vsphere high performance cookbook · 2014-02-18 · vsphere high performance cookbook . welcome to...
TRANSCRIPT
vSphere High Performance Cookbook
Prasenjit Sarkar
Chapter No. 2 "Memory Performance Design"

In this package, you will find: A Biography of the author of the book
A preview chapter from the book, Chapter NO.2 "Memory Performance Design"
A synopsis of the book’s content
Information on where to buy this book
About the Author Prasenjit Sarkar (@stretchcloud) is a senior member of the technical staff inVMware Service Provider Cloud R&D, where he provides architectural oversight and technical guidance for the design, implementation, and testing of VMware's Cloud datacenters.
He is an author, R&D guy, and a blogger, focusing on Virtualization, Cloud Computing, Storage, Networking, and other enterprise technologies.
He has more than 10 years of expert knowledge in R&D/Professional Services/Alliances/ Solution Engineering/Consulting, and Technical Sales, with expertise in Architecting and Deploying Virtualization Solutions, and rolling out new technology and solution initiatives.
His primary focus is on VMware vSphere Infrastructure and Public Cloud, using VMware vCloud Suite.One of his other focuses is to own the entire life cycle of a VMware based IaaS (SDDC), specially, vSphere, vCloud Director, vShield Manager, and vCenter Operations. He is one of the VMware vExperts in 2012 and 2013 as well, and is well known for his acclaimed Virtualization Blog http://stretch-cloud.info.
For More Information:
www.packtpub.com/vsphere-high-performance-cookbook/book

He holds certifications from VMware, Cisco, Citrix, RedHat, Microsoft, IBM, HP, and Exin.
Prior to joining VMware, Prasenjit has served in other fine organizations (such as Capgemini, HP, and GE.) as Solution Architect and Infrastructure Architect.
I would like to thank and dedicate this book to my family, my mom, dad, and my lovely wife Lipika. Without their endless and untiring support, this book would not have been possible.
For More Information:
www.packtpub.com/vsphere-high-performance-cookbook/book
vSphere High Performance Cookbook Welcome to vSphere High Performance Cookbook. In this book, we will teach you how to tune and grow a VMware vSphere 5 Infrastructure. This book will provide you with the knowledge, skills, and abilities to build and run a high-performing VMware vSphere virtual infrastructure. Also, we will look at the detailed, step-by-step coverage, with screenshots that are usually not available in product manuals.
You will learn how to configure and manage ESXi CPU, memory, networking, and storage for sophisticated, enterprise-scale environments. Also, you will learn how to manage changes to the vSphere environment, and optimize the performance of all vSphere components.
This book focuses on high value and often overlooked performance-related topics, such as NUMA Aware CPU Scheduler, VMM Scheduler, Core Sharing, the Virtual Memory Reclamation technique, Checksum offloading, VM DirectPath I/O, queuing on storage array, command queuing, vCenter Server design, and virtual machine and application tuning.
What This Book Covers Chapter 1, CPU Performance Design, covers VMM Scheduler, Cache aware CPU Scheduler, Hyperthreaded Core Sharing, Ready Time (%RDY), and so on.
Chapter 2, Memory Performance Design, covers virtual memory reclamation technique, how to rightly size a VM's memory, monitoring host ballooning, swapping activity, and so on.
Chapter 3, Networking Performance Design, covers different vSwitch load balancing, options consideration for checksum offloading, VMDirectPath I/O, NetQueue, SplitRx mode for multicast traffic, Multi NIC vMotion, NIOC, and so on.
Chapter 4, DRS, SDRS, and Resource Control Design, covers the DRS algorithm, resource pool guidelines, SIOC threshold considerations, profile driven storage, SDRS and its affinity/anti-affinity rules, and so on.
Chapter 5, vSphere Cluster Design, covers considerations for scale up and scale out cluster design, FT and its caveats, application monitoring, DPM, Host affinity/ anti-affinity rules, and so on.
Chapter 6, Storage Performance Design, covers how to design vSphere storage based onvarious workloads, how you design iSCSI, FC storage for best performance, considerations for VAAI, and so on.
For More Information:
www.packtpub.com/vsphere-high-performance-cookbook/book

Chapter 7, Designing vCenter and vCenter Database for Best Performance, covers whatplatform to choose when designing your vCenter Server, redundant vCenter design, vCenter design for highly-available Auto Deploy, vCenter SSO and its deployment, and so on.
Chapter 8, Virtual Machine and Application Performance Design, covers how to select the best time synchronization in virtual machines, considerations for Virtual NUMA, VM swapfile placement best practices and its impact, and so on.
For More Information:
www.packtpub.com/vsphere-high-performance-cookbook/book
2
Memory Performance Design
In this chapter, we will cover the tasks related to memory performance design. You will learn the following aspects of memory performance design:
Virtual memory reclamation techniques
Monitoring host-swapping activity
Monitoring host-ballooning activity
Keeping memory free for VMkernel
Key memory performance metrics to monitor
What metrics not to use
Identifying when memory is the problem
Analyzing host and VM memory
Memory performance best practices
IntroductionAlthough VMware vSphere uses various mechanisms to effi ciently allocate memory, you might still encounter a situation where virtual machines are allocated insuffi cient physical memory.
You should know how to monitor memory usage of both the host and virtual machines. You should also know how to troubleshoot common memory performance problems, such as those involving an excessive demand for memory.
For More Information:
www.packtpub.com/vsphere-high-performance-cookbook/book

CPU Performance Design
28
To monitor these sections you need to know the esxtop counters and those are:
PCPU Used (%)
Per group statistics
%Used
%Sys
%RDY
%Wait
%CSTP
%MLMTD
Getting readyTo step through this recipe, you need a running ESXi Server, a couple of running CPU-hungry virtual machines, and a SSH Client (for example, Putty). No other prerequisites are required.
How to do it...Let's get started:
1. Log in to the ESXi host using SSH client (Putty).
2. Run esxtop and monitor the statistics. The following screenshot is an example output:
3. Now look at the performance counters as mentioned previously. In the following example output, look at the different metrics.
For More Information:
www.packtpub.com/vsphere-high-performance-cookbook/book

Chapter 1
29
In the preceding example, you can see our pCPU 0 and pCPU 1 are heavily being used (100 percent and 73 percent UTIL respectively) and it shows the following fi gure:
Now in the preceding example, you see that the %Used value for the four CPU-hungry virtual machines are pretty high.
Also look at the %RDY screen, and you will see a high ready time, which indicates a performance problem.
The following list is a quick explanation for each of these metrics:
PCPU USED (%): This is the CPU utilization per physical CPU.
%USED: This is the physical CPU usage by per group.
%SYS: This is the VMkernel system activity time.
%RDY: This is the ready time. This is referred as the amount of time that the group spent ready to run, but waiting for the CPU to be available. Note that this is not adjusted for the number of vCPUs. You should expand the group to see %Ready for each vCPU, or at least divide this by the number of vCPUs to use an average per vCPU.
%WAIT: This is the percentage of time spent in blocked or busy state. This includes idle time and also the time waiting for I/O from the disk or network.
%CSTP: This is referred as the percentage of time spent in the VMkernel, on behalf of the group for processing interrupts. %CSTP for a vCPU is how much time the vCPU spent not running in order to allow the extra vCPUs in the same VM to catch up. High values suggest that this VM has more vCPUs than it needs and the performance might be suffering.
%MLMTD: This is the amount of time spent ready to run, but not scheduled because of a CPU limit.
For More Information:
www.packtpub.com/vsphere-high-performance-cookbook/book
CPU Performance Design
30
CPU performance best practicesCPU virtualization adds varying amount of overhead, because of this you may need to fi ne tune the CPU performance and need to know what are the standard best practices.
Following are the standard CPU performance best practices:
You need to avoid using SMP VMs unless it is required by the application running inside the guest OS. That means if the application is not multithreaded then there is no benefi t of using SMP VM.
You should prioritize the VM CPU usage with proportional share algorithm.
Use DRS (Distributed Resource Scheduler) and vMotion to redistribute VMs and reduce contention.
Use the latest available virtual hardware for the VMs.
Reduce the number of VMs running inside a single host. This way, you can not only reduce the contention, but also reduce the fault domain confi guration.
You should leverage the application tuning guide from the vendor to tune your VMs for best performance.
Getting readyTo step through this recipe, you need a running ESXi Server, a couple of running virtual machines, and a working installation of vSphere Client. No other prerequisites are required.
How to do it…Let's get started:
1. For the fi rst best practice, you need to check whether the application is single threaded or multi-threaded. If it is single threaded, then avoid running SMP VM.
2. You need to log in to vCenter using vSphere Client, then go to the Home tab. Once there, go to the VM and look at the Summary tab.
3. Now you can see whether the VM has one vCPU or multiple vCPUs. You see whether it's using them by looking at %Utilization or similar metric for each vCPU. This Summary tab doesn't tell us whether the app is single threaded or multi-threaded.
For More Information:
www.packtpub.com/vsphere-high-performance-cookbook/book
Chapter 1
31
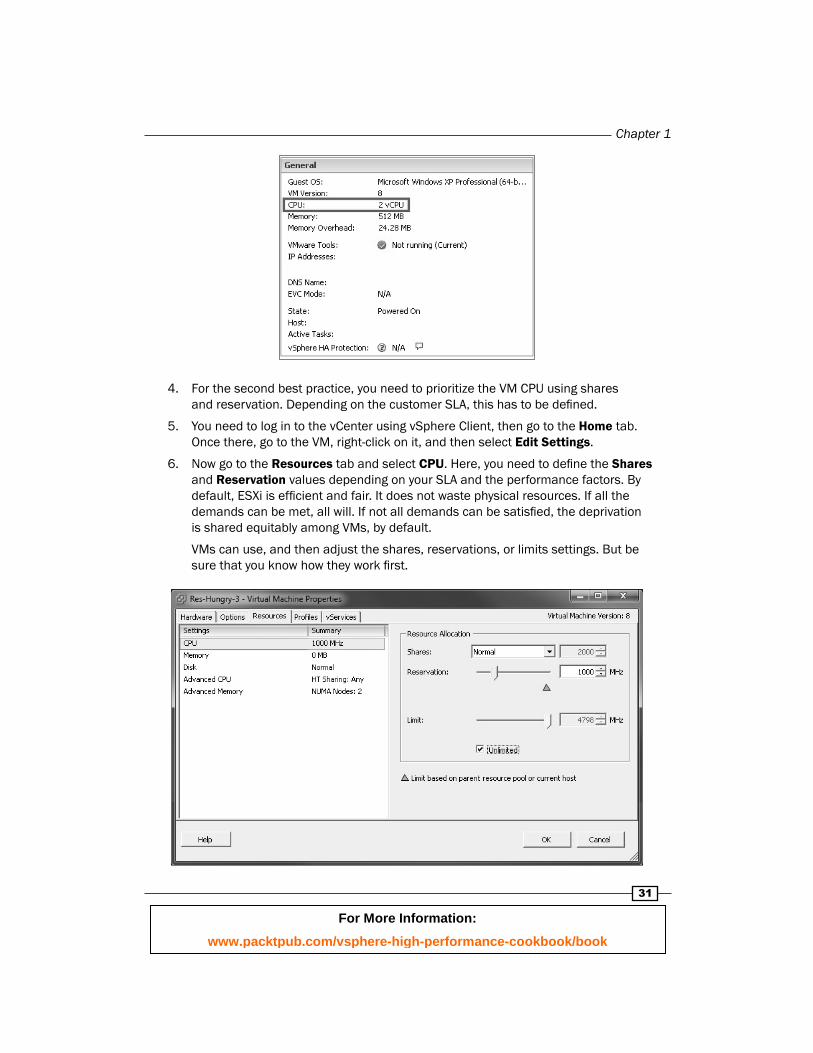
4. For the second best practice, you need to prioritize the VM CPU using shares and reservation. Depending on the customer SLA, this has to be defi ned.
5. You need to log in to the vCenter using vSphere Client, then go to the Home tab. Once there, go to the VM, right-click on it, and then select Edit Settings.
6. Now go to the Resources tab and select CPU. Here, you need to defi ne the Shares and Reservation values depending on your SLA and the performance factors. By default, ESXi is effi cient and fair. It does not waste physical resources. If all the demands can be met, all will. If not all demands can be satisfi ed, the deprivation is shared equitably among VMs, by default.
VMs can use, and then adjust the shares, reservations, or limits settings. But be sure that you know how they work fi rst.
For More Information:
www.packtpub.com/vsphere-high-performance-cookbook/book

CPU Performance Design
32
7. For the third best practice, you need to have a vSphere Cluster and have DRS enabled for this. DRS would load balance the VMs across the ESXi hosts using vMotion.
The fi rst screenshot shows that the DRS is enabled on this vSphere Cluster:
The second screenshot shows the automation level and migration threshold.
For More Information:
www.packtpub.com/vsphere-high-performance-cookbook/book
Chapter 1
33
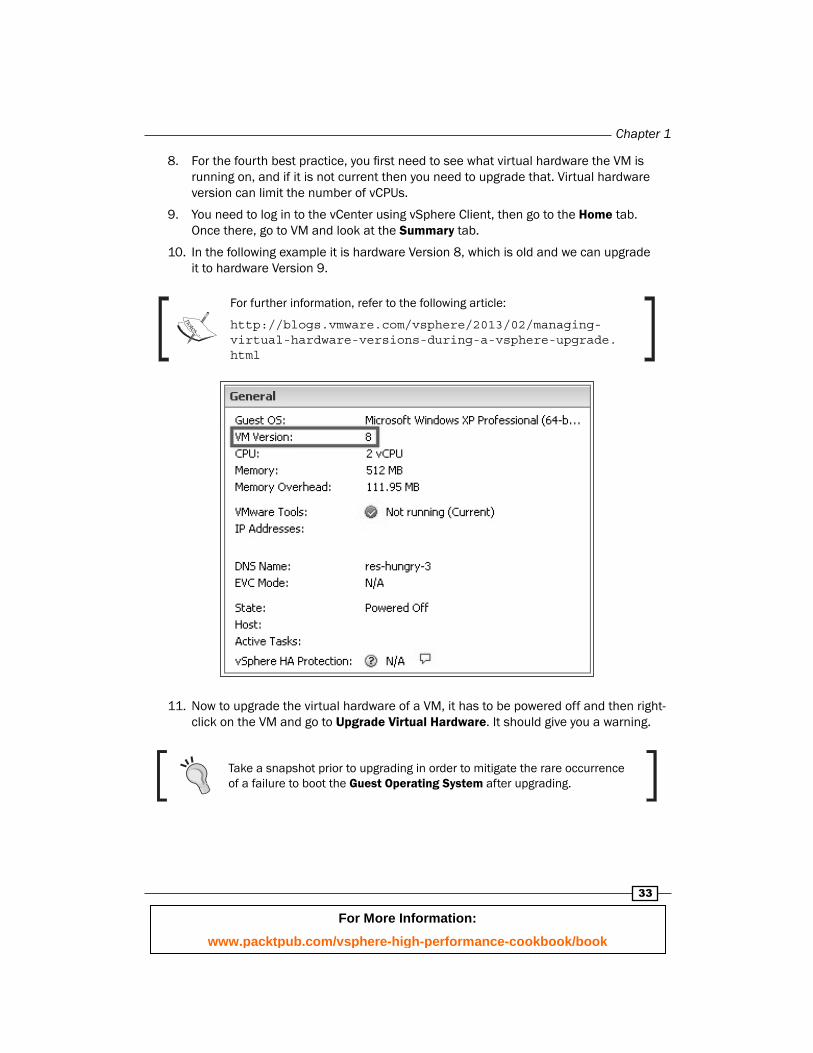
8. For the fourth best practice, you fi rst need to see what virtual hardware the VM is running on, and if it is not current then you need to upgrade that. Virtual hardware version can limit the number of vCPUs.
9. You need to log in to the vCenter using vSphere Client, then go to the Home tab. Once there, go to VM and look at the Summary tab.
10. In the following example it is hardware Version 8, which is old and we can upgrade it to hardware Version 9.
For further information, refer to the following article:
http://blogs.vmware.com/vsphere/2013/02/managing-virtual-hardware-versions-during-a-vsphere-upgrade.html
11. Now to upgrade the virtual hardware of a VM, it has to be powered off and then right-click on the VM and go to Upgrade Virtual Hardware. It should give you a warning.
Take a snapshot prior to upgrading in order to mitigate the rare occurrence of a failure to boot the Guest Operating System after upgrading.
For More Information:
www.packtpub.com/vsphere-high-performance-cookbook/book
CPU Performance Design
34
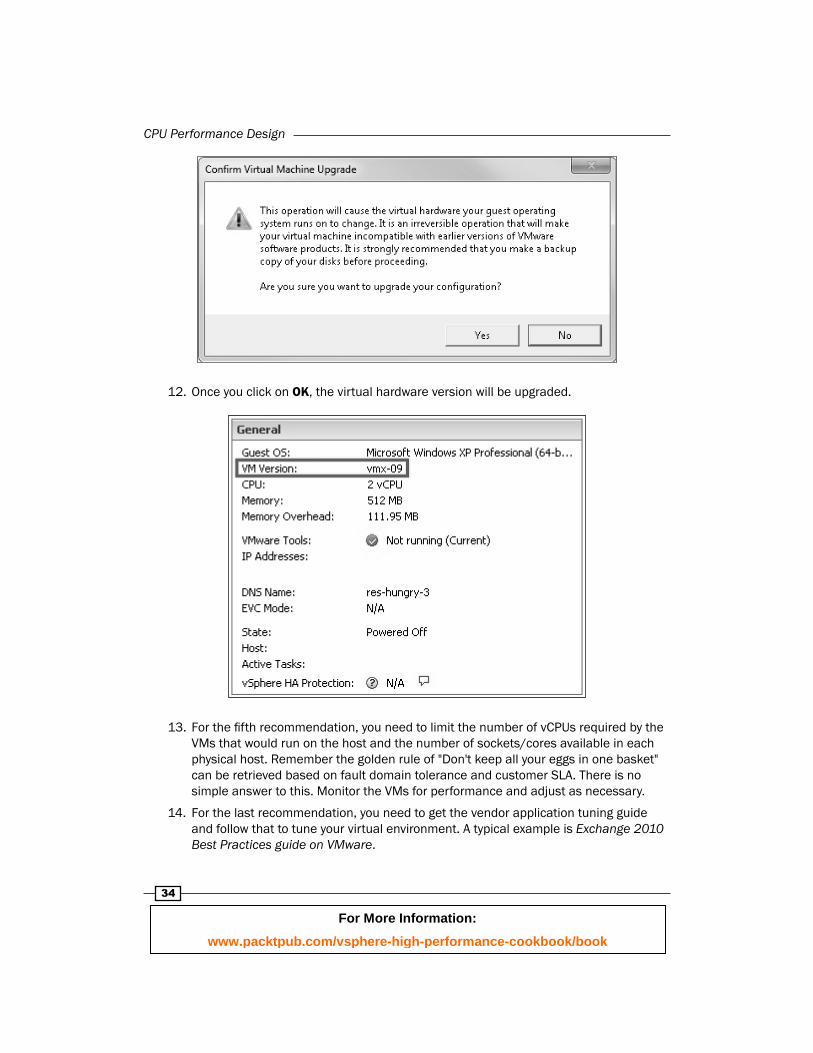
12. Once you click on OK, the virtual hardware version will be upgraded.
13. For the fi fth recommendation, you need to limit the number of vCPUs required by the VMs that would run on the host and the number of sockets/cores available in each physical host. Remember the golden rule of "Don't keep all your eggs in one basket" can be retrieved based on fault domain tolerance and customer SLA. There is no simple answer to this. Monitor the VMs for performance and adjust as necessary.
14. For the last recommendation, you need to get the vendor application tuning guide and follow that to tune your virtual environment. A typical example is Exchange 2010 Best Practices guide on VMware.
For More Information:
www.packtpub.com/vsphere-high-performance-cookbook/book
Memory Performance Design
36
Virtual memory reclamation techniquesVirtual machines perform memory allocation in the same way, as an operating system handles memory allocation and deallocation. The guest operating system frees itself from a piece of physical memory by adding the memory page numbers to the guest free list.
The guest operating system free list is not accessible to the hypervisor and thus it is diffi cult for the hypervisor to know when to free host physical memory and when the guest physical memory is freed. The hypervisor is completely unaware of which pages are free or allocated in the guest operating system, and because of this the hypervisor cannot reclaim host physical memory when the guest operating system frees guest physical memory.
So VMware hypervisor relies on memory reclamation techniques to reclaim the host physical memory that is freed by the guest operating system. The memory reclamation techniques are:
Transparent page sharing
Memory ballooning
Host-level (or hypervisor) swapping
Getting readyTo step through this recipe, you will need a running ESXi Server, a couple of running virtual machines, and a working installation of vSphere Client. No other prerequisites are required.
How to do it...Perhaps you don't need to do anything to enable Transparent Memory Page Sharing, as it is by default enabled on your ESXi Hypervisor.
Memory ballooning is driven by the VMware tools. So you need to install the latest version of VMware tools on all of your virtual machines. It will load the vmmemctl driver, which is responsible for memory ballooning.
Perform the following steps:
1. Log in to the VMware vSphere Client.
2. In the virtual machine inventory, right-click on the virtual machine and click on Install or Upgrade VMware Tools.
3. Go to the VM Console and follow the on-screen instruction to install it.
Similarly, Host-level or Hypervisor Swapping is also enabled by default. You don't need to perform any additional steps to enable it.
For More Information:
www.packtpub.com/vsphere-high-performance-cookbook/book
Chapter 2
37
How it works...Let us now look at how these techniques work.
Transparent page sharingWhen there are multiple virtual machines running on the same hypervisor, most of the time some of them might have identical sets of memory content (known as memory pages). This creates opportunities for sharing memory across virtual machines. ESXi Hypervisor can reclaim the redundant copies and keep only one copy using transparent page sharing. You can think of it as Memory De-duplication.
Traditionally in x86 systems, memory is split into 4 kilobytes pages and that happens only if you are using small pages with shadow pages tables. The TPS process runs every 60 minutes. It scans all memory pages and calculates a hash value for each of them. Those hashes are saved in a separate table and compared to each other by the kernel. Every time the ESXi kernel fi nds two identical hashes it starts a bit-by-bit comparison of the corresponding memory pages. If these pages are absolutely the same, the kernel leaves only one copy of page in memory and removes the second one. When one of your VM requests to write to this page, the kernel creates a new page because the change made by one VM must not affect the memory contents of another VM.
VMware ESXi scans the guest physical pages randomly, with a base scan rate specifi ed by Mem.ShareScanTime. The maximum number of scanned pages per second in the host and the maximum number of per-virtual machine scanned pages, (that is, Mem.ShareScanGHz and Mem.ShareRateMax respectively) can also be specifi ed in ESXi advanced settings.
Memory ballooningMemory ballooning makes the guest operating system aware that it does not have enough memory from the host, so that the guest operating system frees some of its memory. When there is a memory crisis, hypervisor tells the balloon driver to request some amount of megabytes from the guest operating system. The hypervisor knows that pages occupied by the balloon driver will never store data, so the pages of pRAM backing the balloon driver can then be reallocated safely to other VMs. It is the guest operating system's call to decide which pages of vRAM it should allocate to the balloon driver, and it will start with free pages. If it has a plenty of free or idle guest physical memory, infl ating the balloon will induce no guest-level paging and thus it will not affect guest performance. However, in a case of memory contention within the guest, the VM guest decides which guest physical pages are to be paged out to the virtual swap device in order to satisfy the balloon driver's allocation requests.
For More Information:
www.packtpub.com/vsphere-high-performance-cookbook/book

Memory Performance Design
38
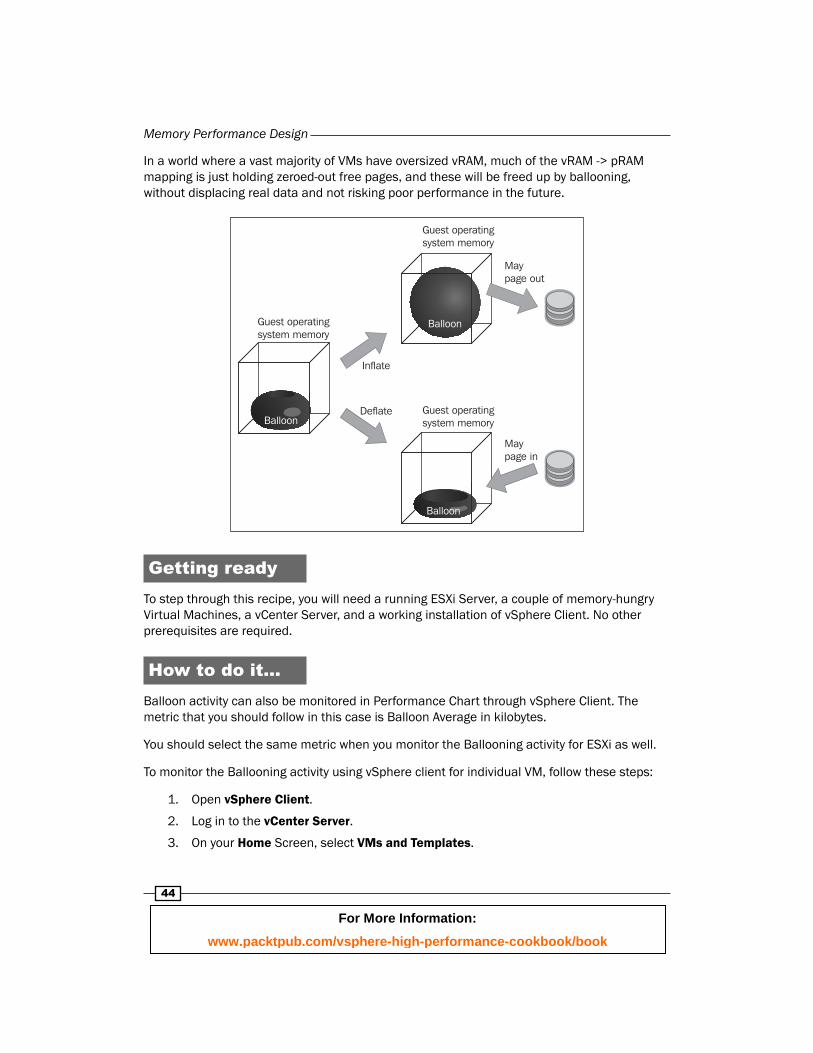
The balloon driver reclaims guest operating systems allocated memory using the Idle Memory Tax (IMT) . IMT may reclaim up to 75 percent of idle memory. A guest operating system page fi le is necessary in order to prevent guest operating system kernel starvation. The memctl should aggressively reclaim memory due to severe host contention (make sure that the guest operating system page fi le is at least 65 percent of the confi gured vRAM). Even here, the guest operating system can make intelligent guesses about which pages of data are least likely to be requested in the future. (You'll see this in contrast with hypervisor-level swapping, which is discussed next.) Look at the following pictorial representation of memory page mapping to host memory:
Guest operatingsystem memory
Guest operatingsystem memory
Guest operatingsystem memory
Maypage in
Balloon
Balloon
Balloon
Inflate
Deflate
Maypage out
Host-level swapping stars in ESXi are not suffi cient to reclaim memory during transparent page sharing and ballooning. To support this, when starting a virtual machine, the hypervisor creates a separate swap fi le for the virtual machine. This is primarily because if it frees pRAM for other virtual machines, the hypervisor can directly swap out vRAM to the swap fi le.
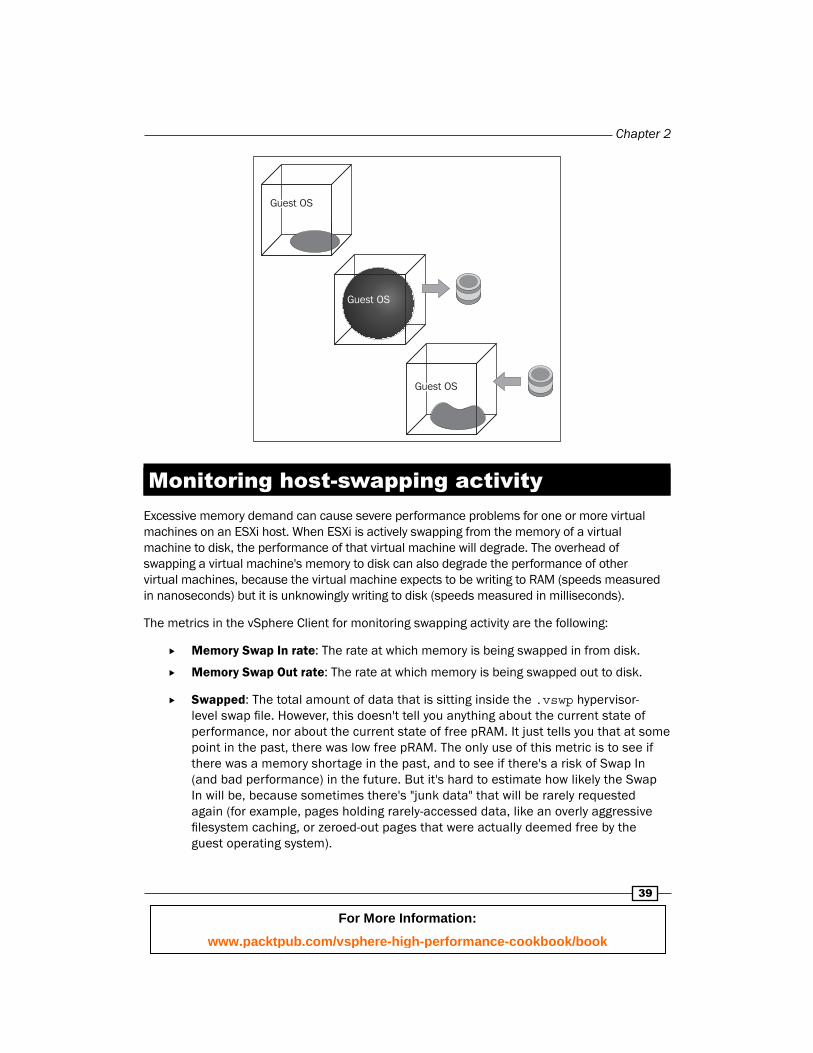
Swapping is a guaranteed technique to reclaim a specifi c amount of memory within a specifi c amount of time. However, you should be concerned about host-level swapping because it can severely penalize guest performance. This occurs when the hypervisor has no knowledge about which guest physical pages should be swapped, and the swapping might cause unintended interactions with the native memory management policies in the guest operating system. The following is a pictorial representation of host-level memory page swapping:
For More Information:
www.packtpub.com/vsphere-high-performance-cookbook/book
Chapter 2
39
Guest OS
Guest OS
Guest OS
Monitoring host-swapping activityExcessive memory demand can cause severe performance problems for one or more virtual machines on an ESXi host. When ESXi is actively swapping from the memory of a virtual machine to disk, the performance of that virtual machine will degrade. The overhead of swapping a virtual machine's memory to disk can also degrade the performance of other virtual machines, because the virtual machine expects to be writing to RAM (speeds measured in nanoseconds) but it is unknowingly writing to disk (speeds measured in milliseconds).
The metrics in the vSphere Client for monitoring swapping activity are the following:
Memory Swap In rate: The rate at which memory is being swapped in from disk.
Memory Swap Out rate: The rate at which memory is being swapped out to disk.
Swapped: The total amount of data that is sitting inside the .vswp hypervisor-level swap fi le. However, this doesn't tell you anything about the current state of performance, nor about the current state of free pRAM. It just tells you that at some point in the past, there was low free pRAM. The only use of this metric is to see if there was a memory shortage in the past, and to see if there's a risk of Swap In (and bad performance) in the future. But it's hard to estimate how likely the Swap In will be, because sometimes there's "junk data" that will be rarely requested again (for example, pages holding rarely-accessed data, like an overly aggressive fi lesystem caching, or zeroed-out pages that were actually deemed free by the guest operating system).
For More Information:
www.packtpub.com/vsphere-high-performance-cookbook/book
Memory Performance Design
40
High values for metric indicate a lack of memory and that performance is suffering as a result.
However, a high Swap Out rate means that the host is low on free pRAM, but essentially it does not indicate a current performance problem. A high Swap In rate indicates a current performance problem but not necessarily that the host is currently low on free pRAM (Swap In happens only on demand, which could be a week after the data was swapped out, and maybe the free-host-memory shortage has long since been resolved).
Getting readyTo step through this recipe, you will need a running ESXi Server, a couple of memory-hungry Virtual Machines, a vCenter Server, and a working installation of vSphere Client. No other prerequisites are required.
How to do it...To monitor a host's swapping activity in vSphere Client, view the Memory screen. A couple of useful metrics are Swapped, Swap In, and Swap Out. This metric represents total swapping for a virtual machine on the host.
To monitor host-level swapping activity for all virtual machines, you need to select one single ESXi Host and then go to the Performance tab. There, you need to go to the Memory tab, which will show the entire VMs. After this is done, perform the following steps:
1. Open vSphere Client.
2. Log in to the vCenter Server.
3. On your Home screen, select VMs and Templates.
4. Choose the memory-hungry.
5. Go to the Performance tab, and switch to the Memory screen.
6. Click on the Advanced tab, and select Chart Options.
7. Select the three values there, that is, Swapped, Swap in Rate in KBps, and Swap Out Rate in KBps.
8. Click on OK. Now you should see something similar to the following image, if there are swapping activities on your VM:
For More Information:
www.packtpub.com/vsphere-high-performance-cookbook/book

Chapter 2
41
In the preceding example, you can see that this VM has swapped 4372 Kilobytes, Swap out for 1012 Kilobytes, and Swap in for 40 Kilobytes.
Now to see the overall swapped situation for all VMs in a single ESXi server, you should perform the following steps:
1. Open vSphere Client.
2. Log in to the vCenter Server.
3. On your Home screen, select Hosts and Clusters.
4. Choose the poorly-performing ESXi host.
5. Go to the Performance tab, and switch to the Memory screen.
6. Click on the Advanced tab, and select Chart Options.
7. Select the three values there, that is, Swap Used, Swap In, and Swap Out rate in KBps.
For More Information:
www.packtpub.com/vsphere-high-performance-cookbook/book

Memory Performance Design
42
8. Click on OK. Now you should see something similar to the following image if there are swapping activities on your ESXi host:
In this example, you can see that this ESXi host Swap in for 1657976 Kilobytes and Swap out for 4930940 Kilobytes.
How it works...We talked about how it works in the previous recipe. Please refer to the Virtual memory reclamation technique recipe.
There's more...The basic cause of host-level swapping is memory overcommitment from using memory intensive virtual machines whose combined confi gured memory is greater than the amount of host physical memory available.
For More Information:
www.packtpub.com/vsphere-high-performance-cookbook/book

Chapter 2
43
To resolve this problem, you should consider the following factors:
Reduce the level of memory overcommitment (for example, reduce oversized VM's, and add more memory where necessary, add more hosts to the cluster if necessary, and so on)
Enable the balloon driver in all virtual machines by installing VMware tools
Reduce memory Reservations. This is covered in Chapter 5, vSphere Cluster Design
Use resource controls (Shares, Reservations, and Limits) with careful understanding and planning, to reduce memory contention on the most critical virtual machines
Note that this will not reduce the total memory contention on this host, but it allows you to mitigate the risk to the performance of your most important VMs.
Monitoring host-ballooning activityBallooning is a part of normal operations when memory is overcommitted. The fact that ballooning occurrence is not necessarily an indication of a performance problem. The use of the balloon driver enables the guest to give up physical memory pages that are not being used. In fact, ballooning can be a sign that you're getting extra value out of the memory you have in the host.
However, if ballooning causes the guest to give up memory that it actually needs, performance problems can occur due to guest operating system paging.
Note, however, that this is fairly uncommon because the guest operating system will always assign already-free memory to the balloon driver whenever possible, thereby avoiding any guest operating system swapping.
In the vSphere Client, use the Memory Balloon metric to monitor a host's ballooning activity. This metric represents the total amount of memory claimed by the balloon drivers of the virtual machines on the host. The memory claimed by the balloon drivers can be used by other virtual machines. Again, this is not a performance problem, but it represents that the host starts to take memory from less needful virtual machines for those with large amounts of active memory. If the host is ballooning, check the swap rate counters (Memory Swap In Rate and Memory Swap Out Rate), which might indicate performance problems, but it does not mean that you have a performance problem presently. It means that the unallocated pRAM on the host has dropped below a predefi ned threshold.
For More Information:
www.packtpub.com/vsphere-high-performance-cookbook/book
Memory Performance Design
44
In a world where a vast majority of VMs have oversized vRAM, much of the vRAM -> pRAM mapping is just holding zeroed-out free pages, and these will be freed up by ballooning, without displacing real data and not risking poor performance in the future.
Guest operatingsystem memory
Guest operatingsystem memory
Guest operatingsystem memory
Maypage in
Balloon
Balloon
Balloon
Inflate
Deflate
Maypage out
Getting readyTo step through this recipe, you will need a running ESXi Server, a couple of memory-hungry Virtual Machines, a vCenter Server, and a working installation of vSphere Client. No other prerequisites are required.
How to do it...Balloon activity can also be monitored in Performance Chart through vSphere Client. The metric that you should follow in this case is Balloon Average in kilobytes.
You should select the same metric when you monitor the Ballooning activity for ESXi as well.
To monitor the Ballooning activity using vSphere client for individual VM, follow these steps:
1. Open vSphere Client.
2. Log in to the vCenter Server.
3. On your Home Screen, select VMs and Templates.
For More Information:
www.packtpub.com/vsphere-high-performance-cookbook/book

Chapter 2
45
4. Choose the memory-hungry VM.
5. Go to the Performance tab, and switch to the Memory screen.
6. Click on the Advanced tab, and select Chart Options.
7. Select Balloon as the metric.
8. Click on OK. Now you should see something similar to the following image if there is Ballooning activity on your VM:
In this example you can see that this VM (Memhog-VM3) is releasing its inactive memory pages to Host memory. Here it is 1582956 Kilobytes.
To monitor the Ballooning activity using vSphere client for your ESXi, you should follow these steps:
1. Open vSphere Client.
2. Log in to the vCenter Server.
3. On your Home Screen, select Hosts and Clusters.
4. Choose the poorly performing ESXi host.
5. Go to the Performance tab and switch to the Memory screen.
6. Click on the Advanced tab and select Chart Options.
7. Select Balloon as the metric.
For More Information:
www.packtpub.com/vsphere-high-performance-cookbook/book

Memory Performance Design
46
8. Click on OK. Now you should see something similar to this if there is ballooning activity on your ESXi host:
In this example you can see that this ESXi host is involved in ballooning and its VMs are actively releasing inactive memory pages.
How it works...In our previous recipe, we talked about how it works. Refer to the Virtual memory reclamation technique recipe.
There's more...The basic cause of memory that ballooning is again memory overcommitment from using memory-intensive virtual machines. However, this is just indicative, which means that the presence of ballooning does not always say it's a performance problem. Ballooning is an effective way to use pRAM more effi ciently, usually with no negative performance impact.
In order to maximize the ability of ESXi to recover idle memory from virtual machines, the balloon driver should be enabled on all virtual machines. The balloon driver should never be deliberately disabled on a virtual machine. Disabling the balloon driver might cause unintended performance problems.
For More Information:
www.packtpub.com/vsphere-high-performance-cookbook/book
Chapter 2
47
Keeping memory free for VMkernelThe amount of memory the VMkernel will try to keep free can be achieved through the Mem.MemMinFreePct parameter. MemMinFreePct determines the amount of memory that the VMkernel should keep free. vSphere 4.1 introduced a dynamic threshold of the Soft, Hard, and Low state to set appropriate thresholds and prevent virtual machine performance issues, while protecting VMkernel. The different states, based on %pRAM which is still free, determines what type of memory reclamation techniques are being used.
For MemMinFreePct, using a default value of 6 percent can be ineffi cient when 256 gigabyte or 512 gigabyte systems are becoming more and more mainstream. A 6 percent threshold on a 512 gigabyte results in 30 gigabyte idling most of the time. However, not all customers use large systems; some prefer to scale out rather than to scale up. In this scenario, a 6 percent MemMinFreePct might be suitable. To have the best of both worlds, VMkernel uses a sliding scale to determine the Mem.MemMinFreePct threshold based on the amount of RAM installed in vSphere 5 hosts. Sliding scale is not applicable to vSphere 4.
Getting readyTo step through this recipe, you will need a running ESXi Server and a working installation of vSphere Client. No other prerequisites are required.
How to do it...1. VMkernel uses a sliding scale to determine the Mem.MinFreePct threshold based
on the amount of RAM installed in the host and it is automatic. However, if you need to change this behavior and set something on your own, then follow these steps:
2. Open vSphere Client.
3. Log in to the vCenter Server.
4. On your Home Screen, select Hosts and Clusters.
5. Choose the ESXi host where you want to perform this activity.
6. Go to the Confi guration tab, and click on Advanced Settings.
7. In the Memory section, scroll down and locate Mem.MemMinFreePct.
8. Choose a value between 0 to 50, where 0 indicates automatic.
So here you can set the percentage of host memory to reserve for accelerating memory allocations when free memory is low, which means this percentage determines when memory reclamation techniques (besides TPS) will start to be used.
For More Information:
www.packtpub.com/vsphere-high-performance-cookbook/book

Memory Performance Design
48
The following is a sample screenshot when you confi gure this parameter:
How it works...MemMinFreePct is used to calculate the minimum free memory which we want to keep by reclaiming memory. For systems with smaller memory (0 to 4 gigabytes), we want to keep 6 percent free, otherwise memory requests from VMkernel or VMs might not be fulfi lled.
Now for the systems having relatively more memory than previously mentioned (4 to 12 gigabyte), we want to keep 4 percent free. For systems having memory ranging from (12 to 28 gigabyte), we want to keep the Free State threshold at 2 percent.
The thresholds for the "high", "soft", and "hard" states are about performance and each state corresponds to a successively lower amount of free pRAM. The main intention is to kick off ballooning and other reclamation mechanisms before hitting the low state.
So, in a nutshell, the MemMinFreePct parameter defi nes the minimal desired amount of free memory in the system. Falling below this level causes the system to reclaim memory through ballooning or swapping.
For More Information:
www.packtpub.com/vsphere-high-performance-cookbook/book
Chapter 2
49
So, the amount of memory the VMkernel keeps free is controlled by the value of MemMinFreePct, which is now determined using a sliding scale. This means that when free memory is greater than or equal to the derived value, the host is not under memory pressure. Check out the following points. Note that these are based on vSphere 4.x.
6 percent free (High): Split small pages for TPS (if applicable); begin ballooning.
4 percent free (Soft): Ballooning in full swing; in vSphere 4.1 begin compressing virtual memory.
2 percent free (Hard): VM swap; break large pages for TPS in full swing.
1 percent free (Low): No new pages provided to VMs.
Even if a host is under memory pressure, it just means that less free pRAM is available than is preferred. It does not mean that a performance problem is present, currently. Because VMs often have extra vRAM, and because the hypervisor doesn't know how much vRAM is considered free by the guest operating system, there is often pRAM allocated to back vRAM, which is holding junk data and which could be freed for use elsewhere without any negative performance impact.
Key memory performance metrics to monitor
To troubleshoot memory performance in a VMware vSphere environment, you should monitor the memory performance very carefully. In this aspect you should monitor the following metrics:
Average memory active: Memory estimated to be used based on recently touched memory pages.
Average memory swapped in or out: Virtual memory swapped to or from disk.
Average memory swapped: Total amount of memory swapped out. This indicates a possibility (with an unknown likelihood) of poor performance in the future.
Getting readyTo step through this recipe, you will need a running ESXi Server, a couple of running memory-hungry Virtual Machines, and a working installation of vSphere Client. No other prerequisites are required.
For More Information:
www.packtpub.com/vsphere-high-performance-cookbook/book
Memory Performance Design
50
How to do it...To spot the average Active Memory, you should check both the VM level and Host level. To monitor at the VM level, you should perform the following steps:
1. Open up vSphere Client.
2. Log in to the vCenter Server.
3. On the Home screen, select VMs and Templates.
4. Choose the VM where you want to monitor Active Memory.
5. Go to the Performance tab on the right-hand side.
6. Select Memory from the drop-down list.
7. Click on the Advanced tab, and select Chart Options.
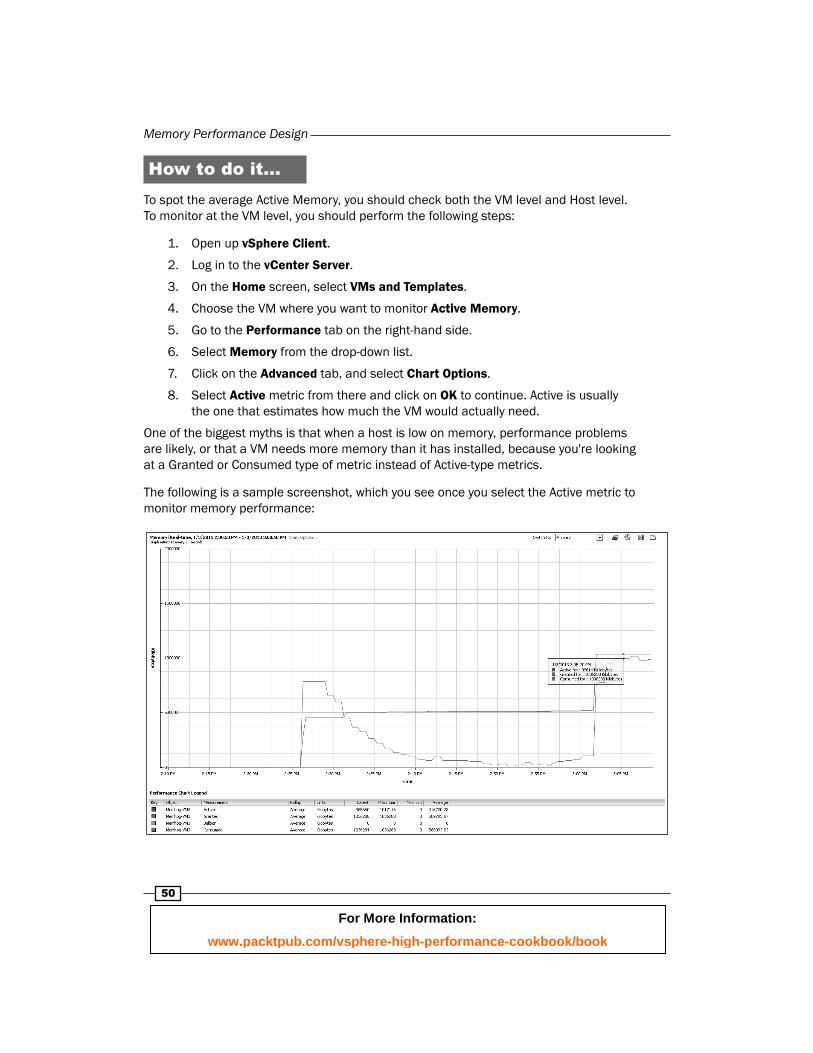
8. Select Active metric from there and click on OK to continue. Active is usually the one that estimates how much the VM would actually need.
One of the biggest myths is that when a host is low on memory, performance problems are likely, or that a VM needs more memory than it has installed, because you're looking at a Granted or Consumed type of metric instead of Active-type metrics.
The following is a sample screenshot, which you see once you select the Active metric to monitor memory performance:
For More Information:
www.packtpub.com/vsphere-high-performance-cookbook/book
Chapter 2
51
In the preceding example, you can see that Memhog-VM3 is using close to 1 gigabyte of memory, which means the Active memory is 1 gigabyte, whereas the confi gured memory for this VM is also 1 gigabyte.
If you want to monitor this metric for the ESXi Host level then perform the following steps:
1. Open up vSphere Client.
2. Log in to the vCenter Server.
3. On the Home screen, select Hosts and Clusters.
4. Choose the ESXi host where you want to monitor the Active Memory.
5. Go to the Performance tab at the right-hand side.
6. Select Memory from the drop-down list.
7. Click on the Advanced tab, and select Chart Options.
8. Select Active metric from there and click on OK to continue.
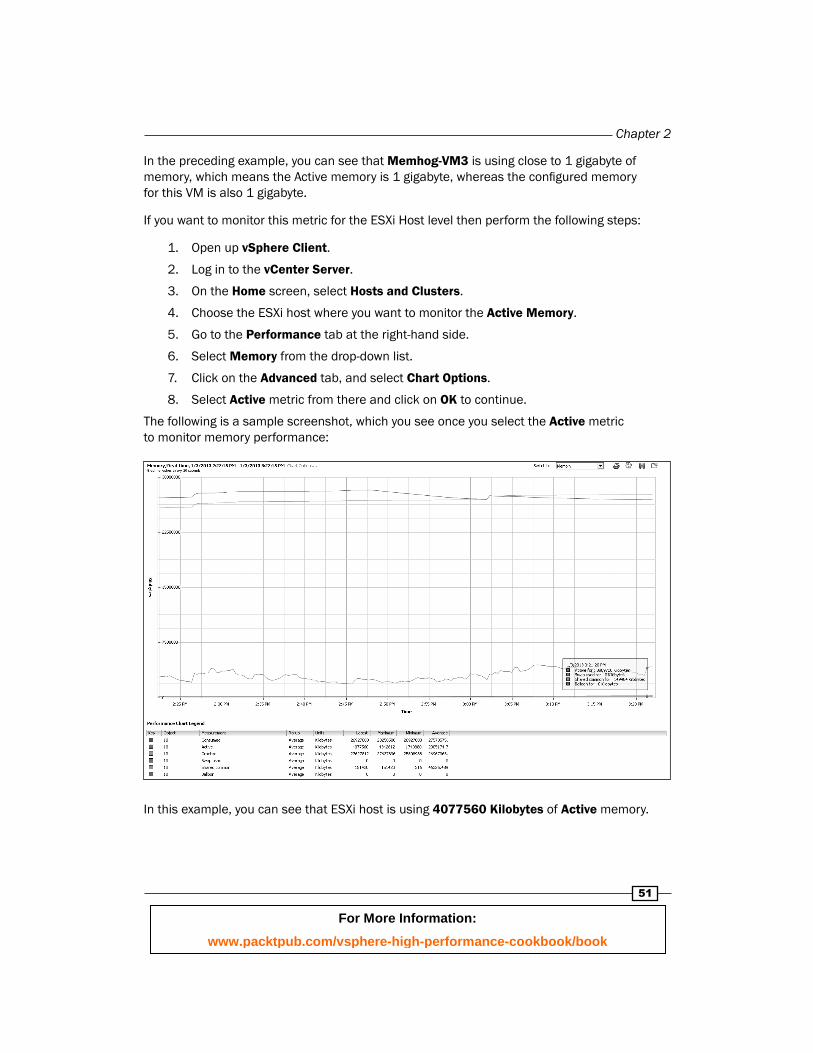
The following is a sample screenshot, which you see once you select the Active metric to monitor memory performance:
In this example, you can see that ESXi host is using 4077560 Kilobytes of Active memory.
For More Information:
www.packtpub.com/vsphere-high-performance-cookbook/book
Memory Performance Design
52
You may notice another Shared common metric here. This is a measure of savings due to TPS. Having TPS run does not have any downside and does not provide any reason to monitor it either. You could get into most shared pages being zeroed pages, and the VDI is more likely to share memory if all of the guest operating systems are the same. TPS doesn't work with large pages, which are standard now, until you hit a threshold, where the large pages are broken down and then TPS starts.
Now to monitor Swapped, Swap in, and Swap out, you should follow the Monitoring host swapping activity recipe.
How it works...To understand how swapping happens, you should check the Monitoring host swapping activity recipe.
The average active memory refers to the average amount of memory that is actively used in kilobytes.
What metrics not to useA lot of the time, we assume that some very popular metric would be better to monitor memory performance. However, many a times, it leads to something else. This means that these are not an indication of a memory performance issue. If this metric is combined with something else then it may indicate performance degradation.
In this aspect you should not use two of the most popular metrics just to understand whether memory is under pressure or not:
Mem.consumed (Consumed Memory)
Mem.vmmemctl (Ballooned Memory)
Let me show you what they essentially indicate.
Mem.consumed is the amount of memory consumed by one or all virtual machines. This is calculated as memory granted minus memory saved by sharing. Now the question is why we should not use this. The reason is that memory allocation will vary dynamically based on the VM's entitlement. It is important that a VM should get whatever it actually demands.
Similarly, Mem.vmmemctl is the amount of ballooned memory. This does not indicate a performance problem as well. However, when it gets combined with Host Swapping then it indicates a performance problem.
For More Information:
www.packtpub.com/vsphere-high-performance-cookbook/book

Chapter 2
53
Getting readyTo step through this recipe, you will need a running ESXi Server, a couple of running Memory Hungry Virtual Machines, and a working installation of vSphere Client. No other prerequisites are required.
How to do it...To spot the Consumed Memory metric value within the vSphere infrastructure, this is what you should do:
1. Open up vSphere Client.
2. Log in to the vCenter Server.
3. In the Home screen, select VMs and Templates.
4. Choose the VM where you want to monitor the Consumed Memory.
5. Go to the Performance tab on the right-hand side.
6. Select Memory from the drop-down list.
7. Click on the Advanced tab, and select Chart Options.
8. Select the Consumed metric, and then click on OK to continue.
Now you should see something similar to the following screenshot:
For More Information:
www.packtpub.com/vsphere-high-performance-cookbook/book
Memory Performance Design
54
In this example you can see that the Consumed value of the Memhog-VM3 VM is 1409900 Kilobyte.
To understand the Mem.vmmemctl metric you should follow the Monitoring host ballooning recipe.
Identifying when memory is the problemBoth your host memory and VM memory can indicate that it is under pressure. But the main challenge to a VMware admin is how to determine that there is a memory performance issue.
There are a few things which a VMware admin should understand is that there could be a memory performance issue and those are:
Your host memory consumption is approaching your total host memory
Active memory in your host is approaching your total memory
Ballooning is occurring
Host swapping is occurring
Now, if you wonder what is Active memory here in relation to Consumed memory, let me tell you that Active Memory is the amount of memory that is actively used, as estimated by VMkernel based on recently touched memory pages. For a VM this is referred to the amount of guest "physical" memory actively used.
An ESXi host calculates Active memory by using the sum of all active metrics for all powered-on virtual machines plus vSphere services on the host.
There could be another side to it, which can depict that VM is under memory pressure and to determine that you could combine the factors described previously. You should check whether VM memory has high percent utilization.
Getting readyTo step through this recipe, you will need a running ESXi Server, a couple of running memory-hungry Virtual Machines, and a working installation of vSphere Client. No other prerequisites are required.
For More Information:
www.packtpub.com/vsphere-high-performance-cookbook/book

Chapter 2
55
How to do it...To check the Memory Utilization of VM, you should follow the following steps:
1. Open up vSphere Client.
2. Log in to the vCenter Server.
3. On the Home screen, select VMs and Templates.
4. Choose the VM, where you want to monitor the Utilization of memory.
5. Go to the Performance tab on the right-hand side.
6. Select Memory from the drop-down list.
7. Click on the Advanced tab and select Chart Options.
8. Select the Usage metric from there and click on OK to continue.
For More Information:
www.packtpub.com/vsphere-high-performance-cookbook/book
Memory Performance Design
56
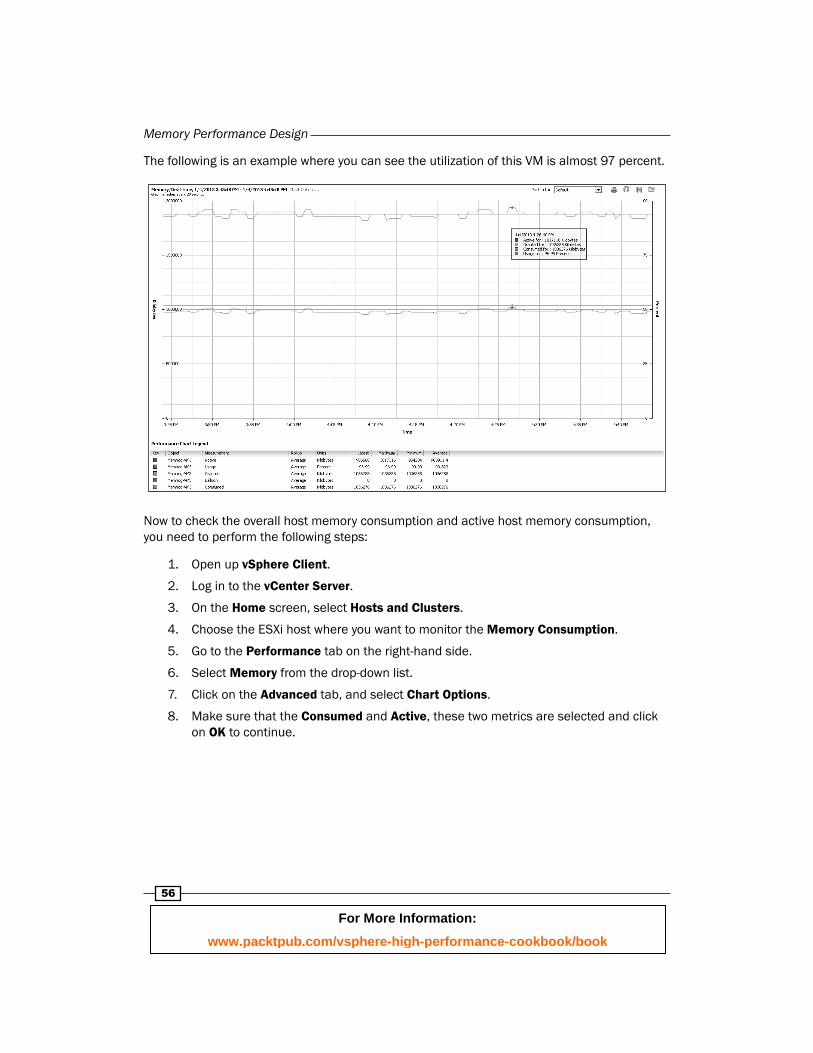
The following is an example where you can see the utilization of this VM is almost 97 percent.
Now to check the overall host memory consumption and active host memory consumption, you need to perform the following steps:
1. Open up vSphere Client.
2. Log in to the vCenter Server.
3. On the Home screen, select Hosts and Clusters.
4. Choose the ESXi host where you want to monitor the Memory Consumption.
5. Go to the Performance tab on the right-hand side.
6. Select Memory from the drop-down list.
7. Click on the Advanced tab, and select Chart Options.
8. Make sure that the Consumed and Active, these two metrics are selected and click on OK to continue.
For More Information:
www.packtpub.com/vsphere-high-performance-cookbook/book

Chapter 2
57
Now let us look at a sample screenshot and see what it looks like:
You can see in this example, that we have an ESXi host that has 32 gigabytes of physical memory, and we are consuming almost every bit of it.
However, if you look at the Active memory here, we are using little more than 7 gigabytes. So that means that although we have more than 30 gigabytes of consumed memory, we only have 7 gigabytes of Active memory. It should not create many issues. This could indicate overprovisioning of resources; if applicable, VMs should be right-sized by removing allocated RAM that is not required.
Analyzing host and VM memoryOften you need to monitor virtual machine and host memory usage; the good part about this is that VMware vSphere Client exposes two memory statistics in the Summary tab of a virtual machine. These are consumed host memory and active guest memory.
Consumed host memory is the amount of host physical memory that is allocated to the virtual machine. Please note that this value includes the virtualization overhead also.
For More Information:
www.packtpub.com/vsphere-high-performance-cookbook/book
Memory Performance Design
58
Also note that many VMs have oversized vRAM, and the guest operating system is likely to opportunistically fi ll up its vRAM with unnecessary things (for example, caching everything read from disk, no matter how unlikely it will be requested again). Consumed memory only means that the VM used this memory at some point, not that it's likely to use it again.
Active guest memory is defi ned as the amount of guest physical memory that is currently being used by the guest operating system and its applications.
These two statistics are quite useful for analyzing the memory status of the virtual machine and providing hints to address potential performance issues.
For host memory usage, you may want to look at the Resources section of the Summary tab for an ESXi Host and to understand how much is the actual usage by VM, you need to check the Memory section of the Confi guration page.
Getting readyTo step through this recipe, you will need a running ESXi Server, a couple of running Virtual Machines, and a working installation of vSphere Client. No other prerequisites are required.
How to do it...1. Open up vSphere Client.
2. Log in to the vCenter Server.
3. On the Home screen, select VMs and Templates.
4. Choose the VM where you want to monitor the Utilization of Memory.
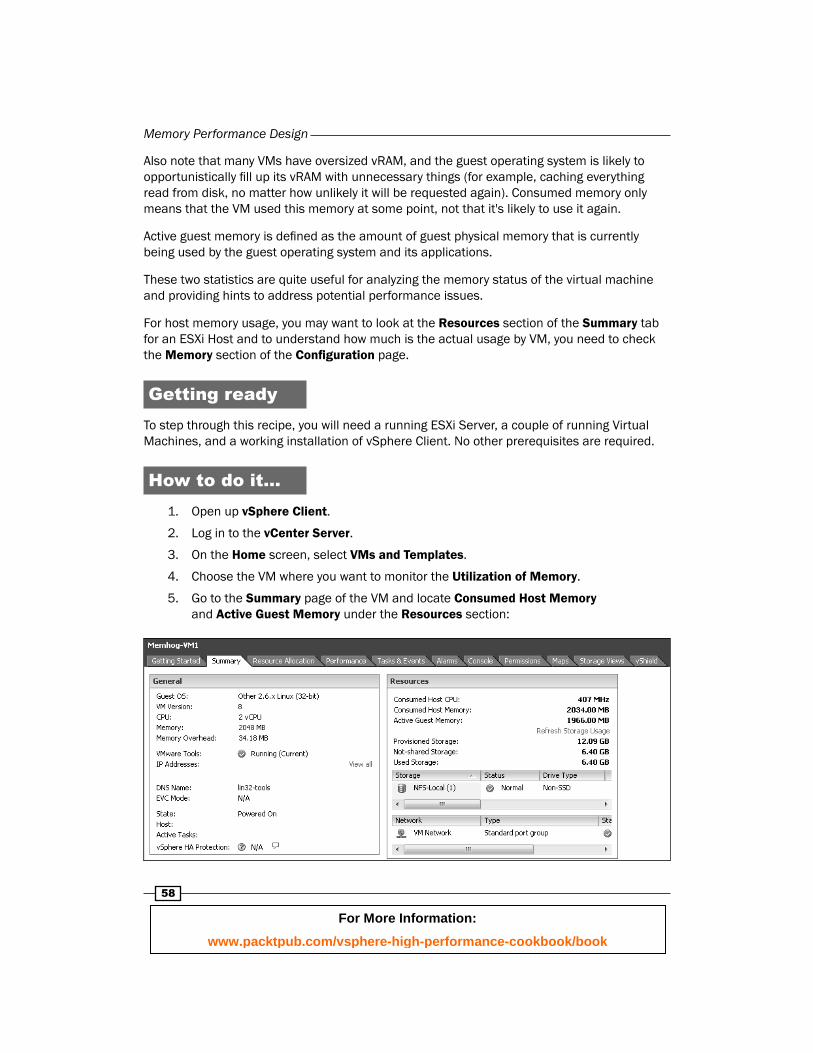
5. Go to the Summary page of the VM and locate Consumed Host Memory and Active Guest Memory under the Resources section:
For More Information:
www.packtpub.com/vsphere-high-performance-cookbook/book
Chapter 2
59
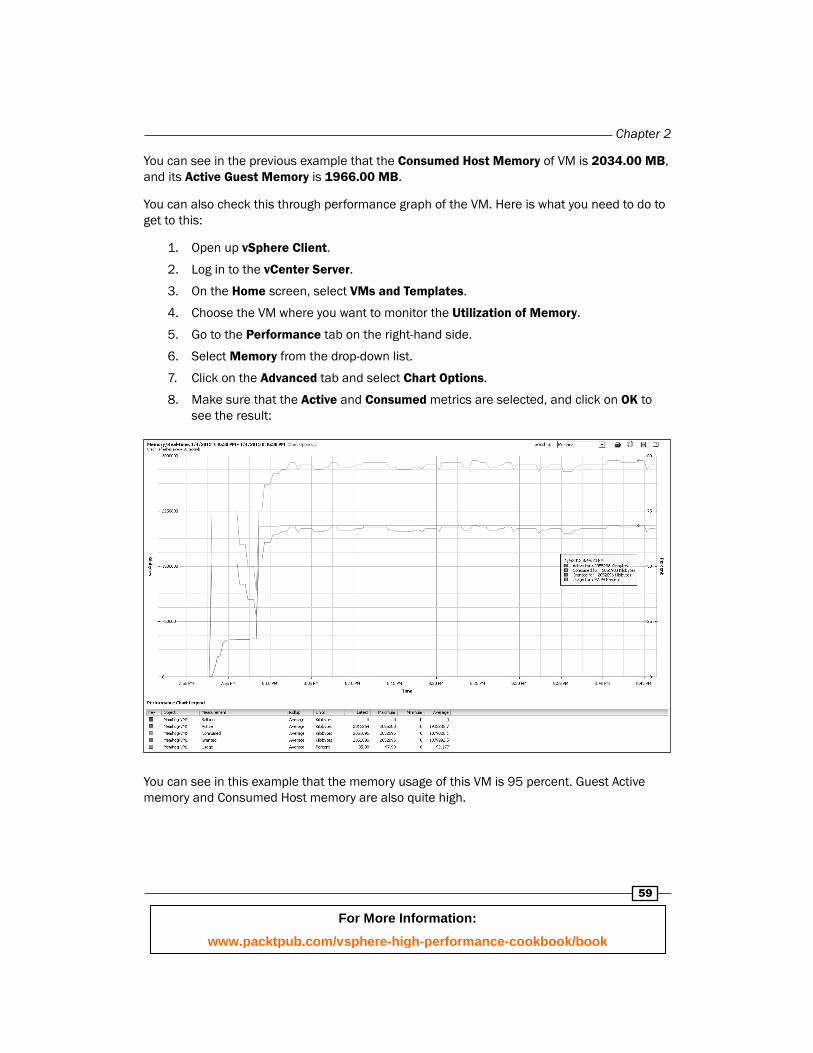
You can see in the previous example that the Consumed Host Memory of VM is 2034.00 MB, and its Active Guest Memory is 1966.00 MB.
You can also check this through performance graph of the VM. Here is what you need to do to get to this:
1. Open up vSphere Client.
2. Log in to the vCenter Server.
3. On the Home screen, select VMs and Templates.
4. Choose the VM where you want to monitor the Utilization of Memory.
5. Go to the Performance tab on the right-hand side.
6. Select Memory from the drop-down list.
7. Click on the Advanced tab and select Chart Options.
8. Make sure that the Active and Consumed metrics are selected, and click on OK to see the result:
You can see in this example that the memory usage of this VM is 95 percent. Guest Active memory and Consumed Host memory are also quite high.
For More Information:
www.packtpub.com/vsphere-high-performance-cookbook/book
Memory Performance Design
60
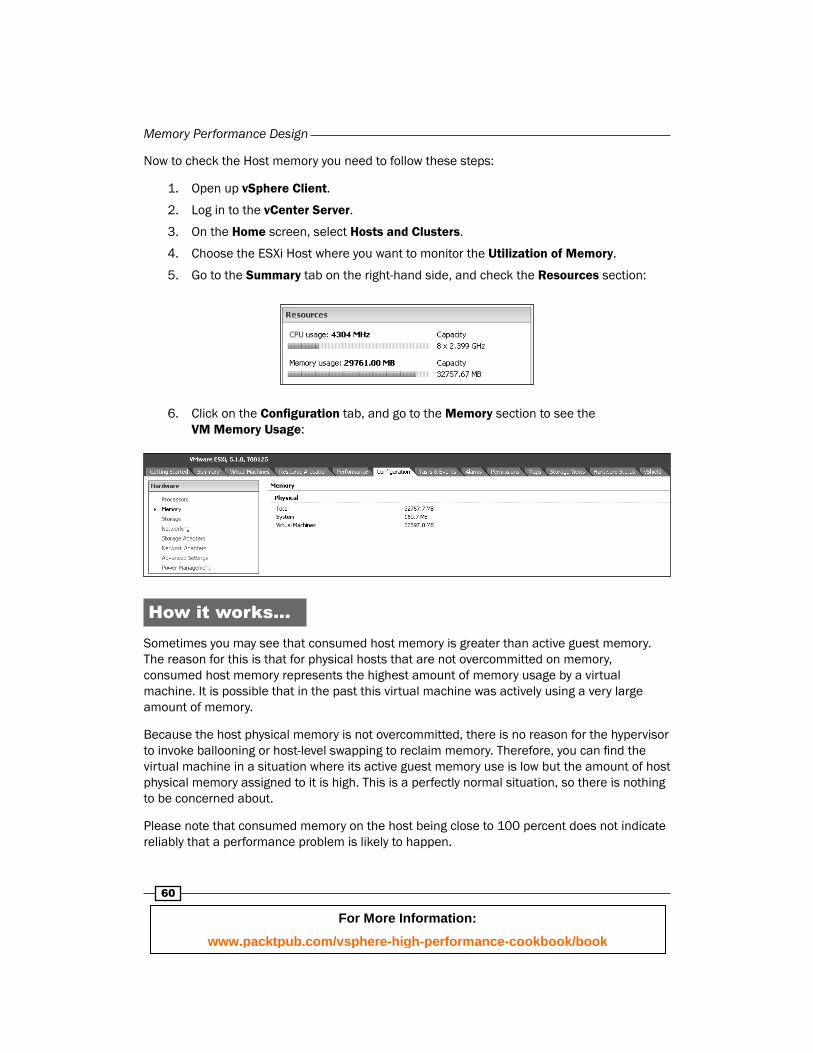
Now to check the Host memory you need to follow these steps:
1. Open up vSphere Client.
2. Log in to the vCenter Server.
3. On the Home screen, select Hosts and Clusters.
4. Choose the ESXi Host where you want to monitor the Utilization of Memory.
5. Go to the Summary tab on the right-hand side, and check the Resources section:
6. Click on the Confi guration tab, and go to the Memory section to see the VM Memory Usage:
How it works...Sometimes you may see that consumed host memory is greater than active guest memory. The reason for this is that for physical hosts that are not overcommitted on memory, consumed host memory represents the highest amount of memory usage by a virtual machine. It is possible that in the past this virtual machine was actively using a very large amount of memory.
Because the host physical memory is not overcommitted, there is no reason for the hypervisor to invoke ballooning or host-level swapping to reclaim memory. Therefore, you can fi nd the virtual machine in a situation where its active guest memory use is low but the amount of host physical memory assigned to it is high. This is a perfectly normal situation, so there is nothing to be concerned about.
Please note that consumed memory on the host being close to 100 percent does not indicate reliably that a performance problem is likely to happen.
For More Information:
www.packtpub.com/vsphere-high-performance-cookbook/book

Chapter 2
61
If consumed host memory is less than or equal to active guest memory, this might be because the active guest memory of a virtual machine might not completely reside in the host physical memory. This might occur if a guest's active memory has been reclaimed by the balloon driver, or if the virtual machine has been swapped out by the hypervisor. In both cases, this is probably due to high memory overcommitment.
Memory performance best practicesVirtualization causes an increase in the amount of physical memory required, due to the extra memory needed by ESXi for its own code and data structures, and you need to know what are the best practice standards you have.
There are four basic principles, which you should keep in mind:
Allocate enough memory to hold the working set of applications that you will run on the virtual machine, thus minimizing swapping. You can estimate the working set by monitoring the Active memory metric.
Do not disable the balloon driver
Keep transparent page sharing enabled. It's free!
Avoid overcommitting memory to the point that it results in heavy memory reclamation, especially non-trivial Swap In rates (KBps).
How to do it…So you may ask how we can determine the total required datacenter memory.
Well, there are several methods to determine the total memory capacity requirement:
Use the information gathered during the current-state analysis to determine the current memory capacity requirements.
Use application vendor documentation to estimate memory capacity requirements.
Actual datacenter usage analysis is typically more accurate.
Do not plan on fully utilizing host memory resources, plan only for 70–90 percent usage. Leave some headroom for such things as:
Increases in short-term utilization as part of the normal business cycle
Hardware maintenance and host patching
Failover in a VMware HA cluster
Failover from other datacenters during disaster recovery
VMkernel overhead
Virtual machine overhead
Future growth
For More Information:
www.packtpub.com/vsphere-high-performance-cookbook/book

Where to buy this book You can buy vSphere High Performance Cookbook from the Packt Publishing website: http://www.packtpub.com/vsphere-high-performance-cookbook/book. Free shipping to the US, UK, Europe and selected Asian countries. For more information, please read our shipping policy.
Alternatively, you can buy the book from Amazon, BN.com, Computer Manuals and most internet book retailers.
www.PacktPub.com
For More Information:
www.packtpub.com/vsphere-high-performance-cookbook/book