vulnerability analysis using attack graphs joint work with somesh jha (wisconsin) and oleg sheyner...
TRANSCRIPT
Vulnerability Analysis Using Attack Graphs
joint work with Somesh Jha (Wisconsin) and Oleg Sheyner (CMU)
Jeannette M. WingSchool of Computer ScienceCarnegie Mellon University
Pittsburgh, PA USA
2Attack Graphs Jeannette M. Wing
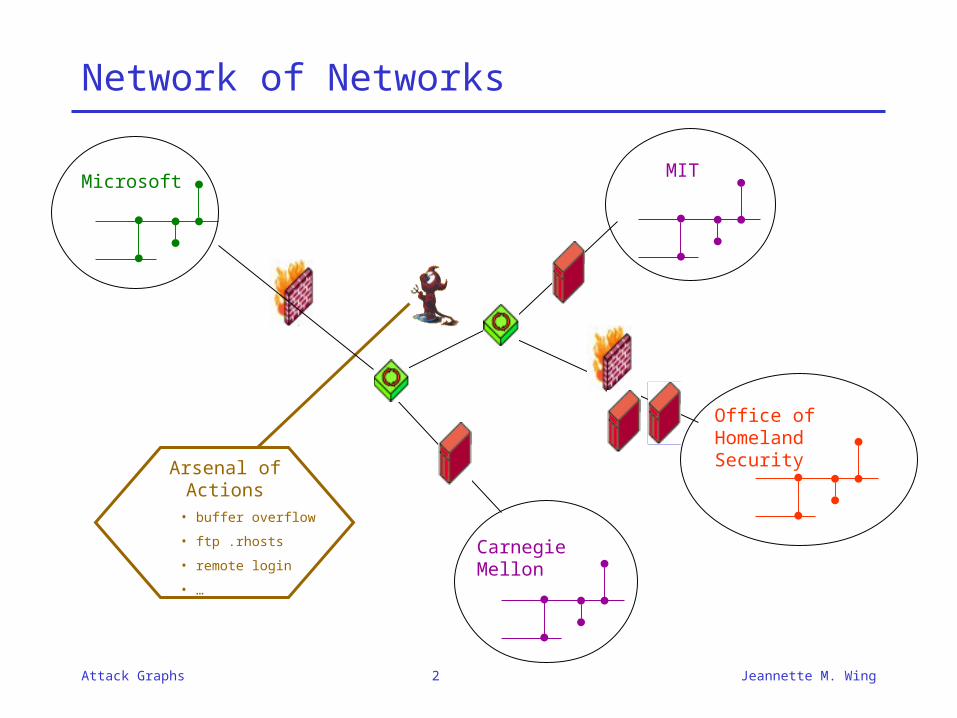
Network of Networks
MITMicrosoft
Office of Homeland SecurityArsenal of Actions
• buffer overflow
• ftp .rhosts
• remote login
• …Carnegie Mellon
3Attack Graphs Jeannette M. Wing
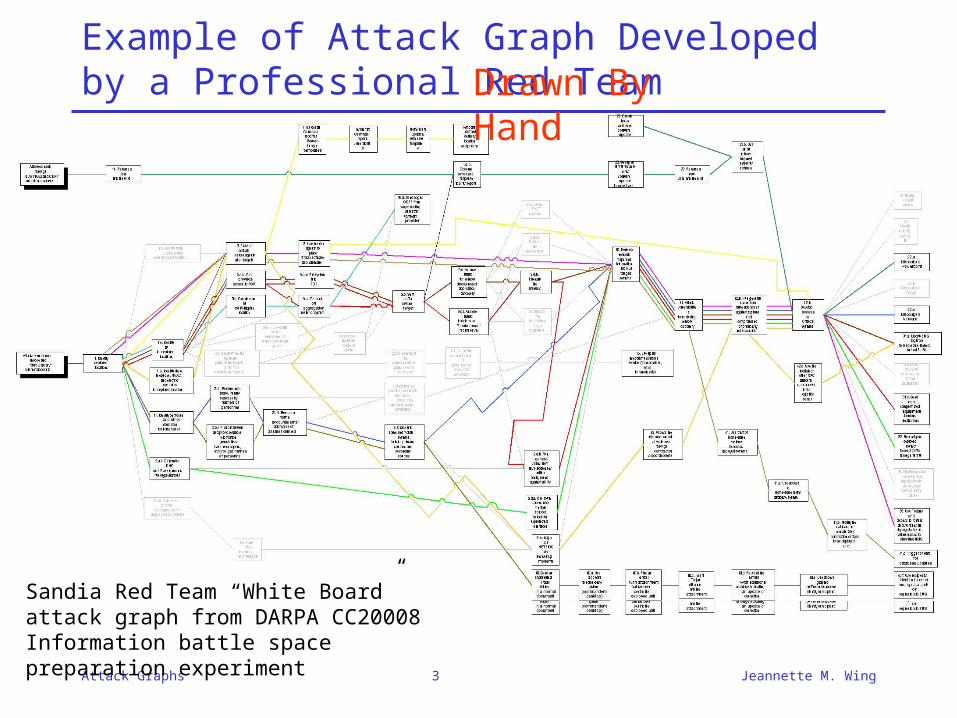
Example of Attack Graph Developed by a Professional Red Team
• Sandia Red Team “White Board” attack tree from DARPA CC20008 Information battle space preparation experiment
Sandia Red Team “White Board” attack graph from DARPA CC20008 Information battle space preparation experiment
Drawn By Hand

4Attack Graphs Jeannette M. Wing
Vulnerability Analysis by System Administrators
• Information-gathering– What attacks is my system vulnerable to?
• Is a different configuration of my system less “attackable”?
– What is the likelihood of this attack?– Is this on-going attack similar to any of the known
attacks?
• Decision-making– If I put this set of security measures in place, what
attacks can I prevent?– Given the likelihood of certain attacks, deploying which
measures will increase the security of my system?– What is the most cost-effective set of measures I
should deploy, to increase the security of my system?
5Attack Graphs Jeannette M. Wing
Problem Statement
• Problem: Generating attack graphs by hand is tedious, error-prone, and impractical for large systems.
• Our Goal: Automate the generation and analysis of attack graphs.
– Generation• Must be fast and completely automatic• Must handle large, realistic examples• Should guarantee properties of attack graphs
– Analysis• Must enable further security analysis by system administrators• Should support incremental, partial specification
6Attack Graphs Jeannette M. Wing
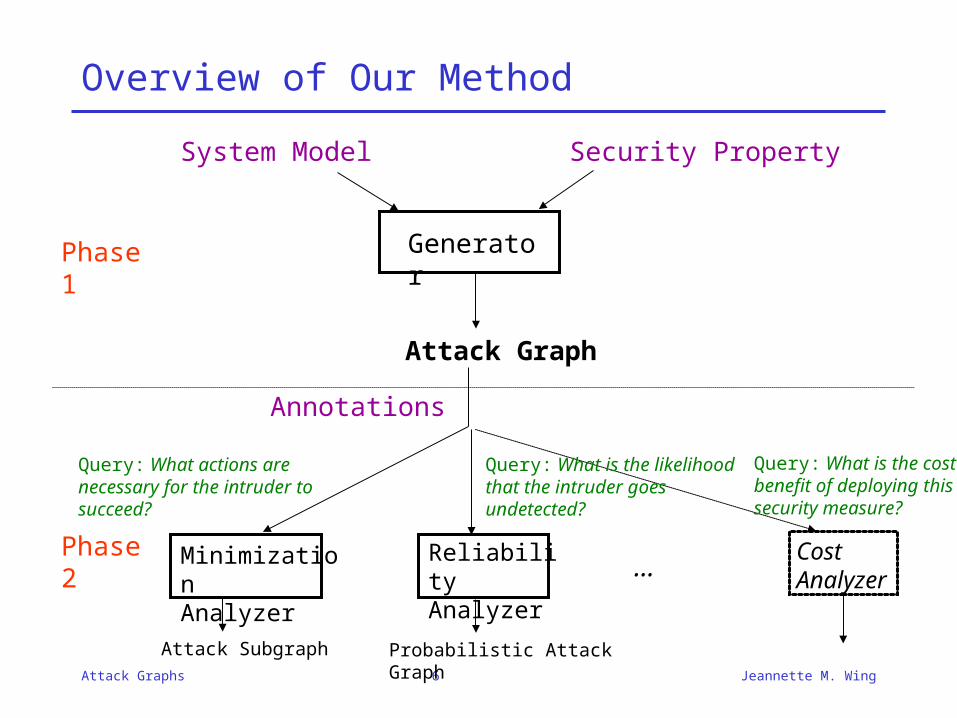
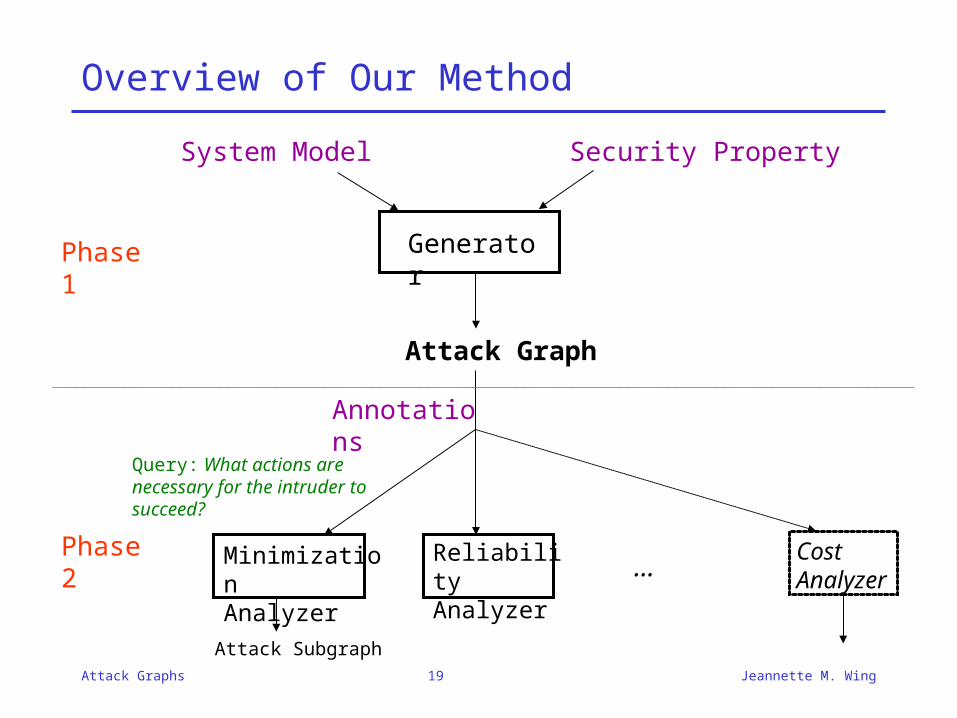
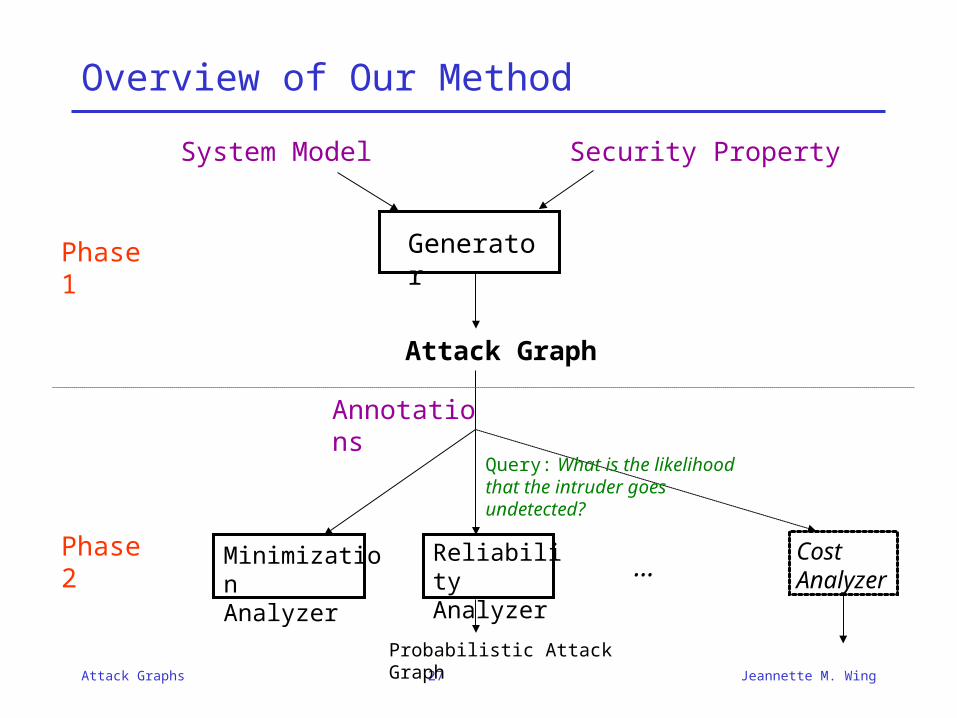
Overview of Our Method
Phase 1
Generator
System Model Security Property
Attack Graph
Phase 2
MinimizationAnalyzer
Query: What actions are necessary for the intruder to succeed?
Attack Subgraph
…CostAnalyzer
ReliabilityAnalyzer
Annotations
Query: What is the likelihood that the intruder goes undetected?
Probabilistic Attack Graph
Query: What is the cost benefit of deploying this security measure?
7Attack Graphs Jeannette M. Wing
Why Model Checking?
• Pragmatic reasons– Off-the-shelf technology– Major verification success story
• Technical reasons– Fast, automatic– Large state spaces– Handles safety and liveness properties– Generates counterexamples
8Attack Graphs Jeannette M. Wing
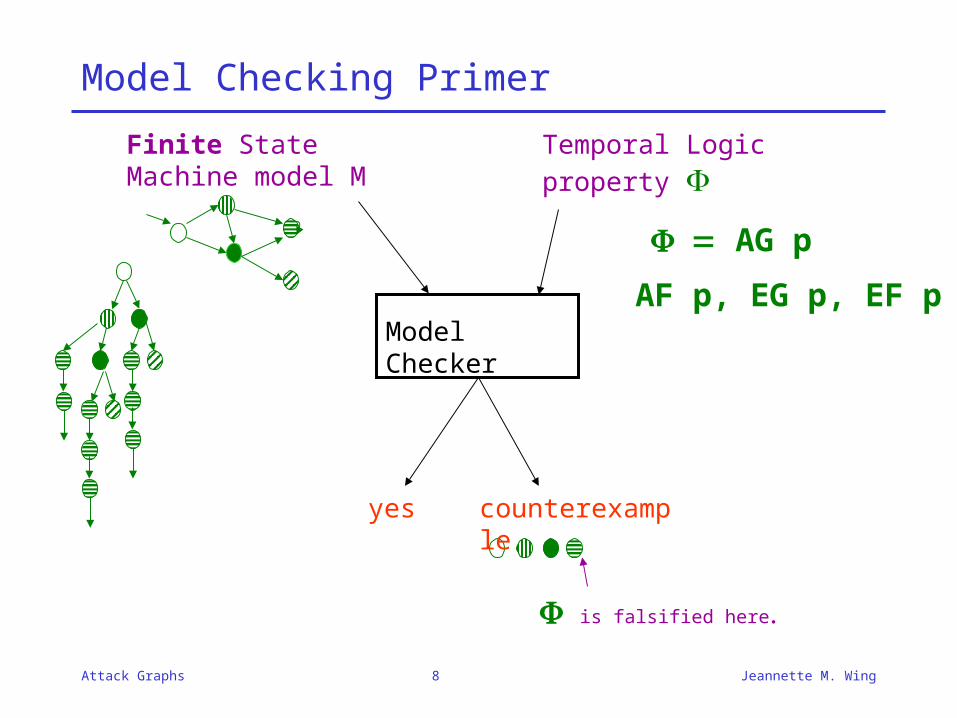
Model Checking Primer
Model Checker
Finite State Machine model M
Temporal Logicproperty
is falsified here
counterexample
yes
AG p
AF p, EG p, EF p
9Attack Graphs Jeannette M. Wing
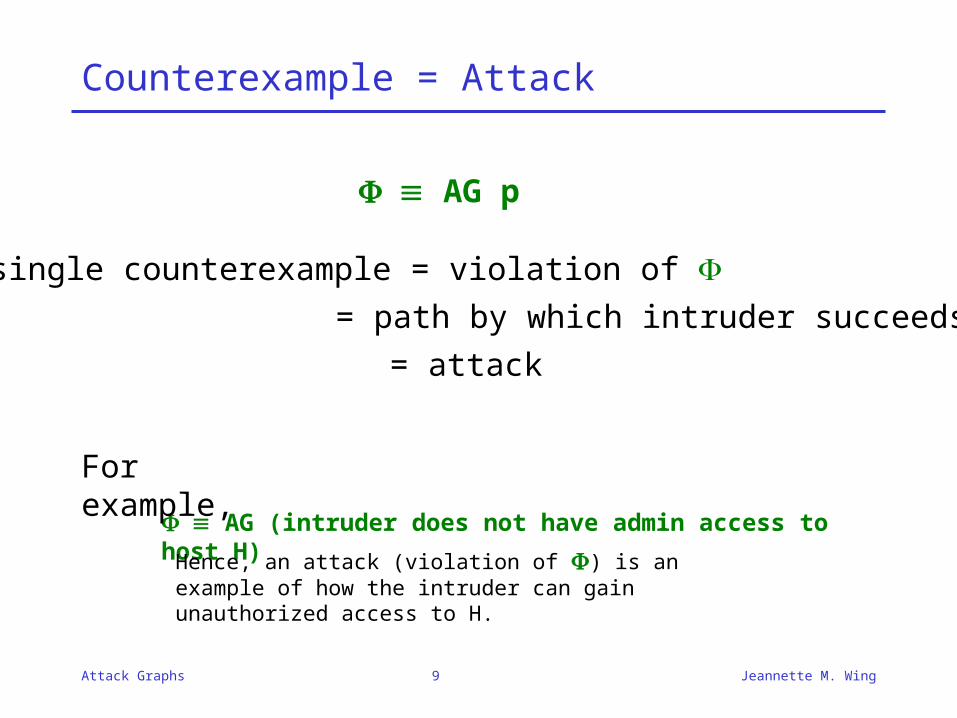
Counterexample = Attack
AG p
single counterexample = violation of = path by which intruder succeeds
= attack
AG (intruder does not have admin access to host H)Hence, an attack (violation of ) is an example of
how the intruder can gain unauthorized access to H.
For example,

10Attack Graphs Jeannette M. Wing
Definition of Attack Graph
• Given – a finite state model, M, of network
– a security property
• An attack is an execution of M that violates .
• An attack graph is a set of attacks of M.
11Attack Graphs Jeannette M. Wing
Properties of Attack Graphs
• Exhaustive– All possible attacks are represented in G.
• Succinct– Only relevant states are contained in G.– Only relevant transitions are contained in G.
The next two algorithms satisfy these properties.
12Attack Graphs Jeannette M. Wing
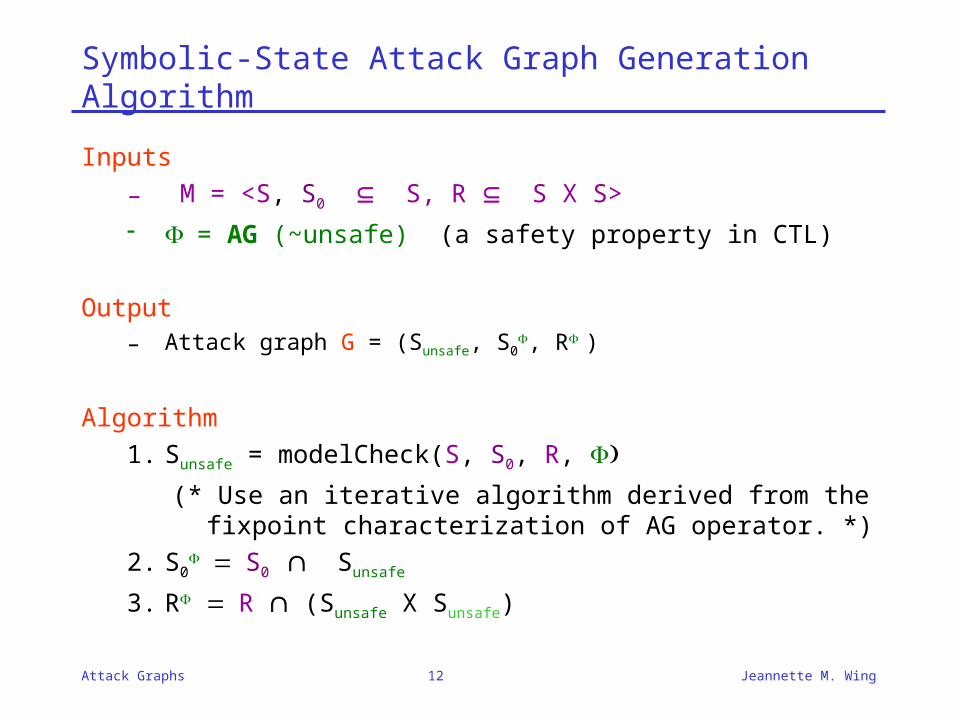
Symbolic-State Attack Graph Generation Algorithm
Inputs
– M = <S, S0 S, R S X S>
= AG (~unsafe) (a safety property in CTL)
Output– Attack graph G = (Sunsafe, S0
, R)
Algorithm1. Sunsafe = modelCheck(S, S0, R,
(* Use an iterative algorithm derived from the fixpoint characterization of AG operator. *)
2. S0S0 Sunsafe
3. RR (Sunsafe X Sunsafe)

13Attack Graphs Jeannette M. Wing
Explicit-State Attack Graph Generation Algorithm
Inputs– M– = LTL property (safety or liveness)
Algorithm1. Interpret both network model M and security
property as Buchi automata.• M and induce languages L(M ) and L().
2. Compute L(M )\L() = executions of M that violate .
3. Construct M ~ by computing intersection of Buchi automata.
Output - Attack graph G s.t. L(G) = L(M ~)
(request (response))

14Attack Graphs Jeannette M. Wing
Performance Charts
Symbolic-state algorithm Explicit-state algorithm
2 3 4 56 7
8
3
450.00
200.00
400.00
600.00
800.00
1000.00
1200.00
sec
Actions
Hosts 2 3 4 56 7
8
3
450.00
200.00
400.00
600.00
800.00
1000.00
1200.00
sec
Actions
Hosts

15Attack Graphs Jeannette M. Wing
Performance
Linear Regression R2 = 0.9967
0
5
10
15
20
25
30
35
40
45
0 100000 200000 300000 400000 500000 600000 700000 800000 900000
Reachable Transitions (Edges)
Gen
era
tio
n T
ime (
sec)

16Attack Graphs Jeannette M. Wing
An Illustrative Example
Action ArsenalIIS buffer overflow: remotely get rootSquid portscan: port scanLICQ remote-to-user: gain user privileges remotelyscripting exploit: gain user privileges remotelylocal buffer overflow: locally get root
database
attackerfirewall
Windows
Linux
ftpfirewal
l
IIS Web Server
Always Detected
IDS
17Attack Graphs Jeannette M. Wing
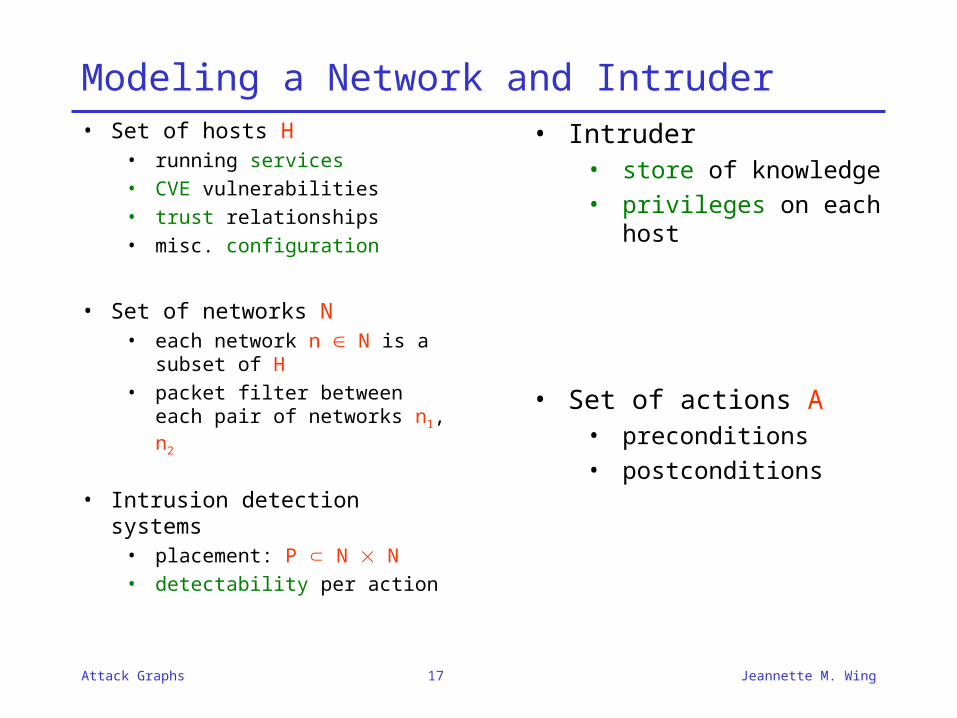
Modeling a Network and Intruder• Set of hosts H
• running services• CVE vulnerabilities• trust relationships• misc. configuration
• Set of networks N• each network n N is a
subset of H• packet filter between each
pair of networks n1, n2
• Intrusion detection systems• placement: P N N• detectability per action
• Intruder• store of knowledge• privileges on each host
• Set of actions A• preconditions• postconditions

18Attack Graphs Jeannette M. Wing
Example Attack Graph
Begin
IIS bufferoverflow
CAN-2002-0364
Squid portscanCVE-2001-1030
LICQ remote-to-user
CVE-2001-0439Local bufferoverflow
CVE-2002-0004
Done!
= G (intruder.privilege(Linux) < root)
19Attack Graphs Jeannette M. Wing
Overview of Our Method
Phase 1
Generator
System Model Security Property
Attack Graph
ReliabilityAnalyzer
MinimizationAnalyzer
Query: What actions are necessary for the intruder to succeed?
Attack Subgraph
…CostAnalyzer
Annotations
Phase 2
20Attack Graphs Jeannette M. Wing
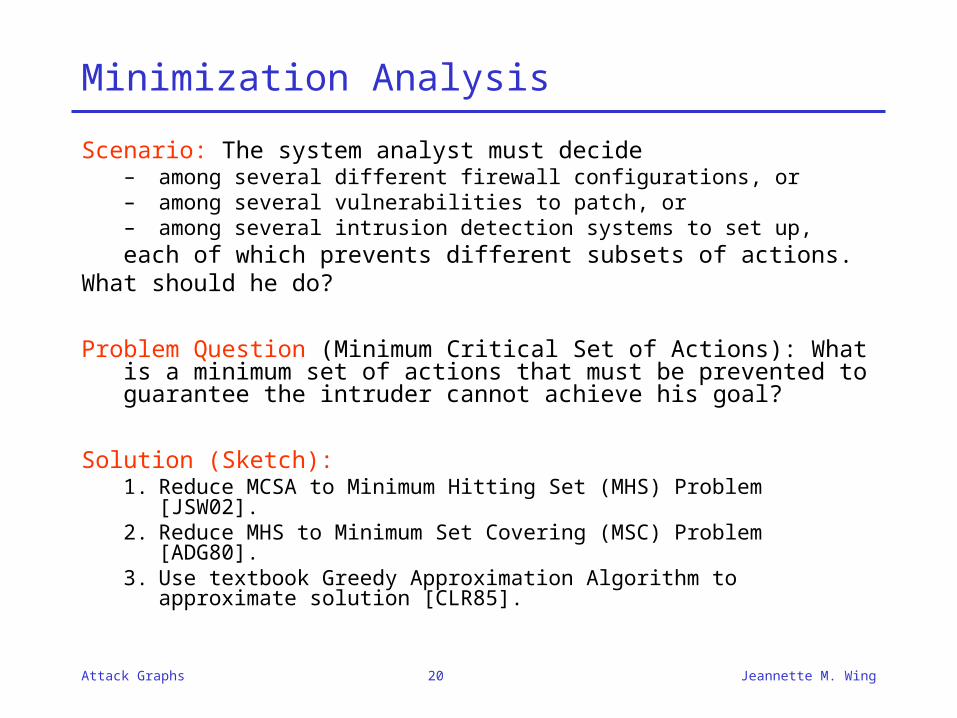
Minimization Analysis
Scenario: The system analyst must decide– among several different firewall configurations, or– among several vulnerabilities to patch, or– among several intrusion detection systems to set up,each of which prevents different subsets of actions.
What should he do?
Problem Question (Minimum Critical Set of Actions): What is a minimum set of actions that must be prevented to guarantee the intruder cannot achieve his goal?
Solution (Sketch):1. Reduce MCSA to Minimum Hitting Set (MHS) Problem
[JSW02].2. Reduce MHS to Minimum Set Covering (MSC) Problem
[ADG80].3. Use textbook Greedy Approximation Algorithm to
approximate solution [CLR85].

21Attack Graphs Jeannette M. Wing
Minimum Critical Set of Actions
A = the set of actions available to the intruder
Def 1: A set of actions C is critical if the intruder cannot achieve his goal using only actions in A \ C.
Def 3: A critical set of actions C is minimum if there is no critical action set of smaller size.
Finding a minimum set: NP-complete
Def 2: A set of actions C is realizable if the intruder can achieve his goal using only actions in C.
Minimum Critical Set of Actions (MCSA):Given a set of actions A and an attack graph G, finda minimum critical action subset C A

22Attack Graphs Jeannette M. Wing
Reduction to Minimum Hitting Set ProblemMinimum Hitting Set (MHS):
Given a collection C of subsets of a finite set S, find a minimum subset S’ S such that each subset in C contains at least one element from S’.
MCSA:Collection of realizable
sets of actions
MHS:Collection of
subsets C
MCSA and MHS are polynomially-equivalent.
[JSW02b] Jha, Sheyner, Wing, “Two Formal Analyses of Attack Graphs,” Computer Security Foundations Workshop, Nova Scotia, June 2002.

23Attack Graphs Jeannette M. Wing
Sketch of Reduction from MCSA to MHS
A
D
G
B C
E
H
F
I
S1 = {G,H,I}
S2 = {C,E,F,H}
S3 = {B,D,E}
H
G
I
B
D
E
C
F
H
G
I
H
E
C
F
B
D
E
24Attack Graphs Jeannette M. Wing
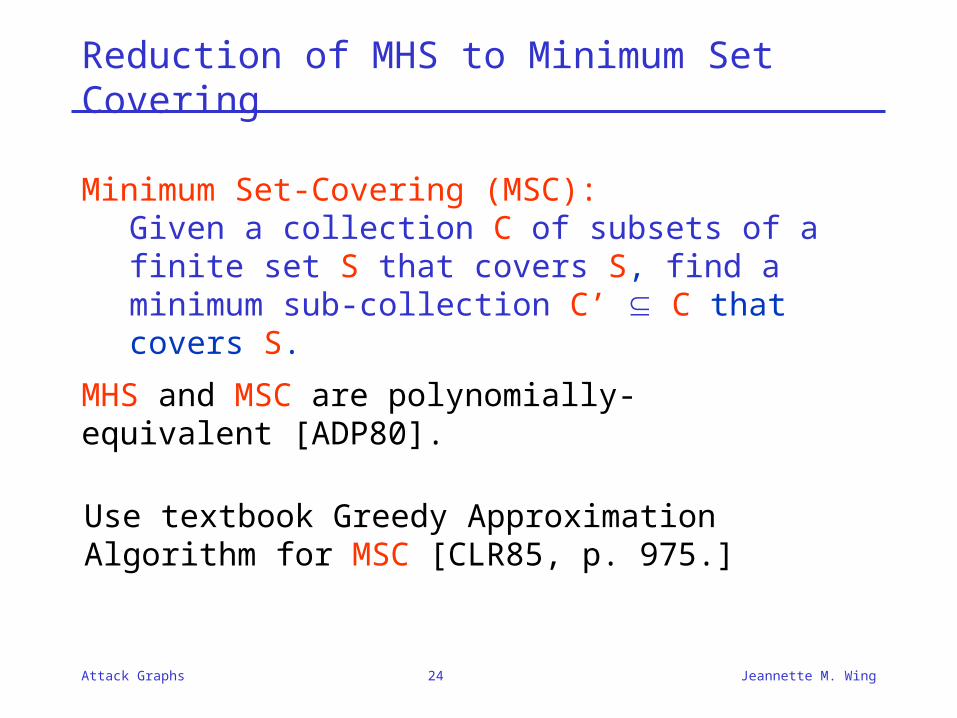
Reduction of MHS to Minimum Set Covering
Minimum Set-Covering (MSC):Given a collection C of subsets of a finite set S that covers S, find a minimum sub-collection C’ C that covers S.
MHS and MSC are polynomially-equivalent [ADP80].
Use textbook Greedy Approximation Algorithm for MSC [CLR85, p. 975.]
25Attack Graphs Jeannette M. Wing
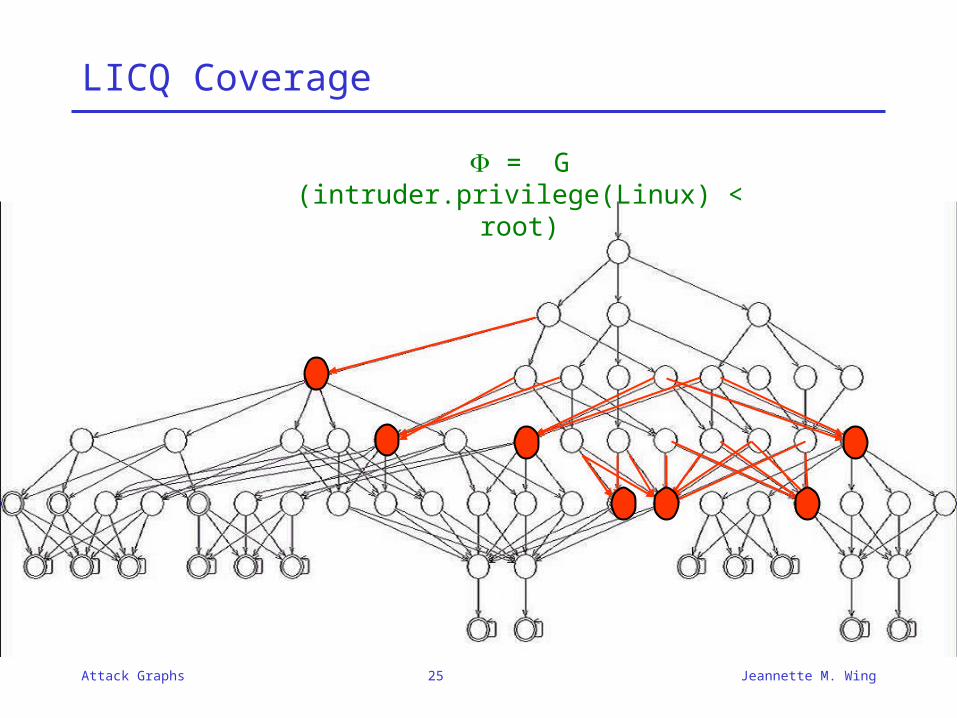
LICQ Coverage
= G (intruder.privilege(Linux) < root)

26Attack Graphs Jeannette M. Wing
Other Minimization Analyses [JSW02b, S04]Scenario: The system analyst has a set of
measures, each of which prohibits a subset of actions.E.g., M = {packet filter firewall, application firewall, smart cards, one-
time passwords, authentication policy servers, VPNs, anti-virus software, email filters, database encryption, host-based IDS, net-based IDS, network monitors, auditing, key stroke replicator, log analysis, forensic software, hardened O/S}
– Problem Question 1: If he deploys all measures, does the system become safe? [JSW02b]
• Solution Approach (Naïve): Remove all edges from graph that are “covered” by the measures. Reachability analysis is linear time in size of graph.
– Problem Question 2: What is the smallest subset of measures he can deploy to make the system safe? [S04]
• Solution Approach: Greedy algorithm with provable bounds. General case is NP-complete (slightly more complex than minimum cover problem).
27Attack Graphs Jeannette M. Wing
Overview of Our Method
Phase 1
Generator
System Model Security Property
Attack Graph
ReliabilityAnalyzer
MinimizationAnalyzer
…CostAnalyzer
Annotations
Query: What is the likelihood that the intruder goes undetected?
Probabilistic Attack Graph
Phase 2
28Attack Graphs Jeannette M. Wing
Reliability Analysis
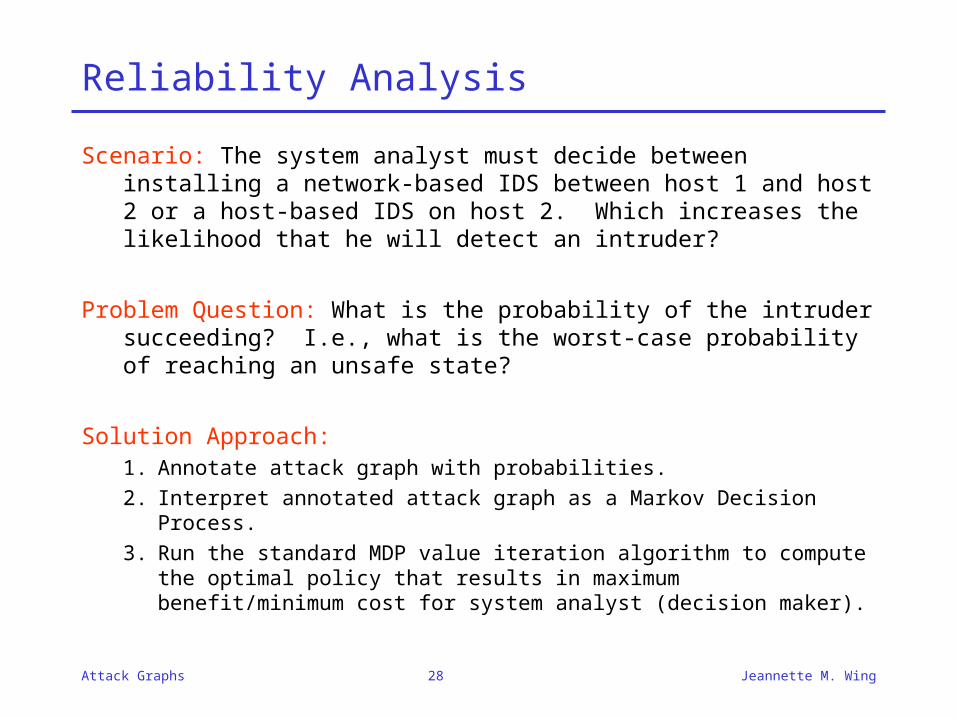
Scenario: The system analyst must decide between installing a network-based IDS between host 1 and host 2 or a host-based IDS on host 2. Which increases the likelihood that he will detect an intruder?
Problem Question: What is the probability of the intruder succeeding? I.e., what is the worst-case probability of reaching an unsafe state?
Solution Approach:1. Annotate attack graph with probabilities.2. Interpret annotated attack graph as a Markov Decision
Process.3. Run the standard MDP value iteration algorithm to compute
the optimal policy that results in maximum benefit/minimum cost for system analyst (decision maker).

29Attack Graphs Jeannette M. Wing
Status of Tool Suite
Attack Graph Generators
Host Configuration
Data System and Goal Specification
Model Builder
<XML/>
Attack GraphAnalyzers
NetworkConfiguration
Data
Library of Actions
Graphical User Interface
MITRE
Lockheed
SQLdatabase
OutpostServer
OutpostClients
Nessus
30Attack Graphs Jeannette M. Wing
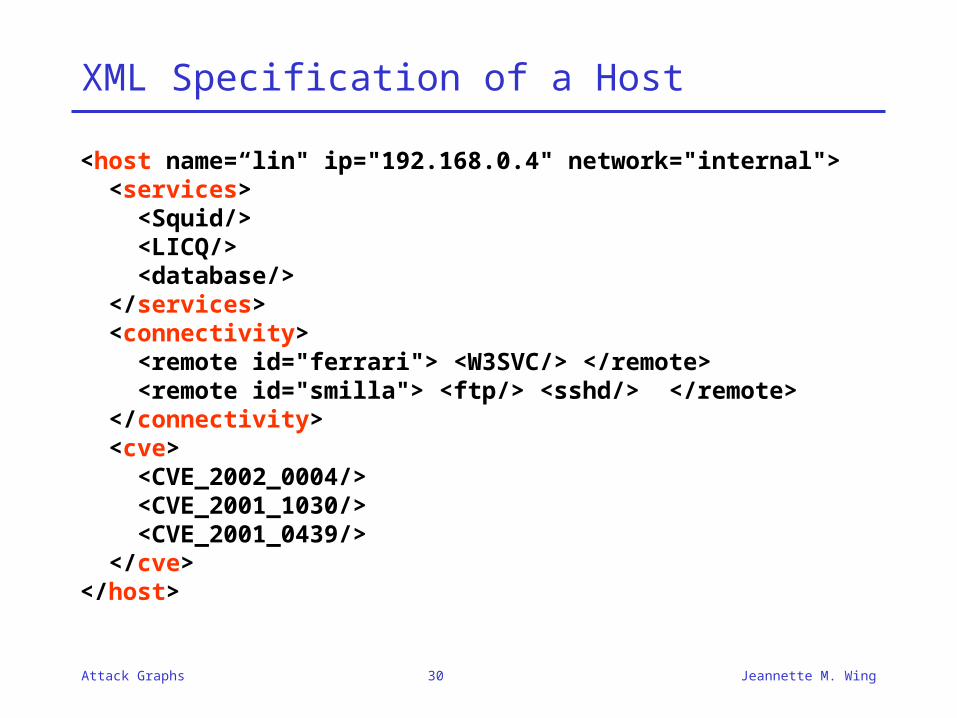
XML Specification of a Host
<host name=“lin" ip="192.168.0.4" network="internal"> <services> <Squid/> <LICQ/> <database/> </services> <connectivity> <remote id="ferrari"> <W3SVC/> </remote> <remote id="smilla"> <ftp/> <sshd/> </remote> </connectivity> <cve> <CVE_2002_0004/> <CVE_2001_1030/> <CVE_2001_0439/> </cve></host>
31Attack Graphs Jeannette M. Wing
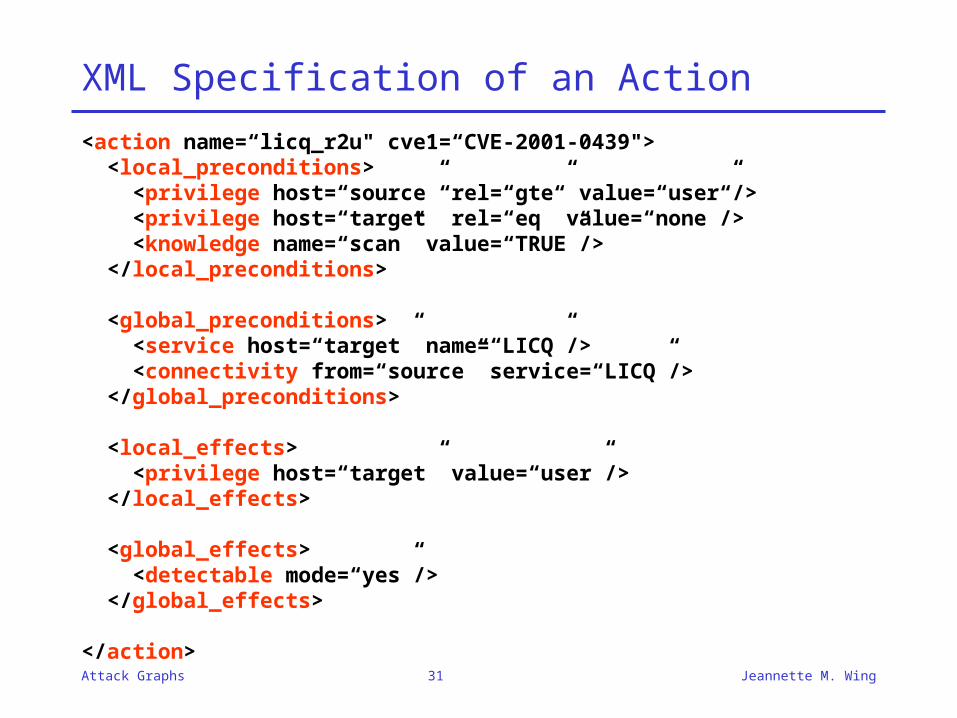
XML Specification of an Action
<action name=“licq_r2u" cve1=“CVE-2001-0439"> <local_preconditions> <privilege host=“source” rel=“gte” value=“user”/> <privilege host=“target” rel=“eq” value=“none”/> <knowledge name=“scan” value=“TRUE”/> </local_preconditions>
<global_preconditions> <service host=“target” name=“LICQ”/> <connectivity from=“source” service=“LICQ”/> </global_preconditions>
<local_effects> <privilege host=“target” value=“user”/> </local_effects>
<global_effects> <detectable mode=“yes”/> </global_effects>
</action>
32Attack Graphs Jeannette M. Wing
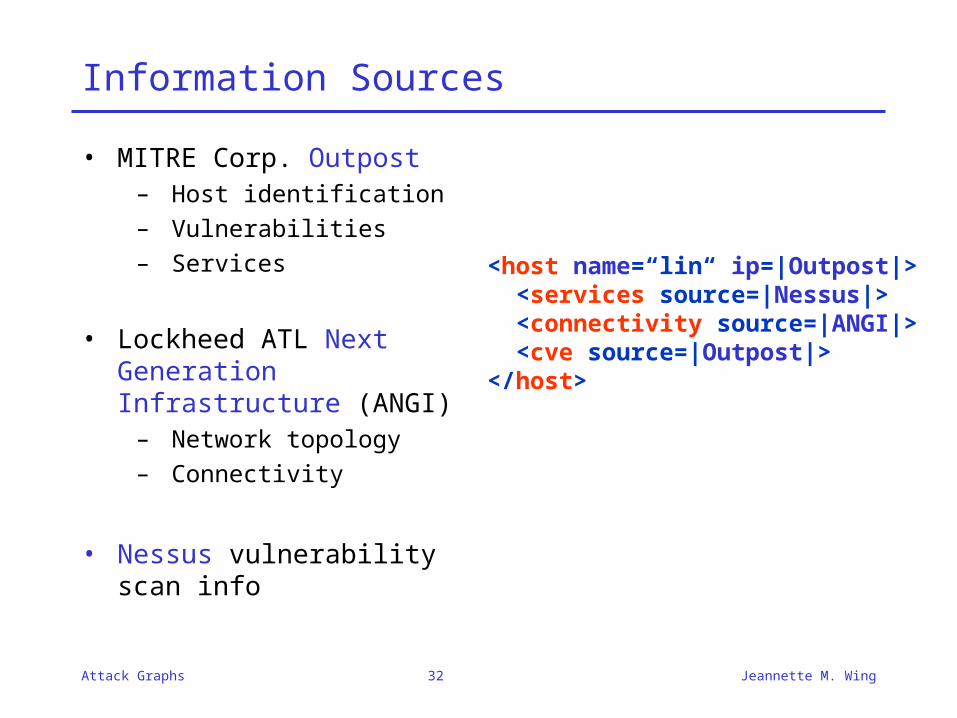
Information Sources
• MITRE Corp. Outpost– Host identification– Vulnerabilities– Services
• Lockheed ATL Next Generation Infrastructure (ANGI)
– Network topology– Connectivity
• Nessus vulnerability scan info
<host name=“lin“ ip=|Outpost|> <services source=|Nessus|> <connectivity source=|ANGI|> <cve source=|Outpost|></host>
33Attack Graphs Jeannette M. Wing
Related Work
• Philips and Swiler 1998– Tool constructs “attack graph” by forward exploration
starting from initial state. Also based on model checking.• Our backward algorithm saves space (vulnerabilities not
relevant are not explored) and can handle liveness properties.– Models only attacks
• Our modeling framework can handle arbitrary state transitions (actions), not just actions.
• Dacier 1994, Orlato et al. 1999– Privilege graphs: nodes = sets of user privileges, edges =
vulnerabilities. Explore privilege graphs to construct attack graphs.
– Defines a metric, Mean-Effort-To-Failure, based on attack graphs.
• Ritchey and Ammann 2001– Also use model checking. Produces only one counter-
example (attack).– No post-facto analysis.
34Attack Graphs Jeannette M. Wing
Limitations => Current and Future Work
• Input to graph generation– Need a library of specifications of actions (with CMU
students)– CERT advisories, MSR security bulletins, Symantec, …
• Ontology for vulnerabilities and exploits• Discover new attacks
• More analyses– Reduction of “attack surface”
• Which configuration of my system is less “attackable”?– Ongoing with Jon Pincus at MSR/Redmond and CMU students
– Cost-benefit analysis• Exploit MDP theory further
35Attack Graphs Jeannette M. Wing
Recent References
[JSW02a] Jha, Sheyner, and Wing, “Minimization and Reliability Analyses of Attack Graphs,” Carnegie Mellon technical report, CMU-CS-02-109, February 2002.
[JSW02b] Jha, Sheyner, Wing, “Two Formal Analyses of Attack Graphs, Computer Security Foundations Workshop, Nova Scotia, June 2002.
[SHJ+02] Sheyner, Haines, Jha, Lippmann, and Wing, “Automated Generation and Analysis of Attack Graphs,” IEEE Symposium on Security and Privacy, May 2002.