vulnerability assessment of coastal mangroves to impacts...
TRANSCRIPT

“Developing a Generalisable Method to define Coastal Resilience of Mangroves to Impacts of Climate Change”.
GEF Project:
Vulnerability Assessment of Coastal
Mangroves to Impacts of Climate ChangeFIJI CASE STUDIES September 2010

ISBN#
Copyright: © 2010 WWF Soth Pacific ProgrammeReproduction of this publication for resale or other commercial purpose is prohibited without prior written permission of the copyright holder
Citation: Fiu, M., Areki, F., Rounds, I., Ellison, J. (2010). Assessing vulnerability of coastal mangroves to impacts of climate change: case studies from Fiji. (2010). Report. Suva, Fiji, WWF South Pacific Programme

The implementation of this global project in-country and compilation of this report would not have been possible without the endorsement of the Department ofEnvironment, Republic of Fiji and funding support from UNEP-GEF.
We would like to thank Joanna Ellison from the University of Tasmania, Isaac Rounds, Fiona Heilala from the Herbarium Unit, IAS-USP, Simon McGree (former FijiMeteorological Services) and Francis Areki (former WWF) for their technical contribution to the documentation of Fiji case studies in mangroves vulnerability assessment.
We acknowledge with deep appreciation the endorsement from the Provincial Offices of Tailevu, Nadroga, Macuata and the support from communities of Verata,Tikina Wai, Tikina Kubulau that administered monitoring activities onsite plus sharing their local knowledge and putting up with much of the field visits to theirmangrove areas. Their support has been critical to the implementation of this project since 2006. We are grateful to the group of national stakeholders representinggovernment agencies, NGO partners, provincial representatives and experts who participated in the national communication sessions. We have drawn heavily upontheir insights and quoted liberally from their ideas during the progress of this project.
ACKNOWLEDGEMENT

AMS Accelerated Mass Spectrometry
CC Climate Change
DRR Disaster Risk Reduction
ENSO El Nino Southern Oscillation
FMS Fiji Meteorological Services
IPCC Intergovernmental Panel on Climate Change
GEF Global Environment Facility
GIS Geographical Information Systems
NOAA National Oceanic and Atmospheric Administration
NGO Non Governmental Organisation
PA Protected Area
PLA Participatory Learning Action
RSMC Regional Specialized Meteorological Centre
SEAFRAME Sea Level Fine Resolution Acoustic Measuring Equipment
SNC Second National Communications
SRES Special Report on Emissions Scenarios
UNFCCC United Nations Framework Convention on Climate Change
USP-IAS University of the South Pacific-Institute of Applied Science
WCS Wildlife Conservation Society
WGII Working Group II
WWF World Wildlife Fund for Nature
ACRONYMS

PART A- VULNERABILITY ASSESSMENT
1.0 Background 1
2.0 Site selection 2
3.0 Method Development 4 3.1 Fiji Islands Climate Change Trends and Projections 43.2 Ecological Assessment 4
3.2.1 Mangroves community 43.2.2 Seagrass watch 73.2.3 Coral reef resilience 83.2.4 Sea surface temperature monitoring 10
3.3 Geographical Information Systems site profiling 113.4 Evaluation of sites’ past relative sea level trends 123.5 Community and national stakeholders’ involvement 13
3.5.1 Climate Witness Toolkit 133.5.2 National Stakeholders 13
4.0 Results 144.1 Fiji Islands Climate Change Trends & Projection 144.2 Vulnerability Assessment Profiles 16
Kubulau 16Tikina Wai 23Verata 31
PART B- FRAMING ADAPTATION STRATEGIES
5.1 Important lessons from adaptation activities 345.2 Strengthening national mechanisms 35
6.0 References 367.0 Appendices 38
ACKNOWLEDGEMENTACRONYMS

8.0 List of Tables and Figures
Table 1 Project baseline information on environmental, social and economic setting 3Table 2 Three levels of mangrove monitoring techniques 5Table 3 The schedule for mangroves monitoring by community monitors 6Table 4 Summary of resilience assessment for coral reefs 9Table 5 Comparative summary of sites’ GIS profiling features 11Table 6 Summary of methods for evaluation of sites’ past SL trends 12Table 7 Mangrove survey results for Raviravi test site, Kubulau Transect 1 16Table 8 Difference in total mangrove area, Kubulau 17Table 9 Elevations of mangrove zones in Lomawai Reserve 22Table 10 Radiocarbon dating and sedimentation results for Lomawai and Kubulau 22Table 11 Mangrove measurements for Tikina Wai 23Table 12 Mangrove measurements for Verata 31
Figure 1 Pathway to developing a generalisable approach 1Figure 2 Fiji map of project mangrove sites 2Figure 3 Sketch map of Lomawai, Tikina Wai 6Figure 4 Sampling design for assessing coral reef health and vulnerability 8Figure 5 Typical step-by-step to processing aerial imagery for Verata 11Figure 6 The steps taken during the community engagement process 13Figure 7 Fiji climate change trends and projections 15Figure 8 Graph of mangrove trees’ diameter@breast height, Raviravi transect, Kubulau 16Figure 9-11 Mangrove distributions overlay, Kubulau 17Figure 12-13 Core locations and relative elevation, Kubulau 18Figure 14-16 Stratigraphy and pollen analysis results for Kubulau Core KB1 19Figure 17-19 Stratigtaphy and pollen analysis results for Kubulau Core KB2 20Figure 20A-B Community derived maps 21Figure 21a-b Graph of mangrove trees’ diameter@breast height, Tikina Wai 24Figure 22 Mangrove distribution mapping overlay 1994 and 2007 25Figure 23 Core locations and elevations, Lomawai, Tikina Wai 26Figure 24-26 Stratigraphy and pollen analysis results for Lomawai Core LW1 27Figure 27-29 Stratigraphy and pollen analysis results for Lomawai Core LW2 28Figure 30-32 Stratigraphy and pollen analysis results for Lomawai Core LW3 29Figure 33 Tikina Wai community prioritised CC concerns 30Figure 34 Graph of mangrove trees’ diameter@breast height, Tikina Verata 31Figure 35 Image of Verata mangrove patches 32
Appendices
Appendix I Mangrove survey results in tablesAppendix II Outline costs for VA activitiesAppendix III List of national stakeholders


1
PART A. VULNERABILITY ASSESSMENT
1.0 Background
WWF in partnership with the Global Environment Facility (GEF) is developing and test an adaptation approach through resilience building, the inherent ability to recover fromclimate change in high biodiversity tropical mangrove areas and associated coral reef, seagrass and upland ecosystems. The project by examining similar systems in multiplelocations, develops a generalizable method, generating replicable results between sites in mangroves, seagrass and coral reef ecosystems. The parallel situation drawn frommultiple sites allows for the development of regional scale planning, potentially promote protected area networks and linkages between threatened systems.
The project focus on four initiatives, jointly implemented with government, NGO, resource owners and communities with a stake in resource management of mangroves andassociated systems like coral reefs and seagrass meadows (refer to Figure 1).
The developed methodology assists conservation practitioners particularly WWF South Pacific Programme, to promote effective vulnerability assessments on coastal systems thus designing climate adaptation projects and contributing recommendations to related policies.
Scientific research to develop a vulnerability
assessment method
Vulnerability assessment to develop
adaptation strategies
Implementation of identified
adaptation measures
Incorporate policy recommendations and
adaptation measures to strengthen livelihood
security in the Pacific
Figure 1. Pathway to developing a generalizable approach for adaptive management in mangroves and associated habitats forcoastal resilience to climate change.
A s s e s s i n g v u l n e r a b i l i t y o f c o a s t a l m a n g r o v e s t o i m p a c t s o f c l i m a t e c h a n g e : F i j i c a s e s t u d i e s

2
2.0 Site selection
Fiji has the third largest mangrove area in the Pacific, extremely important ecosystems that are among the better studied areas in the Pacific. The climatic variation across thelarger Fijian islands influences mangrove distribution and ecology therefore, different locations are expected to experience distinct effects of climate change. There will also bedifferences in the rate of sea level rise within Fiji, as certain areas with its diverse mangrove and reef systems are experiencing tectonic uplift or subsidence, while others aretectonically stable (Nunn and Peltier, 2001).
CENTRAL DIVISION
MANGROVE SURVEY SITES
WESTERN DIVISION
SUVA
NAVUASIGATOKA
NADI
LAUTOKA BA
TAVUA
RAKIRAKI
KOROVOU
BUA
MACUATA
CAKAUDROVE
NAUSORI
NORTHERN DIVISION
TIKINA O KUBULAU
TIKINA O VERATATIKINA WAI
Figure 2. Fiji map of mangrove project sites
Tikina Wai is located on the dry leeward side of the higher volcanic island of VitiLevu. A significant portion of the area’s population, infrastructure and prime crop landare located in low lying coastal land enhancing susceptibility to rising sea level. Thearea’s local population is made up of predominantly semi-subsistence farmers andfishermen, that any adverse impacts upon their land or marine resources would severely affect them in terms of food security and income generation.
Tikina Verata is located on the wet and windward side of Viti Levu (the province ofTailevu). The mangrove stand approximately 5.30km2 in area on this side of the island is characterized by large stands of Bruguiera with the absence of salt pans.Most of the mangrove patches are located near or along the banks of creeks andrivers especially downstream of the Waidalice catchment.
Tikina Kubulau is located on the wet, windward side of the second largest island,Vanua Levu in the Bua Province. There are approximately 795 ha of mangroves distributed unevenly throughout the Kubulau area (Walls, 2008). The Raviravi mangrove forests were selected for the study due to its close proximity to the Kilakaand Yanawai Rivers to the immediate north, the Suetabu River to the immediate westand the Wainunu River further to the west.
VANUA LEVU
VITI LEVU
A s s e s s i n g v u l n e r a b i l i t y o f c o a s t a l m a n g r o v e s t o i m p a c t s o f c l i m a t e c h a n g e : F i j i c a s e s t u d i e s

3
Defining vulnerability: a future-focussed approach
Vulnerability refers to the tendency of something to be damaged, yet its ability to resist (absorb change) and/or recover from damage proves its resilience (ability tomaintain system function, services and processes in the face of change). Vulnerabilityapplies to physical entities i.e. people, ecosystems, coastlines as well as abstractconcepts of social and economic systems. The factors that cause the damage arehazards, each of which will be associated with some level of risk or likelihood of occurring. Climate vulnerability refers to ecosystems’ potential to suffer damage as aresult of climate change.
The Intergovernmental Panel on Climate Change (IPCC) has described climatechange vulnerability as: “The degree to which a system is susceptible to, or unable to
cope with, adverse effects of climate change, including climate variability and
extremes. Vulnerability is a function of the character, magnitude and rate of climate
variation to which a system is exposed, its sensitivity, and to its adaptive capacity” .
Vulnerability of Fiji mangroves and associated coastal habitats to climate change interconnect and the parallel characterisation of these three ecosystem types- mangroves, seagrass beds, coral reefs are considered. Pre-selection of project siteswere primarily based on available information and existing partnerships that work inkey mangrove areas critical to biodiversity conservation and sustainable development. A composite of environmental, social and bio-geographic indicators formangroves and coastal habitats (seagrass, coral reefs) as outlined in Table 1 provides the baseline information for the vulnerability assessment in determining the potential coastal resilience of mangroves and associated coastal habitats to climatechange effects at the three project sites.
Baseline information type TIKINA KUBULAU TIKINA WAI TIKINA VERATA
(Kubulau) (Nadroga) (Tailevu)
Physical Landscape2
Total land areaTotal marine (fishing) area i qoliqoli Extent (including perimeter)Status of mangrove area Land-use pattern
Threat level to mangroves
Demographics2
Number of villagesTotal population (1996 Census)Human population density
District annual growth rate
Major industries
Lead NGO
Holocene tectonics4
Sea level implications4 Negligible relative sea levelrise
Can be predicted globally Will experience greater sealevel rise
Uplifting Stable Subsiding
Climate baselines 1971- 2000 period3
Precipitation standards Annual rainfall=1882mm Max – Minimum air temperatureAverage air temperature=25.5oCRelative Humidity, %
Wet2338mm28.9-22.3 oC25.6 oC
79.8%
Dry188230.2 -30.8 oC25.5 oC70.6%
Wet2915mm28.4 -21.5 oC24.9 oC81.2%
10956 10 people/km2
0-1%
Pine plantation, semi-commercial faming/fishing
WCS active in the districtsince 2005
WWF active in the districtsince 1999
USP IAS active in the districtsince 1995
Sugarcane farming, pine planta-tion, tourism, semi-commercialfarming/fishing
Mahogany/pine plantations, cat-tle farming, semi-commercial farming/fishing
62,02623 people/km2
-0.3-0%
88,74637 people/km2
0-1%
100.3 km2
263 km2
7.44 km2
Intact 60% converted,40% intactLow
89.6 km2
50 km2
2.54 km2
Degraded85% converted, 15% intactMedium
235 km2
89.7km2
5.30 km2 (perimeter 101.5km)Degraded70% converted, 30% intactMedium
Table 1. Baselineinformation on environmental, social and economic setting ofthe project sites inFiji.
Intergovernmental Panel on Climate Change (2001). 2 WWF pers.comm 3 http://www.fms.gov.fj 4 Nunn and Peltier (2001).
A s s e s s i n g v u l n e r a b i l i t y o f c o a s t a l m a n g r o v e s t o i m p a c t s o f c l i m a t e c h a n g e : F i j i c a s e s t u d i e s

4
3.1 Fiji Islands Climate Change Trends and Projections
Climate processed data was acquired from the Fiji Meteorological Service (FMS) a department under the government with the responsibility to provide an essential national service. At a regional scale, FMS provides weather forecasting and tropical cyclone warning services to countries within of the tropical South-west Pacific.
Based on the request for historical climate baselines of Fiji and aggregated weather information from near weather recording stations for regions of Kubulau, Nadroga(Tikina Wai) and Tailevu (Verata) sites, FMS provided the following:
3.2 Ecological assessment
Vulnerability assessments of ecosystems to climate change provide a structure for examining the potential impacts of climate change and adaptation options. Duringthe vulnerability assessment process, the project attempted to assess what systems or aspects of the systems have greater resilience and resistance to climatechange impacts. Coral reefs and seagrass areas will serve as one variable each to compare and contrast different mangroves systems by specifically analyzingwhether their presence contributes to increased resilience and resistance. This type of information will assist in identifying sites that have greater long-term potentialas ecosystem “refugia” from climate change impacts.
The project also looked into both proximal and confounding factors causing climate change impacts. For example, the proximal cause of coral bleaching is increasedsea surface temperature, however there are many confounding variables suspected to exacerbate the rate of bleaching or hinder recovery from bleaching. These confounding factors include ultraviolet radiation, nutrients from terrestrial systems and resource extraction. By combining mangrove restoration with coral reef protection, the mutual benefits for surviving climate change can be assessed. Monitoring of the mangrove, coral reef and seagrass habitats was done yearly by thecommunity members at the mangrove permanent transect and an overall survey of the habitats every two years beyond project lifetime would be ideal, thus the strongcommunity-based training and monitoring program for sustainability.
3.2.1 Mangroves community
There are 3 levels in the monitoring techniques adapted for the mangroves research as part of the vulnerability assessment. Monitoring allows the identification ofchanges such as degradation or dieback and movement of zones which consequently and guide management decisions. Techniques are the same between sites toallow data comparison.
n Fiji Islands air temperature trends across Fiji during period 1957-2007
n Fiji Islands mean annual rainfall anomalies during period 1957-2007
n Lautoka 100 year annual rainfall trend during period 1905-2008
n Frequency of heavy rainfall events-Lautoka during period 1905-2008
n Net relative sea level trend at SEAFRAME sites in Australia and the South Pacific (mm/yr) since records began in early 90s, National Tidal Centre, Bureau of Meteorology.
n Regional Tropical Cyclone Trends in the Nadi RSMC Region (1970/71 to 2007/08)
n Temperature projections to the end of the 21st century. Monthly data for 12 models interpolated to Nadi, Fiji.
n Rainfall projections to the end of the 21st century over small islands by region (%) relative to the 1961-90 period WGII, 2008.
n ENSO projections to the end of the 21st century. Monthly data for 17 models, SRES A1B scenarios, 2008.
ME
TH
OD
S
Vulnerability assessments are a form of integrated assessment that aims tointegrate social, ecological and economic information. The project will firstdemonstrate a vulnerability assessment methodology to understand whataspects of the system are already experiencing climate change impacts orwhat aspects are most vulnerable to future impacts. The process for making these determinations is fairly standard, generally including three approaches:
Approach 1: on-site experimental research to determine changes,
Approach 2: gathering information from the literature on studies already conducted, and
Approach 3: scenarios based upon climate change model projections.
3.0 Method Development
A s s e s s i n g v u l n e r a b i l i t y o f c o a s t a l m a n g r o v e s t o i m p a c t s o f c l i m a t e c h a n g e : F i j i c a s e s t u d i e s

5
Type of monitoring Definition Equipment required Level of capacity & lessons Survey design per site
Transect based survey recordingof mangrove locations, specieszones, mangrove condition and identifying pressures. Along each transect three 10m x10m plots were laid out.
Vegetation plots in each zonerecording community structure,height and diameter of trees, density of seedlings.
Sedimentation monitoring and litter productivity. Leaf litter collection is periodical, minimumof a year, using “litter catch” to indicate vegetative production andthe timing of flowering, fruiting perm2 of mangrove forest.
Each litter catcher, 4 m of 4 cm diameter PVC pipe, 4 PVC corners to fit, glue to stick thesetogether into a square, about 2m2
of shade-cloth, small plasticratchet clips, rope to hang catcherin trees, plastic bags and markerpen for the catch, drying oven, 2 decimal place balance.Sedimentation monitoring- narrow PVC pipes or other narrowplastic building material (nylon rodis suitable), 50 cm long based onthe estimated combined length ofyour transects, where you will install one PVC pipe every 10 malong each transect. Small level. Hand-held tape measure.
Fieldwork In each permanentplot, hang 1m2 litter catchers inthe trees above the reach of tides,minimum three catchers per plot,emptied monthly into a plasticbag. These techniques take longerto carry out but can give good information on mangrove healthand sedimentation trends.Laboratory work Place each sample in a large oven proof tray,and dry the catch of each in anoven at 60°C for 2 days, then sortinto leaves, fruit, flowers, woodetc. and weigh each component.
• PVC pipe (50cm long) is
installed at every 10m along eachtransect and a monthly or yearlymonitoring is undertaken. • Tikina Wai and Kubulau sites
engaged in leaf litter trap and sedimentation PVC pipes placedin each plot. Data is periodicallycollected by trained communitymembers forming a network ofmangrove monitors.
All listed above plus small shortmetric tape measure (ie sewingtape measure) with mm intervalsmarked to measure tree girth, numbered aluminium tree tags &nails, hammers, binding wire & cutters, calipers if available tomeasure girth of small trees, extending surveyors staff for measuring height (can be borrowedfrom a survey department).
Level 2 monitoring takes about aday per transect and can involveboth project staff with communitygroups assisting.
Level 1
Level 2
Level 3
Pencil and copies of data sheet,clip board, 50 m fibre glass tape(open reel is best in mangrovemud), magnetic compass, photocopy of aerial photo of area,GPS, brightly colored flaggingtape.
• This type of monitoring is quick
to do and a suitable exercise forcapacity building with communitygroups. • Local knowledge from the
community is important for ease ofmovement in the mangrove areasand providing background on theuse of area, identifying otherstress variables in a relativelyshorter period of time.
• Tikina Kubulau
Four transects were placed, insets of 2 transects, along adjacentmangrove sites from Raviravi village with two to three 10m x10mplots from landward and seaward.• Tikina Wai
Four transects were placed along3 mangrove reserves.Lomaiwai Reserve (control site)with 2transects, Lotonaluya Reserve and Bole Reserve eachwith 1 transect.• Tikina Verata
Five transects were placed, withthree 10m x 10m plot in each ofthe 2 sites Naloto and Verata.Four of these transects were onNaloto and 1 on Verata
(control site).
Table 2. The three levels of monitoring techniques for assessing vulnerability of mangroves
Development of a monitoring schedule involve the participation of community group right from the start during the training to developing a monitoring schedule for the sustainable monitoring of permanent plots, sedimentation stakes and collection of litter catches periodically in the surveyed mangrove areas (refer to Table 3).
4 Ellison, J.( 2007). Manual for Mangrove Monitoring in the Pacific Islands Region (Draft 30th April, 2007). SPREP.
ME
TH
OD
SA s s e s s i n g v u l n e r a b i l i t y o f c o a s t a l m a n g r o v e s t o i m p a c t s o f c l i m a t e c h a n g e : F i j i c a s e s t u d i e s

6
Table 3. The drafted schedule for mangroves monitoring by the trained communitygroup of mangrove monitors
Sedimentation
stakes
(6 monthly)
Dec 07June 08Dec 08
Lomawai
Bole and Lotonaluya Reserves survey work
Lomawai groupMangroveAssessor
Collection o
f litter (monthly)
July/August07 (start of monthly collection)
T1Q1, T1Q2, T1Q3, T2Q1, T2Q2, T2Q3July/August 07
Lomawai – community mangrove monitors’ group
Permanent
plots (annual)
June-August 07June 08 (2nd monitoring)
T1Q1, T1Q2,T1Q3, T2Q1, T2Q2, T2Q3
MangroveAssessorLomawai group
Mangrove
transect (annual)
July/August 07
T1Q1, T1Q2,T1Q3, T2Q1, T2Q2, T2Q3 Transects (additional 2) added to thesampling design.
MangroveAssessor/ community mangrove monitors’group
ME
TH
OD
S
Monitoring
Activity
Timing
Area
Who
T1Q1
T1Q2
T1Q3
T2Q2
T2Q1
T2Q4
T2Q3
T1Q1 Survey site
A s s e s s i n g v u l n e r a b i l i t y o f c o a s t a l m a n g r o v e s t o i m p a c t s o f c l i m a t e c h a n g e : F i j i c a s e s t u d i e s
Figure 3. Sketch mapping of Lomawai mangroves.

Tikina Wai is the only site where seagrass surveys and monitoring were conducted mainly due to WWF’s ongoing community-based seagrass watch program. Survey techniques for assessing health and extent of seagrass growth along the coastline were adapted from Seagrass Watch survey protocol. Despite the seagrasshabitat assessment beyond the scope of this project detail, a comprehensive survey was conducted based on the probability of significant seagrass cover, accessibility to coastline plus the easy-to-use seagrass survey guidelines for community participation. These seagrass sites along the shoreline and adjacent barrierreef flats included representative examples of marine habitats of interest and mangroves areas. The surveys were conducted late June-August twice during the periods 2007 and 2009 which was primarily focused on providing detailed information (distribution and abundance) on high priority intertidal and shallow subtidalseagrass ecosystems along the Tikina Wai coastline.
Seagrass habitat were characteristics via visual estimates of above-ground biomass percentage cover (3 replicates of a 0.25m2 quadrat), species composition, percentage algae cover, sediment type, water depth and geographic location were recorded at each seagrass survey site.
Field equipment:
n Seagrass watch Kit includes 4x0.25m2 quadrat
n Seagrass ID guide
n Data sheets (3 per transectx3 transects per site)
n 50m measure tape
n 30cm ruler
n compass
ME
TH
OD
S
3.2.2 Seagrass habitat characterisation
Seagrass watch community monitoring along coastlineof Tikina Wai since 2002.
7
A s s e s s i n g v u l n e r a b i l i t y o f c o a s t a l m a n g r o v e s t o i m p a c t s o f c l i m a t e c h a n g e : F i j i c a s e s t u d i e s

8
There are two levels of sites.
1) Primary sites include detailed collection of all variables/methods in 5-10 sites at 2 survey depths for each site. More detailed monitoring of climate sensitive data i.e. coral bleaching condition, permanently marked/tagged corals (colony-specific observations of resistance/resilience oftargeted corals).
2) Secondary sites include more basic data collection, lower replication and more basic ecological survey methods in 30-40 sites at 2 depth surveys for each site.
3.2.3 Coral reef resilience
Primary sites
Secondary sites
Figure 4. Sampling design for assessing coral reef health and vulnerability status
ME
TH
OD
S
Tikina Wai and Kubulau (under the EBM project guidance) were 2 out ofthe 3 sites which conducted coral reef surveys of varying extent. However,a generalised reef survey sampling design is outlined is based on thefocus of the vulnerability assessment of coastal mangroves to impacts ofclimate change within report the limited project period of 3 years and thepurpose of characterisation of habitat type, of coral reef survey data, wasnot treated to a rigorous statistical analysis.
Coral reef status of the 3 sites vary depending on its proximity to major riverways influencing sediment input to local reefs and human population inducedby stress of fishing for subsistence and commercial exploitation of resources. Kubulau high coral cover reefs demonstrate higher integrity of coral reefhealth. Verata reefs, sites are heavily silted during period of survey, seasonally affected by the heavy rains which causes flooded waters, sediment and nutrient rich runoff to pour into the nearshore environment. Tikina Wai however, has an extensive lagoon, important gleaning grounds for women-fishers,and the diverse range of patch submerged reefs dot the coastline bordered by the Navula barrier reef, proximal to an important channel for large ships enroute to Lautoka International Port. For the purpose of this report, the coral reef component in this document is not discussed in length.
A s s e s s i n g v u l n e r a b i l i t y o f c o a s t a l m a n g r o v e s t o i m p a c t s o f c l i m a t e c h a n g e : F i j i c a s e s t u d i e s

9
Component Method/approach Equipment
1 Benthic cover
2 Coral community structure (genera)
3 Coral size class distributions (selected genera)*
4 Coral condition
5 Fish community structure - herbivores
6 Resistance and resilience indicators
Compatible with main long term monitoring approach in the area. Method used point transects.
Visual estimate - relative abundance of generaat the study site, in 5 classes – dominant, abundant, common, uncommon, rare.
Belt transects (25 * 1 m, four replicates) withsub-sampling using quadrats for colonies > 10cm. 15-20 selected genera, in doubling sizeclasses (0-2.5, 3-5, 6-10, 11-20 cm etc)Slate, marked along its top with 5, 10 and 20 cmto help guide size estimates.
Incidence of coral bleaching, disease, other conditions and mortality in the size distributionbelt transects then in the general study site.
Long swim and belt transects (50 * 5 m, threereplicates) recording incidence of large indicatorfish and main functional groups, focusing onherbivore functional groups.
Visual estimation (e.g. slope) or 5-point scale ofresistance and resilience indicators across multiple factors – • benthic cover, • physical site parameters, • substrate and reef morphology, • cooling and flushing, • shading and screening, • extreme conditions and acclimatization,
coral condition, • coral population structure and coral
associates, • fish functional groups (herbivory), • connectivity and anthropogenic conditions.
Genus guide for corals
Datasheets- benthic, fish, invertebrates.
1m ruler/stick marked at 10, 20, 40 and 80 cm tohelp guide size estimates (3/4” PVC tube idealfor this). Fish stick per observer
Benthic data sheet+Coral Watch Coral HealthChart
Transectx50m line, datasheet with ID sheet ofmain groups.
Table 4. Summarises the resilience assessment for coral reefs according to 6 field components, grouped into the following six areas by data collection approach 6 :
ME
TH
OD
S
6Obura, D. and Grimsditch, G. (2008). IUCN CCCR Resilience Assessment Protocol.http://www.projectaware.org
A s s e s s i n g v u l n e r a b i l i t y o f c o a s t a l m a n g r o v e s t o i m p a c t s o f c l i m a t e c h a n g e : F i j i c a s e s t u d i e s

10
3.2.4 Sea surface temperature SST logger
The HOBO U22 Water Temp Pro v27 logger is designed with a durable, streamlined, UV-stable case for extended deployments to allow the measurementof temperature in fresh or salt water. The logger was set and deployed to at least 15m depth of coral reef to record in situ seawater temperature on hourly-intervals, this is real time thermal measurements down the barrier reef adjacent to mangroves, mudflats and seagrass areas of Tikina Wai.
Air temperature influences the top 5metres along the water column, therefore, the results of the HOBO logger at a 15m depth is reliable to detect any significant temperature change, usually warmer waters that may cause thermal stress to coral conditions and its eventual bleaching. Mean monthly air temperature readings from the nearest weather monitoring station (Nadi/Lautoka) has a temperature range of 25.2-27.0 0C which has been extrapolatedagainst the automated sea temperature readings to detect any signal on warming of water at 15metre depth, crucial information to coral reef studies on potential localized coral bleaching.
Heat conducts differently in air or seawater as well as down the water column where water is expectedly cooler under ‘normal conditions’. Data from theHOBO logger deployed at the local reef site can provide real time temperature information for the NOAA’s Coral Reef Watch Program from satellite datafor both monitoring and assessment of coral bleaching. Bleaching alerts at a temperature range of 27.7-29.30C, a difference of 0.2-1.10C higher than normal. Alert levels are triggered when there is a 100C above the long term monthly average temperature recorded over an extended period and coralbleaching is expected to occur8.
HOBO U22 Water Temp Pro v2 logger.
Features The durable logger has a 12-bit resolution and precision water temperature sensor for ±0.2 0C accuracy over a wide temperature range. Waterproof to 120m depth.
ME
TH
OD
S
7http://www.onsetcomp.com
8http://www.osdpd.noaa.gov/ml/ocean/cb/hotspots.html
A s s e s s i n g v u l n e r a b i l i t y o f c o a s t a l m a n g r o v e s t o i m p a c t s o f c l i m a t e c h a n g e : F i j i c a s e s t u d i e s

11
3.3 Geographical Information Systems site profiling/ remote sensing
In order to discriminate short-term, local effects from long-term regional drivers of mangrove change, mangrove distributions between a range of periodsfor each of the 3 mangrove sites were mapped from aerial photographs. Comparison was then made with more recent mapping from 2001 satellite imagery completed by the Fiji Department of Forestry.
The GIS mapping profile for the 3 project sites were conducted separately by 3 different personnel representing the facilitating partner organisation of theproject. WCS provided GIS mapping report for Kubulau site, USP-IAS (Institute of Applied Sciences) provided for Verata and WWF contracted a GIS technician to conduct the mapping for Tikina Wai. Table 5 highlights the features each of the profiled sites mapped in summary, however, for more. Moredetail on the GIS profiling can be read from the sites’ GIS mapping report.
Features Kubulau Tikina Wai Verata
Habitat mapping
MangrovesMangrove zonesCoral reefsSeagrass habitatsLand-use patterns
Change detection
Mangroves coverSalt pans extent
GPS positions
coral reef surveysseagrass surveysmangroves sites
P
O
P
NA
O
P
NA
P
O
P
P
O
MonitoringMonitoring
P
P
P
P
P
P
P
O
O
NA
O
P
NA
P
O
O
Table 5. A comparative summary of sites’ GIS profiling features.
Mapping mangrove change through time and land-use patterns
Kubulau - scanned black and white (1954, 1978, 1994) aerial photographs, at scales of 1:10,000 covering the coastal portions of Kubulau district were obtained from the Fiji Department of Lands. Individual photographs were mosaic using ArcGIS 9.2 software. Each photomosaic was georeferenced to hydrology data (roads, river, creek, places) using at least 20points with a total root mean squared error (RMSE) of less than 3.5 m. Mangrove regions (to nearest ha) were manually digitized based on tone, texture and contrast with adjacent substrates (Jupiter et al. 2007). ArcGIS 9.2 and MapInfo software was used to calculate the total area and perimeter of mangroves for each dataset. These distributions were compared from mangrove regions for 2001 manually digitized by the Fiji Department of Forestry Landsat ETM+ satellitedata for all of Fiji, subset to the Kubulau region9.
Tikina Wai- aerial photographs for 1938, 1993/1994, 2007/2008 were mapped and compared across a time series forchange of mangrove areas and salt pans.
Verata - aerial photographs for 1951, 1967/1968, 1978, 1986 and 1994, plus a Landsat 7 ETM+image with the following parameters were used in the mapping exercise. Good Earth Pro was used for the acquisition of high resolution Ground Control Points9 .
Hard copy-aerial
photography
Google Earth Pro
Scanned at 600PDI and converted to .tiff image format
Coarse sub-setting of aerial imagery based on 2km bufferaround digitised 2002 mangrove areas
Digitising of 2002 mangroveareas from Lands at 7ETM+ imagery at 1:20,000 scale
Mosaicing of multiple imageswhere mangrove area spanstwo or more images
Fine georeferencing of aerialimagery to ensure positionalaccuracy across time-seriesimagery
High scale digitisation of aerial imagery to allow spatialchange detection of mangrove areas
Initial georeferencing to Lat/Long WGS84 according to GE ground control points
Figure 5. Step bystep process, USP-IAS applied toprocessing aerial imagery for the Verata mangrovesite.
Lands at 7ETM+imagery
ME
TH
OD
S
Lands at 7ETM+imagery
9USP IAS (2009) Verata GIS mapping report (unpublished). WCS (2009) Kubulau GIS mapping report
A s s e s s i n g v u l n e r a b i l i t y o f c o a s t a l m a n g r o v e s t o i m p a c t s o f c l i m a t e c h a n g e : F i j i c a s e s t u d i e s

12
3.4 Evaluation of sites’ past relative sea level trends10
The reconstruction of paleo-environmental mangrove response to past sea level change can be used to predict how mangroves may respond to current rising sea levels.
Table 6 provides a brief description of the methods utilised in two project sites for evaluation of its past relative sea level trends.
Equipment/materials required Methods
Coring techniques andrelative elevations
Radiocarbon dating
Analysis of pollen
Map-mangrove zonationA Hiller Corer with a 1m sample chamber length & 4cmdiameter , Russian Peat Corer with a 50cm samplechamber length & 5cm diameter.Tripod mounted level (temporary tide gauge), MunsellSoil Colour Charts
Spatula, aluminium foil, ziploc plastic bags
• 3 coring sites @Lomawai, Tikina Wai along the landward-seaward transect. For determining elevations, a temporary tide gauge was used at sites through the mangrove swamp in depth relative to sea water level.
• 2 coring sites @ Kubulau, one on the seaward edge of the mangrove forest and about60metres inland on the edge of the river. Relative elevations of this site were determined from the high tide markings on the mangrove trunks.
Samples collected for radiocarbon dating and analysis were removed from the corer usinga spatula, placed on aluminium foil and wrapped on site in individual plastic bags to avoidcontamination. They were sent to Beta Analytic Incorporated in Florida, USA for Accelerated Mass Spectrometry (AMS). Radiocarbon dating is a method of dating materialwhich has been buried from contact with any decaying process.
Samples for pollen analysis were taken from cores at 10 cm intervals and stored in coolconditions in Ziploc bags. They were taken by Australian Quarantine at Sydney Airport forgamma irradiation sterilization, as arranged by a University of Tasmania Quarantine Permit.
Table 6. Summary of methods utilised for evaluation of sites’ past sea level trends.
ME
TH
OD
S
10Ellison, J. and Strickland, P.(2009).
A s s e s s i n g v u l n e r a b i l i t y o f c o a s t a l m a n g r o v e s t o i m p a c t s o f c l i m a t e c h a n g e : F i j i c a s e s t u d i e s

13
3.5.2 National Stakeholders12
Mangroves management is complex and involve many line ministries and departments, governed by bits of legislations.Throughout the project history, two national stakeholders sessions have been conducted and involvement with related keymangrove-climate change discussions including the development of the Framework for Integrated Coastal Zone Management. All projects relating to climate change across sectors contribute to a database developed by the Department of Environment as the national focus. Two parallel project processes occur at the national level i.e. the Second National Communications (SNC) for the UNFCCC reporting obligations of developing countries and the Fiji National Climate Change Country Team that oversees all climate change related activities including the SNC project.
This project’s outcomes inform the national process in terms of highlighting the need for protection of remaining mangroves areas and contribute to discussion of assessing vulnerability of key ecosystems (coastal) in Fiji that hasregion wide implications.
3.5 Local community and national stakeholders’ engagement
3.5.1 Climate Witness11 Toolkit
This component is a community-based survey of focus groups and engaging with them on the participatory learning andaction (PLA) process to understand environmental and climate changes issues. This will provide primary information forthe vulnerability assessment, improve on awareness/ perceptions of communities to inform the adaptation strategies andparticipatory components of monitoring. It may include some basic socio-economic information.
Three components to include in the community participatory assessment include:
a) specific issues and features of the local setting and climate variabilityb) develop a seasonal calendar of observations, particularly relating to localised mangrove/coral reef interactionsc) changes over the local history for as far back as memory of community serves.
The PLA tools of using timelines, community mapping, seasonal calendars for quantifying changes observed with regardto climate change. The identification and prioritisation of problems relating to potential extreme climate events and vulnerabilities, then assessing community perspectives on adaptation measures and the prioritisation of the adaptationmeasure most suitable for implementation onsite. A detailed description and illustration on how this process was undertaken is illustrated in Figure 6.
A socio-economic (SE) component to these community participatory exercises was conducted to complement secondaryinformation collected per site to inform the process of developing and implementing adaptation strategies to cater forlong-term changes and vulnerability, eg. issues of control and access, pine logging upstream local river system, flooding,wild fires.
PROBLEM LISTING
ROOT CAUSES ANALYSIS
SOLUTION DEVELOPMENT
COMMUNITY ACTION PLAN
ASSESMENT OF DEVELOPMENT
OPTION
Figure 6. Schematics of the community participatory assessment process.
ME
TH
OD
S
11http://www.wwfpacific.og.fj
12Fiji National Stakeholders’ Communications Session Report, 2009.
A s s e s s i n g v u l n e r a b i l i t y o f c o a s t a l m a n g r o v e s t o i m p a c t s o f c l i m a t e c h a n g e : F i j i c a s e s t u d i e s

1414
RE
SU
LT
S
4.1 Fiji Islands Climate Change Trends and Projections13
4.0 Results
Regional Tropical Cyclone Trends
Temperature increases widespread across Fiji~ 0.6ºC over last 50 years (similar to neighbouring countries)Similar inc. in rate for both day and night time temperatures
Annual Mean Temperature Anomalies for Fiji
Te
mp
era
ture
s, (D
eg
ree
Ce
lciu
s)
Almost no trend (slightly negative) over the last ~50 years on a Fiji scale. El Niño (droughts)and La Niña (wet periods) effect on Fiji’s climate significant e.g. almost -900mm in 1998 andalmost +1000mm in 1999
Likely increase in tropical cyclone intensity (wind and rainfall). Global decrease oftropical cyclone numbers.
FMS/WWF Study 2008: Monthly data for 12 models interpolated to Nadi, Fiji: 5 models 1.5-2.0 0C, 5 models 2.0-2.50 0C, current trend ~1.50 0C.
Table SPM.1. Projected global averaged surface warming and sea level rise at the end of the21st century. (Table 3.1)
Fiji Islands Mean Annual Rainfall Anomalies for Fiji ( since 1957 )
Ra
infa
ll A
no
ma
lies (
mm
)
Rainfall Anomalies for Fiji 5 Year Running Mean
Linear (Rainfall Anormalies)
Bestestimate
0.6
1.82.42.42.83.44.0
Likelyrange
0.3 - 0.9
1.1 - 2.91.4 - 3.81.4 - 3.81.7 - 4.42.0 - 5.42.4 - 6.4
Model-based range excluding futurerapid dynamical changes in ice flow
Not available
0.18 - 0.380.20 - 0.450.20 - 0.430.21 - 0.480.23 - 0.510.26 - 0.59
Temperature change(0C at 2090 - 2099 relative to 1960 -1999) a,b
Sea level rise(m at 2090 - 2099 relative to 1960 -1999)
Case
Constant year 2000concentrationsb
B1 scenarioA1T scenarioB2 scenario
A1B scenarioA2 scenario
A1FI scenario
13Source: Fiji Meteorological Service, 2009.
A s s e s s i n g v u l n e r a b i l i t y o f c o a s t a l m a n g r o v e s t o i m p a c t s o f c l i m a t e c h a n g e : F i j i c a s e s t u d i e s

Rainfall projections to the end of the 21st century
Projected change in rainfall over small islands, by region (%) relative to the 1961-90 periodWGII. The ranges are derived from seven AOGCMs run under the SRES B1, B2, A2 andA1F1 scenarios
Regions
Mediterranean
Caribbean
Indian Ocean
Northern Pacific
Southern Pacific
2010-2039
-35.6 to +55.1
-14.2 to + 13.7
-5.4 to + 6.0
-6.3 to + 9.1
-3.9 to + 3.4
2040-2069
-52.6 to + 38.3
-36.3 to + 34.2
-6.9 to + 12.4
-19.2 to + 21.3
-8.23 to + 6.7
2070-2099
-61.0 to + 6.2
-49.3 to + 28.9
-9.8 to + 14.7
-2.7 to + 25.8
-14.0 to + 14.6
FMS/WWF Study 2008: Monthly data for 12 models interpolated to Nadi, Fiji: 7 of 12 models > 1980-1999 rainfall (1829mm)Annual anomalies +/- 27% apply to 75% of models, +/-16% applies to 50% of models
ENSO projections to the end of the 21st century
FMS/WWF Study 2008: Monthly data for 17 models, SRESA1B scenarios50% of models shows a more El Nino-like future and 50% ofmodels a more La Nina-like futureNo definite change in inter-annual variability.
15
RE
SU
LT
SA s s e s s i n g v u l n e r a b i l i t y o f c o a s t a l m a n g r o v e s t o i m p a c t s o f c l i m a t e c h a n g e : F i j i c a s e s t u d i e s
Figure 7. Fiji climate trends and regional projection

1416
4.2 Vulneralbility Assessment Profiles
Vanua Levu is the second largest island of Fiji. The Kubulau district landscape is lush with native forests, commercial pine plantations and rich mangrove forests fringing the coastline.The island’s main mountain ranges lie near the windward, southern coasts making them muchwetter.
Community structure (Level 2 mangrove monitoring)
Kubulau site has a large dominant Bruguiera gymnorhiza zone with a small very narrow Rhizophora stylosa zone. The site is not diverse in terms of mangrove species with only twomangrove species recorded. The transect starts from land to seaward.
Table 7. Mangrove measurements for transects at Raviravi, Kubulau.
CENTRAL DIVISION
WESTERN DIVISION
SUVA
NAVUASIGATOKA
NADI
LAUTOKA BA
TAVUA
RAKIRAKI
KOROVOU
BUA
MACUATA
CAKAUDROVE
NAUSORI
TIKINA O VERATATIKINA WAI
VANUA LEVU
VITI LEVU
TIKINA O KUBULAU
NORTHERN DIVISION
KU
BU
LA
UA s s e s s i n g v u l n e r a b i l i t y o f c o a s t a l m a n g r o v e s t o i m p a c t s o f c l i m a t e c h a n g e : F i j i c a s e s t u d i e s
Tikina Kubulau
Rhizophora stylosa
Bruguieria
gymnorhiza
Total
Count
49
105
154
Basal Area (cm2)
4480
1,226,812
1,231,292
Relative Frequency (%)
32
68
100
Relative Dominance(%)
1
99
100
Figure 8. Graph of the mangrove trees’ diameter at breast height for Raviravitransects, Kubulau.
note. Litter productivity results (Level 3 mangrove monitoring) can beviewed in the report, Mangrove survey report, 2009

17
KU
BU
LA
U
Spatial information & habitat change detection14
Between 1954 and 1994, there was a net decline in mangrove area of approximately 200 ha (Table 8). There
was a slight decline in total mangrove area between 1954 and 1978 (Figure 9). The thin, fringing mangrove
regions adjacent to coastal areas are likely to have existed in 1954 as well, but were not able to be
distinguished due to poor contrast of the aerial photographs. Between 1978 and 1994, mangroves were lost
from upper intertidal areas (Figure 10). The causes for mangrove decline are currently being investigated
through a masters project by USP student Simita Singh, titled, “A Study of the Relationship between the
Wetland Ecosystem Services and Human Well-being in the Coastal Villages of the Kubulau Tikina in Vanua
Levu, Fiji”.
The area of mangroves mapped by the Department of Lands from 2001 Landsat imagery included 131.5 ha
more mangroves than the distributions mapped from 1994 aerial photographs (Figure 11). While it is possible
that some of the previously cleared mangroves may have expanded within their natural range, it is likely that
narrow areas of mangroves were either overestimated or missed altogether using visual interpretation from
the coarser (28.5 m) Landsat pixels (Manson et al. 2001). Contraction and expansion of mangroves within
estuarine areas was unlikely to be related to cycles of dry or wet periods (Bucher & Saenger 1994; Jupiter et
al. 2007), as there were no consistently wet or dry periods between 1977 and 2006.
In summary, results from mapping analysis show a substantial net loss of mangroves between 1954 and
2002. Further investigation is required to determine whether the changes were related to natural or
anthropogenic activities, and whether these changes have impacted mangrove ecosystem services.
27
Figure 13a. Graph show trends of mean sea surface temperature logged by a HOBO Pro v2 logger at Navula reef adjacent to Tikina Wai mangroves and seagrass areas along the shoreline.
Figure 13b describes air temperature and the real-time SST recording to exhibit a similar trend, notably during the hurricane season from the months of November to April. According to investigations of studied reef areas affected during the 1998/2000 coral bleaching events- bleaching threshold for Fiji was determined to be in the range of 29.5-30 0 C (Cumming, et.al 2000). In situ temp recordings at Tikina Wai reefs during the hurricane season were in the range 28-28.90 C and then started to cool after May 2008.This temperature logger exercise has contributed some significant real time SST data, a value added tool to assess the vulnerability of mangroves and coastal habitats and creating the awareness of how reefs respond to warming seas, state of reef health and the need for management action. ISuch real time locally relevant information provides crucial input to the community-driven process of developing adaptive management strategies.
4.2 Spatial information & habitat change detection
Kubulau16 Between 1954 and 1994, there was a net decline in mangrove area of approximately 200 ha (Table 13). There was a slight decline in total mangrove area between 1954 and 1978.The thin, fringing mangrove regions adjacent to coastal areas are likely to have existed in 1954 as well, but were not able to be distinguished due to poor contrast of the aerial photographs.
16 Jupiter, S. et al., (2009).
Figure 13b. Recorded mean air temperature from Lautoka weather station,
correlated to logged SST at 15m depth on Tikina Wai barrier reef slope.
Comparison of average air temperature and logged sea surface temperature on Tikina Wai reefs with near Lautoka weather
Area- Kubulau between 1954 and 2001
Year Mangrove area (ha)
1954 812.1
1978 734.8
1994 612.5
2001 744.0
Table 8. Differences in Total Mangrove Area- Kubulau between 1954 and 2001
Figure 9. 1954 (red) and 1978 (yellow) mangrove distributions overlaid on 1994 aerial photomosaic.
Figure 10. 1978 (yellow) and 1994 (pink) mangrove distributionsoverlaid on 1994 aerial photomosaic.
Figure 11. 1994 (pink) and 2001 (green) mangrove distributions overlaid on 1994 aerial photomosaic.
14Mangrove mapping report, Kubulau.WCS, 2009
A s s e s s i n g v u l n e r a b i l i t y o f c o a s t a l m a n g r o v e s t o i m p a c t s o f c l i m a t e c h a n g e : F i j i c a s e s t u d i e s

18
KU
BU
LA
U
Past relative sea level trends15
There was a distinct zonation found in Kubulau mangroves with Rhizophora forests dominating the seaward edge before a transition to monospecificBruguiera on the landward side of the mangrove swamp. In the river entrance that comes through the mangrove tabu area west of Raviravi village (Figure 6), core attempts in the seaward edge only penetrated 50 cm before hitting rock.
Core KB1 was taken about 15 m inside the seaward edge at the Rhizophora/Bruguiera boundary with 15 m tall Rhizophora to seaward and 15 m tallBruguiera to landward. KB1 core 0 level was 6 cm lower in elevation relative to the 0 level of KB2 which was located further inland. The stratigraphy of thetwo Kubulau cores showed primarily peat and silty clay without any marine sediment or sand lenses (Figure 14).
Figure 13. Location of KB Cores in the mangrove Tabu site west of Raviravi Village,Kubulau (adapted from a WCS image produced for this project).
Core KB2 was located in closed canopy monospecific Bruguiera forest about 25 m highwith numerous seedlings and saplings. The high tide mark indicated on the trees was 80cm and the water depth at the time was 26 cm. The Hiller Corer was used for this core.The top 20 cm was very loose and not recovered, but by hand sampling was determinedto be similar to the recovered material at 20 cm. Between 20 cm and 90 cm was a peatysilt mix without sand (10YR 2/1) and large roots were apparent at 85 cm, as shown in figure 17. From 90-100 cm the sand content increased and between 135 cm and 143 cmthe sediment became a loose organic silty grey with grit (5YR 3/1), before hitting hardrock.
Figure 12. Core locations and relative elevations, Kubulau, Fiji
15Ellison, J. and Strickland, P.(2009).
A s s e s s i n g v u l n e r a b i l i t y o f c o a s t a l m a n g r o v e s t o i m p a c t s o f c l i m a t e c h a n g e : F i j i c a s e s t u d i e s

Pollen Analysis Results
The pollen diagrams show the relative representation of each mangrovetaxon recorded in samples down each core as a percentage of the totalpollen sum which includes mangrove taxa, non-mangrove trees, shrubs,herbs, aquatics and ferns. Other palynomorphs such as fungal spores, microforaminifera, dinoflagellates and chlorophyllaceae were excluded.
Kubulau Core KB1
In core KB1 mangrove pollen is consistently high throughout the core at 70-90% of the total sum (Figure 16). Rhizophora, Bruguiera gymnorrhiza
and Excoecaria agallocha each occur at about 20% until 30 cm depth,below which Rhizophora percentages increase to 60-75%. MangrovePollen concentrations range between 20,000 and 80,000 grains/cm³ withno obvious trends (Figure 14). Percentage organics show a general decrease with depth from 50-17% (Figure 15).
Figure 16. Stratigraphy and Pollen Diagram fromCore KB1, Kubulau, Fiji (percentage based on totalpollen sum)
Figure 14. Pollen Concentrations from Core KB1, Kubu-lau, Fiji
Figure 15. Percentage Organics from Core KB1, Kubulau, Fiji
19
KU
BU
LA
UA s s e s s i n g v u l n e r a b i l i t y o f c o a s t a l m a n g r o v e s t o i m p a c t s o f c l i m a t e c h a n g e : F i j i c a s e s t u d i e s
20
KU
BU
LA
U
Kubulau Core KB2
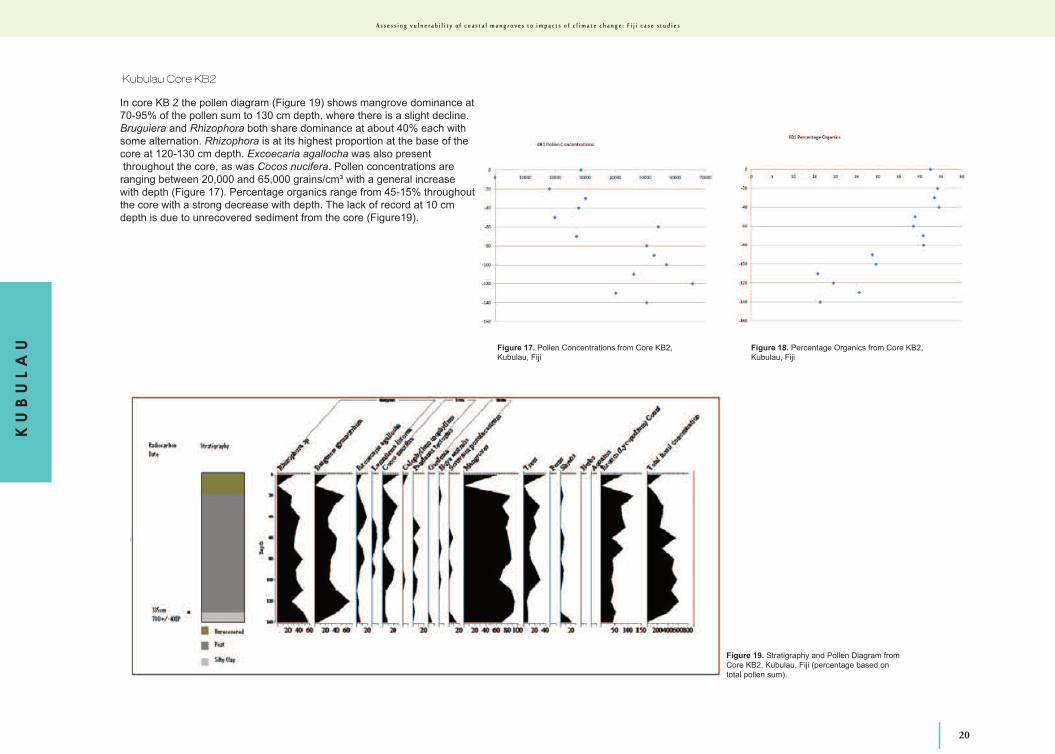
In core KB 2 the pollen diagram (Figure 19) shows mangrove dominance at70-95% of the pollen sum to 130 cm depth, where there is a slight decline.Bruguiera and Rhizophora both share dominance at about 40% each withsome alternation. Rhizophora is at its highest proportion at the base of thecore at 120-130 cm depth. Excoecaria agallocha was also presentthroughout the core, as was Cocos nucifera. Pollen concentrations areranging between 20,000 and 65,000 grains/cm³ with a general increasewith depth (Figure 17). Percentage organics range from 45-15% throughoutthe core with a strong decrease with depth. The lack of record at 10 cmdepth is due to unrecovered sediment from the core (Figure19).
Figure 19. Stratigraphy and Pollen Diagram fromCore KB2, Kubulau, Fiji (percentage based ontotal pollen sum).
Figure 17. Pollen Concentrations from Core KB2, Kubulau, Fiji
Figure 18. Percentage Organics from Core KB2, Kubulau, Fiji
A s s e s s i n g v u l n e r a b i l i t y o f c o a s t a l m a n g r o v e s t o i m p a c t s o f c l i m a t e c h a n g e : F i j i c a s e s t u d i e s

Climate Change Characteristics & Vulnerabilities:
LAND
- degradation of forest, a refuge for wild species and source of basic food needs
- forest fires that could damage established buffer zones; reforestation at fire affected areas with endemic plant species
- unsustainable logging and unregulated logging viamonitoring of logging license quota
- loss of staple food crops diversity; mono-cropping agricultural practice
- water shortage caused by degraded state of watersystem infrastructure and awareness on best water use practices
SEA
- destructive fishing practices- lack of addressing coastal household waste
disposal management- no regulation on the issuance of fishing licenses
and quota
SOCIO/ CULTURAL/ ECONOMIC EFFECTS
- the impact of outside fishers in their I qoliqoli fishing areas
- increased population as well as migration to nearby urban areas-Savusavu
- unregulated markets for local/subsistence fisheries in Kubulau
- changing weather patterns (i.e. extended rainy periods and shorter dry periods) affecting their agricultural/crop productivity.
21
KU
BU
LA
U
Outcomes of the community vulnerability assessment process15
Community village maps
Fishing grounds mapping involved identifying localreefs to which are commonly named after the mostcommon fish found in those reefs.
Namalata and Raviravi villages have mangroveforested shores that shelter the villages from stormsurges and coastal erosion. Adjacent to the mangroves are extensive sea grass patches that arequite diverse with four known seagrass species foundin Fiji. There are also some healthy Porites coralheads within the mangroves.
Navatu village is located higher above the high tidemark. Coastal erosion is not a problem as the villageis sheltered from direct high impact waves. The island of Navatu has a few stretches of sandybeaches by which rocky shores separate thebeaches. Apart from that, mangroves dominate themore sheltered areas of the island.
There is abundant fish and invertebrates and veryhealthy corals. The exposed reefs have little impactfrom storms as its rapid recovery contributes to itshigh resliency. There were a few cases of bleachingwith many recruits outside the protected areas butnone observed within the protected area, the Nakalireef (Fig 20 B). There are some cases of siltationalong the Batinisavaki reef but it is not that inten-sive.some healthy Porites coral heads within themangroves. Figure 20, A, B. Community derived maps during climate witness process.
A
B
A s s e s s i n g v u l n e r a b i l i t y o f c o a s t a l m a n g r o v e s t o i m p a c t s o f c l i m a t e c h a n g e : F i j i c a s e s t u d i e s

Ot
he
r
ma
ng
ro
ve
r
es
ult
s
22
15Kubulau Climate Witness workshop report 2008, WCS.
Radiocarbon dates and sedimentation rates
Radiocarbon dates from the four longer cores are shown in Table 3. All results showed13C/12C ratio results typical of mangrove sediment (Woodroffe, 1981; Ellison, 1993; Ellison,2005). Using the calibrated years derived from the radiocarbon dates, sedimentation rateswere calculated. The radiocarbon dates shown relative to elevation of the three cores (Figure 5) show increasing age with depth between all three cores, except for the 93-98 cmdate from LW1 which is much younger relative to the other two cores. This may be indicativeof disturbance within the mangrove peat, perhaps bioturbation by crabs which were found atthe site. The sedimentation rate at 93-98 cm of the seaward core at Lomawai was particularly high also, at between 2.8-19.4 mm a-1 while the sedimentation rates at the otherthree cores were between 1.1-2.0 mm -1.
Elevations
Distinct mangrove zonations corresponding with micro-elevation were found within LomawaiReserve with tall Rhizophora forests dominating the seaward edge from 1.9 to 2.6 m belowelevation datum, a range of around 0.7 metres. Bruguiera dominant forests were found moreinland, from 1.9 m below datum, and stunted Rhizophora occurred above this towards thethe salt flat/mangrove boundary which was at 1.6 metres below elevation datum. The survey results indicate an elevation range of 1.0 +/- 0.1 metres for mangroves in the Lomawai Reserve. These results are summarized in Table 9.
Owing to lack of elevation datums in the Kubulau area, core elevations are determined relative to each other by measurement from the high tide mark on trees. Results showedthat the 0 level of the seaward core KB1 was 6 cm lower than the landward core KB2.
Site Elevation (m)
LW3 core top -1.53
Saltflat/ Rhizophora boundary -1.60
Rhizophora/Bruguiera boundary -1.9 +/-0.1
LW2 core top -2.03
LW1 core top -2.04
Rhizophora seaward edge -2.6 +/-0.1
Table 9. Elevations of mangrove zones in the Lomawai Reserve (inmetres below the Elevation Datum).
Table 10. Radiocarbon Dating Results and calculated sedimentationrates from Lomawai and Kubulau, Fiji
A s s e s s i n g v u l n e r a b i l i t y o f c o a s t a l m a n g r o v e s t o i m p a c t s o f c l i m a t e c h a n g e : F i j i c a s e s t u d i e s

Tikina Wai Vulnerability Assessment Profile
Tikina Wai lies in an area comprised of Oligocene-mid Miocene sediments andvolcanics. The soil types present are predominantly clays and a mixture ofsands and loams in the lower lying areas. The dominant landscape feature ofthe district are rolling hills covered by talasiga grassland likened to savannah.
Between 1967 and 1994, about 0.11sq. km of mangroves and 0.03 sq. km ofsalt ponds have been lost in the area (Thaman & Naikatini, 2002). Mangroves in Lomawai Reserve are typical of that found along the westerncoastline of Viti Levu. They consisting of extensive salt pans and areas ofstunted Rhizophora (height at about 1m) fringing the salt pan areas. Along theedges of the creeks and rivers, mangrove growth was more vigorous with thedominant species such as Rhizophora samoensis and Bruguiera gymnorrhiza
up to 4m in height. The landward edge of the salt pan included species such asXylocarpus granatum, and Excoecaria agallocha. The coastal fringe of the reserve was dominated by R. stylosa and Bruguiera gymnorrhiza (Thaman &Naikatini, 2002).
TI
KI
NA
W
AI
23
Tikina Wai
Rhizophora stylosa
Rhizophora
samoensis
B. gymnorhiza
Cordia subcordata
Xylocarpus granatum
Total
Count
191
65
247
5
2
510
Basal Area (cm2)
5,082
2,090
11,619
300
93
19,184
Relative Frequency (%)
37
13
48
1
0
100
Relative Dominance(%)
26
11
61
2
+
100
CENTRAL DIVISION
WESTERN DIVISION
SUVA
NAVUASIGATOKA
NADI
LAUTOKA BA
TAVUA
RAKIRAKI
KOROVOU
BUA
MACUATA
CAKAUDROVE
NAUSORI
TIKINA O VERATATIKINA WAI
VANUA LEVU
VITI LEVU
TIKINA O KUBULAU
NORTHERN DIVISION
Table 11. Mangrove measurements for transects at Tikina Wai.
A s s e s s i n g v u l n e r a b i l i t y o f c o a s t a l m a n g r o v e s t o i m p a c t s o f c l i m a t e c h a n g e : F i j i c a s e s t u d i e s

Figure 21a. Graph of the mangrove trees’ diameter at breast height for survey transects, Tikina Wai.
Figure 21b. Map of Tikina Wai coastline highlighting 3 mangrove areas surveyed.
The mangroves at all sites within Tikina Wai form a distinct zonation with Rhiziphora stylosa and R. samoensis at the seaward edge. They form dense forest 3 to 4 m in height and in some areas is about 100 to 200 m wide. In most areas Bruguiera zone is only present along rivers but in other areas thezone is absent but patches can be observed interspersed within the dense Rhizophora zone. A characteristic of mangrove forest within the drier side of themain island is the extensive salt pans surrounded by stunted Rhizophora spp 1 to 2 m tall. This is the most dominant feature of mangrove forests withinTikina Wai. Landward type mangrove species such as Xylocarpus granatum, Excoecaria agallocha and Heritiera littoralis can be found growing in areasthat are high and stable. In areas where there is distinct Bruguiera zone it is followed by large Xylocarpus granatum trees and in open and dry areasspecies such as Acrostichum aureum and Derris trifoliata are observed (Thaman & Naikatini,2002).
Tikina Wai has more distinct Rhizophora and Bruguiera zone. But the Bruguiera zone is dominated by seedlings and juvenile trees as shown by largecount but small basal area size as compared to the other two sites.
TI
KI
NA
W
AI
24
Community structure (Level 2 mangrove monitoring)
A s s e s s i n g v u l n e r a b i l i t y o f c o a s t a l m a n g r o v e s t o i m p a c t s o f c l i m a t e c h a n g e : F i j i c a s e s t u d i e s

Spatial information & habitat change detection
Alnowledgement
Top Data from Department of Lands, Suva GPS Survey by WWFLayout Preparation and Printing by Kasaqa ToraGIS unit, Land Use SectionDepartment of Land Resources Planning & DevelopmentFebruary, 2009
Map ReferenceTransverse Mercator ProjectionOrigin is at 17’S Latitude & 178.45’ LongitudeGeocode in Meters and are in WGS72 Spheroid Fiji Map GridFalse Coordinates 2,000,000 m East, 4, 000,000 m North
SigatokaSuva
Nausori
RakirakiTavuaBa
Lautoka
NadiSubject Area
0 1,350 2.700 5,400 8, 100 10, 800Meters
1 centimeters equals 0.4 kilometers
1; 40,000
Topographic Reference
wai_villages
Creeks & Streams
Main River
Main Road
Other Roads
Tremlines
New Tabu Area 2009
Old_Tabu area
FEATUREMangroves
pine
reef flats
soft shore (mud)
Mangrove 1994
Mangrove 2007
Legend
Based on the historic overlay between 1978 and 1994, mangroves were lost from upper intertidal areas. The map below overlays maps from 2 periods
between 1994 and 2007.
TI
KI
NA
W
AI
25
Alnowledgement
Top Data from Department of Lands, Suva GPS Survey by WWFLayout Preparation and Printing by Kasaqa ToraGIS unit, Land Use SectionDepartment of Land Resources Planning & DevelopmentFebruary, 2009
Map ReferenceTransverse Mercator ProjectionOrigin is at 17’S Latitude & 178.45’ LongitudeGeocode in Meters and are in WGS72 Spheroid Fiji Map GridFalse Coordinates 2,000,000 m East, 4, 000,000 m North
SigatokaSuva
Nausori
RakirakiTavuaBa
Lautoka
NadiSubject Area
0 1,350 2.700 5,400 8, 100 10, 800Meters
1 centimeters equals 0.4 kilometers
1; 40,000
Topographic Reference
wai_villages
Creeks & Streams
Main River
Main Road
Other Roads
Tremlines
New Tabu Area 2009
Old_Tabu area
FEATUREMangroves
pine
reef flats
soft shore (mud)
Mangrove 1994
Mangrove 2007
Legend
Figure 22. Mangrove distribution mapping overlays 1994 & 2007
A s s e s s i n g v u l n e r a b i l i t y o f c o a s t a l m a n g r o v e s t o i m p a c t s o f c l i m a t e c h a n g e : F i j i c a s e s t u d i e s
Past sea level trends15
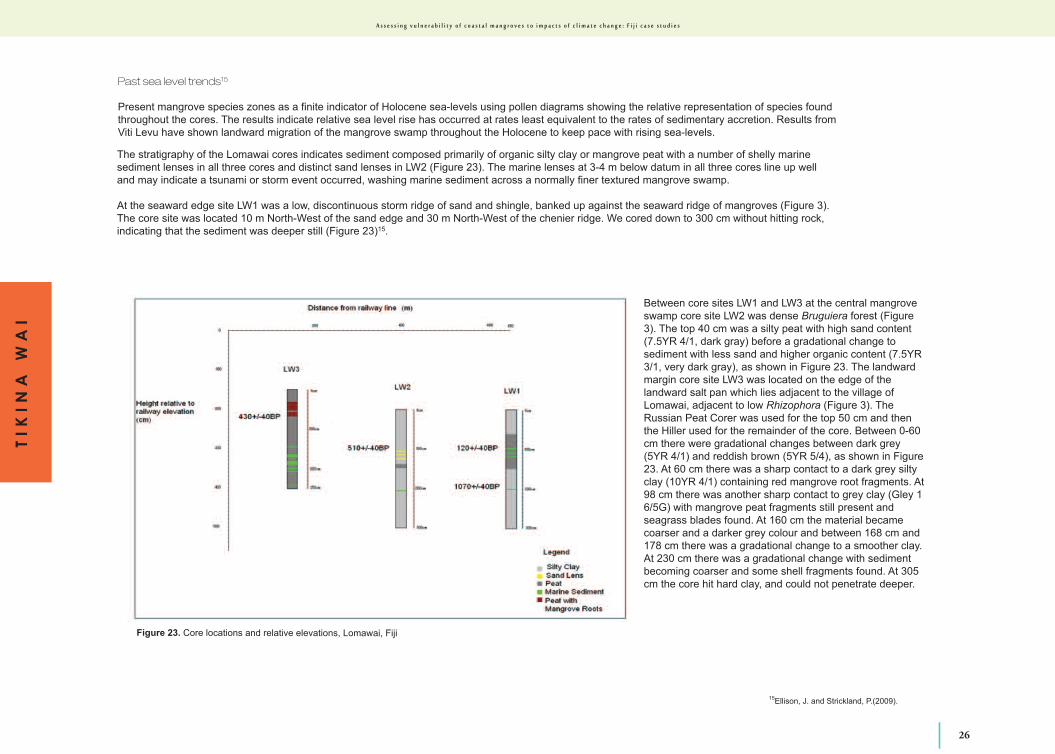
Present mangrove species zones as a finite indicator of Holocene sea-levels using pollen diagrams showing the relative representation of species foundthroughout the cores. The results indicate relative sea level rise has occurred at rates least equivalent to the rates of sedimentary accretion. Results fromViti Levu have shown landward migration of the mangrove swamp throughout the Holocene to keep pace with rising sea-levels.
The stratigraphy of the Lomawai cores indicates sediment composed primarily of organic silty clay or mangrove peat with a number of shelly marine sediment lenses in all three cores and distinct sand lenses in LW2 (Figure 23). The marine lenses at 3-4 m below datum in all three cores line up welland may indicate a tsunami or storm event occurred, washing marine sediment across a normally finer textured mangrove swamp.
At the seaward edge site LW1 was a low, discontinuous storm ridge of sand and shingle, banked up against the seaward ridge of mangroves (Figure 3).The core site was located 10 m North-West of the sand edge and 30 m North-West of the chenier ridge. We cored down to 300 cm without hitting rock,indicating that the sediment was deeper still (Figure 23)15.
Figure 23. Core locations and relative elevations, Lomawai, Fiji
TI
KI
NA
W
AI
26
15Ellison, J. and Strickland, P.(2009).
Between core sites LW1 and LW3 at the central mangroveswamp core site LW2 was dense Bruguiera forest (Figure3). The top 40 cm was a silty peat with high sand content(7.5YR 4/1, dark gray) before a gradational change to sediment with less sand and higher organic content (7.5YR3/1, very dark gray), as shown in Figure 23. The landwardmargin core site LW3 was located on the edge of the landward salt pan which lies adjacent to the village of Lomawai, adjacent to low Rhizophora (Figure 3). The Russian Peat Corer was used for the top 50 cm and thenthe Hiller used for the remainder of the core. Between 0-60cm there were gradational changes between dark grey(5YR 4/1) and reddish brown (5YR 5/4), as shown in Figure23. At 60 cm there was a sharp contact to a dark grey siltyclay (10YR 4/1) containing red mangrove root fragments. At98 cm there was another sharp contact to grey clay (Gley 16/5G) with mangrove peat fragments still present and seagrass blades found. At 160 cm the material becamecoarser and a darker grey colour and between 168 cm and178 cm there was a gradational change to a smoother clay.At 230 cm there was a gradational change with sedimentbecoming coarser and some shell fragments found. At 305cm the core hit hard clay, and could not penetrate deeper.
A s s e s s i n g v u l n e r a b i l i t y o f c o a s t a l m a n g r o v e s t o i m p a c t s o f c l i m a t e c h a n g e : F i j i c a s e s t u d i e s

27
Pollen Analysis Results
The pollen diagrams show the relative representation of each mangrovetaxon recorded in samples down each core as a percentage of the totalpollen sum which includes mangrove taxa, non-mangrove trees, shrubs,herbs, aquatics and ferns. Other palynomorphs such as fungal spores, microforaminifera, dinoflagellates and chlorophyllaceae were excluded.
Lomawai Core LW1
Mangrove pollen was dominant at 60-95% of the total sum throughout theseaward3 m core with a combination of Rhizophora, Bruguiera
gymnorrhiza, Excoecaria agallocha, Lumnitzera littorea and Avicennia
marina found (Figure 26). Rhizophora dominated for the top 95 cm at between about 60-85% with a sharp transition at 95-100 cm to dominationby Bruguiera pollen at 60%, which fluctuates but tends to increase in domination with depth to 300 cm. Pollen concentrations through the corewere between 20,000 to 55,000 grains/cm³ with a few outliers at around80,000 grains/cm³ (Figure 24). The inconsistency in pollen concentrationsat the top of this core may indicate some form of disturbance, which correlates with the relatively recent radiocarbon date, perhaps bioturbationby crabs which were found in the area whilst coring. There was a generaldecrease in percentage organics with depth from around 30% to 8% withone outlier of 50% organics found at 30 cm depth (Figure 25).
Figure 26. Stratigraphy and Pollen Diagram fromCore LW1, Lomawai, Fiji (percentage based on pollen sum)
Figure 24.Pollen Concentrations from Core LW1, Lomawai,Fiji
Figure 25. Percentage Organics from Core LW1, Lomawai, Fiji
A s s e s s i n g v u l n e r a b i l i t y o f c o a s t a l m a n g r o v e s t o i m p a c t s o f c l i m a t e c h a n g e : F i j i c a s e s t u d i e s
TI
KI
NA
W
AI

TI
KI
NA
W
AI
Lomawai Core LW2
Pollen results show that Bruguiera dominated at 60% of the pollen sum atthe surface, and continues to dominate between 30-60% until about 240cm down the core, where it began to decline and Rhizophora became moredominant, fluctuating between 30-50% (Figure 29). Mangrove pollen wasfound to be 60-90% of the total sum, dropping down to 40% at the verybase of the core with an increase in tree and shrub pollen. Pollen concentrations were generally between 30,000 to 60,000 grains/cm³ withone outlier at 135,000 at 130 cm down the core (Figure 27). Percentage organics decreased with depth ranging from about 20% near the top to 9%lower down the core (Figure 20).one outlier of 50% organics found at 30cm depth (Figure 28).
Figure 29. Stratigraphy and Pollen Diagram fromCore LW2, Lomawai, Fiji (percentage based onpollen sum)
Figure 27.Pollen Concentrations from Core LW2, Lomawai, Fiji Figure 28.Percentage Organics from Core LW2, Lomawai, Fiji
28
A s s e s s i n g v u l n e r a b i l i t y o f c o a s t a l m a n g r o v e s t o i m p a c t s o f c l i m a t e c h a n g e : F i j i c a s e s t u d i e s

TI
KI
NA
W
AI
Lomawai Core LW3
Rhizophora dominated at the top of the core before a Bruguiera peak between 70 cm and 110 cm (Figure 32). There was another Rhizophora
peak between 110 cm and130 cm before dropping off also. There was anincrease in Lumnitzera and Avicennia towards the base of the core withhigh levels of Cocos nucifera found also. Mangrove pollen was around 60-100% of the total sum for the top 140 cm before dropping back toaround 20% at 230 cm with a peak in tree species at concentrations up to90% of the total sum. Pollen concentrations were between 45,000 to12,000 grains/cm³, generally decreasing with depth, and with a couple ofoutlying higher concentrations found at 40 cm and 130 cm depth (Figure30). Percentage organics were found to be much lower than in more seaward LW1 and LW2 cores, ranging from 3-15%, and did not have thedecreasing trend with depth found in the other two cores in Lomawai Reserve (Figure 31).
Figure 32. Stratigraphy and Pollen Diagram fromCore LW3, Lomawai, Fiji (percentage based onpollen sum)
Figure 30.Pollen Concentrations from Core LW3, Lomawai, Fiji Figure 31.Percentage Organics from Core LW3, Lomawai, Fiji
29
A s s e s s i n g v u l n e r a b i l i t y o f c o a s t a l m a n g r o v e s t o i m p a c t s o f c l i m a t e c h a n g e : F i j i c a s e s t u d i e s

Climate witness
As part of the facilitated process, the community systematically assess the appropriateness of each ofthese possible actions for each issue or objective per site.
Community Prioritised
CC Concerns
water shortage
Food Security
Coastal Flooding
Increase water storage capacity and improving district delivery
Strengthening local crop productivityand Marine protected area system
Improved district land use management and watershed
restoration
Site implementation
as defined in
community PA
Figure 33. Tikina Wai community prioritised climate change concerns, assessment of adaptation option.
30
TI
KI
NA
W
AI
Outcomes of the community vulnerability assessment process15
Climate Change Characteristics & Vulnerabilities:
LAND
- freshwater shortage- bushfires, a threat to bushland and forests- logged pine forest areas associated with periods
of heavy rain causes landslide and soil erosion- absent buffer zones between pine forests and the
river exacerbate siltation within the river system,sediment loading out in the inter-tidal areas.
- the increasing shallowness of rivers and loss of wetlands near waterways.
- drought affects agricultural productivity and seasonality of traditional calendar of plants
SEA
- observed coral bleaching events in 2000.- increased proliferation of Crown-of-thorns during
the drought period of 1997 and 2000.- encroachment of the high tide mark inland as
compared to the past.- deeper areas in the tidal zone becoming shallow.- fish spawning seasonality uncertain (compared to
historical timelines)- accelerated silt deposition into the mangroves.- coastal flooding and erosion.- excessive removal or cutting of mangroves from
shoreline.
SOCIO/ CULTURAL EFFECTS
- the loss of the river grass 'ovatu', a totem plant of the village of Navatu will result in cultural identityloss; how the threat to marine and land resources is interlinked with the vitality of the people.
- Mangroves encroaching to previously exposed salt pans will lead to increasing silt build up in these areas. The loss of salt pans mean loss of a cultural heritage, the art of making traditional salt for which the district is renowned for.
- Excessive rainfall causes enhanced breeding of mosquitoes and a rise in water-borne diseases(dengue, diarrhea and skin diseases), plantinfestations posing a threat to food security and health of the local population.
- Heavy rain cause flooding of roads affecting schools and workers. Shift in the planting of traditional crops and increasing dependence on purchased food (with limited income source).
A s s e s s i n g v u l n e r a b i l i t y o f c o a s t a l m a n g r o v e s t o i m p a c t s o f c l i m a t e c h a n g e : F i j i c a s e s t u d i e s

Tikina Verata has very little history of mangrove harvesting due to the distance of mangrove forest from villages and a much longer history of integrative resource management in Fiji. According to recorded high numbers for total basal area of mangrove trees in Verata transects indicate the mangroves are much older than theother 2 main sites in Kubulau and Tikina Wai.
Tikina Verata Vulnerability Assessment Profile
31
TI
KI
NA
V
ER
AT
A
CENTRAL DIVISION
WESTERN DIVISION
SUVA
NAVUASIGATOKA
NADI
LAUTOKA BA
TAVUA
RAKIRAKI
KOROVOU
BUA
MACUATA
CAKAUDROVE
NAUSORI
TIKINA O VERATATIKINA WAI
VANUA LEVU
VITI LEVU
TIKINA O KUBULAU
NORTHERN DIVISION
Tikina Verata
Rhizophora stylosa
Rhizophora
samoensis
Bruguiera
gymnorhiza
Total
Count
45
7
56
108
Basal Area (cm2)
20,281
17,156
165,834
203,271
Relative Frequency (%)
42
6
52
100
Relative Dominance(%)
10
8
82
100
Table 12. Mangrove measurements for transects at Tikina Verata.
Community structure (Level 2 mangrove monitoring)
The mangroves at Tikina Verata form a large narrow band along the coast of Verata and becoming very thick at the mouth of the Waidalice River and other small rivers and creeks thatflow out of that catchment. Zonation of mangroves is quite apparent with the Rhizophora zoneoccurring around the river mouth but decreasing in width away from the river. This is followedby the Bruguiera zone which follows the same type of stratification as Rhizophora zone. Themixed species zone normally inhabited by Xylocarpus spp, Heritiera littoralis is distinct only in afew places but completely absent in some areas due to clearing. The overall zonation pattern inTikina Verata is true for those mangroves growing in and around rivers and creeks. For thoseisolated mangrove patches there is a large Rhizophora zone while the Bruguiera zone is either completely missing or found within the mixed species zone. At Tikina Verata these isolated mangrove patches are mostly found adjacent to village and are the most heavily impacted mangrove forest.
Figure 34. Graph of the mangrove trees’ diameter at breast height for survey transects, TikinaVerata.
A s s e s s i n g v u l n e r a b i l i t y o f c o a s t a l m a n g r o v e s t o i m p a c t s o f c l i m a t e c h a n g e : F i j i c a s e s t u d i e s

Spatial information & habitat change detection9
There are 10 mangrove patches that are understudy for this project.
Mangrove patch 1
Mangrove patch 2
• Decrease in mangrove area from 1951-1967 by 0.49%• Decrease again by 0.46% in 1978• Increase by 0.78% in 1986• Then decrease again by 0.46% in 1994.
Mangrove patch 3
• In 1951 the mangrove area was 0.131792km2• 1967 it decrease by 0.56%• 1978 another decrease by 1.09%• 1986 it also decrease by 0.94%• 1994 another decrease by 4%• There was a total decrease of 3.2% from 1951 to 1994
Mangrove patch 4
• In 1951 the mangrove area was 0.131792km2• 1967 it decrease by 0.56%• 1978 another decrease by 1.09%• 1986 it also decrease by 0.94%• 1994 another decrease by 4%• There was a total decrease of 3.2% from 1951 to 1994
Mangrove patch 5
• Decrease by 0.12% in 1967• A sharp increase of mangrove by 0.35% in 1978• Then slight decrease of 0.07% in 1986 and likewise for 1994
Mangrove patch 6
• 1967 increase by 0.95%• 1978 a slight increase again by 0.38% • 1986 a big increase by 12.7%• Then in 1994 there was an increase by 6.8%
Mangrove patch 7
• 1967 decrease by 2.67%• 1978 increase by 4.2%• 1986 decrease by 4.3%
Mangrove patch 8
• Decrease by 0.80% in 1967• 1978 an increase of 0.38%• 1986 an increase again of 1.66%• 1994 an increase of 1.13%
Mangrove patch 9
• 1967 decrease by 2.48%• 1978 decrease by 0.28%• 1986 an increase by 0.23%• 1994 a decrease by 0.32%
Mangrove patch 10
• 1951 was omitted due to unavailability of aerial photograph• 1978 saw a decline in mangrove by 2.60%• 1986 an increase by 9.10%• 1994 is a decrease by 43.30%
29
Verata17 Based on the digitisation (done at a s1:20,000 scale) of the mangrove areas visible in the most recent (1994) aerial imagery, 10 discrete and non-contiguous mangrove areas within the Verata district (Figure 15). Refer to Verata site GIS brief for more details on the spatial characteristics and temporal change conducted on each of the mangrove patch areas.
Figure 15. Mangrove areas within Verata district (fishing area boundary in red). Areas obtained by digitisation of 1994 aerial imagery projected to UTM (60S), WGS-84 datum. Areas overlaid on a Landsat 7 ETM+image.
17 USP Institute of Applied Sciences (2009).
• There was a small mangrove area in 1951. However, in 1967 there was increase in mangrove by 13% and increase again by 2% in 1978 and another increase by 1% in 1986
• 1994 saw a decrease of this mangrove area by 4%.
32
TI
KI
NA
V
ER
AT
A
9USP IAS (2009) Verata GIS mapping report (unpublished).
Figure 35. Image of Verata mangrove patches
A s s e s s i n g v u l n e r a b i l i t y o f c o a s t a l m a n g r o v e s t o i m p a c t s o f c l i m a t e c h a n g e : F i j i c a s e s t u d i e s

33
TI
KI
NA
V
ER
AT
A
Verata is a coastal district of eight villages within the province of Tailevu, located on the eastern shoreof Viti Levu.Verata’s economy is primarily based on fisheries, agriculture and a few formal employmentopportunities. Main revenue generating activities include selling yaqona and dalo as well as harvestingof beche-de-mer, mud lobster, kai-koso (Anadara sp.) and other catch for sale. Past studies of fishingcommunities in the Verata have demonstrated the relationship between the increasing harvestingtrend of inshore fisheries (sessile marine invertebrate) and socio-economic changes; that the lack ofinformation on targeted coastal fisheries like the Anadara clams inhibits opportunities for successfulmanaging and sustaining local fisheries. The Anadara (clams found on mudflats) fishery continues tobe an essential fishery in the area.
Outcomes of the community vulnerability assessment process15 Climate Change Characteristics & Vulnerabilities:
LAND
- lack of consistent piped water supply- overharvesting of resources- excessive cutting of trees & burning- trash, pig waste- flooding & land use management
SEA
- poaching- use of poison and small mesh size nets for fishing- overfishing of resources- loss of shellfish- flooding- mangrove and previously coral extraction for trade
SOCIO/ CULTURAL/ ECONOMIC EFFECTS
- lack of sustainable development- agricultural land (increasing population=less land
for planting- increase in population affecting population
dynamics in the village- urban drift- lack of awareness and capacity/skill for basic
employment
A s s e s s i n g v u l n e r a b i l i t y o f c o a s t a l m a n g r o v e s t o i m p a c t s o f c l i m a t e c h a n g e : F i j i c a s e s t u d i e s

5.1 Important lessons from adaptation activities
In assessing the vulnerability of mangrove systems and coastal marine habitats, the process highlighted a few key tasks to derive a working index that
involves:
n Assess the historical climatological baselines (of 50-100 year trends) for mangrove areas by acquiring information with the assistance of Fiji Meterological Services.
n Stratigraphic research to reconstruct relative sea level of mangrove environments of project sites.
n Community engagement process utilising the Climate Witness toolkit to document local impacts of climate variability, periodic cycles of storms, heavy rainfall and long dry spells.
n Ecological sensitivity of the mangrove-coastal region using biodiversity information as a proxy variable. A biodiversity-rich region measured by thepercentage of protected areas or community-based management effort mainly applying best practices.
n Adaptive capacity as a function of ecosystem health, socio-economic factors, technology and infrastructure across the three project sites as evident during the site profiling. Kubulau the farthest site to the nearest urban area, its mangroves is least affected by major clearance and
development is most intact. Verata site located close to a highway road and transport plus access to 24-hour electricity, its mangroves are heavily
affected by a higher human population density and firewood extraction for mainly commercial purpose. It is also noted that dealing with different
partner organisations per site, proved tedious in managing the monitoring aspects of field activities and adaptation measures.
n Communications aspect of information sharing and raising awareness is crucial to effect public opinion to the issues of protecting mangroves andbuilding coastal resilience.
n Exploring the dimensions of traditional/local ecological knowledge to revitalise local practices that enhance mangroves (seagrass, coral reefs) value and develop innovative, economical technologies practical and sustainable, especially applied at provincial and community level.
The main limitation of our assessment is the inability to manage well with key partner organisations of the methods and tools utilised onsite due mainly to
the delayed timeframe of approving and implementation phase of this project. However, this report attempts to standardise each site’s project activities
included in the vulnerability assessment process contributing to national and regional adaptation planning. Missing are projections of climate change and
socio-economic conditions for the coming years. There is sufficient regional scale climate modelling conducted by others, however, more meaningful
integration of disaster risk reduction (DRR) variables and engagement with the DRR network is crucial for sharing lessons.
34
PART B. FRAMING ADAPTATION STRATEGIES
Adaptation and resilience building require a suite of thoughtful, preventative actions, measures and investment to reduce the vulnerability of these natural
systems whilst addressing community’s needs, provincial and national developmental needs.
A standardised methodology to different ecological context across a geographically diverse scale is difficult, even with a range of tools and approaches,
therefore, a platform for lessons sharing within the region is important. Vulnerability assessments are costly and lengthy, unless supported with
endorsement at a national-provincial level. National stakeholders engagement informs the national reporting on related issues of mangroves and integrated
coastal zone management as well as contributing to national communications to international processes i.e. UNFCCC.
A s s e s s i n g v u l n e r a b i l i t y o f c o a s t a l m a n g r o v e s t o i m p a c t s o f c l i m a t e c h a n g e : F i j i c a s e s t u d i e s

Mangroves located within inter-tidal and submerged land technically belong to the state.
Indigenous communities have customary rights and access to these areas. The principal
legislations relevant to the management of mangroves are the:
1) Forestry Act
2) Crown [State] Lands Act
3) Fisheries Act
A Mangrove Management Committee was established by government in 1983 to review
foreshore development proposals and provide recommendations accordingly. The
National Mangrove Management Plan (phase I & II) was the major highlight of the
committee.
Other policies and legislations that have relevance to mangrove areas include:
n Housing Act- housing settlements means high population density areas. Development such as Raiwaqa, Raiwai, Vatuwaqa settlements
n Land Conservation and Imp. Act – important to the sustainable management of inland and freshwater wetlands – developments aimed at land improvement
which may do more harm than good
n Land Development Act – focuses on major land developments around the country whether they be of agriculture, aquaculture, livestock
n National trust of Fiji Act – covers properties and sites that are placed for safe keeping by government for their historical, biological, geographical
significance. Act is important for wetland conservation.
n Ports Authority of Fiji Act – the boundary under the Ports Authority’s jurisdiction is not confined to the physical port but to the whole harbor area
n Fiji Tourist Commissions and Visitors Bureau Act – covers eco-tourism operation, much of which are located in rural areas and wetland areas
n Fijian Affairs Act - one of the most important act for any conservation or sustainable management of natural resources
n Town Planning Act - supports the Environmental Impact Assessment (EIA) process under the Environment Management Act.
35
Potential mechanisms for better management of Fiji’s mangroves
n National Climate Change Policy (2006)- Actions or activities that people, individually or in groups take in order
to accommodate, cope with or benefit from the effects of climate
change
n National Forest Policy (2008)- Identifies mangroves as a unique ecosystem and advocates for their
protection and sustainable management
n Environment Management Act (2005)- Has provision for EIA processes to help control developments to
minimize negative impacts on our environment.
- Establishes the National Environment Council (NEC) to discuss, make
decisions, oversee and advise government on environmental issues
and conventions.
Climate change policy serves to define the position of government and
stakeholder on the issues of climate change, and provides the framework for the
various responsibilities of each stakeholder in the short and long term. While the
goal is to promote understanding and to formulate appropriate responses to
climate change, an important objective of the policy is on adaptation where
actions are identified or activities that people, individually or in groups take in
order to accommodate, cope with or benefit from the effects of climate change.
The EMAct specifically refers to any development that may alter the natural
processes of the sea, tidal waves including reclamation of mangrove areas. It
also requires an EIA to be undertaken for any proposal that would introduce
pollutants or properties to the air, water or soil that are potentially harmful to
people and wildlife.
Opportunities for adopting mangrove areas for climate change adaptation
n RAMSAR Convention Framework - Provides for a framework or criteria for selection of wetlands areas to
be protected as a RAMSAR sites. Potential sites have been identified
because of their mangrove status.
n Coastal Zone Management Plan - NEC under EMAct may appoint a committee for coastal zone manage-
ment to prepare a coastal zone management plan and advises NEC on
issues relating to coastal zones.
n National legislation on Protected Areas- Gap analysis and identification of effective management and legislative
framework for protected areas under the GEF funded projects eg.
Program of Work for Protected Areas and GEF PAS.
n Review of the Forest Decree and Fisheries Act
5.2 Strengthening national mechanisms
A s s e s s i n g v u l n e r a b i l i t y o f c o a s t a l m a n g r o v e s t o i m p a c t s o f c l i m a t e c h a n g e : F i j i c a s e s t u d i e s

6.0 References cited
Ellison, J. (in prep.). Manual for mangrove monitoring in the Pacific Islands Region. Monitoring changes in mangrove condition. School of Geography and Environmental
Ellison, J. and Strickland, P. (2009). Recent Stratigraphy and Pollen Analysis of Lomawai and Kubulau Mangrove Areas, Fiji.
Fiu, M. et al. (in prep.) Seagrass status and monitoring report for Nadroga coastline, 2006-2009. WWF South Pacific Programme.
Fiu, M. (unpublished) Status report of monitoring coastal marine habitats, Fiji. WWF South Pacific Programme.
Jupiter, S. et al., (2009). Report of mapping mangroves in Kubulau. WCS-South Pacific Program.
Intergovernmental Panel on Climate Change (2001). Climate Change 2001: Impacts, Adaptation and Vulnerability. Summary for Policy Makers and Technical Summary of the
Working Group II Report. Cambridge University Press, Cambridge.
Nunn, P.D. and Peltier, W.R. (2001). Far-field test of the ICE-4G model of global isostatic response to deglaciation using empirical and theoretical Holocene sea-level
reconstructions for the Fiji Islands, southwest Pacific. Quaternary Research, 55,203-214.
Obura, D. And Brimsditch, G. (2008). IUCN CCCR Resilience Assessment Protocol.
Strickland, P. (2009). Reconstruction of Holocene Relative Sea-level of Tikina Wai and Kubulau, Fiji by Pollen Analysis of Mangrove Sediments. School of Geography and
Environmental Studies. University of Tasmania.
Thaman, B. and Naikatini, A. (2002). Report on the mangrove flora and fauna surveys conducted within Lomawai Reserve, Bole Reserve, Lotonaluya Reserve, Tikina
Wai, Nadroga. WWF Fiji Country Programme.
University of the South Pacific, Institute of Applied Science (2009). Verata GIS mapping report.
Walls, K. 2007. Summary report of preliminary survey work on mangroves, seagrass and coral reef habitat in the vicinity of Raviravi, Kubulau, Bua. WCS-South Pacific
Programme.
36
A s s e s s i n g v u l n e r a b i l i t y o f c o a s t a l m a n g r o v e s t o i m p a c t s o f c l i m a t e c h a n g e : F i j i c a s e s t u d i e s

37
WEBSITES:
http://www.fms.gov.fj
http://www.onsetcomp.com
http://www.osdpd.noaa.gov/ml/ocean/cb/hotspots.html
http://www.projectaware.org
http://www.seagrasswatch.org
http://www.wwfpacific.org.fj
Links to Climate Change Relevant Data
The IPCC Data Distribution Centre-Global Climate Dataset
http://www.ipcc-data.org/obs/cru_climatologies.html
The Data Distribution Centre (DDC) of the Intergovernmental Panel on Climate Change (IPCC) is a clearing house of climate data, including future climate scenarios. Future climate scenarios
represent a range of greenhouse gas emissions scenarios, and projections are made using different General Circulation Models (GCM). GCM data tends to be course, over 2% latitude or
longitude per pixel length. Information on how to interpret the data is found at: Data interpretation: http://www.ipcc-data.org/guidelines/index.html
WorldClimm
http://www.worldclim.org/ and http://www.worldclim.org/future.htm
WorldClimm is a set of global climate layers with a spatial resolution of up to square kilometre, and including 19 bioclimatic variables. Current data represent average climate from 1950-2000.
The future projection represents the 2xCO2 scenario and is downscaled from high resolution (~50km) runs of the CCM3 General Circulation Model.
GIS Climate Change Scenarios
http://www.gisclimatechange.org/startPage.do
This GIS data portal provides access to free global datasets of climate change scenarios generated for the 4th Assessment Report of the Intergovernmental Panel on Climate Change (IPCC)
by the Community Climate System Model (CCSM). The datasets can be downloaded in a common GIS format (i.e. shapefiles) or text file format. Currently, the GIS portal distributes a subset of
all the data produced by the CCSM. One can view and or download global monthly mean 2D atmospheric and land variables from the CCSM component models.
Global Change Master Directory (NASA)
http://gcmd.nasa.gov/
Links to all types of environmental data, produced by and outside of NASA. Environmental mediums represent include, but are not limited to agriculture, climate, biological classification, human
dimensions, land surface, the terrestrial hydrosphere and the cryosphere (glaciers, snow/ice cover, etc.)
Global AVHRR-Derived Land Climatology (NOAA)
http://www.ngdc.noaa.gov/seg/fliers/gutavhrr.shtml
Derived from NOAA’s Advanced Very High Resolution Radiometer (AVHRR) sensor. Includes: monthly mean values of Calibrated Normalised Difference Vegetation Index (NDVI), Precipitable
Water Index (PWI), Reflectances and Temperatures. Data cover 1985-1991.
NOAA Coral Reef Watch
http://coralreefwatch.noaa.gov/satellite/index.html
The mission of NOAA’s Coral Reef Watch Program is to utilise remote sensing and in situ tools for near real-time and long term monitoring, modelling and reporting of physical environmental
conditions of coral reef ecosystems. This site has remote sensing derived data products used to indicate potential bleaching events, including coral reef hotspots and sea-surface temperature
anomalies.
Reefbase
http://reefgis.reefbase.org/
Global database of coral reefs, bleaching, diseases and other relevant information. View layers in online map tool or download GIS data.
Natural Disaster Hotspots- A Global Risk Analysis (CIESIN)
http://www.Ideo.columbia.edu/chrr/research/hotspots/coredata.html
Includes global data on the frequency and distribution of specific natural hazards, including cyclones, drought, earthquakes, landslides and volcanic eruption. Also includes data on mortality
and economic loss.
Permanent Service for Mean Sea Level (PSMSL)
http://www.nbi.ac.uk/psmsl
The PSMSL is the global data bank for long term sea level change information from tide gauges. The PSMSL collect data from several hundred gauges situated all over the globe.
Freshwater Resources (Centre for Biodiversity Conservation, AMNH)
https://gaia-staging.amnh.org/freshwatertest/index.php?section=fw_net_data
Links to datasets relevant for freshwater conservation
A s s e s s i n g v u l n e r a b i l i t y o f c o a s t a l m a n g r o v e s t o i m p a c t s o f c l i m a t e c h a n g e : F i j i c a s e s t u d i e s

38
Appendix I
Site label: RaViravi Transect# Quadrat# (test site ) Kubulau RVTT1Q1 Kubulau RVTT1Q2 Kubulau RVTT1Q3
LOCALITY Parameter Baseline resurvey Baseline resurvey Baseline resurvey
Kubulau total tree count 15 12 23 21 22 21
mean no. of tree per
plot (tree/m2) 0.15 0.12
0.23
0.21
0.22 0.21
Ave. dbh (cm) 9.19 12 14.85 15.26 11.05 11.86
Ave. height (m) 5.6 5
10.87
11.10 6.55 6.76
total basal area (cm2) 2506.75 1939.25
5275.6
4968.27 3522.3 3424.7
Rel. frequency
X.moluccensis (%) c.7 c.8
Rel. frequency
B.gymnoorhiza (%) c.87 c.92 100 100 c.41 c.39
Rel. frequency R.
stylosa (%) c.59 c.61
Rel. frequency C.nucifera (%) c.7 u/a
Mangrove survey results for Raviravi test site, Kubulau Transect 1.
Site label: RaViravi Transect# Quadrat# (test site )
Kubulau RVTT2Q1 Kubulau RVTT2Q2 Kubulau RVTT2Q3
LOCALITY Parameter Baseline resurvey Baseli ne resurvey Baseline resurvey
Kubulau total tree count 3 - 25 25 19 19
mean no. of tree per plot
(tree/m2) 0.03 - 0.25 0.25 0.19 0.19
Ave. dbh (cm) 23.33 - 10.68 13.86 10.63 10.11
Ave. height (m) 12 - 8.2 8.2 6 6
total basal area (cm2) 1296.82 - 346.4 4666.28 1965.64 1614.45
Rel. frequency
B.gymnoorhiza (%) 100 - 96 96 c.21 c.21
Rel. frequency R. stylosa
(%) 4 4 c.16 c.16
Rel. frequency C.nucifera
(%)
Rel. frequency R.
samoensis (%) 63 63
Site label: RaViravi Transect# Quadrat# (control site )
Kubulau RVCT1Q1 Kubulau RVCT1Q2 Kubulau RVCT1Q3
LOCALITY Parameter Baseline resurvey Baseline resurvey Baseline resurvey
Kubulau total tree count 20 - 5 4 12 11
mean no. of tree per plot
(tree/m2) 0.2 - 0.05 0.04 0.12 0.11
Ave. dbh (cm) 11.75 - 44.6 49.13 7.58 10.08
Ave. height (m) 7.25 - 18.20 17.75 4.92 4.91
total basal area (cm2) 2659.19 - 8029.77 4986.75 697.87 1067.53
Rel. frequency
B.gymnorrhiza (%) 85 - 100 100 25 c.18
Rel. frequency R. stylosa
(%) 15 - 75 c.82
Mangrove survey results for Raviravi test site, Kubulau Transect 2.
Mangrove survey results for Raviravi control site, Kubulau Transect 1.
Site label: RaViravi Transect# Quadrat# (control site )
Kubulau RVCT2Q1 Kubulau RVCT2Q2 Kubulau RVCT2Q3
LOCALITY Parameter Baseline resurvey Baseline resurvey Baseline resurvey
Kubulau total tree count 13 10 35 3 13 8
mean no. of tree per plot
(tree/m2) 0.13 0.1 0.35 0.03 0.13 0.08
Ave. dbh (cm) 22.31 19.88 12.34 19.33 5.23 6.88
Ave. height (m) 7.08 6.8 6.17 8.00 3.73 4.00
total basal area (cm2) 5422.78 3375.92 5418.07 899.61 441.17 531.05
Rel. frequency
B.gymnorrhiza (%) 100 100 100 100 c.8 25
Rel. frequency R. stylosa
(%) c.92 75
Mangrove survey results for Raviravi control site, Kubulau Transect 2.
A s s e s s i n g v u l n e r a b i l i t y o f c o a s t a l m a n g r o v e s t o i m p a c t s o f c l i m a t e c h a n g e : F i j i c a s e s t u d i e s

39
Site label: Lomawai Transect# Quadrat # (plot) Lomawai T1Q1 Lomawai T1Q2 Lomawai T1Q3
LOCALITY Parameter Baseline resurvey Baseline resurvey Baseline resurvey
Tikina Wai total tree count 23 37 100 100 10 10
mean no. of tree per plot (tree/m2) 0.23 0.37 1 1 0.1 0.1
Ave. dbh (cm) 5.08 5.64 3.49 3.63 11.87 12.23
Ave. height (m)
n/a n/a n/a n/a
total basal area (cm2) 786.27 967.43 1212.56 1331.86 2463.39 2662.01
Rel. frequency X.moluccensis
(%) 33 33 - -
Rel. frequency B.gymnorrhiza
(%) 67 67
Rel. frequency R. stylosa (%) 100 100 33 33
Rel. frequency X. granatum
(%) 70 70
Rel. frequency R. samoensis
(%) 10 10
Rel. frequency E. agallocha
(%) 10 10
Mangrove survey results for Lomawai, Tikina Wai, Transect 1.
Site label: BoleTransect# Quadrat # (plot) Bole T1Q1 Bole T1Q2 Bole T1Q3
LOCALITY Parameter Baseline resurvey Baseline resurve y Baseline resurvey
Tikina Wai total tree count 42 42 5 5 23 23
Bole mean no. of tree per plot
(tree/m2) 0.42 0.42 0.05 0.05 0.23 0.23
Ave. dbh (cm) 3.38 3.63 5.26 5.87 6.39 6.75
Ave. height (m) 2.7 n/a 2.4 n/a 5.85 n/a
total basal area (cm2) 448.25 510.62 170.2 205.7 1112.34 1239.06
Rel. frequency B.gymnorrhiza (%)
Rel. frequency R. stylosa (%) c.90.5 c.90.5 100 100 100 100
Rel. frequency X. granatum (%)
Rel. frequency R. samoensis (%) c.9.5 c.9.5
Mangrove survey results for Bole Reserve transect, Tikina Wai.
Site label: Lomawai Transect# Quadrat # (plot) Lomawai T2Q1 Lomawai T2Q2 Lomawai T2Q3
LOCALITY Parameter Baseline resurvey Baseline resurvey Baseline resurvey
Tikina Wai total tree count 26 26 31 31 39 39
Lomawai mean no. of tree per plot
(tree/m2) 0.26 0.26 0.31 0.31 0.39 0.39
Ave. dbh (cm) 10.2 10.63 9.24 9.84 10.26 10.68
Ave. height (m) 5.98 n/a n/a n/a 8.52 n/a
total basal area (cm2) 2943.33 3142.5 2635.31 2973.72 6161.10 6539.96
Rel. frequency B.gymnorrhiza
(%) c.85 c.85 c.77 c.77 c.87 c.87
Rel. frequency R. stylosa (%) c.15 c.15 c.3 c.3 c.13 c.13
Rel. frequency X. granatum
(%) c.3 c.3
Rel. frequency C. subcordata
(%) c.16 c.16
Mangrove survey results for Lomawai, Tikina Wai, Transect 2.
Site label: Lotonaluya ransect# Quadrat # (plot)
Lotonaluya T1Q1 Lotonaluya T1Q2 LotonaluyaT1Q3
LOCALITY Parameter Baseline resurvey Baseline resurvey Baseline resurvey
Tikina Wai total tree count 36 34 38 37 57 57
mean no. of tree per plot (tree/m2) 0.36 0.34 0.38 0.37 0.57 0.57
Ave. dbh (cm) 6.77 8.53 5.38 5.64 4.92 5.3
Ave. height (m) 6.03 n/a 5.09 n/a 3.60 n/a
total basal area (cm2) 1730.69 1953.07 1199.28 1344.12 1978.58 2197.81
Rel. frequency B.gymnorrhiza (%) c.28 c.29 c.56 c.56
Rel. frequency R. stylosa (%)
100 c.44 c.44
Rel. frequency R. samoensis (%) c.72 c.71
Mangrove survey results for Lotonaluya Reserve, Tikina Wai.
A s s e s s i n g v u l n e r a b i l i t y o f c o a s t a l m a n g r o v e s t o i m p a c t s o f c l i m a t e c h a n g e : F i j i c a s e s t u d i e s

40
Site label: Verata transect# Quadrat # Naloto T1Q1 NalotoT1Q2 Naloto T1Q3
LOCALITY Parameter Baseline resurvey Baseline resurvey Baseline resurvey
Naloto total tree count 20 20 17 17 6 u/a
mean no. of tree per plot (tree/m2) 0.2 0.2 0.17 0.17 0.06 u/a
Ave. dbh (cm) 23.63 23.63 53.44 53.44 129.17 u/a
Ave. height (m) 2.11 2.11 3.72 u/a 10 u/a
total basal area (cm2) 17836.77 17836.77 42999.16 42999.16 85820.13 u/a
Rel. frequency B.gymnorrhiza (%) 15 15 c.94 c.94 33 u/a
Rel. frequency R. stylosa (%) 45 45 c.6 c.6 I.bijuga-50 u/a
Rel. frequency R. samoensis (%) 40 40 E. agallochac.17 u/a
Mangrove survey results for Naloto Transect 1, Verata.
Site label: Verata transect# Quadrat # Verata T1Q1 Verata T1Q2 Verata T1Q3
LOCAL ITY Parameter Baseline resurvey Baseline resurvey Baseline resurvey
Verata total tree count 11 4 9 u/a 18 11
mean no. of tree per plot (tree/m2) 0.11 0.04 0.09 u/a 0.18 0.11
Ave. dbh (cm) 52.64 133.5 9.92 u/a 24.83 30.55
Ave. height (m) 5.81 u/a 5.17 u/a 2.61 u/a
total basal area (cm2) 38418.69 38155.71 966.34 u/a 33168.61 28449.97
Rel. frequency X. granatum (%) c.64 50
Rel. frequency E. agallocha (%) c.18 50
Rel. frequency R. stylosa (%)
100 u/a
Rel. frequency R. samoensis (%)
78 c.64
Rel. frequency H. littoralis (%) c.9 u/s
Rel. frequency C. maanghas (%) c.9 u/a
Rel. frequency B.gymnorrhiza
22 c.36
Mangrove survey results for Verata Transect 1.
Site label: Verata transect# Quadrat # Naloto T2Q1 NalotoT2Q2 Naloto T2Q3
LOCALITY Parameter Baseline resurvey Baseline resurvey Baseline resurvey
Naloto total tree count 5 u/a 23 23 31 31
mean no. of tree per plot (tree/m2) 0.05 u/a 0.23 0.23 0.31
Ave. dbh (cm) 20.38 u/a 30.75 30.75 22.65
Ave. height (m) 2.63 u/a 2.63 u/a u/a
total basal area (cm2) 2892.73 u/a 23383.58 23383.58 16635.72 16635.72
Rel. frequency B.gymnorrhiza (%) 100 u/a c.52 c.52 c.81 c.81
Rel. frequency R. stylosa (%)
c.4 c.4
Rel. frequency R. samoensis (%)
44 44 c.19 c.19
Mangrove survey results for Naloto Transect 2, Verata.
A s s e s s i n g v u l n e r a b i l i t y o f c o a s t a l m a n g r o v e s t o i m p a c t s o f c l i m a t e c h a n g e : F i j i c a s e s t u d i e s

41
TRANSECT 1 TRANSECT 2
Month Leaves (g) Fruits (g) Flowers (g) Wood (g) Leaves (g) Fruits (g) Flowers(g) Wood (g)
Oct. 321.14 0 86.47 13.35 272.56 39.74 88.29 41.84
Nov. 192.11 28.68 58.66 0 230.24 6.11 41.84 30.92
Dec. 164.5 79.7 41.2 20.7 341.48 0 29.91 8.44
Jan. 970.7 0 45.5 92 368.04 97.6 65.16 38.93
TRANSECT 3 TRANSECT 4
Month Leaves (g) Fruits (g) Flowers (g) Wood (g) Leaves (g) Fruits (g) Flowers(g) Wood (g)
Oct. 321.14 0 86.47 13.35 272.56 39.74 88.29 41.84
Nov. 192.11 28.68 58.66 0 230.24 6.11 41.84 30.92
Dec. 164.5 79.7 41.2 20.7 341.48 0 29.91 8.44
Jan. 970.7 0 45.5 92 368.04 97.6 65.16 38.93
Tikina Wai leaf litter data for all transects, during late 2007-2008.
Site Date 1 2 3 4 5 6 7 8 9 10 Site Comment
Lomawai 1 26/06/07 16.6 9.7 14.4 18.5 16.3 16 16.8 19.5 19.3 14.8 measured land to sea direction
22/07/08 10 15.9 14.8 14.4 19.1 15.8 17.8 19.7 18.7 15.4
Lomawai 2 27/06/07 14.4 13 17.4 15.8 14 18.2 16.8 18.6 19 16.8 measured land to sea direction
22/07/08 13.2 16.4 17.9 17.7 18.3 13.7 12.5 14.8 16.8 20.4
Lomawai 3 27/06/07
20.4 24.8 21.1 25 25.1 23.1 25.6 24.5 23 25.1
22/07/08
Lomawai 4 27/06/07
31.4 25.8 28.4 25.8 26.4 25.3 25 26.4 32.4 32.1 edge of water to land directrion
22/07/08
28.8 25.8 27.7 26.6 25.7 25.7 23.9 26 33 29.6
Lomawai 5 27/06/07
23 18.2 18 15.3 13.2 19.9 17 18.1 18.6 19 measured land to sea direction
22/07/08
18.2 16.9 14.8 14.9 12.2 19.2 12.7 11.8 17.3 16.6
Lomawai 6 26/06/07
17 16.7 14.4 10.2 11.9 12.7 15.3 14.6 14 11.2 measured sea to track direction
22/07/08
11 13 9 1.5 1 0.7 17.8 15.6 missing 8.9
Lotonaluya 1 13/08/07 23.4 27.1 20.6 28.7 19.7 19.9 22.8 25.4 24.4 26.7 measured sea to land direction
24/07/08 10.4 7 23.4 16.4 14.1 19.4 25 22.5 40 34.5
Lotonaluya 2 13/08/07 17.6 16.9 16.7 16 14.6 24.3 27.7 27.6 27.7 28.5 measured land to sea direction
24/07/08 16.6 13.2 16.5 16.1 11.7 20.4 23.5 26.6 26.5 28.4
Lotonal uya 3 14/08/07 22.8 20.5 23.5 20.5 22 25.6 18 17.5 23.8 26.5 Measured land to sea direction
24/07/08 23.3 21.3 25.9 19.9 19 26.1 16 16 23.3 24
Bole 1 13/08/07 17.9 24.8 26.9 27.8 21.5 22.4 23.5 20.5 23 21.8 Measured right to left facing the road
23/07/08 19.3 18.3 25.7 27.4 20.4 21.9 23.4 19.4 21 33.6
Bole 2 13/08/07 27 25.5 26.5 25.3 21.2 21.3 22.2 21.6 18.2 19.5 Measured left to right facing hills
23/07/08 31.5 15.7 25 23.5 21.6 19.5 20.4 missing 16.3 17.9
Bole 3 14/08/07 23 24 23.8 17.5 20.5 20.6 21.8 28 19.3 21.5 Measured land to sea direction
23/07/08 20.5 22 22.9 16 16.8 22 19.5 27 18 19
All measurements made in cm
Tikina Wai sedimentation data collected from planted stakes per site.
A s s e s s i n g v u l n e r a b i l i t y o f c o a s t a l m a n g r o v e s t o i m p a c t s o f c l i m a t e c h a n g e : F i j i c a s e s t u d i e s

42
A s s e s s i n g v u l n e r a b i l i t y o f c o a s t a l m a n g r o v e s t o i m p a c t s o f c l i m a t e c h a n g e : F i j i c a s e s t u d i e s
Appendix 2
Vulnerability Assessment Tool
Projected period for conduct of
work
Relative costing In FJD in 2yr
period
Capacity required (minimum)
Opportunities (for engagement, information)
Useful rating for each VA
tool? Scale 1-5
Main messages from the results
Who to communicate such results- target
audience 1. Fiji Islands climate
change trends In less than 6
months
Free service upon request to the
Climate Services Division, Fiji
Meterological services..
Basic understanding of interpreting trends about precipitation,
rainfall intensity, air temperature,
relative humidity
Source from Fiji Meteorological Services
Translation of the regional downscaled climate modeling
5 Information is available upon request for most of the major islands with weather monitoring stations. Site profiles can be drawn for climatological baseline information for a range of 50-100 years .
Message(s): Understanding the climate variability of islands; the language used in messaging of results, its implications to management of natural resource use. Target audience: villages during community outreach and consultation.
2. Fiji Islands climate change projections
Part of the above set of information from FMS
No capacity Information accessed from CSIRO Pacific Climate Change Science Project for its work in progress on regional climate projections
2 Downscaled modeling is not useful at country level mainly due to scale ie. land mass .
Message(s): Regional downscaled modeling is sufficient data in the context of this VA. Sector risk level modeling eg. Flooding, coastal erosion appears useful. Target audience: project managers, department officers, technical working groups.
3. Ecological assessment of mangroves
Depending on the size of mangrove area, project sites spent a maximum of 5 survey days.
$4,500-$10,000FJD to
include community
consultation costs
Community members trained in
basic ecological survey skills
supervised by field staff (graduates)
Low cost and effective for logistics planning dependent on site location for accessibility.
5 Improve on the knowledge base for current status of mangroves, reviewing its pattern for loss of mangrove cover.
Message(s): The condition of mangroves and its threats. Advocacy for mangrove protection highlighting economic & social/cultural links to mangroves conservation. Target audience: Public, Private partners, legislative attention.
4. Mangroves monitoring- Level 1
10 days Est. $6,500FJD depending on site
location
Trained community
graduate level
4 Community documentation
Message(s): support mangrove protection for safeguarding livelihood

43
A s s e s s i n g v u l n e r a b i l i t y o f c o a s t a l m a n g r o v e s t o i m p a c t s o f c l i m a t e c h a n g e : F i j i c a s e s t u d i e s
environmental science (technical staff- mangrove
ecology)
of local mangrove areas for need to develop locally relevant, site-specific adaptation activities
and food security (mainly fisheries). Target audience: community primarily villages/districts. Reporting can translate research information for decision makers eg. To influence provincial development planning.
5. Mangroves monitoring - Level 2
Annual monitoring
$3,000FJD Graduate level- environmental
science
Participatory learning action community members
engaged in the field surveys and monitoring
(sedimentation + litter) proved more effective in raising mangrove ecology
awareness thus enhance the sustainability of protective (or
regulatory) measures for mangroves and associated coastal habitats within the
locality.
Annual monitoring
4 With provision of funding support
6. Mangroves monitoring- Level 3
Litter collection (ideally per month) by trained community group mainly women and youth (12 months).
$250FJD/month total
Trained community
graduate level environmental
science + Laboratory
technicians for the drying.
3-4 Such information provides insight to sedimentation load, main input from upland activities
7. Marine habitat characterization- seagrass and coral reefs
2 weeks of survey depending on sampling size.
2 weeks of data
analysis+reporting
$6,500-$10,000FJD
Seagrass monitoring- community group (youth/women) Coral reef surveys- training in PADI OW + reef survey skills (basic understanding of reef ecology)
5 Message(s): Healthy reefs and seagrass, healthy mangroves build coastal resilience and protection of communities and their livelihoods. Target audience: Surveys conducted by youth+women
8. Real time seawater thermal monitoring
Real time monitoring i.e.
hourly for 6-month
deployment
$2,000FJD Graduate environmental science + dive
operator
Active engagement of local dive operators and graduates will reduce field (boat/dive)
costs for the regular monitoring of SST logger and
time to download and translate logged SST data for
information use.
5 Message(s): Are our seas warming and their effects to our coral reefs? Target audience: dive operators, official websites eg. NOAA
9. Spatial mapping & Sub-granted + GIS major graduate Collaboration with 5 Message(s): Information
habitat change
WWF site GIS profiling
$1500FJD
departments of land, land-use (agriculture) and
forestry/fisheries for access to data
Spatial mapping enhances zoning planning for management and protection of critical habitats.
tool for advocacy on mangrove protection plus aid in mangrove/ecology education and awareness purposes. Target audience: Public and state (district, provincial).
10. Stratigraphy-field
Pollen grain analysis- laboratory analysis
1 week of field work.
At least 2 months of planning
especially with external expertise
and imported field equipment.
$16,000FJD+ Under the
$30,000USD downscaled
modeling budget
Technical experts, graduate honors
students, local field guides.
To engage fellowship students to conduct the research.
Liaison with Customs, Quarantine and Lands departments, Ports Authority broadens the scope of project information to other sectors.
5
5
Message(s): How do mangroves respond to current rising sea levels! Target audience: public (community) and coastal developers.
11. Climate witness & community participatory V&A
Throughout the project lifetime.
$5000FJD Skilled facilitators, community elders.
Identifying social and governing structures adjacent
to studied mangrove areas. Documentation during
community consultation usually wide and unfiltered.
5 Message(s): Understanding the patterns of change by both natural events and man-made. Target audience: village communities.
12. National stakeholder participation & regional learning
Annually $3,000FJD Strong networks and committed partnerships.
Information sharing allows for better consultation and synergy amongst the various sectors, departments.
5 Message(s): Protect our mangroves for the future. Target audience: Public

44
A s s e s s i n g v u l n e r a b i l i t y o f c o a s t a l m a n g r o v e s t o i m p a c t s o f c l i m a t e c h a n g e : F i j i c a s e s t u d i e s
Participant Designation Representing Contact Details 1. Simon McGree
[CONFIRMED]
Manager Climate Services Fiji Meteorological Services Email: [email protected] Phone: 6724888 Fax: 6720430
2. Mr Joeli Cawaki [CONFIRMED]
Director - DISMAC DISMAC Fiji Email: [email protected] Phone: 331 3023 Fax: 3319315
3. Jonetani Tagiveitaua
(Acting) Senior Tourism Officer
Ministry of Tourism- Sustainable Development Section
Email: [email protected] Phone: 331 2788 Ext 217 Fax: 3302060
4. Manoa Malani Principal Tourism Officer Ministry of Tourism- Sustainable Development Section
Email: [email protected] Phone: 331 2788 Ext 216 Fax: 330 2060
5. Viliame Koyamaibole [CONFIRMED]
Eco-Tourism Consultant Sustainable Tourism Consultants Email: [email protected] Phone: 9497460 Fax:
6. Michael Wong [need Info Brief]
Executive Officer Fiji Islands Hotel and Tourism Association Address: 42 Gorrie
Street, Suva
Email: www.fihta.com.fj Phone: 330 2980, 330 2975 Fax: 330 0331
7. Aisake Batibasaga Principal Research Officer
Fisheries Department- MAFF Email: [email protected] or [email protected] Phone: 336 1122 Fax: 336 3170
8. Capt. Inoke Ratotodro Josateki Tagi
Director Assistant Director
Fiji Islands Maritime Safety Administration (FIMSA)
Address: Motibhai Building, Amra Street, Walu Bay
Email: [email protected] Phone: 3315266 Fax: 3303251
9. Capt. Felix Maharaj
Philip Hill
Chief Hydrographer Deputy Port Master
Fiji Islands Maritime Safety Administration (FIMSA)
Address: Motibhai Building, Amra Street, Walu Bay
Email: [email protected] Phone: 3315283 Fax: 3303251
10. Pasirio Samisoni [CONFIRMED]
Director Department of Lands and Surveys Email: Phone: 3211516 Fax: 3303841
11.
Person in charge of mangrove Licensing
Department of Lands and Surveys Email: Phone:
12. Nasra Khan Senior Town Planner
(Development Control) Department of Town and
Country Planning
Email: Phone: 330 5336 ext 102 Fax: 3309578
13. Chief Economic Planning Officer
Ministry of Finance and National Planning
Level 7-8 Ro Lalabalavu House
Tel: 3313411 Fax: 3304809
14. Tsutomu Yoshida [CONFIRMED]
Director OISCA Email: Phone: 6520348 Fax: 6520348
15. Sairusi Masi [CONFIRMED]
OISCA Phone: 6520348 Fax: 6520348
16. Julie [CONFIRMED]
OISCA Phone: 6520348 Fax: 6520348
17. Osea Tuinivanua Pita [CONFIRMED]
Conservator of Forests Forestry Division, Koronivia
Ministry of Forests Email: Phone: 3301611- ask for Eseta (PA) Fax: 3318692
18. Akosita Lewai Forest Officer-GIS Ministry of Forests Email: [email protected] Phone: 3320667 Fax: 3318692
19. Ratu Viliame Tagivetaua
Chairman- Native Lands and Fisheries Commission
Ministry of Fijian Affairs Email: [email protected] Phone: 3301001 Fax: 3309252
20. Ajay Singh Acting Manager- Admin Provincial Development and Natural Disaster Management
Email: [email protected] Phone: 3313400 Fax: 3303256
21. Viliame Bureniwai [CONFIRMED]
Roko Tui Nadroga- Navosa
Nadroga Provincial Office Address: P.O Box 267, Sigatoka
Email: Phone: 650 0137 Fax: 650 0203
22. Alipate Natoba Vitukawalu [CONFIRMED]
Assistant Roko- Tikina Wai
Nadroga Provincial Office Address: P.O Box 267, Sigatoka
Email: Phone: 650 0137 Fax: 650 0203
23. Ken Cokanasiga [CONFIRMED]
Provincial Services Division
Ministry of Fijian Affairs Email: [email protected]
24. Ratu Semi Ramatai [CONFIRMED]
Assistant Roko- Kubulau Bua Provincial Office Email: Phone: 8836020 Fax: 8836101
25. Joape Nalatu [CONFIRMED]
Roko Tui Tailevu Tailevu Provincial Office Address: P.O Box 71, Nausori
Email: Phone: 347 8094 Fax: 347 8211
26. Sitima Naqaravatu [CONFIRMED]
Assistant Roko- Verata Tailevu Provincial Office Address: P.O Box 71, Nausori
Email: Phone: 347 8094 Fax: 347 8211
27. Mosese Nakoroi [CONFIRMED]
Assistant Roko- Macuata Macuata Provincial Office Address: P.O Box 1326, Labasa
Email: Phone: 881 2599 Fax: 881 4597
28. Iliesa Natawa [CONFIRMED]
Mata ni Tikina- Wai Nahue Development Committee (NDC)
Email: Phone:
29. Nanise Natoma [CONFIRMED]
Secretary- NDC, Tikina Wai
Nahue Development Committee (NDC)
Email: Phone: 9406267

45
A s s e s s i n g v u l n e r a b i l i t y o f c o a s t a l m a n g r o v e s t o i m p a c t s o f c l i m a t e c h a n g e : F i j i c a s e s t u d i e s
30. Koto Live and Learn Email: [email protected]
Phone: 3315868 or 3315467 Fax: 3305868
31. Elizabeth Erasito [CONFIRMED]
Director National Trust of Fiji Email: [email protected] Phone: 3301807 Fax: 3305092
32. Sefanaia Nawadra
Director Conservation International Email: [email protected] Phone: 9351696
33. Etika Rupeni FSPI Email: [email protected] Phone: 3312 250 Fax: 331 2298
34. Arthur Webb [CONFIRMED]
Coastal Processes Advisor
SOPAC Email: [email protected] Phone: 338 1377 Fax: 337 0040
35. Peter C Emberson [CONFIRMED]
Climate Change Adaptation
Pacific Council of Churches
Email: [email protected]
36.
Fiji Red Cross Society
Email: [email protected] Phone: 3314133 Fax: 3303818
37. Moortaza Jiwanji [CONFIRMED]
Disaster Risk Management Advisor
UNDP Pacific Center Email: [email protected] Phone: 330 0399 Fax: 330 1976
38. Dr Bale Tamata [CONFIRMED]
Representing PACE-SD Email: [email protected] Phone: 3232567 Fax: 3231514
39. Leone Limalevu Research Assistant- Climate Change
PACE-SD Email: [email protected] Phone: 3232892 Fax: 3232891
40. Dick Watling [CONFIRMED]
Nature Fiji Email: [email protected] Phone: 3383189 Fax: 3381818
41. Randolph Thaman [CONFIRMED]
USP- Geography Email: [email protected] Phone:
42. Marika Tuiwawa [CONFIRMED]
Curator USP- Herbarium Email: [email protected] Phone:
43. Sandeep Singh Environmental Affairs Specialist
US Embassy
Email: [email protected] Phone:
44. Joe Murphy [CONFIRMED]
Regional Environment Coordinator
US Embassy Email: [email protected]
45. Katarina Atalifo UNDP- GEF- SGP Email: [email protected] Phone: 3310541
46. Kesaia Tabunakawai [CONFIRMED]
WWF Email: [email protected]
47. Louise Heaps [CONFIRMED]
WWF Email: [email protected]
48. Sanivalati Navuku [CONFIRMED]
WWF Email: [email protected]
49. Mark Spalding The Nature Conservancy Email: [email protected]
Core Meeting Team List
Participant Designation Representing Contact Details
50. Epeli Nasome Director Department of Environment Email: [email protected] Phone:
51. Eleni Tokaduadua [CONFIRMED]
Department of Environment Email: [email protected] Phone: 3311699
52. Stacy Jupiter [CONFIRMED]
WCS Email: [email protected] Phone:
53. Thomas Tui WCS Email: [email protected] Phone:
54. James Comley [CONFIRMED]
USP-IAS Email: [email protected] Phone:
55. Aaron Jenkins Wetlands International Email: [email protected] Phone:
56. Issac Rounds [CONFIRMED]
CI/NTF Email: Phone:
57. Monifa Fiu [CONFIRMED]
WWF Email: [email protected] Phone:
58. Francis Areki [CONFIRMED]
WWF Consultant Email: [email protected] Phone:

Why we are here.
www.panda.org
To stop the degradation of the planet’s natural environment andto build a future in which humans live in harmony with nature.
WWF South Pacific Programme
4 Ma’afu Street
Suva
Fiji Islands
Tel: (679) 331 5533
Fax: (679) 331 5410
www.wwfpacific.org.fj