vulnerability – the top level performance indicator for ...€¦ · vulnerability – the top...
TRANSCRIPT

Nikola Tanasic, Ph.D. Civ. Eng. Assistant prof. at Faculty of Civil Engineering, University of Belgrade, SerbiaRade Hajdin, Ph.D. Civ. Eng. President Infrastructure Management Consultants, Zürich, SwitzerlandProfessor at Faculty of Civil Engineering, University of Belgrade, Serbiae-Mails: [email protected]; [email protected]
Vulnerability – The top level performance indicator for bridges exposed to flooding hazards
11th International bridge
1

1. Introduction
2. Performance indicators related to flooding in Europe
3. Vulnerability of bridges to flooding events
4. Methodologies for quantitative risk/vulnerability assessment
5. Structuring of adequate quality control plans
6. Conclusion
Outline
Vulnerability – The top level performance indicator for bridges exposed to flooding hazards

3/49
Vulnerability The top level performance indicator for bridges exposed to flooding hazards Tanasic N. & Hajdin R.
Japan, 1998 – intensive rainfall road infrastructures damaged at 645 locations14 bridge failures
South Korea, 2003 – typhoon Maemi27 bridges and 774 roads impaired
Taiwan, 2009 – typhoon Morakot52 bridges devastated
Introduction - extreme flooding events around the world
3/49

Hintze Riberto bridge, Portugal, 2001
Northside bridge, UK, 2009
St. Adolph bridge, Canada, 2009
Bridge over Filos river, Turkey, 2012
Bridge across Rambla de Bejar, Spain, 2012
Boneybrook bridge, Canada, 2013
Two bridges in Sardinia, Italy, 2013
Vulnerability The top level performance indicator for bridges exposed to flooding hazards Tanasic N. & Hajdin R.
4/49
Introduction – recent bridge failures

May 14 – 18, 2014 / Extreme flooding event: South-east Europe floods caused by cyclone Tamara
1.6 mil. people directly affected; Damage estimated 1.0 bil. $
Serbia
Wikipedia Wikipedia
Precipitation11-17 May
Vulnerability The top level performance indicator for bridges exposed to flooding hazards Tanasic N. & Hajdin R.
5/49
Introduction – recent flooding in Serbia

Torrential flooding + flood level 16ft above the ground level at several urban areas = 59 fatalities, tens of thousands evacuated.
~ 2.200 public industrial and infrastructure facilities were flooded, (incl. the coal mine site “Kolubara”)
Vulnerability The top level performance indicator for bridges exposed to flooding hazards Tanasic N. & Hajdin R.
Introduction – recent flooding in Serbia

Severe damage to the transportation infrastructure: ~3500 roads damaged/destroyed; ~1800 at risk - landslides!
~ 300 bridges affectedThe two main causes of bridge failures: Washing away of access roads Local scour
Vulnerability The top level performance indicator for bridges exposed to flooding hazards Tanasic N. & Hajdin R.
Introduction – recent flooding in Serbia

4 bridges collapse in Waco, Texas, USA ~ June 1. 2016
…road will remain closed until the county bridge is repaired, and there is no prediction as to when that might be. (wacotrib.com)
Vulnerability The top level performance indicator for bridges exposed to flooding hazards Tanasic N. & Hajdin R.
Introduction – more flooding…

• Long Term Bridge Performance Program Reliable identification of scour susceptible bridges is necessary !
• FHWA NBI Item 113 – Scour vulnerable bridges
NYSDOT Hydraulic Vulnerability Manual
NCHRP 590 Scour vulnerability & multi-criteria optimization in decision making
Software ? HAZUS-MH (USA), Road Risk (Switzerland), CAESAR (USA)
European research project COST TU1406 Structuring of QC plans for roadway bridges Dynamics and uncertainty of non-interceptable (sudden) events
Vulnerability The top level performance indicator for bridges exposed to flooding hazards Tanasic N. & Hajdin R.
Introduction – scour assessment in bridge management practice

Vulnerability The top level performance indicator for bridges exposed to flooding hazards Tanasic N. & Hajdin R.
Performance indicators for flooding hazards in Europe
• COST TU1406 survey for bridge performance indicators

Reported terms on scour:
• Visual Inspection - exposed foundation, eroded embankment… Possible failure scenario revealed - not reliable Prioritization for monitoring/measuring of scour - not reliable Ineffective against flash flooding!
• Measurements - scour depth and scour affected area Scour cavity infill? Cost and adequacy? Ineffective against flash flooding!
• Indirect evaluation - hydraulic adequacy, scour eval. formulas… Appropriateness of the applied formulas ? Overestimation of a scour depth ?
Vulnerability The top level performance indicator for bridges exposed to flooding hazards Tanasic N. & Hajdin R.
Performance indicators for flooding hazards in Europe

Vulnerability of bridges to flooding events
Vulnerability The top level performance indicator for bridges exposed to flooding hazards Tanasic N. & Hajdin R.
Risk of failure• Qualitative approaches (e.g. Likelihood & Consequences Matrix)• Included only in several BMS !
• Easy ranking?
• How to evaluate: Likelihood of an Event? Consequences ?
• Thresholds ?
• Probability of the Event f = Hazard Magnitude s & Failure mode n
s Conditional
probability of failure
Vulnerability of bridges to flooding events
Vulnerability The top level performance indicator for bridges exposed to flooding hazards Tanasic N. & Hajdin R.
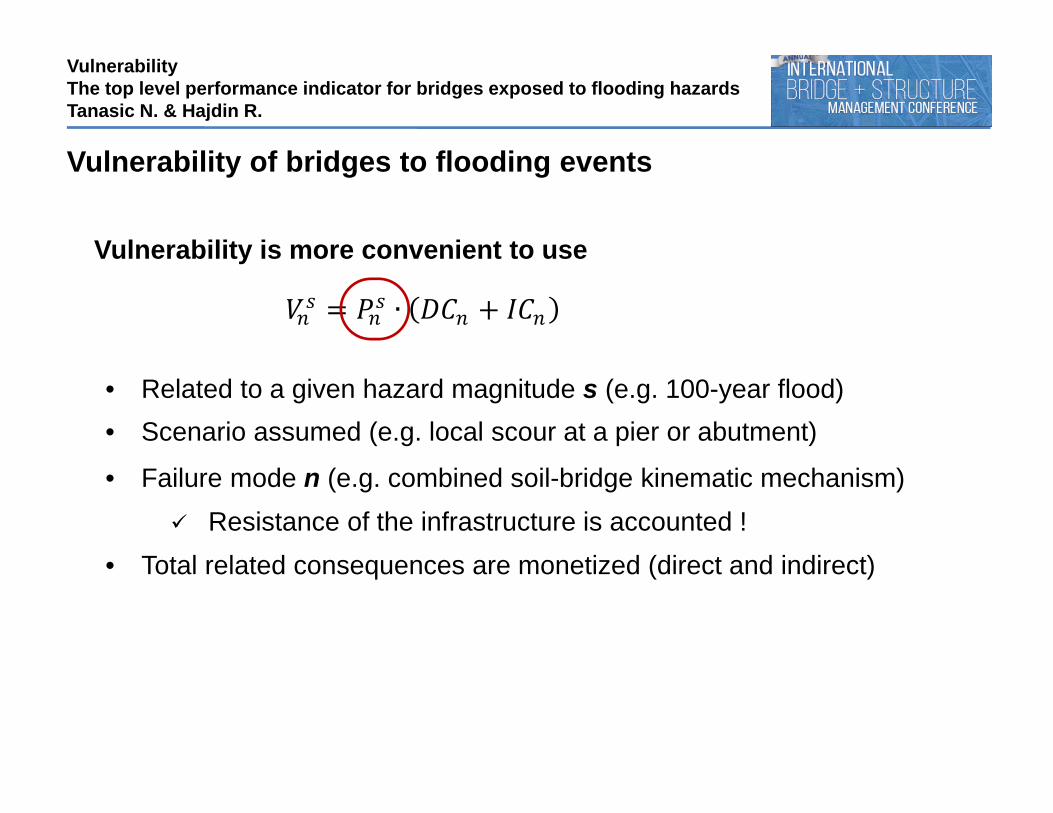
Vulnerability is more convenient to use
• Related to a given hazard magnitude s (e.g. 100-year flood)• Scenario assumed (e.g. local scour at a pier or abutment)
• Failure mode n (e.g. combined soil-bridge kinematic mechanism) Resistance of the infrastructure is accounted !
• Total related consequences are monetized (direct and indirect)
∙

Key data for hazards: Exposure, Resistance, Consequences
• Exposure (hazard scenario) Flooding magnitude and duration (i.e. hydrograph) Water channel geometry & properties Piers & abutments location, geometry and alignment in respect to
a water flow• Resistance (failure modes)
Properties of a soil at foundations (geotechnics and erodibility) Type & detailing of the substructure and superstructure Location and severity of damage on relevant bridge elements
• Consequences (inadequate bridge performance) Costs of repairs or replacement, down time Network & traffic data to account indirect costs of failure e.g.
vehicle operating costs, accident costs, travel time, etc.
Vulnerability of bridges to flooding events
Vulnerability The top level performance indicator for bridges exposed to flooding hazards Tanasic N. & Hajdin R.

• HYRISK Quantitative approach (bridges with unknown foundations)
• Predefined Minimum Performance Levels • QC plans - thresholds for foundation survey, countermeasures,
automated monitoring
Methodologies for quantitative vulnerability assessment
Vulnerability The top level performance indicator for bridges exposed to flooding hazards Tanasic N. & Hajdin R.
Data PI: Risk of scour failureExposure NBI Items
Resistance Adjustment factors for types of foundation and spanProbability of failure – NBI items
Consequences Traffic volumeuncomprehensive !
Failure type not considered !

Methodologies for quantitative vulnerability assessment
Vulnerability The top level performance indicator for bridges exposed to flooding hazards Tanasic N. & Hajdin R.
• Conditional probability of a bridge failure Flooding magnitudes and related local scour action Combined soil-bridge failure modes
Scenario I Local scour at the pier Scenario II
Local scour at the abutment
Failure mode ILocal scour at the pier
Failure mode IILocal scour at the abutment

Vulnerability The top level performance indicator for bridges exposed to flooding hazards Tanasic N. & Hajdin R.
Bridge element Attention ResistanceFailure mode type
Affected substructure foundation
Inadequate detailing/condition state Structure governed 1
Bearing/joint at the top of the affected substructure
Low plastic strength of a bearing/joint (or a poor
condition state)
Governed by soil properties i.e no/low
superstructure resistance
2
Bearings/joints at other substructures
Horizontal displacement is either free or restrained
Combined soil-bridge resistance 3
Main girder DetailingCombined soil-bridge
resistance 3
Failure safe 4
Key bridge elements for different types of resistance to local scour at a substructure
Structuring of adequate quality control plans

Vulnerability The top level performance indicator for bridges exposed to flooding hazards Tanasic N. & Hajdin R.
Structuring of adequate quality control plans
• FM Type 1 – progressive collapse due to inadequate detailing

Vulnerability The top level performance indicator for bridges exposed to flooding hazards Tanasic N. & Hajdin R.
Structuring of adequate quality control plans• FM Type 3 – combined soil-bridge resistance

Vulnerability The top level performance indicator for bridges exposed to flooding hazards Tanasic N. & Hajdin R.
Structuring of adequate quality control plans
• FM Type 4
• Or is this FM Type 2 ? Missing pier !
Deflection ?

Vulnerability The top level performance indicator for bridges exposed to flooding hazards Tanasic N. & Hajdin R.
Conclusion
• Structuring of an adequate control plan for each bridge type
• Minimum set of information !
• Performance Indicator = Vulnerability
• Preventative interventions
Decrease an exposure to a scenario
Monitoring of scour at substructures
Increase of a structure resistance
o Bridges with potential for FM type 1 & 2
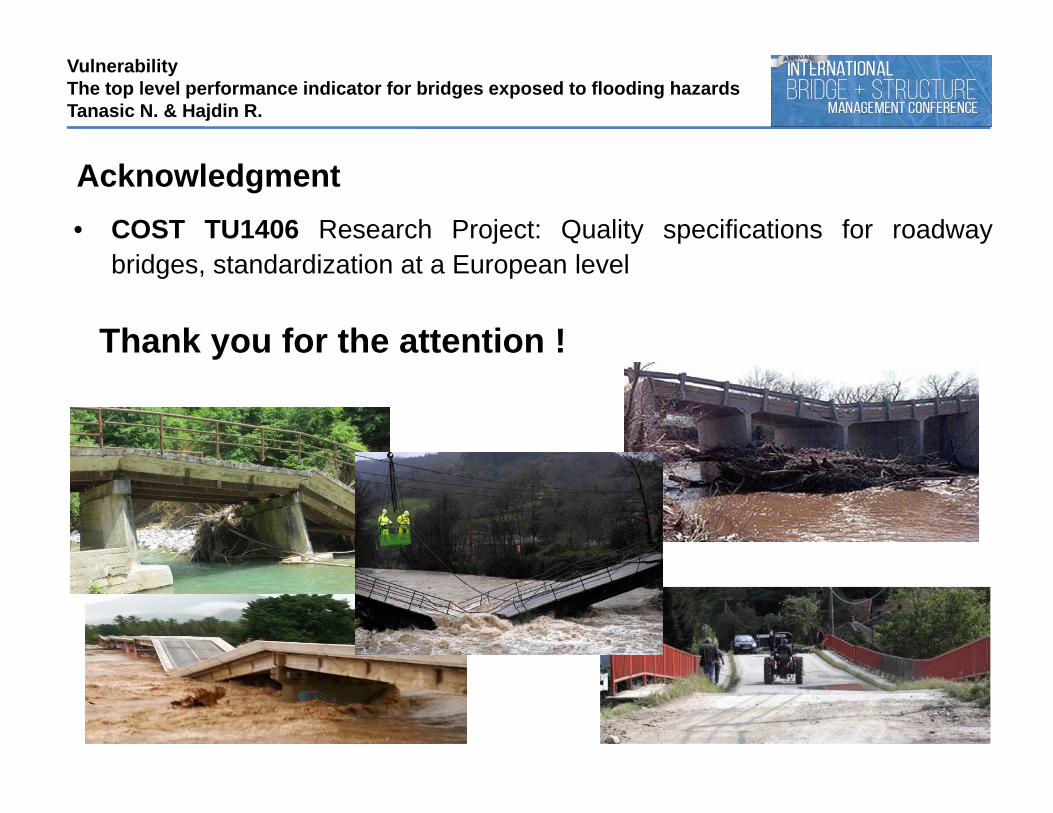
• COST TU1406 Research Project: Quality specifications for roadwaybridges, standardization at a European level
Thank you for the attention !
Acknowledgment
Vulnerability The top level performance indicator for bridges exposed to flooding hazards Tanasic N. & Hajdin R.