vulpes vulpes) and feral cats (felis...
TRANSCRIPT
i
Gastro-intestinal parasites of red foxes
(Vulpes vulpes) and feral cats (Felis catus)
in southwest Western Australia
This thesis is presented for the Honours degree in Biomedical Science at
Murdoch University
Narelle Dybing
2010
BSc Biomedical Science
BSc Conservation Biology

ii
Declaration
I declare that this thesis is my own account of my research and contains at its
main content, work which has not been previously submitted for a degree at
any tertiary educational institution.
Narelle Dybing

iii
Acknowledgements
After such a long and gruelling year, it is finally time to thank all the people
that have pulled me through.
First of all, I would like to thank my supervisors, Dr Peter Adams and Dr Trish
Fleming. I’m sorry if I nagged and asked too many questions. You have been
so helpful throughout this year in so many ways. Thank you for all your
suggestions, comments and encouragement. Thank you Trish for all your
formatting and statistical skills, I wouldn’t have done nearly as much without
your help. Thank you Peter for being as excited as I was when I found a new
parasite and for constantly making yourself available when I had questions
(which was often).
I would also like to thank Aileen Elliot and Russ Hobbs for their endless hours
helping me with identify my parasites and for answering any questions I had.
To Heather Crawford and Jesse Forbes-Harper. Thank you so much for all
your help this year and for making the long hours with this project even more
enjoyable.
To the people of the dungeon and bat cave. Thank you for keeping me sane,
for all your help and great conversations we’ve had. And thanks for letting me
vent, sorry for the tears at times. You guys are awesome.
John McCooke, you are a legend and i have told this over and over. Thank
you so much for helping me with my PCR stuff, I would not have gotten my
head around it myself. I’m sorry I took up most of your time

iv
To Katherine Edwards, Cielito Marbus and Erica MacIntyre for the beer and
nacho sessions which I desperately needed at the end of the week. Kat,
thanks for letting me use your office as sprawl space during my writing period
and getting me dinner when I didn’t have time, you rock.
I’d also like to thank my family for being so understanding during the year. I
couldn’t have done it without your support and for your belief in me.
There are so many more people to thank but I have limited space but you all
know who you are. Thank you all. I would also like to thank the numerous
volunteers that have come out with us for collecting samples and to the Red
Card for the Red Fox volunteers. Without you this project would not have
been possible
Last but not least, I would like to thank ‘V’ and Redbull. Without you I would
not have made it through the days.
v
Abstract
Red foxes (Vulpes vulpes) and feral cats (Felis catus) are present throughout
a wide range of habitats and landscapes across much of Australia. In addition
to the competition and predatory impacts of these two pest species, red foxes
and feral cats harbour a wide range of parasites, many of which may have
important conservation, agricultural and zoonotic repercussions. This project
investigated the occurrence of helminth parasites from the intestines of 147
red foxes and 47 feral cats collected from 14 and 11 locations respectively,
throughout southwest Western Australia.
Helminth parasites were detected in 58% of foxes and 81% of cats. Helminth
species identified from red foxes were: Dipylidium caninum (27.7% of
individual foxes examined), Uncinaria stenocephala (18.2%), Toxocara canis
(14.9%), Spirometra erinaceieuropaei (5.4%), Toxascaris leonina (4.7%),
Taenia spp. (4.1%), Taenia serialis (1.4%), Taenia hydatigena (0.7%),
Brachylaima cribbi (0.7%), Plagiorchis maculosus (0.7%) and an
Acanthocephalan identified to family Centrorhynchidae (2.1%). Helminth
species identified from feral cats were: Taenia taeniaeformis (39.1% of
individual cats examined), Toxocara cati (34.8%), Spirometra
erinaceieuropaei (19.6%), Oncicola pomatostomi (15.2%), Toxascaris leonina
(6.5%), Dipylidium caninum (6.5%), Ancylostoma spp (2.2%) and the
Acanthocephalan Centrorhynchidae (2.2%).
Infracommunity richness varied from 1-3 and 1-4 species per host in red foxes
and feral cats respectively. Average parasite burdens varied from 1-39 worms
vi
across all helminth species. Several environmental factors were significantly
related to the presence of some parasites in red foxes. For red foxes, the
percentage remnant vegetation cover at each sampling location was
significantly positively correlated with the presence of T. canis and
U. stenocephala (p<0.001). Average relative humidity was significantly
positively correlated with the presence of S. erinaceieuropaei (p<0.001), T.
leonina (p<0.01) and U. stenocephala (p<0.01). Five year average minimum
temperature had an effect on S. erinaceieuropaei and U. stenocephala
(p<0.001). For feral cats, a significant positive correlation was detected
between the presence of T. cati and five year annual rainfall (p<0.001) as well
as individual head/body length and T. taeniaeformis (p<0.001).
Helminth species associations were detected between U. stenocephala and
D. caninum, S. erinaceieuropaei, T. canis and T. leonina in red foxes. A
significant association was also detected between S. erinaceieuropaei and
T. leonina in red foxes. In feral cats helminth species associations were
detected between T. taeniaeformis and O. pomatostomi as well as between
T. taeniaeformis and T. cati. The only parasite that was positively correlated
with body condition (assessed by body mass) was S. erinaceieuropaei in
foxes. The species richness within a host was not observed to affect body
condition in either foxes or cats.
In conclusion, red foxes and feral cats in southwest Western Australia harbour
a wide range of helminth parasites, which are of veterinary significance for
wildlife and livestock. Control of red foxes and feral cats in this region may

vii
therefore provide an important mechanism of control of these parasites.
Importantly, Echinococcus granulosus, a parasite of major zoonotic concern,
was not recorded in this study.
.
viii
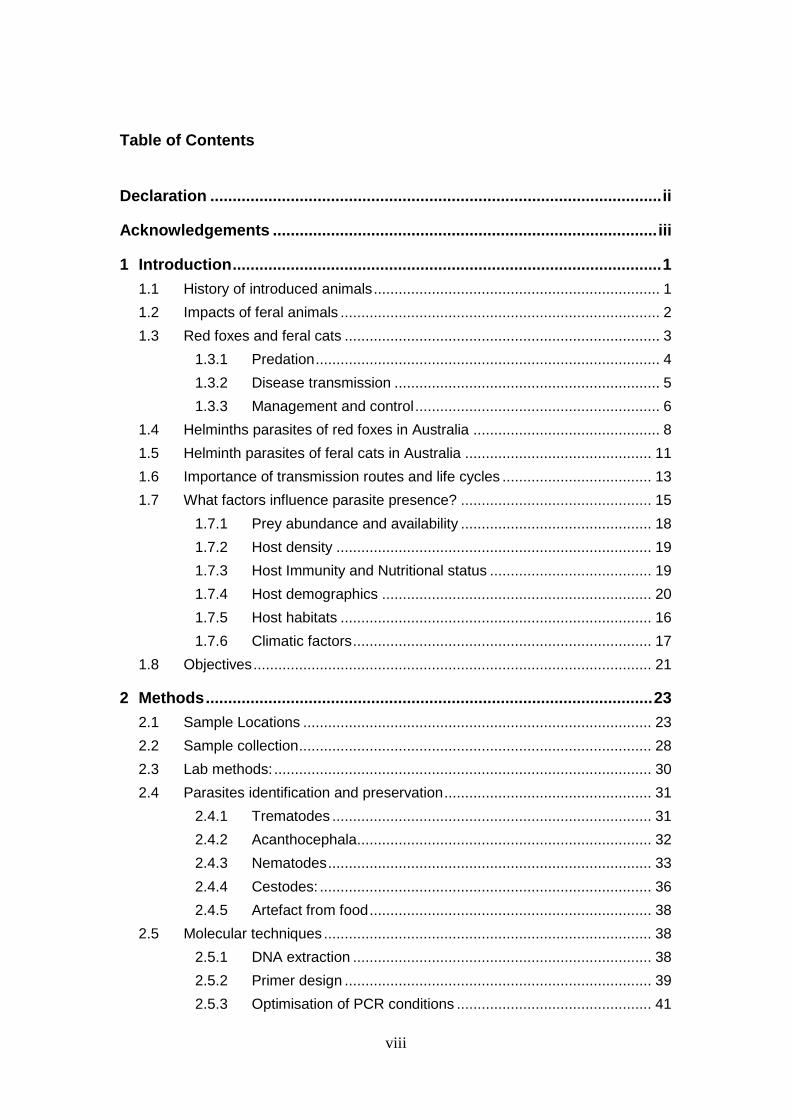
Table of Contents
Declaration ..................................................................................................... ii
Acknowledgements ...................................................................................... iii
1 Introduction ................................................................................................ 1
1.1 History of introduced animals ..................................................................... 1
1.2 Impacts of feral animals ............................................................................. 2
1.3 Red foxes and feral cats ............................................................................ 3
1.3.1 Predation ................................................................................... 4
1.3.2 Disease transmission ................................................................ 5
1.3.3 Management and control ........................................................... 6
1.4 Helminths parasites of red foxes in Australia ............................................. 8
1.5 Helminth parasites of feral cats in Australia ............................................. 11
1.6 Importance of transmission routes and life cycles .................................... 13
1.7 What factors influence parasite presence? .............................................. 15
1.7.1 Prey abundance and availability .............................................. 18
1.7.2 Host density ............................................................................ 19
1.7.3 Host Immunity and Nutritional status ....................................... 19
1.7.4 Host demographics ................................................................. 20
1.7.5 Host habitats ........................................................................... 16
1.7.6 Climatic factors ........................................................................ 17
1.8 Objectives ................................................................................................ 21
2 Methods .................................................................................................... 23
2.1 Sample Locations .................................................................................... 23
2.2 Sample collection ..................................................................................... 28
2.3 Lab methods: ........................................................................................... 30
2.4 Parasites identification and preservation .................................................. 31
2.4.1 Trematodes ............................................................................. 31
2.4.2 Acanthocephala ....................................................................... 32
2.4.3 Nematodes .............................................................................. 33
2.4.4 Cestodes: ................................................................................ 36
2.4.5 Artefact from food .................................................................... 38
2.5 Molecular techniques ............................................................................... 38
2.5.1 DNA extraction ........................................................................ 38
2.5.2 Primer design .......................................................................... 39
2.5.3 Optimisation of PCR conditions ............................................... 41
ix
2.5.4 Agarose gel electrophoresis .................................................... 42
2.6 Statistical analyses .................................................................................. 42
3 Results ...................................................................................................... 45
3.1 Red fox .................................................................................................... 45
3.1.1 Location parasite presence and prevalence ............................ 45
3.1.2 Regression analysis with presence/absence of parasites ........ 49
3.1.3 Parasite associations ............................................................... 54
3.1.4 Worm burden of helminths recovered from 147 red foxes ....... 54
3.1.5 Factors affecting body condition .............................................. 55
3.2 Feral cats ................................................................................................. 58
3.2.1 Location parasite presence and prevalence. ........................... 58
3.2.2 Regression analysis with presence/absence of parasites ........ 62
3.2.3 Parasite associations ............................................................... 64
3.2.4 Worm burden of helminths recovered from 47 feral cats .......... 65
3.2.5 Factors affecting body condition .............................................. 65
3.3 Optimisation of PCR Taenia identification ................................................ 66
4 Discussion ............................................................................................... 69
4.1 Sampling locations, parasite presence and prevalence ............................ 69
4.1.1 Red foxes ................................................................................ 70
4.1.2 Feral cats ................................................................................ 71
4.2 Regression analysis with presence/absence of parasites ........................ 72
4.2.1 Red foxes ................................................................................ 73
4.2.2 Feral cats ................................................................................ 76
4.3 Parasite associations ............................................................................... 77
4.3.1 Red foxes ................................................................................ 77
4.3.2 Feral cats ................................................................................ 79
4.4 Worm burdens for red foxes and feral cats .............................................. 80
4.5 Does parasite presence or load affect host body condition? .................... 82
4.5.1 Red foxes ................................................................................ 82
4.5.2 Feral cats ................................................................................ 83
4.6 Significance of results .............................................................................. 83
5 References ............................................................................................... 85
x
Table of Figures Figure 1-1. Distribution of (a) red foxes and (b) feral cats in Australia (sourced
from West, 2008). .................................................................................. 4
Figure 1-2. Red fox with native mammal prey (West, 2008). ...................................... 5
Figure 1-3. Diagrammatic representation of the links between food availability leading to disease vulnerability, adapted from Chandra, 1981. ............ 19
Figure 2-1. IBRA bioregions for the sampling location within the south west Western Australia (sourced from Environment Australia, 2000). .......... 24
Figure 2-2. Remnant vegetation within the southwest Western Australia. Figure indicates position of sample locations (Department of Agriculture, 2002) ................................................................................................... 25
Figure 2-3. Pictorial example of tied off sections of the samples (Marieb, 2009). ..... 28
Figure 2-4. a) Intestine stretched out on tray to be cut longitudinally b) Sections of intestine on a crystallising dish ready for microscope search. .......... 30
Figure 2-5. Brachylaima cribbi with HH1 stain from a red fox. .................................. 31
Figure 2-6. Plagiorchis maculosus from a red fox. ................................................... 32
Figure 2-7. Oncicola pomatostomi longitudinal rows of hooks with characteristic barbs (indicated by arrow) (sourced from Schmidt, 1983). ................... 33
Figure 2-8. Demonstrates different teeth structures of hookworms. Arrows show position of teeth or cutting plates A) Ancylostoma caninum with 3 pairs of teeth B) Uncinaria stenocephala with cutting plates (images sourced from Murdoch University Parasitology website, 2007). .................................................................................................. 34
Figure 2-9. Distinguishing features of Toxocara spp. A) Toxocara canis note 3 distinctive lips and narrow cervical alae compared to B) Toxocara cati arrow shaped, broad cervical alae. ................................................ 34
Figure 2-10. A) Toxocara canis egg with pitted shell. B) Toxascaris leonina egg with a smooth shell (images sourced from Murdoch University). .......... 35
Figure 2-11. Tails of male Toxocara canis and Toxascaris leonina A) The arrow depicts the finger-like projection that a male Toxocara canis has and B) shows the gradual tapering of the Toxascaris leonina tail. ........ 35
Figure 2-12. Spirometra erinaceieuropei is characterised by a single central genital pore per segment. .................................................................... 36
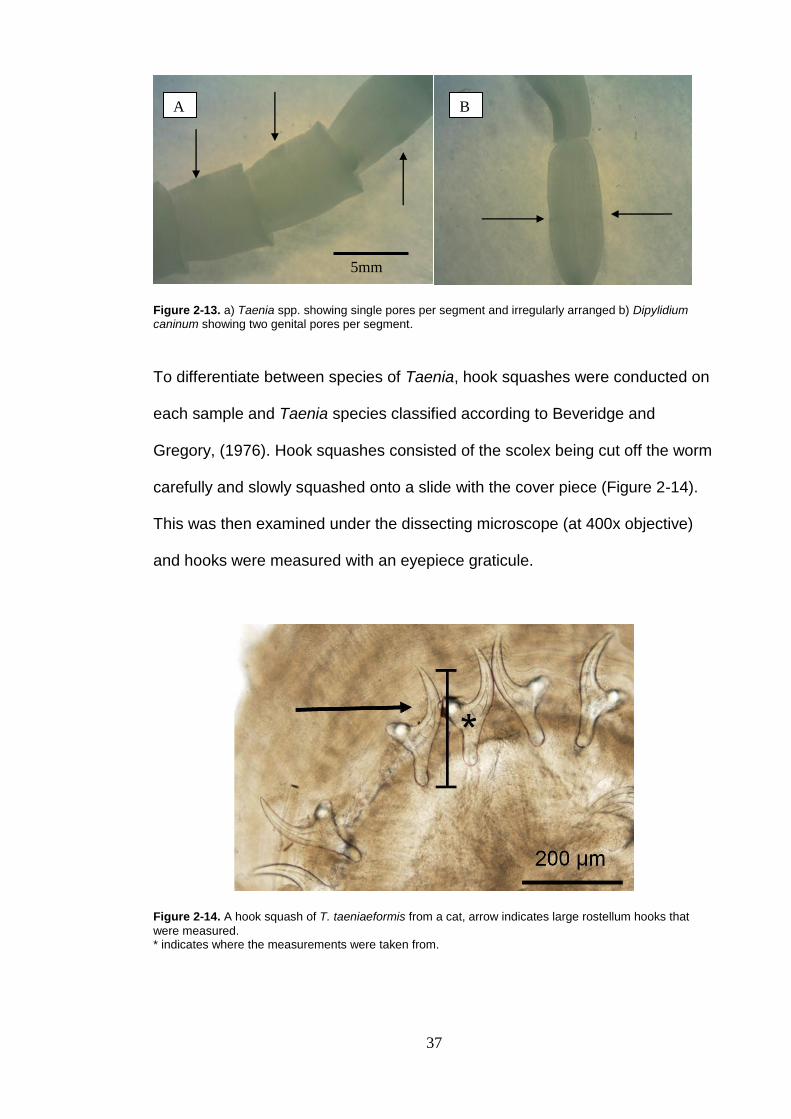
Figure 2-13. a) Taenia spp. showing single pores per segment and irregularly arranged b) Dipylidium caninum showing two genital pores per segment. .............................................................................................. 37
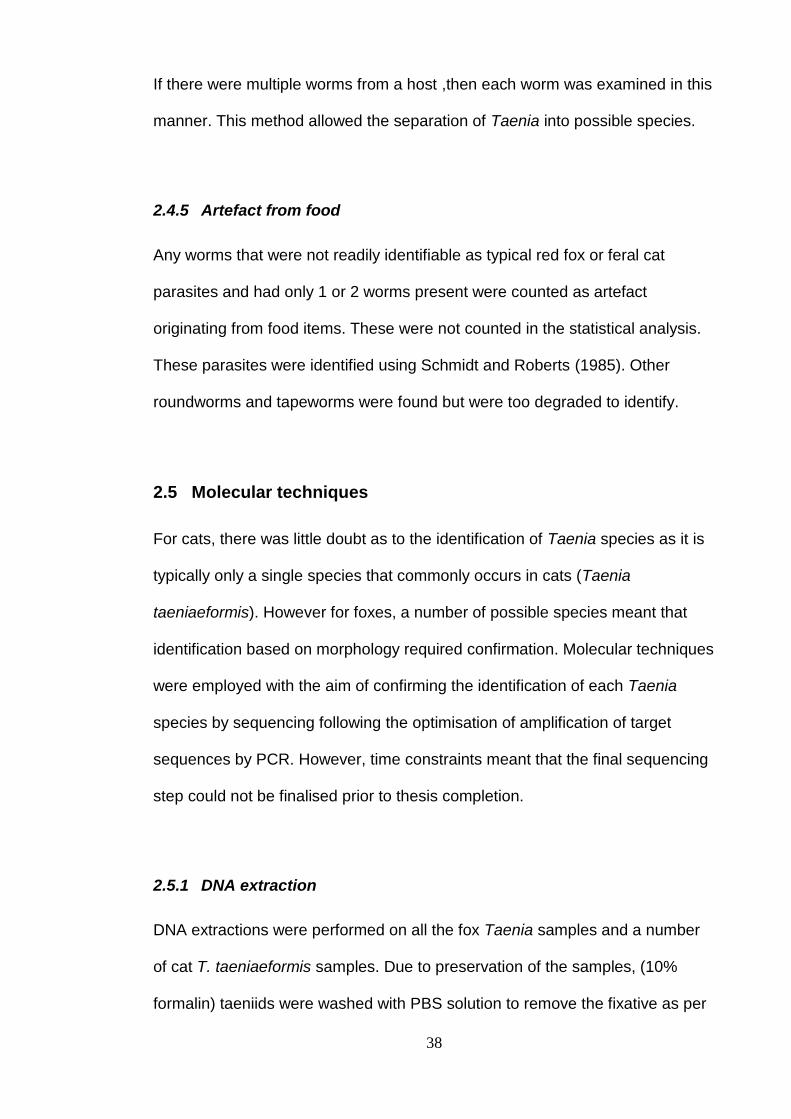
Figure 2-14. A hook squash of T. taeniaeformis from a cat, arrow indicates large rostellum hooks that were measured. .......................................... 37
Figure 3-1. Presence/absence of helminth in foxes from each sampling location. ............................................................................................... 45
Figure 3-2. Species accumulation curves for red foxes from all sampling locations with ≥5 individuals. ................................................................ 46
Figure 3-3. Parasite images from red foxes. A) Uncinaria stenocephala anterior end showing cutting plates, B) Taenia serialis head segment C)
xi
Taenia species proglottids, D) Toxocara canis anterior end, E) Toxocara canis showing distinct three lips F) Finger like projection from a male T. canis G) Bothrium of Spirometra erinaceieuropaei. H) Length of one S. erinaceieuropaei worm. I) Acanthocephalan Centrorhynchidae family proboscis of hooks, J) Dipylidium caninum egg sack K) Plagiorchis maculosus trematode L) Brachylaima cribbi trematode ............................................................... 48
Figure 3-4. Frequency distribution of infracommunity richness of helminths found within red foxes. ......................................................................... 49
Figure 3-5. Percentage occurrence of Toxascaris leonina vs. average relative humidity for previous six months. ......................................................... 51
Figure 3-6. Percentage occurrence of Spirometra erinaceieuropaei compared with A) average humidity for previous six months and B) average minimum temp for previous five years. ................................................. 52
Figure 3-7. Percentage occurrence of Uncinaria stenocephala compared with A) average relative humidity for previous 6 months B) % year average minimum temperature and C) % remnant vegetation cover. ................................................................................................... 53
Figure 3-8. Percentage occurrence of Toxocara canis compared with % remnant vegetation cover. ................................................................... 53
Figure 3-9. Scatterplot of fox body measurement residuals to determine body condition that were calculated using individual measures (i.e. head length, head/body length and pes length). ........................................... 56
Figure 3-10. Number of cats that had parasite presence/absence at each sampling location. ................................................................................ 58
Figure 3-11. Species accumulation curves for feral cats as location that had ≥5 individuals examined............................................................................ 59
Figure 3-12. Parasites found in feral cats in this study. A) Taenia taeniaeformis mature proglottids, B) Ancylostoma spp demonstrating 3 pairs of teeth, C) Copulatory bursa of Ancylostoma spp, D) Numerous Toxocara cati in the stomach of a cat, E) Toxocara cati specimens in cat stomach in situ, F) Taenia taeniaeformis showing suckers and rostellum hooks from scolex, G) Oncicola pomatostomi in situ, H) Trichostrongylus spp put down to artefact in food............................ 61
Figure 3-13. Infracommunity richness in feral cats from all sampling locations. ....... 62
Figure 3-14. Percentage occurrence of Toxocara cati vs. annual rainfall for the previous 5 years. ................................................................................. 63
Figure 3-15. Significant relationship between average ( 1SD) head body length and presence/absence of Taenia taeniaeformis revealed by backward stepwise multiple regression analysis. ................................. 64
Figure 3-16. Optimisation test 1 reaction with temperature range 56˚C-58˚C with forward primer T60f ...................................................................... 67
Figure 3-17. Designed primers A) Forward and reverse primer 1, B) Forward and reverse primer 2, C) forward and reverse primer 3, D) forward and reverse primer 4, E) forward and reverse primer 5, F) forward and reverse primer 6, G) forward and reverse primer 7, H) forward and reverse primer 8 (sequences in Table 2-5. .................................... 68
xii
Figure 4-1. Map showing presence of Uncinaria stenocephala and Dipylidium caninum in locational groupings. .......................................................... 78
xiii
List of Tables Table 1-1. Findings of past research of red fox helminth parasite surveys
conducted in Australia. ........................................................................... 9
Table 1-2. Previous studies recording helminth parasites of feral and domestic cats in Australia. .................................................................................. 12
Table 2-1. Environmental and climatic measures from each sampling location. ....... 27
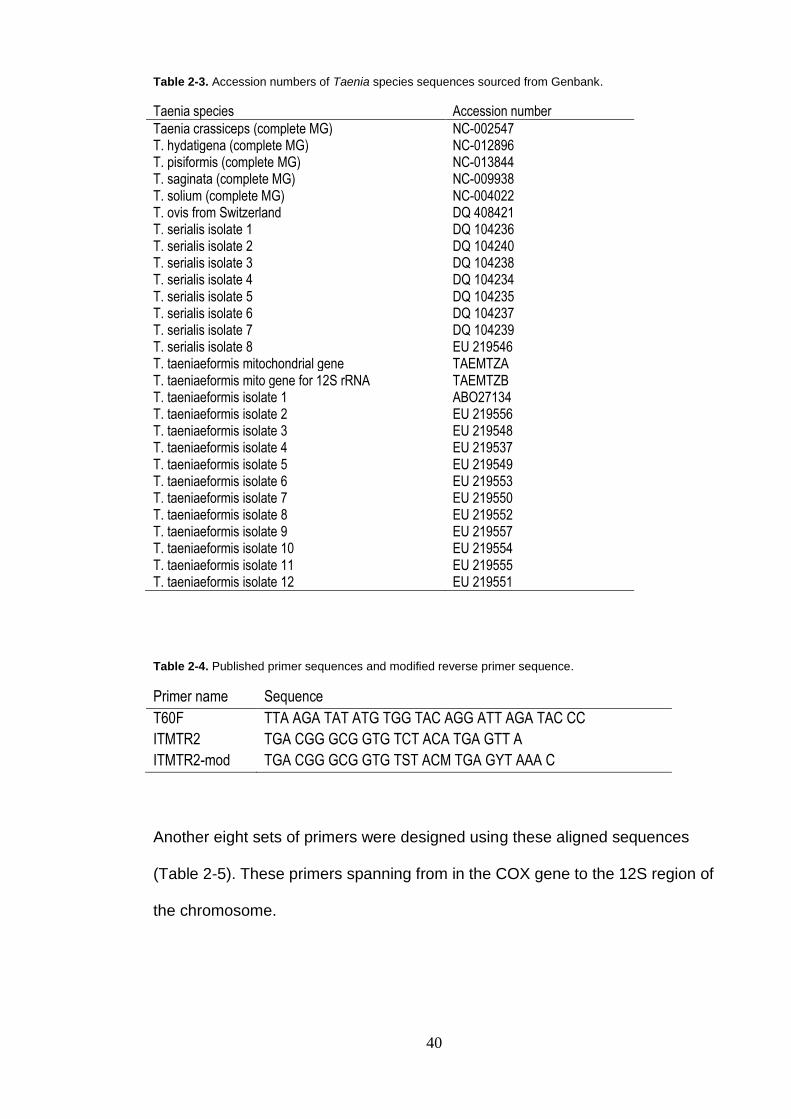
Table 2-3. Accession numbers of Taenia species sequences sourced from Genbank. ............................................................................................. 40
Table 2-4. Published primer sequences and modified reverse primer sequence. ..... 40
Table 2-5. Primers designed in Geneious 5.0 by aligning known Taenia species sequences spanning the COX gene to the 12S gene in the mitochondrial genome. ......................................................................... 41
Table 3-1. Prevalence (%) of the ten parasite species found in red foxes. ............... 47
Table 3-3. Correlation matrix between parasites in red foxes. .................................. 54
Table 3-4. Total parasite load data for 147 red foxes from all sampling locations. ............................................................................................. 55
Table 3-6. Multiple regression factors with body mass as the dependent variable testing the effect of infracommunity richness on body mass. ................................................................................................... 57
Table 3-7. Prevalence (%) from the 47 individual feral cats. Photos of parasites in Figure 3-12 ...................................................................................... 59
Table 3-8. Summary of results from backwards stepwise multiple regression analyses carried out to determine factors that were correlated with the presence/absence of the most prevalent parasite species. ............ 63
Table 3-9. Correlation matrix between parasites found in feral cats. ........................ 64
Table 3-10. Worm burden statistics for feral cat parasites. ....................................... 65
Table 3-11. Summary of multiple regression factors to determine which factors may be associated with body mass of the feral cat (dependent variable). .............................................................................................. 65
Table 4-1. Parasite prevalence in red foxes in Australia from published studies in comparison to this study................................................................... 71
Table 4-2. Parasite prevalence in feral cats in Australia from published studies in comparison to this study................................................................... 72
1
1 Introduction
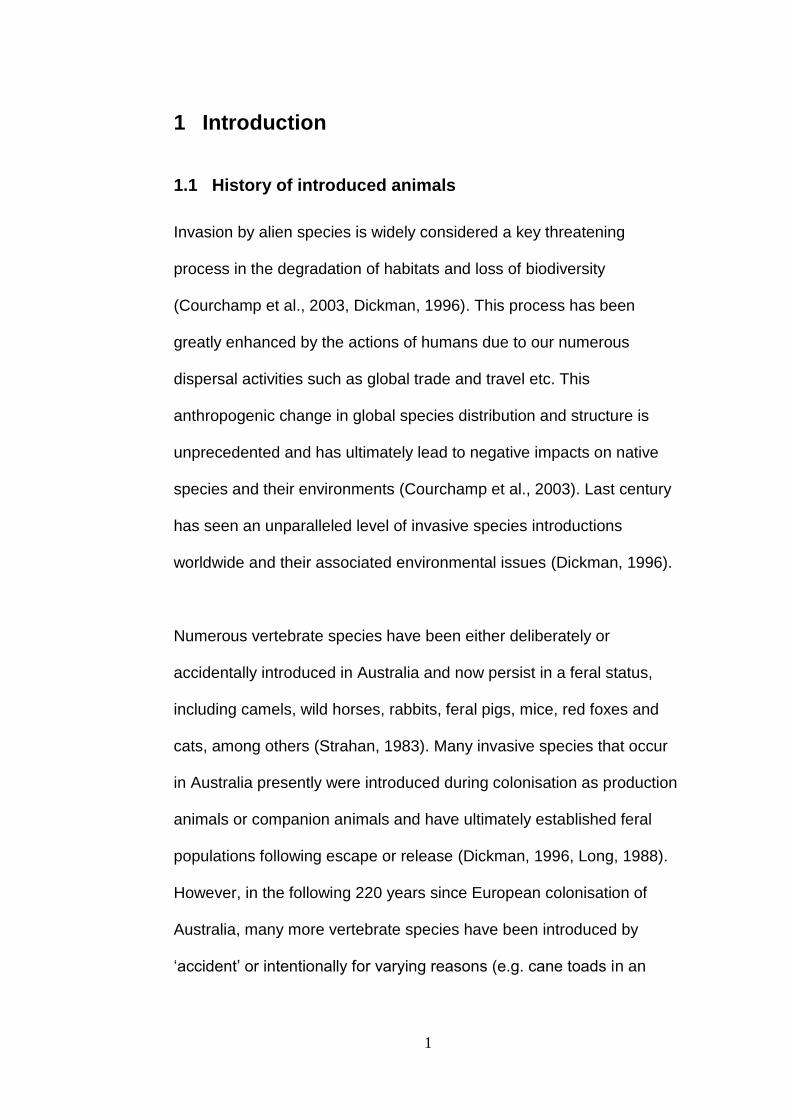
1.1 History of introduced animals
Invasion by alien species is widely considered a key threatening
process in the degradation of habitats and loss of biodiversity
(Courchamp et al., 2003, Dickman, 1996). This process has been
greatly enhanced by the actions of humans due to our numerous
dispersal activities such as global trade and travel etc. This
anthropogenic change in global species distribution and structure is
unprecedented and has ultimately lead to negative impacts on native
species and their environments (Courchamp et al., 2003). Last century
has seen an unparalleled level of invasive species introductions
worldwide and their associated environmental issues (Dickman, 1996).
Numerous vertebrate species have been either deliberately or
accidentally introduced in Australia and now persist in a feral status,
including camels, wild horses, rabbits, feral pigs, mice, red foxes and
cats, among others (Strahan, 1983). Many invasive species that occur
in Australia presently were introduced during colonisation as production
animals or companion animals and have ultimately established feral
populations following escape or release (Dickman, 1996, Long, 1988).
However, in the following 220 years since European colonisation of
Australia, many more vertebrate species have been introduced by
‘accident’ or intentionally for varying reasons (e.g. cane toads in an
2
attempt to control cane beetles) (Long, 1988, McLeod, 2004, Rolls,
1969).
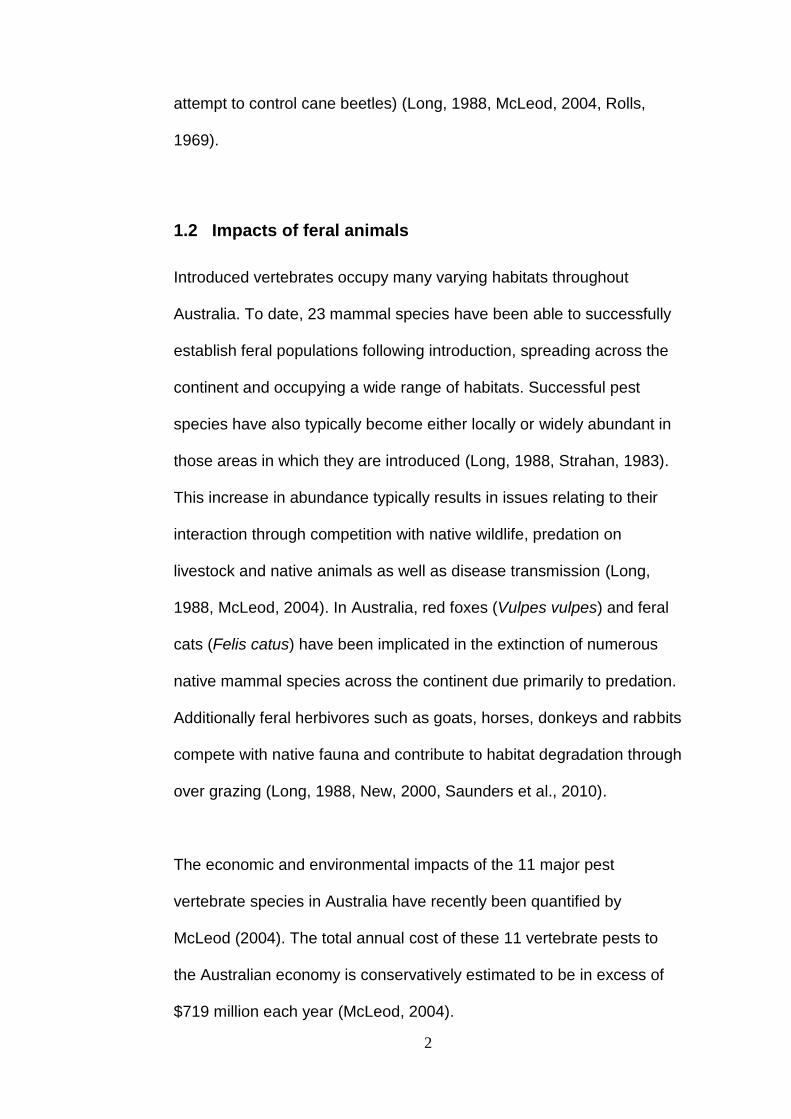
1.2 Impacts of feral animals
Introduced vertebrates occupy many varying habitats throughout
Australia. To date, 23 mammal species have been able to successfully
establish feral populations following introduction, spreading across the
continent and occupying a wide range of habitats. Successful pest
species have also typically become either locally or widely abundant in
those areas in which they are introduced (Long, 1988, Strahan, 1983).
This increase in abundance typically results in issues relating to their
interaction through competition with native wildlife, predation on
livestock and native animals as well as disease transmission (Long,
1988, McLeod, 2004). In Australia, red foxes (Vulpes vulpes) and feral
cats (Felis catus) have been implicated in the extinction of numerous
native mammal species across the continent due primarily to predation.
Additionally feral herbivores such as goats, horses, donkeys and rabbits
compete with native fauna and contribute to habitat degradation through
over grazing (Long, 1988, New, 2000, Saunders et al., 2010).
The economic and environmental impacts of the 11 major pest
vertebrate species in Australia have recently been quantified by
McLeod (2004). The total annual cost of these 11 vertebrate pests to
the Australian economy is conservatively estimated to be in excess of
$719 million each year (McLeod, 2004).
3
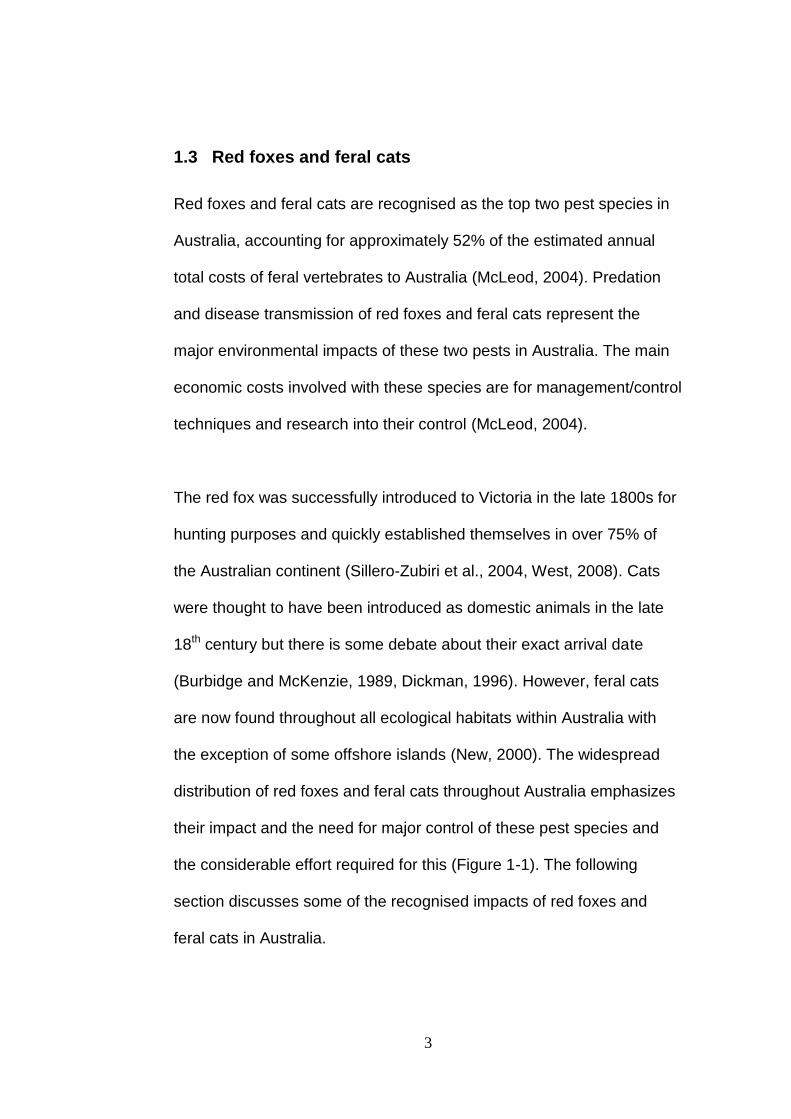
1.3 Red foxes and feral cats
Red foxes and feral cats are recognised as the top two pest species in
Australia, accounting for approximately 52% of the estimated annual
total costs of feral vertebrates to Australia (McLeod, 2004). Predation
and disease transmission of red foxes and feral cats represent the
major environmental impacts of these two pests in Australia. The main
economic costs involved with these species are for management/control
techniques and research into their control (McLeod, 2004).
The red fox was successfully introduced to Victoria in the late 1800s for
hunting purposes and quickly established themselves in over 75% of
the Australian continent (Sillero-Zubiri et al., 2004, West, 2008). Cats
were thought to have been introduced as domestic animals in the late
18th century but there is some debate about their exact arrival date
(Burbidge and McKenzie, 1989, Dickman, 1996). However, feral cats
are now found throughout all ecological habitats within Australia with
the exception of some offshore islands (New, 2000). The widespread
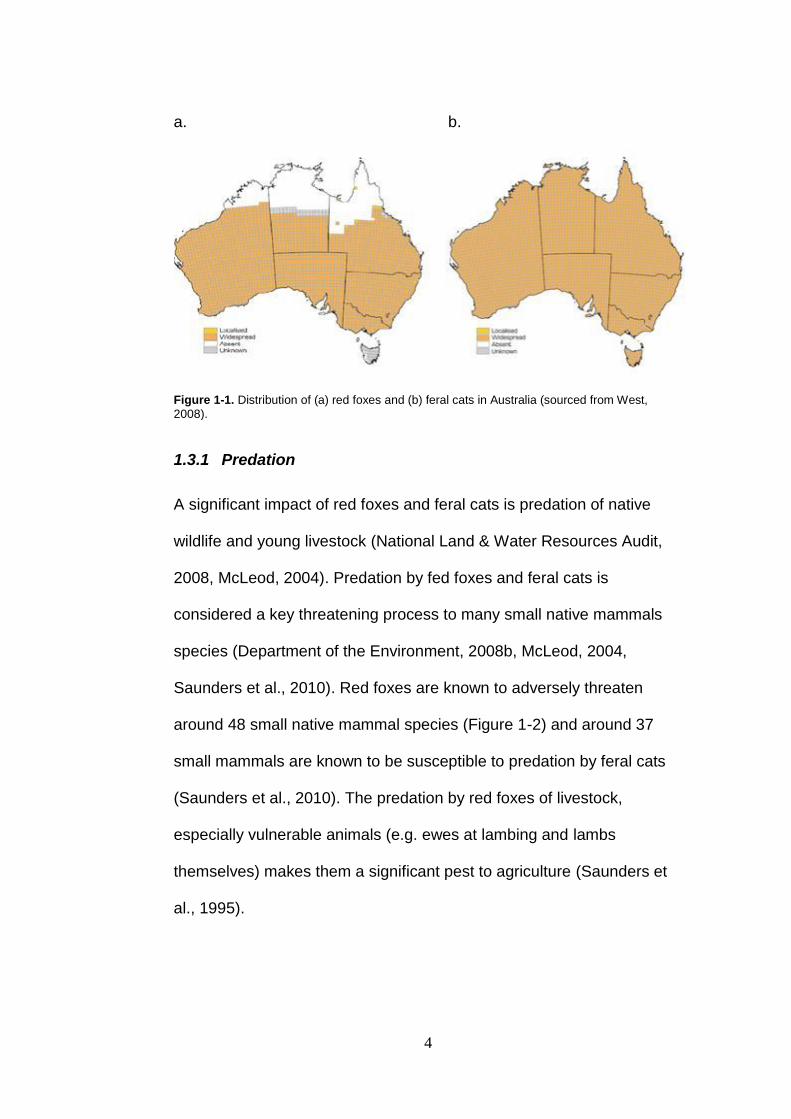
distribution of red foxes and feral cats throughout Australia emphasizes
their impact and the need for major control of these pest species and
the considerable effort required for this (Figure 1-1). The following
section discusses some of the recognised impacts of red foxes and
feral cats in Australia.
4
a. b.
Figure 1-1. Distribution of (a) red foxes and (b) feral cats in Australia (sourced from West,
2008).
1.3.1 Predation
A significant impact of red foxes and feral cats is predation of native
wildlife and young livestock (National Land & Water Resources Audit,
2008, McLeod, 2004). Predation by fed foxes and feral cats is
considered a key threatening process to many small native mammals
species (Department of the Environment, 2008b, McLeod, 2004,
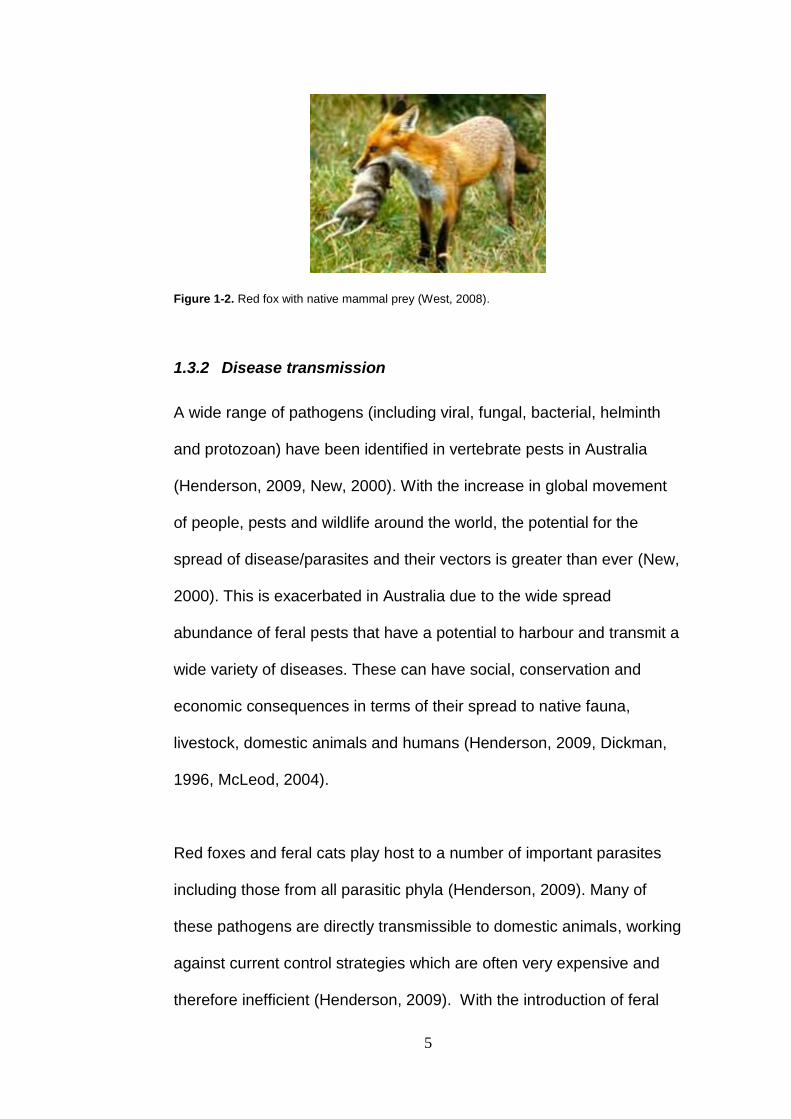
Saunders et al., 2010). Red foxes are known to adversely threaten
around 48 small native mammal species (Figure 1-2) and around 37
small mammals are known to be susceptible to predation by feral cats
(Saunders et al., 2010). The predation by red foxes of livestock,
especially vulnerable animals (e.g. ewes at lambing and lambs
themselves) makes them a significant pest to agriculture (Saunders et
al., 1995).
5
Figure 1-2. Red fox with native mammal prey (West, 2008).
1.3.2 Disease transmission
A wide range of pathogens (including viral, fungal, bacterial, helminth
and protozoan) have been identified in vertebrate pests in Australia
(Henderson, 2009, New, 2000). With the increase in global movement
of people, pests and wildlife around the world, the potential for the
spread of disease/parasites and their vectors is greater than ever (New,
2000). This is exacerbated in Australia due to the wide spread
abundance of feral pests that have a potential to harbour and transmit a
wide variety of diseases. These can have social, conservation and
economic consequences in terms of their spread to native fauna,
livestock, domestic animals and humans (Henderson, 2009, Dickman,
1996, McLeod, 2004).
Red foxes and feral cats play host to a number of important parasites
including those from all parasitic phyla (Henderson, 2009). Many of
these pathogens are directly transmissible to domestic animals, working
against current control strategies which are often very expensive and
therefore inefficient (Henderson, 2009). With the introduction of feral
6
animals comes the potential for disease introduction as well and the
associated impacts of diseases on naive populations of fauna (e.g. red
foxes and dingoes are responsible for the spread of Echinococcus
granulosus into native wildlife and across much of Australia) (Alderton,
1998). Humans and a wide range of animals are susceptible to E.
granulosus infection. In some cases this parasite can be fatal and
infection by E. granulosus is considered a threat to the survival of small
native animals (Thompson et al., 2009).
1.3.3 Management and control
Controlling invasive predators such as red foxes and feral cats on a
national level is largely unattainable with current techniques, therefore
most management strategies are primarily targeted at achieving control
on a local scale (McLeod, 2004, Bomford and Hart, 2002). Management
strategies for introduced species are highly dependant upon the type of
impact each particular animal has on the environment. The control and
management strategies of red foxes for example, are targeted at their
predatory impacts of native animals and livestock.
Environmental impact costs of red foxes and feral cats is estimated at
$190 million for red foxes and $144 million for feral cats (McLeod,
2004). A large proportion of these costs are attributed to control
programmes and research into the management of pest species in
hopes of minimising their impacts (McLeod, 2004).
7
Management of foxes is widely reliant on 1080-poisoned baiting in
nature reserves and national parks due to its cost effectiveness
compared to other strategies (Saunders et al., 2010, Fleming et al.,
2006). In Western Australia, a state-wide initiative called Western
Shield coordinates broad scale feral predator baiting of most major
nature reserves and national parks (Armstrong, 1998). Western Shield
utilises meat baits and present them either by ground based or by aerial
distribution (Saunders et al., 2010). The effectiveness of baiting is
highly variable depending on the fox density, diet availability and
general greediness of individual foxes, with some individuals tending to
pick up multiple baits (Saunders et al., 2010). Trapping, culling
programs, exclusion fencing and livestock guarding animals are also
used as means of red fox control (Fleming et al., 2006).
Feral cat control techniques are usually labour intensive as feral cats
are trap shy, avoid human contact and do not readily take baits
(McLeod, 2004). The most effective control technique is barrier fencing
which is very expensive, thus precluding its use for the protection of
large reserves or parks (Bomford and Hart, 2002, McLeod, 2004). This
leaves recreational hunters, in the form of farmers and registered
programs, as the main control option (McLeod, 2004, Department of the
Environment, 2008a, Coman, 1991).
In addition to red foxes and feral cats, culling is used extensively for
control of a number of other feral species across Australia. The problem
8
with culling as a form of control is the difficulty in effective coordination
of culls and intensive labour requirements, especially as feral animal
density is reduced and the catch per unit effort greatly decreases
(Saunders et al., 2010). However, culling can be a satisfactory short
term solution to control of feral animals, especially in difficult to manage
areas such as farmland, where the application of poison baits threatens
livestock and domestic species.
1.4 Helminths parasites of red foxes in Australia
Across the world, it has been recognised that red foxes have the
potential to carry and transmit parasites of not only economic
importance but of conservation importance and zoonotic potential as
well (Wolfe et al., 2001, Henderson, 2009). It is therefore important to
understand parasite infection of red foxes, not only to further
understand these parasites but also because of their importance in our
environment.
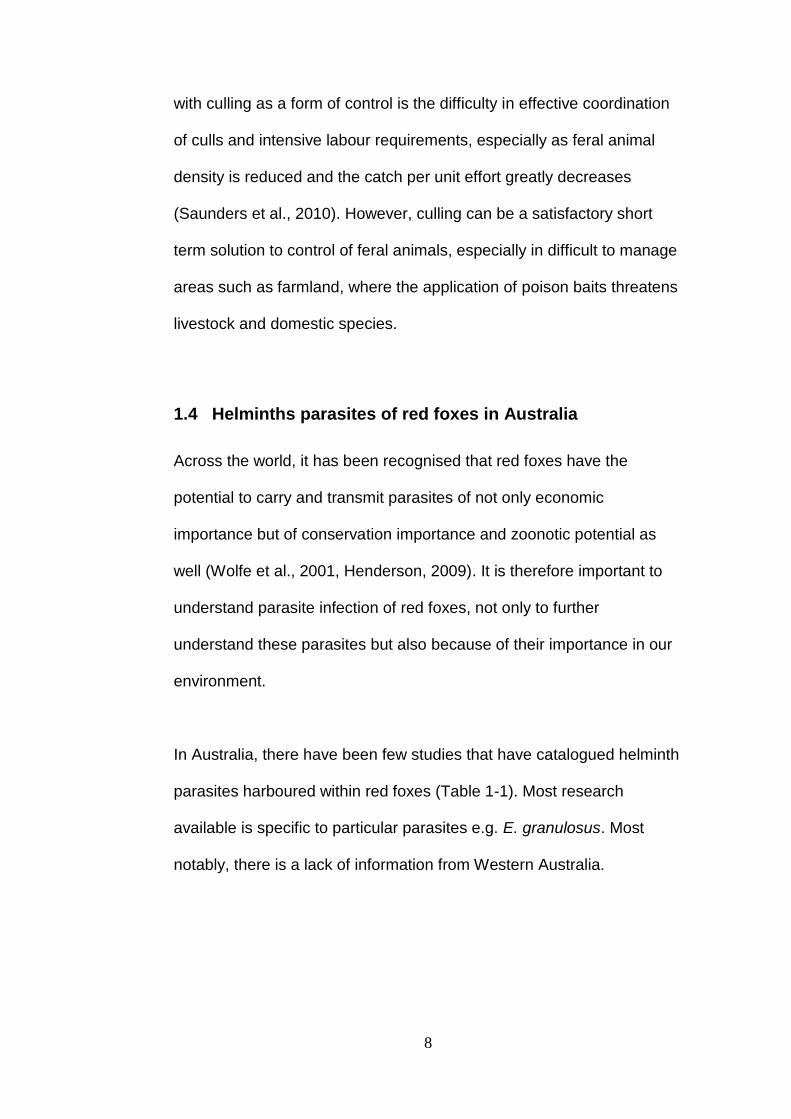
In Australia, there have been few studies that have catalogued helminth
parasites harboured within red foxes (Table 1-1). Most research
available is specific to particular parasites e.g. E. granulosus. Most
notably, there is a lack of information from Western Australia.
9
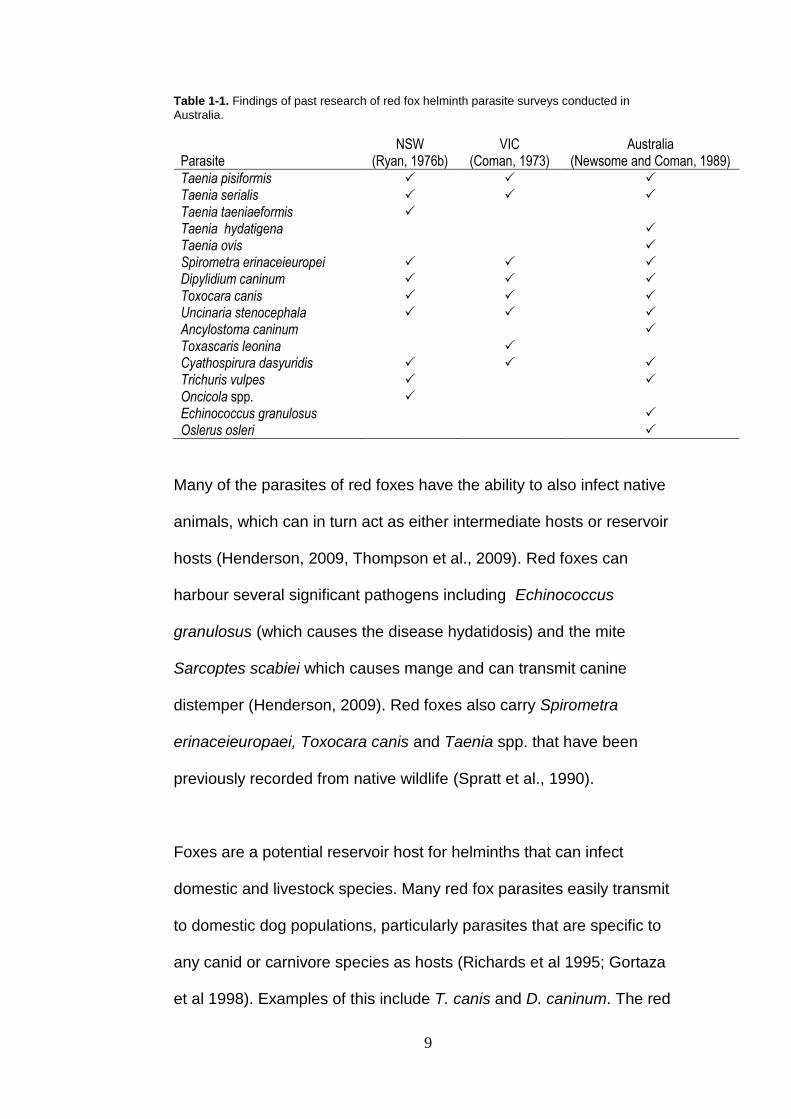
Table 1-1. Findings of past research of red fox helminth parasite surveys conducted in
Australia.
NSW VIC Australia Parasite (Ryan, 1976b) (Coman, 1973) (Newsome and Coman, 1989)
Taenia pisiformis
Taenia serialis
Taenia taeniaeformis
Taenia hydatigena
Taenia ovis
Spirometra erinaceieuropei
Dipylidium caninum
Toxocara canis
Uncinaria stenocephala
Ancylostoma caninum
Toxascaris leonina Cyathospirura dasyuridis
Trichuris vulpes
Oncicola spp. Echinococcus granulosus
Oslerus osleri
Many of the parasites of red foxes have the ability to also infect native
animals, which can in turn act as either intermediate hosts or reservoir
hosts (Henderson, 2009, Thompson et al., 2009). Red foxes can
harbour several significant pathogens including Echinococcus
granulosus (which causes the disease hydatidosis) and the mite
Sarcoptes scabiei which causes mange and can transmit canine
distemper (Henderson, 2009). Red foxes also carry Spirometra
erinaceieuropaei, Toxocara canis and Taenia spp. that have been
previously recorded from native wildlife (Spratt et al., 1990).
Foxes are a potential reservoir host for helminths that can infect
domestic and livestock species. Many red fox parasites easily transmit
to domestic dog populations, particularly parasites that are specific to
any canid or carnivore species as hosts (Richards et al 1995; Gortaza
et al 1998). Examples of this include T. canis and D. caninum. The red
10
fox is also a definitive host for parasites where larval forms infect
livestock including E. granulosus and a number of Taenia spp..
Attempts to control parasites in dog populations and helminths of
veterinary importance in livestock may be hindered by the presence of
the same parasite species in red foxes persisting in the same
environments (Richards et al., 1995).
A number of animal parasitic diseases may also cause disease in
humans. These zoonotic pathogens can be transmitted from animals to
humans (e.g. rabies) (Romich, 2008). Approximately 75% of the world’s
new and emerging diseases are zoonotic (Romich, 2008). To date,
there has been little evidence to suggest the red fox is involved in the
spread or persistence of any disease that has a major financial or public
health significance in Australia (Newsome and Coman, 1989). However,
their high potential as reservoir hosts for some zoonotic intestinal
pathogens, especially in regions where there is a higher human
population density, highlights that the presence of foxes may have
important epidemiological implications (Vervaeke et al., 2005, Jenkins
et al., 2000, Criado-Fornelio et al., 2000). Some of the nematodes
found in red foxes e.g. Toxocara canis, Trichinella spiralis, and
cestodes, like Echinococcus granulosus, are of medical significance as
they cause toxocarosis, trichinellosis and hydatid disease respectively
(Richards et al., 1995).
11
The possibility of zoonotic transmission occurring is increased as
human pressure and environmental factors (e.g. droughts) bring red
foxes closer to human habitats or urban areas (Criado-Fornelio et al.,
2000). Environmental and soil contamination with parasite eggs is a
major issue as is a lack of public awareness of the risk of infection via
parasites from red foxes (Wolfe et al., 2001).
Implementation of control programs for zoonotic helminthiasis would be
futile due to the large number of reservoirs of most parasites (Prociv
and Cross, 2001). Human infection with cestodes and nematodes are
not very common because they are often accidental. Zoonotic
helminthiasis is more likely to be reported from areas where poverty,
substandard hygiene practices and cultural habits, as well as an
insufficiently cooked food, predispose people to parasitic infection
(Prociv and Cross, 2001).
1.5 Helminth parasites of feral cats in Australia
Parasites of feral cats are widely researched due to their potential to
spread to domesticated cats and therefore their zoonotic ability. Feral
cats harbour many parasites of zoonotic and conservation importance
as well as protozoan parasites that can be transmitted to livestock. In
total, around 100 pathogen species have been reported from feral cats
and approximately about 30 of these have also been reported in native
wildlife (Dickman, 1996). Table 1-2 summarises the findings of five
previous studies on cat intestinal helminths in Australia.
12
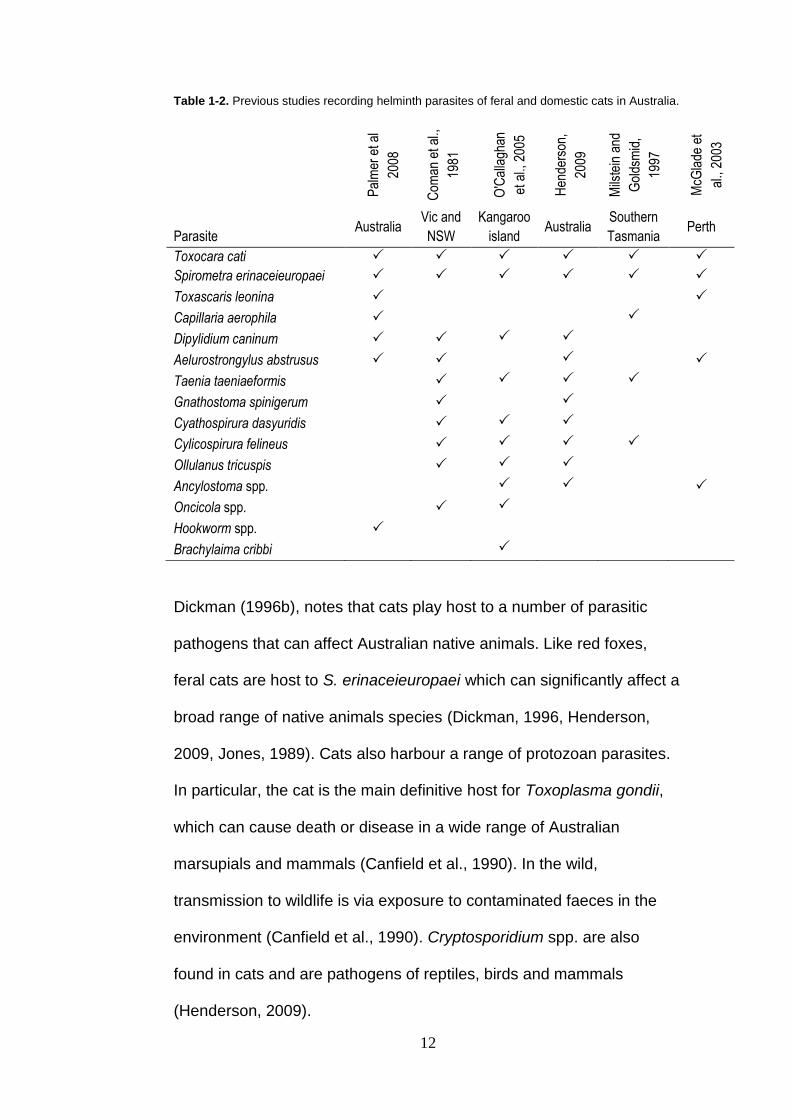
Table 1-2. Previous studies recording helminth parasites of feral and domestic cats in Australia.
Pal
mer
et a
l
2008
Com
an e
t al.,
1981
O'C
alla
ghan
et a
l., 2
005
Hen
ders
on,
2009
Mils
tein
and
Gol
dsm
id,
1997
McG
lade
et
al.,
2003
Parasite Australia
Vic and
NSW
Kangaroo
island Australia
Southern
Tasmania Perth
Toxocara cati
Spirometra erinaceieuropaei
Toxascaris leonina
Capillaria aerophila
Dipylidium caninum
Aelurostrongylus abstrusus
Taenia taeniaeformis
Gnathostoma spinigerum
Cyathospirura dasyuridis
Cylicospirura felineus
Ollulanus tricuspis
Ancylostoma spp.
Oncicola spp.
Hookworm spp.
Brachylaima cribbi
Dickman (1996b), notes that cats play host to a number of parasitic
pathogens that can affect Australian native animals. Like red foxes,
feral cats are host to S. erinaceieuropaei which can significantly affect a
broad range of native animals species (Dickman, 1996, Henderson,
2009, Jones, 1989). Cats also harbour a range of protozoan parasites.
In particular, the cat is the main definitive host for Toxoplasma gondii,
which can cause death or disease in a wide range of Australian
marsupials and mammals (Canfield et al., 1990). In the wild,
transmission to wildlife is via exposure to contaminated faeces in the
environment (Canfield et al., 1990). Cryptosporidium spp. are also
found in cats and are pathogens of reptiles, birds and mammals
(Henderson, 2009).
13
Feral cat populations are known to harbour a number of protozoan and
helminth parasites that can be passed on to domestic cats and livestock
including Toxocara cati and Dipylidium caninum. The parasites that
have an impact on livestock are mainly protozoan parasites (Palmer et
al., 2008). Due to the cat’s widespread and abundant nature, they do
pose a great risk of transmission of their parasites to domestic
populations and livestock animals (Palmer et al., 2008, Jones and
Coman, 1982).
Feral cats are widely underestimated in their transmission risk of
zoonotic diseases. In the case of ocular larval migrans, T. cati
(transmitted by cats) is more widely seen as the causative agent rather
than T. canis (transmitted by dogs or red foxes) (Romich, 2008). The
cestode S. erinaceieuropaei is also a common parasite of cats which
can cause infection in humans, resulting in oedema and a painful
nodule near the eye (Romich, 2008). Cats are naturally cautious
animals, so the main form of transmission is directly through faeces or
by transmitting the parasite to domestic cats and therefore infecting
humans (Romich, 2008, Prociv and Cross, 2001).
1.6 Importance of transmission routes and life cycles
Parasites are reliant on effective transmission strategies and access to
appropriate hosts species. Understanding transmission strategies of
particular parasites improves control methods and helps prevent
14
parasite transmission. Current control efforts surrounding pathogens
involve trying to recognise and halt the lifecycle via transmission routes:
if a parasite is prevented from entering a host, they are unable to
complete their life cycle (Chowdhury et al., 2001). As such,
understanding transmission routes for different parasites is critical for
effective parasite control. There are two basic modes of transmission
for helminth parasites; direct and indirect pathways (Romich, 2008,
Wolfe et al., 2001).
1.6.1.1 Direct transmission
Direct transmission typically occurs via contamination of the
environment with eggs and subsequent ingestion of the infective stage
by the host species (Wolfe et al., 2001). For example, transmission may
occur during animal foraging expeditions where the environment is
likely to become contaminated with the definitive hosts faeces and
therefore parasite eggs, oocysts or larvae. This can result in infection of
additional host species which ingest the infective stages (Wolfe et al.,
2001). As part of their territorial behaviour, red foxes and cats mark
their home range with faeces and urine; thus increasing the likelihood of
transmission of parasites (Coman, 1983) and increases the chances of
parasite transmission from feral predators.
15
1.6.1.2 Indirect transmission
Parasites may also be indirectly transmitted to domestic animals and
livestock animals by ingestion of intermediate or paratenic hosts (Wolfe
et al., 2001). Many helminth lifecycles involve intermediate hosts (i.e.
small mammals, rodents and insects) (Cheng, 1986) and rely on
selective hunting or predatory feeding behaviour of definitive hosts.
Therefore indirect transmission is usually indicative of the diet of
definitive hosts. Parasites can also be transmitted indirectly via contact
with an animal vector (usually an arthropod) that transmits the parasite
whilst biting or feeding on the host (Romich, 2008).
Zoonotic diseases and/or parasites are those which are readily
transmissible from animals to humans. Typically, zoonotic organisms
are relatively asymptomatic in their natural animal host however
manifest clinical disease in humans (Robertson et al., 2000).
Transmission of zoonotic parasites can occur directly through ingestion,
inhalation of infective stage or via contact with contaminated soil or
water, or indirectly through the consumption of infective stages present
in livestock or game species (Romich, 2008).
1.7 What factors influence parasite presence?
The presence of helminth parasites in foxes can be influenced by prey
preference and availability as well as the ability of selected parasites to
become established in the intestine (Kapel and Nansen, 1996). For
16
some parasite species, prevalence can vary with host sex as well as
host age, nutritional status and body condition (Richards et al., 1995).
These variations are largely due to different feeding behaviours and
success of particular individual hosts. Prevalence and intensity of
parasites can also be related to environmental factors and host habitat
(Stromberg, 1997, Richards et al., 1995). Habitat variation and
environmental factors (i.e. differences in temperature, humidity,
presence/absence of intermediate hosts etc) can lead to variation in
animal parasitofauna diversity across wide geographical areas due to
the influence these factors can have on the survival and persistence of
life stages within particular landscapes (Stromberg, 1997, Criado-
Fornelio et al., 2000, Hegglin et al., 2007).
1.7.1 Host habitats
Many studies have shown that there are distinct geographic differences
that determine parasite presence. These geographic variations take into
account vegetation cover and land use within an environment (e.g.
intensive clearing for farming) (Stromberg, 1997). For example
nematodes such as U. stenocephala have been isolated in regions with
moist soils, while Toxascaris leonina or Trichuris vulpis are more
common in semi-arid areas due to their resistant egg and larval stages
(Criado-Fornelio et al 2000; Gortaza et al 1998). Surveys demonstrate
that a host’s diet can vary with different habitat types and consequently
therefore affect the parasitofauna (Richards et al., 1995).
17
1.7.2 Climatic factors
Parasite incidence and perseverance depend on precise environmental
conditions that can facilitate the survival of free-living stages (Hegglin et
al., 2007). Factors related to the development, distribution, survival and
migratory behaviour of parasites are primarily related to weather
conditions (Stromberg, 1997). Physical properties such as temperature,
rainfall and relative humidity are important features of the environment
in which a parasite lives (Stromberg, 1997, Hegglin et al., 2007).
Parasites can differ in their habitat preferences due to variations in
temperature, humidity and shelter (Richards et al., 1995). Certain
environmental conditions are needed in order for vital developmental
stages to be completed; these cannot occur if the environment only
partially meets the life cycle requirements (i.e. too dry, too cold)
(Rogers, 1962, Stromberg, 1997).
Hatching of parasite eggs and larvae development to the infective
stage, is primarily dependent on the weather; particularly temperature
and moisture (Stromberg, 1997). Helminth parasites that have free
living stages (i.e. hookworms) naturally prefer areas that have a higher
relative humidity which reduces the risk of desiccation of larvae and
promotes embryonation of eggs (Criado-Fornelio et al., 2000). Under
optimal moisture and temperature conditions, free living larval stages of
parasites will reach the infective stage in a shorter period of time
(Stromberg, 1997).
18
1.7.3 Prey abundance and availability
The variety of helminth species present in red foxes and feral cats at
particular locations may be determined by the diversity of food items
available (Kapel and Nansen, 1996). Transmission of parasites usually
depends on an intermediate host species being available to predation
by a definitive host (Hegglin et al 2007). Parasite life cycle and
transmission could be adversely affected through these predator prey
interactions. Parasites transmitted indirectly in this manner are usually
limited to areas where the ranges of the definitive and intermediate
hosts intersect (Hegglin et al., 2007).
There are also differences in suitable paratenic hosts which affect
parasitic abundance. If a particular parasite is dependent on specific
paratenic hosts being present within the environment to complete its life
cycle, conditions which are unfavourable for the persistence of these
paratenic hosts will also naturally limit parasite occurrence as well
(Gortaza et al 1998). The presence and abundance of intermediate and
paratenic hosts can vary between habitats and any change in
availability of intermediate hosts and alternate food sources can
influence the behaviour of the definitive host and can therefore
significantly affect the transmission dynamics of some parasites
(Hegglin et al., 2007).
19
1.7.4 Host density
Host species density varies greatly in relation to food and prey
availability (e.g. red fox densities in the UK ranges from 1 - 30 foxes per
km2 in some urban areas) (Sillero-Zubiri et al., 2004). Unusual spatial
and temporal dynamics of intermediate and definitive hosts could
improve dispersal and increase the persistence of a parasite population
(Hegglin et al., 2007). An increased host population density allows for
an increased transmission rate and infectivity as well as an increase in
parasite diversity (Watve and Sukumar, 1995).
1.7.5 Host Immunity and Nutritional status
A number of studies have addressed the relationship between
nutritional status of the host and the ability to regulate a parasitic
infection (Coop and Kryriazakis, 2001, Coop and Holmes, 1996,
Chandra, 1981, Bundy and Golden, 1987). A greater vulnerability to
disease can be attained by an absence of readily available prey species
thus leading to a nutrient deficit in the definitive host (Coop and Holmes,
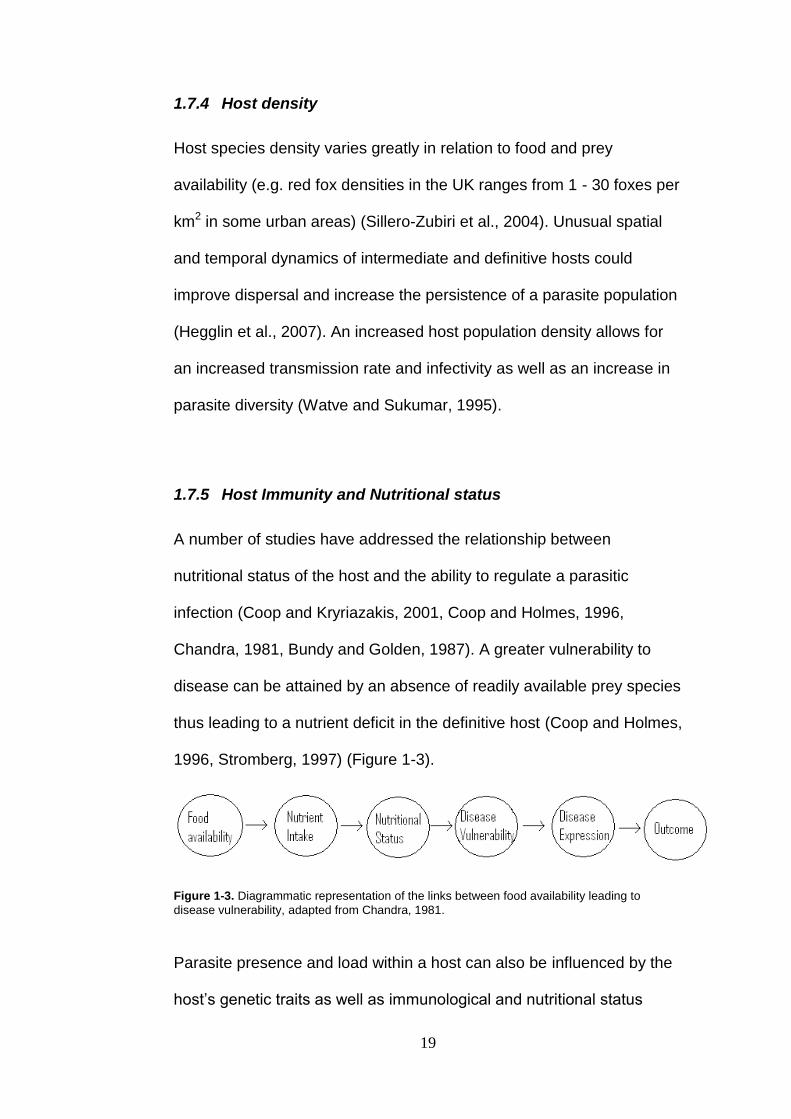
1996, Stromberg, 1997) (Figure 1-3).
Figure 1-3. Diagrammatic representation of the links between food availability leading to
disease vulnerability, adapted from Chandra, 1981.
Parasite presence and load within a host can also be influenced by the
host’s genetic traits as well as immunological and nutritional status

20
(Coop and Holmes, 1996). Nutritional limits (i.e. amount of prey taken)
can negatively affect the ability of the host to counteract a parasitic
infection/challenge (Sorci et al., 2009, Chandra, 1981, Coop and
Kryriazakis, 2001). A frequent infection rate in undernourished hosts
may in part be due to an impaired host immune system (Chandra, 1981,
Stephenson et al., 2000). At a population level, the interactions between
nutrition and immunity with infections are important determinants of
malnutrition and therefore morbidity (Chandra, 1981, Sorci et al., 2009,
Stephenson et al., 2000).
In addition to nutrition, factors that can affect the status of the host’s
immunity include age and cortisol levels (the steroid hormone that is
involved in the stress response and in sexual processes) (Sorci et al.,
2009, Chandra, 1981). Young animals are typically more susceptible to
parasitic disease due to their under developed immune system
compared to a mature host (Chowdhury et al., 2001). Environmental
factors can potentially impact on the host by impairing their
immunological response by triggering cortisol levels if they are present
in stressful conditions such as in arid areas and competition
(Chowdhury et al., 2001). The ability of the host to counteract disease
and its progression can consequently be affected by all of these factors.
1.7.6 Host demographics
In addition to host demographics affecting immunity, it has been found
that some parasite species are found at a higher prevalence in younger
21
target host individuals due to internal factors e.g. Toxocara spp. Their
infective larvae can follow a vertical transmission route, meaning they
can migrate across placenta to the foetus and via transmammary
infection after birth (Chowdhury et al., 2001). Other research has also
found to be a strong sex effect with males having a heavier infection
than female hosts (Behnke et al., 1999).
Not only can host age and sex influence the presence of parasites but
so too can host body size. Body size is believed to be an important
factor in both parasite presence and richness because the host’s body
nicely defines the dimensions of an enclosed habitat (Mourand and
Poulin, 1998). As such, larger hosts are expected to harbour richer
infracommunity parasite fauna because of the greater variety of niches
they provide in comparison to smaller hosts. This is turn allows them to
sustain a greater number of parasites (Mourand and Poulin, 1998).
1.8 Objectives
To date there has been a limited number of studies conducted in
Australia investigating the presence and diversity of intestinal helminth
communities in red foxes. There has been even less work done in south
west Western Australia. Whilst more information is available with
respect to cats, the majority of this work is related to domestic rather
than feral cats. Both red foxes and feral cats are capable of potentially
22
harbouring zoonotic parasites as well as transmitting parasites of
agricultural and conservation importance.
Therefore the objectives of this study are to investigate the species of
intestinal helminth parasites occurring within red foxes and feral cats
across multiple locations in southwest Western Australia. Comparison
of parasite infracommunity richness is examined as well as a correlation
between infracommunity richness and body condition of the animals.
Climate, environmental factors and host demographics are examined to
determine their influence on parasite presence.
23
2 Methods
2.1 Sample Locations
Red fox and feral cat samples were obtained using a culling program
called Red Card for the Red Fox, coordinated by the Department of
Agriculture and Food Western Australia (DAFWA). This program was
conducted during two weekends of the year, February 20th and 21st and
March 20th and 21st. Local farmers were encouraged to participate in
district wide culling of feral animals before returning them to a central
location for tallying. Collections were carried out in as many locations as
possible but due to a limited time frame and large distances between
sites, these were restricted to those study sites that could be attended.
Other towns also culled foxes and feral cats on separate occasions
using their own regional control programs. Some road kill samples were
also taken for examination.
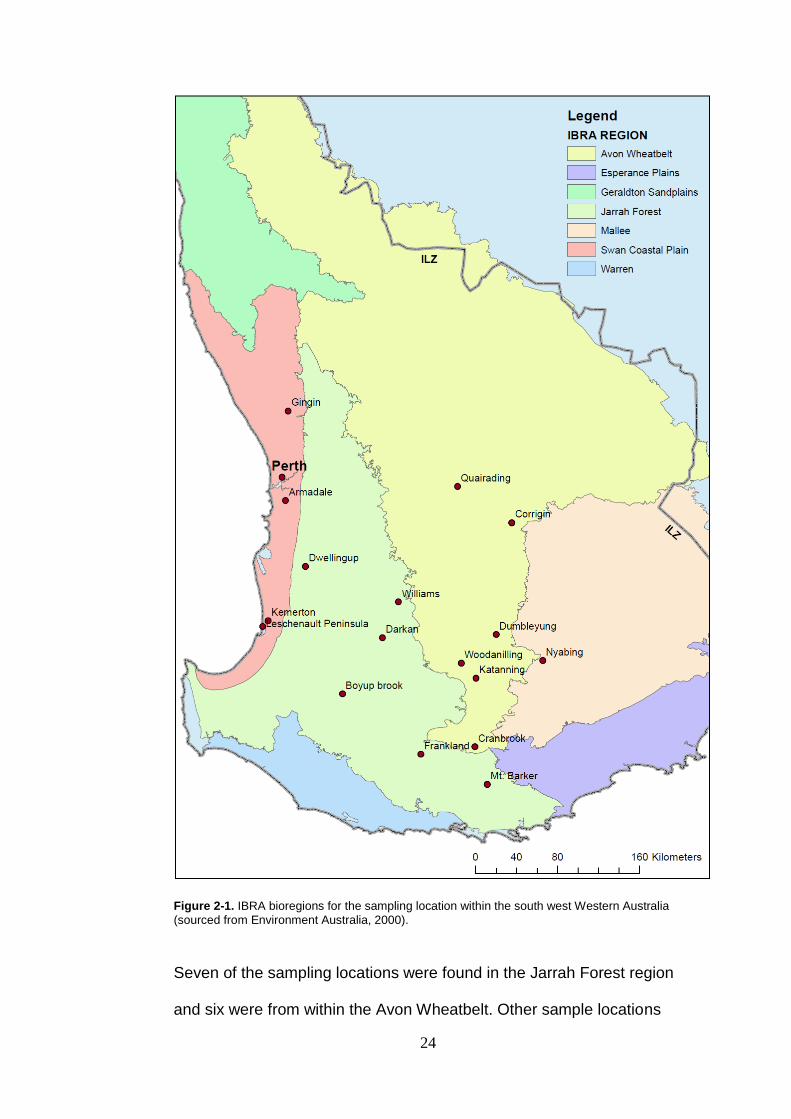
Samples were collected from 17 locations throughout southwest
Western Australia. These locations covered four IBRA (Interim
Biogeographic Regionalisation for Australia) bioregions within the
intensive land use zone of the southwest Western Australia as sourced
from Environment Australia (2000) (Figure 2-1).
24
Figure 2-1. IBRA bioregions for the sampling location within the south west Western Australia
(sourced from Environment Australia, 2000).
Seven of the sampling locations were found in the Jarrah Forest region
and six were from within the Avon Wheatbelt. Other sample locations
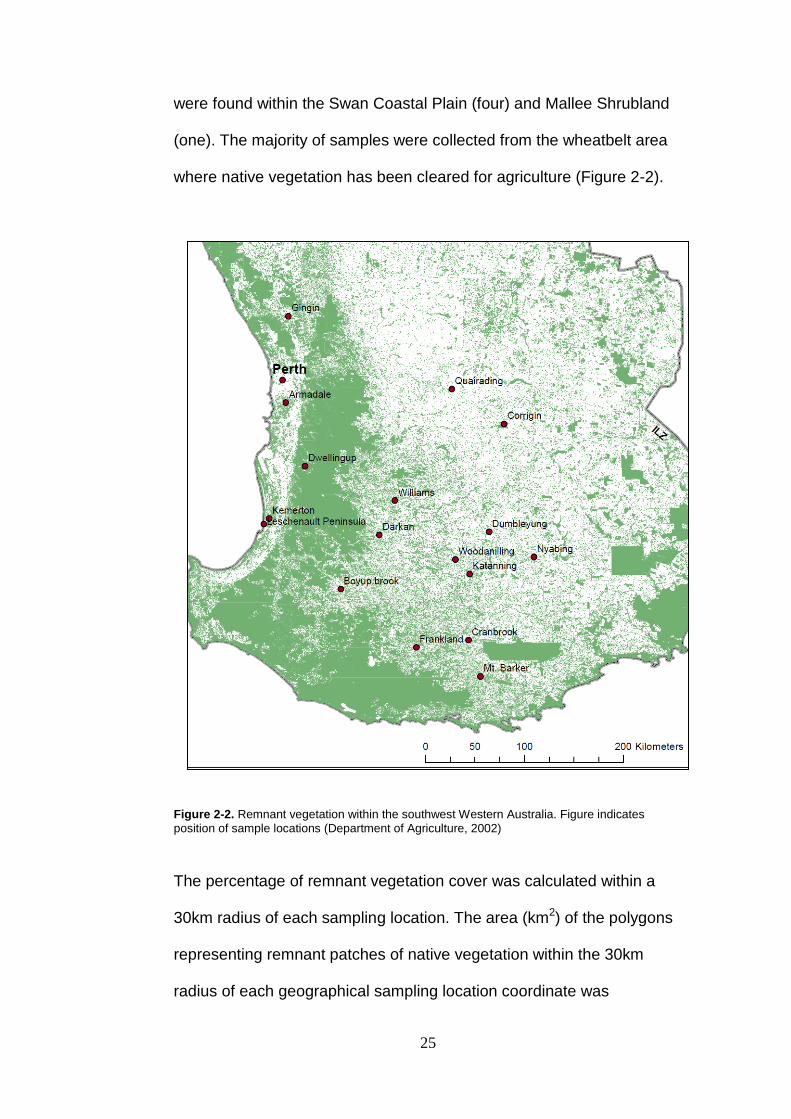
25
were found within the Swan Coastal Plain (four) and Mallee Shrubland
(one). The majority of samples were collected from the wheatbelt area
where native vegetation has been cleared for agriculture (Figure 2-2).
Figure 2-2. Remnant vegetation within the southwest Western Australia. Figure indicates
position of sample locations (Department of Agriculture, 2002)
The percentage of remnant vegetation cover was calculated within a
30km radius of each sampling location. The area (km2) of the polygons
representing remnant patches of native vegetation within the 30km
radius of each geographical sampling location coordinate was
26
calculated and compared against the total area of land (~2,700km2 for
inland locations and less for those sites where the radius overlapped
the coast). The resultant percentage native vegetation cover for each
sampling location is listed in Table 2-1. Sample locations from the
Wheatbelt region, including Corrigin, Dumbleyung, Quairading etc, had
a lower percentage of remnant vegetation cover than the locations
within the Jarrah Forest regions such as Dwellingup and Boyup Brook.
Different environmental and climatic measures were calculated for each
sampling locations for use in a multiple regression analysis (discussed
later in section 2.6). Climatic measures included five year average
mean, minimum and maximum temperatures, five year average annual
rainfall, average monthly rainfall for the previous six months from
capture and average monthly humidity for the previous six months
(sourced from Bureau of Meteorology (2010)).
This climate data was chosen to represent the environmental variability
between each sampling location (i.e. habitat availability, average
temperatures and rainfall patterns). Previous studies have found
evidence of effects on the presence of parasites from annual rainfall,
temperature and seasonal humidity (Stromberg, 1997).
27
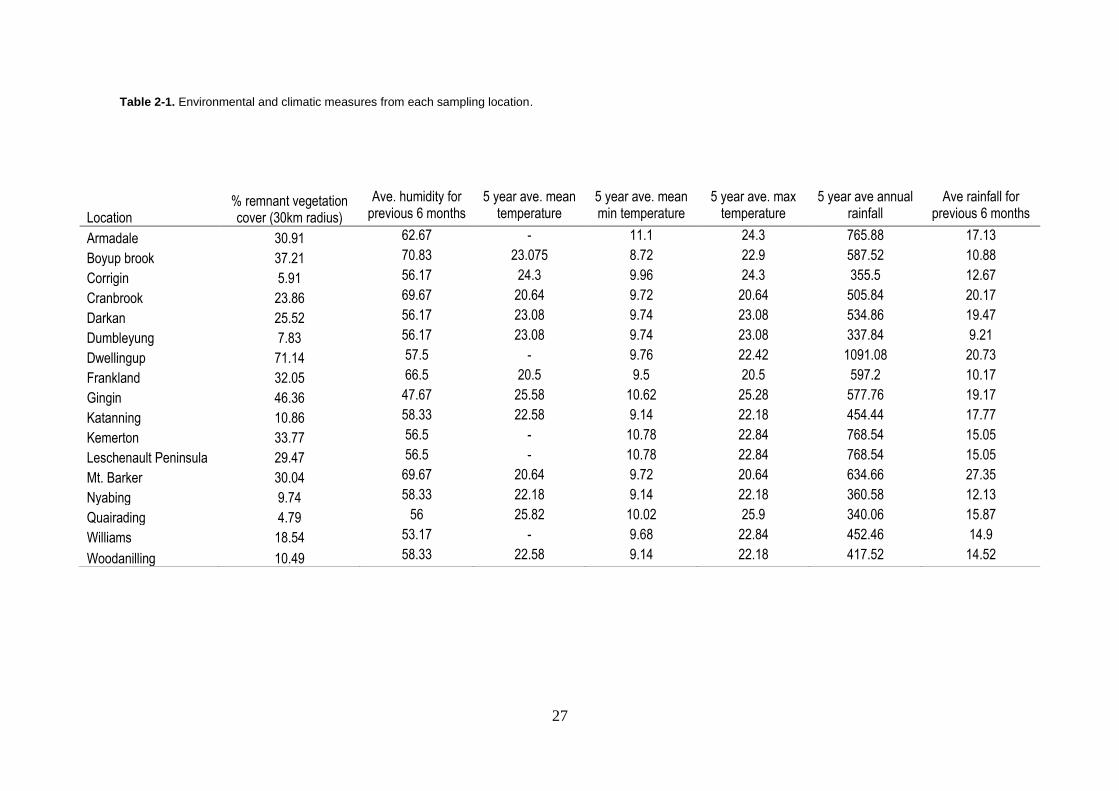
Table 2-1. Environmental and climatic measures from each sampling location.
Location % remnant vegetation cover (30km radius)
Ave. humidity for previous 6 months
5 year ave. mean temperature
5 year ave. mean min temperature
5 year ave. max temperature
5 year ave annual rainfall
Ave rainfall for previous 6 months
Armadale 30.91 62.67 - 11.1 24.3 765.88 17.13
Boyup brook 37.21 70.83 23.075 8.72 22.9 587.52 10.88
Corrigin 5.91 56.17 24.3 9.96 24.3 355.5 12.67
Cranbrook 23.86 69.67 20.64 9.72 20.64 505.84 20.17
Darkan 25.52 56.17 23.08 9.74 23.08 534.86 19.47
Dumbleyung 7.83 56.17 23.08 9.74 23.08 337.84 9.21
Dwellingup 71.14 57.5 - 9.76 22.42 1091.08 20.73
Frankland 32.05 66.5 20.5 9.5 20.5 597.2 10.17
Gingin 46.36 47.67 25.58 10.62 25.28 577.76 19.17
Katanning 10.86 58.33 22.58 9.14 22.18 454.44 17.77
Kemerton 33.77 56.5 - 10.78 22.84 768.54 15.05
Leschenault Peninsula 29.47 56.5 - 10.78 22.84 768.54 15.05
Mt. Barker 30.04 69.67 20.64 9.72 20.64 634.66 27.35
Nyabing 9.74 58.33 22.18 9.14 22.18 360.58 12.13
Quairading 4.79 56 25.82 10.02 25.9 340.06 15.87
Williams 18.54 53.17 - 9.68 22.84 452.46 14.9
Woodanilling 10.49 58.33 22.58 9.14 22.18 417.52 14.52
28
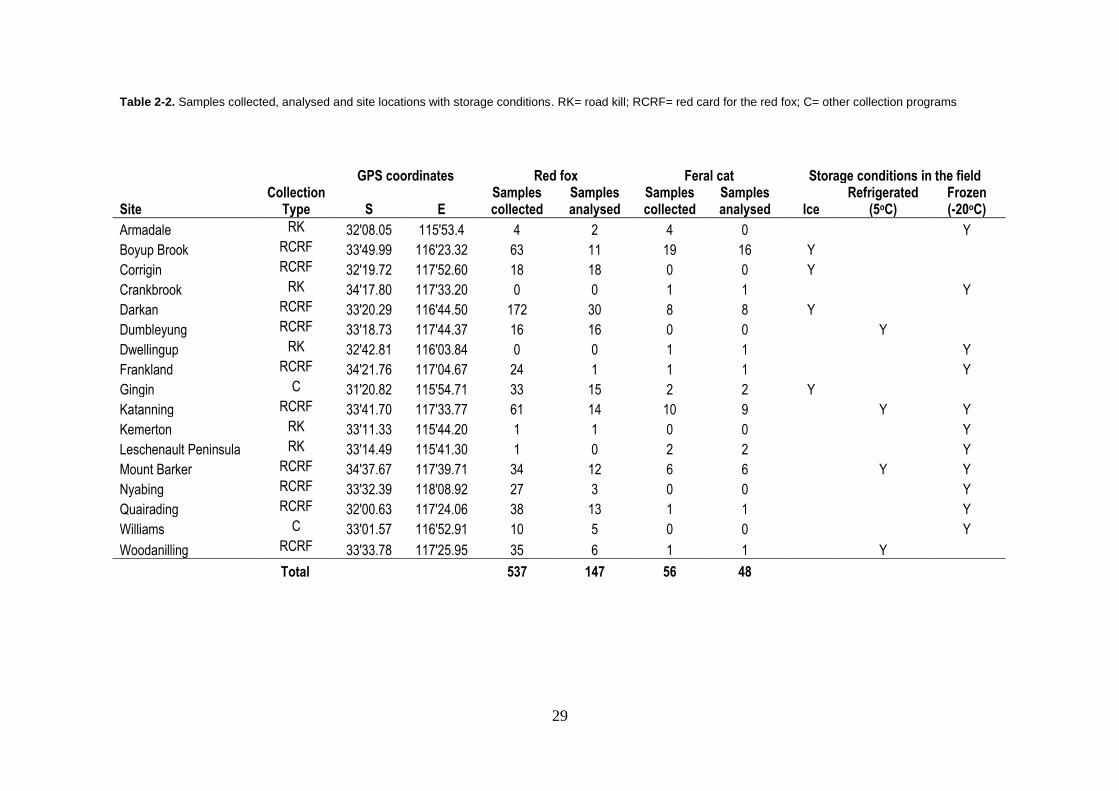
2.2 Sample collection
A total of 544 red foxes and 56 feral cats were collected from 17 geographical
locations (Table 2-2). Sample sizes varied from 1 to 180 between different
sample locations. Information collected from each animal included head,
head-body and pes length (measured with a dress makers tape to ± 0.25cm)
as well as body mass (measured to ± 0.01kg). To improve consistency, the
same person did the measurements for most of the samples collected, where
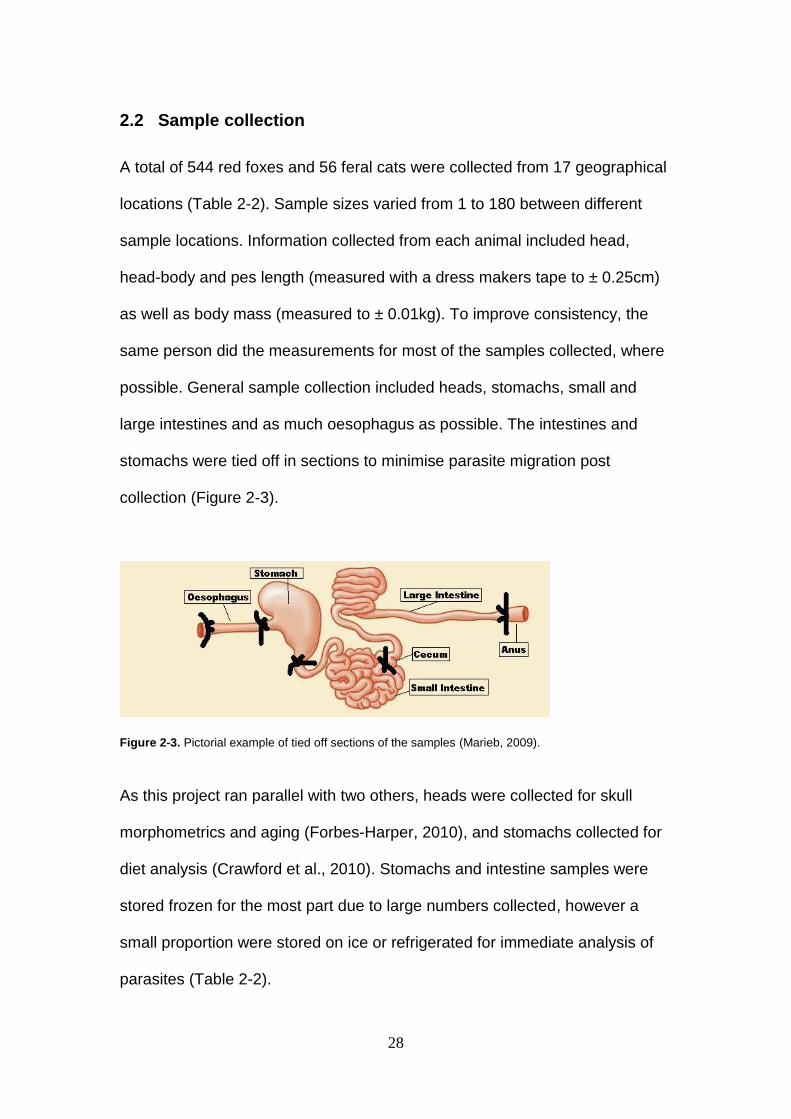
possible. General sample collection included heads, stomachs, small and
large intestines and as much oesophagus as possible. The intestines and
stomachs were tied off in sections to minimise parasite migration post
collection (Figure 2-3).
Figure 2-3. Pictorial example of tied off sections of the samples (Marieb, 2009).
As this project ran parallel with two others, heads were collected for skull
morphometrics and aging (Forbes-Harper, 2010), and stomachs collected for
diet analysis (Crawford et al., 2010). Stomachs and intestine samples were
stored frozen for the most part due to large numbers collected, however a
small proportion were stored on ice or refrigerated for immediate analysis of
parasites (Table 2-2).
29
Table 2-2. Samples collected, analysed and site locations with storage conditions. RK= road kill; RCRF= red card for the red fox; C= other collection programs
GPS coordinates Red fox Feral cat Storage conditions in the field
Site Collection
Type S E Samples collected
Samples analysed
Samples collected
Samples analysed Ice
Refrigerated (5oC)
Frozen (-20oC)
Armadale RK 32'08.05 115'53.4 4 2 4 0 Y
Boyup Brook RCRF 33'49.99 116'23.32 63 11 19 16 Y
Corrigin RCRF 32'19.72 117'52.60 18 18 0 0 Y
Crankbrook RK 34'17.80 117'33.20 0 0 1 1 Y
Darkan RCRF 33'20.29 116'44.50 172 30 8 8 Y
Dumbleyung RCRF 33'18.73 117'44.37 16 16 0 0 Y
Dwellingup RK 32'42.81 116'03.84 0 0 1 1 Y
Frankland RCRF 34'21.76 117'04.67 24 1 1 1 Y
Gingin C 31'20.82 115'54.71 33 15 2 2 Y
Katanning RCRF 33'41.70 117'33.77 61 14 10 9 Y Y
Kemerton RK 33'11.33 115'44.20 1 1 0 0 Y
Leschenault Peninsula RK 33'14.49 115'41.30 1 0 2 2 Y
Mount Barker RCRF 34'37.67 117'39.71 34 12 6 6 Y Y
Nyabing RCRF 33'32.39 118'08.92 27 3 0 0 Y
Quairading RCRF 32'00.63 117'24.06 38 13 1 1 Y
Williams C 33'01.57 116'52.91 10 5 0 0 Y
Woodanilling RCRF 33'33.78 117'25.95 35 6 1 1 Y
Total 537 147 56 48
30
2.3 Lab methods:
Upon reaching the laboratory, the stomach and intestines were defrosted for 1-
2 hours. The stomach contents were examined for diet analysis; any parasites
observed were collected and preserved. The intestines were then stored in the
fridge (5oC) until analysed. The mesentery was removed and intestines were
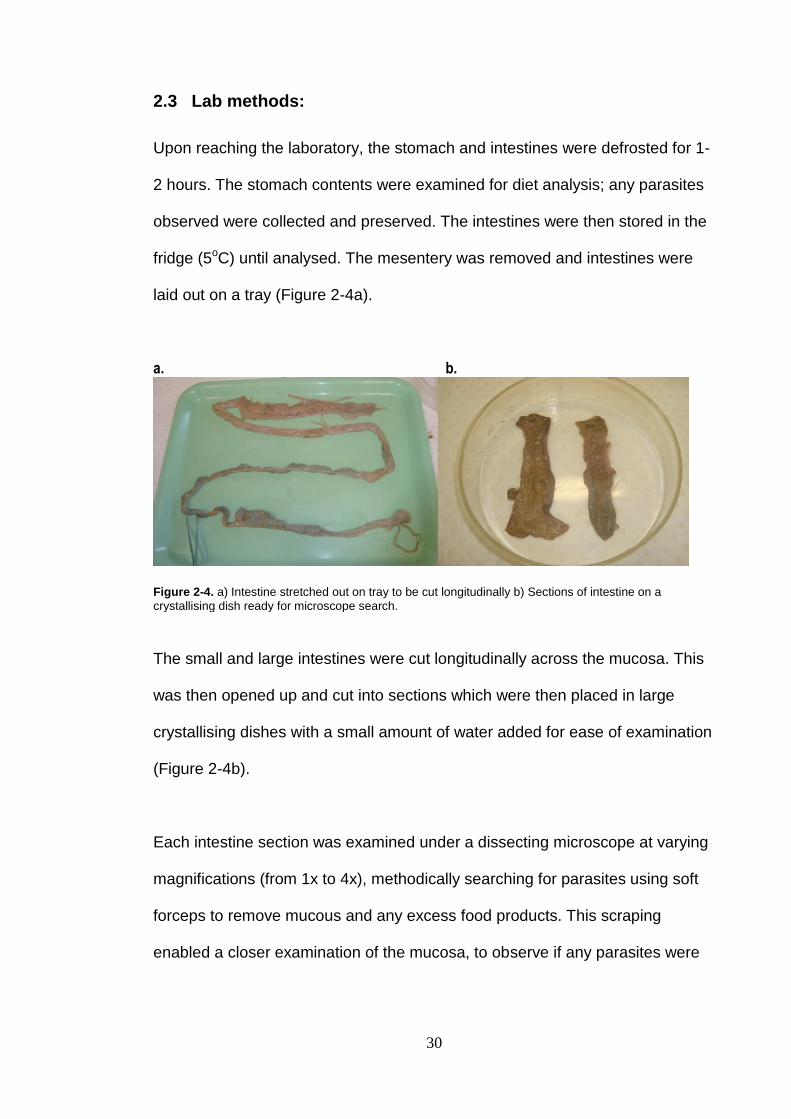
laid out on a tray (Figure 2-4a).
a. b.
Figure 2-4. a) Intestine stretched out on tray to be cut longitudinally b) Sections of intestine on a
crystallising dish ready for microscope search.
The small and large intestines were cut longitudinally across the mucosa. This
was then opened up and cut into sections which were then placed in large
crystallising dishes with a small amount of water added for ease of examination
(Figure 2-4b).
Each intestine section was examined under a dissecting microscope at varying
magnifications (from 1x to 4x), methodically searching for parasites using soft
forceps to remove mucous and any excess food products. This scraping
enabled a closer examination of the mucosa, to observe if any parasites were
31
attached to the mucosa or to reveal any pale-coloured parasites that were
present within the undigested food material.
2.4 Parasites identification and preservation
After visual inspection of the intestine, parasites were identified to class if
possible by morphological characteristics and preserved in their relevant
solutions. All parasites were counted to obtain parasite load for each animal.
2.4.1 Trematodes
With the assistance of Mr Russel Hobbs (adjunct Senior Technologist at
Murdoch University), trematodes were classified as specifically as possible.
The key used for basic identification was from Schell (1970). The flukes were
stained using either Semichon’s acetocarmine or Harris’s haematoxylin (HH1).
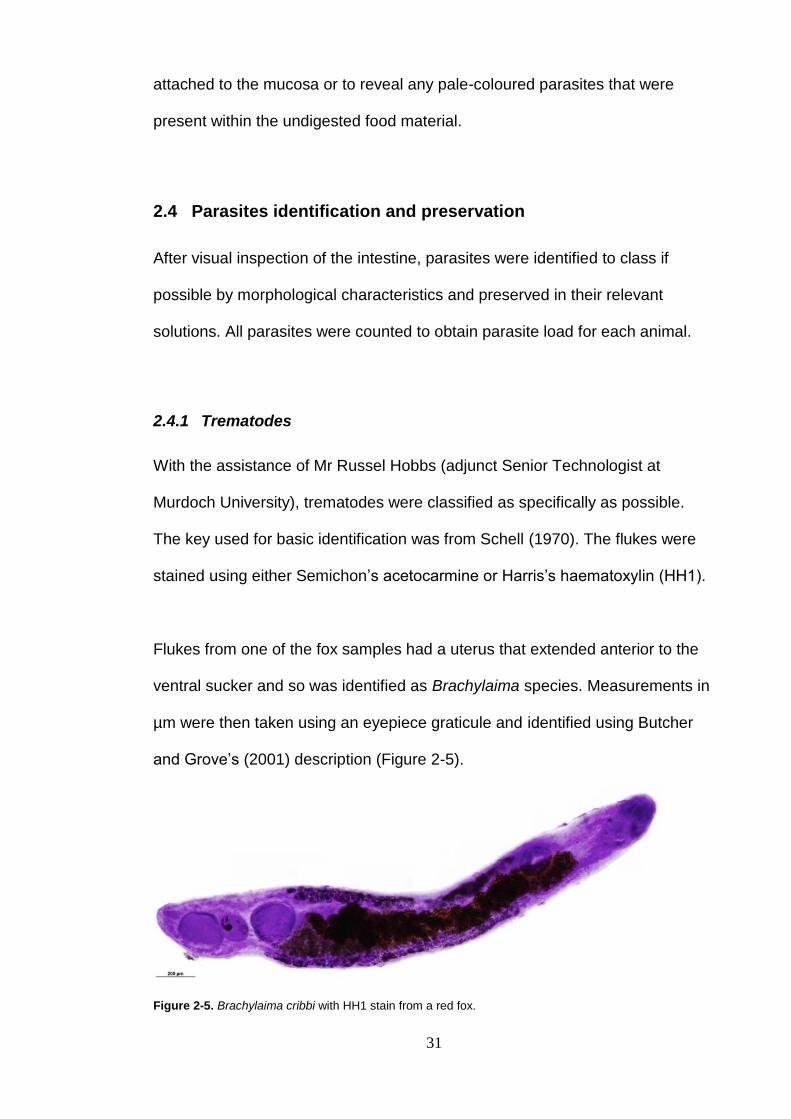
Flukes from one of the fox samples had a uterus that extended anterior to the
ventral sucker and so was identified as Brachylaima species. Measurements in
µm were then taken using an eyepiece graticule and identified using Butcher
and Grove’s (2001) description (Figure 2-5).
Figure 2-5. Brachylaima cribbi with HH1 stain from a red fox.
32
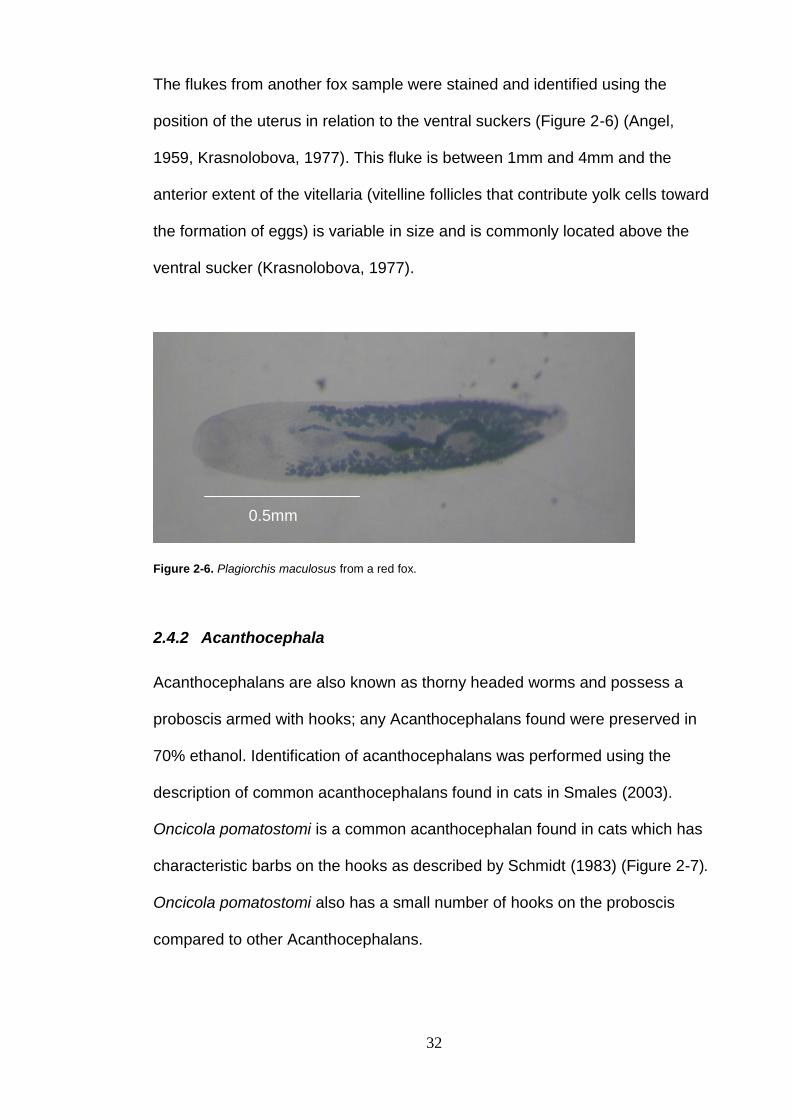
The flukes from another fox sample were stained and identified using the
position of the uterus in relation to the ventral suckers (Figure 2-6) (Angel,
1959, Krasnolobova, 1977). This fluke is between 1mm and 4mm and the
anterior extent of the vitellaria (vitelline follicles that contribute yolk cells toward
the formation of eggs) is variable in size and is commonly located above the
ventral sucker (Krasnolobova, 1977).
Figure 2-6. Plagiorchis maculosus from a red fox.
2.4.2 Acanthocephala
Acanthocephalans are also known as thorny headed worms and possess a
proboscis armed with hooks; any Acanthocephalans found were preserved in
70% ethanol. Identification of acanthocephalans was performed using the
description of common acanthocephalans found in cats in Smales (2003).
Oncicola pomatostomi is a common acanthocephalan found in cats which has
characteristic barbs on the hooks as described by Schmidt (1983) (Figure 2-7).
Oncicola pomatostomi also has a small number of hooks on the proboscis
compared to other Acanthocephalans.
0.5mm
33
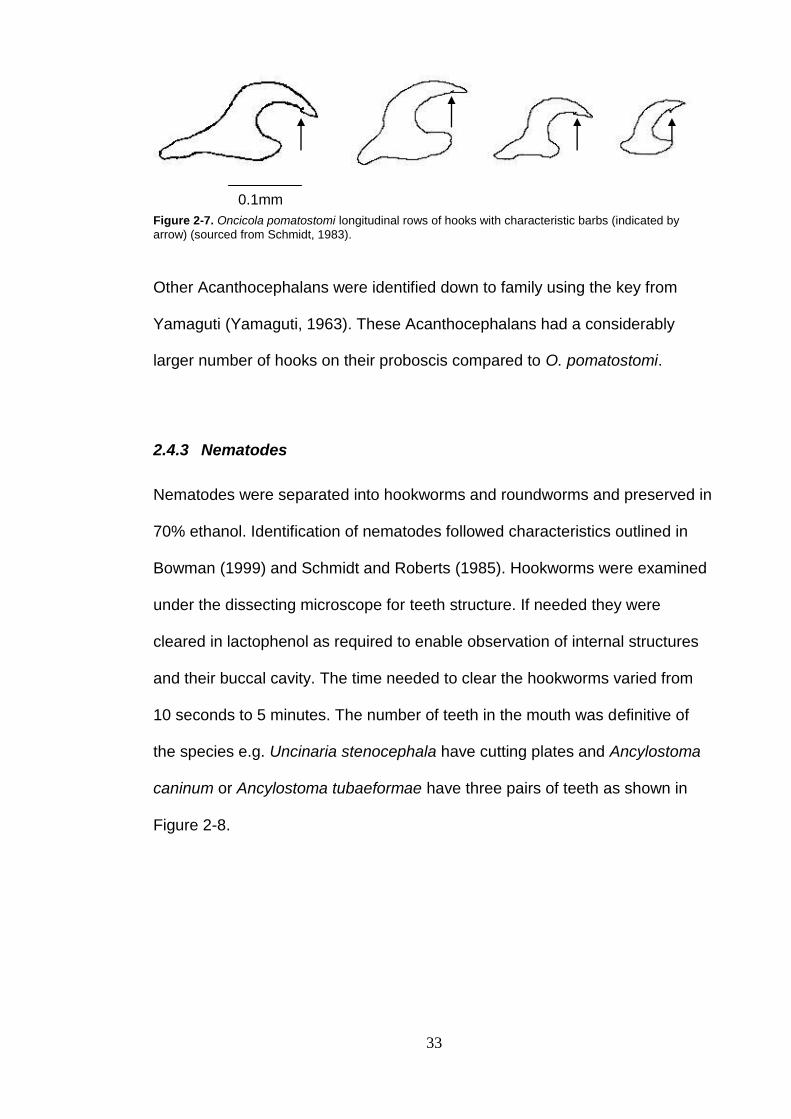
Figure 2-7. Oncicola pomatostomi longitudinal rows of hooks with characteristic barbs (indicated by
arrow) (sourced from Schmidt, 1983).
Other Acanthocephalans were identified down to family using the key from
Yamaguti (Yamaguti, 1963). These Acanthocephalans had a considerably
larger number of hooks on their proboscis compared to O. pomatostomi.
2.4.3 Nematodes
Nematodes were separated into hookworms and roundworms and preserved in
70% ethanol. Identification of nematodes followed characteristics outlined in
Bowman (1999) and Schmidt and Roberts (1985). Hookworms were examined
under the dissecting microscope for teeth structure. If needed they were
cleared in lactophenol as required to enable observation of internal structures
and their buccal cavity. The time needed to clear the hookworms varied from
10 seconds to 5 minutes. The number of teeth in the mouth was definitive of
the species e.g. Uncinaria stenocephala have cutting plates and Ancylostoma
caninum or Ancylostoma tubaeformae have three pairs of teeth as shown in
Figure 2-8.
0.1mm
34
200µm
B A
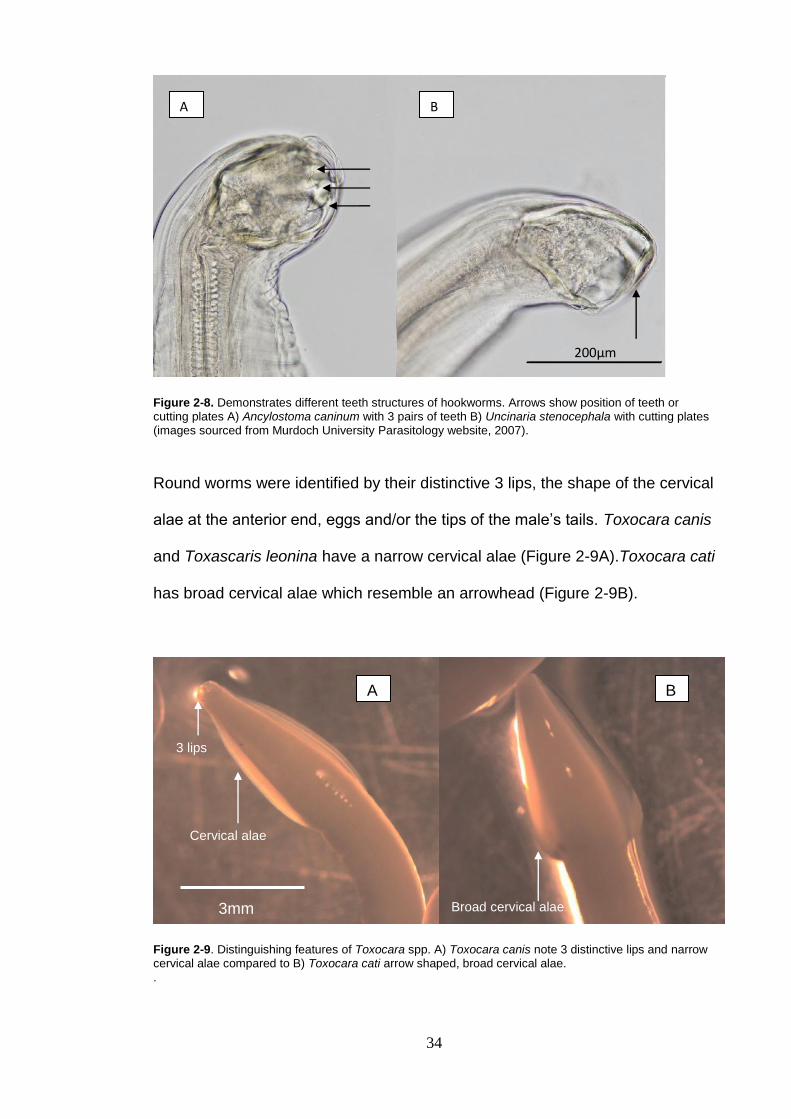
Figure 2-8. Demonstrates different teeth structures of hookworms. Arrows show position of teeth or cutting plates A) Ancylostoma caninum with 3 pairs of teeth B) Uncinaria stenocephala with cutting plates (images sourced from Murdoch University Parasitology website, 2007).
Round worms were identified by their distinctive 3 lips, the shape of the cervical
alae at the anterior end, eggs and/or the tips of the male’s tails. Toxocara canis
and Toxascaris leonina have a narrow cervical alae (Figure 2-9A).Toxocara cati
has broad cervical alae which resemble an arrowhead (Figure 2-9B).
Figure 2-9. Distinguishing features of Toxocara spp. A) Toxocara canis note 3 distinctive lips and narrow cervical alae compared to B) Toxocara cati arrow shaped, broad cervical alae.
.
3mm
Cervical alae
3 lips
Broad cervical alae
A B
35
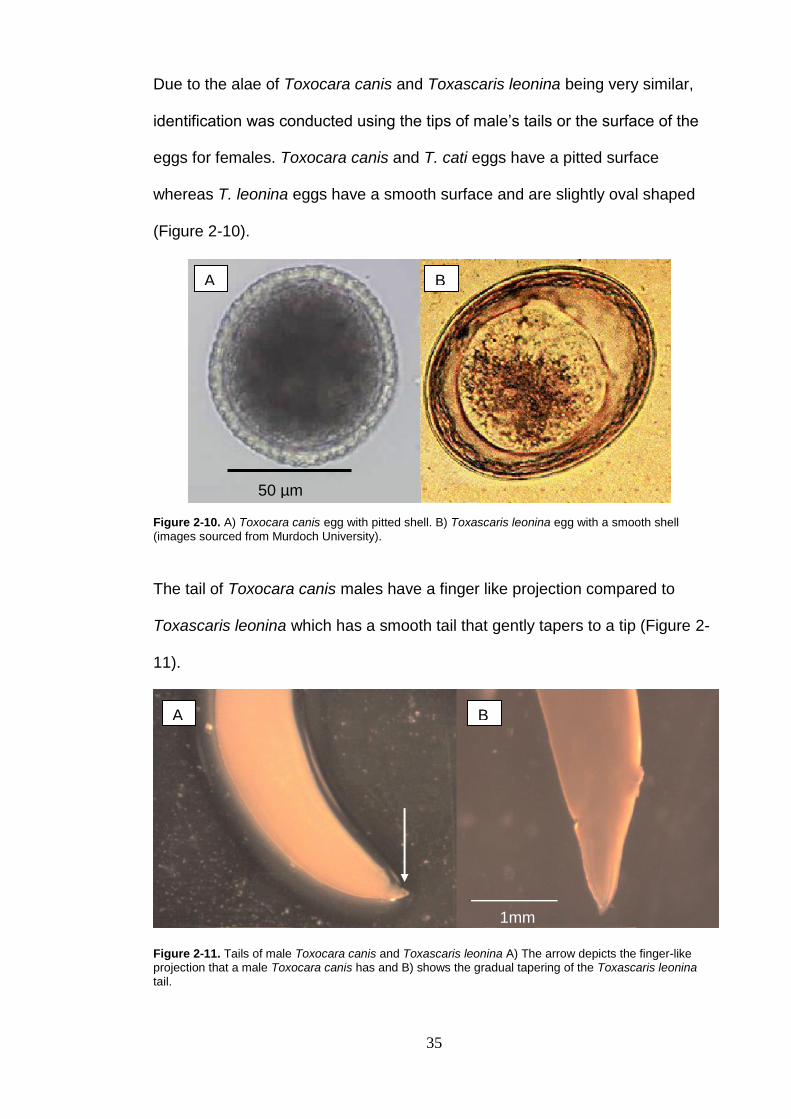
Due to the alae of Toxocara canis and Toxascaris leonina being very similar,
identification was conducted using the tips of male’s tails or the surface of the
eggs for females. Toxocara canis and T. cati eggs have a pitted surface
whereas T. leonina eggs have a smooth surface and are slightly oval shaped
(Figure 2-10).
Figure 2-10. A) Toxocara canis egg with pitted shell. B) Toxascaris leonina egg with a smooth shell
(images sourced from Murdoch University).
The tail of Toxocara canis males have a finger like projection compared to
Toxascaris leonina which has a smooth tail that gently tapers to a tip (Figure 2-
11).
Figure 2-11. Tails of male Toxocara canis and Toxascaris leonina A) The arrow depicts the finger-like projection that a male Toxocara canis has and B) shows the gradual tapering of the Toxascaris leonina
tail.
50 µm
1mm
A B
A B
36
2.4.4 Cestodes:
All cestodes were preserved in a solution of 10% formalin. Cestodes were
identified by their appearance, presence and position of genital pores. For the
parasite load count, the heads/scolices were counted and any small segments
that looked like they would be close to the head were counted as an individual
worm. If there were only a few segments found, then that was counted as one
worm. As such, it is anticipated that the parasite load for cestodes was most
likely an underestimate of true parasite load.
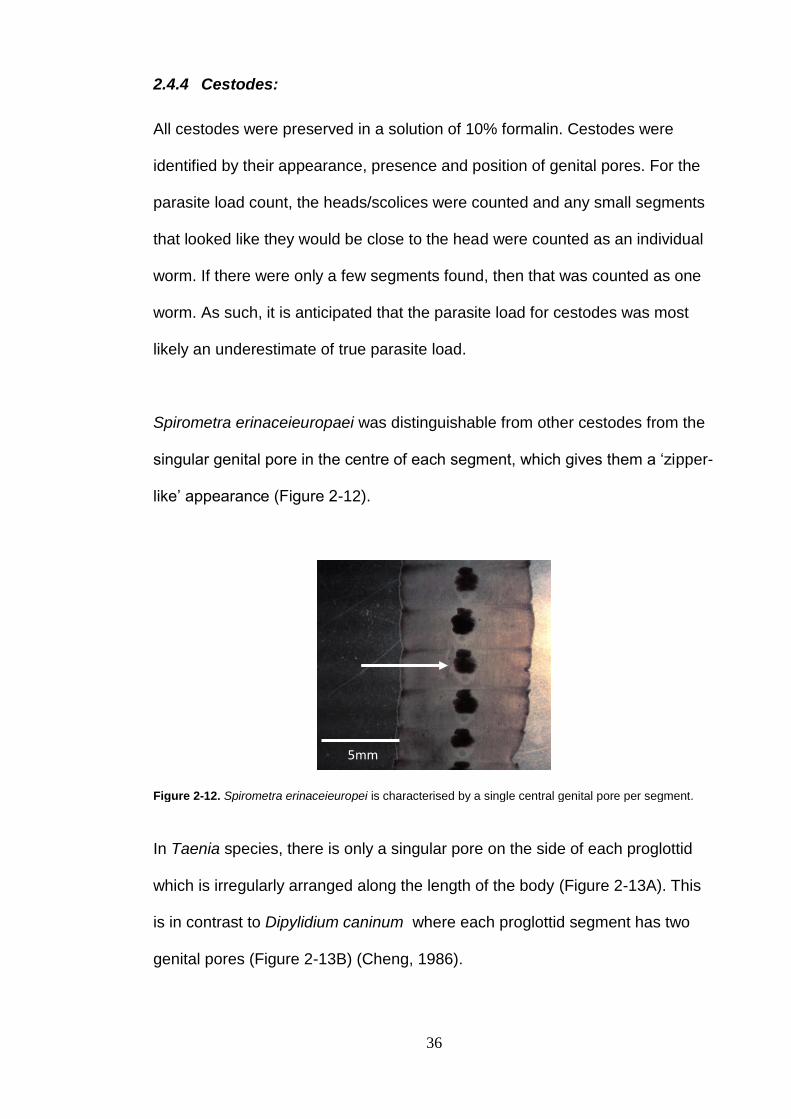
Spirometra erinaceieuropaei was distinguishable from other cestodes from the
singular genital pore in the centre of each segment, which gives them a ‘zipper-
like’ appearance (Figure 2-12).
5mm
Figure 2-12. Spirometra erinaceieuropei is characterised by a single central genital pore per segment.
In Taenia species, there is only a singular pore on the side of each proglottid
which is irregularly arranged along the length of the body (Figure 2-13A). This
is in contrast to Dipylidium caninum where each proglottid segment has two
genital pores (Figure 2-13B) (Cheng, 1986).
37
B A
5mm
Figure 2-13. a) Taenia spp. showing single pores per segment and irregularly arranged b) Dipylidium caninum showing two genital pores per segment.
To differentiate between species of Taenia, hook squashes were conducted on
each sample and Taenia species classified according to Beveridge and
Gregory, (1976). Hook squashes consisted of the scolex being cut off the worm
carefully and slowly squashed onto a slide with the cover piece (Figure 2-14).
This was then examined under the dissecting microscope (at 400x objective)
and hooks were measured with an eyepiece graticule.
Figure 2-14. A hook squash of T. taeniaeformis from a cat, arrow indicates large rostellum hooks that
were measured. * indicates where the measurements were taken from.
38
If there were multiple worms from a host ,then each worm was examined in this
manner. This method allowed the separation of Taenia into possible species.
2.4.5 Artefact from food
Any worms that were not readily identifiable as typical red fox or feral cat
parasites and had only 1 or 2 worms present were counted as artefact
originating from food items. These were not counted in the statistical analysis.
These parasites were identified using Schmidt and Roberts (1985). Other
roundworms and tapeworms were found but were too degraded to identify.
2.5 Molecular techniques
For cats, there was little doubt as to the identification of Taenia species as it is
typically only a single species that commonly occurs in cats (Taenia
taeniaeformis). However for foxes, a number of possible species meant that
identification based on morphology required confirmation. Molecular techniques
were employed with the aim of confirming the identification of each Taenia
species by sequencing following the optimisation of amplification of target
sequences by PCR. However, time constraints meant that the final sequencing
step could not be finalised prior to thesis completion.
2.5.1 DNA extraction
DNA extractions were performed on all the fox Taenia samples and a number
of cat T. taeniaeformis samples. Due to preservation of the samples, (10%
formalin) taeniids were washed with PBS solution to remove the fixative as per
39
the instructions in the Qiagen DNeasy blood and tissue kit (2006). DNA of the
samples was isolated from the parasites using the materials from the
commercial kit as per the protocol from the manufacturer. The DNA
concentration was measured using a nano drop and then diluted down to a
50ng/µl concentration and stored at -20oC until the PCR reaction was
performed.
2.5.2 Primer design
Published PCR primers for Taenia species from the 12S mitochondrial gene
were used (Forward primer, T60F, was derived from Dinkel et al (1998) and the
reverse primer, ITMTR2, derived from Rodriguez-hidalgo et al (2002). T60F
was used as the forward primer for the modified version of the published
reverse primer; (ITMTR2-mod) and was designed by aligning the conserved
regions of the 12S gene of sequences of eight different Taenia species using
the program Geneious 5.0 (Drummond et al., 2010). Sequences of the 12S
gene of Taenia species were obtained from Genbank (Table 2-3). These were
then made into a consensus sequence and the primer was modified (Table 2-
4).
40
Table 2-3. Accession numbers of Taenia species sequences sourced from Genbank.
Taenia species Accession number
Taenia crassiceps (complete MG) NC-002547 T. hydatigena (complete MG) NC-012896 T. pisiformis (complete MG) NC-013844 T. saginata (complete MG) NC-009938 T. solium (complete MG) NC-004022 T. ovis from Switzerland DQ 408421 T. serialis isolate 1 DQ 104236 T. serialis isolate 2 DQ 104240 T. serialis isolate 3 DQ 104238 T. serialis isolate 4 DQ 104234 T. serialis isolate 5 DQ 104235 T. serialis isolate 6 DQ 104237 T. serialis isolate 7 DQ 104239 T. serialis isolate 8 EU 219546 T. taeniaeformis mitochondrial gene TAEMTZA T. taeniaeformis mito gene for 12S rRNA TAEMTZB T. taeniaeformis isolate 1 ABO27134 T. taeniaeformis isolate 2 EU 219556 T. taeniaeformis isolate 3 EU 219548 T. taeniaeformis isolate 4 EU 219537 T. taeniaeformis isolate 5 EU 219549 T. taeniaeformis isolate 6 EU 219553 T. taeniaeformis isolate 7 EU 219550 T. taeniaeformis isolate 8 EU 219552 T. taeniaeformis isolate 9 EU 219557 T. taeniaeformis isolate 10 EU 219554 T. taeniaeformis isolate 11 EU 219555 T. taeniaeformis isolate 12 EU 219551
Table 2-4. Published primer sequences and modified reverse primer sequence.
Primer name Sequence
T60F TTA AGA TAT ATG TGG TAC AGG ATT AGA TAC CC
ITMTR2 TGA CGG GCG GTG TCT ACA TGA GTT A
ITMTR2-mod TGA CGG GCG GTG TST ACM TGA GYT AAA C
Another eight sets of primers were designed using these aligned sequences
(Table 2-5). These primers spanning from in the COX gene to the 12S region of
the chromosome.
41
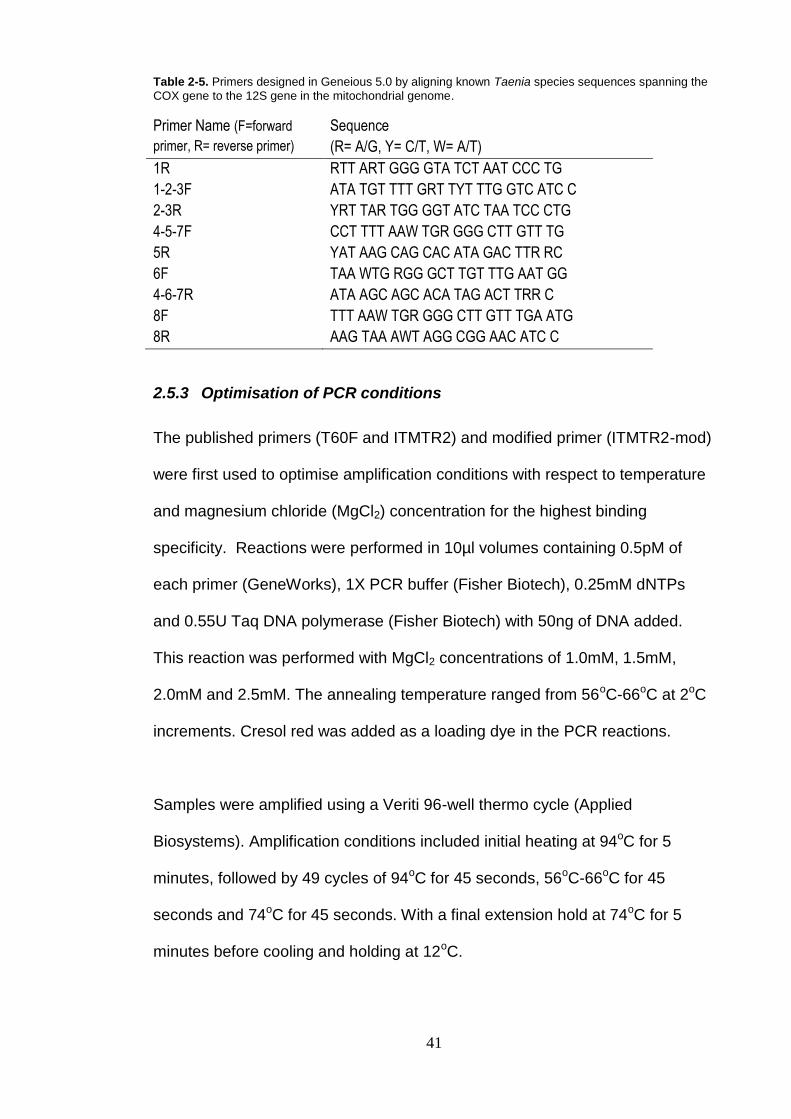
Table 2-5. Primers designed in Geneious 5.0 by aligning known Taenia species sequences spanning the
COX gene to the 12S gene in the mitochondrial genome.
Primer Name (F=forward
primer, R= reverse primer)
Sequence
(R= A/G, Y= C/T, W= A/T)
1R RTT ART GGG GTA TCT AAT CCC TG
1-2-3F ATA TGT TTT GRT TYT TTG GTC ATC C
2-3R YRT TAR TGG GGT ATC TAA TCC CTG
4-5-7F CCT TTT AAW TGR GGG CTT GTT TG
5R YAT AAG CAG CAC ATA GAC TTR RC
6F TAA WTG RGG GCT TGT TTG AAT GG
4-6-7R ATA AGC AGC ACA TAG ACT TRR C
8F TTT AAW TGR GGG CTT GTT TGA ATG
8R AAG TAA AWT AGG CGG AAC ATC C
2.5.3 Optimisation of PCR conditions
The published primers (T60F and ITMTR2) and modified primer (ITMTR2-mod)
were first used to optimise amplification conditions with respect to temperature
and magnesium chloride (MgCl2) concentration for the highest binding
specificity. Reactions were performed in 10µl volumes containing 0.5pM of
each primer (GeneWorks), 1X PCR buffer (Fisher Biotech), 0.25mM dNTPs
and 0.55U Taq DNA polymerase (Fisher Biotech) with 50ng of DNA added.
This reaction was performed with MgCl2 concentrations of 1.0mM, 1.5mM,
2.0mM and 2.5mM. The annealing temperature ranged from 56oC-66oC at 2oC
increments. Cresol red was added as a loading dye in the PCR reactions.
Samples were amplified using a Veriti 96-well thermo cycle (Applied
Biosystems). Amplification conditions included initial heating at 94oC for 5
minutes, followed by 49 cycles of 94oC for 45 seconds, 56oC-66oC for 45
seconds and 74oC for 45 seconds. With a final extension hold at 74oC for 5
minutes before cooling and holding at 12oC.
42
The remaining primers (Table 2.5) were also tested. DNA from T. taeniaeformis
sample was used in a 10µl reaction mixture containing 0.5pM of each primer
(GeneWorks), 1X PCR buffer (Fisher Biotech), 0.25mM dNTPs and 0.55U Taq
DNA polymerase (Fisher Biotech) with 50ng of DNA added. Varying
temperatures of a lower range (48oC-58oC, again in 2oC increments) were used
with 1.5mM MgCl2 concentration (as determined by the initial PCR reaction).
2.5.4 Agarose gel electrophoresis
For the initial optimisation reaction (i.e. with published and modified primers) a
2% agarose gel (Progen) was made with 1 x TBE buffer (90mM Tris HCl base,
90 mM Boric acid and 0.5 mM Ethylenediaminetetraacetic acid (EDTA))
solution and prestained with SYBR Safe DNA gel stain (Invitrogen). PCR
products were loaded onto the gel as was a 100bp ladder (Promega).
Electrophoresis was conducted at 80V for 60 minutes (BioRad Power Pac
3000) and gels visualised using a UV light transilluminator (Bio Rad Gel Doc
3000). Electrophoresis of the second optimisation reaction with the newly
designed primers was performed as described above but on a 1.5% agarose
gel and run at 80V for 30 minutes.
2.6 Statistical analyses
All analyses were performed using Statistica Version 9. Multiple regression
analysis was performed with presence/absence of parasites as the dependent
variable and independent variables (as mentioned in Section 2.2) being
environmental factors such as % remnant vegetation (30km radius), average
relative humidity for previous 6 months from collection date, 5 year average
43
annual rainfall, average rainfall for the previous 6 months, 5 year average mean
temperature, 5 year average minimum temperature, 5 year average maximum
temperature and individual factors including carcass mass (minus stomach
contents), sex, head/body length, pes length and age (age of foxes was
calculated by tooth cementum layers but not available for cat). Multiple
regression analyses were performed to identify those factors that significantly
affected parasite presence. In using multiple regression analysis, a 5:10 ratio
can be used to decide the number of variables that are able to be used for a
given sample size and still allow significance. For example for a sample size of
150 individuals, a maximum of 15 variables should be used for the analysis to
remain valid.
Correlation between the presence of each parasite species was examined
using a correlation matrix in Microsoft Excel, based on presence/absence data
for each individual fox examined. Only parasites that were present in at least 3
foxes or cats were included in the analysis.
Multiple regression analysis was also used to determine whether the
prevalence of selected helminth species affected the body condition of the host.
To investigate this, body mass (kg) of each individual host animal was used as
the dependent variable. To take into account allometric relationships, three
measures of body size were included in the analysis: head length (cm),
head/body length (cm), pes length (cm). The inclusion of body size measures
in the analysis allows all measures of allometric change to be accounted for
and does not require that a single measure will take into account all aspects of
change in body size (Green, 2001). The age (years) and sex of the host were
44
also included in the analyses, since the relationship between body mass and
body size is statistically different for males and females (p<0.005). They have a
common slope but the intercept is different. Location of sample collection was
included as a random factor. Five helminth species, each demonstrating a
prevalence of > 4%, were included in the analysis (Dipylidium caninum,
Spirometra erinaceieuropaei, Toxocara canis, Toxascaris leonina, and
Uncinaria stenocephala).
Multiple regression analysis was also performed to examine the significant
effect infracommunity richness had on body mass (measure of body condition).
The same measures were used as in the above analysis but instead of parasite
load, species richness was used as an independent factor.
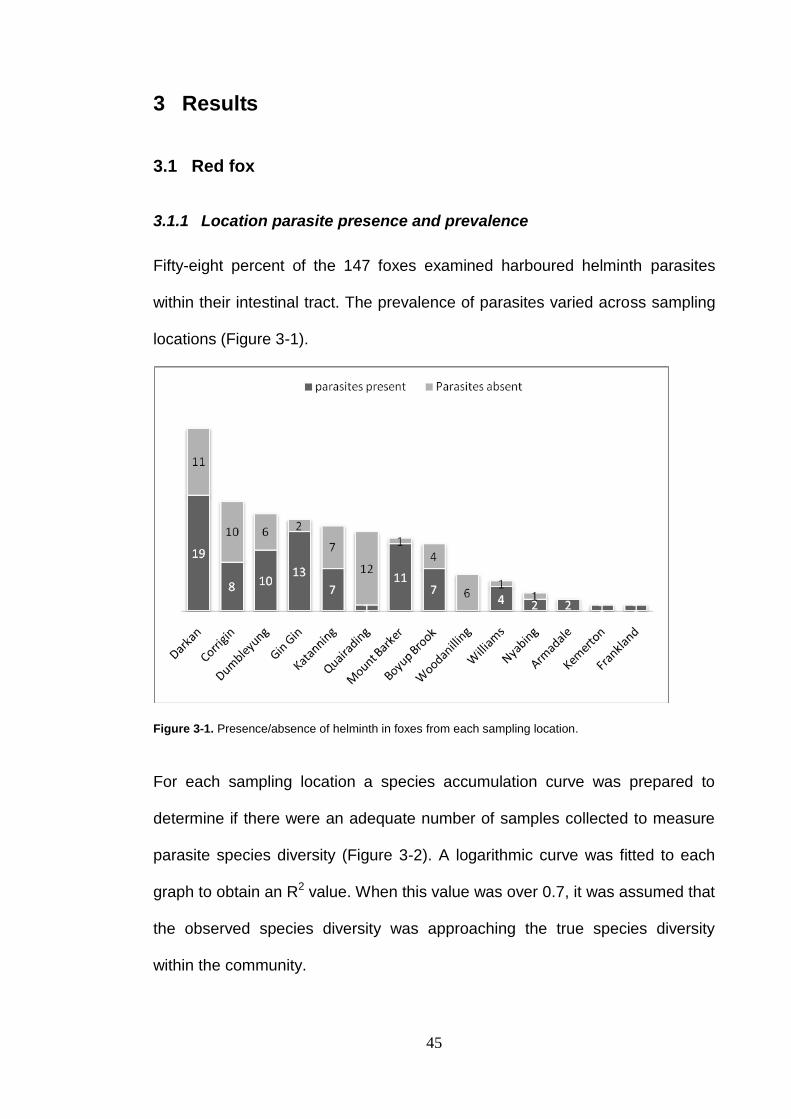
45
3 Results
3.1 Red fox
3.1.1 Location parasite presence and prevalence
Fifty-eight percent of the 147 foxes examined harboured helminth parasites
within their intestinal tract. The prevalence of parasites varied across sampling
locations (Figure 3-1).
Figure 3-1. Presence/absence of helminth in foxes from each sampling location.
For each sampling location a species accumulation curve was prepared to
determine if there were an adequate number of samples collected to measure
parasite species diversity (Figure 3-2). A logarithmic curve was fitted to each
graph to obtain an R2 value. When this value was over 0.7, it was assumed that
the observed species diversity was approaching the true species diversity
within the community.
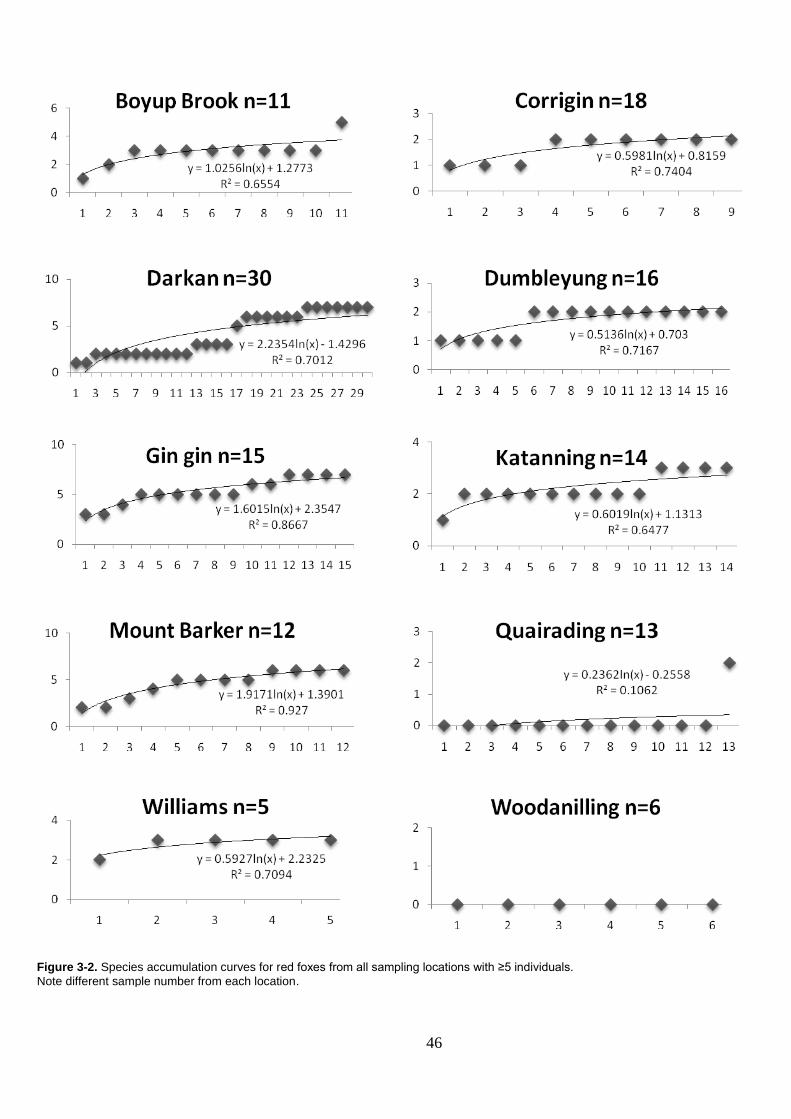
46
Figure 3-2. Species accumulation curves for red foxes from all sampling locations with ≥5 individuals.
Note different sample number from each location.
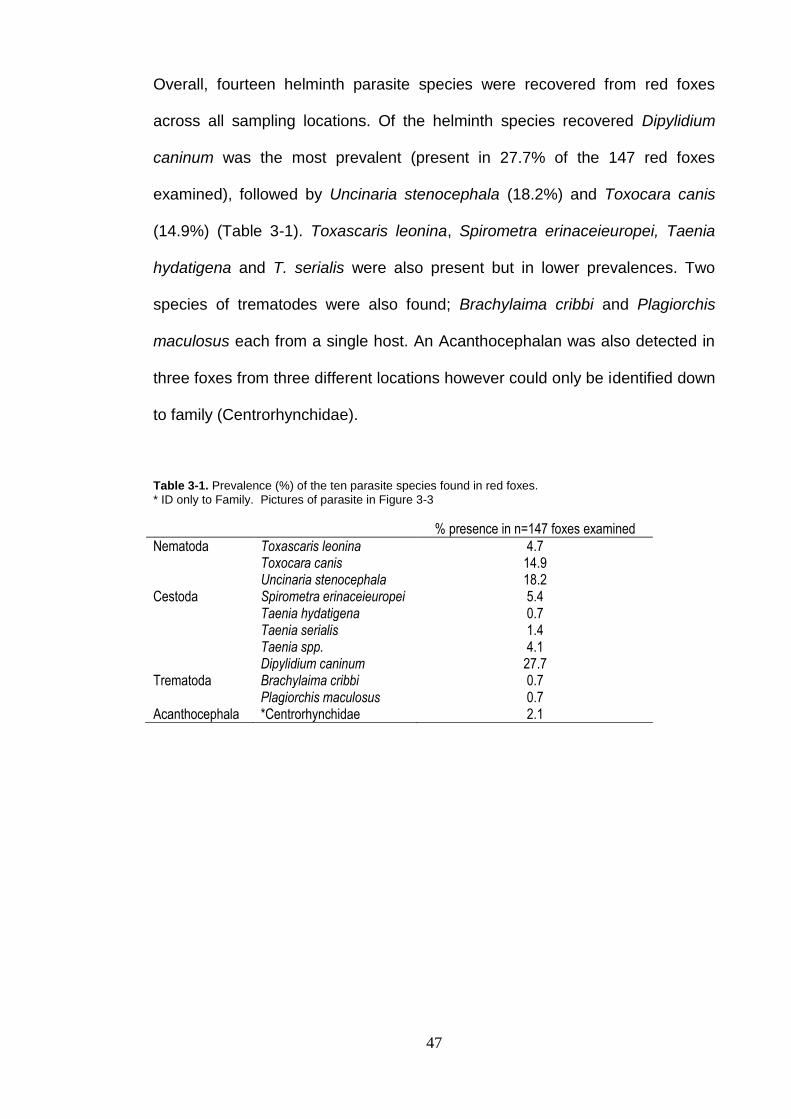
47
Overall, fourteen helminth parasite species were recovered from red foxes
across all sampling locations. Of the helminth species recovered Dipylidium
caninum was the most prevalent (present in 27.7% of the 147 red foxes
examined), followed by Uncinaria stenocephala (18.2%) and Toxocara canis
(14.9%) (Table 3-1). Toxascaris leonina, Spirometra erinaceieuropei, Taenia
hydatigena and T. serialis were also present but in lower prevalences. Two
species of trematodes were also found; Brachylaima cribbi and Plagiorchis
maculosus each from a single host. An Acanthocephalan was also detected in
three foxes from three different locations however could only be identified down
to family (Centrorhynchidae).
Table 3-1. Prevalence (%) of the ten parasite species found in red foxes.
* ID only to Family. Pictures of parasite in Figure 3-3
% presence in n=147 foxes examined
Nematoda Toxascaris leonina 4.7 Toxocara canis 14.9 Uncinaria stenocephala 18.2 Cestoda Spirometra erinaceieuropei 5.4 Taenia hydatigena 0.7 Taenia serialis 1.4 Taenia spp. 4.1 Dipylidium caninum 27.7 Trematoda Brachylaima cribbi 0.7 Plagiorchis maculosus 0.7 Acanthocephala *Centrorhynchidae 2.1
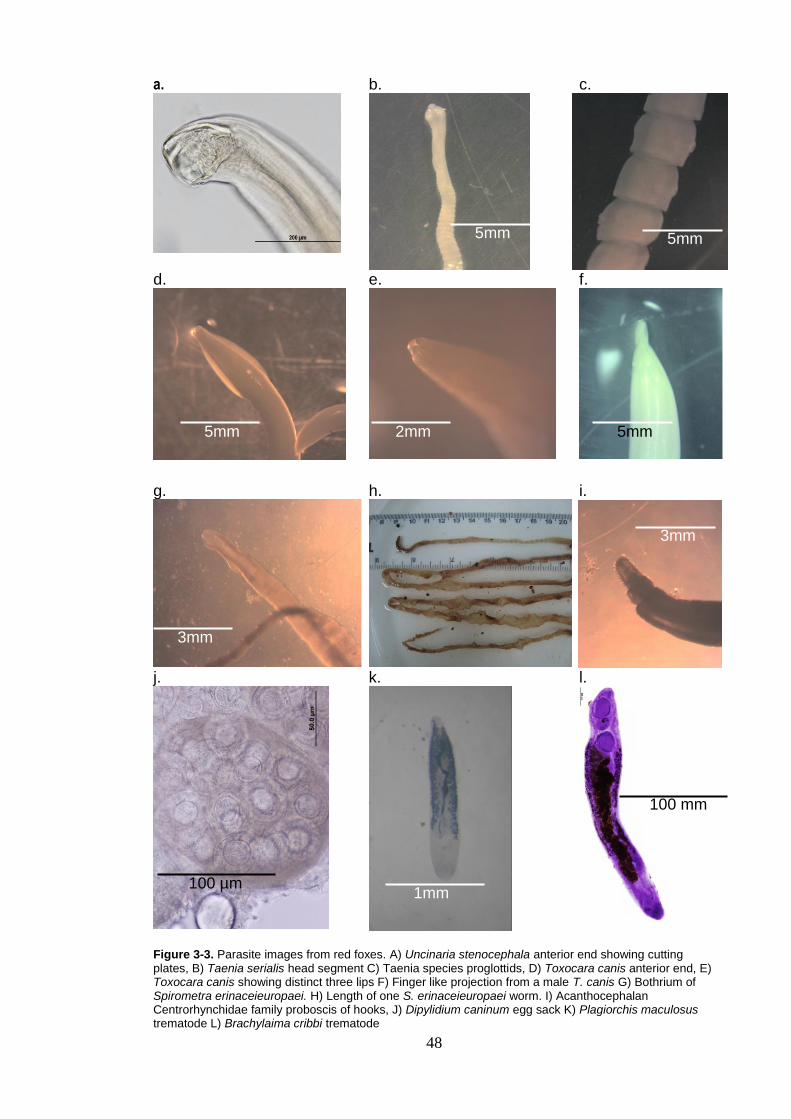
48
a.
b.
c.
d.
e.
f.
g.
h.
i.
j.
k.
l.
Figure 3-3. Parasite images from red foxes. A) Uncinaria stenocephala anterior end showing cutting plates, B) Taenia serialis head segment C) Taenia species proglottids, D) Toxocara canis anterior end, E) Toxocara canis showing distinct three lips F) Finger like projection from a male T. canis G) Bothrium of Spirometra erinaceieuropaei. H) Length of one S. erinaceieuropaei worm. I) Acanthocephalan Centrorhynchidae family proboscis of hooks, J) Dipylidium caninum egg sack K) Plagiorchis maculosus trematode L) Brachylaima cribbi trematode
5mm 5mm
5mm 2mm 5mm
3mm
3mm
1mm 100 µm
100 mm
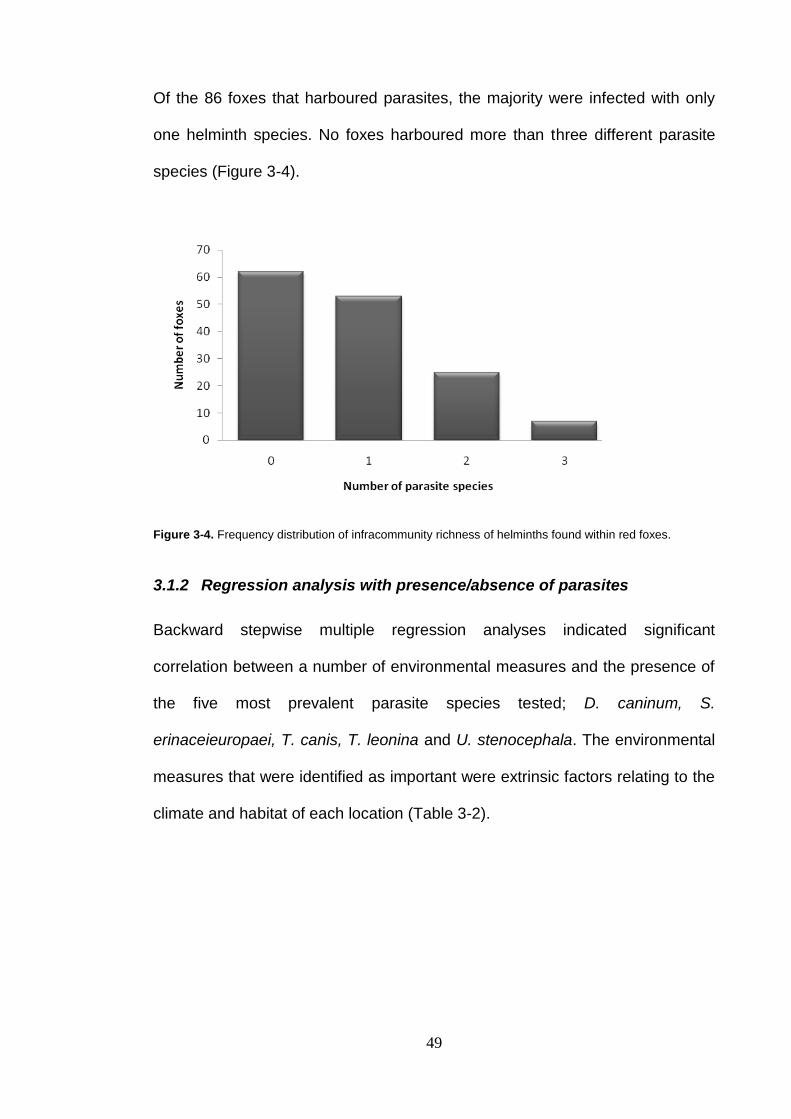
49
Of the 86 foxes that harboured parasites, the majority were infected with only
one helminth species. No foxes harboured more than three different parasite
species (Figure 3-4).
Figure 3-4. Frequency distribution of infracommunity richness of helminths found within red foxes.
3.1.2 Regression analysis with presence/absence of parasites
Backward stepwise multiple regression analyses indicated significant
correlation between a number of environmental measures and the presence of
the five most prevalent parasite species tested; D. caninum, S.
erinaceieuropaei, T. canis, T. leonina and U. stenocephala. The environmental
measures that were identified as important were extrinsic factors relating to the
climate and habitat of each location (Table 3-2).
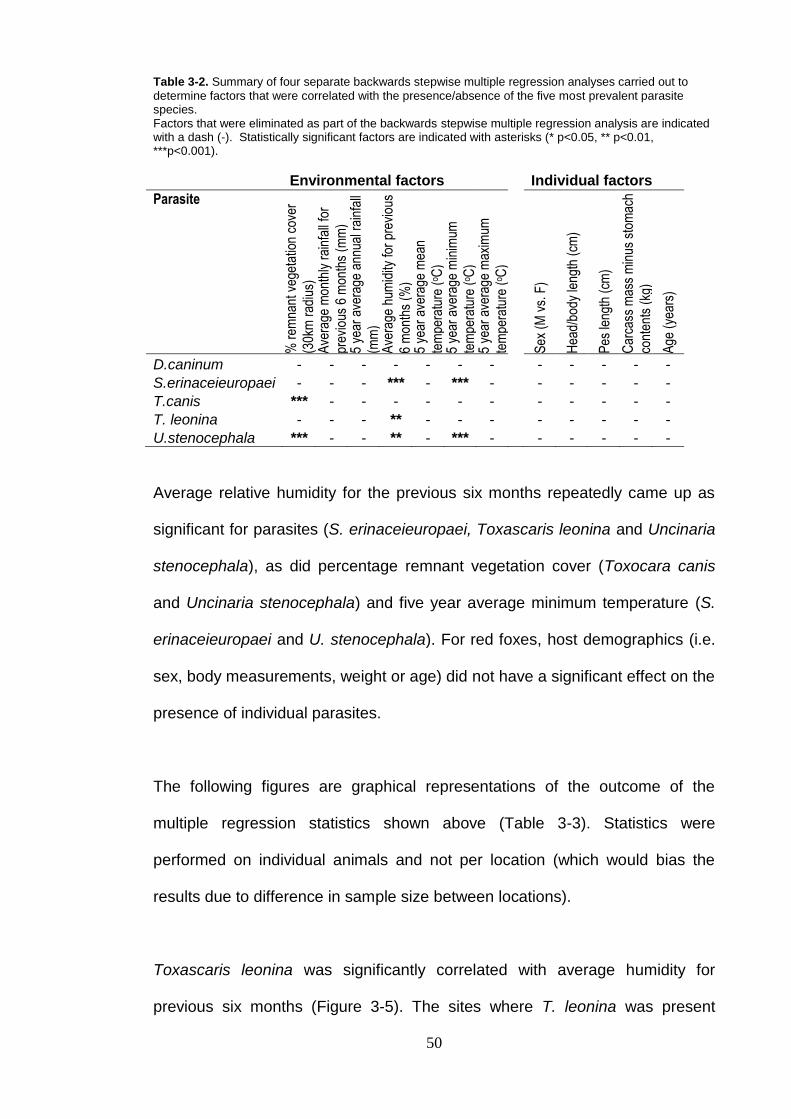
50
Table 3-2. Summary of four separate backwards stepwise multiple regression analyses carried out to
determine factors that were correlated with the presence/absence of the five most prevalent parasite species. Factors that were eliminated as part of the backwards stepwise multiple regression analysis are indicated with a dash (-). Statistically significant factors are indicated with asterisks (* p<0.05, ** p<0.01, ***p<0.001).
Environmental factors Individual factors Parasite
% r
emna
nt v
eget
atio
n co
ver
(30k
m r
adiu
s)
Ave
rage
mon
thly
rai
nfal
l for
prev
ious
6 m
onth
s (m
m)
5 ye
ar a
vera
ge a
nnua
l rai
nfal
l
(mm
) A
vera
ge h
umid
ity fo
r pr
evio
us
6 m
onth
s (%
) 5
year
ave
rage
mea
n
tem
pera
ture
(o C
) 5
year
ave
rage
min
imum
tem
pera
ture
(o C
) 5
year
ave
rage
max
imum
tem
pera
ture
(o C
)
Sex
(M
vs.
F)
Hea
d/bo
dy le
ngth
(cm
)
Pes
leng
th (
cm)
Car
cass
mas
s m
inus
sto
mac
h
cont
ents
(kg
)
Age
(ye
ars)
D.caninum - - - - - - - - - - - - S.erinaceieuropaei - - - *** - *** - - - - - - T.canis *** - - - - - - - - - - - T. leonina - - - ** - - - - - - - - U.stenocephala *** - - ** - *** - - - - - -
Average relative humidity for the previous six months repeatedly came up as
significant for parasites (S. erinaceieuropaei, Toxascaris leonina and Uncinaria
stenocephala), as did percentage remnant vegetation cover (Toxocara canis
and Uncinaria stenocephala) and five year average minimum temperature (S.
erinaceieuropaei and U. stenocephala). For red foxes, host demographics (i.e.
sex, body measurements, weight or age) did not have a significant effect on the
presence of individual parasites.
The following figures are graphical representations of the outcome of the
multiple regression statistics shown above (Table 3-3). Statistics were
performed on individual animals and not per location (which would bias the
results due to difference in sample size between locations).
Toxascaris leonina was significantly correlated with average humidity for
previous six months (Figure 3-5). The sites where T. leonina was present
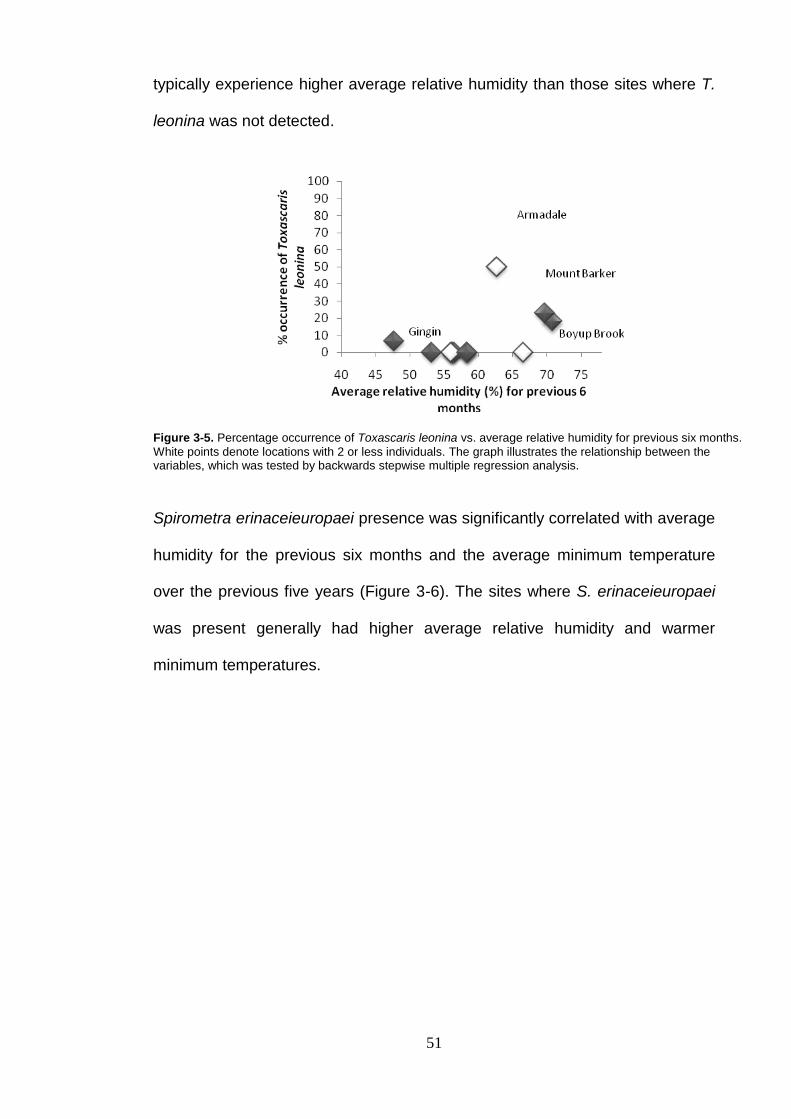
51
typically experience higher average relative humidity than those sites where T.
leonina was not detected.
Figure 3-5. Percentage occurrence of Toxascaris leonina vs. average relative humidity for previous six months.
White points denote locations with 2 or less individuals. The graph illustrates the relationship between the variables, which was tested by backwards stepwise multiple regression analysis.
Spirometra erinaceieuropaei presence was significantly correlated with average
humidity for the previous six months and the average minimum temperature
over the previous five years (Figure 3-6). The sites where S. erinaceieuropaei
was present generally had higher average relative humidity and warmer
minimum temperatures.
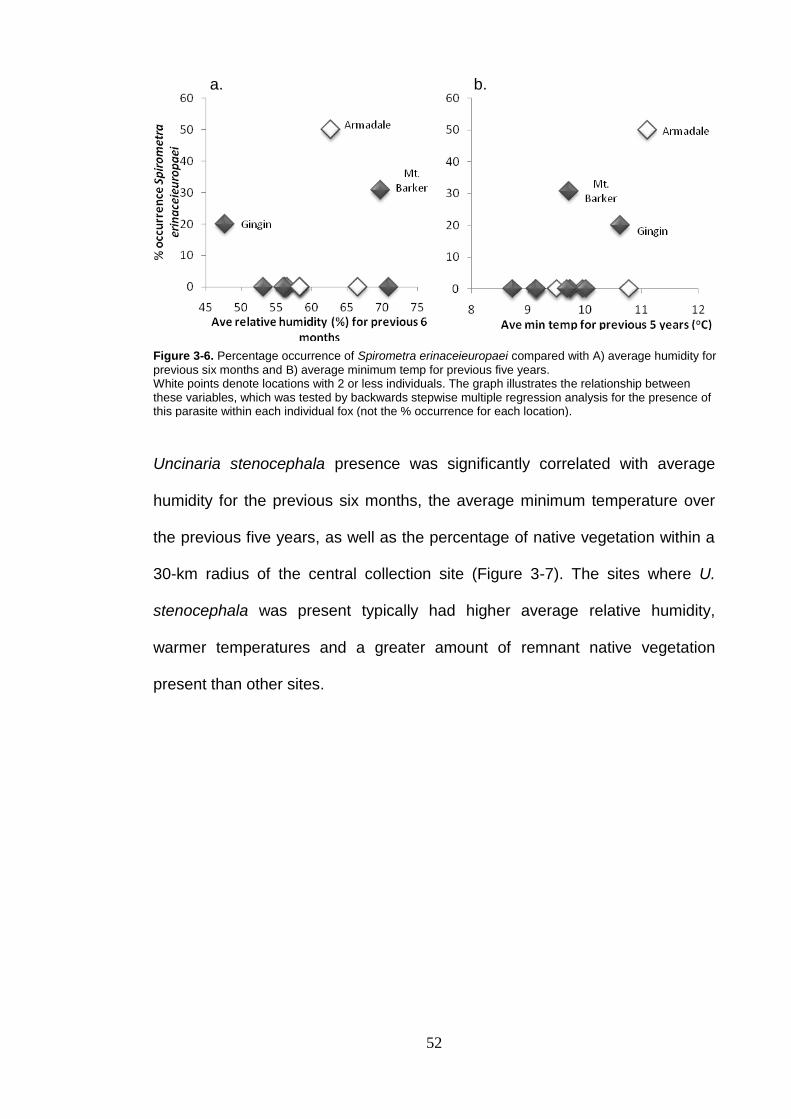
52
a.
b.
Figure 3-6. Percentage occurrence of Spirometra erinaceieuropaei compared with A) average humidity for
previous six months and B) average minimum temp for previous five years. White points denote locations with 2 or less individuals. The graph illustrates the relationship between these variables, which was tested by backwards stepwise multiple regression analysis for the presence of this parasite within each individual fox (not the % occurrence for each location).
Uncinaria stenocephala presence was significantly correlated with average
humidity for the previous six months, the average minimum temperature over
the previous five years, as well as the percentage of native vegetation within a
30-km radius of the central collection site (Figure 3-7). The sites where U.
stenocephala was present typically had higher average relative humidity,
warmer temperatures and a greater amount of remnant native vegetation
present than other sites.
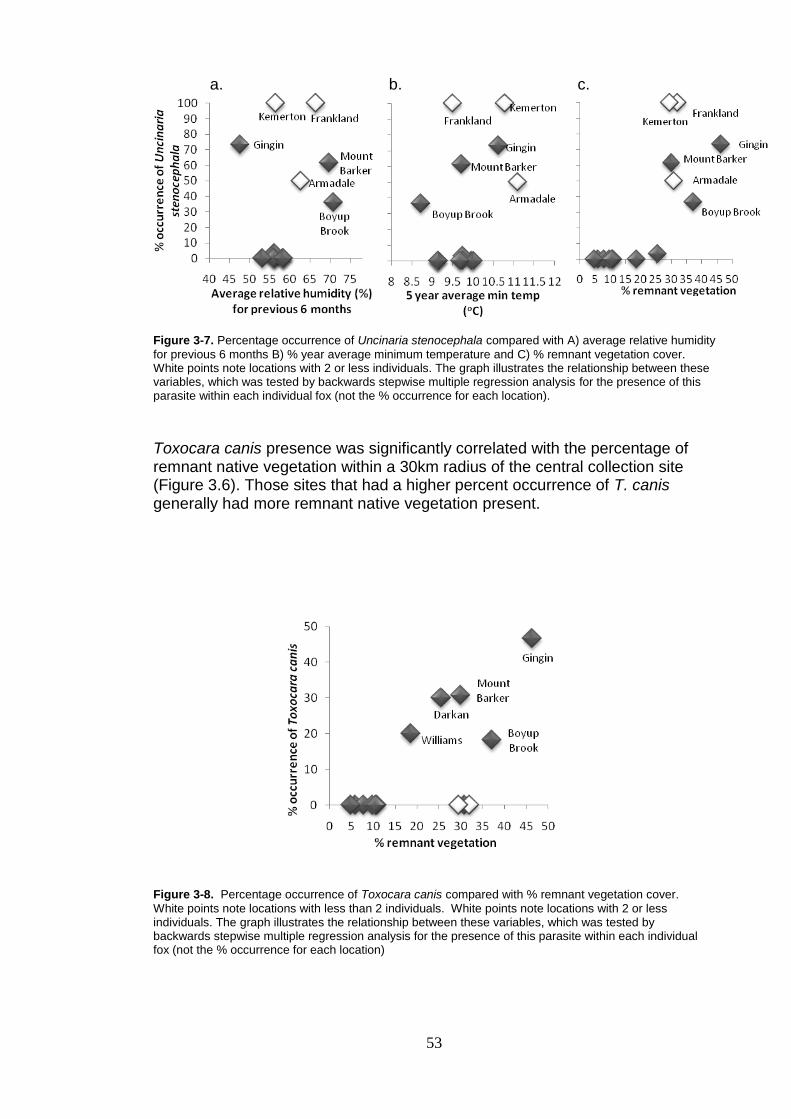
53
a.
b.
c.
Figure 3-7. Percentage occurrence of Uncinaria stenocephala compared with A) average relative humidity
for previous 6 months B) % year average minimum temperature and C) % remnant vegetation cover. White points note locations with 2 or less individuals. The graph illustrates the relationship between these variables, which was tested by backwards stepwise multiple regression analysis for the presence of this parasite within each individual fox (not the % occurrence for each location).
Toxocara canis presence was significantly correlated with the percentage of remnant native vegetation within a 30km radius of the central collection site (Figure 3.6). Those sites that had a higher percent occurrence of T. canis generally had more remnant native vegetation present.
Figure 3-8. Percentage occurrence of Toxocara canis compared with % remnant vegetation cover.
White points note locations with less than 2 individuals. White points note locations with 2 or less individuals. The graph illustrates the relationship between these variables, which was tested by backwards stepwise multiple regression analysis for the presence of this parasite within each individual fox (not the % occurrence for each location)
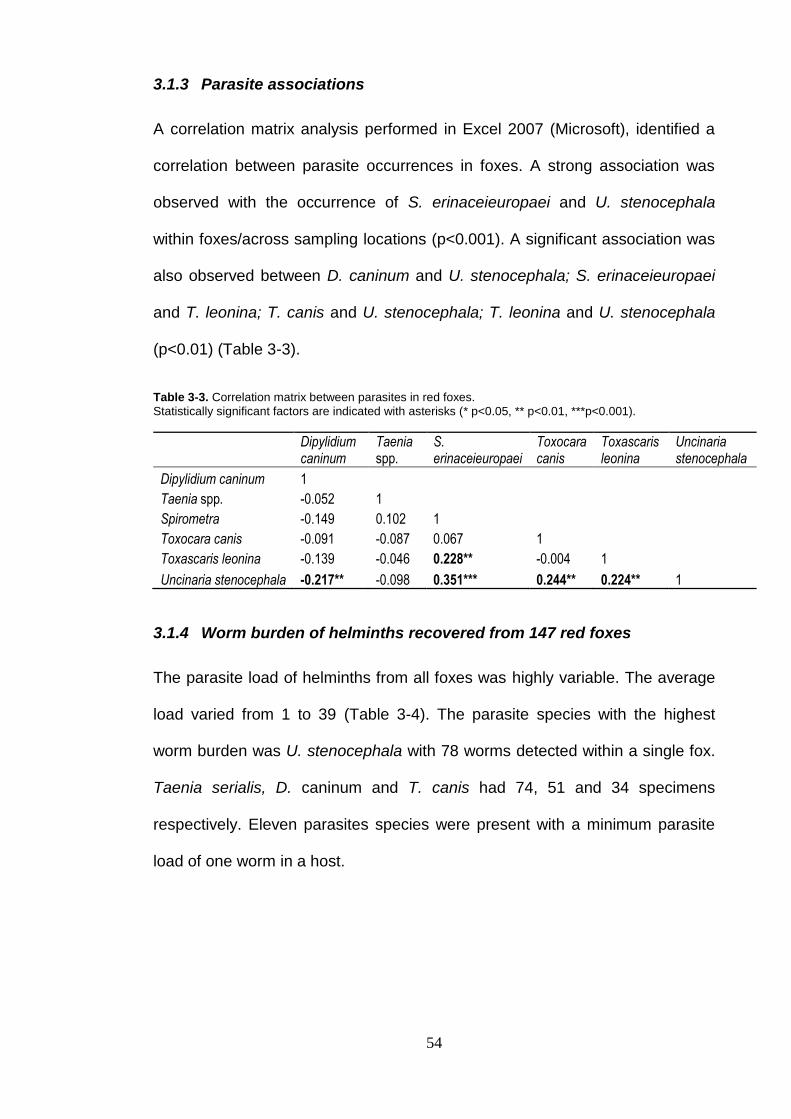
54
3.1.3 Parasite associations
A correlation matrix analysis performed in Excel 2007 (Microsoft), identified a
correlation between parasite occurrences in foxes. A strong association was
observed with the occurrence of S. erinaceieuropaei and U. stenocephala
within foxes/across sampling locations (p<0.001). A significant association was
also observed between D. caninum and U. stenocephala; S. erinaceieuropaei
and T. leonina; T. canis and U. stenocephala; T. leonina and U. stenocephala
(p<0.01) (Table 3-3).
Table 3-3. Correlation matrix between parasites in red foxes.
Statistically significant factors are indicated with asterisks (* p<0.05, ** p<0.01, ***p<0.001).
Dipylidium caninum
Taenia spp.
S. erinaceieuropaei
Toxocara canis
Toxascaris leonina
Uncinaria stenocephala
Dipylidium caninum 1
Taenia spp. -0.052 1
Spirometra -0.149 0.102 1
Toxocara canis -0.091 -0.087 0.067 1
Toxascaris leonina -0.139 -0.046 0.228** -0.004 1
Uncinaria stenocephala -0.217** -0.098 0.351*** 0.244** 0.224** 1
3.1.4 Worm burden of helminths recovered from 147 red foxes
The parasite load of helminths from all foxes was highly variable. The average
load varied from 1 to 39 (Table 3-4). The parasite species with the highest
worm burden was U. stenocephala with 78 worms detected within a single fox.
Taenia serialis, D. caninum and T. canis had 74, 51 and 34 specimens
respectively. Eleven parasites species were present with a minimum parasite
load of one worm in a host.
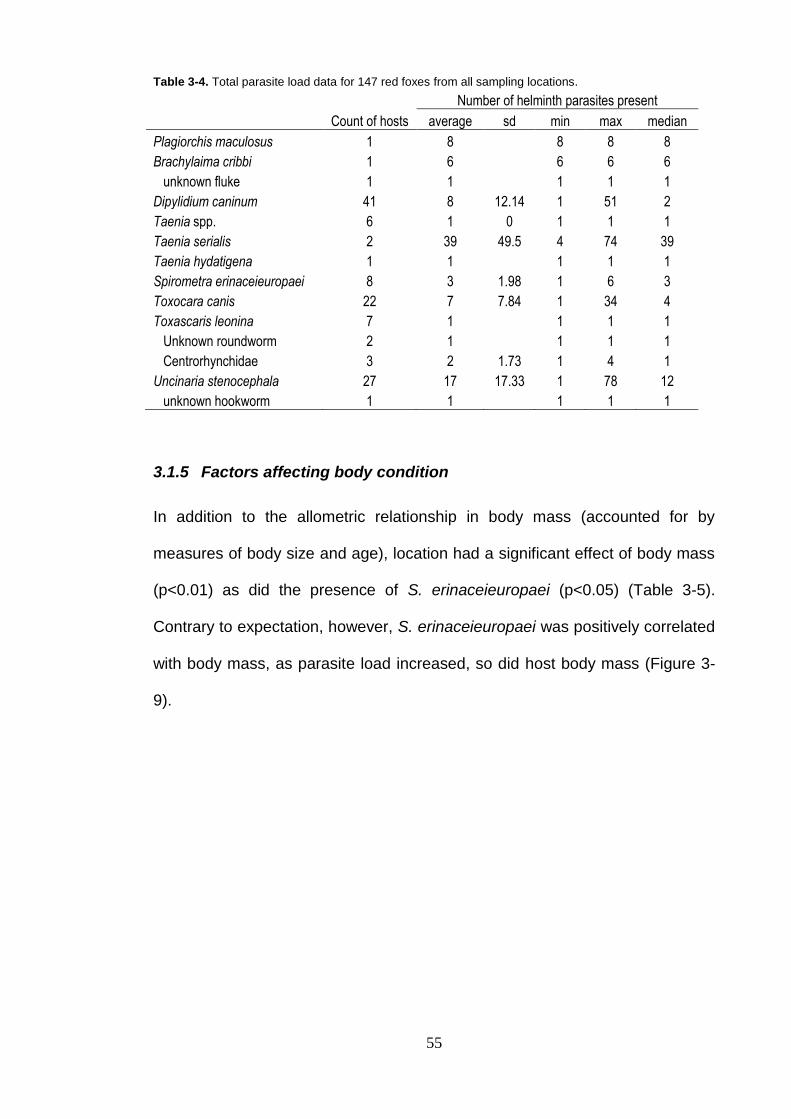
55
Table 3-4. Total parasite load data for 147 red foxes from all sampling locations.
Number of helminth parasites present
Count of hosts average sd min max median
Plagiorchis maculosus 1 8 8 8 8
Brachylaima cribbi 1 6 6 6 6
unknown fluke 1 1 1 1 1
Dipylidium caninum 41 8 12.14 1 51 2
Taenia spp. 6 1 0 1 1 1
Taenia serialis 2 39 49.5 4 74 39
Taenia hydatigena 1 1 1 1 1
Spirometra erinaceieuropaei 8 3 1.98 1 6 3
Toxocara canis 22 7 7.84 1 34 4
Toxascaris leonina 7 1 1 1 1
Unknown roundworm 2 1 1 1 1
Centrorhynchidae 3 2 1.73 1 4 1
Uncinaria stenocephala 27 17 17.33 1 78 12
unknown hookworm 1 1 1 1 1
3.1.5 Factors affecting body condition
In addition to the allometric relationship in body mass (accounted for by
measures of body size and age), location had a significant effect of body mass
(p<0.01) as did the presence of S. erinaceieuropaei (p<0.05) (Table 3-5).
Contrary to expectation, however, S. erinaceieuropaei was positively correlated
with body mass, as parasite load increased, so did host body mass (Figure 3-
9).
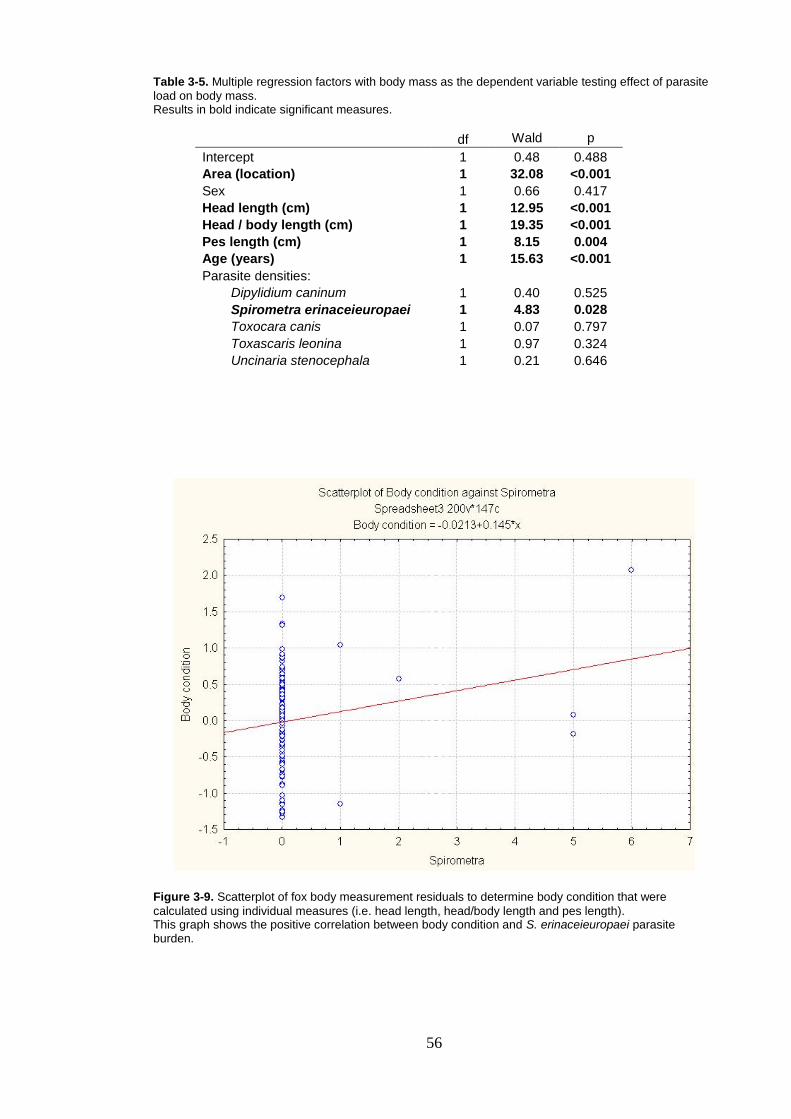
56
Table 3-5. Multiple regression factors with body mass as the dependent variable testing effect of parasite
load on body mass. Results in bold indicate significant measures.
df Wald p
Intercept 1 0.48 0.488
Area (location) 1 32.08 <0.001
Sex 1 0.66 0.417
Head length (cm) 1 12.95 <0.001
Head / body length (cm) 1 19.35 <0.001
Pes length (cm) 1 8.15 0.004
Age (years) 1 15.63 <0.001
Parasite densities:
Dipylidium caninum 1 0.40 0.525
Spirometra erinaceieuropaei 1 4.83 0.028
Toxocara canis 1 0.07 0.797
Toxascaris leonina 1 0.97 0.324
Uncinaria stenocephala 1 0.21 0.646
Figure 3-9. Scatterplot of fox body measurement residuals to determine body condition that were
calculated using individual measures (i.e. head length, head/body length and pes length). This graph shows the positive correlation between body condition and S. erinaceieuropaei parasite burden.
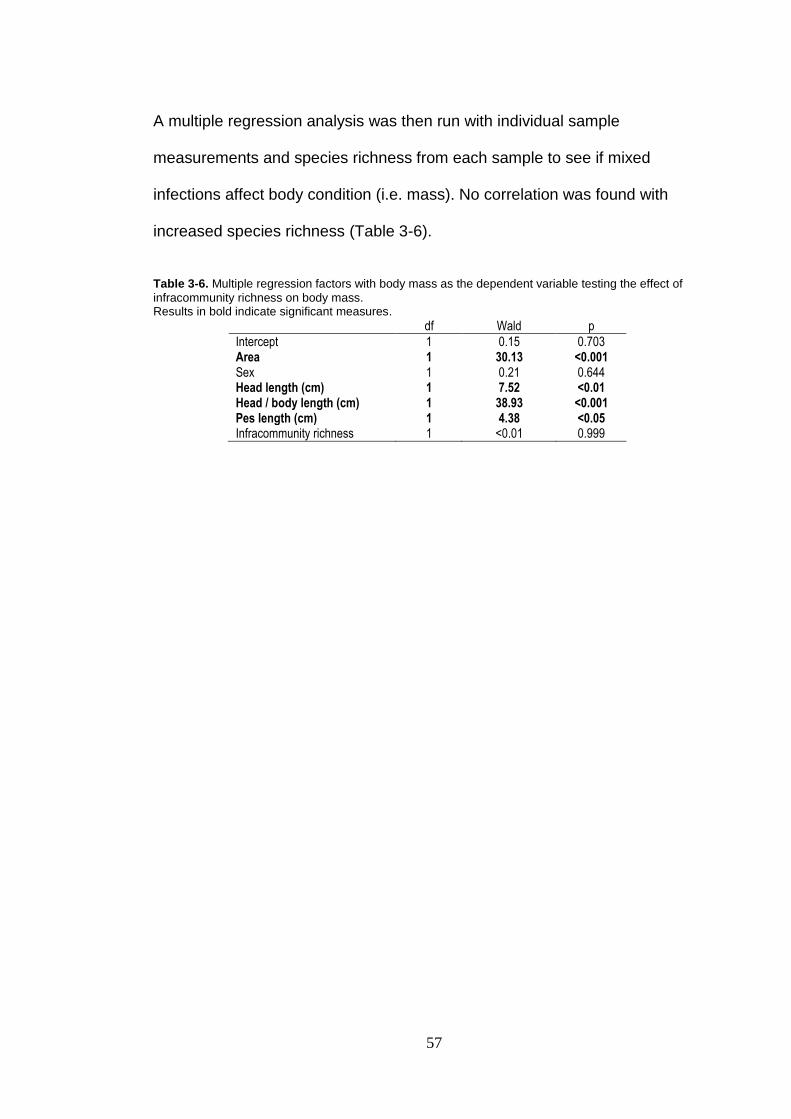
57
A multiple regression analysis was then run with individual sample
measurements and species richness from each sample to see if mixed
infections affect body condition (i.e. mass). No correlation was found with
increased species richness (Table 3-6).
Table 3-6. Multiple regression factors with body mass as the dependent variable testing the effect of
infracommunity richness on body mass. Results in bold indicate significant measures.
df Wald p
Intercept 1 0.15 0.703 Area 1 30.13 <0.001 Sex 1 0.21 0.644 Head length (cm) 1 7.52 <0.01 Head / body length (cm) 1 38.93 <0.001 Pes length (cm) 1 4.38 <0.05 Infracommunity richness 1 <0.01 0.999
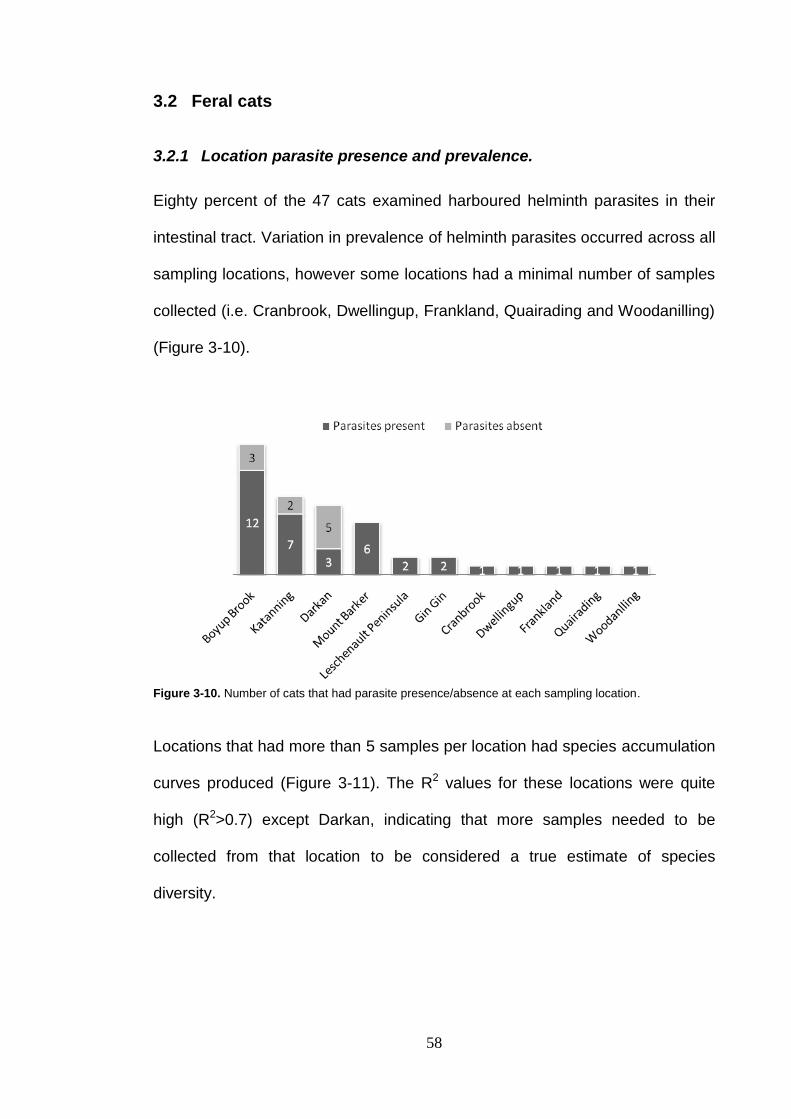
58
3.2 Feral cats
3.2.1 Location parasite presence and prevalence.
Eighty percent of the 47 cats examined harboured helminth parasites in their
intestinal tract. Variation in prevalence of helminth parasites occurred across all
sampling locations, however some locations had a minimal number of samples
collected (i.e. Cranbrook, Dwellingup, Frankland, Quairading and Woodanilling)
(Figure 3-10).
Figure 3-10. Number of cats that had parasite presence/absence at each sampling location.
Locations that had more than 5 samples per location had species accumulation
curves produced (Figure 3-11). The R2 values for these locations were quite
high (R2>0.7) except Darkan, indicating that more samples needed to be
collected from that location to be considered a true estimate of species
diversity.
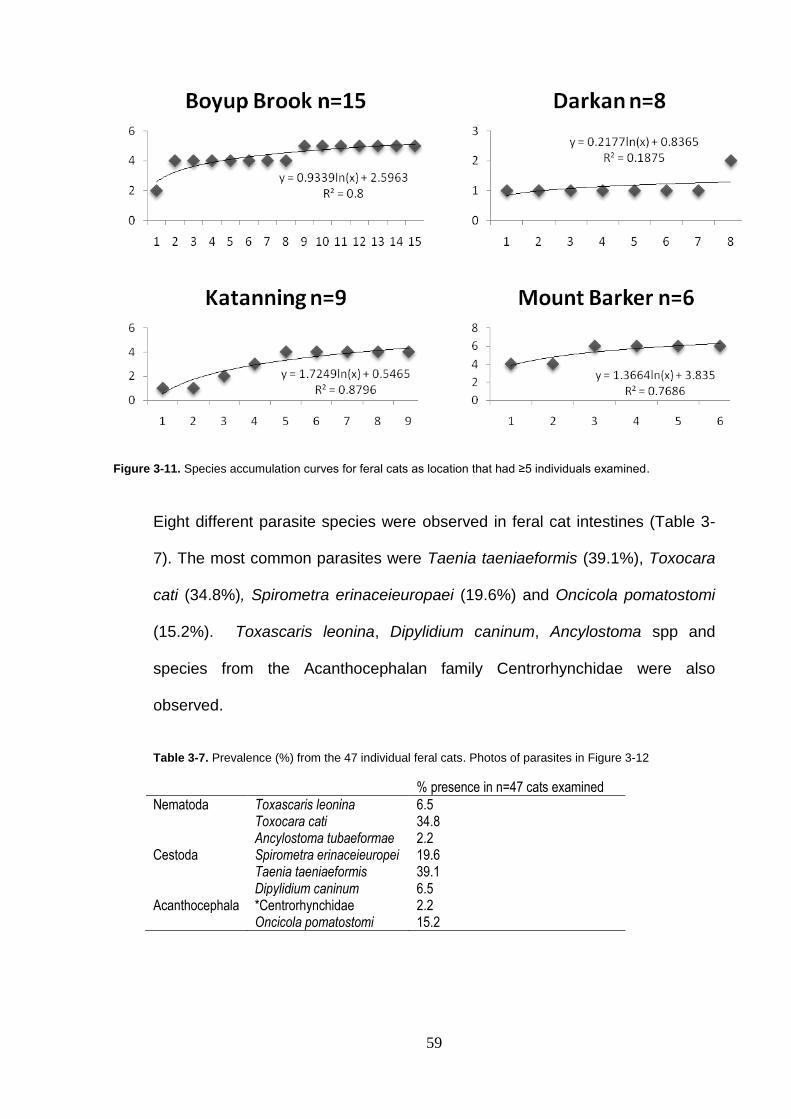
59
Figure 3-11. Species accumulation curves for feral cats as location that had ≥5 individuals examined.
Eight different parasite species were observed in feral cat intestines (Table 3-
7). The most common parasites were Taenia taeniaeformis (39.1%), Toxocara
cati (34.8%), Spirometra erinaceieuropaei (19.6%) and Oncicola pomatostomi
(15.2%). Toxascaris leonina, Dipylidium caninum, Ancylostoma spp and
species from the Acanthocephalan family Centrorhynchidae were also
observed.
Table 3-7. Prevalence (%) from the 47 individual feral cats. Photos of parasites in Figure 3-12
% presence in n=47 cats examined
Nematoda Toxascaris leonina 6.5 Toxocara cati 34.8 Ancylostoma tubaeformae 2.2 Cestoda Spirometra erinaceieuropei 19.6 Taenia taeniaeformis 39.1 Dipylidium caninum 6.5 Acanthocephala *Centrorhynchidae 2.2 Oncicola pomatostomi 15.2
60
3.2.1.1 Artefact from food
Pin worms (Order Oxyurata) were found in two specimens. These were
identified by their common character of a muscular bulb on the posterior end of
the oesophagus. A Trichostrongylid was also found in one cat. This was
identified by the distinctive terminal spike on its anterior end of the female. It
also had an excretory pore near the anterior end. The trichostrongylid was not
able to be identified down to species.
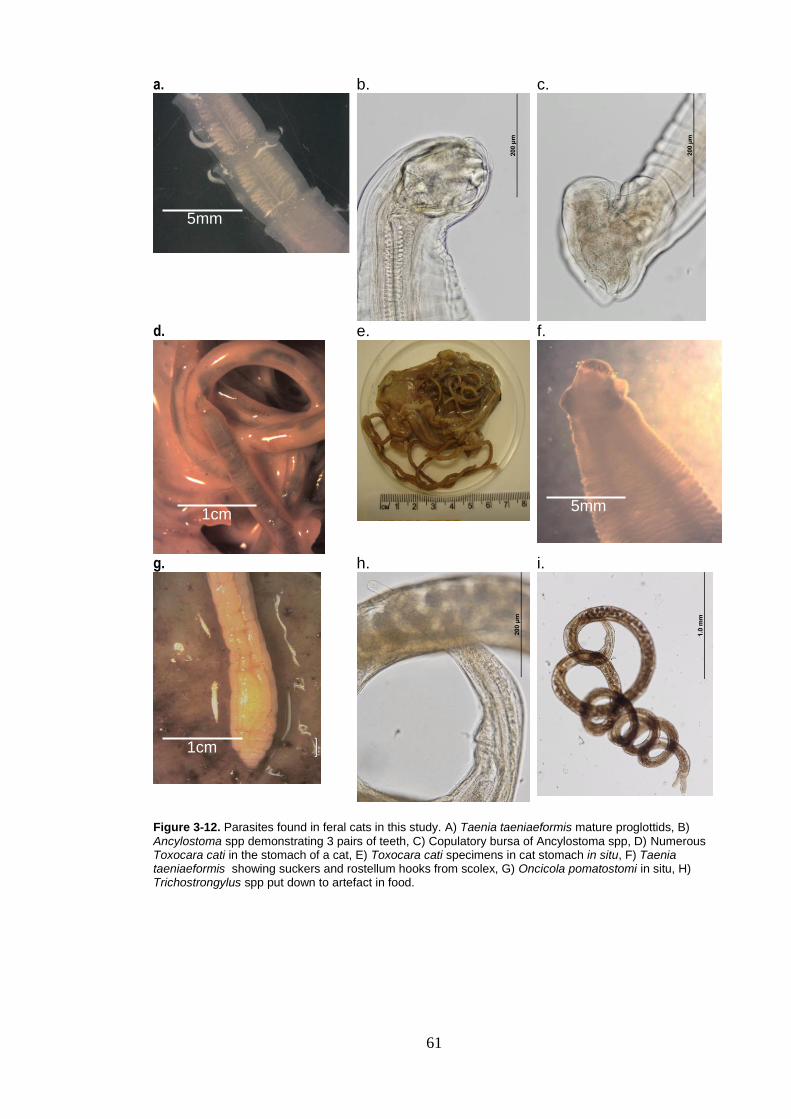
61
a.
b.
c.
d.
e.
f.
g.
h.
i.
Figure 3-12. Parasites found in feral cats in this study. A) Taenia taeniaeformis mature proglottids, B)
Ancylostoma spp demonstrating 3 pairs of teeth, C) Copulatory bursa of Ancylostoma spp, D) Numerous Toxocara cati in the stomach of a cat, E) Toxocara cati specimens in cat stomach in situ, F) Taenia taeniaeformis showing suckers and rostellum hooks from scolex, G) Oncicola pomatostomi in situ, H) Trichostrongylus spp put down to artefact in food.
5mm
1cm 5mm
1cm
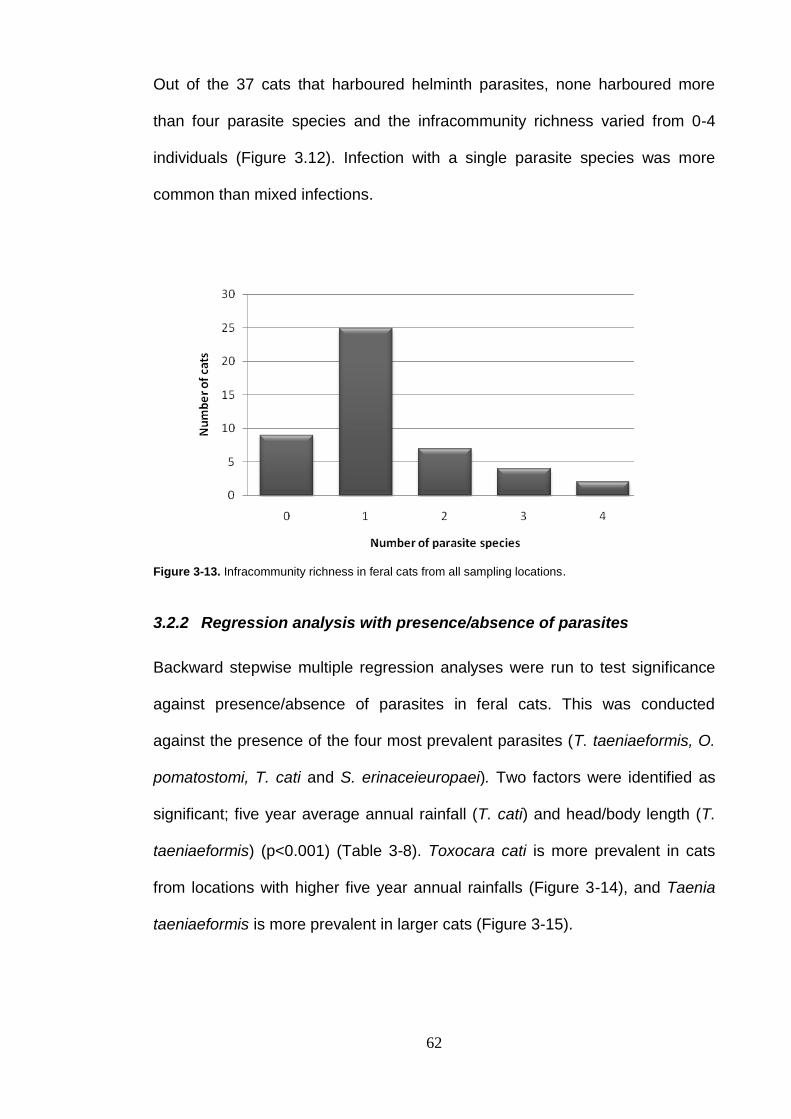
62
Out of the 37 cats that harboured helminth parasites, none harboured more
than four parasite species and the infracommunity richness varied from 0-4
individuals (Figure 3.12). Infection with a single parasite species was more
common than mixed infections.
Figure 3-13. Infracommunity richness in feral cats from all sampling locations.
3.2.2 Regression analysis with presence/absence of parasites
Backward stepwise multiple regression analyses were run to test significance
against presence/absence of parasites in feral cats. This was conducted
against the presence of the four most prevalent parasites (T. taeniaeformis, O.
pomatostomi, T. cati and S. erinaceieuropaei). Two factors were identified as
significant; five year average annual rainfall (T. cati) and head/body length (T.
taeniaeformis) (p<0.001) (Table 3-8). Toxocara cati is more prevalent in cats
from locations with higher five year annual rainfalls (Figure 3-14), and Taenia
taeniaeformis is more prevalent in larger cats (Figure 3-15).
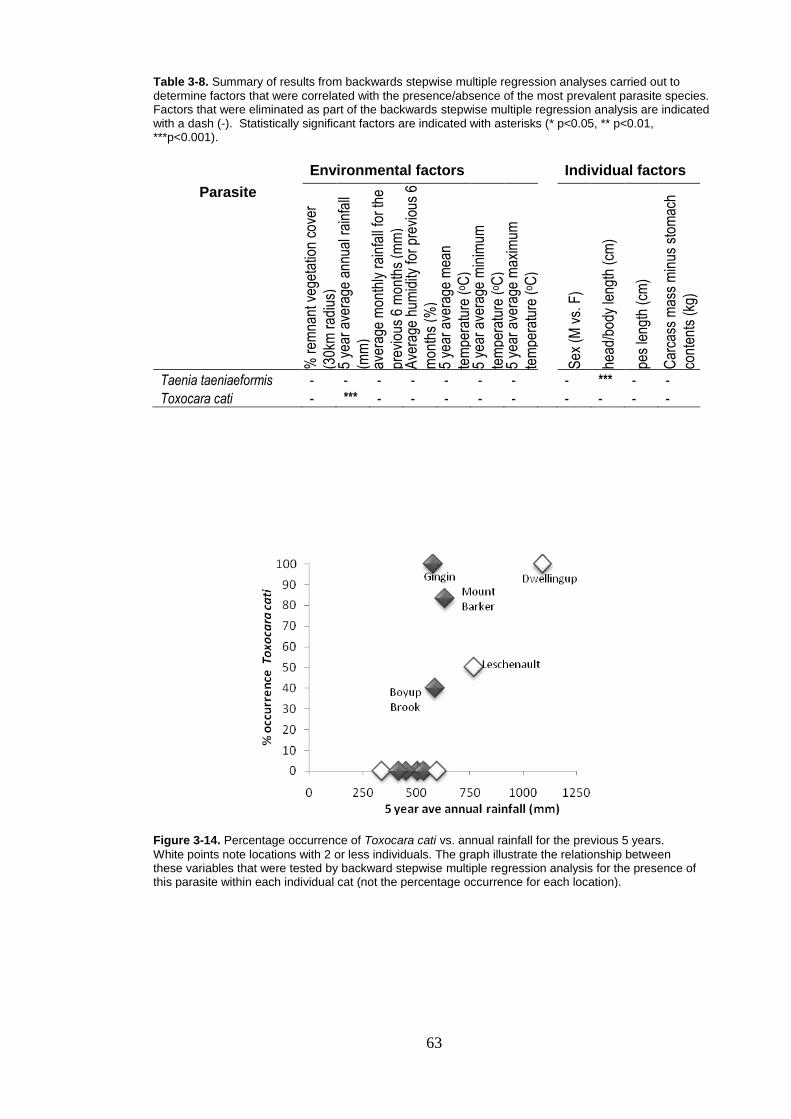
63
Table 3-8. Summary of results from backwards stepwise multiple regression analyses carried out to
determine factors that were correlated with the presence/absence of the most prevalent parasite species. Factors that were eliminated as part of the backwards stepwise multiple regression analysis are indicated with a dash (-). Statistically significant factors are indicated with asterisks (* p<0.05, ** p<0.01, ***p<0.001).
Environmental factors Individual factors
Parasite
% r
emna
nt v
eget
atio
n co
ver
(30k
m r
adiu
s)
5 ye
ar a
vera
ge a
nnua
l rai
nfal
l
(mm
) av
erag
e m
onth
ly r
ainf
all f
or th
e
prev
ious
6 m
onth
s (m
m)
Ave
rage
hum
idity
for
prev
ious
6
mon
ths
(%)
5 ye
ar a
vera
ge m
ean
tem
pera
ture
(o C
) 5
year
ave
rage
min
imum
tem
pera
ture
(o C
) 5
year
ave
rage
max
imum
tem
pera
ture
(o C
)
Sex
(M
vs.
F)
head
/bod
y le
ngth
(cm
)
pes
leng
th (
cm)
Car
cass
mas
s m
inus
sto
mac
h
cont
ents
(kg
)
Taenia taeniaeformis - - - - - - - - *** - - Toxocara cati - *** - - - - - - - - -
Figure 3-14. Percentage occurrence of Toxocara cati vs. annual rainfall for the previous 5 years.
White points note locations with 2 or less individuals. The graph illustrate the relationship between these variables that were tested by backward stepwise multiple regression analysis for the presence of this parasite within each individual cat (not the percentage occurrence for each location).
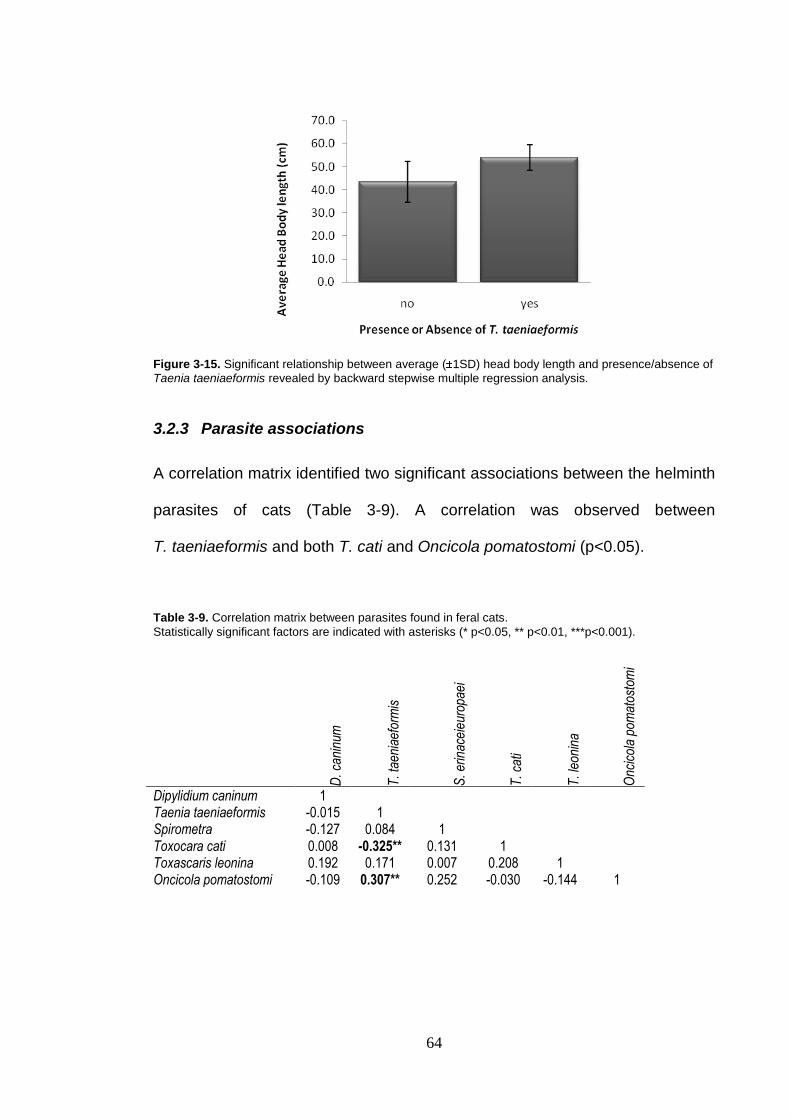
64
Figure 3-15. Significant relationship between average ( 1SD) head body length and presence/absence of
Taenia taeniaeformis revealed by backward stepwise multiple regression analysis.
3.2.3 Parasite associations
A correlation matrix identified two significant associations between the helminth
parasites of cats (Table 3-9). A correlation was observed between
T. taeniaeformis and both T. cati and Oncicola pomatostomi (p<0.05).
Table 3-9. Correlation matrix between parasites found in feral cats.
Statistically significant factors are indicated with asterisks (* p<0.05, ** p<0.01, ***p<0.001).
D. c
anin
um
T. t
aeni
aefo
rmis
S. e
rinac
eieu
ropa
ei
T. c
ati
T. l
eoni
na
Onc
icol
a po
mat
osto
mi
Dipylidium caninum 1 Taenia taeniaeformis -0.015 1 Spirometra -0.127 0.084 1 Toxocara cati 0.008 -0.325** 0.131 1 Toxascaris leonina 0.192 0.171 0.007 0.208 1 Oncicola pomatostomi -0.109 0.307** 0.252 -0.030 -0.144 1
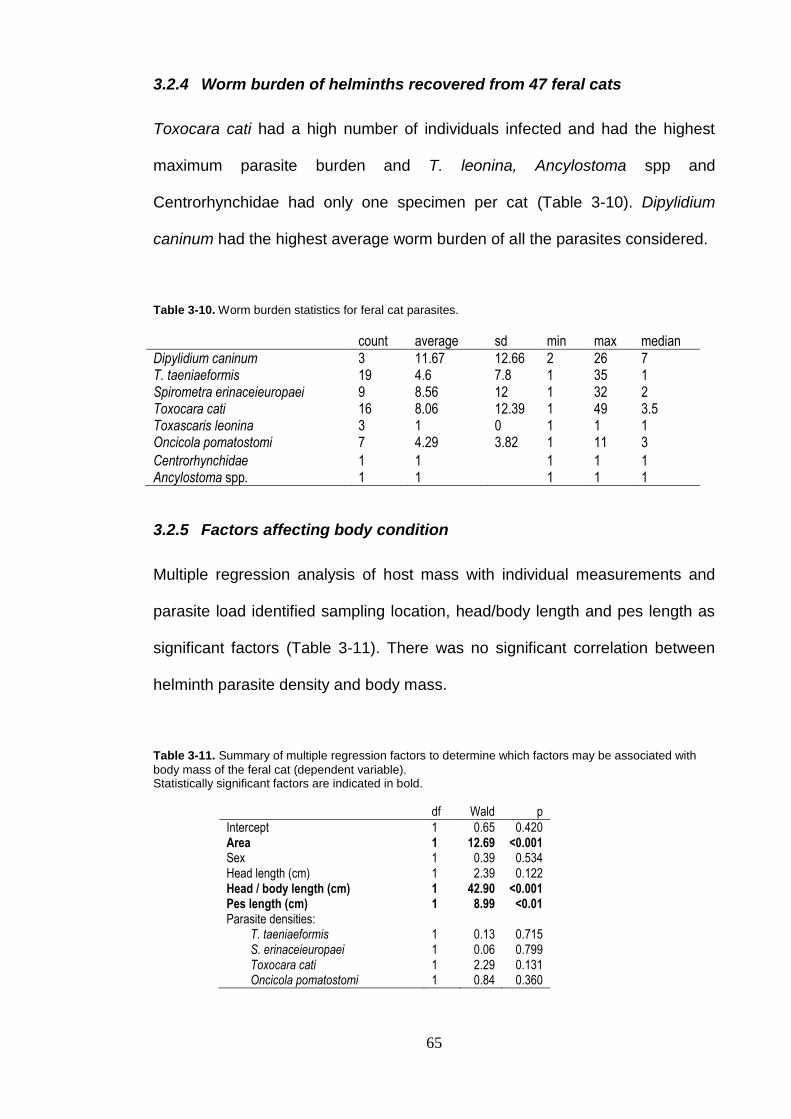
65
3.2.4 Worm burden of helminths recovered from 47 feral cats
Toxocara cati had a high number of individuals infected and had the highest
maximum parasite burden and T. leonina, Ancylostoma spp and
Centrorhynchidae had only one specimen per cat (Table 3-10). Dipylidium
caninum had the highest average worm burden of all the parasites considered.
Table 3-10. Worm burden statistics for feral cat parasites.
count average sd min max median Dipylidium caninum 3 11.67 12.66 2 26 7 T. taeniaeformis 19 4.6 7.8 1 35 1 Spirometra erinaceieuropaei 9 8.56 12 1 32 2 Toxocara cati 16 8.06 12.39 1 49 3.5 Toxascaris leonina 3 1 0 1 1 1 Oncicola pomatostomi 7 4.29 3.82 1 11 3 Centrorhynchidae 1 1 1 1 1 Ancylostoma spp. 1 1 1 1 1
3.2.5 Factors affecting body condition
Multiple regression analysis of host mass with individual measurements and
parasite load identified sampling location, head/body length and pes length as
significant factors (Table 3-11). There was no significant correlation between
helminth parasite density and body mass.
Table 3-11. Summary of multiple regression factors to determine which factors may be associated with
body mass of the feral cat (dependent variable). Statistically significant factors are indicated in bold.
df Wald p
Intercept 1 0.65 0.420 Area 1 12.69 <0.001 Sex 1 0.39 0.534 Head length (cm) 1 2.39 0.122 Head / body length (cm) 1 42.90 <0.001 Pes length (cm) 1 8.99 <0.01 Parasite densities:
T. taeniaeformis 1 0.13 0.715 S. erinaceieuropaei 1 0.06 0.799 Toxocara cati 1 2.29 0.131 Oncicola pomatostomi 1 0.84 0.360
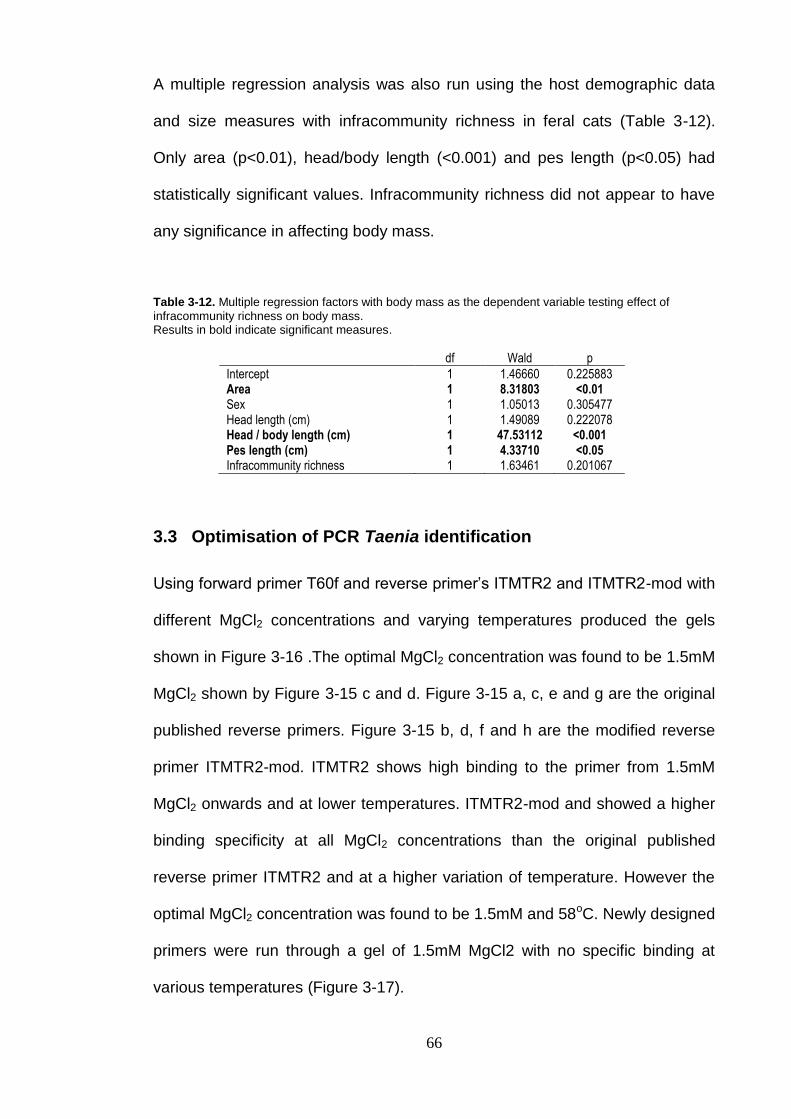
66
A multiple regression analysis was also run using the host demographic data
and size measures with infracommunity richness in feral cats (Table 3-12).
Only area (p<0.01), head/body length (<0.001) and pes length (p<0.05) had
statistically significant values. Infracommunity richness did not appear to have
any significance in affecting body mass.
Table 3-12. Multiple regression factors with body mass as the dependent variable testing effect of
infracommunity richness on body mass. Results in bold indicate significant measures.
df Wald p
Intercept 1 1.46660 0.225883 Area 1 8.31803 <0.01 Sex 1 1.05013 0.305477 Head length (cm) 1 1.49089 0.222078 Head / body length (cm) 1 47.53112 <0.001 Pes length (cm) 1 4.33710 <0.05 Infracommunity richness 1 1.63461 0.201067
3.3 Optimisation of PCR Taenia identification
Using forward primer T60f and reverse primer’s ITMTR2 and ITMTR2-mod with
different MgCl2 concentrations and varying temperatures produced the gels
shown in Figure 3-16 .The optimal MgCl2 concentration was found to be 1.5mM
MgCl2 shown by Figure 3-15 c and d. Figure 3-15 a, c, e and g are the original
published reverse primers. Figure 3-15 b, d, f and h are the modified reverse
primer ITMTR2-mod. ITMTR2 shows high binding to the primer from 1.5mM
MgCl2 onwards and at lower temperatures. ITMTR2-mod and showed a higher
binding specificity at all MgCl2 concentrations than the original published
reverse primer ITMTR2 and at a higher variation of temperature. However the
optimal MgCl2 concentration was found to be 1.5mM and 58oC. Newly designed
primers were run through a gel of 1.5mM MgCl2 with no specific binding at
various temperatures (Figure 3-17).
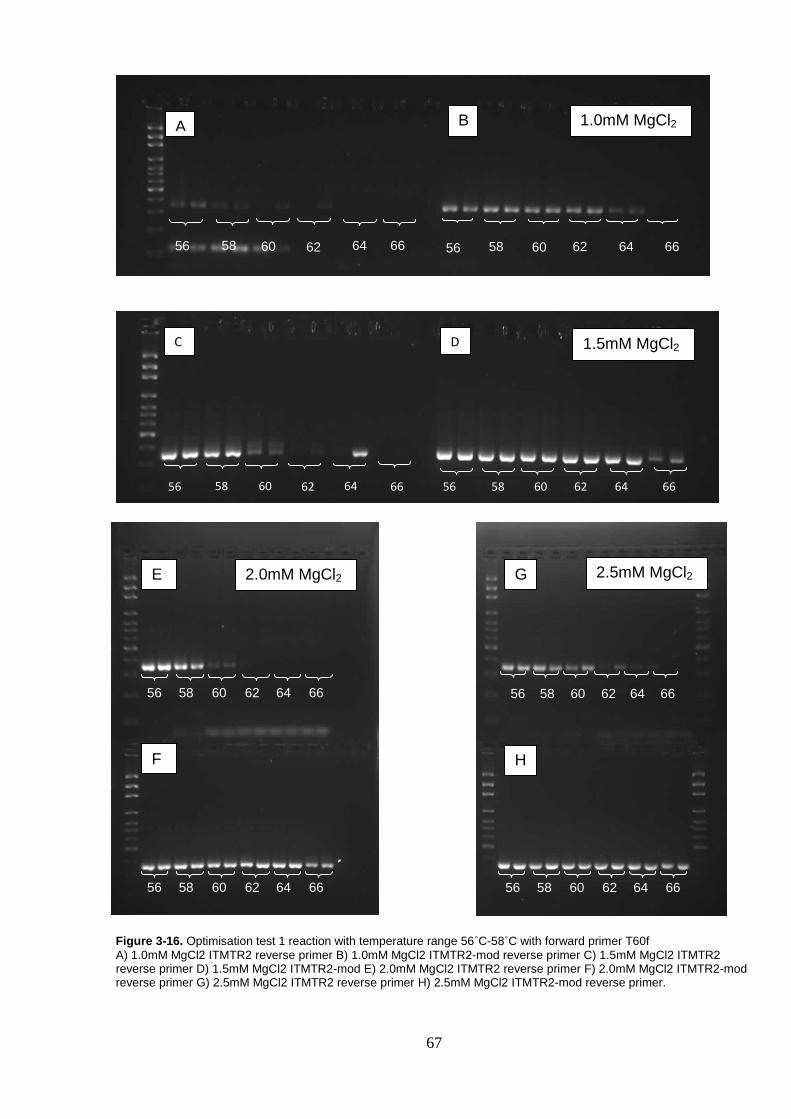
67
56 58 60 62 64 66 56 58 60 62 64 66
C D
Figure 3-16. Optimisation test 1 reaction with temperature range 56˚C-58˚C with forward primer T60f
A) 1.0mM MgCl2 ITMTR2 reverse primer B) 1.0mM MgCl2 ITMTR2-mod reverse primer C) 1.5mM MgCl2 ITMTR2 reverse primer D) 1.5mM MgCl2 ITMTR2-mod E) 2.0mM MgCl2 ITMTR2 reverse primer F) 2.0mM MgCl2 ITMTR2-mod reverse primer G) 2.5mM MgCl2 ITMTR2 reverse primer H) 2.5mM MgCl2 ITMTR2-mod reverse primer.
F
E
56 58 60 62 64 66
56 58 60 62 64 66 56 58 60 62 64 66
56 58 60 62 64 66
H
G
B A
56 58 60 62 64 66 56 58 60 62 64 66
1.0mM MgCl2
1.5mM MgCl2
2.0mM MgCl2 2.5mM MgCl2
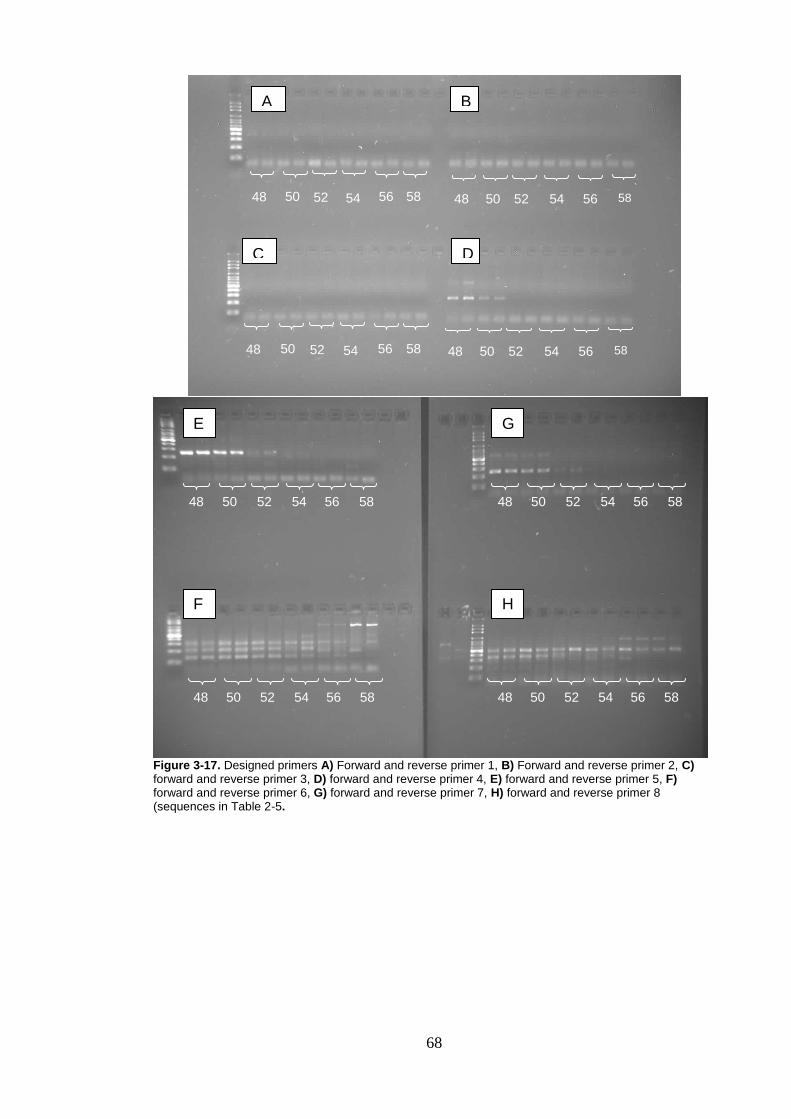
68
Figure 3-17. Designed primers A) Forward and reverse primer 1, B) Forward and reverse primer 2, C) forward and reverse primer 3, D) forward and reverse primer 4, E) forward and reverse primer 5, F) forward and reverse primer 6, G) forward and reverse primer 7, H) forward and reverse primer 8 (sequences in Table 2-5.
D C
48 50 52 54 56 5886
48 50 52 54 56 58
F
E
48 50 52 54 56 58
48 50 52 54 56 58
H
G
48 50 52 54 56 58
48 50 52 54 56 58
B A
48 50 52 54 56 5886
48 50 52 54 56 58
69
4 Discussion
This study examined the helminth parasites of 147 red foxes and 47 feral cats
sampled from a geographic range of ~1,000km in southwest Western Australia.
A total of 11 parasite species were detected and parasite prevalence was
estimated at 58% for foxes and 81% for cats. This is the first time that helminth
parasites have been assessed for southwest Western Australia in such a
comprehensive manner. These data are discussed in light of the limitations of
the sample method undertaken, and in comparison with the literature.
Statistical analyses compared parasite presence with environmental factors
that potentially determine their presence and then the impact of parasite
presence upon host body condition was examined. The consequences of the
presence of these parasites in a feral predator host are discussed and highlight
the potential transmission to livestock and humans.
4.1 Sampling locations, parasite presence and prevalence
There are some limitations of the present study due to the host sampling
method employed. The Red Card for the Red Fox volunteers collected the red
fox and feral cat samples via spotlight shooting methods. These methods are
biased towards red fox collection since cats are more cryptic and cautious in
nature and are not as readily seen. Red foxes may be more susceptible to
spotlight shooting than cats because they may be more obvious due to their
greater body size and less cautious behaviour (red foxes will move around in
the open). In addition to different population numbers, this could account for the
greater number of red foxes collected than cats. Therefore, although all well-
preserved feral cats samples were analysed for helminth parasites, a
70
subsample of the red foxes collected in each area were examined. Another
bias that may influence the results of this study is that this sampling method is
dependent upon the behaviour of the hosts which could vary between
individuals according to their parasite load (Cheng, 1986). For example,
individuals carrying a heavy parasite burden may be more easily sampled due
to obvious behaviour as they go in search of food or less obvious behaviour if
they experience reduced mobility (Perrot-Minnot and Cezilly, 2009)
Although the host sampling may have caveats, there is a high degree of
confidence with helminth identification and presence recording in this study due
to the sampling method. Intestinal sampling from hosts is a more reliable
method of measuring parasite richness and prevalence in any host community
compared with faecal sampling. Faecal samples are more prone to deliver
negative results due to intermittent shedding of eggs and may be less reliable
due to poor differentiation of egg morphology between parasite species (e.g.
Taeniid eggs are hard to differentiate from each other in egg floats of faecal
smears as are Toxocara spp. eggs). Examining the entire intestinal tract is
therefore a highly thorough method of analysis.
4.1.1 Red foxes
In total, 58% of 147 red foxes examined in this study harboured helminth
parasites. This is considerably lower compared with the limited number of
previous studies in Australia. Ryan (1976b) found an 80.6% prevalence of
helminths in 180 foxes and Coman (1973) detected a prevalence of 71% in
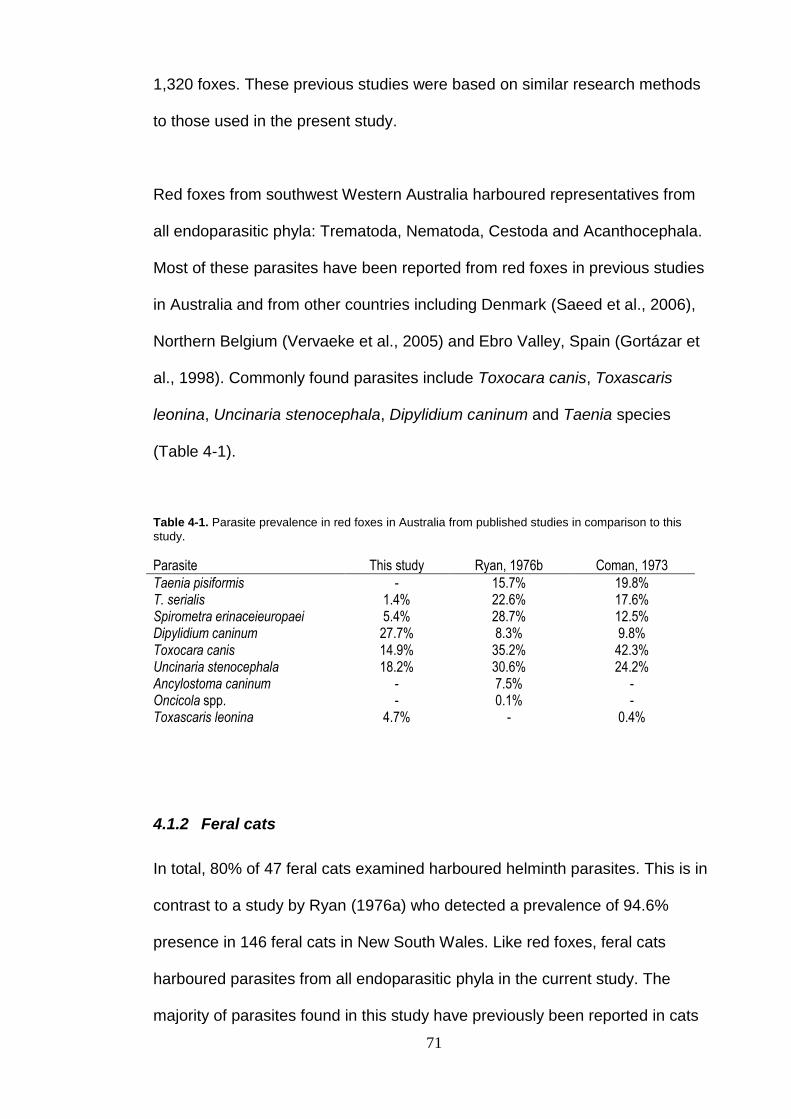
71
1,320 foxes. These previous studies were based on similar research methods
to those used in the present study.
Red foxes from southwest Western Australia harboured representatives from
all endoparasitic phyla: Trematoda, Nematoda, Cestoda and Acanthocephala.
Most of these parasites have been reported from red foxes in previous studies
in Australia and from other countries including Denmark (Saeed et al., 2006),
Northern Belgium (Vervaeke et al., 2005) and Ebro Valley, Spain (Gortázar et
al., 1998). Commonly found parasites include Toxocara canis, Toxascaris
leonina, Uncinaria stenocephala, Dipylidium caninum and Taenia species
(Table 4-1).
Table 4-1. Parasite prevalence in red foxes in Australia from published studies in comparison to this
study.
Parasite This study Ryan, 1976b Coman, 1973
Taenia pisiformis - 15.7% 19.8% T. serialis 1.4% 22.6% 17.6% Spirometra erinaceieuropaei 5.4% 28.7% 12.5% Dipylidium caninum 27.7% 8.3% 9.8% Toxocara canis 14.9% 35.2% 42.3% Uncinaria stenocephala 18.2% 30.6% 24.2% Ancylostoma caninum - 7.5% - Oncicola spp. - 0.1% - Toxascaris leonina 4.7% - 0.4%
4.1.2 Feral cats
In total, 80% of 47 feral cats examined harboured helminth parasites. This is in
contrast to a study by Ryan (1976a) who detected a prevalence of 94.6%
presence in 146 feral cats in New South Wales. Like red foxes, feral cats
harboured parasites from all endoparasitic phyla in the current study. The
majority of parasites found in this study have previously been reported in cats
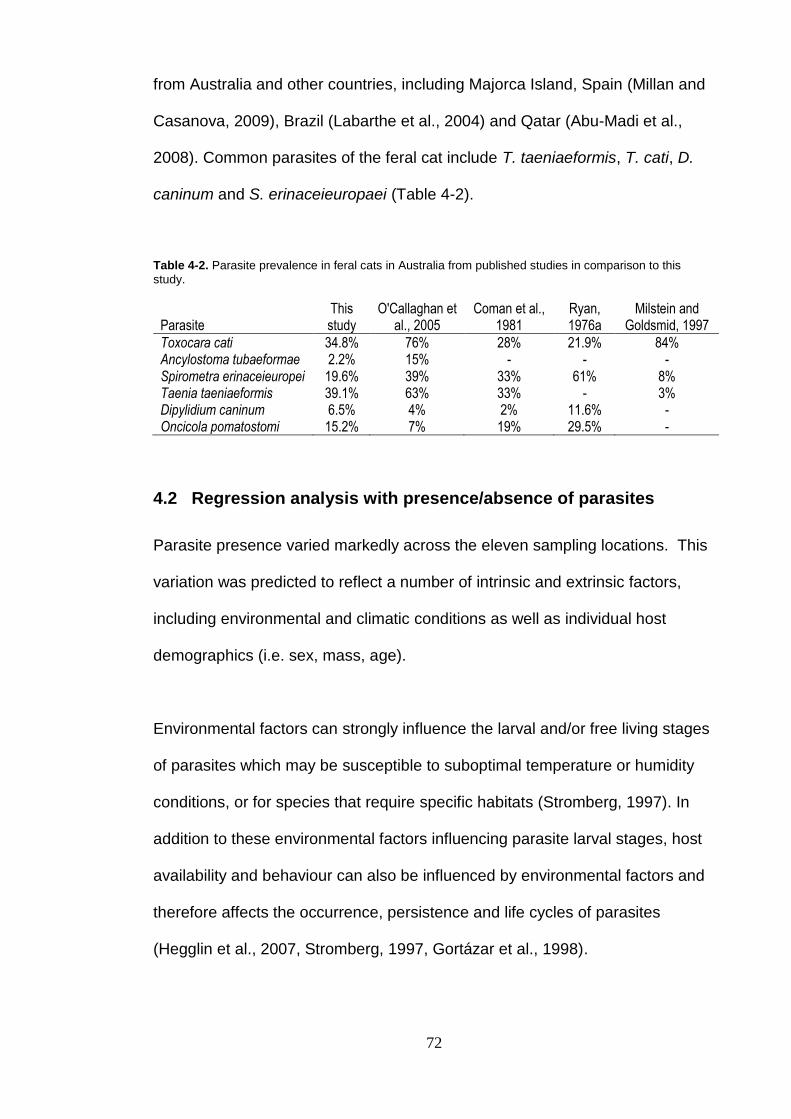
72
from Australia and other countries, including Majorca Island, Spain (Millan and
Casanova, 2009), Brazil (Labarthe et al., 2004) and Qatar (Abu-Madi et al.,
2008). Common parasites of the feral cat include T. taeniaeformis, T. cati, D.
caninum and S. erinaceieuropaei (Table 4-2).
Table 4-2. Parasite prevalence in feral cats in Australia from published studies in comparison to this
study.
Parasite This study
O'Callaghan et al., 2005
Coman et al., 1981
Ryan, 1976a
Milstein and Goldsmid, 1997
Toxocara cati 34.8% 76% 28% 21.9% 84% Ancylostoma tubaeformae 2.2% 15% - - - Spirometra erinaceieuropei 19.6% 39% 33% 61% 8% Taenia taeniaeformis 39.1% 63% 33% - 3% Dipylidium caninum 6.5% 4% 2% 11.6% - Oncicola pomatostomi 15.2% 7% 19% 29.5% -
4.2 Regression analysis with presence/absence of parasites
Parasite presence varied markedly across the eleven sampling locations. This
variation was predicted to reflect a number of intrinsic and extrinsic factors,
including environmental and climatic conditions as well as individual host
demographics (i.e. sex, mass, age).
Environmental factors can strongly influence the larval and/or free living stages
of parasites which may be susceptible to suboptimal temperature or humidity
conditions, or for species that require specific habitats (Stromberg, 1997). In
addition to these environmental factors influencing parasite larval stages, host
availability and behaviour can also be influenced by environmental factors and
therefore affects the occurrence, persistence and life cycles of parasites
(Hegglin et al., 2007, Stromberg, 1997, Gortázar et al., 1998).
73
For red foxes and cats, separate multiple regression analyses were performed
to identify whether a range of environmental and individual factors were
correlated with the occurrence of helminth parasites at each location. These
are discussed below for red foxes and then feral cats.
4.2.1 Red foxes
In red foxes, the average relative humidity for the previous six months at each
location had a significant influence on three parasite species
(S. erinaceieuropaei p<0.001; T. leonina p<0.01; and U. stenocephala p<0.01).
High humidity levels influence parasite survival during their larval and free living
stages as it invariably relates to higher moisture levels in micro-environments,
particularly in soils (Stromberg, 1997, Onorato, 1932). If the environment is too
dry, the eggs or larvae are more susceptible to desiccation and eggs are
unlikely to embryonate (Ruiz de Ybanez et al., 2001). This has been
demonstrated for various parasite species; for example U. stenocephala eggs
are not highly resistant to desiccation, tending to favour high moisture levels in
the soils to encourage embryonation and survival of the infective stages
(Criado-Fornelio et al., 2000). Moisture can also affect the motility and
movement of free living stages of U. stenocephala thereby increasing their
dispersion abilities (Stromberg, 1997).
Although their presence in this study was linked with higher humidity,
Toxascaris leonina eggs are able to withstand larger climate fluctuations than
eggs from parasites such as T. canis so they can survive within a wider range
of environments thus increasing their potential distribution and transmission risk
(Sprent and Barrett, 1964).
74
For S. erinaceieuropaei, the influence of humidity not only involves the
improved survival of eggs from desiccation but also supports the life cycle of
hosts. Spirometra erinaceieuropaei has a relatively complicated life cycle
utilising numerous paratenic hosts, including waterborne copepods and
arthropods. Surface water bodies are more likely to persist in higher humidity or
damp environments which are more likely to provide suitable habitat for various
suitable paratenic and intermediate hosts (Ryan, 1976b). This greater survival
and transmission of the parasite may reflect that higher humidity locations may
be more suitable conditions for parasite transmissibility.
The presence of two parasites (Uncinaria stenocephala and T. canis) were
significantly correlated with increasing percentage remnant vegetation cover in
red foxes. There may be a number of reasons to account for this correlation
and the result is supported by various published studies. For example, Dubná
et al. (Dubná et al., 2007) demonstrated a higher incidence and prevalence of
T.canis in parks or areas with a high vegetation cover compared to rural areas.
Most of the locations that were sampled in the present study were highly
modified, largely homogenous environments (i.e. paddocks and farmland). In
this landscape, remnant native vegetation represents vital refuges of habitat
diversity and cover for hosts, and this may also reflect greater transmissibility of
parasites. The presence of the parasites themselves may also be supported in
these environments, since remnant vegetation provides greater protection from
the elements (i.e. solar radiation, extreme heat and grazing activities), as well
as providing a heterogeneous environment which allows for less desiccation of
the eggs and larvae (Stromberg, 1997).
75
Remnant vegetation cover can also indicate an increased diversity of animal
species in an area. In higher remnant vegetation areas, there is likely to be a
greater variety of fauna and therefore a greater variety of potential parasitic
hosts. Native fauna are more likely to stay in areas where they are afforded
greater protection and shelter from predation and other dangers. This can
potentially result in higher than expected host density due to the
topographically restricted range and ultimately higher concentrations of
infective parasitic stages in the environment.
Parasite infective stages are sensitive to extremes of temperature (both
extremely high or low temperatures). These extremes can lead to desiccation
of eggs and larval stages (Onorato, 1932). The five year average minimum
temperature had a significant correlation with U. stenocephala and S.
erinaceieuropaei presence in red foxes. Whilst lower minimum temperatures
may be more conducive to decreased levels of desiccation (decreased
exposure of eggs and free living stages to solar radiation which increases an
eggs’ susceptibility to desiccation), it can also potentially depress embryonation
of eggs (Onorato, 1932) as well as larval activity and motility (Stromberg,
1997). The positive correlation of U. stenocephala and S. erinaceieuropaei with
average minimum temperature suggests that these species are supported by
warmer winter minimums.
None of the host factors returned significant correlations for red foxes. This
finding may imply that geographic variation in environmental factors had far
76
greater effect upon parasite numbers and presence compared with differences
between individual hosts.
4.2.2 Feral cats
Multiple regression analysis identified two factors significantly correlated with
helminth presence in feral cats: five year average rainfall and head/body length.
Five year average rainfall was significantly correlated with the presence of
Toxocara cati. Toxocara species eggs are known to survive in moist conditions
for longer periods of time. There is a greater likelihood of eggs resisting
desiccation and therefore embryonating and becoming infectious within an
environment that experiences higher rainfall. Toxocara cati eggs present in wet
areas have a higher viability therefore are more likely to reach their next life
cycle stage (Ruiz de Ybanez et al., 2001). Larvae of T. cati need to moult twice
in order to produce infective third stage larvae, which typically takes several
weeks (Bowman et al., 2003). Moist conditions are clearly more favourable for
this process given the time that is needed (Bowman et al., 2003).
The body size (head/body length) of feral cats was correlated with the presence
of Taenia taeniaeformis. This is most likely explained by the fact that larger cats
have a higher likelihood of becoming infected with T. taeniaeformis. Cat size is
closely linked with age, with smaller individuals generally being kittens/juveniles
and larger individuals being adults. The correlation of individual size with the
presence of T. taeniaeformis could be related to older cats having had an
accumulated greater level of exposure to infection via their predatory
behaviour. Larger/older cats are typically more successful hunters than
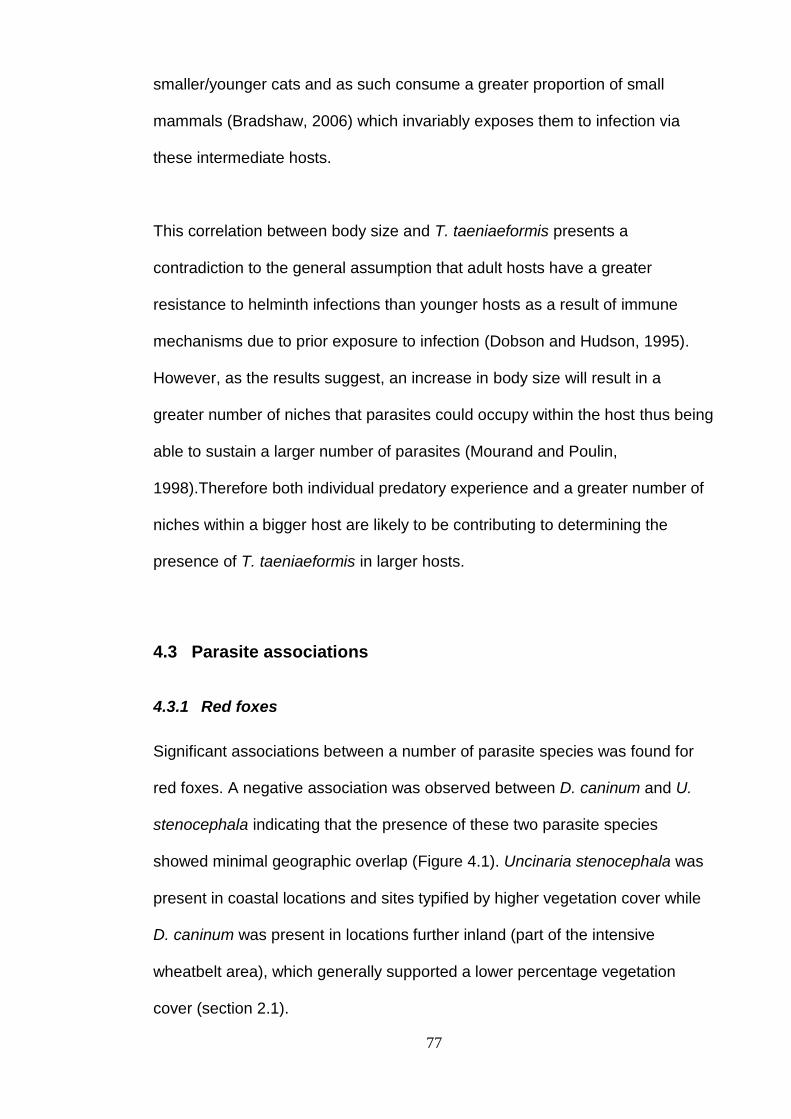
77
smaller/younger cats and as such consume a greater proportion of small
mammals (Bradshaw, 2006) which invariably exposes them to infection via
these intermediate hosts.
This correlation between body size and T. taeniaeformis presents a
contradiction to the general assumption that adult hosts have a greater
resistance to helminth infections than younger hosts as a result of immune
mechanisms due to prior exposure to infection (Dobson and Hudson, 1995).
However, as the results suggest, an increase in body size will result in a
greater number of niches that parasites could occupy within the host thus being
able to sustain a larger number of parasites (Mourand and Poulin,
1998).Therefore both individual predatory experience and a greater number of
niches within a bigger host are likely to be contributing to determining the
presence of T. taeniaeformis in larger hosts.
4.3 Parasite associations
4.3.1 Red foxes
Significant associations between a number of parasite species was found for
red foxes. A negative association was observed between D. caninum and U.
stenocephala indicating that the presence of these two parasite species
showed minimal geographic overlap (Figure 4.1). Uncinaria stenocephala was
present in coastal locations and sites typified by higher vegetation cover while
D. caninum was present in locations further inland (part of the intensive
wheatbelt area), which generally supported a lower percentage vegetation
cover (section 2.1).
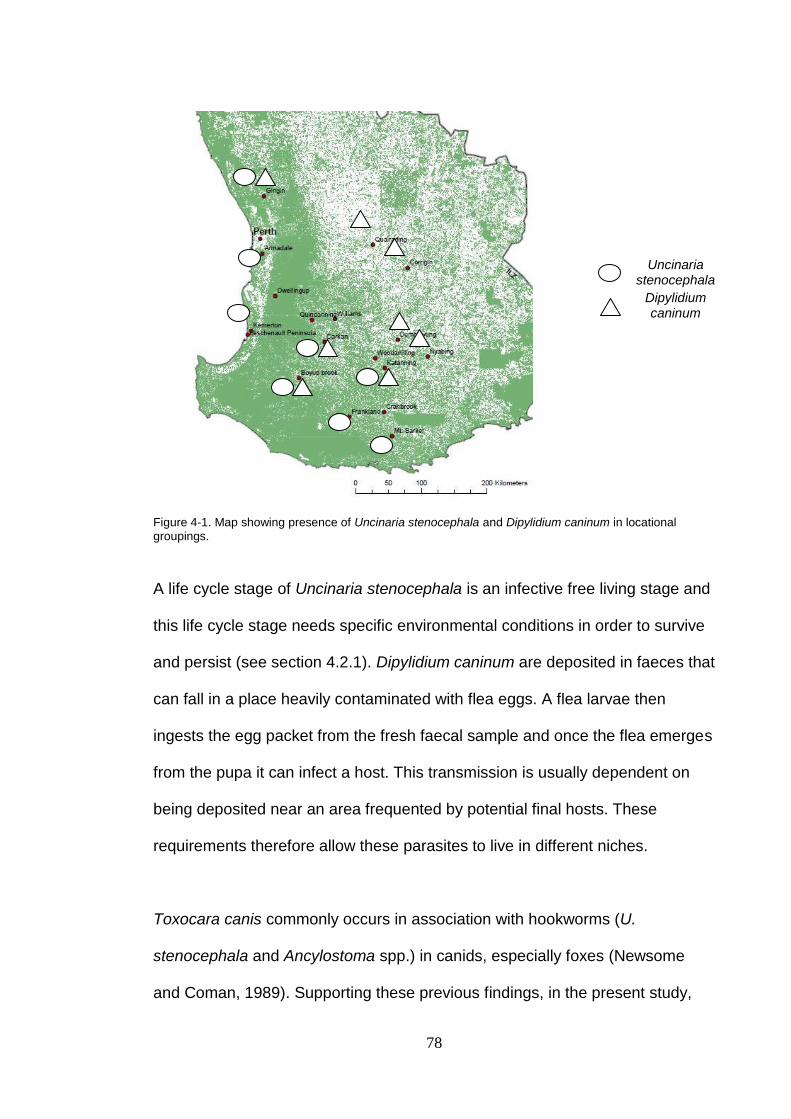
78
Figure 4-1. Map showing presence of Uncinaria stenocephala and Dipylidium caninum in locational groupings.
A life cycle stage of Uncinaria stenocephala is an infective free living stage and
this life cycle stage needs specific environmental conditions in order to survive
and persist (see section 4.2.1). Dipylidium caninum are deposited in faeces that
can fall in a place heavily contaminated with flea eggs. A flea larvae then
ingests the egg packet from the fresh faecal sample and once the flea emerges
from the pupa it can infect a host. This transmission is usually dependent on
being deposited near an area frequented by potential final hosts. These
requirements therefore allow these parasites to live in different niches.
Toxocara canis commonly occurs in association with hookworms (U.
stenocephala and Ancylostoma spp.) in canids, especially foxes (Newsome
and Coman, 1989). Supporting these previous findings, in the present study,
Uncinaria stenocephala
Dipylidium caninum
79
significant correlations were identified in the presence of S. erinaceieuropaei,
U. stenocephala and Toxascaris leonina. These relationships could reflect
similar requirements for these parasites to support their persistence and
survival in the environment. All three parasites were significantly associated
with average relative humidity (Section 4.2.1) and S. erinaceieuropaei and U.
stenocephala were associated with warmer 5-year average minimum
temperatures (section 4.2.1). This is most likely related to the sensitivity of the
eggs and larval stages of these parasites. These parasite species require moist
environments for their free living and larval stages and this could determine the
occurrence of specific intermediate hosts and therefore their greater likelihood
of transmission.
4.3.2 Feral cats
The correlation matrix detected two helminth species associations in feral cats;
the presence of T. taeniaeformis was negatively associated with the presence
of T. cati but positively associated with O. pomatostomi. The association
between T. taeniaeformis and T. cati is likely to reflect differences in habitat
requirements for these parasite species. Taenia taeniaeformis are found in the
wheatbelt and Jarrah forest bioregions whereas T. cati is present on the Swan
coastal plain and Jarrah forest bioregions (Figure 2-1). Although there is some
overlap in the Jarrah forest region, T. taeniaeformis and T. cati generally occur
in two distinct geographical zones.
An assumption can be made from the positive association between T.
Taeniaeformis and O. pomatostomi. This is likely to reflect that these two
80
parasite species can utilise similar intermediate hosts. Oncicola pomatostomi
exploit many bird species as intermediate hosts (Schmidt, 1983) and the
intermediate hosts of T. taeniaeformis are rodent’s, rabbits and insectivores
(Loos-Frank, 2000). The insectivorous host of T. taeniaeformis could potentially
be a bird, of which can also be a host of O. pomatostomi. This shared host can
become prey to cats and consequent infection of the cat from both parasites
may follow.
4.4 Worm burdens for red foxes and feral cats
Generally, worm burdens are dependent on the mode of transmission and
infection (Ryan, 1976b).A high worm burden for the fox or cat is likely to reflect
the worm burden of the intermediate host. An example of this is D. caninum
which was present in large abundance in foxes and cats. This could be
attributed to the flea intermediate host ingesting the entire egg packet from the
faeces of the definitive host. Subsequent ingestion of the infected flea by the
definitive host will cause infection (Coman, 1973, Nichol et al., 1981). The
present study exhibits a high worm burden of D. caninum in red foxes and the
highest average worm burden for cats compared to all parasites. The high
burden can be explained by this transmission strategy and also possibly by a
large presence of fleas on individuals that harbour D. caninum as demonstrated
in Nichol et al (1981). The individual host samples that were laden with D.
caninum also demonstrated levels of dermatitis which can possibly be
attributed to large flea populations. The high incidence of fleas can therefore
lead to recurring cycling of the D. caninum life cycle.
81
A high burden of Taenia serialis was found in one red fox. This result supports
previous reports that ingestion of a single coenurus (larval stage) from the
rabbit intermediate host can result in heavy worm burden (Coman, 1973). The
high abundance of rabbits in the environment, and their role as a staple part of
the fox diet (Dickman, 1996) ensures a constant transmission risk of this
parasite.
A high burden of S. erinaceieuropaei may represent an individual with atypical
feeding patterns. Spirometra erinaceieuropaei can have a range of accidental
paratenic hosts such as frogs, mice and lizards. Due to the non specific
transmission of the larval form S. erinaceieuropaei to varying hosts, combined
with the opportunistic fox predation and highly predatory nature of cats, the
potential risk of infection is increased n both these animals.
Taenia taeniaeformis was found in high abundances in feral cats. This high
prevalence can be attributed to the rodent intermediate host that cats were
feeding on 11% of the feral cats sampled in the present study, were also
identified as feeding on rodents, and rodents made up an average of 21±28%
of stomach contents of cats (Crawford et al., 2010) harbouring a large number
of strobilocerci (larval stage). This results in a large parasite burden of the
infected cats.
The large parasite burden of T. cati in feral cats can be linked to the
transmission route of this parasite. Toxocara cati is generally passed on to
kittens via a transmammary infection. This is one of the main infection routes
and contributes towards the high prevalence of this parasite within cat
82
populations. This is the same for T. canis, but in addition to the transmammary
route of infection, an in-utero path is present for T. Canis,, hence contributing to
the high abundance in red fox populations.
4.5 Does parasite presence or load affect host body condition?
4.5.1 Red foxes
In addition to allometric charges in body mass (revealed by positive correlations
between body size indicators and body mass (including head, head/body length
and pes length and age), there were area (location) affects upon body mass
which reveal differences in their body condition between locations. A surprising
result was a positive correlation of body mass with S. erinaceieuropaei
(although there were few individuals that were found positive for this
parasite).This finding could be explained by a larger body size contributing a
larger number of niches in which a large abundance of parasites can live in (as
discussed in section 4.2.2; however, S. erinaceieuropaei was the only parasite
whose abundance had an effect on body mass).
Multiple regression analysis was also performed to find an effect of
infracommunity richness on foxes and cats. No significance was found for any
of the parasites. Previous studies also have found no significant effect of
helminth infection presence/abundance or the number of parasite species per
individual host on body condition (Vervaeke et al., 2005).
83
4.5.2 Feral cats
Multiple regression analysis was conducted on feral cat body mass in relation
to parasite load and species richness (infracommunity richness). No
significance was found for any of the parasites in relation to these parameters.
Previous studies have found no association between extent of parasitism and
body condition of cats (Coman et al., 1981) Due to the broad access to food
resources and high variability of diet that feral cats can have, they are generally
in good physical condition, which should allow them to cope with parasitic
infection and therefore not have any effect on body condition (Millan and
Casanova, 2009).
4.6 Significance of results
This study has indicated that red foxes and feral cats in southwest Western
Australia harbour parasites from all parasitic phyla. Some of these parasites
are known to be transmissible to wildlife and livestock species, as well as
having zoonotic potential.
Many of these parasites found in red foxes and feral cats have been found
within native wildlife. Taenia species, Spirometra erinaceieuropaei and
Toxocara species are some of these. Spirometra erinaceieuropaei is one of the
worst offenders in being able to infect wildlife causing a disease called
sparganosis in a wide range of vertebrates. This infection results in muscular
haemorrhage, damage to soft tissue and ultimately death. Spirometra
erinaceieuropaei has been found to infect marsupials such as the echidna,
Antechinus, long nosed bandicoot and Tasmanian devil. Toxocara canis has
84
been identified from within Trichosurus vulpecular vulpecular, the brushtail
possum. Various Taenia species have been found in wombats, Tasmanian
devils and among livestock animals.
Environmental conditions have found to have a significant effect on the
presence of particular parasites and their corresponding life cycles. A larger
sample size should help to further distinguish any other links between parasite
presence in red foxes and feral cats. Surprisingly two different species of flukes
were found in this study; Plagiorchis maculosus and Brachylaima cribbi.
Plagiorchis maculosus has been previously noted in South Australia but not
from Western Australia or from red foxes although it is generally found in
insectivores. Brachylaima cribbi is a trematode that is generally in chickens,
mice, rats and humans and has been noted from South Australia. Again, this
trematode has not been noted from south west Western Australia. An unnamed
species was found in a Northern Brown bandicoot from Northern Western
Australia.
In conclusion, this study fills a gap in the knowledge of parasitic diseases from
foxes and cats in the southwest Western Australia. Due to the wide geographic
distribution of the red fox and feral cats, the importance of parasite
transmission from these feral predator hosts cannot be underestimated. Areas
within the southwest with particular conditions that cater for an increased
parasite presence should increase their control efforts towards these species,
not only for their predatory nature but their increased disease transmission risk.
85
5 References
ABU-MADI, M. A., PAL, P., AL-THANI, A. & LEWIS, J. W. (2008) Descriptive epidemiology of intestinal helminth parasites from stray cat populations in Qatar. Journal of Helminthology, 82, 59-68.
ALDERTON, D. (1998) Foxes, Wolves and Wild Dogs of the World, New York, Sterling Publishing Co, Inc.
ANGEL, M. (1959) An account of Plagiorchis maculosus (RUD.), its synonomy and its life history in South Australia. Transactions of the Royal Society of South Australia, 82, 205-277.
ARMSTRONG, R. (1998) Western Sheild- bringing back wildlife from the brink of extinction. Proceedings of the 11th Australiasian Vertebrate Pest Conference. Bunbury, Australia, Agriculture Western Australia.
BEHNKE, J. M., LEWIS, J. W., ZAIN, S. N. M. & GILBERT, F. S. (1999) Helminth infections in Apodemus sylvaticus in southern England: interactive effects of host age, sex and year on the prevalence and abundance of infections. Journal of Helminthology, 73, 31-44.
BEVERIDGE, I. & GREGORY, G. G. (1976) The identification of Taenia species from Australian carnivores. Australian Veterinary Journal, 52, 369-373.
BOMFORD, M. & HART, Q. (2002) Non-indigenous vertebrates in Australia. IN PIMENTAL, D. (Ed.) Biological Invasions: Environmental and Economic Costs of Alien Plant, Animal and Microbe Invasions. CRC Press, New York.
BOWMAN, D. D. (1999) Georgis Parasitology for Veterinarians, W. B. Saunders Company.
BOWMAN, D. D., BARR, S. C., HENDRIX, C. M. & LINDSAY, D. S. (2003) Gastro-intestinal parasites of cats. IN BOWMAN, D. D. (Ed.) Companion and exotic animal parasitology. New York, USA, International veterinary information service.
BRADSHAW, J. W. S. (2006) The Evolutionary Basis for the Feeding Behavior of Domestic Dogs (Canis familiaris) and Cats (Felis catus). The Journal of Nutrition, 136, 1927S-1931S.
BUNDY, D. A. P. & GOLDEN, M. H. N. (1987) The impact of host nutrition on gastrointestinal helminth populations. Parasitology, 95, 623-635.
BURBIDGE, A. A. & MCKENZIE, N. L. (1989) Patterns in the modern decline of Western Australia's vertebrate fauna: causes and conservation implications. Biological Conservation, 50, 143-198.
BUTCHER, A. R. & GROVE, D. I. (2001) Description of the life-cycle stages of Brachylaima cribbi n. sp. (Digenea: Brachylaimidae) derived from eggs recovered from human faeces in Australia. Systematic Parasitology, 49, 211-221.
CANFIELD, P. J., HARTLEY, W. J. & DUBEY, J. P. (1990) Lesions of toxoplasmosis in Australian marsupials. Journal of Comparative Pathology, 103, 159-167.
CHANDRA, R. K. (1981) IMMUNOCOMPETENCE AS A FUNCTIONAL INDEX OF NUTRITIONAL STATUS. British Medical Bulletin, 37, 89-94.
CHENG, T. C. (1986) General Parasitology, Academic Press, Inc. CHOWDHURY, N., O'GRADY, R. T. O. & SOOD, M. L. (2001) Evolution,
Parasitism and Host Specificity in Helminths. IN CHOWDHURY, N. &
86
TADA, I. (Eds.) Perspectives on Helminthology. New Hampshire, Science Publishers, Inc.
COMAN, B. J. (1973) Helminth parasites of the fox (Vulpes vulpes) in Victoria. Australian Veterinary Journal, 49, 378-384.
COMAN, B. J. (1983) Fox, Vulpes vulpes. IN STRAHAN, R. A. (Ed.) The Australian Museum Complete book of Australian Mammals. Sydney, Angus & Robertson.
COMAN, B. J. (1991) The ecology and control of feral cats in Australia. IN POTTER, C. (Ed.) The Impact of Feral Cats on Native Wildlife. Canberra, Endangered Species Unit Australian National Parks and Wildlife Service.
COMAN, B. J., JONES, E. H. & DRIESEN, M. A. (1981) Helminth parasites and arthropods of feral cats. Australian Veterinary Journal, 57, 324-327.
COOP, R. L. & HOLMES, P. H. (1996) Nutrition and parasite interaction. International Journal for Parasitology, 26, 951-962.
COOP, R. L. & KRYRIAZAKIS, I. (2001) Influence of host nutrition on the development and consequences of nematode parasitism in ruminants. Trends in Parasitology, 17, 325-330.
COURCHAMP, F., CHAPUIS, J.-L. & PASCAL, M. (2003) Mammal invaders on islands: impact, control and control impact. Biological Reviews, 78, 347-383.
CRAWFORD, H., CALVER, M., FLEMING, P. A. & ADAMS, P. J. (2010) A comparison of red fox (Vulpes vulpes) and feral cat (Felis catus) diets in the south west region of Western Australia. Perth, Murdoch University.
CRIADO-FORNELIO, A., GUTIERREZ-GARCIA, L., RODRIGUEZ-CAABEIRO, F., REUS-GARCIA, E., ROLDAN-SORIANO, M. A. & DIAZ-SANCHEZ, M. A. (2000) A parasitological survey of wild red foxes (Vulpes vulpes) from the province of Guadalajara, Spain. Veterinary Parasitology, 92, 245-251.
DEPARTMENT OF SUSTAINABILITY, E., WATER, POPULATION AND COMMUNITIES (2010) Bureau of Meteorology. Commonwealth of Australia.
DEPARTMENT OF THE ENVIRONMENT, W., HERITAGE AND THE ARTS (DEWHA) (2008a) Threat Abatement Plan for Predation by Feral Cats. Canberra, DEWHA.
DEPARTMENT OF THE ENVIRONMENT, W., HERITAGE AND THE ARTS (DEWHA) (2008b) Threat abatement plan for predation by the European red fox. Canberra, DEWHA.
DICKMAN, C. R. (1996) Impact of exotic generalist predators on the native fauna of Australia. Wildlife Biology, 3, 165-175.
DINKEL, A., VON NICKISCH-ROSENEGK, M., BILGER, B., MERLI, M., LUCIUS, R. & ROMIG, T. (1998) Detection of Echinococcus multilocularis in the Definitive Host: Coprodiagnosis by PCR as an Alternative to Necropsy. J. Clin. Microbiol., 36, 1871-1876.
DOBSON, A. P. & HUDSON, P. J. (1995) Microparasites: Observed patterns in wild animal populations. IN GRENFELL, B. T. & DOBSON, A. P. (Eds.) The Ecology of Infectious Diseases in Natural Populations. Cambridge, Cambridge University Press.
DRUMMOND, A. J., ASHTON, B., CHEUNG, M., HELED, J., KEARSE, M., MOIR, R., STONES-HAVAS, S., THIERER, T. & WILSON, A. (2010) Geneious. 5.0 ed.
87
DUBNÁ, S., LANGROVÁ, I., JANKOVSKÁ, I., VADLEJCH, J., PEKÁR, S., NÁPRAVNÍK, J. & FECHTNER, J. (2007) Contamination of soil with Toxocara eggs in urban (Prague) and rural areas in the Czech Republic. Veterinary Parasitology, 144, 81-86.
ENVIRONMENT AUSTRALIA (2000) Interim Biogeorgraphic Regionalisation for Australia (IBRA). 5.1 ed., Custodians: Department of the Environment and Heritage (Reserve Systems Section), Australian Government Canberra.
FLEMING, P. J. S., ALLEN, L. R., LAPIDGE, S. J., ROBLEY, A., SAUNDERS, G. R. & THOMSON, P. C. (2006) A strategic approach to mitigating the impacts of wild canids: proposed activities of the Invasive Animals Cooperative Research Centre. Australian Journal of Experimental Agriculture, 46, 753-762.
FORBES-HARPER, J. (2010) Ecomorphology of red fox (Vulpes vulpes) skulls in Southwest Western Australia. Perth, Murdoch University.
GORTÁZAR, C., VILLAFUERTE, R., LUCIENTES, J. & FERNÁNDEZ-DE-LUCO, D. (1998) Habitat related differences in helminth parasites of red foxes in the Ebro valley. Veterinary Parasitology, 80, 75-81.
GREEN, A. J. (2001) Mass/Length residuals: measures of body condition or generators of spurious results. Ecology, 82, 1473-1483.
HEGGLIN, D., BONTADINA, F., CONTESSE, P., GLOOR, S. & DEPLAZES, P. (2007) Plasticity of predation behaviour as a putative driving force for parasite life-cycle dynamics: the case of urban foxes and Echinococcus multilocularis tapeworm. Functional Ecology, 21, 552-560.
HENDERSON, W. (2009) Pathogens in Vertebrate Pests in Australia. Canberra, Invasive Animals Cooperative Research Centre.
JENKINS, D. J., FRASER, A., BRADSHAW, H. & CRAIG, P. S. (2000) Detection Of Echinococcus granulosus coproantigens in Australian canids with natural of experimental infection. Journal of Parasitology, 86, 140-145.
JONES, E. (1989) Felidae. IN WALTON, D. W. & RICHARDSON, B. J. (Eds.) Fauna of Australia. Mammalia. Canberra, Australian Government Publishing Service.
JONES, E. H. & COMAN, B. J. (1982) Ecology of the feral cat, Felis catus (L.), in south-eastern Australia III. Home ranges and population ecology in semi-arid north-west Victoria. Australian Wildlife Research, 9, 409-420.
KRASNOLOBOVA, T. A. (1977) The principles of the systematics of trematodes from the genus Plagiorchis. Trudy Gel'mintologicheskoi Laboratorii, 27, 65-110.
LABARTHE, N., SERRÃO, M. L., FERREIRA, A. M. R., ALMEIDA, N. K. O. & GUERRERO, J. (2004) A survey of gastrointestinal helminths in cats of the metropolitan region of Rio de Janeiro, Brazil. Veterinary Parasitology, 123, 133-139.
LONG, J. L. (1988) Introduced Birds and Mammals in Western Australia, Forrestfield WA, Agriculture Protection Board.
LOOS-FRANK, B. (2000) An up-date of Verster's (1969) 'Taxonomic revision of the genus Taenia Linnaeus' (Cestoda) in table format. Syst Parasitol, 45, 155 - 183.
MARIEB, E. C. (2009) Essentials of human physiology and anatomy, San Francisco, Pearson Benjamin Cummings.
88
MCLEOD, R. (2004) Counting the Costs: Impact of Invasive Animals in Australia 2004. Canberra, Cooperative Research Centre for Pest Animal Control.
MILLAN, J. & CASANOVA, J. C. (2009) High prevalence of helminth parasites in feral cats in Majorca Island (Spain). Parasitol Res, 106, 183-188.
MOURAND, S. & POULIN, R. (1998) Density, body mass and parasite richness of terrestrial mammals. Evolutionary ecology, 12, 717-727.
NATIONAL LAND & WATER RESOURCES AUDIT, I. A. C. R. C. (2008) Assessing invasive animals in Australia 2008. Canberra.
NEW, T. R. (2000) Conservation biology: an introduction for southern Australia, New York, Oxford University Press.
NEWSOME, A. E. & COMAN, B. J. (1989) Canidae. IN WALTON, D. W. & RICHARDSON, B. J. (Eds.) Fauna of Australia. Mammalia. Canberra, Australian Government Publishing Service.
NICHOL, S., BALL, S. J. & SNOW, K. R. (1981) Prevalence of intestinal parasites in feral cats in some urban areas of england. Veterinary Parasitology, 9, 107-110.
ONORATO, A. R. (1932) The effects of temperature and humidity on the ova of Toxocara canis and Trichuris vulpis. American journal of epidemiology, 16, 266-287.
PALMER, C. S., THOMPSON, R. C. A., TRAUB, R. J., REES, R. & ROBERTSON, I. D. (2008) National study of the gastrointestinal parasites of dogs and cats in Australia. Veterinary Parasitology, 151, 181-190.
PERROT-MINNOT, M. & CEZILLY, F. (2009) Parasites and behaviour. IN THOMAS, F., GUEGAN, J. & RENAUD, F. (Eds.) Ecology and evolution of parasitism. New York, Oxford University Press.
PROCIV, P. & CROSS, J. H. (2001) Zoonotic Helminthiases. IN CHOWDHURY, N. & TADA, I. (Eds.) Perspectives on Hlminthology. New Hampshire, USA, Science Publishers, Inc.
RICHARDS, D. T., HARRIS, S. & LEWIS, J. W. (1995) Epidemiological Studies on Intestinal Helminth Parasites of Rural and Urban Red Foxes (Vulpes vulpes) in the United Kingdom. Veterinary Parasitology, 59, 39-51.
ROBERTSON, I. D., IRWIN, P. J., LYMBERY, A. J. & THOMPSON, R. C. A. (2000) The role of companion animals in the emergence of parasitic zoonoses. International Journal for Parasitology, 30, 1369-1377.
RODRIGUEZ-HIDALGO, R., GEYSEN, D., BENÃTEZ-ORTIZ, W., GEERTS, S. & BRANDT, J. (2002) Comparison of conventional techniques to differentiate between Taenia solium and Taenia saginata and an improved polymerase chain reaction-restriction fragment length polymorphism assay using a mitochondrial 12S rDNA fragment. Journal of Parasitology, 88, 1007-1011.
ROGERS, W. P. (1962) The Nature of Parasitism; The Relationship of Some Metazoan Parasites to their Hosts, Academic Press INC, New York and London.
ROLLS, E. C. (1969) They All Ran Wild, Sydney, Angus & Robertson. ROMICH, J. A. (2008) Understanding zoonotic diseases, New York, Thomson
Delmar Learning. RUIZ DE YBANEZ, M. R., GARIJO, M. M. & ALONSO, F. D. (2001) Prevalence
and viability of eggs of Toxocara spp. and Toxascaris leonina in public parks in eastern Spain. Journal of Helminthology, 75, 169-173.
89
RYAN, G. E. (1976a) Gastro-intestinal parasites of feral cats in New South Wales. Australian Veterinary Journal, 52, 224-227.
RYAN, G. E. (1976b) Helminth parasites of the fox (Vulpes vulpes) in New South Wales. Australian Veterinary Journal, 52, 126-131.
SAEED, I., MADDOX-HYTTEL, C., MONRAD, J. & KAPEL, C. M. O. (2006) Hleminths of red foxes (Vulpes vulpes) in Denmark. Veterinary Parasitology, 139, 168-179.
SAUNDERS, G., COMAN, B. J., KINNEAR, J. & BRAYSHER, M. (1995) Managing Vertebrate Pests: Foxes, Australian Goverment Publishing Service, Canberra.
SAUNDERS, G. R., GENTLE, M. N. & DICKMAN, C. R. (2010) The impacts and management of foxes Vulpes vulpes in Australia. Mammal Review, 40, 181-211.
SCHELL, S. C. (1970) How to know the Trematodes, Dubuque, Iowa., Wm. C. Brown Company.
SCHMIDT, G. D. (1983) What is Echinorhynchus pomatostomi Johnston and Cleland, 1912? Journal of Parasitology, 69, 397-399.
SCHMIDT, G. D. & ROBERTS, L. S. (1985) Foundations of parasitology, Missouri, Times Mirror/Mosby College Publishing.
SILLERO-ZUBIRI, C., HOFFMANN, M. & MACDONALD, D. W. (Eds.) (2004) Canids: Foxes, Wolves, Jackals and Dogs. Status Survey and Conservation Action Plan, IUCN, Gland, Switzerland and Cambridge, UK.
SMALES, L. R. (2003) An annotated checklist of the Australian Acanthocephala from mammalian and bird hosts. Records of the South Australian Museum, 36, 59-82.
SORCI, G., BOULINIER, T., GAUTHIER-CLERC, M. & FAIVRE, B. (2009) The Evolutionary Ecology of the Immune Response. IN THOMAS, F., GUEGAN, J.-F. & RENAUD, F. (Eds.) Ecology and Evolution of Parasitism. New York, Oxford University Press Inc.
SPRATT, D. M., BEVERIDGE, I. & WALTER, E. L. (1990) A catalogue of Australasian monotremes and marsupials and their recorded helminth parasites. South Australian Museum Monograph Series, 1, 1-105.
SPRENT, J. F. A. & BARRETT, M. G. (1964) Large roundworms of dogs and cats: differentiation of Toxocara canis and Toxascaris leonina. Australian Veterinary Journal, 40, 166-171.
STEPHENSON, L. S., LATHAM, M. C. & OTTESEN, E. A. (2000) Malnutrition and parasitic helminth infections. Parasitology, 121, S23-S38.
STRAHAN, R. (1983) The Australian Museum Complete Book of Australian Mammals, Sydney, Angus and Robertson.
STROMBERG, B. E. (1997) Environmental factors influencing transmission. Veterinary Parasitology, 72, 247-264.
THOMPSON, R. C., KUTZ, S. J. & SMITH, A. (2009) Parasite Zoonoses and wildlife: energing issues. International journal of environmental research and public health, 6, 678-693.
VERVAEKE, M., DORNY, P., BRUYN, L. D., VERCAMMEN, F., JORDAENS, K., VAN DEN BERGE, K. & VERHAGEN, R. (2005) A survey of Intestinal Helminths of Red Fxoes (Vulpes vulpes) in Northern Belgium. Acta Parasitologica, 50, 221-227.
WATVE, M. G. & SUKUMAR, R. (1995) Parasite abundance and diversity in mammals: correlates with host ecology. Proceedings of the National Academy of Sciences of the United States of America, 92, 8945-8949.
90
WEST, P. (2008) Assessing invasive animals in Australia 2008, Canberra, National Land & Water Resources Audit and Invasive Animals CRC.
WOLFE, A., HOGAN, S., MAGUIRE, D., FITZPATRICK, C., VAUGHAN, L., WALL, D., HAYDEN, T. J. & MULCAHY, G. (2001) Red foxes (Vulpes vulpes) in Ireland as hosts for parasites of potential zoonotic and veterinary significance. Veterinary Record, 149, 759-63.
YAMAGUTI, S. (1963) System Helminthum, Acanthocephala, London, Interscience Publishers, New York.