vxeplw swdel dqg g pw - ec.europa.eu · tkh jryhuqphq kd wdnhq dodqfhg ssurdfk r lvfdo srolf\,...
TRANSCRIPT

2018-19 Convergence Programme for the United Kingdom: submitted in line with the Stability and Growth Pact
April 2019

2018-19 Convergence Programme for the United Kingdom: submitted in line with the Stability and Growth Pact
April 2019

© Crown copyright 2019
This publication is licensed under the terms of the Open Government Licence v3.0 except where otherwise stated. To view this licence, visit nationalarchives.gov.uk/doc/open-government-licence/version/3 or write to the Information Policy Team, The National Archives, Kew, London TW9 4DU, or email: [email protected].
Where we have identified any third party copyright information you will need to obtain permission from the copyright holders concerned.
This publication is available at www.gov.uk/government/publications
Any enquiries regarding this publication should be sent to us at [email protected]
ISBN 978-1-912809-52-3 PU2252
1
Contents
Foreword 2
Chapter 1 Introduction 3
Chapter 2 Overall policy framework and objectives 5
Chapter 3 Quality of public finances 72
Chapter 4 Institutional features of public finances 77
Annex A OBR analysis 81
Annex B Fiscal impact of policy decisions 234
Annex C Supplementary data tables 242

2
Foreword
The UK economy has been growing continuously for the past nine years, employment has broken records, and real wages are rising. The UK has made notable progress in restoring the public finances to health, with debt beginning its first sustained fall in a generation.
Gross domestic product (GDP) growth remained solid at 1.4% in 2018. The OBR expects continued growth for every year in the forecast period.
The employment level and rate are both at record highs of 32.7 million and 76.1%, respectively for the three months to January 2019. The unemployment rate is 3.9% and has not been lower since 1975. Nominal wages are currently growing at the fastest pace in over a decade, at 3.4% in the three months to January compared with the same period a year earlier.
CPI inflation fell gradually through 2018 and was 1.9% in February, well below its November 2017 peak of 3.1%, with the effects of the 2016 sterling depreciation continuing to wane. In the March Economic and Fiscal Outlook, the OBR forecast inflation to average 2.1% over 2019.
Following strong global growth in 2017 and the first half of 2018, global growth momentum has moderated in recent months. Growth has also become less synchronised across countries, with growth in the Euro area slowing and developments in Emerging Markets becoming more mixed. The central outlook for the global economy remains relatively firm in the near term, although risks are weighted to the downside as trade tensions have risen and financial conditions have become more volatile. Despite these downside risks to the global economy, the UK economy has demonstrated resilience.
The government has made significant progress since 2010 in restoring the public finances to health. The deficit has been reduced by four-fifths from a post-war peak and debt has begun its first sustained fall in a generation. The government has taken a balanced approach to fiscal policy, reducing debt, while supporting public services, investing in the economy and infrastructure, and keeping taxes low. The need for fiscal discipline continues as, despite these improvements, debt remains too high at over 80% of GDP.
The fiscal rules approved by Parliament in January 2017 commit the government to reducing the cyclically-adjusted deficit to below 2% of GDP by 2020-21 and having debt as a share of GDP falling in 2020-21. These rules will guide the UK towards a balanced budget by the middle of the next decade. The government is forecast to meet both of the interim fiscal targets early.

3
Chapter 1
Introduction
1.1 The Stability and Growth Pact (SGP) requires Member States to provide information on economic developments in their country for the purposes of the multilateral surveillance procedure under Articles 121 and 126 of the EU Treaty. Member States submit either annual Stability Programmes (euro area countries) or annual Convergence Programmes (non euro area countries) setting out their medium-term fiscal policies.
1.2 On 29 March 2017, the United Kingdom gave notice under Article 50 of the Treaty signalling the intention to withdraw from the European Union. The United Kingdom will continue to apply the acquis, including in matters relating to the Stability and Growth Pact, so long as it remains a Member State and, as set out in the Withdrawal Agreement, for the duration of the Implementation Period, if the Withdrawal Agreement is ratified by both the UK and EU.
1.3 The UK is not a member of the single currency and cannot face sanctions under the EU’s SGP. The UK’s obligation under the SGP is to “endeavour to
avoid an excessive government deficit” as a result of its Protocol to the EU
Treaties (Protocol 15). The Convergence Programme sets out the UK’s
medium-term fiscal policies.
1.4 Major fiscal events since the last Convergence Programme have been Budget 2018 and Spring Statement 2019. This Convergence Programme draws on those publications, particularly Budget 2018.
1.5 The forecasts for the economy and public finances included in the UK’s
Convergence Programme are prepared by the independent Office for Budget Responsibility (OBR). Information on the OBR’s mandate is set out in Chapter
4. The forecasts set out in the Convergence Programme are from the OBR’s
March 2019 Economic and fiscal outlook, which was published alongsideSpring Statement 2019.
1.6 Under Section 5 of the European Communities (Amendment) Act 1993, Parliament is required to approve the government’s assessment of the UK’s
medium-term economic and budgetary position. This forms the basis of the UK’s Convergence Programme. The UK presents copies of its Convergence
Programme to Parliament.
Structure of the Convergence Programme 1.7 The first four chapters of this Convergence Programme set out the
government’s policy on the fiscal position, sustainability of the public
4
finances and the macro-economy, as required by the Stability and Growth Pact Code of Conduct.
1.8 Detail on the OBR’s economic and fiscal forecasts is set out separately in
Annex A of the Convergence Programme, drawing upon the OBR’s March 2019 Economic and fiscal outlook. Annex A also contains details of the OBR’s assumptions and judgements regarding the UK’s exit from the
European Union.
1.9 Annex B provides details of the financial impact of Budget 2018 policy decisions. Annex C provides supplementary data.
5
Chapter 2
Overall policy framework and objectives
2.1 In November 2016, the Chancellor announced that the government would move to a single fiscal event each year. Budgets are now delivered in the autumn. The Budget 2018 was delivered on 29 October 2018.
2.2 The Office for Budget Responsibility (OBR) is still required by law to produce two forecasts a year. One of these remains at Budget, while the other falls in the spring which the government responds to with a Spring Statement. The Spring Statement 2019 was delivered on 13 March 2019.
2.3 The following chapters are from the Budget 2018 document. Please note that where these chapters reference the OBR forecast, they refer to the October 2018 vintage. Where discrepancies exist, the OBR’s March 2019
‘Economic and fiscal outlook’ should now take precedence.
9Budget 2018
1 Economy and public finances
Economic context
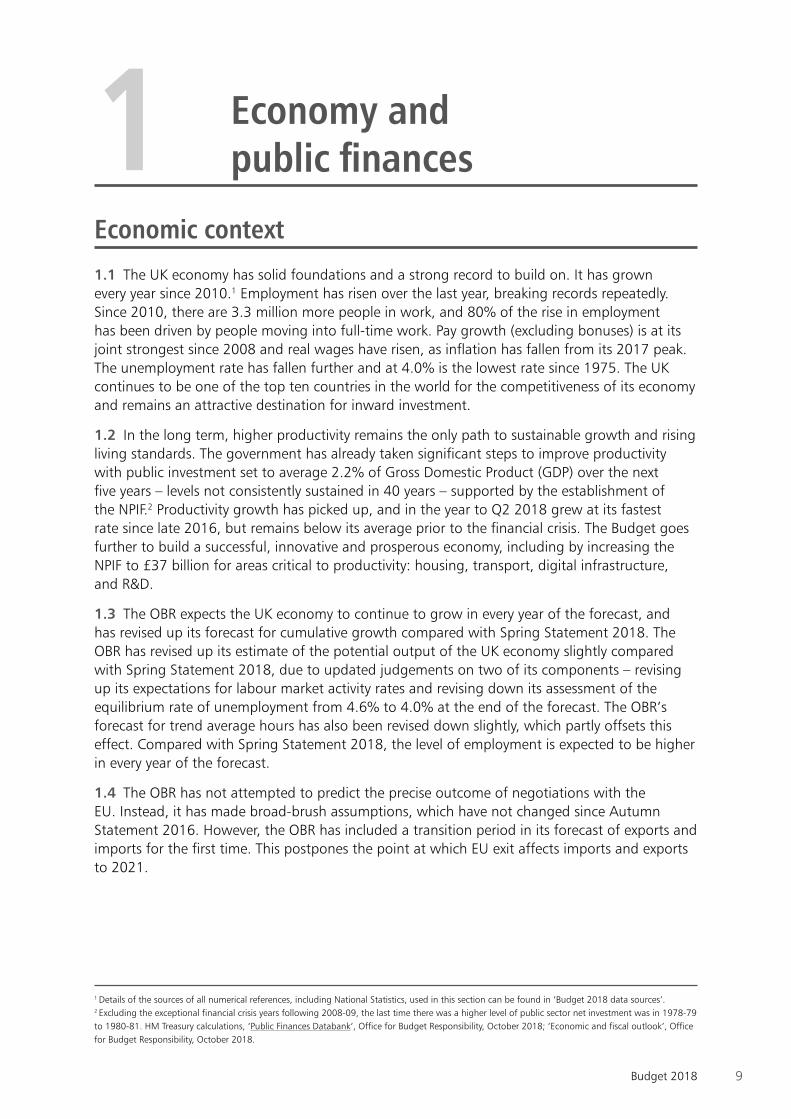
1.1 The UK economy has solid foundations and a strong record to build on. It has grown every year since 2010.1 Employment has risen over the last year, breaking records repeatedly. Since 2010, there are 3.3 million more people in work, and 80% of the rise in employment has been driven by people moving into full-time work. Pay growth (excluding bonuses) is at its joint strongest since 2008 and real wages have risen, as inflation has fallen from its 2017 peak. The unemployment rate has fallen further and at 4.0% is the lowest rate since 1975. The UK continues to be one of the top ten countries in the world for the competitiveness of its economy and remains an attractive destination for inward investment.
1.2 In the long term, higher productivity remains the only path to sustainable growth and rising living standards. The government has already taken significant steps to improve productivity with public investment set to average 2.2% of Gross Domestic Product (GDP) over the next five years – levels not consistently sustained in 40 years – supported by the establishment of the NPIF.2 Productivity growth has picked up, and in the year to Q2 2018 grew at its fastest rate since late 2016, but remains below its average prior to the financial crisis. The Budget goes further to build a successful, innovative and prosperous economy, including by increasing the NPIF to £37 billion for areas critical to productivity: housing, transport, digital infrastructure, and R&D.
1.3 The OBR expects the UK economy to continue to grow in every year of the forecast, and has revised up its forecast for cumulative growth compared with Spring Statement 2018. The OBR has revised up its estimate of the potential output of the UK economy slightly compared with Spring Statement 2018, due to updated judgements on two of its components – revising up its expectations for labour market activity rates and revising down its assessment of the equilibrium rate of unemployment from 4.6% to 4.0% at the end of the forecast. The OBR’s forecast for trend average hours has also been revised down slightly, which partly offsets this effect. Compared with Spring Statement 2018, the level of employment is expected to be higher in every year of the forecast.
1.4 The OBR has not attempted to predict the precise outcome of negotiations with the EU. Instead, it has made broad-brush assumptions, which have not changed since Autumn Statement 2016. However, the OBR has included a transition period in its forecast of exports and imports for the first time. This postpones the point at which EU exit affects imports and exports to 2021.
1 Details of the sources of all numerical references, including National Statistics, used in this section can be found in ‘Budget 2018 data sources’.2 Excluding the exceptional financial crisis years following 2008-09, the last time there was a higher level of public sector net investment was in 1978-79 to 1980-81. HM Treasury calculations, ‘Public Finances Databank‘, Office for Budget Responsibility, October 2018; ‘Economic and fiscal outlook’, Office for Budget Responsibility, October 2018.

10 Budget 2018
Global economy1.5 Global growth remained solid in the first half of 2018, with G20 GDP growth of 1.0% in Q2 2018, up from 0.9% in the previous two quarters. Momentum in the US economy remains strong, but growth in the euro area has moderated, and developments in emerging economies have been mixed. The OBR forecasts that global growth will be 3.7% in 2018 and in 2019, 0.2 percentage points lower in both years than at Spring Statement 2018. Downside risks have risen, as trade tensions have increased and financial conditions have tightened in emerging economies.
UK economy
Growth
1.6 The Office for National Statistics (ONS) estimates that the UK economy grew by 1.7% in real terms in 2017. Growth slowed at the start of 2018 to 0.1% in Q1 2018, but increased to 0.4% in Q2 2018. Q1 2018 was weaker than the OBR expected in its Spring Statement 2018 forecast, but Q2 2018 was in line with its expectations.
1.7 The OBR forecasts that GDP will grow by 0.5% in Q3 2018 and 0.4% in Q4 2018, and expects annual GDP growth of 1.3% in 2018 and 1.6% in 2019. GDP growth dips slightly to 1.4% in 2020 and 2021, and then increases to 1.6% by 2023 (Chart 1.1).
Chart 1.1: UK GDP – contributions to annual GDP growth
Source: Office for National Statistics and Office for Budget Responsibility.
2010 2011 2012 2013 2014 2015 2016 2017 2018 2019 2020 2021 2022 2023-1.0
-0.5
0.0
0.5
1.0
1.5
2.0
2.5
3.0
3.5
Private consumption Fixed investment Net trade
Government Other GDP (% change)
Perc
enta
ge
po
ints
Forecast
1.8 Household consumption growth was 1.8% in 2017. In the first six months of 2018 household consumption grew by 0.8%, up slightly on the second half of 2017. The OBR’s forecast for consumption growth has been revised up in the near term, due to a stronger forecast for employment growth. Consumption growth is expected to dip slightly from 1.3% in 2018 to 1.2% in 2019 and 2020, before rising gradually to 1.5% in 2023.
11Budget 2018
1.9 Business investment grew by 1.8% in 2017, but has subsequently fallen by 0.5% in Q1 2018 and by 0.7% in Q2 2018. The OBR expects business investment to grow by 0.5% in 2018, before rising by 2.3% in 2019. Thereafter, business investment is forecast to grow by around 2.1% a year.
1.10 In 2017, export and import volumes grew by 5.7% and 3.2% respectively. Since export growth exceeded that of imports, net trade contributed positively to GDP growth, adding 0.7 percentage points in 2017. In the first half of 2018, both export and import volumes have declined, though imports have declined by less. As a result, net trade has made a negative contribution to quarterly GDP growth over this period. The OBR has revised down its forecast for the contribution of net trade to GDP growth in the near term, although it still expects net trade to make a positive contribution to GDP growth in 2018 of 0.2 percentage points. The OBR then expects net trade to subtract 0.1 percentage points from GDP growth in 2019 and 2020. Net trade makes no contribution to GDP growth in 2021 and 2022, and then subtracts 0.1 percentage points from GDP growth in 2023.
Prices
1.11 Consumer Prices Index (CPI) inflation stood at 2.4% in September, a decrease from August’s figure of 2.7%, and below its recent peak of 3.1% in November 2017. CPI inflation fell at the start of 2018; was steady from April to June at 2.4%; but increased in July and August, in part due to developments in global energy prices. The ONS’s headline measure of inflation, the Consumer Prices Index including owner occupiers’ housing costs (CPIH) inflation, was 2.2% in September, a slight decrease from 2.4% in August.3 The OBR forecasts CPI inflation to be 2.6% in 2018 and it is then expected to be around 2.0% for the rest of the forecast period.
3 CPIH extends CPI to include costs associated with owning, maintaining and living in one’s own home as well as council tax.
12 Budget 2018
Box 1.A: The government’s use of inflation indices
The government and the private sector make wide use of measures of inflation. The government uses measures of inflation to uprate some taxes and benefits; to determine changes in rail fares, reflecting industry costs; to uprate the rate of interest on student loans; when setting the inflation target for the Bank of England; and as the reference rate for government bonds linked to inflation. In the private sector, inflation is used in some wage agreements; to uprate certain pension payments, particularly defined benefit pensions; and in financial markets. However, there is not a single measure of inflation and the quality of different measures varies.
The ONS, regulated by the UK Statistics Authority (UKSA), produces a range of inflation statistics. The most widely used are CPI and the Retail Prices Index (RPI). Despite measuring the same concept, they use different methodologies and produce different estimates of the rate of inflation. In 2013, as a result of flaws in the way it is measured, RPI lost its status as a National Statistic.a In 2015, the Johnson Review recommended that government and regulators should work towards ending the use of RPI as soon as practicable.b
Since 2010, the government has been reducing its use of RPI. The indexation of direct taxes, benefits, public sector pensions and the State Pension have all moved from RPI to CPI. More recently, the government changed the indexation of business rates to CPI from April 2018, and NS&I has announced it will change the indexation of maturing Index-linked Savings Certificates to CPI from May 2019.
Given the extensive use of RPI across the public and private sectors, moves away from RPI are complex and potentially costly. For instance, switching the remaining uses of RPI to CPI for indirect taxes would come with substantial costs for the Exchequer. At the same time, the prices statistics landscape has evolved. Therefore, it has at times been unclear which measure of inflation it would be appropriate to use. In 2013, the ONS started publishing CPIH. After extensive statistical development, CPIH became the ONS’s main measure of inflation in March 2017 and gained National Statistic status from the UKSA in July that year.c
The government’s objective is that CPIH will become its headline measure over time and that it will reduce the use of RPI when and where practicable. CPIH is conceptually the best measure of inflation, but is relatively new and work is ongoing to understand its properties compared to CPI and RPI. As previously stated, while all index-linked debt is currently indexed to RPI, the government keeps issuance of potential new debt instruments under review.d Further moves away from RPI are complex and more work is required to understand the costs and benefits of any changes, including through consultation with stakeholders. Any changes will require an orderly transition, likely over an extended period of time. Until then, the government will not introduce new uses of RPI.
a ‘Assessment of the Compliance with the Code of Practice for Official Statistics’, UKSA, 2013.b ‘UK Consumer Price Statistics: A Review’, Paul Johnson, UKSA, 2015.c ‘Letter from Ed Humpherson, Director General for Regulation, UKSA, to John Pullinger, National Statistician’, UKSA, 2017.d ‘Managing fiscal risks: government response to the 2017 Fiscal risks report’, HM Treasury, 2018.
Productivity, labour markets and earnings
1.12 UK labour productivity (measured as output per hour) has picked up recently and grew by 0.8% in 2017. Productivity was subdued at the start of 2018, falling in the first quarter, but rose in Q2 2018, due to higher output and a slight fall in hours worked. Quarterly movements can be volatile and on a more stable quarter-on-year basis, productivity grew by 1.4% in the year to Q2 2018 – its fastest quarter-on-year growth rate since Q4 2016, but remaining below its average prior to the financial crisis of 2.2%.
1.13 The OBR forecasts productivity growth of 0.8% in 2018 and 2019.4 Over the medium term, productivity growth is expected to increase to 0.9% in 2020, and then to 1.2% in 2023.
4 The OBR’s productivity growth forecast is based on non-North Sea Gross Value Added (GVA) per hour, which is different from the ONS’s headline productivity growth measure.
13Budget 2018
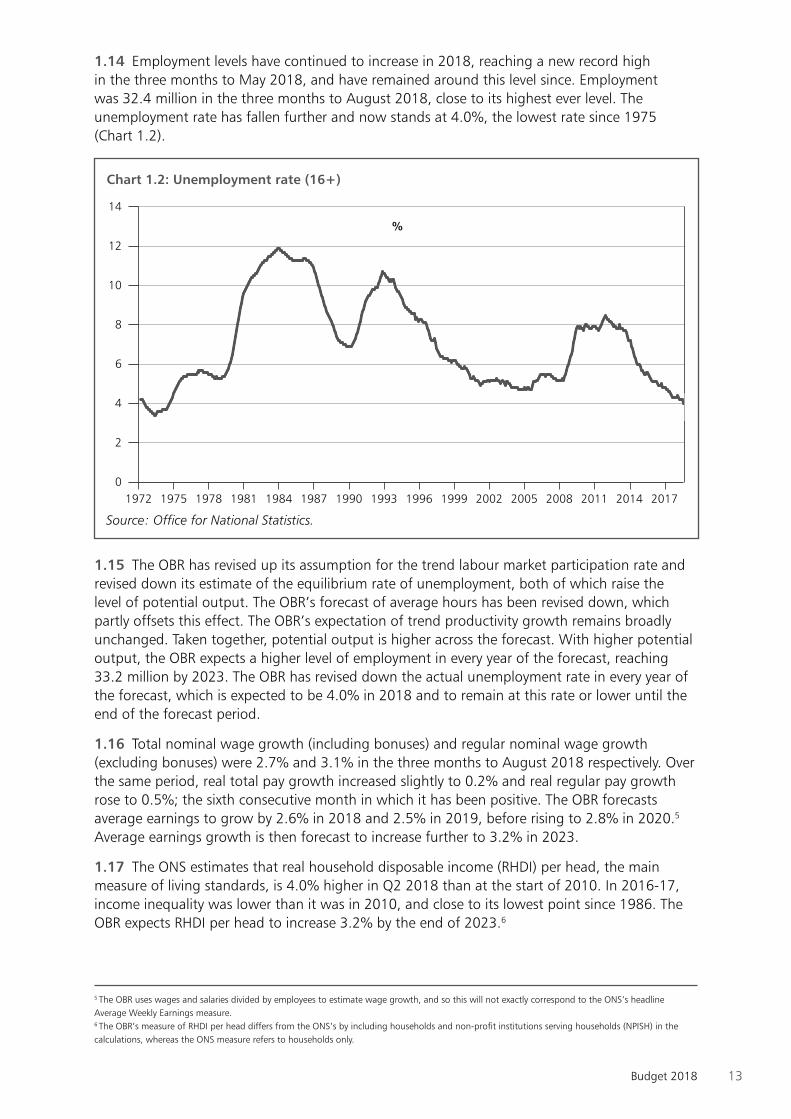
1.14 Employment levels have continued to increase in 2018, reaching a new record high in the three months to May 2018, and have remained around this level since. Employment was 32.4 million in the three months to August 2018, close to its highest ever level. The unemployment rate has fallen further and now stands at 4.0%, the lowest rate since 1975 (Chart 1.2).
Source: Office for National Statistics.
%
1972 1975 1978 1981 1984 1987 1990 1993 1996 1999 2002 2005 2008 2011 2014 2017
Chart 1.2: Unemployment rate (16+)
0
2
4
6
8
10
12
14
1.15 The OBR has revised up its assumption for the trend labour market participation rate and revised down its estimate of the equilibrium rate of unemployment, both of which raise the level of potential output. The OBR’s forecast of average hours has been revised down, which partly offsets this effect. The OBR’s expectation of trend productivity growth remains broadly unchanged. Taken together, potential output is higher across the forecast. With higher potential output, the OBR expects a higher level of employment in every year of the forecast, reaching 33.2 million by 2023. The OBR has revised down the actual unemployment rate in every year of the forecast, which is expected to be 4.0% in 2018 and to remain at this rate or lower until the end of the forecast period.
1.16 Total nominal wage growth (including bonuses) and regular nominal wage growth (excluding bonuses) were 2.7% and 3.1% in the three months to August 2018 respectively. Over the same period, real total pay growth increased slightly to 0.2% and real regular pay growth rose to 0.5%; the sixth consecutive month in which it has been positive. The OBR forecasts average earnings to grow by 2.6% in 2018 and 2.5% in 2019, before rising to 2.8% in 2020.5 Average earnings growth is then forecast to increase further to 3.2% in 2023.
1.17 The ONS estimates that real household disposable income (RHDI) per head, the main measure of living standards, is 4.0% higher in Q2 2018 than at the start of 2010. In 2016-17, income inequality was lower than it was in 2010, and close to its lowest point since 1986. The OBR expects RHDI per head to increase 3.2% by the end of 2023.6
5 The OBR uses wages and salaries divided by employees to estimate wage growth, and so this will not exactly correspond to the ONS’s headline Average Weekly Earnings measure.6 The OBR’s measure of RHDI per head differs from the ONS’s by including households and non-profit institutions serving households (NPISH) in the calculations, whereas the ONS measure refers to households only.

14 Budget 2018
Table 1.1: Summary of the OBR’s central economic forecast (percentage change on a year earlier, unless otherwise stated)1
Forecast
2017 2018 2019 2020 2021 2022 2023
GDP 1.7 1.3 1.6 1.4 1.4 1.5 1.6
GDP per capita 1.1 0.6 1.0 0.9 0.9 1.0 1.1
Main components of GDP
Household consumption2 1.8 1.3 1.2 1.2 1.3 1.4 1.5
General government consumption -0.1 1.0 2.1 2.0 1.7 1.6 1.6
Fixed investment 3.3 1.0 2.9 1.8 1.8 1.9 2.0
Business 1.8 0.5 2.3 2.1 2.1 2.1 2.2
General government 1.7 -0.2 5.7 3.3 1.8 0.9 1.4
Private dwellings3 8.1 7.0 3.0 -0.1 0.8 2.3 1.9
Change in inventories4 -0.5 -0.2 0.1 0.0 0.0 0.0 0.0
Net trade4 0.7 0.2 -0.1 -0.1 0.0 0.0 -0.1
CPI inflation 2.7 2.6 2.0 2.0 2.1 2.1 2.0
Employment (millions) 32.1 32.4 32.7 32.9 33.0 33.1 33.2
LFS unemployment (% rate)5 4.4 4.0 3.7 3.8 3.9 3.9 4.0
Productivity per hour 0.8 0.8 0.8 0.9 1.0 1.1 1.21 All figures in this table are rounded to the nearest decimal place. This is not intended to convey a degree of unwarranted accuracy. Components may
not sum to total due to rounding and the statistical discrepancy.2 Includes households and non-profit institutions serving households.3 Includes transfer costs of non-produced assets.4 Contribution to GDP growth, percentage points.5 Labour Force Survey.
Source: Office for National Statistics and Office for Budget Responsibility.
Current account
1.18 The current account balance consists of the trade balance, the primary income balance, which is mainly net investment income, and finally, other transfers. In 2017, the current account balance narrowed to a deficit of 3.7% of GDP from 5.2% in 2016. The main reason for the narrowing in the current account deficit was the largest annual improvement in the primary income balance since records began in 1946; this narrowed to a deficit of 1.6% of GDP in 2017 from 2.5% of GDP. In Q2 2018, the current account deficit widened to 3.9% of GDP from 3.0% of GDP in Q1 2018. The OBR expects the current account deficit to narrow to 3.5% in 2018 and to widen to 3.8% in 2019. The current account deficit then narrows to 3.2% in 2023.
Monetary policy1.19 The Monetary Policy Committee (MPC) of the Bank of England has full operational independence to set monetary policy. The MPC sets monetary policy to meet the 2% inflation target, and in a way that helps to sustain growth and employment. It is therefore a critical element of the UK’s macroeconomic framework.
1.20 Low and stable inflation supports living standards and provides certainty for households and businesses. This helps households and businesses make efficient decisions about saving, investment and spending. At its meeting concluding on 12 September, the MPC voted to maintain its policy rate at 0.75%, having increased it from 0.5% in August.7
7 ‘Monetary Policy Summary and minutes of the Monetary Policy Committee meeting ending on 12 September 2018’, Bank of England, September 2018.
15Budget 2018
1.21 The Chancellor is responsible for setting the MPC’s remit. In the Budget, the Chancellor reaffirms the symmetric inflation target of 2% for the 12-month increase in the CPI measure of inflation, which applies at all times.8 The government also confirms that the Asset Purchase Facility (APF) will remain in place for the financial years 2018-19 and 2019-20.
8 ‘Monetary policy remit: Budget 2018’, HM Treasury, October 2018.
16 Budget 2018
Public finances
1.22 The government has taken a balanced approach to the public finances since 2016, focusing on getting debt falling, while supporting public services, investing in the economy and keeping taxes low. This followed the necessary actions since 2010 to restore the public finances to health, and the deficit has been reduced by four-fifths from a post-war high of 9.9% of GDP in 2009-10 to 1.9% in 2017-18.9 The public finances have now reached a turning point. The government has met its near-term fiscal rules and debt has begun its first sustained fall in a generation.
1.23 The need for fiscal discipline continues as, despite the improvement, debt currently remains too high at over 80% of GDP or around £65,000 per household.10 Spending on debt interest, if it were a ministry, would be the third-largest government department after health and education.11 Continuing to reduce borrowing and debt is important to enhancing the UK’s economic resilience, improving fiscal sustainability, and lessening the debt interest burden on future generations.
1.24 The fiscal rules approved by Parliament in January 2017 commit the government to reducing the cyclically-adjusted deficit to below 2% of GDP by 2020-21 and having debt as a share of GDP falling in 2020-21.12 These rules will guide the UK towards a balanced budget by the middle of the next decade. The OBR forecasts that the government has met both its near-term fiscal targets in 2017-18, three years early, and will meet them in the target year.
1.25 The Budget continues the government’s balanced approach to fiscal policy; continuing to reduce debt, while also supporting vital public services, keeping taxes low and investing in Britain’s future. Before measures announced in the Budget, the OBR’s forecast shows a significant improvement to the underlying fiscal outlook since Spring Statement 2018. This improvement has allowed the government, in the Budget, to fund the five-year NHS settlement, increase day-to-day spending on public services in real terms, cut taxes for millions of households, whilst reducing borrowing and keeping debt falling in every year of the forecast. Borrowing and debt are now forecast to be lower in every year than at Spring Statement, and headroom against the fiscal mandate has been maintained at £15.4 billion in the target year.
The fiscal outlook1.26 The public finances have performed significantly better than forecast in March 2018. Compared with the Spring Statement 2018 forecast, public sector net borrowing (PSNB) was £5.4 billion lower at 1.9% of GDP in 2017-18 due mainly to lower spending than forecast.13 Strong and broad-based receipts growth in the first half of 2018-19 has helped reduce forecast borrowing by £11.6 billion compared with Spring Statement to 1.2% of GDP this year. Public sector net debt (PSND) has now peaked as a share of GDP at 85.2% in 2016-17 and falls to 83.7% this year, 1.8% of GDP below the Spring Statement forecast.14
9 ‘Public sector finances: September 2018’, ONS, October 2018.10 ‘Public sector finances: September 2018’, ONS, October 2018; ‘Families and households’, ONS, November 2017 and HM Treasury calculations.11 Details of the sources used for this calculation can be found in ‘Budget 2018 data sources’.12 ‘Charter for Budget Responsibility: autumn 2016 update’, HM Treasury, January 2017.13 ‘Public sector finances: September 2018’, ONS, October 2018; ‘Economic and fiscal outlook: March 2018’, OBR, March 2018.14 ‘Public sector finances: September 2018’, ONS, October 2018; ‘Economic and fiscal outlook: March 2018’, OBR, March 2018.

17Budget 2018
1.27 This stronger starting fiscal position coupled with higher forecast levels of employment has improved the fiscal outlook in every year of the forecast. Compared with Spring Statement, the main changes to the forecast are due to a combination of the following factors:
• underlying receipts are higher in every year of the forecast. Excluding a broadly fiscallyneutral change in the treatment of Value Added Tax (VAT) refunds by the ONS, receipts arehigher by £7.4 billion in 2018-19 and £14.1 billion by 2022-23.15 This primarily reflectsstrong outturn data since April 2018 and higher levels of employment across the forecastcompared to Spring Statement 2018.
• underlying spending is forecast to be £4.5 billion lower in 2018-19 and £4.1 billion lowerin 2022-23, excluding ONS’ treatment of VAT refunds. The lower spending is due todownward revisions to the forecasts for welfare spending (due to lower unemployment),debt interest and tax litigation compared to Spring Statement.
• classification and other changes reduce borrowing by £0.8 billion in 2018-19 and£1.2 billion in 2022-23, predominantly because of the reclassification of Welsh and ScottishHousing Associations and the improvement to the recording of fines and penalties for thelate payment of taxes.16
• measures taken by the government in the Budget, and described in Chapter 2, increaseborrowing by £1.1 billion in 2018-19 and by £18.8 billion in 2022-23.
Table 1.2: Changes to the OBR’s forecast for public sector net borrowing since March 2018 (£ billion)
2018-19 2019-20 2020-21 2021-22 2022-23
Spring Statement 2018 37.1 33.9 28.7 26.0 21.4
Total forecast changes since Spring Statement 20181 -12.7 -13.1 -12.8 -15.9 -19.3
of which
Receipts forecast -7.4 -8.0 -8.0 -11.2 -14.1
Spending forecast -4.5 -4.1 -3.7 -3.5 -4.1
Classification and other changes (including net VAT refund change) -0.8 -1.1 -1.1 -1.2 -1.2
Total effect of government decisions since Spring Statement 2018 1.1 10.9 10.7 13.7 18.8
Total changes since Spring Statement 2018 -11.6 -2.1 -2.1 -2.2 -0.6
Budget 2018 25.5 31.8 26.7 23.8 20.8Figures may not sum due to rounding.1 Equivalent to lines from Table 1.3 of the OBR (October 2018) ‘Economic and fiscal outlook’; full references available in ‘Budget 2018 data sources’.
Source: Office for Budget Responsibility and HM Treasury calculations.
1.28 Compared with Spring Statement, borrowing is lower in every year of the forecast and falls as a share of GDP from 1.4% in 2019-20 to 0.8% of GDP in 2023-24, its lowest level since 2001-02.17 The ONS’ outturn data show the UK’s Treaty deficit was 2.0% of GDP in 2017-18,18 below the 3.0% of GDP target agreed in the Stability and Growth Pact.19 The OBR forecasts it will remain below 3.0% of GDP during the forecast period.
15 The revision comes as a result of HMRC and ONS work to improve data for VAT refunds (that adds to receipts and spending in broadly equal measure). Further information available at ‘Public sector finances: September 2018’, ONS, October 2018.16 ‘Public sector finances: June 2018’, ONS, July 2018, ‘Public sector finances: September 2018’, ONS, October 2018.17 ‘Public finances databank’, OBR, October 2018.18 ‘UK government debt and deficit: June 2018’, ONS, October 2018.19 Treaty deficit is general government net borrowing on a Maastricht basis see ‘Budget 2018 data sources’ for more information.

18 Budget 2018
Table 1.3: Overview of the OBR’s borrowing forecast as a percentage of GDP
Outturn Forecast
2017-18 2018-19 2019-20 2020-21 2021-22 2022-23 2023-24
Public sector net borrowing 1.9 1.2 1.4 1.2 1.0 0.9 0.8
Cyclically-adjusted public sector net borrowing 1.9 1.3 1.6 1.3 1.1 0.9 0.8
Treaty deficit1 2.0 1.3 1.5 1.3 1.3 0.9 0.7
Memo: Output gap2 0.1 0.3 0.3 0.2 0.1 0.1 0.11 General government net borrowing on a Maastricht basis.2 Output gap measured as a percentage of potential GDP.
Source: Office for National Statistics and Office for Budget Responsibility.
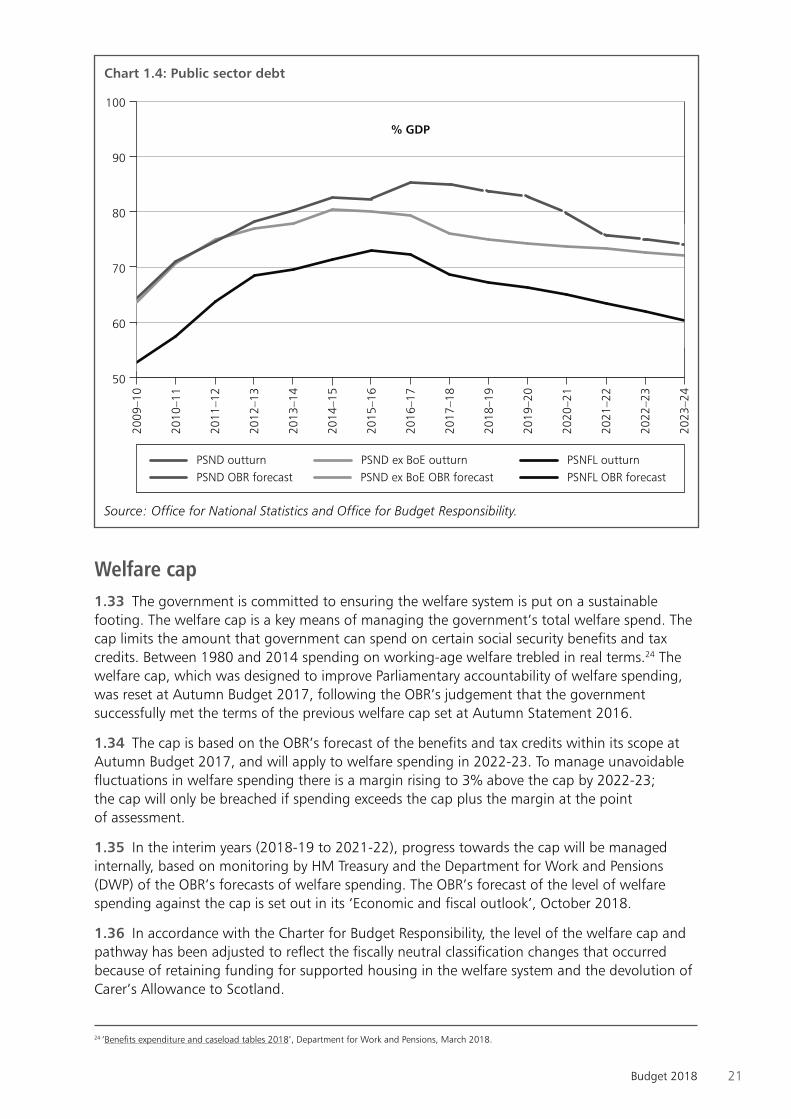
1.29 Compared with Spring Statement, debt is also lower in every year of the forecast as a share of GDP. Debt peaked at over 85% of GDP in 2016-17 and is forecast to fall in every year of the forecast, reaching 74.1% of GDP in 2023-24.20 Public sector net debt excluding the Bank of England (PSND ex BoE) is forecast to decline in every year from 76.0% of GDP last year, to 72.0% of GDP in 2023-24. Public sector net financial liabilities (PSNFL) is also forecast to continue to fall in every year from 68.7% of GDP last year to 60.3% of GDP in 2023-24.
Table 1.4: Overview of the OBR’s debt forecast as a percentage of GDP
Outturn3 Forecast
2017-18 2018-19 2019-20 2020-21 2021-22 2022-23 2023-24
Public sector net debt1 85.0 83.7 82.8 79.7 75.7 75.0 74.1
Public sector net debt ex Bank of England1 76.0 74.9 74.3 73.8 73.3 72.7 72.0
Public sector net financial liabilities1 68.7 67.2 66.3 65.0 63.4 61.9 60.3
Treaty debt2 85.6 85.0 84.1 83.2 82.7 81.8 80.81 Debt and liabilities at end of March; GDP centred on end of March.2 General government gross debt on a Maastricht basis.3 Nominal GDP Q3 2018 has not yet been published therefore GDP centred on end of March is an estimate.
Source: Office for National Statistics and Office for Budget Responsibility.
20 ‘Public finances databank’, OBR, October 2018.
19Budget 2018
Box 1.B: Managing fiscal risks
In July 2017, the OBR published their first biennial ‘Fiscal risks report’ (FRR), providing the UK’s first ever survey of the risks to the public finances.21 It was recognised by the International Monetary Fund (IMF), OECD, and other experts as the most comprehensive report of its kind and the only one produced by an independent body. The report highlighted 57 different risks to the UK’s public finances, relating to the macroeconomy, financial sector, and government revenue, spending and the balance sheet.
In July 2018, in line with its commitments under the Charter for Budget Responsibility, the government published ‘Managing fiscal risks’ (MFR) which provides a detailed account of the actions that the government is taking to address the risks identified by the OBR.22 In doing so, the report provides a mechanism for Parliament and the public to assess the government’s strategies for managing these risks, and hold it to account for their implementation. Its publication reaffirms the UK’s place at the international frontier of fiscal transparency and accountability and supports the government’s long-term fiscal strategy.
MFR highlights the range of policy and management reforms the government has introduced to reduce risks to the fiscal outlook. This includes stronger regulation to reduce the likelihood and cost of financial crises, adapting the tax system to a rapidly changing global economy, ensuring the pension system keeps pace with increasing longevity, tighter controls over the issuance of government loans and guarantees, and actions to reduce the government’s inflation exposure.
Drawing on the fiscal stress test included in the OBR’s FRR, the report also underscores the need to continue to make progress in reducing debt. Governments with high levels of debt are more vulnerable to economic shocks and have less room to mitigate their impact on households and businesses, with consequences for the length and depth of the resulting recessions. Reducing debt also ensures that taxpayers’ money funds vital public services rather than debt interest payments, and avoids burdening the next generation.
Performance against the fiscal rules2122
1.30 The Charter for Budget Responsibility, approved by Parliament in January 2017, sets out the government’s fiscal rules. The government’s objective for fiscal policy is to return the public finances to balance by the middle of the next decade, with interim targets to reduce the cyclically-adjusted deficit to below 2% of GDP by 2020-21 (the fiscal mandate), and to get debt falling as a share of GDP in 2020-21 (the supplementary debt target).
The fiscal mandate
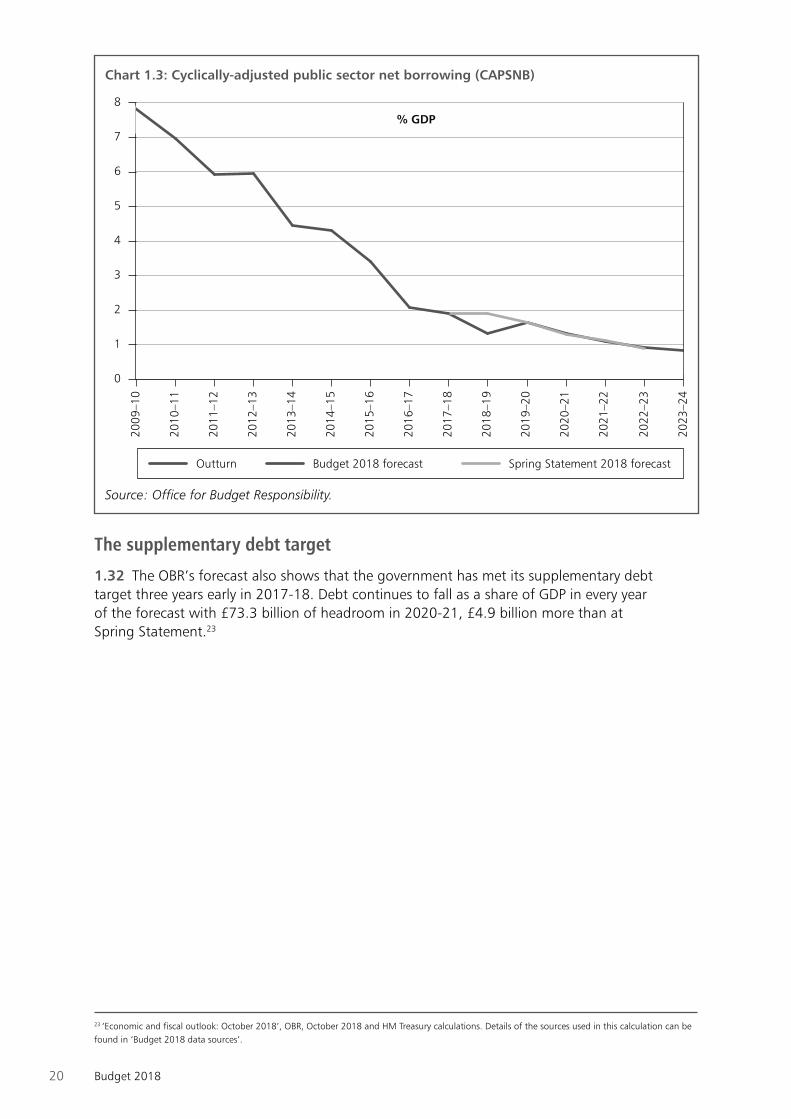
1.31 The OBR’s ‘Economic and fiscal outlook’ shows that the government is forecast to have met the 2% cyclically-adjusted deficit rule three years early in 2017-18, with cyclically-adjusted borrowing at 1.3% of GDP in the target year of 2020-21. Compared with the Spring Statement, cyclically-adjusted borrowing is the same or lower in every year of the forecast. The OBR judges that on current policy, the government has a 65% chance of achieving the fiscal mandate in 2020-21. Given uncertainties in the fiscal outlook the government has retained £15.4 billion of headroom in the target year.
21 ‘Fiscal risks report 2017’, OBR, July 2017.22 ‘Managing fiscal risks: government response to the 2017 Fiscal risks report’, HM Treasury, July 2018.
20 Budget 2018
Chart 1.3: Cyclically-adjusted public sector net borrowing (CAPSNB)
Source: Office for Budget Responsibility.
Outturn Budget 2018 forecast Spring Statement 2018 forecast
2009
–10
2010
–11
2011
–12
2012
–13
2013
–14
2014
–15
2015
–16
2016
–17
2017
–18
2018
–19
2019
–20
2020
–21
2021
–22
2022
–23
2023
–24
% GDP
0
1
2
3
4
5
6
7
8
The supplementary debt target
1.32 The OBR’s forecast also shows that the government has met its supplementary debt target three years early in 2017-18. Debt continues to fall as a share of GDP in every year of the forecast with £73.3 billion of headroom in 2020-21, £4.9 billion more than at Spring Statement.23
23 ‘Economic and fiscal outlook: October 2018’, OBR, October 2018 and HM Treasury calculations. Details of the sources used in this calculation can be found in ‘Budget 2018 data sources’.
21Budget 2018
Chart 1.4: Public sector debt
Source: Office for National Statistics and Office for Budget Responsibility.
PSND outturnPSND OBR forecast
PSNFL outturnPSNFL OBR forecast
PSND ex BoE outturnPSND ex BoE OBR forecast
2009
–10
2010
–11
2011
–12
2012
–13
2013
–14
2014
–15
2015
–16
2016
–17
2017
–18
2018
–19
2019
–20
2020
–21
2021
–22
2022
–23
2023
–24
% GDP
50
60
70
80
90
100
Welfare cap1.33 The government is committed to ensuring the welfare system is put on a sustainable footing. The welfare cap is a key means of managing the government’s total welfare spend. The cap limits the amount that government can spend on certain social security benefits and tax credits. Between 1980 and 2014 spending on working-age welfare trebled in real terms.24 The welfare cap, which was designed to improve Parliamentary accountability of welfare spending, was reset at Autumn Budget 2017, following the OBR’s judgement that the government successfully met the terms of the previous welfare cap set at Autumn Statement 2016.
1.34 The cap is based on the OBR’s forecast of the benefits and tax credits within its scope at Autumn Budget 2017, and will apply to welfare spending in 2022-23. To manage unavoidable fluctuations in welfare spending there is a margin rising to 3% above the cap by 2022-23; the cap will only be breached if spending exceeds the cap plus the margin at the point of assessment.
1.35 In the interim years (2018-19 to 2021-22), progress towards the cap will be managed internally, based on monitoring by HM Treasury and the Department for Work and Pensions (DWP) of the OBR’s forecasts of welfare spending. The OBR’s forecast of the level of welfare spending against the cap is set out in its ‘Economic and fiscal outlook’, October 2018.
1.36 In accordance with the Charter for Budget Responsibility, the level of the welfare cap and pathway has been adjusted to reflect the fiscally neutral classification changes that occurred because of retaining funding for supported housing in the welfare system and the devolution of Carer’s Allowance to Scotland.
24 ‘Benefits expenditure and caseload tables 2018’, Department for Work and Pensions, March 2018.
22 Budget 2018
1.37 The OBR judges that on current policy, welfare spending within scope is forecast to be within the welfare cap and margin in every year of the forecast. The government is providing additional support for Universal Credit in the Budget, as set out in Chapter 5.
Public spending1.38 The balanced approach to fiscal policy taken by the government means it has been able to reduce debt and keep taxes low, while investing in the economy and funding the public’s priorities.
1.39 Since 2016, this has allowed the government to provide additional support to public services. This includes: the lifting of the public sector pay cap;25 the provision of over £44 billion of new financial support for housing between 2017-18 and 2022-23 announced at Autumn Budget 2017;26 and over £42 billion of core funding for schools this year.27
1.40 In June 2018, the government announced a substantial five-year settlement for the NHS in England, under which the NHS England budget would increase by £20.5 billion a year in real terms by 2023-24.28 The Budget confirms the cash allocations announced in June.29 In addition, the government has made provision for NHS pension costs until 2023-24, which will be adjusted in line with the confirmed Superannuation Contributions Adjusted for Past Experience (SCAPE) rate change. Devolved administrations will benefit from Barnett consequentials. Chapter 5 provides further detail of the funding and financial tests the government has put in place to ensure the NHS spends this additional money effectively.
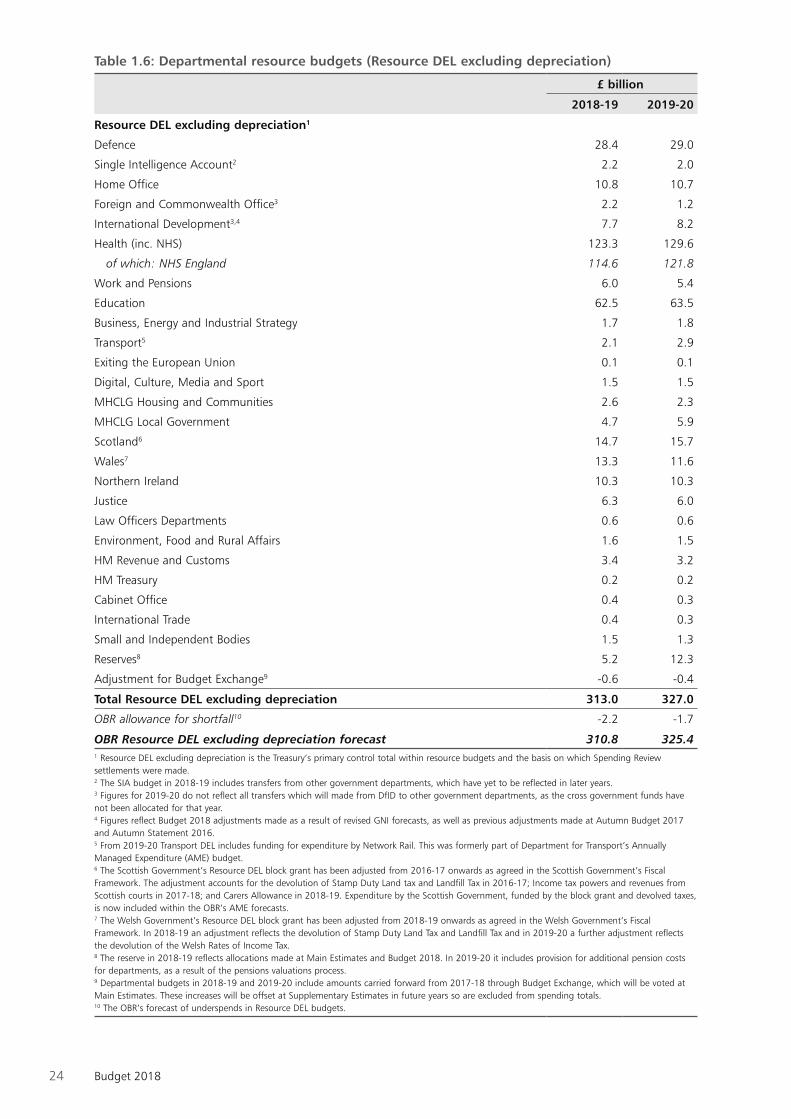
1.41 Spending Review 2015 set individual budgets for all departments. Departmental capital totals (CDEL), the money given to departments for investment, are set until 2020-21, as shown in Table 1.5. Departmental resource totals (RDEL), the money given to departments to spend on day-to-day resources and administration, are set until 2019-20, as shown in Table 1.6.
25 Written Ministerial Statement (HCWS127), Rt Hon Elizabeth Truss MP, 12 September 2017.26 Further information is available at ‘Building the homes the country needs: Autumn Budget 2017 brief’.27 Written Ministerial Statement (HCWS876), Rt Hon Nick Gibb MP, 25 April 2018.28 Further information is available at ‘NHS Funding Settlement’, June 201829 Further information is available at ‘Prime Minister sets out 5-year NHS funding plan’, Department of Health and Social Care, HM Treasury and The Rt Hon Jeremy Hunt MP, June 2018

23Budget 2018
Table 1.5: Departmental capital budgets (Capital DEL)
£ billion
2018-19 2019-20 2020-21
Capital DEL
Defence 9.4 9.8 9.6
Single Intelligence Account 0.6 0.7 0.7
Home Office 0.5 0.5 0.4
Foreign and Commonwealth Office 0.1 0.1 0.1
International Development 2.7 3.7 3.6
Health (inc. NHS) 5.9 6.7 6.8
Work and Pensions 0.3 0.2 0.2
Education 5.6 5.1 4.5
Business, Energy and Industrial Strategy1 10.3 11.5 6.3
Transport2 8.5 15.8 18.4
Exiting the European Union 0.0 0.0 0.0
Digital, Culture, Media and Sport 0.6 0.6 0.5
MHCLG Housing and Communities 9.5 10.8 10.8
MHCLG Local Government 0.0 0.0 0.0
Scotland 3.9 4.5 4.9
Wales 2.0 2.1 2.2
Northern Ireland 1.6 1.5 1.5
Justice 0.6 0.4 0.1
Law Officers Departments 0.0 0.0 0.0
Environment, Food and Rural Affairs 0.6 0.6 0.6
HM Revenue and Customs 0.2 0.2 0.2
HM Treasury 0.2 0.3 0.1
Cabinet Office 0.0 0.0 0.0
International Trade 0.0 0.0 0.0
Small and Independent Bodies 0.3 0.4 0.1
Reserves 1.2 2.2 2.0
Adjustment for Budget Exchange3 -0.8 0.0 0.0
Adjustment for R&D RDEL to CDEL switch4 0.0 0.0 6.5
Total Capital DEL 63.7 77.7 80.1
Remove CDEL not in public sector gross investment5 -11.3 -13.4 -12.1
OBR allowance for shortfall6 -2.2 -2.7 -2.5
Public Sector Gross Investment in CDEL 50.2 61.6 65.51 Full BEIS capital DEL budgets for 2020-21 have not yet been set. See footnote 4.2 From 2019-20 Transport DEL includes funding for expenditure by Network Rail. This was formerly part of Department for Transport’s Annually
Managed Expenditure (AME) budget.3 Departmental budgets in 2018-19 include amounts carried forward from 2017-18 through Budget Exchange, which will be voted at Main Estimates.
These increases will be offset at Supplementary Estimates in future years so are excluded from spending totals.4 As most departmental RDEL budgets have not been set in 2020-21, the OBR has forecast the size of the resource to capital switch for R&D that will
take place in that year.5 Capital DEL that does not form part of public sector gross investment, including financial transactions in capital DEL.6 The OBR’s forecast of underspends in capital DEL budgets.
24 Budget 2018
Table 1.6: Departmental resource budgets (Resource DEL excluding depreciation)
£ billion
2018-19 2019-20
Resource DEL excluding depreciation1
Defence 28.4 29.0
Single Intelligence Account2 2.2 2.0
Home Office 10.8 10.7
Foreign and Commonwealth Office3 2.2 1.2
International Development3,4 7.7 8.2
Health (inc. NHS) 123.3 129.6
of which: NHS England 114.6 121.8
Work and Pensions 6.0 5.4
Education 62.5 63.5
Business, Energy and Industrial Strategy 1.7 1.8
Transport5 2.1 2.9
Exiting the European Union 0.1 0.1
Digital, Culture, Media and Sport 1.5 1.5
MHCLG Housing and Communities 2.6 2.3
MHCLG Local Government 4.7 5.9
Scotland6 14.7 15.7
Wales7 13.3 11.6
Northern Ireland 10.3 10.3
Justice 6.3 6.0
Law Officers Departments 0.6 0.6
Environment, Food and Rural Affairs 1.6 1.5
HM Revenue and Customs 3.4 3.2
HM Treasury 0.2 0.2
Cabinet Office 0.4 0.3
International Trade 0.4 0.3
Small and Independent Bodies 1.5 1.3
Reserves8 5.2 12.3
Adjustment for Budget Exchange9 -0.6 -0.4
Total Resource DEL excluding depreciation 313.0 327.0
OBR allowance for shortfall10 -2.2 -1.7
OBR Resource DEL excluding depreciation forecast 310.8 325.41 Resource DEL excluding depreciation is the Treasury’s primary control total within resource budgets and the basis on which Spending Review settlements were made.2 The SIA budget in 2018-19 includes transfers from other government departments, which have yet to be reflected in later years.3 Figures for 2019-20 do not reflect all transfers which will made from DfID to other government departments, as the cross government funds have not been allocated for that year.4 Figures reflect Budget 2018 adjustments made as a result of revised GNI forecasts, as well as previous adjustments made at Autumn Budget 2017 and Autumn Statement 2016.5 From 2019-20 Transport DEL includes funding for expenditure by Network Rail. This was formerly part of Department for Transport’s Annually Managed Expenditure (AME) budget.6 The Scottish Government’s Resource DEL block grant has been adjusted from 2016-17 onwards as agreed in the Scottish Government’s Fiscal Framework. The adjustment accounts for the devolution of Stamp Duty Land tax and Landfill Tax in 2016-17; Income tax powers and revenues from Scottish courts in 2017-18; and Carers Allowance in 2018-19. Expenditure by the Scottish Government, funded by the block grant and devolved taxes, is now included within the OBR’s AME forecasts.7 The Welsh Government’s Resource DEL block grant has been adjusted from 2018-19 onwards as agreed in the Welsh Government’s Fiscal Framework. In 2018-19 an adjustment reflects the devolution of Stamp Duty Land Tax and Landfill Tax and in 2019-20 a further adjustment reflects the devolution of the Welsh Rates of Income Tax.8 The reserve in 2018-19 reflects allocations made at Main Estimates and Budget 2018. In 2019-20 it includes provision for additional pension costs for departments, as a result of the pensions valuations process.9 Departmental budgets in 2018-19 and 2019-20 include amounts carried forward from 2017-18 through Budget Exchange, which will be voted at Main Estimates. These increases will be offset at Supplementary Estimates in future years so are excluded from spending totals.10 The OBR’s forecast of underspends in Resource DEL budgets.
25Budget 2018
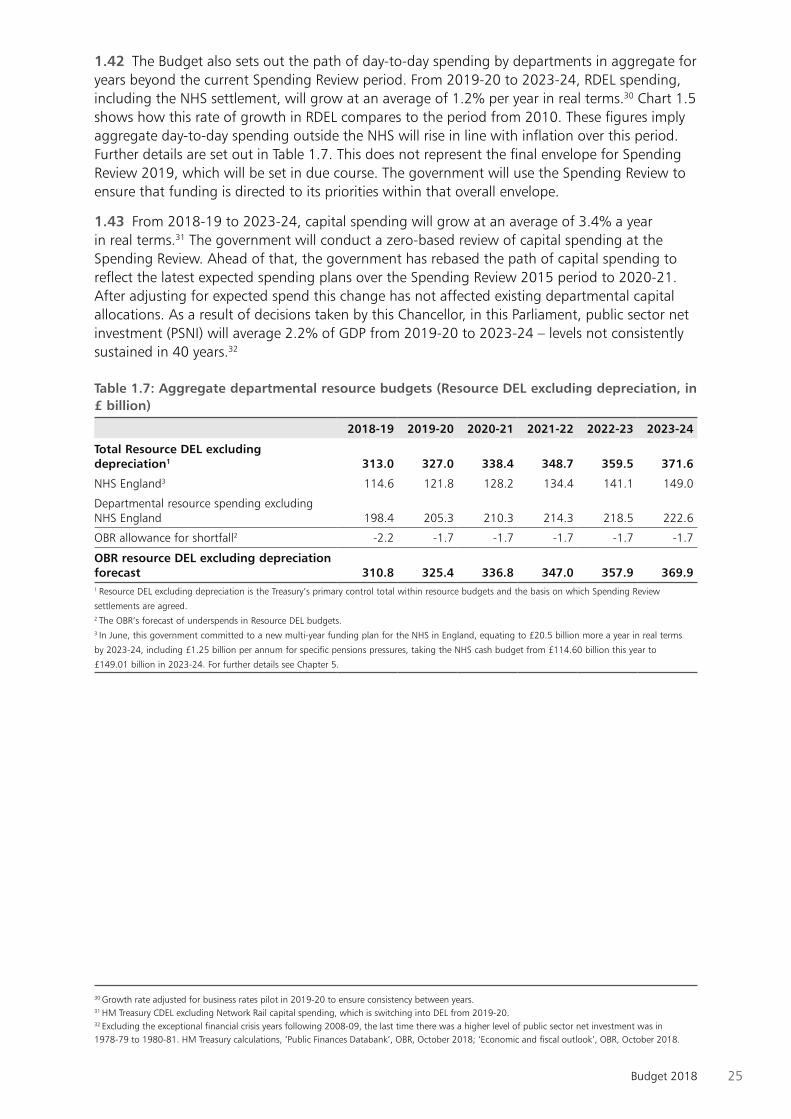
1.42 The Budget also sets out the path of day-to-day spending by departments in aggregate for years beyond the current Spending Review period. From 2019-20 to 2023-24, RDEL spending, including the NHS settlement, will grow at an average of 1.2% per year in real terms.30 Chart 1.5 shows how this rate of growth in RDEL compares to the period from 2010. These figures imply aggregate day-to-day spending outside the NHS will rise in line with inflation over this period. Further details are set out in Table 1.7. This does not represent the final envelope for Spending Review 2019, which will be set in due course. The government will use the Spending Review to ensure that funding is directed to its priorities within that overall envelope.
1.43 From 2018-19 to 2023-24, capital spending will grow at an average of 3.4% a year in real terms.31 The government will conduct a zero-based review of capital spending at the Spending Review. Ahead of that, the government has rebased the path of capital spending to reflect the latest expected spending plans over the Spending Review 2015 period to 2020-21. After adjusting for expected spend this change has not affected existing departmental capital allocations. As a result of decisions taken by this Chancellor, in this Parliament, public sector net investment (PSNI) will average 2.2% of GDP from 2019-20 to 2023-24 – levels not consistently sustained in 40 years.32
Table 1.7: Aggregate departmental resource budgets (Resource DEL excluding depreciation, in £ billion)
2018-19 2019-20 2020-21 2021-22 2022-23 2023-24
Total Resource DEL excluding depreciation1 313.0 327.0 338.4 348.7 359.5 371.6
NHS England3 114.6 121.8 128.2 134.4 141.1 149.0
Departmental resource spending excluding NHS England 198.4 205.3 210.3 214.3 218.5 222.6
OBR allowance for shortfall2 -2.2 -1.7 -1.7 -1.7 -1.7 -1.7
OBR resource DEL excluding depreciation forecast 310.8 325.4 336.8 347.0 357.9 369.91 Resource DEL excluding depreciation is the Treasury’s primary control total within resource budgets and the basis on which Spending Review
settlements are agreed.2 The OBR’s forecast of underspends in Resource DEL budgets.3 In June, this government committed to a new multi-year funding plan for the NHS in England, equating to £20.5 billion more a year in real terms
by 2023-24, including £1.25 billion per annum for specific pensions pressures, taking the NHS cash budget from £114.60 billion this year to
£149.01 billion in 2023-24. For further details see Chapter 5.
30 Growth rate adjusted for business rates pilot in 2019-20 to ensure consistency between years.31 HM Treasury CDEL excluding Network Rail capital spending, which is switching into DEL from 2019-20.32 Excluding the exceptional financial crisis years following 2008-09, the last time there was a higher level of public sector net investment was in 1978-79 to 1980-81. HM Treasury calculations, ‘Public Finances Databank’, OBR, October 2018; ‘Economic and fiscal outlook’, OBR, October 2018.

26 Budget 2018
Source: HM Treasury calculations.
RD
EL e
xclu
din
g d
epre
ciat
ion
(£b
n in
18-
19 p
rice
s)
2010
-11
2011
-12
2012
-13
2013
-14
2014
-15
2015
-16
2016
-17
2017
-18
2018
-19
2019
-20
2020
-21
2022
-23
2023
-24
Chart 1.5: Total Resource DEL excluding depreciation, 2010-11 to 2023-24
250
270
290
310
330
350
370
390
2021
-22
Budget 2018 Spring Statement 2018
(in £ billion real terms)
Financial transactions
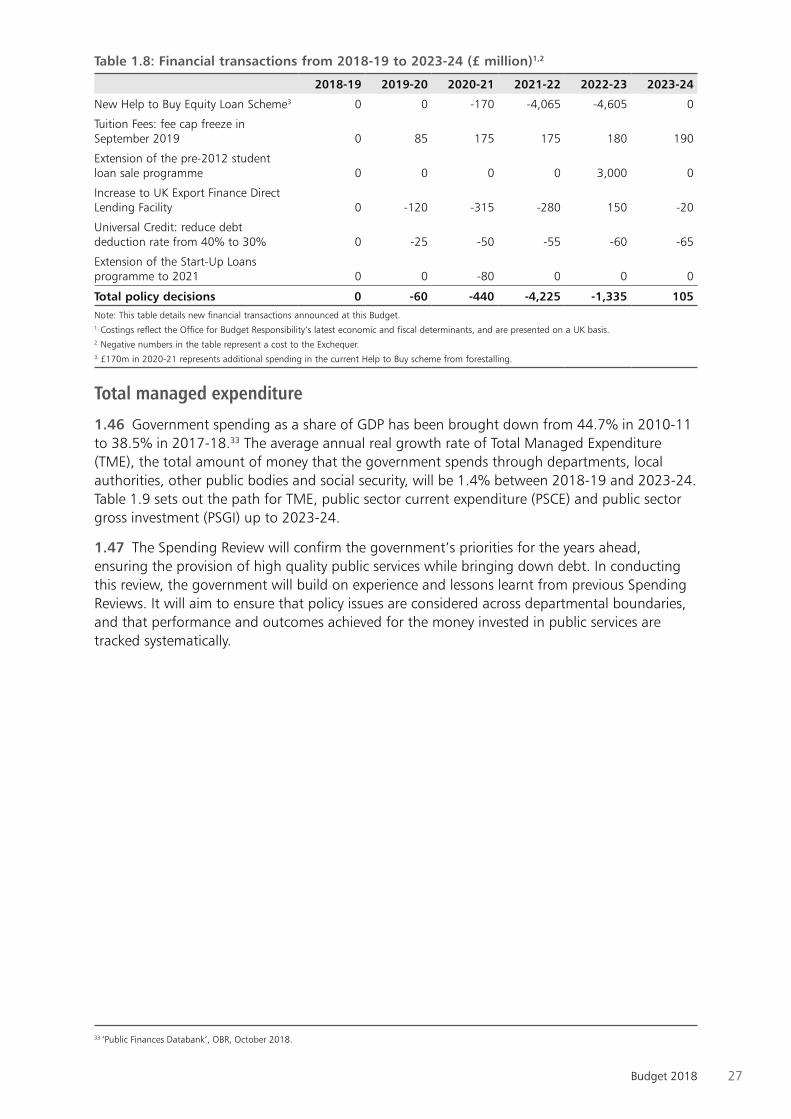
1.44 Some policy measures do not directly affect PSNB in the same way as conventional spending or taxation. These include financial transactions, which affect only the central government net cash requirement (CGNCR) and PSND. Table 1.8 shows the effect of the financial transactions announced since Autumn Budget 2017 on CGNCR. Further information on the student loan sale programme can be found in this chapter at paragraph 1.57.
1.45 Details of policy decisions on Help to Buy, UK Export Finance and Start-Up Loans can be found in Chapter 4 and details on reducing debt reclamation from Universal Credit can be found in Chapter 5.
27Budget 2018
Table 1.8: Financial transactions from 2018-19 to 2023-24 (£ million)1,2
2018-19 2019-20 2020-21 2021-22 2022-23 2023-24
New Help to Buy Equity Loan Scheme3 0 0 -170 -4,065 -4,605 0
Tuition Fees: fee cap freeze in September 2019 0 85 175 175 180 190
Extension of the pre-2012 student loan sale programme 0 0 0 0 3,000 0
Increase to UK Export Finance Direct Lending Facility 0 -120 -315 -280 150 -20
Universal Credit: reduce debt deduction rate from 40% to 30% 0 -25 -50 -55 -60 -65
Extension of the Start-Up Loans programme to 2021 0 0 -80 0 0 0
Total policy decisions 0 -60 -440 -4,225 -1,335 105Note: This table details new financial transactions announced at this Budget.1. Costings reflect the Office for Budget Responsibility’s latest economic and fiscal determinants, and are presented on a UK basis.2. Negative numbers in the table represent a cost to the Exchequer.3. £170m in 2020-21 represents additional spending in the current Help to Buy scheme from forestalling.
Total managed expenditure
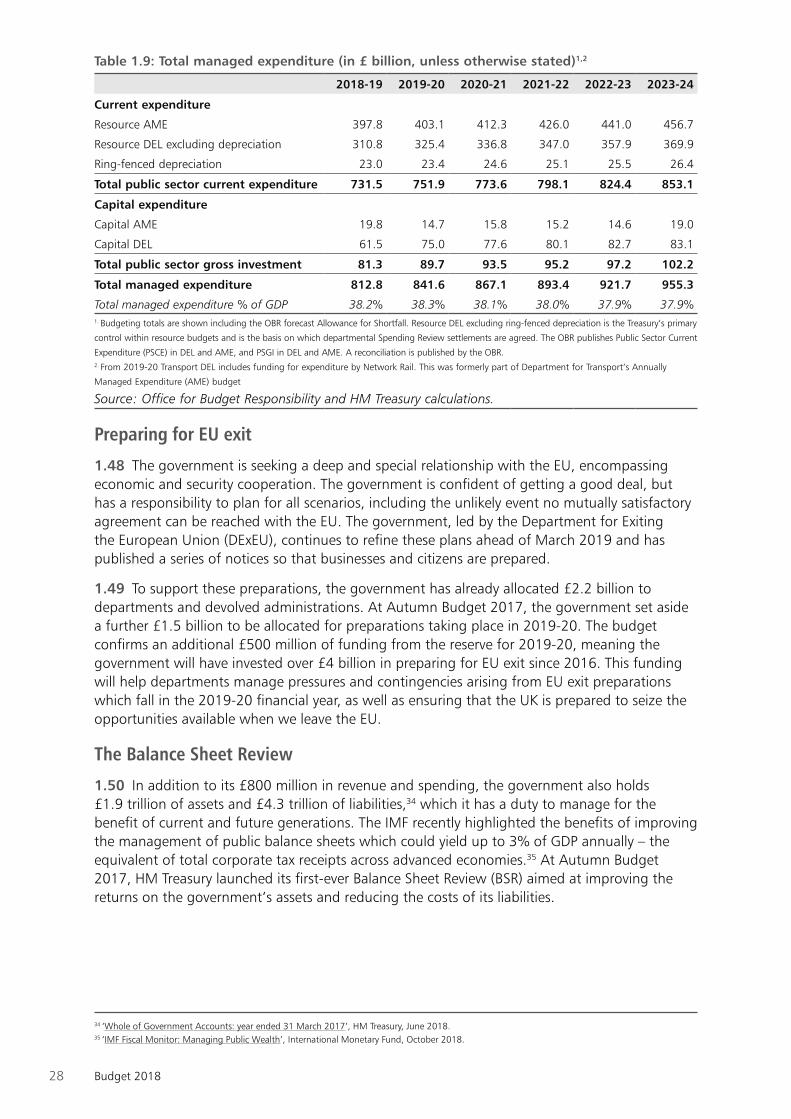
1.46 Government spending as a share of GDP has been brought down from 44.7% in 2010-11 to 38.5% in 2017-18.33 The average annual real growth rate of Total Managed Expenditure (TME), the total amount of money that the government spends through departments, local authorities, other public bodies and social security, will be 1.4% between 2018-19 and 2023-24. Table 1.9 sets out the path for TME, public sector current expenditure (PSCE) and public sector gross investment (PSGI) up to 2023-24.
1.47 The Spending Review will confirm the government’s priorities for the years ahead, ensuring the provision of high quality public services while bringing down debt. In conducting this review, the government will build on experience and lessons learnt from previous Spending Reviews. It will aim to ensure that policy issues are considered across departmental boundaries, and that performance and outcomes achieved for the money invested in public services are tracked systematically.
33 ‘Public Finances Databank’, OBR, October 2018.
28 Budget 2018
Table 1.9: Total managed expenditure (in £ billion, unless otherwise stated)1,2
2018-19 2019-20 2020-21 2021-22 2022-23 2023-24
Current expenditure
Resource AME 397.8 403.1 412.3 426.0 441.0 456.7
Resource DEL excluding depreciation 310.8 325.4 336.8 347.0 357.9 369.9
Ring-fenced depreciation 23.0 23.4 24.6 25.1 25.5 26.4
Total public sector current expenditure 731.5 751.9 773.6 798.1 824.4 853.1
Capital expenditure
Capital AME 19.8 14.7 15.8 15.2 14.6 19.0
Capital DEL 61.5 75.0 77.6 80.1 82.7 83.1
Total public sector gross investment 81.3 89.7 93.5 95.2 97.2 102.2
Total managed expenditure 812.8 841.6 867.1 893.4 921.7 955.3
Total managed expenditure % of GDP 38.2% 38.3% 38.1% 38.0% 37.9% 37.9%1. Budgeting totals are shown including the OBR forecast Allowance for Shortfall. Resource DEL excluding ring-fenced depreciation is the Treasury’s primary
control within resource budgets and is the basis on which departmental Spending Review settlements are agreed. The OBR publishes Public Sector Current
Expenditure (PSCE) in DEL and AME, and PSGI in DEL and AME. A reconciliation is published by the OBR.2. From 2019-20 Transport DEL includes funding for expenditure by Network Rail. This was formerly part of Department for Transport’s Annually
Managed Expenditure (AME) budget
Source: Office for Budget Responsibility and HM Treasury calculations.
Preparing for EU exit
1.48 The government is seeking a deep and special relationship with the EU, encompassing economic and security cooperation. The government is confident of getting a good deal, but has a responsibility to plan for all scenarios, including the unlikely event no mutually satisfactory agreement can be reached with the EU. The government, led by the Department for Exiting the European Union (DExEU), continues to refine these plans ahead of March 2019 and has published a series of notices so that businesses and citizens are prepared.
1.49 To support these preparations, the government has already allocated £2.2 billion to departments and devolved administrations. At Autumn Budget 2017, the government set aside a further £1.5 billion to be allocated for preparations taking place in 2019-20. The budget confirms an additional £500 million of funding from the reserve for 2019-20, meaning the government will have invested over £4 billion in preparing for EU exit since 2016. This funding will help departments manage pressures and contingencies arising from EU exit preparations which fall in the 2019-20 financial year, as well as ensuring that the UK is prepared to seize the opportunities available when we leave the EU.
The Balance Sheet Review
1.50 In addition to its £800 million in revenue and spending, the government also holds £1.9 trillion of assets and £4.3 trillion of liabilities,34 which it has a duty to manage for the benefit of current and future generations. The IMF recently highlighted the benefits of improving the management of public balance sheets which could yield up to 3% of GDP annually – the equivalent of total corporate tax receipts across advanced economies.35 At Autumn Budget 2017, HM Treasury launched its first-ever Balance Sheet Review (BSR) aimed at improving the returns on the government’s assets and reducing the costs of its liabilities.
34 ‘Whole of Government Accounts: year ended 31 March 2017’, HM Treasury, June 2018.35 ‘IMF Fiscal Monitor: Managing Public Wealth’, International Monetary Fund, October 2018.

29Budget 2018
Source: Office for National Statistics and Office for Budget Responsibility.
Debt securities
Monetary Gold & Special Drawing Rights
Currency & Deposits
Equity
Other
Pension entitlementsLoansNet liabilities
-120
-100
-80
-60
-40
-20
0
20
40
60
Chart 1.6: Public Sector Net Financial Liabilities components over time
2006-07 2008-09 2010-11 2012-13 2014-15 2016-17 2018-19 2020-21 2022-23
% o
f G
DP
Assets Forecast
Liabilities
1.51 The BSR has already made significant progress and the Budget provides an update on progress in the following areas:
• Balance sheet reporting – Building on the information provided in Whole of GovernmentAccounts, the OBR has today published its first detailed forecast for the government’sfinancial balance sheet over the next five years (see Chart 1.6). The government has alsocommitted to complying with the IMF’s Government Financial Statistics Manual, whichrequires regular statistical reporting of the entire balance sheet, starting in spring 2019.36
• Intangible assets – A supplementary document published alongside the Budget sets outhow the government is looking to get a better financial, economic and social return on itsestimated £150 billion of intellectual property and other intangible assets.37 The importanceof intangible assets to the UK’s continued economic success is also reflected in thegovernment’s intention to introduce targeted relief for the cost of intellectual property-richacquisitions by UK companies, set out in Chapter 3.
• Private Finance II (PF2) – The government has considered the Private Finance Initiative(PFI) and its successor PF2, in light of experience since 2012, and found the model to beinflexible and overly complex. The OBR’s FRR also identified private finance initiatives asa source of significant fiscal risk to government.38 PF2 has not been used since 2016. TheBudget announces government will no longer use PF2 for new projects.39 A new centreof best practice in the Department of Health and Social Care (DHSC) will improve themanagement of existing PFI contracts.
36 ‘Looking ahead – developments in public sector finance statistics: 2018’, ONS, July 2018 and ‘Managing fiscal risks’, HM Treasury, July 2018.37 ‘SPINTAN database on intangibles in the public sector’, SPINTAN, December 2016.38 ‘Fiscal risks report 2017’, OBR, July 2017.39 Capital spending on public infrastructure is a devolved matter, so this announcement does not affect the use of private finance by devolved administrations.

30 Budget 2018
• Reducing inflation exposure – The government is taking action to reduce its inflationexposure by looking to reduce the proportion of index-linked gilt issuance in a measuredfashion over the medium term (see Annex A for more detail). NS&I has announced that,in line with successive governments’ reduction in the use of RPI, Index-linked SavingsCertificates entering a new term from 1 May 2019 will receive interest based on CPI ratherthan RPI.40 (79)
• Property – As part of the Government Estate Strategy 2018, the government islaunching its first-ever geo-spatial Digital National Asset Register which will enable bettermanagement and commercialisation of its £420 billion of property assets,41 and theWhitehall estate will be brought onto a single balance sheet within 5 years.
• Debt owed to the government – The government will improve its recovery of over£20 billion of overdue debt through new performance management measures andcontinued central support, which has already collected an extra £472 million over the last3 years.42
• Contingent liabilities – In July 2017, HM Treasury introduced stricter new controls overthe issuance of guarantees and other contingent liabilities. The new approvals regime hasalready been applied to over 60 new contingent liabilities with a total value of £158 billion,with over £1 billion of new liabilities rejected outright and the vast majority approved aftersignificant modification to reduce exposure.43 The BSR is exploring options to improveincentives and secure appropriate compensation for the taxpayer when providing insuranceto the private sector.
• Asset sales and loans – HM Treasury will introduce stricter disclosure requirements forasset sales and revised budgetary treatment for financial transactions (e.g. loans) and willpublish new guidance on both in December 2018.
1.52 In the run-up to Spending Review 2019, the BSR is similarly looking at how to improve the management of departments’ individual balance sheets. For example, the NHS will be generating a £3.3 billion increase in proceeds from selling surplus land and buildings, almost doubling the scale of the investment available to the NHS.44 DHSC will also publish a cross-government strategy for managing the rising cost of the government’s almost £72 billion of clinical negligence liabilities.45 The Ministry of Defence’s (MOD) £32 billion rural and built estate covers 1.8% of the UK land mass.46 Through the Defence Estates Optimisation Programme and other activity, the MOD aims to reduce the size of its built estate by 30% by 2040. The Department for Transport (DfT) is exploring opportunities for greater commercialisation of transport assets and ways to realise further value from both new developments and existing land.
1.53 HM Treasury will publish the final conclusions from the BSR at Spending Review 2019, setting out a strategy for the responsible management of public sector wealth.
40 This change in indexation applies only to Index-linked Savings Certificates issued by NS&I. It does not apply to index-linked gilts issued by the Debt Management Office. 41 ‘Whole of Government Accounts: year ended 31 March 2017’, HM Treasury, June 2018.42 ‘Whole of Government Accounts: year ended 31 March 2017’, HM Treasury, June 2018; ‘Economic and fiscal outlook: October 2018’, OBR, October 2018.43 ‘Managing fiscal risks’, HM Treasury, July 2018.44 ‘The Government Response to the Naylor Review’, Department for Health & Social Care, January 2018.45 ‘NHS Annual report and accounts 2017/18’, NHS Resolution, July 2018.46 ‘Whole of Government Accounts: year ended 31 March 2017’, HM Treasury, June 2018; ‘UK Land Holdings 2018’, Ministry of Defence, June 2018.
31Budget 2018
Devolved administrations
1.54 The application of the Barnett formula to spending decisions taken by the UK government at the Budget will provide each of the devolved administrations with additional funding to be allocated according to their own priorities. The Scottish and Welsh Governments’ block grants will be further adjusted, as set out in their respective fiscal frameworks.
1.55 For the OBR’s forecast, the Scottish Government’s spending has now been reclassified from PSCE in RDEL to PSCE in AME and from PSGI in CDEL to PSGI in AME. This reflects the Scottish Government’s borrowing powers, Reserve facility and the fact that around a third of Scottish Government expenditure is financed by locally raised revenue. This new budgeting treatment only affects the way Scottish Government spending is reported. All previous spending controls, including through the block grant and borrowing and reserve limits, remain unchanged, and the spending power of the Scottish Government is not affected. The Scottish Government block grant remains in the governments measure of RDEL excluding depreciation and CDEL.
Asset sales1.56 The government remains committed to returning the financial sector assets acquired in 2008 to 2009 to the private sector in a way that achieves value for money for taxpayers:
• Royal Bank of Scotland (RBS) – It remains the government’s objective to return RBS fullyto the private sector when it represents value for money to do so and market conditionsallow. Over the past year RBS has made significant further progress on resolving its legacyissues. The government now intends to undertake a full disposal of the RBS shareholding by2023-24, subject to market conditions and achieving value for money. The government willkeep all disposal options under review and, as with previous disposal programmes, expectslarger disposal values in later years when increased liquidity in the shares should enablehigher volumes to be sold.
• UK Asset Resolution (UKAR) – UKAR’s balance sheet has reduced from £115.8 billionin 2010 to £19.8 billion as at 31 March 2018. UKAR has completed two sales of Bradford& Bingley (B&B) mortgages of £11.8 billion and £5.3 billion respectively, which enabled B&Bto repay its debt to the Financial Services Compensation Scheme. UKAR has also completeda sale of a £860 million portfolio of equity release mortgages, simplifying the balancesheets of NRAM plc (formerly part of Northern Rock) and B&B. Building on UKAR’s strongtrack record of successful asset sales, the government now expects to divest the remainingassets from B&B and NRAM plc by March 2020, subject to achieving value for money andmarket conditions remaining supportive. As has been the case for all previous UKAR sales,buyers will be required to agree to UKAR’s customer treatment protections which includethe Financial Conduct Authority’s (FCA) Treating Customers Fairly principles. There will beno changes to the terms and conditions of any of the loans that will be sold, and UKAR willrequire that the loans must be serviced by an FCA-regulated firm.

32 Budget 2018
1.57 The government continues to explore options for the sale of wider corporate and financial assets, where there is no longer a policy reason to retain them and when value for money can be secured for taxpayers. This is an integral part of the government’s plan to improve the public finances:
• Student Loans – In December 2017 the government completed the first in its programmeof sales of pre-2012 income-contingent student loans, expected to raise £12 billionby 2021-22. The sale raised £1.7 billion,47 reducing PSND, and was assessed as valuefor money by the National Audit Office.48 The government will now extend the salesprogramme by a further year, increasing total proceeds to £15 billion.
• Network Rail – Following a competitive bidding process, Network Rail agreed the sale ofits commercial property portfolio on 10 September 2018. The sale generates net receipts of£1.27 billion,49 £170 million above the forecast at Spring Statement.
Public service pensions
1.58 Public service pensions were reformed in 2015 and, as part of those reforms, an agreement was reached to maintain their value. Valuations of public service pensions are ongoing, and provisional results indicate that changes will need to be made from 2019-20 to make pension benefits more generous for public servants, including teachers, police, armed forces and NHS staff.
1.59 The Budget confirms a reduction of the discount rate for calculating employer contributions in unfunded public service pension schemes, to 2.4% plus CPI (in line with established methodology to reflect OBR forecasts for long-term GDP growth). The valuations indicate that there will be additional costs to employers in providing public service pensions over the long-term.
1.60 The government is supporting departments to ensure that recognition of these costs does not jeopardise the delivery of frontline public services or put undue pressure on public employers. For the NHS, as outlined in the five-year health settlement in England in June 2018, the Treasury has made provision for NHS pension costs until 2023-24. For state schools, the Department of Education are proposing to provide more funding to cover pension costs for the rest of this Spending Review period. To supplement this, the Budget allocates extra DEL to the reserve for 2019-20 to cover an expected £4.7 billion of additional costs. The Spending Review next year will settle the funding for costs beyond 2019-20 arising from the valuations.
Sovereign Grant
1.61 The Sovereign Grant for 2019-20 will be £82.4 million. This grant provides funding in support of Her Majesty’s official duties as Sovereign.
The Royal Mint
1.62 The Royal Mint has a long-established tradition of producing coins in order to commemorate historic moments, including the 2012 Olympics, the UK’s accession to the European Economic Community, and the centenary of the First World War. In line with this tradition, the Royal Mint will produce a coin to commemorate the UK leaving the European Union. This coin will be available in Spring 2019.
47 ‘Government asset sale: Written statement to Parliament’ (HCWS317), December 2017. 48 ‘The sale of student loans’, National Audit Office, (HC1385), July 2018.49 ‘Landmark property asset sale’, Network Rail; ‘Economic and fiscal outlook: October 2018’, OBR, October 2018.

33Budget 2018
Debt and reserves management1.63 The government’s revised financing plans for 2018-19 are summarised in Annex A.

41Budget 2018
3 Tax
Introduction3.1 The government is committed to keeping taxes low, to allow working families to keep more of what they earn and to provide businesses with an environment in which they can grow and create jobs. The government has already increased the Personal Allowance (PA) and higher rate threshold (HRT), and cut corporation tax to 19% – the lowest in the G201 – and it will fall further to 17% in 2020.
3.2 The government is determined to support working people to keep more of what they earn. The Budget announces that the government will meet its commitment to raise the PA to £12,500 and the HRT to £50,000 from April 2019, one year earlier than planned. These thresholds will remain at the same levels in 2020-21 and then increase by CPI. This means the government has raised the PA by over 90% in less than a decade and in 2019-20 a typical basic rate taxpayer will pay £130 less tax than in 2018-19 and £1,205 less tax than in 2010-11.2 Freezes to fuel duty for the ninth successive year save the average driver a cumulative £1,000 by 2020.3
3.3 The Budget introduces measures to reaffirm the UK’s international competitiveness and support local growth. The Budget announces a new structures and buildings allowance and a temporary increase in the Annual Investment Allowance to £1 million, to support business investment. It also takes action to support high streets as they evolve, supporting a crucial part of local economies.
3.4 It is important that the tax system works fairly and adapts to changes in the new economy. To reflect the value derived from UK users, the government is introducing a digital services tax, ensuring large multinational businesses make a fair contribution to supporting vital public services. To reflect environmental concerns, the Budget is taking action on single-use plastic waste, including announcing a new tax on plastic packaging which does not contain enough recycled content.
3.5 Since 2010 the government has secured and protected over £185 billion of tax that would otherwise have gone unpaid, and introduced over 100 measures to crack down further on avoidance, evasion, aggressive tax planning and unfair outcomes. 4 The Budget reaffirms the government’s commitment to ensuring that everyone, businesses and individuals, pay their fair share.
Personal tax3.6 The government is committed to keeping taxes low to support working people to keep more of what they earn and to encourage individuals to progress. It has made repeated increases to the PA, raising it from £6,475 in 2010-11 to £11,850 in 2018-19.
1 ‘Corporate tax rates table’, KPMG, October 2018.2 HM Treasury analysis, see ‘Budget 2018 data sources’.3 HM Treasury calculations.4 ‘Annual Report and Accounts 2017-18’, HMRC, July 2018; ‘Tacking tax avoidance, evasion and non-compliance’, HM Treasury, November 2017.
42 Budget 2018
Income tax and National Insurance3.7 Personal Allowance and higher rate threshold – The Budget announces that the government will meet its commitment to raise the PA to £12,500 from April 2019, one year earlier than planned. The threshold will remain at the same level in 2020-21 and then increase by CPI. The £650 increase to the PA means that in 2019-20 a typical basic rate taxpayer will pay £130 less tax than in 2018-19 and £1,205 less tax than in 2010-11.5 This will increase the number of tax payers taken out of income tax since 2015-16 to 1.74 million.6 The government will also meet its commitment to increase the HRT to £50,000 from April 2019, one year earlier than planned. The threshold will remain at the same level in 2020-21. This means that there will be nearly one million fewer higher rate taxpayers than in 2015-16.7 Overall, 32 million individuals will see their tax bill reduced in 2019-20 compared to 2015-16.8 (10)
3.8 Off-payroll working in the private sector – To help people comply with the existing rules and bring private sector organisations in line with public-sector bodies and agencies, the government will reform the off-payroll working rules (known as IR35) in the private sector. This follows consultation and the roll-out of reform in the public sector. Responsibility for operating the off-payroll working rules will move from individuals to the organisation, agency or other third party engaging the worker. To give people and businesses time to prepare, this change will not be introduced until April 2020. Small organisations will be exempt, minimising administrative burdens for the vast majority of engagers, and HMRC will provide support and guidance to medium and large organisations ahead of implementation. (54)
3.9 Taxation of self-funded work-related training – Following consultation responses indicating that tax relief is unlikely to be effective in addressing the barriers to learning or incentivising training, the government is maintaining the scope of tax relief currently available to employees and the self-employed for work-related training costs. Instead, the government is launching the National Retraining Scheme and skills pilots to help those in work, including the self-employed, develop the skills they need to thrive.
3.10 Shared occupancy test for rent-a-room relief – Following consultation on draft legislation, to maintain the simplicity of the system the government will not include legislation for the ‘shared occupancy test’ in Finance Bill 2018-19. The government will retain the existing qualifying test of letting in a main or only residence, and will work with stakeholders to ensure that the rules around the relief are clearly understood.
3.11 Employment Allowance reform – To target the Employment Allowance (EA) to support smaller businesses, from April 2020 the government will restrict access to employers with an employer National Insurance contributions (NICs) bill below £100,000 in their previous tax year. The EA provides businesses and charities with up to £3,000 off their employer NICs bill. Over 99% of micro-businesses and 93% of small businesses will still be eligible for the EA.9 (59)
3.12 National Insurance Contributions Bill – As previously announced in September, the government will not abolish Class 2 NICs during this Parliament, given the potential impacts on some of the lowest earning in society. There are two remaining measures in the draft NICs Bill published on 5 December 2016: reforms to the NICs treatment of termination payments and income from sporting testimonials. The government still intends to legislate for these reforms, which will take effect from April 2020. (75)
5 HM Treasury analysis, see ‘Budget 2018 data sources’.6 HMRC analysis based on Survey of Personal Incomes (SPI) 2015-16 data, and Budget 2018 OBR forecast.7 HMRC analysis based on Survey of Personal Incomes (SPI) 2015-16 data, and Budget 2018 OBR forecast.8 HMRC analysis based on Survey of Personal Incomes (SPI) 2015-16 data, and Budget 2018 OBR forecast.9 HMRC analysis based on Real Time Information 2017-18 administrative data and Budget 2018 OBR forecast.
43Budget 2018
3.13 Tax treatment of social security income – The government is legislating to confirm the income tax treatment of nine new and existing social security benefits.10 This includes the five new benefits being introduced in Scotland, which will be treated in accordance with the 2016 agreement between the Scottish government and the UK government on the Scottish Government’s Fiscal Framework.
3.14 Short Term Business Visitors (STBVs) – Following a consultation on the tax and administrative treatment of STBVs from overseas branches of UK headquartered companies, the government will widen eligibility for the STBV Pay As You Earn (PAYE) special arrangement and extend its deadlines for reporting and paying tax. This will reduce administrative burdens on UK employers with effect from April 2020.
3.15 Trusts consultation – As announced at Autumn Budget 2017, the government will publish a consultation on the taxation of trusts, to make the taxation of trusts simpler, fairer and more transparent.
Charity taxes3.16 Reducing administrative burdens on charities – From April 2019, the government will introduce a package of measures to reduce administrative burdens on charities. These will:
• increase the upper limit for trading that charities can carry out without incurring a taxliability from £5,000 to £8,000 where turnover is under £20,000, and from £50,000 to£80,000 where turnover exceeds £200,000
• allow charity shops using the Retail Gift Aid Scheme to send letters to donors every threeyears when their goods raise less than £20 a year, rather than every tax year
• increase the individual donation limit under the Gift Aid Small Donations Scheme to£30, which applies to small collections where it is impractical to obtain a Gift Aiddeclaration (67)
Pensions and savings tax3.17 Lifetime allowance for pensions – The lifetime allowance for pension savings will increase in line with CPI for 2019-20, rising to £1,055,000.
3.18 Starting rate for savings – The band of savings income that is subject to the 0% starting rate will be kept at its current level of £5,000 for 2019-20. (66)
3.19 Individual Savings Account (ISA) annual subscription limits – The adult ISA annual subscription limit for 2019-20 will remain unchanged at £20,000. The annual subscription limit for Junior ISAs for 2019-20 will be uprated in line with CPI to £4,368. (66)
3.20 Child Trust Funds – The government will publish a consultation in 2019 on draft regulations for maturing Child Trust Fund accounts. The annual subscription limit for Child Trust Funds for 2019-20 will be uprated in line with CPI to £4,368.
Business tax3.21 The government is committed to creating a tax system which secures business investment and the location of business activity in the UK. The government has already ensured the UK is a prime location to invest, from cutting the corporation tax rate to 19% and legislating for it
10 These are the: Young Carer Grant, Best Start Grant, Funeral Expense Assistance, Discretionary Housing Payment and Carer’s Allowance Supplement (overseen by the Scottish government); Discretionary Support Scheme (overseen by the Northern Ireland Executive); and, Council Tax Reduction Scheme, Discretionary Housing Payment and the Flexible Support Fund (overseen by the UK government).
44 Budget 2018
to fall to 17% in 2020, to supporting the creative sector through tax reliefs which have helped to make the UK one of the best places to produce film and high-end TV programmes in the world. The Budget builds on the UK’s competitive tax regime by supporting business investment, ensuring that tax paid is fair and responds to the challenges of the new economy. Technology is changing many aspects of the economy – including the vehicles we drive – and the government is considering how the tax system will need to adapt to manage those changes.
Enterprise tax3.22 Annual Investment Allowance (AIA) – The government will increase the Annual Investment Allowance to £1 million for all qualifying investment in plant and machinery made on or after 1 January 2019 until 31 December 2020, to help stimulate business investment. (20)
3.23 Structures and buildings allowance (SBA) – New non-residential structures and buildings will be eligible for a 2% capital allowance where all the contracts for the physical construction works are entered into on or after 29 October 2018. This addresses a significant gap in the UK’s current capital allowances regime, and will improve the international competitiveness of the UK’s tax system. Further information on this measure is available in a supplementary document published alongside the Budget. (21)
3.24 Capital allowances special rate reduction (8% to 6%) – From April 2019, the capital allowances special rate for qualifying plant and machinery assets will be reduced from 8% to 6% to more closely match average accounts depreciation. (22)
3.25 Entrepreneurs’ Relief: minimum qualifying period – To support longer-term business investments, from 6 April 2019 the minimum period throughout which the qualifying conditions for relief must be met will be extended from 12 months to 24 months. (56)
Corporate tax3.26 Digital services tax (DST) – From April 2020, the government will introduce a new 2% tax on the revenues of certain digital businesses to ensure that the amount of tax paid in the UK is reflective of the value they derive from their UK users. The tax will:
• apply to revenues generated from the provision of the following business activities: searchengines, social media platforms and online marketplaces
• apply to revenues from those activities that are linked to the participation of UK users,subject to a £25 million per annum allowance
• only apply to groups that generate global revenues from in-scope business activities inexcess of £500 million per annum
• include a safe harbour provision that exempts loss-makers and reduces the effective rate oftax on businesses with very low profit margins
3.27 The government remains committed to G20 and OECD discussions on potential future reforms to the international corporate tax framework, and will only apply the DST until an appropriate long-term solution is in place. The government will consult on the detailed design of the DST and legislate in Finance Bill 2019-20. (53)
3.28 Corporate capital loss restriction – To ensure that large companies pay tax when they make significant capital gains, the government will bring the tax treatment of corporate capital losses into line with the treatment of income losses. From 1 April 2020, the government will restrict the proportion of annual capital gains that can be relieved by brought-forward capital losses to 50%. The measure will include an allowance that gives companies unrestricted use
45Budget 2018
of up to £5 million capital or income losses each year, meaning that 99% of companies will be unaffected.11 The government will consult on the detailed design of this change and legislate in Finance Bill 2019-20. The measure will be subject to anti-avoidance rules that are to apply with immediate effect. (55)
3.29 Amendments to reform of loss relief rules – With effect from April 2017, the government reformed the rules on how carried-forward corporate losses can be set against taxable profits of a company and its group members. The government will make amendments to the loss relief legislation to ensure that it works as intended and prevents relief for carried-forward losses being claimed in excess of that intended.
3.30 Intangible fixed assets regime – In early 2018, the government reviewed how the tax treatment of acquired intangible assets could be made more competitive and administrable. Following a short consultation, the government will seek to introduce targeted relief for the cost of goodwill (the amount paid for a business that exceeds the fair value of its individual assets and liabilities) in the acquisition of businesses with eligible intellectual property from April 2019. With effect from 7 November 2018, the government will also reform the de-grouping charge rules, which apply when a group sells a company that owns intangibles, so that they more closely align with the equivalent rules elsewhere in the tax code.
3.31 Hybrid Capital Instruments – Certain corporate debt instruments (known as hybrid capital) have some equity-like features. The government will introduce new rules for the taxation of such instruments, to ensure that they are taxed in line with their economic substance, taking into account new Bank of England requirements for loss absorbency. The new rules will also eliminate mismatches between the tax treatment of instruments used to raise funds externally and those used to lend funds internally within a group. The rules will cover issues by companies in any sector and replace current rules covering regulatory hybrid capital instruments issued by banks and insurers.
3.32 Offshore receipts in respect of intangible property (previously Royalties Withholding Tax) – As announced at Autumn Budget 2017, the government is introducing legislation in Finance Bill 2018-19 to tax income from intangible property held in low-tax jurisdictions to the extent that it is referable to UK sales. This measure will come into effect from April 2019. Following consultation, the government is making changes to ensure that the measure is effective, appropriately targeted and robust against abuse. These include:
• collecting the tax by directly taxing offshore entities that realise intangible property incomein low-tax jurisdictions, rather than through applying a withholding tax
• broadening the income in scope of the measure to include embedded royalties and incomefrom the indirect exploitation of intangible property in the UK market through unrelatedparties
• introducing a de minimis UK sales threshold of £10 million, an exemption for income thatis taxed at appropriate levels, and an exemption for income relating to intangible propertythat is supported by sufficient local substance
• anti-avoidance provisions will apply from 29 October 2018 to counteract arrangementsentered into with a main purpose of avoiding a charge under this measure
11 HMRC calculations.
46 Budget 2018
Property tax3.33 High streets – High streets and town centres are crucial parts of communities and local economies, but the government recognises the challenges they face from changing consumer behaviour and is taking action to help them to evolve. High street businesses are already benefitting from recent reforms and reductions to business rates announced since Budget 2016 worth more than £12 billion over the next five years.12 In the Budget the government is going further through Our Plan for the High Street. To provide upfront support through the business rates system, the government is cutting bills by one-third for retail properties with a rateable value below £51,000, benefiting up to 90% of retail properties, for 2 years from April 2019, subject to state aid limits.13 (44)
3.34 In the longer term, to support a sustainable transformation of high streets, the Plan includes a £675 million Future High Streets Fund, planning reform, a High Streets Task Force to support local leadership, and funding to strengthen community assets, including the restoration of historic buildings on high streets.
3.35 Business rates public lavatories relief – The government will introduce 100% business rates relief for all public lavatories to help keep these important local amenities open. (47)
3.36 Business rates local newspaper discount – The government will continue the £1,500 business rates discount for office space occupied by local newspapers in 2019-20.
3.37 Local authorities will be fully compensated for the loss of income as a result of these business rates measures.
3.38 Business rates treatment of self-catering and holiday let accommodation – There is concern that some owners of properties that are not genuine businesses may seek to reduce their tax liability by falsely declaring that the property is available for let. To ensure that second properties are subject to the appropriate tax, the government will consult on the criteria under which self-catering and holiday lets become chargeable to business rates rather than council tax.
3.39 Stamp Duty Land Tax (SDLT) and first-time buyers relief – The government will extend first-time buyers relief in England and Northern Ireland so that all qualifying shared ownership property purchasers can benefit, whether or not the purchaser elects to pay SDLT on the market value of the property. This change will apply to relevant transactions with an effective date on or after 29 October 2018, and will also be backdated to 22 November 2017 so that those eligible who have not previously claimed first-time buyers relief will be able to amend their return to claim a refund. (37)
3.40 Consultation on SDLT charge for non-residents – The government will publish a consultation in January 2019 on a SDLT surcharge of 1% for non-residents buying residential property in England and Northern Ireland.
3.41 Capital gains tax – To better target private residence relief at owner occupiers, from April 2020 the government will reform lettings relief so that it only applies in circumstances where the owner of the property is in shared occupancy with the tenant. The final period exemption will also be reduced from 18 months to 9 months. The government will consult on these changes. There will be no changes to the 36 months final period exemption available to disabled people or those in a care home. (57)
12 Ministry of Housing, Communities and Local Government calculations based on analysis of internal Valuation Office Agency ratings list data and published local authority National non-domestic rates data.13 Ministry of Housing, Communities and Local Government calculations based on analysis of internal Valuation Office Agency ratings list data.

47Budget 2018
Energy and transport tax
Transport tax
3.42 Fuel duty – Fuel duty will be frozen for a ninth successive year saving the average driver a cumulative £1,000 by April 2020,14 compared with what they would have paid under the pre-2010 fuel duty escalator. (11)
3.43 Alternative fuels – Following review, the government will maintain the difference between alternative and main road fuel duty rates until 2032 to support the de-carbonisation of the UK transport sector, subject to review in 2024.
3.44 Introduction of the Worldwide harmonised Light vehicles Test Procedure (WLTP) – The government will review the impact of WLTP on Vehicle Excise Duty (VED) and company car tax (CCT) to report in the spring. WLTP aims to provide a closer representation of ‘real-world’ fuel consumption and CO2 emissions.
3.45 Vehicle Excise Duty (VED): Uprating – From 1 April 2019 VED rates for cars, vans and motorcycles will increase in line with RPI. To support the haulage sector, the government will freeze the Heavy Goods Vehicle (HGV) VED for 2019-20. (62)
3.46 Vehicle Excise Duty (VED): Vans – The government will shortly publish a summary of responses from the consultation on VED reform for vans, published in May 2018. The response will set out proposals to introduce environmental incentives from April 2021. Bands and rates will be set out ahead of Finance Bill 2019-20.
3.47 Vehicle Excise Duty (VED): Blood Bikes – To align the tax treatment of the transportation of blood and medical supplies by the national charity Blood Bikes with other emergency vehicles, the government will introduce an exemption for the purpose-built vehicles operated by Blood Bikes from April 2020.
3.48 Company vehicles – From 6 April 2019 fuel benefit charges will increase in line with RPI and the van benefit charge will increase in line with CPI.
3.49 Air Passenger Duty (APD) – Short-haul APD rates for 2020-21 will not rise, remaining at the same level they have been since 2012, benefitting 80% of passengers.15 Long-haul rates will increase in line with RPI. The rates for long-haul economy will increase by £2, and the rates for those travelling in premium economy, business and first class will increase by £4. Those travelling long-haul by private jets will see the rate increase by £13.
Energy tax
3.50 Carbon price support (CPS) – The price of EU Emissions Trading System (ETS) allowances has risen significantly over recent months, raising the Total Carbon Price (currently made up of the EU ETS price and the CPS rate). The government will freeze the CPS rate at £18/tCO2
16 for 2020-21. From 2021-22, the government will seek to reduce the CPS rate if the Total Carbon Price remains high. (64)
3.51 Carbon pricing following EU exit – The government continues to plan for all scenarios as it prepares for EU exit. In the unlikely event no mutually satisfactory agreement can be reached and the UK departs from the EU ETS in 2019, the government would introduce a Carbon Emissions Tax to help meet the UK’s legally binding carbon reduction commitments under the Climate Change Act. The tax would apply to all stationary installations currently participating in the EU ETS from 1 April 2019. A rate of £16 would apply to each tonne of
14 HMT calculations based on OBR RPI forecasts.15 HMT calculations based on ‘Air Passenger Duty Bulletin’, HMRC, March 2018.16 Per tonne of carbon dioxide

48 Budget 2018
carbon dioxide emitted over and above an installation’s emissions allowance, which would be based on the installation’s free allowances under the EU ETS. The government is also legislating so it can prepare for a range of long-term carbon pricing options.
3.52 Climate change levy (CCL) – The Budget sets the CCL main rates for 2020-21 and 2021-22 and continues with the government’s commitment to rebalance the main rates paid for gas and electricity. The electricity rate will be lowered in 2020-21 and 2021-22. The gas rate will increase in 2020-21 and 2021-22 so it reaches 60% of the electricity main rate by 2021-22. Other fuels, such as coal, will continue to align with the gas rate. The discount for sectors with Climate Change Agreements will change to reflect the change in CCL main rates. (60)
3.53 Enhanced Capital Allowances (ECAs) – The government will end ECAs and First Year Tax Credits for technologies on the Energy Technology List and Water Technology List from April 2020. These ECAs add complexity to the tax system and the government believes there are more effective ways to support energy efficiency. The savings will be reinvested in an Industrial Energy Transformation Fund, to support significant energy users to cut their energy bills and transition UK industry to a low carbon future. (43)
3.54 Enhanced Capital Allowances (ECAs) for electric vehicle charge points – The government will extend the ECA for companies investing in electric vehicle charge points to 31 March 2023. This will help achieve the government’s ambition for the UK to become a world-leader in the ultra-low emission vehicle market.
Environmental tax
Single-use plastics
3.55 Following the government’s call for evidence, the government will take action on the problem of single-use plastics waste. This forms part of the government’s wider strategy to address plastics waste, with further detail to be set out in the Resources and Waste Strategy later this year. This will address the current situation where recycling rates of plastic are too low, plastic producers use little recycled plastic and some problematic items are rarely recycled and often end up in the natural environment. The Budget also announces funding for plastics and waste innovation.
3.56 Plastic packaging – To reduce the problem of excessive and environmentally harmful plastic packaging, and incentivise manufacturers to use recycled plastic, the government will:
• introduce a tax on the production and import of plastic packaging from April 2022. Subjectto consultation, this tax will apply to plastic packaging which does not contain at least30% recycled plastic, to transform financial incentives for manufacturers to produce moresustainable packaging
• reform the Packaging Producer Responsibility System, which will aim to increase producerresponsibility for the costs of their packaging waste, including plastic. This system willprovide an incentive for producers to design packaging that is easier to recycle and penalisethe use of difficult to recycle packaging, such as black plastics
3.57 To ensure a coherent approach, the government will consult on both of these together in the coming months. Future revenues raised from these measures will enable investment to address single-use plastics, waste and litter to meet the government’s ambitions for resources and waste.
3.58 The government recognises the important role incineration currently plays in waste management in the UK, and expects this to continue. However, in the long term the government wants to maximise the amount of waste sent to recycling instead of incineration and landfill.

49Budget 2018
Should wider policies not deliver the government’s waste ambitions in the future, it will consider the introduction of a tax on the incineration of waste, in conjunction with landfill tax, taking account of the possible impacts on local authorities.
3.59 Disposable cups – The government recognises the problems caused by disposable cups, which are difficult to recycle and often littered. The government has concluded that a levy on all cups would not at this time be effective in encouraging widespread reuse. Businesses are already taking steps to limit their environmental impact, but the government expects industry to go further and will return to the issue if sufficient progress is not made. In the meantime, the government will look in the Resources and Waste Strategy at the best way to tackle the environmental impact of cups.
3.60 Aggregates Levy Rates – The government will freeze Aggregates Levy rates for 2019-20, but intends to return the Levy to index-linking in future. (61)
Indirect tax
Alcohol, tobacco and gaming
3.61 Alcohol duty rates and bands – Duty rates on beer, most cider and spirits will be frozen. Duty on most wine and higher strength sparkling cider will rise by RPI inflation from 1 February 2019. The government will review the current Small Brewers Relief to ensure it is supporting growth in the sector. (12)
3.62 Alcohol structures consultation – As announced at Autumn Budget 2017, the government will introduce a new duty band for still cider and perry from 6.9% to 7.5% alcohol by volume (abv), to target white ciders. This will be legislated for in Finance Bill 2018-19, and a rate of £50.71 per hectolitre will apply from 1 February 2019. (12)
3.63 Post duty point dilution – Following a review by HMRC launched at Autumn Budget 2017, and in order to ensure a level playing field with other duty regimes, the government will legislate to ban post duty point dilution from April 2020. (65)
3.64 Tobacco duty rates – Duty rates on all tobacco products will increase by two percentage points above RPI inflation until the end of this Parliament. Hand rolling tobacco will increase by an additional one percentage point. These changes will come into effect from 6pm on 29 October 2018. To signal its intent to put an end to the illicit trade in all its forms, the government will act on the recommendations of the recent All Party Parliamentary Group report by supporting the creation of a UK-wide Anti-Illicit Trade Group. This will bring together senior officials, representing each of the four parts of the United Kingdom, to share best practice and develop a national strategy for tackling this criminal activity and the societal ills that it fuels. (63)
3.65 Minimum Excise Tax – The Minimum Excise Tax for cigarettes will rise to £293.95 per 1,000 cigarettes. This will take effect from 6pm on 29 October 2018.
3.66 Tobacco for heating – As announced at Spring Statement 2018, the government will legislate in Finance Bill 2018-19 for a new duty rate for tobacco for heating. In these products processed tobacco is heated (but not burned like conventional tobacco) to produce, or flavour, vapour. This will be set at the same level as hand rolling tobacco and take effect on 1 July 2019.
3.67 Gaming duty accounting periods and bands – As announced in HMRC’s consultation response in July 2018, the government will legislate in Finance Bill 2018-19 to remove the requirement for casinos to pay gaming duty on account and to allow the carry forward of losses between accounting periods. The return period for gaming duty will remain 6 months. The bands to determine payment of gaming duty will be frozen from April 2019, while the changes to gaming duty accounting periods are implemented.
50 Budget 2018
3.68 Remote Gaming Duty – As announced in May 2018, in order to ensure funding for public services is maintained following the implementation of a £2 maximum stake on B2 machine games, the rate of Remote Gaming Duty will increase to 21%. Both the reduction in maximum stake and increased duty rate will come into effect in October 2019. (78)
3.69 Soft Drinks Industry Levy (SDIL) – The government will legislate in Finance Bill 2018-19 to make the SDIL a common duty with the Isle of Man.
VAT
3.70 VAT registration threshold – Alongside the Budget, the government is publishing a response to the call for evidence on the design of the VAT threshold. The responses to the call for evidence did not provide a clear option for reform. The VAT threshold will therefore be maintained at the current level of £85,000 for a further 2 years until April 2022. The government will look again at the possibility of introducing a smoothing mechanism once the terms of EU exit are clear. (58)
3.71 VAT and vouchers – Following consultation, the government will legislate in Finance Bill 2018-19 to implement EU legislation which ensures that the correct amount of VAT is charged on what the customer pays, irrespective of whether payment is with a voucher or other means of payment.
3.72 VAT fraud in labour provision in the construction sector – As announced at Autumn Budget 2017, and following consultation, the government will introduce a VAT domestic reverse charge to prevent VAT losses through so-called ‘Missing Trader’ fraud. This occurs when traders collect VAT on their sales but go missing before passing that VAT on to HMRC. This will shift responsibility for paying VAT along the supply chain to remove the opportunity for it to be stolen by those traders. The new rules will have effect on and after 1 October 2019 and the government is publishing secondary legislation alongside the Budget to implement this change.
3.73 VAT and higher education – The government will amend VAT law to ensure continuity of VAT treatment for English higher education providers under the Higher Education and Research Act by enabling bodies registered with the Office for Students in the Approved (fee cap) category to exempt supplies of education.
3.74 Alternative method of VAT collection: ‘split payment’ – To reduce online VAT fraud by third country sellers and improve how VAT is collected on cross-border e-commerce, the government is looking at a split payment model. Following the consultation launched at Spring Statement 2018, the government is publishing a response at the Budget. An Industry Working Group will also be established to address some of the main challenges associated with this policy through close cooperation with stakeholders.
EU exit3.75 Consequential minor amendments to tax legislation to reflect EU exit – The government is responsible for preparing for all possible outcomes to EU negotiations. This power will allow the government to make small, essential changes to UK tax law to maintain the effect of tax legislation if the UK leaves the EU without a deal. Changes made under this power will maintain current operation of the tax law in essential areas, including changes in line with no deal legislation in other parts of the law.
51Budget 2018
Avoidance, evasion & unfair outcomes3.76 The government remains committed to tackling tax avoidance and evasion, aggressive tax planning and non-compliance. Since 2010 the government has secured and protected over £185 billion of tax that would otherwise have gone unpaid, and introduced over 100 measures to crack down further on avoidance, evasion, aggressive tax planning and unfair outcomes.17 These actions have helped the UK achieve the lowest tax gap of the last five years at 5.7% in 2016-17.18 Further steps taken in the Budget target avoidance and evasion, as well as unfair outcomes. These measures reaffirm the government’s commitment to ensuring that everyone, no matter who they are, should pay the right amount of tax at the right time.
3.77 Capital gains tax: tackling misuse of Entrepreneurs’ Relief – In addition to the current requirements on share capital and voting rights, from 29 October 2018 shareholders must also be entitled to at least 5% of the distributable profits and net assets of a company to claim the relief. This is to address an identified abuse of the current rules. (73)
3.78 Profit fragmentation – As announced at Autumn Budget 2017, the government will legislate in Finance Bill 2018-19 to introduce targeted legislation that aims to prevent UK businesses from avoiding UK tax by arranging for their UK-taxable business profits to accrue to entities resident in territories where significantly lower tax is paid than in the UK. The taxable UK profits will be increased to the actual, commercial level. (72)
3.79 Reforming Stamp taxes on shares consideration rules – The government will consult on aligning the consideration rules of Stamp Duty and Stamp Duty Reserve Tax and introducing a general market value rule for transfers between connected persons. Reforming consideration rules will simplify Stamp taxes on shares and prevent contrived arrangements being used to avoid tax. From 29 October 2018, a targeted market value rule will be introduced for listed shares transferred to connected companies to prevent forestalling.
3.80 Preventing abuse of R&D tax relief for small and medium-sized enterprises (SMEs) – To help prevent abuse of the payable credit, from 1 April 2020, the amount of payable R&D tax credit that a qualifying loss-making company can receive in any tax year will be restricted to three times the company’s total PAYE and NICs liability for that year. This will ensure the relief is robust against identified abuse, including fraud, following the prevention by HMRC of fraudulent claims worth £300 million.19 The government will consult on this change. (70)
3.81 VAT grouping – The government will legislate in Finance Bill 2018-19 to extend the eligibility to join a VAT group to certain non-corporate entities. In addition, revised VAT grouping guidance will be issued to:
• amend the definition of ‘bought in services’ to ensure that such services are subject toUK VAT
• provide clarity to businesses on HMRC’s protection of revenue powers and treatment of UKfixed establishments
3.82 These guidance changes will be published in draft and come into effect from 1 April 2019. (72)
3.83 VAT Specified Supplies Order – As announced in July 2018, the government will legislate to prevent a version of VAT avoidance (known as ‘looping’) that involves UK insurers setting up associates in non-VAT territories and using these associates to supply their UK customers. This allows them to reclaim VAT on costs that UK based competitors are unable to reclaim. (72)
17 ‘Annual Report and Accounts 2017-18’, HMRC, July 2018; ‘Tacking tax avoidance, evasion and non-compliance’, HM Treasury, November 2017.18 ‘Measuring tax gaps 2018 edition‘, HMRC, June 2018.19 ‘HMRC arrest three during investigation into suspected £300m corporation tax scam’, HMRC Press Release, June 2016.
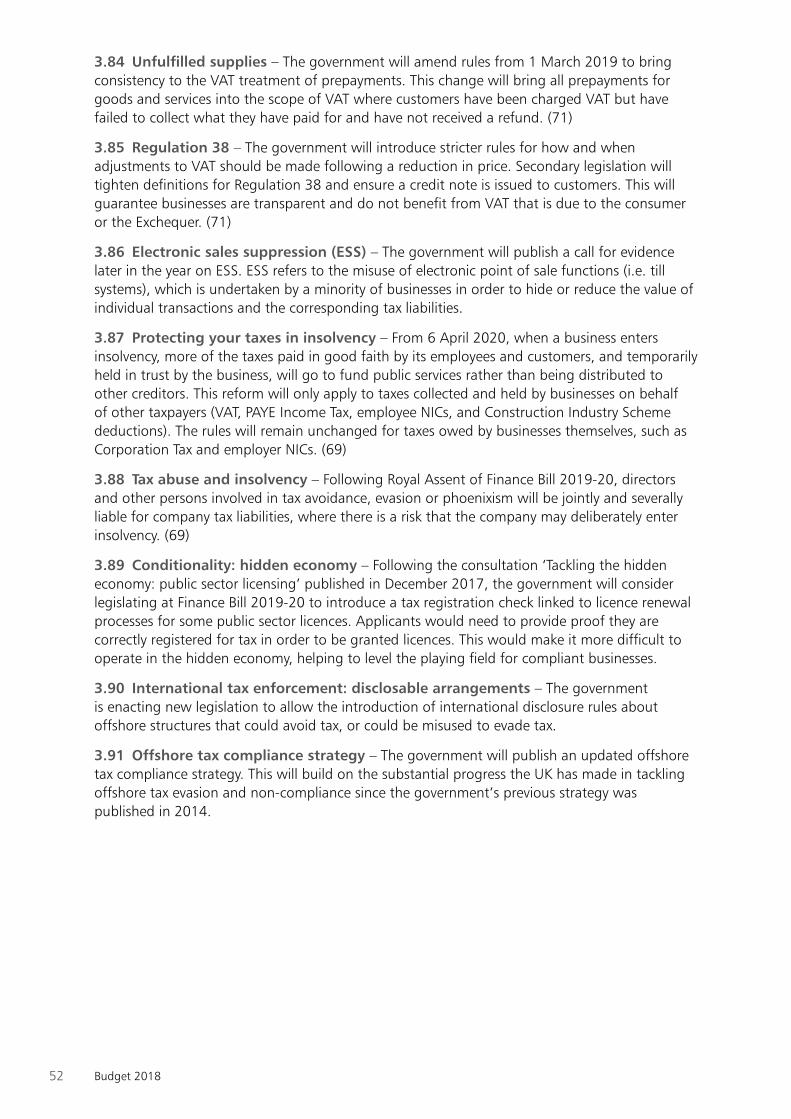
52 Budget 2018
3.84 Unfulfilled supplies – The government will amend rules from 1 March 2019 to bring consistency to the VAT treatment of prepayments. This change will bring all prepayments for goods and services into the scope of VAT where customers have been charged VAT but have failed to collect what they have paid for and have not received a refund. (71)
3.85 Regulation 38 – The government will introduce stricter rules for how and when adjustments to VAT should be made following a reduction in price. Secondary legislation will tighten definitions for Regulation 38 and ensure a credit note is issued to customers. This will guarantee businesses are transparent and do not benefit from VAT that is due to the consumer or the Exchequer. (71)
3.86 Electronic sales suppression (ESS) – The government will publish a call for evidence later in the year on ESS. ESS refers to the misuse of electronic point of sale functions (i.e. till systems), which is undertaken by a minority of businesses in order to hide or reduce the value of individual transactions and the corresponding tax liabilities.
3.87 Protecting your taxes in insolvency – From 6 April 2020, when a business enters insolvency, more of the taxes paid in good faith by its employees and customers, and temporarily held in trust by the business, will go to fund public services rather than being distributed to other creditors. This reform will only apply to taxes collected and held by businesses on behalf of other taxpayers (VAT, PAYE Income Tax, employee NICs, and Construction Industry Scheme deductions). The rules will remain unchanged for taxes owed by businesses themselves, such as Corporation Tax and employer NICs. (69)
3.88 Tax abuse and insolvency – Following Royal Assent of Finance Bill 2019-20, directors and other persons involved in tax avoidance, evasion or phoenixism will be jointly and severally liable for company tax liabilities, where there is a risk that the company may deliberately enter insolvency. (69)
3.89 Conditionality: hidden economy – Following the consultation ‘Tackling the hidden economy: public sector licensing’ published in December 2017, the government will consider legislating at Finance Bill 2019-20 to introduce a tax registration check linked to licence renewal processes for some public sector licences. Applicants would need to provide proof they are correctly registered for tax in order to be granted licences. This would make it more difficult to operate in the hidden economy, helping to level the playing field for compliant businesses.
3.90 International tax enforcement: disclosable arrangements – The government is enacting new legislation to allow the introduction of international disclosure rules about offshore structures that could avoid tax, or could be misused to evade tax.
3.91 Offshore tax compliance strategy – The government will publish an updated offshore tax compliance strategy. This will build on the substantial progress the UK has made in tackling offshore tax evasion and non-compliance since the government’s previous strategy was published in 2014.
53Budget 2018
4 Productivity
Introduction4.1 The government has made productivity a key priority, because increasing productivity is the only sustainable way to boost economic growth and prosperity, and to deliver better jobs and higher income for people across the country. Businesses can become more productive by, for example, adopting better equipment and techniques, and investing in training their staff. Productive firms pay higher wages, are more competitive, and are more likely to succeed internationally. As Chart 4.1 shows, over the long term, wages rise alongside productivity. When productivity rises, this in turn increases tax receipts and government’s ability to provide public services.
Source: HM Treasury calculations
Output per employee Real total compensation per employee
2000 Q1
(200
0 =
Ind
ex)
2002 Q1 2004 Q1 2006 Q1 2008 Q1 2010 Q1 2012 Q1 2014 Q1 2016 Q1 2018 Q1
Chart 4.1: National productivity and wages over time
95
97
99
101
103
105
107
109
111
113
115
117
119
4.2 Since the financial crisis, the UK’s productivity growth has been below long-term trends.1 The government has already taken decisive action to address this challenge by significantly boosting capital investment, and public investment is set to average 2.2% of GDP over the next 5 years – levels not consistently sustained in 40 years.2 This is supporting investment in the fastest, most reliable broadband connections, the largest roads investment programme in a generation, and the biggest rail investment programme since Victorian times,3 enabling
1 ‘International comparisons of UK productivity’, Office for National Statistics, October 2017.2 Excluding the exceptional financial crisis years following 2008-09, the last time there was a higher level of public sector net investment was in 1978-79 to 1980-81. HM Treasury calculations; ‘Public Finances Databank’, OBR, October 2018; ‘Economic and fiscal outlook’, OBR, October 2018. 3 ‘Action for Roads’, Department for Transport, July 2013; ‘Investing in Britain’s future’, HM Treasury, June 2013.
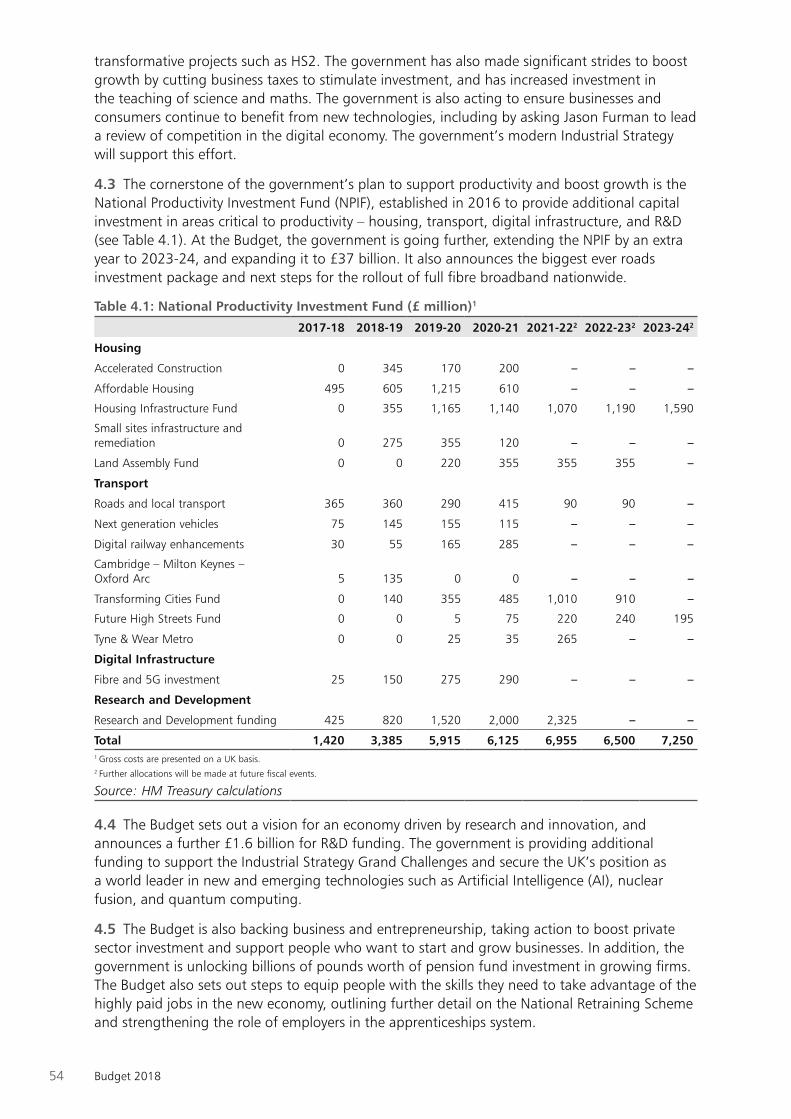
54 Budget 2018
transformative projects such as HS2. The government has also made significant strides to boost growth by cutting business taxes to stimulate investment, and has increased investment in the teaching of science and maths. The government is also acting to ensure businesses and consumers continue to benefit from new technologies, including by asking Jason Furman to lead a review of competition in the digital economy. The government’s modern Industrial Strategy will support this effort.
4.3 The cornerstone of the government’s plan to support productivity and boost growth is the National Productivity Investment Fund (NPIF), established in 2016 to provide additional capital investment in areas critical to productivity – housing, transport, digital infrastructure, and R&D (see Table 4.1). At the Budget, the government is going further, extending the NPIF by an extra year to 2023-24, and expanding it to £37 billion. It also announces the biggest ever roads investment package and next steps for the rollout of full fibre broadband nationwide.
Table 4.1: National Productivity Investment Fund (£ million)1
2017-18 2018-19 2019-20 2020-21 2021-222 2022-232 2023-242
Housing
Accelerated Construction 0 345 170 200 – – –
Affordable Housing 495 605 1,215 610 – – –
Housing Infrastructure Fund 0 355 1,165 1,140 1,070 1,190 1,590
Small sites infrastructure and remediation 0 275 355 120 – – –
Land Assembly Fund 0 0 220 355 355 355 –
Transport
Roads and local transport 365 360 290 415 90 90 –
Next generation vehicles 75 145 155 115 – – –
Digital railway enhancements 30 55 165 285 – – –
Cambridge – Milton Keynes – Oxford Arc 5 135 0 0 – – –
Transforming Cities Fund 0 140 355 485 1,010 910 –
Future High Streets Fund 0 0 5 75 220 240 195
Tyne & Wear Metro 0 0 25 35 265 – –
Digital Infrastructure
Fibre and 5G investment 25 150 275 290 – – –
Research and Development
Research and Development funding 425 820 1,520 2,000 2,325 – –
Total 1,420 3,385 5,915 6,125 6,955 6,500 7,2501 Gross costs are presented on a UK basis.2 Further allocations will be made at future fiscal events.
Source: HM Treasury calculations
4.4 The Budget sets out a vision for an economy driven by research and innovation, and announces a further £1.6 billion for R&D funding. The government is providing additional funding to support the Industrial Strategy Grand Challenges and secure the UK’s position as a world leader in new and emerging technologies such as Artificial Intelligence (AI), nuclear fusion, and quantum computing.
4.5 The Budget is also backing business and entrepreneurship, taking action to boost private sector investment and support people who want to start and grow businesses. In addition, the government is unlocking billions of pounds worth of pension fund investment in growing firms. The Budget also sets out steps to equip people with the skills they need to take advantage of the highly paid jobs in the new economy, outlining further detail on the National Retraining Scheme and strengthening the role of employers in the apprenticeships system.
55Budget 2018
4.6 As the UK prepares to leave the EU, the Budget is supporting the economy to be even more competitive, global and outward-facing. The government will empower local authorities to drive growth in their areas, including by building more homes in the right places, and is committed to ensuring people in every region and nation of the UK benefit from the proceeds of growth. The Budget announces a Future High Streets Fund that will invest £675 million to support local areas to improve access to high streets and town centres, and an extension to the Transforming Cities Fund, funding significant transport projects in English cities.
Infrastructure
4.7 High-quality infrastructure is essential to supporting jobs and economic growth, and to improving people’s quality of life. The Budget announces the biggest ever strategic roads investment package, and additional steps for the nationwide rollout of digital infrastructure. Overall, by 2021 the government will be investing £9 billion a year more in infrastructure than in 2015.4
Modernising transport
4.8 National Roads Fund – The government is delivering its commitment to hypothecate English Vehicle Excise Duty to roads spending, announcing that the National Roads Fund will be £28.8 billion between 2020-25. The Fund will provide long-term certainty for roads investment, including the new major roads network and large local major roads schemes, such as the North Devon Link Road.
4.9 Roads Investment Strategy 2 – The Budget is announcing the draft Roads Investment Strategy 2. This is the largest ever investment in England’s strategic roads and will enable the government to build on the successes of Roads Investment Strategy 1, such as the A1(M) link to Newcastle, and progress transformative projects like the A66 Trans-Pennine, the Oxford-Cambridge Expressway, and the Lower Thames Crossing. The government expects to spend £25.3 billion on this strategy, funded by the National Roads Fund, between 2020-25.
4.10 Local roads – The government will allocate £420 million to local authorities in 2018-19 to tackle potholes, repair damaged roads, and invest in keeping bridges open and safe. To support projects across England that ease congestion on local routes, the government will also make £150 million of NPIF funding available to local authorities for small improvement projects such as roundabouts. (4)
4.11 Transforming Cities Fund extension – As part of the NPIF, the government is extending the Transforming Cities Fund by a year to 2022-23. This will provide an extra £240 million to the six metro mayors for significant transport investment in their areas: £21 million for Cambridgeshire and Peterborough, £69.5 million for Greater Manchester, £38.5 million for Liverpool City Region, £23 million for West of England, £71.5 million for the West Midlands, and £16.5 million for Tees Valley. In addition, a further £440 million will be made available to the city regions shortlisted for competitive funding. Ten city regions are eligible for this funding, and the government will shortly be announcing a further two.
4.12 Transforming Cities Fund: Future Mobility Zones – To support the Industrial Strategy Future of Mobility Grand Challenge, £90 million from the NPIF will be allocated to the Transforming Cities Fund to create Future Mobility Zones. This will trial new transport modes, services, and digital payments and ticketing. £20 million of this will be allocated to the West Midlands.
4 HM Treasury analysis; ‘Congestion, Capacity and Carbon‘, National Infrastructure Commission, October 2017; ‘National Infrastructure Assessment: Technical Annex’, National Infrastructure Commission, July 2018.

56 Budget 2018
Digital infrastructure
4.13 Full fibre networks – The government set out its strategy to meet the goal of a nationwide full fibre network by 2033 in the Future Telecoms Infrastructure Review published in July 2018.5 Full fibre networks are much faster, more reliable, and cheaper to operate than their copper predecessors. The Budget sets out the next steps to accelerate the rollout of full fibre:
• the Budget allocates £200 million from the NPIF to pilot innovative approaches todeploying full fibre internet in rural locations, starting with primary schools, and with avoucher scheme for homes and businesses nearby. The first wave of this will include theBorderlands, Cornwall, and the Welsh Valleys
• alongside the Budget, the government is publishing consultations to mandategigabit-capable connections to new build homes and speed up the delivery of upgradedconnections to tenants, making it quicker and easier for communications providers to rollout full fibre networks
• the government is also announcing that Suffolk is the first local area to be awarded£5.9 million of funding from the third wave of the Local Full Fibre Networks challenge fund,enabling next-generation full fibre connections to key public buildings
Infrastructure strategy
4.14 National Infrastructure Strategy – The government will respond in full to the National Infrastructure Commission’s (NIC) ‘National Infrastructure Assessment’6 through a National Infrastructure Strategy that will be published in 2019. Alongside the Budget, the government has published an interim response setting out its investment record and progress in the priority areas identified in the NIC’s report.
4.15 NIC study: infrastructure resilience – The government has commissioned a new NIC study, to be published in Spring 2020, on how to improve the resilience of the UK’s infrastructure in light of technological advances and future challenges such as climate change.
4.16 Infrastructure finance review – The government will review its existing support for infrastructure finance, to ensure that it continues to meet market needs as the UK leaves the EU.
New technologies and innovation
4.17 Building on the government’s long-term commitment to R&D, and the Industrial Strategy ambition to raise total R&D investment to 2.4% of GDP by 2027, the Budget includes significant additional support for cutting-edge science and technologies that will transform the economy, create highly skilled jobs, and boost living standards across the UK.
4.18 Long-term support for research and development – The Budget allocates £1.6 billion to strengthen the UK’s global leadership in science and innovation. This reinforces the UK’s commitment to a strong environment for international scientific collaboration. Since 2016, the government has invested an additional £7 billion in research and development, the largest increase to R&D in 40 years.7
4.19 Industrial Strategy Challenge Fund – As part of this investment in R&D, the government will increase the Industrial Strategy Challenge Fund by £1.1 billion, supporting technologies of the future. This includes:
• Up to £121 million for Made Smarter to support the transformation of manufacturingthrough digitally-enabled technologies, such as the Internet of Things and virtual reality
5 ‘Future Telecoms Infrastructure Review‘, Department for Digital, Culture, Media & Sport, July 2018.6 ‘National Infrastructure Assessment‘, National Infrastructure Commission, July 2018.7 ‘Gross domestic expenditure on research and development time series’, ONS, 2018; ‘Spending Review 2015’, HM Treasury; ‘Autumn Budget 2017’, HM Treasury; HM Treasury calculations.
57Budget 2018
• Up to £78 million for the Stephenson Challenge, supporting innovation in electric motortechnology, making vehicles lighter and more efficient than ever before
4.20 Quantum technologies – The government will invest a further £235 million to support the development and commercialisation of quantum technologies, including up to £70 million from the Industrial Strategy Challenge Fund, and £35 million to support a new national quantum computing centre. These technologies will transform capabilities in computing, sensing and communications, bringing promising new approaches to solving global problems such as disease and climate change. This investment is in addition to the government’s recent £80 million extension of the Quantum Technology Hubs and takes overall funding for the second phase of the UK’s world-leading National Quantum Technology Programme to £315 million. (32)
4.21 Nuclear fusion – To maintain UK leadership in nuclear fusion and support the government’s Clean Growth Grand Challenge, the Budget announces an additional £20 million in 2019-20 for the UK Atomic Energy Agency to accelerate its ground-breaking work on the development and commercialisation of fusion technologies. (31)
4.22 Artificial Intelligence and data-driven innovation – The government has already taken action to ensure the UK is at the forefront of emerging digital technologies, including through the Industrial Strategy Artificial Intelligence (AI) and Data Grand Challenge, and an AI sector deal of up to £950 million. The Budget sets out the following next steps:
• the Office for AI and Government Digital Service (GDS) will review how governmentcan use AI, automation and data in new ways to drive public sector productivity andwider economic benefits. This will feed into the innovation strategy being led by theCabinet Office
• the Data Science Campus at the ONS and the GDS will conduct an audit of data sciencecapability across the public sector, to make sure the UK public sector can realise themaximum benefits from data
• the government established the UK’s pioneering Centre for Data Ethics and Innovationto ensure that people have confidence in how data and technologies, such as AI, areused. The Budget announces that the Centre has been commissioned to study the use ofdata in shaping people’s online experiences, and the potential for bias in decisions madeusing algorithms
4.23 Global AI and future talent fellowships – To attract, retain and develop world-leading research talent, the government will invest up to £50 million in new Turing AI Fellowships to bring the best global researchers in AI to the UK, and £100 million in an international fellowship scheme.
4.24 Catapults – To support entrepreneurs and businesses to access and adopt cutting-edge technologies, the government is confirming £115 million to extend funding for the Digital Catapult, which has centres in the North East, South East and Northern Ireland, and the Medicines Discovery Catapult in Cheshire. This builds on the £1 billion in long-term funding already committed to the broader network of Catapult centres located across the UK.
4.25 Distributed Ledger Technology Field Labs – Distributed ledger technologies (DLT), such as blockchain, could revolutionise how information is recorded, protected, stored and shared, transforming financial markets, supply chains and public services. To test their potential, the Digital Catapult will run a series of DLT Field Labs, working with businesses, investors, and regulators in a range of areas, including in construction and the management of goods in ports.

58 Budget 2018
4.26 Cryptoassets Taskforce – The Cryptoassets Taskforce was launched at the International Fintech Conference in March 2018. Following extensive work by HM Treasury, the Financial Conduct Authority (FCA) and the Bank of England, the Cryptoassets Taskforce report will be published alongside the Budget. The report will set out the UK’s approach to cryptoassets and distributed ledger technologies in financial services, including actions that will allow innovators to thrive and the benefits of these new technologies to be realised while at the same time mitigating the risks that arise from cryptoassets. This will ensure the UK maintains its international reputation as a financial services centre with high regulatory standards.
4.27 Science and innovation at the heart of government – To stimulate the use of cutting-edge science and innovation in government, the Budget announces a new £50 million per year fund designed to address the most pressing challenges in areas such as public health and cyber security. The fund will focus on joint programmes between government and industry, and will begin in 2021-22.
4.28 Supporting innovation across the country – The government will invest an additional £120 million through the Strength in Places Fund. This will support clusters of science and innovation excellence across the UK and enable them to further develop their strengths. This funding extends the existing programme until 2021-22.
Regulation fit for the future
4.29 The UK has a strong regulatory system which protects the interests of consumers and encourages high levels of investment. The government has already asked the NIC to undertake a study examining long-term challenges for utilities regulation. In addition, the Budget is announcing policies to accelerate innovation and collaboration in utilities regulation.
4.30 Encouraging innovation in regulated utilities – The government will launch a consultation on how to encourage greater innovation in the utilities sectors.
4.31 Increasing the capacity of the UK Regulators Network – Regulated sectors face shared challenges such as adapting to technological change, delivering future infrastructure and protecting vulnerable consumers. The membership body, UK Regulators Network (UKRN), can play a central role in forging a shared response to these challenges. To support this, regulators have pledged additional resources for UKRN to deliver a cross-sector project aimed at improving outcomes for vulnerable consumers. In addition, UKRN will publish a plan in spring 2019 outlining how it will improve collaboration between regulators.
4.32 Improving government messaging to regulators – The government will review the process of setting future ‘Strategic Policy Statements’ to Ofgem, Ofcom and Ofwat, to determine how best to set clear strategic direction for regulators, consistent with cross-sectoral government priorities.
Global Britain
4.33 The Budget takes further steps to sustain the UK’s position as an outward-looking and open economy.
4.34 Supporting exports – To provide additional fixed rate finance to overseas buyers who choose UK goods and services, UK Export Finance (UKEF) will make a one-off increase to their Direct Lending Facility of up to £2 billion over 2020-21 and 2021-22.
4.35 Attracting inward investment – The government will strengthen its investment links with global partners to encourage additional inward investment, including becoming a European Partner to the Institutional Investor Roundtable that brings together leading global investment funds.
59Budget 2018
4.36 Strengthening the overseas network in Europe – To provide enhanced support to UK businesses, the Department for International Trade will expand their network of advisers in Europe. (30)
4.37 Enhancing the UK border experience – In 2019, the government will introduce changes at the UK border to enhance the experience for business and leisure travellers to the UK. As part of this, citizens of the United States, Canada, New Zealand, Australia and Japan will, by next summer, be able to use the e-passport gates at UK ports, significantly improving the flow of passengers at busy airports such as Heathrow. Businesses will be able to become customs trusted traders (including ‘Authorised Economic Operator’) in half the time it currently takes, as part of the UK’s aim to be at the cutting edge of global customs administration. HMRC will implement the improvements within 2 years.
4.38 Festival of Innovation and Creativity – In October the government committed £120 million to a UK Festival of Innovation and Creativity. The Festival will deliver an exciting programme of events on arts, culture, design and tech across the country, and will help attract new inward investment.
Enterprise and business support
4.39 In order to support the UK’s established and emerging businesses, the Budget takes further action to increase management capability and technology adoption, and improves firms’ access to finance.
4.40 Management capability – The Productivity Leadership Group has shown that business-led approaches to improving productivity work. Building on work with Be the Business and the emerging findings of the Industrial Strategy Business Productivity Review, to support management capability so that businesses can raise their productivity, the government will:
• create a Small Business Leadership Programme, delivered in partnership with businessschools and leading businesses across England. 2,000 places will be delivered in 2019-20,with an ambition to train 10,000 people per year by 2025 (81)
• invest up to £25 million to boost business productivity through the Knowledge TransferPartnerships scheme, placing over 200 additional graduates and academics with relevantskills into firms to translate their research insights into business growth (27)
• invest £20 million in 2019-20 to support local peer-to-peer networks focused on businessimprovement so that thousands of business leaders can share expertise on leadership,business development and technology adoption (81)
4.41 Digital tools for business – The government will work in partnership with large banks, professional services firms and technology companies to support the productivity of their small business customers. The government will also improve the customer experience for businesses accessing online government information and services. (81)
4.42 Backing entrepreneurs – To build on the UK’s reputation as one of the best places in the world to start and grow a business, the government will extend the funding of the British Business Bank’s Start-Up Loans Programme to 2021 so it can continue to provide loans and mentoring to entrepreneurs. The British Business Bank, which started operating in 2014, is the government’s UK-wide economic development bank. It makes finance markets for smaller businesses work more effectively, allowing those businesses to prosper, grow and build UK economic activity. (28)
4.43 Pension fund investment in patient capital – Autumn Budget 2017 announced an action plan to unlock £20 billion of finance for innovative high-growth firms, and established a taskforce to address the barriers to pensions investment in patient capital. With total assets
60 Budget 2018
under management expected to exceed £1 trillion by 2025,8 defined contribution pension schemes have a vital role to play in long-term financing for UK growth and innovation. Following The Pensions Regulator’s updated guidance for pension schemes considering patient capital investment,9 the Budget announces that:
• through the British Business Bank, the government will support pension funds to invest ingrowing UK businesses. Several of the largest defined contribution pension providers in theUK have committed to work with the British Business Bank to explore options for pooledinvestment in patient capital, including Aviva, HSBC, L&G, NEST, The People’s Pension, andTesco Pension Fund
• the FCA will publish a discussion paper by the end of 2018 to explore how effectively theUK’s existing fund regime enables investment in patient capital. This will accompany theongoing work of HM Treasury’s Asset Management Taskforce to explore the feasibility of anew long-term asset fund
• the Department for Work and Pensions will consult in 2019 on the function of the pensionscharge cap to ensure that it does not unduly restrict the use of performance fees withindefault pension schemes, while maintaining member protections
• the FCA will consult by the end of 2018 on updating the permitted links framework toallow unit-linked pension funds to invest in an appropriate range of patient capital assets
4.44 Access to finance and EU exit – The government is committed to supporting the UK’s fast-growing and innovative firms to secure the external finance they need to invest and grow. As the UK leaves the EU, it continues to actively explore options for a future relationship with the European Investment Bank Group (EIBG). However, if no future relationship with the EIBG is in place before the UK leaves the EU on 29 March 2019, the government will provide the British Business Bank with the resources to enable it to make up to £200 million of additional investment in UK venture capital and growth finance in 2019-20.
4.45 Intellectual property – The Intellectual Property Office will support more companies to use their intellectual property to access finance, piloting a new offer to help businesses secure high-quality valuations, and will work with banks to improve their awareness of the opportunities and true credit risk associated with such lending.
4.46 SME access to dispute resolution and redress – The government welcomes the FCA’s plans to expand access to the Financial Ombudsman Service (FOS) to small and medium-sized enterprises (SMEs) with a turnover of up to £6.5 million, along with its consultation on increasing the FOS award limit to £350,000. As outlined in the FCA’s recent policy statement, the FOS will now take steps to ensure they have the necessary skills and processes in place to handle these new cases. The government also expects the banking industry to set out its response to the recommendations in Simon Walker’s report on alternative dispute resolution for SMEs by the end of November. This includes responding to its recommendations for a voluntary dispute resolution mechanism for SMEs outside the FOS remit, but below £10 million turnover, and to set up a process that can address unresolved historical complaints.
Skills
4.47 The Budget sets out the government’s vision for developing the new skills needed for the UK’s long-term prosperity, in order to build an economy fit for the future.
8 ‘UK Defined Contribution: Looking Beyond the Passive Approach‘, Spence Jonson Market Intelligence, 2016.9 ‘Managing DC benefits: Investment governance’, The Pensions Regulator, October 2018.
61Budget 2018
4.48 Apprenticeships – The government will introduce a package of reforms to strengthen the role of employers in the apprenticeship programme, so they can develop the skills they need to succeed. As part of this:
• the government will make up to £450 million available to enable levy paying employers totransfer up to 25% of their funds to pay for apprenticeship training in their supply chains
• the government will provide up to £240 million, to halve the co-investment rate forapprenticeship training to 5% (23)
• the government will also provide up to £5 million to the Institute for Apprenticeshipsand National Apprenticeship Service in 2019-20, to identify gaps in the training providermarket and increase the number of employer-designed apprenticeship standards availableto employers. All new apprentices will start on these new, higher-quality courses fromSeptember 2020
• the Exchequer Secretary to the Treasury and the Minister for Apprenticeships and Skills willwork with a range of employers and providers to consider how they are responding to theapprenticeship levy across different sectors and regions in England, as well as the futurestrengthened role of apprenticeships in the post-2020 skills landscape
4.49 National Retraining Scheme – The government will work with employers to give workers the opportunity to upskill or retrain. The Budget allocates £100 million for the first phase of the National Retraining Scheme (NRS). This will include a new careers guidance service with expert advice to help people identify work opportunities in their area, and state-of-the-art courses combining online learning with traditional classroom teaching to develop key transferable skills. The National Retraining Partnership between the government, the Confederation of British Industry and the Trades Union Congress will focus on job-specific retraining in phase two. (80)
4.50 Skills pilots – The government will fund £20 million of skills pilots. This will include:
• a new £3 million pilot to help employers in Greater Manchester and surrounding areas toaddress local digital skills gaps through short training courses (26)
• a £10 million pilot in Greater Manchester, working with the Federation of Small Businesses,to test what forms of government support are most effective in increasing training levels forthe self-employed (24)
• £7 million match funding alongside employers to provide on-the-job training to youngpeople not currently in employment, education or training in Greater Manchester, and tomove them into sustainable career paths with employers (25)
4.51 T levels – The government will provide £38 million of capital funding to support implementation of the first three T levels in 2020 across 52 providers.
4.52 Post-18 education and funding – The government’s review into the post-18 education and funding system in England will ensure that all students are given a genuine choice between high-quality technical, vocational and academic routes in a system accessible to all; students and taxpayers are getting value for money; and employers can access the skilled workforce they need. As part of the review, the government will receive advice from an independent panel, chaired by Philip Augar. The panel will report to ministers at an interim stage before the government concludes the overall review.
4.53 Human capital – The government is working with the ONS to better understand how its investment in people helps improve their earning and skills potential. The ONS will consult on how to further measure human capital, and will convene an international meeting of experts in London later this year.
62 Budget 2018
Housing
4.54 The government is determined to fix the broken housing market. Building more homes in the right places is critical to unlocking productivity growth and makes housing more affordable. At Autumn Budget 2017, the government set out a comprehensive package of new policies to raise housing supply by the end of this Parliament to its highest level since 1970, on track to reach 300,000 a year. At this Budget, the government sets out further steps to deliver this ambition.
4.55 Delivering housing investment – At Autumn Budget 2017, the government announced over £15 billion of new financial support, bringing total support for housing to at least £44 billion over a five-year period. The Budget announces further progress to implement this commitment, including:
• £291 million from the Housing Infrastructure Fund, funded by the NPIF, to unlock18,000 new homes in East London through improvements to the Docklands Light Railway
• the British Business Bank will deliver a new scheme providing guarantees to support up to£1 billion of lending to SME housebuilders
• providing £653 million to 2021-22 for strategic partnerships with nine housing associationsto deliver over 13,000 homes
• £75 million from the Home Building Fund for St Modwen plc, to fund infrastructure tobuild over 13,000 new homes
• a new five-year strategic business plan for Homes England, to be published on30 October 2018
4.56 Housing investment for the long term – In September 2018, the government announced £2 billion new funding in the Affordable Homes Programme to give some housing associations long-term funding certainty to 2028-29. The government announces in this Budget that:
• the Housing Revenue Account cap that controls local authority borrowing for housebuilding will be abolished from 29 October 2018 in England, enabling councils to increasehouse building to around 10,000 homes per year. The Welsh Government is takingimmediate steps to lift the cap in Wales (33)
• the Housing Infrastructure Fund, funded by the NPIF, will increase by £500 million to a total£5.5 billion, unlocking up to 650,000 new homes
4.57 Accelerating housing delivery – Alongside the Budget, Sir Oliver Letwin has published his independent review of the gap between housing completions and the amount of land allocated or permissioned. The review found no evidence that speculative land banking is part of the business model for major house builders, nor that this is a driver of slow build out rates. The review concluded that greater differentiation in the types and tenures of housing delivered on large sites would increase the market absorption rates of new homes – the binding constraint on build out rates on large sites – and has set out recommendations to achieve this aim. The government will respond to the review in full in February 2019. In order to minimise uncertainty for housebuilders, the government confirms that Help to Buy Equity Loan funding will not be made contingent on large sites with existing outline permission being developed in conformity with any new planning policy on differentiation. The government will honour any funding commitments made to sites with existing outline planning permission, regardless of any new planning policy on differentiation.
63Budget 2018
4.58 Planning reform – The government has already revised the National Planning Policy Framework, implementing 85 of the proposals set out in the Housing White Paper and Autumn Budget 2017, ensuring that more land in the right places is available for housing. The Budget announces that the government has launched a consultation on new permitted development rights to allow upwards extensions above commercial premises and residential properties, including blocks of flats, and to allow commercial buildings to be demolished and replaced with homes.
4.59 Land value uplift – The government confirms that it will introduce a simpler system of developer contributions that provides more certainty for developers and local authorities, while enabling local areas to capture a greater share of uplift in land values for infrastructure and affordable housing. The reforms include simplifying the process for setting a higher zonal Community Infrastructure Levy in areas of high land value uplift, and removing all restrictions on Section 106 pooling towards a single piece of infrastructure. The government will also introduce a Strategic Infrastructure Tariff for Combined Authorities and joint planning committees with strategic planning powers.
4.60 Strategic housing deals – The government will make £10 million capacity funding available to support ambitious housing deals with authorities in areas of high housing demand to deliver above their Local Housing Need. (36)
4.61 Help to Buy Equity Loan – The Help to Buy Equity Loan was introduced in 2013 to support the housing market in challenging conditions. By March 2021, the government expects to have invested around £22 billion in the scheme, supporting up to 360,000 households into homeownership. Conditions in the market have improved since 2013: there is a growing number of high Loan to Value products available to first-time buyers, and housing supply continues to increase. To ensure future support is targeted at those who need most help into homeownership, the Budget announces that from April 2021, a new Help to Buy Equity Loan scheme will run for 2 years before closing in March 2023. The new scheme will be available for first-time buyers only, and for houses with a market value up to new regional property price caps, as set out in Table 4.2. These caps are set at 1.5 times the current forecast regional average first-time buyer price, up to a maximum of £600,000 in London. The government does not intend to introduce a further Help to Buy Equity Loan scheme after March 2023.

64 Budget 2018
Table 4.2: New Help to Buy regional property price caps
RegionPrice cap for properties eligible for Help to Buy Equity Loan scheme
from April 2021 to March 2023
North East £186,100
North West £224,400
Yorkshire and The Humber £228,100
East Midlands £261,900
West Midlands £255,600
East of England £407,400
London £600,000
South East £437,600
South West £349,000
Source: HM Treasury analysis
4.62 Shared ownership – To support homeownership further, the government is launching a call for evidence inviting proposals from investors willing to collaborate with government to deliver a new wave of shared ownership homes.
4.63 New discounted homes in up to 500 neighbourhoods – The government wants to see parishes and communities provide many more homes for local people to buy, at prices they can afford. The Localism Act allows the people who know their area best to come together to prepare neighbourhood plans and development orders, to ensure they get the right homes, in the right places. The government will provide £8.5 million of resource support so that up to 500 parishes can allocate or permission land for homes sold at a discount. Neighbourhood plans and orders are approved by local referendums, and the government will update planning guidance to ensure that these cannot be unfairly overruled by local planning authorities. The government will also explore how it can empower neighbourhood groups to offer these homes first to people with a direct connection to the local area. (35)
Clean Growth
4.64 The economy of the future will be low carbon and green, and the UK is well positioned to lead this global transition. The Budget sets out how the government is accelerating this shift to a clean economy, building on the Industrial Strategy, Clean Growth Strategy, and 25 Year Environment Plan.
4.65 Industrial Energy Transformation Fund – As part of the Industrial Strategy, the government will establish an Industrial Energy Transformation Fund, backed by up to £315 million of investment, to support businesses with high energy use to transition to a low carbon future and to cut their bills through increased energy efficiency. (42)
4.66 Improving business energy efficiency – The government will issue a call for evidence on introducing a new Business Energy Efficiency Scheme, focused on smaller businesses. Over time, this scheme will reduce business energy bills and carbon emissions. The call for evidence will seek views on a range of possible delivery options.
4.67 Tackling air quality – £20 million additional funding will be allocated to support more local authorities to meet their air quality obligations. (41)
4.68 Flood risk management – The Budget allocates £13 million to tackle risks from floods and climate change, through pilot projects to ensure property owners have the best information on protecting their homes, and expanding the flood warning system to an additional 62,000 at-risk properties.

65Budget 2018
4.69 Plastics and waste innovation funding – The government is providing £20 million to support measures in this Budget to tackle plactics and boost recycling – £10 million more for plastics R&D, and £10 million to pioneer innovative approaches to boosting recycling and reducing litter, such as smart bins. (38)
4.70 Supporting abandoned waste site clearance – A government pilot scheme will make available up to £10 million to the Environment Agency to work with partners to clear the worst abandoned waste sites that blight local communities. (39)
4.71 Funding for tree planting – Planting trees helps offset carbon emissions and supports wildlife. To provide the long-term certainty needed for investment in woodland, the government will set up a Woodland Carbon Guarantee scheme which will support the planting of around 10 million trees by purchasing up to £50 million of carbon credits for qualifying tree planting. The government will also provide £10 million funding between 2019-20 and 2022-23 for local community street trees and urban trees. (40)
4.72 Supporting the UK fishing sector – The government is investing £10 million from UK Research and Innovation to establish an innovation fund to help transform the industry and ensure the UK is a world leader in safe, sustainable and productive fishing. £2 million will also be provided for fishing safety projects across England and to give the devolved administrations the ability to do the same.
4.73 Avoiding food waste – Around 250 million meals’ worth of accessible edible food is needlessly wasted every year.10 The government will provide £15 million to charities and others to distribute this surplus food. (83)
Regional growth
4.74 The government’s ambition is for all regions to unlock their potential to boost national productivity and growth. To do this, the government is giving local places the powers and funding they need to invest in local priorities and address local barriers to productivity.
4.75 The Budget therefore funds new programmes delivered at the local level to address barriers to productivity and increases funding for existing programmes. These include:
• £770 million to extend the Transforming Cities Fund
• £675 million for a new Future High Streets Fund, which forms part of Our Plan for theHigh Street
• £420 million for local roads maintenance including potholes (4)
• £200 million to pilot innovative approaches to deploying full fibre internet in rural locations
• £150 million for small road improvement projects
• £120 million for the Strength in Places Fund to support areas of R&D excellence across the UK
• £20 million to support local peer-to-peer networks focused on business improvement
• £10 million to generate proposals for new business-backed Development Corporations andsimilar delivery bodies (34)
• £5 million to support new University Enterprise Zones (29)
10 ‘Action to reduce food waste announced’, Department for Environment, Food & Rural Affairs, October 2018.
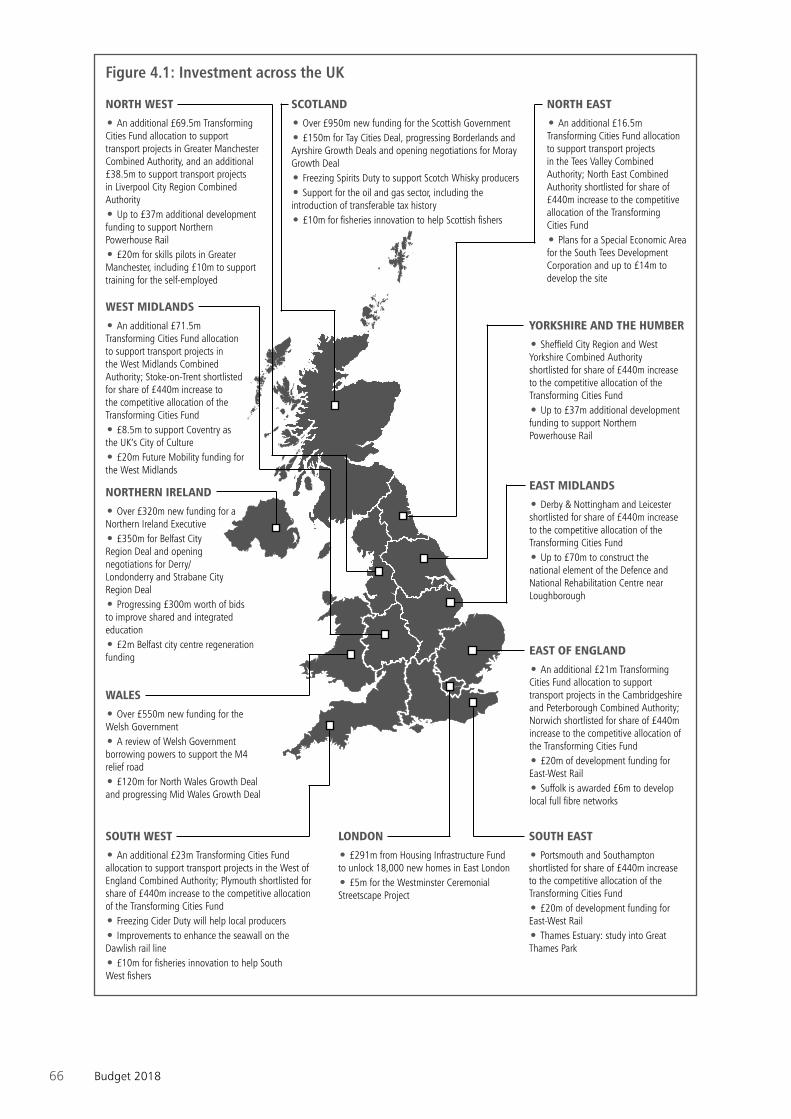
66 Budget 2018
Figure 4.1: Investment across the UK
NORTH WEST
• An additional £69.5m Transforming Cities Fund allocation to support transport projects in Greater Manchester Combined Authority, and an additional £38.5m to support transport projects in Liverpool City Region Combined Authority
• Up to £37m additional development funding to support Northern Powerhouse Rail
• £20m for skills pilots in Greater Manchester, including £10m to support training for the self-employed
WEST MIDLANDS
• An additional £71.5m Transforming Cities Fund allocation to support transport projects in the West Midlands Combined Authority; Stoke-on-Trent shortlisted for share of £440m increase to the competitive allocation of the Transforming Cities Fund
• £8.5m to support Coventry as the UK’s City of Culture
• £20m Future Mobility funding for the West Midlands
NORTHERN IRELAND
• Over £320m new funding for a Northern Ireland Executive
• £350m for Belfast City Region Deal and opening negotiations for Derry/ Londonderry and Strabane City Region Deal
• Progressing £300m worth of bids to improve shared and integrated education
• £2m Belfast city centre regeneration funding
WALES
• Over £550m new funding for the Welsh Government
• A review of Welsh Government borrowing powers to support the M4 relief road
• £120m for North Wales Growth Deal and progressing Mid Wales Growth Deal
SOUTH WEST
• An additional £23m Transforming Cities Fund allocation to support transport projects in the West of England Combined Authority; Plymouth shortlisted for share of £440m increase to the competitive allocation of the Transforming Cities Fund
• Freezing Cider Duty will help local producers
• Improvements to enhance the seawall on the Dawlish rail line
• £10m for fisheries innovation to help South West fishers
SCOTLAND
• Over £950m new funding for the Scottish Government
• £150m for Tay Cities Deal, progressing Borderlands and Ayrshire Growth Deals and opening negotiations for Moray Growth Deal
• Freezing Spirits Duty to support Scotch Whisky producers
• Support for the oil and gas sector, including the introduction of transferable tax history
• £10m for fisheries innovation to help Scottish fishers
LONDON
• £291m from Housing Infrastructure Fund to unlock 18,000 new homes in East London
• £5m for the Westminster Ceremonial Streetscape Project
NORTH EAST
• An additional £16.5m Transforming Cities Fund allocation to support transport projects in the Tees Valley Combined Authority; North East Combined Authority shortlisted for share of £440m increase to the competitive allocation of the Transforming Cities Fund
• Plans for a Special Economic Area for the South Tees Development Corporation and up to £14m to develop the site
YORKSHIRE AND THE HUMBER
• Sheffield City Region and West Yorkshire Combined Authority shortlisted for share of £440m increase to the competitive allocation of the Transforming Cities Fund
• Up to £37m additional development funding to support Northern Powerhouse Rail
EAST MIDLANDS
• Derby & Nottingham and Leicester shortlisted for share of £440m increase to the competitive allocation of the Transforming Cities Fund
• Up to £70m to construct the national element of the Defence and National Rehabilitation Centre near Loughborough
EAST OF ENGLAND
• An additional £21m Transforming Cities Fund allocation to support transport projects in the Cambridgeshire and Peterborough Combined Authority; Norwich shortlisted for share of £440m increase to the competitive allocation of the Transforming Cities Fund
• £20m of development funding for East-West Rail
• Suffolk is awarded £6m to develop local full fibre networks
SOUTH EAST
• Portsmouth and Southampton shortlisted for share of £440m increase to the competitive allocation of the Transforming Cities Fund
• £20m of development funding for East-West Rail
• Thames Estuary: study into Great Thames Park
67Budget 2018
Investing in UK towns and cities
4.76 Future High Streets Fund – As part of Our Plan for the High Street and alongside changes to business rates, the government will launch a new Future High Streets Fund to invest £675 million in England to support local areas to develop and fund plans to make their high streets and town centres fit for the future. This will invest in town centre infrastructure, including to increase access to high streets and support redevelopment and densification around high streets. It will include £55 million for heritage-based regeneration, restoring historic high streets to boost retail and bring properties back into use as homes, offices and cultural venues. The Fund will also establish a new High Streets Taskforce to disseminate best practice among local leaders. (45, 46)
4.77 High streets planning – The government will consult on planning measures to support high streets to evolve. As part of this, it will consult on creating a more flexible and responsive ‘change of use’ regime with new Permitted Development Rights that make it easier to establish new mixed-use business models on the high street. It will also trial a register of empty shops with selected local authorities, and trial a brokerage service to connect community groups to empty shops.
4.78 University Enterprise Zones – The government will provide £5 million to support up to 10 local areas to develop proposals for new University Enterprise Zones. They will promote collaboration between universities and businesses, support start-ups and scale-ups, and disseminate management skills. (29)
4.79 Development Corporations – The government will consult on the legal framework for Development Corporations. It will also launch a £10 million competitive fund, supported with advice from Sir George Iacobescu, to enable local areas to generate locally-led proposals for new business-backed Development Corporations and similar delivery bodies. (34)
4.80 Local infrastructure rate – Following the announcement at Autumn Budget 2017 that local authorities could bid for access to a local infrastructure rate to support infrastructure projects that are high value for money, five local authorities have been successful in the first round of applications. The Metropolitan Borough of Calderdale, Luton Borough Council, St Helens Council, Transport for London and the West Midlands Combined Authority will be able to borrow a total of £275 million at the new discounted interest rate of gilts +60 basis points.
4.81 Dawlish resilience – Following the £15 million of funding committed in November 2016, essential work will begin this November to strengthen the cliffs and protect the seawall at Dawlish. Plans for major improvements for the seawall at Dawlish will be published next summer.
Midlands Engine
4.82 Defence and National Rehabilitation Centre – Working with local partners, the government will continue to support the Midlands Engine with up to £70 million to construct the national element of the Defence and National Rehabilitation Centre, able to provide care for civilians to aid their recovery from debilitating injury and return to the world of work.
4.83 UK Mobility Data Institute – The West Midlands Combined Authority will receive up to £20 million, subject to approval of a satisfactory business case, to create the UK Mobility Data Institute, a research centre to collect, process and analyse transport data generated by new mobility technologies. (52)
68 Budget 2018
4.84 Coventry, UK City of Culture – The government will invest £8.5 million in Coventry’s plans to showcase the city when it hosts the UK City of Culture in 2021. The funding will support Belgrade Theatre to refurbish the auditorium and establish a new creative talent hub. It will also invest in Coventry’s Cathedral Quarter, including the refurbishment of historic venues, the creation of additional exhibition space and a centre for music education and concerts. (49)
4.85 Commonwealth Games Athletes’ Village – In October, the government announced £165 million investment to support the Commonwealth Games Athletes’ Village, which will unlock 5,000 new homes in the area after the Games, creating a long-lasting legacy for Birmingham and the Games.
4.86 Midlands Engine Strategy – The government will publish a refreshed Midlands Engine Strategy next year.
Northern Powerhouse
4.87 Northern Powerhouse Rail – Northern Powerhouse Rail will transform the economic geography of the North, connecting cities with faster, more frequent services to boost growth and improve the experiences of passengers across the region. The Budget announces up to a further £37 million to support the development of Northern Powerhouse Rail, building on £300 million already committed to ensure HS2 infrastructure can accommodate future potential Northern Powerhouse Rail and Midlands Engine Rail services. The first business case of the scheme is due at the end of the year. (50)
4.88 Tees Valley – The government is supporting local growth in the Tees Valley with plans for a Special Economic Area covering the South Tees Development Corporation (STDC) site and up to £14 million in funding for the STDC, the first Mayoral Development Corporation outside of London. This investment, subject to approval of a satisfactory business case, will enable the STDC to undertake early redevelopment of a part of the site and attract new business and investment. Designation of the site as a Special Economic Area would allow for the local retention of additional business rates growth.
4.89 Eden Project North – The government is providing £100,000 to support the development of proposals for an ‘Eden Project North’ centre in Morecambe.
4.90 Northern Powerhouse Strategy – The government will publish a refreshed Northern Powerhouse Strategy next year.
Cambridge – Milton Keynes – Oxford Arc
4.91 Responding to the NIC – Alongside the Budget, the government publishes its response to the NIC’s report on the Arc, detailing significant progress and future plans for the Arc.
4.92 Housing – The government supports the NIC’s ambition to deliver up to 1 million new homes in the Arc by 2050 to maximise sustainable economic growth. The government recognises that the environmental requirements to underpin sustainable growth need to be considered at a pan-Arc level, and that the Arc is valued for its wildlife and natural places. The Arc is an opportunity to demonstrate the ambitions of the government’s 25 Year Environment Plan.
4.93 East West Rail – A new East West Rail company has been established to accelerate the delivery of the central railway section between Cambridge and Bedford. The government is providing a further £20 million to develop a strategic outline business case for the railway. This will explore which routes best support the government’s vision to unlock up to 1 million new homes by 2050. (51)

69Budget 2018
4.94 Cross-Arc collaboration – The government confirms its commitment to work with local partners, and to provide new road and rail links to best achieve its vision for the Arc. The government also announces that:
• working with local partners, the government will publish an ambitious Arc-wide joint visionstatement by Spring 2019
• the government will appoint an independent business Chair for the Arc to provideexpert advice and act as an advocate and champion to help galvanise local, national andinternational support for the Arc, particularly from business and industry
• the government will also appoint a Ministerial Champion for the Arc, to provide furtherfocus and facilitate coordination across Whitehall
London and the South East
4.95 Housing Infrastructure Fund – The government will invest £291 million from the Housing Infrastructure Fund to unlock over 18,000 new homes in East London through investment in the Docklands Light Railway.
4.96 Westminster Ceremonial Streetscape Project – The government will provide £5 million for the Westminster Ceremonial Streetscape Project to improve security and better manage traffic.
4.97 Thames Estuary – Drawing on the Thames Estuary Commission report,11 the government is supporting a study to develop options and consult the local area on a Great Thames Park.
4.98 Crossrail 2 – The government is considering the recommendations of the Independent Affordability Review of Crossrail 2, and will consider the case for the project at the Spending Review.
Scotland, Wales and Northern Ireland
4.99 The government is committed to maintaining a strong and prosperous Union to preserve our shared values. In this Budget, the government is taking further steps to improve living standards and productivity across the UK, including targeted support in Scotland, Wales and Northern Ireland. Certain key economic policies are devolved, and the UK government will continue to work closely with the devolved administrations to deliver the maximum benefit for everyone across the UK.
4.100 Funding – Spending decisions taken by the UK government in the Budget result in Barnett consequentials for the devolved administrations to deliver their devolved responsibilities:
• the Scottish Government’s budget will increase by over £950 million through to 2020-21before adjustments for tax devolution
• the Welsh Government’s budget will increase by over £550 million through to 2020-21before adjustments for tax devolution. This includes over £25 million as a result of a5% uplift in Barnett consequentials agreed as part of the Welsh Government’s fiscalframework
• the budget for a Northern Ireland Executive will increase by over £320 million throughto 2020-21
4.101 The British Business Bank’s UK Network – The government is committed to ensuring that businesses across all regions and nations in the UK can access the finance they need to invest and grow. The British Business Bank is appointing a team to identify and help to reduce
11 ‘2050 Vision’, Thames Estuary 2050 Growth Commission, June 2018.

70 Budget 2018
geographical imbalances in access to finance for smaller businesses. The team will be based across the UK, including Scotland, Wales and Northern Ireland, with new, dedicated directors overseeing its work.
4.102 Supporting the UK’s fishing industry – Over half of the UK’s fishers are based in Scotland, Wales and Northern Ireland.12 The fishing industry across the UK will benefit from the government’s investment of £10 million from UK Research and Innovation to establish an innovation fund. This will help to ensure the UK is a world leader in safe, sustainable and productive fishing. The UK government will also provide additional funding to the devolved administrations to allow them to match the UK government’s increased contribution to fishing safety projects in England.
Scotland
4.103 City and growth deals in Scotland – The government commits £150 million to allow a Tay Cities Deal to be agreed. The government will also begin formal negotiations with local partners and the Scottish Government towards a Moray Growth Deal. The government continues to make good progress towards growth deals for Ayrshire and the Borderlands, and is working with the Scottish Government to achieve this, alongside local partners in England for the Borderlands. (48)
4.104 Maintaining the UK’s globally competitive oil and gas fiscal regime – The government is maintaining headline tax rates at their current level. This will help the oil and gas industry continue its recovery from the 2014 oil price crash, protect jobs, and ensure the UK is attractive for new investment, whilst giving the nation a fair return for its natural resources.
4.105 Oil and gas taxation: transferable tax history and retention of decommissioning expenditure – As announced at Autumn Budget 2017, the government will introduce a transferable tax history mechanism in Finance Bill 2018-19 for oil and gas companies that will remove tax barriers to new investment in the North Sea. The government will also amend the Petroleum Revenue Tax rules on retained decommissioning costs to simplify the way older fields can be sold to new investors. This will provide further support for an industry that is a vital part of the economies of Scotland and the rest of the UK.
4.106 Strengthening the UK’s offshore decommissioning industry – Building on the recent progress made by the oil and gas industry, the government will launch a call for evidence and work together with the Oil and Gas Authority to identify what more should be done to further strengthen Scotland and the UK’s position as a global hub for decommissioning.
Wales
4.107 Growth deals in Wales – The government commits £120 million to allow a North Wales Growth Deal to be agreed, the third deal to be agreed in Wales. The government is also working with local partners and the Welsh Government towards a Mid Wales Growth Deal. (48)
4.108 Infrastructure – The government has committed to the removal of tolls on the Severn Crossings from 17 December 2018. In addition, the Department for Transport and the Welsh Government continue to develop proposals for a number of potential rail schemes within Wales.
4.109 Welsh Government borrowing powers for the M4 relief road – The government will also support the delivery of a new M4 relief road through a review of the Welsh Government’s capital borrowing powers at the Spending Review, to consider whether the borrowing cap should be increased by up to £300 million to support this vital project.
12 ‘UK Sea Fisheries Statistics 2017’ Marine Management Organsiation, September 2018.
71Budget 2018
Northern Ireland
4.110 City Deals in Northern Ireland – The government commits £350 million for a Belfast City Region Deal, and will work with local partners to progress the deal, including establishing robust governance, accountability and transparency arrangements, to ensure this can be spent in the absence of a Northern Ireland Executive. The government will also begin formal negotiations with local partners towards a Derry/Londonderry and Strabane City Region Deal. (48)
4.111 Shared and integrated education and shared housing in Northern Ireland – The government will move forward with projects worth £300 million subject to value for money considerations, as part of the government’s commitment in the Fresh Start Agreement to provide up to £500 million to increase the provision of shared and integrated education and shared housing in Northern Ireland.
4.112 Belfast regeneration funding – The government will provide £2 million for the recovery and regeneration of Belfast city centre following a fire at the Bank Buildings in August.
4.113 VAT and APD – At the Budget the government is publishing its response to the call for evidence on the impact of VAT and APD on tourism in Northern Ireland. There will be no changes to the VAT or APD regimes in Northern Ireland at this time. The government will continue to explore ways to support a successful and growing tourism industry. In particular, establishing a technical working group to consider the practical and legal challenges to changing short-haul APD in Northern Ireland.

72 Budget 2018

73Budget 2018
5 Supporting public services and people
Introduction5.1 Since 2016, the government has continued to reduce debt while providing additional support for public services.1 The core schools budget is at a record high this year, standing at more than £42 billion,2 and the government has allocated £5.8 billion between 2015 and 2020 to deliver new school places.3 A further £6.3 billion was invested in the NHS at Autumn Budget 2017 for frontline services and improving buildings and facilities.4
5.2 The Budget builds on the government’s strong record of investment in public services and living standards. Since 2010, NHS funding has risen every year and the proportion of children in good or outstanding schools has risen from 66% to 86%.5 The government remains committed to protecting the UK from global threats and keeping people safe, honouring the NATO commitment to spend 2% of GDP on defence, and honouring the UK’s international and legal commitment to spend 0.7% of gross national income on official development assistance.6 Supported by the National Living Wage (NLW), the lowest paid have seen their wages grow by 8% above inflation since April 2015.7
5.3 The government’s balanced approach to managing public finances means that the Budget can also provide additional investment in vital public services now, as well as taking action to improve living standards by increasing take-home pay and supporting consumers to make their money go further.
5.4 The Budget provides significant new investment into the public services that people care about the most. This includes the following:
• funding for a new multi-year budget for the NHS until 2023-24, following the PrimeMinister’s June 2018 statement that the NHS budget would increase by £20.5 billion a yearin real terms by 2023-24
• additional funding for social care, to help local councils provide greater support for olderpeople with care needs, and to help more children to live safely at home
• further support for children and young people, including school equipment andmaintenance, and help for young people to build strong communities free from violence
• protecting citizens and communities, increasing defence spending to enable our world-classArmed Forces to face ever-changing threats, including the rise in cyber attacks, andsupporting counter-terrorism policing across the country
1 ‘Public sector finances: September 2018’, ONS, October 2018.2 ‘Dedicated Schools Grant: 2018 to 2019’, Department for Education, July 2018.3 ‘Basic need allocations’, Department for Education, March 2016.4 ‘Autumn Budget 2017’, HM Treasury, November 2017.5 ‘Spending Review 2010’, HM Treasury, October 2010; ‘Spending Round 2013’, HM Treasury, June 2013; ‘Children in good or outstanding schools’, Department for Education, August 2018.6 ‘Defence Expenditure of NATO Countries (2011-2018)’, NATO, July 2018; Official Development Assistance commitment is enshrined in the ‘International Development (Official Development Assistance Target) Act 2015’.7 HM Treasury analysis of ONS Annual Survey of Hours and Earnings, 2015 results and 2018 provisional results.

74 Budget 2018
5.5 The government is committed to a welfare system that ensures work always pays, protects the most vulnerable, and is fair to the taxpayer and sustainable for the future. The Budget provides additional support for people transferring onto Universal Credit, and an increase in the Work Allowance that will mean 2.4 million households keep more of their income.
5.6 While increasing productivity is the only way to raise living standards in the long term, the Budget goes further to help people now. This includes raising the National Living Wage to £8.21 an hour in April 2019, as well as supporting consumers to make their money go further.8
The NHS 5.7 NHS funding – The NHS is the government’s number one spending priority. In June, the government set out an unprecedented multi-year funding plan, with associated cash budgets, for the NHS in England. At that time this equated to £20.5 billion more a year in real terms by 2023-24, an average real growth rate in the NHS’s budget of 3.4% a year; taking the NHS budget from £114.6 billion in 2018-19 to £147.8 billion9 in 2023-24, with a total UK-wide scorecard cost of £83.6 billion. The NHS agreed to come forward with a new long-term plan this year, to be agreed with the government. The cash settlement that the government promised in June 2018 is fully funded at this Budget. The NHS will deliver its plan by the end of the year, and the government will confirm the final settlement consistent with that plan, and the £20.5 billion real terms increase by 2023-24, by Spending Review 2019. (1)
5.8 This settlement will enable the NHS to plan for its future and support it to deliver the world-class care that people want and expect. It is essential that every pound in the NHS is spent wisely. The government has set five financial tests for the NHS to meet in producing the plan, to ensure that it does its part in putting the health service onto a more sustainable footing. The plan must set out how:
• the NHS (including providers) will return to financial balance
• the NHS will achieve cash-releasing productivity growth of at least 1.1% a year (with a finalnumber to be confirmed in the plan), with all savings reinvested in frontline care
• the NHS will reduce the growth in demand for care through better integration andprevention (with a final number to be confirmed in the plan)
• the NHS will reduce variation across the health system, improving providers’ financial andoperational performance
• the NHS will make better use of capital investment and its existing assets to drivetransformation
5.9 As also set out in June 2018, the government will consider proposals from the NHS for a multi-year capital plan to support transformation, and a multi-year funding plan for clinical training places. The government will also ensure that public health services help people live longer healthier lives. Budgets in these areas will be confirmed at Spending Review 2019.
5.10 Mental health funding – The government is committed to achieving parity of esteem between mental health and physical health services, ensuring that high quality mental health support is available for those that need it, in appropriate, safe settings. Funding for mental health services will grow as a share of the overall NHS budget over the next 5 years. These services will take pressure off Accident and Emergency (A&E) departments and other public services such as the police, probation and social services. They will also ensure that people
8 The Low Pay Commission website.9 In addition, the government has made provision for NHS pension costs until 2023-24, which will be adjusted in line with the confirmed Superannuation Contributions Adjusted for Past Experience (SCAPE) rate change.
75Budget 2018
with mental illness can return to, and stay in, work, boosting employment and productivity. The NHS will invest up to £250 million a year by 2023-24 into new crisis services, including: 24/7 support via NHS 111; children and young people’s crisis teams in every part of the country; comprehensive mental health support in every major A&E by 2023-24; more mental health specialist ambulances; and more community services such as crisis cafes. The NHS will also prioritise services for children and young people, with schools-based mental health support teams and specialist crisis teams for young people across the country. For adults, the NHS will expand access to the Individual Placement Support programme to help those with severe mental illness find and retain employment, benefitting 55,000 people by 2023-24.
5.11 Support for air ambulance trusts – Our air ambulance services work tirelessly 24 hours a day, 365 days a year to get those with life-threatening illnesses and injuries to the expert medical care they need. The government is making available £10 million of capital funding in England to back them in this work.
Local councils and social care5.12 Local government has a vital role to play in delivering high quality public services for local communities. The government is already taking steps to empower local councils, giving them greater choice in how best to serve their local area – for example, enabling councils to raise more money locally for services. The Budget provides additional funding to help support local authority financial sustainability.
5.13 The government has already taken action to help secure a stable system of social care in England. The government has created the Improved Better Care Fund to help support health and social care integration, and introduced the new adult social care precept. At Spring Budget 2017, the government provided an additional £2 billion for councils to spend on adult social care services.
5.14 In the longer term, the government is committed to putting social care on fairer and more sustainable footing and will set out proposals for adult social care in the forthcoming green paper.
5.15 Additional social care funding – In the short term, the Budget provides an additional £240 million in 2018-19 and £240 million in 2019-20 for adult social care. This will make sure people can leave hospital when they are ready, into a care setting that best meets their needs. This will help the NHS to free up the beds it needs over winter. (2)
5.16 The Budget provides a further £410 million in 2019-20 for adults and children’s social care. Where necessary, local councils should use this funding to ensure that adult social care pressures do not create additional demand on the NHS. Local councils can also use it to improve their social care offer for older people, people with disabilities and children. (2)
5.17 The Budget provides councils with an additional £55 million in 2018-19 for the Disabled Facilities Grant to provide home aids and adaptations for disabled children and adults on low incomes. (19)
5.18 Children’s social care improvement – The Budget provides £84 million over 5 years for up to 20 local authorities, to help more children to stay at home safely with their families. This investment builds on the lessons learned from successful innovation programmes in Hertfordshire, Leeds and North Yorkshire. (3)

76 Budget 2018
Schools, children and young people5.19 The Budget provides additional support to help children get the care, education and support they need.
5.20 School equipment and maintenance uplift – The Budget provides schools across England with £400 million this year to spend on their equipment and facilities. (5)
5.21 Maths and physics teacher retention trial – The Budget provides funding for a £10 million regional trial to test how to improve retention of early career maths and physics teachers.
5.22 Youth Endowment Fund (YEF) – Building on the Serious Violence Strategy, which was published in April 2018, the Budget provides £200 million for a YEF to help young people avoid a life of violence.10 The YEF will fund activities for 10 to 14 year olds in England and Wales over at least 10 years, specifically working with those most at risk of youth violence to steer them away from becoming serious offenders. (85)
5.23 Contestable Fund – The government is providing £35 million for the first wave of the Contestable Fund. This is a competitive fund available to content producers to encourage the provision of new, high quality children’s TV and radio content.
5.24 Centre for Public Service Leadership – The government welcomes the recommendations of the Public Service Leadership Taskforce chaired by Sir Gerry Grimstone, published alongside the Budget. The Budget will provide £21 million to establish and run a new Centre for Public Service Leadership as a home for the development of public service leaders. The Centre will support leaders to improve productivity and transform the outcomes of the services they run. (8)
Defence and security 5.25 The government is taking further steps to ensure our Armed Forces and the police can respond to ever-changing threats and continue to protect our national security. The government also remains committed to building modern and decent prison places to replace old, expensive and unsuitable accommodation.
5.26 Defence spending – The Budget provides an additional £1 billion for the Ministry of Defence across 2018-19 and 2019-20. Together with the funding announced in March 2018, Defence will have benefitted from an additional £1.8 billion over 2018-19 and 2019-20. This will ensure that our world-class Armed Forces can continue to modernise and meet these threats, including prioritising key capabilities such as offensive cyber, anti-submarine warfare and the nuclear deterrent. (7)
5.27 Counter-terrorism police funding – The Budget provides an additional £160 million in 2019-20 for counter-terrorism policing to ensure that forces across the country are well equipped to work closely with our communities and keep citizens safe.
5.28 Prisons and the wider justice system – The Budget will fund the construction of HM Prison Glen Parva, and provides £30 million this year to improve security and decency across the prison estate. A further £21.5 million will also be invested in the wider justice system. (6)
10 ‘Serious Violence Strategy’, Home Office, April 2018.
77Budget 2018
Official Development Assistance5.29 In line with the commitment to spend 0.7% of GNI on Official Development Assistance (ODA) in each calendar year, ODA budgets will be adjusted up by £230 million in 2018-19 and £190 million in 2019-20, to reflect the OBR’s revised forecasts for GNI.
Welfare5.30 Changes to the welfare system since 2010 have brought welfare spending back under control for the first time in decades. Between 1997 and 2010, costs rose unsustainably – by £84 billion in today’s prices.11 The old welfare system also trapped people out of work, because it did not always pay to work. The old welfare system is being replaced with Universal Credit – a simpler system in which it pays to work, where the most vulnerable in society are protected, and which is fair to the taxpayer.
5.31 The government is introducing Universal Credit slowly and carefully, and has made changes where necessary. Ahead of the further expansion of Universal Credit, the Budget announces other changes to ensure the system works for everyone.
5.32 Universal Credit Work Allowance increase – The Budget announces that the amount that households with children, and people with disabilities can earn before their Universal Credit award begins to be withdrawn – the Work Allowance – will be increased by £1,000 from April 2019. This means that 2.4 million households will keep an extra £630 of income each year. (13)
5.33 Extra help for households moving onto Universal Credit – The government has listened to representations made by stakeholders on Universal Credit, and the Budget announces an extensive package of extra support for claimants as they make the transition to Universal Credit. (14)
5.34 Building on the Autumn Budget 2017 announcement that Housing Benefit claimants will receive an additional payment providing a fortnight’s worth of support during their transition to Universal Credit, the government will extend this provision to cover the income-related elements of Jobseeker’s Allowance and Employment and Support Allowance, and Income Support. This will be effective from July 2020, and benefit around 1.1 million claimants. (14)
5.35 To support the transition to Universal Credit for all self-employed people, the government is also extending the 12-month grace period (the period before the Minimum Income Floor applies) to all gainfully self-employed people; giving claimants time to grow their businesses to a sustainable level.12 This will be introduced from July 2019 and implemented fully from September 2020. (14)
5.36 From October 2019, the government will reduce the maximum rate at which deductions can be made from a Universal Credit award from 40% to 30% of the standard allowance. This will ensure that those on Universal Credit are supported to repay debts in a more sustainable and manageable way. From October 2021, the government will also increase the period over which advances will be recovered, from 12 to 16 months.
5.37 Funding for previously announced measures – In addition, the Budget provides funding for the announcements made by the Secretary of State for Work and Pensions in April and June 2018 to support the roll out of Universal Credit. This provided additional protections for welfare claimants, including: enhancements to transitional protection for people moving
11 ‘Benefit expenditure and caseload tables 2018’, Department for Work and Pensions, March 2018.12 The Minimum Income Floor is an assumed level of earnings that serves to encourage self-employed people to grow their earnings, mitigates the risk of under-reporting of earnings, and ensures fairness by reducing welfare support for businesses that are not sustainable.

78 Budget 2018
onto Universal Credit; extending existing support for non-parental carers and adopters in tax credits and Universal Credit; and enhanced protections for those currently receiving the Severe Disability Premium to provide additional support as Universal Credit is implemented. (14)
5.38 The government will deliver these changes slowly and carefully. In response to feedback on Universal Credit, the implementation schedule has been updated: it will begin in July 2019, as planned, but will end in December 2023. The scope of the surplus earnings policy in Universal Credit will also be temporarily reduced: it will continue to affect large earnings spikes (above £2,500) until April 2020, when it will revert to affecting earnings spikes of £300. (15)
5.39 Housing Benefit – The government continues to ensure that housing benefit is targeted most effectively to support those who need it. This includes:
• Revising the timetable for transferring rent support from Housing Benefit toPension Credit – The government will delay the transfer of rent support from HousingBenefit to Pension Credit by 3 years, to ensure that this transfer aligns with the fullimplementation of Universal Credit. (15)
• Retaining funding for supported housing in welfare – As announced in August 2018,the government has decided to retain funding for supported housing within the welfaresystem, rather than moving to a local funding model.
• Reinstating automatic entitlement to housing support for 18 to 21 year olds –As announced by the Secretary of State for Work and Pensions in March 2018, thegovernment will reinstate automatic entitlement for housing support for 18 to 21 yearolds. This group will therefore be entitled to claim support for housing costs underUniversal Credit. (14)
5.40 Parental bereavement leave and pay – The government will introduce a new statutory entitlement to two weeks’ of leave for employees who suffer the death of a child under 18, or a stillbirth after 24 weeks of pregnancy. Employed parents will also be able to claim pay for this period, subject to meeting eligibility criteria. This entitlement will come into force in April 2020.
5.41 Extension to the closure of childcare vouchers to new entrants – The government listened to the concerns of parents and MPs about the transition from childcare vouchers to Tax-Free Childcare and took the decision to keep childcare vouchers open to new entrants for a further 6 months, until October 2018. This allowed more time for Tax-Free Childcare to bed in and for families to understand their entitlement. (76)
5.42 Inclusion of Dupuytren’s contracture in Industrial Injuries Disablement Benefit – Dupuytren’s contracture will be added to the existing list of over 70 prescribed diseases for which Industrial Injuries Disablement Benefit is payable, as recommended by the Industrial Injuries Advisory Council. Eligible claimants are expected to gain, on average, over £1,200 per year. (16)
Living standards5.43 The government is committed to boosting productivity – in the long term it is the best path to sustainable growth and higher living standards. The Budget goes further to build a successful and prosperous economy, raising minimum wages and helping those who are concerned about the costs of living in the short term.
79Budget 2018
A better deal for workers
5.44 National Living Wage (NLW) and National Minimum Wage (NMW) – Supported by the NLW, the lowest earners (full-time workers at the fifth percentile) have seen their wages grow by 8% above inflation since 2015.13 The government’s objective is for the NLW to reach 60% of median earnings by 2020, subject to sustained economic growth. Following the recommendations of the independent Low Pay Commission (LPC), the government will increase the NLW by 4.9% from £7.83 to £8.21 from April 2019. The LPC estimate that this will benefit around 2.4 million workers. In total, the annual earnings of a full-time minimum wage worker will have increased by over £2,750 since the introduction of the NLW in April 2016. The government will also accept all of the LPC’s recommendations for the other NMW rates to apply from April 2019,14 including:
• increasing the rate for 21 to 24 year olds by 4.3% from £7.38 to £7.70 per hour
• increasing the rate for 18 to 20 year olds by 4.2% from £5.90 to £6.15 per hour
• increasing the rate for 16 to 17 year olds by 3.6% from £4.20 to £4.35 per hour
• increasing the rate for apprentices by 5.4% from £3.70 to £3.90 per hour
5.45 The government has an aspiration to end low pay.15 In 2019, the government will set out the LPC’s remit for the years beyond 2020. In the coming months, it will consult with the LPC and others on this new remit, and as it sets policy will take account of the potential impact on employment and economic growth.
5.46 Extension of the New Enterprise Allowance (NEA) – The government will continue the NEA from April 2019 onwards. The NEA provides support and mentoring for benefit claimants who are looking to start or develop their business.
A better deal for consumers
5.47 The government wants to support consumers to achieve better value for money. The Budget will help rail passengers get a better deal, protect people from nuisance calls, and reduce red tape so that consumers have more choice about where they spend their money.
5.48 26-30 railcard – A new 26-30 railcard will be introduced by the end of 2018, offering a one-third discount (subject to a minimum £12 fare in the morning peak) to around 4.4 million 26 to 30 year olds in England, Scotland and Wales.16
5.49 Making it easier to claim compensation – The Budget confirms a more streamlined process for compensating passengers affected by rail delays. A one-click delay repay system will be introduced as a requirement for future rail franchises and will be available to those passengers with advance purchase and season tickets.
5.50 Blocking scams and nuisance phone calls – As part of the government’s efforts to tackle nuisance calls, National Trading Standards will receive further funding to extend their project providing telephone call blocking technology to vulnerable people.
5.51 Banning pensions cold calling – Cold calling is one of the most common methods used to initiate pension fraud. To help protect people from fraudsters, the government is publishing a response to its consultation alongside the Budget and will shortly be implementing legislation to make pensions cold calling illegal.
13 HM Treasury analysis of ONS Annual Survey of Hours and Earnings, 2015 results and 2018 provisional results.14 The Low Pay Commission website.15 The OECD define relative low pay as two-thirds of median earnings.16 ‘Population Estimates for UK, England and Wales, Scotland and Northern Ireland: Mid-2017’, ONS, June 2018.
80 Budget 2018
5.52 Promoting greater choice of wedding venues – England and Wales have outdated laws about how and where couples can marry. The government has asked the Law Commission to propose options for a simpler and fairer system to give modern couples meaningful choice. This will include looking at reducing unnecessary red tape and lowering the cost of wedding venues for couples.
Support for affordable credit
5.53 A strong and vibrant social lending sector is crucial so that everyone has access to valuable financial services, regardless of their circumstances. Following the work of the Financial Inclusion Policy Forum, the Budget announces new policies to help households manage unexpected costs by increasing access to fair and affordable credit, as well as a consultation on a breathing space scheme for people who fall into problem debt.
5.54 Affordable Credit Challenge Fund – The government will provide £2 million to launch a challenge fund to promote innovative technological solutions that will harness the power of the UK’s world-leading Fintech industry to support social and community lenders. (17)
5.55 Allow Regulated Social Landlords (RSLs) to refer to sources of affordable credit – The government will simplify regulation to make it easier for RSLs to direct tenants to alternatives to high-cost credit.
5.56 Dormant assets fund to target access to affordable credit – In August 2018, the government announced that a new independent body would be established to promote financial inclusion. It will be responsible for deploying an initial £55 million of funding from dormant bank accounts, primarily to address the problem of access to affordable credit.
5.57 No-interest loans scheme pilot – For some people, even borrowing from social and community lenders can be unaffordable. Therefore, the government, working with leading debt charities and the banking industry, will launch a feasibility study to help to design a pilot for a no-interest loans scheme early next year. (17)
5.58 Breathing space for people in debt – Following the Financial Guidance and Claims Act 2018, the Budget announces a consultation on a breathing space scheme for people in problem debt. The scheme will introduce a 60-day period of protection from creditor action to recover debts to help people make plans to pay back their debts in a sustainable way.
5.59 Supporting the credit union sector – Credit unions play an important role in facilitating savings and offering affordable borrowing to their members. To help people increase their financial resilience while boosting awareness and membership of these community organisations, the Budget commits to launching a pilot of a new prize-linked saving scheme for credit unions. (17)
Support for savers
5.60 The government wants to make it easier for more people to save at all stages of their lives.
5.61 Improving NS&I’s offer to customers – NS&I will allow people other than parents and grandparents to gift Premium Bonds to a child. This, alongside a lower minimum investment of just £25 and the launch of a new app, will make saving with NS&I easier than ever.
5.62 Pension Dashboards – The government is taking steps to support the launch of Pensions Dashboards, innovative tools that will for the first time allow an individual to see their pension pots, including their State Pension, in one place. The Budget confirms that the DWP will consult later this year on the detailed design for Pensions Dashboards, and on how an industry-led

81Budget 2018
approach could harness innovation while protecting consumers. DWP will work closely with the pensions industry and financial technology firms. The Budget provides extra funding in 2019-20 to help make this a reality. (18)
5.63 Boosting pensions for the self-employed – This winter, DWP will publish a paper setting out the government’s approach to increasing pension participation and savings persistency among the self-employed. This follows the 2017 review of automatic enrolment and will focus on expanding evidence through a programme of targeted interventions and partnerships.
Supporting communities5.64 The Budget includes support for communities to make the most of their local assets and commemorate the First World War and the Holocaust.
5.65 Village halls, Miners’ Welfare facilities and Armed Forces organisations’ facilities – The government will provide up to £8 million to help with the cost of repairs and alterations to village halls, Miners’ Welfare facilities and Armed Forces organisations’ facilities. (9)
5.66 First World War commemoration – To mark the centenary of the First World War Armistice and the sacrifices made by so many men and women, the government will commit £10 million to support veterans with mental health needs, and will make available an additional £1 million for First World War battlefield visits for school students.
5.67 Holocaust commemoration and education fund – The government will provide a charitable organisation with £1.7 million for educational projects in schools to mark the upcoming 75th anniversary of the liberation of the Bergen-Belsen concentration camps.
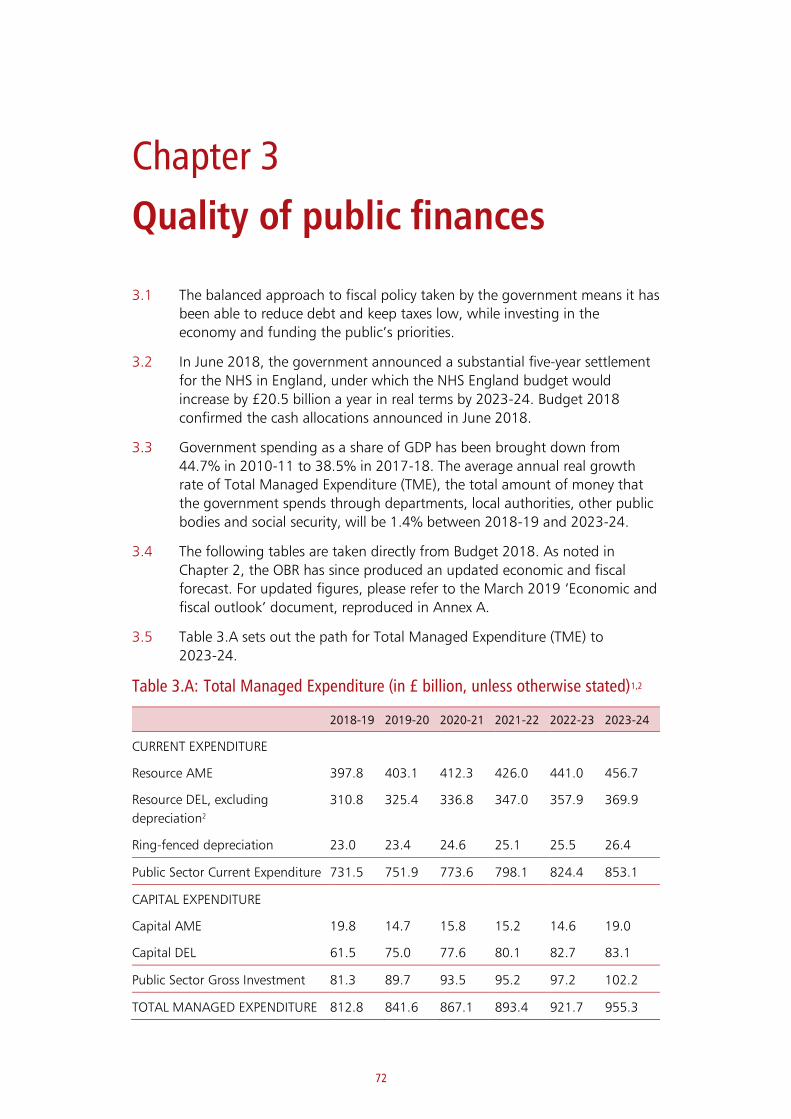
72
Chapter 3
Quality of public finances
3.1 The balanced approach to fiscal policy taken by the government means it has
been able to reduce debt and keep taxes low, while investing in the
economy and funding the public’s priorities.
3.2 In June 2018, the government announced a substantial five-year settlement
for the NHS in England, under which the NHS England budget would
increase by £20.5 billion a year in real terms by 2023-24. Budget 2018
confirmed the cash allocations announced in June 2018.
3.3 Government spending as a share of GDP has been brought down from
44.7% in 2010-11 to 38.5% in 2017-18. The average annual real growth
rate of Total Managed Expenditure (TME), the total amount of money that
the government spends through departments, local authorities, other public
bodies and social security, will be 1.4% between 2018-19 and 2023-24.
3.4 The following tables are taken directly from Budget 2018. As noted in
Chapter 2, the OBR has since produced an updated economic and fiscal
forecast. For updated figures, please refer to the March 2019 ‘Economic and
fiscal outlook’ document, reproduced in Annex A.
3.5 Table 3.A sets out the path for Total Managed Expenditure (TME) to
2023-24.
Table 3.A: Total Managed Expenditure (in £ billion, unless otherwise stated)1,2
2018-19 2019-20 2020-21 2021-22 2022-23 2023-24
CURRENT EXPENDITURE
Resource AME 397.8 403.1 412.3 426.0 441.0 456.7
Resource DEL, excluding
depreciation2
310.8 325.4 336.8 347.0 357.9 369.9
Ring-fenced depreciation 23.0 23.4 24.6 25.1 25.5 26.4
Public Sector Current Expenditure 731.5 751.9 773.6 798.1 824.4 853.1
CAPITAL EXPENDITURE
Capital AME 19.8 14.7 15.8 15.2 14.6 19.0
Capital DEL 61.5 75.0 77.6 80.1 82.7 83.1
Public Sector Gross Investment 81.3 89.7 93.5 95.2 97.2 102.2
TOTAL MANAGED EXPENDITURE 812.8 841.6 867.1 893.4 921.7 955.3
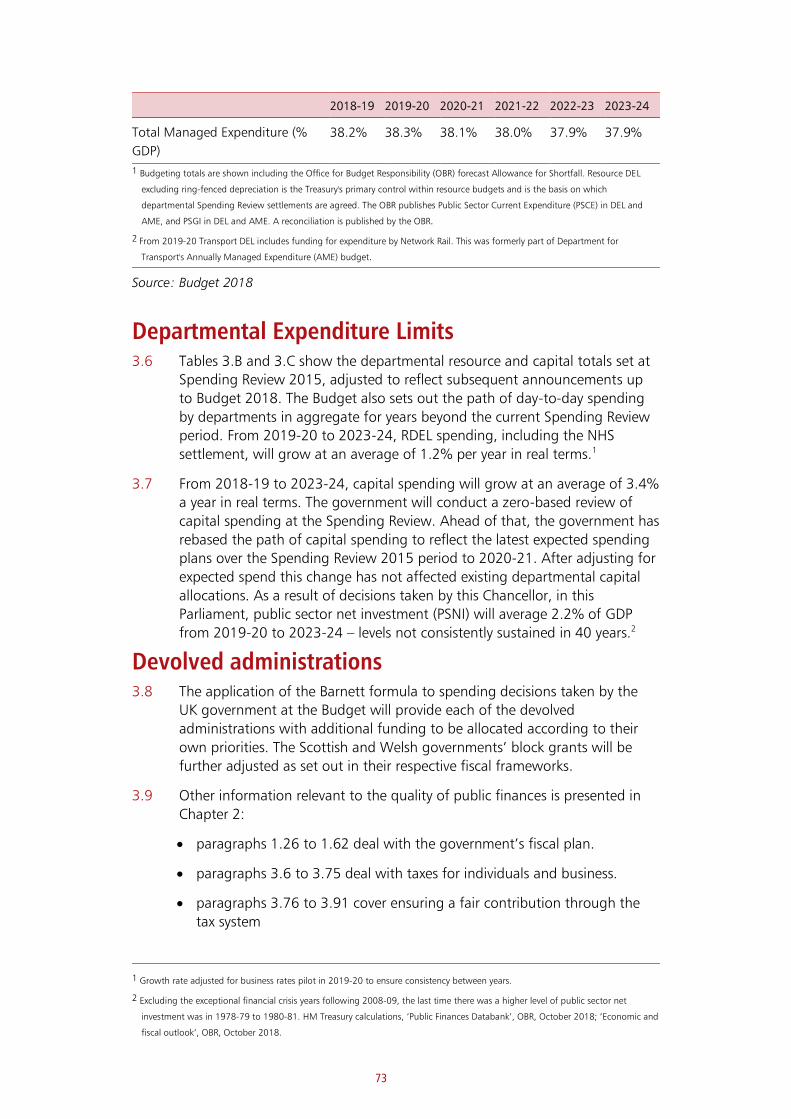
73
2018-19 2019-20 2020-21 2021-22 2022-23 2023-24
Total Managed Expenditure (%
GDP)
38.2% 38.3% 38.1% 38.0% 37.9% 37.9%
1 Budgeting totals are shown including the Office for Budget Responsibility (OBR) forecast Allowance for Shortfall. Resource DEL
excluding ring-fenced depreciation is the Treasury's primary control within resource budgets and is the basis on which
departmental Spending Review settlements are agreed. The OBR publishes Public Sector Current Expenditure (PSCE) in DEL and
AME, and PSGI in DEL and AME. A reconciliation is published by the OBR.
2 From 2019-20 Transport DEL includes funding for expenditure by Network Rail. This was formerly part of Department for
Transport's Annually Managed Expenditure (AME) budget.
Source: Budget 2018
Departmental Expenditure Limits 3.6 Tables 3.B and 3.C show the departmental resource and capital totals set at
Spending Review 2015, adjusted to reflect subsequent announcements up
to Budget 2018. The Budget also sets out the path of day-to-day spending
by departments in aggregate for years beyond the current Spending Review
period. From 2019-20 to 2023-24, RDEL spending, including the NHS
settlement, will grow at an average of 1.2% per year in real terms.1
3.7 From 2018-19 to 2023-24, capital spending will grow at an average of 3.4%
a year in real terms. The government will conduct a zero-based review of
capital spending at the Spending Review. Ahead of that, the government has
rebased the path of capital spending to reflect the latest expected spending
plans over the Spending Review 2015 period to 2020-21. After adjusting for
expected spend this change has not affected existing departmental capital
allocations. As a result of decisions taken by this Chancellor, in this
Parliament, public sector net investment (PSNI) will average 2.2% of GDP
from 2019-20 to 2023-24 – levels not consistently sustained in 40 years.2
Devolved administrations 3.8 The application of the Barnett formula to spending decisions taken by the
UK government at the Budget will provide each of the devolved
administrations with additional funding to be allocated according to their
own priorities. The Scottish and Welsh governments’ block grants will be
further adjusted as set out in their respective fiscal frameworks.
3.9 Other information relevant to the quality of public finances is presented in
Chapter 2:
• paragraphs 1.26 to 1.62 deal with the government’s fiscal plan.
• paragraphs 3.6 to 3.75 deal with taxes for individuals and business.
• paragraphs 3.76 to 3.91 cover ensuring a fair contribution through the
tax system
1 Growth rate adjusted for business rates pilot in 2019-20 to ensure consistency between years.
2 Excluding the exceptional financial crisis years following 2008-09, the last time there was a higher level of public sector net
investment was in 1978-79 to 1980-81. HM Treasury calculations, ‘Public Finances Databank’, OBR, October 2018; ‘Economic and
fiscal outlook’, OBR, October 2018.

74
Table 3.B: Departmental Resource Budgets (Resource DEL excluding depreciation)
Plans
2018-19 2019-20
Resource DEL excluding depreciation1
Defence 28.4 29.0
Single Intelligence Account2 2.2 2.0
Home Office 10.8 10.7
Foreign and Commonwealth Office3 2.2 1.2
International Development3,4 7.7 8.2
Health (inc. NHS) 123.3 129.6
of which: NHS England 114.6 121.8
Work and Pensions 6.0 5.4
Education 62.5 63.5
Business, Energy and Industrial Strategy 1.7 1.8
Transport5 2.1 2.9
Exiting the European Union 0.1 0.1
Digital, Culture, Media and Sport 1.5 1.5
DCLG Communities 2.6 2.3
DCLG Local Government 4.7 5.9
Scotland6 14.7 15.7
Wales7 13.3 11.6
Northern Ireland 10.3 10.3
Justice 6.3 6.0
Law Officers Departments 0.6 0.6
Environment, Food and Rural Affairs 1.6 1.5
HM Revenue and Customs 3.4 3.2
HM Treasury 0.2 0.2
Cabinet Office 0.4 0.3
International Trade 0.4 0.3
Small and Independent Bodies 1.5 1.3
Reserves8 5.2 12.3
Adjustment for Budget Exchange9 -0.6 -0.4
Total Resource DEL excluding depreciation 313.0 327.0
OBR allowance for shortfall10 -2.2 -1.7

75
Plans
2018-19 2019-20
OBR resource DEL excluding depreciation forecast 310.8 325.4
1 Resource DEL excluding depreciation is the Treasury's primary control total within resource budgets and the basis on which Spending Review settlements were made.
2 The SIA budget in 2017-18 includes transfers from other government departments, which have yet to be reflected in later years.
3 Figures for 2018-19 and beyond do not reflect all transfers which will be made from DFID to other government departments, as the cross-government funds have not been allocated for these years.
4 Figures reflect Budget 2018 adjustments made as a result of revised GNI forecasts, as well as previous adjustments made at Autumn Budget 2017 and Autumn Statement 2016.
5 From 2019-20 Transport DEL includes funding for expenditure by Network Rail. This was formerly part of Department for Transport's Annually Managed Expenditure (AME) budget.
6 The Scottish Government’s resource DEL block grant has been adjusted from 2016-17 onwards as agreed in the Sottish Government’s Fiscal Framework. In 2016-17 an adjustment of £5.5bn reflected the devolution of Stamp Duty Land Tax and Landfill Tax and the creation of the Scottish Rate of Income Tax. In 2017-18 an adjustment of £12.5bn reflects the devolution of further income tax powers and revenues from Scottish courts. In 2018-19 and 2019-20, adjustments of £13.1bn and £13.4bn also include the devolution of Air Passenger Duty. However, the UK and Scottish governments have now agreed to delay the devolution of Air Passenger Duty. As a result, the Scottish Government’s block grant for 2018-19 and 2019-20 will be re-calculated.
7 The Welsh Government’s resource DEL block grant has been adjusted from 2018-19 onwards as agreed in the Welsh Government’s Fiscal Framework. In 2018-19 an adjustment of £0.3 billion reflects the devolution of Stamp Duty Land Tax and Landfill Tax and in 2019-20 an adjustment of £2.3 billion reflects the devolution of the Welsh Rate of Income Tax.
8 The reserve in 2017-18 reflects allocations made at Main Estimates and Autumn Budget 2017.
9 Departmental budgets in 2017-18 include amounts carried forward from 2016-17 through Budget Exchange, which has been voted at Main Estimates. These increases will be offset at Supplementary Estimates, so are excluded from spending totals. 10 The OBR’s forecast of underspends in resource DEL budgets.
Source: Budget 2018
Table 3.C: Departmental Capital Budgets (Capital DEL, £ billion)
Plans
2018-19 2019-20 2020-21
Capital DEL
Defence 9.4 9.8 9.6
Single Intelligence Account 0.6 0.7 0.7
Home Office 0.5 0.5 0.4
Foreign and Commonwealth Office 0.1 0.1 0.1
International Development 2.7 3.7 3.6
Health (inc. NHS) 5.9 6.7 6.8
Work and Pensions 0.3 0.2 0.2
Education 5.6 5.1 4.5
Business, Energy and Industrial Strategy1 10.3 11.5 6.3
Transport2 8.5 15.8 18.4
Exiting the European Union 0.0 0.0 0.0
Digital, Culture, Media and Sport 0.6 0.6 0.5
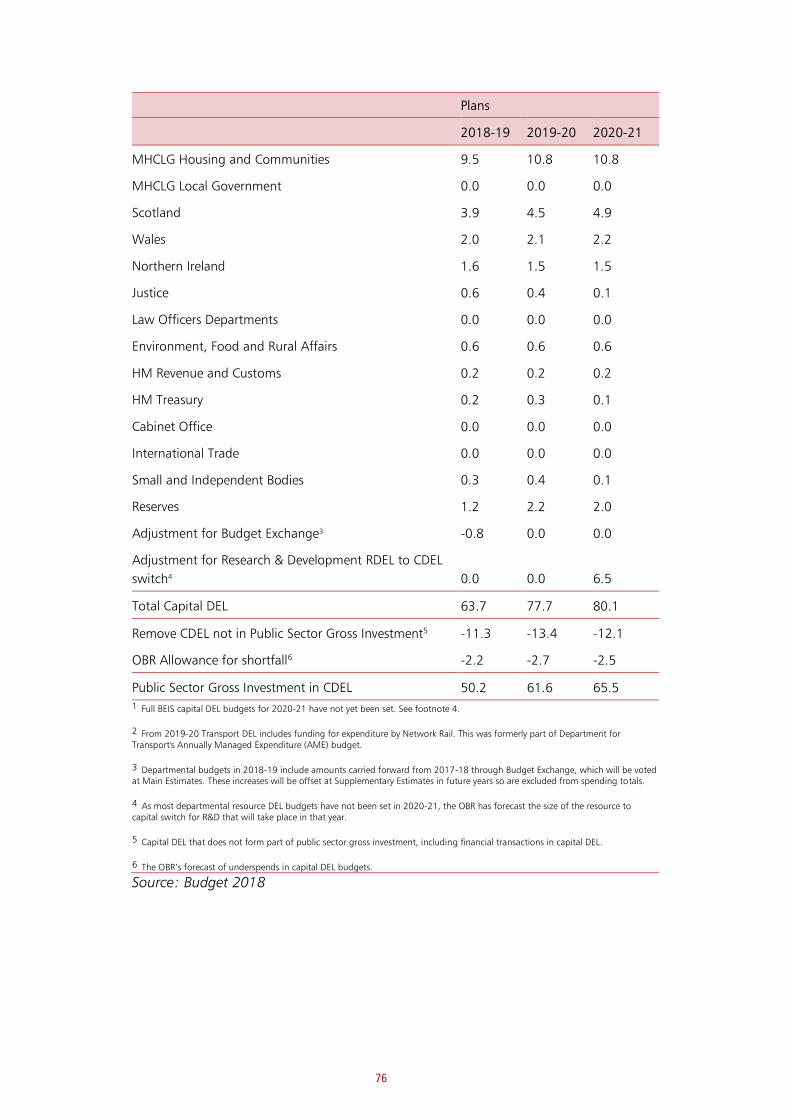
76
Plans
2018-19 2019-20 2020-21
MHCLG Housing and Communities 9.5 10.8 10.8
MHCLG Local Government 0.0 0.0 0.0
Scotland 3.9 4.5 4.9
Wales 2.0 2.1 2.2
Northern Ireland 1.6 1.5 1.5
Justice 0.6 0.4 0.1
Law Officers Departments 0.0 0.0 0.0
Environment, Food and Rural Affairs 0.6 0.6 0.6
HM Revenue and Customs 0.2 0.2 0.2
HM Treasury 0.2 0.3 0.1
Cabinet Office 0.0 0.0 0.0
International Trade 0.0 0.0 0.0
Small and Independent Bodies 0.3 0.4 0.1
Reserves 1.2 2.2 2.0
Adjustment for Budget Exchange3 -0.8 0.0 0.0
Adjustment for Research & Development RDEL to CDEL
switch4 0.0 0.0 6.5
Total Capital DEL 63.7 77.7 80.1
Remove CDEL not in Public Sector Gross Investment5 -11.3 -13.4 -12.1
OBR Allowance for shortfall6 -2.2 -2.7 -2.5
Public Sector Gross Investment in CDEL 50.2 61.6 65.5
1 Full BEIS capital DEL budgets for 2020-21 have not yet been set. See footnote 4. 2 From 2019-20 Transport DEL includes funding for expenditure by Network Rail. This was formerly part of Department for Transport's Annually Managed Expenditure (AME) budget. 3 Departmental budgets in 2018-19 include amounts carried forward from 2017-18 through Budget Exchange, which will be voted at Main Estimates. These increases will be offset at Supplementary Estimates in future years so are excluded from spending totals. 4 As most departmental resource DEL budgets have not been set in 2020-21, the OBR has forecast the size of the resource to capital switch for R&D that will take place in that year. 5 Capital DEL that does not form part of public sector gross investment, including financial transactions in capital DEL. 6 The OBR’s forecast of underspends in capital DEL budgets.
Source: Budget 2018
77
Chapter 4
Institutional features of public finances
The fiscal policy framework
4.1 In recent years, many governments internationally have used fiscal targets as
a tool to demonstrate political commitment to fiscal policy goals.
Increasingly they have established independent fiscal institutions (IFIs) to
assess compliance with these targets, and to increase trust in the forecasts
and analysis on which such assessments are usually based.
4.2 In the case of the UK, the Office for Budget Responsibility (OBR) was
established in 2010 to “ensure that policy is made on an unbiased view of
future prospects, improving confidence in the fiscal forecasts”.1
Office for Budget Responsibility
4.3 The government established the OBR on an interim basis on 17 May 2010.
Since then the OBR has been placed on a permanent, statutory footing
through the Budget Responsibility and National Audit Act 2011 (the Act),
which received Royal Assent on 22 March 2011.
4.4 The OBR is comprised of the Chair of the OBR and 2 other members of the
Budget Responsibility Committee (BRC), and 2 non-executive members. It is
supported by a civil service staff.
4.5 There are three BRC members: Robert Chote (Chair of the OBR), Charlie Bean
and Andy King were appointed by the Chancellor with the approval of the
Treasury Select Committee. Andy King was appointed in September 2018
and Charlie Bean in September 2016. Robert Chote was re-appointed for a
second term of office in September 2015, having first been appointed in
October 2010. There are two non-executive members: Sir Christopher Kelly
was appointed by the Chancellor in June 2017. Bronwyn Curtis OBE was
appointed by the Chancellor in June 2018.
Remit of the OBR 4.6 The government’s fiscal policy decisions are based on the independent
forecasts of the economy and public finances, prepared by the OBR. Since
the general election in May 2010, the OBR has produced all the official
forecasts of the economy and public finances, independently of ministers.
1 https://www.gov.uk/government/uploads/system/uploads/attachment_data/file/210667/press_01_10.pdf
78
4.7 The act sets out the main duty of the OBR; to examine and report on the
sustainability of the public finances. This duty feeds directly into the
Treasury’s fiscal objective to deliver sound and sustainable public finances.
4.8 As set out in the act, the OBR’s responsibilities include:
• the production of at least 2 fiscal and economic forecasts each financial
year, including independent scrutiny of the impact of policy measures and
any resultant impact on the forecasts and the main risks and assumptions
• an assessment of the extent to which the fiscal and debt management
objectives have been, and are likely to be, achieved alongside these
forecasts
• an assessment on the accuracy of the previous fiscal and economic
forecasts
• an analysis of the sustainability of the public finances
Operating framework 4.9 The Charter for Budget Responsibility provides guidance to the OBR in line
with, and in support of, the provisions in the Act. This guidance helps to
explain the role of the OBR within the fiscal framework and provide greater
clarity as to the OBR’s duty to independently examine and report on the
sustainability of the public finances.
4.10 This guidance provides for the OBR to investigate the impact of trends and
policies on the public finances from a multitude of angles including through
forecasting, long-term projections and balance sheet analysis. The OBR must
perform its duty objectively, transparently and impartially and on the basis of
government policy. This protects the independence of the OBR and ensures a
clear separation between analysis (which is the role of the OBR) and policy
making (which is the responsibility of ministers). The OBR has complete
discretion in the performance of its duty subject to its statutory obligations.
4.11 As set out in the Charter, the OBR has additional responsibilities including:
• The production of a fiscal risks statement setting out the main risks to the
public finances, including macroeconomic risks and specific fiscal risks, to
be produced at least once every 2 years. This requirement was included in
amendments to the Charter in October 2015.
• The assessment of spending against the welfare cap and margin at the
first Budget or fiscal update of each new Parliament, coinciding with the
incoming government’s setting of a new cap. In addition, the OBR will
monitor welfare spending against the pathway and margin at each
Budget and fiscal update before the formal assessment against the cap.
4.12 To ensure credibility of the fiscal framework and protect the independence
of the OBR it is vital for there to be transparency in the responsibilities of the
OBR. A Memorandum of Understanding established a transparent
framework for cooperation between the OBR and the Treasury, as well as
other parts of government that the OBR needs to work closely with to
perform its forecasting and analytical duties.
79
4.13 The OBR is accountable to Parliament and the Chancellor for the analysis it
produces and the way it uses public funds. A framework document sets out
the broad governance and management framework within which the OBR
operates.
4.14 The Charter requires the government to set out before Parliament its fiscal
policy objectives, and the means by which these objectives will be attained
(“the fiscal mandate”).
The fiscal mandate and supplementary targets 4.15 The Charter was modified in November 2016 to reflect the government’s
new fiscal rules. The fiscal rules approved by Parliament on 24 January 2017
are:
• In order to provide for sustainable public finances, ensure confidence in
the economy, and support the effectiveness of monetary policy, the
Treasury’s objective for fiscal policy is to: return the public finances to
balance by the middle of the next decade.
• In order to achieve the above objective, the Treasury’s mandate for fiscal
policy in this Parliament is: a target to reduce cyclically-adjusted public
sector net borrowing to below 2% of GDP by 2020-21
• The Treasury’s mandate for fiscal policy is supplemented by: a target for
public sector net debt as a percentage of GDP to be falling in 2020-21
• To ensure that expenditure on welfare remains sustainable, the Treasury’s
mandate for fiscal policy is further supplemented by: a target to ensure
that expenditure on welfare in 2022-23 is contained within a
predetermined cap and margin set by the Treasury at Autumn Budget
2017.
• In the event of a significant negative shock to the UK economy, the
Treasury will review the appropriateness of the fiscal mandate and
supplementary targets as a means of returning the public finances to
balance as early as possible in the next Parliament.
Accounting and statistics 4.16 The independent Office for National Statistics (ONS) and HM Treasury
compile monthly statistics for the public sector and sub-sectors, on both a
cash and accrued basis. Reconciliation tables between these are produced.
The production is guided by the UK’s code of practice which is consistent
with the United Nations Fundamental Principles of Official Statistics and the
European Statistics Code of Practice.
4.17 Information on the UK’s contingent liabilities is published for all central
government departments. The publication of the audited ‘Whole of
Government Accounts’ (WGA), based on International Financial Reporting
Standards, extends the coverage across government, with the latest report
covering the year ended 31 March 2017. A summary of publicly available
information on contingent liabilities is also published in the OBR’s ‘Fiscal
sustainability report’.

80
4.18 WGA is a full accruals-based set of accounts covering the whole public
sector and audited by the National Audit Office. WGA is a consolidation of
the accounts of over 6,000 organisations across the public sector, including
central government departments, local authorities, devolved administrations,
the health service, and public corporations.

81
Annex A
OBR analysis
This annex contains analysis prepared by the Office for Budget Responsibility (OBR).
The first three pieces of analysis included are Chapters 3, 4 and 5 of the OBR’s
March 2019 ‘Economic and fiscal outlook’. They cover, in turn, the economic
outlook, the fiscal outlook, and the performance against the government’s fiscal
targets. The final part of this annex is the executive summary of the OBR’s 2018
‘Fiscal sustainability report’.
3 Economic outlook
Introduction
3.1 This chapter:
• describes our assumptions and judgements in respect of the UK’s forthcoming exit
from the EU (from paragraph 3.2);
• sets out our estimates of the amount of spare capacity in the economy and our
judgement regarding the growth in the economy’s productive potential that underpins
our forecasts for actual GDP growth (from paragraph 3.9);
• describes the key conditioning assumptions for the forecast, including credit conditions,
the exchange rate and the world economy (from paragraph 3.20);
• sets out our real GDP growth forecasts (from paragraph 3.38) and the outlook for
inflation (from paragraph 3.46) and nominal GDP (from paragraph 3.52);
• discusses recent developments and prospects for the household, corporate,
government and external sectors of the economy (from paragraph 3.54); and
• outlines risks and uncertainties (from paragraph 3.91) and compares our central
forecast with those of selected external organisations (from paragraph 3.93).
Assumptions and judgements for the UK’s exit from the EU
Current assumptions and judgements
3.2 The OBR is required by legislation to produce its forecasts based on current government
policy (but not necessarily assuming that particular policy objectives will be met). With the
terms of the UK’s exit from the EU and the nature of the future relationship between the two
still to be settled, this is not straightforward. We asked the Government if it wished to
provide any additional information on post-Brexit policies in relation to trade and migration
that would be relevant to our forecasts. As set out in the Foreword, it directed us to the July
2018 White Paper on the future relationship between the UK and EU and the immigration
White Paper published in December 2018.1, 2
1 Department for Exiting the European Union, The future relationship between the United Kingdom and the European Union, July 2018. 2 HM Government, The UK’s future skills-based immigration system, December 2018.
25 Economic and fiscal outlook

Economic outlook
3.3 Parliament is scheduled to vote on various Brexit-related questions in the week of the Spring
Statement – after we closed the forecast. But reflecting the draft Withdrawal Agreement
published in November 2018, our forecast incorporates a transition period until December
2020 – during which time the terms on which the UK and EU trade with each other will
remain unchanged.3 This means that we continue to assume that the UK makes an orderly
transition to a new – though, as yet, undefined – long-term relationship. Our remit does not
allow us to produce scenarios based on alternative government policy, such as the UK
leaving the EU without the implementation of a Withdrawal Agreement. But our Brexit
discussion paper sets out how different trading and migration relationships could affect our
forecasts,4 and Chapter 5 summarises some of our previous scenarios that shed light on the
responsiveness of the public finances to changes in the outlook.
3.4 Given the relatively high-level nature of the Political Declaration – which accompanied the
Withdrawal Agreement – and the current uncertainty as to how the Government will respond
to the choices and trade-offs it faces during the negotiations regarding the future
relationship between the UK and the EU, we still have no meaningful basis for predicting the
post-Brexit trading relationship beyond the near term. We have not made any changes to
our net migration forecast on the basis of the Government’s immigration White Paper as the Government only plans to publish final immigration rules after a year of consultation. We
have therefore retained the same broad-brush assumptions regarding Brexit that
underpinned our previous post-referendum forecasts. Specifically, for the economy forecast,
we assume that:
• The UK leaves the EU on 29 March 2019 – two years after Article 50 was invoked – but there is a transition period until December 2020.
• The extra frictions associated with new trading arrangements with the EU and other
countries slows import and export growth over a 10-year period. We calibrated this
based on external studies of different possible trade regimes and have assumed
broadly offsetting impacts from exports and imports on net trade and GDP growth.
• The vote to leave the EU will be associated with lower net inward migration, but that
net inward migration will remain above ‘tens of thousands’. We assume that the UK adopts a tighter migration regime than that currently in place and that ‘pull factors’ – such as a fall in the value of UK wages in prospective immigrants’ home currencies due to the past depreciation of the pound – will be weaker. The data do indeed
suggest that inward migration from the EU has fallen since the referendum, consistent
with the weakening of pull factors. But overall net inward migration has not fallen to
the extent implied by the ONS principal migration projections (which we use as the
base for our forecast), as the fall in net immigration from the EU has been partially
offset by a rise in net immigration from non-EU countries.
3 For more information, see European Commission, Draft Agreement on the withdrawal of the United Kingdom of Great Britain and Northern Ireland from the European Union and the European Atomic Energy Community, 2018. 4 OBR, Brexit and the OBR’s forecasts, 2018.
Economic and fiscal outlook 26
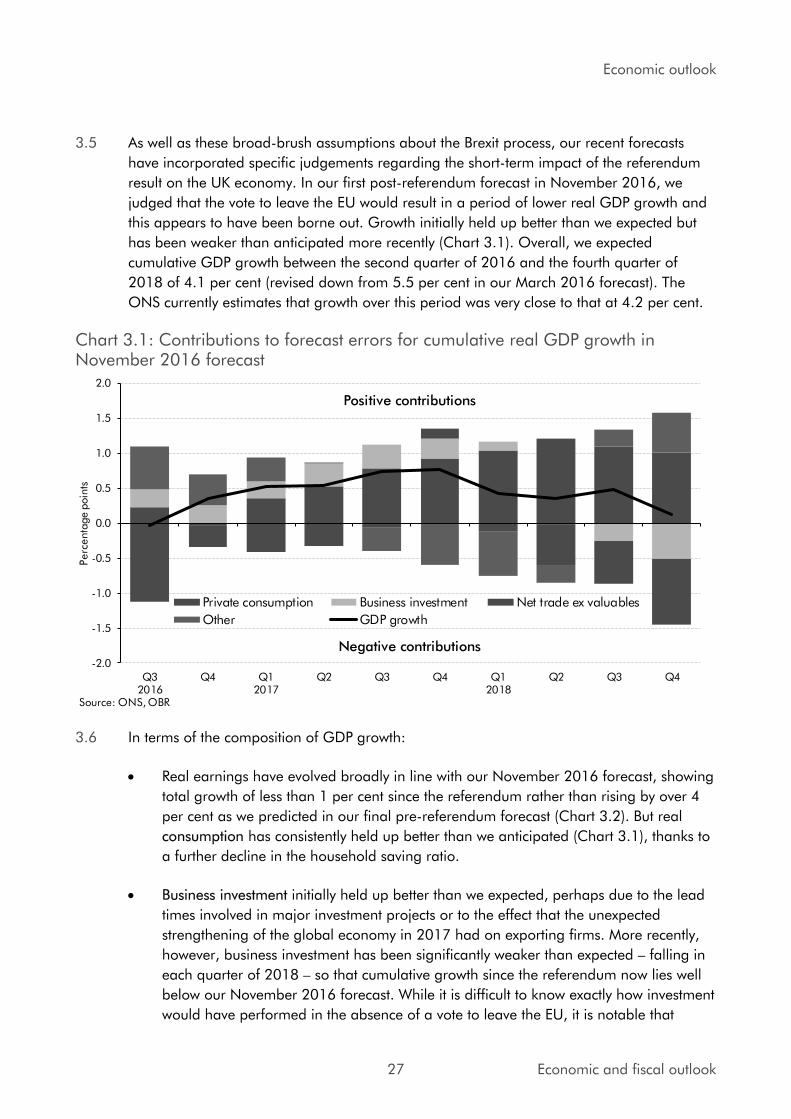
Economic outlook
3.5 As well as these broad-brush assumptions about the Brexit process, our recent forecasts
have incorporated specific judgements regarding the short-term impact of the referendum
result on the UK economy. In our first post-referendum forecast in November 2016, we
judged that the vote to leave the EU would result in a period of lower real GDP growth and
this appears to have been borne out. Growth initially held up better than we expected but
has been weaker than anticipated more recently (Chart 3.1). Overall, we expected
cumulative GDP growth between the second quarter of 2016 and the fourth quarter of
2018 of 4.1 per cent (revised down from 5.5 per cent in our March 2016 forecast). The
ONS currently estimates that growth over this period was very close to that at 4.2 per cent.
Chart 3.1: Contributions to forecast errors for cumulative real GDP growth in November 2016 forecast
-2.0
-1.5
-1.0
-0.5
0.0
0.5
1.0
1.5
2.0
Q32016
Q4 Q12017
Q2 Q3 Q4 Q12018
Q2 Q3 Q4
Perc
enta
ge p
oin
ts
Private consumption Business investment Net trade ex valuables
Other GDP growth
Source: ONS, OBR
Negative contributions
Positive contributions
3.6 In terms of the composition of GDP growth:
• Real earnings have evolved broadly in line with our November 2016 forecast, showing
total growth of less than 1 per cent since the referendum rather than rising by over 4
per cent as we predicted in our final pre-referendum forecast (Chart 3.2). But real
consumption has consistently held up better than we anticipated (Chart 3.1), thanks to
a further decline in the household saving ratio.
• Business investment initially held up better than we expected, perhaps due to the lead
times involved in major investment projects or to the effect that the unexpected
strengthening of the global economy in 2017 had on exporting firms. More recently,
however, business investment has been significantly weaker than expected – falling in
each quarter of 2018 – so that cumulative growth since the referendum now lies well
below our November 2016 forecast. While it is difficult to know exactly how investment
would have performed in the absence of a vote to leave the EU, it is notable that
27 Economic and fiscal outlook

Economic outlook
growth in non-dwellings investment has been significantly weaker in the UK than in the
other G7 economies since the referendum (Chart 3.3).
• We expected the substantial fall in the pound around the time of the referendum to
provide only a modest boost to net trade. While trade outturns have been volatile, net
trade has been significantly weaker than we expected – reducing GDP growth since the
referendum rather than raising it. This suggests that the fall in the pound around the
time of the referendum has not provided much of a boost to GDP growth.
Chart 3.2: Contributions to real Chart 3.3: G7 non-dwellings investment earnings growth
-8
-6
-4
-2
0
2
4
6
8
Q22016
Q4 Q22017
Q4 Q22018
Q4
Per ce
nt
Average earningsCPI inflationReal earningsMarch 2016 real earningsNovember 2016 real earnings
Source: ONS, OBR
98
100
102
104
106
108
110
112
114
Q22016
Q4 Q22017
Q4 Q22018
Q4
Q2 2
016=
100
CanadaFranceGermanyItalyJapanUSUK
Source: OECD
Future forecast issues
3.7 When more substantive detail is available on the future trade and migration relationship
between the UK and EU, we will adjust our Brexit assumptions appropriately. Our
November 2016 lowering of the path of potential output largely reflected the effects of
weaker business investment on potential productivity growth and of lower migration on
labour supply. But as time passes, impediments to the exploitation of comparative
advantage as a result of increased trade barriers are likely to become more salient. We will
also need to assess the likely impact on both the volume and composition of migrant flows
of any new migration regime.
3.8 These are static effects – one-off shifts in the potential level of output in the economy,
although they affect growth rates as the economy moves to that new steady-state. But some
studies suggest that increased barriers to trade, migration and foreign direct investment are
also likely to have further adverse dynamic effects – persistent effects on the growth rate of
potential output – for example, by impeding technology transfer and slowing innovation and
technological progress. There is little consensus on the size of such effects and they are likely
to interact. So, rather than quantify them individually, we will probably take them into
account in a broad-brush fashion in our top-down judgements on potential productivity and
output.
Economic and fiscal outlook 28
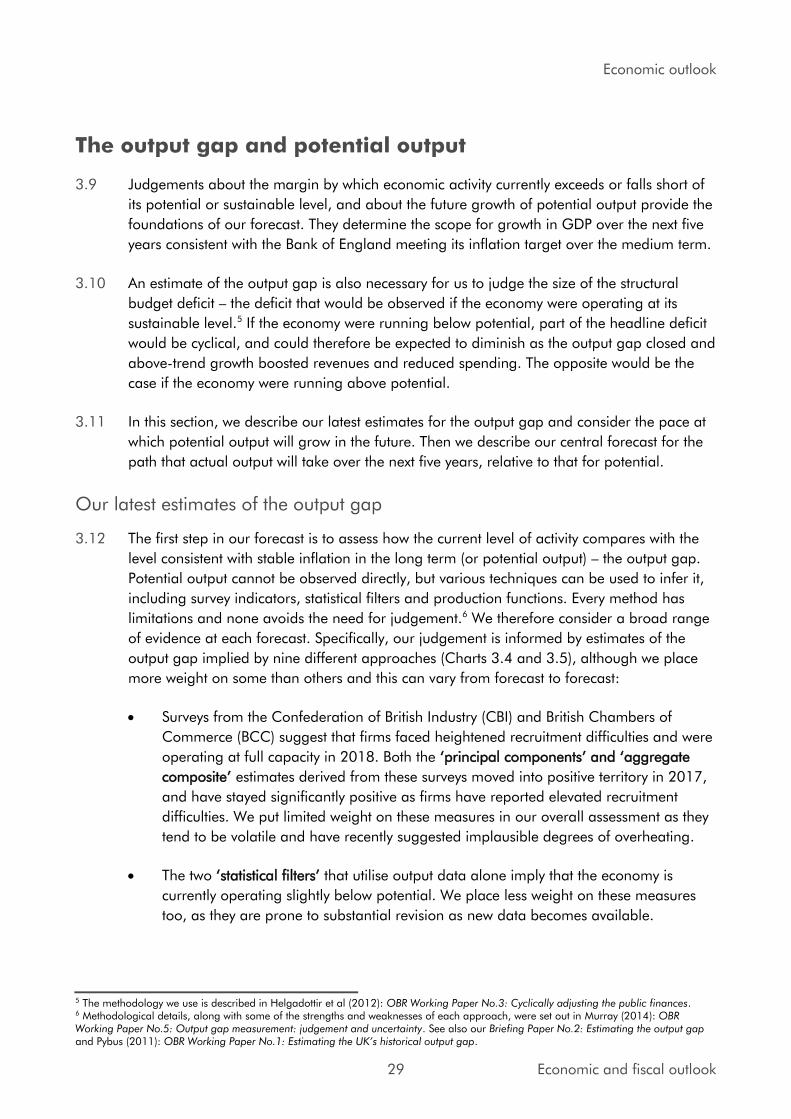
Economic outlook
The output gap and potential output
3.9 Judgements about the margin by which economic activity currently exceeds or falls short of
its potential or sustainable level, and about the future growth of potential output provide the
foundations of our forecast. They determine the scope for growth in GDP over the next five
years consistent with the Bank of England meeting its inflation target over the medium term.
3.10 An estimate of the output gap is also necessary for us to judge the size of the structural
budget deficit – the deficit that would be observed if the economy were operating at its
sustainable level.5 If the economy were running below potential, part of the headline deficit
would be cyclical, and could therefore be expected to diminish as the output gap closed and
above-trend growth boosted revenues and reduced spending. The opposite would be the
case if the economy were running above potential.
3.11 In this section, we describe our latest estimates for the output gap and consider the pace at
which potential output will grow in the future. Then we describe our central forecast for the
path that actual output will take over the next five years, relative to that for potential.
Our latest estimates of the output gap
3.12 The first step in our forecast is to assess how the current level of activity compares with the
level consistent with stable inflation in the long term (or potential output) – the output gap.
Potential output cannot be observed directly, but various techniques can be used to infer it,
including survey indicators, statistical filters and production functions. Every method has
limitations and none avoids the need for judgement.6 We therefore consider a broad range
of evidence at each forecast. Specifically, our judgement is informed by estimates of the
output gap implied by nine different approaches (Charts 3.4 and 3.5), although we place
more weight on some than others and this can vary from forecast to forecast:
• Surveys from the Confederation of British Industry (CBI) and British Chambers of
Commerce (BCC) suggest that firms faced heightened recruitment difficulties and were
operating at full capacity in 2018. Both the ‘principal components’ and ‘aggregate
composite’ estimates derived from these surveys moved into positive territory in 2017,
and have stayed significantly positive as firms have reported elevated recruitment
difficulties. We put limited weight on these measures in our overall assessment as they
tend to be volatile and have recently suggested implausible degrees of overheating.
• The two ‘statistical filters’ that utilise output data alone imply that the economy is
currently operating slightly below potential. We place less weight on these measures
too, as they are prone to substantial revision as new data becomes available.
5 The methodology we use is described in Helgadottir et al (2012): OBR Working Paper No.3: Cyclically adjusting the public finances. 6 Methodological details, along with some of the strengths and weaknesses of each approach, were set out in Murray (2014): OBR Working Paper No.5: Output gap measurement: judgement and uncertainty. See also our Briefing Paper No.2: Estimating the output gap and Pybus (2011): OBR Working Paper No.1: Estimating the UK’s historical output gap.
29 Economic and fiscal outlook
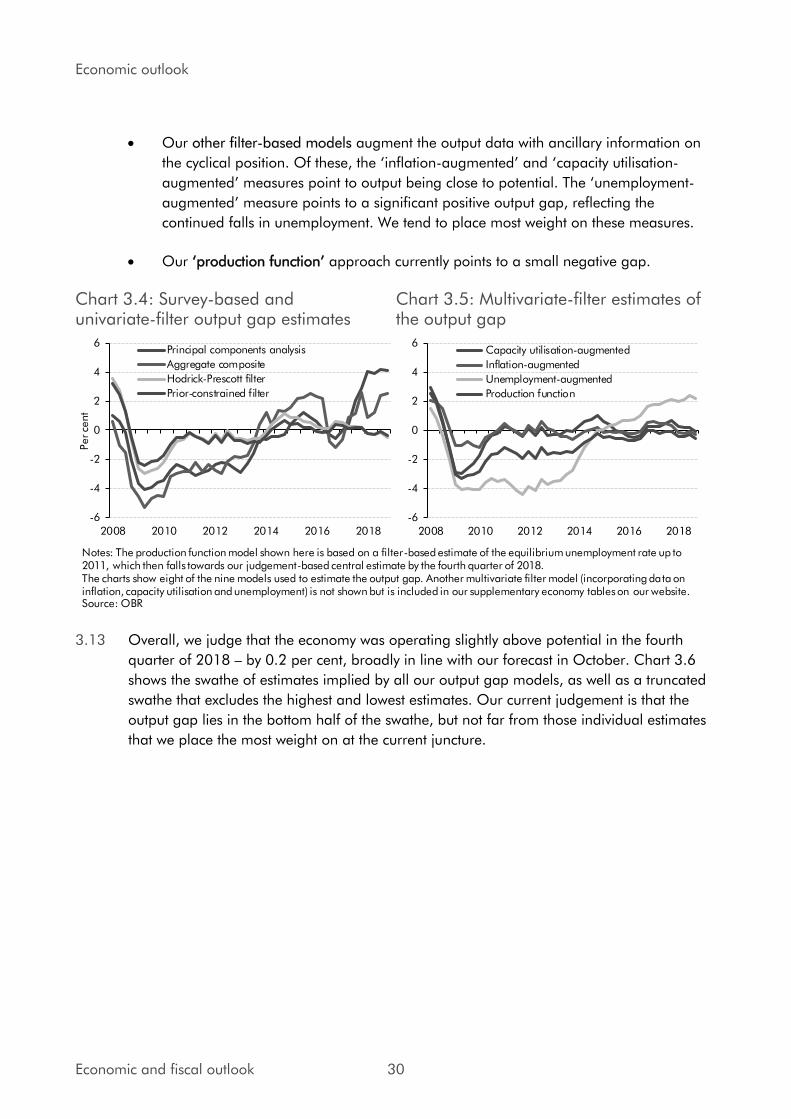
Economic outlook
• Our other filter-based models augment the output data with ancillary information on
the cyclical position. Of these, the ‘inflation-augmented’ and ‘capacity utilisation-
augmented’ measures point to output being close to potential. The ‘unemployment-
augmented’ measure points to a significant positive output gap, reflecting the continued falls in unemployment. We tend to place most weight on these measures.
• Our ‘production function’ approach currently points to a small negative gap.
Chart 3.4: Survey-based and Chart 3.5: Multivariate-filter estimates of univariate-filter output gap estimates the output gap
-6
-4
-2
0
2
4
6
2008 2010 2012 2014 2016 2018
Per ce
nt
Principal components analysis
Aggregate composite
Hodrick-Prescott filter
Prior-constrained filter
-6
-4
-2
0
2
4
6
2008 2010 2012 2014 2016 2018
Capacity utilisation-augmented
Inflation-augmented
Unemployment-augmented
Production function
Notes: The production function model shown here is based on a filter-based estimate of the equilibrium unemployment rate up to 2011, which then falls towards our judgement-based central estimate by the fourth quarter of 2018.The charts show eight of the nine models used to estimate the output gap. Another multivariate filter model (incorporating data on inflation, capacity utilisation and unemployment) is not shown but is included in our supplementary economy tables on our website.Source: OBR
3.13 Overall, we judge that the economy was operating slightly above potential in the fourth
quarter of 2018 – by 0.2 per cent, broadly in line with our forecast in October. Chart 3.6
shows the swathe of estimates implied by all our output gap models, as well as a truncated
swathe that excludes the highest and lowest estimates. Our current judgement is that the
output gap lies in the bottom half of the swathe, but not far from those individual estimates
that we place the most weight on at the current juncture.
Economic and fiscal outlook 30
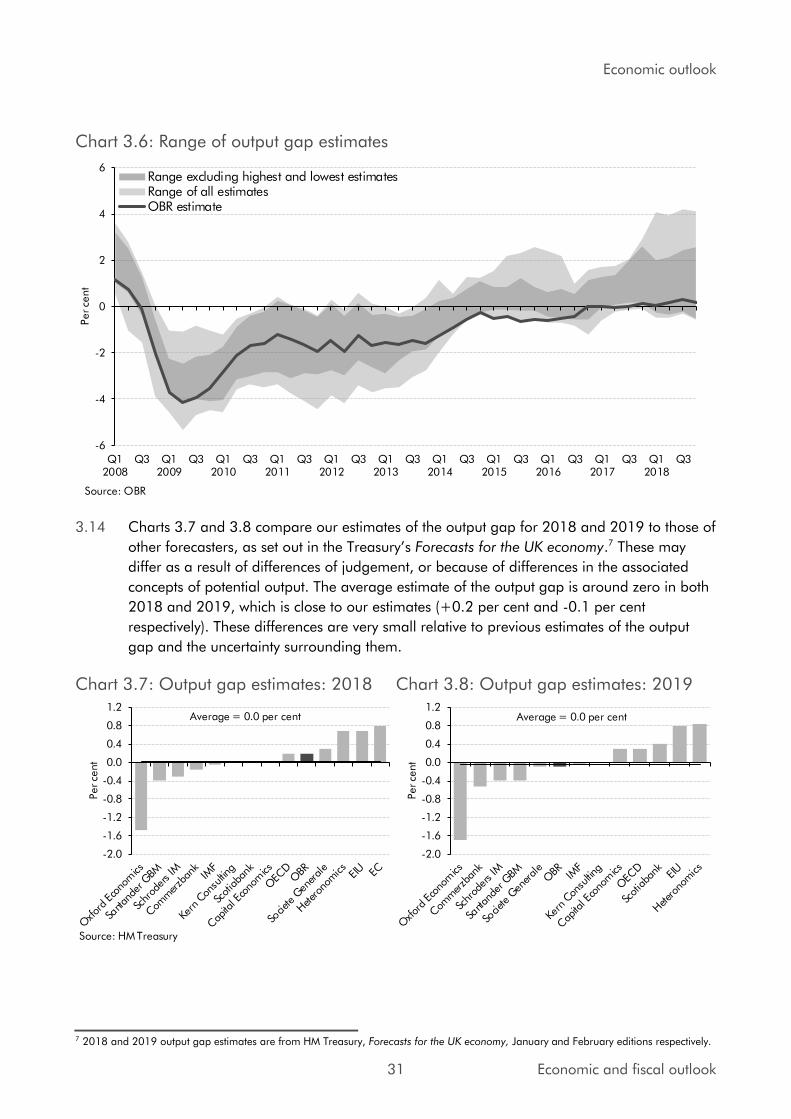
Economic outlook
Chart 3.6: Range of output gap estimates
-6
-4
-2
0
2
4
6
Q12008
Q3 Q12009
Q3 Q12010
Q3 Q12011
Q3 Q12012
Q3 Q12013
Q3 Q12014
Q3 Q12015
Q3 Q12016
Q3 Q12017
Q3 Q12018
Q3
Per ce
nt
Range excluding highest and lowest estimatesRange of all estimatesOBR estimate
Source: OBR
3.14 Charts 3.7 and 3.8 compare our estimates of the output gap for 2018 and 2019 to those of
other forecasters, as set out in the Treasury’s Forecasts for the UK economy.7 These may
differ as a result of differences of judgement, or because of differences in the associated
concepts of potential output. The average estimate of the output gap is around zero in both
2018 and 2019, which is close to our estimates (+0.2 per cent and -0.1 per cent
respectively). These differences are very small relative to previous estimates of the output
gap and the uncertainty surrounding them.
Chart 3.7: Output gap estimates: 2018 Chart 3.8: Output gap estimates: 2019
-2.0
-1.6
-1.2
-0.8
-0.4
0.0
0.4
0.8
1.2
Per ce
nt
Average = 0.0 per cent
-2.0
-1.6
-1.2
-0.8
-0.4
0.0
0.4
0.8
1.2
Per ce
nt
Source: HM Treasury
Average = 0.0 per cent
7 2018 and 2019 output gap estimates are from HM Treasury, Forecasts for the UK economy, January and February editions respectively.
31 Economic and fiscal outlook
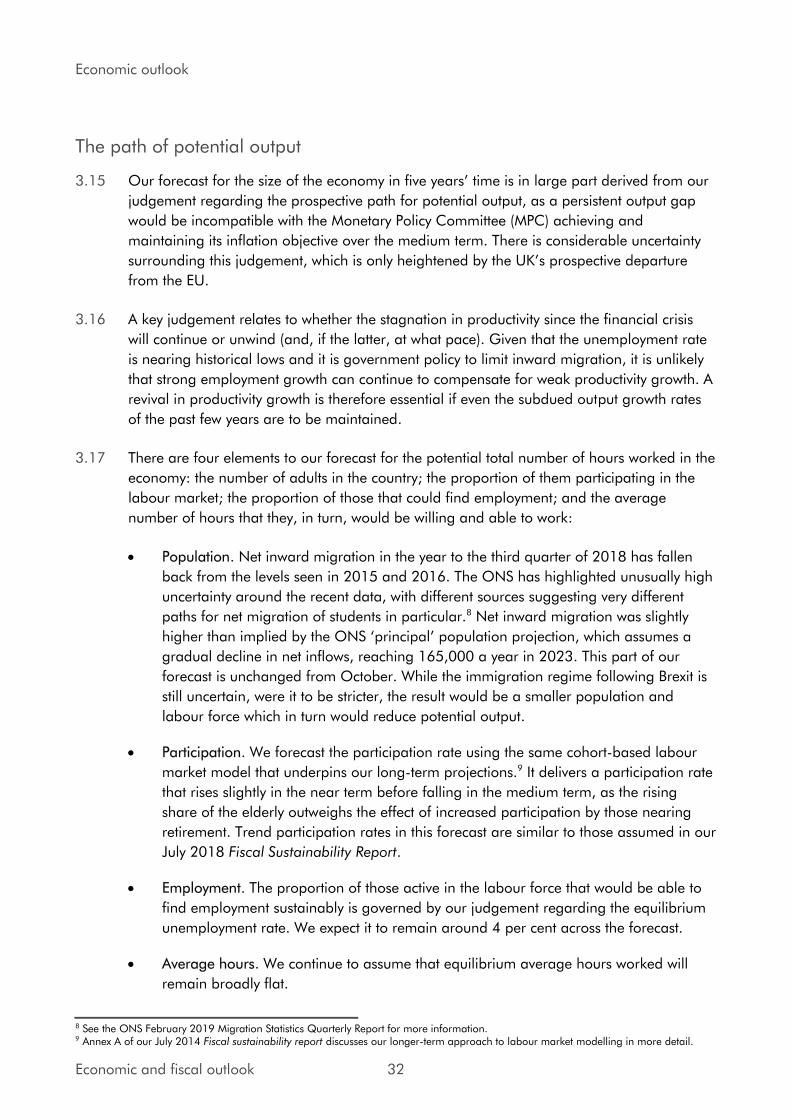
Economic outlook
The path of potential output
3.15 Our forecast for the size of the economy in five years’ time is in large part derived from our judgement regarding the prospective path for potential output, as a persistent output gap
would be incompatible with the Monetary Policy Committee (MPC) achieving and
maintaining its inflation objective over the medium term. There is considerable uncertainty
surrounding this judgement, which is only heightened by the UK’s prospective departure from the EU.
3.16 A key judgement relates to whether the stagnation in productivity since the financial crisis
will continue or unwind (and, if the latter, at what pace). Given that the unemployment rate
is nearing historical lows and it is government policy to limit inward migration, it is unlikely
that strong employment growth can continue to compensate for weak productivity growth. A
revival in productivity growth is therefore essential if even the subdued output growth rates
of the past few years are to be maintained.
3.17 There are four elements to our forecast for the potential total number of hours worked in the
economy: the number of adults in the country; the proportion of them participating in the
labour market; the proportion of those that could find employment; and the average
number of hours that they, in turn, would be willing and able to work:
• Population. Net inward migration in the year to the third quarter of 2018 has fallen
back from the levels seen in 2015 and 2016. The ONS has highlighted unusually high
uncertainty around the recent data, with different sources suggesting very different
paths for net migration of students in particular.8 Net inward migration was slightly
higher than implied by the ONS ‘principal’ population projection, which assumes a gradual decline in net inflows, reaching 165,000 a year in 2023. This part of our
forecast is unchanged from October. While the immigration regime following Brexit is
still uncertain, were it to be stricter, the result would be a smaller population and
labour force which in turn would reduce potential output.
• Participation. We forecast the participation rate using the same cohort-based labour
market model that underpins our long-term projections.9 It delivers a participation rate
that rises slightly in the near term before falling in the medium term, as the rising
share of the elderly outweighs the effect of increased participation by those nearing
retirement. Trend participation rates in this forecast are similar to those assumed in our
July 2018 Fiscal Sustainability Report.
• Employment. The proportion of those active in the labour force that would be able to
find employment sustainably is governed by our judgement regarding the equilibrium
unemployment rate. We expect it to remain around 4 per cent across the forecast.
• Average hours. We continue to assume that equilibrium average hours worked will
remain broadly flat.
8 See the ONS February 2019 Migration Statistics Quarterly Report for more information. 9 Annex A of our July 2014 Fiscal sustainability report discusses our longer-term approach to labour market modelling in more detail.
Economic and fiscal outlook 32

Economic outlook
3.18 The outlook for potential (or trend) productivity is the most important, yet most uncertain,
element of potential output growth. We continue to assume that trend hourly productivity
growth will rise gradually over the forecast period, reaching 1.3 per cent in 2023. We would
expect an increase in trend productivity growth as a tighter labour market exerts pressure on
firms to extract more output from their existing workforce, and as a fading of Brexit-related
uncertainty leads to a pick-up in business investment.
3.19 Table 3.1 summarises our potential output growth forecast. Of course, there is a high
degree of uncertainty surrounding these projections, which is further elevated by the
prospect of Brexit. In the near term, recent investment outturns and surveys suggest that
heightened uncertainty has slowed the pace of capital deepening and productivity growth
with it. In the longer term, impediments to the exploitation of comparative advantage are
likely to become more important. The dynamic effects of migration on productivity and
potential output are uncertain in size, but likely to interact with those of trade and foreign
direct investment. Our recent Brexit discussion paper discussed these issues in more detail.10
Table 3.1: Potential output growth forecast
Population1Equilibrium
employment rate1
Equilibrium
average hours
Potential
productivity2
Potential
output3
memo: Equilibrium
unemployment
rate (per cent)
2018 0.5 0.0 0.0 0.7 1.2 3.9
2019 0.5 0.0 0.0 0.9 1.5 4.0
2020 0.5 0.0 0.0 1.0 1.5 4.0
2021 0.5 -0.1 0.0 1.1 1.6 4.0
2022 0.6 -0.2 0.0 1.2 1.6 4.0
2023 0.6 -0.2 0.0 1.3 1.6 4.0
Percentage change on a year earlier, unless otherwise stated
1 Corresponding to those aged 16 and over. 2 Output per hour.3 Components may not sum to total due to rounding.
Note: Our trend growth forecast for 2018 is lower because we assumed that weak growth in the first quarter also lowered potential
output, given that weather-related disruption reduced supply in that quarter. The first quarter has a disproportionate impact on theannual growth rate.
Key economy forecast assumptions
3.20 We base our economic forecasts on several assumptions. Among them, we assume that
domestic and international interest rates, the exchange rate and oil prices move in line with
market expectations, taking the 10-day average to 14 February. We also base our forecasts
on the Government’s current stated policies on taxes, public spending and financial
transactions, as required by Parliament. And we continue to adopt broad-brush assumptions
about the effects of Brexit, as described in paragraph 3.4. The risks to our forecasts are
discussed later in the chapter.
10 OBR, Brexit and the OBR’s forecasts, 2018.
33 Economic and fiscal outlook
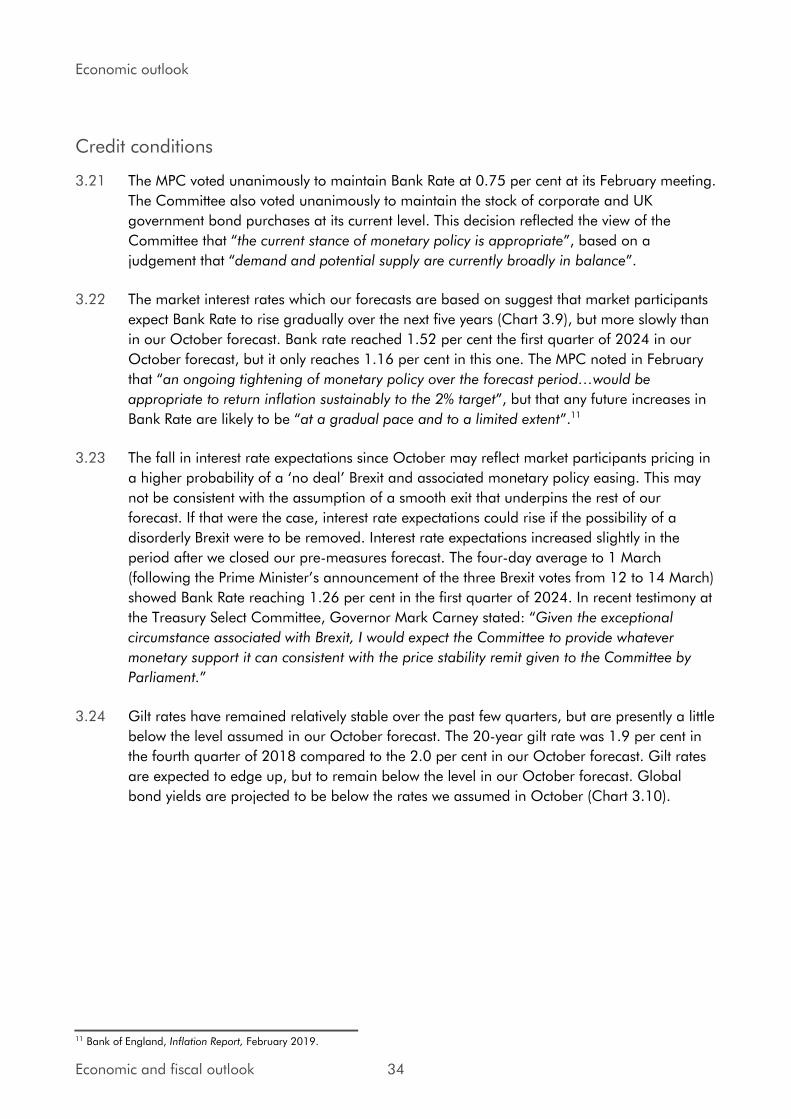
Economic outlook
Credit conditions
3.21 The MPC voted unanimously to maintain Bank Rate at 0.75 per cent at its February meeting.
The Committee also voted unanimously to maintain the stock of corporate and UK
government bond purchases at its current level. This decision reflected the view of the
Committee that “the current stance of monetary policy is appropriate”, based on a judgement that “demand and potential supply are currently broadly in balance”.
3.22 The market interest rates which our forecasts are based on suggest that market participants
expect Bank Rate to rise gradually over the next five years (Chart 3.9), but more slowly than
in our October forecast. Bank rate reached 1.52 per cent the first quarter of 2024 in our
October forecast, but it only reaches 1.16 per cent in this one. The MPC noted in February
that “an ongoing tightening of monetary policy over the forecast period…would be
appropriate to return inflation sustainably to the 2% target”, but that any future increases in
Bank Rate are likely to be “at a gradual pace and to a limited extent”.11
3.23 The fall in interest rate expectations since October may reflect market participants pricing in
a higher probability of a ‘no deal’ Brexit and associated monetary policy easing. This may
not be consistent with the assumption of a smooth exit that underpins the rest of our
forecast. If that were the case, interest rate expectations could rise if the possibility of a
disorderly Brexit were to be removed. Interest rate expectations increased slightly in the
period after we closed our pre-measures forecast. The four-day average to 1 March
(following the Prime Minister’s announcement of the three Brexit votes from 12 to 14 March)
showed Bank Rate reaching 1.26 per cent in the first quarter of 2024. In recent testimony at
the Treasury Select Committee, Governor Mark Carney stated: “Given the exceptional
circumstance associated with Brexit, I would expect the Committee to provide whatever
monetary support it can consistent with the price stability remit given to the Committee by
Parliament.”
3.24 Gilt rates have remained relatively stable over the past few quarters, but are presently a little
below the level assumed in our October forecast. The 20-year gilt rate was 1.9 per cent in
the fourth quarter of 2018 compared to the 2.0 per cent in our October forecast. Gilt rates
are expected to edge up, but to remain below the level in our October forecast. Global
bond yields are projected to be below the rates we assumed in October (Chart 3.10).
11 Bank of England, Inflation Report, February 2019.
Economic and fiscal outlook 34

Economic outlook
Chart 3.9: Bank Rate Chart 3.10: Global bond yields
0
1
2
3
4
5
2007 2009 2011 2013 2015 2017 2019 2021 2023
Per ce
nt
Global (Oct)Global (March)UK gilt (Oct)UK gilt (March)
Note: 20-year gilts for UK, asset-weighted bond rates for global.Source: Bank of England, Bloomberg, Datastream, OBR
Forecast
0
2
4
6
8
2007 2009 2011 2013 2015 2017 2019 2021 2023
Per ce
nt
October forecast
March forecast
Forecast
Source: Bank of England, OBR
3.25 Mortgage rates have risen slightly since the second quarter of 2018, reflecting the Bank
Rate rise in August. Although Bank Rate expectations have come down since October, the
effect on mortgage rates is offset by an increase in bank funding costs, so that our current
assumption remains in line with our October forecast.
Equity prices
3.26 UK equity prices were 6.8 per cent lower in the fourth quarter of 2018 than assumed in our
October forecast. Based on outturn data so far in 2019, we assume that equity prices are
set to fall in the first quarter of 2019. We then assume they will rise in line with nominal
GDP. This means that equity prices are expected to rise by 18.9 per cent over the forecast
period, although they are 6.9 per cent lower on average across the period than in our
October forecast.
Sterling exchange rate
3.27 Sterling has so far risen slightly in the first quarter of 2019. Against the dollar, it is assumed
to be 1.8 per cent weaker in the first quarter of 2019 than projected in our October
forecast, but 1.6 per cent stronger against the euro. Compared to our March 2016 forecast
– our final one before the referendum – the pound is assumed to be down 9.8 per cent
against the euro and 10.3 per cent against the dollar in the first quarter of 2019.
3.28 From its current level, we assume that the exchange rate will follow the path implied by
uncovered interest parity: namely, that it will move to reflect the difference between UK and
overseas interest rates so as to equalise the expected return to investing at home and
abroad. On average, our latest assumption is 0.2 per cent below our October assumption,
and 7.5 per cent below our final pre-referendum assumption (Chart 3.11).
35 Economic and fiscal outlook

Economic outlook
Chart 3.11: Sterling effective exchange rate
65
70
75
80
85
90
95
100
105
2007 2009 2011 2013 2015 2017 2019 2021 2023
Q1 2
007=
100
March 2016 forecast
October 2018 forecast
March 2019 forecast
Source: Bank of England, Bloomberg, OBR
Forecast
Oil prices
3.29 Oil prices rose steadily in the first three quarters of 2018, then dropped in the fourth quarter
(Chart 3.12). The recent fall reflected both demand and supply factors. The prospect of
slowing global economic activity and declining global trade weighed on demand. And
though OPEC maintained production curbs last year and plans to cut production further in
the first half of 2019, that was outweighed by market expectations of an increase in supply
elsewhere. Our assumption for the first quarter of 2019 lies 23 per cent below our October
assumption (25 per cent in dollar terms). The oil price futures curve remains at this level in
the near term, and oil prices are assumed to stabilise at about £47 per barrel, 18 per cent
below our October projection.
Economic and fiscal outlook 36
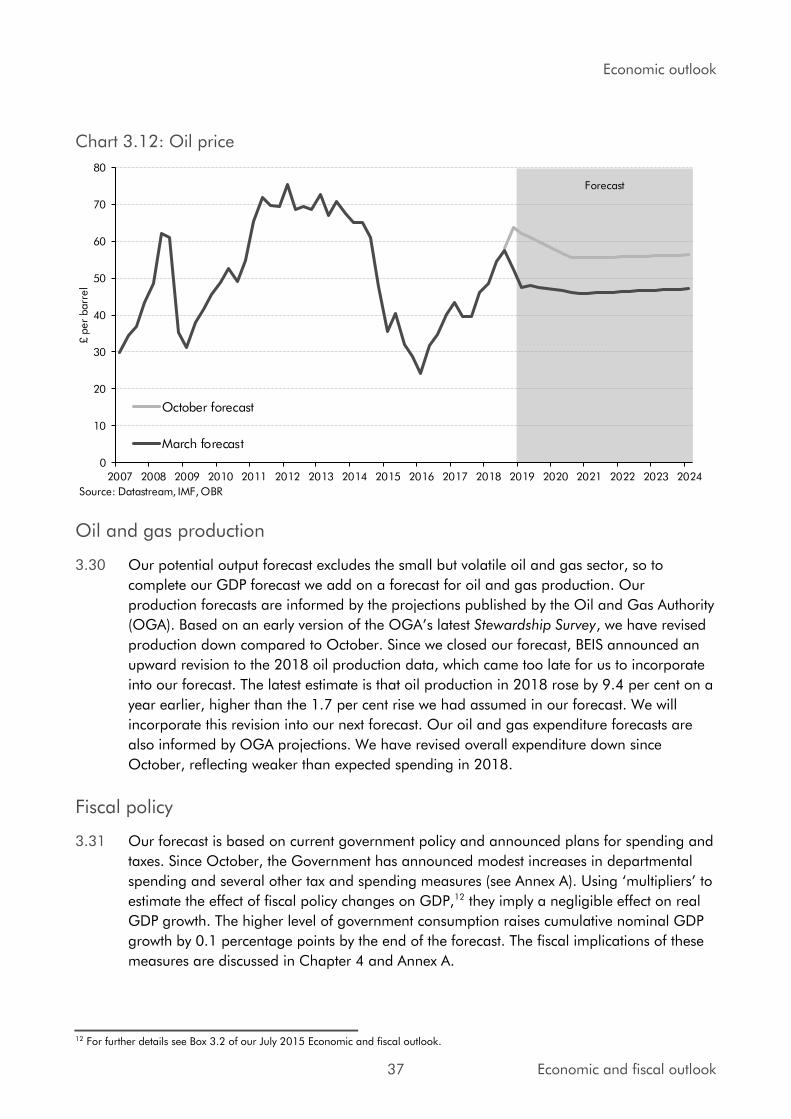
Economic outlook
Chart 3.12: Oil price
0
10
20
30
40
50
60
70
80
2007 2008 2009 2010 2011 2012 2013 2014 2015 2016 2017 2018 2019 2020 2021 2022 2023 2024
£ p
er
barr
el
October forecast
March forecast
Forecast
Source: Datastream, IMF, OBR
Oil and gas production
3.30 Our potential output forecast excludes the small but volatile oil and gas sector, so to
complete our GDP forecast we add on a forecast for oil and gas production. Our
production forecasts are informed by the projections published by the Oil and Gas Authority
(OGA). Based on an early version of the OGA’s latest Stewardship Survey, we have revised
production down compared to October. Since we closed our forecast, BEIS announced an
upward revision to the 2018 oil production data, which came too late for us to incorporate
into our forecast. The latest estimate is that oil production in 2018 rose by 9.4 per cent on a
year earlier, higher than the 1.7 per cent rise we had assumed in our forecast. We will
incorporate this revision into our next forecast. Our oil and gas expenditure forecasts are
also informed by OGA projections. We have revised overall expenditure down since
October, reflecting weaker than expected spending in 2018.
Fiscal policy
3.31 Our forecast is based on current government policy and announced plans for spending and
taxes. Since October, the Government has announced modest increases in departmental
spending and several other tax and spending measures (see Annex A). Using ‘multipliers’ to
estimate the effect of fiscal policy changes on GDP,12 they imply a negligible effect on real
GDP growth. The higher level of government consumption raises cumulative nominal GDP
growth by 0.1 percentage points by the end of the forecast. The fiscal implications of these
measures are discussed in Chapter 4 and Annex A.
12 For further details see Box 3.2 of our July 2015 Economic and fiscal outlook.
37 Economic and fiscal outlook
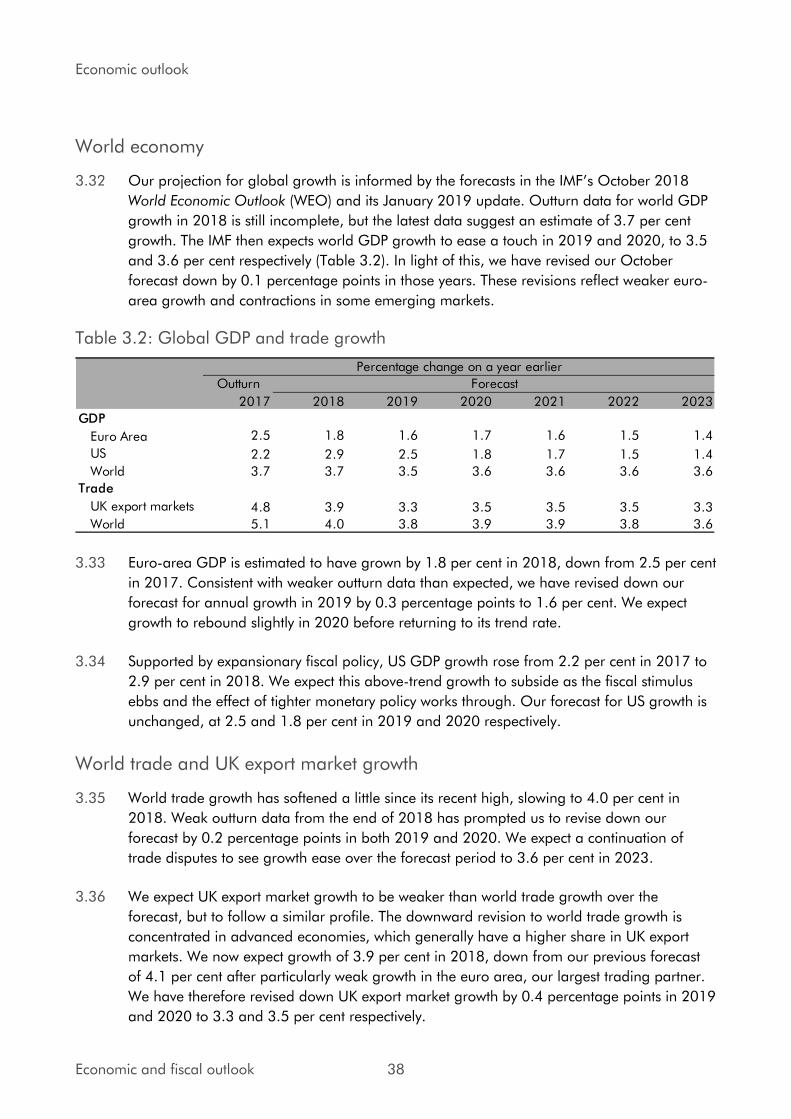
Economic outlook
World economy
3.32 Our projection for global growth is informed by the forecasts in the IMF’s October 2018 World Economic Outlook (WEO) and its January 2019 update. Outturn data for world GDP
growth in 2018 is still incomplete, but the latest data suggest an estimate of 3.7 per cent
growth. The IMF then expects world GDP growth to ease a touch in 2019 and 2020, to 3.5
and 3.6 per cent respectively (Table 3.2). In light of this, we have revised our October
forecast down by 0.1 percentage points in those years. These revisions reflect weaker euro-
area growth and contractions in some emerging markets.
Table 3.2: Global GDP and trade growth
Outturn
2017 2018 2019 2020 2021 2022 2023
GDP
Euro Area 2.5 1.8 1.6 1.7 1.6 1.5 1.4
US 2.2 2.9 2.5 1.8 1.7 1.5 1.4
World 3.7 3.7 3.5 3.6 3.6 3.6 3.6
Trade
UK export markets 4.8 3.9 3.3 3.5 3.5 3.5 3.3
World 5.1 4.0 3.8 3.9 3.9 3.8 3.6
Percentage change on a year earlier
Forecast
3.33 Euro-area GDP is estimated to have grown by 1.8 per cent in 2018, down from 2.5 per cent
in 2017. Consistent with weaker outturn data than expected, we have revised down our
forecast for annual growth in 2019 by 0.3 percentage points to 1.6 per cent. We expect
growth to rebound slightly in 2020 before returning to its trend rate.
3.34 Supported by expansionary fiscal policy, US GDP growth rose from 2.2 per cent in 2017 to
2.9 per cent in 2018. We expect this above-trend growth to subside as the fiscal stimulus
ebbs and the effect of tighter monetary policy works through. Our forecast for US growth is
unchanged, at 2.5 and 1.8 per cent in 2019 and 2020 respectively.
World trade and UK export market growth
3.35 World trade growth has softened a little since its recent high, slowing to 4.0 per cent in
2018. Weak outturn data from the end of 2018 has prompted us to revise down our
forecast by 0.2 percentage points in both 2019 and 2020. We expect a continuation of
trade disputes to see growth ease over the forecast period to 3.6 per cent in 2023.
3.36 We expect UK export market growth to be weaker than world trade growth over the
forecast, but to follow a similar profile. The downward revision to world trade growth is
concentrated in advanced economies, which generally have a higher share in UK export
markets. We now expect growth of 3.9 per cent in 2018, down from our previous forecast
of 4.1 per cent after particularly weak growth in the euro area, our largest trading partner.
We have therefore revised down UK export market growth by 0.4 percentage points in 2019
and 2020 to 3.3 and 3.5 per cent respectively.
Economic and fiscal outlook 38

Economic outlook
Summary
3.37 The key assumptions underpinning our central forecast are that:
• The UK leaves the EU in March 2019, moving in due course to a less open trade
regime and a tighter migration regime than would otherwise have been the case.
• Brexit uncertainty appears to have weighed on business investment more than
assumed in our previous forecasts. We expect this to continue in the near term.
• Credit conditions remain highly accommodative, and monetary policy is slightly looser
than assumed in October.
• Fiscal policy changes since October have a negligible effect on our real GDP forecast.
• The sterling effective exchange rate is broadly in line with our October assumption and
on average 7.5 per cent below the level assumed in our pre-referendum forecast.
• Sterling oil prices are significantly lower than assumed in October.
• UK export market growth is expected to slow after 2018, by more than world trade
growth and by more than assumed in October.
Prospects for real GDP growth
The short-term outlook for GDP
3.38 Services sector growth has been relatively stable over 2018, averaging 0.5 per cent a
quarter. Other sectors account for smaller shares of overall output, but they tend to be more
volatile and so, in some cases, have had significant effects on recent quarterly GDP growth
(Chart 3.13). The construction sector contracted at the start of 2018 as snow disrupted
activity, but bounced back in the third quarter before contracting again in the fourth. The
manufacturing sector weakened in 2018, with output contracting in all but the third quarter.
39 Economic and fiscal outlook

Economic outlook
Chart 3.13: Contributions to quarterly output growth
-0.2
0.0
0.2
0.4
0.6
0.8
1.0
Q12016
Q2 Q3 Q4 Q12017
Q2 Q3 Q4 Q12018
Q2 Q3 Q4
Perc
enta
ge p
oin
ts
ServicesConstructionOther productionManufacturingTotal (Output GVA)Headline GDP
Source: ONS
Note: In the most recent two quarters, headline GDP is aligned to output-based GVA growth. Prior to the most recent two quarters, headline GDP growth may differ from output-based GVA growth as it is calculated as an average of the expenditure, income and output approaches to measuring GDP.
3.39 Quarterly GDP growth slowed significantly over the final quarter of last year (Table 3.3). The
latest estimates show growth of 0.6 and 0.2 per cent in the third and fourth quarters of
2018 respectively. It is possible that the strength in the third quarter was supported in part
by temporary factors, such as the warm weather and the FIFA World Cup. In our October
forecast, we expected some of these effects to unwind and for growth to slow to 0.3 per
cent. But growth has slowed by more than we expected, with production output experiencing
its biggest fall since the fourth quarter of 2012 and construction also contracting.
3.40 Monthly data suggest much of this weakness was concentrated in December. GDP fell by
0.4 per cent compared to the previous month, with negative contributions from services,
construction and production. Monthly data are particularly volatile and the tendency for
GDP growth to be revised means that one should not place too much weight on any
particular vintage. But the slowdown in the final quarter of 2018 is also present in surveys
such as the Purchasing Managers Index. We expect quarterly GDP growth of 0.2 per cent in
the first quarter of 2019, as the drag from a fall in activity in December and Brexit
uncertainty depresses growth. The deterioration in the outlook is consistent with several
leading indicators of business confidence. The Lloyds business barometer indicated that
business confidence fell in February to its lowest since June 2016. Similarly, the CBI’s quarterly service sector survey reported that business optimism declined sharply in the three
months to February. The deterioration was particularly marked in the business and
professional services sector, which saw optimism reach its lowest since 2009.
Economic and fiscal outlook 40

Economic outlook
Table 3.3: The quarterly GDP profile
Q1 Q2 Q3 Q4 Q1 Q2 Q3 Q4 Q1 Q2 Q3 Q4
October forecast1 0.1 0.4 0.5 0.4 0.4 0.4 0.4 0.4 0.3 0.4 0.4 0.3
March forecast2 0.1 0.4 0.6 0.2 0.2 0.3 0.3 0.3 0.3 0.4 0.4 0.4
Change3 0.0 0.0 0.2 -0.2 -0.2 -0.1 0.0 0.0 0.0 0.0 0.0 0.0
3 Changes may not sum due to rounding.
1 Forecast from the third quarter of 2018.2 Forecast from first quarter of 2019.
Percentage change on previous quarter
2018 2019 2020
The medium-term outlook for GDP
3.41 We continue to assume that the negotiations between the UK and the EU lead to an orderly
transition to a new long-term relationship, whatever that relationship might be. In the near
term, we expect uncertainty to continue to weigh on business investment. We also expect
subdued consumption growth, as a further improvement in real earnings growth is offset by
slowing employment growth. A weaker global outlook also means that net trade acts as a
significant drag on growth.
3.42 Taking these factors together, we expect GDP growth to slow to 1.2 per cent in 2019. As
Brexit uncertainty begins to dissipate, and productivity growth gradually improves, we expect
it to pick up to 1.4 per cent in 2020, and remain at 1.6 per cent a year across the rest of
the forecast period (Chart 3.14). The profile for real GDP growth reflects several factors:
• Real household consumption growth is expected to remain relatively subdued in the
near term. We expect it to improve steadily from mid-2019 as real earnings growth
gradually increases, supporting an increase in real household income growth.
• Brexit-related uncertainty is currently weighing on investment, which fell throughout
2018. The gradual dissipation of uncertainty as the post-Brexit regime is clarified is
expected to provide a modest boost to GDP growth later in the forecast. Business
investment is also supported by measures introduced in last October’s Budget.
• We expect world trade and UK export market growth to be weaker than over the past
two years – and weaker than we forecast in October. This implies a lower contribution
from net trade to GDP growth. The Brexit transition period delays the expected
reduction in both export and import intensity, and we assume it has a neutral effect on
net trade (Table 3.4).
• Discretionary fiscal loosening supports growth. Real government consumption growth
steps up in 2019, driven by higher NHS spending announced in June 2018.
41 Economic and fiscal outlook
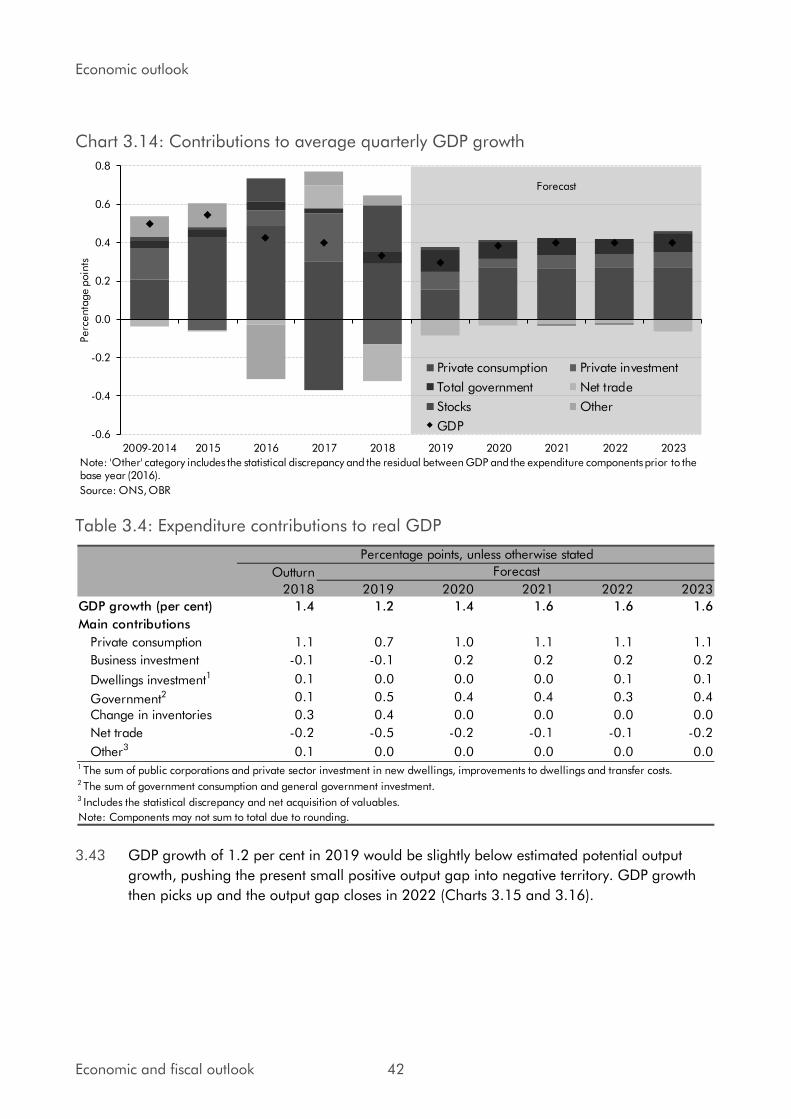
Economic outlook
Chart 3.14: Contributions to average quarterly GDP growth
-0.6
-0.4
-0.2
0.0
0.2
0.4
0.6
0.8
2009-2014 2015 2016 2017 2018 2019 2020 2021 2022 2023
Perc
enta
ge p
oin
ts
Private consumption Private investment
Total government Net trade
Stocks Other
GDP
Note: 'Other' category includes the statistical discrepancy and the residual between GDP and the expenditure components prior to the base year (2016).
Source: ONS, OBR
Forecast
Table 3.4: Expenditure contributions to real GDP
Outturn
2018 2019 2020 2021 2022 2023
GDP growth (per cent) 1.4 1.2 1.4 1.6 1.6 1.6
Main contributions
Private consumption 1.1 0.7 1.0 1.1 1.1 1.1
Business investment -0.1 -0.1 0.2 0.2 0.2 0.2
Dwellings investment1 0.1 0.0 0.0 0.0 0.1 0.1
Government2 0.1 0.5 0.4 0.4 0.3 0.4
Change in inventories 0.3 0.4 0.0 0.0 0.0 0.0
Net trade -0.2 -0.5 -0.2 -0.1 -0.1 -0.2
Other3 0.1 0.0 0.0 0.0 0.0 0.0
Note: Components may not sum to total due to rounding.
Forecast
Percentage points, unless otherwise stated
1 The sum of public corporations and private sector investment in new dwellings, improvements to dwellings and transfer costs.2 The sum of government consumption and general government investment.3 Includes the statistical discrepancy and net acquisition of valuables.
3.43 GDP growth of 1.2 per cent in 2019 would be slightly below estimated potential output
growth, pushing the present small positive output gap into negative territory. GDP growth
then picks up and the output gap closes in 2022 (Charts 3.15 and 3.16).
Economic and fiscal outlook 42
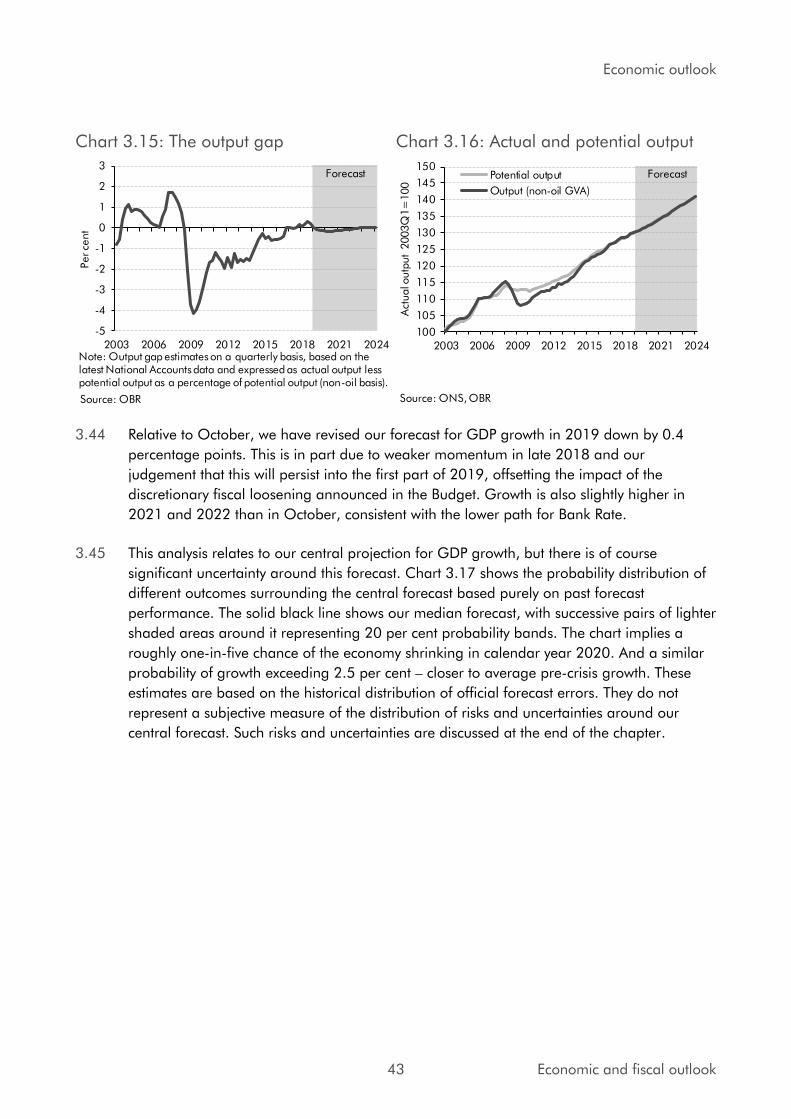
Economic outlook
Chart 3.15: The output gap Chart 3.16: Actual and potential output
-5
-4
-3
-2
-1
0
1
2
3
2003 2006 2009 2012 2015 2018 2021 2024
Per ce
nt
Note: Output gap estimates on a quarterly basis, based on the latest National Accounts data and expressed as actual output less potential output as a percentage of potential output (non-oil basis).
Source: OBR
Forecast
100
105
110
115
120
125
130
135
140
145
150
2003 2006 2009 2012 2015 2018 2021 2024
Act
ual o
utp
ut
2003Q
1=
100
. Potential output
Output (non-oil GVA)
Source: ONS, OBR
Forecast
3.44 Relative to October, we have revised our forecast for GDP growth in 2019 down by 0.4
percentage points. This is in part due to weaker momentum in late 2018 and our
judgement that this will persist into the first part of 2019, offsetting the impact of the
discretionary fiscal loosening announced in the Budget. Growth is also slightly higher in
2021 and 2022 than in October, consistent with the lower path for Bank Rate.
3.45 This analysis relates to our central projection for GDP growth, but there is of course
significant uncertainty around this forecast. Chart 3.17 shows the probability distribution of
different outcomes surrounding the central forecast based purely on past forecast
performance. The solid black line shows our median forecast, with successive pairs of lighter
shaded areas around it representing 20 per cent probability bands. The chart implies a
roughly one-in-five chance of the economy shrinking in calendar year 2020. And a similar
probability of growth exceeding 2.5 per cent – closer to average pre-crisis growth. These
estimates are based on the historical distribution of official forecast errors. They do not
represent a subjective measure of the distribution of risks and uncertainties around our
central forecast. Such risks and uncertainties are discussed at the end of the chapter.
43 Economic and fiscal outlook
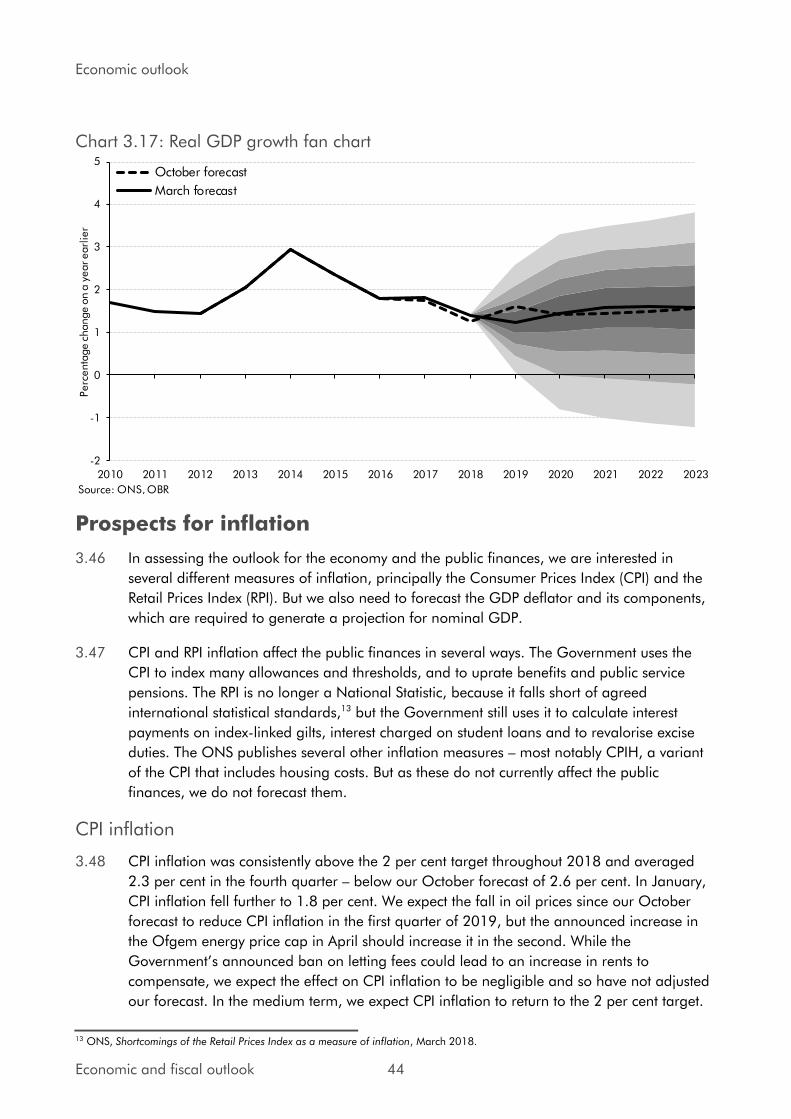
Economic outlook
Chart 3.17: Real GDP growth fan chart
-2
-1
0
1
2
3
4
5
2010 2011 2012 2013 2014 2015 2016 2017 2018 2019 2020 2021 2022 2023
Perc
enta
ge c
hange o
n a
year earl
ier
October forecast
March forecast
Source: ONS, OBR
Prospects for inflation
3.46 In assessing the outlook for the economy and the public finances, we are interested in
several different measures of inflation, principally the Consumer Prices Index (CPI) and the
Retail Prices Index (RPI). But we also need to forecast the GDP deflator and its components,
which are required to generate a projection for nominal GDP.
3.47 CPI and RPI inflation affect the public finances in several ways. The Government uses the
CPI to index many allowances and thresholds, and to uprate benefits and public service
pensions. The RPI is no longer a National Statistic, because it falls short of agreed
international statistical standards,13 but the Government still uses it to calculate interest
payments on index-linked gilts, interest charged on student loans and to revalorise excise
duties. The ONS publishes several other inflation measures – most notably CPIH, a variant
of the CPI that includes housing costs. But as these do not currently affect the public
finances, we do not forecast them.
CPI inflation
3.48 CPI inflation was consistently above the 2 per cent target throughout 2018 and averaged
2.3 per cent in the fourth quarter – below our October forecast of 2.6 per cent. In January,
CPI inflation fell further to 1.8 per cent. We expect the fall in oil prices since our October
forecast to reduce CPI inflation in the first quarter of 2019, but the announced increase in
the Ofgem energy price cap in April should increase it in the second. While the
Government’s announced ban on letting fees could lead to an increase in rents to compensate, we expect the effect on CPI inflation to be negligible and so have not adjusted
our forecast. In the medium term, we expect CPI inflation to return to the 2 per cent target.
13 ONS, Shortcomings of the Retail Prices Index as a measure of inflation, March 2018.
Economic and fiscal outlook 44
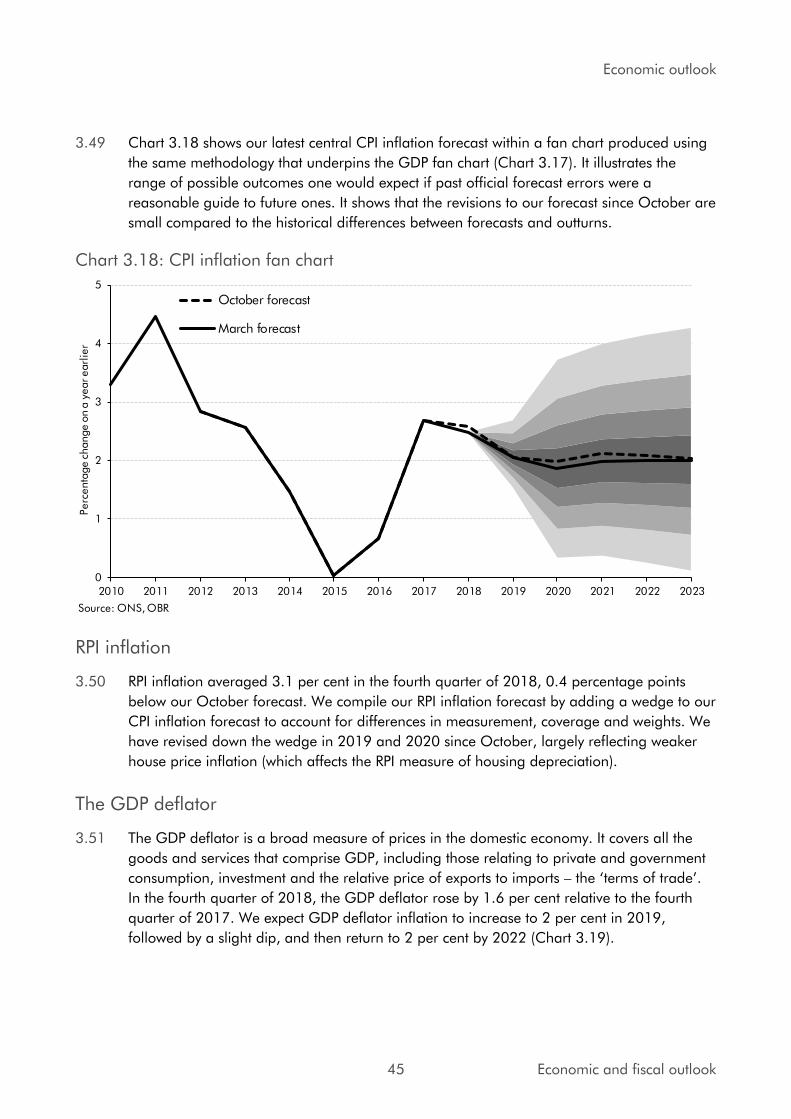
Economic outlook
3.49 Chart 3.18 shows our latest central CPI inflation forecast within a fan chart produced using
the same methodology that underpins the GDP fan chart (Chart 3.17). It illustrates the
range of possible outcomes one would expect if past official forecast errors were a
reasonable guide to future ones. It shows that the revisions to our forecast since October are
small compared to the historical differences between forecasts and outturns.
Chart 3.18: CPI inflation fan chart
0
1
2
3
4
5
2010 2011 2012 2013 2014 2015 2016 2017 2018 2019 2020 2021 2022 2023
Perc
enta
ge c
hange o
n a
year earl
ier
October forecast
March forecast
Source: ONS, OBR
RPI inflation
3.50 RPI inflation averaged 3.1 per cent in the fourth quarter of 2018, 0.4 percentage points
below our October forecast. We compile our RPI inflation forecast by adding a wedge to our
CPI inflation forecast to account for differences in measurement, coverage and weights. We
have revised down the wedge in 2019 and 2020 since October, largely reflecting weaker
house price inflation (which affects the RPI measure of housing depreciation).
The GDP deflator
3.51 The GDP deflator is a broad measure of prices in the domestic economy. It covers all the
goods and services that comprise GDP, including those relating to private and government
consumption, investment and the relative price of exports to imports – the ‘terms of trade’. In the fourth quarter of 2018, the GDP deflator rose by 1.6 per cent relative to the fourth
quarter of 2017. We expect GDP deflator inflation to increase to 2 per cent in 2019,
followed by a slight dip, and then return to 2 per cent by 2022 (Chart 3.19).
45 Economic and fiscal outlook
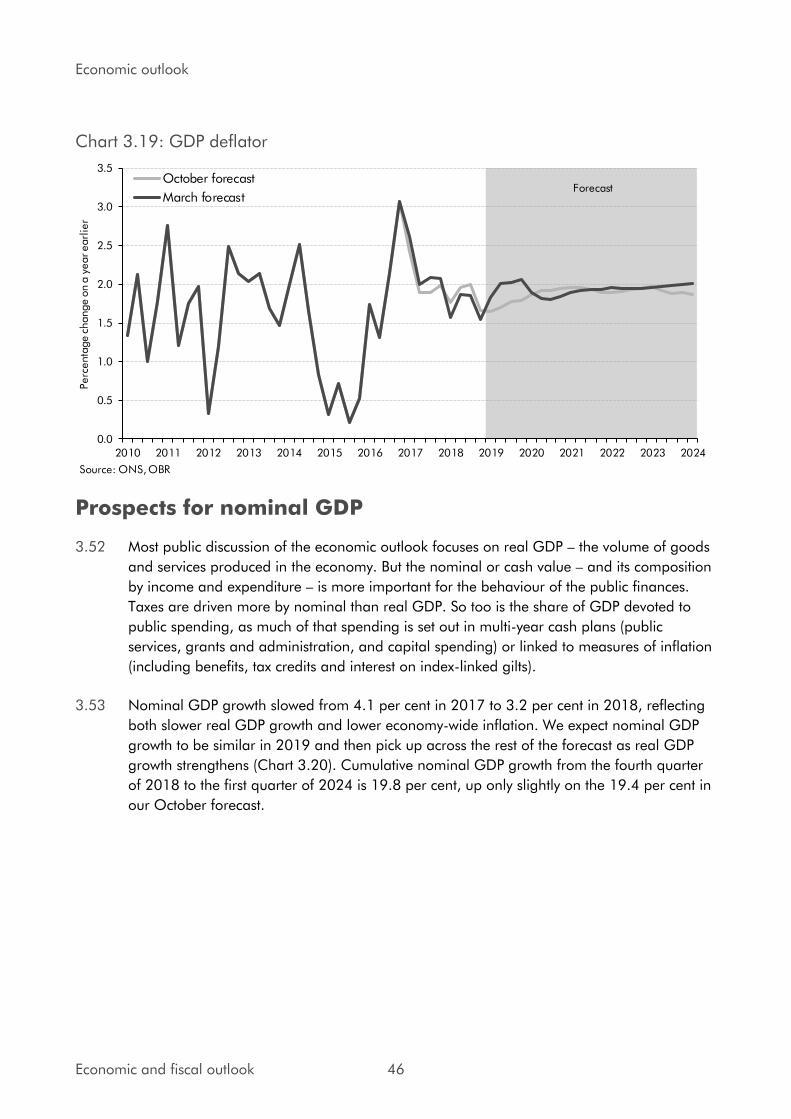
Economic outlook
Chart 3.19: GDP deflator
0.0
0.5
1.0
1.5
2.0
2.5
3.0
3.5
2010 2011 2012 2013 2014 2015 2016 2017 2018 2019 2020 2021 2022 2023 2024
Perc
enta
ge c
hange o
n a
year earl
ier
October forecast
March forecast
Source: ONS, OBR
Forecast
Prospects for nominal GDP
3.52 Most public discussion of the economic outlook focuses on real GDP – the volume of goods
and services produced in the economy. But the nominal or cash value – and its composition
by income and expenditure – is more important for the behaviour of the public finances.
Taxes are driven more by nominal than real GDP. So too is the share of GDP devoted to
public spending, as much of that spending is set out in multi-year cash plans (public
services, grants and administration, and capital spending) or linked to measures of inflation
(including benefits, tax credits and interest on index-linked gilts).
3.53 Nominal GDP growth slowed from 4.1 per cent in 2017 to 3.2 per cent in 2018, reflecting
both slower real GDP growth and lower economy-wide inflation. We expect nominal GDP
growth to be similar in 2019 and then pick up across the rest of the forecast as real GDP
growth strengthens (Chart 3.20). Cumulative nominal GDP growth from the fourth quarter
of 2018 to the first quarter of 2024 is 19.8 per cent, up only slightly on the 19.4 per cent in
our October forecast.
Economic and fiscal outlook 46
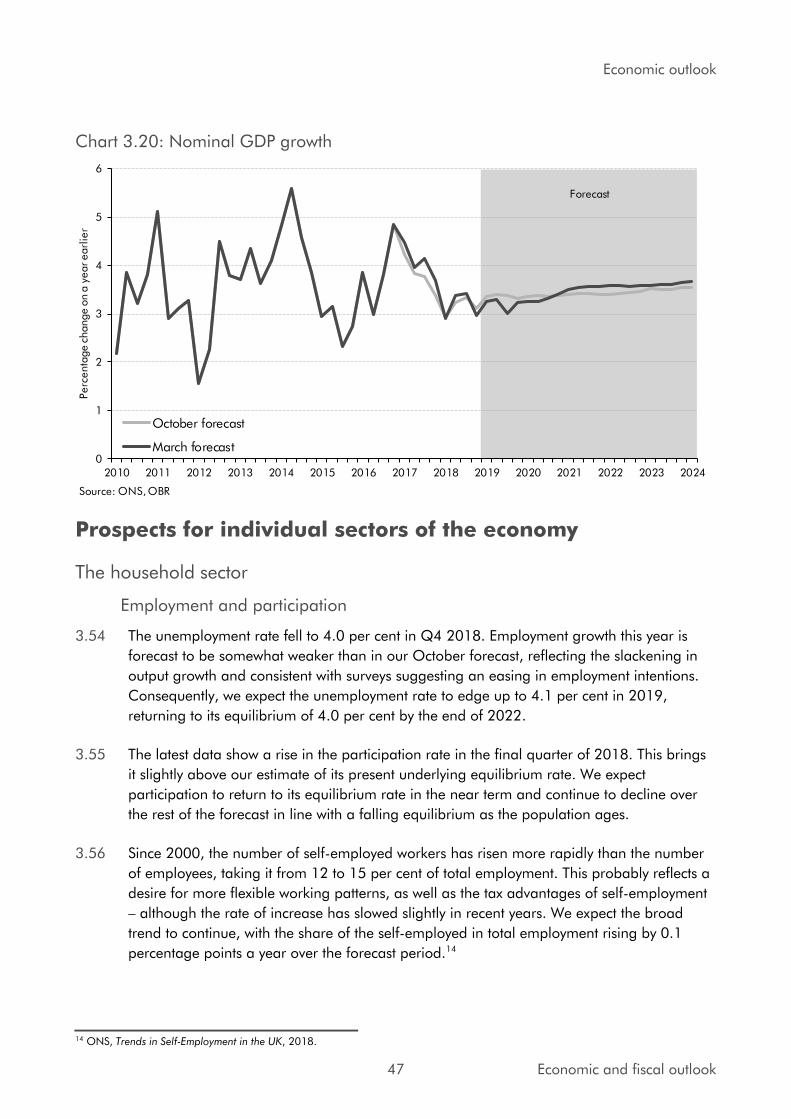
Economic outlook
Chart 3.20: Nominal GDP growth
0
1
2
3
4
5
6
2010 2011 2012 2013 2014 2015 2016 2017 2018 2019 2020 2021 2022 2023 2024
Perc
enta
ge c
hange o
n a
year earl
ier
October forecast
March forecast
Source: ONS, OBR
Forecast
Prospects for individual sectors of the economy
The household sector
Employment and participation
3.54 The unemployment rate fell to 4.0 per cent in Q4 2018. Employment growth this year is
forecast to be somewhat weaker than in our October forecast, reflecting the slackening in
output growth and consistent with surveys suggesting an easing in employment intentions.
Consequently, we expect the unemployment rate to edge up to 4.1 per cent in 2019,
returning to its equilibrium of 4.0 per cent by the end of 2022.
3.55 The latest data show a rise in the participation rate in the final quarter of 2018. This brings
it slightly above our estimate of its present underlying equilibrium rate. We expect
participation to return to its equilibrium rate in the near term and continue to decline over
the rest of the forecast in line with a falling equilibrium as the population ages.
3.56 Since 2000, the number of self-employed workers has risen more rapidly than the number
of employees, taking it from 12 to 15 per cent of total employment. This probably reflects a
desire for more flexible working patterns, as well as the tax advantages of self-employment
– although the rate of increase has slowed slightly in recent years. We expect the broad
trend to continue, with the share of the self-employed in total employment rising by 0.1
percentage points a year over the forecast period.14
14 ONS, Trends in Self-Employment in the UK, 2018.
47 Economic and fiscal outlook

Economic outlook
Average earnings
3.57 We use a measure of average earnings constructed by dividing the National Accounts
measure of wages and salaries by the number of employees, instead of the official ONS
average weekly earnings (AWE) series. This allows us to fit the earnings forecast directly into
the National Accounts framework on which our economy forecast is based – particularly the
measure of wages and salaries that is an important determinant of tax receipts.
3.58 Average earnings growth has been stronger in recent data than we expected in October.
This growth has outstripped the sum of labour productivity growth and whole economy
inflation, resulting in a rise in labour’s share of national income. We assume that some of this momentum in average earnings growth is maintained, with growth of 3.1 per cent in
2019, up from 2.5 per cent in our October forecast. From 2021 onwards, average earnings
grow broadly in line with the sum of our forecasts for labour productivity growth and whole
economy inflation. By 2023 average earnings growth reaches 3.3 per cent, reflecting a
modest increase in productivity growth. Throughout the forecast, average earnings growth
remains below the rates typical before the financial crisis.
Household disposable income
3.59 Full household income data for 2018 are not yet available, but we expect real household
disposable income growth to have picked up to 1.6 per cent in 2018, from 0.5 per cent in
2017. This reflects a modest acceleration in employment and earnings, a fall in CPI inflation
and the unwinding of the effect of higher dividend taxation in 2017. We then expect it to fall
back to 0.7 per cent in 2019 as weaker employment growth offsets the effect of higher real
earnings growth. From 2020, gradual increases in nominal earnings growth support a
modest pick-up. The freeze in most working-age benefits and tax credits weighs on growth
in 2019, while fiscal drag in the income tax system does so in most years (Chart 3.21). Our
forecasts for per capita real earnings and real disposable income growth remain relatively
weak (Table 3.5).
Table 3.5: Real earnings and real incomes
2019 2020 2021 2022 2023
Real disposable income per capita 0.1 0.6 1.1 1.2 1.3
of which:
Labour income1,2 0.6 0.7 0.8 0.7 0.8
Net taxes and benefits2 -0.7 -0.4 -0.1 0.0 0.0
Other non-labour income2 0.3 0.3 0.5 0.5 0.5
Forecast, annual percentage change
1 Employee compensation (including net compensation from abroad) plus mixed income less employer social contributions. 2 Per capita basis, deflated by consumption deflator.
Economic and fiscal outlook 48
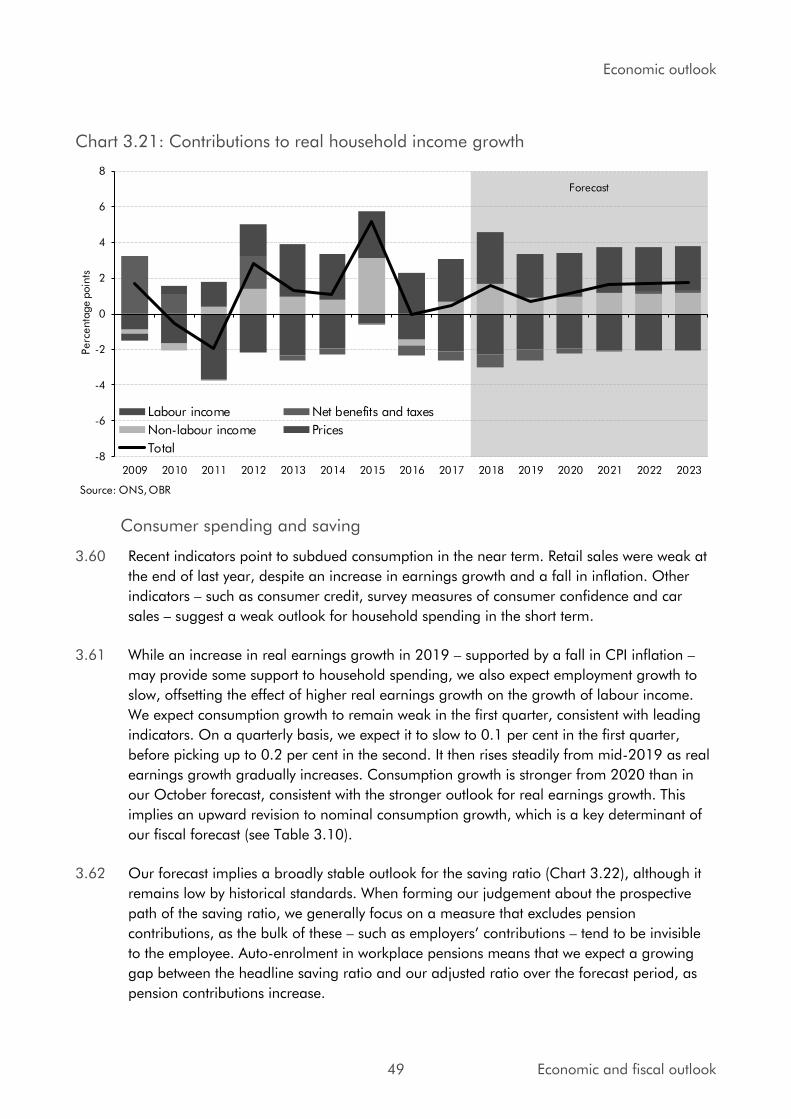
Economic outlook
Chart 3.21: Contributions to real household income growth
-8
-6
-4
-2
0
2
4
6
8
2009 2010 2011 2012 2013 2014 2015 2016 2017 2018 2019 2020 2021 2022 2023
Perc
enta
ge p
oin
ts
Labour income Net benefits and taxes
Non-labour income Prices
Total
Forecast
Source: ONS, OBR
Consumer spending and saving
3.60 Recent indicators point to subdued consumption in the near term. Retail sales were weak at
the end of last year, despite an increase in earnings growth and a fall in inflation. Other
indicators – such as consumer credit, survey measures of consumer confidence and car
sales – suggest a weak outlook for household spending in the short term.
3.61 While an increase in real earnings growth in 2019 – supported by a fall in CPI inflation – may provide some support to household spending, we also expect employment growth to
slow, offsetting the effect of higher real earnings growth on the growth of labour income.
We expect consumption growth to remain weak in the first quarter, consistent with leading
indicators. On a quarterly basis, we expect it to slow to 0.1 per cent in the first quarter,
before picking up to 0.2 per cent in the second. It then rises steadily from mid-2019 as real
earnings growth gradually increases. Consumption growth is stronger from 2020 than in
our October forecast, consistent with the stronger outlook for real earnings growth. This
implies an upward revision to nominal consumption growth, which is a key determinant of
our fiscal forecast (see Table 3.10).
3.62 Our forecast implies a broadly stable outlook for the saving ratio (Chart 3.22), although it
remains low by historical standards. When forming our judgement about the prospective
path of the saving ratio, we generally focus on a measure that excludes pension
contributions, as the bulk of these – such as employers’ contributions – tend to be invisible
to the employee. Auto-enrolment in workplace pensions means that we expect a growing
gap between the headline saving ratio and our adjusted ratio over the forecast period, as
pension contributions increase.
49 Economic and fiscal outlook

Economic outlook
3.63 We expect a somewhat higher path for household saving than in October, particularly when
pension contributions are excluded. This partly reflects the effect of ONS revisions to recent
estimates of household saving,15 but also reflects our judgement that consumer spending
will remain subdued in the near term despite upward revisions to our earnings forecast.
Chart 3.22: The household saving ratio
-2
0
2
4
6
8
10
12
14
16
2000 2002 2004 2006 2008 2010 2012 2014 2016 2018 2020 2022 2024
Per ce
nt (
four-
quart
er m
ovi
ng a
vera
ge)
Headline saving ratio
Saving ratio excluding pension equity adjustment
Note: Both series show four-quarter moving averages. The estimate of the saving ratio excluding the pension equity adjustment is calculated as household disposable income less consumption, as a proportion of household disposable income. Source: ONS, OBR
Forecast
The housing market and residential investment
3.64 House price inflation slowed significantly during 2018 – reaching 2.7 per cent in the fourth
quarter, down from 4.6 per cent in the final quarter of 2017 and significantly below the 7.0
per cent average rate recorded in 2016.
3.65 Indicators of housing market activity and price expectations have deteriorated significantly
since our October forecast and are consistent with a further fall in house price inflation. The
Halifax and Nationwide price indices – which are timelier than the ONS measure used in
our forecast – have generally been consistent with a further slowdown. We expect annual
house price inflation to fall to just below zero towards the end of 2019 (Chart 3.23).
3.66 Beyond the near term, we expect house price inflation to pick up as a result of stronger real
household income growth and continued pressure of demand on supply. We expect house
price inflation to reach around 4 per cent a year by the end of the forecast horizon. Overall,
we expect house prices to rise by almost 17 per cent between the fourth quarter of 2018
and the first quarter of 2024 – close to household income growth over the same period.
That compares with forecast growth of nearly 20 per cent in our October forecast.
15 The tendency for recent estimates of the saving ratio to be revised means it is often more informative to look at the change in the saving ratio over the forecast, rather than the level in isolation. See Box 3.4 of our October 2018 EFO for further discussion.
Economic and fiscal outlook 50
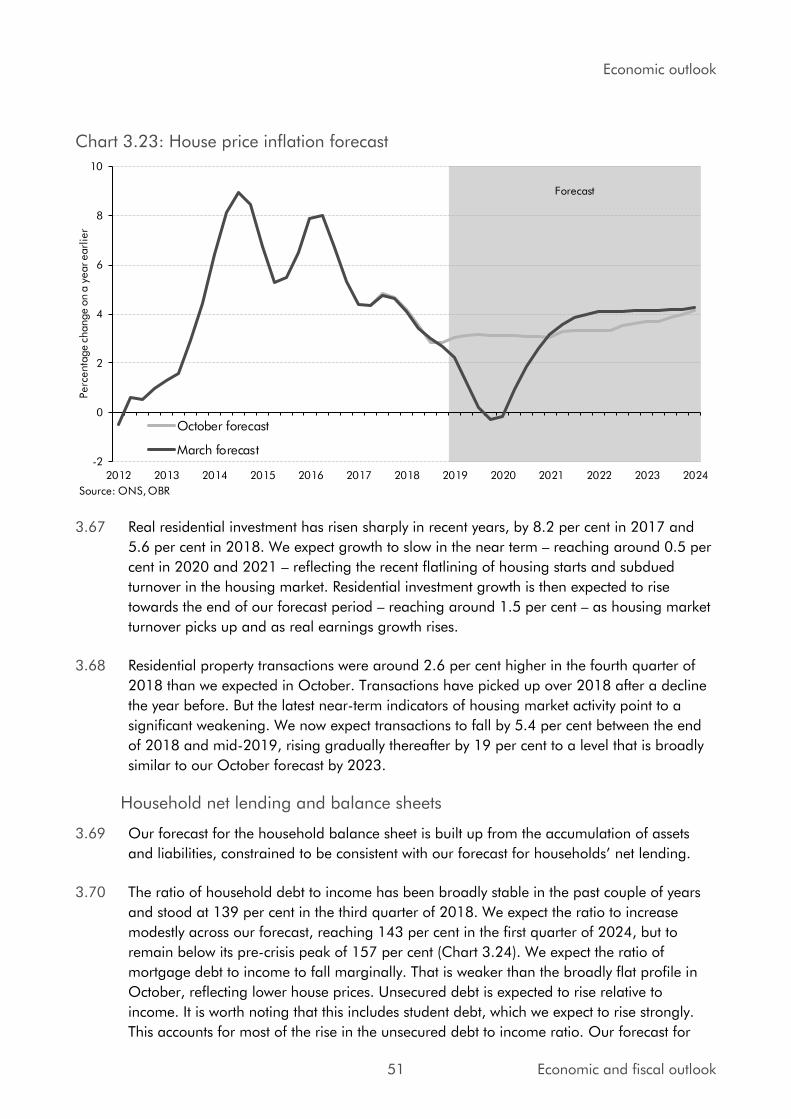
Economic outlook
Chart 3.23: House price inflation forecast
-2
0
2
4
6
8
10
2012 2013 2014 2015 2016 2017 2018 2019 2020 2021 2022 2023 2024
Perc
enta
ge c
hange o
n a
year earl
ier
October forecast
March forecast
Forecast
Source: ONS, OBR
3.67 Real residential investment has risen sharply in recent years, by 8.2 per cent in 2017 and
5.6 per cent in 2018. We expect growth to slow in the near term – reaching around 0.5 per
cent in 2020 and 2021 – reflecting the recent flatlining of housing starts and subdued
turnover in the housing market. Residential investment growth is then expected to rise
towards the end of our forecast period – reaching around 1.5 per cent – as housing market
turnover picks up and as real earnings growth rises.
3.68 Residential property transactions were around 2.6 per cent higher in the fourth quarter of
2018 than we expected in October. Transactions have picked up over 2018 after a decline
the year before. But the latest near-term indicators of housing market activity point to a
significant weakening. We now expect transactions to fall by 5.4 per cent between the end
of 2018 and mid-2019, rising gradually thereafter by 19 per cent to a level that is broadly
similar to our October forecast by 2023.
Household net lending and balance sheets
3.69 Our forecast for the household balance sheet is built up from the accumulation of assets
and liabilities, constrained to be consistent with our forecast for households’ net lending.
3.70 The ratio of household debt to income has been broadly stable in the past couple of years
and stood at 139 per cent in the third quarter of 2018. We expect the ratio to increase
modestly across our forecast, reaching 143 per cent in the first quarter of 2024, but to
remain below its pre-crisis peak of 157 per cent (Chart 3.24). We expect the ratio of
mortgage debt to income to fall marginally. That is weaker than the broadly flat profile in
October, reflecting lower house prices. Unsecured debt is expected to rise relative to
income. It is worth noting that this includes student debt, which we expect to rise strongly.
This accounts for most of the rise in the unsecured debt to income ratio. Our forecast for
51 Economic and fiscal outlook

Economic outlook
Chart 3.24: Household gross debt to income
130
135
140
145
150
155
160
2005 2006 2007 2008 2009 2010 2011 2012 2013 2014 2015 2016 2017 2018 2019 2020 2021 2022 2023 2024
Per ce
nt
October forecast
March forecast
Source: ONS, OBR
Forecast
unsecured debt is lower than in October, consistent with a stronger path for household
income relative to consumption.
The corporate sector
Corporate profits
3.71 Non-oil private non-financial corporation (PNFC) profit growth fell from 6.7 per cent in
2016 to 2.9 per cent in 2017. Annual profit growth then picked up slightly in the first three
quarters of 2018, averaging 3.7 per cent. While non-oil profit data are not yet available for
the fourth quarter of 2018, the high-level income breakdown suggests that corporations’
operating surplus fell back slightly at the end of the year, although early estimates are
particularly uncertain. As output falls below potential, we expect profit growth to be
somewhat weaker than nominal GDP growth up to 2021. From 2022 onwards, we expect
profits to grow broadly in line with nominal GDP.
3.72 Our forecast for financial company profits has been revised down since October. We still
estimate that financial company profits grew faster than the rest of the economy in 2017-
18, but have lowered assumed growth in 2018-19 in light of the recent weakness in
financial company earnings and tax data. From 2020-21 onwards, we assume profit
growth will lag that in the wider economy, reflecting our view that the sector is likely to be
more adversely affected by the UK leaving the EU than the wider economy.
Business investment and stockbuilding
3.73 The latest data suggest business investment fell throughout last year, the first four
consecutive quarterly declines since 2009. The recent weakness suggests that Brexit
Economic and fiscal outlook 52
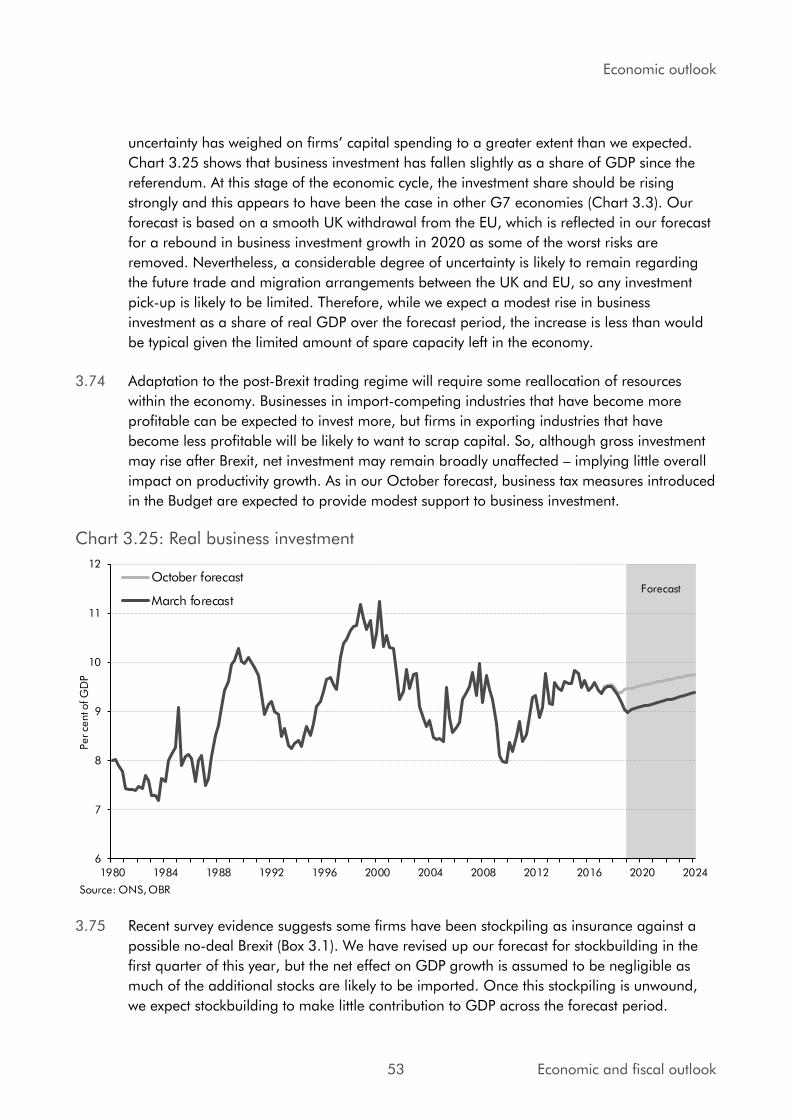
Economic outlook
uncertainty has weighed on firms’ capital spending to a greater extent than we expected.
Chart 3.25 shows that business investment has fallen slightly as a share of GDP since the
referendum. At this stage of the economic cycle, the investment share should be rising
strongly and this appears to have been the case in other G7 economies (Chart 3.3). Our
forecast is based on a smooth UK withdrawal from the EU, which is reflected in our forecast
for a rebound in business investment growth in 2020 as some of the worst risks are
removed. Nevertheless, a considerable degree of uncertainty is likely to remain regarding
the future trade and migration arrangements between the UK and EU, so any investment
pick-up is likely to be limited. Therefore, while we expect a modest rise in business
investment as a share of real GDP over the forecast period, the increase is less than would
be typical given the limited amount of spare capacity left in the economy.
3.74 Adaptation to the post-Brexit trading regime will require some reallocation of resources
within the economy. Businesses in import-competing industries that have become more
profitable can be expected to invest more, but firms in exporting industries that have
become less profitable will be likely to want to scrap capital. So, although gross investment
may rise after Brexit, net investment may remain broadly unaffected – implying little overall
impact on productivity growth. As in our October forecast, business tax measures introduced
in the Budget are expected to provide modest support to business investment.
Chart 3.25: Real business investment
6
7
8
9
10
11
12
1980 1984 1988 1992 1996 2000 2004 2008 2012 2016 2020 2024
Per ce
nt o
f G
DP
October forecast
March forecast
Source: ONS, OBR
Forecast
3.75 Recent survey evidence suggests some firms have been stockpiling as insurance against a
possible no-deal Brexit (Box 3.1). We have revised up our forecast for stockbuilding in the
first quarter of this year, but the net effect on GDP growth is assumed to be negligible as
much of the additional stocks are likely to be imported. Once this stockpiling is unwound,
we expect stockbuilding to make little contribution to GDP across the forecast period.
53 Economic and fiscal outlook
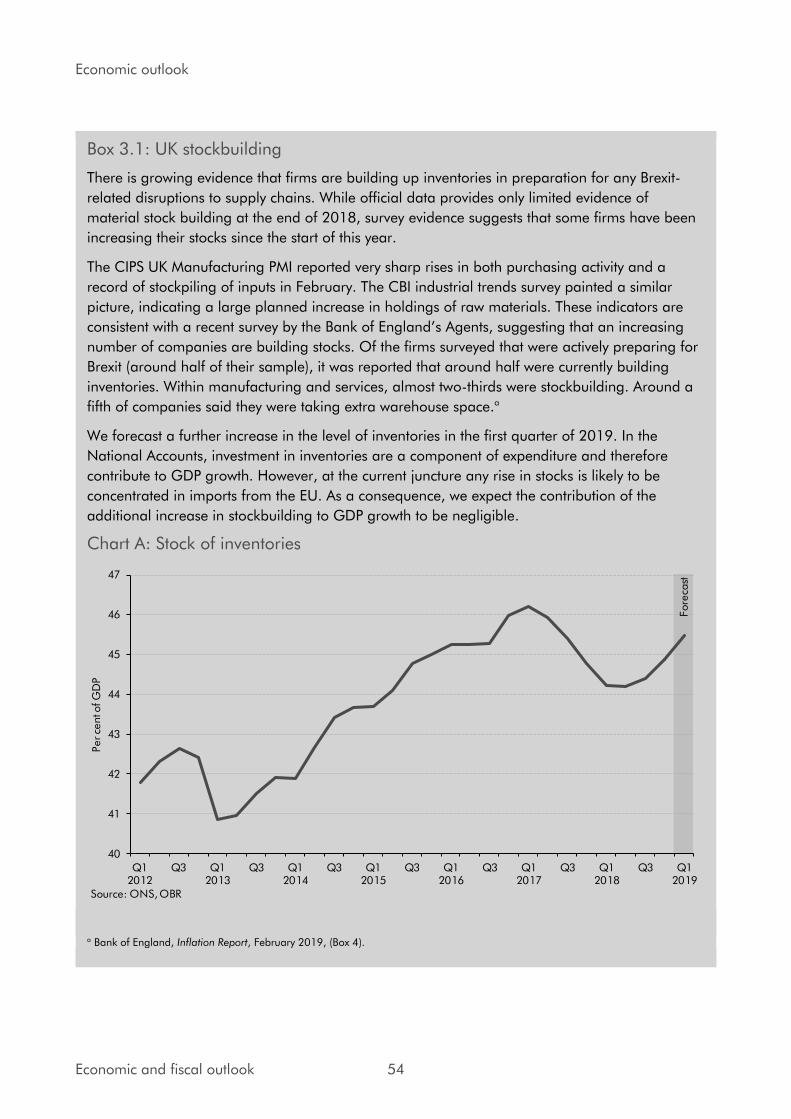
Economic outlook
Box 3.1: UK stockbuilding
There is growing evidence that firms are building up inventories in preparation for any Brexit-
related disruptions to supply chains. While official data provides only limited evidence of
material stock building at the end of 2018, survey evidence suggests that some firms have been
increasing their stocks since the start of this year.
The CIPS UK Manufacturing PMI reported very sharp rises in both purchasing activity and a
record of stockpiling of inputs in February. The CBI industrial trends survey painted a similar
picture, indicating a large planned increase in holdings of raw materials. These indicators are
consistent with a recent survey by the Bank of England’s Agents, suggesting that an increasing
number of companies are building stocks. Of the firms surveyed that were actively preparing for
Brexit (around half of their sample), it was reported that around half were currently building
inventories. Within manufacturing and services, almost two-thirds were stockbuilding. Around a
fifth of companies said they were taking extra warehouse space.a
We forecast a further increase in the level of inventories in the first quarter of 2019. In the
National Accounts, investment in inventories are a component of expenditure and therefore
contribute to GDP growth. However, at the current juncture any rise in stocks is likely to be
concentrated in imports from the EU. As a consequence, we expect the contribution of the
additional increase in stockbuilding to GDP growth to be negligible.
Chart A: Stock of inventories
40
41
42
43
44
45
46
47
Q12012
Q3 Q12013
Q3 Q12014
Q3 Q12015
Q3 Q12016
Q3 Q12017
Q3 Q12018
Q3 Q12019
Per ce
nt o
f G
DP
Source: ONS, OBR
Fore
cast
a Bank of England, Inflation Report, February 2019, (Box 4).
Economic and fiscal outlook 54
Economic outlook
Commercial property
3.76 Commercial property price inflation is expected to recover in 2018-19, after falls in prices in
both 2016-17 and 2017-18. In line with the latest consensus outlook from the IPF,16 prices
are still expected to fall in 2019-20 and 2020-21 before recovering. Our commercial
property transactions forecast is stronger for 2018-19 than it was in October, reflecting the
latest outturn data from HMRC, but it is little changed thereafter.
The government sector
Government consumption
3.77 Nominal government consumption grew by 2.8 per cent in 2018, up from 2.0 per cent in
2017. Outturn data and the Government’s fiscal plans imply growth of more than 3 per
cent a year through the remainder of the forecast, supported by the large increase in NHS
spending growth announced last year.
3.78 Real government consumption grew by 0.2 per cent in 2018, following a fall of 0.2 per cent
in 2017. Taking account of the way the ONS measures government consumption, for any
given forecast for nominal growth we assume that roughly half will be reflected in real
growth and half in the implicit deflator. On this basis, real government consumption is
expected to grow by 2.1 per cent in 2019 and then between 1.6 and 1.8 per cent a year
across the rest of the forecast period.
Government investment
3.79 Nominal government investment grew by 2.9 per cent in 2018, down from 5.7 per cent in
2017. Outturn data and the Government’s fiscal plans imply a sharp pick-up to over 9 per
cent in 2019. The fiscal plans then imply growth slows to 4.1 per cent in 2020 and is then
between 2 and 4 per cent a year over the rest of the forecast. We assume the general
government investment deflator grows broadly in line with its historical average since 1998.
General government employment
3.80 In the absence of specific workforce plans, we project general government employment
based on a few simple assumptions. We begin by assuming that the total paybill will grow
in line with a relevant measure of current government spending. We then forecast
government sector wage growth, taking account of recent data, stated government policy
and private sector earnings growth. We then combine the two to derive an implied
projection for general government employment.
3.81 Following the lifting of the 1 per cent cap on public sector pay rises in 2018-19, we assume
that general government earnings growth will rise so that it broadly matches private sector
average earnings growth in 2020. This implies general government employment will rise by
a cumulative 110,000 between the third quarter of 2018 and the first quarter of 2024. This
rise is similar to our October forecast.
16 Investment property forum UK consensus forecast, Autumn 2018. Since we closed our pre-measures forecast, the IPF released a subsequent consensus forecast covering the winter period. We will incorporate this into our next forecast in the autumn.
55 Economic and fiscal outlook

Economic outlook
The external sector
The impact of the EU referendum result on trade flows
3.82 As explained in paragraph 3.6, the sharp fall in sterling following the referendum appears
to have provided even less support to net trade than the small amount we expected. The
depreciation has resulted in a large rise in sterling export prices which has boosted
exporters’ profitability. But exporters appear to have been reluctant to expand production to
take advantage of this, presumably in part due to uncertainty around the future trading
relationship with the EU and other countries that the EU currently has trade agreements
with. Resolution of this uncertainty could boost exports in the near term, but the effect would
probably be outweighed by the impact of increased barriers to trade with the EU and those
non-EU countries with trading agreements with the EU that are not rolled over.
3.83 We continue to assume that leaving the EU will result in a lower trade intensity of UK
economic activity. But with no meaningful basis on which to predict the eventual trading
relationship with other countries, we have not made any assumptions in respect of the
specific arrangements in place after the transition period ends. Instead, we calibrated the
trade effect of leaving the EU by averaging the results of three major external studies.17 We
assume that the full effect will take a decade to be felt and that it will reduce exports and
imports symmetrically so that the effect on net trade will be broadly neutral.
Net trade
3.84 Export volumes grew by 0.2 per cent in 2018, significantly less than the 5.6 per cent seen
the previous year. The fall was partly due to lower growth in the UK’s export markets. Import
volumes increased by 0.8 per cent in 2018, down from 3.5 per cent in 2017. Net trade is
estimated to have reduced GDP growth by 0.2 percentage points in 2018, having increased
it by 0.5 percentage points the previous year. The trade data are extremely volatile, prone to
substantial revision and currently not accorded National Statistic status, so it is unwise to
place too much weight on any particular vintage of data.
3.85 Following the weakness in 2018, we expect export volumes growth to pick up to around 1.5
per cent in 2019 and 2020. Export growth is expected to slow thereafter, as the transition
period comes to an end and increased trade barriers weigh on the UK’s export market
share. We also expect import growth to pick up to around 3 per cent in 2019. That is mostly
a consequence of the rise in import-weighted domestic demand growth, partly reflecting the
heavy stockbuilding in the first quarter. We then expect import growth to flatten off by the
end of the forecast period as Brexit holds back import penetration.
3.86 Overall, we expect net trade to drag on GDP growth over the forecast period (Chart 3.26).
Relative to October, we have revised down the near-term contribution of net trade to GDP
growth, reflecting weaker prospects in the UK’s main export markets.
17 Specifically, we have taken the average estimated effect from studies by NIESR (The long-term economic impact of leaving the EU, National Institute Economic Review no. 236, May 2016), the OECD (The economic consequences of Brexit: A taxing decision, OECD policy paper no. 16, April 2016) and LSE/CEP (The consequences of Brexit for UK trade and living standards, March 2016). These represent a subset of the many studies that were presented before the referendum.
Economic and fiscal outlook 56
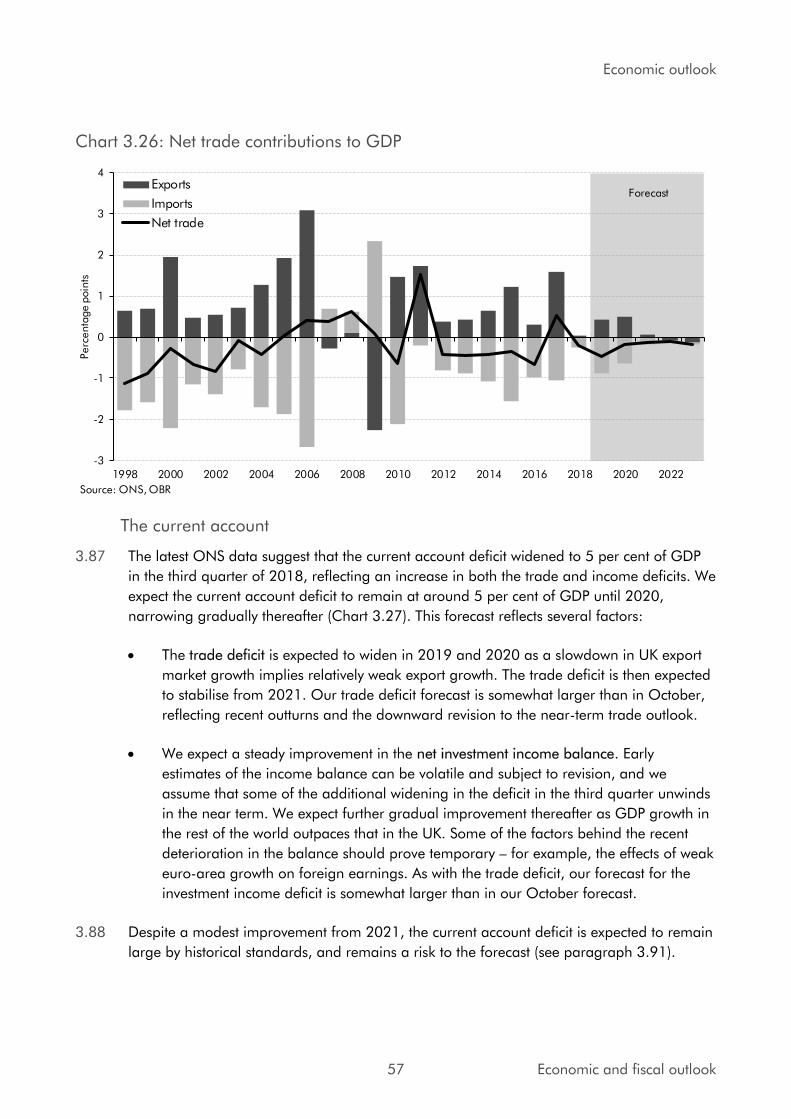
Economic outlook
Chart 3.26: Net trade contributions to GDP
-3
-2
-1
0
1
2
3
4
1998 2000 2002 2004 2006 2008 2010 2012 2014 2016 2018 2020 2022
Perc
enta
ge p
oin
ts
Exports
Imports
Net trade
Source: ONS, OBR
Forecast
The current account
3.87 The latest ONS data suggest that the current account deficit widened to 5 per cent of GDP
in the third quarter of 2018, reflecting an increase in both the trade and income deficits. We
expect the current account deficit to remain at around 5 per cent of GDP until 2020,
narrowing gradually thereafter (Chart 3.27). This forecast reflects several factors:
• The trade deficit is expected to widen in 2019 and 2020 as a slowdown in UK export
market growth implies relatively weak export growth. The trade deficit is then expected
to stabilise from 2021. Our trade deficit forecast is somewhat larger than in October,
reflecting recent outturns and the downward revision to the near-term trade outlook.
• We expect a steady improvement in the net investment income balance. Early
estimates of the income balance can be volatile and subject to revision, and we
assume that some of the additional widening in the deficit in the third quarter unwinds
in the near term. We expect further gradual improvement thereafter as GDP growth in
the rest of the world outpaces that in the UK. Some of the factors behind the recent
deterioration in the balance should prove temporary – for example, the effects of weak
euro-area growth on foreign earnings. As with the trade deficit, our forecast for the
investment income deficit is somewhat larger than in our October forecast.
3.88 Despite a modest improvement from 2021, the current account deficit is expected to remain
large by historical standards, and remains a risk to the forecast (see paragraph 3.91).
57 Economic and fiscal outlook
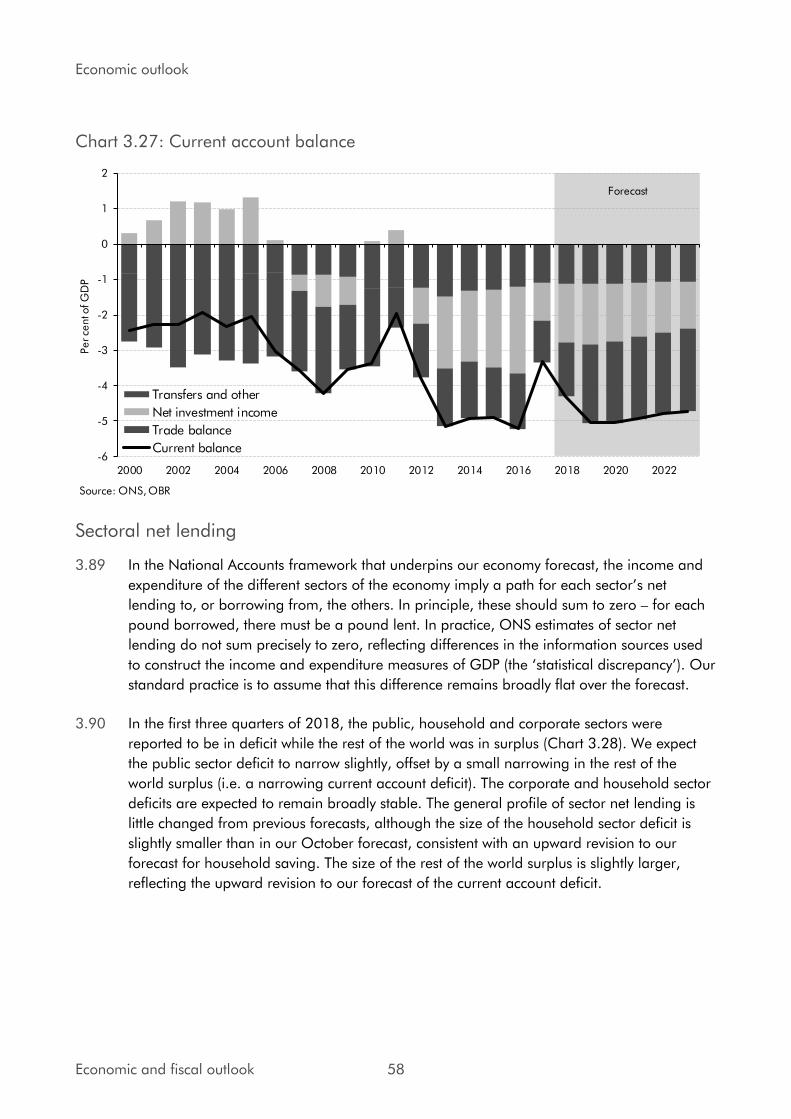
Economic outlook
Chart 3.27: Current account balance
-6
-5
-4
-3
-2
-1
0
1
2
2000 2002 2004 2006 2008 2010 2012 2014 2016 2018 2020 2022
Per ce
nt o
f G
DP
Transfers and other
Net investment income
Trade balance
Current balance
Source: ONS, OBR
Forecast
Sectoral net lending
3.89 In the National Accounts framework that underpins our economy forecast, the income and
expenditure of the different sectors of the economy imply a path for each sector’s net
lending to, or borrowing from, the others. In principle, these should sum to zero – for each
pound borrowed, there must be a pound lent. In practice, ONS estimates of sector net
lending do not sum precisely to zero, reflecting differences in the information sources used
to construct the income and expenditure measures of GDP (the ‘statistical discrepancy’). Our standard practice is to assume that this difference remains broadly flat over the forecast.
3.90 In the first three quarters of 2018, the public, household and corporate sectors were
reported to be in deficit while the rest of the world was in surplus (Chart 3.28). We expect
the public sector deficit to narrow slightly, offset by a small narrowing in the rest of the
world surplus (i.e. a narrowing current account deficit). The corporate and household sector
deficits are expected to remain broadly stable. The general profile of sector net lending is
little changed from previous forecasts, although the size of the household sector deficit is
slightly smaller than in our October forecast, consistent with an upward revision to our
forecast for household saving. The size of the rest of the world surplus is slightly larger,
reflecting the upward revision to our forecast of the current account deficit.
Economic and fiscal outlook 58
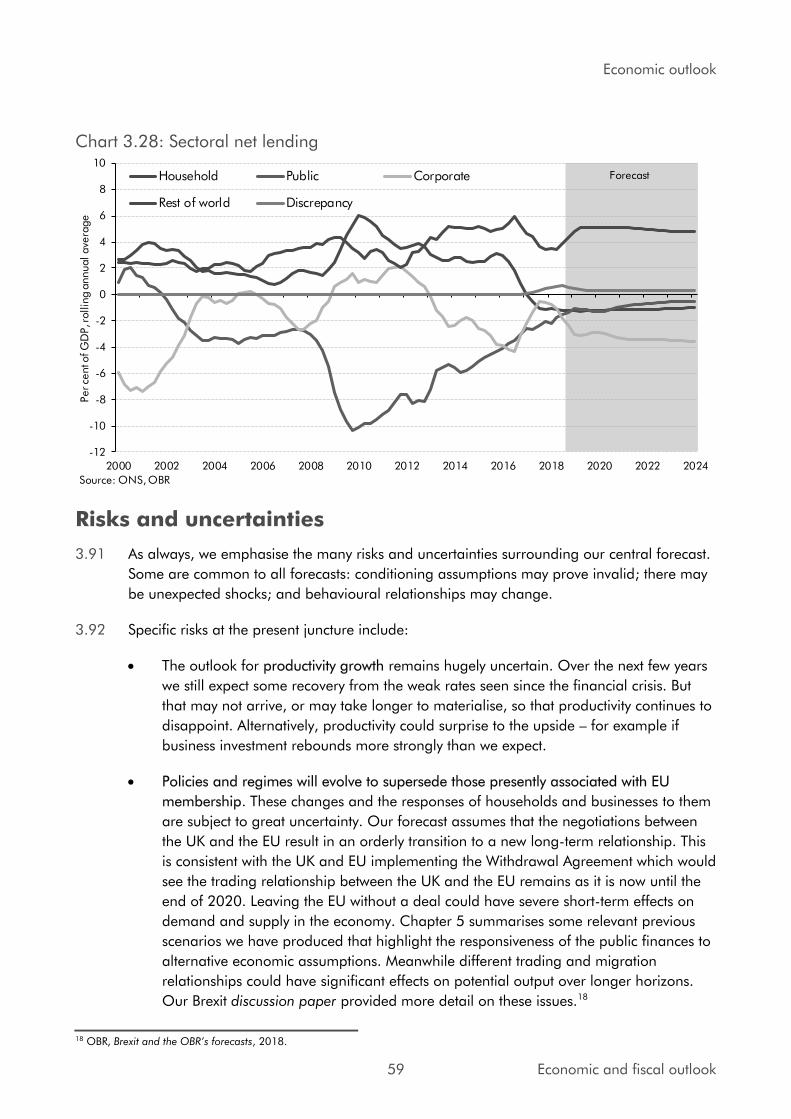
Economic outlook
Chart 3.28: Sectoral net lending
-12
-10
-8
-6
-4
-2
0
2
4
6
8
10
2000 2002 2004 2006 2008 2010 2012 2014 2016 2018 2020 2022 2024
Per ce
nt o
f G
DP, r
ollin
g a
nnual ave
rage
Household Public Corporate
Rest of world Discrepancy
Forecast
Source: ONS, OBR
Risks and uncertainties
3.91 As always, we emphasise the many risks and uncertainties surrounding our central forecast.
Some are common to all forecasts: conditioning assumptions may prove invalid; there may
be unexpected shocks; and behavioural relationships may change.
3.92 Specific risks at the present juncture include:
• The outlook for productivity growth remains hugely uncertain. Over the next few years
we still expect some recovery from the weak rates seen since the financial crisis. But
that may not arrive, or may take longer to materialise, so that productivity continues to
disappoint. Alternatively, productivity could surprise to the upside – for example if
business investment rebounds more strongly than we expect.
• Policies and regimes will evolve to supersede those presently associated with EU
membership. These changes and the responses of households and businesses to them
are subject to great uncertainty. Our forecast assumes that the negotiations between
the UK and the EU result in an orderly transition to a new long-term relationship. This
is consistent with the UK and EU implementing the Withdrawal Agreement which would
see the trading relationship between the UK and the EU remains as it is now until the
end of 2020. Leaving the EU without a deal could have severe short-term effects on
demand and supply in the economy. Chapter 5 summarises some relevant previous
scenarios we have produced that highlight the responsiveness of the public finances to
alternative economic assumptions. Meanwhile different trading and migration
relationships could have significant effects on potential output over longer horizons.
Our Brexit discussion paper provided more detail on these issues.18
18 OBR, Brexit and the OBR’s forecasts, 2018.
59 Economic and fiscal outlook
Economic outlook
• We base our forecasts on several assumptions, including a path for interest rates that
follows market expectations. However, market participants are likely to have attached
a non-zero probability to a disorderly Brexit, whereas our central forecast assumes an
orderly transition. If that is the case, interest rate expectations could rise if and when
the possibility of a disorderly Brexit is removed. That would also have consequences for
debt interest costs (discussed in Chapter 4), as well as other asset prices (including
sterling) and thus output and inflation.
• The household saving ratio has fallen over recent years as private consumption growth
has outpaced income growth. We expect the saving ratio to remain low but stable
across the forecast. But an adverse shock could trigger an upwards adjustment as
households increase their precautionary saving in response to expectations of rising
unemployment. This would amplify the effects of the slowdown.
• There may be less labour market slack than we assume, for example if the equilibrium
unemployment rate is higher than our current assumption. In this event, wage growth
may be stronger than we expect.
• Global trade tensions remain high, after the US imposed tariffs on some imports
causing retaliatory measures from several of its trading partners. Further tariff
increases have been delayed but an escalation of trade tensions remains possible if a
resolution cannot be found. In its January WEO update, for instance, the IMF
suggested that the medium-term risks to the global economy were skewed to the
downside, reflecting the ongoing trade tensions, the risk of a deterioration in financial
market sentiment, and high levels of public and private debt.
• The UK’s current account deficit remains large as a share of GDP by historical
standards and is expected to remain so over the forecast period. Overseas investors
are consequently significant net lenders to the UK, which could pose risks if their
confidence in the UK economy were to be damaged by uncertainty regarding the
economic and political outlook – including if there were a disorderly Brexit. That could
lead to a sharp fall in sterling, bringing about a more abrupt demand-led narrowing
of the current account deficit and a subsequent spike in inflation. But while the current
account deficit remains large, it is worth noting that the UK’s net international
investment liabilities are modest as a share of GDP, mitigating this risk somewhat.
• In the 63 years for which the ONS has published consistent quarterly real GDP data,
there have been seven recessions – suggesting that the chance of a recession in any
five-year period is around one in two.19 So, the probability of a cyclical downturn
occurring sometime over our forecast horizon is fairly high.
19 See Chapter 3 our 2017 Fiscal risks report for more details.
Economic and fiscal outlook 60
Economic outlook
Comparison with external forecasters
3.93 In this section, we compare our latest projections with those of selected outside forecasters.
The differences between our forecast and those of external forecasters are generally small
compared with the uncertainty that surrounds any one of them.
Comparison with the Bank of England’s Inflation Report forecast
3.94 Alongside the February 2019 Inflation Report, the Bank of England published additional
information about its forecast that can be compared against our own (Table 3.6). This
included the Bank staff’s forecasts for the expenditure composition of GDP, consistent with the MPC’s central forecasts for GDP, CPI inflation and the unemployment rate.
3.95 The MPC’s modal forecast for GDP growth in 2019 is 1.2 per cent, the same as our central
forecast. This represents a downward revision from their November projection, driven by
softer global demand and the expectation of continued weak business investment in the first
half of this year. In the medium term, the Bank is a little more optimistic than we are
regarding the UK’s economic prospects. The MPC’s real GDP growth forecasts for 2020 and 2021 are 1.5 and 1.9 per cent respectively, 0.1 and 0.3 percentage points higher than
our central forecast. The Bank forecasts a similar unemployment rate but stronger average
earnings growth, despite a more pessimistic outlook for productivity.
3.96 By expenditure composition component, the Bank expects stronger consumption growth in
2019, but weaker business investment growth. It also expects a small negative contribution
from net trade to GDP growth in 2019, mainly due to subdued external demand weighing
on export growth. The Bank also expects a near-term boost to imports from stockbuilding.
61 Economic and fiscal outlook
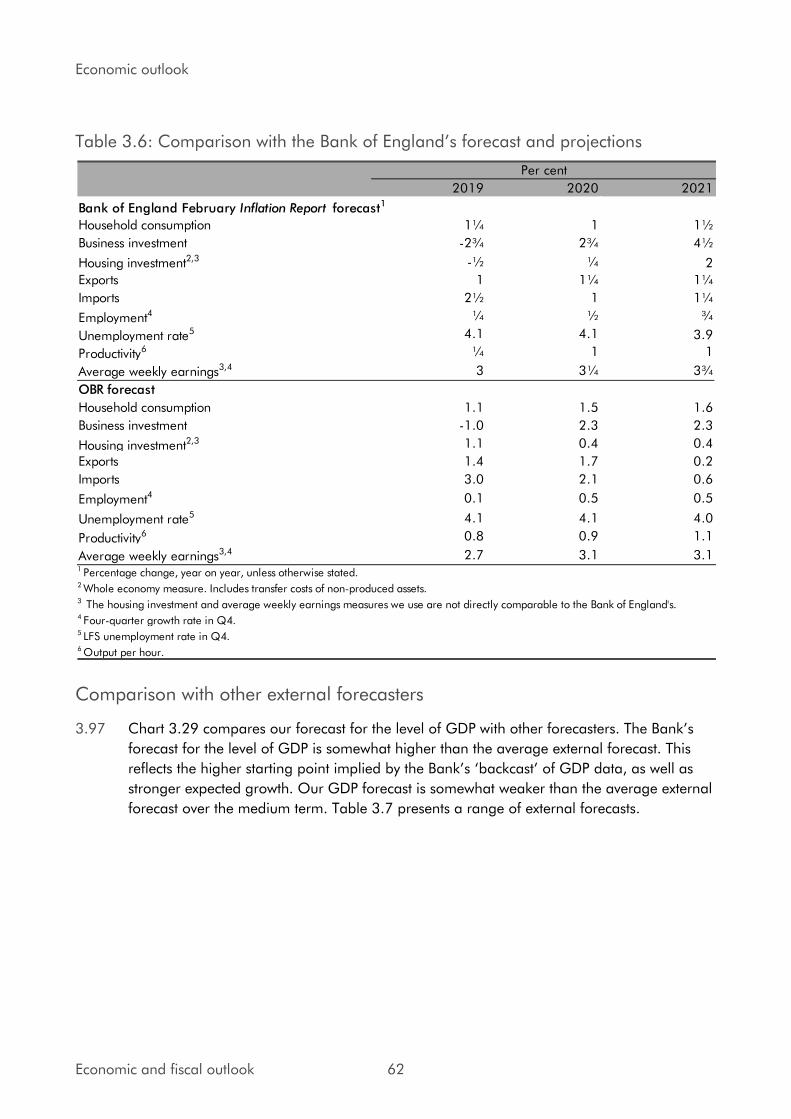
Economic outlook
Table 3.6: Comparison with the Bank of England’s forecast and projections
2019 2020 2021
Bank of England February Inflation Report forecast1
Household consumption 1¼ 1 1½
Business investment -2¾ 2¾ 4½
Housing investment2,3 -½ ¼ 2
Exports 1 1¼ 1¼
Imports 2½ 1 1¼
Employment4 ¼ ½ ¾
Unemployment rate5 4.1 4.1 3.9
Productivity6 ¼ 1 1
Average weekly earnings3,4 3 3¼ 3¾
OBR forecast
Household consumption 1.1 1.5 1.6
Business investment -1.0 2.3 2.3
Housing investment2,3 1.1 0.4 0.4
Exports 1.4 1.7 0.2
Imports 3.0 2.1 0.6
Employment4 0.1 0.5 0.5
Unemployment rate5 4.1 4.1 4.0
Productivity6 0.8 0.9 1.1
Average weekly earnings3,4 2.7 3.1 3.1
Per cent
5 LFS unemployment rate in Q4.6 Output per hour.
1 Percentage change, year on year, unless otherwise stated.2 Whole economy measure. Includes transfer costs of non-produced assets.3 The housing investment and average weekly earnings measures we use are not directly comparable to the Bank of England's.4 Four-quarter growth rate in Q4.
Comparison with other external forecasters
3.97 Chart 3.29 compares our forecast for the level of GDP with other forecasters. The Bank’s forecast for the level of GDP is somewhat higher than the average external forecast. This
reflects the higher starting point implied by the Bank’s ‘backcast’ of GDP data, as well as
stronger expected growth. Our GDP forecast is somewhat weaker than the average external
forecast over the medium term. Table 3.7 presents a range of external forecasts.
Economic and fiscal outlook 62

Economic outlook
Chart 3.29: External forecasters GDP comparison
100
102
104
106
108
110
112
114
116
118
120
122
2013 2014 2015 2016 2017 2018 2019 2020 2021 2022 2023
2013 =
100
Bank of England
Consensus
OBR
Source: Bank of England, HM Treasury, ONS, OBR
Forecast
63 Economic and fiscal outlook
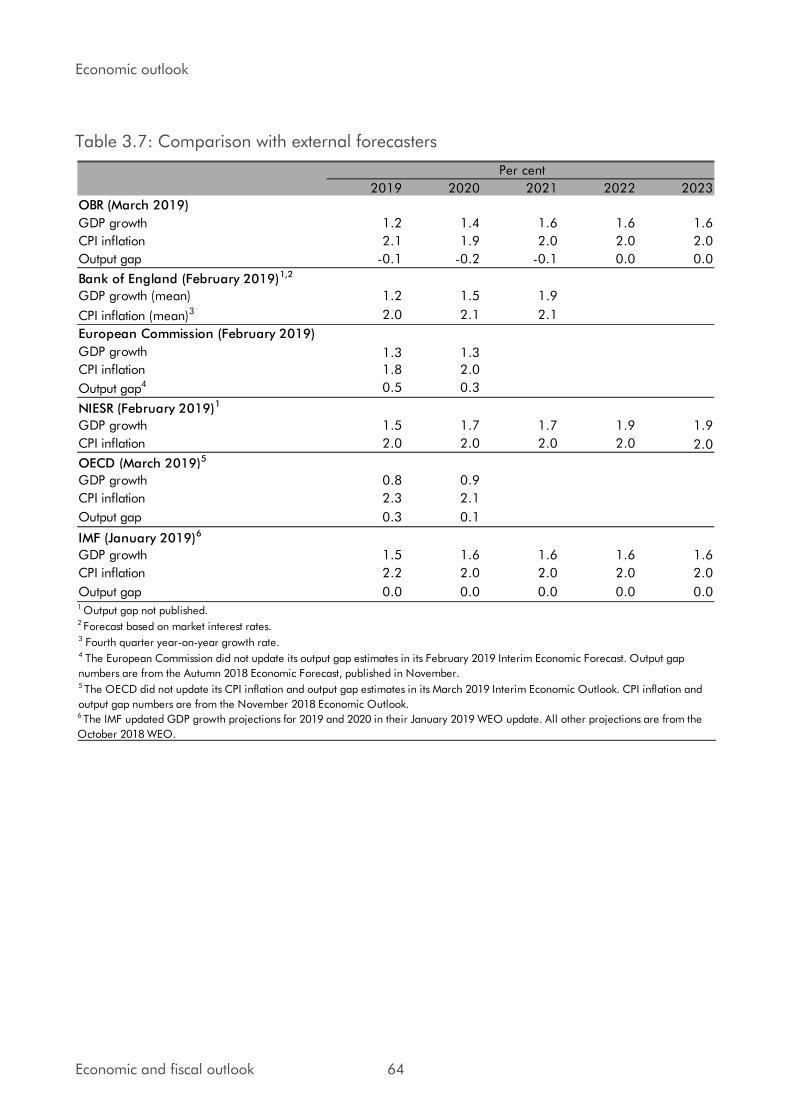
Economic outlook
Table 3.7: Comparison with external forecasters
2019 2020 2021 2022 2023
OBR (March 2019)
GDP growth 1.2 1.4 1.6 1.6 1.6
CPI inflation 2.1 1.9 2.0 2.0 2.0
Output gap -0.1 -0.2 -0.1 0.0 0.0
Bank of England (February 2019)1,2
GDP growth (mean) 1.2 1.5 1.9
CPI inflation (mean)3 2.0 2.1 2.1
European Commission (February 2019)
GDP growth 1.3 1.3
CPI inflation 1.8 2.0
Output gap4 0.5 0.3
NIESR (February 2019)1
GDP growth 1.5 1.7 1.7 1.9 1.9
CPI inflation 2.0 2.0 2.0 2.0 2.0
OECD (March 2019)5
GDP growth 0.8 0.9
CPI inflation 2.3 2.1
Output gap 0.3 0.1
IMF (January 2019)6
GDP growth 1.5 1.6 1.6 1.6 1.6
CPI inflation 2.2 2.0 2.0 2.0 2.0
Output gap 0.0 0.0 0.0 0.0 0.0
6 The IMF updated GDP growth projections for 2019 and 2020 in their January 2019 WEO update. All other projections are from the
October 2018 WEO.
Per cent
2 Forecast based on market interest rates.3 Fourth quarter year-on-year growth rate.4 The European Commission did not update its output gap estimates in its February 2019 Interim Economic Forecast. Output gap
numbers are from the Autumn 2018 Economic Forecast, published in November.
1 Output gap not published.
5 The OECD did not update its CPI inflation and output gap estimates in its March 2019 Interim Economic Outlook. CPI inflation and
output gap numbers are from the November 2018 Economic Outlook.
Economic and fiscal outlook 64
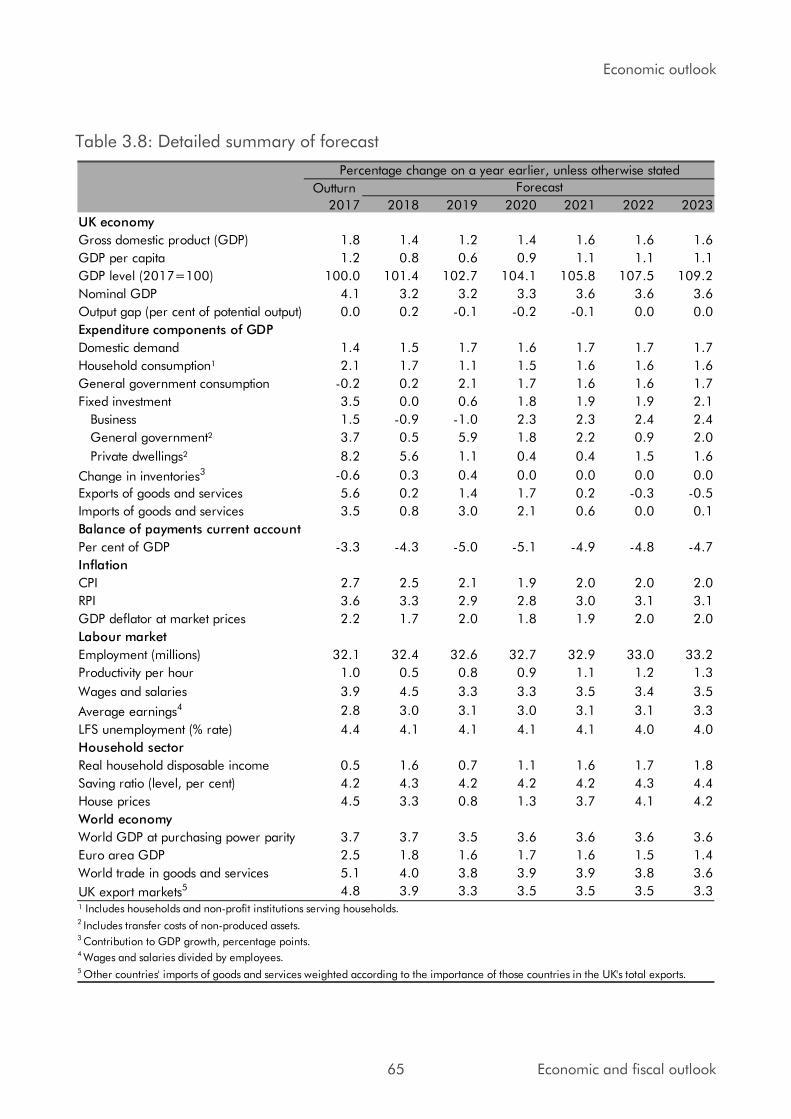
Economic outlook
Table 3.8: Detailed summary of forecast
Outturn
2017 2018 2019 2020 2021 2022 2023
UK economy
Gross domestic product (GDP) 1.8 1.4 1.2 1.4 1.6 1.6 1.6
GDP per capita 1.2 0.8 0.6 0.9 1.1 1.1 1.1
GDP level (2017=100) 100.0 101.4 102.7 104.1 105.8 107.5 109.2
Nominal GDP 4.1 3.2 3.2 3.3 3.6 3.6 3.6
Output gap (per cent of potential output) 0.0 0.2 -0.1 -0.2 -0.1 0.0 0.0
Expenditure components of GDP
Domestic demand 1.4 1.5 1.7 1.6 1.7 1.7 1.7
Household consumption¹ 2.1 1.7 1.1 1.5 1.6 1.6 1.6
General government consumption -0.2 0.2 2.1 1.7 1.6 1.6 1.7
Fixed investment 3.5 0.0 0.6 1.8 1.9 1.9 2.1
Business 1.5 -0.9 -1.0 2.3 2.3 2.4 2.4
General government² 3.7 0.5 5.9 1.8 2.2 0.9 2.0
Private dwellings² 8.2 5.6 1.1 0.4 0.4 1.5 1.6
Change in inventories3 -0.6 0.3 0.4 0.0 0.0 0.0 0.0
Exports of goods and services 5.6 0.2 1.4 1.7 0.2 -0.3 -0.5
Imports of goods and services 3.5 0.8 3.0 2.1 0.6 0.0 0.1
Balance of payments current account
Per cent of GDP -3.3 -4.3 -5.0 -5.1 -4.9 -4.8 -4.7
Inflation
CPI 2.7 2.5 2.1 1.9 2.0 2.0 2.0
RPI 3.6 3.3 2.9 2.8 3.0 3.1 3.1
GDP deflator at market prices 2.2 1.7 2.0 1.8 1.9 2.0 2.0
Labour market
Employment (millions) 32.1 32.4 32.6 32.7 32.9 33.0 33.2
Productivity per hour 1.0 0.5 0.8 0.9 1.1 1.2 1.3
Wages and salaries 3.9 4.5 3.3 3.3 3.5 3.4 3.5
Average earnings4 2.8 3.0 3.1 3.0 3.1 3.1 3.3
LFS unemployment (% rate) 4.4 4.1 4.1 4.1 4.1 4.0 4.0
Household sector
Real household disposable income 0.5 1.6 0.7 1.1 1.6 1.7 1.8
Saving ratio (level, per cent) 4.2 4.3 4.2 4.2 4.2 4.3 4.4
House prices 4.5 3.3 0.8 1.3 3.7 4.1 4.2
World economy
World GDP at purchasing power parity 3.7 3.7 3.5 3.6 3.6 3.6 3.6
Euro area GDP 2.5 1.8 1.6 1.7 1.6 1.5 1.4
World trade in goods and services 5.1 4.0 3.8 3.9 3.9 3.8 3.6
UK export markets5 4.8 3.9 3.3 3.5 3.5 3.5 3.3
4 Wages and salaries divided by employees.5 Other countries' imports of goods and services weighted according to the importance of those countries in the UK's total exports.
Percentage change on a year earlier, unless otherwise stated
¹ Includes households and non-profit institutions serving households.2 Includes transfer costs of non-produced assets.3 Contribution to GDP growth, percentage points.
Forecast
65 Economic and fiscal outlook

Economic outlook
Table 3.9: Detailed summary of changes to the forecast
Outturn
2017 2018 2019 2020 2021 2022 2023
UK economy
Gross domestic product (GDP) 0.1 0.1 -0.4 0.0 0.1 0.1 0.0
GDP per capita 0.1 0.1 -0.4 0.0 0.1 0.1 0.0
GDP level (2017=100)1 0.0 0.1 -0.2 -0.2 -0.1 0.0 0.1
Nominal GDP 0.3 0.0 -0.2 -0.1 0.1 0.1 0.1
Output gap (per cent of potential output) 0.0 0.0 -0.4 -0.4 -0.2 -0.1 -0.1
Expenditure components of GDP
Domestic demand 0.1 0.4 -0.1 0.1 0.3 0.1 0.1
Household consumption2 0.3 0.4 -0.1 0.3 0.3 0.2 0.1
General government consumption -0.1 -0.8 0.0 -0.3 -0.1 0.0 0.1
Fixed investment 0.2 -1.0 -2.3 0.0 0.1 -0.1 0.1
Business -0.2 -1.4 -3.2 0.2 0.3 0.3 0.2
General government3 2.0 0.7 0.3 -1.5 0.4 0.1 0.6
Private dwellings3 0.1 -1.4 -1.9 0.4 -0.4 -0.8 -0.3
Change in inventories4 -0.1 0.5 0.4 0.0 0.1 0.0 0.0
Exports of goods and services -0.1 -1.2 -0.9 -0.4 -0.3 0.0 -0.1
Imports of goods and services 0.3 0.2 0.2 -0.1 0.2 0.1 0.0
Balance of payments current account
Per cent of GDP 0.4 -0.8 -1.3 -1.4 -1.5 -1.5 -1.5
Inflation
CPI 0.0 -0.1 0.0 -0.1 -0.1 -0.1 0.0
RPI 0.0 -0.1 -0.2 -0.3 -0.1 0.0 0.0
GDP deflator at market prices 0.1 -0.1 0.3 -0.1 0.0 0.0 0.1
Labour market
Employment (millions) 0.0 0.0 -0.1 -0.1 -0.1 -0.1 0.0
Productivity per hour 0.2 -0.3 0.0 0.1 0.1 0.1 0.1
Wages and salaries 0.0 0.4 0.1 0.1 0.3 0.1 0.1
Average earnings5 0.0 0.4 0.6 0.2 0.2 0.0 0.0
LFS unemployment (% rate) 0.0 0.1 0.4 0.3 0.2 0.1 0.0
Household sector
Real household disposable income 0.6 0.9 0.1 0.3 0.3 0.3 0.2
Saving ratio (level, per cent) -0.3 0.2 0.2 0.2 0.2 0.3 0.4
House prices 0.0 -0.1 -2.3 -1.8 0.4 0.7 0.4
World economy
World GDP at purchasing power parity 0.0 -0.1 -0.1 -0.1 0.0 0.0 0.0
Euro area GDP 0.0 -0.2 -0.3 0.0 0.0 0.0 0.0
World trade in goods and services 0.1 -0.1 -0.2 -0.2 -0.1 0.0 0.0
UK export markets6 0.3 -0.2 -0.4 -0.4 -0.2 0.0 -0.11 Per cent change since October.2 Includes households and non-profit institutions serving households.3 Includes transfer costs of non-produced assets.4 Contribution to GDP growth, percentage points.5 Wages and salaries divided by employees.
Percentage change on a year earlier, unless otherwise stated
Forecast
6 Other countries' imports of goods and services weighted according to the importance of those countries in the UK's total exports.
Economic and fiscal outlook 66

Economic outlook
Table 3.10: Determinants of the fiscal forecast 195 45 45 45 45 45
Outturn
2017-18 2018-19 2019-20 2020-21 2021-22 2022-23 2023-24
GDP and its components
Real GDP 1.7 1.4 1.2 1.5 1.6 1.6 1.6 9.3
Nominal GDP1 3.9 3.1 3.2 3.4 3.5 3.6 3.6 22.3
Nominal GDP (£ billion)1,2 2067 2131 2200 2275 2355 2440 2529 462
Nominal GDP (centred end-March £bn)1,3 2100 2165 2236 2314 2397 2483 2574 473
Wages and salaries4 4.0 4.1 3.1 3.5 3.5 3.4 3.5 23.2
Non-oil PNFC profits4,5 2.9 2.9 2.2 3.0 3.3 3.6 3.6 20.1
Consumer spending4,5 4.2 3.9 3.2 3.4 3.7 3.7 3.7 23.6
Prices and earnings
GDP deflator 1.9 1.8 2.0 1.8 1.9 2.0 2.0 12.1
RPI 3.7 3.1 2.9 2.8 3.1 3.1 3.1 19.5
CPI 2.8 2.3 2.0 1.9 2.0 2.0 2.0 12.8
Average earnings6 2.7 2.9 3.0 3.1 3.1 3.2 3.3 20.0
'Triple-lock' guarantee (September) 3.0 2.6 3.5 2.9 3.1 3.1 3.2 19.9
Key fiscal determinants
Employment (millions) 32.2 32.5 32.6 32.8 32.9 33.1 33.2 1.0
Output gap (per cent of potential output) 0.1 0.2 -0.1 -0.2 -0.1 0.0 0.0 -0.1
Financial and property sectors
Equity prices (FTSE All-Share index) 4059 4002 3930 4063 4208 4359 4517 459
HMRC financial sector profits1,5,8 10.0 3.2 3.1 1.7 1.8 1.8 1.8 14.1
Residential property prices9 4.5 2.8 0.2 2.2 3.9 4.1 4.2 18.7
Residential property transactions (000s)10 1208 1194 1180 1247 1291 1328 1362 154
Commercial property prices10 -7.0 3.6 -1.6 -0.9 1.9 2.0 2.0 7.1
Commercial property transactions10 -0.8 -1.4 1.2 1.5 1.6 1.6 1.6 6.2
Oil and gas
Oil prices ($ per barrel)5 54.6 71.3 62.1 61.6 62.0 63.3 64.5 9.9
Oil prices (£ per barrel)5 42.4 53.4 47.7 46.5 46.3 46.7 47.1 4.7
Gas prices (p/therm)5 44.9 60.7 50.5 53.1 54.1 55.2 56.3 11.3
Oil production (million tonnes)5 46.6 47.3 48.4 48.4 46.0 43.7 41.5 -5.1
Gas production (billion therms)5 14.2 13.7 13.7 13.3 12.7 12.0 11.4 -2.8
Interest rates and exchange rates
Market short-term interest rates (%)11 0.4 0.8 0.9 1.1 1.2 1.3 1.3 0.9
Market gilt rates (%)12 1.3 1.4 1.3 1.4 1.5 1.6 1.7 0.4
Euro/Sterling exchange rate (€/£) 1.13 1.13 1.13 1.12 1.11 1.09 1.08 -0.051 Non-seasonally adjusted.2 Denominator for receipts, spending and deficit
forecasts as a per cent of GDP. 3 Denominator for net debt as a per cent of GDP.4 Nominal. 5 Calendar year. 11 3-month sterling interbank rate (LIBOR). 6 Wages and salaries divided by employees.
8 HMRC Gross Case 1 trading profits.9 Outturn data from ONS House Price Index. 10 Outturn data from HMRC information on stamp duty land tax.
12 Weighted average interest rate on conventional gilts.
Percentage change on previous year, unless otherwise specified Growth
over
forecast
Forecast
7 Adjusted for timing effects.
67 Economic and fiscal outlook
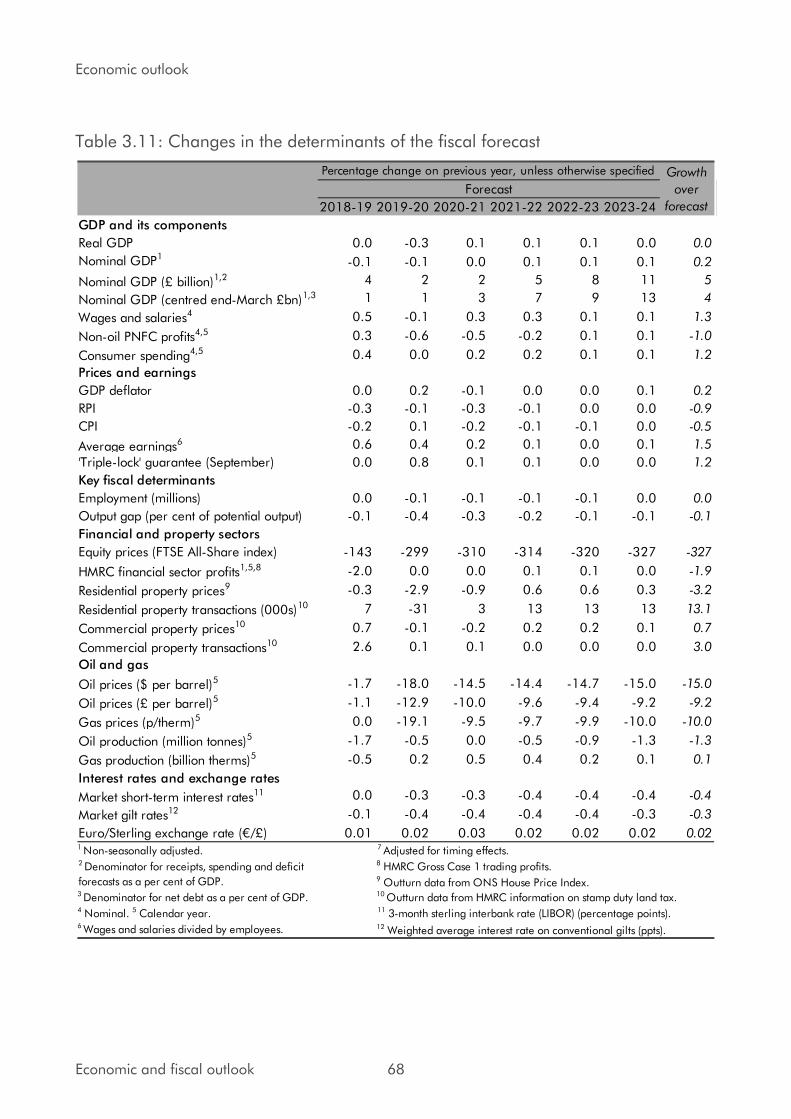
Economic outlook
Table 3.11: Changes in the determinants of the fiscal forecast 2
2018-19 2019-20 2020-21 2021-22 2022-23 2023-24
GDP and its components
Real GDP 0.0 -0.3 0.1 0.1 0.1 0.0 0.0
Nominal GDP1-0.1 -0.1 0.0 0.1 0.1 0.1 0.2
Nominal GDP (£ billion)1,2 4 2 2 5 8 11 5
Nominal GDP (centred end-March £bn)1,3 1 1 3 7 9 13 4
Wages and salaries4 0.5 -0.1 0.3 0.3 0.1 0.1 1.3
Non-oil PNFC profits4,5 0.3 -0.6 -0.5 -0.2 0.1 0.1 -1.0
Consumer spending4,5 0.4 0.0 0.2 0.2 0.1 0.1 1.2
Prices and earnings
GDP deflator 0.0 0.2 -0.1 0.0 0.0 0.1 0.2
RPI -0.3 -0.1 -0.3 -0.1 0.0 0.0 -0.9
CPI -0.2 0.1 -0.2 -0.1 -0.1 0.0 -0.5
Average earnings6 0.6 0.4 0.2 0.1 0.0 0.1 1.5
'Triple-lock' guarantee (September) 0.0 0.8 0.1 0.1 0.0 0.0 1.2
Key fiscal determinants
Employment (millions) 0.0 -0.1 -0.1 -0.1 -0.1 0.0 0.0
Output gap (per cent of potential output) -0.1 -0.4 -0.3 -0.2 -0.1 -0.1 -0.1
Financial and property sectors
Equity prices (FTSE All-Share index) -143 -299 -310 -314 -320 -327 -327
HMRC financial sector profits1,5,8 -2.0 0.0 0.0 0.1 0.1 0.0 -1.9
Residential property prices9 -0.3 -2.9 -0.9 0.6 0.6 0.3 -3.2
Residential property transactions (000s)10 7 -31 3 13 13 13 13.1
Commercial property prices10 0.7 -0.1 -0.2 0.2 0.2 0.1 0.7
Commercial property transactions10 2.6 0.1 0.1 0.0 0.0 0.0 3.0
Oil and gas
Oil prices ($ per barrel)5 -1.7 -18.0 -14.5 -14.4 -14.7 -15.0 -15.0
Oil prices (£ per barrel)5 -1.1 -12.9 -10.0 -9.6 -9.4 -9.2 -9.2
Gas prices (p/therm)5 0.0 -19.1 -9.5 -9.7 -9.9 -10.0 -10.0
Oil production (million tonnes)5 -1.7 -0.5 0.0 -0.5 -0.9 -1.3 -1.3
Gas production (billion therms)5 -0.5 0.2 0.5 0.4 0.2 0.1 0.1
Interest rates and exchange rates
Market short-term interest rates11 0.0 -0.3 -0.3 -0.4 -0.4 -0.4 -0.4
Market gilt rates12 -0.1 -0.4 -0.4 -0.4 -0.4 -0.3 -0.3
Euro/Sterling exchange rate (€/£) 0.01 0.02 0.03 0.02 0.02 0.02 0.021 Non-seasonally adjusted.2 Denominator for receipts, spending and deficit
forecasts as a per cent of GDP. 3 Denominator for net debt as a per cent of GDP.4 Nominal. 5 Calendar year. 11 3-month sterling interbank rate (LIBOR) (percentage points).6 Wages and salaries divided by employees. 12 Weighted average interest rate on conventional gilts (ppts).
Percentage change on previous year, unless otherwise specified Growth
over
forecast
Forecast
7 Adjusted for timing effects.8 HMRC Gross Case 1 trading profits.9 Outturn data from ONS House Price Index.10 Outturn data from HMRC information on stamp duty land tax.
Economic and fiscal outlook 68

4 Fiscal outlook
Introduction
4.1 This chapter:
• specifies the assumptions that we have made in respect of the UK’s forthcoming exit
from the EU (from paragraph 4.4);
• explains the effects of new policies announced since October on the fiscal forecast
(from paragraph 4.7);
• reviews classification issues affecting our forecast (in paragraph 4.14);
• describes the outlook for public sector receipts, including a tax-by-tax analysis
explaining how the forecasts have changed since October (from paragraph 4.15);
• portrays the outlook for public sector expenditure, focusing on spending covered by
departmental expenditure limits and the components of annually managed
expenditure, including those subject to the ‘welfare cap’ (from paragraph 4.60);
• presents the outlook for the key fiscal deficit aggregates, including headline and
structural measures of the budget deficit (from paragraph 4.113);
• describes the outlook for government lending to the private sector and other financial
transactions, including asset sales (from paragraph 4.130);
• shows the outlook for key balance sheet aggregates, such as public sector net debt
(from paragraph 4.155);
• summarises risks and uncertainties, including those embodied in the reporting of
contingent liabilities (paragraph 4.179); and
• compares our forecasts to those of international organisations (in paragraph 4.190).
4.2 Further breakdowns of receipts and expenditure and other details of our forecast are
provided in extensive supplementary tables on our website. The forecasts in this chapter start
from the estimates of 2017-18 outturn data published by the Office for National Statistics
(ONS) on 21 February. We then present an in-year estimate for 2018-19 that makes use of
ONS outturn data for April 2018 to January 2019 and limited administrative tax data for
some of February. Finally, we present forecasts for 2019-20 to 2023-24.
69 Economic and fiscal outlook

Fiscal outlook
4.3 As in previous Economic and fiscal outlooks (EFOs), this fiscal forecast:
• Represents our central view of the path of the public finances, based on the current
policies and policy assumptions of the Government, including some broad-brush
assumptions about future policy settings in respect of the UK’s exit from the EU. On that basis, we believe that, in the absence of future policy or classification changes, the
outturns would be as likely to be above the forecast as below it.
• Is based on announced Government policy on the indexation of rates, thresholds and
allowances for taxes and benefits, and incorporates estimates of the effects of new
policies announced since our previous forecast in October.
• Focuses on official ‘headline’ fiscal aggregates that exclude public sector banks.
Assumptions regarding the UK’s exit from the EU
4.4 The OBR is required by legislation to produce its forecasts based on current government
policy (but not necessarily assuming that particular objectives will be met). With negotiations
over the UK’s exit from the EU still taking place, this is not straightforward. We asked the Government if it wished to provide any additional information on its current policies that
would be relevant to our forecasts. As set out in the Foreword, it directed us to its July 2018
White Paper and the White Paper on immigration published in December 2018.
4.5 Since our previous forecast, the UK Government and the European Union published the
latest draft Withdrawal Agreement and the Political Declaration on the future relationship
between the UK and the EU on 25 November 2018. This set out in further detail the terms
of the financial settlement – the so-called ‘divorce bill’ – to complement the draft
Withdrawal Agreement from 19 March 2018. We have updated our central forecast to
incorporate the latest information on the cost of the financial settlement.
4.6 Given the uncertainty as to how the Government will respond to the choices and trade-offs
facing it during the negotiations, we still have no meaningful basis for predicting a precise
outcome upon which we could then condition our forecast. Moreover, even if the outcome
of the negotiations were predictable, its impact on the economy and the public finances
would still be uncertain. Specifically, as regards this fiscal forecast, we assume that:
• The UK leaves the EU on 29 March 2019 – two years after Article 50 was invoked. A
transition period follows until December 2020.
• Any reduction in expenditure transfers to EU institutions – after factoring in the cost of
the financial settlement – would be recycled fully into substitute spending. This
assumption is fiscally neutral.
• There are no changes to the structure or membership of tax systems for which there
are common EU rules (such as VAT and the EU emissions trading system or the
customs duties that are deemed to be collected on behalf of the EU).
Economic and fiscal outlook 70
Fiscal outlook
Policy announcements
4.7 The Government does not consider this Spring Statement to be a full ‘fiscal event’ and has not produced a ‘scorecard’ of policy measures. But several measures have been announced
since the Budget and departmental spending totals were increased in the Statement itself.
4.8 We consider the effects of all policy announcements that affect the public finances, so long
as they can be quantified with reasonable accuracy and assigned to specific years. We note
as risks to the fiscal forecast any significant policy commitments or ambitions that are not
quantifiable, for example because there is insufficient detail on the policy design or delivery.
4.9 The policy changes that we have incorporated in this forecast are summarised in Table 4.1,
which follows the Treasury convention of showing costs that raise borrowing as negative and
savings that reduce it as positive. Overall, these policy changes amount to a small fiscal
giveaway, driven mainly by higher departmental spending across the forecast period.
4.10 The key features of these measures include:
• Higher health spending to maintain real-terms funding in the face of revisions to GDP
deflator inflation – adding amounts rising to £0.8 billion in 2023-24.
• Higher non-health current departmental spending again to keep spending flat in real
terms despite higher GDP deflator inflation – also adding amounts rising to £0.8
billion in 2023-24.
• Several policy changes to universal credit and disability benefits. Overall, these
changes raise spending by £0.2 billion a year on average from 2020-21 onwards.
• Other policy changes are smaller and their effects are largely offsetting. They include
raising the fees payable for an application for a grant of probate and the doubling of
the ‘immigration health surcharge’, the fiscal effect of which the Government has chosen to offset via changes to the Home Office’s departmental budget.
4.11 These decisions have a partially offsetting indirect effect on borrowing. This reflects the
modest boost net fiscal giveaway gives to the economy and tax receipts and the increase in
public service pension contributions associated with higher departmental current spending.
4.12 The overall effect of policy changes on our forecast is to increase net borrowing by amounts
rising from £0.7 billion in 2019-20 to £2.1 billion in 2023-24.
4.13 We discuss their effect in more detail in Annex A, where we also set out our assessment of
the degree of uncertainty associated with them. Annex A also provides an update on various
previous measures, and the policy commitments and ambitions we treat as policy risks.
71 Economic and fiscal outlook
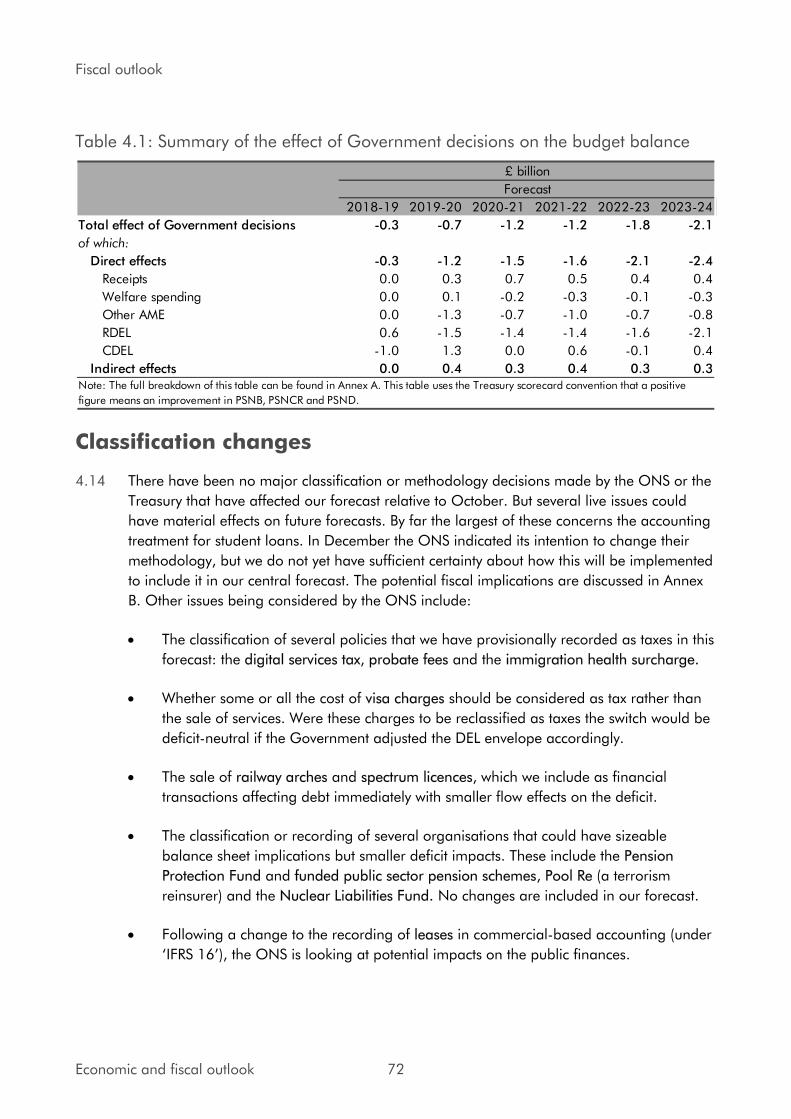
Fiscal outlook
Table 4.1: Summary of the effect of Government decisions on the budget balance
2018-19 2019-20 2020-21 2021-22 2022-23 2023-24
Total effect of Government decisions -0.3 -0.7 -1.2 -1.2 -1.8 -2.1
of which:
Direct effects -0.3 -1.2 -1.5 -1.6 -2.1 -2.4
Receipts 0.0 0.3 0.7 0.5 0.4 0.4
Welfare spending 0.0 0.1 -0.2 -0.3 -0.1 -0.3
Other AME 0.0 -1.3 -0.7 -1.0 -0.7 -0.8
RDEL 0.6 -1.5 -1.4 -1.4 -1.6 -2.1
CDEL -1.0 1.3 0.0 0.6 -0.1 0.4
Indirect effects 0.0 0.4 0.3 0.4 0.3 0.3
£ billion
Forecast
Note: The full breakdown of this table can be found in Annex A. This table uses the Treasury scorecard convention that a positive
figure means an improvement in PSNB, PSNCR and PSND.
Classification changes
4.14 There have been no major classification or methodology decisions made by the ONS or the
Treasury that have affected our forecast relative to October. But several live issues could
have material effects on future forecasts. By far the largest of these concerns the accounting
treatment for student loans. In December the ONS indicated its intention to change their
methodology, but we do not yet have sufficient certainty about how this will be implemented
to include it in our central forecast. The potential fiscal implications are discussed in Annex
B. Other issues being considered by the ONS include:
• The classification of several policies that we have provisionally recorded as taxes in this
forecast: the digital services tax, probate fees and the immigration health surcharge.
• Whether some or all the cost of visa charges should be considered as tax rather than
the sale of services. Were these charges to be reclassified as taxes the switch would be
deficit-neutral if the Government adjusted the DEL envelope accordingly.
• The sale of railway arches and spectrum licences, which we include as financial
transactions affecting debt immediately with smaller flow effects on the deficit.
• The classification or recording of several organisations that could have sizeable
balance sheet implications but smaller deficit impacts. These include the Pension
Protection Fund and funded public sector pension schemes, Pool Re (a terrorism
reinsurer) and the Nuclear Liabilities Fund. No changes are included in our forecast.
• Following a change to the recording of leases in commercial-based accounting (under
‘IFRS 16’), the ONS is looking at potential impacts on the public finances.
Economic and fiscal outlook 72
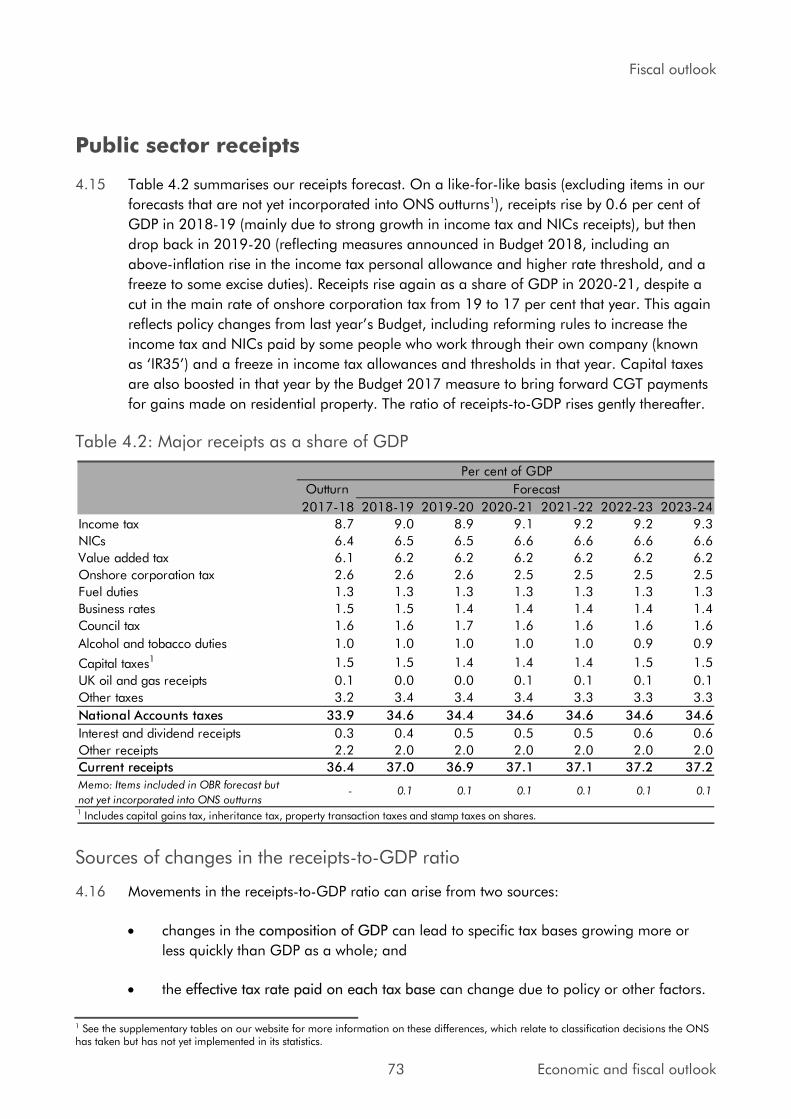
Fiscal outlook
Public sector receipts
4.15 Table 4.2 summarises our receipts forecast. On a like-for-like basis (excluding items in our
forecasts that are not yet incorporated into ONS outturns1), receipts rise by 0.6 per cent of
GDP in 2018-19 (mainly due to strong growth in income tax and NICs receipts), but then
drop back in 2019-20 (reflecting measures announced in Budget 2018, including an
above-inflation rise in the income tax personal allowance and higher rate threshold, and a
freeze to some excise duties). Receipts rise again as a share of GDP in 2020-21, despite a
cut in the main rate of onshore corporation tax from 19 to 17 per cent that year. This again
reflects policy changes from last year’s Budget, including reforming rules to increase the income tax and NICs paid by some people who work through their own company (known
as ‘IR35’) and a freeze in income tax allowances and thresholds in that year. Capital taxes
are also boosted in that year by the Budget 2017 measure to bring forward CGT payments
for gains made on residential property. The ratio of receipts-to-GDP rises gently thereafter.
Table 4.2: Major receipts as a share of GDP
Outturn
2017-18 2018-19 2019-20 2020-21 2021-22 2022-23 2023-24
Income tax 8.7 9.0 8.9 9.1 9.2 9.2 9.3
NICs 6.4 6.5 6.5 6.6 6.6 6.6 6.6
Value added tax 6.1 6.2 6.2 6.2 6.2 6.2 6.2
Onshore corporation tax 2.6 2.6 2.6 2.5 2.5 2.5 2.5
Fuel duties 1.3 1.3 1.3 1.3 1.3 1.3 1.3
Business rates 1.5 1.5 1.4 1.4 1.4 1.4 1.4
Council tax 1.6 1.6 1.7 1.6 1.6 1.6 1.6
Alcohol and tobacco duties 1.0 1.0 1.0 1.0 1.0 0.9 0.9
Capital taxes1 1.5 1.5 1.4 1.4 1.4 1.5 1.5
UK oil and gas receipts 0.1 0.0 0.0 0.1 0.1 0.1 0.1
Other taxes 3.2 3.4 3.4 3.4 3.3 3.3 3.3
National Accounts taxes 33.9 34.6 34.4 34.6 34.6 34.6 34.6
Interest and dividend receipts 0.3 0.4 0.5 0.5 0.5 0.6 0.6
Other receipts 2.2 2.0 2.0 2.0 2.0 2.0 2.0
Current receipts 36.4 37.0 36.9 37.1 37.1 37.2 37.2
Memo: Items included in OBR forecast but
not yet incorporated into ONS outturns- 0.1 0.1 0.1 0.1 0.1 0.1
1 Includes capital gains tax, inheritance tax, property transaction taxes and stamp taxes on shares.
Forecast
Per cent of GDP
Sources of changes in the receipts-to-GDP ratio
4.16 Movements in the receipts-to-GDP ratio can arise from two sources:
• changes in the composition of GDP can lead to specific tax bases growing more or
less quickly than GDP as a whole; and
• the effective tax rate paid on each tax base can change due to policy or other factors.
1 See the supplementary tables on our website for more information on these differences, which relate to classification decisions the ONS has taken but has not yet implemented in its statistics.
73 Economic and fiscal outlook
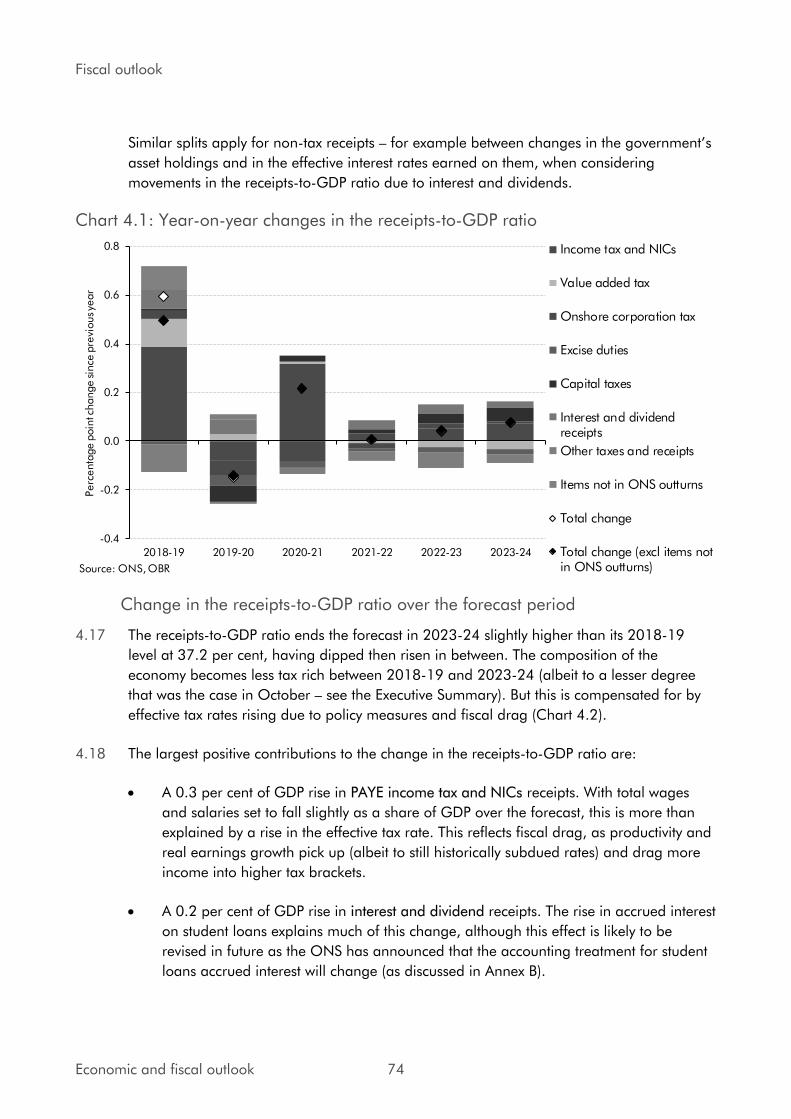
Fiscal outlook
Similar splits apply for non-tax receipts – for example between changes in the government’s asset holdings and in the effective interest rates earned on them, when considering
movements in the receipts-to-GDP ratio due to interest and dividends.
Chart 4.1: Year-on-year changes in the receipts-to-GDP ratio
-0.4
-0.2
0.0
0.2
0.4
0.6
0.8
2018-19 2019-20 2020-21 2021-22 2022-23 2023-24
Perc
enta
ge p
oin
t change sin
ce p
revi
ous ye
ar
Income tax and NICs
Value added tax
Onshore corporation tax
Excise duties
Capital taxes
Interest and dividendreceipts
Other taxes and receipts
Items not in ONS outturns
Total change
Total change (excl items notin ONS outturns)Source: ONS, OBR
Change in the receipts-to-GDP ratio over the forecast period
4.17 The receipts-to-GDP ratio ends the forecast in 2023-24 slightly higher than its 2018-19
level at 37.2 per cent, having dipped then risen in between. The composition of the
economy becomes less tax rich between 2018-19 and 2023-24 (albeit to a lesser degree
that was the case in October – see the Executive Summary). But this is compensated for by
effective tax rates rising due to policy measures and fiscal drag (Chart 4.2).
4.18 The largest positive contributions to the change in the receipts-to-GDP ratio are:
• A 0.3 per cent of GDP rise in PAYE income tax and NICs receipts. With total wages
and salaries set to fall slightly as a share of GDP over the forecast, this is more than
explained by a rise in the effective tax rate. This reflects fiscal drag, as productivity and
real earnings growth pick up (albeit to still historically subdued rates) and drag more
income into higher tax brackets.
• A 0.2 per cent of GDP rise in interest and dividend receipts. The rise in accrued interest
on student loans explains much of this change, although this effect is likely to be
revised in future as the ONS has announced that the accounting treatment for student
loans accrued interest will change (as discussed in Annex B).
Economic and fiscal outlook 74

Fiscal outlook
• A 0.1 per cent of GDP rise in self-assessment (SA) income tax receipts. This is largely
due to a rising tax base, reflecting our assumption that the share of self-employment in
total employment will rise over the forecast, continuing the trend of recent years.
4.19 The largest negative contributions to the change in the ratio are:
• A 0.1 per cent of GDP fall in business rate receipts. Receipts rise in 2021-22 due to the
planned revaluation, but gradually fall away in other forecast years as rateable values
fall in real terms thanks to subsequent appeals.
• A 0.1 per cent of GDP fall in excise duties. This is explained by declining tax bases,
due to falling alcohol and tobacco consumption and the rising fuel efficiency of the
vehicle stock. These are only partly offset by rises in duty rates based on the
Government’s stated duty uprating assumptions, which raise the effective tax rate.
• A 0.1 per cent of GDP fall in onshore corporation tax receipts. This is partly caused by
a fall in the effective tax rate – as the main rate will be cut to 17 per cent in 2020. But
we also assume that profits fall as a share of the economy over the forecast.
Chart 4.2: Sources of changes in the receipts-to-GDP ratio (2018-19 to 2023-24)
-0.6
-0.4
-0.2
0.0
0.2
0.4
0.6
0.8
PAYE ITand NICs
Interestand
dividends
Selfassess-ment
Propertytransact-ion taxes
Oilandgas
Environ-mentallevies
CGT VAT Othertaxes andreceipts
Banklevy
Businessrates
Exciseduties
OnshoreCT
Currentreceipts
Perc
enta
ge p
oin
t change
Change due to tax base
Change due to effective tax rate
Not disaggregated
Total change in share of GDP
Source: OBR
Detailed current receipts forecasts
4.20 Our detailed receipts forecasts and changes since October are presented in Tables 4.3 and
4.4. Further breakdowns are available on our website. Our forecasts for Scottish and Welsh
devolved taxes are discussed in our Devolved tax and spending forecasts publication.
75 Economic and fiscal outlook
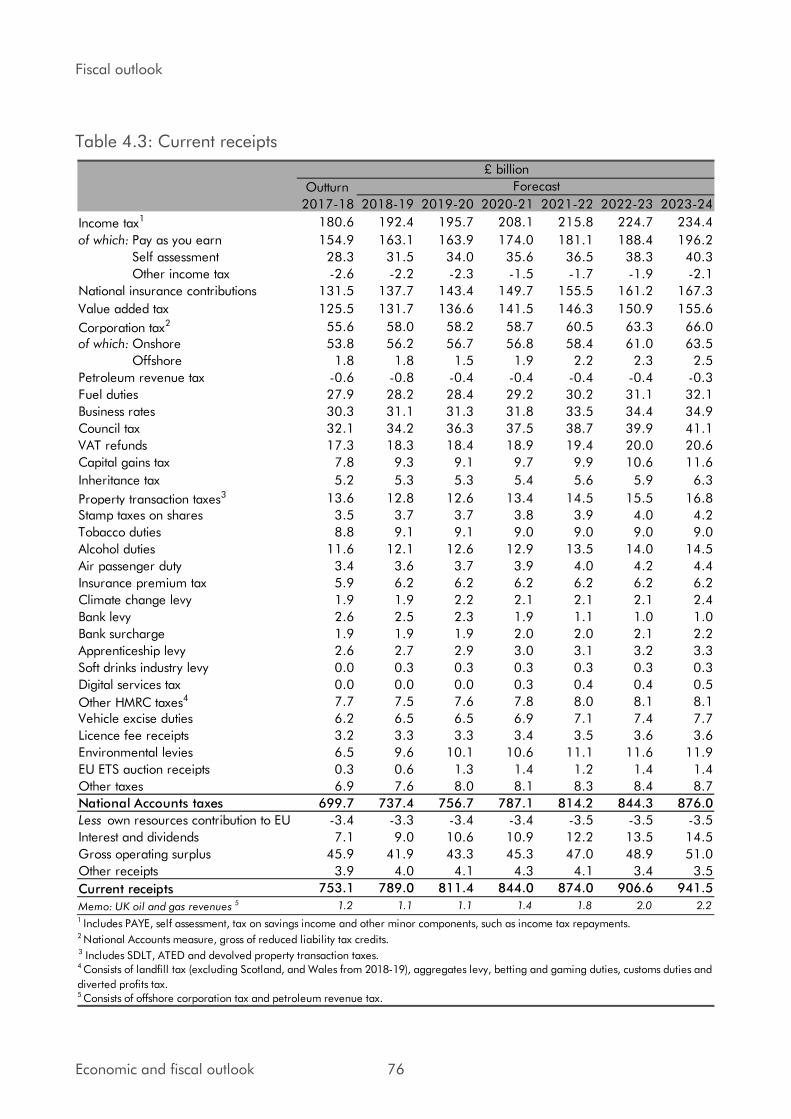
Fiscal outlook
Table 4.3: Current receipts
Outturn
2017-18 2018-19 2019-20 2020-21 2021-22 2022-23 2023-24
Income tax1 180.6 192.4 195.7 208.1 215.8 224.7 234.4
of which: Pay as you earn 154.9 163.1 163.9 174.0 181.1 188.4 196.2
Self assessment 28.3 31.5 34.0 35.6 36.5 38.3 40.3
Other income tax -2.6 -2.2 -2.3 -1.5 -1.7 -1.9 -2.1
National insurance contributions 131.5 137.7 143.4 149.7 155.5 161.2 167.3
Value added tax 125.5 131.7 136.6 141.5 146.3 150.9 155.6
Corporation tax2 55.6 58.0 58.2 58.7 60.5 63.3 66.0
of which: Onshore 53.8 56.2 56.7 56.8 58.4 61.0 63.5
Offshore 1.8 1.8 1.5 1.9 2.2 2.3 2.5
Petroleum revenue tax -0.6 -0.8 -0.4 -0.4 -0.4 -0.4 -0.3
Fuel duties 27.9 28.2 28.4 29.2 30.2 31.1 32.1
Business rates 30.3 31.1 31.3 31.8 33.5 34.4 34.9
Council tax 32.1 34.2 36.3 37.5 38.7 39.9 41.1
VAT refunds 17.3 18.3 18.4 18.9 19.4 20.0 20.6
Capital gains tax 7.8 9.3 9.1 9.7 9.9 10.6 11.6
Inheritance tax 5.2 5.3 5.3 5.4 5.6 5.9 6.3
Property transaction taxes3 13.6 12.8 12.6 13.4 14.5 15.5 16.8
Stamp taxes on shares 3.5 3.7 3.7 3.8 3.9 4.0 4.2
Tobacco duties 8.8 9.1 9.1 9.0 9.0 9.0 9.0
Alcohol duties 11.6 12.1 12.6 12.9 13.5 14.0 14.5
Air passenger duty 3.4 3.6 3.7 3.9 4.0 4.2 4.4
Insurance premium tax 5.9 6.2 6.2 6.2 6.2 6.2 6.2
Climate change levy 1.9 1.9 2.2 2.1 2.1 2.1 2.4
Bank levy 2.6 2.5 2.3 1.9 1.1 1.0 1.0
Bank surcharge 1.9 1.9 1.9 2.0 2.0 2.1 2.2
Apprenticeship levy 2.6 2.7 2.9 3.0 3.1 3.2 3.3
Soft drinks industry levy 0.0 0.3 0.3 0.3 0.3 0.3 0.3
Digital services tax 0.0 0.0 0.0 0.3 0.4 0.4 0.5
Other HMRC taxes4 7.7 7.5 7.6 7.8 8.0 8.1 8.1
Vehicle excise duties 6.2 6.5 6.5 6.9 7.1 7.4 7.7
Licence fee receipts 3.2 3.3 3.3 3.4 3.5 3.6 3.6
Environmental levies 6.5 9.6 10.1 10.6 11.1 11.6 11.9
EU ETS auction receipts 0.3 0.6 1.3 1.4 1.2 1.4 1.4
Other taxes 6.9 7.6 8.0 8.1 8.3 8.4 8.7
National Accounts taxes 699.7 737.4 756.7 787.1 814.2 844.3 876.0
Less own resources contribution to EU -3.4 -3.3 -3.4 -3.4 -3.5 -3.5 -3.5
Interest and dividends 7.1 9.0 10.6 10.9 12.2 13.5 14.5
Gross operating surplus 45.9 41.9 43.3 45.3 47.0 48.9 51.0
Other receipts 3.9 4.0 4.1 4.3 4.1 3.4 3.5
Current receipts 753.1 789.0 811.4 844.0 874.0 906.6 941.5
Memo: UK oil and gas revenues 5 1.2 1.1 1.1 1.4 1.8 2.0 2.2
2 National Accounts measure, gross of reduced liability tax credits.3 Includes SDLT, ATED and devolved property transaction taxes.
5 Consists of offshore corporation tax and petroleum revenue tax.
£ billion
Forecast
1 Includes PAYE, self assessment, tax on savings income and other minor components, such as income tax repayments.
4 Consists of landfill tax (excluding Scotland, and Wales from 2018-19), aggregates levy, betting and gaming duties, customs duties and
diverted profits tax.
Economic and fiscal outlook 76

Fiscal outlook
Table 4.4: Changes to current receipts since October
Outturn
2017-18 2018-19 2019-20 2020-21 2021-22 2022-23 2023-24
Income tax1 -0.1 2.2 2.8 5.0 5.2 5.0 4.5
of which: Pay as you earnPay as you earn 0.0 1.4 1.9 3.2 3.8 3.5 2.8
Self assessment 0.0 1.0 1.1 2.0 1.7 1.8 2.0
Other income tax -0.1 -0.2 -0.3 -0.2 -0.3 -0.3 -0.3
National insurance contributions -1.0 0.8 1.5 1.9 2.1 2.0 1.8
Value added tax 0.1 -0.5 -0.6 -0.4 -0.1 0.1 0.3
Corporation tax2 -0.4 -1.5 -1.8 -0.9 -0.4 -0.2 -0.1
of which: Onshore -0.4 -1.2 -0.7 -0.2 0.3 0.5 0.6
Offshore 0.0 -0.3 -1.1 -0.7 -0.7 -0.7 -0.6
Petroleum revenue tax 0.0 -0.2 0.2 0.3 0.1 0.0 0.0
Fuel duties 0.0 -0.1 0.1 0.0 0.0 0.0 0.0
Business rates 0.1 0.3 0.4 0.4 0.3 0.5 0.3
Council tax 0.0 0.0 0.4 0.5 0.5 0.6 0.8
VAT refunds 0.2 0.5 0.1 -0.1 -0.1 -0.1 -0.1
Capital gains tax 0.0 0.7 0.0 -0.8 -0.9 -0.9 -0.9
Inheritance tax 0.0 -0.1 -0.3 -0.6 -0.6 -0.6 -0.7
Property transaction taxes3 0.0 0.0 -0.7 -0.7 -0.5 -0.4 -0.4
Stamp taxes on shares 0.0 0.0 -0.1 -0.1 -0.1 -0.1 -0.1
Tobacco duties 0.0 -0.1 -0.2 -0.2 -0.1 -0.1 -0.1
Alcohol duties 0.0 -0.2 -0.1 -0.1 -0.1 -0.1 -0.1
Air passenger duty 0.0 -0.1 -0.1 -0.1 -0.1 -0.1 -0.1
Insurance premium tax 0.0 -0.1 -0.1 -0.1 -0.1 -0.1 -0.1
Climate change levy 0.0 -0.1 0.0 -0.1 -0.1 -0.1 -0.1
Bank levy 0.0 0.0 0.0 0.0 0.0 0.0 0.0
Bank surcharge 0.0 0.0 -0.1 0.0 0.0 0.0 0.1
Apprenticeship levy -0.1 -0.1 -0.1 -0.1 0.0 0.0 0.0
Soft drinks industry levy 0.0 0.1 0.1 0.1 0.1 0.1 0.1
Digital services tax 0.0 0.0 0.0 0.0 0.0 0.0 0.0
Other HMRC taxes4 0.0 0.1 0.1 0.1 0.2 0.2 0.2
Vehicle excise duties 0.0 0.0 0.1 0.2 0.2 0.2 0.2
Licence fee receipts 0.0 0.0 0.0 0.0 0.0 0.0 0.0
Environmental levies 0.0 -0.6 -1.1 -1.3 -1.0 -0.9 -1.2
EU ETS auction receipts 0.0 0.0 -0.3 0.2 0.0 0.0 -0.1
Other taxes 0.0 0.3 0.6 0.4 0.3 0.3 0.3
National Accounts taxes -1.0 1.4 0.8 3.6 4.6 5.2 4.7
Less own resources contribution to EU 0.0 0.0 0.0 0.0 0.0 -0.1 -0.1
Interest and dividends 0.0 0.2 -0.1 -1.2 -1.2 -1.1 -0.6
Gross operating surplus -0.6 -0.2 0.4 0.8 0.6 1.1 1.5
Other receipts 0.7 0.4 0.4 0.5 0.5 0.5 0.5
Current receipts -0.9 1.7 1.6 3.6 4.5 5.7 6.0
Memo: UK oil and gas revenues 5 0.0 -0.5 -0.8 -0.4 -0.6 -0.7 -0.7
2 National Accounts measure, gross of reduced liability tax credits.3 Includes SDLT, ATED and devolved property transaction taxes.
5 Consists of offshore corporation tax and petroleum revenue tax.
£ billion
Forecast
4 Consists of landfill tax (excluding Scotland, and Wales from 2018-19), aggregates levy, betting and gaming duties, customs duties and
diverted profits tax.
1 Includes PAYE, self assessment, tax on savings income and other minor components, such as income tax repayments.
77 Economic and fiscal outlook
Fiscal outlook
Changes in the receipts forecast since October
4.21 We have revised our pre-measures forecast up in all years compared to October:
• Higher average earnings growth relative to our October forecast boosts receipts by
£2.1 billion in 2018-19 and by progressively larger amounts across the forecast.
• Stronger than expected self-assessment (SA) income tax and capital gains tax (CGT)
receipts in 2018-19 increase receipts by £1.7 billion. On the income tax side,
provisional HMRC analysis suggests that the strength is broadly based across the
various tax streams, so we assume that it largely persists over the forecast. On the
CGT side, around a third of the unexpected strength in January receipts is assumed to
be a timing effect, possibly related to policy changes in recent years. So only some of
the upward revision since October boosts receipts in future years. But this increases
receipts by progressively larger amounts across the forecast as we assume that gains
from financial assets are geared to equity prices rising in line with nominal GDP.
• Higher cumulative consumer spending growth across the forecast boosts VAT and
some other smaller indirect tax receipts by £0.4 billion in 2018-19, and by
increasingly larger amounts from 2019-20 onwards.
4.22 Partly offsetting these upward revisions, the main sources of downward revision include:
• Lower equity prices have reduced receipts by £1.8 billion a year on average from
2019-20 onwards. Our equity price assumption feeds into several tax forecasts, with
our capital gains tax forecast the most sensitive to changes in the assumption.
• Lower oil and gas prices since October have reduced UK oil and gas receipts by an
average of £1.6 billion a year from 2019-20 onwards.
• We have revised down near-term employment growth since October, particularly in
2019-20 due to our expectation that the unemployment rate will increase as output
dips below potential. This reduces income tax and NICs receipts by £1.2 billion in
2019-20, but by diminishing amounts thereafter as this effect unwinds.
• Lower interest rates reduce interest receipts on the government’s assets by around £1 billion a year from 2020-21 onwards.
4.23 The direct effect of Government decisions in this forecast boosts receipts by £0.5 billion a
year on average from 2019-20 onwards. The largest changes reflect increases in the rates
of both probate fees and the immigration health surcharge. The Government has decided
to offset both of these measures by increasing departmental spending limits, so the effects
of the measures are neutral for borrowing overall. Annex A provides more detail.
4.24 The indirect effect of the total policy package boosts earnings growth marginally, raising
income tax and NICs receipts by £0.2 billion a year on average from 2019-20 onwards.
Economic and fiscal outlook 78
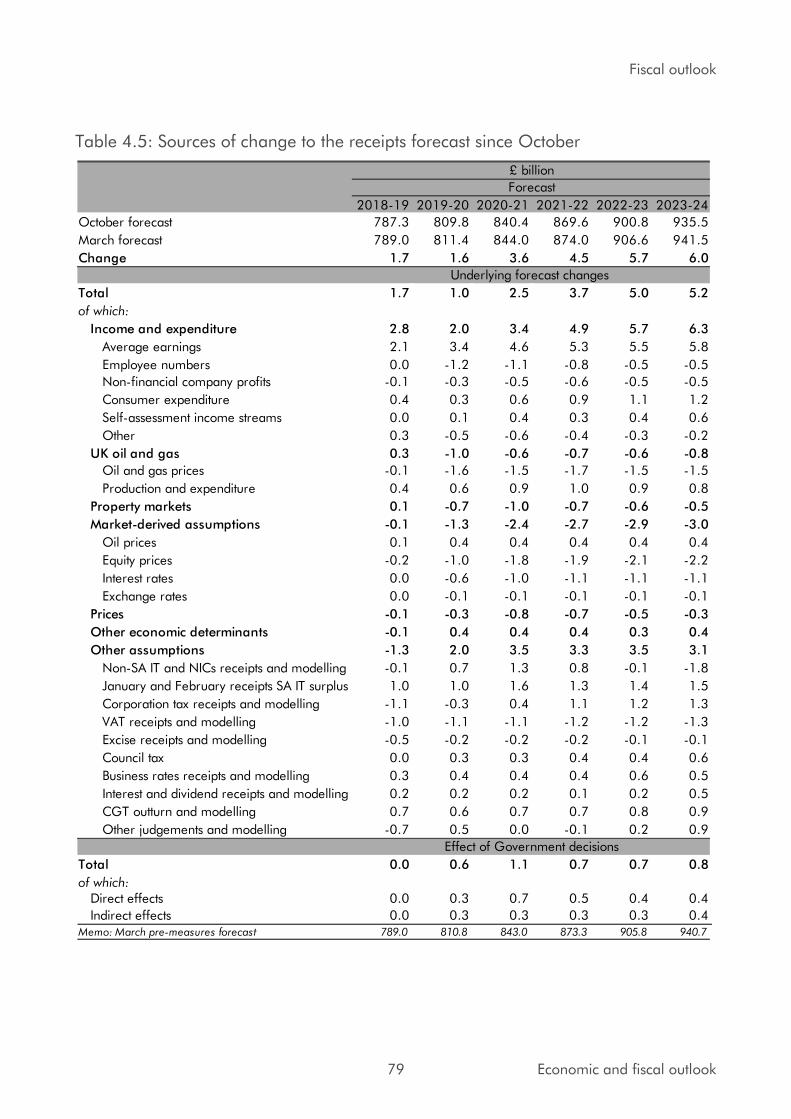
Fiscal outlook
Table 4.5: Sources of change to the receipts forecast since October
2018-19 2019-20 2020-21 2021-22 2022-23 2023-24
October forecast 787.3 809.8 840.4 869.6 900.8 935.5
March forecast 789.0 811.4 844.0 874.0 906.6 941.5
Change 1.7 1.6 3.6 4.5 5.7 6.0
Total 1.7 1.0 2.5 3.7 5.0 5.2
of which:
Income and expenditure 2.8 2.0 3.4 4.9 5.7 6.3
Average earnings 2.1 3.4 4.6 5.3 5.5 5.8
Employee numbers 0.0 -1.2 -1.1 -0.8 -0.5 -0.5
Non-financial company profits -0.1 -0.3 -0.5 -0.6 -0.5 -0.5
Consumer expenditure 0.4 0.3 0.6 0.9 1.1 1.2
Self-assessment income streams 0.0 0.1 0.4 0.3 0.4 0.6
Other 0.3 -0.5 -0.6 -0.4 -0.3 -0.2
UK oil and gas 0.3 -1.0 -0.6 -0.7 -0.6 -0.8
Oil and gas prices -0.1 -1.6 -1.5 -1.7 -1.5 -1.5
Production and expenditure 0.4 0.6 0.9 1.0 0.9 0.8
Property markets 0.1 -0.7 -1.0 -0.7 -0.6 -0.5
Market-derived assumptions -0.1 -1.3 -2.4 -2.7 -2.9 -3.0
Oil prices 0.1 0.4 0.4 0.4 0.4 0.4
Equity prices -0.2 -1.0 -1.8 -1.9 -2.1 -2.2
Interest rates 0.0 -0.6 -1.0 -1.1 -1.1 -1.1
Exchange rates 0.0 -0.1 -0.1 -0.1 -0.1 -0.1
Prices -0.1 -0.3 -0.8 -0.7 -0.5 -0.3
Other economic determinants -0.1 0.4 0.4 0.4 0.3 0.4
Other assumptions -1.3 2.0 3.5 3.3 3.5 3.1
Non-SA IT and NICs receipts and modelling -0.1 0.7 1.3 0.8 -0.1 -1.8
January and February receipts SA IT surplus 1.0 1.0 1.6 1.3 1.4 1.5
Corporation tax receipts and modelling -1.1 -0.3 0.4 1.1 1.2 1.3
VAT receipts and modelling -1.0 -1.1 -1.1 -1.2 -1.2 -1.3
Excise receipts and modelling -0.5 -0.2 -0.2 -0.2 -0.1 -0.1
Council tax 0.0 0.3 0.3 0.4 0.4 0.6
Business rates receipts and modelling 0.3 0.4 0.4 0.4 0.6 0.5
Interest and dividend receipts and modelling 0.2 0.2 0.2 0.1 0.2 0.5
CGT outturn and modelling 0.7 0.6 0.7 0.7 0.8 0.9
Other judgements and modelling -0.7 0.5 0.0 -0.1 0.2 0.9
Total 0.0 0.6 1.1 0.7 0.7 0.8
of which:Direct effects 0.0 0.3 0.7 0.5 0.4 0.4
Indirect effects 0.0 0.3 0.3 0.3 0.3 0.4Memo: March pre-measures forecast 789.0 810.8 843.0 873.3 905.8 940.7
Effect of Government decisions
£ billion
Forecast
Underlying forecast changes
79 Economic and fiscal outlook
Fiscal outlook
Tax-by-tax analysis
PAYE income tax and NICs
4.25 PAYE income tax and NICs receipts on employee salaries have been revised up by £2.3
billion in 2018-19 relative to our October forecast. This comes on top of the £3.0 billion
upward revision we made in October. That £5.3 billion boost to 2018-19 receipts relative to
the forecast we made a year ago reflects:
• Unexpectedly strong earnings growth since our October forecast adds around £2.1
billion to receipts since then. This more than offsets the £1.0 billion drag on receipts
from average earnings growth revisions in our October forecast.
• Strong employment growth – particularly in the first half of 2018-19 – boosted our
receipts forecast by just over £2.0 billion in October. This has been only partly offset by
the downward revision to employment growth in this forecast.
• Real-time information (RTI) indicates that earnings growth at the very top of the
employee earnings distribution has been particularly strong. Mean total pay between
April and September for the top 0.1 per cent rose 5.9 per cent on a year earlier,
compared with a 3.7 per cent rise for the whole distribution on this measure. The latest
receipts data suggest that difference may have widened further since then. While this
relates to just 31,000 taxpayers, they accounted for 7.9 per cent of the PAYE income
tax and NIC receipts covered by the RTI system in 2017-18. This top-end strength will
have boosted the effective tax rate. (Earnings growth at the bottom of the distribution
has also been relatively strong, thanks to rises in the National Living Wage, but this
has relatively little effect on tax receipts due to the income tax personal allowance.)
• Higher tax paid on pension flexibility withdrawals and the effect of ‘PAYE refresh’, an
HMRC operational scheme to implement more in-year coding changes when PAYE
taxpayers’ circumstances change. Much of the additional receipts from these sources were incorporated into our October forecast.
4.26 With bonuses in both the financial and non-financial sectors concentrated in the final
months of the fiscal year, receipts for 2018-19 as a whole remain uncertain. We have
assumed that financial sector bonuses will be flat on a year earlier, but at this stage there is
little evidence to inform this judgement. Receipts growth from the sector so far this year has
been modest, while corporation tax receipts from the sector have fallen.
4.27 Growth in PAYE income tax and NIC receipts is expected to slow from 5.0 per cent in 2018-
19 to 2.2 per cent in 2019-20. This reflects the Budget 2018 measures raising the personal
allowance to £12,500 (up 5.5 per cent from 2018-19) and the higher rate threshold to
£50,000 (up 7.9 per cent) from April 2019. Weaker employment growth in 2019-20 also
contributes to slower growth in receipts. We expect growth in the number of employees to
slow from 1.2 per cent in 2018-19 to just 0.2 per cent in 2019-20.
Economic and fiscal outlook 80
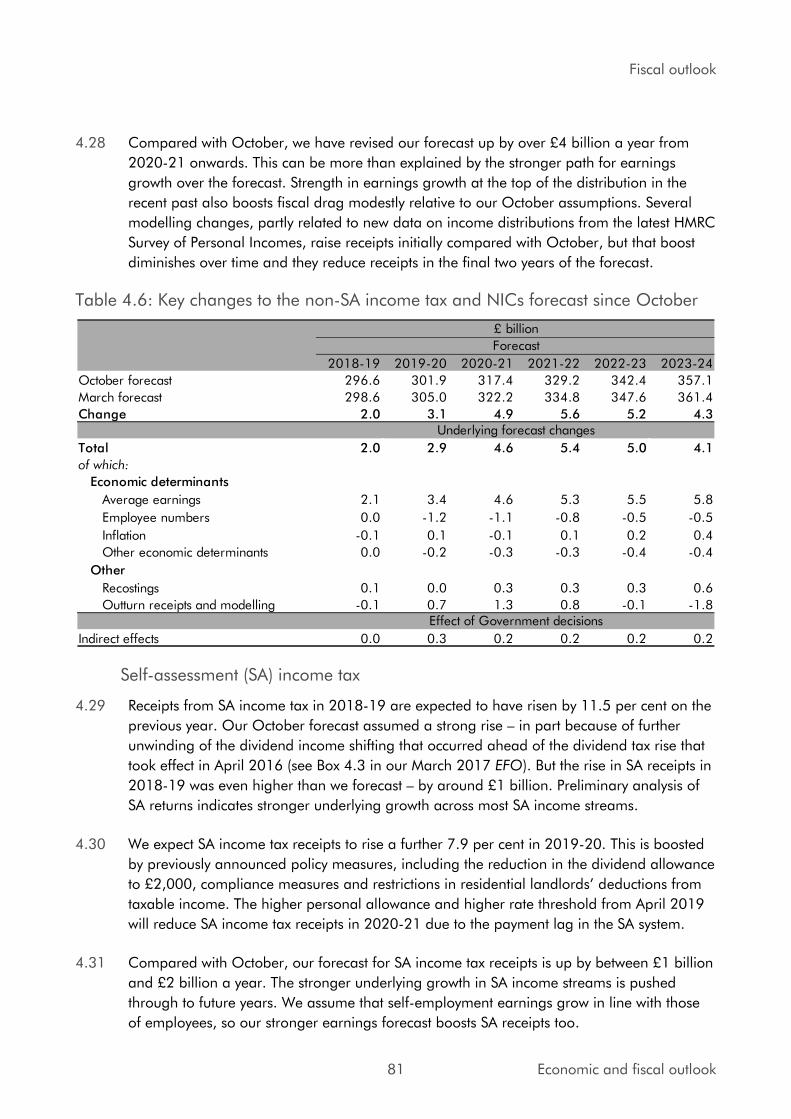
Fiscal outlook
4.28 Compared with October, we have revised our forecast up by over £4 billion a year from
2020-21 onwards. This can be more than explained by the stronger path for earnings
growth over the forecast. Strength in earnings growth at the top of the distribution in the
recent past also boosts fiscal drag modestly relative to our October assumptions. Several
modelling changes, partly related to new data on income distributions from the latest HMRC
Survey of Personal Incomes, raise receipts initially compared with October, but that boost
diminishes over time and they reduce receipts in the final two years of the forecast.
Table 4.6: Key changes to the non-SA income tax and NICs forecast since October
2018-19 2019-20 2020-21 2021-22 2022-23 2023-24
October forecast 296.6 301.9 317.4 329.2 342.4 357.1
March forecast 298.6 305.0 322.2 334.8 347.6 361.4
Change 2.0 3.1 4.9 5.6 5.2 4.3
Total 2.0 2.9 4.6 5.4 5.0 4.1
of which:
Economic determinants
Average earnings 2.1 3.4 4.6 5.3 5.5 5.8
Employee numbers 0.0 -1.2 -1.1 -0.8 -0.5 -0.5
Inflation -0.1 0.1 -0.1 0.1 0.2 0.4
Other economic determinants 0.0 -0.2 -0.3 -0.3 -0.4 -0.4
Other
Recostings 0.1 0.0 0.3 0.3 0.3 0.6
Outturn receipts and modelling -0.1 0.7 1.3 0.8 -0.1 -1.8
Indirect effects 0.0 0.3 0.2 0.2 0.2 0.2
Effect of Government decisions
£ billion
Forecast
Underlying forecast changes
Self-assessment (SA) income tax
4.29 Receipts from SA income tax in 2018-19 are expected to have risen by 11.5 per cent on the
previous year. Our October forecast assumed a strong rise – in part because of further
unwinding of the dividend income shifting that occurred ahead of the dividend tax rise that
took effect in April 2016 (see Box 4.3 in our March 2017 EFO). But the rise in SA receipts in
2018-19 was even higher than we forecast – by around £1 billion. Preliminary analysis of
SA returns indicates stronger underlying growth across most SA income streams.
4.30 We expect SA income tax receipts to rise a further 7.9 per cent in 2019-20. This is boosted
by previously announced policy measures, including the reduction in the dividend allowance
to £2,000, compliance measures and restrictions in residential landlords’ deductions from
taxable income. The higher personal allowance and higher rate threshold from April 2019
will reduce SA income tax receipts in 2020-21 due to the payment lag in the SA system.
4.31 Compared with October, our forecast for SA income tax receipts is up by between £1 billion
and £2 billion a year. The stronger underlying growth in SA income streams is pushed
through to future years. We assume that self-employment earnings grow in line with those
of employees, so our stronger earnings forecast boosts SA receipts too.
81 Economic and fiscal outlook
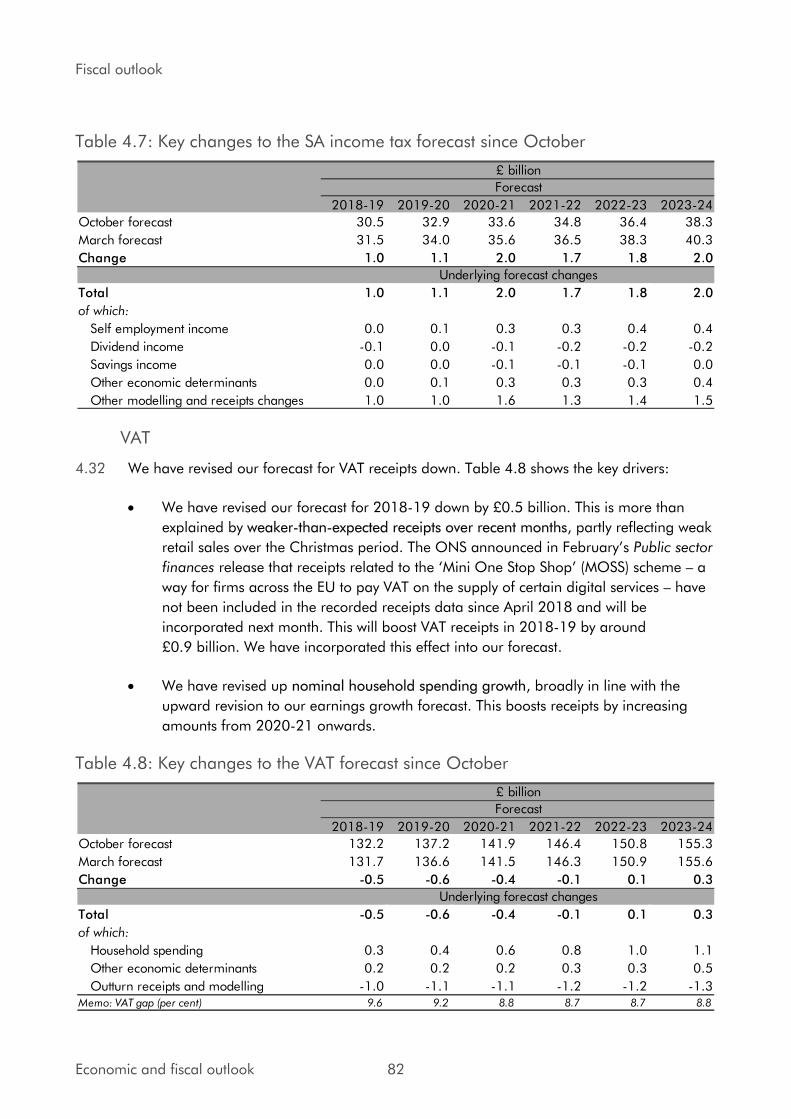
Fiscal outlook
Table 4.7: Key changes to the SA income tax forecast since October
2018-19 2019-20 2020-21 2021-22 2022-23 2023-24
October forecast 30.5 32.9 33.6 34.8 36.4 38.3
March forecast 31.5 34.0 35.6 36.5 38.3 40.3
Change 1.0 1.1 2.0 1.7 1.8 2.0
Total 1.0 1.1 2.0 1.7 1.8 2.0
of which:
Self employment income 0.0 0.1 0.3 0.3 0.4 0.4
Dividend income -0.1 0.0 -0.1 -0.2 -0.2 -0.2
Savings income 0.0 0.0 -0.1 -0.1 -0.1 0.0
Other economic determinants 0.0 0.1 0.3 0.3 0.3 0.4
Other modelling and receipts changes 1.0 1.0 1.6 1.3 1.4 1.5
£ billion
Forecast
Underlying forecast changes
VAT
4.32 We have revised our forecast for VAT receipts down. Table 4.8 shows the key drivers:
• We have revised our forecast for 2018-19 down by £0.5 billion. This is more than
explained by weaker-than-expected receipts over recent months, partly reflecting weak
retail sales over the Christmas period. The ONS announced in February’s Public sector
finances release that receipts related to the ‘Mini One Stop Shop’ (MOSS) scheme – a
way for firms across the EU to pay VAT on the supply of certain digital services – have
not been included in the recorded receipts data since April 2018 and will be
incorporated next month. This will boost VAT receipts in 2018-19 by around
£0.9 billion. We have incorporated this effect into our forecast.
• We have revised up nominal household spending growth, broadly in line with the
upward revision to our earnings growth forecast. This boosts receipts by increasing
amounts from 2020-21 onwards.
Table 4.8: Key changes to the VAT forecast since October
2018-19 2019-20 2020-21 2021-22 2022-23 2023-24
October forecast 132.2 137.2 141.9 146.4 150.8 155.3
March forecast 131.7 136.6 141.5 146.3 150.9 155.6
Change -0.5 -0.6 -0.4 -0.1 0.1 0.3
Total -0.5 -0.6 -0.4 -0.1 0.1 0.3
of which:
Household spending 0.3 0.4 0.6 0.8 1.0 1.1
Other economic determinants 0.2 0.2 0.2 0.3 0.3 0.5
Outturn receipts and modelling -1.0 -1.1 -1.1 -1.2 -1.2 -1.3Memo: VAT gap (per cent) 9.6 9.2 8.8 8.7 8.7 8.8
Forecast
£ billion
Underlying forecast changes
Economic and fiscal outlook 82
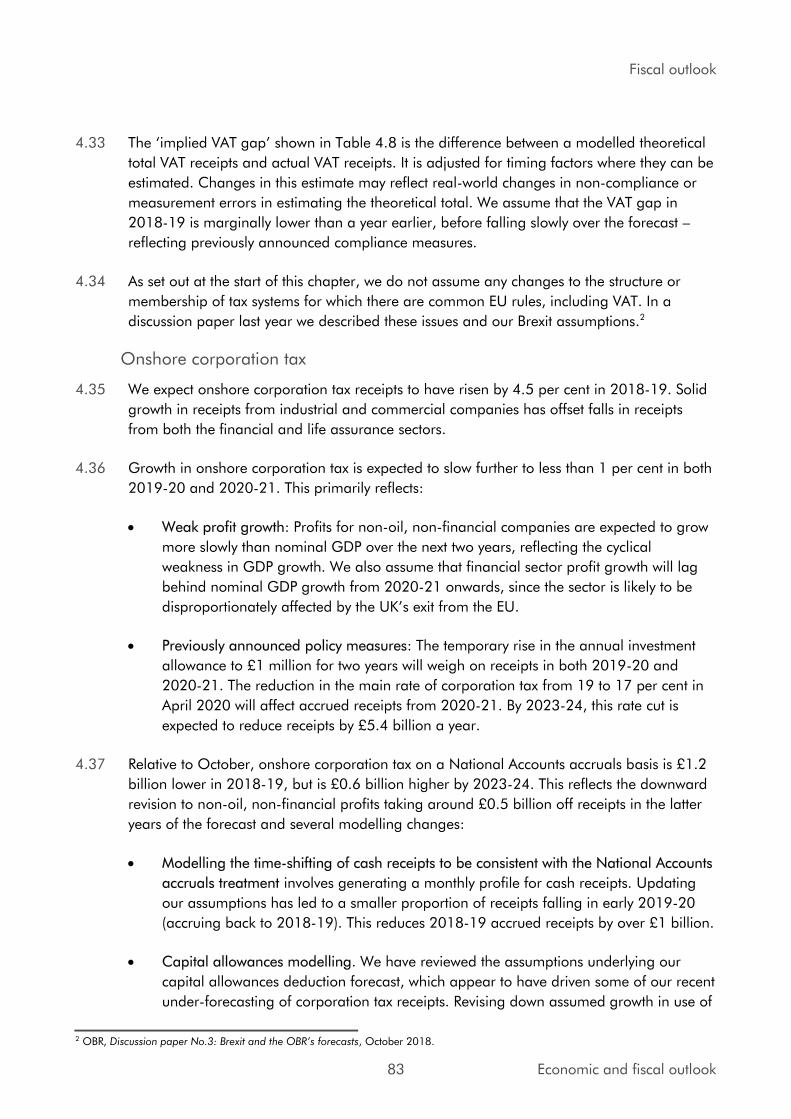
Fiscal outlook
4.33 The ‘implied VAT gap’ shown in Table 4.8 is the difference between a modelled theoretical
total VAT receipts and actual VAT receipts. It is adjusted for timing factors where they can be
estimated. Changes in this estimate may reflect real-world changes in non-compliance or
measurement errors in estimating the theoretical total. We assume that the VAT gap in
2018-19 is marginally lower than a year earlier, before falling slowly over the forecast – reflecting previously announced compliance measures.
4.34 As set out at the start of this chapter, we do not assume any changes to the structure or
membership of tax systems for which there are common EU rules, including VAT. In a
discussion paper last year we described these issues and our Brexit assumptions.2
Onshore corporation tax
4.35 We expect onshore corporation tax receipts to have risen by 4.5 per cent in 2018-19. Solid
growth in receipts from industrial and commercial companies has offset falls in receipts
from both the financial and life assurance sectors.
4.36 Growth in onshore corporation tax is expected to slow further to less than 1 per cent in both
2019-20 and 2020-21. This primarily reflects:
• Weak profit growth: Profits for non-oil, non-financial companies are expected to grow
more slowly than nominal GDP over the next two years, reflecting the cyclical
weakness in GDP growth. We also assume that financial sector profit growth will lag
behind nominal GDP growth from 2020-21 onwards, since the sector is likely to be
disproportionately affected by the UK’s exit from the EU.
• Previously announced policy measures: The temporary rise in the annual investment
allowance to £1 million for two years will weigh on receipts in both 2019-20 and
2020-21. The reduction in the main rate of corporation tax from 19 to 17 per cent in
April 2020 will affect accrued receipts from 2020-21. By 2023-24, this rate cut is
expected to reduce receipts by £5.4 billion a year.
4.37 Relative to October, onshore corporation tax on a National Accounts accruals basis is £1.2
billion lower in 2018-19, but is £0.6 billion higher by 2023-24. This reflects the downward
revision to non-oil, non-financial profits taking around £0.5 billion off receipts in the latter
years of the forecast and several modelling changes:
• Modelling the time-shifting of cash receipts to be consistent with the National Accounts
accruals treatment involves generating a monthly profile for cash receipts. Updating
our assumptions has led to a smaller proportion of receipts falling in early 2019-20
(accruing back to 2018-19). This reduces 2018-19 accrued receipts by over £1 billion.
• Capital allowances modelling. We have reviewed the assumptions underlying our
capital allowances deduction forecast, which appear to have driven some of our recent
under-forecasting of corporation tax receipts. Revising down assumed growth in use of
2 OBR, Discussion paper No.3: Brexit and the OBR’s forecasts, October 2018.
83 Economic and fiscal outlook

Fiscal outlook
capital allowances adds progressively larger amounts to receipts, reaching around £1
billion a year by the end of the forecast.
4.38 For accounting periods starting in or after April 2019, companies with profits of over £20
million a year will have to make their quarterly instalment payments four months earlier
than under the current regime. Firms will start making payments three months (rather than
seven) after the start of their accounting period. This will provide a largely one-off boost to
cash receipts, particularly in 2019-20 and to a lesser extent in 2020-21, without changing
underlying tax liabilities. The ONS will change how cash receipts are time-shifted to proxy
accrued receipts to ensure as best it can that this change does not affect the path of accrued
receipts recorded in the National Accounts.
4.39 We have revised down our estimate for the effect of bringing forward instalment payments
on cash receipts by £2.4 billion in 2019-20 and by £1.7 billion in 2020-21. Most of this
revision is explained by changes to two key assumptions:
• The share of tax paid by quarterly instalment payers that will be subject to the new
regime has been revised down from around two-thirds to around a half. This reflects
HMRC’s latest analysis of companies’ corporation tax returns. This accounts for around
two-thirds of the total revision across the two years.
• The share of all corporation tax receipts paid by quarterly instalment payers is likely to
be revised down, as HMRC has identified an issue in the algorithm that splits its
monthly administrative data on cash payments and repayments between larger
quarterly payers and smaller annual payers. The size of this reallocation is uncertain,
but HMRC’s initial analysis suggests around £3 billion to £4 billion (around 5 to 7 per
cent of onshore corporation tax) could be shifted from quarterly to annual payers. This
assumption accounts for around a third of the downward revision.
4.40 We have only included the effect from this allocation issue in the costing for the instalment
regime change in this forecast. HMRC is currently carrying out further quality assurance of
its latest methodology for identifying different types of payments before it can be reflected in
the ONS public sector finances data. While total cash receipts will not change, the different
accruals methods for quarterly and annual payers will result in changes to both ONS
outturns and our forecasts on a National Accounts basis. All else equal, a greater share of
cash receipts coming from annual payers, where the payment lag is greater, will generate a
larger difference between cash and accrued receipts. But corporation tax modelling is
necessarily complex – reflecting the tax system being modelled – so the eventual effect of
any change is very uncertain. We will reflect the full implications of these changes in our
next forecast.
Economic and fiscal outlook 84

Fiscal outlook
Table 4.9: Key changes to the onshore corporation tax forecast since October
2018-19 2019-20 2020-21 2021-22 2022-23 2023-24
October forecast 57.3 57.4 57.0 58.0 60.5 62.9
March forecast 56.2 56.7 56.8 58.4 61.0 63.5
Change -1.2 -0.7 -0.2 0.3 0.5 0.6
Total -1.2 -0.7 -0.2 0.4 0.6 0.7
of which:
Industrial and commercial company profits -0.1 -0.3 -0.5 -0.6 -0.5 -0.5
Other economic determinants 0.0 -0.1 -0.1 -0.1 -0.1 0.0
Recostings 0.2 0.7 0.5 0.4 0.3 0.1
Modelling -1.2 -0.4 0.5 1.2 1.5 1.7
Outturn receipts -0.1 -0.6 -0.6 -0.6 -0.5 -0.5
Government decisions 0.0 0.0 0.0 -0.1 -0.1 -0.1
Effect of Government decisions
Underlying forecast changes
£ billion
Forecast
UK oil and gas revenues
4.41 We have revised our forecast for UK oil and gas revenues down in all years and by an
average of £0.6 billion a year. Table 4.10 breaks down the main sources of revision.
• Sterling oil and gas prices are lower across the forecast, reflecting movements since
October and their effect on futures prices (which drive our near-term forecast). This
reduces revenues by £1.6 billion a year on average from 2019-20 onwards.
• On the basis of the latest Stewardship Survey data from the Oil and Gas Authority, we
have revised total expenditure down across the forecast after unexpectedly weak
spending in 2018. We have revised total oil and gas production down marginally from
2019 onwards, again reflecting the latest survey data.3
3 As set out in Chapter 3, at the end of February BEIS announced an upward revision to the 2018 oil production data that we were not able to incorporate into our forecast as it was released after we had closed our pre-measures forecast. The latest estimate is that oil production in 2018 rose by 9.4 per cent on a year earlier, higher than the 1.7 per cent rise we had assumed in our forecast. The direct effect of this on our receipts forecast would be more muted than might be expected. Our model forecasts receipts growth from a 2018-19 receipts base and that base is generated by analysing oil and gas companies’ corporation tax instalment payments on 2018 liabilities, all of which have already been made. So higher 2018 production would not affect our forecast for 2018-19 receipts, but it could have knock-on effects to modelled growth rates when it is fed into HMRC’s detailed field-level forecasting model.
85 Economic and fiscal outlook
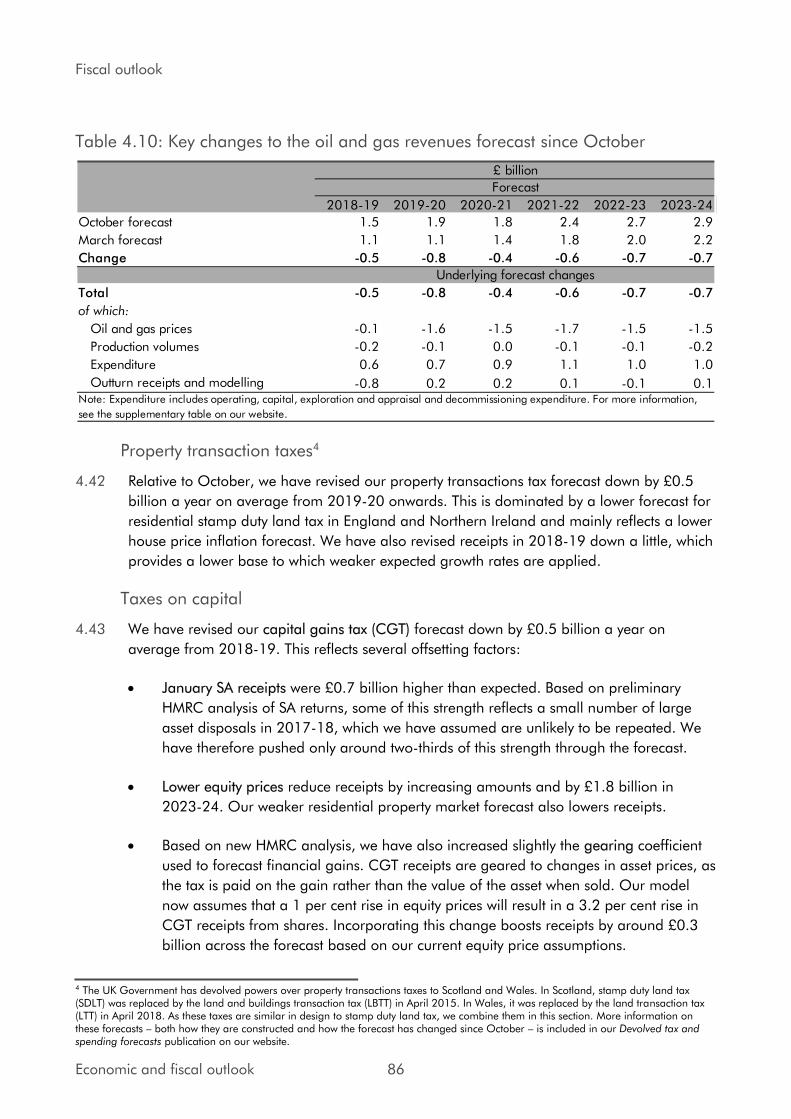
Fiscal outlook
Table 4.10: Key changes to the oil and gas revenues forecast since October
2018-19 2019-20 2020-21 2021-22 2022-23 2023-24
October forecast 1.5 1.9 1.8 2.4 2.7 2.9
March forecast 1.1 1.1 1.4 1.8 2.0 2.2
Change -0.5 -0.8 -0.4 -0.6 -0.7 -0.7
Total -0.5 -0.8 -0.4 -0.6 -0.7 -0.7
of which:
Oil and gas prices -0.1 -1.6 -1.5 -1.7 -1.5 -1.5
Production volumes -0.2 -0.1 0.0 -0.1 -0.1 -0.2
Expenditure 0.6 0.7 0.9 1.1 1.0 1.0
Outturn receipts and modelling -0.8 0.2 0.2 0.1 -0.1 0.1
Underlying forecast changes
Forecast
£ billion
Note: Expenditure includes operating, capital, exploration and appraisal and decommissioning expenditure. For more information,
see the supplementary table on our website.
Property transaction taxes4
4.42 Relative to October, we have revised our property transactions tax forecast down by £0.5
billion a year on average from 2019-20 onwards. This is dominated by a lower forecast for
residential stamp duty land tax in England and Northern Ireland and mainly reflects a lower
house price inflation forecast. We have also revised receipts in 2018-19 down a little, which
provides a lower base to which weaker expected growth rates are applied.
Taxes on capital
4.43 We have revised our capital gains tax (CGT) forecast down by £0.5 billion a year on
average from 2018-19. This reflects several offsetting factors:
• January SA receipts were £0.7 billion higher than expected. Based on preliminary
HMRC analysis of SA returns, some of this strength reflects a small number of large
asset disposals in 2017-18, which we have assumed are unlikely to be repeated. We
have therefore pushed only around two-thirds of this strength through the forecast.
• Lower equity prices reduce receipts by increasing amounts and by £1.8 billion in
2023-24. Our weaker residential property market forecast also lowers receipts.
• Based on new HMRC analysis, we have also increased slightly the gearing coefficient
used to forecast financial gains. CGT receipts are geared to changes in asset prices, as
the tax is paid on the gain rather than the value of the asset when sold. Our model
now assumes that a 1 per cent rise in equity prices will result in a 3.2 per cent rise in
CGT receipts from shares. Incorporating this change boosts receipts by around £0.3
billion across the forecast based on our current equity price assumptions.
4 The UK Government has devolved powers over property transactions taxes to Scotland and Wales. In Scotland, stamp duty land tax (SDLT) was replaced by the land and buildings transaction tax (LBTT) in April 2015. In Wales, it was replaced by the land transaction tax (LTT) in April 2018. As these taxes are similar in design to stamp duty land tax, we combine them in this section. More information on these forecasts – both how they are constructed and how the forecast has changed since October – is included in our Devolved tax and spending forecasts publication on our website.
Economic and fiscal outlook 86

Fiscal outlook
4.44 We have revised inheritance tax receipts down by £0.6 billion a year on average relative to
October. This largely reflects weaker equity and house prices, although receipts in 2018-19
have also come in slightly lower than expected. Since inheritance tax is typically received by
HMRC with a long lag, this is likely to reflect lower liabilities from previous years.
4.45 Having reviewed its initial plans, the Government has altered its proposed schedule of fees
payable for an application for a grant of probate. The new rates come into effect in April
and range between £250 and £6,000, depending on the value of the estate. Given the
structure of the fees, the Treasury expects the ONS to classify them as a tax on capital rather
than a payment for a service (which is treated as negative spending and had been factored
into the Ministry of Justice’s RDEL budget). This will add to receipts and spending equally,
because the new tax is offset by the removal of the negative spending from RDEL.
4.46 The new fee structure is expected to raise around £155 million a year. We have reduced our
inheritance tax forecast by around £5 million a year to reflect the incentive for individuals
with estates worth close to the new probate fee thresholds to reduce the value of their
estates to pay a lower fee. This effect is expected to be small, since the inheritance tax
liability itself already provides a significant incentive to reduce the value of estates.
Excise duties
4.47 Our fuel duties forecast is little changed since October. Receipts have been a little weaker
over the past few months, so we have revised down our 2018-19 estimate by just under
£0.1 billion – we assume that this effect persists. Offsetting that, lower oil prices reduce the
cost of driving, boosting revenues by £0.2 billion a year on average from 2019-20
onwards. Lower RPI inflation lowers the assumed duty path from 2020-21 onwards. As we
note in each forecast, these assumed duty rises have not been implemented for many years.
4.48 Alcohol duties are lower by £0.1 billion a year on average over the forecast period. This is
almost entirely explained by weaker-than-expected wine receipts over recent months. Since
changes to the duty uprating timetable in Autumn Budget 2017, the effect of forestalling
ahead of potential duty rate changes (which are now scheduled to take place in February
rather than April) has been more challenging to predict.
4.49 We have revised tobacco duties down by £0.1 billion a year on average relative to our
October forecast, reflecting weaker clearances in recent months. Monthly receipts have
been more volatile than usual in the past two years, again reflecting the new timetable of
duty uprating announced in Autumn Budget 2017. This generates significant uncertainty
around our forecast, although we expect this volatility to subside once the new uprating
timetable beds in. We have also made some minor changes to the specification of our
forecasting models, which together increase the forecast by £0.1 billion a year.
Business rates
4.50 Business rates are calculated by multiplying the rateable value of non-domestic property by
the ‘multiplier’, which is uprated by inflation, minus any reliefs. Since October, we have
revised our forecast up by an average of £0.4 billion a year. This reflects:
87 Economic and fiscal outlook

Fiscal outlook
• Lower CPI inflation reduces the multiplier later in the forecast, reducing receipts by an
average of £0.1 billion a year from 2021-22 onwards.
• We have incorporated the latest provisional information from local authorities about
expected yield in 2019-20. This suggests local authorities will raise more than
previously expected in future years, adding £0.2 billion a year on average.
• We have also removed an adjustment accounting for local authorities’ historical over-
forecasting of gross rates yield, based on provisional MHCLG analysis that suggests
this has fallen in recent years. This increases receipts by £0.3 billion a year.
Other taxes
4.51 Council tax receipts have been revised up by £0.6 billion a year on average from 2019-20
onwards. This reflects both policy measures and increases in our pre-measures forecast,
discussed in the local authority spending section of this chapter.
4.52 The revisions to our forecast for VAT refunds are uneven across years. Receipts have been
revised up in the near term, reflecting a higher path for government procurement and
investment, but have been revised down in the medium term as the growth in procurement
spending slows. The modest boost to RDEL announced in the Spring Statement generates a
slightly higher path for VAT refunds than would otherwise have been the case.
4.53 Environmental levies include levy-funded spending policies such as the renewables
obligation (RO), contracts for difference (CfD), feed-in tariffs, the capacity market scheme
and the warm home discount. We also include receipts from the ‘CRC energy efficiency scheme’ until its abolition from the 2018-19 compliance year.
4.54 The capacity markets scheme (that focuses on the security of electricity supply) has been
suspended following a European Court of Justice ruling that removed state aid approval of
the scheme. As such, payments cannot be made to those with capacity agreements until
state aid approval has been reinstated. The Government is working with the European
Commission to achieve this and its intention is to honour all outstanding capacity
agreement payments from all auctions held to date. When the scheme will achieve state aid
approval and resume is uncertain, so we have included only the payments made in 2018-
19 prior to the suspension of the scheme. Given the treatment of this scheme in the public
finances, this is neutral for net borrowing with an equal reduction in both tax and spending.
4.55 At the end of December, the European Commission announced that the UK would in effect
be suspended from issuing carbon allowances under the EU emissions trading system (ETS)
(with effect from 1 January 2019). This suspension will be lifted “on the day following the
one on which the ratification instruments concerning the Withdrawal Agreement are
deposited”.5 In response to this, the Government has not auctioned EU ETS allowances so
far in 2019. The Government will auction the 2019 allowances across the remainder of the
5 European Commission, Notice to stakeholders, Withdrawal of the United Kingdom and the EU Emissions Trading System (ETS), 19 December 2018.
Economic and fiscal outlook 88
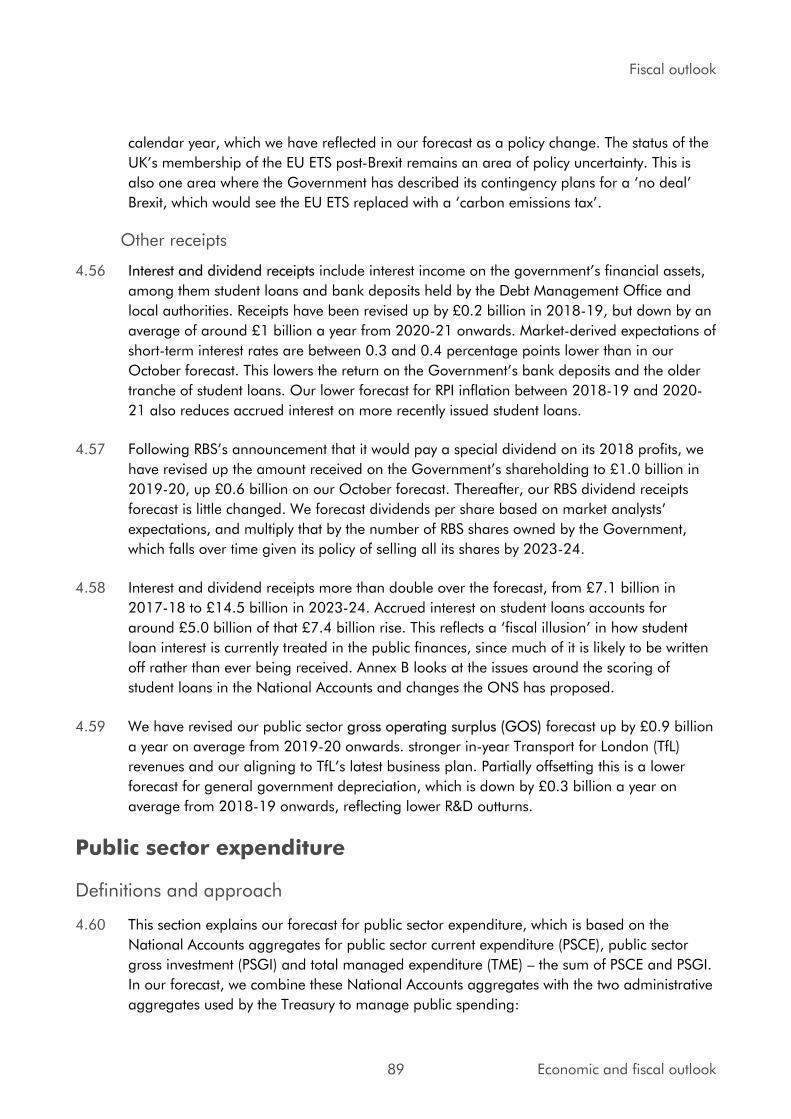
Fiscal outlook
calendar year, which we have reflected in our forecast as a policy change. The status of the
UK’s membership of the EU ETS post-Brexit remains an area of policy uncertainty. This is
also one area where the Government has described its contingency plans for a ‘no deal’ Brexit, which would see the EU ETS replaced with a ‘carbon emissions tax’.
Other receipts
4.56 Interest and dividend receipts include interest income on the government’s financial assets, among them student loans and bank deposits held by the Debt Management Office and
local authorities. Receipts have been revised up by £0.2 billion in 2018-19, but down by an
average of around £1 billion a year from 2020-21 onwards. Market-derived expectations of
short-term interest rates are between 0.3 and 0.4 percentage points lower than in our
October forecast. This lowers the return on the Government’s bank deposits and the older tranche of student loans. Our lower forecast for RPI inflation between 2018-19 and 2020-
21 also reduces accrued interest on more recently issued student loans.
4.57 Following RBS’s announcement that it would pay a special dividend on its 2018 profits, we have revised up the amount received on the Government’s shareholding to £1.0 billion in 2019-20, up £0.6 billion on our October forecast. Thereafter, our RBS dividend receipts
forecast is little changed. We forecast dividends per share based on market analysts’ expectations, and multiply that by the number of RBS shares owned by the Government,
which falls over time given its policy of selling all its shares by 2023-24.
4.58 Interest and dividend receipts more than double over the forecast, from £7.1 billion in
2017-18 to £14.5 billion in 2023-24. Accrued interest on student loans accounts for
around £5.0 billion of that £7.4 billion rise. This reflects a ‘fiscal illusion’ in how student
loan interest is currently treated in the public finances, since much of it is likely to be written
off rather than ever being received. Annex B looks at the issues around the scoring of
student loans in the National Accounts and changes the ONS has proposed.
4.59 We have revised our public sector gross operating surplus (GOS) forecast up by £0.9 billion
a year on average from 2019-20 onwards. stronger in-year Transport for London (TfL)
revenues and our aligning to TfL’s latest business plan. Partially offsetting this is a lower
forecast for general government depreciation, which is down by £0.3 billion a year on
average from 2018-19 onwards, reflecting lower R&D outturns.
Public sector expenditure
Definitions and approach
4.60 This section explains our forecast for public sector expenditure, which is based on the
National Accounts aggregates for public sector current expenditure (PSCE), public sector
gross investment (PSGI) and total managed expenditure (TME) – the sum of PSCE and PSGI.
In our forecast, we combine these National Accounts aggregates with the two administrative
aggregates used by the Treasury to manage public spending:
89 Economic and fiscal outlook
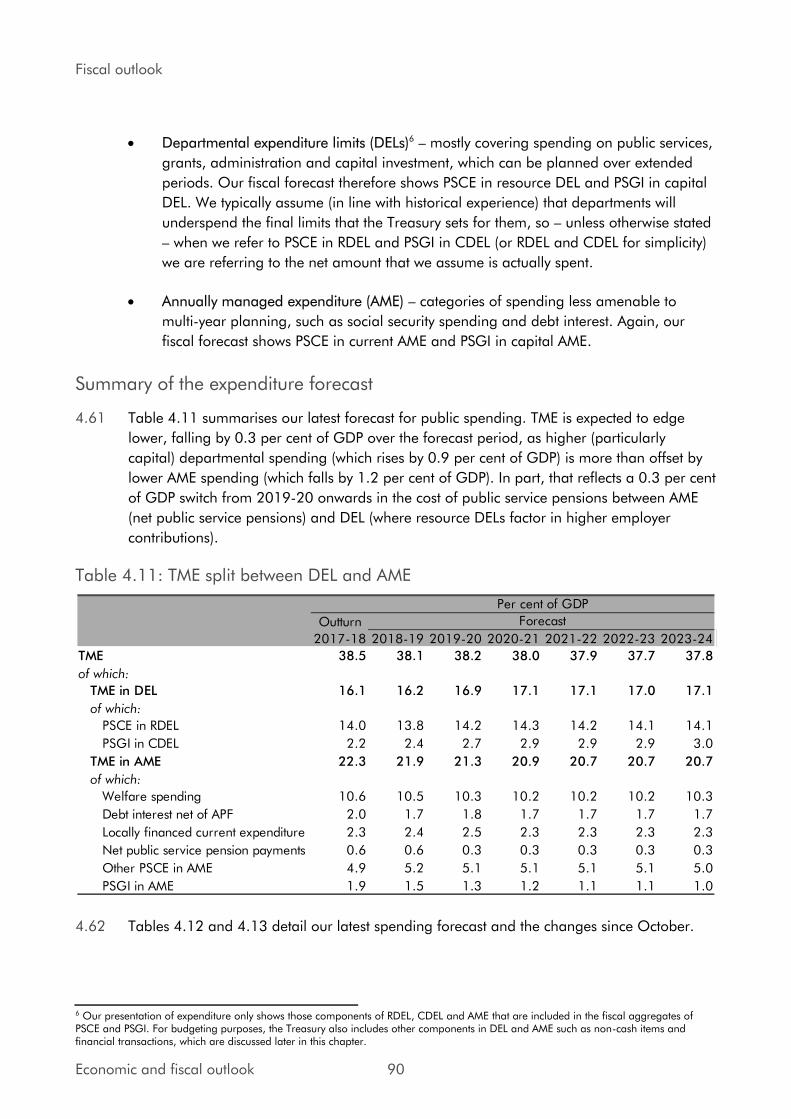
Fiscal outlook
• Departmental expenditure limits (DELs)6 – mostly covering spending on public services,
grants, administration and capital investment, which can be planned over extended
periods. Our fiscal forecast therefore shows PSCE in resource DEL and PSGI in capital
DEL. We typically assume (in line with historical experience) that departments will
underspend the final limits that the Treasury sets for them, so – unless otherwise stated
– when we refer to PSCE in RDEL and PSGI in CDEL (or RDEL and CDEL for simplicity)
we are referring to the net amount that we assume is actually spent.
• Annually managed expenditure (AME) – categories of spending less amenable to
multi-year planning, such as social security spending and debt interest. Again, our
fiscal forecast shows PSCE in current AME and PSGI in capital AME.
Summary of the expenditure forecast
4.61 Table 4.11 summarises our latest forecast for public spending. TME is expected to edge
lower, falling by 0.3 per cent of GDP over the forecast period, as higher (particularly
capital) departmental spending (which rises by 0.9 per cent of GDP) is more than offset by
lower AME spending (which falls by 1.2 per cent of GDP). In part, that reflects a 0.3 per cent
of GDP switch from 2019-20 onwards in the cost of public service pensions between AME
(net public service pensions) and DEL (where resource DELs factor in higher employer
contributions).
Table 4.11: TME split between DEL and AME
Outturn
2017-18 2018-19 2019-20 2020-21 2021-22 2022-23 2023-24
TME 38.5 38.1 38.2 38.0 37.9 37.7 37.8
of which:
TME in DEL 16.1 16.2 16.9 17.1 17.1 17.0 17.1
of which:
PSCE in RDEL 14.0 13.8 14.2 14.3 14.2 14.1 14.1
PSGI in CDEL 2.2 2.4 2.7 2.9 2.9 2.9 3.0
TME in AME 22.3 21.9 21.3 20.9 20.7 20.7 20.7
of which:
Welfare spending 10.6 10.5 10.3 10.2 10.2 10.2 10.3
Debt interest net of APF 2.0 1.7 1.8 1.7 1.7 1.7 1.7
Locally financed current expenditure 2.3 2.4 2.5 2.3 2.3 2.3 2.3
Net public service pension payments 0.6 0.6 0.3 0.3 0.3 0.3 0.3
Other PSCE in AME 4.9 5.2 5.1 5.1 5.1 5.1 5.0
PSGI in AME 1.9 1.5 1.3 1.2 1.1 1.1 1.0
Per cent of GDP
Forecast
4.62 Tables 4.12 and 4.13 detail our latest spending forecast and the changes since October.
6 Our presentation of expenditure only shows those components of RDEL, CDEL and AME that are included in the fiscal aggregates of PSCE and PSGI. For budgeting purposes, the Treasury also includes other components in DEL and AME such as non-cash items and financial transactions, which are discussed later in this chapter.
Economic and fiscal outlook 90
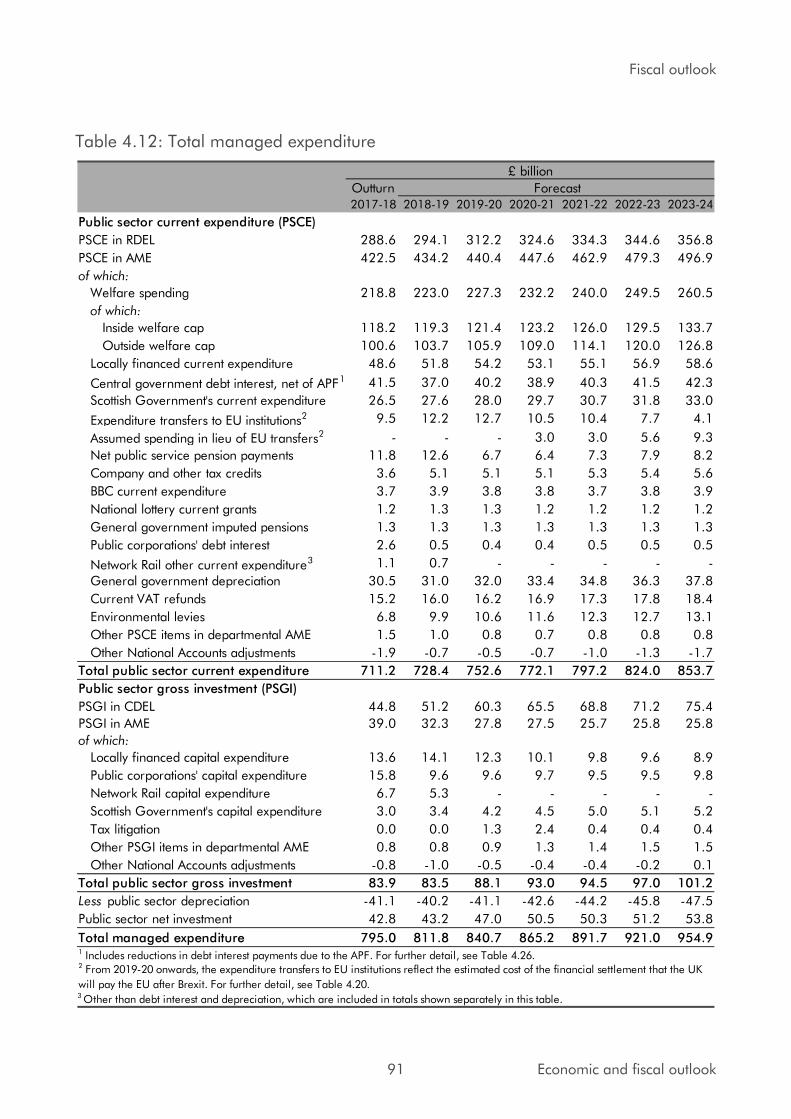
Fiscal outlook
Table 4.12: Total managed expenditure
Outturn2017-18 2018-19 2019-20 2020-21 2021-22 2022-23 2023-24
Public sector current expenditure (PSCE)
PSCE in RDEL 288.6 294.1 312.2 324.6 334.3 344.6 356.8
PSCE in AME 422.5 434.2 440.4 447.6 462.9 479.3 496.9
of which:
Welfare spending 218.8 223.0 227.3 232.2 240.0 249.5 260.5
of which:
Inside welfare cap 118.2 119.3 121.4 123.2 126.0 129.5 133.7
Outside welfare cap 100.6 103.7 105.9 109.0 114.1 120.0 126.8
Locally financed current expenditure 48.6 51.8 54.2 53.1 55.1 56.9 58.6
Central government debt interest, net of APF1 41.5 37.0 40.2 38.9 40.3 41.5 42.3
Scottish Government's current expenditure 26.5 27.6 28.0 29.7 30.7 31.8 33.0
Expenditure transfers to EU institutions2 9.5 12.2 12.7 10.5 10.4 7.7 4.1
Assumed spending in lieu of EU transfers2 - - - 3.0 3.0 5.6 9.3
Net public service pension payments 11.8 12.6 6.7 6.4 7.3 7.9 8.2
Company and other tax credits 3.6 5.1 5.1 5.1 5.3 5.4 5.6
BBC current expenditure 3.7 3.9 3.8 3.8 3.7 3.8 3.9
National lottery current grants 1.2 1.3 1.3 1.2 1.2 1.2 1.2
General government imputed pensions 1.3 1.3 1.3 1.3 1.3 1.3 1.3
Public corporations' debt interest 2.6 0.5 0.4 0.4 0.5 0.5 0.5
Network Rail other current expenditure3 1.1 0.7 - - - - -
General government depreciation 30.5 31.0 32.0 33.4 34.8 36.3 37.8
Current VAT refunds 15.2 16.0 16.2 16.9 17.3 17.8 18.4
Environmental levies 6.8 9.9 10.6 11.6 12.3 12.7 13.1
Other PSCE items in departmental AME 1.5 1.0 0.8 0.7 0.8 0.8 0.8
Other National Accounts adjustments -1.9 -0.7 -0.5 -0.7 -1.0 -1.3 -1.7
Total public sector current expenditure 711.2 728.4 752.6 772.1 797.2 824.0 853.7
Public sector gross investment (PSGI)
PSGI in CDEL 44.8 51.2 60.3 65.5 68.8 71.2 75.4
PSGI in AME 39.0 32.3 27.8 27.5 25.7 25.8 25.8
of which:
Locally financed capital expenditure 13.6 14.1 12.3 10.1 9.8 9.6 8.9
Public corporations' capital expenditure 15.8 9.6 9.6 9.7 9.5 9.5 9.8
Network Rail capital expenditure 6.7 5.3 - - - - -
Scottish Government's capital expenditure 3.0 3.4 4.2 4.5 5.0 5.1 5.2
Tax litigation 0.0 0.0 1.3 2.4 0.4 0.4 0.4
Other PSGI items in departmental AME 0.8 0.8 0.9 1.3 1.4 1.5 1.5
Other National Accounts adjustments -0.8 -1.0 -0.5 -0.4 -0.4 -0.2 0.1
Total public sector gross investment 83.9 83.5 88.1 93.0 94.5 97.0 101.2
Less public sector depreciation -41.1 -40.2 -41.1 -42.6 -44.2 -45.8 -47.5
Public sector net investment 42.8 43.2 47.0 50.5 50.3 51.2 53.8
Total managed expenditure 795.0 811.8 840.7 865.2 891.7 921.0 954.9
2 From 2019-20 onwards, the expenditure transfers to EU institutions reflect the estimated cost of the financial settlement that the UK
will pay the EU after Brexit. For further detail, see Table 4.20.
Forecast
£ billion
3 Other than debt interest and depreciation, which are included in totals shown separately in this table.
1 Includes reductions in debt interest payments due to the APF. For further detail, see Table 4.26.
91 Economic and fiscal outlook
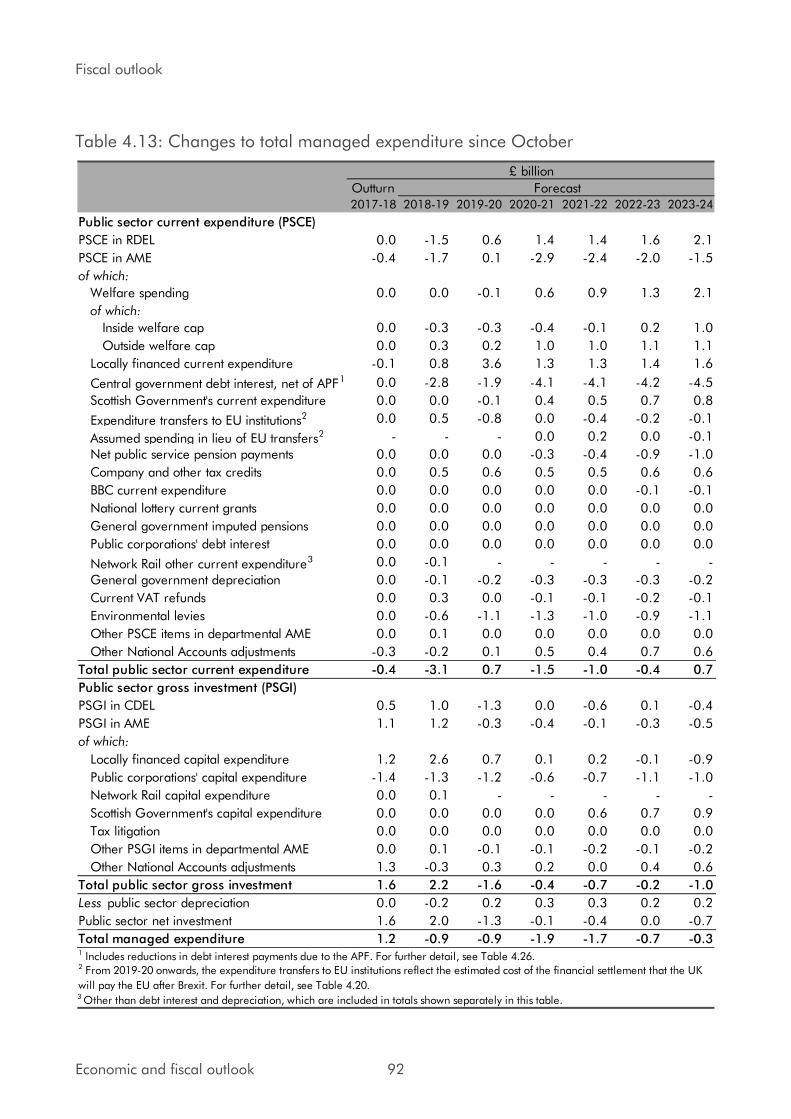
Fiscal outlook
Table 4.13: Changes to total managed expenditure since October
Outturn2017-18 2018-19 2019-20 2020-21 2021-22 2022-23 2023-24
Public sector current expenditure (PSCE)
PSCE in RDEL 0.0 -1.5 0.6 1.4 1.4 1.6 2.1
PSCE in AME -0.4 -1.7 0.1 -2.9 -2.4 -2.0 -1.5
of which:
Welfare spending 0.0 0.0 -0.1 0.6 0.9 1.3 2.1
of which:
Inside welfare cap 0.0 -0.3 -0.3 -0.4 -0.1 0.2 1.0
Outside welfare cap 0.0 0.3 0.2 1.0 1.0 1.1 1.1
Locally financed current expenditure -0.1 0.8 3.6 1.3 1.3 1.4 1.6
Central government debt interest, net of APF1 0.0 -2.8 -1.9 -4.1 -4.1 -4.2 -4.5
Scottish Government's current expenditure 0.0 0.0 -0.1 0.4 0.5 0.7 0.8
Expenditure transfers to EU institutions2 0.0 0.5 -0.8 0.0 -0.4 -0.2 -0.1
Assumed spending in lieu of EU transfers2 - - - 0.0 0.2 0.0 -0.1
Net public service pension payments 0.0 0.0 0.0 -0.3 -0.4 -0.9 -1.0
Company and other tax credits 0.0 0.5 0.6 0.5 0.5 0.6 0.6
BBC current expenditure 0.0 0.0 0.0 0.0 0.0 -0.1 -0.1
National lottery current grants 0.0 0.0 0.0 0.0 0.0 0.0 0.0
General government imputed pensions 0.0 0.0 0.0 0.0 0.0 0.0 0.0
Public corporations' debt interest 0.0 0.0 0.0 0.0 0.0 0.0 0.0
Network Rail other current expenditure3 0.0 -0.1 - - - - -
General government depreciation 0.0 -0.1 -0.2 -0.3 -0.3 -0.3 -0.2
Current VAT refunds 0.0 0.3 0.0 -0.1 -0.1 -0.2 -0.1
Environmental levies 0.0 -0.6 -1.1 -1.3 -1.0 -0.9 -1.1
Other PSCE items in departmental AME 0.0 0.1 0.0 0.0 0.0 0.0 0.0
Other National Accounts adjustments -0.3 -0.2 0.1 0.5 0.4 0.7 0.6
Total public sector current expenditure -0.4 -3.1 0.7 -1.5 -1.0 -0.4 0.7
Public sector gross investment (PSGI)
PSGI in CDEL 0.5 1.0 -1.3 0.0 -0.6 0.1 -0.4
PSGI in AME 1.1 1.2 -0.3 -0.4 -0.1 -0.3 -0.5
of which:
Locally financed capital expenditure 1.2 2.6 0.7 0.1 0.2 -0.1 -0.9
Public corporations' capital expenditure -1.4 -1.3 -1.2 -0.6 -0.7 -1.1 -1.0
Network Rail capital expenditure 0.0 0.1 - - - - -
Scottish Government's capital expenditure 0.0 0.0 0.0 0.0 0.6 0.7 0.9
Tax litigation 0.0 0.0 0.0 0.0 0.0 0.0 0.0
Other PSGI items in departmental AME 0.0 0.1 -0.1 -0.1 -0.2 -0.1 -0.2
Other National Accounts adjustments 1.3 -0.3 0.3 0.2 0.0 0.4 0.6
Total public sector gross investment 1.6 2.2 -1.6 -0.4 -0.7 -0.2 -1.0
Less public sector depreciation 0.0 -0.2 0.2 0.3 0.3 0.2 0.2
Public sector net investment 1.6 2.0 -1.3 -0.1 -0.4 0.0 -0.7
Total managed expenditure 1.2 -0.9 -0.9 -1.9 -1.7 -0.7 -0.3
Forecast
£ billion
1 Includes reductions in debt interest payments due to the APF. For further detail, see Table 4.26.2 From 2019-20 onwards, the expenditure transfers to EU institutions reflect the estimated cost of the financial settlement that the UK
will pay the EU after Brexit. For further detail, see Table 4.20.3 Other than debt interest and depreciation, which are included in totals shown separately in this table.
Economic and fiscal outlook 92
Fiscal outlook
4.63 Table 4.14 summarises the sources of changes to our forecast since October:
• Economy forecast changes have a mixed impact. Lower RPI inflation reduces debt
interest payments in 2018-19 by £2.8 billion. From 2019-20 onwards the net
(downward) effects are more modest, averaging £0.4 billion, reflecting temporarily
higher unemployment, and a more persistent downward revision to inflation and
upward one to earnings.
• Market-derived interest rate assumptions cut spending by increasing amounts through
the forecast, reaching £4.1 billion by 2023-24.
• DEL forecast changes reduce spending in 2018-19 and 2019-20 reflecting greater
expected underspends against RDEL budgets.
• Upward revisions to welfare spending forecast rise steadily to reach £1.5 billion in
2023-24, primarily driven by higher spending on disability benefits.
• Expenditure transfers to the EU are up in 2018-19 and down in 2019-20. This largely
reflects £0.4 billion of spending in calendar year 2019 shifting from 2019-20 into
2018-19. The 2019-20 surcharge is £0.3 billion lower than we assumed in October.
• Local authority self-financed current spending is higher by an average of £1.3 billion a
year. Abstracting from a spending-neutral current-to-capital switch, the rise mainly
reflects higher forecasts for council tax and retained business rates. The jump in 2019-
20 is due to a £1.2 billion increase in our forecast of authorities’ use of reserves.
• Locally financed capital expenditure and public corporations’ capital expenditure is down by an average of £0.5 billion a year, although the profile of revisions is uneven.
Abstracting from the current-to-capital switch, this reflects the latest in-year data, the
implications of the latest 2017-18 outturns and TfL’s latest business plan.
• The main Government decisions affecting this forecast include higher departmental
current and capital spending (RDEL and CDEL respectively). The Government has
added amounts rising to £1.7 billion a year by the end of the forecast. Other spending
measures relate to the Treasury’s Scottish block grant assumptions, welfare spending
measures and higher council tax boosting local authority spending. These add £1.1
billion a year on average from 2019-20 onwards.
93 Economic and fiscal outlook
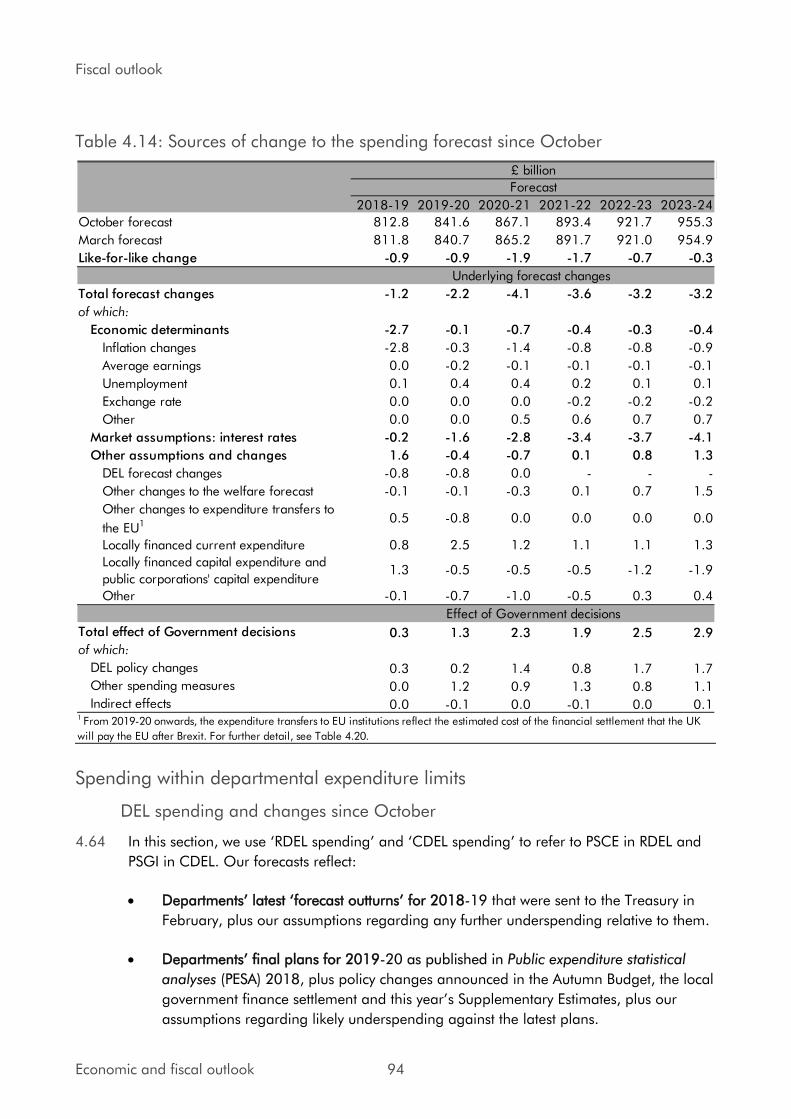
Fiscal outlook
Table 4.14: Sources of change to the spending forecast since October
2018-19 2019-20 2020-21 2021-22 2022-23 2023-24
October forecast 812.8 841.6 867.1 893.4 921.7 955.3
March forecast 811.8 840.7 865.2 891.7 921.0 954.9
Like-for-like change -0.9 -0.9 -1.9 -1.7 -0.7 -0.3
Total forecast changes -1.2 -2.2 -4.1 -3.6 -3.2 -3.2
of which:
Economic determinants -2.7 -0.1 -0.7 -0.4 -0.3 -0.4
Inflation changes -2.8 -0.3 -1.4 -0.8 -0.8 -0.9
Average earnings 0.0 -0.2 -0.1 -0.1 -0.1 -0.1
Unemployment 0.1 0.4 0.4 0.2 0.1 0.1
Exchange rate 0.0 0.0 0.0 -0.2 -0.2 -0.2
Other 0.0 0.0 0.5 0.6 0.7 0.7
Market assumptions: interest rates -0.2 -1.6 -2.8 -3.4 -3.7 -4.1
Other assumptions and changes 1.6 -0.4 -0.7 0.1 0.8 1.3
DEL forecast changes -0.8 -0.8 0.0 - - -
Other changes to the welfare forecast -0.1 -0.1 -0.3 0.1 0.7 1.5
Other changes to expenditure transfers to
the EU1 0.5 -0.8 0.0 0.0 0.0 0.0
Locally financed current expenditure 0.8 2.5 1.2 1.1 1.1 1.3
Locally financed capital expenditure and
public corporations' capital expenditure1.3 -0.5 -0.5 -0.5 -1.2 -1.9
Other -0.1 -0.7 -1.0 -0.5 0.3 0.4
Total effect of Government decisions 0.3 1.3 2.3 1.9 2.5 2.9
of which:
DEL policy changes 0.3 0.2 1.4 0.8 1.7 1.7
Other spending measures 0.0 1.2 0.9 1.3 0.8 1.1
Indirect effects 0.0 -0.1 0.0 -0.1 0.0 0.11 From 2019-20 onwards, the expenditure transfers to EU institutions reflect the estimated cost of the financial settlement that the UK
will pay the EU after Brexit. For further detail, see Table 4.20.
Forecast
£ billion
Effect of Government decisions
Underlying forecast changes
Spending within departmental expenditure limits
DEL spending and changes since October
4.64 In this section, we use ‘RDEL spending’ and ‘CDEL spending’ to refer to PSCE in RDEL and PSGI in CDEL. Our forecasts reflect:
• Departments’ latest ‘forecast outturns’ for 2018-19 that were sent to the Treasury in
February, plus our assumptions regarding any further underspending relative to them.
• Departments’ final plans for 2019-20 as published in Public expenditure statistical
analyses (PESA) 2018, plus policy changes announced in the Autumn Budget, the local
government finance settlement and this year’s Supplementary Estimates, plus our
assumptions regarding likely underspending against the latest plans.
Economic and fiscal outlook 94

Fiscal outlook
• The Government’s latest provisional total DELs for 2020-21 to 2023-24, in which it
has raised RDEL and lowered CDEL relative to the Budget totals. The departmental
allocation of these DELs will not be finalised until the 2019 Spending Review, with
some exceptions, notably the increased NHS England RDEL budget up to 2023-24 that
was set out by the Prime Minister last summer and was raised again in January.7
4.65 Table 4.15 shows our forecasts for resource (RDEL) and capital (CDEL) spending and overall
changes relative to our October forecast. It shows that:
• Actual resource spending has been revised up in each year from 2019-20 onwards, by
rising amounts, with extra spending reaching £2.1 billion in 2023-24.
• Actual capital spending has been revised down by £0.4 billion a year on average over
the same period, but with an uneven profile of revisions across years, primarily
reflecting offsetting changes in the Scottish Government spending profile.
4.66 In Table 4.15 we present plans, expected underspends and actual spending in every year.
For years covered by the Spending Review, plans have been set by the Treasury and our
forecasts for actual spending are generated by subtracting expected underspends. For
subsequent years, we ask the Government to set out its policy on actual RDEL and CDEL
spending and show the implied plans and underspends that we think would be consistent
with that (the shaded years in the table). The next Spending Review is due in 2019.
4.67 Table 4.15 also shows the changes in our forecasts for actual spending since October,
broken down into our underlying forecast judgements and the consequences of Government
policy decisions. Our only underlying forecast changes relate to RDEL underspending in
2018-19 and 2019-20, which we have revised up by £0.8 billion in each year. This reflects
the latest departmental forecasts for this year and the surprisingly large RDEL underspend in
2017-18, relative to the PESA plans for that year.
4.68 As regards policy decisions, the Chancellor has increased RDEL plans since October, on top
of the large increases announced then. There are two parts to the latest increase:
• The first raises non-NHS RDEL spending in cash terms sufficiently to hold spending flat
in real terms relative to our latest GDP deflator forecast and from a 2019-20 base that
reflects our latest underspend assumptions. This adds £0.5 billion a year on average
from 2019-20 onwards, rising to £0.8 billion in 2023-24.
• The second reflects further additional funding for the NHS to maintain the real terms
rise agreed between the Government and the NHS in June 2018 given our October
GDP deflator forecast. (In part, we revised our deflator forecast up due to the expected
effect of higher health spending on whole economy inflation) This addition rises to
£0.8 billion in 2023-24. The Treasury has told us that this now confirms the final RDEL
7 See ‘Prime Minister sets out 5-year NHS funding plan’, 18 June 2018, on the original boost to NHS funding, and ‘Secretary of State’s oral statement on the NHS long-term plan’, 7 January 2019, on the further boost relative to the figures set out by the Prime Minister.
95 Economic and fiscal outlook
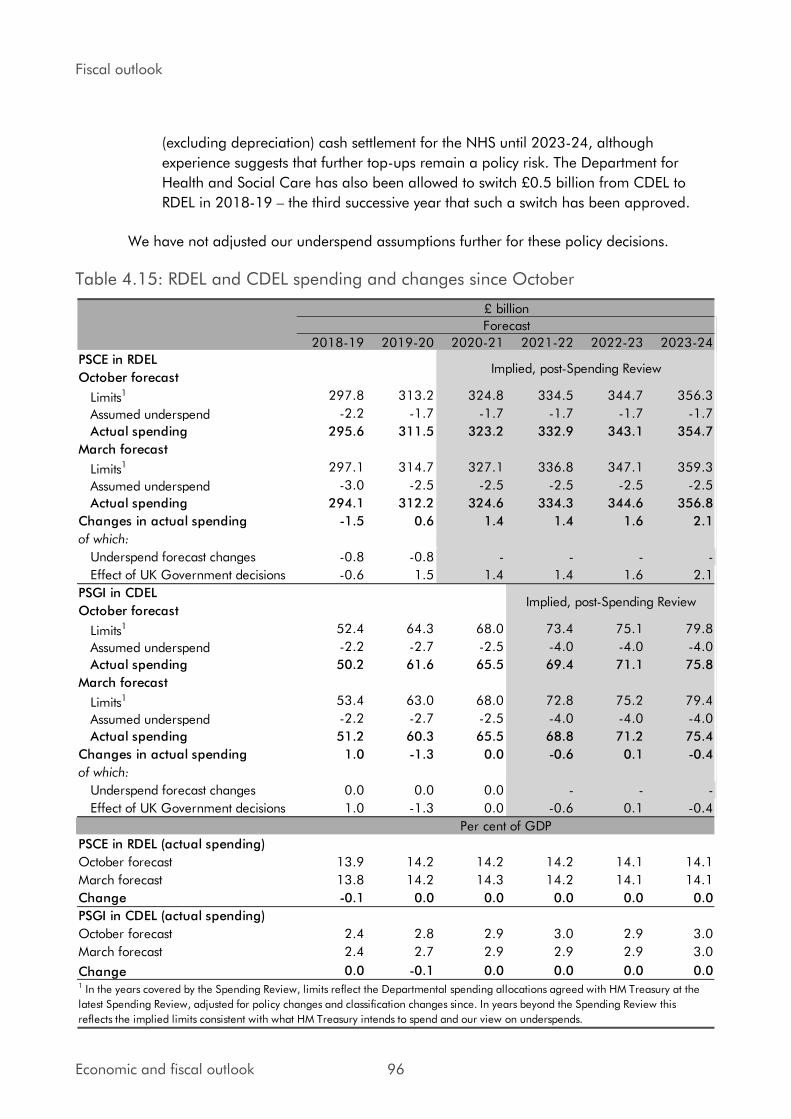
Fiscal outlook
(excluding depreciation) cash settlement for the NHS until 2023-24, although
experience suggests that further top-ups remain a policy risk. The Department for
Health and Social Care has also been allowed to switch £0.5 billion from CDEL to
RDEL in 2018-19 – the third successive year that such a switch has been approved.
We have not adjusted our underspend assumptions further for these policy decisions.
Table 4.15: RDEL and CDEL spending and changes since October
2018-19 2019-20 2020-21 2021-22 2022-23 2023-24
PSCE in RDEL
October forecast
Limits1 297.8 313.2 324.8 334.5 344.7 356.3
Assumed underspend -2.2 -1.7 -1.7 -1.7 -1.7 -1.7
Actual spending 295.6 311.5 323.2 332.9 343.1 354.7
March forecast
Limits1 297.1 314.7 327.1 336.8 347.1 359.3
Assumed underspend -3.0 -2.5 -2.5 -2.5 -2.5 -2.5
Actual spending 294.1 312.2 324.6 334.3 344.6 356.8
Changes in actual spending -1.5 0.6 1.4 1.4 1.6 2.1
of which:
Underspend forecast changes -0.8 -0.8 - - - -
Effect of UK Government decisions -0.6 1.5 1.4 1.4 1.6 2.1
PSGI in CDEL
October forecast
Limits1 52.4 64.3 68.0 73.4 75.1 79.8
Assumed underspend -2.2 -2.7 -2.5 -4.0 -4.0 -4.0
Actual spending 50.2 61.6 65.5 69.4 71.1 75.8
March forecast
Limits1 53.4 63.0 68.0 72.8 75.2 79.4
Assumed underspend -2.2 -2.7 -2.5 -4.0 -4.0 -4.0
Actual spending 51.2 60.3 65.5 68.8 71.2 75.4
Changes in actual spending 1.0 -1.3 0.0 -0.6 0.1 -0.4
of which:
Underspend forecast changes 0.0 0.0 0.0 - - -
Effect of UK Government decisions 1.0 -1.3 0.0 -0.6 0.1 -0.4
PSCE in RDEL (actual spending)
October forecast 13.9 14.2 14.2 14.2 14.1 14.1
March forecast 13.8 14.2 14.3 14.2 14.1 14.1
Change -0.1 0.0 0.0 0.0 0.0 0.0
PSGI in CDEL (actual spending)
October forecast 2.4 2.8 2.9 3.0 2.9 3.0
March forecast 2.4 2.7 2.9 2.9 2.9 3.0
Change 0.0 -0.1 0.0 0.0 0.0 0.0
Per cent of GDP
£ billion
Forecast
Implied, post-Spending Review
Implied, post-Spending Review
1 In the years covered by the Spending Review, limits reflect the Departmental spending allocations agreed with HM Treasury at the
latest Spending Review, adjusted for policy changes and classification changes since. In years beyond the Spending Review this
reflects the implied limits consistent with what HM Treasury intends to spend and our view on underspends.
Economic and fiscal outlook 96

Fiscal outlook
4.69 We have not made any changes to our forecast in respect of the £1.6 billion ‘Stronger Towns Fund’ announced by the Prime Minister on 4 March, as the Treasury has confirmed
that its cost will be met from within existing DEL totals in 2019-20 and 2020-21, creating a
modest further pressure on other budgets in those years, while the roughly £300 million a
year cost from 2021-22 onwards merely pre-allocates some of the envelope that will be
allocated in full in the Spending Review.
Annually managed expenditure
Welfare spending
4.70 Total welfare spending in our forecast refers to AME spending on social security and tax
credits. Just over half is subject to the Government’s ‘welfare cap’, which excludes the state pension and payments that are most sensitive to the economic cycle. We provide an update
on performance against the cap in Chapter 5.
4.71 As detailed in our 2018 Welfare trends report (WTR), much of our working-age welfare
spending forecast is constructed by estimating a counterfactual in which the ‘legacy’ benefits system continues as though universal credit (UC) did not exist, and then adding to it an
estimate of the marginal cost associated with rolling UC out. This allows us to base the
forecast on as much administrative data as possible, but it does not directly reflect the real-
world change in spending on legacy benefits as spending on UC rises. For the year in
progress, we forecast on an ‘actual cost’ basis, since the counterfactual and marginal effects
cannot be observed in the monthly flow of administrative data. This approach generates
several problems that add uncertainty to our forecasts, but is unavoidable at present. As
soon as is practical, we will switch to forecasting UC on an actual cost basis in all years.
4.72 Table 4.16 shows that welfare spending is forecast to increase by 17 per cent in cash terms
between 2018-19 and 2023-24 (but to fall by 0.2 per cent of GDP), reaching £260 billion
(10.3 per cent of GDP). Spending within the welfare cap is expected to rise by 12.1 per
cent, or 1.7 per cent in real terms (relative to CPI inflation). Spending outside the cap – which is dominated by state pensions – is projected to increase by 22.3 per cent, or 12.0
per cent in real terms. Spending outside the cap increases as a share of GDP later in the
forecast as the ageing population raises state pensions spending during a period in which
there are no offsetting downward pressures from increases in the State Pension age.
Table 4.16: Welfare spending forecast
Outturn
2017-18 2018-19 2019-20 2020-21 2021-22 2022-23 2023-24
Total welfare spending 218.8 223.0 227.3 232.2 240.0 249.5 260.5
of which:
Inside welfare cap 118.2 119.3 121.4 123.2 126.0 129.5 133.7
Outside welfare cap 100.6 103.7 105.9 109.0 114.1 120.0 126.8
Total welfare spending 10.6 10.5 10.3 10.2 10.2 10.2 10.3
of which:
Inside welfare cap 5.7 5.6 5.5 5.4 5.3 5.3 5.3Outside welfare cap 4.9 4.9 4.8 4.8 4.8 4.9 5.0
£ billion
Forecast
Per cent of GDP
97 Economic and fiscal outlook
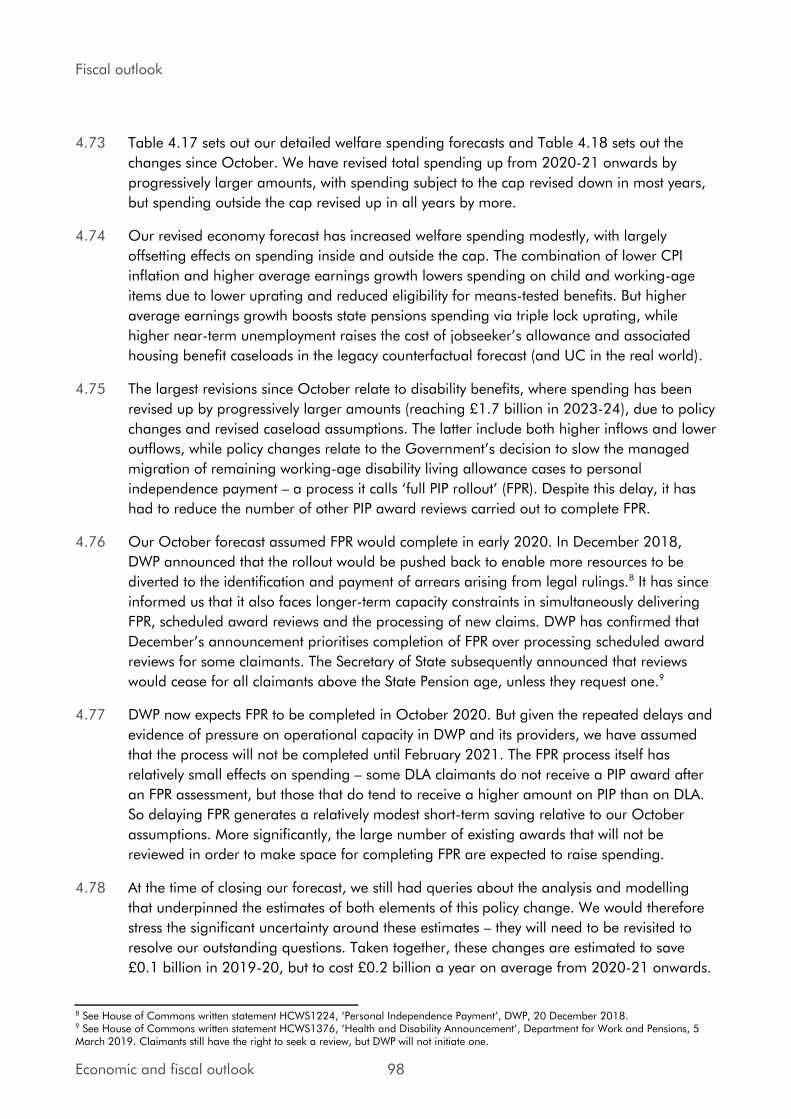
Fiscal outlook
4.73 Table 4.17 sets out our detailed welfare spending forecasts and Table 4.18 sets out the
changes since October. We have revised total spending up from 2020-21 onwards by
progressively larger amounts, with spending subject to the cap revised down in most years,
but spending outside the cap revised up in all years by more.
4.74 Our revised economy forecast has increased welfare spending modestly, with largely
offsetting effects on spending inside and outside the cap. The combination of lower CPI
inflation and higher average earnings growth lowers spending on child and working-age
items due to lower uprating and reduced eligibility for means-tested benefits. But higher
average earnings growth boosts state pensions spending via triple lock uprating, while
higher near-term unemployment raises the cost of jobseeker’s allowance and associated housing benefit caseloads in the legacy counterfactual forecast (and UC in the real world).
4.75 The largest revisions since October relate to disability benefits, where spending has been
revised up by progressively larger amounts (reaching £1.7 billion in 2023-24), due to policy
changes and revised caseload assumptions. The latter include both higher inflows and lower
outflows, while policy changes relate to the Government’s decision to slow the managed migration of remaining working-age disability living allowance cases to personal
independence payment – a process it calls ‘full PIP rollout’ (FPR). Despite this delay, it has had to reduce the number of other PIP award reviews carried out to complete FPR.
4.76 Our October forecast assumed FPR would complete in early 2020. In December 2018,
DWP announced that the rollout would be pushed back to enable more resources to be
diverted to the identification and payment of arrears arising from legal rulings.8 It has since
informed us that it also faces longer-term capacity constraints in simultaneously delivering
FPR, scheduled award reviews and the processing of new claims. DWP has confirmed that
December’s announcement prioritises completion of FPR over processing scheduled award
reviews for some claimants. The Secretary of State subsequently announced that reviews
would cease for all claimants above the State Pension age, unless they request one.9
4.77 DWP now expects FPR to be completed in October 2020. But given the repeated delays and
evidence of pressure on operational capacity in DWP and its providers, we have assumed
that the process will not be completed until February 2021. The FPR process itself has
relatively small effects on spending – some DLA claimants do not receive a PIP award after
an FPR assessment, but those that do tend to receive a higher amount on PIP than on DLA.
So delaying FPR generates a relatively modest short-term saving relative to our October
assumptions. More significantly, the large number of existing awards that will not be
reviewed in order to make space for completing FPR are expected to raise spending.
4.78 At the time of closing our forecast, we still had queries about the analysis and modelling
that underpinned the estimates of both elements of this policy change. We would therefore
stress the significant uncertainty around these estimates – they will need to be revisited to
resolve our outstanding questions. Taken together, these changes are estimated to save
£0.1 billion in 2019-20, but to cost £0.2 billion a year on average from 2020-21 onwards.
8 See House of Commons written statement HCWS1224, ‘Personal Independence Payment’, DWP, 20 December 2018. 9 See House of Commons written statement HCWS1376, ‘Health and Disability Announcement’, Department for Work and Pensions, 5 March 2019. Claimants still have the right to seek a review, but DWP will not initiate one.
Economic and fiscal outlook 98
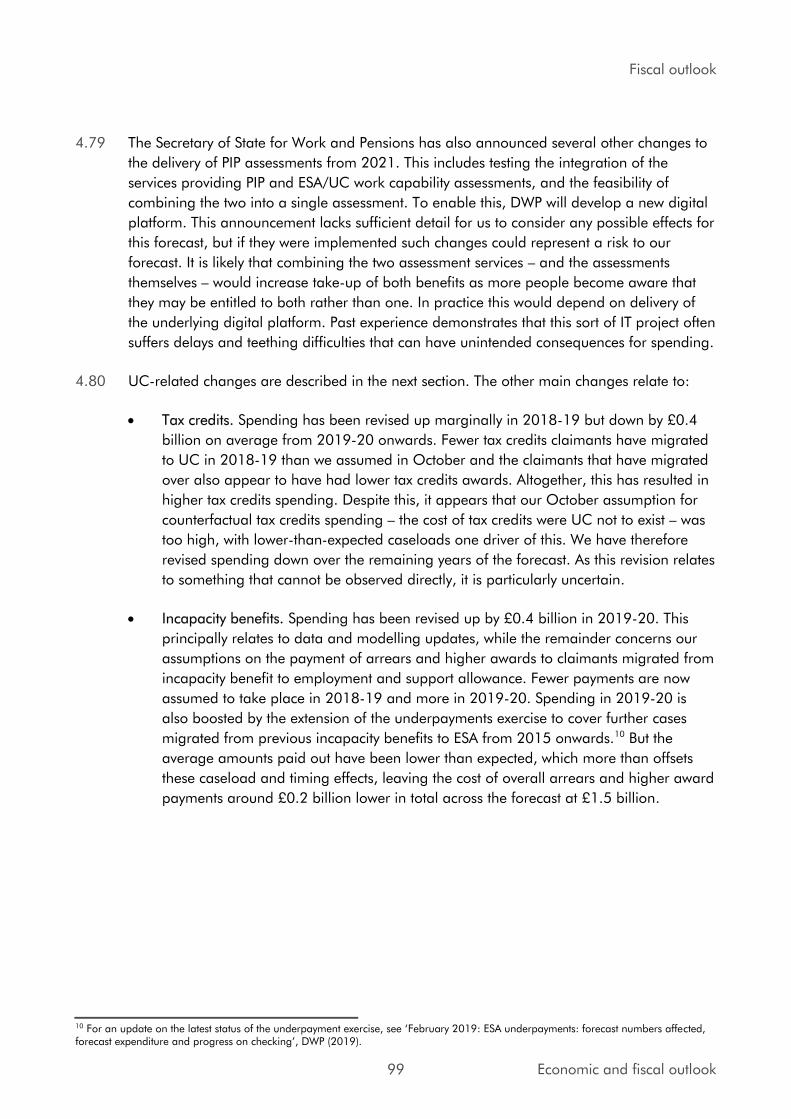
Fiscal outlook
4.79 The Secretary of State for Work and Pensions has also announced several other changes to
the delivery of PIP assessments from 2021. This includes testing the integration of the
services providing PIP and ESA/UC work capability assessments, and the feasibility of
combining the two into a single assessment. To enable this, DWP will develop a new digital
platform. This announcement lacks sufficient detail for us to consider any possible effects for
this forecast, but if they were implemented such changes could represent a risk to our
forecast. It is likely that combining the two assessment services – and the assessments
themselves – would increase take-up of both benefits as more people become aware that
they may be entitled to both rather than one. In practice this would depend on delivery of
the underlying digital platform. Past experience demonstrates that this sort of IT project often
suffers delays and teething difficulties that can have unintended consequences for spending.
4.80 UC-related changes are described in the next section. The other main changes relate to:
• Tax credits. Spending has been revised up marginally in 2018-19 but down by £0.4
billion on average from 2019-20 onwards. Fewer tax credits claimants have migrated
to UC in 2018-19 than we assumed in October and the claimants that have migrated
over also appear to have had lower tax credits awards. Altogether, this has resulted in
higher tax credits spending. Despite this, it appears that our October assumption for
counterfactual tax credits spending – the cost of tax credits were UC not to exist – was
too high, with lower-than-expected caseloads one driver of this. We have therefore
revised spending down over the remaining years of the forecast. As this revision relates
to something that cannot be observed directly, it is particularly uncertain.
• Incapacity benefits. Spending has been revised up by £0.4 billion in 2019-20. This
principally relates to data and modelling updates, while the remainder concerns our
assumptions on the payment of arrears and higher awards to claimants migrated from
incapacity benefit to employment and support allowance. Fewer payments are now
assumed to take place in 2018-19 and more in 2019-20. Spending in 2019-20 is
also boosted by the extension of the underpayments exercise to cover further cases
migrated from previous incapacity benefits to ESA from 2015 onwards.10 But the
average amounts paid out have been lower than expected, which more than offsets
these caseload and timing effects, leaving the cost of overall arrears and higher award
payments around £0.2 billion lower in total across the forecast at £1.5 billion.
10 For an update on the latest status of the underpayment exercise, see ‘February 2019: ESA underpayments: forecast numbers affected, forecast expenditure and progress on checking’, DWP (2019).
99 Economic and fiscal outlook
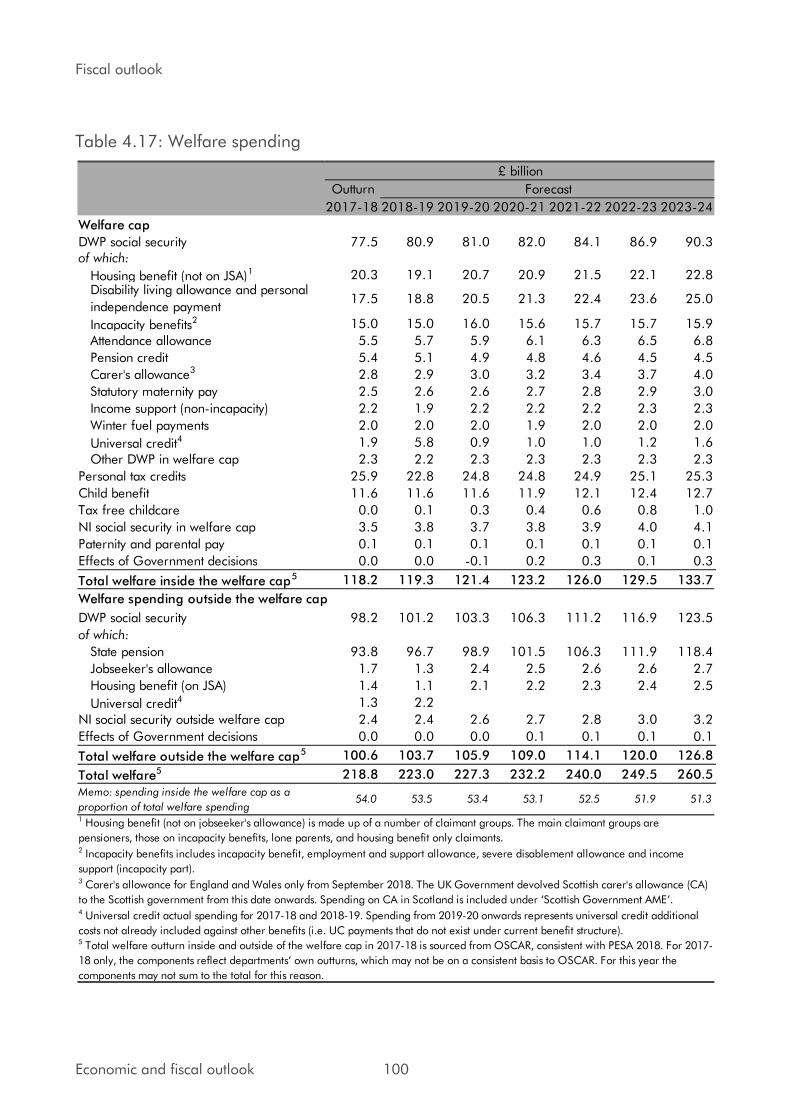
Fiscal outlook
Table 4.17: Welfare spending
Outturn
2017-18 2018-19 2019-20 2020-21 2021-22 2022-23 2023-24
Welfare cap
DWP social security 77.5 80.9 81.0 82.0 84.1 86.9 90.3of which:
Housing benefit (not on JSA)1 20.3 19.1 20.7 20.9 21.5 22.1 22.8Disability living allowance and personal
independence payment17.5 18.8 20.5 21.3 22.4 23.6 25.0
Incapacity benefits2 15.0 15.0 16.0 15.6 15.7 15.7 15.9
Attendance allowance 5.5 5.7 5.9 6.1 6.3 6.5 6.8
Pension credit 5.4 5.1 4.9 4.8 4.6 4.5 4.5
Carer's allowance3 2.8 2.9 3.0 3.2 3.4 3.7 4.0
Statutory maternity pay 2.5 2.6 2.6 2.7 2.8 2.9 3.0
Income support (non-incapacity) 2.2 1.9 2.2 2.2 2.2 2.3 2.3
Winter fuel payments 2.0 2.0 2.0 1.9 2.0 2.0 2.0
Universal credit4 1.9 5.8 0.9 1.0 1.0 1.2 1.6
Other DWP in welfare cap 2.3 2.2 2.3 2.3 2.3 2.3 2.3
Personal tax credits 25.9 22.8 24.8 24.8 24.9 25.1 25.3
Child benefit 11.6 11.6 11.6 11.9 12.1 12.4 12.7
Tax free childcare 0.0 0.1 0.3 0.4 0.6 0.8 1.0
NI social security in welfare cap 3.5 3.8 3.7 3.8 3.9 4.0 4.1
Paternity and parental pay 0.1 0.1 0.1 0.1 0.1 0.1 0.1
Effects of Government decisions 0.0 0.0 -0.1 0.2 0.3 0.1 0.3
Total welfare inside the welfare cap5 118.2 119.3 121.4 123.2 126.0 129.5 133.7
Welfare spending outside the welfare cap
DWP social security 98.2 101.2 103.3 106.3 111.2 116.9 123.5
of which:
State pension 93.8 96.7 98.9 101.5 106.3 111.9 118.4
Jobseeker's allowance 1.7 1.3 2.4 2.5 2.6 2.6 2.7
Housing benefit (on JSA) 1.4 1.1 2.1 2.2 2.3 2.4 2.5
Universal credit4 1.3 2.2
NI social security outside welfare cap 2.4 2.4 2.6 2.7 2.8 3.0 3.2
Effects of Government decisions 0.0 0.0 0.0 0.1 0.1 0.1 0.1
Total welfare outside the welfare cap5 100.6 103.7 105.9 109.0 114.1 120.0 126.8
Total welfare5 218.8 223.0 227.3 232.2 240.0 249.5 260.5
Memo: spending inside the welfare cap as a
proportion of total welfare spending54.0 53.5 53.4 53.1 52.5 51.9 51.3
Forecast
£ billion
1 Housing benefit (not on jobseeker's allowance) is made up of a number of claimant groups. The main claimant groups are
pensioners, those on incapacity benefits, lone parents, and housing benefit only claimants.2 Incapacity benefits includes incapacity benefit, employment and support allowance, severe disablement allowance and income
support (incapacity part).
4 Universal credit actual spending for 2017-18 and 2018-19. Spending from 2019-20 onwards represents universal credit additional
costs not already included against other benefits (i.e. UC payments that do not exist under current benefit structure).5 Total welfare outturn inside and outside of the welfare cap in 2017-18 is sourced from OSCAR, consistent with PESA 2018. For 2017-
18 only, the components reflect departments’ own outturns, which may not be on a consistent basis to OSCAR. For this year the
components may not sum to the total for this reason.
3 Carer's allowance for England and Wales only from September 2018. The UK Government devolved Scottish carer's allowance (CA)
to the Scottish government from this date onwards. Spending on CA in Scotland is included under ‘Scottish Government AME’.
Economic and fiscal outlook 100

Fiscal outlook
Table 4.18: Sources of change to welfare spending since October
Outturn
2017-18 2018-19 2019-20 2020-21 2021-22 2022-23 2023-24
Total welfare spending
October forecast 218.8 223.0 227.4 231.6 239.1 248.2 258.4
March forecast 218.8 223.0 227.3 232.2 240.0 249.5 260.5
Change 0.0 0.0 -0.1 0.6 0.9 1.3 2.1
Welfare spending inside the welfare cap
October forecast 118.2 119.6 121.7 123.6 126.1 129.3 132.7
March forecast 118.2 119.3 121.4 123.2 126.0 129.5 133.7
Change 0.0 -0.3 -0.3 -0.4 -0.1 0.2 1.0
of which:
Economic determinants 0.0 -0.1 -0.3 -0.2 -0.4 -0.5 -0.6
Estimating/modelling changes 0.0 -0.3 0.1 -0.4 -0.1 0.5 1.3
Personal tax credits 0.0 0.1 -0.4 -0.4 -0.4 -0.4 -0.4
Universal credit 0.0 -0.6 -0.2 -0.2 -0.2 -0.3 -0.3
Housing benefit 0.0 0.1 0.1 -0.2 -0.1 0.1 0.3
Incapacity benefits1 0.0 0.0 0.4 0.0 0.0 0.0 0.1
Disability benefits2 0.0 0.1 0.4 0.7 0.9 1.2 1.5
Child benefit -0.1 -0.1 -0.1 -0.1 -0.1 -0.1 -0.1
Carer's allowance 0.0 0.0 0.0 0.0 0.0 0.1 0.3
Other 0.1 0.0 -0.1 -0.2 -0.1 0.0 0.0
Effects of Government decisions 0.0 0.0 -0.1 0.2 0.3 0.1 0.3
Other 0.0 0.0 0.0 0.0 0.0 0.0 0.0
Welfare spending outside the welfare cap
October forecast 100.6 103.4 105.7 108.0 113.0 118.9 125.7
March forecast 100.6 103.7 105.9 109.0 114.1 120.0 126.8
Change 0.0 0.3 0.2 1.0 1.0 1.1 1.1
of which:
Economic determinants 0.0 0.1 0.4 0.9 0.8 0.8 0.8
CPI inflation 0.0 0.0 -0.1 0.0 -0.1 -0.1 -0.1
Unemployment 0.0 0.1 0.4 0.4 0.2 0.1 0.1
Triple lock 0.0 0.0 0.0 0.6 0.7 0.9 0.9
Other 0.0 0.0 0.0 0.0 -0.1 -0.1 -0.1
Estimating/modelling changes 0.0 0.2 -0.2 0.0 0.1 0.2 0.2
State pension 0.0 0.0 0.0 0.1 0.2 0.2 0.2
Jobseeker's allowance 0.0 -0.1 0.0 0.0 0.1 0.1 0.1
Housing benefit 0.0 -0.1 -0.2 -0.1 -0.1 -0.1 -0.1
Other 0.0 0.4 0.0 0.0 0.0 0.0 0.0
Effects of Government decisions 0.0 0.0 0.0 0.1 0.1 0.1 0.1
Other 0.1 0.0 0.0 0.0 0.0 0.0 0.0
Forecast
£ billion
1 Incapacity benefits includes incapacity benefit, employment and support allowance, severe disablement allowance and income
support (incapacity part).2 Disability benefits refers to disability living allowance and personal independence payment.
Universal credit
4.81 Large revisions to actual spending on UC inside and outside the welfare cap partially offset
to give a small downward revision to total UC spending in 2018-19 of £0.2 billion. UC
cases that would have received tax credits or ESA under the legacy system have been lower
than expected, but those that would have received jobseeker’s allowance have been higher.
101 Economic and fiscal outlook

Fiscal outlook
4.82 From 2019-20 onwards – the period in which UC is forecast on a marginal cost basis
relative to the legacy system – spending has been revised down by £0.2 billion on average.
Around half of this relates to data and modelling updates, with the remainder due to revised
costings of the Autumn Budget 2018 UC package, discussed in Annex A.
4.83 Following the Secretary of State for Work and Pensions’ 11 January speech on UC, we have incorporated the effect of two UC policies into this forecast. The first reverses the part of the
policy limiting child-related UC awards for particular claims where all the family’s three or
more children were born before 6 April 2017 (along with some exceptions after that date).
As this would only have applied to new claims from families that had not claimed benefits in
the preceding six months, the cost of not implementing it is relatively modest: £0.3 billion in
total over the forecast period. In the long term this has no cost because ultimately all
children in the UC caseload will have been born after April 2017 and will therefore be
subject to the two-child limit policy that applies to children born after that date.
4.84 The Government has then reshaped the UC managed migration profile in a way that lowers
the cost of UC by £0.2 billion over the next five years – broadly offsetting the cost of the
reversal on the two child-limit policy. This includes the effect of the Secretary of State’s January announcement that, rather than beginning managed migration in earnest in July
2019, it will commence with a 12-month pilot limited to just 10,000 claimants. Parliament
will then vote on further regulations before it is extended to more claimants. DWP then plans
to migrate more slowly initially than in October, before ramping up activity to complete the
migration by December 2023.
4.85 In our October forecast, we added a six-month contingency to the start and end of DWP’s extant rollout plan. We still assume that the managed migration will end six months later
than DWP intends, spreading out the final 12-month high-volume phase in DWP’s plan over a more achievable 18-month period. That said, we now see less risk that the pilot phase will
be delayed and have greater confidence that the gradual build-up in volumes that follows
can be delivered. In part, this is because the Government has reduced volumes to well
below DWP’s operational capacity in order to reduce the costs associated with transitional
protection for claimants who would otherwise lose out relative to their legacy benefit claim
and those associated with claimants who would gain from UC relative to legacy benefits but
are only expected to move to UC via managed migration. We have therefore removed the
six-month contingency from all but the final phase of DWP’s rollout plan, assuming that it
ends in June 2024 (Chart 4.3).
4.86 The main outstanding risks to the managed migration timetable are the Parliamentary
hurdle to be cleared after the pilot phase and the ramp-up in volumes between 2021-22
and 2022-23, where past experience indicates that when sharp rises in delivery volumes are
planned they are often revised to be more gradual when the time comes to deliver them.
4.87 More generally, UC has been an area where Government policy has changed frequently,
often reflecting pressure from Parliament to modify particular elements that are less
generous than in the legacy system. Despite UC now being expected to cost more overall
than the legacy system, there are still individual elements of it that are expected to save
Economic and fiscal outlook 102

Fiscal outlook
money. As the number of people subject to these elements grows, calls for further policy
changes could arise.
Chart 4.3: Successive revisions to the universal credit rollout assumption
0
2
4
6
8
10
2014-15 2015-16 2016-17 2017-18 2018-19 2019-20 2020-21 2021-22 2022-23 2023-24
Ave
rage c
ase
load (m
illions)
March 2013 assumption
Successive DWP assumptions and forecasts
Successive OBR assumptions and forecasts
October 2018 OBR
March 2019 OBR
Source: DWP, OBR
Public service pensions
4.88 Our net public service pensions forecast covers gross expenditure on benefits paid, less
employer and employee contributions received. (The corresponding spending by
departments on employer contributions is included within RDEL.) It includes central
government pay-as-you-go schemes and locally-administered police and firefighters’
schemes.11 A breakdown of spending and income for the major schemes we cover is
included in the supplementary tables on our website.
4.89 Table 4.19 details the changes to our forecast since October. Net spending has been
revised down by an average of £0.6 billion a year from 2020-21 onwards due to:
• Slightly lower gross expenditure, mostly reflecting our lower CPI inflation forecast,
which affects the uprating of pensions in payment.
• Higher income from contributions in most years. In part, this reflects the removal of an
earlier top-down adjustment that accounted for Autumn Budget 2017 pay and wider
DEL measures and which should have been removed when it was superseded by
subsequent increases in DEL plans and the consequent increases in receipts. Teachers’
pension scheme (TPS) receipts have been revised up a little, due to a technical change
in how the higher employer contribution rate in academic year 2019-20 is reflected in
our fiscal year forecast. The Government’s latest increases to DEL spending also raise pension scheme receipts by small amounts.
11 The police and firefighters’ pension schemes are administered at a local level, but pensions in payment are funded from AME, along with other public service pension schemes. They are therefore included in our pensions forecast.
103 Economic and fiscal outlook
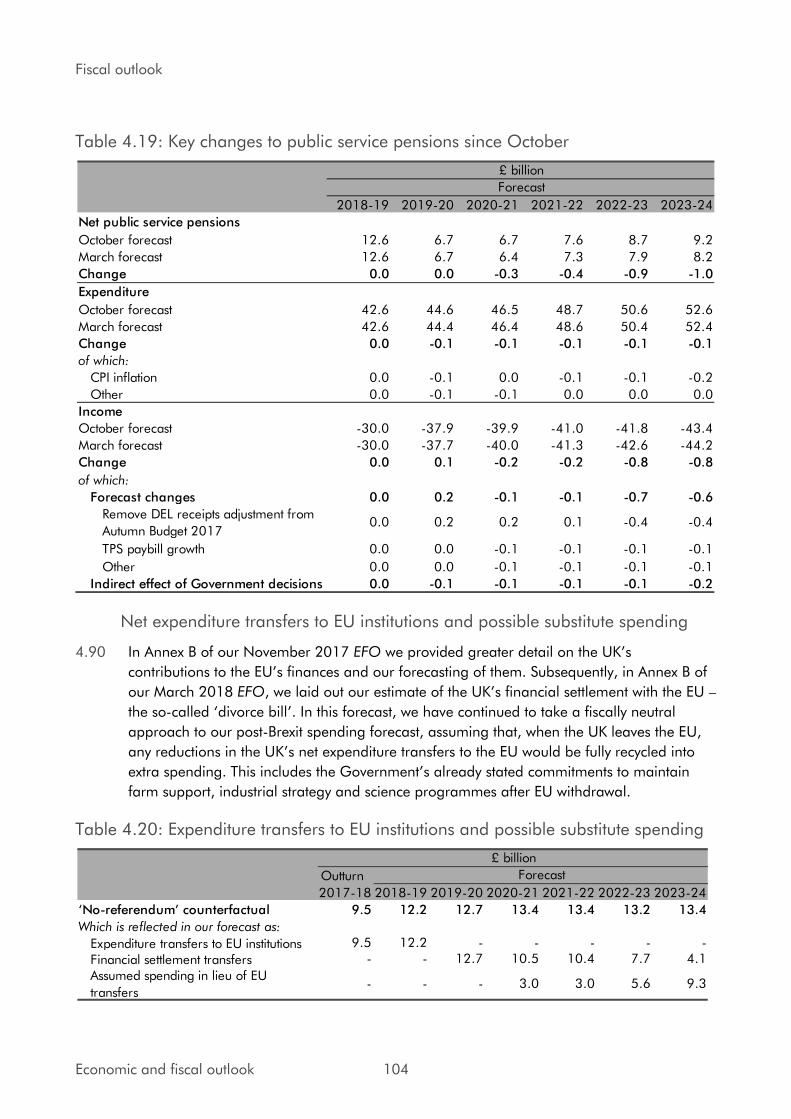
Fiscal outlook
Table 4.19: Key changes to public service pensions since October
2018-19 2019-20 2020-21 2021-22 2022-23 2023-24
Net public service pensions
October forecast 12.6 6.7 6.7 7.6 8.7 9.2
March forecast 12.6 6.7 6.4 7.3 7.9 8.2
Change 0.0 0.0 -0.3 -0.4 -0.9 -1.0
Expenditure
October forecast 42.6 44.6 46.5 48.7 50.6 52.6
March forecast 42.6 44.4 46.4 48.6 50.4 52.4
Change 0.0 -0.1 -0.1 -0.1 -0.1 -0.1
of which:
CPI inflation 0.0 -0.1 0.0 -0.1 -0.1 -0.2
Other 0.0 -0.1 -0.1 0.0 0.0 0.0
Income
October forecast -30.0 -37.9 -39.9 -41.0 -41.8 -43.4
March forecast -30.0 -37.7 -40.0 -41.3 -42.6 -44.2
Change 0.0 0.1 -0.2 -0.2 -0.8 -0.8
of which:
Forecast changes 0.0 0.2 -0.1 -0.1 -0.7 -0.6
Remove DEL receipts adjustment from
Autumn Budget 20170.0 0.2 0.2 0.1 -0.4 -0.4
TPS paybill growth 0.0 0.0 -0.1 -0.1 -0.1 -0.1
Other 0.0 0.0 -0.1 -0.1 -0.1 -0.1
Indirect effect of Government decisions 0.0 -0.1 -0.1 -0.1 -0.1 -0.2
£ billion
Forecast
Net expenditure transfers to EU institutions and possible substitute spending
4.90 In Annex B of our November 2017 EFO we provided greater detail on the UK’s contributions to the EU’s finances and our forecasting of them. Subsequently, in Annex B of
our March 2018 EFO, we laid out our estimate of the UK’s financial settlement with the EU – the so-called ‘divorce bill’. In this forecast, we have continued to take a fiscally neutral
approach to our post-Brexit spending forecast, assuming that, when the UK leaves the EU,
any reductions in the UK’s net expenditure transfers to the EU would be fully recycled into extra spending. This includes the Government’s already stated commitments to maintain
farm support, industrial strategy and science programmes after EU withdrawal.
Table 4.20: Expenditure transfers to EU institutions and possible substitute spending
Outturn
2017-18 2018-19 2019-20 2020-21 2021-22 2022-23 2023-24
‘No-referendum’ counterfactual 9.5 12.2 12.7 13.4 13.4 13.2 13.4
Which is reflected in our forecast as:
Expenditure transfers to EU institutions 9.5 12.2 - - - - -
Financial settlement transfers - - 12.7 10.5 10.4 7.7 4.1
Assumed spending in lieu of EU
transfers- - - 3.0 3.0 5.6 9.3
Forecast
£ billion
Economic and fiscal outlook 104
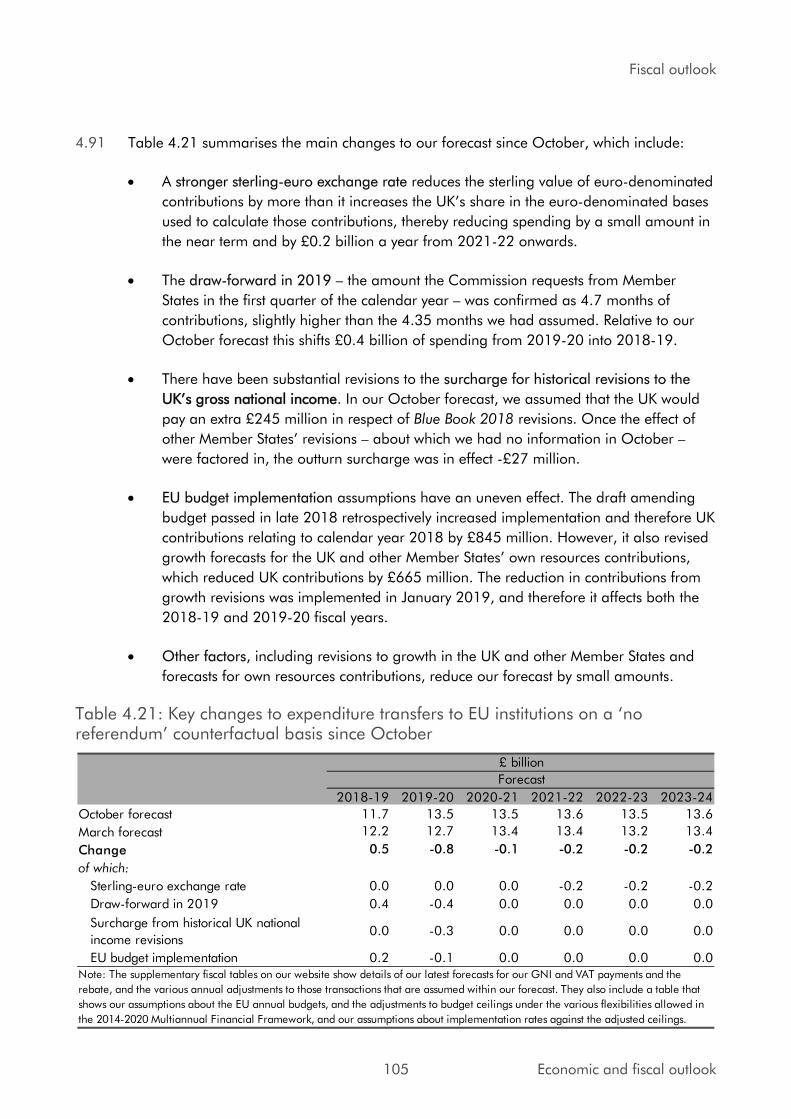
Fiscal outlook
4.91 Table 4.21 summarises the main changes to our forecast since October, which include:
• A stronger sterling-euro exchange rate reduces the sterling value of euro-denominated
contributions by more than it increases the UK’s share in the euro-denominated bases
used to calculate those contributions, thereby reducing spending by a small amount in
the near term and by £0.2 billion a year from 2021-22 onwards.
• The draw-forward in 2019 – the amount the Commission requests from Member
States in the first quarter of the calendar year – was confirmed as 4.7 months of
contributions, slightly higher than the 4.35 months we had assumed. Relative to our
October forecast this shifts £0.4 billion of spending from 2019-20 into 2018-19.
• There have been substantial revisions to the surcharge for historical revisions to the
UK’s gross national income. In our October forecast, we assumed that the UK would
pay an extra £245 million in respect of Blue Book 2018 revisions. Once the effect of
other Member States’ revisions – about which we had no information in October – were factored in, the outturn surcharge was in effect -£27 million.
• EU budget implementation assumptions have an uneven effect. The draft amending
budget passed in late 2018 retrospectively increased implementation and therefore UK
contributions relating to calendar year 2018 by £845 million. However, it also revised
growth forecasts for the UK and other Member States’ own resources contributions,
which reduced UK contributions by £665 million. The reduction in contributions from
growth revisions was implemented in January 2019, and therefore it affects both the
2018-19 and 2019-20 fiscal years.
• Other factors, including revisions to growth in the UK and other Member States and
forecasts for own resources contributions, reduce our forecast by small amounts.
Table 4.21: Key changes to expenditure transfers to EU institutions on a ‘no referendum’ counterfactual basis since October
2018-19 2019-20 2020-21 2021-22 2022-23 2023-24
October forecast 11.7 13.5 13.5 13.6 13.5 13.6
March forecast 12.2 12.7 13.4 13.4 13.2 13.4
Change 0.5 -0.8 -0.1 -0.2 -0.2 -0.2
of which:
Sterling-euro exchange rate 0.0 0.0 0.0 -0.2 -0.2 -0.2
Draw-forward in 2019 0.4 -0.4 0.0 0.0 0.0 0.0
Surcharge from historical UK national
income revisions0.0 -0.3 0.0 0.0 0.0 0.0
EU budget implementation 0.2 -0.1 0.0 0.0 0.0 0.0
£ billion
Forecast
Note: The supplementary fiscal tables on our website show details of our latest forecasts for our GNI and VAT payments and the
rebate, and the various annual adjustments to those transactions that are assumed within our forecast. They also include a table that
shows our assumptions about the EU annual budgets, and the adjustments to budget ceilings under the various flexibilities allowed in
the 2014-2020 Multiannual Financial Framework, and our assumptions about implementation rates against the adjusted ceilings.
105 Economic and fiscal outlook
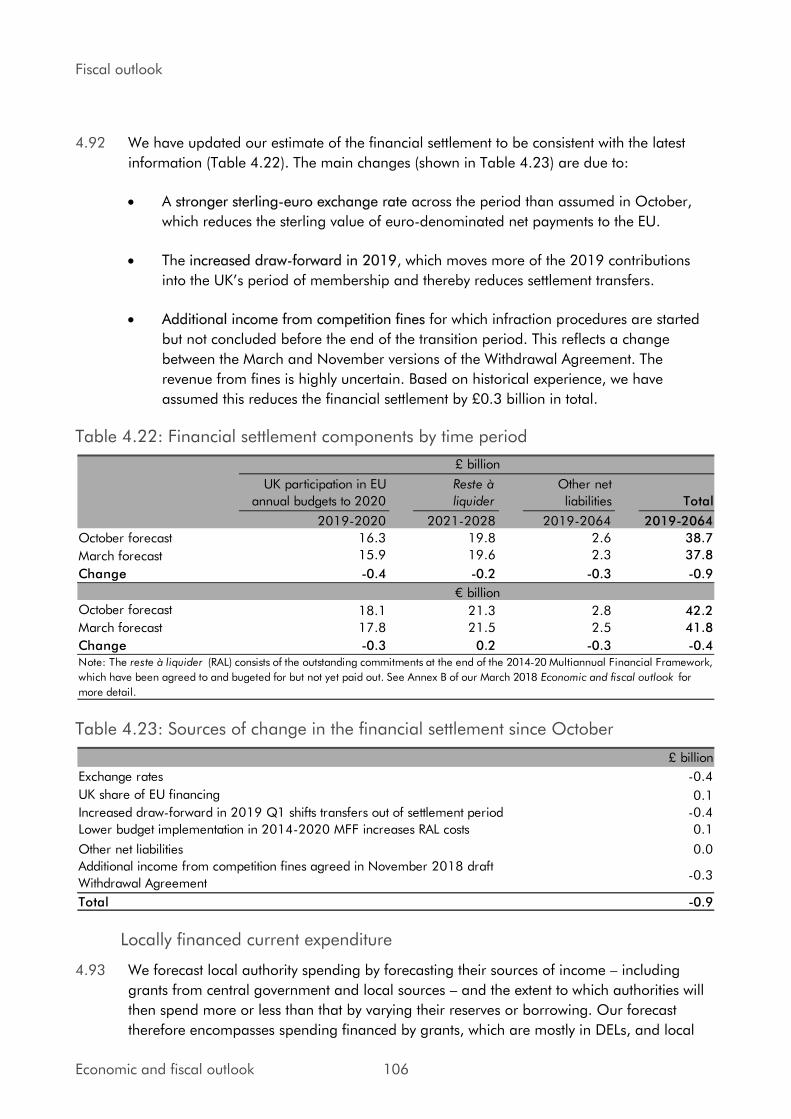
Fiscal outlook
4.92 We have updated our estimate of the financial settlement to be consistent with the latest
information (Table 4.22). The main changes (shown in Table 4.23) are due to:
• A stronger sterling-euro exchange rate across the period than assumed in October,
which reduces the sterling value of euro-denominated net payments to the EU.
• The increased draw-forward in 2019, which moves more of the 2019 contributions
into the UK’s period of membership and thereby reduces settlement transfers.
• Additional income from competition fines for which infraction procedures are started
but not concluded before the end of the transition period. This reflects a change
between the March and November versions of the Withdrawal Agreement. The
revenue from fines is highly uncertain. Based on historical experience, we have
assumed this reduces the financial settlement by £0.3 billion in total.
Table 4.22: Financial settlement components by time period
UK participation in EU
annual budgets to 2020
Reste à
liquider
Other net
liabilities Total
2019-2020 2021-2028 2019-2064 2019-2064
October forecast 16.3 19.8 2.6 38.7
March forecast 15.9 19.6 2.3 37.8
Change -0.4 -0.2 -0.3 -0.9
October forecast 18.1 21.3 2.8 42.2
March forecast 17.8 21.5 2.5 41.8
Change -0.3 0.2 -0.3 -0.4
£ billion
€ billion
Note: The reste à liquider (RAL) consists of the outstanding commitments at the end of the 2014-20 Multiannual Financial Framework,
which have been agreed to and bugeted for but not yet paid out. See Annex B of our March 2018 Economic and fiscal outlook for
more detail.
Table 4.23: Sources of change in the financial settlement since October
£ billion
Exchange rates -0.4
UK share of EU financing 0.1
Increased draw-forward in 2019 Q1 shifts transfers out of settlement period -0.4
Lower budget implementation in 2014-2020 MFF increases RAL costs 0.1
Other net liabilities 0.0
Additional income from competition fines agreed in November 2018 draft
Withdrawal Agreement-0.3
Total -0.9
Locally financed current expenditure
4.93 We forecast local authority spending by forecasting their sources of income – including
grants from central government and local sources – and the extent to which authorities will
then spend more or less than that by varying their reserves or borrowing. Our forecast
therefore encompasses spending financed by grants, which are mostly in DELs, and local
Economic and fiscal outlook 106
Fiscal outlook
authority self-financed expenditure (LASFE), which is in AME. Tables 4.24 and 4.25 focus on
LASFE. Further detail is available in supplementary tables on our website.
4.94 Table 4.24 summarises the main changes to our current LASFE forecast since October.
When looking at these changes, it is important to distinguish between those related to
council tax and business rates – which also affect our receipts forecast and are therefore
broadly neutral for borrowing – and those related to the net use of current reserves or
changes in the amounts set aside to repay debt. These reflect authorities spending more or
less than their income and therefore affect our borrowing forecast.
4.95 We have not changed our view on the extent to which local authorities will spend less than
their income in 2018-19, thereby adding to reserves. But we have revised up use of reserves
in 2019-20 by £1.2 billion. Abstracting from changes due to Transport for London (TfL), this
reflects quarterly current spending data, which points to higher spending in 2018-19. We
assume this higher spending will persist to a lesser degree in 2019-20. The effect is offset in
2018-19 and compounded in 2019-20 by £0.8 billion of reserves use moving from 2018-
19 into 2019-20 in TfL’s latest business plan.12
4.96 This assumed profile of reserves drawdowns would leave local authorities in England with
£24.7 billion of reserves at the end of 2019-20. This is £8.4 billion (51.5 per cent) more
than they held at the end of 2010-11. The extent to which reserves are used over the
forecast period is an important source of uncertainty. Box 4.4 of our March 2018 EFO
demonstrated that, although the aggregate picture for the level of reserves held by English
authorities appears healthy, this masks considerable variation across individual authorities,
with pressures most significant for those with social care responsibilities.
4.97 Other sources of change to our pre-measures forecast since October include:
• A higher forecast for council tax receipts, which is up £0.3 billion a year from 2019-20
onwards, due to both higher tax base growth than assumed in October and our latest
pre-measures assumptions about council tax rises in 2019-20.
• Upward revisions to our forecast for the locally retained share of business rates,
averaging £0.2 billion a year, peaking at £0.4 billion in 2019-20. These mostly reflect
the same factors discussed in the receipts section – in particular, the inclusion of the
latest local authority forecasts for 2019-20, which imply that authorities will record a
surplus on collection in 2019-20 (where a deficit was previously expected).
• Increases averaging £0.6 billion a year in current income and spending due to less
use of capital expenditure from revenue account (CERA) – that is, current income used
to finance capital spending projects. The change mostly reflects a methodological
correction to align the forecast with outturn data. It is broadly neutral for spending and
borrowing overall, as it also reduces our forecast for private contributions from
developers (shown in Table 4.25).
12 TFL, Transport for London Business plan, December 2018.
107 Economic and fiscal outlook
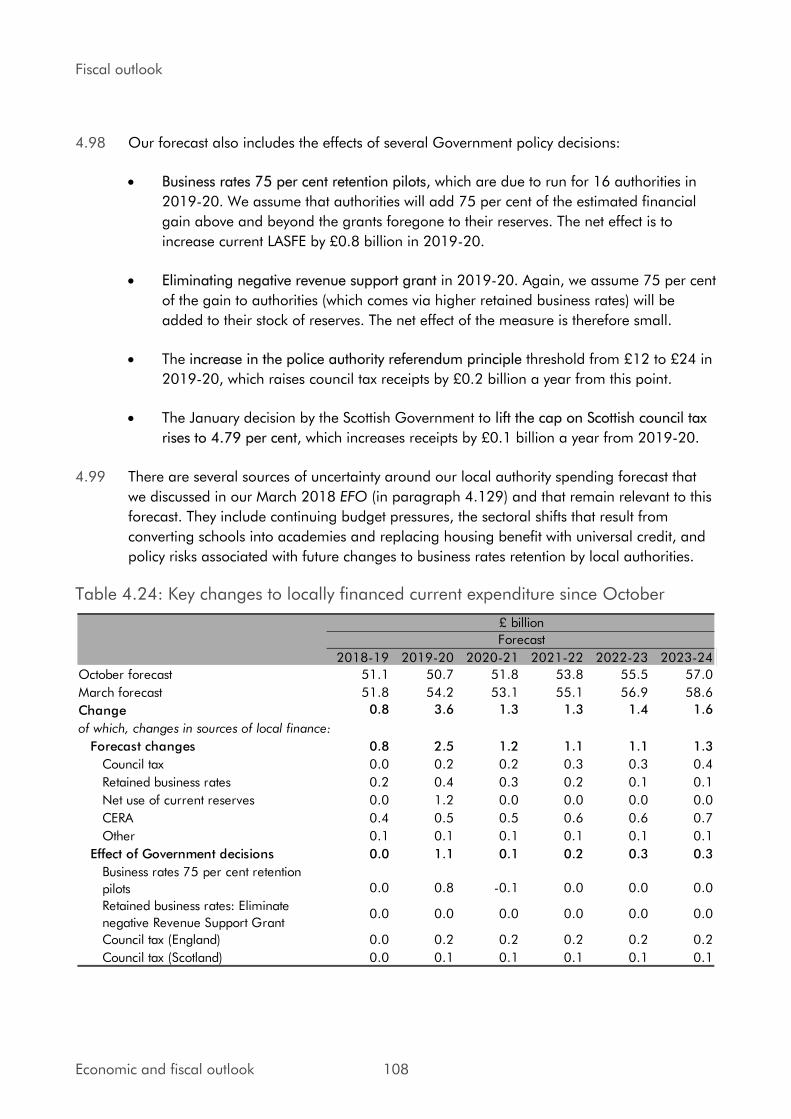
Fiscal outlook
4.98 Our forecast also includes the effects of several Government policy decisions:
• Business rates 75 per cent retention pilots, which are due to run for 16 authorities in
2019-20. We assume that authorities will add 75 per cent of the estimated financial
gain above and beyond the grants foregone to their reserves. The net effect is to
increase current LASFE by £0.8 billion in 2019-20.
• Eliminating negative revenue support grant in 2019-20. Again, we assume 75 per cent
of the gain to authorities (which comes via higher retained business rates) will be
added to their stock of reserves. The net effect of the measure is therefore small.
• The increase in the police authority referendum principle threshold from £12 to £24 in
2019-20, which raises council tax receipts by £0.2 billion a year from this point.
• The January decision by the Scottish Government to lift the cap on Scottish council tax
rises to 4.79 per cent, which increases receipts by £0.1 billion a year from 2019-20.
4.99 There are several sources of uncertainty around our local authority spending forecast that
we discussed in our March 2018 EFO (in paragraph 4.129) and that remain relevant to this
forecast. They include continuing budget pressures, the sectoral shifts that result from
converting schools into academies and replacing housing benefit with universal credit, and
policy risks associated with future changes to business rates retention by local authorities.
Table 4.24: Key changes to locally financed current expenditure since October
2018-19 2019-20 2020-21 2021-22 2022-23 2023-24
October forecast 51.1 50.7 51.8 53.8 55.5 57.0
March forecast 51.8 54.2 53.1 55.1 56.9 58.6
Change 0.8 3.6 1.3 1.3 1.4 1.6
of which, changes in sources of local finance:
Forecast changes 0.8 2.5 1.2 1.1 1.1 1.3
Council tax 0.0 0.2 0.2 0.3 0.3 0.4
Retained business rates 0.2 0.4 0.3 0.2 0.1 0.1
Net use of current reserves 0.0 1.2 0.0 0.0 0.0 0.0
CERA 0.4 0.5 0.5 0.6 0.6 0.7
Other 0.1 0.1 0.1 0.1 0.1 0.1
Effect of Government decisions 0.0 1.1 0.1 0.2 0.3 0.3
Business rates 75 per cent retention
pilots 0.0 0.8 -0.1 0.0 0.0 0.0
Retained business rates: Eliminate
negative Revenue Support Grant0.0 0.0 0.0 0.0 0.0 0.0
Council tax (England) 0.0 0.2 0.2 0.2 0.2 0.2
Council tax (Scotland) 0.0 0.1 0.1 0.1 0.1 0.1
Forecast
£ billion
Economic and fiscal outlook 108
Fiscal outlook
Locally financed and public corporations’ capital expenditure
4.100 Our latest forecasts for locally financed capital expenditure (capital LASFE) and public
corporations’ capital spending are shown in Table 4.25. These are net of asset sales,
forecasts for which are shown in supplementary tables on our website. Capital LASFE is
measured net of capital spending by local authorities’ Housing Revenue Accounts (HRAs)
and the Transport for London (TfL) subsidiaries that are treated as public corporations in the
National Accounts.13 We switch these items from capital LASFE to public corporations’
capital expenditure in our forecast to ensure it is consistent with the National Accounts.
4.101 We present changes to capital LASFE and public corporations’ capital spending together so that any switches between them net out and do not obscure the changes that affect TME.
Spending has mostly been revised down by uneven amounts across the forecast period.
4.102 The main changes relative to October relate to our forecasts of TfL spending, which are
shown in the TfL capital spending and capital grants from local authorities to public
corporations lines in Table 4.25. This reflects TfL’s latest business plan, which includes its
view of the impact of the delay to finishing Crossrail on fare income and capital spending,
as well as the Government’s December 2018 decision to offer a £1.3 billion loan to the Greater London Authority from the Department for Transport. This loan is passed on to TfL
as a capital grant, financing higher capital spending on Crossrail in 2018-19 and 2019-20.
We have also aligned other parts of our forecast to TfL’s business plan – having aimed off
the previous edition – as we believe that it represents a central view of the effects of
Crossrail changes and other pressures on fare income. Removing the adjustments that we
previously made leads to an uneven yearly profile of small changes relative to October.
4.103 The other main changes to our forecast since October reflect:
• Relatively small revisions to our (non-TfL) prudential borrowing forecast. The upward
revisions to 2018-19 are based on an analysis of three quarters of English authority
net capital spending outturn data for the year to date. The upward revision is assumed
to persist in 2019-20, but diminish in 2020-21. These upward revisions are partly
offset in those years by downward revisions to the use of prudential borrowing to
finance capital spending by Welsh authorities. The downward revision related to Welsh
authorities then dominates in 2022-23 and 2023-24.
• Income from asset sales has been revised down by £0.9 billion in 2018-19, thus
increasing capital spending net of asset sales by that amount. This change more than
reverses judgements in our October forecast, where strong quarterly asset sales data
at the time led us to revise up our 2018-19 forecast by £0.5 billion. This initial in-year
strength has since subsided. The change also smooths the profile of asset sales
between outturn and forecast years and over the forecast period.
13 These TfL transport subsidiaries trade under the company name ‘Transport Trading Ltd’ (TTL). The ONS currently classifies all the large TTL subsidiaries as public corporations apart from Crossrail, which is classified as part of the local authority sector.
109 Economic and fiscal outlook

Fiscal outlook
• Downward revisions averaging £0.5 billion a year to private contributions from
developers, largely reflecting the CERA changes discussed in the preceding section.
• Decreases in other spending, averaging £0.3 billion a year, mostly as a result of
revised 2017-18 outturn data, which reduces our future year forecasts.
Table 4.25: Key changes to locally financed capital expenditure and public corporations’ capital expenditure since October
2018-19 2019-20 2020-21 2021-22 2022-23 2023-24
October forecast 22.4 22.4 20.3 19.8 20.3 20.5
March forecast 23.7 21.9 19.8 19.3 19.1 18.6
Change 1.3 -0.5 -0.5 -0.5 -1.2 -1.9
of which:
TfL capital spending 0.6 -0.4 0.2 0.4 -0.4 -0.5
Capital grants from local authorities to
public corporations0.6 0.5 0.0 0.0 0.2 -0.3
Prudential borrowing (non-TfL) 0.2 0.3 0.1 0.0 -0.1 -0.1
Less asset sales 0.9 0.0 0.0 0.0 0.0 0.0
Private contributions from developers -0.5 -0.5 -0.5 -0.5 -0.6 -0.6
Other -0.5 -0.2 -0.3 -0.3 -0.4 -0.4
£ billionForecast
Public sector debt interest
4.104 Debt interest payments are forecast by applying appropriate interest rates to the stocks of
conventional and index-linked gilts outstanding at different maturities and to other debt,
such as NS&I products and Treasury bills.14 The assumptions we use to forecast the levels of
debt instruments are described later in this chapter. Financial market expectations are used
to derive relevant interest rates (for example, coupons on newly issued conventional gilts),
while our inflation forecast is used for index-linked gilts and other index-linked debt. Flows
associated with the Bank of England’s Asset Purchase Facility (APF) and its own balance
sheet similarly apply appropriate market-derived interest rates to the APF’s loan liability and
to the stocks of gilt, corporate bond and loan assets.15
4.105 Debt interest payments are expected to fall in 2018-19, thanks to lower RPI inflation this
year than in 2017-18. Central government interest payments are fairly stable across the
forecast as the gently rising cost of financing new borrowing is offset by the saving
associated with rolling over previously issued debt at lower interest rates than those that
prevailed when it was issued. The APF continues to reduce public sector debt interest over
the forecast, but by decreasing amounts each year as the gap between the average interest
rate earned on its assets and that paid on its liabilities (Bank Rate) narrows.
14 Our forecasting approach was explained in Box 4.4 of our March 2015 EFO and is discussed in the ‘in depth’ section of our website. A supplementary fiscal table on our website presents the different stocks, flows and effective interest rates that make up this forecast. 15 Since our October forecast, assets and liabilities associated with the Term Funding Scheme have been moved from the balance sheet of the APF to the main Bank of England accounts. This accounting change has no impact on the public finances.
Economic and fiscal outlook 110
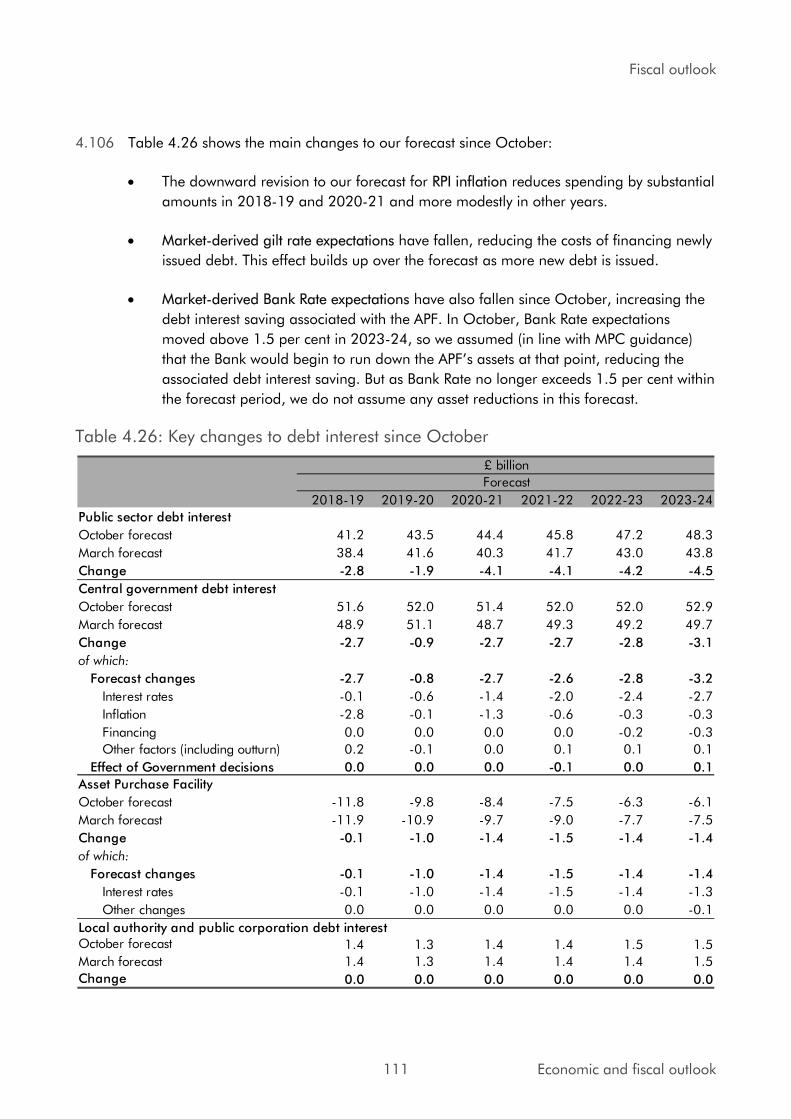
Fiscal outlook
4.106 Table 4.26 shows the main changes to our forecast since October:
• The downward revision to our forecast for RPI inflation reduces spending by substantial
amounts in 2018-19 and 2020-21 and more modestly in other years.
• Market-derived gilt rate expectations have fallen, reducing the costs of financing newly
issued debt. This effect builds up over the forecast as more new debt is issued.
• Market-derived Bank Rate expectations have also fallen since October, increasing the
debt interest saving associated with the APF. In October, Bank Rate expectations
moved above 1.5 per cent in 2023-24, so we assumed (in line with MPC guidance)
that the Bank would begin to run down the APF’s assets at that point, reducing the
associated debt interest saving. But as Bank Rate no longer exceeds 1.5 per cent within
the forecast period, we do not assume any asset reductions in this forecast.
Table 4.26: Key changes to debt interest since October
2018-19 2019-20 2020-21 2021-22 2022-23 2023-24
Public sector debt interest
October forecast 41.2 43.5 44.4 45.8 47.2 48.3
March forecast 38.4 41.6 40.3 41.7 43.0 43.8
Change -2.8 -1.9 -4.1 -4.1 -4.2 -4.5
Central government debt interest
October forecast 51.6 52.0 51.4 52.0 52.0 52.9
March forecast 48.9 51.1 48.7 49.3 49.2 49.7
Change -2.7 -0.9 -2.7 -2.7 -2.8 -3.1
of which:
Forecast changes -2.7 -0.8 -2.7 -2.6 -2.8 -3.2
Interest rates -0.1 -0.6 -1.4 -2.0 -2.4 -2.7
Inflation -2.8 -0.1 -1.3 -0.6 -0.3 -0.3
Financing 0.0 0.0 0.0 0.0 -0.2 -0.3
Other factors (including outturn) 0.2 -0.1 0.0 0.1 0.1 0.1
Effect of Government decisions 0.0 0.0 0.0 -0.1 0.0 0.1
Asset Purchase Facility
October forecast -11.8 -9.8 -8.4 -7.5 -6.3 -6.1
March forecast -11.9 -10.9 -9.7 -9.0 -7.7 -7.5
Change -0.1 -1.0 -1.4 -1.5 -1.4 -1.4
of which:
Forecast changes -0.1 -1.0 -1.4 -1.5 -1.4 -1.4
Interest rates -0.1 -1.0 -1.4 -1.5 -1.4 -1.3
Other changes 0.0 0.0 0.0 0.0 0.0 -0.1
Local authority and public corporation debt interestOctober forecast 1.4 1.3 1.4 1.4 1.5 1.5
March forecast 1.4 1.3 1.4 1.4 1.4 1.5
Change 0.0 0.0 0.0 0.0 0.0 0.0
Forecast
£ billion
111 Economic and fiscal outlook

Fiscal outlook
4.107 It is likely that the market-derived interest rates on which we base this forecast include
different implicit assumptions about the nature of Brexit than those underpinning the rest of
our forecast. Specifically, markets appear to be placing some weight on the possibility of a
‘no deal’ Brexit accompanied by some monetary policy easing. These different underlying
assumptions mean that debt interest spending on a fully consistent interest rate path would
probably be higher, but there is no reliable way to calibrate by how much.
4.108 One indication is given by recent movements in the interest-rate expectations of market
participants relative to those used in our forecast, which are based on the average of the 10
days to 14 February. Market participants interpreted the Prime Minister’s announcement on
26 February of a sequence of Brexit votes in Parliament in mid-March as substantially
reducing the likelihood of a ‘no deal’ outcome and prompted a corresponding rise in
market interest rates – over the four days to 1 March, Bank Rate expectations rose by an
average of 8 basis points and gilt rate expectations by 9 basis points (at 20-year maturities).
The effect of using these rates on our debt interest payments forecast would be to raise it by
£0.4 billion in 2019-20, rising to £0.7 billion by 2023-24, although that would unwind less
than a fifth of the downward revision since October.
Scottish Government AME
4.109 In October 2018 Scottish Government expenditure was reclassified from central government
DEL to AME, ostensibly because an increasing proportion of expenditure is self-financed
from taxation and thus falls outside Treasury control. There are three main sources of
funding for Scottish Government expenditure. First, the majority is funded from a (residual)
block grant tightly linked to central government DELs via the Barnett formula. Second,
around 45 per cent of resource expenditure is self-financed from taxation, though income
tax funding is subject to potentially large reconciliations as outturn liabilities are only known
after a long lag.16 Finally, under the fiscal framework agreed between the Scottish and UK
Governments, smaller amounts can be funded from Scottish reserves and borrowing.
4.110 The Scottish Government announced its latest spending plans in December 2018. We have
used these as the starting point to update our forecast, but have then adjusted each of the
funding sources in line with our latest forecasts. First, we have increased expenditure funded
from the residual block grant. DELs from 2020-21 onwards are outside the Spending
Review period, so we have used the Treasury’s policy assumptions (in the same way we do
for overall DEL spending). These show the Scottish residual block grant rising in line with
overall DEL. They generate the largest change in our forecast since October. Further
changes made in the Supplementary Estimates process have also increased our forecast.
These include the Treasury granting flexibility to carry forward some of the additional
funding into 2019-20 outside the normal operation of the Scotland Reserve, akin to the
Budget Exchange process normally only used for spending managed under DEL budgets.
16 For more information on the self-financed tax components of Scottish Government expenditure see our Devolved tax and spending forecasts publication.
Economic and fiscal outlook 112
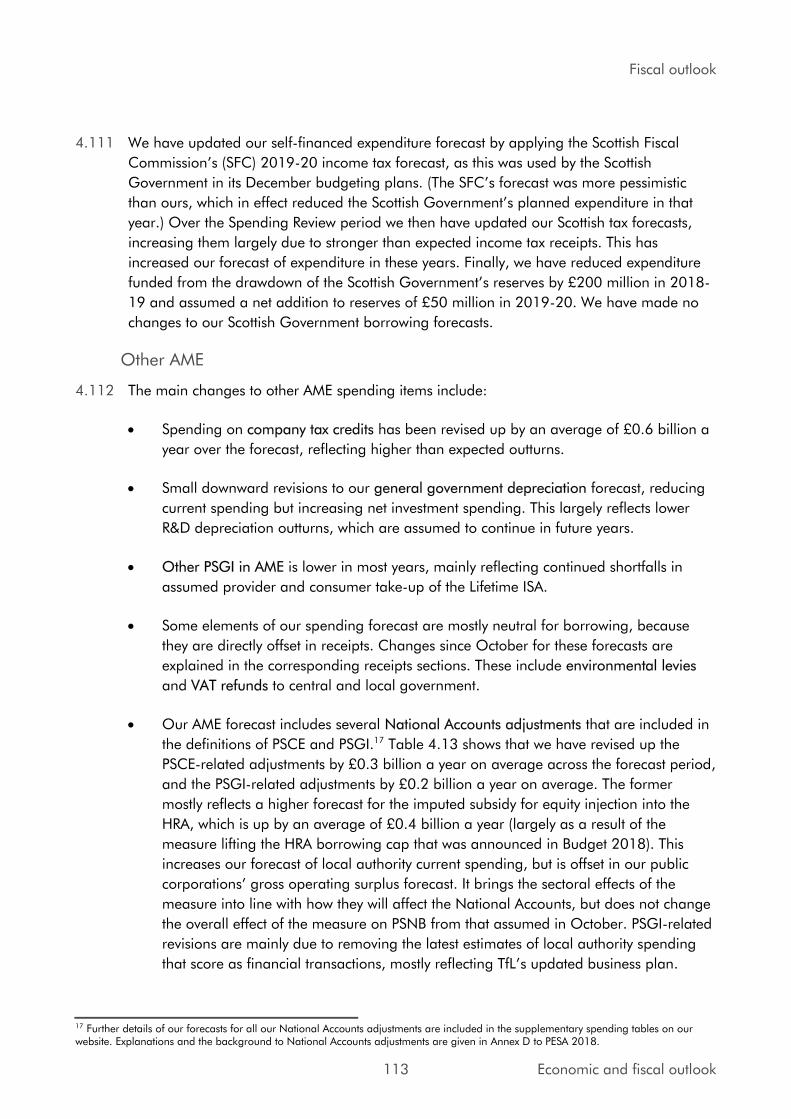
Fiscal outlook
4.111 We have updated our self-financed expenditure forecast by applying the Scottish Fiscal
Commission’s (SFC) 2019-20 income tax forecast, as this was used by the Scottish
Government in its December budgeting plans. (The SFC’s forecast was more pessimistic than ours, which in effect reduced the Scottish Government’s planned expenditure in that
year.) Over the Spending Review period we then have updated our Scottish tax forecasts,
increasing them largely due to stronger than expected income tax receipts. This has
increased our forecast of expenditure in these years. Finally, we have reduced expenditure
funded from the drawdown of the Scottish Government’s reserves by £200 million in 2018-
19 and assumed a net addition to reserves of £50 million in 2019-20. We have made no
changes to our Scottish Government borrowing forecasts.
Other AME
4.112 The main changes to other AME spending items include:
• Spending on company tax credits has been revised up by an average of £0.6 billion a
year over the forecast, reflecting higher than expected outturns.
• Small downward revisions to our general government depreciation forecast, reducing
current spending but increasing net investment spending. This largely reflects lower
R&D depreciation outturns, which are assumed to continue in future years.
• Other PSGI in AME is lower in most years, mainly reflecting continued shortfalls in
assumed provider and consumer take-up of the Lifetime ISA.
• Some elements of our spending forecast are mostly neutral for borrowing, because
they are directly offset in receipts. Changes since October for these forecasts are
explained in the corresponding receipts sections. These include environmental levies
and VAT refunds to central and local government.
• Our AME forecast includes several National Accounts adjustments that are included in
the definitions of PSCE and PSGI.17 Table 4.13 shows that we have revised up the
PSCE-related adjustments by £0.3 billion a year on average across the forecast period,
and the PSGI-related adjustments by £0.2 billion a year on average. The former
mostly reflects a higher forecast for the imputed subsidy for equity injection into the
HRA, which is up by an average of £0.4 billion a year (largely as a result of the
measure lifting the HRA borrowing cap that was announced in Budget 2018). This
increases our forecast of local authority current spending, but is offset in our public
corporations’ gross operating surplus forecast. It brings the sectoral effects of the measure into line with how they will affect the National Accounts, but does not change
the overall effect of the measure on PSNB from that assumed in October. PSGI-related
revisions are mainly due to removing the latest estimates of local authority spending
that score as financial transactions, mostly reflecting TfL’s updated business plan.
17 Further details of our forecasts for all our National Accounts adjustments are included in the supplementary spending tables on our website. Explanations and the background to National Accounts adjustments are given in Annex D to PESA 2018.
113 Economic and fiscal outlook

Fiscal outlook
Deficit aggregates
4.113 Our central forecast for the key measures of the budget deficit incorporates the forecasts for
receipts and expenditure set out earlier in this chapter. In this section we explain the
changes in our forecasts for the following aggregate measures of the deficit:
• Public sector net borrowing: the difference between total public sector receipts and
expenditure on an accrued basis each year. As the widest measure of borrowing, PSNB
is a key indicator of the fiscal position and we focus on it when explaining changes
since our previous forecast. It was also the target measure used for the fiscal mandate
early in the last Parliament.
• Cyclically adjusted net borrowing: public sector net borrowing adjusted to remove the
estimated impact of the economic cycle. This is an estimate of underlying or ‘structural’ net borrowing, in other words the borrowing we would expect to see if the economy
were operating at potential. It is the current target measure for the fiscal mandate.
• The current budget deficit: the difference between receipts and public sector current
expenditure each year. In effect, this is public sector net borrowing excluding
borrowing to finance investment that boosts the public sector capital stock. This was
the target measure from 1997 to 2008 under the Labour Government’s ‘golden rule’.
• The cyclically adjusted current budget deficit: the current budget deficit adjusted to
reflect the estimated impact of the economic cycle. This was the target measure for the
Coalition Government’s fiscal mandate between 2010 and 2015.
Public sector net borrowing
Summary of changes since October
4.114 As in October, we have revised down our pre-measures forecast for borrowing in every year
– but by only about half as much as in that forecast. This is driven by the relatively unusual
combination of an upward revision to receipts and a downward revision to debt interest
spending – only the fifth time that revisions to receipts and debt interest spending have
pushed borrowing in the same direction in the 19 forecast revisions since June 2010.
4.115 The drivers of these revisions reflect two key factors:
• Despite little change in our forecast for nominal GDP growth, the tax-to-GDP ratio has
been revised up. This largely reflects near-term momentum in earnings growth and a
buoyant effective tax rate on labour income due to particularly strong earnings growth
among the highest earners. Both have boosted income tax and NICs receipts.
• Market-derived expectations of future interest rates are lower than in October,
reducing our forecast for debt interest payments. This is, however, likely to reflect the
market pricing in some probability of a ‘no deal’ Brexit and an associated monetary
Economic and fiscal outlook 114
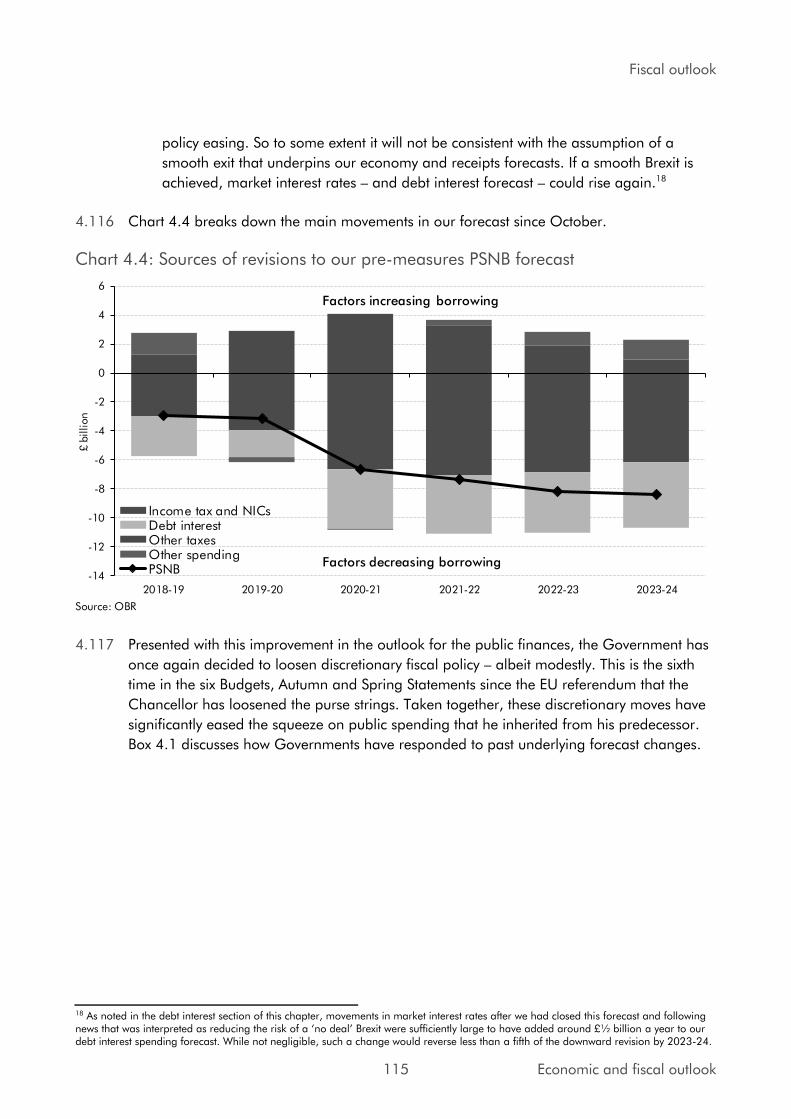
Fiscal outlook
policy easing. So to some extent it will not be consistent with the assumption of a
smooth exit that underpins our economy and receipts forecasts. If a smooth Brexit is
achieved, market interest rates – and debt interest forecast – could rise again.18
4.116 Chart 4.4 breaks down the main movements in our forecast since October.
Chart 4.4: Sources of revisions to our pre-measures PSNB forecast
-14
-12
-10
-8
-6
-4
-2
0
2
4
6
2018-19 2019-20 2020-21 2021-22 2022-23 2023-24
£ b
illion
Income tax and NICsDebt interestOther taxesOther spendingPSNB
Source: OBR
Factors increasing borrowing
Factors decreasing borrowing
4.117 Presented with this improvement in the outlook for the public finances, the Government has
once again decided to loosen discretionary fiscal policy – albeit modestly. This is the sixth
time in the six Budgets, Autumn and Spring Statements since the EU referendum that the
Chancellor has loosened the purse strings. Taken together, these discretionary moves have
significantly eased the squeeze on public spending that he inherited from his predecessor.
Box 4.1 discusses how Governments have responded to past underlying forecast changes.
18 As noted in the debt interest section of this chapter, movements in market interest rates after we had closed this forecast and following news that was interpreted as reducing the risk of a ‘no deal’ Brexit were sufficiently large to have added around £½ billion a year to our debt interest spending forecast. While not negligible, such a change would reverse less than a fifth of the downward revision by 2023-24.
115 Economic and fiscal outlook
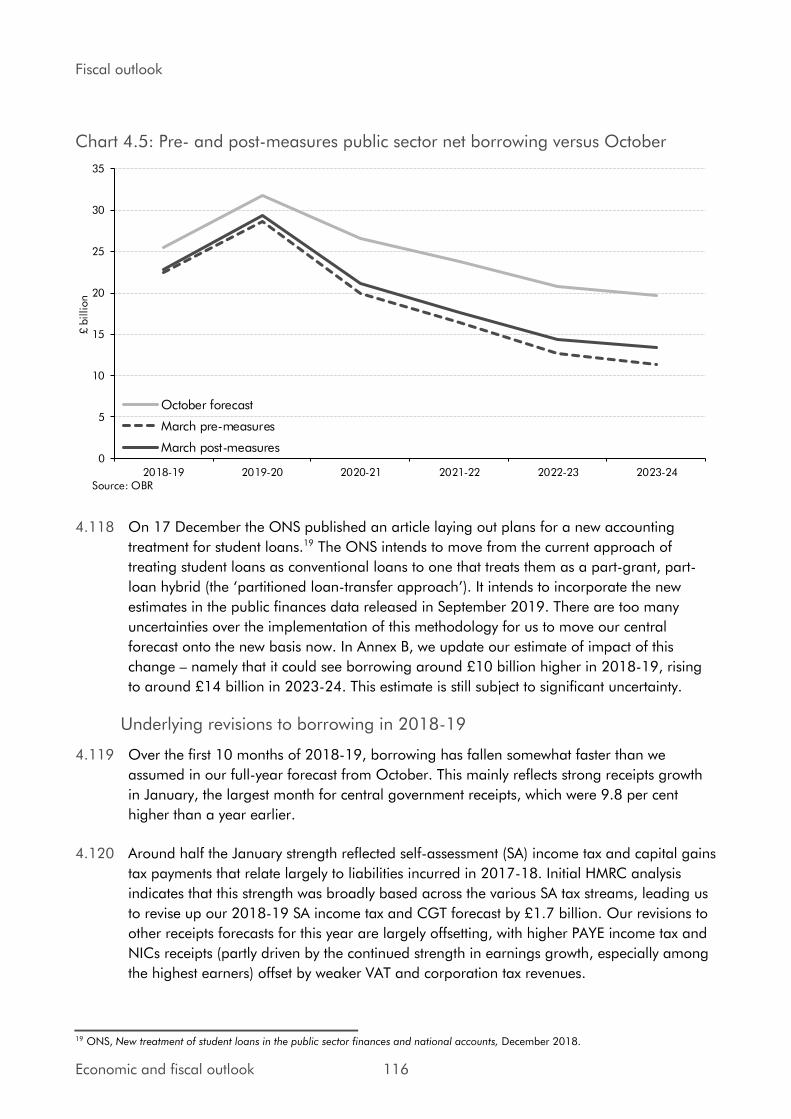
Fiscal outlook
Chart 4.5: Pre- and post-measures public sector net borrowing versus October
0
5
10
15
20
25
30
35
2018-19 2019-20 2020-21 2021-22 2022-23 2023-24
£ b
illion
October forecast
March pre-measures
March post-measures
Source: OBR
4.118 On 17 December the ONS published an article laying out plans for a new accounting
treatment for student loans.19 The ONS intends to move from the current approach of
treating student loans as conventional loans to one that treats them as a part-grant, part-
loan hybrid (the ‘partitioned loan-transfer approach’). It intends to incorporate the new estimates in the public finances data released in September 2019. There are too many
uncertainties over the implementation of this methodology for us to move our central
forecast onto the new basis now. In Annex B, we update our estimate of impact of this
change – namely that it could see borrowing around £10 billion higher in 2018-19, rising
to around £14 billion in 2023-24. This estimate is still subject to significant uncertainty.
Underlying revisions to borrowing in 2018-19
4.119 Over the first 10 months of 2018-19, borrowing has fallen somewhat faster than we
assumed in our full-year forecast from October. This mainly reflects strong receipts growth
in January, the largest month for central government receipts, which were 9.8 per cent
higher than a year earlier.
4.120 Around half the January strength reflected self-assessment (SA) income tax and capital gains
tax payments that relate largely to liabilities incurred in 2017-18. Initial HMRC analysis
indicates that this strength was broadly based across the various SA tax streams, leading us
to revise up our 2018-19 SA income tax and CGT forecast by £1.7 billion. Our revisions to
other receipts forecasts for this year are largely offsetting, with higher PAYE income tax and
NICs receipts (partly driven by the continued strength in earnings growth, especially among
the highest earners) offset by weaker VAT and corporation tax revenues.
19 ONS, New treatment of student loans in the public sector finances and national accounts, December 2018.
Economic and fiscal outlook 116

Fiscal outlook
4.121 We have revised our spending forecast for 2018-19 down by £0.9 billion. That is more than
explained by lower debt interest, where RPI inflation in January 2019 – the key month for
accrued interest on index-linked gilts – was lower than we had predicted in October. (RPI
inflation feeds through to accrued interest on index-linked gilts with a lag of two months.)
4.122 Taking those factors into account, and bearing in mind that the new policy decisions do not
affect borrowing materially this year, we have revised overall borrowing in 2018-19 down
by £2.7 billion to £22.8 billion. That is broadly in line with the in-year forecast that would
be generated by extrapolating the year-to-date performance of the public finances.
Underlying revisions to borrowing from 2019-20 onwards
4.123 From 2019-20 onwards, our pre-measures borrowing forecast has been revised down in
every year, by £6.8 billion (0.3 per cent of GDP) a year on average:
• Just over half the revision reflects higher receipts, which are up by £3.5 billion a year
on average. That is more than explained by strength in income tax and NICs receipts,
thanks to the higher 2018-19 starting point and slightly stronger earnings growth. This
is partly offset by downward revisions to oil and gas revenues (due to lower oil and gas
prices), capital tax receipts (due to lower equity prices) and interest and dividend
receipts (due to lower market expectations of future interest rates).
• Just under half the revision reflects lower spending, which is down by £3.3 billion a
year on average. This is dominated by lower spending on debt interest, reflecting
lower near-term RPI inflation and lower market expectations for interest rates across
the forecast. Other spending revisions are largely offsetting, with higher welfare
spending (largely driven by an upward revision to our disability benefits forecast) offset
by other smaller items.
Government decisions
4.124 The Government does not consider this Spring Statement to be a full ‘fiscal event’ and has not produced a ‘scorecard’ of policy measures. But several measures have been announced since the Budget and another increase in departmental spending totals was announced in
the Statement. Overall, these changes increase borrowing by increasing amounts over the
forecast period, rising from £0.7 billion in 2019-20 to £2.1 billion in 2023-24:
• Total departmental spending has been increased by £0.2 billion in 2019-20, rising to
£1.7 billion in 2023-34. This comprises two main parts. First, the decision to respond
to our forecast of higher GDP deflator inflation and keep non-NHS current
departmental spending flat in real terms adds amounts rising to £0.8 billion in 2023-
24. Second, a further addition to NHS funding – again to maintain real-terms funding
– adds amounts rising to £0.8 billion in 2023-24.
• Several policy changes to universal credit (UC) and disability benefits. These include
delaying the rollout of personal independence payment and stopping the review of
some existing cases to free up capacity to finish the rollout. This costs £0.2 billion a
117 Economic and fiscal outlook

Fiscal outlook
year on average from 2020-21 onwards. The decision not to limit child-related awards
for some new UC claims with three or more children and changes to the profile of the
UC managed migration phase have broadly offsetting effects over the five years.
• Other policy changes are smaller and their effects are largely offsetting. They include
raising the fees payable for an application for a grant of probate and the doubling of
the ‘immigration health surcharge’. Annex A provides more detail.
4.125 The modest net giveaway led us to revise our nominal GDP forecast up a fraction. This
reduces borrowing marginally in every year via higher tax revenues. Higher departmental
spending raises contributions to public service pension schemes, reducing net expenditure.
These effects are shown in the ‘Indirect effect of Government decisions’ row in Table 4.27.
Table 4.27: Changes to public sector net borrowing 230
Outturn
2017-18 2018-19 2019-20 2020-21 2021-22 2022-23 2023-24
October forecast 39.8 25.5 31.8 26.7 23.8 20.8 19.8
March forecast 41.9 22.8 29.3 21.2 17.6 14.4 13.5
Change 2.1 -2.7 -2.4 -5.5 -6.2 -6.4 -6.3
Underlying revisions to receipts 0.9 -1.7 -1.0 -2.5 -3.7 -5.0 -5.2
of which:
Income tax and NICs 1.1 -3.0 -4.0 -6.6 -7.1 -6.9 -6.1
VAT -0.1 0.5 0.6 0.4 0.1 -0.1 -0.3
Onshore corporation tax 0.4 1.2 0.7 0.2 -0.4 -0.6 -0.7
Capital taxes 0.0 -0.6 1.1 2.2 2.2 2.0 2.1
Other -0.4 0.2 0.6 1.3 1.4 0.5 -0.1
Underlying revisions to spending 1.2 -1.2 -2.2 -4.1 -3.6 -3.2 -3.2
of which:
Debt interest 0.0 -2.7 -1.9 -4.1 -4.0 -4.1 -4.6
Welfare spending 0.0 0.0 0.0 0.4 0.6 1.0 1.7
Departmental spending 0.5 -0.8 -0.8 0.0 0.0 0.0 0.0
Other changes 0.7 2.4 0.5 -0.4 -0.2 -0.1 -0.3
Total effect of Government decisions - 0.3 0.7 1.2 1.2 1.8 2.1
of which:
Departmental spending - 0.3 0.2 1.4 0.8 1.7 1.7
Other measures - 0.0 1.0 0.1 0.8 0.4 0.7
Indirect effects - 0.0 -0.4 -0.3 -0.4 -0.3 -0.3Memo: March pre-measures forecast 41.9 22.5 28.6 20.0 16.4 12.6 11.4
Note: This table uses the convention that a negative figure means a reduction in PSNB, i.e. an increase in receipts or a reduction in
spending will have a negative effect on PSNB.
£ billion
Forecast
Economic and fiscal outlook 118

Fiscal outlook
Box 4.1: How do governments respond to good and bad news in our forecasts?
Our pre-measures fiscal forecasts provide the baseline against which governments make the tax
and spending policy decisions that determine our post-measures forecasts. Whether a
government chooses to ease or tighten fiscal policy with an overall policy package will be guided
by its legislated fiscal targets and any other fiscal objectives. Its choices will also be influenced by
the nature of the changes to our pre-measures forecasts (for example, whether they are judged
to be cyclical or structural). We maintain a database of fiscal forecast revisions that splits them
into pre-measures, policy and classification factors, which allows us to look for any patterns in
the way governments respond to good or bad news in our underlying forecast revisions.
Chart 4.A shows policy responses to our pre-measures revisions since November 2010. The
cumulative effect of policy decisions across each forecast period are shown on the vertical axis
and are measured as the total cash effect on borrowing over the five-year period, as a share of
total nominal GDP over the same period. This expresses the typical ‘£ billion’ effect of giveaways or takeaways in units that do not rise over time simply because the cash size of the economy is
growing. Our pre-measures forecast changes are shown on the horizontal axis using the same
metric. The effect of major classification changes has been stripped out. The chart shows that:
• When we deliver good news about the pre-measures outlook for the public finances,
governments have tended to loosen fiscal policy. They have typically done this by easing
the squeeze on public spending that had previously been the stated policy intent. On
some occasions, this has involved raising plans in Spending Review years, but often it has
been achieved by changing policy assumptions for departmental spending beyond the
years for which plans have been set. (These assumptions have sometimes implied large
real terms cuts that have been revised away before plans were set – for example the
December 2014 assumptions that were raised in March 2015 and again in July 2015,
ahead of the Spending Review in November 2015.) The only exception was in December
2013, when the Government ‘banked’ the good news in our borrowing forecast and
added to it by squeezing medium-term spending even more tightly. Otherwise, downward
revisions to pre-measures borrowing have always been met with a net policy giveaway.
On average, these have offset the forecast improvement roughly one-for-one.
• When we deliver bad news about the pre-measures outlook, the average policy response
has been more varied. In two-thirds of cases, the Government has responded by partly
offsetting the deterioration, usually by squeezing spending further in the medium term.
On average, this offset is much less than one-for-one. In the other third of cases, the
Government responded by loosening fiscal policy. On two occasions this has happened
alongside a change in the terms of the ‘fiscal mandate’ (including in November 2016).
• Since the Brexit referendum, fiscal policy has been loosened at every Budget, Autumn and
Spring Statement, regardless of whether we have delivered good or bad news in our pre-
measures borrowing forecast. The bulk of the cumulative net giveaway across these six
fiscal statements has come via boosting public spending. In March 2016, our post-
measures forecast showed public spending falling by 2.9 per cent of GDP between 2016-
17 and 2020-21 – largely thanks to policy measures squeezing departmental and welfare
spending. In this forecast, after successive policy giveaways – notably the boost to NHS
119 Economic and fiscal outlook
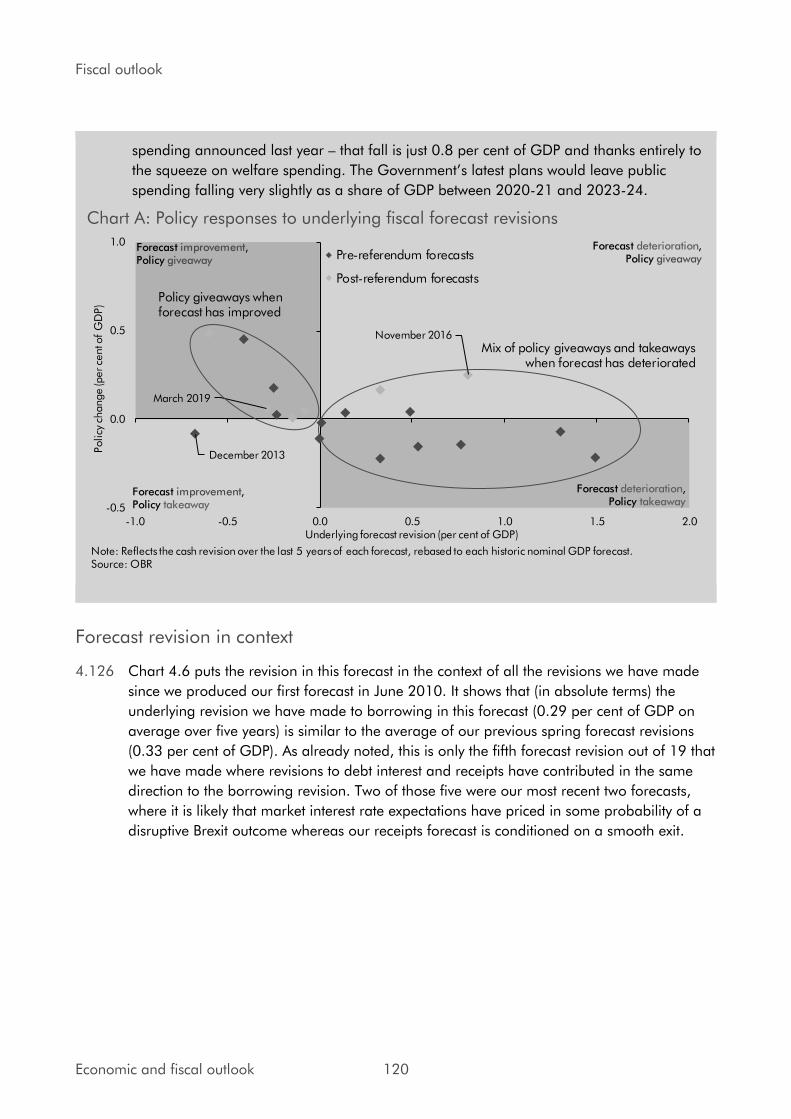
Fiscal outlook
spending announced last year – that fall is just 0.8 per cent of GDP and thanks entirely to
the squeeze on welfare spending. The Government’s latest plans would leave public
spending falling very slightly as a share of GDP between 2020-21 and 2023-24.
Chart A: Policy responses to underlying fiscal forecast revisions
December 2013
November 2016
March 2019
-0.5
0.0
0.5
1.0
-1.0 -0.5 0.0 0.5 1.0 1.5 2.0
Policy
change (p
er ce
nt o
f G
DP)
Underlying forecast revision (per cent of GDP)
Pre-referendum forecasts
Post-referendum forecasts
Note: Reflects the cash revision over the last 5 years of each forecast, rebased to each historic nominal GDP forecast.Source: OBR
Forecast improvement,Policy giveaway
Forecast deterioration,Policy giveaway
Forecast improvement,Policy takeaway
Forecast deterioration,Policy takeaway
Policy giveaways when forecast has improved
Mix of policy giveaways and takeaways when forecast has deteriorated
Forecast revision in context
4.126 Chart 4.6 puts the revision in this forecast in the context of all the revisions we have made
since we produced our first forecast in June 2010. It shows that (in absolute terms) the
underlying revision we have made to borrowing in this forecast (0.29 per cent of GDP on
average over five years) is similar to the average of our previous spring forecast revisions
(0.33 per cent of GDP). As already noted, this is only the fifth forecast revision out of 19 that
we have made where revisions to debt interest and receipts have contributed in the same
direction to the borrowing revision. Two of those five were our most recent two forecasts,
where it is likely that market interest rate expectations have priced in some probability of a
disruptive Brexit outcome whereas our receipts forecast is conditioned on a smooth exit.
Economic and fiscal outlook 120

Fiscal outlook
Chart 4.6: Sources of underlying revisions to borrowing since June 2010
-1.5
-1.0
-0.5
0.0
0.5
1.0
1.5
2.0
Nov10
Mar11
Nov11
Mar12
Dec12
Mar13
Dec13
Mar14
Dec14
Mar15
July15
Nov15
Mar16
Nov16
Mar17
Nov17
Mar18
Oct18
Mar19
Per ce
nt o
f G
DP
Other spending Receipts Debt interest Underlying change
Note: Reflects the cash revision over the last 5 years of each forecast, rebased to each historic nominal GDP forecast.Source: OBR
Higher borrowing/higher spending/lower receipts
Lower borrowing/Lower spending/Higher receipts
Cyclically adjusted net borrowing (the structural fiscal position)
4.127 Cyclically adjusted net borrowing has been revised down more than PSNB, because the
strength of income tax and the downward revision to debt interest spending are treated as
structural improvements to the fiscal position. The former reflects our judgement that the
recent buoyancy of revenues and the effective tax rate will persist. The latter could reflect an
inconsistency between the Brexit assumptions underpinning our economy forecast and those
implicit in the market-derived interest rate path that drives our debt interest forecast, as
discussed above. We now expect structural borrowing to fall to 0.5 per cent of GDP by
2023-24, down from 0.8 per cent in our October forecast. The Government’s ‘fiscal
mandate’ is set in terms of this measure, so its profile is discussed in Chapter 5.
Current budget balance
4.128 We continue to expect the current budget to remain in surplus over the forecast period,
rising from £20.4 billion in 2018-19 (1.0 per cent of GDP) to £40.3 billion (1.6 per cent of
GDP) in 2023-24. Relative to October, the surplus is larger in every year, largely reflecting
our forecast for higher tax receipts and lower debt interest spending.
4.129 Cyclically adjusted, we expect the current budget to show a surplus of 0.9 per cent of GDP
in 2018-19, a little smaller than the headline current budget surplus due to our assumption
that the output gap is slightly positive. We continue to expect this surplus to rise in every year
of the forecast, reaching 1.6 per cent of GDP in 2023-24.
121 Economic and fiscal outlook
Fiscal outlook
Financial transactions and cash borrowing
4.130 Public sector net borrowing (PSNB) is the difference between total public sector receipts and
expenditure each year, measured on an accrued basis. But the public sector’s fiscal position
also depends on the flow of financial transactions, such as loans and repayments between
government and the private sector or the sale of financial assets to the private sector. These
do not affect PSNB directly, but they do affect the Government’s cash position and its stock of debt and assets. This affects interest paid and received, which do affect PSNB.
4.131 The public sector net cash requirement (PSNCR) is the most complete measure of the public
sector’s cash flow position in each year.20 It drives our forecast of public sector net debt
(PSND), which is also largely a cash measure. From our estimate of the PSNCR we derive an
estimate of the central government net cash requirement (CGNCR), which in turn largely
determines the Government’s financing requirement – the amount it needs to raise from
debt instruments including Treasury bills, gilt issues and NS&I products.
4.132 Differences between the PSNCR and PSNB can be split into the following categories:
• Loans and repayments: loans that the public sector makes to the private sector do not
affect PSNB directly, but the cash flows affect the PSNCR. In Table 4.28 we divide net
lending into programmes that the Government manages within DEL and others.
• Sales or purchases of financial assets: the public sector may acquire or sell financial
assets such as loans, equity or corporate bonds. When it sells an asset for cash, the
initial transaction does not affect PSNB, whereas the cash received will reduce the
PSNCR. But both PSNB and the PSNCR will be higher in future years if the Government
foregoes an income stream that flowed from the asset sold.
• Bank of England schemes: some Bank of England actions involve loans and
repayments or the purchase of financial assets that affect the PSNCR. We describe the
effects of these schemes, such as the Term Funding Scheme, separately from
transactions involving other public sector loans and financial assets.
• Timing effects: PSNB is an accruals measure of borrowing in which, where possible,
spending and receipts are attributed to the year of the activity to which they relate. In
contrast, PSNCR is a cash measure in which spending and receipts are attributed to the
year in which the cash flow takes place. These timing differences must be adjusted for.
20 Consistent with the measures of debt and deficit used in this forecast, PSNCR excludes the public sector banks.
Economic and fiscal outlook 122
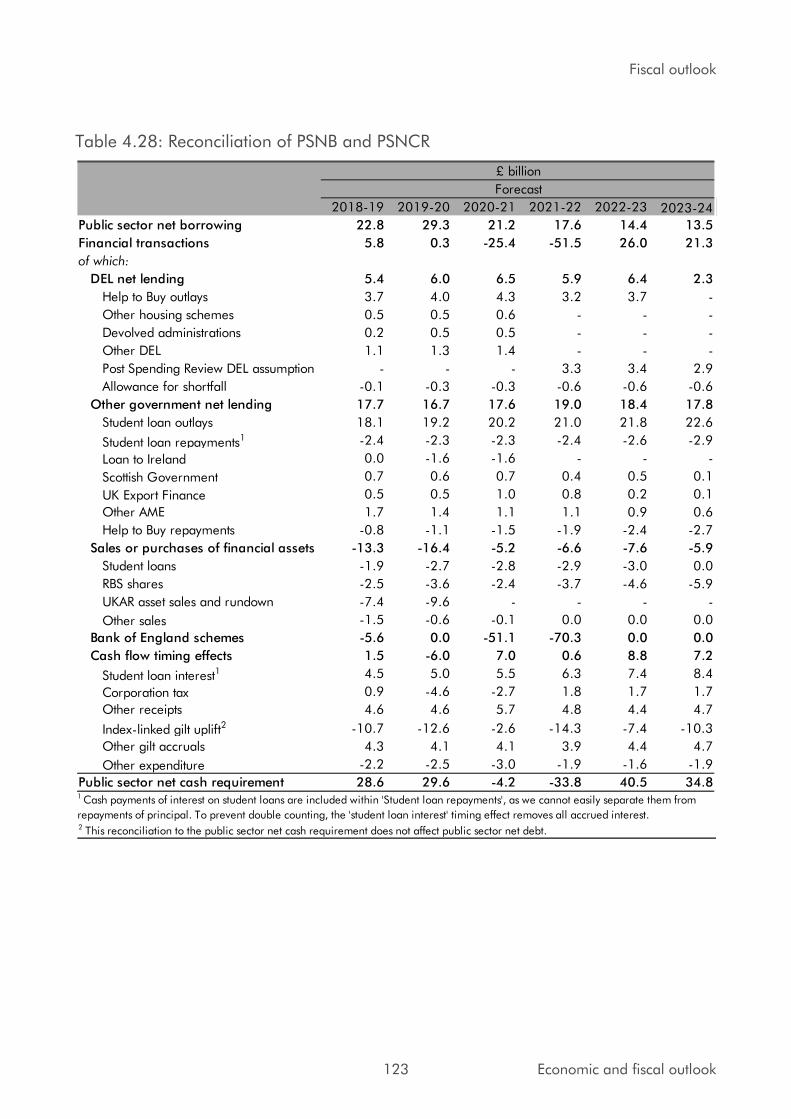
Fiscal outlook
Table 4.28: Reconciliation of PSNB and PSNCR
2018-19 2019-20 2020-21 2021-22 2022-23 2023-24
Public sector net borrowing 22.8 29.3 21.2 17.6 14.4 13.5
Financial transactions 5.8 0.3 -25.4 -51.5 26.0 21.3
of which:
DEL net lending 5.4 6.0 6.5 5.9 6.4 2.3
Help to Buy outlays 3.7 4.0 4.3 3.2 3.7 -
Other housing schemes 0.5 0.5 0.6 - - -
Devolved administrations 0.2 0.5 0.5 - - -
Other DEL 1.1 1.3 1.4 - - -
Post Spending Review DEL assumption - - - 3.3 3.4 2.9
Allowance for shortfall -0.1 -0.3 -0.3 -0.6 -0.6 -0.6
Other government net lending 17.7 16.7 17.6 19.0 18.4 17.8
Student loan outlays 18.1 19.2 20.2 21.0 21.8 22.6
Student loan repayments1 -2.4 -2.3 -2.3 -2.4 -2.6 -2.9
Loan to Ireland 0.0 -1.6 -1.6 - - -
Scottish Government 0.7 0.6 0.7 0.4 0.5 0.1
UK Export Finance 0.5 0.5 1.0 0.8 0.2 0.1
Other AME 1.7 1.4 1.1 1.1 0.9 0.6
Help to Buy repayments -0.8 -1.1 -1.5 -1.9 -2.4 -2.7
Sales or purchases of financial assets -13.3 -16.4 -5.2 -6.6 -7.6 -5.9
Student loans -1.9 -2.7 -2.8 -2.9 -3.0 0.0
RBS shares -2.5 -3.6 -2.4 -3.7 -4.6 -5.9
UKAR asset sales and rundown -7.4 -9.6 - - - -
Other sales -1.5 -0.6 -0.1 0.0 0.0 0.0
Bank of England schemes -5.6 0.0 -51.1 -70.3 0.0 0.0
Cash flow timing effects 1.5 -6.0 7.0 0.6 8.8 7.2
Student loan interest1 4.5 5.0 5.5 6.3 7.4 8.4
Corporation tax 0.9 -4.6 -2.7 1.8 1.7 1.7
Other receipts 4.6 4.6 5.7 4.8 4.4 4.7
Index-linked gilt uplift2 -10.7 -12.6 -2.6 -14.3 -7.4 -10.3
Other gilt accruals 4.3 4.1 4.1 3.9 4.4 4.7
Other expenditure -2.2 -2.5 -3.0 -1.9 -1.6 -1.9
Public sector net cash requirement 28.6 29.6 -4.2 -33.8 40.5 34.8
2 This reconciliation to the public sector net cash requirement does not affect public sector net debt.
£ billion
Forecast
1 Cash payments of interest on student loans are included within 'Student loan repayments', as we cannot easily separate them from
repayments of principal. To prevent double counting, the 'student loan interest' timing effect removes all accrued interest.
123 Economic and fiscal outlook

Fiscal outlook
Table 4.29: Changes in the reconciliation of PSNB and PSNCR
2018-19 2019-20 2020-21 2021-22 2022-23 2023-24
Public sector net borrowing -2.7 -2.4 -5.5 -6.2 -6.4 -6.3
Financial transactions 0.2 -3.6 4.7 4.3 0.7 6.6
of which:
DEL net lending -0.6 -1.0 -0.8 0.0 0.0 0.0
Help to Buy outlays -0.1 -0.4 -0.5 -0.2 -0.2 -
Other housing schemes -0.1 -0.6 -0.5 - - -
Devolved administrations -0.2 0.0 0.0 - - -
Other DEL -0.2 -0.4 -0.2 - - -
Post Spending Review DEL assumption - - - 0.2 0.2 0.0
Allowance for shortfall 0.0 0.3 0.3 0.0 0.0 0.0
Other government net lending -0.1 -0.1 -0.3 0.4 0.4 0.3
Student loan outlays 0.1 0.0 0.0 0.1 0.1 0.1
Student loan repayments1 0.0 0.0 0.1 0.1 0.1 0.4
Loan to Ireland 0.0 0.0 0.0
Scottish Government 0.0 0.0 0.0 0.0 0.0 0.0
UK Export Finance -0.2 -0.2 -0.4 -0.2 0.2 0.1
Other AME 0.0 0.0 -0.1 0.2 -0.2 -0.5
Help to Buy repayments 0.0 0.0 0.1 0.2 0.2 0.3
Sales or purchases of financial assets 4.4 -4.6 0.0 0.1 0.1 0.1
Student loans 0.0 0.0 0.0 0.0 0.0 0.0
RBS shares 0.0 0.0 0.1 0.1 0.1 0.1
UKAR asset sales and rundown 4.4 -4.6 - - - -
Other sales 0.0 0.0 0.0 0.0 0.0 0.0
Bank of England schemes -5.0 0.0 2.1 2.9 0.0 0.7
Cash flow timing effects 1.6 2.2 3.7 1.0 0.2 5.4
Student loan interest1 0.0 -0.5 -0.6 -0.6 -0.4 0.0
Corporation tax -1.5 2.5 2.2 0.3 0.1 0.3
Other receipts 0.5 0.2 0.7 0.5 0.2 -0.3
Index-linked gilt uplift2 2.8 -0.2 1.1 0.4 0.0 5.1
Other gilt accruals -0.2 0.2 0.3 0.3 0.3 0.3
Other expenditure 0.0 0.0 0.0 0.0 0.0 0.0
Public sector net cash requirement -2.5 -6.0 -0.8 -1.9 -5.7 0.3
£ billion
1 Cash payments of interest on student loans are included within 'Student loan repayments', as we cannot easily separate them from
repayments of principal. To prevent double counting, the 'student loan interest' timing effect removes all accrued interest.2 This reconciliation to the public sector net cash requirement does not affect public sector net debt.
Forecast
Economic and fiscal outlook 124
Fiscal outlook
Loans and repayments
Departmental programmes within DEL
4.133 DEL lending programmes are set department by department and subject to multi-year
spending (or lending) limits. The largest of these by far is the Help to Buy: Equity Loan (HtB)
scheme, which is managed within DEL even though it is entirely demand driven. The path of
HtB outlays reflects how the scheme is set to change in future years. In 2021-22 and 2022-
23, eligibility will be more restricted than currently – in particular, only first-time buyers will
be eligible in those years. The Government plans to close the scheme to new loans in 2023-
24. Outlays have been revised down a little since October thanks to lower house prices.
4.134 DEL lending across the main lending departments (BEIS and MHCLG) and the devolved
administrations has also been revised down. We had anticipated such revisions in our
‘allowance for shortfall’ assumption (which relates to the extent to which departments will
lend less than they plan to), so have revised that down in light of these latest plans.
4.135 The Government’s post-Spending Review DEL policy assumption is unchanged from
October – slightly lower Help to Buy outlays therefore create space for higher lending
elsewhere. We have not changed our allowance for shortfall assumption in this period.
Student loans
4.136 Net outlays on student loans raise the net cash requirement relative to net borrowing in
each year of our forecast. Other than policy changes, revisions to the number of new
full-time undergraduate entrants to higher education institutions are generally one of the
biggest drivers of change in our outlays forecast. We continue to expect student entrants to
fall slightly in the 2018-19 academic year, but by less than we assumed in October. This
reflects more entrants than expected in the latest Higher Education Statistics Agency (HESA)
outturn for 2017-18; unexpectedly high acceptance rates by higher education institutions in
the latest UCAS data for 2018-19; and more UCAS applicants by the January 2019
deadline (by which time most undergraduate applications have been made) than would
have been consistent with our October forecast. This generates a modest rise in England
domiciled student entrants in 2019-20, after which trends in the number of 18-year olds in
the population cause entrants to decline again in 2020-21 before growing slowly thereafter.
4.137 In July 2018, the Government announced that EU students entering English universities in
the 2019-20 academic year would “be charged the same tuition fees as UK students” and
able to access financial support “on the same basis as is available today”.21 In the absence
of a stated policy for beyond 2019-20, we assume flat EU student entrants thereafter.
4.138 Net outlays on student loans rise from £15.7 billion in 2018-19 to £19.8 billion in 2023-
24. This is up slightly since October, thanks to the upward revision to student numbers. A
correction to the profile of repayments foregone as a result of the Government’s sales of tranches of the student loan book, and revisions to our economic forecast that affect
repayment levels and fees uprating, also increase net outlays relative to October.
21 HM Government, Further financial support for UK and EU students, July 2018.
125 Economic and fiscal outlook
Fiscal outlook
4.139 In February 2018, the Government announced a review of post-18 education and funding – the ‘Augar review’. Among other things, this will cover “the level, terms and duration” of students’ financial contribution to their post-18 education. After several delays, the review is
now expected to be completed later this year. Any policy changes in response to the review’s recommendations could have significant implications for our student loans forecast.
4.140 Following the ONS’s announcement that it intends to change the accounting treatment of
student loans, we explore the potential impact of its ‘partitioned loan transfer approach’ in
Annex B. This would not change how the cashflows described in this section are accounted
for, but would have significant implications for how and when they are accrued.
Other net lending
4.141 Other net lending includes the phased repayment of a £3.2 billion loan extended to the
Irish Government during the euro area crisis, loan programmes of the Scottish Government
(including Help to Buy (Scotland)), lending by local authorities and UK Export Finance loan
schemes. Additionally, while outlays under Help to Buy in England are recorded within DEL,
the repayments are not so we record them separately here.
4.142 Changes in other lending since October are generally small. The largest are the downward
revision to Help to Buy repayments, due to lower house price inflation, and downward
revisions to the initial years of our UK Export Finance lending forecast, in light of lower-
than-expected lending in the year-to-date and its own slower lending plans.
Sales and purchases of financial assets
4.143 The Government plans to sell several financial assets across the forecast period, raising a
total of £55.2 billion. We only include the proceeds from financial asset sales in our
forecasts when firm details are available that allow the effects to be quantified with
reasonable accuracy and allocated to a specific year. There are several planned sales that
currently meet these criteria (see Chart 4.7). All are subject to uncertainty. We have
assumed that there will be sufficient private-sector demand for the sales to take place and at
a sufficiently attractive price for the transaction to pass the Government’s value for money
criteria and go ahead. Several sales were delayed after the EU referendum vote in 2016.
There is clearly a risk at present that unexpected events could lead to further delays.
4.144 Selling most financial assets will produce an upfront benefit to PSND (and a smaller one to
PSNB via lower interest payments), but reduce future income, lowering interest or dividend
receipts (affecting both PSNB and PSND). Their effect on the broader balance sheet measure
PSNFL, which includes all financial assets not just ‘liquid’ ones, tends to be closer to neutral, since the sales in effect swap one asset for another (e.g. shares for cash). However, in the
case of student loans, and reflecting in part the subsidy element, the sales are at a steep
discount to the face value recorded in PSNFL. Sales therefore swap loan assets for a smaller
sum of cash, increasing PSNFL. The ONS’s proposed student loan accounting changes,
discussed in Annex B, would reduce the extent of these discounts.
Economic and fiscal outlook 126

Fiscal outlook
4.145 In terms of the largest financial asset sales included in our current forecast:
• The Government intends to divest itself of the remaining loan assets held within UK
Asset Resolution (UKAR)22 during 2019-20. A sale that in October we had expected to
complete at the end of 2018-19 is now expected to complete in early 2019-20,
altering the profile of receipts but not materially affecting the overall size.
• We continue to assume that sales of RBS shares recommence in 2019-20 and then
continue across the forecast. Overall proceeds have been revised up £0.3 billion
relative to our October forecast, reflecting share price movements in the interim.
• The Government raised £1.9 billion from sales of Plan 1 student loans in December
2018 as part of its plan to raise £15 billion up to 2022-23. As the December proceeds
were close to the estimate in our October forecast, there is little change to the future
years of the forecast. Details on the next sale are expected later in the year.
Chart 4.7: Proceeds from financial asset sales
0
2
4
6
8
10
12
14
16
18
2018-19 2019-20 2020-21 2021-22 2022-23 2023-24
£ b
illion
RBS shares
Student loans
UKAR asset sales and rundown
Other sales
Source: HM Treasury, OBR
Bank of England schemes
4.146 Since March 2009, the Bank of England’s Monetary Policy Committee (MPC) has deployed unconventional forms of monetary policy to support the economy. The purchase of gilts by
the Asset Purchase Facility (APF) affects PSND, but does not affect the flow measures of
borrowing or the cash requirement. The flows of interest associated with those gilts have a
relatively large effect on public sector debt interest spending and therefore borrowing.
4.147 In our October forecast, market-derived expectations of Bank Rate exceeded 1.5 per cent by
the end of the forecast. Consequently, in line with MPC guidance, we assumed that the APF
22 UK Asset Resolution holds the assets and liabilities of the former Northern Rock Asset Management and Bradford and Bingley.
127 Economic and fiscal outlook
Fiscal outlook
would begin to sell its assets in 2023-24. In this forecast, Bank Rate remains below 1.5 per
cent throughout, so we do not assume any change in asset holdings within the forecast
period. This increases the cash requirement in 2023-24 relative to our October assumption.
4.148 The Bank’s Term Funding Scheme (TFS) remains the largest source of year-to-year
fluctuations in our PSNCR forecast. The scheme extended £127 billion of loans to
commercial banks. Since our October forecast £5.0 billion of them have been repaid early
rather than at the end of their 4-year terms in 2020-21 and 2021-22 – reflecting one large
repayment and one very small one. We have therefore reduced the expected redemptions in
those years by an equivalent amount. In line with the terms and conditions of the scheme
there could be further repayments between now and the term of the remaining loans.
However, since at this stage there is insufficient information to forecast either the size or
timing of any future early repayments, we have treated the 2018 repayments as one-offs
and assumed remaining loans are repaid at their original maturity date.
Timing effects
4.149 To move from PSNB to PSNCR, it is necessary to adjust for expected timing differences
between cash flows and accruals. For example, as taxes are generally paid in arrears, and if
receipts are forecast to rise over time, the cash received each year will generally be lower
than the accrued receipts. The timing difference is large for smaller firms’ corporation tax.
4.150 The largest receipts timing adjustment relates to interest on student loans. This is included in
the accrued measure of public sector current receipts from the point at which the loan is
issued, but cash repayments do not begin until the former students’ income rises above a specific threshold. Much of the accrued interest will eventually be written off rather than
received as cash payments – a ‘fiscal illusion’ within the public sector net borrowing calculation that is due to be addressed later this year (see Annex B). We have revised down
our forecast of this part of the receipts accruals adjustment slightly relative to October.
4.151 Similar timing adjustments are made for spending. The largest relates to index-linked gilts.
This is very sensitive to RPI inflation, as well as to the uneven profile of redemptions from
year to year. Positive RPI inflation raises the amount that governments will have to pay on
index-linked gilts when they are redeemed. This commitment is recognised in PSNB as
accrued debt interest spending each year, but the actual cash payments do not occur until
redemption, which can be decades into the future. This adjustment has a larger negative
impact in most years than it did in our October forecast reflecting changes to our inflation
forecast, partly offset by a reduction in planned index-linked gilt issuance.
4.152 The largest change in our forecast since October relates to corporation tax. The timetable
for larger firms’ corporation tax payments will be brought forward for accounting periods starting from April 2019 onwards, resulting in some companies making five quarterly cash
instalment payments in a single fiscal year. These effects are spread across 2019-20 and
2020-21, reflecting the different accounting periods of the affected firms. These boosts to
cash receipts do not reflect changes in the underlying liabilities that determine the accrued
tax receipts used for PSNB estimates, so they are associated with large negative accruals
Economic and fiscal outlook 128

Fiscal outlook
adjustments in 2019-20 and 2020-21. Relative to our October forecast, the boost to cash
receipts in those two years – and therefore the accruals adjustment – has been revised down
by an average of over £2 billion a year. This reflects large downward revisions to the
proportion of firms assumed to pay corporation tax quarterly and the proportion of those
assumed to be large enough to be affected by the measure (see paragraph 4.35).
Central government net cash requirement
4.153 The central government net cash requirement (CGNCR) is a primary determinant of
government’s net financing requirement. Table 4.30 reconciles CGNCR with PSNCR and
Table 4.31 sets out the changes in this reconciliation since October. The reconciliation
removes transactions associated with local authorities and public corporations from the
PSNCR. Relative to October, the biggest change relates to our revised assumptions
regarding the Bank of England’s monetary policy operations, which affect public corporations’ net cash requirement at the start and middle of the forecast period.
4.154 The classification of Bradford & Bingley (B&B), Northern Rock Asset Management (NRAM)
and Network Rail in the central government sector means that the CGNCR is not simply a
measure of the cash required by the Exchequer to fund its operations, which forms the basis
for the Government’s net financing requirement.23 This has three effects:
• The banks’ own cash requirements are included in the headline CGNCR. Running
down the banks’ loan books (including through asset sales) reduces the CGNCR by £7.4 billion in 2018-19, falling to zero by 2020-21, but this does not directly affect the
Exchequer (this forecast is shown in Table 4.28).
• Interactions between the Exchequer and these bodies net off within the headline
measure. The B&B and NRAM adjustment shows the difference between net cash
received by UKAR and that transferred to central government.
• The Treasury finances Network Rail’s new and maturing debt for a fee. Refinancing needs are estimated at £4.2 billion over the forecast.
23 The Government is publishing revised financing arithmetic for 2018-19 and setting the financing remit for 2019-20 alongside this Spring Statement. The OBR provides the Government with the forecast of the CGNCR for this purpose, but plays no further role in the derivation of the net financing requirement.
129 Economic and fiscal outlook
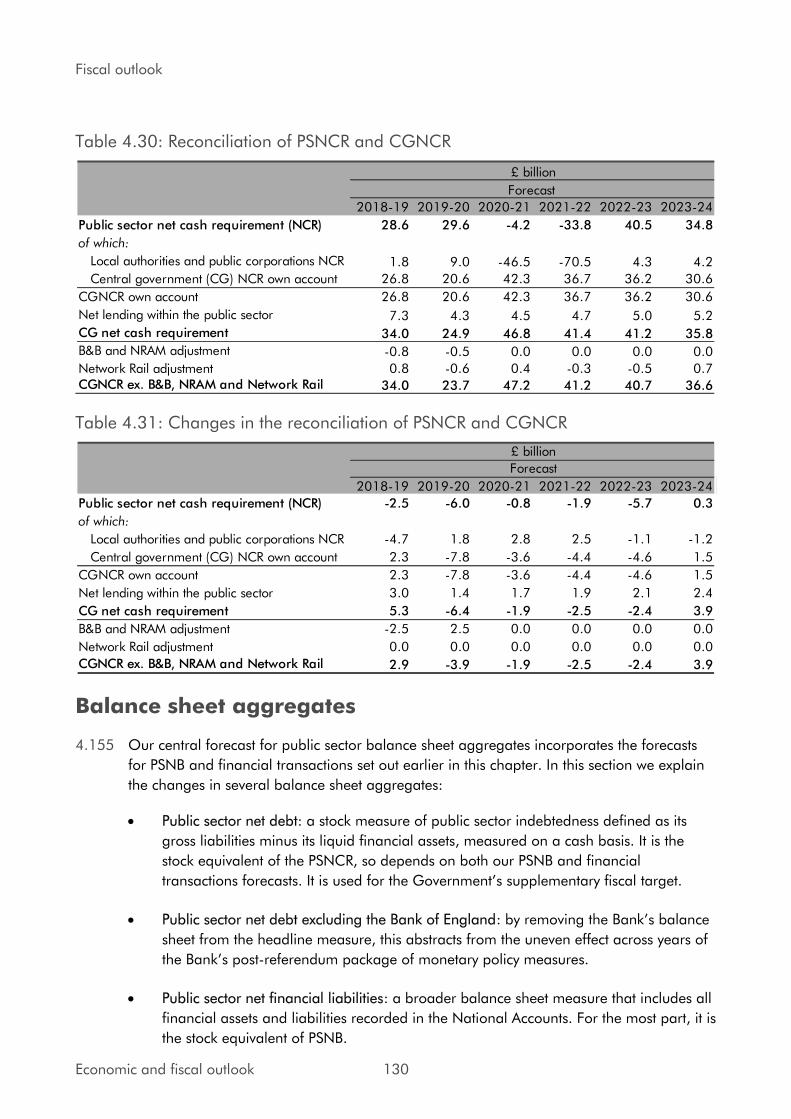
Fiscal outlook
Table 4.30: Reconciliation of PSNCR and CGNCR
2018-19 2019-20 2020-21 2021-22 2022-23 2023-24
Public sector net cash requirement (NCR) 28.6 29.6 -4.2 -33.8 40.5 34.8
of which:
Local authorities and public corporations NCR 1.8 9.0 -46.5 -70.5 4.3 4.2
Central government (CG) NCR own account 26.8 20.6 42.3 36.7 36.2 30.6
CGNCR own account 26.8 20.6 42.3 36.7 36.2 30.6
Net lending within the public sector 7.3 4.3 4.5 4.7 5.0 5.2
CG net cash requirement 34.0 24.9 46.8 41.4 41.2 35.8
B&B and NRAM adjustment -0.8 -0.5 0.0 0.0 0.0 0.0
Network Rail adjustment 0.8 -0.6 0.4 -0.3 -0.5 0.7CGNCR ex. B&B, NRAM and Network Rail 34.0 23.7 47.2 41.2 40.7 36.6
£ billion
Forecast
Table 4.31: Changes in the reconciliation of PSNCR and CGNCR
2018-19 2019-20 2020-21 2021-22 2022-23 2023-24
Public sector net cash requirement (NCR) -2.5 -6.0 -0.8 -1.9 -5.7 0.3
of which:
Local authorities and public corporations NCR -4.7 1.8 2.8 2.5 -1.1 -1.2
Central government (CG) NCR own account 2.3 -7.8 -3.6 -4.4 -4.6 1.5
CGNCR own account 2.3 -7.8 -3.6 -4.4 -4.6 1.5
Net lending within the public sector 3.0 1.4 1.7 1.9 2.1 2.4
CG net cash requirement 5.3 -6.4 -1.9 -2.5 -2.4 3.9
B&B and NRAM adjustment -2.5 2.5 0.0 0.0 0.0 0.0
Network Rail adjustment 0.0 0.0 0.0 0.0 0.0 0.0
CGNCR ex. B&B, NRAM and Network Rail 2.9 -3.9 -1.9 -2.5 -2.4 3.9
Forecast
£ billion
Balance sheet aggregates
4.155 Our central forecast for public sector balance sheet aggregates incorporates the forecasts
for PSNB and financial transactions set out earlier in this chapter. In this section we explain
the changes in several balance sheet aggregates:
• Public sector net debt: a stock measure of public sector indebtedness defined as its
gross liabilities minus its liquid financial assets, measured on a cash basis. It is the
stock equivalent of the PSNCR, so depends on both our PSNB and financial
transactions forecasts. It is used for the Government’s supplementary fiscal target.
• Public sector net debt excluding the Bank of England: by removing the Bank’s balance sheet from the headline measure, this abstracts from the uneven effect across years of
the Bank’s post-referendum package of monetary policy measures.
• Public sector net financial liabilities: a broader balance sheet measure that includes all
financial assets and liabilities recorded in the National Accounts. For the most part, it is
the stock equivalent of PSNB.
Economic and fiscal outlook 130
Fiscal outlook
Public sector net debt
4.156 Table 4.32 shows the sources of year-on-year changes in PSND between 2018-19 and
2023-24. In addition to PSNB and financial transactions, the level of debt can be affected
by changes in the valuation of existing assets and liabilities that make up PSND or in the
classification of bodies into or out of the public sector. The main effects in our forecast are:
• The large gilt premia associated with low gilt yields (including negative real yields)
relative to the coupons paid on the gilts. This is particularly pronounced for index-
linked gilts. As PSND rises by the nominal value of gilts issued, rather than their market
value, selling at a premium reduces the recorded impact on debt.
• Index-linked gilts are recorded at their uplifted nominal value in PSND, so positive RPI
inflation adds to PSND each year but does not affect the PSNCR until the gilts redeem.
• Differences between the nominal and purchase value of gilts held by the Bank of
England’s Asset Purchase Facility (APF) add to net debt. This changes little in most
years, but is material in 2021-22 when several gilts that the APF holds are due to
redeem. We assume they will be rolled over for gilts of higher nominal value.
• A weaker pound increases the value of the unhedged component of the international
reserves that are netted off PSND in 2018-19.
• The reclassification of Scottish and Welsh housing associations causes a step change
down in 2018-19. In later years the reclassification affects PSNCR and PSND equally.
4.157 Cash borrowing as measured by the PSNCR adds to the stock of debt at the start and the
end of the forecast, but reduces it in 2020-21 and 2021-22 when there is a cash surplus
generated by the redemption of the Bank of England’s Term Funding Scheme (TFS) loans.
TFS loans are the prime driver of the uneven path of PSND over the forecast.
4.158 Valuation changes also have an uneven profile – in particular as regards the inflation uplift
in the value of index-linked gilts.
131 Economic and fiscal outlook

Fiscal outlook
Table 4.32: Year-on-year change in public sector net debt
2018-19 2019-20 2020-21 2021-22 2022-23 2023-24
Level of PSND 1803 1838 1828 1796 1838 1878
Year-on-year change in PSND 24.5 34.8 -10.3 -32.0 42.3 39.9
of which:
Due to public sector net cash requirement 28.6 29.6 -4.2 -33.8 40.5 34.8
Public sector net borrowing 22.8 29.3 21.2 17.6 14.4 13.5
Financial transactions 5.8 0.3 -25.4 -51.5 26.0 21.3
Due to valuation changes 1.9 5.2 -6.1 1.9 1.9 5.1
Gilt premia -5.8 -8.1 -9.3 -7.2 -6.3 -5.6
Asset Purchase Facility gilt premia 1.1 0.3 0.5 -5.4 0.7 0.3
Index-linked gilts uplift 10.7 12.6 2.6 14.3 7.4 10.3
International reserves -4.0 0.5 0.2 0.1 0.1 0.1
Due to classification changes -6.0 0.0 0.0 0.0 0.0 0.0
£ billion
Forecast
Changes to public sector net debt
4.159 Our latest PSND forecast has been revised down in all years relative to our October
forecast, by steadily increasing amounts that reach 1.1 per cent of GDP in 2023-24.
4.160 We have revised down our pre-measures forecast due to:
• Modestly higher nominal GDP, which reduces the debt-to-GDP ratio slightly from
2020-21 onwards.
• The downward revisions to our pre-measures forecast for public sector net borrowing
reduce cash debt and the debt-to-GDP ratio by progressively larger amounts. This is
the largest source of change to our debt forecast since October.
• Upward revisions to our pre-measures financial transactions forecast, mainly due to
changes related to the timing of onshore corporation tax payments.
• Early redemptions in the Term Funding Scheme reduce debt at the start of the forecast
but this unwinds by 2021-22. Higher gilt prices and the assumption that the APF no
longer sells any assets within the forecast period increasingly add to debt.
4.161 As regards Government policy decisions, a short delay to a large UK Asset Resolution
(UKAR) asset sale increases debt in 2018-19 but this unwinds in 2019-20, after which the
effects of lower departmental spending dominate.
Economic and fiscal outlook 132
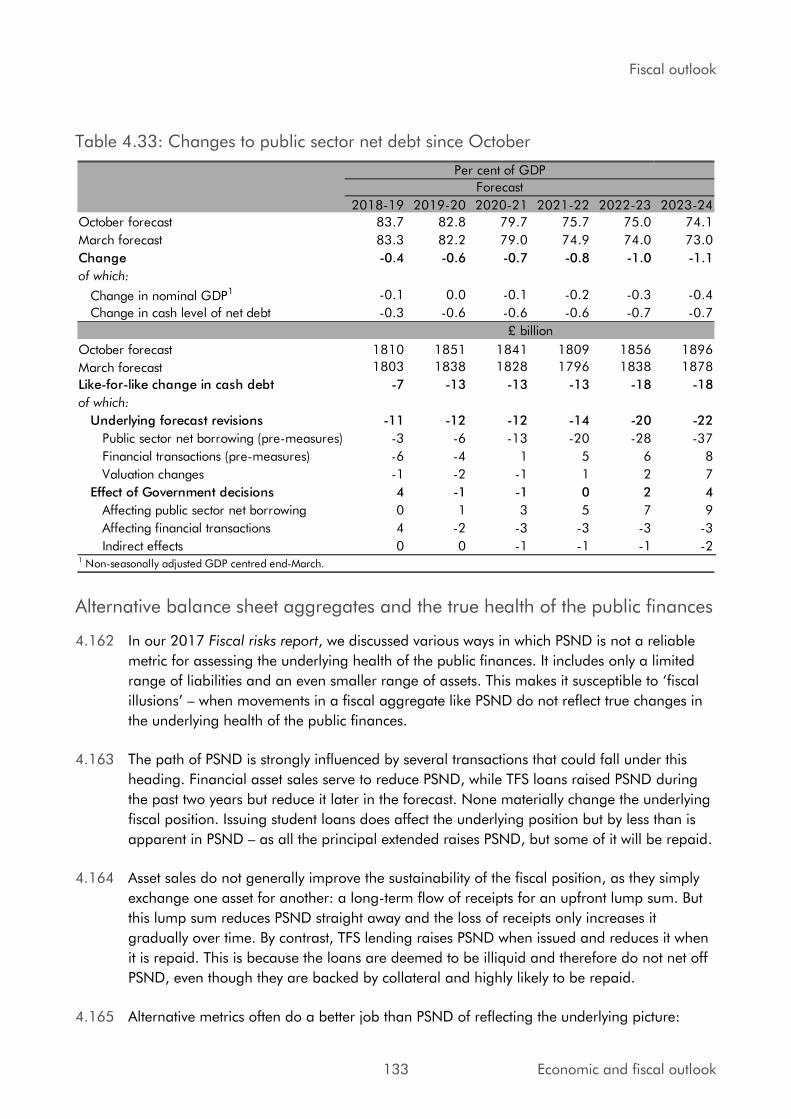
Fiscal outlook
Table 4.33: Changes to public sector net debt since October
2018-19 2019-20 2020-21 2021-22 2022-23 2023-24
October forecast 83.7 82.8 79.7 75.7 75.0 74.1
March forecast 83.3 82.2 79.0 74.9 74.0 73.0
Change -0.4 -0.6 -0.7 -0.8 -1.0 -1.1
of which:
Change in nominal GDP1 -0.1 0.0 -0.1 -0.2 -0.3 -0.4
Change in cash level of net debt -0.3 -0.6 -0.6 -0.6 -0.7 -0.7
October forecast 1810 1851 1841 1809 1856 1896
March forecast 1803 1838 1828 1796 1838 1878
Like-for-like change in cash debt -7 -13 -13 -13 -18 -18
of which:
Underlying forecast revisions -11 -12 -12 -14 -20 -22
Public sector net borrowing (pre-measures) -3 -6 -13 -20 -28 -37
Financial transactions (pre-measures) -6 -4 1 5 6 8
Valuation changes -1 -2 -1 1 2 7
Effect of Government decisions 4 -1 -1 0 2 4
Affecting public sector net borrowing 0 1 3 5 7 9
Affecting financial transactions 4 -2 -3 -3 -3 -3
Indirect effects 0 0 -1 -1 -1 -21 Non-seasonally adjusted GDP centred end-March.
Per cent of GDP
Forecast
£ billion
Alternative balance sheet aggregates and the true health of the public finances
4.162 In our 2017 Fiscal risks report, we discussed various ways in which PSND is not a reliable
metric for assessing the underlying health of the public finances. It includes only a limited
range of liabilities and an even smaller range of assets. This makes it susceptible to ‘fiscal
illusions’ – when movements in a fiscal aggregate like PSND do not reflect true changes in
the underlying health of the public finances.
4.163 The path of PSND is strongly influenced by several transactions that could fall under this
heading. Financial asset sales serve to reduce PSND, while TFS loans raised PSND during
the past two years but reduce it later in the forecast. None materially change the underlying
fiscal position. Issuing student loans does affect the underlying position but by less than is
apparent in PSND – as all the principal extended raises PSND, but some of it will be repaid.
4.164 Asset sales do not generally improve the sustainability of the fiscal position, as they simply
exchange one asset for another: a long-term flow of receipts for an upfront lump sum. But
this lump sum reduces PSND straight away and the loss of receipts only increases it
gradually over time. By contrast, TFS lending raises PSND when issued and reduces it when
it is repaid. This is because the loans are deemed to be illiquid and therefore do not net off
PSND, even though they are backed by collateral and highly likely to be repaid.
4.165 Alternative metrics often do a better job than PSND of reflecting the underlying picture:
133 Economic and fiscal outlook
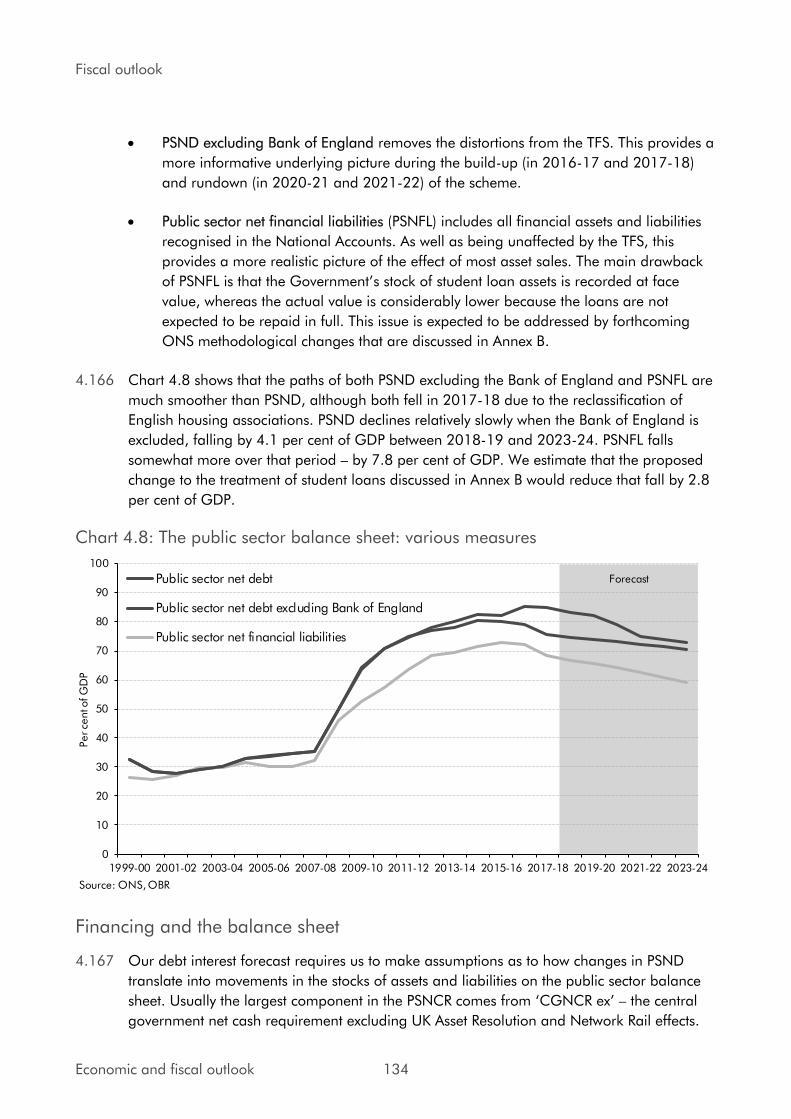
Fiscal outlook
• PSND excluding Bank of England removes the distortions from the TFS. This provides a
more informative underlying picture during the build-up (in 2016-17 and 2017-18)
and rundown (in 2020-21 and 2021-22) of the scheme.
• Public sector net financial liabilities (PSNFL) includes all financial assets and liabilities
recognised in the National Accounts. As well as being unaffected by the TFS, this
provides a more realistic picture of the effect of most asset sales. The main drawback
of PSNFL is that the Government’s stock of student loan assets is recorded at face
value, whereas the actual value is considerably lower because the loans are not
expected to be repaid in full. This issue is expected to be addressed by forthcoming
ONS methodological changes that are discussed in Annex B.
4.166 Chart 4.8 shows that the paths of both PSND excluding the Bank of England and PSNFL are
much smoother than PSND, although both fell in 2017-18 due to the reclassification of
English housing associations. PSND declines relatively slowly when the Bank of England is
excluded, falling by 4.1 per cent of GDP between 2018-19 and 2023-24. PSNFL falls
somewhat more over that period – by 7.8 per cent of GDP. We estimate that the proposed
change to the treatment of student loans discussed in Annex B would reduce that fall by 2.8
per cent of GDP.
Chart 4.8: The public sector balance sheet: various measures
Forecast
0
10
20
30
40
50
60
70
80
90
100
1999-00 2001-02 2003-04 2005-06 2007-08 2009-10 2011-12 2013-14 2015-16 2017-18 2019-20 2021-22 2023-24
Per ce
nt o
f G
DP
Public sector net debt
Public sector net debt excluding Bank of England
Public sector net financial liabilities
Source: ONS, OBR
Financing and the balance sheet
4.167 Our debt interest forecast requires us to make assumptions as to how changes in PSND
translate into movements in the stocks of assets and liabilities on the public sector balance
sheet. Usually the largest component in the PSNCR comes from ‘CGNCR ex’ – the central
government net cash requirement excluding UK Asset Resolution and Network Rail effects.
Economic and fiscal outlook 134
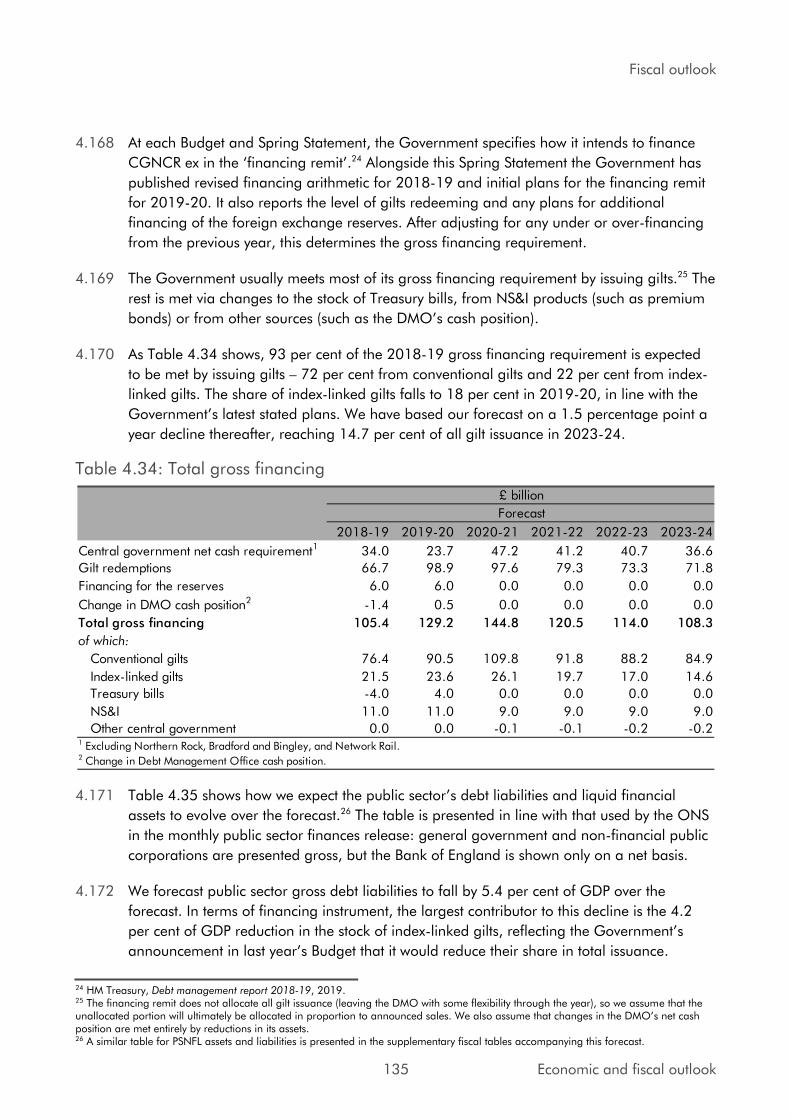
Fiscal outlook
4.168 At each Budget and Spring Statement, the Government specifies how it intends to finance
CGNCR ex in the ‘financing remit’.24 Alongside this Spring Statement the Government has
published revised financing arithmetic for 2018-19 and initial plans for the financing remit
for 2019-20. It also reports the level of gilts redeeming and any plans for additional
financing of the foreign exchange reserves. After adjusting for any under or over-financing
from the previous year, this determines the gross financing requirement.
4.169 The Government usually meets most of its gross financing requirement by issuing gilts.25 The
rest is met via changes to the stock of Treasury bills, from NS&I products (such as premium
bonds) or from other sources (such as the DMO’s cash position).
4.170 As Table 4.34 shows, 93 per cent of the 2018-19 gross financing requirement is expected
to be met by issuing gilts – 72 per cent from conventional gilts and 22 per cent from index-
linked gilts. The share of index-linked gilts falls to 18 per cent in 2019-20, in line with the
Government’s latest stated plans. We have based our forecast on a 1.5 percentage point a
year decline thereafter, reaching 14.7 per cent of all gilt issuance in 2023-24.
Table 4.34: Total gross financing
2018-19 2019-20 2020-21 2021-22 2022-23 2023-24
Central government net cash requirement1 34.0 23.7 47.2 41.2 40.7 36.6
Gilt redemptions 66.7 98.9 97.6 79.3 73.3 71.8
Financing for the reserves 6.0 6.0 0.0 0.0 0.0 0.0
Change in DMO cash position2 -1.4 0.5 0.0 0.0 0.0 0.0
Total gross financing 105.4 129.2 144.8 120.5 114.0 108.3
of which:
Conventional gilts 76.4 90.5 109.8 91.8 88.2 84.9
Index-linked gilts 21.5 23.6 26.1 19.7 17.0 14.6
Treasury bills -4.0 4.0 0.0 0.0 0.0 0.0
NS&I 11.0 11.0 9.0 9.0 9.0 9.0
Other central government 0.0 0.0 -0.1 -0.1 -0.2 -0.21 Excluding Northern Rock, Bradford and Bingley, and Network Rail.2 Change in Debt Management Office cash position.
£ billion
Forecast
4.171 Table 4.35 shows how we expect the public sector’s debt liabilities and liquid financial
assets to evolve over the forecast.26 The table is presented in line with that used by the ONS
in the monthly public sector finances release: general government and non-financial public
corporations are presented gross, but the Bank of England is shown only on a net basis.
4.172 We forecast public sector gross debt liabilities to fall by 5.4 per cent of GDP over the
forecast. In terms of financing instrument, the largest contributor to this decline is the 4.2
per cent of GDP reduction in the stock of index-linked gilts, reflecting the Government’s announcement in last year’s Budget that it would reduce their share in total issuance.
24 HM Treasury, Debt management report 2018-19, 2019. 25 The financing remit does not allocate all gilt issuance (leaving the DMO with some flexibility through the year), so we assume that the unallocated portion will ultimately be allocated in proportion to announced sales. We also assume that changes in the DMO’s net cash position are met entirely by reductions in its assets. 26 A similar table for PSNFL assets and liabilities is presented in the supplementary fiscal tables accompanying this forecast.
135 Economic and fiscal outlook
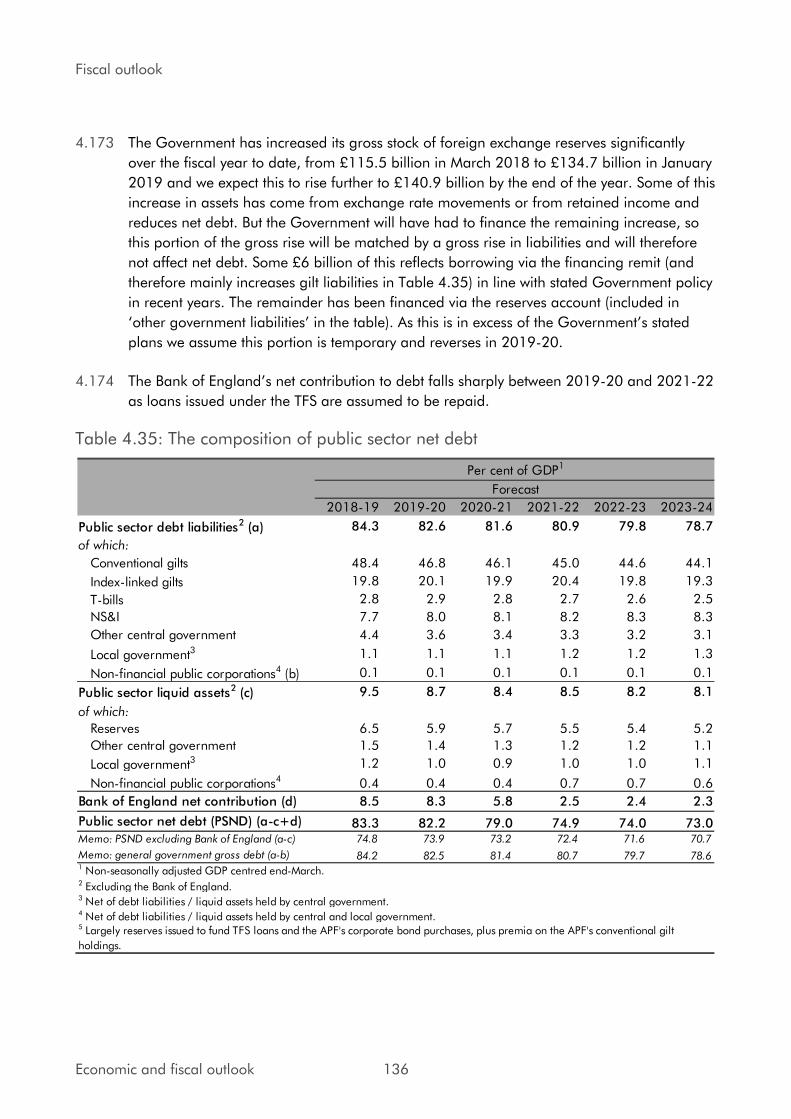
Fiscal outlook
4.173 The Government has increased its gross stock of foreign exchange reserves significantly
over the fiscal year to date, from £115.5 billion in March 2018 to £134.7 billion in January
2019 and we expect this to rise further to £140.9 billion by the end of the year. Some of this
increase in assets has come from exchange rate movements or from retained income and
reduces net debt. But the Government will have had to finance the remaining increase, so
this portion of the gross rise will be matched by a gross rise in liabilities and will therefore
not affect net debt. Some £6 billion of this reflects borrowing via the financing remit (and
therefore mainly increases gilt liabilities in Table 4.35) in line with stated Government policy
in recent years. The remainder has been financed via the reserves account (included in
‘other government liabilities’ in the table). As this is in excess of the Government’s stated plans we assume this portion is temporary and reverses in 2019-20.
4.174 The Bank of England’s net contribution to debt falls sharply between 2019-20 and 2021-22
as loans issued under the TFS are assumed to be repaid.
Table 4.35: The composition of public sector net debt
2018-19 2019-20 2020-21 2021-22 2022-23 2023-24
Public sector debt liabilities2 (a) 84.3 82.6 81.6 80.9 79.8 78.7
of which:
Conventional gilts 48.4 46.8 46.1 45.0 44.6 44.1
Index-linked gilts 19.8 20.1 19.9 20.4 19.8 19.3
T-bills 2.8 2.9 2.8 2.7 2.6 2.5
NS&I 7.7 8.0 8.1 8.2 8.3 8.3
Other central government 4.4 3.6 3.4 3.3 3.2 3.1
Local government3 1.1 1.1 1.1 1.2 1.2 1.3
Non-financial public corporations4 (b) 0.1 0.1 0.1 0.1 0.1 0.1
Public sector liquid assets2 (c) 9.5 8.7 8.4 8.5 8.2 8.1
of which:
Reserves 6.5 5.9 5.7 5.5 5.4 5.2
Other central government 1.5 1.4 1.3 1.2 1.2 1.1
Local government3 1.2 1.0 0.9 1.0 1.0 1.1
Non-financial public corporations4 0.4 0.4 0.4 0.7 0.7 0.6
Bank of England net contribution (d) 8.5 8.3 5.8 2.5 2.4 2.3
Public sector net debt (PSND) (a-c+d) 83.3 82.2 79.0 74.9 74.0 73.0Memo: PSND excluding Bank of England (a-c) 74.8 73.9 73.2 72.4 71.6 70.7
Memo: general government gross debt (a-b) 84.2 82.5 81.4 80.7 79.7 78.61 Non-seasonally adjusted GDP centred end-March.2 Excluding the Bank of England.3 Net of debt liabilities / liquid assets held by central government.4 Net of debt liabilities / liquid assets held by central and local government.
Per cent of GDP1
5 Largely reserves issued to fund TFS loans and the APF's corporate bond purchases, plus premia on the APF's conventional gilt
holdings.
Forecast
Economic and fiscal outlook 136

Fiscal outlook
Financial sector interventions
4.175 Table 4.36 updates our estimate of the net direct effect on the public finances of the
Government’s interventions in the financial sector during the financial crisis and subsequent
recession. This is not an attempt to quantify their overall effect on the public finances relative
to a counterfactual where the Government had not intervened as the crisis unfolded. The
costs of the crisis would almost certainly have been much greater in the absence of direct
interventions to restore the financial system to stability.27
4.176 In total, £136.6 billion was disbursed by the Treasury during and following the crisis. By
mid-February 2019, principal repayments had amounted to £95.0 billion, up slightly
relative to October, reflecting ongoing repayments from UKAR. This has fed through to a
smaller net cash shortfall of £19.4 billion.
4.177 As of mid-February, the Treasury was still owed £2.3 billion from loans (almost entirely by
UKAR). The value of its RBS shares had fallen to £18.2 billion,28 from the £20.3 billion
recorded in our October EFO, while the Treasury’s holdings in UKAR had an equity book value of around £8.5 billion. If the Treasury were to receive all loan payments in full, and to
sell its remaining shares at their mid-February values, it would realise an overall cash
surplus of £9.7 billion.
4.178 The cash surplus estimate excludes, however, the costs to the Treasury of financing these
interventions. If all interventions are assumed to have been financed through gilts, at the
then prevailing market rates, the Treasury estimates that the additional debt interest costs
would have amounted to £37.0 billion by February, mainly due to the costs associated with
RBS and UKAR.29 This is slightly higher than our October estimate, partly reflecting four
more months servicing debt on interventions yet to be repaid or sold. Together this implies
an overall cost of £27.3 billion to the Government (1.7 per cent of 2008-09 GDP), £2.8
billion higher than we estimated in October.
27 We discussed the fiscal implications of financial crises in Chapter 4 of our 2017 Fiscal risks report. 28 The RBS share price is an average over the 10 days to 14 February, consistent with other market-derived assumptions in our forecast. 29 The debt interest costs (or savings) associated with interventions that yield an overall deficit (or surplus) continue beyond the point the intervention itself has been wound up. This is the ‘Exchequer financing’ metric recorded in Table 4.36. In response to user requests, we now also report the split between financing costs up to the close of the intervention and those subsequently in a footnote to the table.
137 Economic and fiscal outlook
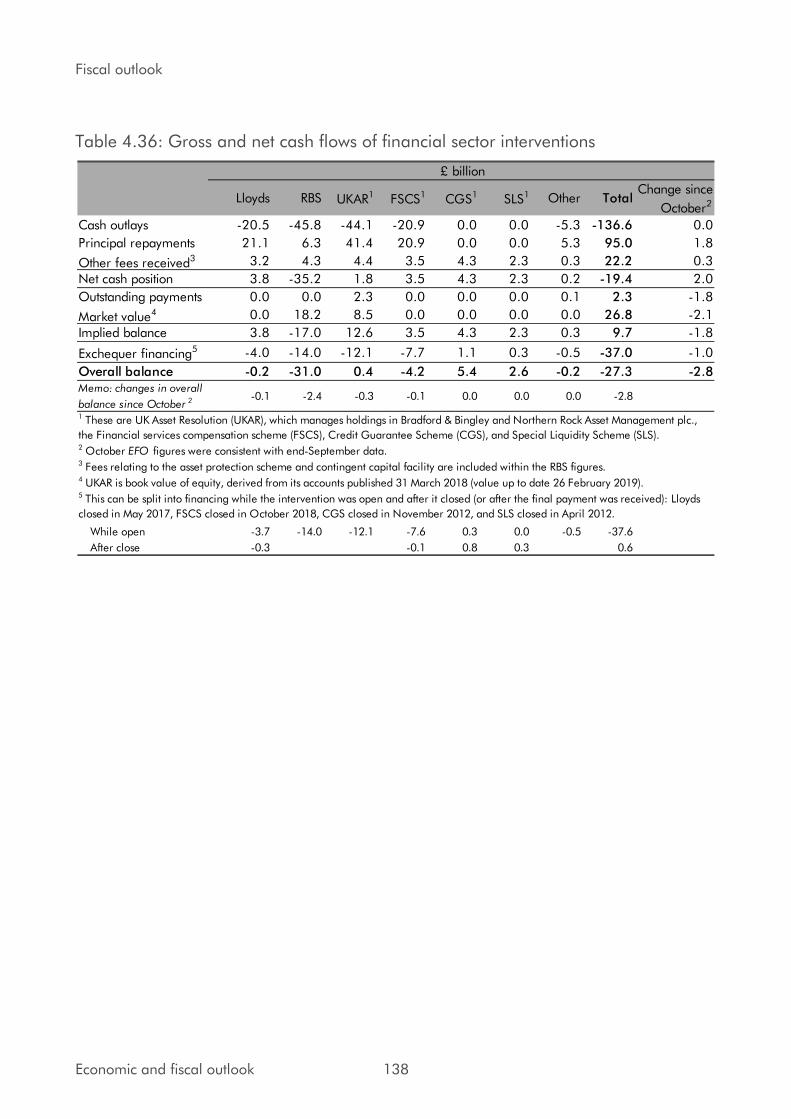
Fiscal outlook
Table 4.36: Gross and net cash flows of financial sector interventions
Lloyds RBS UKAR1 FSCS1 CGS1 SLS1 Other TotalChange since
October2
Cash outlays -20.5 -45.8 -44.1 -20.9 0.0 0.0 -5.3 -136.6 0.0
Principal repayments 21.1 6.3 41.4 20.9 0.0 0.0 5.3 95.0 1.8
Other fees received3 3.2 4.3 4.4 3.5 4.3 2.3 0.3 22.2 0.3
Net cash position 3.8 -35.2 1.8 3.5 4.3 2.3 0.2 -19.4 2.0
Outstanding payments 0.0 0.0 2.3 0.0 0.0 0.0 0.1 2.3 -1.8
Market value4 0.0 18.2 8.5 0.0 0.0 0.0 0.0 26.8 -2.1
Implied balance 3.8 -17.0 12.6 3.5 4.3 2.3 0.3 9.7 -1.8
Exchequer financing5 -4.0 -14.0 -12.1 -7.7 1.1 0.3 -0.5 -37.0 -1.0
Overall balance -0.2 -31.0 0.4 -4.2 5.4 2.6 -0.2 -27.3 -2.8Memo: changes in overall
balance since October 2 -0.1 -2.4 -0.3 -0.1 0.0 0.0 0.0 -2.8
2 October EFO figures were consistent with end-September data.3 Fees relating to the asset protection scheme and contingent capital facility are included within the RBS figures.4 UKAR is book value of equity, derived from its accounts published 31 March 2018 (value up to date 26 February 2019).
While open -3.7 -14.0 -12.1 -7.6 0.3 0.0 -0.5 -37.6
After close -0.3 -0.1 0.8 0.3 0.6
1 These are UK Asset Resolution (UKAR), which manages holdings in Bradford & Bingley and Northern Rock Asset Management plc.,
the Financial services compensation scheme (FSCS), Credit Guarantee Scheme (CGS), and Special Liquidity Scheme (SLS).
5 This can be split into financing while the intervention was open and after it closed (or after the final payment was received): Lloyds
closed in May 2017, FSCS closed in October 2018, CGS closed in November 2012, and SLS closed in April 2012.
£ billion
Economic and fiscal outlook 138

Fiscal outlook
Table 4.37: Fiscal aggregates
Outturn
2017-18 2018-19 2019-20 2020-21 2021-22 2022-23 2023-24
Receipts and expenditure
Public sector current receipts (a) 36.4 37.0 36.9 37.1 37.1 37.2 37.2
Total managed expenditure (b) 38.5 38.1 38.2 38.0 37.9 37.7 37.8
of which:
Public sector current expenditure (c) 34.4 34.2 34.2 33.9 33.8 33.8 33.8
Public sector net investment (d) 2.1 2.0 2.1 2.2 2.1 2.1 2.1
Depreciation (e) 2.0 1.9 1.9 1.9 1.9 1.9 1.9
Fiscal mandate and supplementary target
Cyclically adjusted net borrowing 2.0 1.2 1.3 0.8 0.7 0.6 0.5
Public sector net debt1 84.7 83.3 82.2 79.0 74.9 74.0 73.0
Deficit
Public sector net borrowing (b-a) 2.0 1.1 1.3 0.9 0.7 0.6 0.5
Current budget deficit (c+e-a) 0.0 -1.0 -0.8 -1.3 -1.4 -1.5 -1.6
Cyclically adjusted current budget deficit -0.1 -0.9 -0.8 -1.4 -1.5 -1.5 -1.6
Primary deficit 0.2 -0.3 -0.1 -0.4 -0.5 -0.6 -0.6
Cyclically adjusted primary deficit 0.2 -0.2 -0.1 -0.5 -0.6 -0.6 -0.6
Financing
Central government net cash requirement 1.9 1.6 1.1 2.1 1.8 1.7 1.4
Public sector net cash requirement 3.9 1.3 1.3 -0.2 -1.4 1.7 1.4
Alternative balance sheet metrics
Public sector net debt ex. Bank of England 75.7 74.8 73.9 73.2 72.4 71.6 70.7
Public sector net financial liabilities 68.4 66.8 65.9 64.3 62.5 60.8 59.0
Stability and Growth Pact
Treaty deficit2 2.1 1.2 1.4 1.1 1.1 0.7 0.6
Cyclically adjusted Treaty deficit 2.1 1.3 1.4 1.0 1.0 0.7 0.6
Treaty debt ratio3 85.3 85.5 83.8 82.9 82.2 81.1 80.0
Public sector net borrowing 41.9 22.8 29.3 21.2 17.6 14.4 13.5
Current budget deficit -0.9 -20.4 -17.7 -29.3 -32.7 -36.8 -40.3
Cyclically adjusted net borrowing 41.5 24.9 28.7 18.9 15.9 13.9 13.4
Cyclically adjusted current budget deficit -1.3 -18.3 -18.3 -31.6 -34.5 -37.3 -40.4
Public sector net debt 1779 1803 1838 1828 1796 1838 1878Memo: Output gap (per cent of GDP) 0.1 0.2 -0.1 -0.2 -0.1 0.0 0.01 Debt at end March; GDP centred on end March.2 General government net borrowing.3 General government gross debt. Uses financial year GDP.
Per cent of GDP
Forecast
£ billion
Risks, uncertainties and contingent liabilities
Risks and uncertainties
4.179 As always, we emphasise the uncertainties that lie around our central fiscal forecast. The
uncertainties around the UK’s departure from the EU remain elevated in this forecast. In
particular, as we finalised this report the risk of a ‘no deal’ exit continued to represent a
major source of uncertainty to our forecast. We consider the channels along which such a
139 Economic and fiscal outlook
Fiscal outlook
scenario might affect the public finances in Chapter 5 and provided a broader discussion of
how Brexit-related risks might affect our forecast in a recent discussion paper.30
4.180 We expose our judgements to various sensitivities in Chapter 5. Several of the risks we
highlighted in our 2017 FRR remain key sources of uncertainty around our central forecast:
• Macroeconomic risks: such as risks to potential output growth from productivity and
migratory flows and the risks from shocks, such as the pound falling sharply given the
large current account deficit or as a result of a disorderly Brexit.
• Financial sector risks: the UK remains home to one of the world’s largest financial
sectors, both in absolute terms and relative to the size of the economy. The fiscal risks
that can be associated with this have been illustrated clearly over the past decade.
• Revenue-specific risks: our FRR highlighted potential pressures on the sustainability of
various tax bases. One issue we considered was the concentration of some receipts
streams on a small proportion of the tax base. Part of the reason for revising up
income tax and NICs receipts in this forecast relates to earnings growth among the
small number of taxpayers at the very top of the earnings distribution. This relative
strength could be reversed or repeated at some point in the future.
• Primary spending risks (i.e. spending on everything other than debt interest): in the
FRR, we noted how pressures can build and the risk of higher borrowing if they are
accommodated. The Government addressed some of these pressures via a multi-
billion pound settlement for the NHS in October, but has already chosen to top that up
in light of higher inflation. The risk of further such policy changes remains.
• Balance sheet risks: these can relate to real-world events or statistical changes. The
ONS review of the recording of public sector pension funds remains a potential source
of risk to the measured balance sheet aggregates in this forecast.
• Debt interest risks: in the FRR we flagged how greater index-linked gilts issuance had
increased the sensitivity of debt interest spending to inflation shocks. The Government’s initial financing plans for 2019-20 further reduce the share of borrowing financed via
index-linked gilts to 18 per cent (down from 26 per cent in 2017-18).
• Policy delays and reversals: in recent years, several tax rises and welfare spending cuts
have subsequently been reversed or delayed. In Annex A, we summarise those that
have affected this forecast.
4.181 Two legal processes initiated by the European Commission represent sources of risk to our
fiscal forecast. The first relates to the Commission’s contention that it has lost around €2 billion of customs revenue, after deducting notional collection costs (but before adding on
any potential late payment interest costs), as a result of the UK failing to enforce checks
30 OBR, Discussion paper No. 3: Brexit and the OBR's forecasts, October 2018.
Economic and fiscal outlook 140
Fiscal outlook
against customs fraud. If the Commission is not satisfied with the UK’s response it may seek
court proceedings against the UK. The second regards the UK’s application of a zero rate of VAT to certain derivative transactions. On this issue, the Commission has now referred the
UK to the European Court of Justice.
Contingent liabilities
Regular update
4.182 We have as usual asked the Treasury to identify any changes to future contingent liabilities
since our October forecast. Its dedicated reporting system noted 11 were entered into over
that period or soon to be entered into, with a total maximum exposure of £5.5 billion for
those that can be quantified. We have reviewed these and do not consider any to represent
a material increase in the fiscal risk to which the public sector is exposed.
4.183 The Treasury’s 2017-18 departmental accounts disclose an unquantifiable remote
contingent liability in respect of the UK’s decision to leave the European Union and the
Article 50 process. The Treasury has informed us that this has not changed.
4.184 On 20 December 2018, the Court of Appeal ruled that the Government’s transitional
pension arrangements offered to some judges and firefighters amounted to unlawful
discrimination. The Chief Secretary to the Treasury announced this could cost around £4
billion a year if extended to all applicable public service pension schemes.31 The
Government has challenged the Court of Appeal’s decision. We asked the Treasury whether this was being treated as a contingent liability. It explained that schemes have made
provisions of £29.5 billion in respect of a potential increase in liabilities. If the Government
were to lose its appeal, the Treasury would not expect that to affect scheme contribution
rates until beyond the period to 2023 for which they are currently in the process of being
set. As such, this case represents a longer-term fiscal risk rather than one that would be
likely to affect the public finances within our current forecast horizon.
Assurances provided to Nissan in 2016 and recently reversed
4.185 Ahead of our November 2016 EFO, we asked the Treasury “What if any new contingent
liabilities have been created in respect of Government assurances provided to Nissan? If new
contingent liabilities have been created, which department’s accounts do you expect them to be reported in and how?”. The Treasury declined to address the substance of our question
and told us “There is a standard process for departments to report to Parliament as and
when they incur contingent liabilities. Any commitments incurring costs will be managed
within existing overall DEL totals.”
4.186 On 4 February 2019, the Secretary of State for Business, Energy and Industrial Strategy
(BEIS) published a letter addressed to Nissan and dated 21 October 2016.32 It referenced a
package of support of up to £80 million that was described as being subject to business
31 Chief Secretary to the Treasury, Pensions: Written statement - HCWS1286, January 2019. 32 Department for Business, Energy & Industrial Strategy, Nissan’s investment in the UK, February 2019.
141 Economic and fiscal outlook
Fiscal outlook
cases being developed and also “contingent… on a positive decision by the Nissan Board” to allocate the production of two of Nissan’s vehicle types at its Sunderland plant. We have
since asked the Treasury how its response to us in November 2016 was consistent with the
Secretary of State’s letter to Nissan and the OBR’s right of access to information under the Budget Responsibility and National Audit Act 2011.
4.187 The Treasury told us that “The decision as to whether government assurances regarding
Nissan are classified as a contingent liability is the responsibility of the BEIS accounting
officer.”
4.188 We followed this up with BEIS, who told us that “The BEIS accounting officer is responsible
for assessing whether contingent liabilities are created by the department. This assessment is
done with reference to standards in ‘Managing Public Money’ and International Accounting
Standard 37 (Provisions, Contingent Liabilities and Contingent Assets). Observing these
standards, the accounting officer judged that the department’s letter to Nissan dated 21
October 2016 did not create a contingent liability because no present obligation was
created by the letter. The accounting officer’s judgement on this matter was reviewed and
endorsed by the National Audit Office in December 2016, and subsequently in its external
audit of the BEIS Annual Report and Accounts 2016-17.”
4.189 This appears consistent with the view stated by the Comptroller and Auditor General in
2016 when he was asked by the Treasury Select Committee to review these assurances,
which at the time were not in the public domain. This seems to be an artefact of the
Treasury’s Managing Public Money guidance to which BEIS refer, since an offer to make a
payment that is contingent on a specific decision might reasonably be considered a
‘contingent liability’ in a broader sense.
International comparisons
4.190 International organisations, such as the European Commission and the International
Monetary Fund (IMF), produce forecasts of deficit and debt levels of different countries on a
comparable basis. These are based on the narrower general government definitions of debt
and borrowing than the public sector definition that we focus on. They are also presented
on a calendar year basis. To facilitate comparisons, Tables 4.38 and 4.39 convert our UK
forecasts to a basis that is comparable with that used by these international organisations.
With both modelling and reporting of much tax and expenditure in the UK carried out
primarily on a fiscal year basis, the calendar year forecasts are illustrative and have been
derived by simply weighting our fiscal year forecasts.
Economic and fiscal outlook 142

Fiscal outlook
Table 4.38: Comparison with European Commission forecasts
2018 2019 2020 2018 2019 2020
UK (March EFO ) 1.5 1.4 1.2 86.8 84.2 83.1
UK (EC) 1.3 1.0 1.0 86.0 84.5 82.6
Germany -1.6 -1.2 -1.1 60.1 56.7 53.7
France 2.6 2.8 1.7 98.7 98.5 97.2
Italy 1.9 2.9 3.1 131.1 131.0 131.1
Spain 2.7 2.1 1.9 96.9 96.2 95.4
Euro area 0.6 0.8 0.7 86.9 84.9 82.81 General government net borrowing.2 General government gross debt.
Source: European Commission, European Economic Forecast Autumn 2018, OBR
Per cent of GDP
Treaty deficit1 Treaty debt2
Table 4.39: Comparison with IMF forecast 6
2018 2019 2023 2018 2019 2023
UK (March EFO ) 1.5 1.4 0.6 86.8 84.2 80.3
UK (IMF) 2.0 1.7 0.8 87.4 87.2 84.0
Germany -1.5 -1.5 -0.8 59.8 56.0 44.6
France 2.6 2.8 2.8 96.7 96.5 93.9
Italy 1.7 1.7 2.2 130.3 128.7 125.1
Japan 3.7 2.8 2.0 238.2 236.6 235.4
US 4.7 5.0 4.5 106.1 107.8 117.0
Per cent of GDP
General government net borrowing General government gross debt
Source: IMF, World Economic Outlook, October 2018, OBR
143 Economic and fiscal outlook

Economic and fiscal outlook 144
5 Performance against the Government’s fiscal targets
Introduction
5.1 This chapter:
• sets out the Government’s medium-term fiscal targets (from paragraph 5.2);
• examines whether the Government has a better than 50 per cent chance of meeting
them on current policy, given our central forecast (from paragraph 5.6); and
• assesses how robust these judgements are to the uncertainties inherent in any fiscal
forecast, by looking at past differences between forecast and outturn, sensitivity to key
parameters of the forecast and alternative economic scenarios (from paragraph 5.27).
The Government’s fiscal targets
5.2 The Charter for Budget Responsibility requires the OBR to judge whether the Government
has a greater than 50 per cent chance of meeting its fiscal targets under current policy. The
Charter has been updated several times in recent years as governments have revised their
fiscal targets. The latest version was approved by Parliament in January 2017.1
5.3 The Charter states that the Government’s objective for fiscal policy is to “return the public
finances to balance at the earliest possible date in the next Parliament”. At the time that it
was drawn up, ‘the next Parliament’ was expected to run from 2020 to 2025.
5.4 The Charter also sets out targets for borrowing, debt and welfare spending that require:
• The structural deficit (cyclically adjusted public sector net borrowing) to lie below 2 per
cent of GDP by 2020-21 (the ‘fiscal mandate’).
• Public sector net debt to fall relative to GDP in 2020-21 (the ‘supplementary target’).
• Welfare spending (excluding the state pension and payments closely linked to the
economic cycle) to lie below a ‘welfare cap’. The latest version of the cap was initially set in November 2017, to apply in 2022-23. A non-binding pathway was also
specified for the years leading up to the cap year. The Government set the effective
cap 3 per cent above our November 2017 forecast for 2022-23 at £135 billion, with
1 The latest and previous versions are available on the ‘Legislation and related material’ page of our website.
145 Economic and fiscal outlook
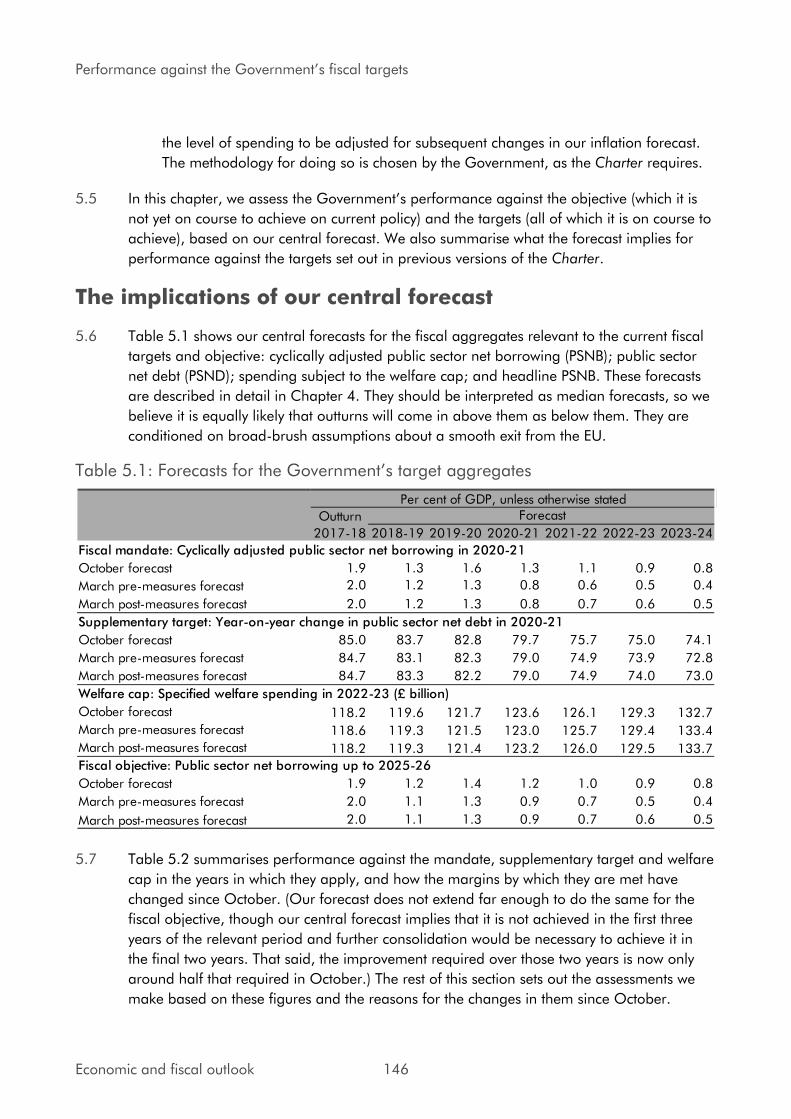
Performance against the Government’s fiscal targets
the level of spending to be adjusted for subsequent changes in our inflation forecast.
The methodology for doing so is chosen by the Government, as the Charter requires.
5.5 In this chapter, we assess the Government’s performance against the objective (which it is
not yet on course to achieve on current policy) and the targets (all of which it is on course to
achieve), based on our central forecast. We also summarise what the forecast implies for
performance against the targets set out in previous versions of the Charter.
The implications of our central forecast
5.6 Table 5.1 shows our central forecasts for the fiscal aggregates relevant to the current fiscal
targets and objective: cyclically adjusted public sector net borrowing (PSNB); public sector
net debt (PSND); spending subject to the welfare cap; and headline PSNB. These forecasts
are described in detail in Chapter 4. They should be interpreted as median forecasts, so we
believe it is equally likely that outturns will come in above them as below them. They are
conditioned on broad-brush assumptions about a smooth exit from the EU.
Table 5.1: Forecasts for the Government’s target aggregates
Outturn
2017-18 2018-19 2019-20 2020-21 2021-22 2022-23 2023-24
Fiscal mandate: Cyclically adjusted public sector net borrowing in 2020-21
October forecast 1.9 1.3 1.6 1.3 1.1 0.9 0.8
March pre-measures forecast 2.0 1.2 1.3 0.8 0.6 0.5 0.4
March post-measures forecast 2.0 1.2 1.3 0.8 0.7 0.6 0.5
Supplementary target: Year-on-year change in public sector net debt in 2020-21
October forecast 85.0 83.7 82.8 79.7 75.7 75.0 74.1
March pre-measures forecast 84.7 83.1 82.3 79.0 74.9 73.9 72.8
March post-measures forecast 84.7 83.3 82.2 79.0 74.9 74.0 73.0
Welfare cap: Specified welfare spending in 2022-23 (£ billion)
October forecast 118.2 119.6 121.7 123.6 126.1 129.3 132.7
March pre-measures forecast 118.6 119.3 121.5 123.0 125.7 129.4 133.4
March post-measures forecast 118.2 119.3 121.4 123.2 126.0 129.5 133.7
Fiscal objective: Public sector net borrowing up to 2025-26
October forecast 1.9 1.2 1.4 1.2 1.0 0.9 0.8
March pre-measures forecast 2.0 1.1 1.3 0.9 0.7 0.5 0.4
March post-measures forecast 2.0 1.1 1.3 0.9 0.7 0.6 0.5
Per cent of GDP, unless otherwise statedForecast
5.7 Table 5.2 summarises performance against the mandate, supplementary target and welfare
cap in the years in which they apply, and how the margins by which they are met have
changed since October. (Our forecast does not extend far enough to do the same for the
fiscal objective, though our central forecast implies that it is not achieved in the first three
years of the relevant period and further consolidation would be necessary to achieve it in
the final two years. That said, the improvement required over those two years is now only
around half that required in October.) The rest of this section sets out the assessments we
make based on these figures and the reasons for the changes in them since October.
Economic and fiscal outlook 146
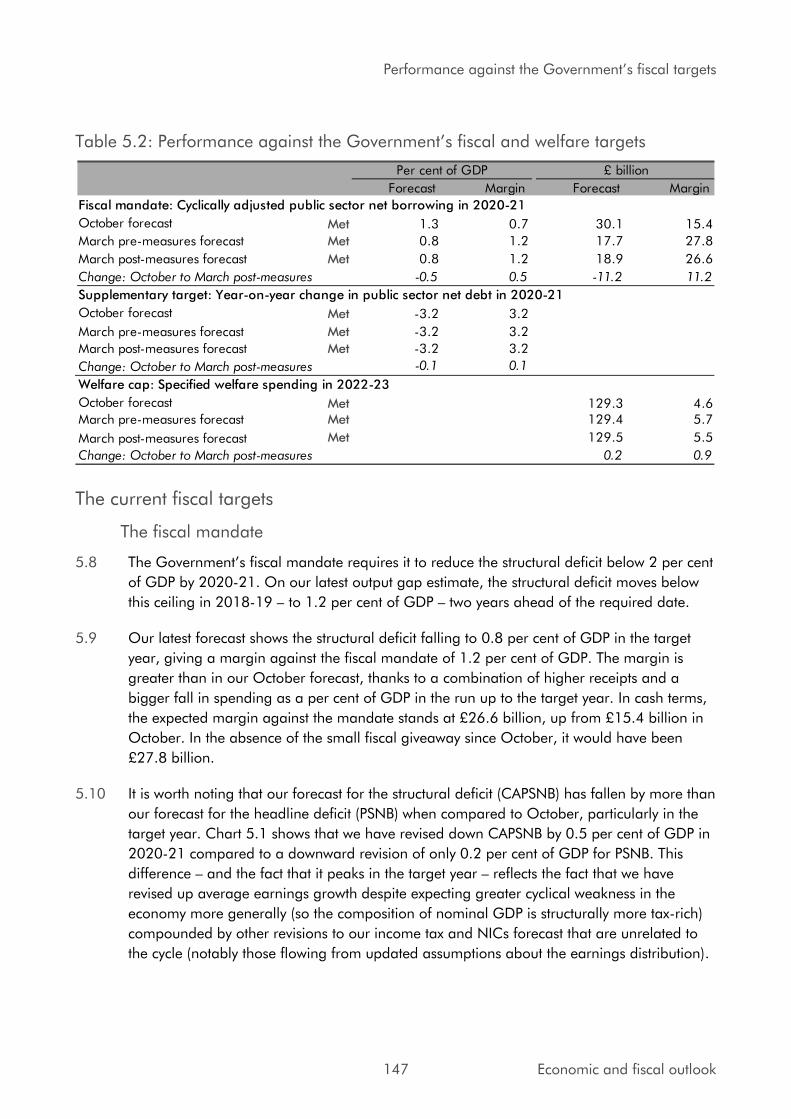
Performance against the Government’s fiscal targets
Table 5.2: Performance against the Government’s fiscal and welfare targets
Forecast Margin Forecast Margin
Fiscal mandate: Cyclically adjusted public sector net borrowing in 2020-21
October forecast Met 1.3 0.7 30.1 15.4
March pre-measures forecast Met 0.8 1.2 17.7 27.8
March post-measures forecast Met 0.8 1.2 18.9 26.6
Change: October to March post-measures -0.5 0.5 -11.2 11.2
Supplementary target: Year-on-year change in public sector net debt in 2020-21
October forecast Met -3.2 3.2
March pre-measures forecast Met -3.2 3.2
March post-measures forecast Met -3.2 3.2
Change: October to March post-measures -0.1 0.1
Welfare cap: Specified welfare spending in 2022-23
October forecast Met 129.3 4.6March pre-measures forecast Met 129.4 5.7
March post-measures forecast Met 129.5 5.5
Change: October to March post-measures 0.2 0.9
Per cent of GDP £ billion
The current fiscal targets
The fiscal mandate
5.8 The Government’s fiscal mandate requires it to reduce the structural deficit below 2 per cent
of GDP by 2020-21. On our latest output gap estimate, the structural deficit moves below
this ceiling in 2018-19 – to 1.2 per cent of GDP – two years ahead of the required date.
5.9 Our latest forecast shows the structural deficit falling to 0.8 per cent of GDP in the target
year, giving a margin against the fiscal mandate of 1.2 per cent of GDP. The margin is
greater than in our October forecast, thanks to a combination of higher receipts and a
bigger fall in spending as a per cent of GDP in the run up to the target year. In cash terms,
the expected margin against the mandate stands at £26.6 billion, up from £15.4 billion in
October. In the absence of the small fiscal giveaway since October, it would have been
£27.8 billion.
5.10 It is worth noting that our forecast for the structural deficit (CAPSNB) has fallen by more than
our forecast for the headline deficit (PSNB) when compared to October, particularly in the
target year. Chart 5.1 shows that we have revised down CAPSNB by 0.5 per cent of GDP in
2020-21 compared to a downward revision of only 0.2 per cent of GDP for PSNB. This
difference – and the fact that it peaks in the target year – reflects the fact that we have
revised up average earnings growth despite expecting greater cyclical weakness in the
economy more generally (so the composition of nominal GDP is structurally more tax-rich)
compounded by other revisions to our income tax and NICs forecast that are unrelated to
the cycle (notably those flowing from updated assumptions about the earnings distribution).
147 Economic and fiscal outlook

Performance against the Government’s fiscal targets
Chart 5.1: Change in CAPSNB and PSNB relative to our October forecast
-0.6
-0.5
-0.4
-0.3
-0.2
-0.1
0.0
2018-19 2019-20 2020-21 2021-22 2022-23 2023-24
Per ce
nt o
f G
DP
CAPSNB
PSNB
Source: OBR
5.11 A little over half of the fall in structural borrowing as a share of GDP between 2017-18 and
2020-21 now results from higher receipts and just under half from lower spending. Chart
5.2 shows how this differs from October, estimated using cyclical-adjustment coefficients:2
• Structural receipts are expected to rise as a per cent of GDP relative to 2017-18, and
by slightly more than in October. As in October, rises in income tax, NICs, VAT and
other taxes (e.g. the introduction of the apprenticeship levy and higher environmental
levies) are only partly offset by falls in corporation tax and fuel and excise duties.
Receipts in the target year are boosted by a one-off effect of changing the timing of
capital gains tax payments, which brings forward some payments into that year.
• Structural spending is expected to fall as a per cent of GDP between 2017-18 and
2020-21. This reflects falls in welfare, debt interest and other spending. This is only
partly offset by higher departmental spending, including capital expenditure (CDEL),
which increases in the run up to the target year. The fall is larger than the one we
expected in October, largely due to a greater fall in debt interest payments as a share
of GDP than previously forecast thanks to lower RPI inflation and interest rates.
• Structural borrowing declines as a per cent of GDP between 2017-18 and 2020-21 by
a larger amount than in our October forecast. This reflects the higher receipts and
greater fall in spending.
5.12 Following the ONS’s announcement that it is reviewing the accounting treatment of student
loans, we explore the potential impact of its proposed ‘partitioned loan transfer approach’ in detail in Annex B. Should this approach be adopted, we expect it would increase CAPSNB
2 Further details can be found in Helgadottir, T., et al., OBR Working Paper No.4: Cyclically adjusting the public finances, 2012.
Economic and fiscal outlook 148

Performance against the Government’s fiscal targets
by around £12 billion or 0.5 per cent of GDP in 2020-21, absorbing almost half the
Government’s current headroom relative to its fiscal mandate.
Chart 5.2: Cumulative changes in the structural deficit from 2017-18 to 2020-21
-2.0
-1.5
-1.0
-0.5
0.0
0.5
1.0
Per ce
nt o
f G
DP
RDEL
Welfare
Debt interest
CDEL
Other
Total spending
-2.0
-1.5
-1.0
-0.5
0.0
0.5
1.0
October forecast March forecast
Per ce
nt o
f G
DP
Total receipts
Total spending
PSNB
-2.0
-1.5
-1.0
-0.5
0.0
0.5
1.0
Per ce
nt o
f G
DP
Income tax & NICs
Onshore CT
VAT
Fuel & excise duties
Capital taxes
Other
Total receipts
Source: OBR
Cyclically adjusted spending
Cyclically adjusted receipts
Cyclically adjusted public sector borrowing
The supplementary debt target
5.13 The supplementary debt target requires PSND to fall as a percentage of GDP in 2020-21.
PSND was broadly stable on this basis between 2016-17 and 2017-18. We now expect it to
fall in each year of the forecast, with a large drop of 3.2 per cent of GDP in the target year
(unchanged from October). The Government is therefore comfortably on course to meet this
target.
149 Economic and fiscal outlook
Performance against the Government’s fiscal targets
5.14 Chart 5.3 decomposes year-on-year changes in the PSND-to-GDP ratio over the forecast
period, to show the different drivers of the decline we expect. It shows that:
• The Bank of England’s August 2016 monetary policy package continues to have a
material effect on the path of net debt. This reflects lending to commercial banks
under the Term Funding Scheme (TFS). (Lending through the TFS is treated as the
acquisition of an illiquid asset, which is therefore not netted off PSND. But it is secured
against high-quality collateral and thus most unlikely to generate losses for the public
sector.) The repayment of TFS loans after four years reduces the debt ratio significantly
in the target year of 2020-21 (accounting for the majority of the decline as a per cent
of GDP in that year) as well as an even larger impact in 2021-22. Excluding the TFS
effect, the path of changes in the PSND as a share of GDP would be smoother.
• The primary balance – net borrowing excluding net debt interest spending – is in
surplus every year of the forecast, lowering debt in 2020-21.
• Nominal GDP growth is expected to exceed nominal gilt rates throughout the forecast,
reducing debt as a share of GDP by relatively large amounts each year. This
‘growth-corrected interest rate’ is a key driver of public sector debt dynamics,
especially over longer timeframes. We explored this in our 2017 Fiscal risks report.
• Net lending to the non-bank private sector – mainly through student loans, plus other
lending schemes such as Help to Buy – increases debt as a share of GDP in every year
including the target year 2020-21. As a financial transaction, this lending only affects
the deficit indirectly, via interest income, write-off expenses and debt interest costs. We
discuss future changes to the accounting treatment of student loans in Annex B. 3
• Financial asset sales – including the active sale and rundown of UK Asset Resolution
(UKAR) assets and the sale of student loans and RBS shares – reduce debt by large
amounts in 2018-19 and 2019-20 before smaller amounts in subsequent years.
Financial asset sales usually leave the underlying fiscal position largely unaffected, as
they typically bring forward cash that would otherwise have been received in later
years as revenue, in the shape of mortgage repayments or dividends. So they only
reduce debt temporarily.
• Valuation changes – largely relating to auction premia from Government sales of gilts
and from changes to gilt holdings in the APF – reduce debt as a share of GDP in every
year of the forecast, including the target year 2020-21.
• The reclassification of Scottish and Welsh housing associations from the public to the
private sector reduces measured debt in 2018-19.
• Other factors increase net debt in every year of the forecast, including the target year
2020-21, chiefly because accrued receipts exceed cash receipts over the medium term.
Some receipts, including interest on student loans, are collected with a long lag.
3 We explored this issue in more detail in Ebdon, J. and Waite, R., OBR Working Paper No.12: Student loans and fiscal illusions, 2018.
Economic and fiscal outlook 150

Performance against the Government’s fiscal targets
5.15 Abstracting from the effect of Bank of England schemes (largely the TFS), net debt is on a
steady downward trajectory over the whole forecast period, falling by an average of 1.1 per
cent of GDP a year. The target is met by a margin of 3.2 percentage points, and would still
be met with a 1.0 per cent of GDP margin without the TFS repayments.
Chart 5.3: Year-on-year changes to the debt-to-GDP ratio
-6
-4
-2
0
2
4
2018-19 2019-20 2020-21 2021-22 2022-23 2023-24
Per ce
nt o
f G
DP
Bank of England
Other factors
Growth-correctedinterest rate
Reclassifications
Asset sales
Valuation changes
Net lending
Primary balance
Total change
Total change excludingBank of England
Source: OBR
Debttargetyear
5.16 Table 5.3 shows how and why the year-on-year changes in net debt shown in Chart 5.3
have changed since our October forecast. The revision to the change in the target year is
small because, even though net debt as a per cent of GDP is lower in 2020-21 than it was
in our October forecast, it is also lower in 2019-20 by a similar amount.
5.17 The new treatment of student loans does not affect PSND – a cash-based measure of the
balance sheet – and will not therefore affect performance against the supplementary target.
Table 5.3: Changes in the profile of net debt since October
2018-19 2019-20 2020-21 2021-22 2022-23 2023-24
October forecast -1.4 -0.8 -3.2 -4.0 -0.6 -1.0
March forecast -1.4 -1.1 -3.2 -4.1 -0.9 -1.0
Change 0.0 -0.3 -0.1 -0.1 -0.3 -0.1
of which:
Nominal GDP1 0.3 0.0 -0.1 -0.1 -0.1 -0.1
Pre-measures net borrowing -0.1 -0.1 -0.3 -0.3 -0.3 -0.3
Other pre-measures forecast changes -0.4 0.1 0.3 0.3 0.1 0.2
Government decisions 0.2 -0.2 0.0 0.1 0.1 0.11 GDP is centred end-March.
Change in net debt as per cent of GDP on previous year
Forecast
151 Economic and fiscal outlook
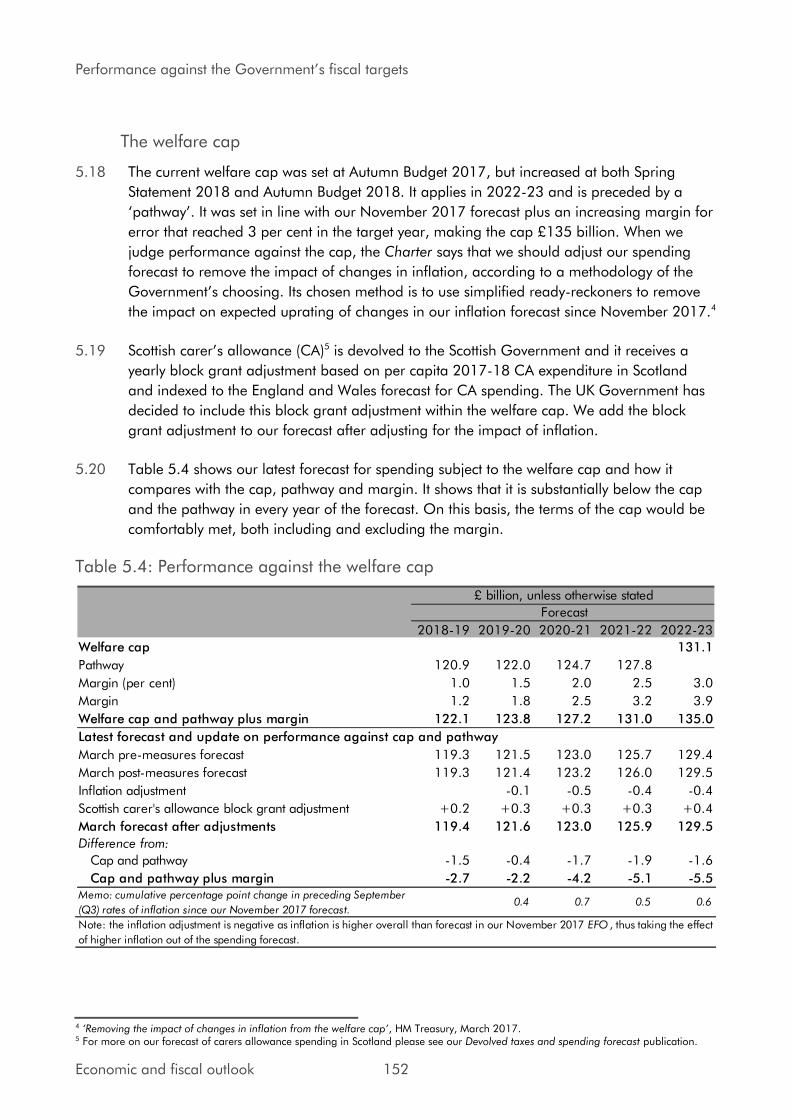
Performance against the Government’s fiscal targets
The welfare cap
5.18 The current welfare cap was set at Autumn Budget 2017, but increased at both Spring
Statement 2018 and Autumn Budget 2018. It applies in 2022-23 and is preceded by a
‘pathway’. It was set in line with our November 2017 forecast plus an increasing margin for error that reached 3 per cent in the target year, making the cap £135 billion. When we
judge performance against the cap, the Charter says that we should adjust our spending
forecast to remove the impact of changes in inflation, according to a methodology of the
Government’s choosing. Its chosen method is to use simplified ready-reckoners to remove
the impact on expected uprating of changes in our inflation forecast since November 2017.4
5.19 Scottish carer’s allowance (CA)5 is devolved to the Scottish Government and it receives a
yearly block grant adjustment based on per capita 2017-18 CA expenditure in Scotland
and indexed to the England and Wales forecast for CA spending. The UK Government has
decided to include this block grant adjustment within the welfare cap. We add the block
grant adjustment to our forecast after adjusting for the impact of inflation.
5.20 Table 5.4 shows our latest forecast for spending subject to the welfare cap and how it
compares with the cap, pathway and margin. It shows that it is substantially below the cap
and the pathway in every year of the forecast. On this basis, the terms of the cap would be
comfortably met, both including and excluding the margin.
Table 5.4: Performance against the welfare cap
2018-19 2019-20 2020-21 2021-22 2022-23
Welfare cap 131.1
Pathway 120.9 122.0 124.7 127.8
Margin (per cent) 1.0 1.5 2.0 2.5 3.0
Margin 1.2 1.8 2.5 3.2 3.9
Welfare cap and pathway plus margin 122.1 123.8 127.2 131.0 135.0
Latest forecast and update on performance against cap and pathway
March pre-measures forecast 119.3 121.5 123.0 125.7 129.4
March post-measures forecast 119.3 121.4 123.2 126.0 129.5
Inflation adjustment -0.1 -0.5 -0.4 -0.4
Scottish carer's allowance block grant adjustment +0.2 +0.3 +0.3 +0.3 +0.4
March forecast after adjustments 119.4 121.6 123.0 125.9 129.5
Difference from:
Cap and pathway -1.5 -0.4 -1.7 -1.9 -1.6
Cap and pathway plus margin -2.7 -2.2 -4.2 -5.1 -5.5Memo: cumulative percentage point change in preceding September
(Q3) rates of inflation since our November 2017 forecast.0.4 0.7 0.5 0.6
Forecast
£ billion, unless otherwise stated
Note: the inflation adjustment is negative as inflation is higher overall than forecast in our November 2017 EFO , thus taking the effect
of higher inflation out of the spending forecast.
4 ‘Removing the impact of changes in inflation from the welfare cap’, HM Treasury, March 2017. 5 For more on our forecast of carers allowance spending in Scotland please see our Devolved taxes and spending forecast publication.
Economic and fiscal outlook 152
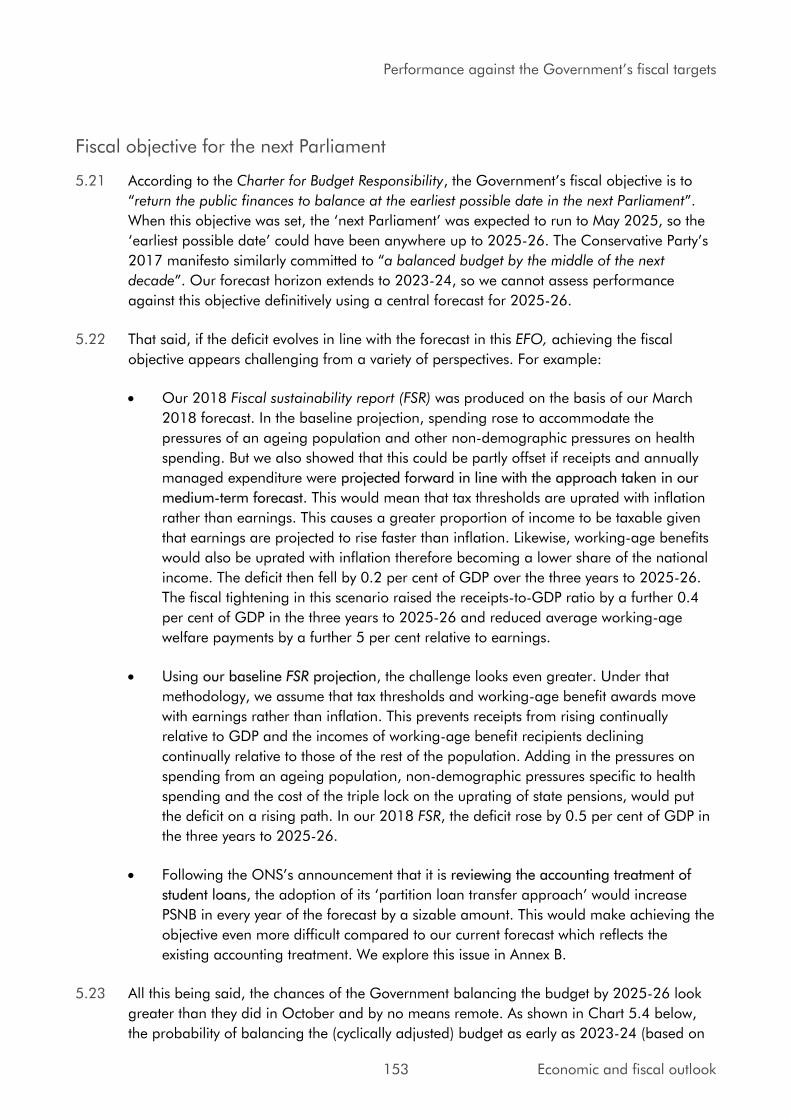
Performance against the Government’s fiscal targets
Fiscal objective for the next Parliament
5.21 According to the Charter for Budget Responsibility, the Government’s fiscal objective is to “return the public finances to balance at the earliest possible date in the next Parliament”.
When this objective was set, the ‘next Parliament’ was expected to run to May 2025, so the ‘earliest possible date’ could have been anywhere up to 2025-26. The Conservative Party’s 2017 manifesto similarly committed to “a balanced budget by the middle of the next
decade”. Our forecast horizon extends to 2023-24, so we cannot assess performance
against this objective definitively using a central forecast for 2025-26.
5.22 That said, if the deficit evolves in line with the forecast in this EFO, achieving the fiscal
objective appears challenging from a variety of perspectives. For example:
• Our 2018 Fiscal sustainability report (FSR) was produced on the basis of our March
2018 forecast. In the baseline projection, spending rose to accommodate the
pressures of an ageing population and other non-demographic pressures on health
spending. But we also showed that this could be partly offset if receipts and annually
managed expenditure were projected forward in line with the approach taken in our
medium-term forecast. This would mean that tax thresholds are uprated with inflation
rather than earnings. This causes a greater proportion of income to be taxable given
that earnings are projected to rise faster than inflation. Likewise, working-age benefits
would also be uprated with inflation therefore becoming a lower share of the national
income. The deficit then fell by 0.2 per cent of GDP over the three years to 2025-26.
The fiscal tightening in this scenario raised the receipts-to-GDP ratio by a further 0.4
per cent of GDP in the three years to 2025-26 and reduced average working-age
welfare payments by a further 5 per cent relative to earnings.
• Using our baseline FSR projection, the challenge looks even greater. Under that
methodology, we assume that tax thresholds and working-age benefit awards move
with earnings rather than inflation. This prevents receipts from rising continually
relative to GDP and the incomes of working-age benefit recipients declining
continually relative to those of the rest of the population. Adding in the pressures on
spending from an ageing population, non-demographic pressures specific to health
spending and the cost of the triple lock on the uprating of state pensions, would put
the deficit on a rising path. In our 2018 FSR, the deficit rose by 0.5 per cent of GDP in
the three years to 2025-26.
• Following the ONS’s announcement that it is reviewing the accounting treatment of
student loans, the adoption of its ‘partition loan transfer approach’ would increase PSNB in every year of the forecast by a sizable amount. This would make achieving the
objective even more difficult compared to our current forecast which reflects the
existing accounting treatment. We explore this issue in Annex B.
5.23 All this being said, the chances of the Government balancing the budget by 2025-26 look
greater than they did in October and by no means remote. As shown in Chart 5.4 below,
the probability of balancing the (cyclically adjusted) budget as early as 2023-24 (based on
153 Economic and fiscal outlook
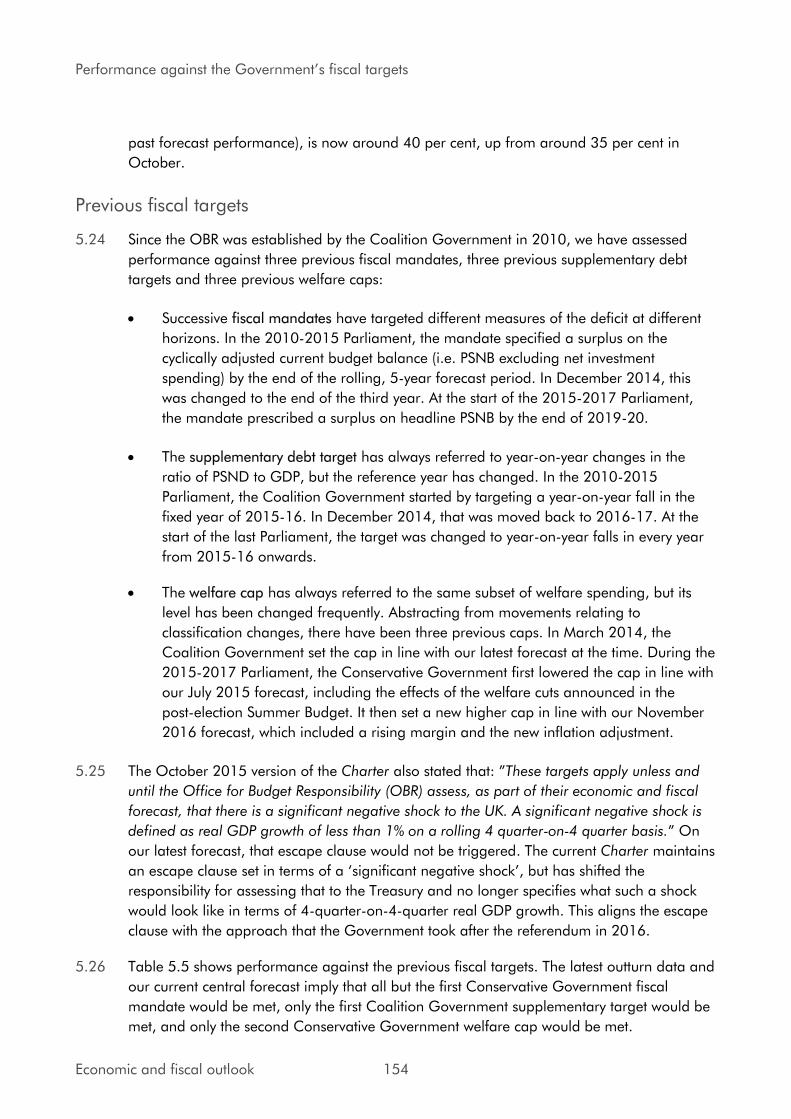
Performance against the Government’s fiscal targets
past forecast performance), is now around 40 per cent, up from around 35 per cent in
October.
Previous fiscal targets
5.24 Since the OBR was established by the Coalition Government in 2010, we have assessed
performance against three previous fiscal mandates, three previous supplementary debt
targets and three previous welfare caps:
• Successive fiscal mandates have targeted different measures of the deficit at different
horizons. In the 2010-2015 Parliament, the mandate specified a surplus on the
cyclically adjusted current budget balance (i.e. PSNB excluding net investment
spending) by the end of the rolling, 5-year forecast period. In December 2014, this
was changed to the end of the third year. At the start of the 2015-2017 Parliament,
the mandate prescribed a surplus on headline PSNB by the end of 2019-20.
• The supplementary debt target has always referred to year-on-year changes in the
ratio of PSND to GDP, but the reference year has changed. In the 2010-2015
Parliament, the Coalition Government started by targeting a year-on-year fall in the
fixed year of 2015-16. In December 2014, that was moved back to 2016-17. At the
start of the last Parliament, the target was changed to year-on-year falls in every year
from 2015-16 onwards.
• The welfare cap has always referred to the same subset of welfare spending, but its
level has been changed frequently. Abstracting from movements relating to
classification changes, there have been three previous caps. In March 2014, the
Coalition Government set the cap in line with our latest forecast at the time. During the
2015-2017 Parliament, the Conservative Government first lowered the cap in line with
our July 2015 forecast, including the effects of the welfare cuts announced in the
post-election Summer Budget. It then set a new higher cap in line with our November
2016 forecast, which included a rising margin and the new inflation adjustment.
5.25 The October 2015 version of the Charter also stated that: ”These targets apply unless and
until the Office for Budget Responsibility (OBR) assess, as part of their economic and fiscal
forecast, that there is a significant negative shock to the UK. A significant negative shock is
defined as real GDP growth of less than 1% on a rolling 4 quarter-on-4 quarter basis.” On
our latest forecast, that escape clause would not be triggered. The current Charter maintains
an escape clause set in terms of a ‘significant negative shock’, but has shifted the responsibility for assessing that to the Treasury and no longer specifies what such a shock
would look like in terms of 4-quarter-on-4-quarter real GDP growth. This aligns the escape
clause with the approach that the Government took after the referendum in 2016.
5.26 Table 5.5 shows performance against the previous fiscal targets. The latest outturn data and
our current central forecast imply that all but the first Conservative Government fiscal
mandate would be met, only the first Coalition Government supplementary target would be
met, and only the second Conservative Government welfare cap would be met.
Economic and fiscal outlook 154
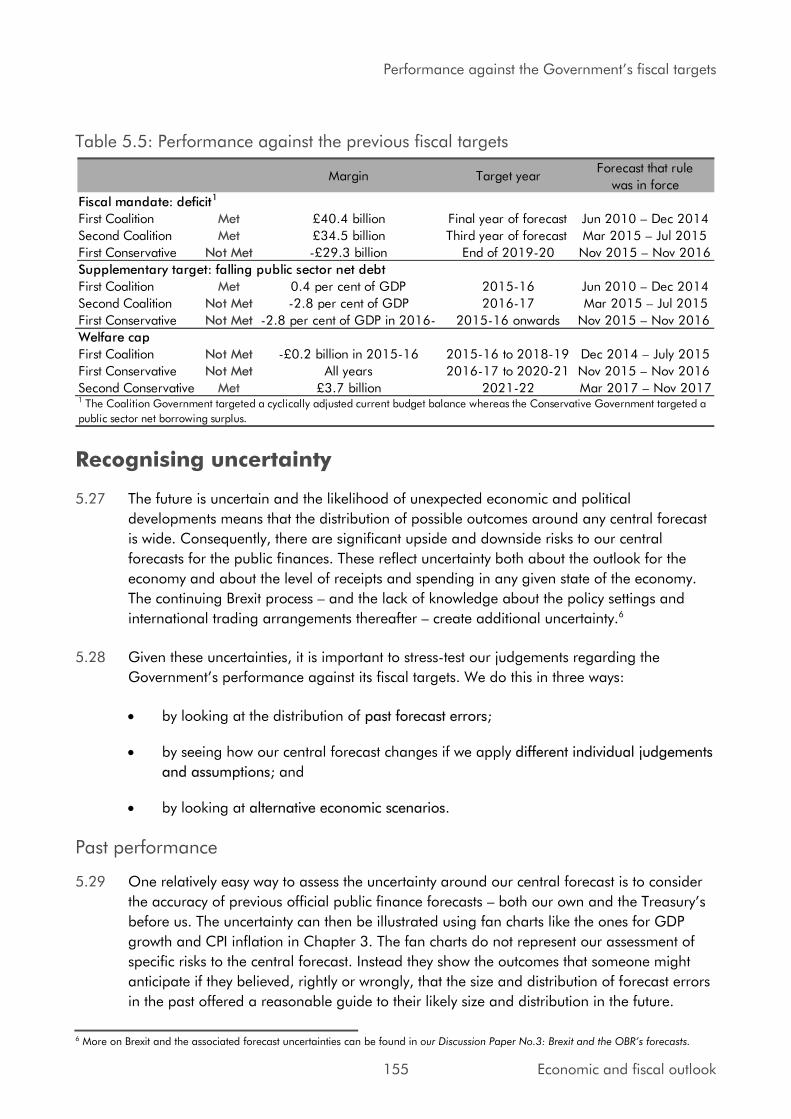
Performance against the Government’s fiscal targets
Table 5.5: Performance against the previous fiscal targets
Margin Target yearForecast that rule
was in force
Fiscal mandate: deficit1
First Coalition Met £40.4 billion Final year of forecast Jun 2010 – Dec 2014
Second Coalition Met £34.5 billion Third year of forecast Mar 2015 – Jul 2015
First Conservative Not Met -£29.3 billion End of 2019-20 Nov 2015 – Nov 2016
Supplementary target: falling public sector net debt
First Coalition Met 0.4 per cent of GDP 2015-16 Jun 2010 – Dec 2014
Second Coalition Not Met -2.8 per cent of GDP 2016-17 Mar 2015 – Jul 2015
First Conservative Not Met -2.8 per cent of GDP in 2016- 2015-16 onwards Nov 2015 – Nov 2016
Welfare cap
First Coalition Not Met -£0.2 billion in 2015-16 2015-16 to 2018-19 Dec 2014 – July 2015
First Conservative Not Met All years 2016-17 to 2020-21 Nov 2015 – Nov 2016
Second Conservative Met £3.7 billion 2021-22 Mar 2017 – Nov 20171 The Coalition Government targeted a cyclically adjusted current budget balance whereas the Conservative Government targeted a
public sector net borrowing surplus.
Recognising uncertainty
5.27 The future is uncertain and the likelihood of unexpected economic and political
developments means that the distribution of possible outcomes around any central forecast
is wide. Consequently, there are significant upside and downside risks to our central
forecasts for the public finances. These reflect uncertainty both about the outlook for the
economy and about the level of receipts and spending in any given state of the economy.
The continuing Brexit process – and the lack of knowledge about the policy settings and
international trading arrangements thereafter – create additional uncertainty.6
5.28 Given these uncertainties, it is important to stress-test our judgements regarding the
Government’s performance against its fiscal targets. We do this in three ways:
• by looking at the distribution of past forecast errors;
• by seeing how our central forecast changes if we apply different individual judgements
and assumptions; and
• by looking at alternative economic scenarios.
Past performance
5.29 One relatively easy way to assess the uncertainty around our central forecast is to consider
the accuracy of previous official public finance forecasts – both our own and the Treasury’s before us. The uncertainty can then be illustrated using fan charts like the ones for GDP
growth and CPI inflation in Chapter 3. The fan charts do not represent our assessment of
specific risks to the central forecast. Instead they show the outcomes that someone might
anticipate if they believed, rightly or wrongly, that the size and distribution of forecast errors
in the past offered a reasonable guide to their likely size and distribution in the future.
6 More on Brexit and the associated forecast uncertainties can be found in our Discussion Paper No.3: Brexit and the OBR’s forecasts.
155 Economic and fiscal outlook
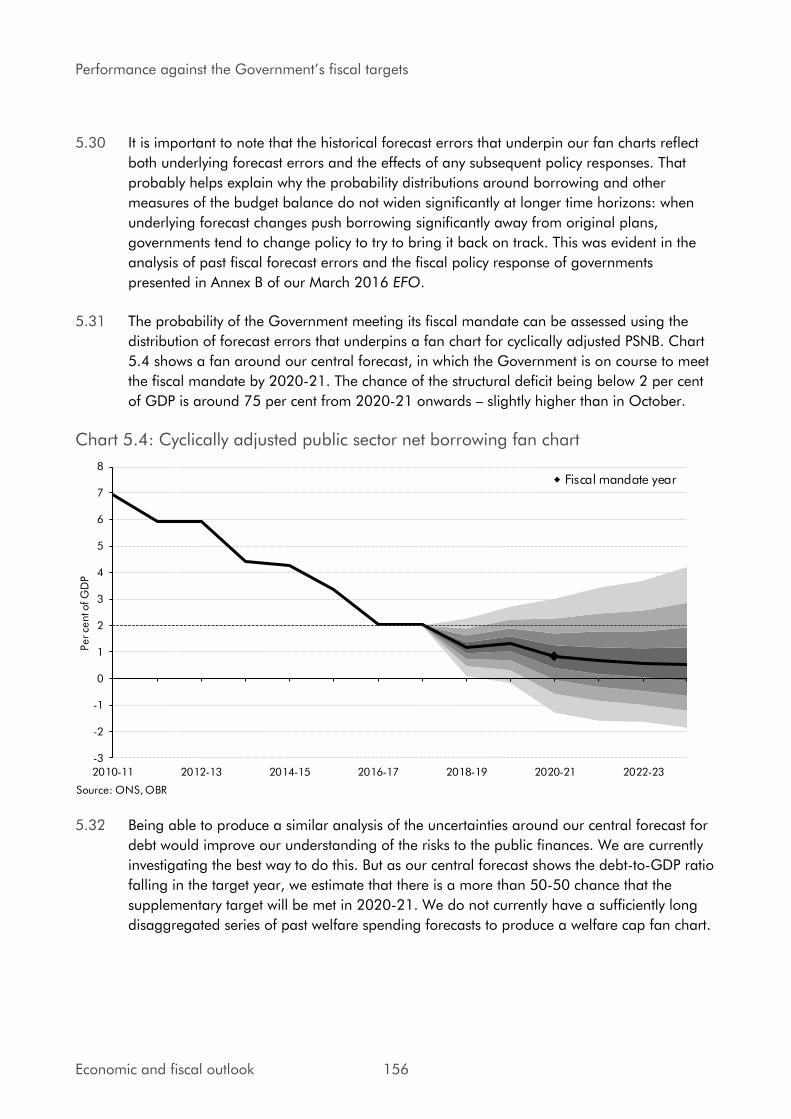
Performance against the Government’s fiscal targets
5.30 It is important to note that the historical forecast errors that underpin our fan charts reflect
both underlying forecast errors and the effects of any subsequent policy responses. That
probably helps explain why the probability distributions around borrowing and other
measures of the budget balance do not widen significantly at longer time horizons: when
underlying forecast changes push borrowing significantly away from original plans,
governments tend to change policy to try to bring it back on track. This was evident in the
analysis of past fiscal forecast errors and the fiscal policy response of governments
presented in Annex B of our March 2016 EFO.
5.31 The probability of the Government meeting its fiscal mandate can be assessed using the
distribution of forecast errors that underpins a fan chart for cyclically adjusted PSNB. Chart
5.4 shows a fan around our central forecast, in which the Government is on course to meet
the fiscal mandate by 2020-21. The chance of the structural deficit being below 2 per cent
of GDP is around 75 per cent from 2020-21 onwards – slightly higher than in October.
Chart 5.4: Cyclically adjusted public sector net borrowing fan chart
-3
-2
-1
0
1
2
3
4
5
6
7
8
2010-11 2012-13 2014-15 2016-17 2018-19 2020-21 2022-23
Per ce
nt o
f G
DP
Fiscal mandate year
Source: ONS, OBR
5.32 Being able to produce a similar analysis of the uncertainties around our central forecast for
debt would improve our understanding of the risks to the public finances. We are currently
investigating the best way to do this. But as our central forecast shows the debt-to-GDP ratio
falling in the target year, we estimate that there is a more than 50-50 chance that the
supplementary target will be met in 2020-21. We do not currently have a sufficiently long
disaggregated series of past welfare spending forecasts to produce a welfare cap fan chart.
Economic and fiscal outlook 156
Performance against the Government’s fiscal targets
Sensitivity analysis
5.33 It is next to impossible to produce a full unconditional probability distribution for the
Government’s target fiscal variables because they are affected by so many determinants – both economic and non-economic – many of which are also interrelated in complex ways.
But we can go further than using evidence from past forecast errors by illustrating how
sensitive the central forecast is to changes in individual parameters and judgements.
5.34 In thinking about the evolution of the public finances over the medium term, there are
several parameters that have an important bearing on the forecast. Here we focus on:
• the sensitivity of the fiscal mandate to changes to the level of potential GDP, inflation,
interest rates and the effective tax rate;
• the sensitivity of the supplementary debt target to differences in the level of debt or the
growth rate of the economy, which both affect how debt changes from year to year as
a percentage of GDP; and
• some of the circumstances in which the supplementary target could be missed while
still meeting the fiscal mandate.
The fiscal mandate
5.35 As Chart 5.4 illustrated, on the basis of past forecast errors, we estimate that there is a
roughly 25 per cent chance that the structural budget deficit will exceed 2 per cent of GDP
in 2020-21. There are many reasons why this might happen. For example, the evolution of
potential output could be less favourable than forecast or receipts or spending could turn
out differently for a given state of the economy. And while our forecasts are conditioned on
current Government policy, that is also likely to change, especially in respect of the policy
settings that will apply once the UK has left the EU.
5.36 On our website we publish ready-reckoners that show how elements of the public finances
could be affected by changes in some of the determinants of our fiscal forecast. It is
important to stress that these are stylised exercises that reflect the typical impact of changes
in variables on receipts and spending as embodied in our forecast models. The actual
impact in any given case is likely to depend on the state of the economy at the time and the
reaction of other policymakers, such as the MPC. The ready-reckoners are also subject to
significant uncertainty. But bearing those caveats in mind, we can use them to calibrate
several possible adverse surprises relative to our central forecast that would be sufficient to
push the structural deficit above 2 per cent of GDP in 2020-21.
5.37 This analysis shows that the 1.2 per cent of GDP margin relative to the 2 per cent target
could fall to zero if:
• Potential output were 2.4 per cent lower. This is small relative to the cumulative
downward revisions made since the financial crisis, but is quite large given the
relatively short period between now and the mandate year of 2020-21.
157 Economic and fiscal outlook
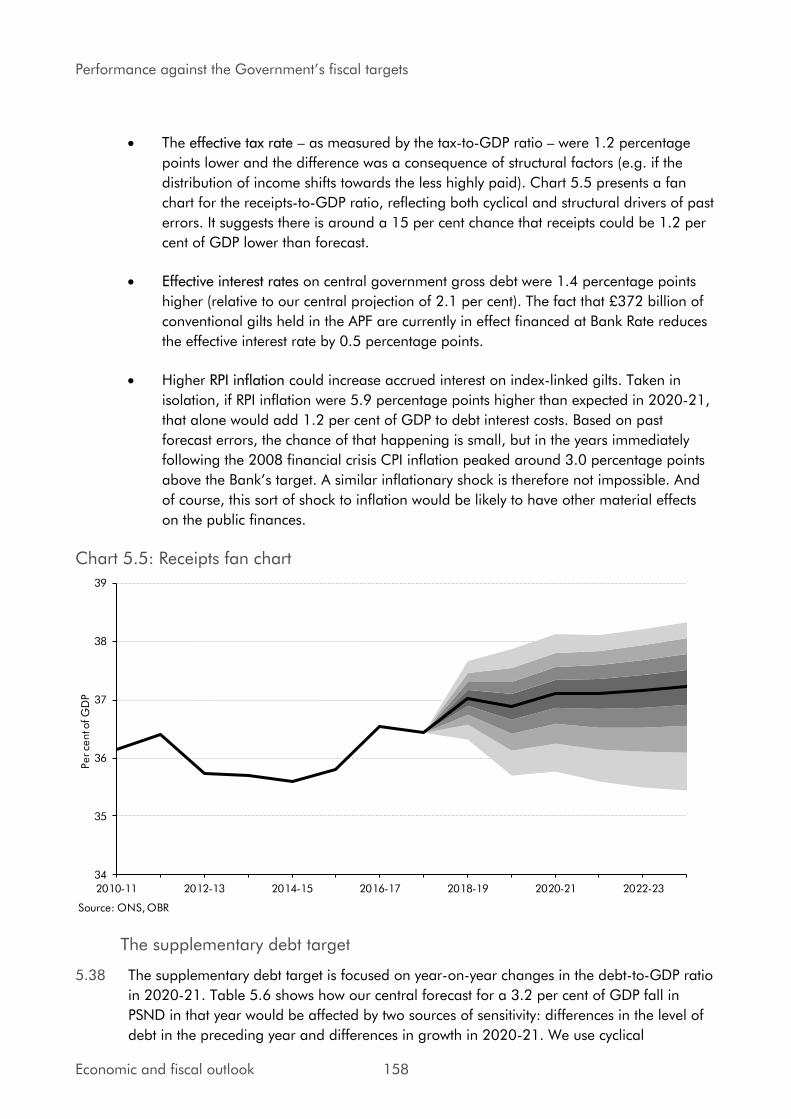
Performance against the Government’s fiscal targets
• The effective tax rate – as measured by the tax-to-GDP ratio – were 1.2 percentage
points lower and the difference was a consequence of structural factors (e.g. if the
distribution of income shifts towards the less highly paid). Chart 5.5 presents a fan
chart for the receipts-to-GDP ratio, reflecting both cyclical and structural drivers of past
errors. It suggests there is around a 15 per cent chance that receipts could be 1.2 per
cent of GDP lower than forecast.
• Effective interest rates on central government gross debt were 1.4 percentage points
higher (relative to our central projection of 2.1 per cent). The fact that £372 billion of
conventional gilts held in the APF are currently in effect financed at Bank Rate reduces
the effective interest rate by 0.5 percentage points.
• Higher RPI inflation could increase accrued interest on index-linked gilts. Taken in
isolation, if RPI inflation were 5.9 percentage points higher than expected in 2020-21,
that alone would add 1.2 per cent of GDP to debt interest costs. Based on past
forecast errors, the chance of that happening is small, but in the years immediately
following the 2008 financial crisis CPI inflation peaked around 3.0 percentage points
above the Bank’s target. A similar inflationary shock is therefore not impossible. And
of course, this sort of shock to inflation would be likely to have other material effects
on the public finances.
Chart 5.5: Receipts fan chart
34
35
36
37
38
39
2010-11 2012-13 2014-15 2016-17 2018-19 2020-21 2022-23
Per ce
nt o
f G
DP
Source: ONS, OBR
The supplementary debt target
5.38 The supplementary debt target is focused on year-on-year changes in the debt-to-GDP ratio
in 2020-21. Table 5.6 shows how our central forecast for a 3.2 per cent of GDP fall in
PSND in that year would be affected by two sources of sensitivity: differences in the level of
debt in the preceding year and differences in growth in 2020-21. We use cyclical
Economic and fiscal outlook 158

Performance against the Government’s fiscal targets
adjustment coefficients to estimate the effect of GDP growth shocks on borrowing, but do
not vary interest rates, so that differences in the assumed rate of GDP growth result in
changes to the interest rate-growth rate differential. On that basis, the table shows that:
• In most cases, the extent to which the debt-to-GDP ratio changes in 2020-21 is
inversely related to the debt-to-GDP ratio in the preceding year. That counterintuitive
result is due to the low level of interest rates assumed in our central forecast, which
means that the effect of GDP growth on the denominator in the debt-to-GDP ratio is
greater than the effect of interest rates on growth in the cash level of debt (via debt
interest spending). The higher the starting level of debt, the more the denominator
effect outweighs the interest rate effect. It is only the larger negative growth shocks that
see the growth rate fall close to the assumed interest rate. When they are similar
(which would be the case if growth was around 2 percentage points slower), the two
effects cancel out. If the growth rate was lower than the interest rate, the extent to
which the debt-to-GDP ratio changes would be positively related to the level of debt in
the preceding year.
• As expected, negative shocks to GDP growth reduce the extent by which debt falls as a
share of GDP and positive shocks increase it. The year-on-year change in the debt-to-
GDP ratio is more sensitive to GDP shocks than the deficit, because it is affected both
by the deficit channel (which drives the accumulation of debt in that year) and by the
denominator channel (which means the previous year’s cash debt is divided by a different level of nominal GDP). Well over half the fall in the debt-to-GDP ratio in
2020-21 reflects the assumed repayment of TFS loans at the end of their four-year
term. Excluding that effect, meeting the proposed target would be at risk to small
negative shocks to GDP growth.
Table 5.6: Illustrative debt target sensitivities in 2020-21
-3 -2 -1 0 +1 +2
-20 1.0 -0.3 -1.6 -2.9 -4.2 -5.4
-10 1.2 -0.3 -1.7 -3.1 -4.4 -5.8
+0 1.3 -0.3 -1.8 -3.2 -4.7 -6.2
+10 1.4 -0.2 -1.8 -3.4 -5.0 -6.5
+20 1.5 -0.2 -1.9 -3.6 -5.3 -6.9
Difference in the level
of PSND in 2019-20
(per cent of GDP)
Year on year change in the PSND-to-GDP ratio in 2020-21
Difference in GDP growth in 2020-21 (percentage points)
5.39 The Government’s fiscal targets only apply in the fixed year of 2020-21, but each is subject
to different sensitivities. For example, holding all other elements of our central forecast
constant, but assuming that structural borrowing in 2020-21 was 2 per cent of GDP (more
than twice the level in our central forecast), it would still be possible for the supplementary
target to be missed if:
• TFS loans issued in 2016-17 were rolled over rather than being repaid, as their
repayment reduces debt by 2.2 per cent of GDP in 2020-21 in our central forecast.
159 Economic and fiscal outlook
Performance against the Government’s fiscal targets
• Cyclical borrowing caused the primary balance to deteriorate by more than 2.1 per
cent of GDP. (It is near zero in our central forecast).
• Financial transactions pushed cash borrowing up relative to PSNB by 2.1 per cent of
GDP more than in our central forecast. That could happen if the Bank of England
decided that a monetary policy stimulus of the type that was announced in August
2016 was necessary in that year.
• Nominal GDP growth was 2.1 per cent (or lower) in the year centred on end-March
2021 that is the denominator for the debt-to-GDP ratio in 2020-21 (relative to 3.5 per
cent in our central forecast).
Scenario analysis
5.40 In this section of each previous EFO, we have produced alternative scenarios that help us to
examine how the effects of a specific risk to our economy forecast could affect the public
finances. Over the past nine years, we have produced 42 such scenarios on a wide range of
topical issues. The current primary risks of interest are those relating to a ‘no deal’ Brexit.
5.41 A ‘no deal’ Brexit would involve – at least in the first instance – an immediate reversion to
the UK trading largely under World Trade Organization rules. Our recent Brexit Discussion
Paper discussed the consequences of the resulting increase in trade barriers for UK trade,
investment and productivity. There we noted that outside studies had yielded a range of
estimates of both the long-run impact and the speed of transition. In addition, there is
uncertainty as to how UK government policies will be adjusted to take advantage of the
extra freedoms conferred by leaving the EU.
5.42 Our recent Brexit Discussion Paper also noted that an abrupt, disorderly exit could have a
severe short-term impact on the economy. Elevated uncertainty would continue to depress
demand and an abrupt exit would also be likely to raise inflation, with a weaker pound – alongside the direct impact of higher tariffs – pushing up import prices. In addition, a
disorderly exit might well result in temporary disruption to the supply of some imported
products and domestic goods containing imported components. It is, though, likely that the
UK and EU authorities would in due course take action to mitigate some of the worst
disruption, while businesses would gradually adjust to the new constraints. Hence, such a
period of dislocation should prove largely transitory.
5.43 The Bank of England recently published an assessment of two potential ‘no deal’ outcomes.7
But as the Bank emphasised at the time, these were intended as stress tests – appropriate to
meeting the Bank’s financial stability mandate – rather than central forecasts. Moreover, as
the Governor has recently noted, supportive policy measures could potentially mitigate
some – though not all – of the adverse consequences. 8
7 Bank of England, EU withdrawal scenarios and monetary and financial stability: a response to the House of Commons Treasury Committee, November 2018. The Bank also examine scenarios in which there is reversion to WTO rules after an orderly transition period. 8 Carney, M., Annual Report to the Treasury Committee, February 2019.
Economic and fiscal outlook 160

Performance against the Government’s fiscal targets
5.44 Given the substantial uncertainty about both the short- and long-run consequences of a ‘no deal’ Brexit, we have not posited a specific alternative scenario. But we draw on our library of past scenarios to illustrate the indirect fiscal consequences of the types of disturbance to
the outlook that are characteristic of a ‘no deal’ Brexit. We cannot incorporate the direct
fiscal effects of policies accompanying a ‘no deal’ Brexit (such as the customs revenue from
the introduction of new tariff rates) as these are presently unknown.
5.45 None of our past scenarios provide a direct correspondence to the combination of shocks
that are likely to characterise a ‘no-deal’ Brexit. These include: a short-term disruption to
supply, possibly accompanied by hoarding by consumers and businesses; a more persistent
but temporary weakness in demand; an adverse long-run impact on potential output via
productivity and migration; and a further real depreciation of sterling. But some of our past
scenarios do illustrate parts of the story. Three (sets of) scenarios are particularly relevant:
shocks to the economy’s growth potential via productivity and migration; cyclical weakness in aggregate demand; and inflationary shocks.
5.46 Taking each in turn:
• One consistent theme of past scenarios is that adverse shocks to potential output have
the greatest medium-term fiscal costs. Drawing on our previous simulations we can
generate rough ‘ready reckoners’ of the impact of weaker productivity growth and
lower net inward migration. For every 1 percentage point off potential productivity at
the forecast horizon (i.e. around 0.2 percentage points a year off growth), structural
borrowing would be around 0.5 per cent of GDP higher. For every 50,000 a year
reduction in net inward migration, the population by the end of the forecast would be
0.4 per cent smaller and employment 0.5 per cent lower, leaving structural borrowing
around 0.2 per cent of GDP higher. The effects are reasonably linear and additive,
although any change in the mix of inward migrants’ average pay would have further modest fiscal consequences.
• By contrast, cyclical shocks can cause large short-term rises in the deficit but – so long
as they do not have a lasting effect on potential output – the deficit will ultimately fall
back to roughly where it would have been. This was illustrated in our ‘consumer bust’
simulation in March 2017, which saw GDP fall 2.2 per cent below our central forecast
at its weakest point, but return to the central forecast by the forecast horizon. The
deficit returned to around ½ per cent of GDP above the levels in our central forecast
by the end of the period, but debt was over 4 per cent of GDP higher thanks to the
extra cyclical borrowing induced by the shock.
• The effect of higher inflation on the public finances is more complex and harder to
provide a ready reckoner for. It has a large and almost immediate effect on the cost of
servicing index-linked gilts. Taxes are affected via the uprating of thresholds (where
higher inflation reduces revenue) and revalorisation of rates (where it raises revenue).
Departmental spending rises if the Government chooses to increase budgets to
maintain real spending power, as do other items of public spending (including benefits
and public service pensions, most of which are uprated in line with inflation). The
161 Economic and fiscal outlook
Performance against the Government’s fiscal targets
balance of these effects will depend crucially on the source of the higher inflation. If it
results from strong demand and higher wage growth, it tends to be positive; if it results
from an exchange rate or import price shock, lowering real wages, it tends to be
negative. The latter case is probably more applicable in a ‘no deal’ Brexit (though
there would be some offset from any tariffs introduced on imports from the EU).
5.47 As mentioned above, alongside these ‘indirect’ effects, there would be several ‘direct’
impacts on the public finances. For instance, the end to full UK contributions to the EU
budget would reduce public spending – but this might be tempered by the costs of any
financial settlement and offset by domestic commitments. On the tax side, there would be
direct revenue consequences from any changes in tariff policy: if the UK left the customs
union, it would retain customs revenues instead of remitting them to the EU. And the
Government would be faced with other policy choices, such as whether to incur the costs of
setting up new IT systems, and whether to use fiscal policy to offset temporary disruption.
5.48 Taking all this together, what can we usefully say about the fiscal implications of a ‘no deal’ Brexit, were it to happen? First, the range of possible outcomes is clearly large, given the
uncertainty both around the economic impact and around the nature and effectiveness of
any policy response. Second, while the short-term shock to the economy would no doubt
have fiscal costs, the more significant channels would probably be via its impact on
potential output. Third, the direct fiscal effects of any policy response would also affect the
final path of the deficit, though this is presently unknowable.
Economic and fiscal outlook 162

3 Fiscal sustainability report
Executive summary
Overview
1 In our Fiscal sustainability report (FSR) we look beyond the medium-term forecast horizon of
our twice-yearly Economic and fiscal outlooks (EFOs) and ask whether the UK’s public
finances are likely to be sustainable over the longer term.
2 In doing so our approach is twofold:
• first, we look at the fiscal impact of past government activity, as reflected in the assets
and liabilities on the public sector’s balance sheet; and
• second, we look at the potential fiscal impact of future government activity, by making
50-year projections of all public spending, revenues and significant financial
transactions, such as government loans to students.
3 Our projections are based on current stated Government policy, but in three key instances
policy formation is ongoing:
• Our projections include the impact of the Government’s as-yet unfunded June 2018
announcement of increased health spending over the medium term. The Government
has indicated that measures to finance at least part of the additional spending will be
announced at some point, but has given no firm details of their size or composition.
• Following the Government’s December 2017 decision not to implement the Dilnot
reforms to adult social care funding it planned for 2020, we have removed them from
our projections, reducing projected spending. The Government says it will announce
new policy proposals in due course, which could push projected spending up again.
• The Government’s July 2017 State Pension age (SPA) review gave greater clarity on the
probable timing of future increases to the SPA and we have included the consequences
of this. The Government has also said that it will review the continued operation of
triple-lock uprating of the state pension beyond this Parliament, potentially reducing
projected spending. But in the absence of a firm decision to replace the triple lock we
assume that it remains in place.
4 With or without these policy changes, our projections suggest that the public finances are
likely to come under significant pressure over the longer term, due to an ageing population
and further upward pressure on health spending from factors such as technological
advances and the rising prevalence of chronic health conditions. Under our definition of
unchanged policy, the Government would end up having to spend more as a share of
Executive summary
Fiscal sustainability report 4
national income on age-related items such as pensions and (in particular) health care, but
the same demographic trends would leave government revenues roughly stable.
5 In the absence of offsetting tax rises or spending cuts, this would widen the government’s
budget deficit over time and put public sector net debt on an unsustainable upward
trajectory. This fiscal challenge from an ageing population and from additional pressures on
health spending is common to many developed nations.
6 The long-term outlook for the public finances is less favourable than at the time of our last
FSR in January 2017. This is more than explained by the June health spending
announcement, which – in the absence of accompanying offsetting tax or spending measures
– increases spending by significantly more than the modest fiscal tightening implied by
dropping the Dilnot reforms and accelerating rises in the State Pension age. If the higher
health spending were to be fully financed by tax rises or cuts in other spending, the long-
term outlook for the public finances would be little changed from our 2017 FSR. The latest
population projections from the ONS weaken the long-term fiscal position, with prospective
demographic trends slightly less favourable to the public finances.
7 Long-term projections such as these are highly uncertain and the results we present here
should be seen as illustrative scenarios conditioned on particular ‘what if’ assumptions, not
as precise forecasts. We quantify some of the uncertainties through sensitivity analyses,
particularly relating to demography and health spending.
8 It is important to emphasise that we focus here on the additional fiscal tightening that might
be necessary to achieve fiscal sustainability beyond our medium-term forecast horizon, which
currently ends in 2022-23. Our March 2018 forecast incorporated the modest further fiscal
tightening then planned by the Government over the medium term – primarily further cuts to
departmental current spending as a share of GDP and cuts to working-age welfare
spending. In the absence of offsetting tax or spending policies that have yet to be specified,
the subsequent June health spending announcement leaves the deficit broadly flat over the
medium term in the figures we use in this report, rather than narrowing.
9 While it is not for us to recommend the size or timing of any additional fiscal tightening
measures, policymakers and would-be policymakers should certainly think carefully about
the long-term consequences of any policies they introduce or propose in the short term,
including at next year’s Spending Review. And they should give thought too to the policy
choices that will confront them once the current planned consolidation is complete.
Public sector balance sheets
10 We assess the fiscal impact of past government activity by looking at the assets and liabilities
on the public sector’s balance sheet. We look at two presentations of the balance sheet: the
National Accounts and the 2016-17 Whole of Government Accounts (WGA).
11 The last three governments have set targets for the National Accounts measure of public
sector net debt (PSND) – the difference between the public sector’s debt liabilities and liquid
Executive summary
5 Fiscal sustainability report
financial assets. At the end of 2017-18, PSND stood at £1,779 billion, equivalent to 85.4
per cent of GDP or £65,000 per household. Thanks in part to significant planned asset sales
during 2018-19, our March forecast assumed that PSND would peak as a share of GDP in
2017-18. The medium-term debt profile in this report is little changed from that in our 2017
FSR, with the impact of the June health spending increase offset by the reclassification of
English housing associations and their borrowing and debt to the private sector in November
2017. However, the latter does not fundamentally improve the health of the public finances.
12 National Accounts balance sheet measures do not include liabilities arising from the future
consequences of past government activities, for example the pension rights that have been
accrued by public sector workers. More information on liabilities of this sort is available in
the WGA, which are produced using commercial accounting rules.
13 According to the 2016-17 WGA, as of the end of March 2017:
• The net present value of future public service pension payments arising from past
employment was £1,835 billion or 92 per cent of GDP. This is £410 billion higher
than a year earlier, with the rise more than explained by the use of a lower discount
rate to convert the projected flow of future payments into a one-off net present value
and by other changes to assumptions underpinning the value of the liabilities.
(Unfortunately, the WGA do not split these out transparently.)
• The public sector’s liabilities include £322 billion (16 per cent of GDP) in provisions for
future costs that are expected (but not certain) to arise. They have increased by £17
billion since 2016-17. The three largest sources of provisions – for future nuclear
decommissioning costs (particularly at Sellafield), for clinical negligence claims and for
the Pension Protection Fund – all increased significantly, by £3.2 billion, £9.0 billion
and £3.2 billion respectively. Repeated and often large increases in provisions suggest
that these could become significant future pressures on public spending.
• £84 billion (4 per cent of GDP) of quantifiable contingent liabilities had been
identified. These are costs that could arise in the future, but where the probability of
each of them in isolation doing so is estimated at less than 50 per cent (so they are not
included in the headline total of liabilities). The £20 billion reduction compared with
last year was more than explained by a £30.4 billion fall in HMRC’s contingent liability
associated with tax litigation cases, reflecting the cessation of litigation in some cases
and revised cost estimates for some ongoing cases. This reduction was partially offset
by a £9.8 billion increase relating to clinical negligence (for which the WGA record
both provisions and contingent liabilities), due to the use of a lower discount rate to
calculate compensation claims.
14 Overall, gross liabilities in the WGA increased by £595 billion over the year to reach £4,324
billion at the end of March 2017. In part this was explained by the net deficit of £98 billion
recorded during the year, as expenditure exceeded revenue, but the majority reflected the
use of a lower discount rate to estimate public service pension liabilities.
Executive summary
Fiscal sustainability report 6
15 Unlike PSND, the WGA balance sheet also includes the value of tangible and intangible fixed
assets – for example the road network and the electromagnetic spectrum respectively. These
are estimated at £1,181 billion or 59 per cent of GDP at the end of March 2017. They have
increased by £51 billion since last year’s WGA, thanks to revaluation effects and new assets
under construction. Total gross assets reached £1,903 billion, up £161 billion on last year.
16 The overall net liability in the WGA was £2,421 billion or 122 per cent of GDP at the end of
March 2017, up £435 billion on the previous year’s restated results. This compares with a
£124 billion rise in PSND to £1,727 billion. The sharper rise in the WGA liability largely
reflects the discount rate effect on the public service pensions liability.
17 There are significant limits to what public sector balance sheets alone can tell us about fiscal
sustainability. In particular, balance sheet measures look only at the impact of past
government activity. They do not include the present value of future spending that we know
future governments will wish to undertake, for example on health, education and state
pensions. Just as importantly, they exclude the public sector’s most valuable financial asset –
its ability to levy future taxes. So we should not overstate the significance of the fact that
PSND and the WGA balance sheet both show the public sector’s liabilities outstripping its
assets. Across countries and time, this has usually been the case.
Long-term fiscal projections
18 We assess the potential fiscal impact of future government activity by making long-term
projections of revenue, spending and financial transactions on an assumption of ‘unchanged
policy’, as best we can define it. In doing so, we usually assume that spending and revenues
initially evolve over the next five years as we forecast in our most recent EFO. We have
departed from this approach in this FSR by incorporating the significant increase in NHS
spending through to 2023-24 announced by the Prime Minister in June (and including an
assumption about its ‘Barnett consequentials’ for health spending outside England).
19 We incorporate this announcement both because it is very large compared to most policy
announcements outside scheduled fiscal events and because health is the most important
component in our long-term analysis. The Government has indicated that it will fund at least
some of the health package by increasing taxes and/or reducing other spending, but in the
absence of firm detail we cannot include this in our projections. It has also said that the
announcement will be funded in part by a ‘Brexit dividend’, although our provisional analysis
suggests Brexit is more likely to weaken than strengthen the public finances overall. There will
be direct savings from the net contributions to the EU budget that the UK will no longer have
to make, but it is unclear how much will be available after payments towards the agreed
withdrawal settlement and other Brexit-related spending commitments.
20 We have not made any further judgements or assumptions about the nature of the UK’s
departure from the European Union beyond those that underpinned our March EFO.
Executive summary
7 Fiscal sustainability report
Demographic, economic and health-specific assumptions
21 Demographic change is a key long-term pressure on the public finances. Like many
developed nations, the UK is projected to have an ageing population over the next few
decades, with the old-age dependency ratio – the ratio of the elderly to those of working age
– rising. This reflects increasing life expectancy (particularly among older people), relatively
low fertility rates, and the retirement of the post-war ‘baby boom’ cohorts.
22 We base our analysis on detailed population projections produced by the Office for National
Statistics (ONS). In this FSR, we use its 2016-based population projections, which were
released in October 2017. As in our 2017 FSR, our baseline fiscal projections use the
‘principal’ ONS population projection. This assumes that net inward migration falls to
165,000 a year by 2022-23 and remains at that level thereafter. We test the sensitivity of our
conclusions to using different ONS variants. Relative to the 2014-based projections that
underpinned our 2017 FSR, lower net inward migration and fewer births reduce the working
age population. As a result, the old-age dependency ratio now rises more rapidly than in our
previous report, despite slower improvements in future life expectancy leading the ONS to
revise down the projected number of elderly people by increasing amounts.
23 As regards the economy, we continue to assume in our baseline projection that whole
economy productivity growth will average 2.0 per cent a year in steady state. We have made
several small changes to the long-term economic determinants we use, including revising
down GDP deflator inflation by 0.1 percentage points to 2.2 per cent a year and revising
down employment growth due to slower growth in the adult population. Having revised
down our medium-term productivity growth forecast significantly since our previous FSR, we
now assume it takes longer for productivity growth to return to its steady state rate.
24 In this year’s report, we continue to assume that health spending rises to accommodate non-
demographic cost pressures beyond the medium term and that this adds 1 percentage point
a year to health spending growth in the long term. We assume that excess cost growth falls
from the latest available estimates for primary and secondary care (which are higher than 1
percentage point) back to this long-term assumption steadily over the period to 2038-39.
This approach and the values that we have chosen are similar to those used by the US
Congressional Budget Office. It is important to emphasise that our health spending
projections are not based on any bottom-up assessment of ‘need’, but rather embody a
judgement that ‘unchanged policy’ is best interpreted as assuming that spending rises to
accommodate demographic and non-demographic cost pressures over time.
Defining ‘unchanged’ policy
25 Fiscal sustainability analysis is designed to identify whether and when changes in government
policy may be necessary to move the public finances from an unsustainable to a sustainable
path. To make this judgement, we must first define what we mean by ‘unchanged’ policy
over the long term for all tax and spending streams, not just health.

Executive summary
Fiscal sustainability report 8
26 Government policy is rarely clearly defined over the long term. In many cases, simply
assuming that a stated medium-term policy continues for 50 years would be unrealistic.
Where policy is not clearly defined over the long term, the Charter for Budget Responsibility
allows us to make appropriate assumptions. These are set out clearly in the report.
Consistent with the Charter, we only include the impact of policy announcements in our
baseline projections when they can be quantified with “reasonable accuracy”.
Medium-term policy changes
27 Changes in the starting point for our projections are often an important driver of changes in
the long-term projections from one FSR to the next. The net effect of the three EFO forecasts
since our 2017 FSR has been relatively minor, but the June announcement of significantly
higher health spending over the medium term has had a significant effect on our projections.
28 For the largest component of UK-wide health spending – the budget of NHS England – the
Government has now set out current spending plans up to 2023-24, so our long-term
assumptions start from 2024-25. The June announcement implies a real terms increase in
spending of £20.5 billion by 2023-24, relative to an adjusted 2018-19 baseline. In 2022-
23, the resulting increase in UK-wide health spending is 0.9 per cent of GDP (£20.5 billion
in cash terms), relative to what we assume it would have been absent the announcement.
(This includes an additional £1.25 billion to cover a “specific pensions pressure”).
29 Chart 1 shows our baseline projection for UK-wide health spending over the next 10 years
with and without the June announcement. The pre-announcement path declines steadily as a
share of GDP to 2022-23, based on Government plans as they stood at the March 2018
Spring Statement, at which point our long-term assumptions would have put it back on an
upward trend as a share of GDP. With the June announcement, health spending is on a
rising path up to 2022-23 too, reaching 7.6 per cent of GDP (£181.8 billion).
Chart 1: Impact of June 2018 NHS spending announcement
5.0
5.5
6.0
6.5
7.0
7.5
8.0
8.5
9.0
2017-18 2018-19 2019-20 2020-21 2021-22 2022-23 2023-24 2024-25 2025-26 2026-27 2027-28
Per ce
nt o
f G
DP
FSR 2018
FSR 2018 (pre-June policy)
Demographic and other cost pressures accommodated from 2018-19
Demographic pressures accommodated from 2018-19
Source: HMT, OBR
Executive summary
9 Fiscal sustainability report
30 Health spending is currently estimated at 7.1 per cent of GDP (£150.2 billion) in 2018-19,
on the functional definition we use. If spending were to rise from that level to accommodate
only demographic pressures, we estimate that it would reach 7.3 per cent of GDP (£174.4
billion) in 2022-23. If it rose sufficiently to accommodate other cost pressures as well, it
would reach 7.7 per cent of GDP (£184.7 billion).
31 Absent the June 2018 announcement, we would have projected health spending at 6.8 per
cent of GDP (£161.3 billion) in 2022-23, implying shortfalls against those two hypothetical
paths of 0.5 per cent of GDP (£13.0 billion) and 1.0 per cent of GDP (£23.3 billion)
respectively. The June 2018 announcement means that health spending is now projected to
rise more than enough to meet the demographic cost pressures over those four years and
sufficiently to meet around four fifths of the demographic and non-demographic pressures
combined, leaving a shortfall of 0.1 per cent of GDP (£2.8 billion) against that
counterfactual in 2022-23.
32 Given the significant uncertainty around estimates of these pressures, particularly the non-
demographic ones, these paths and the gaps relative to them should be treated as
illustrative. They do not represent a bottom-up assessment of the necessary level of health
spending as a share of GDP, which would anyway lie beyond our remit.
33 Announcing the additional health spending, the Prime Minister said that it would be funded
by a “Brexit dividend, with us as a country contributing a little more”. As already noted, the
Government has not set out the size or composition of any additional taxpayer contribution,
either through higher taxes or cuts in other spending, so we have not been able to include it
in our projections. As regards the ‘Brexit dividend’, our provisional analysis suggests that
Brexit is more likely to weaken the public finances than strengthen them over the medium
term, thanks to its likely effect on the economy and tax revenues. Looking more narrowly at
direct financial flows with the EU, we estimated in our March 2018 EFO that the UK would
have had to make a contribution of £13.3 billion to the EU budget in 2022-23 if we
remained a member. Of that potential saving, £7.5 billion will be absorbed by the
withdrawal settlement payment expected for that year, leaving £5.8 billion to be spent on
other things. In principle this could cover slightly less than 30 per cent of the cost of health
package in that year, but this does not take into account other calls on these potential
savings, including commitments the Government has already made on farm support,
structural funds, science and access to regulatory bodies. Pending a detailed withdrawal
agreement and associated spending decisions, we assume in this report that the extra health
spending adds to total spending and borrowing rather than being absorbed in whole or part
elsewhere.
Long-term policy assumptions
34 With the notable exception of non-demographic cost pressures in health, our baseline
projection assumes that underlying age-specific spending on public services rises with per
capita GDP beyond 2022-23.
Executive summary
Fiscal sustainability report 10
35 We assume that most tax thresholds and benefits are uprated in line with earnings growth
rather than inflation beyond the medium term, which provides a more plausible and fiscally
neutral baseline for long-term projections. An inflation-based assumption would, other things
equal, imply an ever-rising ratio of tax to national income and an ever-falling ratio of benefit
payments to average earnings in the rest of the economy. In the past, policy has indeed
tended to evolve to offset fiscal drag in the tax system.
36 We have assumed in our baseline projection that the ‘triple lock’ on state pensions uprating
continues to apply – and that on average it leads to the state pension being uprated by 0.36
percentage points on top of earnings growth. The Chancellor has said that the Government
will review whether this commitment will continue into the next Parliament “in light of the
evolving fiscal position at the next Spending Review” – this is expected to be in 2019. We test
the sensitivity of our projections to assuming earnings uprating instead of the triple lock, as
this would be a plausible alternative interpretation of unchanged policy.
Results of our projections
37 Having defined unchanged policy, we apply our demographic and economic assumptions to
produce projections of the public finances over the next 50 years.
Expenditure
38 An ageing population and health-specific cost pressures put upward pressure on public
spending in our baseline projection. Total non-interest spending rises from 36.4 per cent of
GDP at the end of our medium-term forecast in 2022-23 to 44.6 per cent by 2067-68. This
increase of 8.2 per cent of GDP is equivalent to £172.8 billion a year in today’s terms.
39 The main drivers are upward pressures on age-related spending:
• Health spending rises from 7.6 per cent of GDP in 2022-23 to 13.8 per cent in
2067-68 as the population ages and non-demographic cost pressures mount. The
starting point for UK-wide health spending in 2022-23 is 0.6 per cent of GDP higher
than it was in FSR 2017, more than explained by the 0.9 per cent of GDP effect of the
NHS announcement in that year and its knock-on effects outside England, which is
partly offset by our attributing more of the Better Care Fund to social care. Applying
our long-term assumptions about demographic and other cost pressures, the first of
which are a little more unfavourable than in our previous report, by 2067-68 the
upward revision relative to FSR 2017 rises to 1.0 per cent of GDP.
• State pension costs increase from 5.0 per cent of GDP in 2022-23 to 6.9 per cent in
2067-68 as the population ages and the triple lock raises average awards relative to
whole economy earnings. This profile is a little lower than in FSR 2017, mostly
reflecting Government decisions that accelerate the pace of SPA increases.
• Adult social care costs rise from 1.3 per cent of GDP in 2022-23 to 1.9 per cent in
2067-68, reflecting the ageing of the population. The projections are slightly lower
Executive summary
11 Fiscal sustainability report
than in our previous report as we have removed the effect of the Dilnot reforms that
were included in our previous report. This is only partly offset by increasing the
proportion of the Better Care Fund that we attribute to adult social care.
Revenue
40 Demographic factors are expected to have much less impact on revenues than on spending.
Non-interest revenues are projected to be all but flat as a share of GDP across the projection
period. In our baseline projection, those revenue streams that are not affected by
demographics are explicitly held constant as a share of GDP. As we have explored in
previous reports, there are various non-demographic factors that may affect different
revenue streams in the future, but these are not incorporated into our baseline projections.
Financial transactions
41 To move from spending and revenue projections to an assessment of the outlook for public
sector net debt, we also need to take public sector financial transactions into account. These
affect net debt directly, without affecting accrued spending or borrowing.
42 For the majority of financial transactions, we assume that their net effect over the long term is
zero. Student loans are an important exception. Lending to students adds to net debt
immediately through financing the outlays. Repayments then reduce that addition, but not
completely because some of the lending is expected to be written-off rather than repaid.
43 We have revised up our projection for the effect of student loans on net debt relative to our
previous report. This largely reflects policy changes announced since then. In particular, the
Government has raised the threshold at which students start repaying their loans from
£21,000 in 2017-18 to £25,000 in 2018-19 and it plans to uprate this with average
earnings over time. This significantly reduces the repayments made by students over the
lifetime of their loans and consequently increases the write-offs at the end of the 30-year
loan period. At the peak, student loans are now projected to increase net debt by 12.4 per
cent of GDP in the late-2030s, before falling back slightly to 11.2 per cent of GDP in 2067-
68. This latter figure is 1.9 per cent of GDP higher than our previous projection last year.
44 Alongside this FSR we publish a working paper on the accounting treatment of student loans
and the fiscal illusions that this produces.1 This is particularly true in respect of public sector
net borrowing, which is flattered in the near term by interest receipts that are accrued in full
but only expected to be paid in part, and which only recognises the cost of subsidising the
loans far in the future when outstanding balances are written off after 30 years.
45 The Government continues to reduce the assets held by UK Asset Resolution (UKAR) through
active sales and the natural rundown of mortgages and plans to sell much of its stake in RBS.
The sale of financial assets is classified as a financial transaction in the public finances
statistics. Sales reduce public sector net debt directly and indirectly (via net borrowing,
because interest is paid on a smaller stock of debt), but typically (and in the case of these
1 Ebdon and Waite, Working Paper No. 12: Student loans and fiscal illusions, OBR, July 2017.
Executive summary
Fiscal sustainability report 12
sales) the government also loses a related income stream. Over the long term, therefore, the
net impact of asset sales on net debt is significantly less than the sale price. The effect on
broader balance sheet measures is typically close to zero because the sales involve
converting one asset (mortgages or shares) into another (cash).
Projections of the primary balance and public sector net debt
46 Our baseline projections show public spending increasing as a share of national income
beyond the medium-term forecast horizon, exceeding receipts by increasing amounts over
the projection period. As a result, the primary budget deficit (the difference between non-
interest revenues and spending) is projected to move from 0.3 per cent of GDP in 2022-23
to 8.6 per cent of GDP in 2067-68 – an eventual overall deterioration of 8.3 per cent of
GDP, equivalent to £176.5 billion a year in that year in today’s terms.
47 Taking this and our projection of financial transactions into account, PSND is projected to fall
from its medium-term peak of 85.6 per cent of GDP in 2017-18 to 80.0 per cent of GDP in
2022-23, before rising thereafter and reaching 282.8 per cent of GDP in 2067-68. Beyond
this point, debt would remain on a rising path. Needless to say, in practice policy would
need to change long before this date to prevent this outcome.
Chart 2: Baseline projections of the primary balance and PSND
0
25
50
75
100
125
150
175
200
225
250
275
300
-10
-5
0
5
10
15
20
25
30
35
40
2023-24 2028-29 2033-34 2038-39 2043-44 2048-49 2053-54 2058-59 2063-64
Per ce
nt o
f GD
PPer ce
nt o
f G
DP
Source: OBR
48 The primary deficit and PSND at the end of the projection period are considerably higher
than in our 2017 FSR projections. As Table 1 shows, this reflects:
• Methodology changes to the calculation of debt interest. These do not affect the
primary balance, but increase debt.
Executive summary
13 Fiscal sustainability report
• Classification changes. English housing associations have been reclassified to the
private sector, which has a small effect on the primary balance but a larger effect on
net debt in the short term that increases over the projection period.
• More unfavourable demographics put upward pressure on age-related spending.
• Changes to long-term policy (including dropping the Dilnot reforms to adult social
care and accelerating increases in the SPA) amount to a significant fiscal tightening
over the long run, reducing the primary deficit by 0.4 per cent of GDP and net debt by
31.0 per cent of GDP in 2067-68. But we do not yet know what will replace the Dilnot
reforms, so future policy changes could see spending and debt revised up again.
• The June 2018 health spending announcement increases the primary deficit and net
debt at the start of our baseline projection and by increasing amounts thereafter. The
effect in 2022-23 reflects the fact that the Government has specified the spending
announcement in sufficient detail for us to include it in these projections, but has not
provided any detail on how it will be financed (although it has indicated that tax rises
are expected to finance at least some of it). The longer-term effect also includes the
result of assuming that spending will continue to rise from that base to accommodate
continuing demographic and other cost pressures. Overall it increases the primary
deficit by 1.5 per cent of GDP and net debt by 57.9 per cent of GDP in 2067-68.
49 It may seem counterintuitive that increasing health spending in the medium term, to address
some of the immediate apparent pressures on the NHS, leads to greater long-term fiscal
pressures. But the June announcement can be interpreted as a crystallisation of medium-
and long-term risks that we highlighted in our 2017 Fiscal risks report, namely that the
medium-term path set out before the announcement would turn out to be politically
unsustainable. In effect, the Government has now chosen to accommodate most of the
demographic and other cost pressures we assume over the next five years, having not
previously planned to do so. That will presumably help maintain the quality and quantity of
services, but at the cost of greater long-term fiscal pressure if future governments choose to
maintain the resulting higher service levels further into the future.
50 Taking all these factors into account, if left unaddressed our latest projections suggest that
the primary deficit would rise to 8.6 per cent of GDP and PSND to 282.8 per cent of GDP in
2067-68 and continue rising thereafter. The big picture of upward pressure from health costs
and ageing is common to many advanced economies and would still be seen in the UK even
if the Government fully finances the June health announcement.
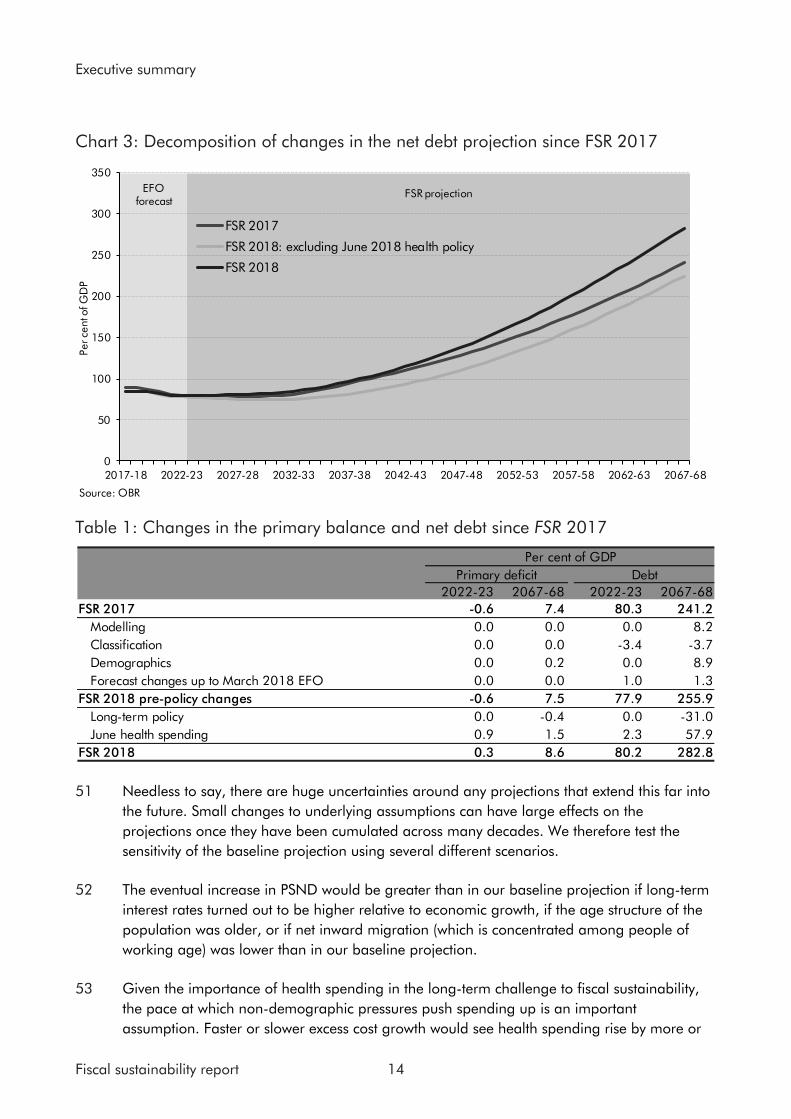
Executive summary
Fiscal sustainability report 14
Chart 3: Decomposition of changes in the net debt projection since FSR 2017
FSR projectionEFOforecast
0
50
100
150
200
250
300
350
2017-18 2022-23 2027-28 2032-33 2037-38 2042-43 2047-48 2052-53 2057-58 2062-63 2067-68
Per ce
nt o
f G
DP
FSR 2017
FSR 2018: excluding June 2018 health policy
FSR 2018
Source: OBR
Table 1: Changes in the primary balance and net debt since FSR 2017
2022-23 2067-68 2022-23 2067-68
FSR 2017 -0.6 7.4 80.3 241.2
Modelling 0.0 0.0 0.0 8.2
Classification 0.0 0.0 -3.4 -3.7
Demographics 0.0 0.2 0.0 8.9
Forecast changes up to March 2018 EFO 0.0 0.0 1.0 1.3
FSR 2018 pre-policy changes -0.6 7.5 77.9 255.9
Long-term policy 0.0 -0.4 0.0 -31.0
June health spending 0.9 1.5 2.3 57.9
FSR 2018 0.3 8.6 80.2 282.8
Primary deficit
Per cent of GDP
Debt
51 Needless to say, there are huge uncertainties around any projections that extend this far into
the future. Small changes to underlying assumptions can have large effects on the
projections once they have been cumulated across many decades. We therefore test the
sensitivity of the baseline projection using several different scenarios.
52 The eventual increase in PSND would be greater than in our baseline projection if long-term
interest rates turned out to be higher relative to economic growth, if the age structure of the
population was older, or if net inward migration (which is concentrated among people of
working age) was lower than in our baseline projection.
53 Given the importance of health spending in the long-term challenge to fiscal sustainability,
the pace at which non-demographic pressures push spending up is an important
assumption. Faster or slower excess cost growth would see health spending rise by more or
Executive summary
15 Fiscal sustainability report
less than in our baseline projection – by +2.5/-2.1 per cent of GDP in the ±0.5 percentage
point sensitivity analyses we present.
54 Over a shorter time horizon, the Government has set itself an objective of balancing the
budget by the middle of the next decade. Our projections suggest that this will be
challenging in the face of ageing pressures on health, social care and state pensions
spending, and if non-demographic pressures on health spending continue at close to their
recent pace. That would be true even if tax and benefit thresholds were uprated in line with
inflation rather than earnings beyond our medium-term forecast horizon, boosting tax
receipts through fiscal drag and reducing welfare spending through the erosion of the
average awards relative to average earnings.
Summary indicators of fiscal sustainability
55 In our baseline projections, and under the variants we construct, on current policy we would
expect the budget deficit to widen significantly over the long term, putting public sector net
debt on a rising trajectory as a share of national income. This would not be sustainable.
56 Summary indicators of sustainability can be used to illustrate the scale of the challenge more
rigorously and to quantify the tax increases and/or spending cuts necessary to return the
public finances to different definitions of sustainability. We focus on a measure of
sustainability that asks how large a permanent spending cut or tax increase would be
necessary to move public sector net debt to a particular desired level at a particular chosen
date. This is referred to as the ‘fiscal gap’.
57 There is no consensus on what an optimal level for the public debt to GDP ratio would be.
So, for illustration, we calculate the additional fiscal tightening necessary from 2022-23 to
return PSND to 20, 40 or 60 per cent of GDP at the end of our projections in 2067-68. In
practice, given that expenditure pressures in our projections build up gradually over time, a
phased fiscal adjustment might be considered a more realistic illustration.
58 Under our baseline projection, a once and for all policy tightening of 5.2 per cent of GDP in
2023-24 (£111 billion in today’s terms) would see the debt ratio come in at 40 per cent of
GDP in 2067-68. But this is less than the 8.6 per cent of GDP required to stabilise debt over
the longer term, so the debt ratio would continue rising beyond the target date. Tightening
policy by 1.9 per cent of GDP a decade would see the debt ratio fall more slowly to begin
with, but the overall tightening would be large enough to stabilise the debt ratio at around
the target level and prevent it from taking off again.
59 These estimates are slightly larger than in our previous report, as the effect of higher
medium-term health spending more than offsets the long-term policy tightening due to faster
SPA rises and dropping the Dilnot reforms to adult social care. Targeting debt ratios of 20
and 60 per cent of GDP would require larger and smaller adjustments respectively.

Executive summary
Fiscal sustainability report 16
234
Annex B
Fiscal impact of policy decisions
The tables in this annex show the fiscal impact of policy decisions taken at
Budget 2018.

36 Budget 2018
Table 2.1: Budget 2018 policy decisions (£ million)1
Head 2018-19 2019-20 2020-21 2021-22 2022-23 2023-242
Spending and public services
1 National Health Service: five year settlement agreed in June 2018
Spend 0 -7,350 -11,130 -16,090 -21,400 -27,610
2 Social Care: 2018-19 and 2019-20 funding
Spend -285 -775 – – – –
3 Children's Social Care: improvement pilots
Spend 0 -45 -25 -15 -15 0
4 Transport: road maintenance Spend -500 0 0 0 0 0
5 Schools: 2018-19 capital Spend -475 0 0 0 0 0
6 Justice: 2018-19 prisons, courts, and justice system funding
Spend -60 0 0 0 0 0
7 Defence: 2018-19 and 2019-20 funding
Spend -200 -800 0 0 0 0
8 Centre for Public Sector Leadership Spend 0 -10 -10 -10 0 0
9 Armistice Day Commemorations Spend -15 0 0 0 0 0
Living standards
Tax
10 Personal Allowance and Higher Rate Threshold: increase to £12,500 and £50,000 for 2019-20 and 2020-21
Tax 0 -2,790 -1,935 -1,445 -1,605 -1,780
11 Fuel Duty: freeze for 2019-20 Tax 0 -840 -855 -880 -910 -935
12 Alcohol Duties: freeze spirits, beer and cider in 2019 and set rate for high strength cider
Tax -35 -165 -175 -175 -180 -185
Welfare
13 Universal Credit: £1,000 increase to work allowance
Spend 0 -545 -865 -1,130 -1,400 -1,695
14 Universal Credit: additional support for transition
Spend -35 -90 -170 -255 -240 -205
15 Universal Credit: revised implementation schedule
Spend 0 -95 +320 +845 +745 +250
16 Industrial Injuries Disablement Benefit: include Dupuytren's contracture
Spend 0 0 -5 -5 -5 -5
Spending
17 Low Cost Credit: support Spend 0 -5 * 0 0 0
18 Pensions Dashboard: further funding Spend 0 -5 0 0 0 0
19 Disabled Facilities Grant: expand Spend -65 0 0 0 0 0
Business and growth
20 Annual Investment Allowance: temporary increase to £1 million for two years from January 2019
Tax -215 -600 -425 +140 +185 +155
21 Structures and Buildings Allowance: permanent capital allowance for new structures and buildings
Tax -55 -165 -260 -365 -475 -585
22 Special Writing Down Allowance: align with depreciation in accounts at 6% rate
Tax +75 +250 +360 +325 +315 +305
23 Apprenticeships: halve co-investment rate to 5%
Spend 0 -25 -60 -60 -70 -70
24 Skills: regional pilot of course subsidy for self-employed
Spend 0 -5 -5 0 0 0
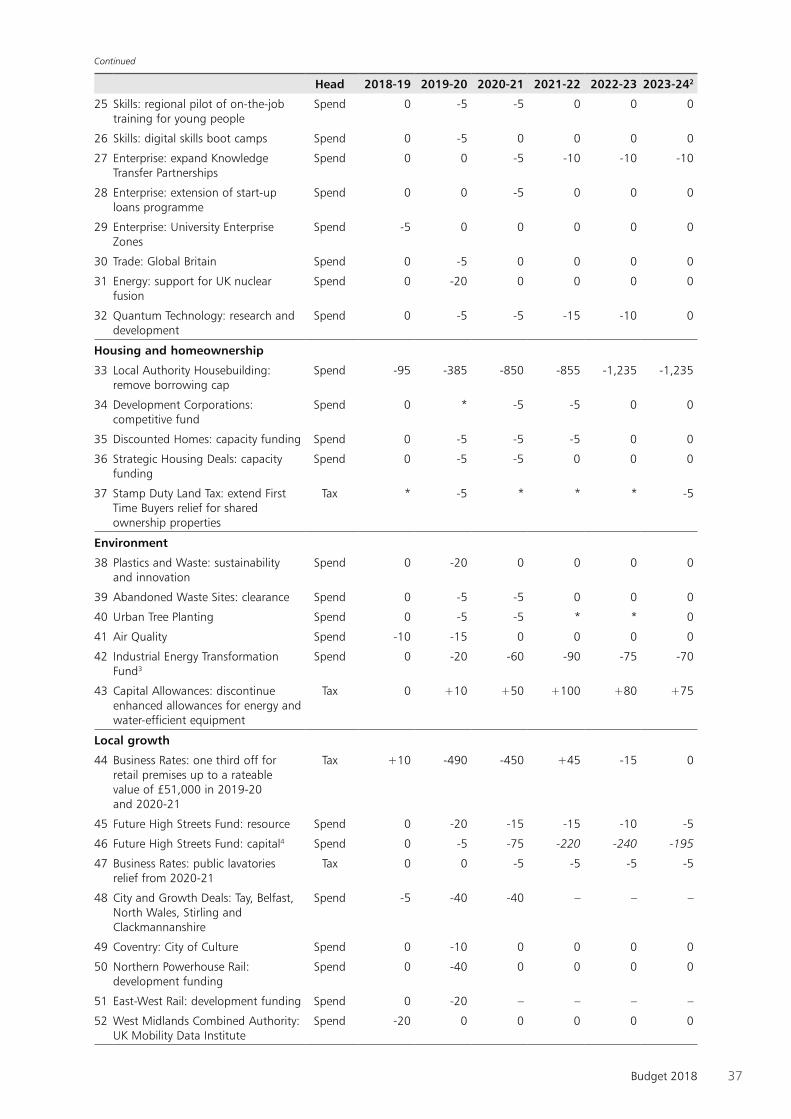
37Budget 2018
Continued
Head 2018-19 2019-20 2020-21 2021-22 2022-23 2023-242
25 Skills: regional pilot of on-the-job training for young people
Spend 0 -5 -5 0 0 0
26 Skills: digital skills boot camps Spend 0 -5 0 0 0 0
27 Enterprise: expand Knowledge Transfer Partnerships
Spend 0 0 -5 -10 -10 -10
28 Enterprise: extension of start-up loans programme
Spend 0 0 -5 0 0 0
29 Enterprise: University Enterprise Zones
Spend -5 0 0 0 0 0
30 Trade: Global Britain Spend 0 -5 0 0 0 0
31 Energy: support for UK nuclear fusion
Spend 0 -20 0 0 0 0
32 Quantum Technology: research and development
Spend 0 -5 -5 -15 -10 0
Housing and homeownership
33 Local Authority Housebuilding: remove borrowing cap
Spend -95 -385 -850 -855 -1,235 -1,235
34 Development Corporations: competitive fund
Spend 0 * -5 -5 0 0
35 Discounted Homes: capacity funding Spend 0 -5 -5 -5 0 0
36 Strategic Housing Deals: capacity funding
Spend 0 -5 -5 0 0 0
37 Stamp Duty Land Tax: extend First Time Buyers relief for shared ownership properties
Tax * -5 * * * -5
Environment
38 Plastics and Waste: sustainability and innovation
Spend 0 -20 0 0 0 0
39 Abandoned Waste Sites: clearance Spend 0 -5 -5 0 0 0
40 Urban Tree Planting Spend 0 -5 -5 * * 0
41 Air Quality Spend -10 -15 0 0 0 0
42 Industrial Energy Transformation Fund3
Spend 0 -20 -60 -90 -75 -70
43 Capital Allowances: discontinue enhanced allowances for energy and water-efficient equipment
Tax 0 +10 +50 +100 +80 +75
Local growth
44 Business Rates: one third off for retail premises up to a rateable value of £51,000 in 2019-20 and 2020-21
Tax +10 -490 -450 +45 -15 0
45 Future High Streets Fund: resource Spend 0 -20 -15 -15 -10 -5
46 Future High Streets Fund: capital4 Spend 0 -5 -75 -220 -240 -195
47 Business Rates: public lavatories relief from 2020-21
Tax 0 0 -5 -5 -5 -5
48 City and Growth Deals: Tay, Belfast, North Wales, Stirling and Clackmannanshire
Spend -5 -40 -40 – – –
49 Coventry: City of Culture Spend 0 -10 0 0 0 0
50 Northern Powerhouse Rail: development funding
Spend 0 -40 0 0 0 0
51 East-West Rail: development funding Spend 0 -20 – – – –
52 West Midlands Combined Authority: UK Mobility Data Institute
Spend -20 0 0 0 0 0
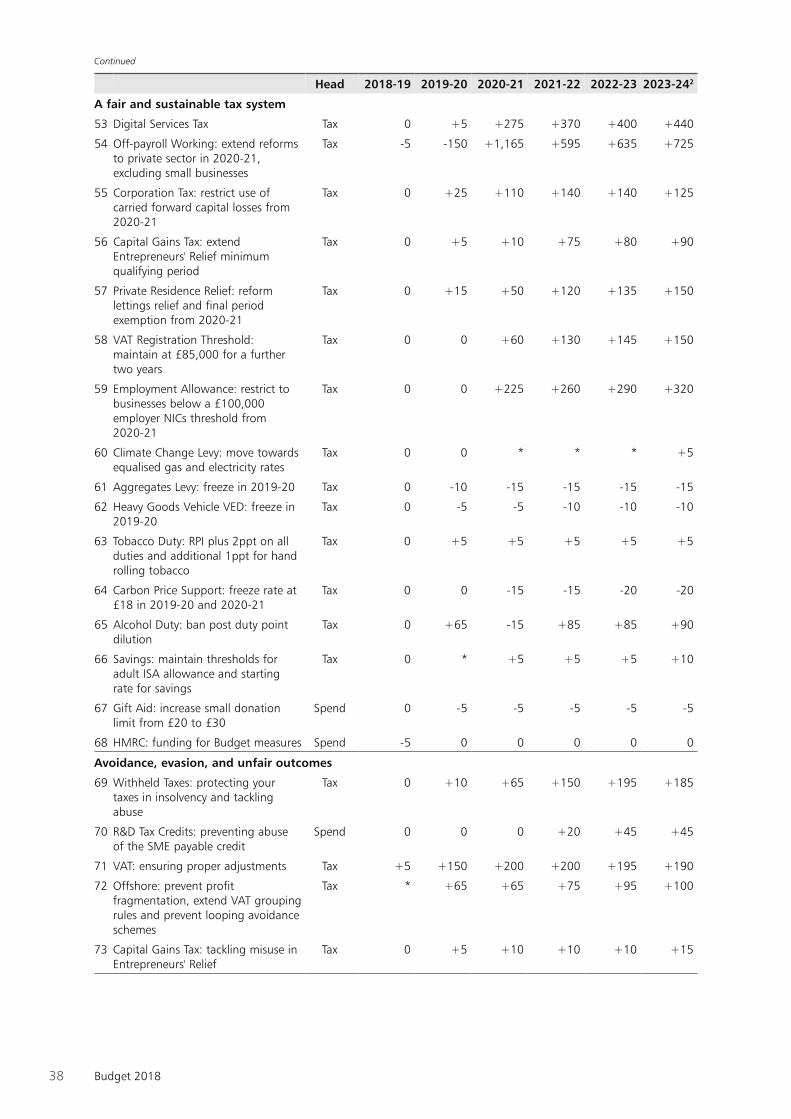
38 Budget 2018
Continued
Head 2018-19 2019-20 2020-21 2021-22 2022-23 2023-242
A fair and sustainable tax system
53 Digital Services Tax Tax 0 +5 +275 +370 +400 +440
54 Off-payroll Working: extend reforms Tax -5 -150 +1,165 +595 +635 +725to private sector in 2020-21, excluding small businesses
55 Corporation Tax: restrict use of Tax 0 +25 +110 +140 +140 +125carried forward capital losses from 2020-21
56 Capital Gains Tax: extend Tax 0 +5 +10 +75 +80 +90Entrepreneurs' Relief minimum qualifying period
57 Private Residence Relief: reform Tax 0 +15 +50 +120 +135 +150lettings relief and final period exemption from 2020-21
58 VAT Registration Threshold: Tax 0 0 +60 +130 +145 +150maintain at £85,000 for a further two years
59 Employment Allowance: restrict to Tax 0 0 +225 +260 +290 +320businesses below a £100,000 employer NICs threshold from 2020-21
60 Climate Change Levy: move towards Tax 0 0 * * * +5equalised gas and electricity rates
61 Aggregates Levy: freeze in 2019-20 Tax 0 -10 -15 -15 -15 -15
62 Heavy Goods Vehicle VED: freeze in Tax 0 -5 -5 -10 -10 -102019-20
63 Tobacco Duty: RPI plus 2ppt on all Tax 0 +5 +5 +5 +5 +5duties and additional 1ppt for hand rolling tobacco
64 Carbon Price Support: freeze rate at Tax 0 0 -15 -15 -20 -20£18 in 2019-20 and 2020-21
65 Alcohol Duty: ban post duty point Tax 0 +65 -15 +85 +85 +90dilution
66 Savings: maintain thresholds for Tax 0 * +5 +5 +5 +10adult ISA allowance and starting rate for savings
67 Gift Aid: increase small donation Spend 0 -5 -5 -5 -5 -5limit from £20 to £30
68 HMRC: funding for Budget measures Spend -5 0 0 0 0 0
Avoidance, evasion, and unfair outcomes
69 Withheld Taxes: protecting your Tax 0 +10 +65 +150 +195 +185taxes in insolvency and tackling abuse
70 R&D Tax Credits: preventing abuse Spend 0 0 0 +20 +45 +45of the SME payable credit
71 VAT: ensuring proper adjustments Tax +5 +150 +200 +200 +195 +190
72 Offshore: prevent profit Tax * +65 +65 +75 +95 +100fragmentation, extend VAT grouping rules and prevent looping avoidance schemes
73 Capital Gains Tax: tackling misuse in Tax 0 +5 +10 +10 +10 +15Entrepreneurs' Relief
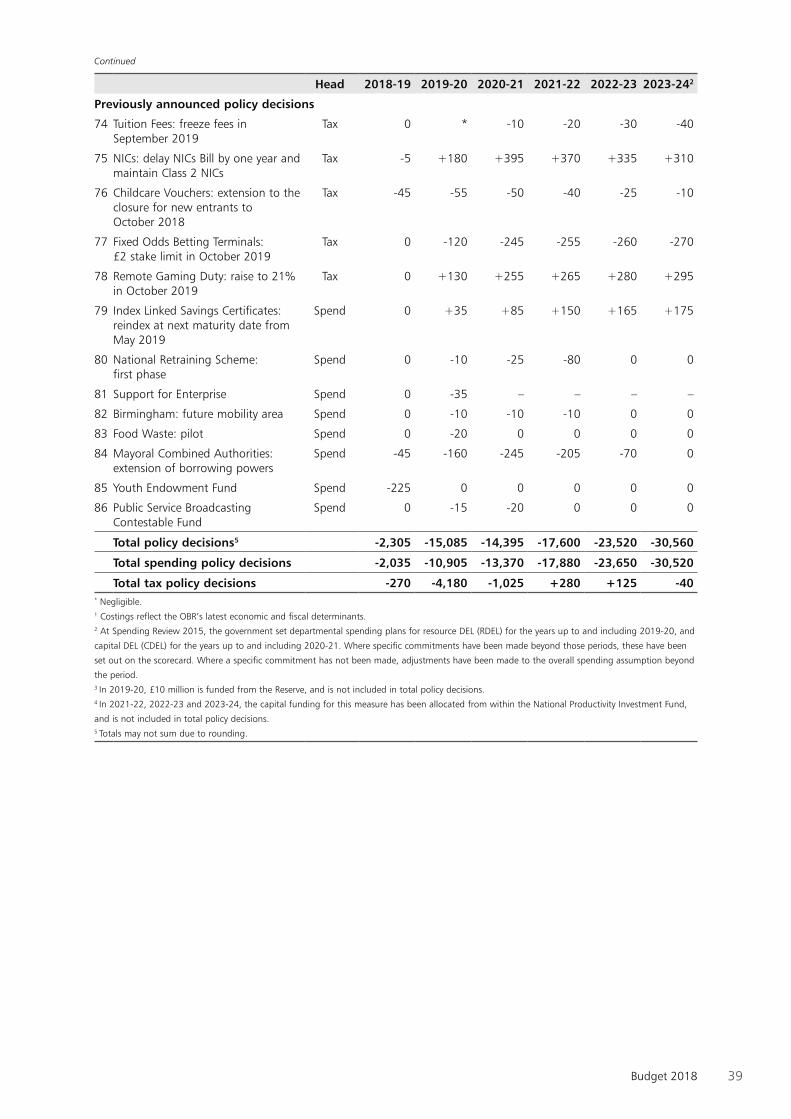
39Budget 2018
Continued
Head 2018-19 2019-20 2020-21 2021-22 2022-23 2023-242
Previously announced policy decisions
74 Tuition Fees: freeze fees in September 2019
Tax 0 * -10 -20 -30 -40
75 NICs: delay NICs Bill by one year and maintain Class 2 NICs
Tax -5 +180 +395 +370 +335 +310
76 Childcare Vouchers: extension to the closure for new entrants to October 2018
Tax -45 -55 -50 -40 -25 -10
77 Fixed Odds Betting Terminals: £2 stake limit in October 2019
Tax 0 -120 -245 -255 -260 -270
78 Remote Gaming Duty: raise to 21% in October 2019
Tax 0 +130 +255 +265 +280 +295
79 Index Linked Savings Certificates: reindex at next maturity date from May 2019
Spend 0 +35 +85 +150 +165 +175
80 National Retraining Scheme: first phase
Spend 0 -10 -25 -80 0 0
81 Support for Enterprise Spend 0 -35 – – – –
82 Birmingham: future mobility area Spend 0 -10 -10 -10 0 0
83 Food Waste: pilot Spend 0 -20 0 0 0 0
84 Mayoral Combined Authorities: extension of borrowing powers
Spend -45 -160 -245 -205 -70 0
85 Youth Endowment Fund Spend -225 0 0 0 0 0
86 Public Service Broadcasting Contestable Fund
Spend 0 -15 -20 0 0 0
Total policy decisions5 -2,305 -15,085 -14,395 -17,600 -23,520 -30,560
Total spending policy decisions -2,035 -10,905 -13,370 -17,880 -23,650 -30,520
Total tax policy decisions -270 -4,180 -1,025 +280 +125 -40* Negligible.1 Costings reflect the OBR’s latest economic and fiscal determinants.2 At Spending Review 2015, the government set departmental spending plans for resource DEL (RDEL) for the years up to and including 2019-20, and
capital DEL (CDEL) for the years up to and including 2020-21. Where specific commitments have been made beyond those periods, these have been
set out on the scorecard. Where a specific commitment has not been made, adjustments have been made to the overall spending assumption beyond
the period. 3 In 2019-20, £10 million is funded from the Reserve, and is not included in total policy decisions.4 In 2021-22, 2022-23 and 2023-24, the capital funding for this measure has been allocated from within the National Productivity Investment Fund,
and is not included in total policy decisions.5 Totals may not sum due to rounding.

239
Table B.1: Measures announced at Spring Budget 2017 or earlier that will take effect from December 2017 or later (£ million)a
Head 2017-18 2018-19 2019-20 2020-21 2021-22 2022-23
Measures announced at Spring Budget 2017
a Making Tax Digital:
one year deferral
for businesses with
turnover below VAT
threshold
Tax -105 +100 * * * *
b Stamp Duty Land
Tax: delay
reduction in
payment window
to 2018-19
Tax 0 0 -5 -5 -5 -5
c Packaging
Recycling Targets:
set rates for 2018-
20
Tax 0 +55 +150 +175 +150 +65
d Tax Credit Debt:
enhanced collection
Tax * -5 +820 +770 +850 +945
e Dividend
Allowance: reduce
to £2,000 from
April 2018
Tax -105 +100 * * * *
Measures announced at Autumn Statement 2016
f Company Car Tax:
reforms to
incentivise ULEVs
Tax 0 0 0 -45 -115 -75
g Offshore Tax: close
loopholes and
improve reporting
Tax +15 +30 +15 +60 +85 +85
h HMRC:
administration and
operational
measures
Tax -20 +45 +165 +210 +185 +190
i Money Service
Businesses: bulk
data gathering
Tax 0 +5 +10 +10 +15 +15
Measures announced at Budget 2016
j Public Service
Pensions: update to
discount rate
Spend 0 0 +2040 +2090 +2130 +2165
k Soft Drinks Industry
Levy
Tax 0 +275 +275 +275 +275 +275
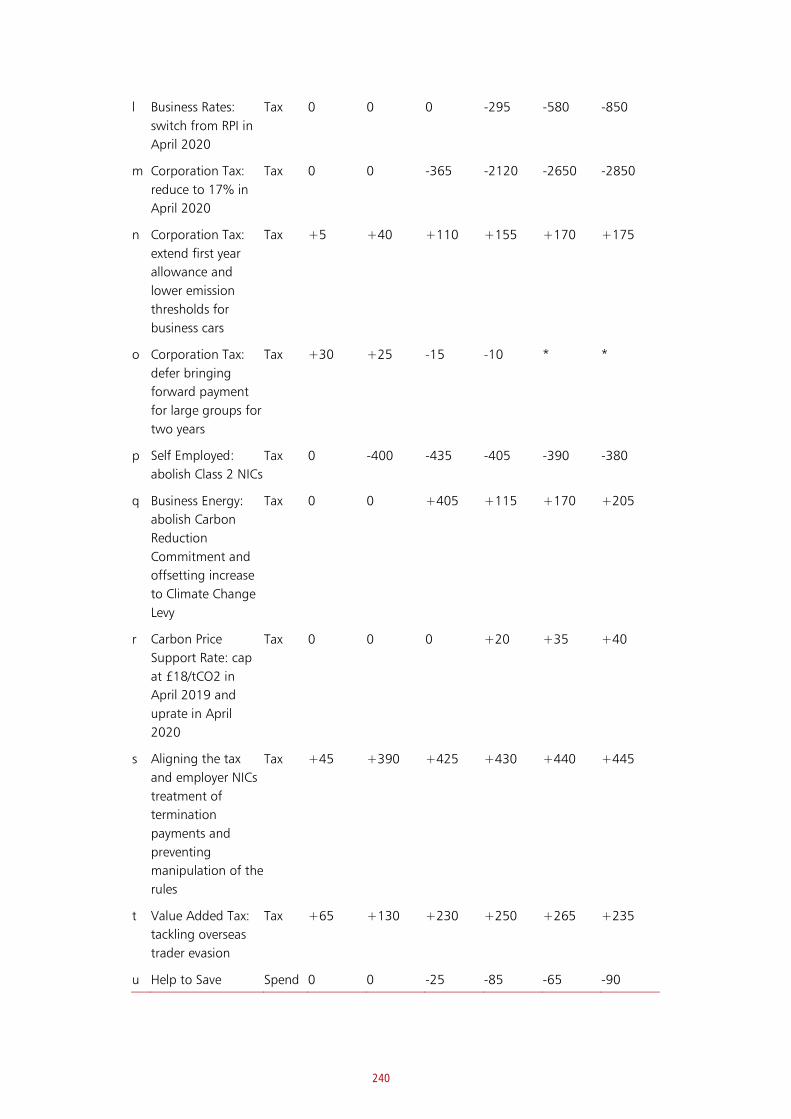
240
l Business Rates:
switch from RPI in
April 2020
Tax 0 0 0 -295 -580 -850
m Corporation Tax:
reduce to 17% in
April 2020
Tax 0 0 -365 -2120 -2650 -2850
n Corporation Tax:
extend first year
allowance and
lower emission
thresholds for
business cars
Tax +5 +40 +110 +155 +170 +175
o Corporation Tax:
defer bringing
forward payment
for large groups for
two years
Tax +30 +25 -15 -10 * *
p Self Employed:
abolish Class 2 NICs
Tax 0 -400 -435 -405 -390 -380
q Business Energy:
abolish Carbon
Reduction
Commitment and
offsetting increase
to Climate Change
Levy
Tax 0 0 +405 +115 +170 +205
r Carbon Price
Support Rate: cap
at £18/tCO2 in
April 2019 and
uprate in April
2020
Tax 0 0 0 +20 +35 +40
s Aligning the tax
and employer NICs
treatment of
termination
payments and
preventing
manipulation of the
rules
Tax +45 +390 +425 +430 +440 +445
t Value Added Tax:
tackling overseas
trader evasion
Tax +65 +130 +230 +250 +265 +235
u Help to Save Spend 0 0 -25 -85 -65 -90
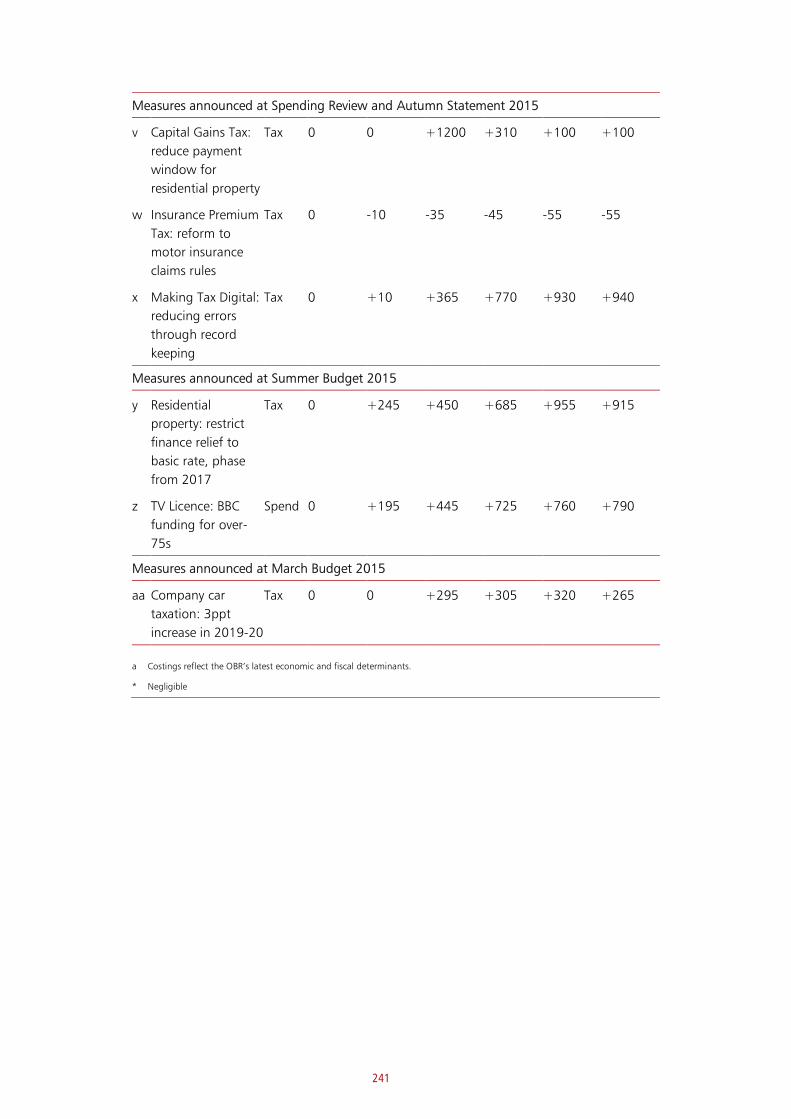
241
Measures announced at Spending Review and Autumn Statement 2015
v Capital Gains Tax:
reduce payment
window for
residential property
Tax 0 0 +1200 +310 +100 +100
w Insurance Premium
Tax: reform to
motor insurance
claims rules
Tax 0 -10 -35 -45 -55 -55
x Making Tax Digital:
reducing errors
through record
keeping
Tax 0 +10 +365 +770 +930 +940
Measures announced at Summer Budget 2015
y Residential
property: restrict
finance relief to
basic rate, phase
from 2017
Tax 0 +245 +450 +685 +955 +915
z TV Licence: BBC
funding for over-
75s
Spend 0 +195 +445 +725 +760 +790
Measures announced at March Budget 2015
aa Company car
taxation: 3ppt
increase in 2019-20
Tax 0 0 +295 +305 +320 +265
a Costings reflect the OBR’s latest economic and fiscal determinants.
* Negligible
242
Annex C
Supplementary data tables
Information in these tables these tables is consistent with the OBR’s March 2019
‘Economic and fiscal outlook’ (EFO) and supplementary tables, unless otherwise
noted. The OBR’s supplementary tables are available at
http://budgetresponsibility.org.uk/efo/economic-fiscal-outlook-march-2018/. Any
HM Treasury calculations are derived from and consistent with published sources.
Further details of outturn statistics drawn from Budget 2018 or EFO can be found in
the data sources documents on the HMT and OBR websites respectively.
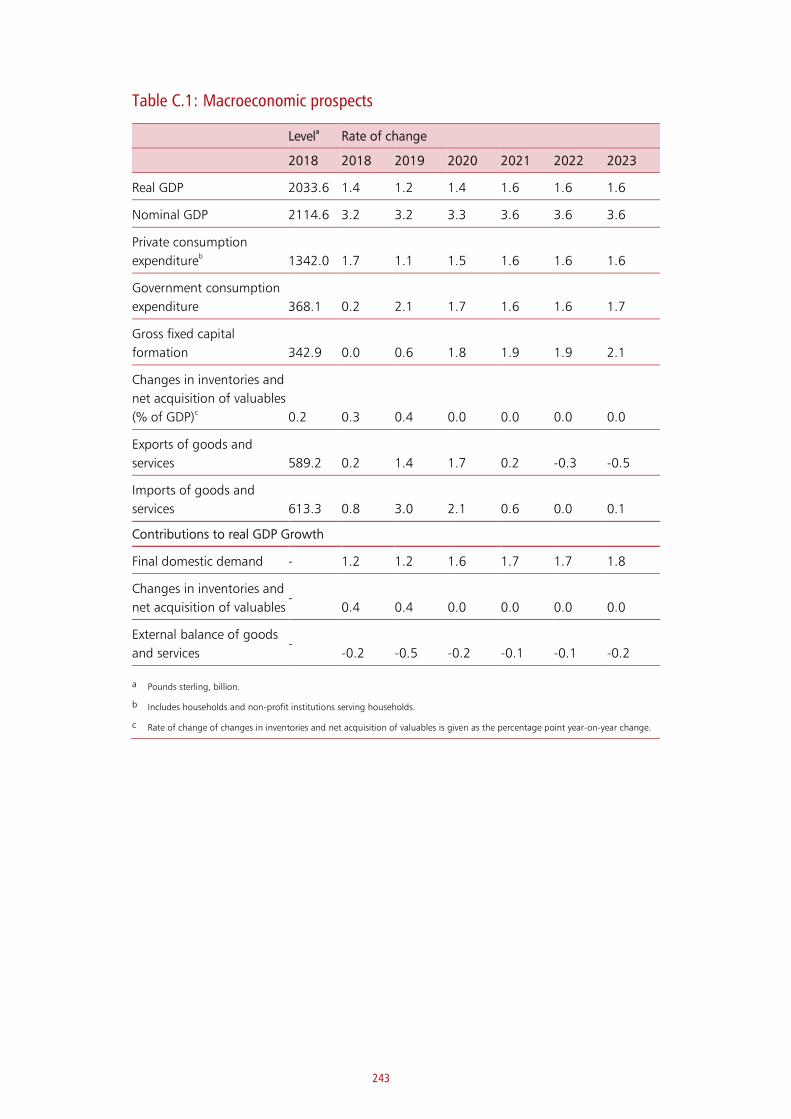
243
Table C.1: Macroeconomic prospects
Levela Rate of change
2018 2018 2019 2020 2021 2022 2023
Real GDP 2033.6 1.4 1.2 1.4 1.6 1.6 1.6
Nominal GDP 2114.6 3.2 3.2 3.3 3.6 3.6 3.6
Private consumption
expenditureb 1342.0 1.7 1.1 1.5 1.6 1.6 1.6
Government consumption
expenditure 368.1 0.2 2.1 1.7 1.6 1.6 1.7
Gross fixed capital
formation 342.9 0.0 0.6 1.8 1.9 1.9 2.1
Changes in inventories and
net acquisition of valuables
(% of GDP)c 0.2 0.3 0.4 0.0 0.0 0.0 0.0
Exports of goods and
services 589.2 0.2 1.4 1.7 0.2 -0.3 -0.5
Imports of goods and
services 613.3 0.8 3.0 2.1 0.6 0.0 0.1
Contributions to real GDP Growth
Final domestic demand - 1.2 1.2 1.6 1.7 1.7 1.8
Changes in inventories and
net acquisition of valuables -
0.4 0.4 0.0 0.0 0.0 0.0
External balance of goods
and services -
-0.2 -0.5 -0.2 -0.1 -0.1 -0.2
a Pounds sterling, billion.
b Includes households and non-profit institutions serving households.
c Rate of change of changes in inventories and net acquisition of valuables is given as the percentage point year-on-year change.
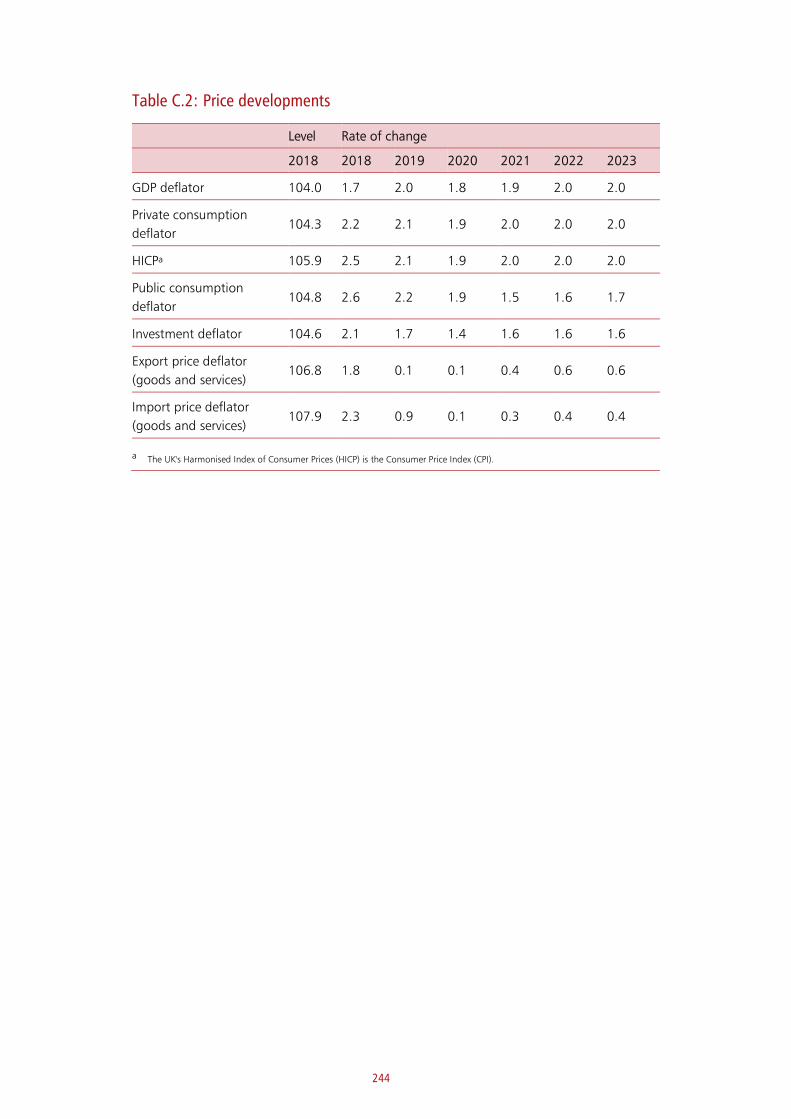
244
Table C.2: Price developments
Level Rate of change
2018 2018 2019 2020 2021 2022 2023
GDP deflator 104.0 1.7 2.0 1.8 1.9 2.0 2.0
Private consumption
deflator 104.3 2.2 2.1 1.9 2.0 2.0 2.0
HICPa 105.9 2.5 2.1 1.9 2.0 2.0 2.0
Public consumption
deflator 104.8 2.6 2.2 1.9 1.5 1.6 1.7
Investment deflator 104.6 2.1 1.7 1.4 1.6 1.6 1.6
Export price deflator
(goods and services) 106.8 1.8 0.1 0.1 0.4 0.6 0.6
Import price deflator
(goods and services) 107.9 2.3 0.9 0.1 0.3 0.4 0.4
a The UK's Harmonised Index of Consumer Prices (HICP) is the Consumer Price Index (CPI).
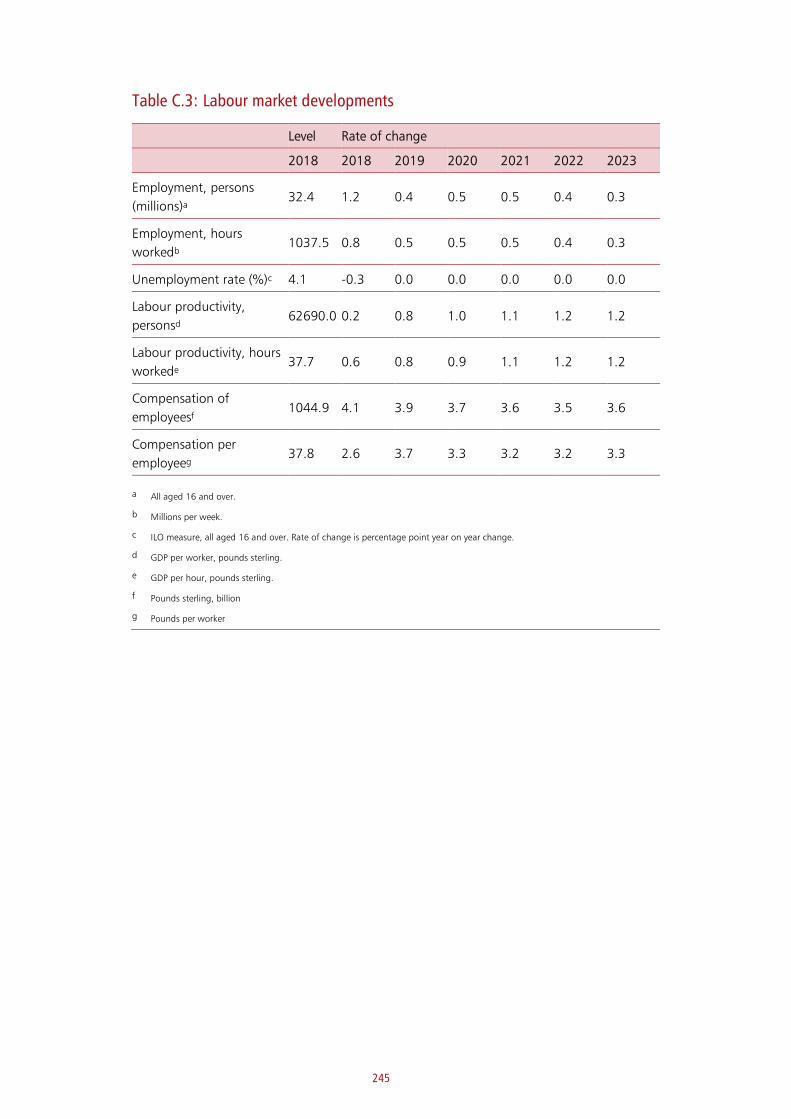
245
Table C.3: Labour market developments
Level Rate of change
2018 2018 2019 2020 2021 2022 2023
Employment, persons
(millions)a 32.4 1.2 0.4 0.5 0.5 0.4 0.3
Employment, hours
workedb 1037.5 0.8 0.5 0.5 0.5 0.4 0.3
Unemployment rate (%)c 4.1 -0.3 0.0 0.0 0.0 0.0 0.0
Labour productivity,
personsd 62690.0 0.2 0.8 1.0 1.1 1.2 1.2
Labour productivity, hours
workede 37.7 0.6 0.8 0.9 1.1 1.2 1.2
Compensation of
employeesf 1044.9 4.1 3.9 3.7 3.6 3.5 3.6
Compensation per
employeeg 37.8 2.6 3.7 3.3 3.2 3.2 3.3
a All aged 16 and over.
b Millions per week.
c ILO measure, all aged 16 and over. Rate of change is percentage point year on year change.
d GDP per worker, pounds sterling.
e GDP per hour, pounds sterling.
f Pounds sterling, billion
g Pounds per worker

246
Table C.4: Sectoral balances
% of GDP 2017-18 2018-19 2019-20 2020-21 2021-22 2022-23 2023-24
Net lending/borrowing
vis-à-vis the rest of the
world
3.5 4.8 5.1 5.2 5.0 4.9 4.8
of which:
- Balance on goods
and services -1.1 -1.8 -2.2 -2.3 -2.3 -2.3 -2.4
- Balance of primary
incomes and transfers -2.4 -2.9 -2.8 -2.7 -2.6 -2.5 -2.4
- Capital account 0.1 0.1 0.1 0.1 0.1 0.1 0.1
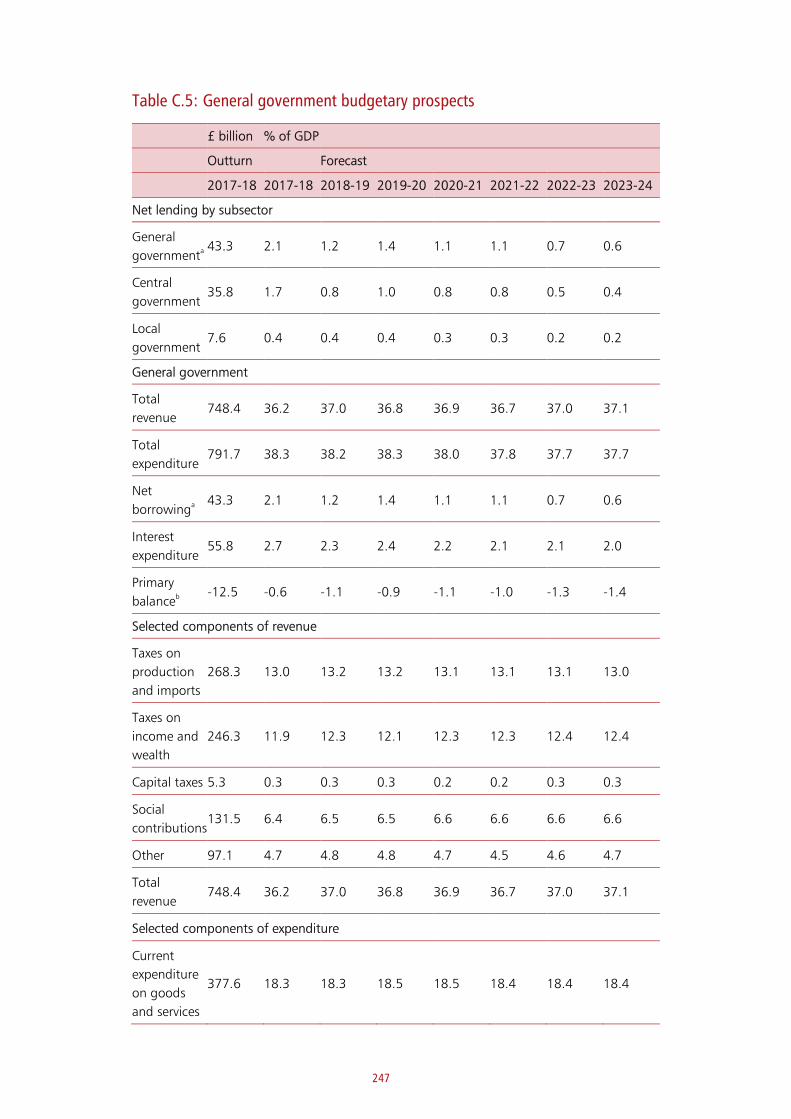
247
Table C.5: General government budgetary prospects
£ billion % of GDP
Outturn Forecast
2017-18 2017-18 2018-19 2019-20 2020-21 2021-22 2022-23 2023-24
Net lending by subsector
General
governmenta 43.3 2.1 1.2 1.4 1.1 1.1 0.7 0.6
Central
government 35.8 1.7 0.8 1.0 0.8 0.8 0.5 0.4
Local
government 7.6 0.4 0.4 0.4 0.3 0.3 0.2 0.2
General government
Total
revenue 748.4 36.2 37.0 36.8 36.9 36.7 37.0 37.1
Total
expenditure 791.7 38.3 38.2 38.3 38.0 37.8 37.7 37.7
Net
borrowinga
43.3 2.1 1.2 1.4 1.1 1.1 0.7 0.6
Interest
expenditure 55.8 2.7 2.3 2.4 2.2 2.1 2.1 2.0
Primary
balanceb
-12.5 -0.6 -1.1 -0.9 -1.1 -1.0 -1.3 -1.4
Selected components of revenue
Taxes on
production
and imports
268.3 13.0 13.2 13.2 13.1 13.1 13.1 13.0
Taxes on
income and
wealth
246.3 11.9 12.3 12.1 12.3 12.3 12.4 12.4
Capital taxes 5.3 0.3 0.3 0.3 0.2 0.2 0.3 0.3
Social
contributions 131.5 6.4 6.5 6.5 6.6 6.6 6.6 6.6
Other 97.1 4.7 4.8 4.8 4.7 4.5 4.6 4.7
Total
revenue 748.4 36.2 37.0 36.8 36.9 36.7 37.0 37.1
Selected components of expenditure
Current
expenditure
on goods
and services
377.6 18.3 18.3 18.5 18.5 18.4 18.4 18.4
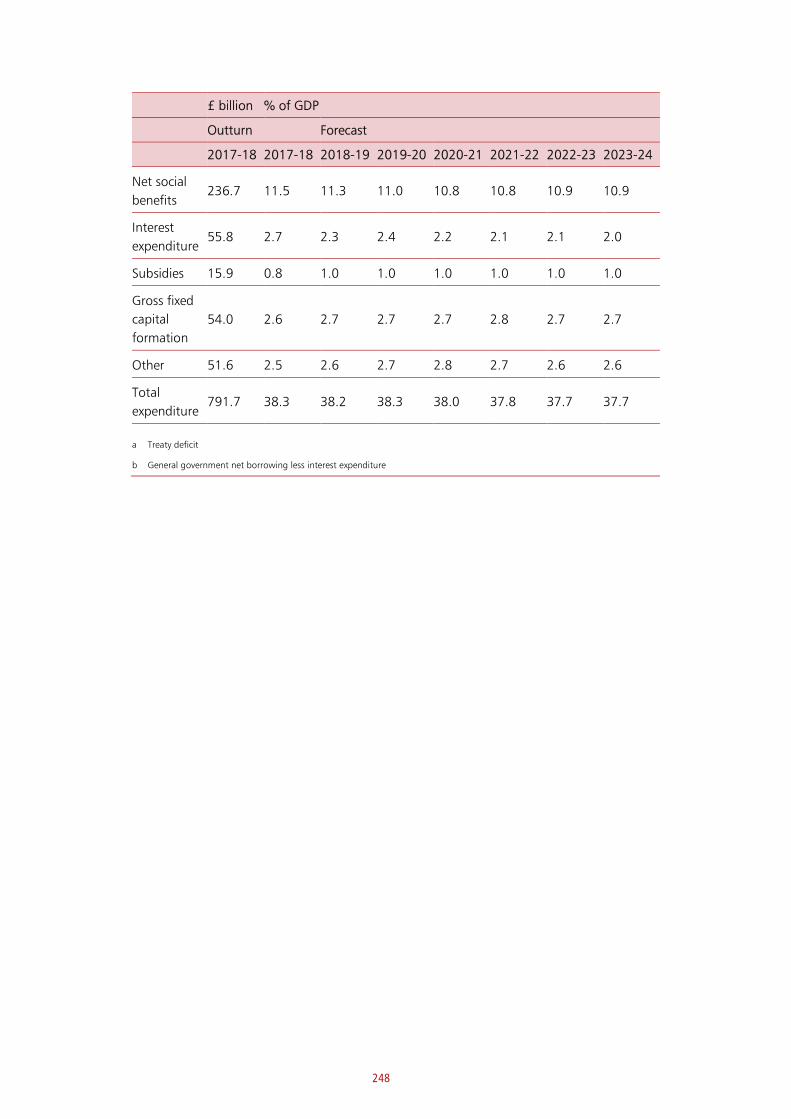
248
£ billion % of GDP
Outturn Forecast
2017-18 2017-18 2018-19 2019-20 2020-21 2021-22 2022-23 2023-24
Net social
benefits 236.7 11.5 11.3 11.0 10.8 10.8 10.9 10.9
Interest
expenditure 55.8 2.7 2.3 2.4 2.2 2.1 2.1 2.0
Subsidies 15.9 0.8 1.0 1.0 1.0 1.0 1.0 1.0
Gross fixed
capital
formation
54.0 2.6 2.7 2.7 2.7 2.8 2.7 2.7
Other 51.6 2.5 2.6 2.7 2.8 2.7 2.6 2.6
Total
expenditure 791.7 38.3 38.2 38.3 38.0 37.8 37.7 37.7
a Treaty deficit
b General government net borrowing less interest expenditure
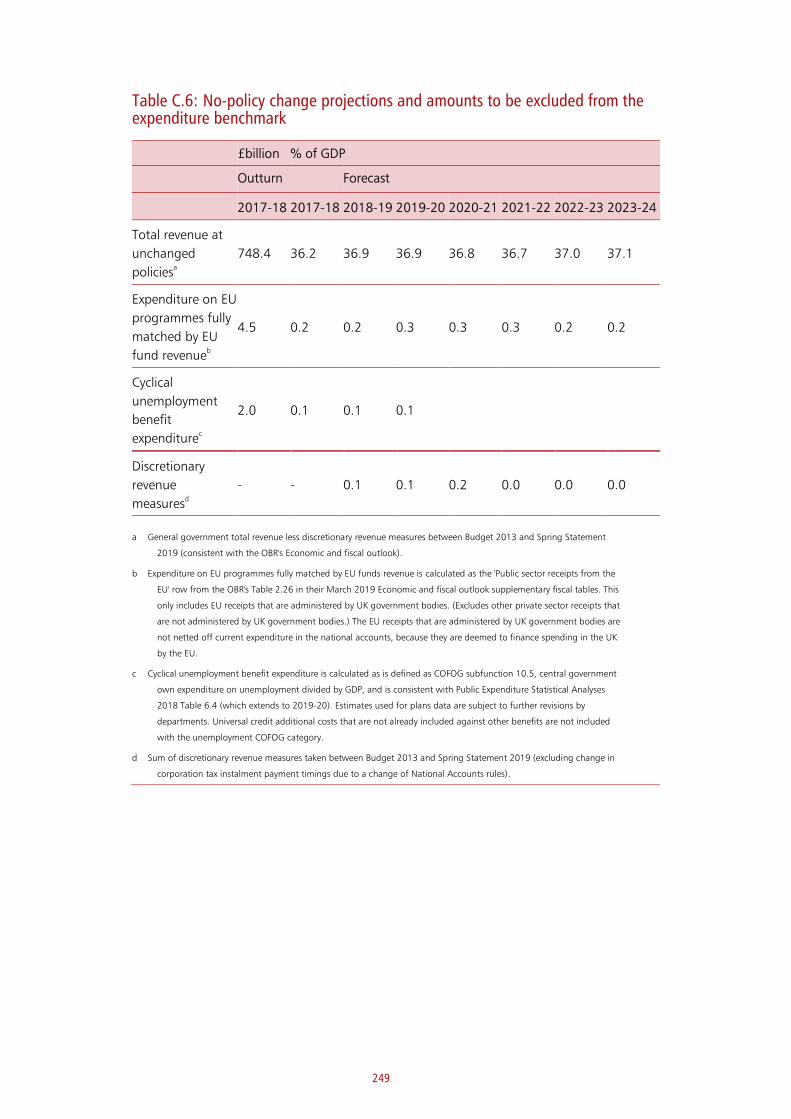
249
Table C.6: No-policy change projections and amounts to be excluded from the expenditure benchmark
£billion % of GDP
Outturn Forecast
2017-18 2017-18 2018-19 2019-20 2020-21 2021-22 2022-23 2023-24
Total revenue at
unchanged
policiesa
748.4 36.2 36.9 36.9 36.8 36.7 37.0 37.1
Expenditure on EU
programmes fully
matched by EU
fund revenueb
4.5 0.2 0.2 0.3 0.3 0.3 0.2 0.2
Cyclical
unemployment
benefit
expenditurec
2.0 0.1 0.1 0.1
Discretionary
revenue
measuresd
- - 0.1 0.1 0.2 0.0 0.0 0.0
a General government total revenue less discretionary revenue measures between Budget 2013 and Spring Statement
2019 (consistent with the OBR's Economic and fiscal outlook).
b Expenditure on EU programmes fully matched by EU funds revenue is calculated as the 'Public sector receipts from the
EU' row from the OBR's Table 2.26 in their March 2019 Economic and fiscal outlook supplementary fiscal tables. This
only includes EU receipts that are administered by UK government bodies. (Excludes other private sector receipts that
are not administered by UK government bodies.) The EU receipts that are administered by UK government bodies are
not netted off current expenditure in the national accounts, because they are deemed to finance spending in the UK
by the EU.
c Cyclical unemployment benefit expenditure is calculated as is defined as COFOG subfunction 10.5, central government
own expenditure on unemployment divided by GDP, and is consistent with Public Expenditure Statistical Analyses
2018 Table 6.4 (which extends to 2019-20). Estimates used for plans data are subject to further revisions by
departments. Universal credit additional costs that are not already included against other benefits are not included
with the unemployment COFOG category.
d Sum of discretionary revenue measures taken between Budget 2013 and Spring Statement 2019 (excluding change in
corporation tax instalment payment timings due to a change of National Accounts rules).

250
Table C.7: Central government expenditure by functiona,b,c
% of GDP
2016-17 2019-20
General public services 3.4 3.2
Defence, public order and
safety 2.7 2.5
Economic affairs 1.8 2.1
Environmental protection 0.2 0.2
Housing and community
amenities 0.1 0.2
Health 7.0 6.8
Recreation, culture and
religion 0.4 0.3
Education 2.0 1.9
Social protection 10.5 10.2
Total expenditured 29.7 29.6
a Spending data used consistent with Public Expenditure Statistical Analyses (PESA) 2018, HM Treasury July 2018.
b Central government data taken from PESA 2018 Table 6.4 (which extends to 2019-20)
c Percentage of GDP calculations consistent with March 2019 EFO
d Total expenditure is more than just the sum of the functions, it also includes EU transactions and accounting
adjustments

251
Table C.8: General government debt developments
% of GDP
Outturn Forecast
2017-18 2018-19 2019-20 2020-21 2021-22 2022-23 2023-24
Gross debta 85.3 85.5 83.8 82.9 82.2 81.1 80.0
Change in gross
debt ratio -1.1 0.2 -1.7 -0.9 -0.7 -1.0 -1.1
Contributions to changes in gross debt
Primary balanceb 0.6 1.1 0.9 1.1 1.0 1.3 1.4
Interest expenditure 2.7 2.3 2.4 2.2 2.1 2.1 2.0
Stock-flow
adjustmentc
0.0 1.5 -0.5 0.7 1.1 1.1 1.1
Implicit interest rate
on debtd
3.2 2.8 2.9 2.7 2.7 2.6 2.6
a Treaty debt
b General government net borrowing less interest expenditure
c Change in Treaty debt less general government net borrowing
d Interest expenditure as a percentage of Treaty debt in previous year

252
Table C.9: Cyclical developments
% of GDP
Outturn Forecast
2017-18 2018-19 2019-20 2020-21 2021-22 2022-23 2023-24
Net
borrowing of
general
government
2.1 1.2 1.4 1.1 1.1 0.7 0.6
Interest
expenditure 2.7 2.3 2.4 2.2 2.1 2.1 2.0
Output gap 0.1 0.2 -0.1 -0.2 -0.1 0.0 0.0
Cyclical
budgetary
componenta
0.0 -0.1 0.0 0.1 0.1 0.0 0.0
Cyclically-
adjusted
balance
-2.1 -1.3 -1.4 -1.0 -1.0 -0.7 -0.6
Cyclically-
adjusted
primary
balanceb
0.6 1.0 1.0 1.2 1.1 1.4 1.4
Outturn Forecast
2017 2018 2019 2020 2021 2022 2023
Real GDP
growth (%)c 1.8 1.4 1.2 1.4 1.6 1.6 1.6
Potential
GDP growth
(%)c
1.7 1.2 1.5 1.5 1.6 1.6 1.6
a Treaty deficit less cyclically adjusted treaty deficit
b Cyclically-adjusted treaty deficit less interest expenditure
c Growth in real GDP and growth in potential GDP are expressed in calendar rather than financial years and are
calculated on a non-oil basis.
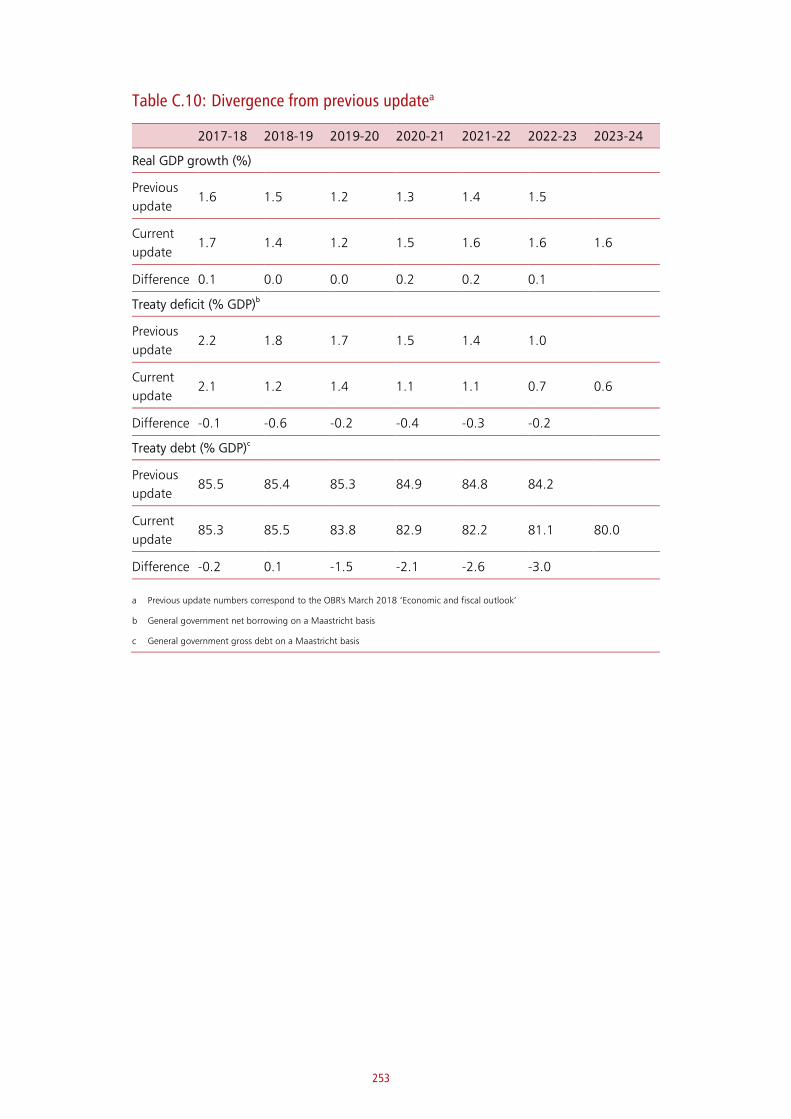
253
Table C.10: Divergence from previous updatea
2017-18 2018-19 2019-20 2020-21 2021-22 2022-23 2023-24
Real GDP growth (%)
Previous
update 1.6 1.5 1.2 1.3 1.4 1.5
Current
update 1.7 1.4 1.2 1.5 1.6 1.6 1.6
Difference 0.1 0.0 0.0 0.2 0.2 0.1
Treaty deficit (% GDP)b
Previous
update 2.2 1.8 1.7 1.5 1.4 1.0
Current
update 2.1 1.2 1.4 1.1 1.1 0.7 0.6
Difference -0.1 -0.6 -0.2 -0.4 -0.3 -0.2
Treaty debt (% GDP)c
Previous
update 85.5 85.4 85.3 84.9 84.8 84.2
Current
update 85.3 85.5 83.8 82.9 82.2 81.1 80.0
Difference -0.2 0.1 -1.5 -2.1 -2.6 -3.0
a Previous update numbers correspond to the OBR's March 2018 ‘Economic and fiscal outlook’
b General government net borrowing on a Maastricht basis
c General government gross debt on a Maastricht basis

254
Table C.11: Long-term sustainability of public financesa
% of GDP
Outturn Forecasts/Projections
2017-18 2018-19 2020-21 2030-31 2040-41 2050-51 2060-61
Total
expenditure 38.8 38.4 38.6 40.3 44.4 49.2 54.2
Of which:
age-related
expendituresb 20.5 20.5 20.6 22.4 24.7 26.7 28.4
State
pensions 5.1 5.0 4.9 5.3 6.0 6.5 6.8
Pensioner
benefits 0.8 0.8 0.8 0.9 1.1 1.3 1.3
Public service
pensions 2.0 2.0 2.1 2.0 1.8 1.6 1.6
Health 7.1 7.1 7.4 8.8 10.3 11.7 13.0
Long-term
care 1.2 1.2 1.2 1.4 1.6 1.8 1.9
Education 4.3 4.3 4.2 4.0 3.8 3.8 3.8
Net interest 1.8 1.6 1.5 1.5 3.2 5.7 8.9
Total
revenue 36.6 36.7 36.8 37.0 37.3 37.4 37.5
a Consistent with the central projection in the OBR's July 2018 Fiscal sustainability report
b Sum of pensions, pensioner benefits, public service pensions, health, long-term care and education
Table C.12: Contingent liabilitiesa
£ billion 2015-16 2016-17
Total quantifiable contingent
liabilities 104.3 84.0
Of which: financial stability
interventionsb
0.3 0.3
a Taken from Whole of Governments Accounts- year ended 31 March 2017, HM Treasury, 2018
b As this is not reported in the latest Whole of Governments Accounts publication, figures are taken from HM Treasury
annual report and accounts 2017-18
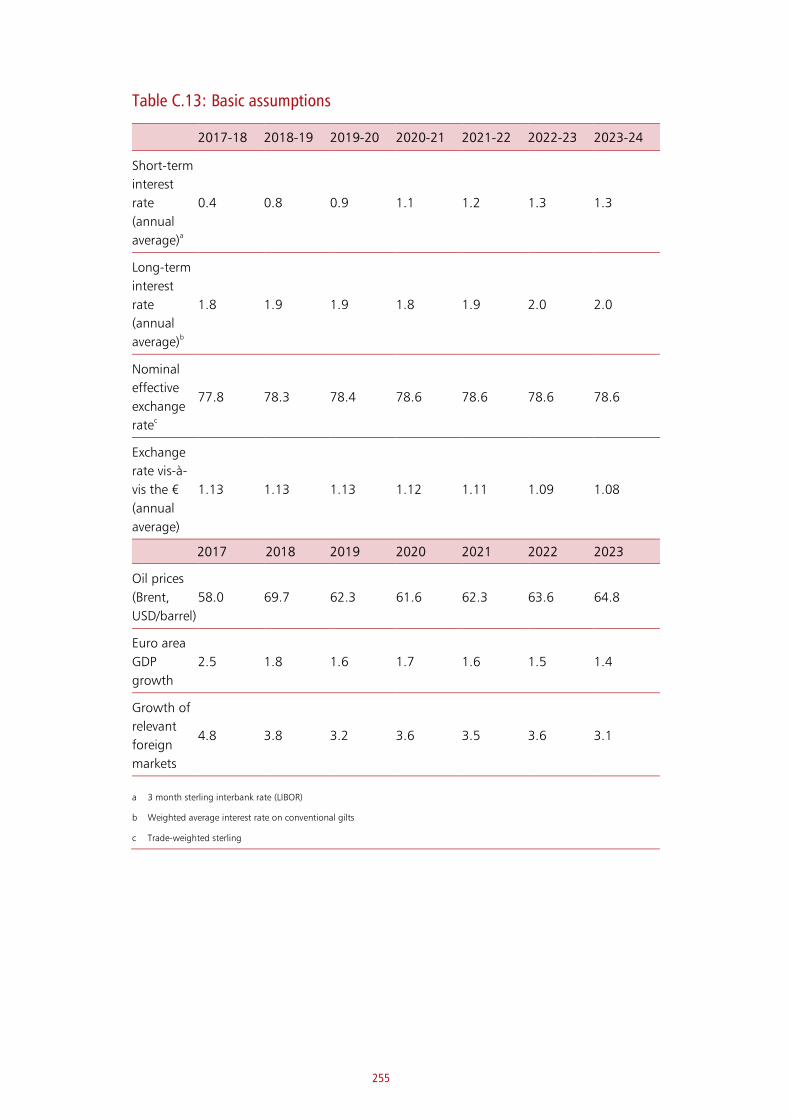
255
Table C.13: Basic assumptions
2017-18 2018-19 2019-20 2020-21 2021-22 2022-23 2023-24
Short-term
interest
rate
(annual
average)a
0.4 0.8 0.9 1.1 1.2 1.3 1.3
Long-term
interest
rate
(annual
average)b
1.8 1.9 1.9 1.8 1.9 2.0 2.0
Nominal
effective
exchange
ratec
77.8 78.3 78.4 78.6 78.6 78.6 78.6
Exchange
rate vis-à-
vis the €
(annual
average)
1.13 1.13 1.13 1.12 1.11 1.09 1.08
2017 2018 2019 2020 2021 2022 2023
Oil prices
(Brent,
USD/barrel)
58.0 69.7 62.3 61.6 62.3 63.6 64.8
Euro area
GDP
growth
2.5 1.8 1.6 1.7 1.6 1.5 1.4
Growth of
relevant
foreign
markets
4.8 3.8 3.2 3.6 3.5 3.6 3.1
a 3 month sterling interbank rate (LIBOR)
b Weighted average interest rate on conventional gilts
c Trade-weighted sterling


HM Treasury contacts
This document can be downloaded from www.gov.uk
If you require this information in an alternative format or have general enquiries about HM Treasury and its work, contact:
Correspondence Team HM Treasury 1 Horse Guards Road London SW1A 2HQ
Tel: 020 7270 5000
Email: [email protected]