w, - california institute of technologyauthors.library.caltech.edu/55684/2/basal dislocation...
TRANSCRIPT

ABSTRACT
BASAL DISLOCATION MOBILITY IN ZINC SINGLE CRYSTALS
K. H. Adams*, T. Vreeland, Jr., and D. S. Wood W. M. Keck Laboratory of Engineering Materials
California Institute of Technology Pasadena, California
Experimental measurements .of basal dislocation mobility and the strainrate sensitivity of the flow stress have been made on 99.999% pure zinc single crystals. Dislocation mobility in the [l2l0] (0001) basal slip system was measured by observing slip band growth produced by load pulses of controlled amplitude and duration. Local rearrangement of dislocations occurs at a resolved stress of 7 lb/in2 . Slip bands are formed at stresses greater than 7 lb/in2, and their growth velocities are in the range of 7 to 80 em/sec for sh~ar stresses between 7 and 12 lb/in2. The results of th~ experimental measurements of dislocation mobility are discussed in relation to current theories . A comparison of the strain-rate sensitivity and the mobility measurements shows that a significant change in the density of moving dislocation~ is associ- ~ted with a change in strain-rate. This change in density has generally been ignored by previous investigators. A dislocation model is proposed to explain th~ obser~strain-rate sensitivity .
·, Introduction
The stress dependence of the mobility of dislocations has been clearly
established for a variety of b.c.c. metal, ionic and semiconducting crystals by
various investigators. Etch pit methods have been used to establish the mobil-/ t-- 2 ~ s-_
ity rel.ation for 3. 25% silicon-iron W, tungsten ~, LiF .(-3), NaCl (M, Si {-57, ,5, Co .
and Ge ~. No direct determinations of dislocation mobility in bulk size
crystals of f . c.c . or h.c.p. metals have been reported. A basic understanding
* Present Address: Department of Mechanical Engineering, Tulane University, New Orleans, Louisiana,
-
~of the dynamic stress-strain behavior of f.c.c. and h.c.p. metals will be
achieved when dislocation mobility studies have been conducted on these classes
of metals.
The direct determination of dislocation velocity by etch pit techniques is
very tedious and requires a reliable etching technique for revealing disloca
tions in every material of interest. Since reliable techniques are not avail
able for many materials, there is a great need for indirect experiments which
can be used to deduce the stress dependence of the dislocation mobility.
Guard (7) has suggested a method for determining the stress dependence of the
dislocation mobility by an indirect test. The plastic strain-rate, Y , of a p
crystalline solid is a function of the density of moving dislocations Pm , the
Burgers vector of the dislocations, b, ' and the average dislocation velocity, v,
through the relation
Pm bv ( 1)
Therefore, the power dependence of the dislocation velocity is related to the
strain-rate sensitivity of the flow stress, O ln ,. I o ln Yp, by the relation
0 ln 'e 0 ln p 0 ln v ( 2) m + 0 ln ,. 0 ln T 0 ln 'T
where the power dependence of the dislocation velocity or mobility exponent is
equal to o ln v I o ln 'T. The inverse strain-rate sensitivity will be equal to
the mobility exponent if o ln Pm I o ln ,. is zero. Johnston and Stein (8) have
shown this to be the case for LiF and 3.25% silicon-iron if the inverse strain
rate sensitivity is extrapolated to zero strain. Schadler (2) has shown this
extrapolation procedure to be inaccurate for tungsten. The validity of this
method as applied to other materials has not as yet been established.
This paper describes the results of the direct determination of basal dis
location mobility by etch pit methods and the relation between the mobility ex
ponent and the inverse strain-rate sensitivity in zinc single crystals •
. Exeerimental Procedure
Specimen ereparation
Single crystals were prepared from C.P. grade zinc of 99.999% purity ob
tained from the New Jersey Zinc Company. An analysis of this material furnished
by the supplier indicated the following impurities in wt. %: Pb = 0.0002; Fe=
0.0002; Cd = 0.00005; other< 0.00011. Single crystals were grown by a modified
Bridgeman technique in graphite coated Pyrex molds. Cylindrical single crystals
718 in, in diameter and 8 in. long were grown.
•l /

The 7/8 in. diameter crystals were acid sawed into• sections u s ing 8N HN0 3 on a stainless steel wire. The crystallographic orientation o f e ach section
was found by observation of the orientation and markings on a cleavage surface
of the crystal. Cleaving was done in liquid nitrogen with a n e edle struck by
a light hammer. The cleavage surface established the (0001) basal plane and
cleavage steps, which were found to correspond to twinning traces, were used to
establish the [l2l0] direction in the (0001) plane. These cleavage steps were
probably formed by basal cleavage within twinned material.
Test specimens in the form of 1/2 in . cubes were machined from acid sawed
and cleaved sections with the use of a Servomet Electric Spark Discharge Mach
ine. The spark machining consisted of trepanning and planing operations at
minimum spark energy settings. All spark machining operations were done in oil
at 200° - 210 ° F to prevent cleavage cracks. The damage produced by spark dis
charge machining and the methods used to reduce such damage have been described
by Turner et al (9).
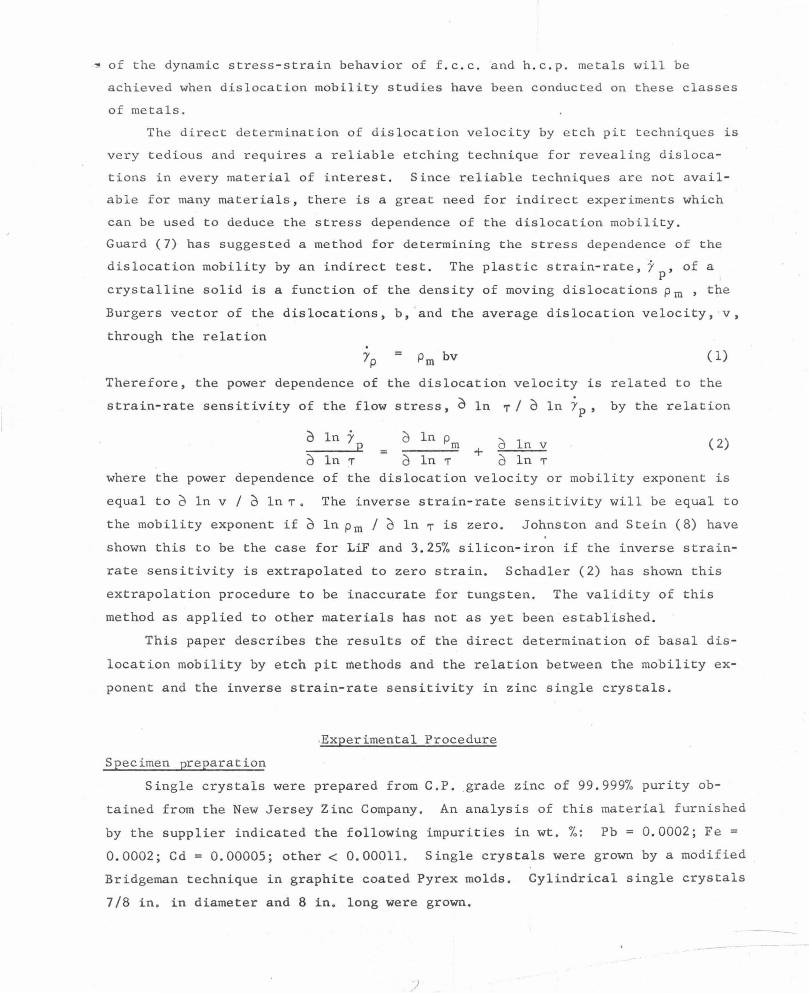
Test specimens with two different orientations of the basal slip plane with
respect to the load axis were used. Figure 1 shows the two orientations of the
specimens, all of which have a set of (lOlO) prism surfaces . The (1010) sur
faces were used to reveal basal dislocations by the etching technique of Brandt
et al ( 10). --The machining operations resulted in specimen surfaces which were parallel
to within 0. 1°. The surface finish achieved by spark planing was of the order
of 10~ in r.m.s. The manner in which the test specimens were machined resulted
in some uncertainty in the orientation of the basal slip system with respect to
the specimen surfaces on which compressive forces were applied during subse
quent testing. This crystallographic uncertainty was sufficiently small to pro
duce a maximum uncertainty in basal resolved shear stress of ± 1% .
Damage to the specimens resulting from the spark machining operations was
removed chemically by polishing off approximately 0.005 in. of material and an
nealing at 700° F in a purified hydrogen atmosphere for 4 to 8 hours . The lo~
ing surfaces were masked with tape during the polishing to retain a flat sur
face .
Velocity measurements
A standard method f or determining dislocation mobility by etch pit tech
niques has been used by many investigators (1, 2, 3, 4, 5, 6). Generally the
method involves scratching a well annealed crystal to introduced fresh unpinned
dislocations in a known region in the vicinity of the scratch. A stress pulse
of known amplitude and duration is then applied. The specimen is re-etched to
'./ j
-
Load Axis [ 0001]
[ izio]
(a) 45° Specimen
Load Axis
[ 0001]
[ 1210]
( '1?) 80 o S pee imen.
FIG. ~
Crystallographic Orientation of Test Specimens .
determine the final location of the dislocations in the scratched region and
a dislocation velocity is computed from the measured dislocation displacement
and time duration of the pulse test. The successful use of this standard
method usually requires that only dislocations induced by the scratch move
during the application of the load and that dislocation displacements produced
are small compared to the average distance between grown-in dislocations so
that the fres h dislocations can be differentiated from the background disloca
tion density.
The standard method was us e d in the present investigation with some minor
variations and additions. In most .cases, however, pulse tests were conducted
without the introduction of fresh dislocations prior to the test. The reason
fo r this will be discussed subsequently.
Each specimen was etched prior to a pulse test and after the introduction
of intentional damage, if any, and replicas were made of the etched surfaces to
record the initial dislocation density and configuration on (lOlO) prism sur
faces of the specimen. Replicas were made using a replication solut i on ob tainrl
from Ladd Industries and 0 . 005 in . thick cellulose acetate film. The transpar
ent replicas were subsequently coated with a vapor deposited layer of aluminum
at vacuum pressures of less than 5 x 10⁻⁵ mrn of Hg. An optically opaque film
of aluminum was sufficiently reflective for optical examination with a metal
lurgical microscope and was not so thick as to obscure details on the replicas
at magnifications less than 500X.
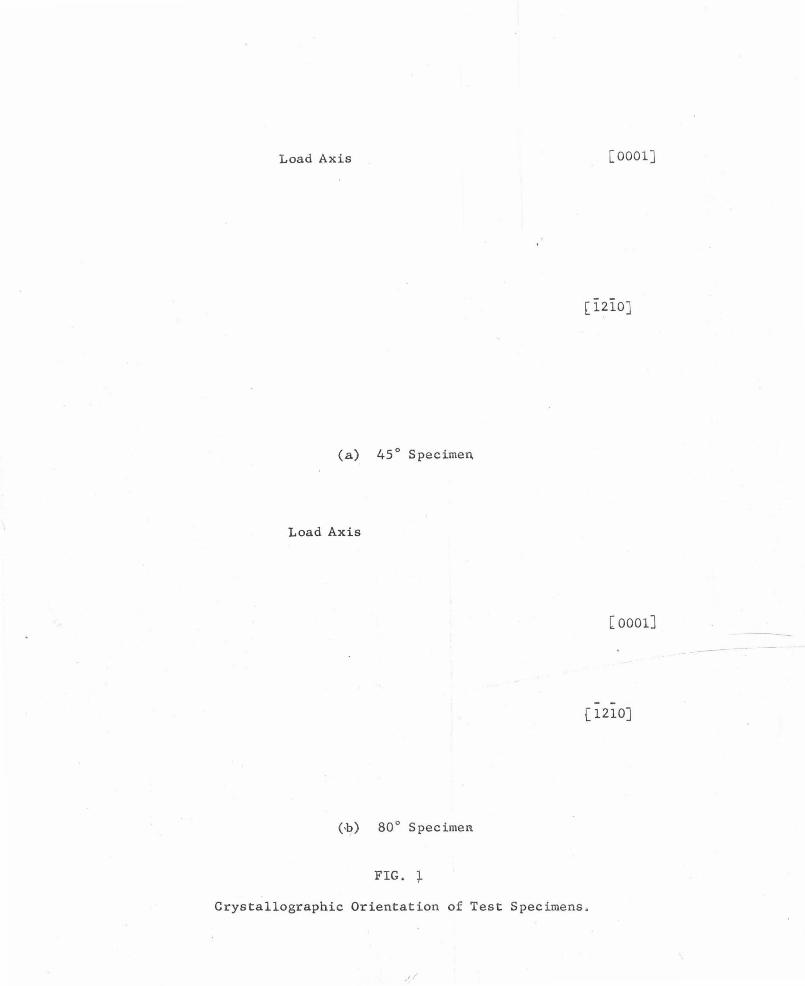
Figure 2 illustrates the damage produced on a (lOlO) prism surface by two
scratches with a diamond phonograph stylus with a contact load of 1.25g .
. ·.-:-· ..
' '
FIG. 2
;. ·-Prism surface of test specimen prior to pulse testing shown
damage produced by two scratches. Line indicates [i2iO] direction Magnification XlOO.
/
Fig. 2 is a photomicrograph of a replica taken prior to testing. The back
ground density of dislocations in Fig. 2 is generally representative of the
density found in all the as-grown, annealed specimens used in this investiga-
tion.
Afte r pulse testing, the specimens were re-etched and again replicated.
The elapsed time between test and re-etch was usually limited to less than 3
min to minimize dislocation rearrangement . Mercury introduced during the in
itial etch was sufficient to cause etch pits to form during the second e tch (1~.
The number of pulse tests that could be conducted before the specimen had to
be annealed was determined by the amount of deformation or increase in disloca
tion density produced in a series of tests and by the conditions of the (lOiO)
specimen surfaces after several re-etching operations. In several cases, as
many as twenty pulse tests were conducted on a specimen before high tempera
ture annealing was required because tQe dislocation density had reached too high
a level.
Before annealing specimens which had been previously etched, a vacuum
treatment was required to remove the mercury from the surfaces. Specimens were - 6 -5
placed in a vacuum of 10 to 10 mm of Hg for 8 h for this purpose. Subse-
quent annealing was carried out in a purified hydrogen atmosphere at 700° F for
4 to 8 h. This annealing procedure was also used after each strain-rate sensi
tivity test to return the specimen to as near its original pretes~ condition as
possible.
The pulse load tests were carried out using a special compression test f ix
ture in the rapid load tensile testing machine of Russell et al (11). The test
ing equipment was capable of applying constant amplitude load pulses with a rise
time of 2 msec and a minimum duration of 17 msec. Records of load vs time were
obtained with a Consolidated Electrodynamics oscillograph using a four leg dyna
mometer bridge of high output silicon filament strain gages obtained from Micro
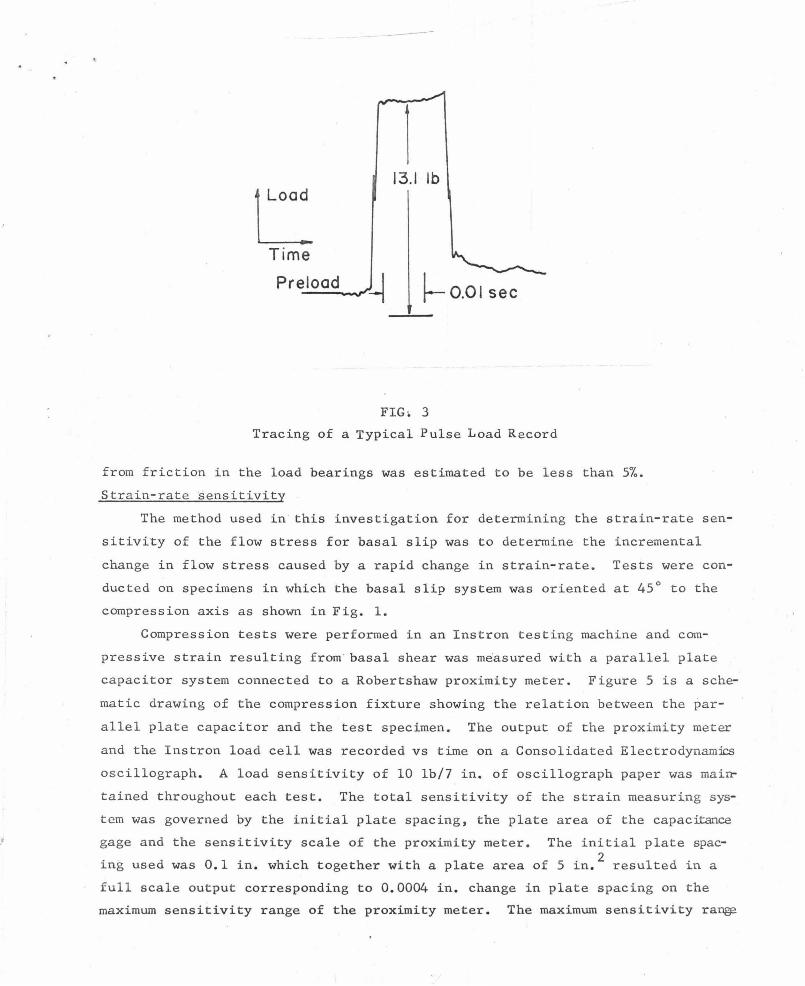
systems, Inc. An example of a typical load pulse is given in Fig. 3.
The compression fixture used in connection with a rapid load machine, as
shown schematically in Fig. 4, as· a self-aligning system of spherical seats sup
ported by air pressure. The air bearing feature minimizes alignment errors due
to friction between the bearing surfaces and hence reduces the error produce d
when the load axis is off the centroid of the specimen. In addition, a shee t
of 0.001 in. teflon was used between the loading surfaces of the specimen and
the spherical seats to reduce friction and the effect of surface irregularities.
The combined uncertainty in basal resolved shear stress caused by crystallo
graphic orientation uncertainty, specimen alignment error and errors resulting
1 Loa~ Time
Preload
---
13.1 lb
l-o.OI sec
FIG~ 3
Tracing of a Typical Pulse Load Record
from friction in the load bearings was estimated to be less than 5%.
Strain-rate sensitivity
The method used in this investigation for determining the strain-rate sen
sitivity of the flow stress for basal slip was to determine the incremental
change in flow stress caused by a rapid change in strain-rate. Tests were con
ducted on specimens in which the basal slip system was oriented at 45° to the
compression axis as shown in Fig. 1.
Compression tests were performed in an Instron testing machine and com
pressive strain resulting from · basal shear was measured with a parallel plate
capacitor system connected to a Robertshaw proximity meter. Figure 5 is a sche
matic drawing of the compression fixture showing the relation between the par
allel plate capacitor and the test specimen. The output of the proximity meter
and the Instron load cell was recorded vs time on a Consolidated Electrodynam~
oscillograph. A load sensitivity of 10 lb/7 in. of oscillograph paper was mai~
tained throughout each test. The total sensitivity of the strain measuri.ng sys
tem was governed by the initial plate spacing, the plate area of the capac~ce
gage and the sensitivity scale of the proximity meter. The initial plate spac
ing used was 0.1 in. which together with a plate area of 5 in.2
resulted in a
full scale output corresponding to 0.0004 in. change in plate spacing on the
maximum sensitivity range of the proximity meter. The maximum sensitivity ra~

f Load
---Yoke
Air
l
-+-~1--------+--f..../ Specimen
J-----+--+- Sleeve
Seat
Air
FIG. · 4 -
Schematic of Compression Fixture For Rapid Load Machine

Ball Seat
--
Seat
Capacitor Plate
Positive Capacitor Plate, 5 in~ Area
Specimen 0.001 in. Tef I on, Top
...,.....,.......r"'T""7'...,....,~~'*r""T'7""'7"-:~ and 8 otto m of
FIG. 5
Specimen
Base on Centering Pin
Schematic of Test Fixture For Strain-Rate Sensitivity Tests
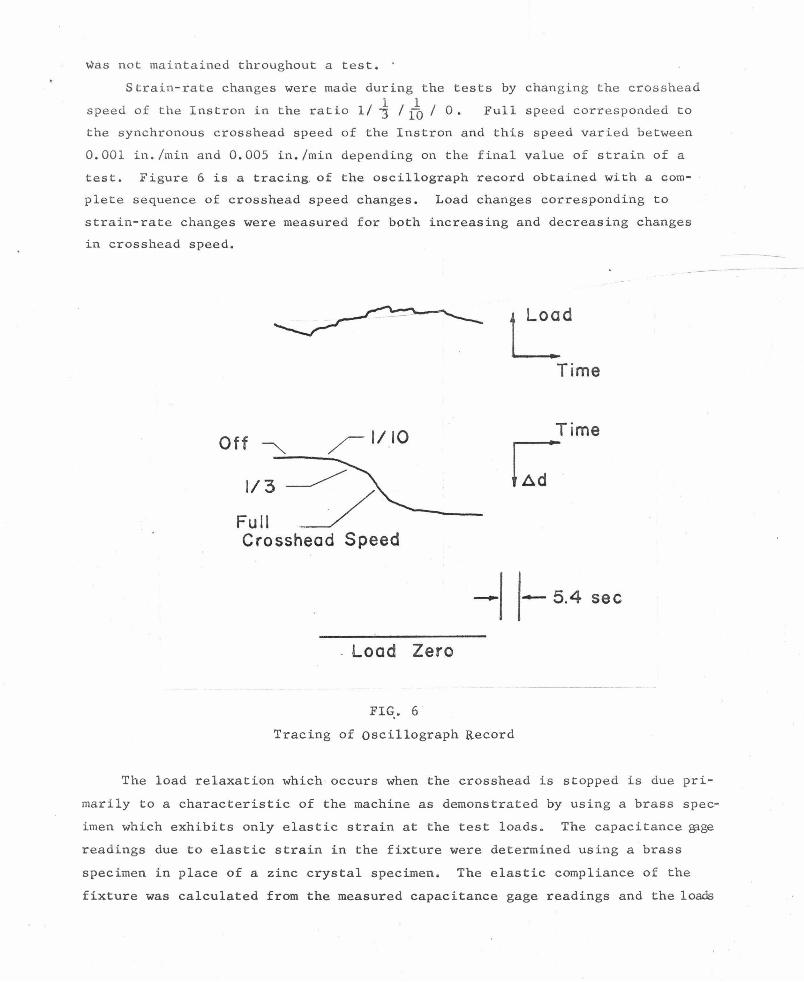
was not maintained throughout a test. ·
Strain -rate changes wer~ made during the tests by chang ing the crosshead
speed of the Instron in the ratio 11 j I fo I 0. Full speed corresp onded to
the synchronous crosshead speed of the Instron and this speed varied between
0.001 in.lmin and 0.005 in.lmin depending on the final value of strain of a
test. Figure 6 is a tracing. of the oscillograph record obtained with a com
plete sequence of crosshead speed changes. Load changes corresponding to
strain-rate changes were measured for both increasing and decreasing changes
in crosshead speed.
Off~ /1/10 ~--.;...,__
~
_/ 1/3
Time
c Full Crosshead Speed
--5.4 sec
. Load Zero
FIG .• 6
Tracing of oscillograph Record
The load relaxation which occurs when the crosshead is stopped is due pri
marily to a characteristic of the machine as demonstrated by using a brass spec
imen which exhibits only elastic strain at the test loads . The capacitance ~ge
readings due to elastic strain in the fixture were determined using a brass
specimen in place of a zinc crystal specimen. The elastic compliance of the
fixture was calculated from the measured capacitance gage readings and the lo~

applied to the brass specimen. The measured elastic compliance and the compl~
ance of the load cell were used to estimate the errors involved in assuming tte
crosshead speed ratios were equal to the corresponding plastic strain-rate
ratios in tests on zinc single crystals. This was a more accurate means of es
timating the errors than measuring strain-rates directly because the load sen
sitivity of the system was relatively much greater than the strain sensitivity.
The relation between the compressive plastic strain-rate ratio, ~l I €p2
, and
the crosshead speeds, y, is given by
. yl - CT Ll
y2 - CT L2
. where L is the load rate and CT is the total elastic compliance of the system
including both ball seats, the load cell and the specimen. For basal strain
rate tests, the maximum error in assuming
yl . Y2
was found to be less than 5%, so no correction for elastic strai~ of the system
was made in the analysis of the records.
---Experimental Results
Velocity measurements
Pulse tests performed at resolved shear stresses up to 19 lb/in.2
and for
durations of from 17 msec to 1 sec gave information from which the basal dis
location mobility is deduced. The following general observations were made in
these tests:
(1) Stress pulses of amplitude less than 7 lb/in. 2
produced no increase
in dislocation density, but some local rearrangement of dislocations was occa
sionally observed.
(2) Stress pulses of amplitude greater than 7 lb/in. 2
produced an incr~ in dislocation density and in particular, the formation of pile-ups was ob
served near sub-boundaries. Dislocation sources within the specimen or at the
surfaces where the load was applied appeared to operate and cause dislocation
pile-ups at the same stress levels that influenced the fresh dislocations pro
duced by scratches. This, in effect, prevented any one-to-one correspondence
of before and after dislocation positions from being made. Long, extended
pile-ups along basal slip plane traces were observed within the shear stress
range of 7 to 19 lb/in.2
Often the length of an individual pile-up against a

•
sub-boundary was much less than the spacing of sub-boundaries, but pile-ups on
adjacent sub-boundaries appeared in the same slip plane trace. These pile-ups
generally extended to at least one specimen edge and could often be traced a-·
cross the entire specimen. In several tests, dislocation pile-ups, which ap
peared to lie on a single plane, were observed on opposite (lOlO) surfaces of
the test specimen. This indicates that dislocations moved a distance equal to
the width of the specimen (~ in . ) in the direction normal to the slip vector
during the period of the load pulse.
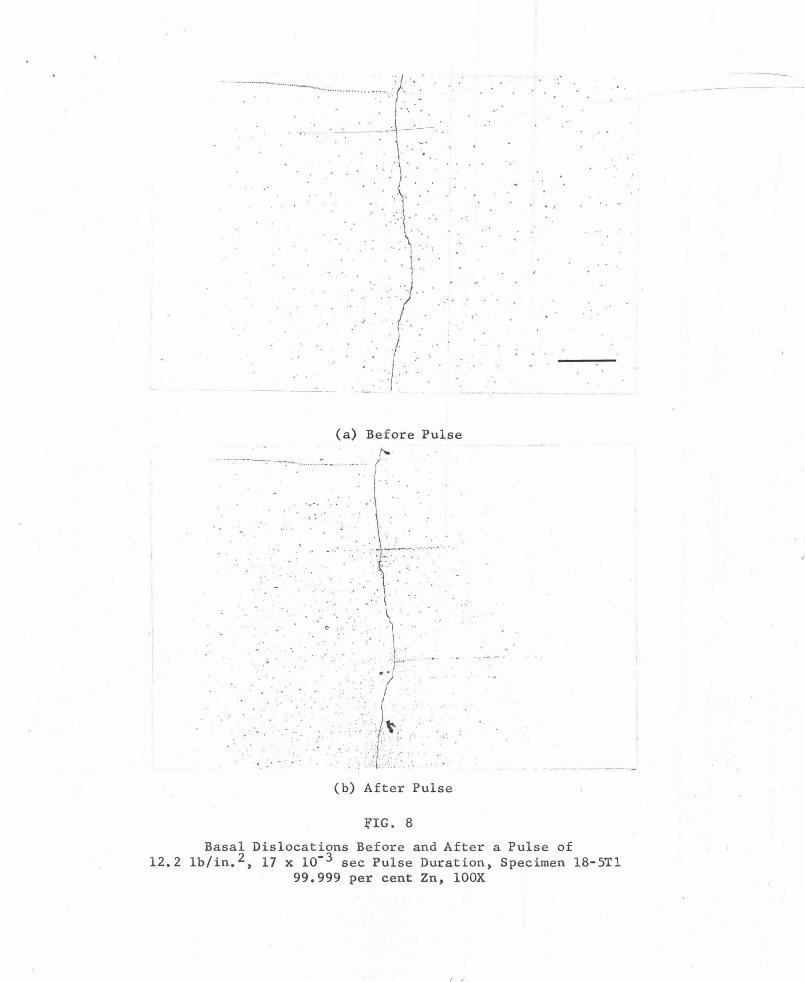
Typical areas showing the dislocation structure before a load pulse, and
the pile- ups observed after a load pulse, are shown in Fig. 7 and 8. The long
pile-ups in Fig. 7 extend across the entire specimen.
(3) The number of pile-ups , and the density of dislocations increase as
the stress pulse amplitude is increased.
(4) Break-up of some of the substructure is observed at stresses above
approximately 15 lb/in. 2
which is the macroscopic yield strength of 99.999%
zinc single crystals (12) (see Fig. 7).
The distance along the slip plane from the edge of the specimen to the
furthest sub-boundary which exhibited a pile-up was assumed to be the distance
traversed by the leading dislocation in the pile- up. The velocity of the lead
ing dislocation was taken to be the distance moved divided by the pulse dura
tion. The results of a series of pulse tests are presented in Table I where T
is the resolved shear stress and v is dislocation velocity. Log velocity has
been plotted vs log resolved shear stress in Fig. 9. Points labelled with a
caret (A) are measurements on pile- up lengths that extended across the entire
specimen face and hence are to be regarded as lower limits for the velocity at
the corresponding stress level. The points in Fig. 9 without a caret represent
pile-up lengths that extended £rom a load surface into the specimen. Each
point represents the maximum velocity calculated for a given test and hence in
volves the maximum length of all the observed dislocation pile-ups.
Figure 9 shows a considerable scatter in the experimental data. Astr~t
line has been drawn through the points representing the maximum bbserved veloc
ity for a given stress level. The straight line indicates that the date can be ---represented by an empirical power function relation of the form:
(3)
where T is the applied shear stress, n 5 and T equals the shear stress coro
responding to a velocity of 1 em/sec and is 5 lb/in.2
• Several sources of er-
ror existed that may explain the scatter observed, One of the uncertainties
--
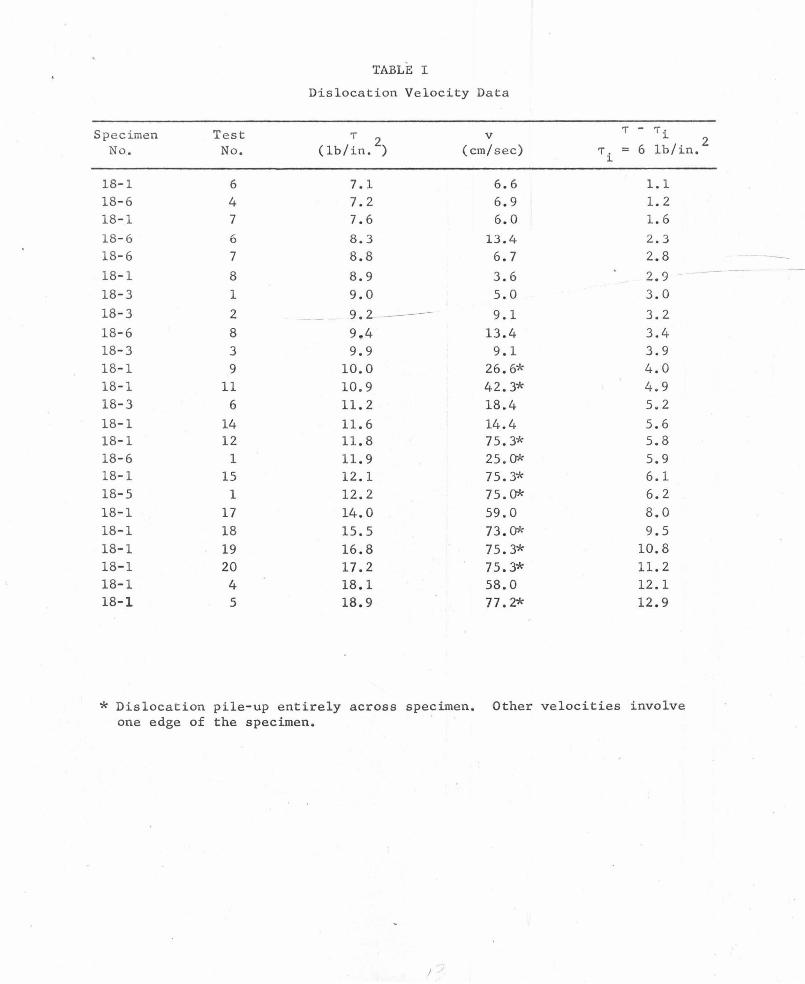
TABLE I
Dislocation Velocity Data
Spe cimen Test 'T 2 v 'T - 'Ti No. No. (lb/in. ) (em/ sec) 'T. 6 lb/in.
~
18-1 6 7.1 6.6 1.1 18-6 4 7.2 6.9 1.2 18-l 7 7.6 6.0 1.6 18-6 6 8.3 13.4 2.3 18-6 7 8.8 6.7 2.8 18-1 8 8.9 3.6 2.9 18-3 1 9.0 5.0 3.0 18-3 2 9.2 -- 9.1 3.2 18-6 8 9~4 13.4 3.4 18-3 3 9.9 9.1 3.9 18-1 9 10.0 26. 6* 4.0 18-l 11 10.9 42. 3* 4.9 18-3 6 ll. 2 18.4 5.2 18-1 14 ll. 6 14 .4 5.6 18-1 12 ll. 8 75. 3* 5.8 18-6 1 11.9 25. 0* 5.9 18-l 15 12 .1 75. 3* 6.1 18-5 1 12.2 75. 0* 6.2 18-1 17 14.0 59.0 8.0 18-1 18 15.5 73. 0* 9.5 18-l 19 16.8 75.3* 10.8 18-l 20 17.2 75. 3* ll. 2 18-l 4 18.1 58.0 12.1 18-1 5 18 .9 77. 2* 12.9
* Dislocation pile-up entirely across specimen. Other velocities involve one edge of the specimen.
I ,
2

1 •;. ; ..
:0 ": .• •
. ;
· )
I . ~ ; ~-
: ~
£. '( i·
., ... ·· ·.: ..
:\\ '·
·:· ; .~l ! . :. ; . ...
. : .I r .. I T i I
~· . - . i
(a) Before Pulse
FIG. 7
.,_L\ ._./· ......... ··'
; .. .... .. .. ... ..... ....... -r·. ·. .
..
\ y \. ).
Basal Di~locations Before and After a Pulse of 15.4 lb/in. , 45 sec Pulse Duration, Specimen 16-2T2
99.999 per cent Zn, lOOX
· ......
. . . ....... ···-·· .......... -...
· ~ . . --·-- ~ · - : ··-. .. ..
. · . . ·
' .
(a) Before Pulse ,....
': · ..
. . .
(b) After Pulse
fiG. 8
Basal Dislocations Before and After a Pulse of 12.2 lb/in.2, 17 x 10-3 sec Pulse Duration, Specimen 18-STl
99.999 per cent Zn, lOOX
I •

c () 0 Q) - Cl)
o' o E 0 ()
Cl)
0 ~ -0
()
Cl) 0 0 Q)
CD >
80
60
40
20
10
8
6
4
3 4
! ..... _
~~ 0
J. 0 0
0
I
/t ..... 0
/. 0
0
/ 00
I. 0
I 0
..... Edge to Edge
0 Measurement
I I . 6
Resolved 8 10 15 20
Shear Stress_ lb/in~
FIG. 9
Basal Dislocation Velocity vs Resolved Shear Stress
/ '
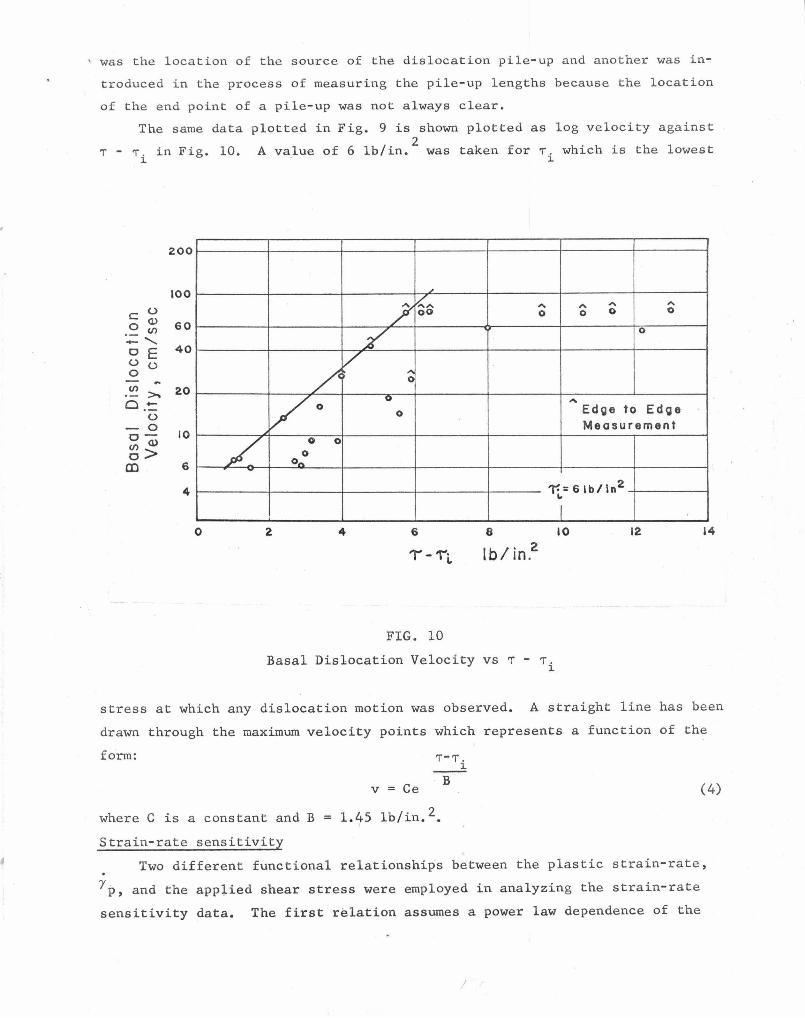
was the location of the source of the dislocation pile-up and another was in
troduced in the process of measuring the pile-up lengths because the location
of the end point of a pile-up was not always clear.
The same data plotted in Fig. 9 is shown plotted as log velocity against
T - T . in Fig. 10. A value o f 6 lb/in. 2
was taken for T . which is the lowest ~ ~
200
100
c (.) 0 <1> 60 ·- IJ) _, o E 40 (.) (.) 0 IJ)
>... 20 0 -(.) -0 o- 10 IJ) <1> o>
CD 6 / 4
0
/ ~,., "' " "' "' oo 0 0 0 0
;/ 0
/ / ~ vo g
"' 0 Edge to Edge Measurement
0 0 0
o ....
1"!= 6lblln2
" I 2 4 8 10
lb/in.2
FIG~ 10
Basal Dislocation Velocity vs T - T. ~
12 14
stress at which any dislocation motion was observed. A straight line has been
drawn through the maximum velocity points which represents a function of the
form:
where C is a constant and B
Strain-rate sensitivity
v = Ce
1.45 lb/in. 2 •
B (4)
Two different functional relationships between the plastic strain-rate,
Yp, and the app~ied shear stress were employed in analyzing the strain-rate
sensitivity data. The first relation assumes a power law dependence of the
I
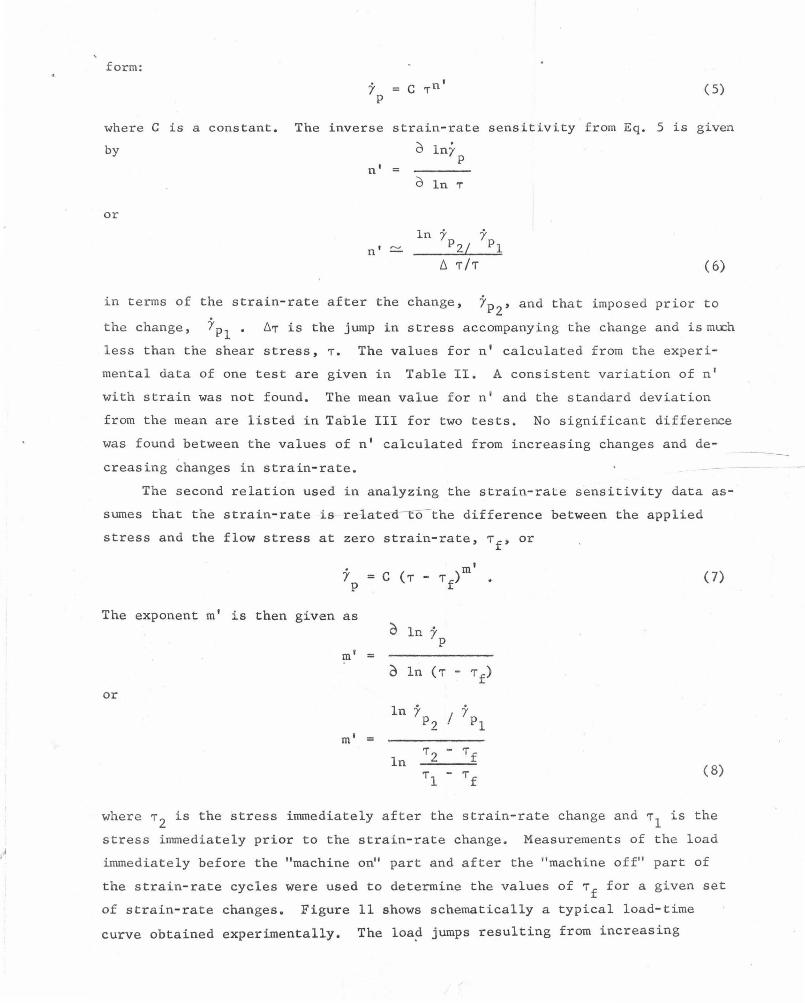
form:
( 5)
where c is a constant. The inverse strain-rate sensitivity from Eq. 5 is given
by 0 lny p n'
d ln '!"
or
ln y yp n' - PzL 1
b. 'f/'f ( 6)
in terms of the strain-rate after the change, Yp2
, and that imposed prior to
the change, Yp1
. ~:::.,.. is the jump in stress accompanying the change and ismoch
less than the shear stress, '!". The values for n' calculated from the experi
mental data of one test are given in Table II. A consistent variation of n'
with strain was not found. The mean value for n' and the standard deviation
from the mean are listed in Table III for two tests. No significant difference
was found between the values of n' calculated from increasing changes and de
creasing changes in strain-rate.
The second relation used in analyzing the strain-rate sensitivity data as
sumes that the strain-rate is relat~d-r:o-the difference between the applied
stress and the flow stress at zero strain-rate, 'ff' or
y p
The exponent m' is then given as
m'
or
m'
C ( T - 'f f) m'
( 7)
0 ln lp
0 ln ( 'f - 'f ) f
ln )'p I )'p 2 1
'f - 'ff ln 2
T - Tf 1 ( 8)
where ,..2
is the stress immediately after the strain-rate change and -r1 is the
stress immediately prior to the strain-rate change. Measurements of the load
immediately before the "machine on" part and after the "machine off" part of
the strain-rate cycles were used to determine the values of Tf for a given set
of strain-rate changes. Figure 11 shows schematically a typical load-time
curve obtained experimentally. The load jumps resulting from increasing
---

TABLE II
Strain-Rate Sensitivity Data, Specimen 16-4, Test 2. Max Crosshead Speed 1 x lo-3 in. /min
'T 2 Yp n' m' (lb/in . ) (%)
14.2 0.01 77 14.4 . 0.015 65 14.5 0.02 47 15.4 0.08 47 2.15 15.6 0.10 76 15.9 0.12 90 16.0 0.13 62 16.2 0.14 49 2.97 16.4 0.15 99 16.5 0.17 76 17.2 0.24 62 1. 98 17.4 0.25 105 1.87 17.4 0.25 79 17.7 0.28 64 18.6 0.36 92 18.7 0.38 57 1. 31 18.8 0.39 77 18.9 0.41 95 19.6 0.50 82 19.8 0.52 77 1. 92 20.0 0.55 97 20.0 0.56 100 20.6 0.63 86 20.7 0.65 94 1. 94 21.0 0.68 75 21.4 0.74 90 21.6 0.77 65 1. 31 21.7 0.78 84 21.8 0.80 78 22.6 0.·91 47 1.45 22.9 0.94 113 2.32 23.0 0.95 62 23.5 1. 02 78 23.6 1. 03 72 1. 81
TABLE III
Summary of Strain-Rate Sensitivity Data, Specimen No. 16 - 4
Test Max Crosshead Speed Final Strain n ' m' No. ( 10-3 in. /min) (%)
2 1 1.03 77 ± 17 1.91 ·± 0.46 !)
3 5 6.3 90 ± 20 2.04 ± 0.30

y=O
Load
Time
FIG~ 11
Schematic of Load vs Time Curve
changes in crosshead speed, y , are shown as 60
, 61
, and 62
• The stress dif
ference ratios are then given as
T - .,.f 6 + 61 2 0
.,. - .,.f 6 1 0
and .,. - .,.f 6 + 61 + 62 3 0
.,. - .,.f 6 + 61 2 0
The values of m' calculated from the experimental data are given in Table II.
Table III gives mean values and standard deviations from the mean for two ~ts.
A consistent variation of m' with strain was not found.
Discussion
Dislocation pile-ups
The great majority of the etch pits which were produced during the pulse
loading tests must have been associated with basal dislocations of predomin
ately edge character in view of the following considerations. The specimens
•
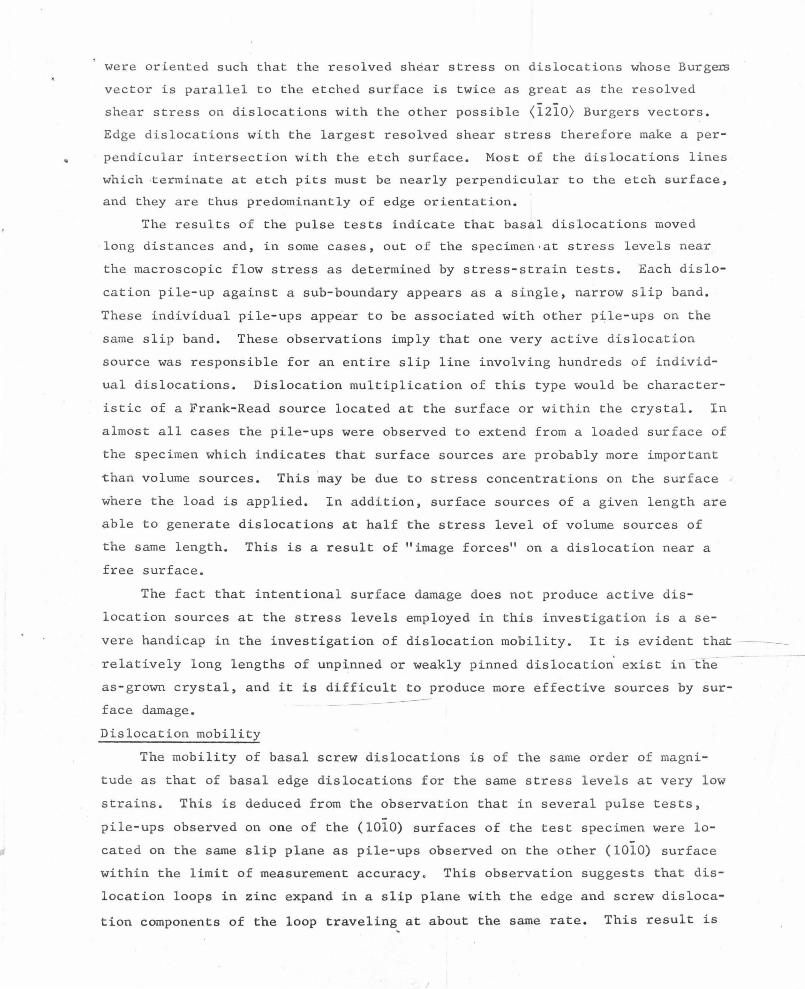
were oriented such that the resolved shear stress on dislocations whose Burg~
vector is parallel to the etched surface is twice as great as the resolved
shear stress on dislocations with the other possible (izio) Burgers vectors.
Edge dislocations with the largest resolved shear stress therefore make a per
pendicular intersection with the etch surface. Most of the dislocations lines
which ·terminate at etch pits must be nearly perpendicular to the etch surface,
and they are thus predominantly of edge orientation.
The results of the puls e tests indicate that basal dislocations moved
long distances and, in some cases, out of the specimen·at stress levels near
the macroscopic flow stress as determined by stress-strain tests. Each dislo
cation pile-up against a sub-boundary appears as a single, narrow slip band.
These individual pile-ups app~ar to be associated with other pile-ups on the
same slip band . These observations imply that one very active dislocation
source was responsible for an entire slip line involving hundreds of individ
ual dislocations. Dislocation multiplication of this type would be character
istic of a Frank- Read source located at the surface or within the crystal. In
almost all cases the pile-ups were observed to extend from a loaded surface of
the specimen which indicates that surface sources are probably more important
than volume sources. This may be due to stress concentrations on the surface
where the load is applied. In addition, surface sources of a given length are
able to generate dislocations at half the stress level of volume sources of
the same length. This is a result of "image forces" on a dislocation near a
free surface.
The fact that intentional surface damage does not produce active dis
location sources at the stress levels employed in this investigation is a se-
vere handicap in the investigation of dislocation mobility. It is evident that
relatively long lengths of unpinned or weakly pinned dislocatio~ exist in the
as-grown crystal, and it is difficult to produce more effective sources by sur-
face damage.
Dislocation mobility
-The mobility of basal screw dislocations is of the same order of magni
tude as that of basal edge dislocations for the same stress levels at very low
strains. This is deduced from the observation that in several pulse tests,
pile-ups observed on one of the (1010) surfaces of the test specimen were lo
cated on the same slip plane as pile-ups observed on the other (1010) surface
within the limit of measurement accuracy. This observation suggests that dis
location loops in zinc expand in a slip plane with the edge and screw disloca
tion c omponents o f the l oop traveling at about the same rate . This result is
--
different from that found forLWO) and 3.25% silicon-iron (1) where edge dis
location velocities are much greater than screw velocities at the same stress
level.
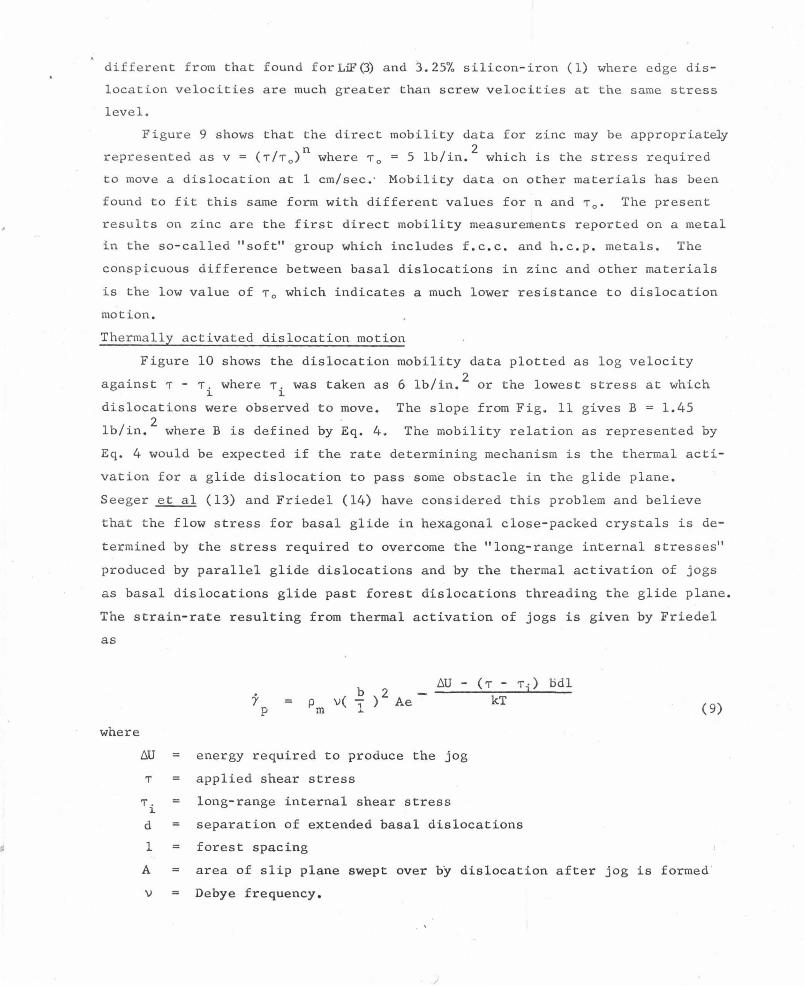
Figure 9 shows that the direct mobility data for zinc may be appropriatcly
represented as v = (T/T 0 )n where T0 = 5 lb/in. 2
which is the stress required
to move a dislocation at 1 em/sec. · Mobility data on other materials has been
found to fit this same form with different values for nand T 0 • The present
results on zinc are the first direct mobility measurements reported on a metal
in the so-called "soft" group which includes f.c.c. and h.c.p. metals. The
conspicuous difference between basal dislocations in zinc and other materials
is the low value of T 0 which indicates a much lower resistance to dislocation
motion.
Thermally activated dislocation motion
Figure 10 shows the dislocation mobility data plotted as log velocity
against T - T. where T. was taken as 6 lb/in. 2 or the lowest stress at which ~ ~
dislocations were observed to move. The slope from Fig. 11 gives B = 1.45
lb/in. 2
where B is defined by Eq. 4. The mobility relation as represented by
Eq. 4 would be expected if the rate determining mechanism is the thermal acti
vation for a glide dislocation to pass some obstacle in the glide plane.
Seeger et al (13) and Friedel (14) have considered this problem and believe
that the flow stress for basal glide in hexagonal close-packed crystals is de
termined by the stress required to overcome the "long-range internal stresses"
produced by parallel glide dislocations and by the thermal activation of jogs
as basal dislocations glide past forest dislocations threading the glide plane.
The strain-rate resulting from thermal activation of jogs is given by Friedel
as
where
y p P v( .E ) 2 Ae
m 1
6U - (T - T·) odl kT
6U energy required to produce the jog
T applied shear stress
T. long-range internal shear stress ~
d separation of extended basal dislocations
1 forest spacing
( 9)
A area of slip plane swept over by dislocation after jog is formed '
\1 De bye frequency.
I

The velocity of a dislocation is then given by
v
where
B
b \i- Ae
12
kT bdl
6U kT e
'T" - 'T". ~
B ( 10)
The forest spacing 1 for the crystals used in this investigation can be
estimated from the etch pit density observed on basal planes (104 cm-2), and w
10-2
em B is then equal . to 2.5 x 10- 3 lb/in. 2
if d is taken as 7 b05). Th~ value of B is considerably lower than the directly determined value of 1.45
lb/in. 2
• This lack of agreement shows that a model based on the thermal acti
vation of jogs is incapable of explaining the observed dislocation mobility.
One reason the above model is not applicable to zinc can be seen by com
paring the terms 6U and ('T"- 'T".)bdl in the exponential term of Eq. 9. For an ~
applied shear stress of 16 lb/in.2
, ('T"- 'T".)bdl ~ 20eV for the forest spacing ~ -
observed and a long-range internal stress of about 6 lb/in. 2
which is the low-
est stress at which basal dislocations were observed to move long distances.
6U has been estimated by Friedel (15) to be
--- 2 t>U = Gb d
30
6U is then about leV for basal dislocations in zinc. This result means that
the applied stress is more than sufficient to supply the jog energy required
and thus no assistance from the thermal energy of the lattice is required.
The "activation volume" for a thermally activated process which gives rise
to a dislocation velocity described by Eq. 10 is the term bdl. This activatim
volume is calculated to be 4 x .10- 5 cm3 ~ 2 x 10¹⁸ b 3 using the experimentally ./·
determined value of B. This value of activation volume is large compared to
the value expected if the activation event was the formation or motion of klillis
on the dislocation lines or the thermally activated motion of dislocations
past impurity atoms. Other thermally activated events which give rise to a
dislocation velocity described by Eq. 10 can be eliminated as a controlling
factor in zinc on the basis of the unreasonably large activation volume ob
served.
Lattice resistance to dislocation motion
Two possible sources of lattice resistance to dislocation motion in an
otherwise perfect lattice have been considered theoretically. Leibfried (16)
-

was the first to consider the drag on a screw dislocation moving at a constant
velocity caused by the scattering of phonons or sound waves and Eshelby (17)
has estimated the drag caused by thermoelastic effects. Lothe (18) has r e
cently reviewed and extended the calculations for both effec ts. Lothe con
cludes that for ' metals the thermoelastic effect is negligible and that Leib
fried 's result for the phonon drag is correct and should b e about the same f or
an edge as well as a screw dislocation. The drag stress due to phonon scatter
i s given by _l 10
where € is the thermal energy density, v is dislocation velocity and c2
is the
velocity of shear waves. Since zinc at room temperature is above the Debye
temperature (250° K),
and
where for zinc
3kT b3
0. 3 kTv 3 b c
2
-8 5 b = 2.66 x 10 em and c
2 = 2.31 x 10 em/sec.
The phonon drag stress on ·a dislocation moving at 25 em/sec in zinc is
calculated to be about 1 lb/in.2
which from the present mobility results is a
factor of 10 lower than the observed stress required to move a dislocation at
this velocity. Seeger (19) has indicated that the damping constant for an e~
dislocation should be an order of magnitude greater than that for a screw dis
location which would result in a drag stress of about 10 lb/in. 2
for an edge
dislocation moving at 25 em/sec . This is very near the value given by the
stress pulse tests for a velocity of 25 em/sec. The present results suggest
that the drag stress could vary as the velocity to the 1/5 power rather than
the first power. Considering the uncertainties i nvolved i n the theoretical
calculations, the possibility that the majority of lattice resistance to mov
ing basal dislocations in Zn may be due to phonon scattering cannot be excluded.
Since the experimental results indicate comparable velocities for edge mm screw oriented dislocations, a greater phonon drag stress on edge oriented ilia
locations would have to be offset by another drag stress acting preferentially
on the screw oriented dislocations. Such a drag stress could arise from jogs
on the screw oriented segments. The jogs could be formed on the screw oriented
segments when cross-slip occurs, and they would not be present on the edge
) {
.•
•
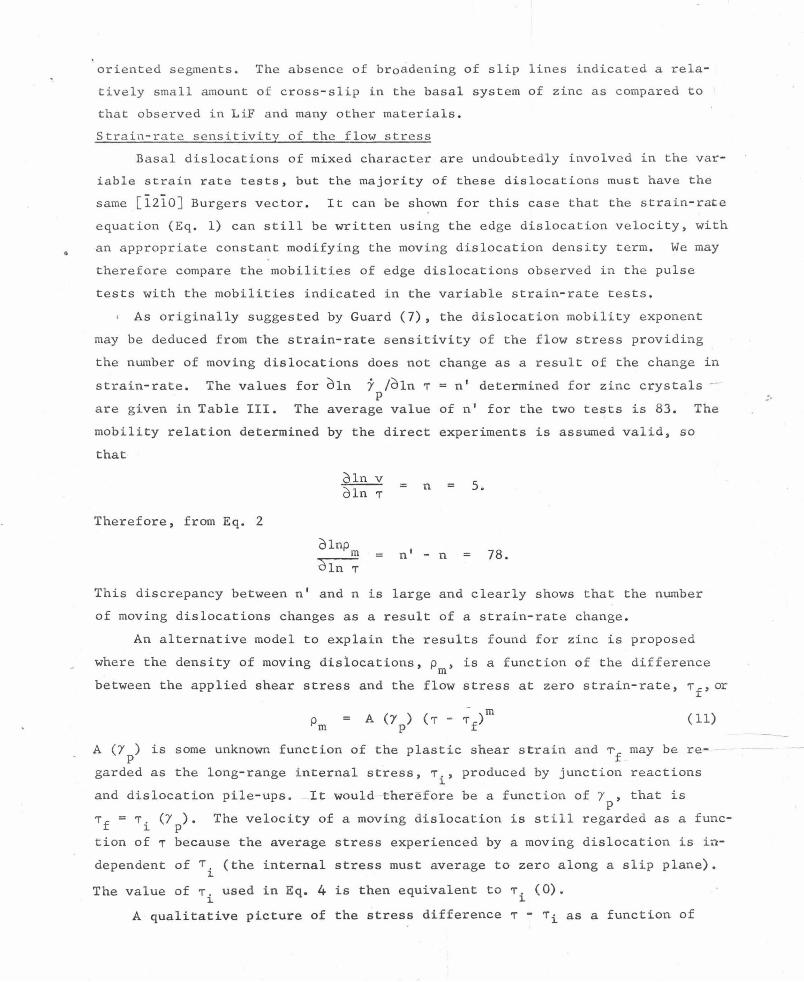
oriented segments. The absence of broadening of slip lines indicated a rela
tively small amount of cross-slip in the basal system of zinc as compared to
that observed in LiF and many other materials.
Stra in-ra t e sensitivity of the flow stress
Basal dislocations of mixed character are undoubtedly involved in the var
iable strain rate tests, but the majority of these dislocations must have the
same [l2l0] Burgers vector. It can be shown for this case that the strain-rate
equation (Eq. 1) can still be written using the edge dislocation velocity, with
an appropriate constant modifying the moving dislocation density term. We may
therefore compare the mobilities of edge dislocations observed in the pulse
tests with the mobilities indicated in the variable strain-rate tests.
As originally suggested by Guard (7), the dislocation mobility exponent
may be deduced from the strain-rate sensitivity of the flow stress providing
the number of moving dislocations does not change as a result of the change in
strain-rate. The values for dln j /dln ,. = n' determined for zinc crystals --p
are given in Table III. The average value of n' for the two tests is 83. The
mobility relation determined by the direct experiments is assumed valid, so
that
Therefore, from Eq. 2
(Jln v oln ,.
olnp m
n 5.
n' - n 78.
This discrepancy between n' and n is large and clearly shows that the number
of moving dislocations changes as a result of a strain-rate change.
An alternative model to explain the results f ound for zinc is proposed
where the density of moving dislocations, p , is a function of the difference m
between the applied shear stress and the flow stress at zero strain-rate, Tf' or
( ll)
A (Yp) is some unknown function of the plastic shear strain and ~f may be re
garded as the long-range internal stress, T., produced by junction reactions ~
and dislocation pile-ups. It would therefore be a function of Y , that is p
Tf = T. (Y ) • ~ p
The velocity of a moving dislocation is still regarded as a func-
tion of ,- because the average stress experienced by a moving dislocation is in
dependent of Ti (the internal stress must average to zero along a slip plane).
The value of 1". used in Eq. 4 is then equivalent to 1". (0). ~ ~
A qualitative picture of the stress difference 1" - Ti as a function of
•'

distance along a slip plane is given in Fig. 12. Glide dislocations will be
i
Distance Along Slip Plane
FIG. 12
Variation in Shear Stress Along A Slip Plane
prevented from moving when T - T. is negative or equal to zero. This condition l.
is shown for several dislocations. A slight increase iu the applied stress
will shift the curve upwards allowing some obstructed dislocations to glide.
The specific number of dislocations released in this manner would depend on the
details of the internal stress variation and, in particular, the distribution
of points where T - T. goes negative because this stress difference governs l.
whether a dislocation will be released when a given stress change is imposed .
The strain-rate from Eqs. 1, 3, and 11 . is now given as
. A (I) (T -
m n l 'f.) 'f p p l.
and
o lnj' o ln( T - 'f . ) Q m l. + n
Oln T OlnT
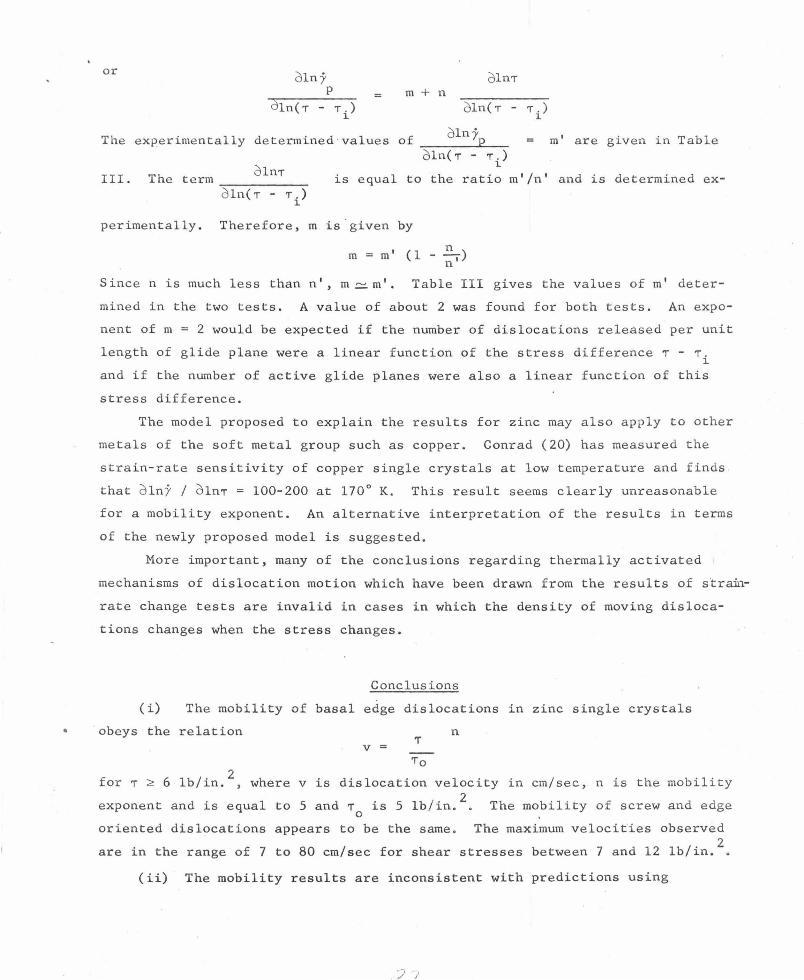
or oln)' (JlnT
p m + n chn( 1" - 1" i) o ln(T - 1" i)
The experimentally determined ·values of (Jln)' ml are given in Table
oln(T - T.) ~
o lnT III. The term-=------ is equal to the ratio m'/n 1 and is determined ex-
o ln(T- 1".) ~
perimentally. Therefore, m is given by
m = m1 n (l - -;;-)
Since n is much less than n 1, m ~ m 1 • Table III gives the values of m' deter
mined in the two tests. A value of about 2 was found for both tests. An expo
nent of m = 2 would be expected if the number of dislocations released per unit
length of glide plane were a linear function of the stress difference 1" - T. ~
and if the number of active glide planes were also a linear function of this
stress difference.
The model proposed to explain the results for zinc may also apply to other
metals of the soft metal group such as copper. Conrad (20) has measured the
strain-rate sensitivity of copper single crystals at low temperature and finds
that o lny I dlnT = 100-200 at 170° K. This result seems clearly unreasonable
for a mobility exponent. An alternative interpretation of the results in terms
of the newly proposed model is suggested.
More important, many of the conclusions regarding thermally activated
mechanisms of dislocation motion which have been drawn from the results of s 'tra:in-
rate change tests are invalid in cases in which the density of moving disloca
tions changes when the stress changes.
Conclusions
(i) The mobility of basal edge dislocations in zinc single crystals
obeys the relation n T
v = To
forT~ 6 lb/in.2
, where vis dislocation velocity in em/sec, n is the mobility
exponent and is equal to 5 and T is 5 lb/in.2
• The mobility of screw and edge 0
oriented dislocations appears to be the same. The maximum velocities observed
are in the range of 7 to 80 em/sec for shear stresses between 7 and 12 lb/in.2
•
(ii) The mobility results are inconsistent with predictions using
) j

' theoretical models which involve the thermally activated motion of glide dis-
locations past forest dislocations or impurity atoms. The drag stress on a
moving dislocation caused by phonon scattering is considered to be a likely -------
velocity limiting process.
(iii) A large difference is observed between the inverse strain-rate
sensitivity and the directly determined mobility exponent. A dislocation mod
el is proposed which explains the observed differences. The major part of the
strain-rate sensitivity is attributed to changes in the number of moving dis
locations which accommodate a change in strain-rate, rather than to the change
in dislocation velocity. The proposed dislocation model for the strain- rate
sensitivity in zinc may al s o apply to other h.c.p. and f.c.c. crystals deformed
in easy glide, in whi c h l a rge strain- rate changes may be made with very small
changes in stress.
/

•
References
1 D. F. Stein and J. F. Low, Jr., J. Appl. Phys., 31 (1960) 362.
2 H. W. Schadler, Acta Met., 12 (1964) 861.
3 W. G. Johnston and J. J. Gilman, J. Appl. Phys., 30 (1959) 129.
4 E. Yu Gutmanas, E. M. Madgornyi and A. V. Stepanov, Fix. Tverd. Tela, 5 ( 1963) 1021.
5 A. R. Chandhuri, J. R. Patel and L. G. Rubin, J. Appl. Phys., 33 (1962) 2736.
6 M. N. Kabler, Phys. Rev., 131 (1963) 54.
7 R. W. Guard, Acta Met., 9 (1961) 163.
8 W. G. Johnston and D. F. Stein, Acta Met., 11 (1963) 317.
9 A. P. L. Turner, K. H. Adams and T. Vreeland, Jr., Mat. Sci. Eng., 1 ( 1966) 70 •
10 R. C. Brandt, K. H. Adams and T. Vreeland, Jr., J. Appl. Phys., 34 (1963) 587.
11 T. L. Russell, D. S. Wood and D. S. Clark, First Interim Technical Report Under Office of Ordnance Research, Contract No. DA-04-495-0RD-171, California Institute of Technology, 1955.
12 K. H. Adams, Ph.D. Thesis, California Institute of Technology, 1965.
13 A. Seeger, S. Mader and H. Kronmuller, in G. Thomas and J. Washburn (eds.), Electron Microscopy and Strength of Crystals, Interscience, New York, 1963, p. 665.
14 J. Friedel, in G. Thomas and J. Washburn (eds.), Electron Microscopy and Strength of Crystals, Interscience, New York, 1963, 605.
15 J. Friedel, in G. M. Rassweiler and W. L. Grube (eds.), Internal Stresses and Fatigue in Metals, Elsevier, Amsterdam, 1959, 220.
16 G. Leibfried, Z. Physik, 127 (1950) 344.
17 J.D. Eshelby, Proc. Roy. Soc. (London), 197A (1949) 396.
18 J. Lothe, J. Appl. Phys., _33 (1962) 2116.
19 A. Seeger, in J. C. Fisher, W. G. Johnston, R. Thomson and T. Vreeland, Jr. (eds.), Dislocations and Mechanical Properties of Crystals, Wiley, New York, 1957, 447.
20 H. Conrad, Acta Met., 6 (1958) 339.
-

Fig. 1
Fig. 2
Fig. 3
Fig. 4
Fig. 5
Fig. 6
Fig. 7
Fig. 8
Fig. 9
Fig. 10
Fig. 11
Fig. 12
Legends To Figures
Crystallographic Orientation of Test Specimens.
Prism surface of test specimen prior to pulse testing shown
damage produced by two scratches~ Line indic~tes [l2l0] direction.
Magnification XlOO.
Tracing of a Typical Pulse Load Record.
Schematic of Compression Fixture for Rapid Load Machine.
Schematic of Test Fixture for Strain-Rate Sensitivity Tests.
Tracing of Oscillograph Record.
Basal Dislocations Before and After a Pulse of 15.4 lb/in.2
, 45 sec
P.ulse Duration, Specimen 16-2T2, 99.999 per cent Zn
Magnification XlOO.
Basal Dislocations Before and After a Pulse of 12.2 lb/in. 2
,
17 x 10-3
sec Pulse Duration, Specimen 18-5Tl, 99.999 per cent Zn,
Magnification XlOO.
Basal Dislocation Velocity vs Resolved Shear Stress
Basal Dislocation Velocity vs ,. - ,. .. ~
Schematic of Load vs Time Curve
Variation in Shear Stress Along A Slip Plane

•
Acknowledgments
The authors wish to express !h~5r_ appreciation to the U. S.
Atomic Energy Commission for sponsorship of this work under
Contract No. AT (04-3)-473. The invaluable assistance of
A. P. L. Turner and R. c. Blish in specimen preparation, test
ing and data analysis is gratefully acknowledged.