w mass and width at cdf emily nurse university of manchester seminar 30th march 2006
TRANSCRIPT
W mass and width at CDF
Emily NurseUniversity of Manchester Seminar
30th March 2006

30th March 2006 E. Nurse, U. of Manchester Seminar 2
Outline
• EWK precision measurements• Unstable particles: mass and width• The W mass and width:
– Motivation– Current status– CDF width measurement– CDF mass measurement (brief summary)
• Summary and projections
30th March 2006 E. Nurse, U. of Manchester Seminar 3
Introduction: EWK measurements
• The Standard Model contains free parameters that must be found from experiment.
• Relationships between these parameters are given in the theory.
• Measuring the parameters to a high precision is a stringent test of the theory and deviations from expected values indicate physics Beyond The Standard Model.

30th March 2006 E. Nurse, U. of Manchester Seminar 4
Introduction : unstable particles mass and width
• The properties of short lived particles can be measured by reconstructing the invariant mass of their decay products.
• This distribution peaks at the particle mass and has a finite intrinsic width.• The width is due to the Heisenberg uncertainty principle: Et ≥ ћ• The shorter the lifetime the larger the width.

30th March 2006 E. Nurse, U. of Manchester Seminar 5
• Z bosons decaying to neutrinos cannot be detected.
• This decay mode will, however, contribute to the width.
• The LEP experiment measurements of the Z width gives the number of neutrino species.
30th March 2006 E. Nurse, U. of Manchester Seminar 6
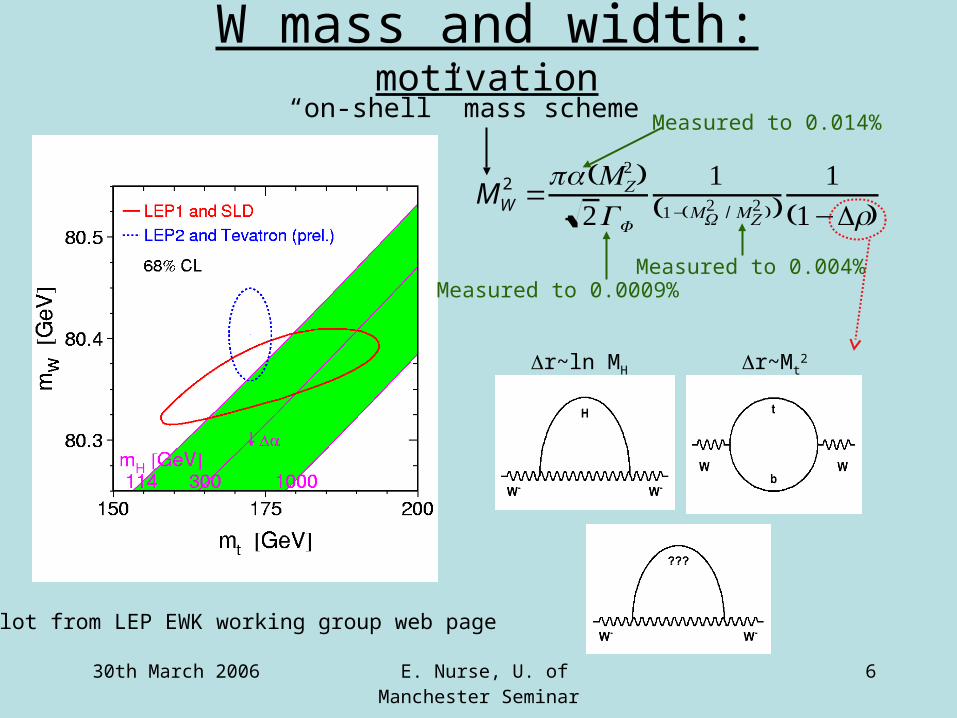
W mass and width: motivation
MW2 =
πα(MZ2 )
2GF
1(1−(MW
2 / MZ2 ))
1(1−r)
r~Mt2r~ln MH
Plot from LEP EWK working group web page
Measured to 0.0009%Measured to 0.004%
Measured to 0.014%“on-shell” mass scheme
30th March 2006 E. Nurse, U. of Manchester Seminar 7
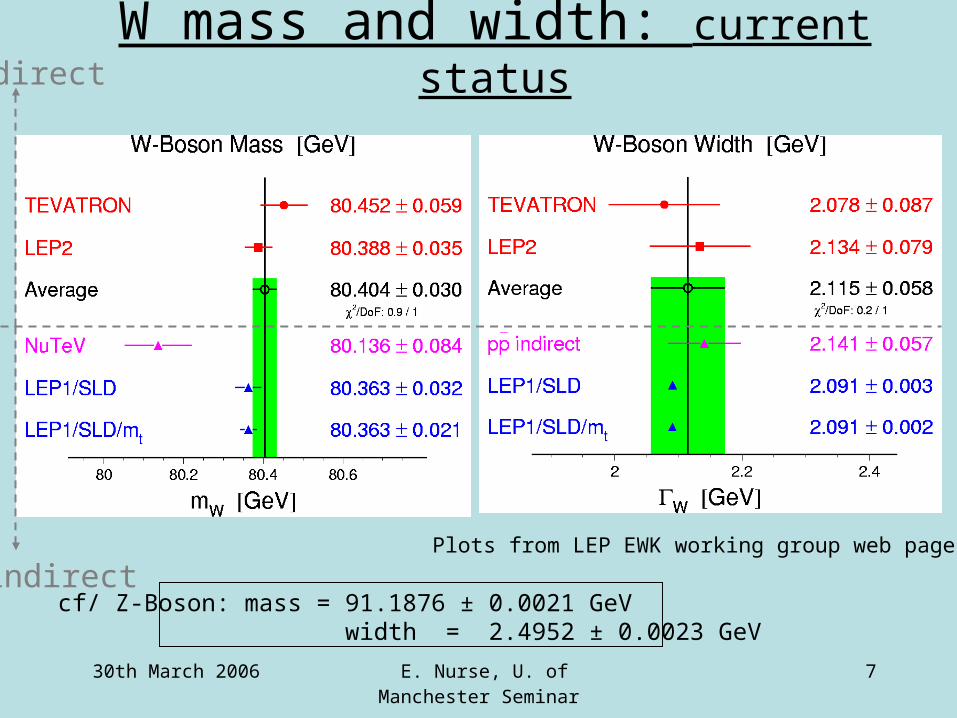
W mass and width: current status
Plots from LEP EWK working group web page
direct
indirectcf/ Z-Boson: mass = 91.1876 ± 0.0021 GeV width = 2.4952 ± 0.0023 GeV
30th March 2006 E. Nurse, U. of Manchester Seminar 8
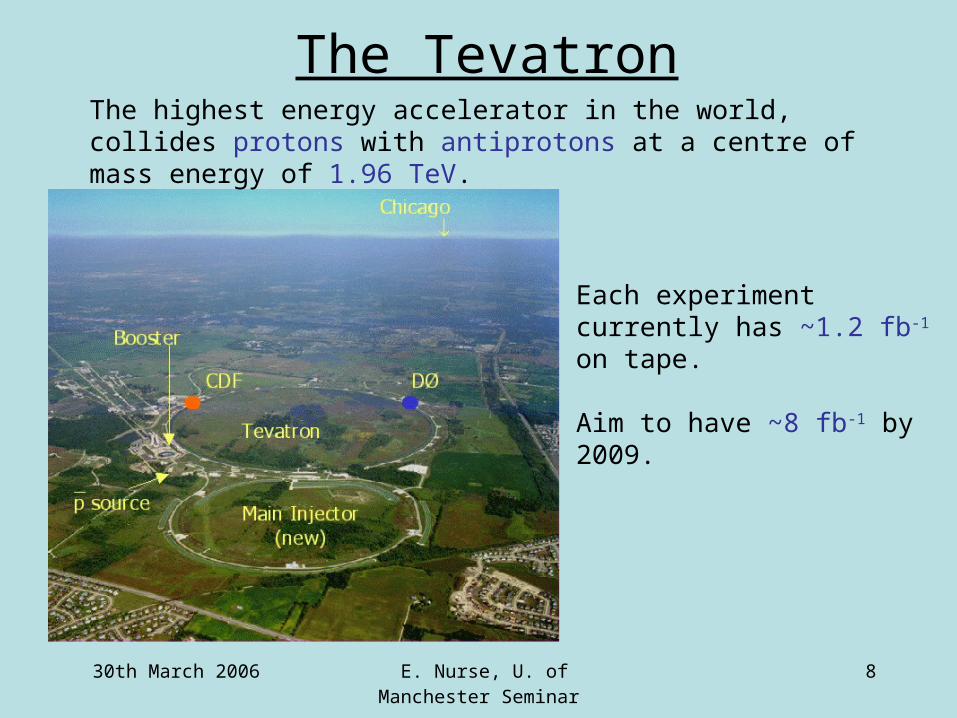
The TevatronThe highest energy accelerator in the world, collides protons with antiprotons at a centre of mass energy of 1.96 TeV.
Each experiment currently has ~1.2 fb-1 on tape.
Aim to have ~8 fb-1 by 2009.
30th March 2006 E. Nurse, U. of Manchester Seminar 9
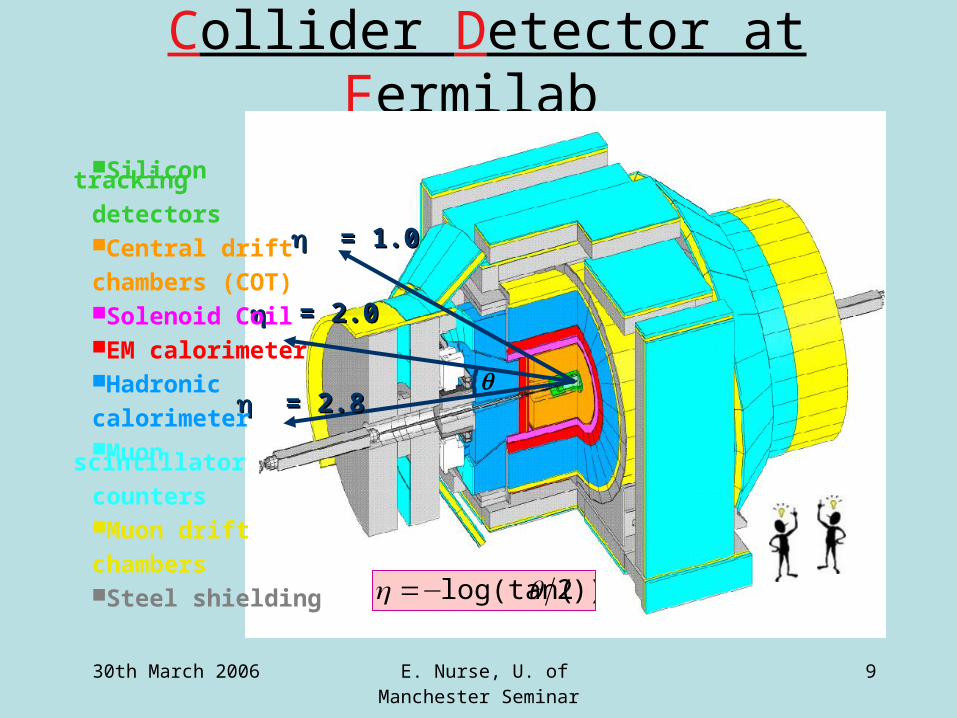
Collider Detector at Fermilab
))2log(tan(θη −=
θ
ηη = 1.0= 1.0
ηη = 2.8= 2.8
ηη = 2.0= 2.0
■Silicon tracking detectors■Central drift chambers (COT)■Solenoid Coil■EM calorimeter■Hadronic calorimeter■Muon scintillator counters■Muon drift chambers■Steel shielding
30th March 2006 E. Nurse, U. of Manchester Seminar 10
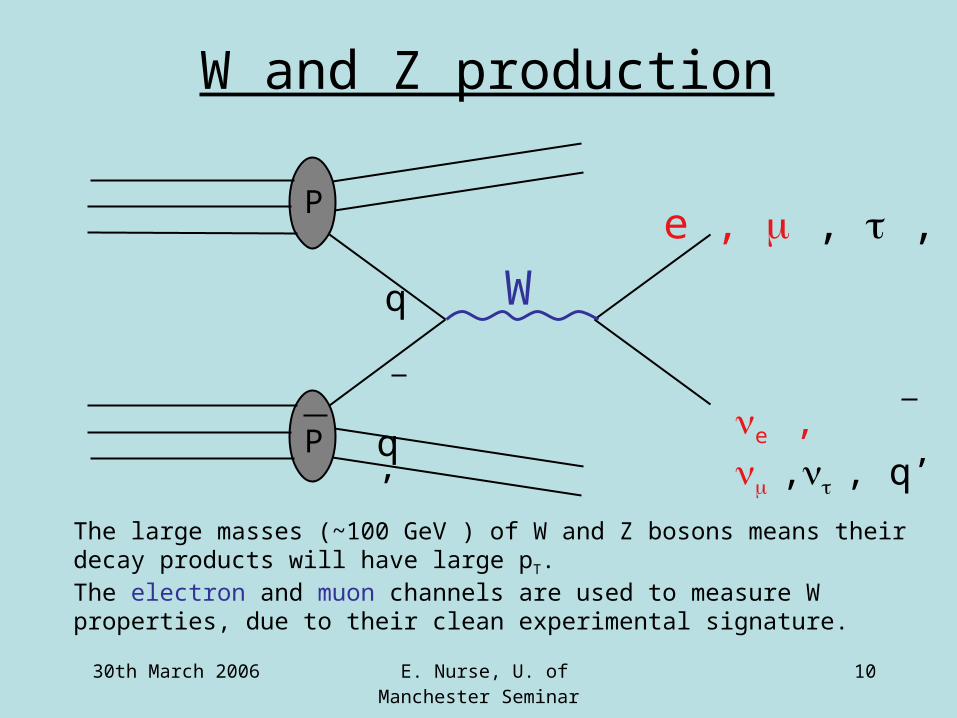
W and Z production
We , , , q
e , , , q’
P
P q’
q
The large masses (~100 GeV ) of W and Z bosons means their decay products will have large pT.The electron and muon channels are used to measure W properties, due to their clean experimental signature.

30th March 2006 E. Nurse, U. of Manchester Seminar 11
CDF W width analysis
note: this analysis is work in progress!
current analysis based on 350 pb-1
30th March 2006 E. Nurse, U. of Manchester Seminar 12
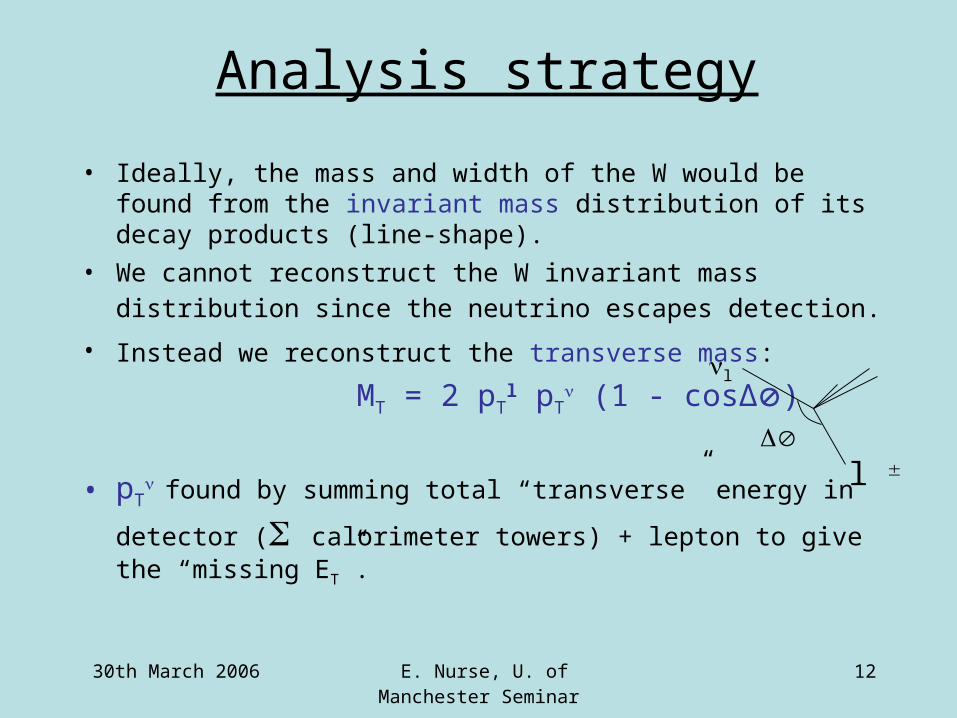
Analysis strategy
• Ideally, the mass and width of the W would be found from the invariant mass distribution of its decay products (line-shape).
• We cannot reconstruct the W invariant mass distribution since the neutrino escapes detection.
• Instead we reconstruct the transverse mass:
MT = 2 pTl pT
(1 - cos∆)
• pT found by summing total “transverse” energy in
detector ( calorimeter towers) + lepton to give the “missing ET”.
l
l

30th March 2006 E. Nurse, U. of Manchester Seminar 13
Analysis strategy• Width and mass found by fitting MT in data to that in
Monte Carlo.• The line-shape of the W is described by a Breit-Wigner
distribution with a scale dependent width:
x1x2s

30th March 2006 E. Nurse, U. of Manchester Seminar 14
Analysis strategy
Same principle for W mass, with fit region 50 - 100 GeV
• Simulate MT distributions using Monte Carlo event generator with various “blinded” input width values.• Normalise to data in the low MT
region.• Fit to data in the high MT region (exactly where is a trade off between systematics and statistics).• A fast simulation is required (rather than full detector simulation). • Z events used to tune the detector response to particles.

30th March 2006 E. Nurse, U. of Manchester Seminar 15
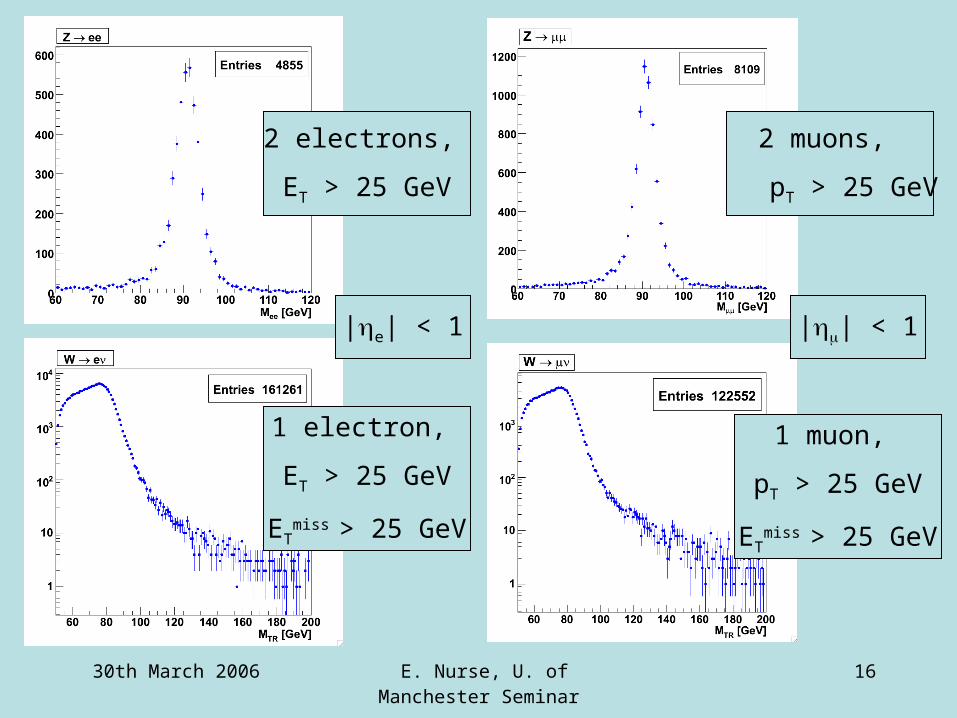
The dataSelect 4 data samples: Z and Zee (control samples). W and We
Muons identified in COT, calorimeters (MIP signature) and muon detectors.
Electrons identified in COT andEM calorimeter.
30th March 2006 E. Nurse, U. of Manchester Seminar 16
2 electrons,
ET > 25 GeV
2 muons,
pT > 25 GeV
1 electron,
ET > 25 GeV
ETmiss > 25 GeV
1 muon,
pT > 25 GeV
ETmiss > 25 GeV
|ηe| < 1 |η| < 1

30th March 2006 E. Nurse, U. of Manchester Seminar 17
The simulation• Toygen event generator produces Z, W, Zee and We
samples.• Purely electroweak (no gluon radiation, i.e. pT(boson) = 0 GeV).
pT(Z) is added from a functional form (fit to pT(Z) data). A theoretical calculation converts pT(Z)pT(W).
• QED radiation - Toygen is interfaced with Berends and Kleiss program: one photon FSR correction.
UA2 program

30th March 2006 E. Nurse, U. of Manchester Seminar 18
• Simulation of detector: – Simple tracking: helix extrapolation through detector with
calorimeter and muon geometry simulated.– The ionisation energy loss of muon tracks in central trackers taken
from the Bethe-Bloch equation.– Electron bremsstrahlung and photon conversion within central
trackers simulated. – Clustering of electrons/photons in calorimeter simulated.
nIter = 0 1 2 3 … etc.
Ze+e-initial
30th March 2006 E. Nurse, U. of Manchester Seminar 19
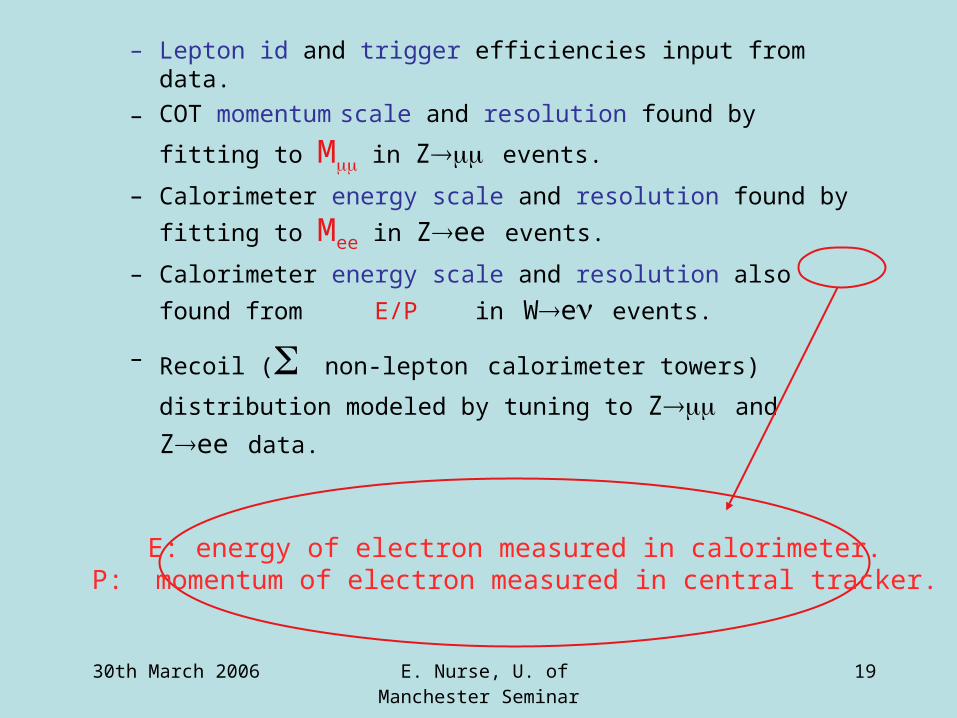
– Lepton id and trigger efficiencies input from data.
– COT momentum scale and resolution found by fitting to
M in Z events.
– Calorimeter energy scale and resolution found by fitting
to Mee in Zee events.
– Calorimeter energy scale and resolution also found from
E/P in We events.
– Recoil ( non-lepton calorimeter towers) distribution
modeled by tuning to Z and Zee data.
E: energy of electron measured in calorimeter.P: momentum of electron measured in central tracker.
30th March 2006 E. Nurse, U. of Manchester Seminar 20
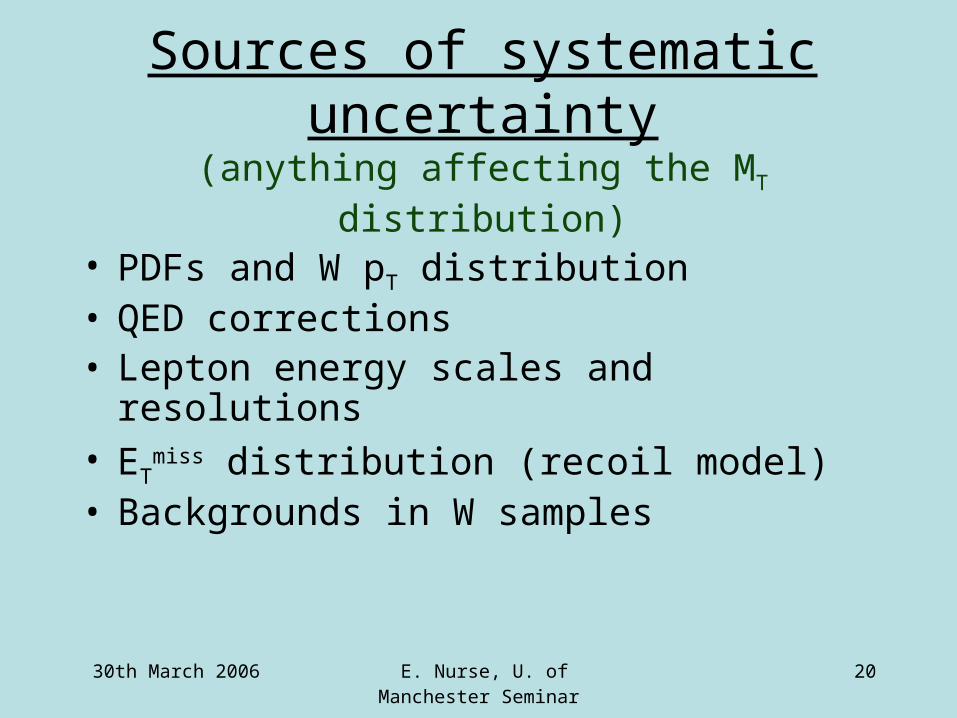
Sources of systematic uncertainty
(anything affecting the MT distribution)
• PDFs and W pT distribution• QED corrections• Lepton energy scales and resolutions• ET
miss distribution (recoil model)• Backgrounds in W samples
30th March 2006 E. Nurse, U. of Manchester Seminar 21
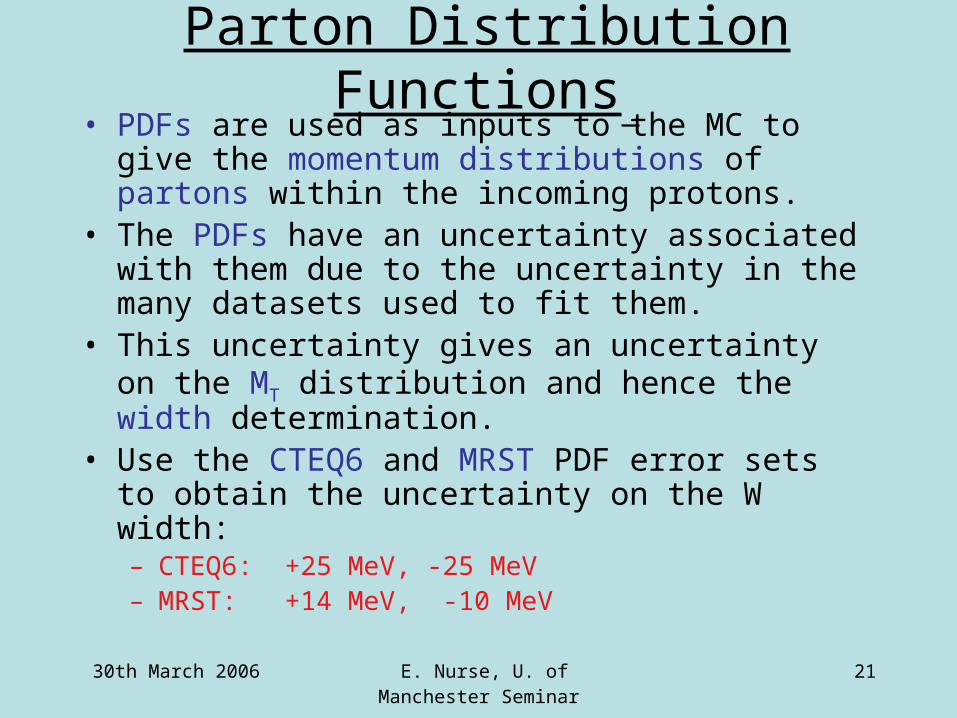
Parton Distribution Functions
• PDFs are used as inputs to the MC to give the momentum distributions of partons within the incoming protons.
• The PDFs have an uncertainty associated with them due to the uncertainty in the many datasets used to fit them.
• This uncertainty gives an uncertainty on the MT distribution and hence the width determination.
• Use the CTEQ6 and MRST PDF error sets to obtain the uncertainty on the W width:– CTEQ6: +25 MeV, -25 MeV– MRST: +14 MeV, -10 MeV
30th March 2006 E. Nurse, U. of Manchester Seminar 22
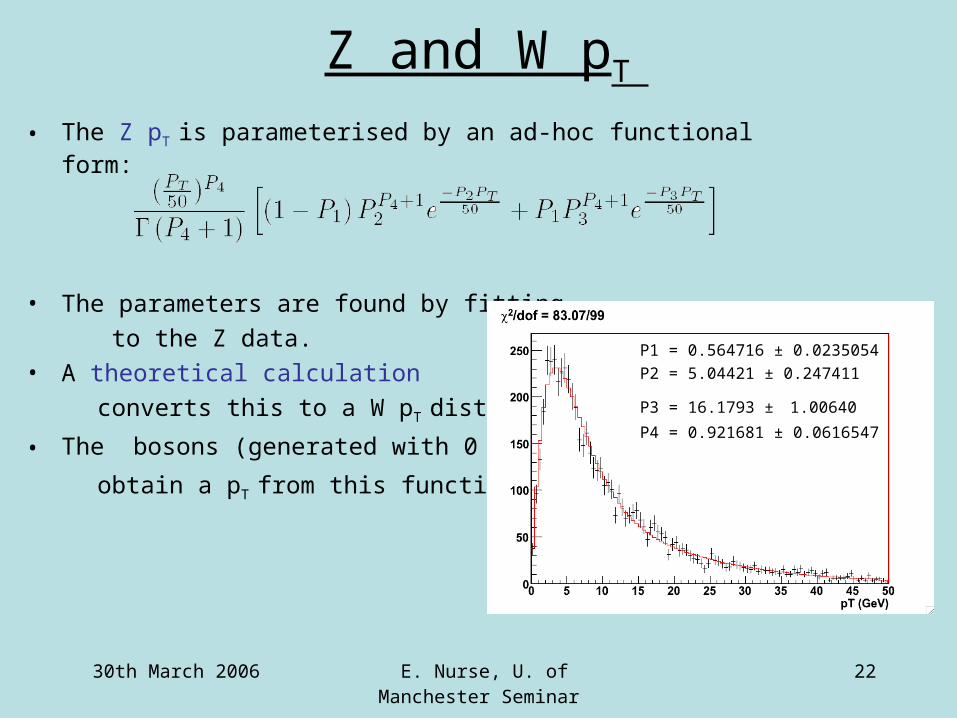
Z and W pT
• The Z pT is parameterised by an ad-hoc functional form:
• The parameters are found by fitting to the Z data.• A theoretical calculation converts this to a W pT distribution.
• The bosons (generated with 0 pT)
obtain a pT from this functional form.
P1 = 0.564716 ± 0.0235054P2 = 5.04421 ± 0.247411
P3 = 16.1793 ± 1.00640
P4 = 0.921681 ± 0.0616547

30th March 2006 E. Nurse, U. of Manchester Seminar 23
Lepton momentum/energy scales and resolutions
Since we do not model the complete CDF detector and event reconstruction we must smear the “true” lepton momentum (as measured in the COT) and energy (as measured in calorimeter). The smearing parameters are found by tuning to the data.
30th March 2006 E. Nurse, U. of Manchester Seminar 24
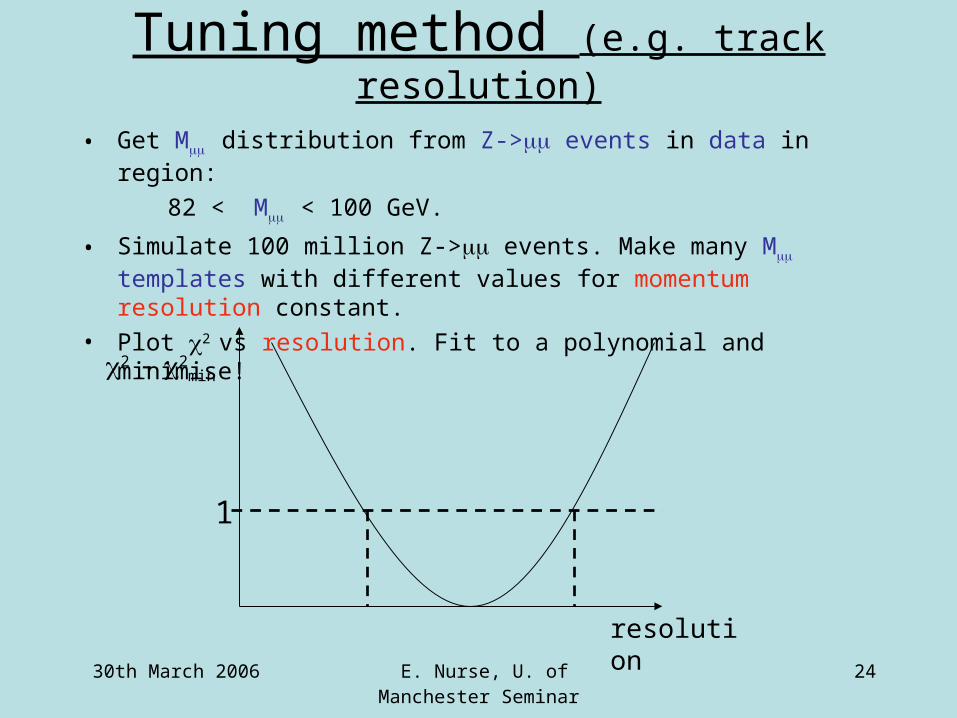
• Get M distribution from Z-> events in data in region:
82 < M < 100 GeV.
• Simulate 100 million Z-> events. Make many M templates with different values for momentum resolution constant.
• Plot 2 vs resolution. Fit to a polynomial and minimise!
2 - 2min
1
resolution
Tuning method (e.g. track resolution)

30th March 2006 E. Nurse, U. of Manchester Seminar 25
Track momentum scale: pT
meas = 0.9986 pT
resolution: (1/pT) = 0.00055 0.006 / pT
curvature term multiple scattering term

30th March 2006 E. Nurse, U. of Manchester Seminar 26
Calorimeter energy scale: Emeas
= 1.0030 Eresolution: (E) / E = 13.5% / ET 2.2%
stochastic term constant term
scale = 1.0030 0.0006kappa = 2.22 0.14 %
2 = 18.5 / 18

30th March 2006 E. Nurse, U. of Manchester Seminar 27
Calorimeter energy: E/P
Momentum loss in trackers throughbremsstrahlung
Energy leakagefrom electroncalorimetertower (not yet simulated)
Calorimeter energy and track momentum resolutions
scales consistent; resolutions have ~4 different!scale = 1.0030 0.0006kappa = (2.22 0.14) %
e energy in calorimetere mom in COT
30th March 2006 E. Nurse, U. of Manchester Seminar 28
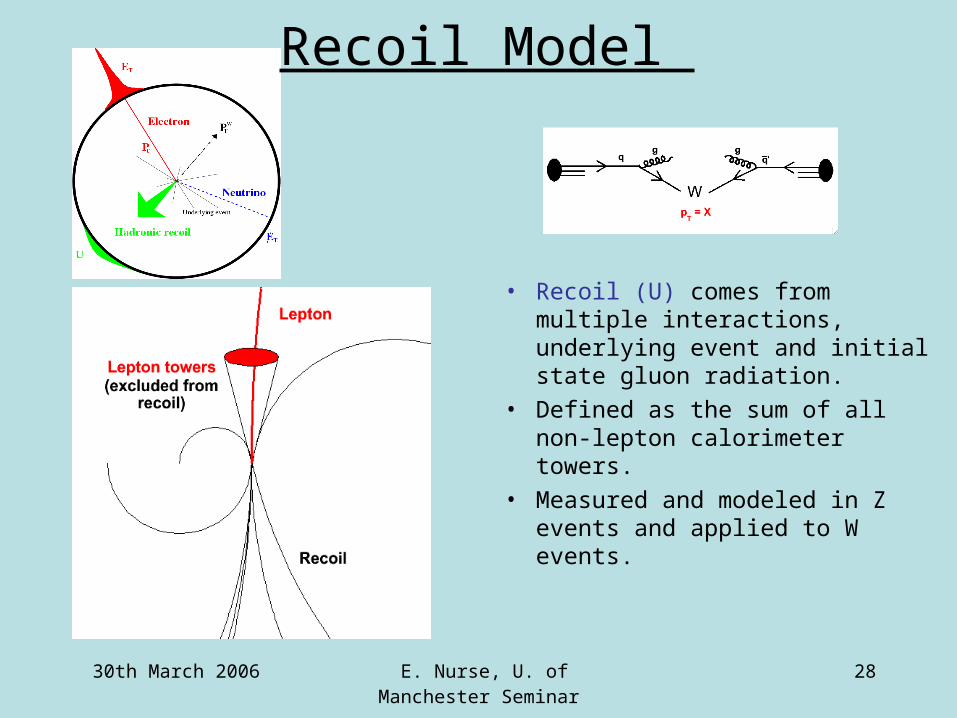
• Recoil (U) comes from multiple interactions, underlying event and initial state gluon radiation.
• Defined as the sum of all non-lepton calorimeter towers.
• Measured and modeled in Z events and applied to W events.
Recoil Model

30th March 2006 E. Nurse, U. of Manchester Seminar 29
• U in Z events resolved into 2 directions:– U1 : anti-parallel to the Z pT – U2 : perpendicular to Z pT
• U1 and U2 are gaussian in bins of Z pT.
• <U1> = a +bpT +cpT2
• <U2> = 0
(U1) = d + epT + f(ET)g
(U2) =h(ET)i
Zee events:
The recoil is then added in this way to the simulation for both Z and W events. Note: this is ongoing work, the simulation currently uses a Run I model.

30th March 2006 E. Nurse, U. of Manchester Seminar 30
Efficiencies…measured in the data and applied to MC as a function of η

30th March 2006 E. Nurse, U. of Manchester Seminar 31
Z ll
Potential backgrounds to W events
• One lepton lost• ET
miss due to missing lepton
• decays to e/• intrinsic ET
miss
We need to know MT distribution of backgrounds as well as overall normalisation!!
Residual background: run full event selections on signal and background MC samples passed through simulation of CDF detector to get fractional background.
muon channel: Z : 4.7%
W : 1.9%
Background suppression: veto on additional high pT, isolated track
electroweak
W

30th March 2006 E. Nurse, U. of Manchester Seminar 32
• Jet contains /fakes a lepton• ET
miss from misconstruction
Residual background: Found from difference in isolation distributions in W and Z events. muon channel: 0.5%,electron channel: 1.4%
Background suppression: total recoil in event < 20 GeV
Background suppression: Cosmic tagger takes a seed track and searches for additional track hits on the other side of the interaction point.
. . . ..
. . . ... .
Residual background: muon channel: negligibleelectron channel: N/A
di-jet
cosmic muons

30th March 2006 E. Nurse, U. of Manchester Seminar 33
Residual background: Found by fitting the d0 distribution in W events to that in Z + W + kaon (with fraction of kaon varying). muon channel: 1.00 0.19 % electron channel: N/A
• Kaon decays to a pair when passing through COT.• kink in track can give a fake high pT and ET
miss.
Background suppression: Cut on track 2 and d0 (impact parameter).
kaon decay
Tracks with no silicon hits

30th March 2006 E. Nurse, U. of Manchester Seminar 34
Muon channel backgrounds:
1% kaon background is probably too much for us!
Muon channel transverse mass distributions:

30th March 2006 E. Nurse, U. of Manchester Seminar 35
Width measurement: summary
• Fast simulation modeling the detector reasonably well.
• Work still required to ensure a good understanding of some effects:– electron energy resolution– recoil model
• Need to determine systematic uncertainties for all the effects discussed.
• When this is done fits for the width will be “un-blinded”.

30th March 2006 E. Nurse, U. of Manchester Seminar 36
Width measurement: estimated uncertainties
• Run I analysis achieved 130 MeV with 110 pb-1 (one third of our luminosity).
• A naïve estimate of most systematics can be obtained by scaling Run I numbers by increased statistics (since they are controlled by Z statistics).
• Some systematics are not determined by Z statistics (e.g. QED corrections).
• Estimate ~80 MeV with this dataset with dominant errors from statistics, recoil and backgrounds.
• In reality may be higher…
30th March 2006 E. Nurse, U. of Manchester Seminar 37
W mass status
• Current analysis uses 200 pb-1.• Very similar to the width analysis, but with
50 - 100 GeV fit region.• Some effects are more important and must
be better understood (e.g. track momentum scale determined using J/ and decays to muons, with Z events as a cross check). Therefore their simulation is more sophisticated than ours.
• Use Resbos Monte Carlo event generator interfaced with Wgrad for QED corrections.

30th March 2006 E. Nurse, U. of Manchester Seminar 38
W mass status
current work
Total uncertainty 76 MeV (Run 1b: 79 MeV)
Fits blinded with additive offsets
110 pb-1

30th March 2006 E. Nurse, U. of Manchester Seminar 39
Projections
W width to a similar level of precision

30th March 2006 E. Nurse, U. of Manchester Seminar 40
Outlook
• Hope to have these first round measurements out by the summer(?)
• After that the plan is join forces on the “W mass 1 fb-1 challenge”.
• Watch this space….
30th March 2006 E. Nurse, U. of Manchester Seminar 41
Back-up slides
30th March 2006 E. Nurse, U. of Manchester Seminar 42