w?? ö)« - global science journals · 43 h. molavi and a. zahiri among classical maintenance...
TRANSCRIPT

Journal of Engg. Research Vol. 3 No. (2) June 2015 pp. 41-58
«b U ©MR® qOL « s U —u MB ¡UD hO A Ë W U b —jHM « qOK% U UO
ÍdON U{dOK Ë Íu u ÍbÊ«d ¨Ê«dN ¨ËdO ÀU bNF
W?? ö)« W «d W U rOOI - ¨“WOzU u « W UOBK WO O «d ô« ËdA « f ” ·«b v dEM U …b oO D ‰ö s ©LTC® qOL « s U —u MB ©M® Ÿu s ©MR® ¡UD hO A Ë Èu ÷UH v U U M ô« XHA Ë ÆWI A*« U UO « qOK% UNOK ¨jHM « qOK% UOMI ‰UB ô« W ËUI …œU “ Ë WHOH)« „uJ « r l Í—«d(« QD)« w ÂbI p c Ë jHM « W UE vK ÍdB « h H «Ë »UDF « Õö S v u Y « ¨p c W O Ë Æb bA « ¡UM ô« Ë Í ¡«d ÂbF `BM Íc «Ë ¨lMB*« q s Õd I*« Õö ù« dO UF l UN{—UF s r d « s UE ö*« l ¨©LTC® qOL « s UA Õö bF Ë «dO Ë Æ©LTC®s UA q U Õö UNCF l oO Ë ‚UH « „UM ÊQ b Ë ¨jHM « U UO qOK% ZzU l UN —UI Ë wzU eOH « h H «
ÆiF «
10.7603/s40632-015-0013-8

Condition monitoring and fault diagnosis of an MR load tap changer using oil analysis data 42
Condition monitoring and fault diagnosis of an MR load tap changer using oil analysis data
*H. Molavi and A. Zahiri
Niroo Research Institute (NRI), Tehran, Iran
*Corresponding author: [email protected]
ABSTRACT
Considering the objectives of “condition based preventative maintenance strategy”, condition monitoring and fault diagnosis of an MR M-type load tap changer (LTC) was assessed by applying several oil analysis techniques, followed by interpretation of the derived data. The interpretation revealed the oil low cleanliness level as well as in progress thermal fault with light coking or increased resistance of the contacts or severe arcing. As a result, overhauling and visual inspection were recommended in spite of the suggested overhaul criteria by the manufacturer, which advised no overall repair for the pilot LTC at that time.
Finally by overhauling the pilot LTC, the observations from physical inspection were compared to the extracted results from oil analyses data interpretation, which were in close agreement with each other.
Keywords: Condition monitoring; DGA; fault diagnosis; LTC: oil analysis
INTRODUCTION
Load tap changers (LTCs) for power transformers are essential components of electrical networks. Depending on the size of a transformer, an outage due to equipment failure has an immediate effect on the distribution system supply and may lead to temporary power outage and also a significant financial loss (Schellhase et al., 2002; Redfern et al., 2001).
LTC, which is immersed in insulating oil, is the only moveable part of a transformer and hence, experiences various aging mechanisms (Erbrink et al., 2009). It has been appraised that more than 30% of all transformer failures is due to faulty LTCs (Schellhase et al., 2002; EPRI Report #1001946, 2001). Generally, tap changer wear increases with time, load and the number of operations (Handley et al., 2001). The most frequent reasons for LTC’s failures have been reported to be mechanical malfunction, increased contact resistance, localized thermal stress, breakdown of the insulating oil, contact wear, etc. (Schellhase et al., 2002 ).
H. Molavi and A. Zahiri 43
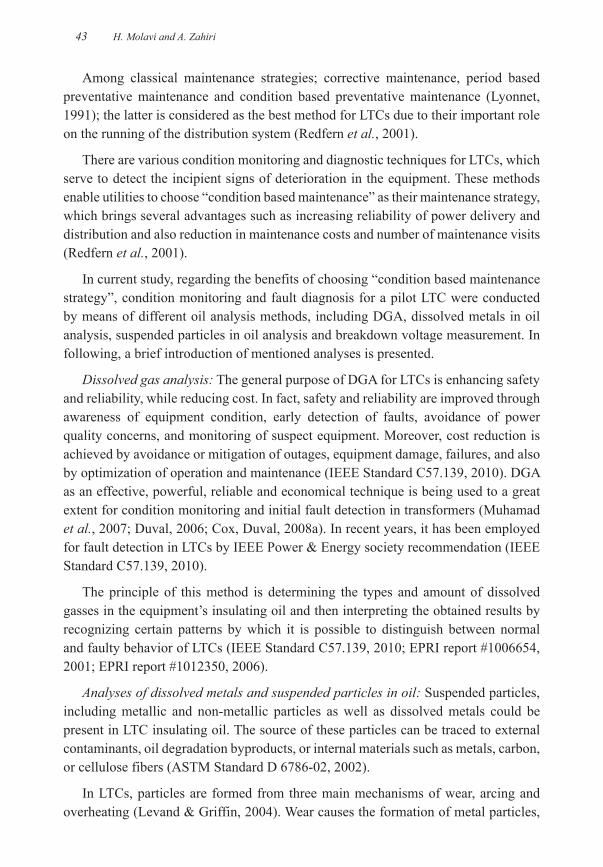
Among classical maintenance strategies; corrective maintenance, period based preventative maintenance and condition based preventative maintenance (Lyonnet, 1991); the latter is considered as the best method for LTCs due to their important role on the running of the distribution system (Redfern et al., 2001).
There are various condition monitoring and diagnostic techniques for LTCs, which serve to detect the incipient signs of deterioration in the equipment. These methods enable utilities to choose “condition based maintenance” as their maintenance strategy, which brings several advantages such as increasing reliability of power delivery and distribution and also reduction in maintenance costs and number of maintenance visits (Redfern et al., 2001).
In current study, regarding the benefits of choosing “condition based maintenance strategy”, condition monitoring and fault diagnosis for a pilot LTC were conducted by means of different oil analysis methods, including DGA, dissolved metals in oil analysis, suspended particles in oil analysis and breakdown voltage measurement. In following, a brief introduction of mentioned analyses is presented.
Dissolved gas analysis: The general purpose of DGA for LTCs is enhancing safety and reliability, while reducing cost. In fact, safety and reliability are improved through awareness of equipment condition, early detection of faults, avoidance of power quality concerns, and monitoring of suspect equipment. Moreover, cost reduction is achieved by avoidance or mitigation of outages, equipment damage, failures, and also by optimization of operation and maintenance (IEEE Standard C57.139, 2010). DGA as an effective, powerful, reliable and economical technique is being used to a great extent for condition monitoring and initial fault detection in transformers (Muhamad et al., 2007; Duval, 2006; Cox, Duval, 2008a). In recent years, it has been employed for fault detection in LTCs by IEEE Power & Energy society recommendation (IEEE Standard C57.139, 2010).
The principle of this method is determining the types and amount of dissolved gasses in the equipment’s insulating oil and then interpreting the obtained results by recognizing certain patterns by which it is possible to distinguish between normal and faulty behavior of LTCs (IEEE Standard C57.139, 2010; EPRI report #1006654, 2001; EPRI report #1012350, 2006).
Analyses of dissolved metals and suspended particles in oil: Suspended particles, including metallic and non-metallic particles as well as dissolved metals could be present in LTC insulating oil. The source of these particles can be traced to external contaminants, oil degradation byproducts, or internal materials such as metals, carbon, or cellulose fibers (ASTM Standard D 6786-02, 2002).
In LTCs, particles are formed from three main mecha nisms of wear, arcing and overheating (Levand & Griffin, 2004). Wear causes the formation of metal particles,

Condition monitoring and fault diagnosis of an MR load tap changer using oil analysis data 44
while arcing can form teardrop-shaped metal particles. Furthermore, organic particles such as carbon fines and larger conglomerations from the breakdown of the oil could also be produced by arcing. On the other hand, overheating increases the rate of decay of other materials and induces the formation of by-products such as polymerized oil films (Levand & Griffin, 2004). Determination of elements in insulating oils provides rapid screening of used oils for indications of wear and other contaminations. It also can be used to monitor equipment condition and help to find when corrective action is needed (ASTM Standard D 7151-05, 2005). The metals test, consisting of both particulate metals and those dissolved in the oil, is an extremely meaningful test indicating the amount of material that has been worn or sublimated from the moving and/or stationary con tacts and could be related to specific materials of the construction (Levand & Griffin, 2004). This technique is being used more frequently to diagnose conditions in an electrical apparatus (Levand, 2007). Particle counts provide a general degree of contamination level and may be useful in accessing the condition of the equipment (ASTM Standard D 6786-02, 2002).
Breakdown voltage: High dielectric strength is the most important necessity of insulation oils. Using ASTM D 1816 (ASTM Standard D1816, 2012), the minimum breakdown voltage for insulating oils in LTCs could be 28 kV.
EXPERIMENTAL METHODS
Choosing an LTC
An LTC in a 230/63 kV substation was selected due to the possibility of overhauling in the near future. The unit was equipped with a sampling valve in the bottom of the apparatus which facilitated sampling procedure. The selected free breathing LTC was an MR M-type load tap changer (made in Germany) of a 125-MVA power transformer. The LTC’s type was MIIIY500 and it has been operating for 20 years and last was overhauled in August 2007.
Choosing the pilot LTC was due to the fact that, 230/63 kV transformers are considered key transformers in Iran. Furthermore, the pilot LTC is the most frequently being used LTC in the country.
Experimental work: sampling and analyzing procedure
Oil sampling was done three times in nearly three-month intervals. It should be noted that, the 1st and 2nd stages of oil sampling were carried out according to ASTM D 3613 standard (ASTM Standard D3613-98, 1998), while due to the fault of maintenance team; the 3rd stage of oil sampling was not conducted in accordance with the mentioned standard. In fact, it had been planned to perform the 3rd stage sampling and then the pilot LTC be overhauled. However before sampling, the maintenance team drained the LTC oil; therefore, the 3rd stage sample was taken from the drained oil containing

H. Molavi and A. Zahiri 45
suspending sludge and particles. This means that the obtained results in this stage, especially the results of the breakdown voltage and dissolved metals and suspended particles in oil, are not trustworthy.
After each sampling, the specimens were sent to reliable laboratories, where dissolved gas analysis was carried out according to ASTM D 3612 standard (ASTM Standard D 3612, 2009). Furthermore, number of particles, particle size distribution and particle density were determined considering NAS 1638 (NAS 1638, 2001) and ISO 4406 (ISO 4406, 1999) standards. Analyses of the types of metals and contaminants in the oil were conducted according to ASTM D 7151 standard (ASTM Standard D 7151-05, 2005). Finally, the breakdown voltage was measured using ASTM D 1816 standard (ASTM Standard D1816, 2012).
Sampling information has been tabulated in Table 1, which also contains the overhaul information.
Table 1. Sampling information for the pilot LTC
Sampling stage 1st 2nd 3rd & Overhaul
Sampling date Feb. 2012 May 2012 Oct. 2012
No. of operation 2568 3162 3894
Tap position 16 14 14
Oil Temp. 27ºC 37ºC 30ºC
Environ. Temp. 21ºC 30ºC 18ºC
RESULTS AND DISCUSSION
Results interpretation approach
In order to interpret DGA data, the resulted gas concentrations from analysis were compared to “the LTC monthly watch criteria” presented by Youngblood et al.. If none of the concentrations exceeded the limitations, the LTC performance would be concluded to be normal.
In case of exceeding one of the gas concentrations from its threshold value, in order to investigate the possibility of fault presence, two different ratio methods suggested by EPRI (Schellhase et al., 1999) would be applied.
In the first ratio method using Table 2 ((Mackenzie et al., 2010) (originally from Schellhase et al., (1999)), three distinct diagnostic regions have been provided for contacts overheating: Needs attention, Damage possible and Damage detected.

Condition monitoring and fault diagnosis of an MR load tap changer using oil analysis data 46
Table 2. Interpretation criteria for the 1st gas ratio method for contacts overheating (Schellhase et al., 1999)
R Needs attention Damage possible Damage detected
FR 0.6 0.35 0.15
R1 0.5 0.6 0.8
R2 0.8 4 6
R3 1 6 9
In the second ratio method (EPRI report #1012350, 2006) (originally from Schellhase et al., (1999), three separate diagnostic areas have been considered: Normal, Alert and Fault/Failure (Table 3).
Table 3. The 2nd gas ratio method fault alert limits (Schellhase et al.,1999)
Description code Codes in this study Normal Alert Fault/Failure
Simple arc ratio: [C
2H
2/TDCG]
B1 0.3-1.0 <0.3 0.1
Total arc ratio: [(C
2H
2+ CH
4+ H
2)/TDCG] B2
0.7-1.0 <0.7 <0.7
Simple thermal ratio:Log [C
2H
4/ C
2H
2] B3
<0 0-0.5 >0.5
Total thermal ratio:Log [(C
2H
4+ C
2H
6)/ C
2H
2] B4
<0 0-0.5 >0.5
In the case of not laying data in the Normal ranges, the fault type would be identified applying the Duval triangle 2 (Duval, 2008b).
Since there was not any published quantitative data for dissolved metal and suspended particles analyses in LTC's oil, it was attempted to relate the materials in oil to the specific material in LTC construction, external contaminations, oil additives, or products of oil deterioration, in the interpretation of the obtained data.
The condition of the oil for breakdown voltage was evaluated considering the criteria mentioned in "Breakdown voltage" section.
DGA results interpretation
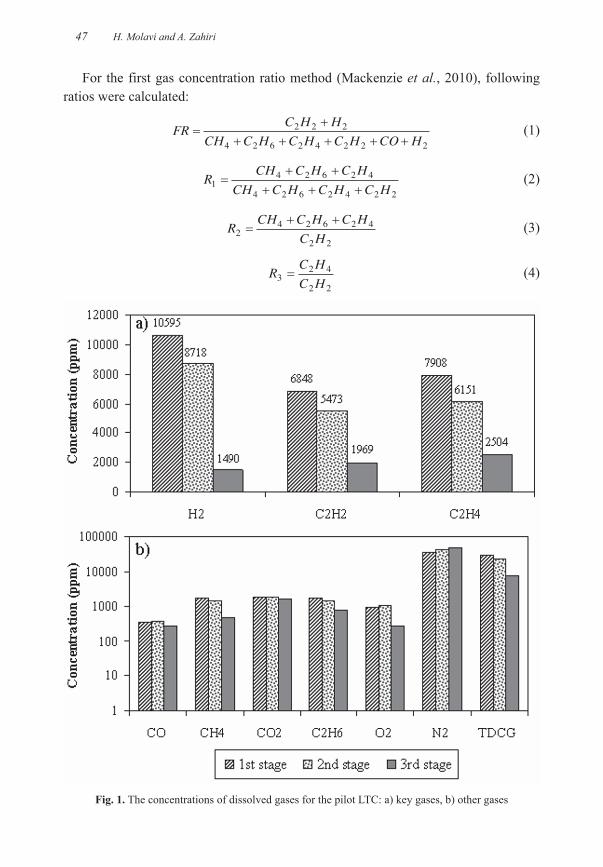
Figure 1 demonstrates the concentrations of dissolved gases in oil (including total dissolved combustible gases concentration (TDCG) for each sampling stage.
Using the LTC monthly watch criteria, it was revealed that the concentrations of hydrogen, ethylene and acetylene (key gases) for all sampling stages were beyond the criteria. Therefore, the gas concentration ratio methods were applied.
H. Molavi and A. Zahiri 47
For the first gas concentration ratio method (Mackenzie et al., 2010), following ratios were calculated:
(1)
(2)
(3)
(4)
Fig. 1. The concentrations of dissolved gases for the pilot LTC: a) key gases, b) other gases
Condition monitoring and fault diagnosis of an MR load tap changer using oil analysis data 48
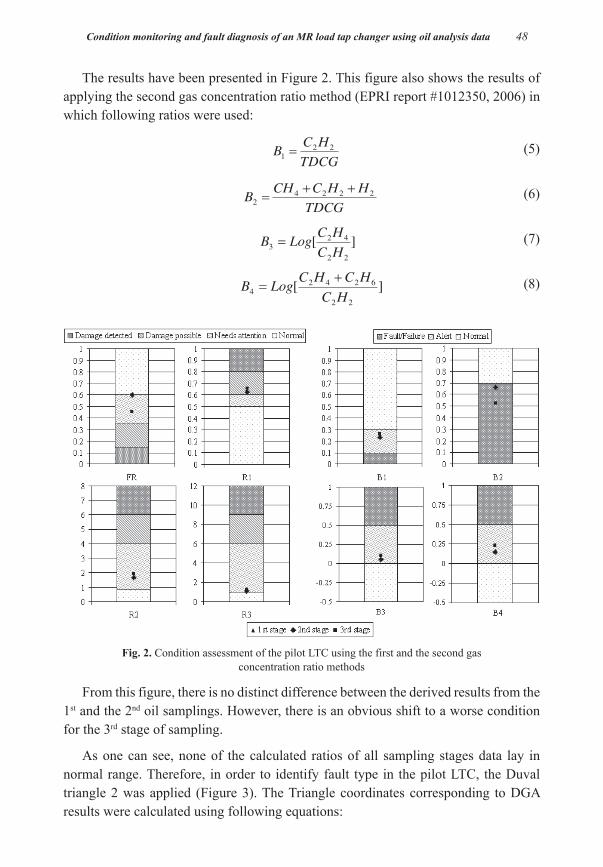
The results have been presented in Figure 2. This figure also shows the results of applying the second gas concentration ratio method (EPRI report #1012350, 2006) in which following ratios were used:
(5)
(6)
(7)
(8)
Fig. 2. Condition assessment of the pilot LTC using the first and the second gas concentration ratio methods
From this figure, there is no distinct difference between the derived results from the 1st and the 2nd oil samplings. However, there is an obvious shift to a worse condition for the 3rd stage of sampling.
As one can see, none of the calculated ratios of all sampling stages data lay in normal range. Therefore, in order to identify fault type in the pilot LTC, the Duval triangle 2 was applied (Figure 3). The Triangle coordinates corresponding to DGA results were calculated using following equations:

H. Molavi and A. Zahiri 49
(9)
(10)
(11)
Regarding Figure 3, the crossing point for all sampling stages located in X3 section, which corresponded to in progress thermal fault with light coking or increased resistance of the contacts or severe arcing. Therefore, it was recommended to test or inspect the LTC for signs of faults. However, this was in spite of the fact that the number of tap changes was very low (much lower than 80,000) and the number of years since last overhaul was less than seven years (the recommended overhaul criteria by the manufacturer).
Fig. 3. Fault diagnosis of the pilot LTC by means of the Duval triangle 2

Condition monitoring and fault diagnosis of an MR load tap changer using oil analysis data 50
Interpretation of derived data from analyses of dissolved metals and suspended particles in oil
Concentrations of different elements have been shown in Figure 4. Since there was not any quantitative data for particles in LTC's oil in the literature, the derived results were compared to each other. Furthermore, it was attempted to relate the materials in the oil samples to the specific material in the LTC construction, external contamination or as a product of oil deterioration.
Fig. 4. Elements’ concentrations (ppm) in the oil samples
As one can see, copper, the main element of the contacts, had the most concentration, especially in the 3rd stage of sampling. The presence of nickel, chrome, iron, aluminum, vanadium, molybdenum, titanium and zinc in the oil sample was attributed to wear of contacts. Regarding the conversations with the manufacturer, these elements were ingredients of the contacts. On the other hand, calcium, sodium and magnesium were related to oil additives and silicon was ascribed to be a result of dirt and external contaminants in the insulating oil.

H. Molavi and A. Zahiri 51
In Figure 5, optical microscopy images of the oil specimens for three oil sampling stages have been presented at 50x and 500x magnifications. As it is observed, the particles had the most densities in the 3rd stage sampling, which was a sign of oil low cleanliness level due to oil mixing in non-standard sampling conditions.
Fig. 5. Optical microscopy image of a) the 1st stage, b) the 2nd stage and c) the 3rd stage oil sampling
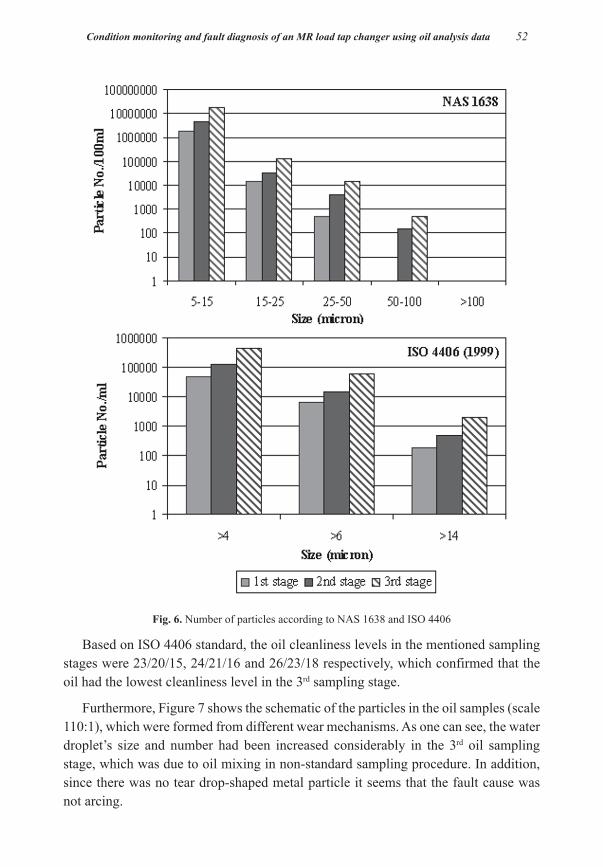
Figure 6 depicts the particle size distributions based on NAS 1638 and ISO 4406 standards for three oil sampling stages. These diagrams show that the number of particles in the oil had increasing trend, in order that the number of particles in oil in the 3rd stage was much more than that of the 2nd stage and also the number of particles in the oil in the 2nd stage was more than that of the 1st stage. It could be concluded that, the oil had the lowest cleanliness level in the 3rd stage of sampling.
Condition monitoring and fault diagnosis of an MR load tap changer using oil analysis data 52
Fig. 6. Number of particles according to NAS 1638 and ISO 4406
Based on ISO 4406 standard, the oil cleanliness levels in the mentioned sampling stages were 23/20/15, 24/21/16 and 26/23/18 respectively, which confirmed that the oil had the lowest cleanliness level in the 3rd sampling stage.
Furthermore, Figure 7 shows the schematic of the particles in the oil samples (scale 110:1), which were formed from different wear mechanisms. As one can see, the water droplet’s size and number had been increased considerably in the 3rd oil sampling stage, which was due to oil mixing in non-standard sampling procedure. In addition, since there was no tear drop-shaped metal particle it seems that the fault cause was not arcing.

H. Molavi and A. Zahiri 53
Fig. 7. The schematic of the particles in three stages of oil sampling
The distributions of particles formed by different wear mechanisms in three stages of oil samplings have been depicted in Figure 8. This reveals that, the dominant mechanism of metallic particles’ formation was fatigue mechanism, which was a resultant of contacts heating and cooling cycles.

Condition monitoring and fault diagnosis of an MR load tap changer using oil analysis data 54
Fig. 8. The distribution of particles formed by different wear mechanisms
In addition, particles number distribution based on their formation mechanism has been shown as a column diagram in Figure 9. Number of total particles showed a significant increase in the 3rd sampling stage compared with that of the former sampling stages.
In conclusion, regarding the oil low cleanliness level, oil replacement or filtration was advised. Furthermore, it seemed that the contacts were suffering from different wear mechanisms especially fatigue. Therefore, overhauling and visual inspection were recommended.

H. Molavi and A. Zahiri 55
Fig. 9. Particles number distribution based on their formation mechanisms
Interpretation of data from breakdown voltage measurements
The results of breakdown voltage measurements for three oil sampling stages were 68, 51.8 and 19.2 kV, respectively. The parameter had decreasing tendency, but its values met the standards in the 1st and 2nd sampling stages. In the 3rd sampling stage, a value of 19.2 kV was obtained, which was much lower than acceptable criteria. However, due to non-standard sampling condition in the mentioned stage, no more conclusions could be reached.
Visual inspection results
By considering the conclusions from interpretation of the obtained data from different oil analyses, the pilot LTC was overhauled and visual inspection of its mechanism was performed. Physical inspection revealed that, the oil was dark, with low quality. This was in good agreement with the predicted results obtained from oil analysis data.
Figure 10 presents the contacts of the pilot LTC on which wear and cocking signs are obvious. It is noteworthy that, contacts wear was foretold by particle analysis of the oil samples. Furthermore, the contacts' cocking was also predicted well by dissolved gas analysis.

Condition monitoring and fault diagnosis of an MR load tap changer using oil analysis data 56
Fig. 10. Eye inspection of the contacts of the pilot LTC
CONCLUSIONS
Condition monitoring and fault diagnosis of an MR load tap changer (LTC) was performed using different oil analyses consisted of DGA, breakdown voltage measurement, dissolved metals and suspended particles in oil. The oil samplings were done in three stages and in nearly three-month intervals. Analyzing of the oil samples for dissolved gases was performed considering ASTM D3612 standard. Furthermore, analyses of dissolved metals and suspended particles in oil samples were conducted according to ISO4406, NAS1638 and ASTM D7151 standards. Finally, the breakdown voltage was measured using ASTM D1816 standard.
DGA data interpretation was done applying the LTC monthly watch criteria, two different gas concentration ratio methods and the Duval triangle 2. This interpretation revealed that there were in progress thermal fault with light coking or increased resistance of the contacts or severe arcing in the LTC. Therefore, overhauling of the equipment was strongly recommended. However, this was despite the suggested overhaul criteria by the manufacturer, which recommended no overhaul for the pilot LTC at that time.

H. Molavi and A. Zahiri 57
The results from other analyses were used for determining contacts condition, wear mechanism and oil cleanliness level. The data interpretation disclosed the decreasing trend of the oil cleanliness level. Therefore, the recommended decision was replacing or filtering the oil in near future. Furthermore, the main contact wear mechanism was determined to be fatigue due to contacts heating and cooling cycles.
After the last oil sampling, the pilot was overhauled. It is worth noting that, the results from overhaul and visual inspection of the LTC were in good agreement with the interpretation of the extracted data from different oil analyses. This confirms that, the different employed oil analyses could be applied for condition monitoring and fault diagnosis of LTCs.
ACKNOWLEDGMENTS
The authors would like to acknowledge Niroo Research Institute (NRI) and also Mr. Marjanmehr, Mr. Jalali and Mr. Fathi for supporting this research. We also gratefully acknowledge the colleagues in Niroo Research Institute (NRI): Mr. Zhaam, Mr. Ahmadi, Mr. Ghadimi and also Dr. Porkar from Iran Grid Management Company (IGMC). Furthermore, special thanks go to Mr. Mosalrezaei, Mr. Ma’refat and Mr. Asgari from Esfahan Regional Electric Company (EREC) for their cooperation and providing the pilot LTC.
REFERENCES
ASTM Standard D1816. 2012. Standard test method for dielectric breakdown voltage of insulating oils of petroleum origin using VDE electrodes. Vol. 10.03.
ASTM Standard D 3612-02. 2009. Standard test method for analysis of gases dissolved in electrical insulating oil by gas chromatography. Vol. 10.03.
ASTM Standard D 3613-98. 1998. Standard practices for sampling electrical insulating liquids. Vol. 10.03.
ASTM Standard D 6786-02. 2002. Test method for particle count in mineral insulating oil using automatic optical particle counters. Vol. 10.03.
ASTM Standard D 7151-05. 2005. Electrical insulating liquids and gases; electrical protective equipment, standard test method for determination of elements insulating oils by inductively coupled plasma atomic emission spectrometry (ICP-AES). Vol. 10.03.
Cox. R.: The benefits of on-line DGA tap changer monitoring. www.weidmann-diagnostics.com
Duval, M. 2006. Dissolved gas analysis and the Duval triangle. The Fifth AVO New Zealand International Technical Conference. Methven, New Zealand.
Duval, M. 2008A. Calculation of DGA limit values and sampling intervals in transformers in service. IEEE Electrical Insulation Magazine, 24, 5: 7-13.
Duval, M. 2008B. The Duval Triangle for Load Tap Changers, Non-Mineral Oils and Low Temperature Faults in Transformers. IEEE Electrical Insulation Magazine, 24, 6: 22-29.
EPRI Report #1001946. 2001. Development of Load Tap Changer Monitoring Technique: Mechanism of Coking.

Condition monitoring and fault diagnosis of an MR load tap changer using oil analysis data 58
EPRI report #1006654. 2001. Transformer Load Tap Changer Management, Diagnostics, Contact Coking, and On-line Oil Filtration.
EPRI report #1012350. 2006. New Equipment and Performance Design Review – LTC Management Course Materials.
Erbrink, J., Gulski, E., Smit, J. & Leich, R. 2009. Experimental model for diagnosing on-load tap changer contact aging with dynamic resistance measurements. The 20th International Conference on Electricity Distribution. Prague, Czech Republic, 1-17.
Handley, B., Redfern, M. & White, S. 2001. On load tap-changer conditioned based maintenance. IEE Proceedings Generation, Transmission and Distribution, 148, 4: 296-300.
IEEE Standard C57.139. 2010. IEEE Guide for Dissolved Gas Analysis in Transformer Load Tap Changers.
ISO 4406. 1999. Hydraulic fluid power -- Fluids -- Method for coding the level of contamination by solid particles
Levand, L. & Griffin, P. 2004. Condition assessment of oil circuit breakers and load tap-changers by the use of laboratory testing and diagnostics, NETA World. 1-4.
Levand, L. 2007. Metals Analysis in Transformers, Load Tap-Changers and Oil Circuit Breakers, NETA World. 1-4.
Lyonnet, P. 1991. Maintenance planning- methods and mathematics, Chapman and Hall, New Delhi, India.
Mackenzie, E.A., Crossey, J., De Pablo, A. & Ferguson, W. 2010. On-line monitoring and diagnostics for power transformers, application to on-load tap-changers. IEEE International Symposium on Electrical Insulation. San Diego, California, USA, 1-5.
Muhamad, N.A., Phung, B.T, Blackburn, T.R. & Lai, K.X. 2007. Comparative study and analysis of DGA methods for transformer mineral oil. IEEE Lausanne Power tech. Lausanne, Switzerland, 45-50.
NAS 1638. 2001. Cleanliness requirements of parts used in Hydraulic systems. Aerospace Industries of America, Washington D.C., USA.
Redfern, M.A. & Handley, W.R.C. 2001. Duty based maintenance for on-load transformer tap changers. IEEE Power Engineering Society Summer Meeting. Vancouver, BC, Canada, 1824-1829.
Schellhase, H.U., Wilye, I., Lau, M. & Ward, B. 1999. Load tap-changer diagnostics: a critical review of the past ten years. Electrical Power Research Institute (EPRI).
Schellhase, H., Pollock, R.G., Rao, A.S., Korolenko, E.C. & Ward, B. 2002. Load tap changers: Investigations of contacts, Contact wear and contact coking. The Forty-Eighth IEEE Holm Conference on Electrical contacts. Orlando, USA, 259-272.
Youngblood, R., Baker, C., Jakob & F., Perjanik, Application of dissolved gas analysis to load tap changers. www.weidmannacti.com
Open Access: This article is distributed under the terms of the Creative Commons Attribution License (CC-BY 4.0) which permits any use, distribution, and reproduction in any medium, provided the original author(s) and the source are credited.
Submitted: 5-5-2014
Revised: 31-10-2014
Accepted: 8-11-2014