wacker biosolutions – chemistry for life 2018
TRANSCRIPT

WACKER BIOSOLUTIONS –Chemistry for Life
Annual Report
2018

WACKER at a Glance
As an innovative chemical company, WACKER makes a vital contribution to improving the quality of life around the world. We want to continue developing and supplying solutions that meet our own expectations of adding value for
our customers and shareholders, and of growing sustainably.
€ million 2018 2017 Change in %
Results / ReturnSalesEBITDA 1
EBITDA margin 2 (%)EBIT 3
EBIT margin 2 (%)
Financial resultIncome from continuing operations before income taxesIncome from continuing operationsIncome from discontinued operationsNet income for the year
Earnings per share from continuing operations (basic / diluted) (€ )Earnings per share (basic / diluted) (€ )ROCE (%)
Financial Position / Cash FlowsTotal assetsEquityEquity ratio (%)Financial liabilitiesNet financial debt 4
Capital expenditures (continuing operations) 5
Depreciation (continuing operations) Net cash flow (continuing operations) 6
Research and DevelopmentResearch and development expenses (continuing operations)
EmployeesPersonnel expenses (continuing operations)Employees (December 31, number)
1
2
3
4
5
6
EBITDA is EBIT before depreciation and amortization.Margins are calculated based on sales.EBIT is the result from continuing operations for the period before interest result and other financial result, and income taxes.Sum of cash and cash equivalents, noncurrent and current securities, and noncurrent and current financial liabilities.Excluding acquisitions.Sum of cash flow from operating activities (excluding changes in advance payments received) and cash flow from long-term investing activities (before securities), including additions due to finance leases.
4,978.8 4,924.2 1.1930.0 1,014.1 -8.3
18.7 20.6 n.a.389.6 423.7 -8.0
7.8 8.6 n.a.
-65.2 -96.3 -32.3324.4 327.4 -0.9260.1 250.1 4.0
- 634.7 -100.0260.1 884.8 -70.6
4.95 4.85 2.24.95 17.45 -71.6
5.9 7.5 n.a.
7,118.7 6,835.7 4.13,145.5 3,169.3 -0.8
44.2 46.4 n.a.997.2 1,001.6 -0.4609.7 454.4 34.2460.9 326.8 41.0
-540.4 -590.4 -8.5124.7 358.1 -65.2
164.6 153.1 7.5
1,231.5 1,198.0 2.814,542 13,811 5.3

Key Events in 2018 2 WACKER BIOSOLUTIONS – Chemistry for Life 3
a
For Our ShareholdersLetter to Our Shareholders 29 Executive Board 33 Report of the Supervisory Board 34 WACKER Stock in 2018 38
b
Combined Management ReportGroup Business Fundamentals 43 Goals and Strategies 49 Management Processes 50 Statutory Information on Takeovers 53 Business Report 54 Earnings 59 Net Assets 64 Financial Position 67 Further Information on R&D, Employees, Procurement, Production, Sales and Marketing 70 Management Report of Wacker Chemie AG 77 Risk Management Report 81 Outlook 97
Annual Report
2018
c
Consolidated Financial StatementsStatement of Income 105 Statement of Comprehensive Income 106 Statement of Financial Position 107 Statement of Cash Flows 108 Statement of Changes in Equity 109 Reconciliation of Other Equity Items 110 Segment Information by Division 111 Segment Information by Region 112 Notes of the WACKER Group 113 Declaration by the Executive Board on Accounting Methods and Auditing 174 Reproduction of the Independent Auditor ’s Report 175
d
Further Information Supervisory Board, Executive Board,
Corporate Governance Report and Non-Financial Report
Supervisory Board 183 Executive Board 184 Corporate Governance Report and Declaration on Corporate Management 185 Separate Non-Financial Statement Combined for the WACKER Group and for Wacker Chemie AG 197 Limited Assurance Report of the Independent Auditor 211 Multiyear Overview 213 Chemical Glossary / Financial Glossary 215 List of Tables and Figures 218 Index 219
WACKER BIOSOLUTIONS combines chemical expertise with biotech
know-how. In biotechnology, it is often the smallest building blocks that
have the greatest effect – for instance, in the production of therapeutic
proteins for the pharmaceutical industry.
WACKER BIOSOLUTIONS
Chemistry for Life

JanuaryThe Bavarian government com-mended WACKER for its policy of work place inclusiveness. Johannes Hintersberger, State Secretary at the Bavarian Ministry of Social Affairs, presented Wacker Chemie AG with the “Inclusion in Bavaria – We Work
Together” emblem.
WACKER BIOSOLUTIONS began producing fermentation-generated
cystine at its site in León, Spain.
Germany’s chemical industry opened its gates to the public. WACKER opened its Burghausen and Nünchritz sites and Munich-based central re-search facility for the event. More
than 25,000 visitors turned up.
OctoberWACKER presented the Alexander Wacker Innovation Award in the product-innovation category to two Burghausen-based chemists. They developed binders for producing especially high-performing adhe-sives, sealants, wood varnishes and
coating materials.
NovemberAt the China International Import Exhibit ion ( CI IE ) in Shanghai, WACKER’s booth attracted numerous visitors interested in new tech-nologies such as 3D printing with silicones. WACKER Executive Board members Dr. Rudolf Staudigl and Dr. Christian Hartel were there, wel-coming guests such as Christian Hirte, Parliamentary State Secretary at Germany’s Federal Ministry for
Economic Affairs and Energy.
SeptemberAt the European Silicon Days in Saarbrücken, Dr. Herbert W. Roesky, Emeritus Professor of Inorganic Chemistry at the Georg-August Uni-versity of Göttingen, was presented with the WACKER Silicone Award for his work on low-valence silicon
chemistry.
JuneWACKER joined the “Familienpakt Bayern” network (Family Pact Bavaria) of the Bavarian government and Bavarian industry. By doing so, the company underscored its goal of promoting a family-friendly corpo-
rate culture.
AprilWACKER acquired a production plant for biopharmaceuticals from SynCo Bio Partners Luxembourg S. à. r. l. The new subsidiary, Wacker Biotech B. V.,
is based in Amsterdam.
WACKER opened a new production site for silicone elastomers in Jincheon, South Korea. The new plant manufac-tures silicone sealants and specialty silicones for the electronics industry.
MarchAt the Bavarian Young Scientists Competition, which WACKER spon-sors, 79 budding scientists presented their scientific and technical projects
to a specialist jury in Munich.
MayThe Bavarian government recognized WACKER as a family-friendly company. Participating in the state’s “Success-ful. Family-Friendly” corporate com-petition, WACKER was commended for its exemplary support in reconciling
family life and work.
Following the loss event at the Charleston, Tennessee (USA) site in September 2017, WACKER gradually began ramping up the production facilities again. WACKER is also con-structing a new plant for pyrogenic
silica there.
Key Events
2018
JulyBavaria’s Premier, Dr. Markus Söder, visited the Burghausen plant. He was met by Dr. Peter-Alexander Wacker (Supervisory Board chairman), Dr. Rudolf Staudigl (president and CEO) and site manager Dr. Dieter Gilles. They explained Burghausen’s importance as the oldest and larg-est site in the Group’s production
network.
2
Wacker Chemie AG – Annual Report 2018
Key Events – 2018

The name of our business division, WACKER BIOSOLUTIONS, says it all: “BIO” stands for the goal of continuing to expand the innovative biotech products and processes that WACKER has developed with almost 30 years’ experience. “SOLUTIONS” means we not only offer our customers individual products, but also tailored and innovative end-to-end solutions. WACKER optimally combines its extensive chemical expertise with its biotech know-how, investing strategically in a growth field with huge
potential for our future business.
Biotechnology
Chemistry for Life
3
WACKER BIOSOLUTIONS – Chemistry for Life

New Name2010 marked a turning point. The fine chemicals division became the biotech arm – with WACKER FINE CHEMICALS being renamed WACKER BIOSOLUTIONS. A small part of the traditional fine-chemicals business remained, but the focus for the future has changed to biotechnology. The new name says it all. “BIO” stands for the goal of continuing to expand the innovative biotech products and process-es that WACKER has developed with almost 30 years’ experience. “SOLUTIONS” indicates that WACKER offers its customers not only individual products, but increasingly also customized and innovative end-to-end solutions.
The future belongs to biotech products. Today, biotech-nology is an innovation driver for key industrial sectors that WACKER supplies with products and applications. The potential is great. The biologics market alone is expanding at projected annual growth rates of around
9 percent.
New TerritoryWACKER’s first line of biotech products saw the light of day in the early 1990s: cyclodextrins – ring-shaped sugar molecules produced in bioreactors were initially used in medicines, for stabilizing active ingredients and improving their solubility. The first products were heartburn tablets, eye drops, nasal sprays and mouthwashes. A little later, an entirely new application area opened up for the sugar
molecules, namely textiles.
In this application, cyclodextrins even made an appear-ance on German television in 2001. Here, a farmer was seen mucking out his stables wearing a business suit; the same suit was then worn by a refuse collector emptying garbage cans; and, finally, sprayed with liquid manure. You could throw almost anything at this treated garment and it wouldn’t harbor smells, they were mopped up
by the cyclodextrins.
Since then, the number of application areas has prolifer-ated. Today, cyclodextrins are used as additives in face and body care products, as fat-free emulsifiers in foods,
Cyclodextrins consist of glucose units bonded together
in the form of a ring. The sugar molecules have a cavity
in their interior. They can capture other molecules and
retain them.
Biotechnology Solutions
Our Business at a Glance
as carriers for pharmaceuticals or as odor-masking agents in household cleaners. Cyclodextrins from WACKER be-came known throughout the world under the trade names
CAVASOL® and CAVAMAX®.
Global Biotechnology Market in US$ Billion
400
200
02018 20242019 2020 2021 2022 2023
230
383
OH
OH
OH
OH
OH
OH
OH
OH
OH
HOHOHO
HO
HO
HO
HO
HO
HO
HOHO
O
OO
O
O
O
O
O
O OO
O
O
O
4
Wacker Chemie AG – Annual Report 2018
WACKER BIOSOLUTIONS –

10% GrowthWACKER BIOSOLUTIONS sales totaled some € 227 million last year – a rise of 10 percent on the previous year. Alongside specific smaller acquisitions, WACKER BIOSOLUTIONS’ priority
for the coming years is strong organic growth.
3 Target Markets When it comes to developing new applications and prod-ucts, WACKER BIOSOLUTIONS primarily focuses on the target markets of pharmaceuticals, food and agri culture. This includes the natural amino acid cysteine, which WACKER produces in a patented fermentation process that it developed itself. The food industry uses cysteine in the manufacture of flavorings or as an additive in baked goods, while the pharmaceutical sector relies on the amino acid as an adjuvant in expectorants or to pro-duce insulin, for instance. Another specialty of WACKER BIOSOLUTIONS is the contract manufacturing of pharma-ceutical proteins via microbial systems. Polyvinyl acetate solid resins, fine chemicals and complex organic building
blocks for synthesis round out the portfolio.
7 Production Sites WACKER operates 24 production sites around the world. Seven of them belong to the WACKER BIOSOLUTIONS net-work – from Eddyville in Iowa, USA, to Burghausen, Jena and Halle in Germany, and Nanjing in China. In 2018, the business division expanded its global value-creation network with two further production sites at León in
Spain and Amsterdam in the Netherlands.
4 Competence CentersAt its technical competence centers, WACKER develops tailor-made products and applications for its customers. In order to find solutions for every market that meet local requirements, the technical-center network spans three continents – from Adrian in North America to Burghausen in Europe and Singapore in Asia. The division’s fourth technical center will soon be opening in Shanghai and
will focus specifically on food.
700 EmployeesThe number of WACKER BIOSOLUTIONS employees has risen steadily over recent years. Since the division’s restructuring in 2010, the workforce has almost doubled. With the acquisition of the production site for biologics, live bacteria and vaccines in Amsterdam in the Nether-lands, staff numbers rose by around 110 in 2018 alone. WACKER BIOSOLUTIONS now employs a total of almost
700 people.
31 % The Americas 45 % Europe
19 % Asia 5 % Rest of the world
5
3119
45
€ 227 million
a
Chromatography at the Jena site: clean up
during the manufacture of biopharmaceuticals
a
b
Staff member at the fermentation plant
in León, Spainb
5
Wacker Chemie AG – Annual Report 2018
At a Glance

WACKER BIOSOLUTIONS has undergone an exemplary process of transformation.
What is the new core business?Gerhard Schmid: In 2010, we restructured completely, clearly focusing our organization on the market. Today, we concentrate on our customers’ needs in the core markets of food and pharmaceuticals. We have been very successful in this in recent years. Since we restructured the division, we have increased sales from € 100 million to
over € 220 million.
Biologics are considered a growth market.
Gerhard Schmid: There is a major shift in the pharma-ceuticals market toward bioengineered medicines. Where chemical molecules were used in the past, medical pro-fessionals now rely on biologics. As a biologist, I think these new treatments are marvelous. Our own body cells can be reprogrammed to specifically attack a tumor, for example. Another incredibly fascinating approach is the
use of gene therapy to treat epilepsy or Alzheimer’s.
What role does WACKER BIOSOLUTIONS play here?
Gerhard Schmid: We are well-positioned as a service provider for these novel treatments and now also have the capacity to take on new customers. Our production line in Amsterdam, which we acquired in 2018, is doubling
our capacity.
Amsterdam is a good example. WACKER BIOSOLUTIONS manufactures live bacteria there, as vaccines
among other things. What is this all about?Gerhard Schmid: Live bacteria that are used as vaccines, for example against cholera, must be produced under sterile conditions – that is without bacterial or viral con-tamination. This requires special techniques that only very few manufacturers possess and thus puts us in
somewhat of a unique position.
Interview with Dr. Gerhard Schmid, President of
WACKER BIOSOLUTIONS
How Biotech Enters All Areas of Our Lives
Ten Answers
Dr. Gerhard Schmid (64) has headed the WACKER BIOSOLUTIONS division since 2003. He has been
at WACKER since 1997.
6
Wacker Chemie AG – Annual Report 2018
WACKER BIOSOLUTIONS –

So, WACKER could essentially start developing medicines itself …
Gerhard Schmid: We do not want to be a pharmaceutical company. As a contract manufacturer, we offer compre-hensive service – and are growing more strongly than the market. We are developing cell lines for new pharma-ceutical proteins, for example for cancer treatments. Our technologies have an excellent reputation and help produce these proteins more cost-efficiently. We have no desire to develop and sell pharmaceutical prod-
ucts ourselves.
What are your main areas of focus in the food sector?
Gerhard Schmid: The food market is an important pillar for us. It is stable, expansive and heterogeneous – and is growing considerably in certain areas. As the world’s biggest producer of gumbase for chewing gum, we have been an active player in this sector for decades. As well as this, we have pursued the healthy-eating megatrend
in recent years.
How exactly does WACKER contribute to healthy eating?
Gerhard Schmid: We are, for example, very successful in marketing a cyclodextrin-encapsulated curcumin prod-uct that we developed ourselves. It has been proven that curcumin, an extract from turmeric, has a strong anti- inflammatory effect. Our product CAVACURMIN® is char-acterized by its particularly high bioavailability – the human body can absorb forty times more curcumin from
this product than it would otherwise.
Cysteine is also used in the food sector. It had previously been obtained from feathers,
human hair or pig bristles. WACKER has developed a new process.
Gerhard Schmid: We are the first company to succeed in producing cysteine by fermentation. It is vegetarian- grade and, at the same time, eliminates the need for large quantities of hydrochloric acid. That’s why we won
an environmental award for our process. At our new site in León in northern Spain, we now have a fermentation plant where we can manufacture cystine, which is con-verted into cysteine via electrolysis. Cysteine is not only used in the food sector. It is also an important raw mate-rial in the pharmaceutical industry for manufacturing
expectorants and biopharmaceuticals.
WACKER BIOSOLUTIONS is highly innovative when it comes to cyclodextrins as well. Your
scientists frequently develop new applications here. What are the most promising ones?
Gerhard Schmid: We are the only manufacturer able to produce all three forms of this natural degradation prod-uct of starch on an industrial scale. The lion’s share of our production takes the form of beta-cyclodextrin for room sprays that neutralize odors. We are continually finding new applications for alpha- and gamma-cyclodextrins They are magical molecules! You can mix vegetable oil with cyclodextrin, for example, to obtain an egg-free vegetarian mayonnaise. You can also whip cyclodextrin up with honey to make a mousse. What’s more, it can
mask bitter tastes.
Where do you see the business division in five to ten years?
Gerhard Schmid: Growth will continue. We expect rates in the double-digit percentage range. The investments and acquisitions of the past months present a huge opportunity, because we can now show that we are a chemical company capable of operating a large part of our business on a biotechnological basis with renewable
raw materials over the long term.
7
Wacker Chemie AG – Annual Report 2018

a
8
Wacker Chemie AG – Annual Report 2018

With its high, red-brick walls, the building looks almost like a fortress Except for the vaulted glass roof at its center. It allows daylight into WACKER’s new site in Am-sterdam, lending it a bright and welcoming atmosphere. The microorganisms with which the biotechnologists work here also resemble tiny fortresses: each individual cell is protected against harmful influences by a mem-brane, much like a wall. Nevertheless, there are ways
and means of getting in.
WACKER experts can make the membranes temporarily permeable in order to insert genomic fragments. This is the first step in a production process that ultimately yields finished biologics. “That’s how we, as a contract manufacturer, produce active ingredients for pharma-ceutical and biotech companies,” says Dr. Susanne Leonhartsberger, managing director of Wacker Biotech GmbH, who is responsible for the biologics business.“ We are able to run this process on both a small and a large scale, for clinical development phases to get approval for a drug, but also to subsequently supply the
commercial market.”
Making Use of Natural Talents – Producing Biologics
Acquired in April 2018, the new Amsterdam site joins Jena and Halle as Wacker Biotech’s third excellently equipped production plant. All three sites use microorganisms as miniature factories, so to speak, to manufacture pharma-ceutical actives. These very large and complex bio-molecules – biologics – are unreachable by the standard
techniques of synthetic chemistry.
“When it comes to developing biotech processes, we can
boast more than 200 successfully completed projects.”
Dr. Susanne Leonhartsberger, Managing Director of Wacker Biotech GmbH and
responsible for the biologics business
Beneficial Bacteria
Tomorrow’s Medicines
c
b
a
World-class production: Wacker Biotech GmbH
produces active proteins for pharmaceuticals in Jena,
Halle and Amsterdam.
b
Dr. Susanne Leonhartsberger has been responsible for
biologics business at WACKER since 2017.
c
The new Wacker Biotech B. V. site in Amsterdam.
9
Tomorrow’s Medicines

d
f
e
g
h
d
Gauge for monitoring the pressure in the fermenter.
e
Pharmaceutical companies use active proteins from
WACKER in their production.
f
Bacteria from cell banks are cultivated for biopharma-
ceutical production.
g
Preparations for active ingredient production.
h
High-throughput analytics in the lab.
10
Wacker Chemie AG – Annual Report 2018

Bacteria, on the other hand, with their sophisticated metabolic pathways, once again demonstrate their exceptional skills as chemists. However, these naturally talented microorganisms can only be employed for the large-scale production of actives if as many of them as possible can be “made happy” at the same time. This is the function of the fermentation plants at each of the sites. These giant steel tanks contain nutrient broth, in which customized bacterial strains swim, grow and multiply – and in doing so produce the desired active ingredient.
Microorganism Boot CampThe Amsterdam site doubles Wacker Biotech’s capacity with two further fermentation lines of 270 and 1,500 liters respectively. “Furthermore, our Dutch biotech experts have experience with a wide variety of production organ-isms and live bacteria, for example for a cholera vaccine. Our teams in Jena and Halle, in turn, are experts in work-ing with Escherichia coli bacteria,” says Leonhartsberger.
The general procedure is usually the same: a circular piece of genetic material – a so-called plasmid – is trans-ferred into the microorganism. The genes it contains induce the bacterium to produce the desired protein. The plasmid is passed on from one generation of bacteria to the next, ensuring that each generation manufactures
the biomolecule.
Once the microorganisms have produced sufficient amounts, WACKER experts stop the fermentation process and purify the tank’s content in several steps. Cell com-ponents, pieces of genetic material and undesired proteins are separated by centrifugation and chroma-tography, for example. The final product is the pure active ingredient as commissioned by the customer. Live bacteria are sometimes also used without altering the
genetic material.
Biotech Partner to the Pharmaceutical IndustryWACKER already has over 20 years of experience in the field of microbial production. With the takeover of Jena- based ProThera GmbH, later renamed Wacker Biotech GmbH, 13 years ago, WACKER became a contract manu-facturer of pharmaceutical proteins, or CDMO (contract development and management organization). This line of business has been growing steadily since then. In 2014, with the acquisition of Scil Proteins Production in Halle, a second site came on stream. This doubled the number of production plants. “A high level of expertise is needed to get bacteria to efficiently manufacture very pure ac-tives in large amounts. In addition, the required technical equipment is expensive. It is, furthermore, risky to invest in the full production equipment, because during the early development stages, pharmaceutical companies do not know whether their active ingredients will make it
through the clinical phases and approval marathon,” explains Leonhartsberger, a doctor of biology, who began
her career at WACKER 17 years ago.
Top Quality from a Single SourceThat’s why pharmaceutical companies increasingly outsource this part to contract manufacturers. Industry experts expect global demand for contract manufactur-ing to continue on its growth trajectory and increase by 8 percent per year. Wacker Biotech recognized this trend in good time by acquiring SynCo Bio Partners B. V.
in Amsterdam in April 2018.
As of November 1, 2018, the Dutch site has been renamed Wacker Biotech B. V. – and is managed together with the two German sites in Jena and Halle. “We place great emphasis on offering our customers a uniform standard of quality,” says Leonhartsberger. “We want to supply pharmaceutical companies from a single source. We are now well-equipped to do so with Jena, Halle and Amster-dam, where we can also fill actives in sterile conditions.”
Microorganisms Produce Therapeutic Anti-Cancer Agents
Each of the three sites has its own specialties, such as different technologies, specific fermentation plants, accompanying biotech processes or downstream steps, as well as the necessary expertise of the respective teams. Jena focuses on the so-called ESETEC® technol-ogy, a process developed and patented by WACKER. The key here is that “normally, bacteria keep the proteins they produce in the cell, including the desired actives,” explains Leonhartsberger. “This, however, makes releas-ing and purifying them laborious. In the ESETEC® secretion system, we use E. coli strains whose genomes we alter so that they secrete the desired proteins into the surround-
ing culture medium in soluble form.”
The bacteria essentially expel the actives from their cells, which is a great advantage, as the cells and proteins can then be easily separated by centrifugation. Eliminating elaborate purification steps saves costs. In addition, the process offers record yields of several grams per liter in many cases. Another advantage is that even complex biopharmaceuticals, such as antibody fragments, can be produced cost-effectively and efficiently. In 2014, the developers of the ESETEC® process received WACKER’s
in-house Alexander Wacker Innovation Award.
“We offer our customers in the pharmaceutical sector
everything from a single source – at three certified sites.”
Dr. Susanne Leonhartsberger
11
Wacker Chemie AG – Annual Report 2018
Tomorrow’s Medicines

Bacterial Clones in Cryogenic SleepAnother specialty of the Jena site is the manufacture of cell banks. These are like every individual customer’s golden treasure. Akin to a library, they hold rows of sev-eral hundred little glass vials in storage boxes. These contain millions of bacterial clones that WACKER has genetically modified for a specific job – swimming in suspensions and stored at cryogenic temperatures. In this way, they remain stable and reusable for decades.
“For safety reasons, we keep our cell banks in duplicate at two separate locations,” says Leonhartsberger. When-ever a customer wants to manufacture a specific active ingredient, the biotech experts go to the respective cell bank, take out bacteria and cultivate them in the fermen-ters to produce the biopharmaceutical. Jena has a 350-
liter plant for this purpose.
Heart Medication from FermentersThe fermentation line in Halle is more than four times that size. It has a capacity of 1,500 liters. This WACKER site also boasts another innovative technology: FOLDTEC®. “There are some proteins that simply remain insoluble in the bacterial cell,” explains Leonhartsberger. “This is the case, for example, with the active Reteplase – a protein that is used to treat acute heart attacks. It aggregates so much, that the bacteria cannot discharge it from the cell. To obtain such proteins from our custom-designed E. coli strains and make them available as actives, we
use FOLDTEC®.”
In a nutshell, while the desired proteins are synthesized in the correct sequence by the bacteria, they must also have exactly the right spatial structure – only then do they develop their activity. They cannot do this if they remain in the cells as insoluble inclusion bodies. With FOLDTEC®, the biotech experts are able to produce the proteins in large quantities in the cells, then extract them and convert them into their active form using special refolding techniques. By now, WACKER can draw on a wealth of knowledge in order to quickly identify optimum process parameters and folding conditions for customer
projects – and thus achieve high yields.
Optimal Filling of ActivesWACKER fills the active-ingredient solutions of low micro-bial count manufactured in Jena and Halle either into bottles or into plastic bags with a capacity of up to 50 liters
and delivers them to its customers for further processing. “The Amsterdam site’s fill-and-finish facility now affords us the possibility of filling sterile solutions directly into vials,” says Leonhartsberger. To this end, the facilities at the Dutch site comply with the highest cleanroom classi-fication – Class A. This means that there must be only very few organisms in each cubic meter of air. The room setup and cleaning procedures that employees must follow before entering are correspondingly elaborate. Additionally, Amsterdam has a lyophilization facility, where active ingredient solutions can be freeze dried.
This often improves their shelf life.
Individual Support with High-Tech Equipment“All this is a very good way to complement our service portfolio. We offer a flexible degree of vertical integration and cater to individual customer needs. In principle, it is enough for us just to have the gene sequence on paper – we then work out everything else individually together with the customer,” emphasizes Leonhartsberger. How-ever, there are also projects that require Wacker Biotech to produce active ingredients on an industrial scale for the commercial market on behalf of a pharmaceutical
company, for example, or to simply fill a product.
“The biologics business is growing
steadily. This success justifies our business model.”
Dr. Susanne Leonhartsberger
i
j
i
Quality control at the Halle site.
j
Tank for refolding proteins.
k
Proteins intended for therapeutic use from
the bioreactor must be purified in several steps.
This is done by filtration and chromatography.
12
Wacker Chemie AG – Annual Report 2018
WACKER BIOSOLUTIONS –

The new site has increased the company’s capacity. This expansion was urgently needed, as the plants at Halle and Jena were starting to reach their limits thanks to above-average growth. “The manufacture of biologics is time-consuming. Our production plants and all upstream and downstream steps are always booked for just one customer and thus occupied for several weeks or months,” explains Leonhartsberger. Then everything has to be cleaned meticulously, so that all of the equipment
is ready for the next customer order.
Wacker Biotech guarantees the highest quality standards in accordance with pharmaceutical cGMP (current Good Manufacturing Practice) at all three sites. At the same time, the technologies also represent speed. This is indispensable for fast approval and a real cost benefit for customers in the pharmaceutical sector – and ultimately
also the patients.
At the Heart of Pharmaceutical Innovations“I’m particularly motivated by the fact that we provide innovative medicines for sick people around the globe – this feeling affects most of us,” says Leonhartsberger. In Amsterdam, the biotech experts are currently working
on tailor-made bacteria that might help the smallest among us achieve a good start in life: specially designed bacteria are intended to provide a foundation for healthy intestinal flora in babies. Another conceivable applica-tion would be microorganisms that improve wound
healing for diabetics.
“The use of live bacteria is an exciting, future-oriented field, which our site in the Netherlands has now opened up for us,” says the WACKER expert. “It demonstrates once again that we are highly technology-driven and, together with our customers, do our best to bring innovative
treatments to patients.”
k13
Wacker Chemie AG – Annual Report 2018

A scent of bread dough and yeast wafts through the air. In the factory hall stands a long row of stainless steel tanks, around the largest of which stairs wind up to a height of three stories. The technical equipment hums loudly, though inside the tanks, billions of tiny biological factories are going about their work in silence: bacte-rial cells, each of them an independent production unit. Togeth er, they produce cystine, an amino acid used, for example, in the food and pharmaceutical industries. The only thing the bacteria need as a starting material
is glucose.
Biotech Expertise on a Growth TrajectoryWACKER’s site in León in northern Spain specializes in bioengineering this amino acid with the aid of micro-organisms. León is a city with a population of over 100,000 and a tourist hub – it is located on the well-known Camino de Santiago pilgrimage route. Microbiologists have been manufacturing bacterial products such as antibiotics here for over 50 years. WACKER is new to León. “We acquired the plant in León in 2016,” says Dr. Stefan Neumann, head of the Bioprocessing business line at WACKER. Since then, he has set up and expanded the site and its team bit by bit. The plant went into normal operation in late 2018.
Specialists for Food-Grade CystineLast fall, Neumann and his team were busy starting up the cystine production plant. At the same time, the WACKER biotechnologists got their production certified in accordance with applicable food-production regula-tions – as proof that the plant produces food-grade cystine. “We have long been supplying customers from the food sector with cysteine, but had so far not manu-factured it ourselves,” explains Neumann. Cystine con-sists of two cysteine molecules joined together. Industry predominantly uses the single amino acid, cysteine, which is obtained by splitting cystine. In León, WACKER specialists now produce cystine themselves. This offers several advantages: WACKER is no longer dependent on suppliers and is able to react to higher demand more quickly, while maintaining consistently high quality.
From Ready Meals to ExpectorantsThe amino acid has a wide range of possible applica-tions. As a food additive, cysteine creates a meaty flavor, even though it is vegetarian-grade itself. The amino acid is widely found as an additive in ready meals such as packet soups. It has a completely different function in large-scale bakeries. Here, cysteine removes gluten from
flour, making doughs easier to knead and process.
It plays a key role in the pharmaceutical industry as well. “Cysteine is often the starting material for active ingredi-ents found in effervescent tablets that help clear mucous. Specialty solutions that doctors use in the artificial feeding of patients also contain the amino acid,” says Neumann.
Bacteria as Production PlantsBefore WACKER’s cysteine can be used, the bacterial “synthetic chemists” must get to work in the fermenters. “Each one of our stainless-steel tanks has a capacity of 100,000 liters, but we start with just one milliliter,” explains Neumann. The biotech specialists divide this preculture into several larger vessels with correspondingly more growth medium. That’s how they increase the number of bacteria incrementally. The advantage of this method is continuous monitoring, which ensures that only the
desired microbes are cultivated.
Working with a Modified Safe StrainNeumann’s team focuses on a special subspecies of the Escherichia coli bacterium. This type of microbe has been used in laboratories around the world for decades. The WACKER specialists in León work with a so-called “safe strain.” It is modified so that it cannot survive outside of
“Each one of our stainless-steel
tanks has a capacity of 100,000 liters, but we start with
just one milliliter.”
Dr. Stefan Neumann, Head of WACKER’s Bioprocessing business field
Microbes as Factories
Cystine by Crowdsourcing
14
Wacker Chemie AG – Annual Report 2018
WACKER BIOSOLUTIONS –

c
a
b
a
Nutrient media are produced in the lab.
b
Dr. Stefan Neumann has been building up and expanding
the León site since 2016.
c
WACKER is the only company in the world to produce
the amino acid cystine in extreme purity by fermentation
using bacteria, with glucose and inorganic salts as
feedstocks.
15
Cystine by Crowdsourcing

the fermenters. In addition, WACKER has optimized the bacterial strain so that it makes as much cystine out of
glucose as possible.
When the culture in the fermenter has reached maximum density, the valuable product is taken out. “We then iso-late the cystine from the bacteria. We use centrifuges do to this, among other things,” says Neumann. That’s how the experts separate the nutrient broth’s constituents by density. The purified cystine end product is a white
powder that can be packaged and shipped.
Advantages over Conventional MethodsThanks to their sophisticated process, WACKER biotech-nologists are able to produce the complex cystine mole-cule from the raw material glucose. An advantage here is that the glucose used is purely plant-based, as it is obtained from grain. This means that the derivative cysteine is also vegetarian-grade, kosher and halal. The conventional method of obtaining cysteine, on the other hand, depends on animal hair, feathers or human hair as raw materials. These are broken down by hydrochloric acid, which splits the proteins into their amino-acid constituents. That’s how industrial chemists have long been obtaining cysteine on a large scale. “However, this method raises ethical concerns and is resource-inten-
sive, because it uses large amounts of hydrochloric acid,” emphasizes Neumann.
WACKER’s process is very different, as it only requires a fraction of the hydrochloric acid used conventionally. It won the company the 2008 Environmental Award from the Federation of German Industries (BDI). The biotech process is also ideal for standardizing production. “We have clearly defined media and starting materials for our cystine manufacture. Unlike processes based on animal hair, our raw materials are not subject to quality fluctua-tions,” explains Neumann. This is particularly important for the pharmaceutical and food industries, because these sectors demand very high quality and purity standards
for their raw materials.
A Long History and a Bright FutureLeón offered the WACKER team an ideal starting position for building up a high-quality manufacturing plant for cysteine. “The site’s long history has made the premises perfect for biotechnological production – from the delivery of raw materials to fermentation and purification, and shipment of the end product. We only had to look after minor modifications, such as an access airlock at the entrance to the fermentation hall, to ensure food-grade
production,” says Neumann.
d e
d
The WACKER team in León, northern Spain, includes
around 50 employees.
e
Drier for cystine production.
f
The site is perfectly designed for biotech
production.
16
Wacker Chemie AG – Annual Report 2018
WACKER BIOSOLUTIONS –

In order to fully utilize the fermentation capacity in the future, customer acquisition activities are running at full speed in the Sales department. The starting position is good. Primarily for ethical reasons, the mindset in the food industry is changing. “For some time now, we have been observing a trend away from animal-sourced cys-teine,” says Neumann. He is convinced that more and more companies will come on board and is already thinking of further products that could be produced by fermentation – although he does not want to reveal what they are. One thing is certain, however: the bacteria in León will not run out of work any time soon. So the fer-menter medium will continue to emit the aroma of yeast
and bread dough for the foreseeable future.
An extra floor with a laboratory has improved on-site analysis. In addition, there are many skilled employees in León who have experience with the large-scale implementation of fermentative production. “We made sure to bring WACKER’s corporate culture to northern Spain from the start,” stresses Neumann. This strategy has paid off: “The employees are highly motivated and hardworking, because they value WACKER as a reliable
and stable employer.”
Bright Outlook for Microbial CysteineNow that WACKER produces cysteine itself, it no longer relies on the contracting party that had previously supplied the amino acid. The company has also built up its biotech expertise and increased its added value. “ Integration of cysteine production was a logical step. The fact that we successfully completed the project to-gether with our team and brought it into routine operation is a milestone for our future business,” says Neumann. There are currently some 50 people working at the site, mostly in production – and staff numbers are set to increase. There is no shortage of space: the site prem-ises in León, northern Spain, covers around 100,000
square meters.
León – Site Facts and Figures:
“We made sure to bring WACKER’s corporate culture to northern
Spain from the start.”
Dr. Stefan Neumann
50Employees
100,000 m2Total area
800,000 lFermentation volume
€ 30 millionTotal investment
f
17
Wacker Chemie AG – Annual Report 2018
Cystine by Crowdsourcing
No egg, no milk, no meat. More and more people are voluntarily abstaining from animal products. Others are forced to ban some foodstuffs from their diets due to health issues such as intolerances and allergies. “Free from” products are gaining popularity. According to a recent survey, 24 percent of consumers said they had purchased this type of food in the past three months. Among 16-to-24-year-olds, the figure was as high as 40 percent. The food industry has responded by looking for new ingredients that preserve old tried-and-tested recipes, and familiar tastes and consistencies, while serving new trends: vegetarian, vegan and allergen free.
Cyclodextrins for the Perfect CakeAddressing this discrepancy calls for high-performance alternatives – such as WACKER’s cyclodextrins. These molecules are degradation products of natural starch. They are manufactured in the USA under the brand name CAVAMAX® W6 – in Eddyville, Iowa – the world’s largest
Partner to the Food Industry
corn-producing region. Here high-tech enzymes convert the corn starch into cyclodextrins, which consist of glu-cose molecules bonded together into rings. Depending on the number of molecules, i. e. the ring size, a distinction is drawn between alpha-, beta- and gamma-cyclodex-trins. While beta-cyclodextrins are used in room sprays to neutralize unpleasant odors, for example, alpha- and
gamma-cyclodextrins are used mainly in food.
The outer ring of the donut-like molecule is hydrophilic, which means water-loving; yet the interior cavity is lipo-philic, or fat-loving. That’s why cyclodextrins have ex-cellent emulsifying properties. They envelop fatty acid residues, thereby combining what would otherwise be
A 2013 EU test certificate confirmed
that alpha-cyclodextrin has a blood-sugar-lowering effect.
Food has to taste good. Consumers can all agree on that. Yet what they choose to put in their shopping baskets varies greatly, driven by many different factors such as look, texture or price. Demand is constantly changing – strongly
influenced by social development.
Health, convenience and sustainability are food- market trends. As a food-sector partner, WACKER supplies ingredients for dietary supplements and food incorporation into a wide range of
products including beverages, chewing gum, dairy products and baked goods. “We offer innovative solutions that respond to the food and nutrition industry‘s current challenges,” says Dr. Allison Haitz, who heads the Food busi-
ness unit at WACKER BIOSOLUTIONS.
Cyclodextrins, for example, ensure perfect egg- free cakes and nature-identical plant anti oxidants as dietary supplements can help to strengthen the immune system and reduce
cholesterol.
New Ingredients
Sugar Rings for Baking
18
Wacker Chemie AG – Annual Report 2018
WACKER BIOSOLUTIONS –

immiscible: fats and aqueous solutions. In grandmother’s kitchen, this was the task of eggs and lecithin, the emulsi-fier contained in egg yolk. It ensures even distribution of fats in cake dough and at the same time, has a stabilizing and frothing effect. In vegan cakes, alpha-cyclodextrins perform this task since they have a similar effect in com-bination with the fats and proteins of the other ingre-dients. The result is a stable dough that’s just as good as the egg-based alternative, and finally, a cake with
uniform pores.
WACKER cyclodextrins offer a convenient solution to those who want to bake without egg: the powder dissolves well in water and is easy to use. And there’s yet another advantage, particularly for large-scale bakeries: the cyclodextrins do not influence baking operations and the viscosity of the dough. This means that fine baked goods such as cakes can be produced in existing factories
without the texture or taste of the product changing.
Avoiding Trans Fats, Lowering Blood Sugar Sweet creations such as muffins, cupcakes and the like often have cocoa glazes or soft, melt-in-the-mouth fill-ings. Such delicacies often contain solid fats consisting of saturated fats and partially unhealthy trans fats. Here too, WACKER has an alternative: by using alpha-cyclodextrins, solid fats can be replaced with natural vegetable oils.
They ensure the necessary stability and serve as whip-ping aids at the same time. And that’s not all: the sugar rings render cream garnishes more heat-resistant, making them suitable for pastries in tropical countries where
temperatures often exceed 30 degrees Celsius.
But cyclodextrins do more than just serve the vegan trend and provide a practical ingredient for food manu-facturing. They also offer a health benefit: owing to the fact that blood sugar levels do not increase as much after eating a meal containing cornstarch if alpha-cyclodex-trins are present, the EU Commission certified them as having a health-promoting effect in 2013. Since then, foodstuffs containing at least five grams of alpha-cyclo-dextrin per 50 grams of starch in a quantified portion as part of a meal may now carry a label stating the blood-
sugar-lowering effect.
Experts at WACKER BIOSOLUTIONS want to use cyclodex-trins’ beneficial properties to find further application areas
for the “sugar genius” as an ingredient in foodstuffs.
Their emulsifying properties
make cyclodextrins multi-talents in kitchens and bakeries.
a b
c
a
Dr. Allison Haitz is head of the food business
at WACKER BIOSOLUTIONS.
b
CAVAMAX® W6 is water- soluble and uncomplicated
to process.
c
Sweet confections such as cupcakes are made heat-
resistant thanks to WACKER’s alpha-dextrins.
19
Wacker Chemie AG – Annual Report 2018
Food industry

c
b
a a
Cyclodextrins ensure high bioavailability
of curcumin.
b
Hydroxytyrosol used to be obtained from olives.
c
Turmeric contains the natural antioxidant curcumin.
20
Wacker Chemie AG – Annual Report 2018
WACKER BIOSOLUTIONS –

A Powerful PairingWhile hydroxytyrosol is soluble in water and readily absorbed by the body, health promoters such as cur-cumin extracted from turmeric are not – their drawback is low bioavailability. “To improve this, we use a trick and form complexes of the curcumin extracts with our cyclo-
dextrins,” explains Mohr.
In the product CAVACURMIN®, these ring-shaped sugar molecules enclose the natural substance. The outer ring of the cyclodextrin is hydrophilic, literally water-loving. This makes the complex water-soluble. A clinical study has verified that this increases curcumin bioavailability immensely – by a factor of 40 compared to conventional extracts. That’s good news for people suffering from rheumatic problems or irritable bowel syndrome, for ex-ample: curcumin can provide some relief here. “We want to develop applications with further plant substances to help people age healthily,” says Mohr. “We already have
our eye on several interesting candidates.”
To stay fit and look radiant as we age is something we all wish for. In Germany, life expectancy is rising from year to year. It is currently 78 years for men, while women live five years longer on average. Preventive healthcare plays an ever more important role here. Health-conscious lifestyles and the desire to do something beneficial for our bodies are fueling continuous nutritional-supplement market growth. “People of all ages are more and more concerned with preventing illness in the long term,” says Rachela Mohr, who is responsible for the development of
biologically active ingredients at WACKER.
Lowering Cholesterol – Following the Olive’s ExampleThe focus is on plant-based functional ingredients that have a positive effect on coronary health, immune response and cholesterol levels, for example. The latter has already been proven by a substance that is naturally found in olives: hydroxytyrosol. WACKER synthesizes this substance in a patented process under the trade name HTEssence®. “A human clinical study recently confirmed that our nature-identical product lowers the ‘bad’ choles-terol LDL by 8 percent. This, in turn, can reduce the risk
of heart disease,” explains Mohr.
Conventional extraction of hydroxytyrosol from olives and olive leaves is complex and the extract only contains a low percentage of the natural product. WACKER’s process yields hydroxytyrosol with a purity of up to 98 percent. “We can produce it on a large scale, ensuring consistent quality and meeting precise specifications – regardless of factors such as climatic conditions that affect olive
cultivation,” emphasizes Mohr.
“We produce highly pure, nature-
identical plant substances or improve the bioavailability of
natural products.”
Rachela Mohr, responsible for developing bioactive ingredients
The Power of Plants
Healthy from Within
d
CAVACURMIN® in the form of capsules.
21
Wacker Chemie AG – Annual Report 2018
Healthy from Within

Human sweat attracts them magically. Mosquitoes buzz purposefully towards their next meal, bite, and leave behind an unpleasant itch – sometimes even a dangerous pathogen. One way to keep insects away from the skin is to use mosquito repellants. These evaporate on the skin and form an invisible protective cover. When a mosquito approaches, it bounces off this scent barrier – until the
odor molecules have dissipated.
Cyclodextrins from WACKER keep this protective cover on the skin much longer. The ring-shaped sugar molecules can capture and hold other molecules. They enclose the active ingredient that drives away the mosquitoes and release it only in small doses. Tests have shown that the scent barrier lasts almost twice as long. This appli-cation was developed in the WACKER laboratories in
Burghausen.
And cyclodextrins from WACKER can do more than repel mosquitoes. They have many talents. The sugar mole-cules also trap foul-smelling sweat in sportswear. They can also conceal unpleasant taste, for example bitter sub-stances in green tea, or offer a new vegetarian alternative to stabilize oil-in-water emulsions such as mayonnaise.
At WACKER, new applications are always being researched. “In the world of cyclodextrins, many skills are hidden, some still unexplored,” says Mark Harrison, who is re-sponsible for industrial applications of cyclodextrins at
WACKER. He and his team are on the lookout for these hidden talents in the new WACKER laboratory in Adrian, USA. The laboratory is unique because it exclusively de-velops cyclodextrin products for industrial applications.
Forging Solutions with CyclodextrinsFor example, the WACKER team is working along with leading academic institutes to develop products for the automotive industry, such as self-repairing car paints. New polymers crosslinked with cyclodextrins help heal scratches in the paint in the future. “The aim is to ‘heal’ simple scrapes through heating so that no new paint is required,” explains Harrison. New solutions for water and wastewater management are also being researched in the WACKER laboratories. Cyclodextrins, for example, could be an alternative to conventional activated carbon to filter micropollutants including pesticides and pharma-
ceuticals out of the water.
Sugar rings could also be a safer option in the future for gold extraction and gold recovery, where until now very toxic chemicals such as cyanides have been used. The cyclodextrins are able to extract the gold content from a cocktail of various precious-metal compounds. They also fish out the gold salts in gold-bearing electronic scrap.
“We use known cyclodextrin properties to formulate new solutions,” says the WACKER expert. The sugar molecules can bind ingredients, release active ingredients or sta-bilize sensitive substances. This is due to their special ring shape: in their hollow space, they can absorb guest molecules and release them again. “We are far from running out of ideas for possible applications for our sugar rings,” says Harrison. “At the same time, we are trying to develop cost-efficient solutions. For industrial
applications, this plays a major role.”
“In our lab in Adrian, we want get our
tried-and-tested cyclodextrins in shape for completely new applications.”
Dr. Mark Harrison, responsible for industrial applications of cyclodextrins
Hidden Talents
Self-Healing Car Paint
22
Wacker Chemie AG – Annual Report 2018
WACKER BIOSOLUTIONS –

a
New polymers cured with cyclodextrins are intended
to help repair scratches in the car paint.
b
In his lab in Adrian, USA, Dr. Mark Harrison seeks out new industrial applications
for cyclodextrins.
c
Binding ingredients, releasing active ingredients
and stabilizing sensitive substances, cyclodextrins
have many talents.
b
c
a
23
Wacker Chemie AG – Annual Report 2018
Self-Healing Car Paint
Copying Biomolecules
Biosimilars are imitations of previously patented bio-logics, i. e. bioengineered pharmaceuticals. Unlike gener-ics – copies of synthetic branded drugs with identical active ingredients – biosimilars differ from the original. They resemble it, but are not entirely identical. Never-theless, a special approval process for biosimilars guarantees that these are just as effective and safe as the reference drugs. Biopharmaceuticals can only be similar to the original at best. This is because of their complexity and molecular size – as well as the production process – they can only be generated from living cells, such as microorganisms. The production route plays a much greater role for biosimilars than for traditional generics. This starts with the type of genetically modified microbe, which is kept secret by the manufacturer of the
original and can thus never be replicated exactly.
Biosimilars – a Future Field with Growth Potential
In collaboration with a large Asian corporation, WACKER already produces, on behalf of a customer, a biosimilar that is used to treat age-related macular degeneration, which affects the retina of the eye. This is an up-and-coming field with huge growth potential, as numerous patents on biologics – which are usually quite expen-sive – are due to expire in the coming years. That opens up the market and competition for biosimilars, which are generally less expensive than the originals and thus more affordable for healthcare systems and patients. However, this requires a good, efficient biotech process. That is precisely what the WACKER processes offer. They provide fast production of high-quality biologics – together with
the advantage of low costs.
Innovations
Ideas That Create the Future
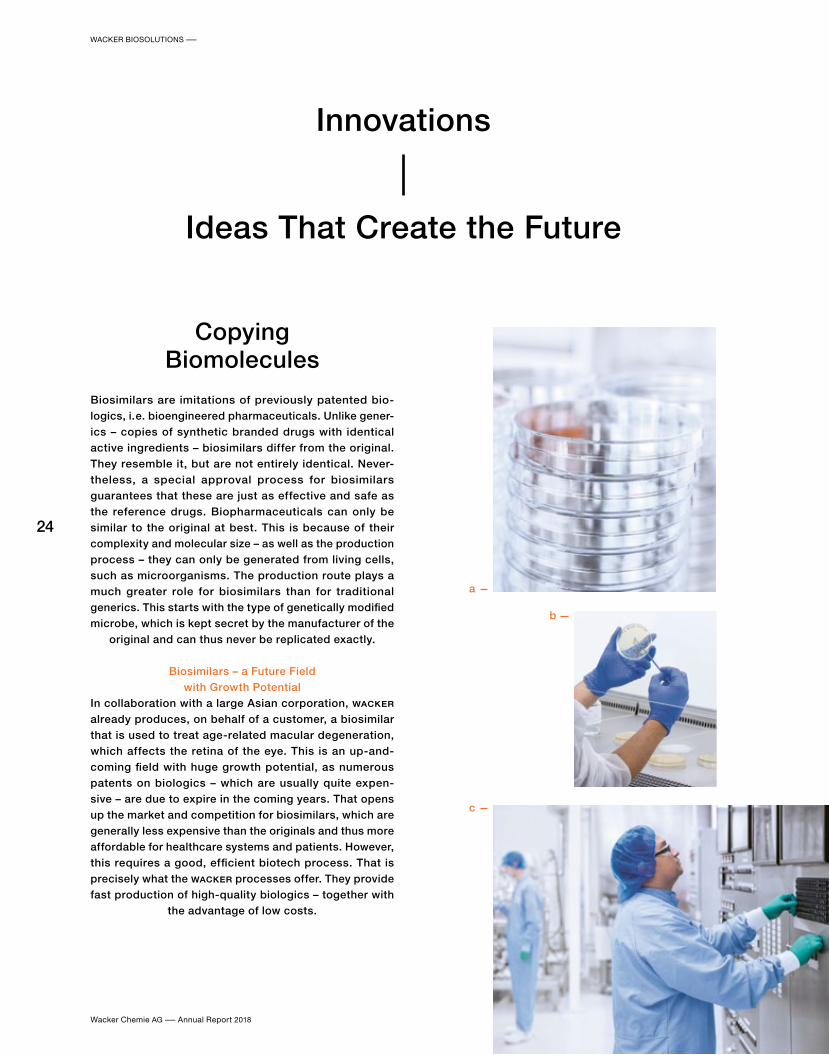
a
c
b
24
Wacker Chemie AG – Annual Report 2018
WACKER BIOSOLUTIONS –

Library on Course for Growth
From gene to active ingredient in four weeks – this is pos-sible with ESETEC®, the expression and secretion system developed and patented by WACKER. The biotech platform is based on the Escherichia coli K12 bacterial strain and a series of plasmids – small, circular genetic fragments.
Simple and Efficient HarvestIt is one of WACKER’s ongoing tasks to further enhance this innovative high-performance production system for biologics and to equip it for the manufacture of new pro-tein and active-ingredient classes with useful abilities. A glimpse into the bacterial cell makes the approach
clear: genetic engineering methods are used to modify the metabolism of the microorganisms, for example, so that they expel the active they produce from their cell at a specific time or in response to a stimulus. This makes harvesting the biopharmaceutical easy and efficient. Another goal is to deactivate specific proteases to increase production. The background: the bacteria’s enzymes break down some of the desired proteins into their amino acid building blocks again and thus deci-mate the yield. Work is ongoing to prevent this. These and other improvements make the ESETEC® production
system even more effective, versatile and robust.
Live Bacteria as Medicine
We are never truly alone, because there are some 38 tril-lion bacteria living on and in our bodies. That actually makes human cells, of which there are only around 30 trillion, the minority. This bacterial zoo – or microbiome, as experts call it – has a huge impact on our health. The microbiome consists of both beneficial bacteria and pathogenic organisms. For a person to stay healthy, the two must be balanced. That’s why scientists are looking for a new generation of probiotics – or helpful microbes – that have a positive effect on the immune system and, as pharmaceutically active substances, even have the
potential to heal.
The corresponding projects are being performed at the new WACKER site in Amsterdam: the BIOSOLUTIONS experts here are working on, for example, beneficial bacteria for premature babies. The “good” microbes can remove “bad” ones that are responsible for life-threatening necrosis, for example, and help the babies make a healthy start into life. Other specially designed bacteria can produce growth factors that promote wound healing and can thus prevent amputations for diabetics. These kinds of bac-teria belong to the so-called probiotics. WACKER intends to pursue this medical trend further in the future and win
customer projects.
d
a
Petri dishes for cultivating microorganisms.
b
Bacteria such as E. coli form the starting point for
producing biologics.
c
Fermentation at the Amsterdam site.
d
Chromatography at the Jena site.
25
Wacker Chemie AG – Annual Report 2018
Ideas That Create the Future

A Treasure Chest Full of Ideas
At WACKER, the most important resources for innovations are the ideas in the employees’ heads. Dr. Oliver Minge and his eleven-strong team ensure that the right ideas are identified and developed in the WACKER BIOSOLUTIONS division – so that they can give rise to new innovations.
As part of an innovation management system, ideas must first survive a strict selection process. Only 10 percent manage to pass this first hurdle. The candidates then undergo a multistage innovation process that can last anywhere between six months and five years. Milestones are defined and must be achieved within specified time frames and budgets. The process ideally culminates in the scale-up and market launch of a new or refined product.
“We are not the only ones looking after innovations at BIOSOLUTIONS, however,” says Minge, who has been in charge of the innovations team for the past one and a half years. Chemists, biologists, biochemists, process engineers, food technologists, laboratory assistants and chemical-technical assistants in the regions and indi-vidual departments are also driving new developments. “They are close to the customer, are familiar with specific
regional requirements and get support from us,” explains Minge. So, there are some 30 innovation drivers overall.
Partners in an Innovation ProcessTogether with the affected corporate sectors, they de-cide which ideas make it to the innovation process. “When we receive an idea, we develop it up to a certain point – then we decide whether it has the ‘WACKER fit,’” says Minge. He means whether the idea fits in with WACKER’s technologies, raw materials, markets and sales channels. It must also be clarified whether the cost- benefit ratio is good, whether existing patents could potentially block development and whether the time is
ripe for a product.
There are currently some 30 projects up and running, with three quarters of them being promoted together with partners – whether research institutes, universities, startups or customers. The focus is on biologics and food. That was a strategic decision. “We also make sure that we have a good mix of many smaller projects that are close to WACKER’s business and a few disruptive projects aimed at opening up new fields,” says Minge.
If an idea is rejected or if it fails the innovation process, it does not go straight to the recycle bin, but into the ideas archive set up by Minge. Some 50 ideas are cur-rently sitting there, waiting to maybe be taken out of the
drawer again sometime – when the time is ripe.
“The focus of our projects is on
biologics and food.”
Dr. Oliver Minge, head of the Innovations Teams at WACKER BIOSOLUTIONS
e
e
In coordination with its corporate sectors, WACKER
produces tomorrow’s products and applications.
26
Wacker Chemie AG – Annual Report 2018
WACKER BIOSOLUTIONS –

a
27 40
Fo
r O
ur
Sh
are
ho
lde
rs
For OurShareholders
1999:
WACKER’s FirstBiotech Product
Commercial manufactureof our fi rst biotech
product: cyclodextrins(ring-shaped sugar molecules)
13505_GB18_Kapiteltrenner_de_en.indd | v8 | 12. März 2019, 3:00 vorm.

a
For Our Shareholders
Letter to Our Shareholders 29 Executive Board 33 Report of the Supervisory Board 34 WACKER Stock in 2018 38

WACKER’s performance in 2018 was marked by the strength of our chemical business and by difficult conditions in the solar market. Overall, sales rose by 1 percent to € 4.98 billion. EBITDA (earnings before interest, taxes, depreciation and amortization) came in at € 930 million, 8 percent lower than the year before. The decline was due to the fact that insurance compensation was still outstanding for the shutdown caused by the loss event at our Charleston site in Tennessee (USA). Income from continuing operations rose, on the other hand, by 4 percent to € 260 million.
The outstanding insurance payments affected our net financial debt. It came in at € 609 million and was thus higher year over year. Net cash flow of around € 125 million was clearly positive, but substantially lower than a year earlier because capital expenditures were higher (as planned), as were cash outflows for working capital and taxes.
Essentially, 2018 was a year of highs and lows for WACKER. Our chemical business performed very well, especially silicones. We increased silicone sales by 14 percent. The rise was fueled by volume gains for high-margin specialties and higher prices for standard products. Chemical-division EBITDA increased to more than € 780 million, despite significantly higher raw-material costs, particularly in our polymer business.
We further strengthened WACKER BIOSOLUTIONS by acquiring a new production site for pharmaceutical actives. The acquisition doubled our capacity to a total of 4,000 liters in the fast-growing biopharma-ceuticals market.
Another positive fact is that, after the loss event at Charleston in September 2017, we resumed polysilicon production there in Q2 2018 and, in December, reached full capacity.

But, aside from this good news, WACKER POLYSILICON faced very challenging market conditions in 2018. Business was dampened by China’s decision to curb feed-in tariffs for some solar projects and to cap the amount of new solar installations. As a result, solar-silicon volumes contracted markedly, with prices continuing to decline. We used this market situation to rebuild inventories, enabling us to supply customers much faster in the future.
Given our strong income from continuing operations, the Supervisory and Executive Boards will propose to the Annual Shareholders’ Meeting in May 2019 that a dividend of € 2.50 per share should be distributed.
From today’s perspective, 2019 is not going to be an easy year for us. The global economy’s momentum has slowed significantly. Among the multiple reasons for this are international trade conflicts, the UK’s unresolved exit from the EU and slackening global demand for products and services.
For our business, we anticipate a slight decline in raw-material costs, but a substantial rise in electricity prices in Germany. That means pressure will ease on our chemical divisions but increase, in particular, on WACKER POLYSILICON’s earnings. The market situation for polysilicon will remain difficult in the weeks ahead. Yet we are confident of growing sales at every business division. For EBITDA, on the other hand, we anticipate a substantial decline, prompted mainly by very low average prices for polysilicon, as well as by lower prices for standard chemical products. We also expect Group net income to decrease.
We are doing our utmost to cut costs further. We see considerable potential for this in our polysilicon business, and are also working hard to enhance the cost situation in all other areas of the company.

At the same time, we are intensifying our focus at WACKER POLYSILICON. In this segment, we want to gain market share through customers in the semiconductor industry and increase our volumes of polysilicon for monocrystalline solar wafers.
Although the economy has clouded over, we look ahead, thinking and acting for the long term. That is why we continue to seize the oppor-tunities that arise in our business. Demand for many of our products is very high, especially at our chemical divisions. Our investment spending thus focuses on expanding facilities for intermediate and downstream silicone products. We intend to enhance our portfolio of silicone specialties in the coming years.
The goals behind these measures are clear: we are preparing for the next growth step by continuing to strengthen our market positions. Importantly, we are pursuing the strategy set until 2020 of ensuring that our capital expenditures remain below the level of depreciation.
At WACKER, the future goes hand in hand with digitalization. Through digitalization, we will satisfy customer needs even better. It spans the entire value chain, from product development and manufacturing through to customer service. That is why, in 2017, we launched “WACKER digital,” a program for advancing the digital transformation at all stages of the value chain.
At present, we face economic headwinds rather than tailwinds. But we look ahead with optimism.
WACKER is well positioned to shape the future.
– We have the right products.
– We are developing new, innovative products and technologies.
– We hold leading positions in all of our key markets.

We have highly skilled employees, whose hard work and dedication were a key factor in WACKER’s successful performance last year. I sincerely thank them on behalf of the entire Executive Board.
It is our combination of expertise, experience, innovation, shared identity, performance and passion that makes WACKER unique. This is the source of our strength and our optimism. My Executive Board colleagues and I express our gratitude to our customers, suppliers and shareholders for the trust they have placed in us. Stay with us on the path ahead!
Munich, March 2019
Dr. Rudolf Staudigl
President & CEO of Wacker Chemie AG

Executive Board
Dr. Christian Hartel
WACKER POLYMERSWACKER BIOSOLUTIONS (since July 1, 2018)
Human Resources (Personnel Director), Corporate Research & Development (since July 1, 2018), Intellectual Property (since July 1, 2018), Corporate Engineering Region: Asia
Dr. Tobias Ohler
Corporate Accounting and Tax, Corporate Controlling, Corporate Finance and Insurance, Information Technology, Procurement & Logistics Region: The Americas
Auguste Willems
WACKER SILICONES WACKER BIOSOLUTIONS (until June 30, 2018)
Sales & Distribution, Site Management, Corporate Security, Environment / Health / Safety, Product Stewardship, Corporate Research & Development, (until June 30, 2018) Intellectual Property (until June 30, 2018) Regions: Europe, Middle East
Dr. Rudolf StaudiglPresident & CEO
WACKER POLYSILICON
Executive Personnel, Corporate Development, Corporate Communications, Investor Relations, Corporate Auditing, Legal, Compliance, Retirement Benefits
33
Wacker Chemie AG – Annual Report 2018
For our Shareholders – Executive Board

Dr. Peter-Alexander Wacker
Chairman of the Supervisory Board of Wacker Chemie AG
Report of the Supervisory Board
34
For Our Shareholders – Report of the Supervisory Board
Wacker Chemie AG – Annual Report 2018

After getting off to a strong start, the global economy increasingly slowed as 2018 progressed. Future growth is endangered because free trade is losing advocates and major industrial nations, such as the USA and China, are pursuing interventionist policies to protect their economies against foreign competition. Companies are becoming noticeably more dependent on the decisions of individual governments – and not just since the UK decided to leave the EU.
As a company that exports many of its products across the EU and to China, WACKER is directly impacted by these trends. From our own experience with polysilicon, we know how strongly trade restrictions and protectionism can impact operations. We are monitoring policy developments closely, since they might influence our business in the com-ing years. Despite these challenging political conditions, we consider ourselves well positioned to continue growing organically.
Over the last 15 years, we have invested substantial capital in expanding our global production and sales network. In 2018, it was our chemical business, in particular, that benefited from these investments. We enhanced our market position in Western and Eastern Europe, and in China. Growth was particularly robust in silicones, where we are the Number 2 worldwide. WACKER’s main strength in this segment is our broad range of sophisticated products for key industries.
The decision to give up majority control over Siltronic AG has made us more independent of cyclical markets and reduced the capital intensity of our business. With our 30-percent share in Siltronic, we continue to profit from its positive performance.
WACKER’s good capitalization gives us the scope we need to pursue our long-term growth strategy. We financed all our capital expenditures in 2018 from cash flow. What is more, we have a high equity ratio and low levels of net financial debt.
We believe that one of our core duties as an enterprise is to remain resolute in our defense of free trade. Indeed, we are convinced that free trade is the only way to create the future affluence and growth that will benefit increasing numbers of
people around the world. In turn, the trend toward greater affluence will increase people’s desire for a better quality of life. This is where WACKER’s high-quality products have an important role to play. There are many more markets for us to develop and expand to grow our market share.
The Supervisory Board wishes to thank WACKER’s employ-ees for their commitment, hard work and achievements last year.
Continuous Dialogue with the Executive BoardAt WACKER, sound corporate governance and control are built on a relationship of trust between the Executive Board and Supervisory Board as they work closely together in the company’s interest. In 2018, the Supervisory Board performed – with great diligence – the duties incumbent upon it under law, the Articles of Association and its own Rules of Procedure. The Supervisory Board was involved at an early stage in every decision of fundamental significance for the company.
In both written and oral reports, the Executive Board regularly provided us with timely and comprehensive information on corporate planning, strategic development, business operations, and the current state of Wacker Chemie AG and the Group, including the risk situation and compliance issues. Outside of the scheduled Supervisory Board meetings, the Chairman of the Supervisory Board remained in close contact with the Executive Board, espe-cially with the CEO, and was kept informed of the business situation, current trends and key business transactions. Any deviations from business plans and targets were explained to the Supervisory Board in detail.
Wherever required by statutory provisions or the Articles of Association, the Supervisory Board voted on the reports and proposals of the Executive Board after detailed exam-ination and discussion.
In the reporting year, we paid particularly close attention to investment projects, the current earnings situation, including the risk position and risk management, as well as the company’s liquidity and financial position.
The Supervisory Board held five meetings in 2018, three ( including the newly elected body’s inaugural meeting) in the first half of the year and two in the second half. Between meetings, the Executive Board informed us in detail by means of written reports about all projects and plans of particular importance to the Group. At its full meetings and in its committees, the Supervisory Board discussed in detail, on the basis of the reports submitted by the
35
For Our Shareholders – Report of the Supervisory Board
Wacker Chemie AG – Annual Report 2018

Executive Board, business transactions of importance to the company. The full meetings were prepared by share-holder and employee representatives in their own separate sessions.
All Supervisory Board members attended at least half of the meetings of the full Supervisory Board. All committee mem-bers attended all of their respective committee meetings.
The Supervisory Board’s Main Areas of DeliberationThe development of sales, earnings and employment at the Group and its individual segments were the subject of regular deliberations in the full meetings. At each meeting, the Supervisory Board evaluated the Executive Board’s per-formance – on the basis of Executive Board reports – and discussed strategic development opportunities and other key topics with the Executive Board. There was no need for additional monitoring measures, such as the inspection of corporate documents or the appointment of experts.
Major areas of deliberation dealt with by the Supervisory Board were:
– The anti-dumping proceedings against the solar and other industries in the USA, EU and China; their impact on WACKER; and corresponding courses of action
– The explosion in a plant at the production site in Charleston, Tennessee (USA) and its consequences
– Performance of the share price– Group financing activities– Renewal of the contract of Executive Board member
Auguste Willems
The Supervisory Board discussed the WACKER Group’s plans for 2019 at its meeting of December 6, 2018. On that occasion, the Supervisory Board also dealt with medium-term corporate plans for the period 2019 – 2023. In addition, it discussed and approved the capital-expenditure budget for 2019.
Work in the CommitteesThe Supervisory Board is assisted in its work by the com-mittees it has constituted. WACKER’s Supervisory Board has created three committees – an Audit Committee, an Executive Committee, and a Mediation Committee (the latter in accordance with Section 27 (3 ) of the German Co-Determination Act (MitbestG)). With the exception of the Audit Committee, which is chaired by Franz-Josef Kortüm, Dr. Peter-Alexander Wacker, the Chairman of the Supervisory Board, chairs the committees.
The Audit Committee met four times last year. Its work included the audit of the annual financial statements of Wacker Chemie AG and the Group for 2017 and of the consolidated interim financial statements for the first half-year. It also discussed the Group’s quarterly financial figures, CSR reporting, and issues relating to risk manage-ment, compliance and auditing. The committee monitored the independence of the auditors and also discussed the additional services they had provided. Moreover, the Audit Committee submitted a recommendation to the Supervisory Board for the latter’s proposal at the Annual Shareholders’ Meeting for appointment of an auditor for 2018. It then awarded the auditing contract for 2018 and determined the focus of auditing.
The Executive Committee met twice in 2018, discussing personnel matters in relation to the Executive Board (e. g. determining overall compensation, setting the performance goals for variable compensation, preparing a recommen-dation to the Supervisory Board regarding the renewal of Auguste Willems’ contract).
The Mediation Committee did not need to be convened last year.
The Supervisory Board was regularly informed about the committees’ work.
Corporate GovernanceLast year, the Supervisory Board again looked closely at corporate-governance standards. At its meeting of December 6, 2018, the Supervisory Board dealt with appli-cation of the German Corporate Governance Code and adopted the annual Declaration of Conformity that must be submitted jointly by the Executive and Supervisory Boards in accordance with Section 161 of the German Stock Corporation Act (AktG). Shareholders can access the Declaration on the company’s website.
In its Corporate Governance Report, the Executive Board provides details – also on behalf of the Supervisory Board – of corporate governance at WACKER in accordance with Item 3.10 of the German Corporate Governance Code.
For further details, please refer to page 185
At its meeting in December 2018, the Supervisory Board also discussed the efficiency of its activities and found that it works efficiently – one reason being the regular preliminary discussions regarding the Supervisory Board meetings.
36
For Our Shareholders – Report of the Supervisory Board
Wacker Chemie AG – Annual Report 2018

Audit of the Annual Financial Statements of Wacker Chemie AG and the WACKER GroupKPMG AG Wirtschaftsprüfungsgesellschaft, Munich, audited the annual financial statements of Wacker Chemie AG for 2018, the consolidated financial statements and the com-bined management report (as of Dec. 31, 2018), as prepared by the Executive Board, including the relevant accounts.
The Supervisory Board’s Audit Committee had awarded the auditing contracts in accordance with the resolution of the Annual Shareholders’ Meeting of May 9, 2018. The auditors issued unqualified audit reports.
The auditors also examined the risk management system in accordance with Section 91 of the German Stock Corpora-tion Act (AktG). The audit verified that the risk management system and internal control system meet the legal require-ments. No risks endangering the continued existence of the company were identified. The auditors also carried out a voluntary review of the combined non-financial report for Wacker Chemie AG and the Group. Their review confirmed that this report, too, meets the legal requirements.
The financial-statement documents ( including the auditors’ reports, the combined management report and the Executive Board’s proposal for the distribution of profits) were submitted to all the Supervisory Board members in good time.
At its meeting of February 26, 2019, the Audit Committee examined and discussed in detail the above-mentioned financial statements, the combined management report, the combined non-financial report for Wacker Chemie AG and the Group (as per Sections 289b and 315b of the German Commercial Code – HGB) as well as the auditors’ reports. At its meeting of March 13, 2019, the full Supervisory Board closely examined and discussed the relevant annual accounting documents – including the combined non- financial report for Wacker Chemie AG and the Group – with knowledge and in consideration of both the report of the Audit Committee and the auditors’ reports. The auditors took part in the deliberations at both meetings. They reported on the main results of the audit – in particular the key audit matters described in the auditors’ report – and were available to answer questions and provide supple-mentary information.
After concluding our own examination, we have no ob- jections to raise to the annual financial statements of Wacker Chemie AG, the consolidated financial statements, the combined management report, the combined non- financial report for Wacker Chemie AG and the Group, or the auditors’ reports.
We therefore approve the annual financial statements of Wacker Chemie AG and the consolidated financial statements as of December 31, 2018 as prepared by the Executive Board. The annual financial statements of Wacker Chemie AG are hereby adopted. We concur with the Executive Board’s proposal for the distribution of retained profit.
Changes in the Composition of the Supervisory and Executive BoardsThe shareholder representatives on the Supervisory Board of Wacker Chemie AG were elected at the Annual Share-holders’ Meeting held in Munich on May 9, 2018. On that occasion, Ann-Sophie Wacker was newly elected to the Supervisory Board to replace Dr. Thomas Strüngmann, who had not stood for re-election. All the other share-holder representatives were re-elected to the Supervisory Board. At its inaugural meeting, directly after the Annual Shareholders’ Meeting, the Supervisory Board confirmed Dr. Peter-Alexander Wacker as its chairman. The employee representatives on the Supervisory Board had been elected by Wacker Chemie AG’s employees and executives before the Annual Shareholders’ Meeting, with Ingrid Heindl being elected to the Supervisory Board to replace Dagmar Burghart as employee representative.
Harald Sikorski stepped down from the Supervisory Board with effect from October 31, 2018. At the Executive Board’s request, Jörg Kammermann was appointed to the Super-visory Board by order of the District Court of Munich on November 14, 2018.
At its meeting on March 6, 2018, Wacker Chemie AG’s Supervisory Board confirmed Auguste Willems’ member-ship on the Executive Board and renewed his contract for a further five years (until December 31, 2023).
Munich, March 13, 2019 The Supervisory Board
Dr. Peter-Alexander WackerChairman of the Supervisory Board of Wacker Chemie AG
37
For Our Shareholders – Report of the Supervisory Board
Wacker Chemie AG – Annual Report 2018

WACKER Stock in 2018
At the start of 2018, WACKER stock climbed strongly due to the continued strength of its chemical divisions. Then in the second half-year, in particular, WACKER’s share price posted a significant decline. It was prompted by trade tensions between the USA and China, by Brexit-related uncertainties, and by regulatory changes and the amount of new solar installations in China. In the first three months of 2018, global stock markets were volatile and, on balance, declined noticeably during the quarter. That was primarily due to the mounting worries of market participants about a global trade war. At the same time, the world’s major central banks decided to prepare financial markets for an end to accommodative monetary policies. The US Federal Reserve, for instance, raised the federal funds rate by 0.25 percentage points in late March to a target range of 1.50 to 1.75 percent.
After a good start to 2018, Germany’s benchmark indices faced significant pressure as of late January. The first-quar-ter loss for the DAX exceeded 6 percent, while the MDAX lost more than 2 percent. WACKER stock started Q1 2018 at € 162.20 (closing price on Dec. 29, 2017) and initially posted substantial gains. After reaching its year-high of € 174.00 on January 26, the stock came under pressure amid the general market trend. Furthermore, market participant concerns about rising raw-material prices, a rebounding euro and contracting solar-silicon prices returned to the forefront. The share price declined and finished trading at € 133.35 on March 29, down 18 percent from the start of the quarter.
From April through June 2018, global stock markets gener-ally performed well for long stretches, declining noticeably only toward the end of the second quarter. After the price setbacks of Q1 2018, market sentiment initially became more optimistic in spite of rising US interest rates, as tension seemed to ease in the trade dispute between the US and China. At the same time, sentiment was lifted by China’s unexpectedly strong economic growth. Later in the quarter, the trade disputes escalated further between the USA, on the one hand, and China and the European Union on the other. Given the mounting uncertainty, the major stock market indices lost most of their previous gains in the last two weeks of June. At the end of June, the DAX closed 2 percent higher versus the end of March, while the MDAX gained 1 percent during the same period.
Initially, WACKER stock rebounded strongly in the second quarter. But, in June, it came under increased pressure. A key reason was China’s decision, announced June 1, to reduce solar feed-in tariffs and cap the construction of new photovoltaic installations for the rest of the year. Market participants became concerned that fewer new PV installations in China could dampen WACKER’s polysilicon volumes and earnings. As a result, the share price fell markedly. WACKER stock closed at € 112.15 on June 29, down 16 percent versus the beginning of the quarter.
In the third quarter, political risks clouded stock-market sentiment, even as economic conditions remained gen-erally robust. The world’s major central banks normalized monetary policy further. The US Federal Reserve raised the federal funds rate by 25 basis points in late Septem-ber. The European Central Bank also announced that it would end its bond-buying program by year-end. Market uncertainties remained high, though, fueled by the ongoing trade disputes between the USA and both China and the European Union. Overall, the DAX finished September down 0.5 percent versus the end of June, while the MDAX edged up 1 percent during the same period.
WACKER stock initially outperformed the market in the July- through-September quarter. But, in early September, it lost considerable ground, influenced not only by the general market trend, but also by falling prices for standard silicone products in China. WACKER stock closed at € 108.30 on September 28, down 3 percent versus the beginning of the quarter.
From November through December, the DAX and the MDAX fell by 14 and 17 percent, respectively. WACKER’s share price also declined in the fourth quarter, trading in line with shares of other European chemical companies. In a weak overall market and still difficult political climate, the European chemical industry came under pressure after a series of profit warnings, and investors sold off chemical stocks. Due to WACKER’s reduced market capitalization, the stock was removed from the STOXX Europe 600 Index in late December. After reaching its year-low of € 71.28 on December 10, Wacker Chemie AG’s stock traded at € 79.10 at year-end (Dec. 28, 2018), down 27 percent versus the beginning of October.
Discussions with capital-market participants during the year were dominated by questions about the supply /demand balance for silicones, the further trend in raw-material costs at WACKER POLYMERS and solar demand in China.
38
For Our Shareholders – WACKER Stock in 2018
Wacker Chemie AG – Annual Report 2018

Dividend Payment of € 4.50 per ShareAt the Annual Shareholders’ Meeting of Wacker Chemie AG held in Munich on May 9, 2018, all Executive Board and Supervisory Board proposals were adopted by large major-ities. WACKER distributed a shareholder dividend for 2017 totaling € 223.6 million (€ 99.4 million for 2016). The dividend per dividend-bearing share was € 2.50 (2016: € 2.00), plus a special bonus of € 2.00 per share. The dividend yield based on WACKER’s average share price in 2017 was 4.0 percent (2016: 2.6 percent).
Shareholder StructureWacker Chemie AG’s largest shareholder continues to be Dr. Alexander Wacker Familiengesellschaft mbH, Munich. It holds over 50 percent of the voting shares in Wacker Chemie AG (2017: over 50 percent). Blue Elephant Holding GmbH (Pöcking, Germany) also had no voting-share changes to report in 2018, with its holding in Wacker Chemie AG remaining at over 10 percent (2017: over 10 percent).
WACKER Stock Versus DAX and MDAXIn full-year 2018, Germany’s DAX and MDAX indices both lost 18 percent. WACKER’s share price decreased by 51 percent during the same period. The stock started the year at € 162.20 (year-end closing price on Dec. 29, 2017) and at year-end (Dec. 28, 2018) stood at € 79.10.
Earnings per Share of € 4.95Earnings per share (EPS) are calculated by dividing net income allocable to Wacker Chemie AG shareholders by the weighted average of all shares in circulation during the year. In the reporting year, the number of shares in circulation was 49,677,983. On this basis, the EPS was € 4.95.
A.2 WACKER Share Performance ( indexed to 100)1
Jan Feb Mar Apr May Jun Jul Aug Sep Oct Nov Dec
120
110
100
90
80
70
60
50
40
WACKER1 DAX 30 MDAX 1 100 = € 162.20 (year-end closing price on Dec. 29, 2017)
A.1 Facts & Figures on Wacker Chemie AG’s Stock
€
Year-high (on Jan. 26, 2018) 174.00
Year-low (on Dec. 10, 2018) 71.28
Year-end closing price (on Dec. 29, 2017) 162.20
Year-end closing price (on Dec. 28, 2018) 79.10
Performance for the year (without dividend) (%) -51.2
Year-end market capitalization (shares outstanding; prior year: 8.06) (billion) 3.93
Average daily trading volume1 (prior year: 20.2) (million) 32.5
Earnings per share from continuing operations (prior year: 4.85) 4.95
Dividend per share (proposal ) 2.50
Dividend yield 2 (%) 2.1
1
2Trading platforms (Xetra, Chi-X and Turquoise)Dividend proposal based on an average weighted share price of € 119.76 in 2018
A.3 Dividend Trends
€ 2017 2016 2015
Dividend 2.50 2.00 2.00
Special bonus from the sale of Siltronic shares 2.00 – –
Total dividend 4.50 2.00 2.00
Dividend yield (%) 4.0 2.6 2.2
Net result for the year (allocable to WACKER’s shareholders) (million) 866.7 179.2 246.7
Net result for the year from continuing operations (allocable to WACKER’s shareholders) (million) 240.5 179.2 246.7
Dividend payout (million) 223.6 99.4 99.4
Distribution ratio (%) ¹ 51.6 55.5 40.3
1 Excluding special bonus; in relation to net income from continuing operations (allocable to WACKER’s shareholders)
39
For Our Shareholders – WACKER Stock in 2018
Wacker Chemie AG – Annual Report 2018

Free Float: Strong Base in Germany and the Rest of EuropeAccording to the analysis of WACKER’s shareholder struc-ture as of December 31, 2018, the majority of shareholders (37 percent) are located in Germany (2017: 31 percent). The proportion of US shareholders was 22 percent (2017: 25 percent). The percentage of stock accounted for by UK shareholders edged up from 20 to 21 percent. The pro-portion of shares held by other European investors was 18 percent (2017: 21 percent).
Market Capitalization and Weighting (Weighting as of December 31, 2018)WACKER’s year-end market capitalization decreased from € 8.06 billion to € 3.93 billion (total stock without treasury shares). WACKER’s MDAX market capitalization based on the free float was € 1.2 billion (2017: € 2.8 billion). WACKER thus had an MDAX weighting of 0.56 percent, after 1.44 percent in the prior year, and is currently ranked 12th by 12-month trading volume (2017: 22nd) and 59th by market capitalization (2017: 27th) among the 60 (2017: 50) companies in the index.
Trading VolumeIn the reporting period, the average daily trading volume on the Xetra, Chi-X and Turquoise trading platforms for WACKER stock was approximately 269,000 shares, which was clearly above the prior-year figure of around 181,000 shares.
WACKER Communicates Closely with Capital MarketsKey elements of the corporate strategy include achieving organic growth, investing in promising markets and reduc-ing capital intensity across all segments. These priorities are reinforced through continuous and open commu-nication with institutional and private investors and with analysts. On many occasions, Executive Board members attended events to answer questions from capital-market participants. There were 22 roadshows with a total of 27 roadshow days in Germany, Europe, the USA and Asia. About 700 meetings were held in total, both in person and by telephone. WACKER also participated in international conferences and gave presentations at events in 2018, including the following:
The number of analysts covering WACKER in 2018 was 20 (2017: 20). During the year, analysts’ consensus price target for WACKER stock fell. In Q1, the average price target for WACKER stock was € 155 (19 estimates). At year-end 2018, though, analysts set their fair-value price target at € 106 on average (19 estimates), roughly one-third lower than at the start of the year.
On our website, we regularly report consensus analyst expectations for the current year. Moreover, our website offers extensive information on WACKER stock. In addition to the annual report, other financial reports, a Fact Book, presentations and publications (viewable online or down-loadable), our website lists all our key financial-calendar dates, along with information on who to contact with questions. Videos of our annual press conference and other events are also available for online viewing, or as an audio stream.
A.4 Useful Information on WACKER Stock
ISIN DE000WCH8881
German security identification number (WKN) WCH888
Frankfurt Stock Exchange WCH
Bloomberg CHM / WCH.GR
Reuters CHE / WCHG.DE
Capital stock € 260,763,000
Number of shares (Dec. 31, 2018) 52,152,600
Number of shares outstanding 49,677,983
A.5 Banks and Investment Firms Covering and Rating WACKER
Baader Helvea HSBC
Bankhaus Lampe KG J.P. Morgan Cazenove Ltd.
Berenberg Kepler Cheuvreux
Citigroup Landesbank Baden-Württemberg
Commerzbank Corporates & Markets
Mainfirst
Credit Suisse Securities (Europe) Ltd.
Morgan Stanley & Co. International Ltd.
DZ Bank AG Norddeutsche Landesbank
Exane BNP Paribas Société Générale
fairesearch GmbH & Co. KG UBS Ltd.
Hauck & Aufhäuser Privatbankiers AG
Warburg Research GmbH
As of the end of December 2018
Commerzbank German Invest-ment Seminar in New York
Warburg Highlights 2018 in Hamburg
Oddo Forum in Lyon
Jefferies Global Industrials Conference in New York
Kepler Cheuvreux GCC 2019 in Frankfurt am Main
Berenberg & GS German Cor-porate Conference in Munich
Mainfirst Corporate Conference in Copenhagen
Baader Investment Conference in Munich
BHL Deutschlandkonferenz in Baden-Baden
Bernstein’s Annual SDC in London
Morgan Stanley Chemical Day in London
Morgan Stanley Global Chemicals and Agriculture Conference in Boston
dbAccess Berlin Conference in Berlin
Berenberg European Corporate Conference in London
Credit Suisse Global Chemicals and Agriculture Conference in London
Credit Suisse European Corporate Conference in London
JPM Materials Conference in London
BofAML European Chemicals Conference in London
40
For Our Shareholders – WACKER Stock in 2018
Wacker Chemie AG – Annual Report 2018

b
41 102 Ma
na
ge
me
nt
Re
po
rt
CombinedManagement Report
WACKER acquiresProThera GmbH in Jena,
Germany: launch of biopharmaceutical business
2005:
Wacker BiotechAcquisition in Jena
13505_GB18_Kapiteltrenner_de_en.indd | v8 | 12. März 2019, 3:00 vorm.

b
Combined Management Report
Group Business Fundamentals 43 Goals and Strategies 49 Management Processes 50 Statutory Information on Takeovers 53 Business Report 54 Earnings 59 Net Assets 64 Financial Position 67 Further Information on R&D, Employees, Procurement, Production, Sales and Marketing 70 Management Report of Wacker Chemie AG 77 Risk Management Report 81 Outlook 97

Group Business Fundamentals
Business Model of the Group
WACKER is a global company with state-of-the-art specialty chemical products found in countless everyday items, ranging from cosmetic powders to solar cells. Our port-folio includes more than 3,200 products supplied in over 100 countries.
Silicon Is Our Main Starting MaterialMost of our products are based on inorganic starting materials. Silicon-based products account for about 70 percent of WACKER sales, and primarily ethylene-related products for 30 percent. Our customers come from virtually every major industry, including base chemicals, electrical engineering and electronics, the solar, textile and food sectors, consumer goods, medical technology and biotech. As a manufacturer of silicones and polymers, WACKER has a particularly strong presence in the construction and automotive sectors. WACKER is one of the world’s largest manufacturers of polycrystalline silicon for the semicon-ductor and solar industries.
Technical Competence Centers Support Sales and Marketing ActivitiesWACKER operates all over the world. Our sales strategy is centered around expanding our presence in growth mar-kets. In total, WACKER has 50 sales offices in 32 countries.
Our sales organization is supplemented not only by a network of technical competence centers, where custom-ers learn about WACKER’s product portfolio, but also by the WACKER ACADEMY, where we offer technical training programs about our products and their application fields. In 2018, we opened a new technical competence center in Anyang (South Korea).
24 Production SitesWACKER’s integrated global production system consists of 24 production sites (2017: 23). Ten are in Europe, seven in the Americas and seven in Asia. The Group’s key production location is Burghausen (Germany). At this site alone, we have over 8,100 employees ( including temporary workers and trainees). In 2018, Burghausen manufactured around 950,000 metric tons of product, accounting for almost 50 per-cent of the Group’s production output. Nünchritz is WACKER’s second multidivisional site alongside Burghausen.
See Figure B.2 on page 44
Legal Structure
In November 2005, WACKER became a stock corporation (AG) under German law. Headquartered in Munich, Wacker Chemie AG holds a direct or indirect stake in 54 companies belonging to the WACKER Group. The consolidated financial statements cover 51 fully consolidated companies. Three companies are accounted for using the equity method. Wacker Chemie AG and a number of its subsidiaries also have branch offices, but they are of only minor significance for the Group.
For more information about changes in the scope of consolidation and the
resulting effects, please refer to the Scope of Consolidation section in the
Notes to the Consolidated Financial Statements.
B.1 Key Factors for Multidivisional Sites
WACKER Group
Burghausen Nünchritz
Captive energy supply
Integrated production
Qualified employees
from local area
Long-term supplier relations
Areas on site available for expansion
43
Combined Management Report – Group Business Fundamentals
Wacker Chemie AG – Annual Report 2018

B.2 WACKER’s Production and Sales Sites and Technical Competence Centers 1
North and South America
1 Adrian, Michigan, USA 2 Allentown, Pennsylvania, USA 3 Ann Arbor, Michigan, USA 4 Calvert City, Kentucky, USA 5 Charleston, Tennessee, USA 6 Chino, California, USA 7 Dalton, Georgia, USA 8 Eddyville, Iowa, USA 9 North Canton, Ohio, USA 10 Jandira, São Paulo, Brazil 11 Bogotá, Colombia 12 Mexico City, Mexico
Europe
13 Burghausen, Germany 14 Halle (Saale), Germany 15 Jena, Germany 16 Cologne, Germany 17 Munich, Germany 18 Nünchritz, Germany 19 Riemerling, Germany 20 Stetten, Germany 21 Stuttgart, Germany 22 Lyon, France 23 Bracknell, Great Britain 24 Milan, Italy 25 Amsterdam, Netherlands 26 Krommenie, Netherlands 27 Kyrksæterøra, Holla, Norway 28 Warsaw, Poland 29 Moscow, Russia 30 Solna, Sweden 31 Barcelona, Spain 32 León, Spain 33 Plzeň, Czech Republic 34 Istanbul, Turkey 35 Kiev, Ukraine 36 Budapest, Hungary
Asia
37 Dhaka, Bangladesh 38 Beijing, China 39 Chengdu, China 40 Guangzhou, China 41 Hong Kong, China 42 Nanjing, China 43 Shanghai, China 44 Shunde, China 45 Zhangjiagang, China 46 Chennai, India 47 Delhi, India 48 Kolkata, India 49 Mumbai, India 50 Jakarta, Indonesia 51 Tokyo, Japan 52 Tsukuba (Akeno), Japan 53 Kuala Lumpur, Malaysia 54 Yangon, Myanmar 55 Makati City, Philippines 56 Singapore 57 Anyang, South Korea 58 Jincheon, South Korea 59 Seoul, South Korea 60 Ulsan, South Korea 61 Taipei, Taiwan 62 Bangkok, Thailand 63 Dubai, United Arab Emirates 64 Hanoi, Vietnam 65 Ho Chi Minh City, Vietnam
Australia
66 Melbourne, Victoria, Australia
Production site Sales site Technical competence center
1 Only majority-owned subsidiaries and joint ventures
Europe
Germany
13
1815
1416
1720
1921
22
23
24
27
28
29
30
31
33
34
35
36
25
32
26
37
38
39404144
53
45
42
43
49
47
50
6564
66
5251
54
57
55
58
61
62
63
56
46
48
60
11
10
1 24
6
89
3
7
12
559
44
Combined Management Report – Group Business Fundamentals
Wacker Chemie AG – Annual Report 2018

Four Business DivisionsWACKER is based on a matrix organization with clearly defined functions and has four business divisions.
Each business division has global responsibility for its products, manufacturing facilities, markets, customers and results. Regional organizations are responsible for all business in their respective countries. WACKER’s corporate departments primarily provide services for the whole Group, although some also have production-related functions.
See Figure B.5 on page 46
Management and Supervision
In compliance with the German Stock Corporation Act (AktG), Wacker Chemie AG has a two-tier management system, comprising an Executive Board and Supervisory Board. The Executive Board has four members.
Wacker Chemie AG is the parent company and thus determines the Group’s strategy, overall management, resource allocation, funding, and communications with key target groups (especially with the capital market and shareholders).
Executive Board and Supervisory Board in 2018At its meeting on March 6, 2018, the Supervisory Board of Wacker Chemie AG renewed the contract of Executive Board member Auguste Willems for a further five years (until December 31, 2023). On May 9, 2018, the Annual Shareholders’ Meeting in Munich elected the shareholder representatives for the Supervisory Board. Newly elected was Ann-Sophie Wacker, who replaced shareholder rep-resentative Dr. Thomas Strüngmann on the Supervisory Board. All the other shareholder representatives were re-elected to the Supervisory Board. At its inaugural
meeting, directly after the Annual Shareholders’ Meeting, the Supervisory Board confirmed Dr. Peter-Alexander Wacker as its chairman. The employee representatives on the Supervisory Board had been elected by Wacker Chemie AG’s employees and executives before the Annual Shareholders’ Meeting. They elected Ingrid Heindl to the Supervisory Board to replace Dagmar Burghart as employee representative.
B.4 Group Structure
WACKER Group
Corporate Departments Business Divisions
WACKER SILICONES
WACKER POLYMERS
WACKER BIOSOLUTIONS
WACKER POLYSILICON
B.3 Executive Board Responsibilities
Dr. Rudolf Staudigl President & CEOWACKER POLYSILICON Executive Personnel, Corporate Development, Corporate Communications, Investor Relations, Corporate Auditing, Legal, Compliance, Retirement Benefits
Dr. Christian HartelWACKER POLYMERS WACKER BIOSOLUTIONS (since July 1, 2018) Human Resources (Personnel Director), Corporate Research & Development (since July 1, 2018), Intellectual Property (since July 1, 2018), Corporate Engineering Region: Asia
Dr. Tobias OhlerCorporate Accounting and Tax, Corporate Controlling, Corporate Finance and Insurance, Information Technology, Procurement & Logistics Region: The Americas
Auguste WillemsWACKER SILICONES WACKER BIOSOLUTIONS (until June 30, 2018) Sales & Distribution, Site Management, Corporate Security, Environment / Health / Safety, Product Stewardship, Corporate Research & Development (until June 30, 2018), Intellectual Property (until June 30, 2018) Regions: Europe, Middle East
45
Combined Management Report – Group Business Fundamentals
Wacker Chemie AG – Annual Report 2018

On October 31, 2018, Harald Sikorski stepped down as employee representative on the Supervisory Board, as he had taken up a new post in another district outside Bavaria. At the Executive Board’s request, Jörg Kammermann was appointed to the Supervisory Board by order of the District Court of Munich on November 14, 2018.
Declaration on Corporate ManagementThe declaration on corporate management required by Section 315d in combination with Section 289f of the German Commercial Code (HGB) is included in the corporate governance report. This declaration, which does not form part of the combined management report, is also available online. It contains the Executive and Supervisory Boards’ work procedures, the declaration of conformity pursuant to Section 161 of the German Stock Corporation Act (AktG), and information on key corporate management practices. It also includes: targets for the proportion of women on the Supervisory Board and Executive Board, and in the two levels of management below the Executive Board, as well as deadlines for implementation; statutory minimum quotas to be observed when filling Supervisory Board positions; and information on the company’s diversity strategy.
www.wacker.com/corporate-governance
Non-Financial StatementThe non-financial statement that is to be submitted in accordance with Sections 315b and c and 289b and c of the German Commercial Code (HGB) is included in the annual report in the form of a non-financial report for the Group and does not form part of the combined management report. It is also available on the internet and in the online Annual Report for 2018. Further, it has been published in Germany’s Federal Gazette. This non-financial report includes a description of the Group’s business model and details of environmental concerns, social issues and personnel matters, as well as information on respect for human rights and on combating corruption and bribery. In compliance with the revised International Standard on Assurance Engagements ( ISAE) 3000 (Revised): “Assurance Engagements Other Than Audits or Reviews of Historical Financial Information,” the non-financial report for the
Group was reviewed by KPMG AG, Wirtschaftsprüfungs-gesellschaft, the auditors of the consolidated financial statements.
https://reports.wacker.com/2018/annual-report/
Executive Board and Supervisory Board CompensationExecutive Board compensation contains both fixed and vari-able components. The main features of the compensation system for the Executive Board and Supervisory Board are described in the compensation report, which is included in the corporate governance report. The compensation report also forms part of the combined management report.
Key Products, Services and Business Processes
Overall, the range of products and services at each of our divisions remained unchanged in 2018. In several applica-tion areas, though, we expanded our product portfolio. With more than 2,800 products, WACKER SILICONES has our broadest offering. The division produces both specialties and standard products.
WACKER POLYMERS makes state-of-the-art binders and polymeric additives (such as dispersible polymer powders and dispersions). These are used in diverse industrial appli-cations or as feedstock. Customers include the paint and coating sectors and the paper and adhesives industries. The main customer for polymer binders is the construction industry.
WACKER BIOSOLUTIONS supplies customized biotech and catalog products for fine chemicals. Products include pharmaceutical proteins, cyclodextrins, cysteine, polyvinyl acetate solid resins (for gumbase), organic intermediates and acetylacetone. The division focuses on customer-spe-cific solutions for growth areas, such as food additives, pharmaceutical actives and agrochemicals.
WACKER POLYSILICON produces hyperpure polysilicon for the semiconductor and solar sectors.
B.5 Group Structure in Terms of Managerial Responsibility
Managerial ResponsibilityStructure based on decision-making responsibility and reporting lines
Executive Board
Business divisions Corporate departments Regions Group coordinators
46
Combined Management Report – Group Business Fundamentals
Wacker Chemie AG – Annual Report 2018

Integrated Production System – WACKER’s Greatest StrengthThe highly integrated material loops at its major sites in Burghausen, Nünchritz and Zhangjiagang are one of the WACKER’s key competitive advantages. The basic principle of integrated production is to use the byproducts from one stage as starting materials for making other products. The auxiliaries required for this, such as silanes, are recycled in a closed loop. Waste heat from one process is utilized in other chemical processes. Integrated production not only cuts energy and resource consumption, but also improves the use of raw materials in the long term, and integrates environmental protection into our processes.
Major Sales Markets and Competitive Positions
The competitive positions of WACKER’s three biggest divi-sions by sales were unchanged in 2018. Globally, we rank among the top two suppliers of polysilicon and of silicones, dispersions and dispersible polymer powders based on vinyl acetate-ethylene (VAE). For a number of products, we are the world leader. Asia is the key sales region for our products, followed by Europe and the Americas.
Competitive Positions of WACKER’s DivisionsWACKER SILICONES is No. 2 in the world and leads the market in Europe. WACKER is the global market leader in building-protection silicones. With their wide range of properties, silicones are used in every major industry. The largest growth potential lies in Asia.
WACKER POLYMERS is the world’s largest producer of VAE dispersions and dispersible polymer powders. WACKER is the only company in the market to have a complete supply chain for dispersions and dispersible polymer powders in Europe, the Americas and Asia. At this division, too, we see Asia as the region with the largest growth potential.
WACKER BIOSOLUTIONS is the global market leader in cyclodextrins and cysteine, and in polyvinyl acetate solid resins for gumbase. We hold a small but promising market position as a producer of bacterial pharmaceutical proteins and are continually working to expand that position. The division also offers fine chemicals in profitable niches.
Business at WACKER POLYSILICON is marked by intense competition. Determining factors are the solar industry’s demand for polysilicon and market trends in the global solar sector. According to in-house analyses, WACKER POLYSILICON is the world No. 1 in terms of production capac-ity for both polysilicon supplied to the semiconductor sector and monocrystalline polysilicon used in the solar sector.
Economic and Legal Factors
WACKER sells its products and services to virtually every industry. Although our individual business divisions are not immune to economic fluctuations, their impact and onset may vary. Our product portfolio and broad customer base enable us to mitigate the magnitude of these fluctuations.
OrdersThe terms for orders placed with WACKER vary from division to division. Most orders received by WACKER SILICONES are short term, though a small number are long term. Goods are usually shipped within three months of receipt of order. At WACKER POLYMERS, business is based on contracts and framework agreements with terms of up to one year. Around 30 percent of incoming orders are short term. WACKER POLYSILICON concludes short- and medium-term contracts. An increasing proportion of incoming orders are short-term ones based on market benchmarks. As a rule, our aim is to conclude fixed contracts with negotiated prices and quantities. Due to varying order-placement procedures at the Group and its divisions, order-level reporting is not very meaningful and hence does not serve as an indicator in our monthly reports.
B.6 WACKER’s Competitive Positions
Number 1 Number 2 Number 3
WACKER SILICONES DowDuPont WACKER Momentive
WACKER POLYMERS
WACKER(dispersible polymer powders / VAE dispersions)
Nouryon (Elotex / dispersible polymer powders) Celanese (dispersions)
Dairen (dispersible polymer powders / dispersions)
WACKER POLYSILICON WACKER GCL-Poly OCI
47
Combined Management Report – Group Business Fundamentals
Wacker Chemie AG – Annual Report 2018

Operational Metrics as Leading Indicators of Future DevelopmentsBy referring to specific leading indicators based on oper-ational metrics, we try to factor potential developments into our business plans and to allocate capacities accordingly. Since our operations are based on diverse businesses and markets, we use a number of leading indicators to gain insights into potential developments at each of our business divisions.
Economic Factors Impacting Our BusinessThe main economic factors influencing WACKER’s business remained unchanged in many areas. Accounting for around 44 percent of production costs, energy and raw-material costs had the largest impact in 2018.
Energy and Raw-Material CostsAs a chemical company, we belong to an energy-intensive industry and require diverse raw materials to manufacture our products. Consequently, higher energy and raw- material costs affect our cost structure after a time lag. WACKER constantly strives to keep costs at a competitive level. By generating our own power at Burghausen and Nünchritz, we reduce our energy-procurement needs and, consequently, the cost risk. Amendments to the regulatory framework – such as to grid charges, to energy and elec-tricity taxes, to CO2 certificates in the European Emissions Trading Scheme (ETS) and to the German Renewable Energy Act (EEG) – can negatively affect WACKER’s energy costs both directly and indirectly, e. g. through higher
grid charges or fees. We continually strive to improve our energy efficiency. Our goal is to reduce specific energy consumption by half between 2007 and 2022. When procur-ing raw materials, we ensure not only favorable pricing, but also price flexibility, by sometimes concluding contracts featuring varying durations, greater freedom as regards the volume procured or regular adjustments of wholesale market prices.
Exchange-Rate FluctuationsAs a rule, WACKER hedges against exchange-rate fluctua-tions. We hedge about half of our dollar exposure for each subsequent year with a mix of derivative currency-hedging transactions. In determining sensitivity, we simulate a 10-percent devaluation of the US dollar against the euro. Without hedging, such an increase in the euro against the US dollar would have negatively impacted EBITDA by around € 50 million.
State-Regulated Incentive and Feed-In Tariff Programs for Renewable Energy SourcesAs one of the world’s leading suppliers of hyperpure poly-crystalline silicon, we are affected by regulatory changes to incentive and feed-in tariff programs for renewable energy sources. Substantially lower prices for solar modules and cells have greatly increased the competitive advantage of solar energy over fossil fuels and other methods of power generation. The cost of manufacturing photovoltaic products is expected to continue decreasing, which will further reduce dependence on state-regulated incentive
B.7 Leading Operational Indicators
Business Divisions Leading Operational Indicator Indicator of
WACKER SILICONES WACKER POLYMERS WACKER BIOSOLUTIONS
Raw-material and energy price trends
Our cost trends
WACKER SILICONES Orders received per month Our capacity utilization
WACKER POLYSILICON
Short-, medium- and long-term contracts
Market research, talks with customers
Our capacity utilization, further market trends
Increase in solar capacity by country, our capacity utilization
All business divisions Talks with customers
Market research
Our sales trend, our product quality
Market trends, product innovations
48
Combined Management Report – Group Business Fundamentals
Wacker Chemie AG – Annual Report 2018

and feed-in tariff programs over the next few years. Our assumption is that, in a few years, solar energy will get along even without special incentives, particularly in combination with cost-efficient storage options. China’s announcement in late May that it was curbing solar feed-in tariffs and capping the amount of new photovoltaic installa-tions in 2018 slowed demand for solar modules. Our strong cost position, high product quality, international orientation, broad customer base and fixed supply contracts give us a competitive edge over other manufacturers. WACKER will maintain its focus on improving its specific production costs to secure its competitive position.
Legal Factors Impacting Our BusinessChina imposed anti-dumping and anti-subsidy tariffs on polysilicon made in the USA. These tariffs currently affect polysilicon produced at our site in Charleston, Tennessee (USA). Trade relations with China were additionally impaired by the USA’s introduction of safeguard tariffs in 2018 through a Section 201 proceeding (global safeguard tariffs on solar cells and modules) and by its use of similar proceedings. An amicable settlement to the dispute over solar products is likely to be part of a comprehensive trade agreement between the USA and China. Additionally, a new shipper review may enable WACKER to request exemption from China’s anti-dumping and anti-subsidy tariffs on polysilicon from the USA. The chances of success are hard to estimate given the current situation.
On the other hand, the anti-dumping and anti-subsidy tariffs between Europe and China have ended. Back in May 2014, WACKER and the Chinese Ministry of Commerce (MOFCOM) signed a minimum price agreement for exports of polysilicon produced in Europe. MOFCOM, in turn, refrained from imposing anti-dumping and anti-subsidy tariffs on this material. After the EU Commission allowed its anti-dumping and anti-subsidy tariffs on Chinese makers of solar cells and modules to expire in September 2018, MOFCOM ended all its restrictive measures, effective November 1, 2018. As a result, WACKER’s EU-made polysilicon can be imported into China without the restrictions of a minimum price agreement.
Goals and Strategies
Strategy of the WACKER GroupWACKER’s vision and five overarching strategic goals have not changed. Our strategy is focused on profitable growth and the goal of attaining a leading competitive position in most of our business fields, while observing the principle of sustainable development.
For further information, visit www.wacker.com
WACKER’s strategic business goals are:
– Expanding our production capacities, with capital expenditures below depreciation
– Generating higher growth than the average rate for the chemical industry
– Focusing even more strongly on sustainability– Achieving attractive margins throughout the
economic cycle– Increasing our cash inflow from operating activities
Our capital expenditures will remain below depreciation until at least 2020. In our individual regions, we are focusing spending on plants for producing intermediates and down-stream products, which have a lower capital intensity than full-scale plants for upstream products.
We want to grow faster than the chemical-sector average by deploying new capacities, by expanding in emerging markets and regions, by innovating, and by substituting competitors’ products with WACKER products. Product innovations will spur momentum, as will raising the percent-age of specialty products in our portfolio. Our focal regions and countries for further growth remain unchanged: China, Southeast Asia, India, the Middle East and Brazil. We also see opportunities to expand our chemical business in our established markets in Europe and the USA.
We constantly strive to reduce our raw-material consump-tion and improve the process efficiency of our plants. The Wacker Operating System (WOS) program helps us boost productivity along the entire supply chain, the goal being to further reduce specific operating costs. In addition, we are developing a wide range of sustainable products for renewable energy, thermal insulation and electromobility that will help reduce CO2 emissions in the use phase.
49
Wacker Chemie AG – Annual Report 2018
Combined Management Report – Group Business Fundamentals – Goals and Strategies

Our aim is to achieve attractive margins with our products. Our target EBITDA margin for the chemical divisions is >16 percent.
Capital expenditures that are below the level of deprecia-tion, further efficiency gains and cost improvements, and our planned sales growth will enable us to generate higher cash flow. We want our shareholders to benefit even more from our profitability. The goal is to distribute around half of our Group net income to them.
Digitalization is another topic affecting all our business processes. Our digitalization program, which has been running since 2017, covers all core business processes – ranging from logistics, production control and maintenance through to our distribution systems and new business models. WACKER will vigorously promote the digital trans-formation in the years ahead, making it a cornerstone of its transformation strategy.
Strategy at Each Business DivisionAs the world’s second-largest producer of silicones, WACKER SILICONES intends to continue increasing its share of high-margin specialties to generate profitable growth. In relation to standard products, the division’s focus is on being a full-range supplier with global reach and achieving cost leadership via economies of scale. WACKER POLYMERS is pursuing growth by concentrating on the trend toward value-added construction materials and actively promoting related industry standards ( transformation). Using the advantages offered by VAE dispersions and dispersible powders, the division aims to replace conventional tech-nologies (substitution) and tap new application areas. By operating production facilities for both VAE dispersions and dispersible polymer powders across the globe, WACKER POLYMERS creates opportunities to tap into growth regions faster. WACKER BIOSOLUTIONS is focusing on expanding its biotech activities and on acquiring new customers. To this end, the division is leveraging its extensive expertise and its facilities for making biotech products on an industrial scale. As for polysilicon business, WACKER POLYSILICON is concen-trating on efficiency and high cash inflows from operating activities. The top priorities are cutting production costs further, increasing the output of existing manufacturing plants, and reducing consumption of energy and raw mate-rials. At the same time, we will maintain the high standard of quality that has become the industry benchmark. Our business focus is to build on our market position with semiconductor customers and to grow our share of the market for solar-grade monocrystalline polysilicon.
Management Processes
Value-Based Management Is Integral to Our Corporate Policies
Value-based management is an integral part of our corpo-rate policies. Its purpose is to achieve a lasting increase in our company’s value. In our management processes, we distinguish between performance parameters and budget parameters. Performance parameters serve the financial management of the company. They include the EBITDA margin and ROCE. The EBITDA margin indicates how successful the company is compared with the competition, while ROCE shows how efficiently the company employs its capital. Budget parameters such as EBITDA and net cash flow are also important for management control. In addition to these indicators, BVC (business value contribution) is a dedicated budget parameter used in the calculation of variable compensation for Executive Board members.
Value management and strategic planning complement each other, which is why we align the strategic positioning of a business entity with its contribution to increasing the company’s value. As part of our annual planning process, we make fundamental decisions on capital expenditures and innovation projects, on tapping new markets and on a variety of other projects.
Active use is made of key financial performance indicators in the management decision-making process. For example, lower-than-expected net cash flow could prompt us to adjust our capital expenditure during the year. WACKER is very flexible at responding to both positive and negative changes.
The EBITDA trend is considered to be the most important financial indicator for communication with capital markets.
Key Financial Performance Indicators for the WACKER GroupIn 2018, we continued to use the same key financial per-formance indicators for value management as in previous years. These are:
– EBITDA margin (EBITDA in relation to sales). We compare historical performance with planned performance as
50
Wacker Chemie AG – Annual Report 2018
Combined Management Report – Goals and Strategies – Management Processes

well as with that of the competition, and use the results to calculate a target EBITDA margin. We calculate the weighted divisional average as our target margin for the Group.
– ROCE or return on capital employed. ROCE is defined as earnings before interest and taxes (EBIT ) divided by capital employed. Capital employed comprises working capital as well as noncurrent assets required for business operations. Investment income from Siltronic AG and the corresponding carrying amount in equity are not included when calculating ROCE. ROCE is a clear indicator of how profitably the capital required for business operations is being employed. It is influenced not only by profitability, but also by capital intensity with regard to noncurrent assets required for business operations and to working capital. ROCE is reviewed annually as part of our planning process and is a key criterion for managing our capital expenditure budget.
– EBITDA (earnings before interest, taxes, depreciation and amortization). This demonstrates the operational performance capability of the company before taking into consideration the cost of capital. We set absolute EBITDA targets for the business divisions and take the cost of capital into account by using BVC to deter-mine the internal budget target. We calculate BVC by deducting the cost of capital, non-operational factors, and depreciation and amortization from EBITDA. The development of BVC depends mainly on changes in EBITDA.
– Net cash flow (defined as the sum of cash flow from operating activities and long-term investing activities before securities and including additions from finance leases, less the change in advance payments received). Net cash flow shows whether we can finance ongoing operations and necessary investments from our own operating activities. WACKER’s aim is to generate a sustained positive net cash flow. Apart from profit-ability, the main factors affecting net cash flow are the effective management of net current assets and the level of capital expenditures.
Supplementary Financial Performance IndicatorsOur key financial performance indicators are supplemented by additional performance indicators that provide us with information on the Group’s sales and liquidity situation and on its debt levels.
These supplementary financial performance indicators include:
Sales: profitable growth is an important factor in increasing the company’s value over the long term and one of the main drivers of a positive cash flow trend.
Capital expenditures: in the course of our medium-term planning, we set capital-expenditure priorities and an investment budget. Other capital expenditures are planned by each business division. To this end, the individual busi-ness divisions regularly analyze their capacity utilization and anticipated capacity requirements. The respective business divisions and Corporate Engineering are responsible for the operational management of individual investment projects (project handling, deadlines, budgets, quality and safety).
Net financial debt: WACKER’s net financial debt is a supple-mentary performance indicator used to monitor the Group’s financial situation. We define it as the sum of cash and cash equivalents, noncurrent and current securities, and noncurrent and current financial liabilities.
Non-Financial Performance Indicators Are Not Intended for Corporate ManagementNone of the non-financial performance indicators we employ is used universally for corporate decision-making.
Development of Key Financial Performance Indicators in 2018EBITDA margin: in 2018, the target margin was 20 percent. The Group’s actual EBITDA margin was 18.7 percent.
EBITDA: we expected EBITDA to increase by a mid-single-digit percentage in 2018 compared with the previous year. We missed this target, the reason being that we did not receive the insurance compensation for the loss event at
B.8 Planned and Actual Figures
€ million Reported for 2018
Forecast 2018
2017
EBITDA margin (%) 18.7Slightly higher than last year 20.6
EBITDA 930.0A mid-single-digit
percentage increase 1,014.1
ROCE (%) 5.9Substantially higher
than last year 7.5
Net cash flow 124.7
Clearly positive, substantially
below last year 358.1
51
Wacker Chemie AG – Annual Report 2018
Combined Management Report – Management Processes

the Charleston site in Tennessee (USA ) in the course of the year. EBITDA declined by € 84.1 million year over year to € 930.0 million. In 2018, the cost of capital before taxes was 10.3 percent. We did not meet our BVC target at the Group level in 2018. At € –266.6 million, the figure achieved was worse than in the prior year.
ROCE: WACKER’s ROCE in 2018 was 5.9 percent. In our March 2018 forecast, we had expected ROCE to be substan-tially above the prior-year level. The still unpaid insurance compensation prevented us from reaching this target.
Net cash flow: our projection for 2018 was that net cash flow would be clearly positive, but substantially below the previous year’s figure. At € 124.7 million, net cash flow was in line with our forecast.
Two-Stage Strategic PlanningStrategic planning, which determines how we can meet value-related and corporate goals, is conducted in two stages. First, our divisions identify their market and com-petitive positions, and their value-related strength. We then use these results to formulate recommendations regarding strategic positioning and planned steps. All of this is supplemented by innovation and investment projects, and approved by the Strategy Conference.
Operational planning in the second half of the year addresses strategic-planning decisions with a five-year timeline. The Executive and Supervisory Boards jointly approve the annual plan, which then forms the basis for determining basic forecasts for the current year in early February. We monitor whether we are meeting our forecasts
by means of monthly comparisons of planned and actual figures.
Financing StrategyThe goal of WACKER’s financing strategy is to ensure sus-tainable growth and stability for the Group. This strategy comprises both financing through our own resources and the use of debt instruments.
We satisfy our capital requirements by means of operating cash flow, and short-term and long-term financing.
We ensure the Group’s ongoing solvency with rolling cash-flow management and sufficient contractually agreed lines of credit. Financing requirements are calculated for the entire Group, with loans usually being taken out centrally. Project-specific and regional funding are available in special cases.
For details of the financing measures implemented in 2018, please refer to
the Financial Position section on page 67.
Operational Control InstrumentsWe control operational processes via our integrated management system ( IMS). This system stipulates uniform standards throughout the Group for issues relating to quality, environmental protection, and health and safety. We have our Group management system analyzed by an international certification organization in accordance with uniform standards based on ISO 9001 (quality) and ISO 14001 (environment).
B.9 ROCE and BVC
€ million 2018 2017
EBIT 389.6 423.7
Capital employed 1 4,917.0 5,138.3
ROCE 2 (%) 5.9 7.5
Pre-tax cost of capital (%) 10.3 10.1
BVC 3 -266.6 -151.8
1
2
3
Capital employed is the sum of average noncurrent assets ( less noncurrent securities and deferred tax assets), plus inventories and trade receivables ( less trade payables). It is the variable used in calculating the cost of capital.Return on capital employed is a ratio indicating how profitably capital is employed. Investment income from Siltronic AG and the corresponding carrying amount in equity are not included when ROCE is calculated.BVC is calculated by adjusting EBIT for non-operational factors.
B.10 Strategic and Operational Planning
a Forecasts made for current year
b Operational planning used as a basis for strategic planning ( incl. the latest actual and rolling forecast figures)
c Strategy Conference
d Strategy approvede Strategy implemented in
operational planningf Planning Conferenceg Operational planning
approved (by Supervisory Board)
Jan Feb Mar A
pr M
ay Jun Jul Aug
S
ep
Oct
N
ov Dec
f
a
b
d c
e
gS
trate
gic planning
Op
erat
ion
al p
lann
ing
52
Wacker Chemie AG – Annual Report 2018
Combined Management Report – Management Processes

Statutory Information on Takeovers
B.11 Information Required by Section 315a (1) of the German Commercial Code (HGB)
The following table contains information required by Section 315a (1) of the German Commercial Code (HGB):
§ 315a (1) 1
Composition of subscribed capital:
Wacker Chemie AG’s subscribed capital comprises 52,152,600 non-par value voting shares. No other share classes have been issued. The total number of shares currently includes 49,677,983 held by external shareholders and 2,474,617 held by Wacker Chemie AG itself. WACKER’s treasury shares were acquired by repurchasing Wacker Chemie GmbH shares in August 2005, when it was still a private limited company. The Executive Board may use or sell 1,692,317 of these treasury shares with the consent of the Supervisory Board; use or sale of the remaining 782,300 shares requires Supervisory Board approval as well as a resolution by the Annual Shareholders’ Meeting.
§ 315a (1) 2
Restrictions on voting rights or on the transfer of shares:
There are no restrictions on voting rights or the transfer of shares.
§ 315a (1) 3
Direct or indirect capital stakes:
Each of the following holds a stake of over 10 percent of the sub-scribed capital: Dr. Alexander Wacker Familiengesellschaft mbH, based in Munich; Blue Elephant Holding GmbH, based in Pöcking; and Dr. Peter-Alexander Wacker, resident in Bad Wiessee and to whom the voting shares of Blue Elephant Holding GmbH are attributable.
§ 315a (1) 4 Owners of shares with special rights: Shareholders have not been given any special rights that bestow powers of control.
§ 315a (1) 5 Method of voting-right control in the case of employee participation:
Insofar as employees hold shares in Wacker Chemie AG’s capital, they exercise their resulting control rights directly.
§ 315a (1) 6
Statutory provisions and articles of association regarding the appointment and dismissal of executive board members and amendments to said articles:
The provisions to appoint and dismiss Wacker Chemie AG’s Executive Board members are based on Section 84 et seq. of the German Stock Corporation Act (AktG). Wacker Chemie AG’s Articles of Association do not contain any further provisions in this respect. Pursuant to Article 4 of the Articles of Association, the number of Executive Board members is fixed by the Supervisory Board, which also appoints an Executive Board member as President & CEO. Amendments to the Articles of Association are covered by Sections 133 and 179 of the German Stock Corporation Act. In accordance with Section 179 (1) sentence 2 of the Act, the Supervisory Board has been empowered to amend the Articles of Association if only the wording thereof is affected.
§ 315a (1) 7
Authority of the executive board to issue or buy back shares:
In accordance with a resolution passed at the May 8, 2015 Annual Shareholders’ Meeting, Wacker Chemie AG’s Executive Board was authorized – in compliance with the legal provisions set out in Section 71 (1) no. 8 of the German Stock Corporation Act – to acquire treasury shares totaling a maximum of 10 percent of capital stock. No capital has been authorized for the issue of new shares.
§ 315a (1) 8
Major agreements associated with changes of control due to a takeover bid:
Various agreements with joint-venture partners include change- of-control clauses, which stipulate what is to happen if one of the joint-venture partners is taken over. These arrangements comply with the usual standards for such joint-venture agreements. In addition, several loan agreements contain change-of-control clauses. Here, too, the clauses are typical of this type of agreement.
§ 315a (1) 9
Severance agreements with the executive board or employees in the event of a takeover bid:
There are no severance agreements or similar with employees or with Executive Board members in the event of a takeover bid (please refer to the Compensation Report).
53
Combined Management Report – Statutory Information on Takeovers
Wacker Chemie AG – Annual Report 2018

Business Report
Economic Trends
In 2018, the world economy continued to grow across all regions. According to the International Monetary Fund ( IMF), global GDP climbed by 3.7 percent. Growth was thus on par with the year before. Initially, economic researchers projected higher growth rates, but revised them down during the year given the mounting risks.
Advanced economies saw expansion dampened by increasing uncertainty due to trade conflicts and by deep-ening political and geopolitical crises. Growth in many parts of Europe and in Japan lagged the rates of previous years. In the USA, that trend was offset by the domestic economy’s strength.
In developing and emerging economies, GDP rose markedly in some cases. Commodity-exporting countries, such as Russia and Brazil, benefited from higher exports. Growth in India accelerated amid strong domestic demand. Accord-ing to the Asian Development Bank (ADB), infrastructure programs and structural reforms had a favorable impact there. In China, the economy was likewise supported by
strong domestic demand, even though growth slowed slightly. At 6.6 percent, GDP expansion was still above the original expectations of Beijing, which had targeted 6.5 percent.
Sector-Specific ConditionsWe supply products to a wide range of industries. Our main customers are in the chemical, construction, electrical, electronics and photovoltaic sectors.
WACKER’s Chemical Divisions Deliver Good Sales TrendThe chemical industry performed well in 2018. Production grew in nearly all parts of the world, spurring demand for chemicals. According to the German Chemical Industry Association (VCI), global chemical sales ( including pharma-ceuticals) totaled € 4.8 trillion in 2017, with Asia accounting for close to 60 percent. The favorable situation on international markets bolstered the performance of chemical companies in Germany. Given the good economic trend, demand for German chemical products rose in both domestic and inter-national markets last year. Capacity utilization at German chemical plants in 2018 was about 84 percent. According to the VCI, chemical production in Germany expanded by 2.5 percent. As chemical prices gained 2.0 percent at the same time, the sector’s sales grew by 4.5 percent year over year to € 204 billion (2017: € 195 billion).
WACKER’s chemical divisions lifted their total sales versus the year before. The rise was driven by better prices, especially for silicone products, and by higher volumes. At WACKER SILICONES, demand was particularly good for silicone products for the electronics, textile and plastics industries. WACKER POLYMERS grew its sales of dispersible polymer powders and dispersions based on vinyl acetate-ethylene ( VAE). The sales trend at WACKER BIOSOLUTIONS was especially positive for products used in pharmaceutical and agricultural applications.
Construction Industry Grows in 2018According to market research institute B + L Marktdaten GmbH, the global construction industry grew by 2.9 percent in 2018, to US$ 9.1 trillion (2017: US$ 8.9 trillion). Construction contracts in Western Europe rose by 2.0 percent. In Eastern Europe, construction expenditures were up by 2.7 percent. The North American construction industry expanded by 3.2 percent in 2018. In Asia, construction-sector growth was especially strong, climbing by 4.0 percent.
B.12 GDP Trends in 2018
%
Europe 1.9
Asia 6.0
China 6.6
India 7.3
Japan 0.9
USA 2.9
Sources – worldwide: IMF; Asia: ADB; China: National Bureau of Statistics; India: ADB; Japan: OECD; USA: IMF; Europe: OECD
0 Worldwide 3.7
54
Combined Management Report – Business Report
Wacker Chemie AG – Annual Report 2018

WACKER POLYMERS lifted its sales further in construction applications. In dispersible polymer powders, volume gains were driven in every region of the world by the expanding dry-mix mortar market. In dispersions, WACKER POLYMERS posted gains in Asia, especially China. Key markets for our VAE dispersions include not only adhesives and sealants, but also water-based, environmentally compatible coat-ings. Construction applications at WACKER SILICONES also delivered sales growth. We continued to expand in all three product segments: building protection, sealants / adhesives and silane-modified polymers. In 2018, sales at WACKER SILICONES grew in every region. The trend was especially strong in the CIS, China and India.
Electrical and Electronics Sector Expands in Emerging EconomiesAccording to the German Electrical and Electronic Man-ufacturers’ Association (ZVEI ), the global electrical and electronics market grew 5 percent to about € 4.4 trillion in 2018 (2017: € 4.2 trillion). The main impetus came from China and emerging economies, which gained around 7 percent each.
WACKER has two business divisions that supply customers in the electrical and electronics sector. WACKER POLYSILICON delivers polysilicon to customers in the semiconductor industry. WACKER SILICONES increased its sales of silicones to the electronics industry by 20 percent. This growth was spurred especially by applications for automotive electronics. Silanes for electronic applications grew 12 percent. The increase was also double-digit for stan-dard materials used in producing molded parts in diverse application fields.
Photovoltaics Pivotal to Global Energy SupplyIn 2018, the global solar market edged above the year-earlier growth level. Various market studies and our own market surveys show that some 105 gigawatts (GW) were newly installed worldwide (2017: about 100 GW). That was about 5 percent more than the year before. Incentives and substantially lower system costs supported the global expansion of PV installations. The amount of installed PV capacity worldwide thus exceeded 500 GW at year-end 2018. About two-thirds of new capacity in 2018 was added in China, India, Japan and the USA. Changes in China’s incentive policies, though, caused newly installed capacity there to decrease from 53 GW in 2017 to 43 GW in 2018. China strongly curbed solar feed-in tariffs and the amount of new PV installations in June 2018. Additionally, efficiency gains lowered polysilicon consumption. This impacted volumes at WACKER POLYSILICON.
Despite the slight global rise in new installations, market conditions in photovoltaics remained challenging. In the USA and India, punitive tariffs on imported solar cells and modules pushed up prices, impeding growth in those markets. In Europe, an end to minimum prices for imported solar cells and modules took effect on September 3, 2018, but declining prices for cells and modules are expected to only begin unfolding their full market potential in 2019. Given continued overcapacity, price pressures persist at all stages of the supply chain. That prevented numerous solar companies from achieving any major full-year improvement in their financial situation.
B.13 Growth Rate in Construction by Region in 2018
%
Middle East and Africa
0.7
Asia 4.0
North America
3.2
Western Europe
2.0
Eastern Europe
2.7
South America
1.2
Source: B + L Marktdaten GmbH, December 2018
0 Worldwide 2.9
B.14 Installation of New PV Capacity in 2017 and 2018
Installation of New PV Capacity (MW)
Growth in 2018
2018 2017 %
Germany 3,100 1,800 72
France 1,000 900 11
Rest of Europe 7,500 4,100 83
USA 11,100 10,600 5
Japan 7,000 7,400 -5
China 43,000 52,800 -19
India 9,500 9,600 -1
Other regions 22,800 12,800 78
Total 105,000 100,000 5
Sources: Germany’s Federal Network Agency, Commissariat Général au Développement Durable, IHS, Solar Energy Industries Association (SEIA), RTS Corporation, China National Energy Agency, India’s Ministry of New and Renewable Energy, Bridge to India, market studies, and WACKER’s own market surveys.
55
Combined Management Report – Business Report
Wacker Chemie AG – Annual Report 2018

Raw-Material Prices Generally Higher than a Year EarlierIn 2018, raw-material prices were markedly higher on balance than the year before. Vinyl acetate monomer (VAM) saw a price rise of around 14 percent. Methanol was 13 percent more expensive than in 2017. On average, the price of silicon metal increased by 3 percent. Ethylene prices climbed by an average of around 8 percent.
Overall Statement by the Executive Board on Underlying Conditions
Despite continued conflicts and political uncertainties, the world economy grew in 2018. Global economic activity was especially strong in the first quarter of 2018. As the year progressed, the underlying dynamics gradually weakened and growth slowed amid mounting trade tensions between the United States, on the one hand, and China and Europe, on the other. Global growth was also impeded by problems associated with the United Kingdom’s withdrawal from the European Union. In 2018, China posted its lowest growth rate since 1990. This was due to trade tensions with the United States and lower capital spending by Chinese companies.
WACKER’s chemical business developed well in 2018 amid these underlying economic conditions. Sales growth at our silicones business was especially strong at 14 percent. Our other two chemical divisions, WACKER POLYMERS and WACKER BIOSOLUTIONS, also expanded, posting higher volumes. Further, earnings at the chemical divisions rose, even though higher raw-material costs had a dampening effect, especially at WACKER POLYMERS. The trend with our polysilicon business, on the other hand, was clearly weaker. The main reasons were lower average prices and slowing customer demand. Additionally, the market was dampened by China’s decision to curb its solar feed-in tariffs and limit the installation of new photovoltaic capacity. All these factors meant that sales and earnings were substantially lower than planned.
It was due to the declines in our polysilicon business that our sales decreased in Asia, particularly in China. As regards our other two main regions, Europe and the Americas, WACKER lifted its sales by a mid-single-digit per-centage. Further, we expanded in the other countries of the world, where we grew by a high-single-digit percentage.
B.15 Market-Price Trends for WACKER’s Key Raw Materials
2016 2017 2018
Silicon metal (€ /t)
Ethylene (€ / t)
Methanol (€ / t )
Vinyl acetate monomer (€ / t )
Annual average in each case
Three-year high€ 2,218
Three-year low€ 1,604
€1,988€1,683
€ 2,046
3,000
2,000
1,000
0
1,500
1,000
500
0
€ 908€ 1,017
€ 1,100
Three-year low€ 810
Three-year high€ 1,150
Three-year high€ 394
€ 208
Three-year low€150
€ 334€ 295
600
400
200
0
€1,004€ 899
Three-year low€ 795
Three-year high€1,370
€1,143
2,000
1,000
0
56
Combined Management Report – Business Report
Wacker Chemie AG – Annual Report 2018

Key Events Affecting Business Performance
After shutting down polysilicon production at our site in Charleston, Tennessee (USA ) in September 2017, we gradually resumed production in May 2018, reaching full production capacity in December.
AcquisitionsIn April 2018, WACKER acquired a production site in Amster-dam (Netherlands) for biopharmaceuticals from SynCo Bio Partners Luxembourg S. à. r. l. On acquiring the site, WACKER also took over the associated business operations. The two fermentation lines there have a total capacity some 1,800 liters. As a result, WACKER BIOSOLUTIONS’ total capacity has doubled. Through the acquisition, WACKER aims to continue strengthening its position as a contract manu-facturer of biopharmaceuticals.
DivestituresWACKER did not divest any business fields or product business in 2018.
Capital ExpendituresCapital expenditures increased year over year, as planned. They amounted to € 460.9 million in the reporting year (2017: € 326.8 million).
The focus of WACKER’s investing activities was on our three chemical divisions, with several projects in different coun-tries. In 2018, our Charleston production site in Tennessee (USA) continued construction work on a pyrogenic-silica facility. This project alone accounted for some € 55 million. In Holla, Norway, we are expanding production facilities for silicon metal. Investment there was around € 45 million in 2018. In Ulsan, South Korea, we are building new production facilities for dispersions and dispersible polymer powders. About € 30 million of the project’s total budget of some € 65 million was spent in the reporting year. In León, Spain, we completed the modernization of a large-scale fermenta-tion plant. The investment in 2018 for this project amounted to about € 8 million. Additionally, WACKER invested in a series
of small- and medium-scale projects for intermediates and downstream products, and in infrastructure measures, especially at our fully integrated sites in Burghausen and Nünchritz.
Comparing Actual with Forecast Performance
WACKER did not change the 2018 targets it had set early in the year for EBITDA, EBITDA margin, ROCE and net cash flow. In the case of net financial debt and capital expenditures, WACKER issued more specific guidance during the year. At the start of 2018, WACKER projected that its sales would increase by a low-single-digit percentage. The EBITDA margin would be slightly higher than the previous year, EBITDA would increase by a mid-single-digit percentage and ROCE would be substantially above the prior-year level. Net cash flow would be clearly positive, but substantially below the prior-year level.
Forecast Unchanged during Year, with Guidance Specified on Net Financial Debt and Capital ExpendituresIn its Q1 Interim Report of April 2018, WACKER left its pro-jections unchanged.
On publishing its Q2 Interim Report, WACKER adjusted its guidance only for net financial debt and capital expen-ditures. Net financial debt was forecast to total around € 500 million at the end of 2018. Until then, WACKER had expected net financial debt to be on par with the prior-year level of € 454.4 million. Capital expenditures were predicted at around € 450 million for full-year 2018. That was about € 20 million less than projected at the start of the year (€ 470 million).
In its Q3 Interim Report, WACKER confirmed its projections for the full year.
WACKER Reaches Sales Target – EBITDA Down Over Prior Year Due to Outstanding Insurance CompensationWACKER increased its sales by 1.1 percent to € 4.98 billion (2017: € 4.92 billion), primarily due to volume growth. Sales climbed further at the chemical divisions, with WACKER SILICONES posting especially strong sales gains. Sales contracted markedly at WACKER POLYSILICON, dampened by lower average prices and reduced volumes.
In the first weeks of the new business year, prior to publi-cation of the consolidated financial statements on March 5, 2019, business has developed in line with our expectations.
57
Combined Management Report – Business Report
Wacker Chemie AG – Annual Report 2018

EBITDA, diverging from our guidance, came in at € 930.0 mil-lion, 8.3 percent below the year before (2017: € 1,014.1 million). That is why the EBITDA margin was lower than a year earlier. The reason for the EBITDA decline was that our 2018 earn-ings guidance included insurance compensation (for the incident at Charleston, Tennessee) that is still outstanding. As polysilicon production at Charleston did not reach full capacity until early December 2018, there was not enough time to conclude talks with the insurer before year-end. We now expect to do so in 2019.
Net cash flow of € 124.7 million was clearly positive, but substantially below the year-earlier figure, as forecast. ROCE, diverging from our guidance, was 5.9 percent lower versus the year before due to the still outstanding insurance compensation. Raw-material and energy costs increased more than we expected. The average rate of the euro against the US dollar over the year was somewhat lower than we had originally anticipated.
In 2018, capital expenditures were markedly above the year-earlier level. They amounted to € 460.9 million.
Year-end net financial debt of € 609.7 million was not on par with the previous year as initially projected, but substantially higher. Here, too, the outstanding insurance compensation had an impact.
Employee numbers increased as anticipated at the start of the year. At the reporting date, WACKER had 14,542 employees. That was 731 more than the year before.
Deviations from Projected ExpensesPersonnel costs edged up, both in absolute terms and as a percentage of sales. In the medium-term, we expect personnel costs to decline markedly in relation to sales, given our extensive program to increase productivity.
Raw-material costs were markedly higher than the year before, both in absolute terms and as a percentage of sales. That was because prices of key raw materials, especially VAM and ethylene, continued to rise throughout the year. Our medium-term projection is that the ratio of raw-material costs to sales will decrease slightly, given our measures to lower the quantities of raw materials used in our products.
Energy costs declined slightly year over year due to our ongoing program to cut production costs and to the shut-down of polysilicon production at Charleston in the first half of 2018.
B.17 Comparing Actual with Forecast Performance
Results in 2017,
adjusted
Forecast March 2018
Forecast April 2018
Forecast July 2018
Forecast Oct. 2018
Results in 2018
Key Financial Performance Indicators
EBITDA margin (%) 20.6Slightly higher than
last yearSlightly higher than
last yearSlightly higher than
last yearSlightly higher than
last year 18.7
EBITDA (€ million) 1,014.1Mid-single-digit
percentage increaseMid-single-digit
percentage increaseMid-single-digit
percentage increaseMid-single-digit
percentage increase 930.0
ROCE (%) 7.5Substantially higher
than last yearSubstantially higher
than last yearSubstantially higher
than last yearSubstantially higher
than last year 5.9
Net cash flow (€ million) 358.1
Clearly positive, substantially
below last year
Clearly positive, substantially
below last year
Clearly positive, substantially
below last year
Clearly positive, substantially
below last year 124.7
Supplementary Financial Performance Indicators
Sales (€ million) 4,924.2Low-single-digit
percentage increaseLow-single-digit
percentage increaseLow-single-digit
percentage increaseLow-single-digit
percentage increase 4,978.8
Capital expenditures (€ million) 326.8 Around 470 Around 470 Around 450 Around 450 460.9
Net financial debt (€ million) 454.4 At last year’s level At last year’s level Around 500 Around 500 609.7
Depreciation (€ million) 590.4 Around 550 Around 550 Around 550 Around 550 540.4
B.16 Expenses by Cost Type
% of sales 2018 2017
Personnel costs 24.7 24.5
Raw-material costs 29.6 28.6
Energy costs 6.6 6.9
Depreciation 10.8 12.0
58
Combined Management Report – Business Report
Wacker Chemie AG – Annual Report 2018

Earnings
Group Sales of € 4.98 Billion Up Slightly Over Prior Year’s € 4.92 BillionIn 2018, the WACKER Group again lifted its sales, which rose 1 percent to € 4.98 billion (2017: € 4.92 billion). Higher volumes and prices in chemicals, especially silicones, were the main reason for this slight increase. This enabled WACKER to compensate for negative exchange-rate effects from the euro’s strength versus the US dollar and for lower polysilicon prices. WACKER SILICONES generated the strongest growth, with sales up 14 percent. WACKER POLYMERS grew its sales by 3 percent, while WACKER BIOSOLUTIONS posted an increase of 10 percent. At WACKER POLYSILICON, on the other hand, sales declined by 27 percent. Sales of solar-grade
polysilicon weakened due to lower volumes and prices. China’s decision to curb the amount of new photovoltaic installations markedly slowed demand for solar modules from late May 2018 onward. WACKER POLYSILICON used this market situation for inventory rebuilding, enabling it to supply customers more quickly.
For further information on the business divisions, please refer to the
Segments section starting on page 61.
WACKER generated the majority of its sales outside Ger-many. International sales came in at € 4.11 billion (2017: € 4.10 billion), representing 82.5 percent of total sales. The US dollar’s depreciation against the euro dampened sales.
For further information, please refer to the Regions section starting on
page 63.
Group EBITDA at € 930.0 Million, with EBITDA Margin at 18.7 PercentGroup EBITDA declined 8 percent year over year, coming in at € 930.0 million (2017: € 1,014.1 million). The EBITDA margin of 18.7 percent was lower than the previous year (20.6 percent). This decrease was chiefly attributable to the costs of the business interruption at the Charleston plant and to the fact that insurance compensation for the loss event there is still outstanding. Following the loss event, we gradually ramped up production again at the site from May through December 2018. Higher raw-material and energy costs dampened earnings considerably.
EBITDA was lifted by the Group’s result from investments in joint ventures and associates, which came in at € 131.7 mil-lion. It included income of € 99.9 million from Siltronic (2017: € 40.0 million) and positive remeasurements of other investments.
For further information on the business divisions, please refer to the
Segments section starting on page 61.
As expected, depreciation declined markedly year over year, both in absolute terms and as a percentage of sales. This was due to lower levels of investment spending in 2016 and 2017 and to the expiry of depreciation periods. In 2019, we expect depreciation to fall further, amounting to about € 500 million in the medium term.
B.18 Year-over-Year Sales Comparison
€ million
Group sales, full-year 2017
Sales-volume and product-mix effects
Price effects Exchange- rate effects
Group sales, full-year 2018
4,924
–31
158
–72
4,979
0
59
Wacker Chemie AG – Annual Report 2018
Combined Management Report – Business Report – Earnings

EBIT Substantially LowerThe Group’s earnings before interest and taxes (EBIT ) totaled € 389.6 million in the reporting period (2017: € 423.7 million). That was 8 percent less than the year before and corresponded to an EBIT margin of 7.8 percent (2017: 8.6 percent). Lower depreciation than in the previous year improved EBIT: depreciation declined by 9 percent in 2018, in line with expectations.
Cost of Goods Sold Rises 3 Percent Year over YearAt € 874.7 million, gross profit from sales was 8 percent lower than in the prior year (2017: € 954.4 million). The cost of goods sold came in at € 4.10 billion (2017: € 3.97 billion). The gross margin was 17.6 percent (2017: 19.4 percent). On the one hand, it was lifted by increased sales. On the other, higher raw-material costs and the ongoing costs of the production shutdown at Charleston in September 2017 weighed on the gross margin. In 2018, no insurance com-pensation payments to be posted as income were received for Charleston. The Group’s cost-of-sales ratio rose from 81 percent to 82 percent.
Functional Costs ClimbOther functional costs (selling, R & D and general admin-istrative expenses) were 6 percent higher year over year, climbing to € 627.8 million (2017: € 594.0 million). The rise was due not only to higher personnel expenses across all units, but also to increased research and development expenses.
Other Operating Income and ExpensesIn 2018, the balance of other operating income and expenses was € 11.0 million (2017: € 19.4 million). Foreign currency losses of € –6.9 million (2017: € –9.7 million) lowered other operating income and expenses. Higher other operating expenses versus the year before also decreased the balance.
Result from InvestmentsDue to higher income from Siltronic AG, the result from investments in joint ventures and associates rose signifi-cantly. It amounted to € 131.7 million (2017: € 42.0 million). WACKER sold part of its stake in Siltronic AG at the end of Q1 2017 and has since accounted for the company using the equity method. Remeasurements of other investments also had a positive effect.
Financial and Net Interest ResultAs expected, WACKER’s financial result improved year over year, amounting to € –65.2 million (2017: € –96.3 million). Inter-est income came in at € 8.0 million (2017: € 7.5 million) and interest expenses at € 22.1 million (2017: € 38.3 million). The net interest result was thus € –14.1 million (2017: € –30.8 million). Interest expense on bank loans decreased markedly due to the repayment of such loans in the course of 2018 and their refinancing at more favorable terms.
The other financial result was € –51.1 million ( 2017: € –65.5 million). It included not only the interest-rate effects of provisions for pensions and other provisions, but also exchange-rate effects and the costs of derivative financial instruments used to hedge Group loans.
B.20 Reconciliation of EBIT to Net Income for the Period
€ million 2018 2017 Change in %
EBIT
Financial result
Income from con-tinuing operations before income taxes
Income taxes
Net income from con-tinuing operations
Net income from discontinued operations
Net income for the year
Of whichAttributable to Wacker Chemie AG shareholders
Attributable to non-controlling interests
Earnings per common share (€ ) (basic /diluted)
Earnings per common share (€ ) from continuing operations
Earnings per common share (€ ) from discontinued operations
Average number of shares outstanding (weighted)
389.6 423.7 -8.0
-65.2 -96.3 -32.3
324.4 327.4 -0.9
-64.3 -77.3 -16.8
260.1 250.1 4.0
– 634.7 -100.0
260.1 884.8 -70.6
246.1 866.7 -71.6
14.0 18.1 -22.7
4.95 17.45 -71.6
4.95 4.85 2.2
– 12.60 -100.0
49,677,983 49,677,983 –
B.19 Reconciliation of EBITDA to EBIT
€ million 2018 2017 Change in %
EBITDA
Depreciation / appreciation of fixed assets
EBIT
930.0 1,014.1 -8.3
-540.4 -590.4 -8.5
389.6 423.7 -8.0
60
Combined Management Report – Earnings
Wacker Chemie AG – Annual Report 2018

Capital expenditures climbed by 56.0 percent year over year to € 222.7 million (2017: € 142.8 million). The main investment projects were the construction of a new pyrogenic silica plant at Charleston (USA), the expansion of silicon-metal production at Holla (Norway), and new facilities for down-stream silicone products at Burghausen (Germany) and Zhangjiagang (China). As of December 31, 2018, the division had 5,114 employees (Dec. 31, 2017: 4,737).
WACKER POLYMERS
Sales at WACKER POLYMERS grew by 3.0 percent in 2018, reaching € 1.28 billion (2017: € 1.25 billion). Growth was fueled by higher volumes for dispersions and dispersible polymer powders.
WACKER POLYMERS continued to increase its sales in Europe and Asia, achieving its biggest percentage gain in Asia. In the reporting year, polymer applications for both construc-tion and coatings performed well.
EBITDA of € 147.7 million (2017: € 205.6 million) was markedly lower than the year before, chiefly due to substantially higher raw-material costs. The EBITDA margin declined to 11.5 percent (2017: 16.5 percent).
Capital expenditures climbed year over year to € 71.0 million (2017: € 48.1 million). Investment spending included new production plants for dispersions and dispersible polymer
Income TaxesWACKER reported tax expenses of € 64.3 million for 2018 (2017: € 77.3 million). The Group’s effective tax rate was 19.8 percent (2017: 23.6 percent). This decrease was mainly due to high investment income from Siltronic AG, which was recognized after tax and formed part of pre-tax income.
Group Net IncomeIn part due to the effects mentioned, income from continuing operations rose, with net income for the year reaching € 260.1 million. In the previous year, income from continuing operations was € 250.1 million. Total net income for 2017, though, came in at € 884.8 million, as it included income of € 634.7 million from discontinued operations in connection with the deconsolidation of Siltronic as a WACKER segment.
Return on Capital Employed (ROCE)The return on capital employed (ROCE) sets earnings before interest and taxes (EBIT ) in relation to the capital employed for business activities. Since Q2 2017, investment income from Siltronic and the corresponding carrying amount in equity have no longer been included when calculating ROCE.
In the reporting year, ROCE was 5.9 percent (2017: 7.5 per-cent). The decline stemmed from a significant drop in EBIT. As a result of low capital expenditures and high depreciation, capital employed sank. It decreased from € 5,138.3 million to € 4,917.0 million in the year under review.
Segments
WACKER SILICONES
WACKER SILICONES generated substantial sales growth in 2018. Sales climbed 13.6 percent to € 2.50 billion (2017: € 2.20 billion). The main factors were markedly higher volumes for specialty products – coupled with a corre-spondingly better product mix – and higher prices. Many different market segments spurred this growth, including electronics, construction and medical technology. WACKER SILICONES posted robust sales gains in all of its three main regions: Europe, the Americas and Asia.
EBITDA outpaced sales growth year over year, rising by 38.6 percent to € 616.6 million (2017: € 444.9 million). It was driven by strong volume growth, higher prices and high plant utilization rates. The EBITDA margin was 24.7 percent, considerably higher than a year earlier (2017: 20.2 percent).
B.21 Key Data: WACKER SILICONES
€ million 2018 2017 20161 2015 2014
Total sales
EBITDA
EBITDA margin (%)
EBIT
Capital expenditures
R & D expenses
Employees (December 31, number)
1 Costs from selling expenses reclassified to R & D expenses as of 2016
2,499.6 2,200.2 2,001.1 1,943.3 1,733.6
616.6 444.9 361.2 276.2 209.8
24.7 20.2 18.1 14.2 12.1
536.7 362.2 280.8 194.5 128.9
222.7 142.8 88.6 82.0 88.5
60.9 58.6 53.7 35.8 39.5
5,114 4,737 4,566 4,353 4,240
61
Combined Management Report – Earnings
Wacker Chemie AG – Annual Report 2018

powders at Ulsan (South Korea) and facility expansions at Burghausen (Germany). At 1,600, employee numbers were higher as of December 31, 2018 (Dec. 31, 2017: 1,539).
WACKER BIOSOLUTIONS
In 2018, WACKER BIOSOLUTIONS lifted its sales by 10.0 per-cent to € 227.0 million (2017: € 205.9 million). The increase was mainly driven by volume growth and better prices for some products. The biggest sales gains were posted by pharmaceutical proteins and by the Pharma/Agro business line. In regional terms, sales performance was particularly positive in Germany and the Americas.
At € 23.5 million, EBITDA decreased significantly year over year (2017: € 37.5 million). This was primarily due to higher raw-material costs, to integration costs for the new sites in León and Amsterdam, and to still-low utilization rates at the new biologics production plant in the Netherlands. The EBITDA margin was 10.4 percent (2017: 18.2 percent).
Capital expenditures climbed year over year to € 17.9 million (2017: € 15.7 million), a rise of 14.0 percent. Investments focused on expansion and modernization projects at the plants in León (Spain) and Jena (Germany). In addition, in April 2018, we acquired a biopharmaceuticals production site in Amsterdam from SynCo Bio Partners Luxembourg S. à. r. l. The capacity of the two fermentation lines there is 1,800 liters. As a result, WACKER BIOSOLUTIONS doubled
its total production capacity for biopharmaceuticals. Due to the acquisition, employee numbers rose to 709 as of December 31, 2018 (Dec. 31, 2017: 533).
WACKER POLYSILICON
Sales at WACKER POLYSILICON decreased in 2018. At € 823.5 million (2017: € 1.12 billion), sales were 26.7 percent lower than the year before. The main reasons were sub-stantially reduced volumes and lower average prices for polysilicon. At the end of May 2018, China announced that it would curb solar feed-in tariffs and cap the amount of new photovoltaic installations. That slowed demand for solar modules in China and put pressure on the entire value chain for solar products. WACKER POLYSILICON used this market situation for inventory rebuilding so as to ensure faster deliveries to its customers. In the reporting year, Asia was again the key sales region for our products.
EBITDA at WACKER POLYSILICON amounted to € 72.4 million, after € 290.4 million in 2017. That was a decrease of 75.1 per-cent, which was chiefly due to considerably lower average prices and to lower volumes. Additionally, earnings were dampened by the business-interruption costs and subse-quent ramp-up costs at the Charleston, Tennessee site. The EBITDA margin was 8.8 percent (2017: 25.8 percent). Earnings in 2018 did not include any insurance compensation for the business interruption loss in Charleston.
B.23 Key Data: WACKER BIOSOLUTIONS
€ million 2018 2017 20161 2015 2014
Total sales
EBITDA
EBITDA margin (%)
EBIT
Capital expenditures
R & D expenses
Employees (December 31, number)
1 Costs from selling expenses reclassified to R & D expenses as of 2016
227.0 205.9 206.4 197.1 176.2
23.5 37.5 37.0 32.2 23.6
10.4 18.2 17.9 16.3 13.4
9.8 26.1 25.7 21.0 13.6
17.9 15.7 9.1 6.2 8.4
6.3 6.0 6.2 6.1 6.7
709 533 510 491 484
B.22 Key Data: WACKER POLYMERS
€ million 2018 2017 20161 2015 2014
Total sales
EBITDA
EBITDA margin (%)
EBIT
Capital expenditures
R & D expenses
Employees (December 31, number)
1 Costs from selling expenses reclassified to R & D expenses as of 2016
1,282.2 1,245.1 1,194.8 1,185.5 1,064.4
147.7 205.6 261.0 222.2 149.5
11.5 16.5 21.8 18.7 14.0
108.0 168.1 223.7 184.4 118.7
71.0 48.1 37.5 47.4 56.3
30.0 29.3 30.3 14.8 13.2
1,600 1,539 1,484 1,461 1,408
62
Combined Management Report – Earnings
Wacker Chemie AG – Annual Report 2018

WACKER POLYSILICON’s capital expenditures were higher year over year. Investment spending rose 8.0 percent to € 62.2 million (2017: € 57.6 million). The number of employees rose to 2,549 (Dec. 31, 2017: 2,538).
Other
Sales reported under “Other” totaled € 170.6 million in 2018 (2017: € 168.8 million), up 1.1 percent.
“Other” EBITDA amounted to € 70.6 million in the year under review (2017: € 32.6 million). The rise was mainly due to investment income from Siltronic, which is now recognized in this segment.
“Other” EBIT was € –6.8 million (2017: € –48.2 million).
As of December 31, 2018, “Other” had 4,570 employees (Dec. 31, 2017: 4,464). This WACKER segment includes site management and the employees at infrastructure units in Burghausen and Nünchritz, and at the Group’s corporate departments.
Regions
WACKER’s operations are highly international. Of the Group’s € 4.98 billion in sales in 2018 (2017: € 4.92 billion), we generated 82.5 percent through international business (2017: 83.4 per-cent). Germany accounted for 17.5 percent.
Sales Decline in AsiaWACKER’s sales in Asia decreased by 6.9 percent in 2018. The main reason was that WACKER POLYSILICON sold less polysilicon to China, the world’s biggest buyer of this starting material for the solar industry. That weighed on sales in Asia, which amounted to € 1.76 billion (2017: € 1.89 billion). In the Greater China region ( including Taiwan), sales decreased by 13.1 percent to € 1.05 billion (2017: € 1.20 billion). WACKER did generate strong sales growth in South Korea (up 14.9 percent) and in India (up 20.3 percent). Asia accounted for 35.3 percent of Group sales (2017: 38.3 percent).
Business in Europe GrowsIn Europe, a market where WACKER holds a strong position, the sales trend was positive in the reporting year. Sales climbed 6.4 percent to € 2.10 billion (2017: € 1.97 billion). The region accounted for 42.1 percent of Group sales (2017: 40.0 percent).
B.24 Key Data: WACKER POLYSILICON
€ million 2018 2017 20161 2015 2014
Total sales
EBITDA
EBITDA margin (%)
EBIT
Capital expenditures
R & D expenses
Employees (December 31, number)
1 Costs from selling expenses reclassified to R & D expenses as of 2016
823.5 1,124.0 1,095.5 1,063.6 1,049.1
72.4 290.4 285.9 402.4 537.0
8.8 25.8 26.1 37.8 51.2
-257.3 -87.6 -117.1 162.6 305.3
62.2 57.6 130.0 581.8 334.5
32.8 22.6 18.3 15.3 18.7
2,549 2,538 2,490 2,373 2,093
B.25 Divisional Shares in External Sales
%
50.2 % WACKER SILICONES 25.3 % WACKER POLYMERS 16.5 % WACKER POLYSILICON
4.6 % WACKER BIOSOLUTIONS3.4 % OTHER
€ 4,978.8 million
3.4
50.2
16.5
4.6
25.3
B.26 External Sales by Customer Location
€ million 2018 2017 2016 2015 2014
Europe
The Americas
Asia
Other regions
Group
2,096.7 1,970.4 1,850.9 1,887.6 1,794.2
878.2 838.7 825.6 945.1 810.7
1,756.9 1,886.2 1,751.6 2,253.1 2,039.7
247.0 228.9 206.1 210.4 181.8
4,978.8 4,924.2 4,634.2 5,296.2 4,826.4
63
Combined Management Report – Earnings
Wacker Chemie AG – Annual Report 2018

Net Assets
WACKER’s total assets were 4 percent higher versus Decem-ber 31, 2017. Rising by € 283.0 million, they amounted to € 7.12 billion as of December 31, 2018 (Dec. 31, 2017: € 6.84 bil-lion). The main items that increased were inventories and equity-accounted investments. The main changes on the equity and liabilities side were an increase in provisions for pensions and higher trade payables.
Sales Growth in the AmericasSales in the Americas increased by 4.7 percent to € 878.2 mil-lion (2017: € 838.7 million) and accounted for 17.6 percent of Group sales (2017: 17.0 percent).
Rising Sales in Other RegionsWACKER continued to increase its sales in other regions of the world. In 2018, sales in these regions rose by 7.9 percent to € 247.0 million (2017: € 228.9 million) with around 40 percent generated in Middle Eastern countries. “Other regions” accounted for 5.0 percent of Group sales (2017: 4.6 percent).
B.28 Trends: Assets
€ million 2018 2017 Change in %
Intangible assets, property, plant and equipment, and investment property
Investments in joint ventures and associates accounted for using the equity method
Other noncurrent assets
Noncurrent assets
Inventories
Trade receivables
Other current assets
Current assets
Total assets
3,565.3 3,543.2 0.6
658.3 564.6 16.6
639.9 605.3 5.7
4,863.5 4,713.1 3.2
1,010.7 783.6 29.0
681.9 655.7 4.0
562.6 683.3 -17.7
2,255.2 2,122.6 6.2
7,118.7 6,835.7 4.1
B.27 External Sales by Group Company Location
€ million 2018 2017 2016 2015 2014
Europe
The Americas
Asia
Other regions
Consolidation
Group
4,018.3 4,029.5 3,825.2 4,466.6 4,144.3
1,106.1 1,167.7 1,116.2 892.8 769.7
979.5 859.5 731.2 1,164.5 962.3
13.0 12.1 10.4 9.2 7.6
–1,138.1 –1,144.6 –1,048.8 –1,236.9 –1,057.5
4,978.8 4,924.2 4,634.2 5,296.2 4,826.4
B.29 Asset and Capital Structure
2018 2017
Total Balance Sheet € 7,118.7 million
Total Balance Sheet € 6,835.7 million
Assets Equity and liabilities Assets Equity and liabilities
Fixed assets 60.9 %
Inventories 14.2 %
Receivables 19.5 %
5.4 %Cash / securities
44.2 % Equity
30.5 % Provisions
14.0 % Financial liabilities
Liabilities / advance 11.3 % payments received
Fixed assets 61.6 %
Inventories 11.5 %
Receivables 18.9 %
8.0 %Cash / securities
46.4 % Equity
29.6 % Provisions
14.7 % Financial liabilities
Liabilities /advance 9.3 % payments received
64
Wacker Chemie AG – Annual Report 2018
Combined Management Report – Earnings – Net Assets

Property, Plant and Equipment Unchanged – Substantial Increase in Equity-Accounted InvestmentsRelative to the end of the previous year, fixed assets ( includ-ing equity-accounted investments) rose by € 115.8 million to € 4.22 billion (Dec. 31, 2017: € 4.11 billion). At € 3.53 billion, property, plant and equipment was virtually unchanged year over year (Dec. 31, 2017: € 3.50 billion). Depreciation, mainly of property, plant and equipment, amounted to € 540.4 million. Capital expenditures increased to € 460.9 million in the year under review (2017: € 326.8 million). The main focus was on WACKER SILICONES and WACKER POLYMERS, as well as on infrastructure measures. Over half of investment spending was for projects outside Germany. Changes in exchange rates increased the carrying amount of property, plant and equipment by about € 84 million.
The total value of equity-accounted investments was lifted by a profit of € 99.9 million from investments in joint ventures and associates and also by distributions in the amount of € 23.1 million from our equity investment in Siltronic. Further measurement gains contributed to the increase. As a result, the carrying amount rose from € 564.6 million to € 658.3 million.
Other Noncurrent Assets and SecuritiesOther noncurrent assets totaled € 639.9 million as of Decem-ber 31, 2018 (Dec. 31, 2017: € 605.3 million). That was 6 percent higher than at the previous year-end. WACKER reduced its holdings of noncurrent securities from € 42.1 million to € 4.4 million. Deferred tax assets rose markedly, from € 452.6 million to € 520.9 million, driven by the increase in provisions for pensions.
Working Capital Up 4 PercentCurrent assets grew by 6 percent year over year, amounting to € 2.26 billion (Dec. 31, 2017: € 2.12 billion). This increase was due predominantly to the strategic build-up of inventory at WACKER POLYSILICON. Inventories rose by 29 percent, up from € 783.6 million to € 1.01 billion. On the other hand, current liquidity – comprising securities and cash – declined by 24 percent to € 383.1 million (Dec. 31, 2017: € 505.1 million).
Working capital was 4 percent higher on December 31, 2018, amounting to € 1.22 billion (Dec. 31, 2017: € 1.17 billion).
In addition to an inventory build-up of 29 percent and a 4 percent increase in trade receivables, trade payables were also up 75 percent. These changes were attributable to a rise in business volumes and higher investment spend-ing as of year-end 2018. The inverse effects of prepayments made at year-end 2017 were another influencing factor. Changes in exchange rates had only a marginal effect on working capital.
Liquidity Down 29 PercentSecurities and cash and cash equivalents are a major component of other current assets. Current securities amounted to € 42.0 million at the end of 2018 (Dec. 31, 2017: € 218.2 million), with WACKER investing liquid funds in fixed-term deposits and short-term bonds that matured at year-end. As a result, cash and cash equivalents rose to € 341.1 million as of December 31, 2018 (Dec. 31, 2017: € 286.9 million). Total liquid assets (current and noncurrent securities, cash and cash equivalents) decreased by 29 percent to € 387.5 million (Dec. 31, 2017: € 547.2 million). Wacker Chemie AG’s dividend payment of € 223.6 million and the disbursement of variable compensation in Q2 2018 reduced liquid assets. The cost of Charleston’s production shutdown in the first months of 2018 and of the gradual production ramp-up there resulted in cash outflows. It was not possible to make up for these outflows, since no insur-ance compensation payments were received for Charleston in 2018. The insurance company’s advance payment of US$ 100 million was offset against the property damage claims. High tax prepayments also reduced liquidity. WACKER recognized income tax receivables of € 64.0 million under other current assets (Dec. 31, 2017: € 13.9 million).
B.30 Working Capital
€ million 2018 2017 Change in %
Trade receivables
Inventories
Trade payables
Working capital
681.9 655.7 4.0
1,010.7 783.6 29.0
-470.6 -268.5 75.3
1,222.0 1,170.8 4.4
65
Combined Management Report – Net Assets
Wacker Chemie AG – Annual Report 2018

Equity Ratio at 44.2 PercentGroup equity was virtually unchanged year over year. On December 31, 2018, it amounted to € 3.15 billion (Dec. 31, 2017: € 3.17 billion). The resulting equity ratio was 44.2 per-cent (Dec. 31, 2017: 46.4 percent). Net income for the year increased retained earnings by € 260.1 million. Prior-year equity had included the high net income figure of € 884.8 mil-lion, which reflected the gain generated by the deconsol-idation of Siltronic AG. The dividend payment of Wacker Chemie AG reduced retained earnings by € 223.6 million. The change in provisions for pensions, which was recognized in other comprehensive income, lowered other equity items by € 112.6 million. Currency translation effects lifted equity by € 64.3 million. The share of equity attributable to non- controlling interests amounted to € 58.3 million as of the reporting date (Dec. 31, 2017: € 50.1 million).
Liabilities Up Due to Higher Provisions for Pensions and Higher Trade PayablesCompared with the previous year, WACKER’s liabilities increased by € 306.8 million – or 8 percent – to € 3.97 billion. Provisions for pensions were € 176.7 million higher year over year and totaled € 1.80 billion. The applicable discount rates declined on balance, increasing provisions for pensions by € 67.6 million. Further, actuarial assumptions were adjusted
as regards the mortality tables for Germany. Application of the new Heubeck 2018G tables led to an increase of € 62.6 million in provisions for pensions. The discount rates were 1.98 percent in Germany (Dec. 31, 2017: 2.09 percent) and 4.12 percent in the USA (Dec. 31, 2017: 3.50 percent). On balance, other noncurrent liabilities were lower at € 74.3 million (Dec. 31, 2017: € 117.3 million). That was due to the reclassification of noncurrent advance payments as current.
Trade payables increased markedly to € 470.6 million (Dec. 31, 2017: € 268.5 million). This change was attributable to a rise in business volumes and higher investment spending as of year-end 2018. The inverse effects of prepayments made at year-end 2017 were another influencing factor.
Other current provisions and liabilities fell 14 percent to € 327.7 million (Dec. 31, 2017: € 379.6 million). Current advance payments received amounted to € 71.7 million at the report-ing date (Dec. 31, 2017: € 61.8 million). Current provisions for income taxes were lower year over year, due both to payments made and to reclassifications to other provisions. Provisions for interest and penalties related to income taxes were reclassified, falling from € 71.1 million to € 21.7 million. Personnel liabilities – including those relating to vacation, flextime and performance-related compensation – were down 8 percent on balance at the reporting date.
Financial Liabilities Almost UnchangedAt the end of the reporting period, current and noncurrent financial liabilities were € 4.4 million lower at € 997.2 million (Dec. 31, 2017: € 1.0 billion). Changes in exchange rates had only a marginal impact on financial liabilities. In Q1 2018, WACKER repaid loans totaling US$ 250 million ahead of schedule. At the same time, the company issued a promissory note (German Schuldschein) for € 300 million at favorable conditions, taking advantage of the prevailing low interest rates. The majority of WACKER’s financial liabilities are recognized in euros or US dollars. To a minor extent the company assumed financial liabilities in Chinese renminbi. Fixed interest is payable on most of the financial liabilities.
For further information on our financial liabilities, please refer to Note 14 in the Notes to the Consolidated Financial Statements. For further information on the principles and goals of financial management, please refer to Note 11 in the Notes to the Consolidated Financial Statements.
B.31 Trends: Equity and Liabilities
€ million 2018 2017 Change in %
Equity
Noncurrent provisions
Financial liabilities
Other noncurrent liabilities
Of which advance payments received
Noncurrent liabilities
Financial liabilities
Trade payables
Other current provisions and liabilities
Current liabilities
Liabilities
Total equity and liabilities
Capital employed
3,145.5 3,169.3 -0.8
2,103.4 1,899.4 10.7
894.7 800.4 11.8
74.3 117.3 -36.7
64.1 112.5 -43.0
3,072.4 2,817.1 9.1
102.5 201.2 -49.1
470.6 268.5 75.3
327.7 379.6 -13.7
900.8 849.3 6.1
3,973.2 3,666.4 8.4
7,118.7 6,835.7 4.1
4,917.0 5,138.3 -4.3
66
Combined Management Report – Net Assets
Wacker Chemie AG – Annual Report 2018

Financial Position
Financial-Management Principles and GoalsOur key financial-management goal is to secure WACKER’s financial strength over the long term. The central task is to sufficiently cover the financial needs of our operations and investment projects. Financial management at WACKER comprises capital-structure management, cash and liquid-ity management, and the management of market-price risk
(currencies, interest rates). The Group organizes financial management centrally. A groupwide financial regulation sets out the tasks and responsibilities. Capital-structure management involves shaping the capital structure of the Group and its subsidiaries. The latter are capitalized and financed in accordance with the principles of cost and risk optimization. This involves taking account of restrictions on the movement of capital, as well as other capital and foreign-currency transfer constraints.
In liquidity management, WACKER continuously monitors cash flows from operations and from financial business. WACKER covers the resulting liquidity needs via suitable instruments, such as intra-Group financing through borrow-ings, or through external loans from local banks. We receive the necessary outside funding from contractually agreed lines of credit denominated in various currencies and with differing maturities. We invest surplus liquidity in the money and capital markets at an optimum risk/return rate. WACKER has centralized cash management procedures in place to calculate cash requirements and surpluses.
WACKER pursues a careful financing policy that targets a balanced financing portfolio, a diversified maturity port-folio and a comfortable liquidity buffer. In addition to the financing instruments already mentioned, WACKER expects to be able to tap the bond markets and other instruments if necessary. Our aim is to maintain our corporate financial structures so that the Group’s credit rating remains – at a minimum – in the investment-grade range.
WACKER’s key liquidity source is the operations of its Group companies and the resultant incoming payments. As part of our cash-management systems, we use liquid-ity surpluses at individual Group companies to cover the financing requirements of other Group companies. This centralized system of internal transfers reduces our interest expense and the need for debt financing. The purpose of managing market-price risks is to limit the effects of fluctuations in exchange rates and interest rates on the Group’s bottom line. That involves first determining the Group’s overall exposure to currency risks. On the basis of the information obtained, we can then make decisions as regards hedging – namely, the volume to be hedged, the respective term of the hedge and the choice of hedging instrument.
Unrecognized Assets and Off-Balance-Sheet Financing InstrumentsAn important asset that does not appear in our statement of financial position is the value of the WACKER brand and other Group trademarks. We consider the high profile and reputation of our trademarks to be the key factor influencing customer acceptance of our products and solutions. But there are other intangible assets that are vital for success and that benefit our business. They include well- established customer relationships and our customers’ trust in our expertise in supplying products and solutions. Just as important are our employees’ know-how and experience, and our wealth of profound knowledge in R & D, product design, business and manufacturing processes, and project management. In particular, our integrated production system gives us an edge over our rivals. Another key success factor is WACKER’s sales network, which has evolved over many years. It enables the Group to market and sell its range of products and services locally to cus-tomers. Various rented and leased goods (operating leases) reported on in Note 16 are also items that do not appear in the statement of financial position. The same applies to other self-constructed assets. WACKER does not use any off-balance-sheet financing instruments.
67
Wacker Chemie AG – Annual Report 2018
Combined Management Report – Net Assets – Financial Position

Financing Measures in 2018A promissory note (German Schuldschein) of € 300 million taken out at the end of 2017 was disbursed in January 2018. Of this total amount, € 150 million matures in five years while the remaining € 150 million matures in seven years. In Q1 2018, WACKER prematurely repaid a total of US$ 250 million for loans taken out in 2016. WACKER also repaid the first scheduled installment of US$ 70 million agreed in its private placement of 2013. A promissory note (German Schuld-schein) of € 50 million was refinanced.
The Group’s financing agreements contain standard market credit terms. The major loans are subject to financial cov-enants (net debt-to-EBITDA ratio and maximum debt level of all Group companies).
Financial AnalysisThe Group’s cash flow is a key instrument of liquidity man-agement. Net cash flow serves as the internal indicator for measuring the liquidity of operating activities.
Net Cash Flow from Continuing OperationsIn 2018, WACKER complied with its long-term policy of financing its investments essentially from its own cash flow. Net cash flow totaled € 124.7 million in 2018 (2017: € 358.1 million), demonstrating that long-term investments are covered largely by cash flow from operating activities.
Net cash flow is the sum of cash flow from operating activ-ities (excluding the change in advance payments received) and cash flow from long-term investing activities (before securities), including finance leases.
Gross Cash Flow from Continuing OperationsIn 2018, cash flow from operating activities (gross cash flow) totaled € 509.6 million (2017: € 613.0 million). Net income from continuing operations was slightly higher at € 260.1 million (2017: € 250.1 million), while changes to working capital increased to € 182.7 million (2017: € 124.1 million) and taxes paid to € 152.0 million (2017: € 92.8 million). The profit from investments in joint ventures and associates of € 131.7 million (2017: € 42.0 million), which was included in net income for the period, reduced gross cash flow. Siltronic AG’s divi-dend payment of € 23.1 million increased gross cash flow. In advanced payments retained, the smaller reduction of € 38.5 million (2017: € 70.1 million) had a positive effect on gross cash flow. The depreciation of € 540.4 million included in net income for the period was less than in the previous year (2017: € 590.4 million).
Cash Flow from Long-Term Investing Activities – Continuing OperationsThe Group’s investment projects influence cash flow from long-term investing activities. In 2018, cash payments of € –408.8 million for investments were substantially more than
B.32 Net Cash Flow
€ million 2018 2017
Cash flow from operating activities (gross cash flow)
Change in advance payments received
Cash flow from long-term investing activities before securities
Additions from finance leases
Net cash flow – continuing operations
509.6 613.0
38.5 70.1
-423.4 -325.0
– –
124.7 358.1
B.34 Cash Flow from Operating Activities (Gross Cash Flow) – Continuing Operations
€ million
2018 509.6
2017 613.0
2016 621.0
2015 617.2
2014 485.2
0
B.33 Net Cash Flow – Continuing Operations
€ million
2018 124.7
2017 358.1
2016 361.1
2015 22.5
2014 215.7
0
68
Combined Management Report – Financial Position
Wacker Chemie AG – Annual Report 2018
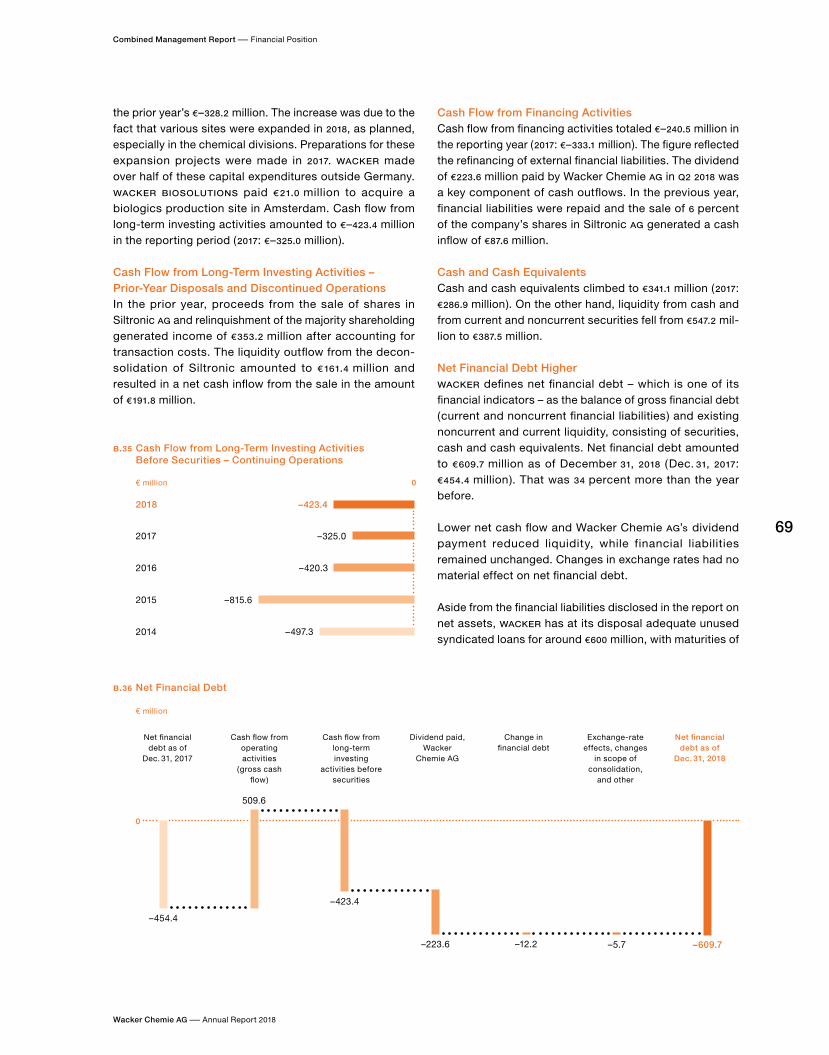
the prior year’s € –328.2 million. The increase was due to the fact that various sites were expanded in 2018, as planned, especially in the chemical divisions. Preparations for these expansion projects were made in 2017. WACKER made over half of these capital expenditures outside Germany. WACKER BIOSOLUTIONS paid € 21.0 million to acquire a biologics production site in Amsterdam. Cash flow from long-term investing activities amounted to € –423.4 million in the reporting period (2017: € –325.0 million).
Cash Flow from Long-Term Investing Activities – Prior-Year Disposals and Discontinued OperationsIn the prior year, proceeds from the sale of shares in Siltronic AG and relinquishment of the majority shareholding generated income of € 353.2 million after accounting for transaction costs. The liquidity outflow from the decon-solidation of Siltronic amounted to € 161.4 million and resulted in a net cash inflow from the sale in the amount of € 191.8 million.
Cash Flow from Financing ActivitiesCash flow from financing activities totaled € –240.5 million in the reporting year (2017: € –333.1 million). The figure reflected the refinancing of external financial liabilities. The dividend of € 223.6 million paid by Wacker Chemie AG in Q2 2018 was a key component of cash outflows. In the previous year, financial liabilities were repaid and the sale of 6 percent of the company’s shares in Siltronic AG generated a cash inflow of € 87.6 million.
Cash and Cash EquivalentsCash and cash equivalents climbed to € 341.1 million (2017: € 286.9 million). On the other hand, liquidity from cash and from current and noncurrent securities fell from € 547.2 mil-lion to € 387.5 million.
Net Financial Debt HigherWACKER defines net financial debt – which is one of its financial indicators – as the balance of gross financial debt (current and noncurrent financial liabilities) and existing noncurrent and current liquidity, consisting of securities, cash and cash equivalents. Net financial debt amounted to € 609.7 million as of December 31, 2018 (Dec. 31, 2017: € 454.4 million). That was 34 percent more than the year before.
Lower net cash flow and Wacker Chemie AG’s dividend payment reduced liquidity, while financial liabilities remained unchanged. Changes in exchange rates had no material effect on net financial debt.
Aside from the financial liabilities disclosed in the report on net assets, WACKER has at its disposal adequate unused syndicated loans for around € 600 million, with maturities of
B.35 Cash Flow from Long-Term Investing Activities Before Securities – Continuing Operations
€ million
2018 –423.4
2017 –325.0
2016 –420.3
2015 –815.6
2014 –497.3
0
B.36 Net Financial Debt
€ million
Net financial debt as of
Dec. 31, 2017
Cash flow from operating activities
(gross cash flow)
Cash flow from long-term investing
activities before securities
Dividend paid, Wacker
Chemie AG
Change in financial debt
Exchange-rate effects, changes
in scope of consolidation,
and other
Net financial debt as of
Dec. 31, 2018
–609.7
–454.4
–223.6 –12.2 –5.7
0
509.6
–423.4
69
Combined Management Report – Financial Position
Wacker Chemie AG – Annual Report 2018

over one year. Our existing lines of credit provide us with enough financial scope to secure the Group’s continued growth. The Group does not use any off-balance-sheet financing instruments.
RatingWACKER has sufficient lines of credit with banks and does not issue rated financing instruments such as bonds and commercial paper. Consequently, WACKER has not published a credit rating thus far.
Proposal on Appropriation of ProfitsIn 2018, Wacker Chemie AG posted a retained profit of € 1,482.3 million under German Commercial Code accounting rules. The Executive and Supervisory Boards will propose a dividend of € 2.50 per share at the Annual Shareholders’ Meeting. Based on the number of shares entitled to divi-dends on December 31, 2018, the total cash dividend corre-sponds to a payout of € 124.2 million. Calculated in relation to WACKER’s average share price in 2018, the dividend yield is 2.1 percent. At the Annual Shareholders’ Meeting, the Executive and Supervisory Boards will propose treating the amount remaining after deduction of the dividend as profit carried forward.
Executive Board Statement on Business Development and on the Group’s Economic Position
In 2018, WACKER’s operations were characterized by robust volume growth at its three chemical divisions, by a marked volume decline amid lower average prices at WACKER POLYSILICON, and by raw-material costs that, on balance, climbed significantly. WACKER met its sales projection. We were below guidance for EBITDA, EBITDA margin and ROCE because part of the insurance compensation for the loss event at Charleston, Tennessee, was still outstanding at year-end.
In chemicals, sales continued rising, spurred mainly by volume gains along with high capacity utilization. Sales growth was also supported by the fact that prices were higher on balance. Earnings were dampened by higher raw-material costs and negative exchange-rate effects. At WACKER POLYSILICON, declining volumes and lower average prices weighed on business. In addition, reductions in solar feed-in tariffs and a cap on the construction of new solar installations in China had a negative impact. Earnings were also slowed by the costs of the production shutdown and restart at Charleston.
Personnel expenses rose slightly, both in absolute terms and as a percentage of sales. Raw-material costs were markedly higher year over year, both in absolute terms and in relation to sales. Energy costs declined slightly year over year. As projected, depreciation edged down – in absolute figures and as a percentage of sales.
At € 3.15 billion, Group equity was down € 23.8 million year over year, mainly due to actuarial losses from provisions for pensions. The equity ratio came in at 44.2 percent. The Group’s net financial debt increased, amounting to € 609.7 million on December 31, 2018. Capital expenditures rose versus a year earlier, as planned. But, at € 460.9 million, they were below depreciation. Net cash flow of € 124.7 million was clearly positive, but substantially lower year over year.
Further Information on R & D, Employees, Procurement, Production, Sales and Marketing
This section provides further information on research and development, employees, procurement, production, sales and marketing. These topics play a key role in WACKER’s continuing success.
Research & Development
WACKER’s research and development activities pursue three goals:
– We contribute to our customers’ market success by searching for solutions that meet their needs.
– We optimize our methods and processes in order to lead in technology and be sustainably profitable.
70
Wacker Chemie AG – Annual Report 2018
Combined Management Report – Financial Position – Further Information on R & D, Employees, Procurement, Production, Sales and Marketing

– We concentrate on creating innovative products and applications for new markets and on serving highly promising fields, such as energy storage, renewable energy generation, electromobility, modern construction, and biotechnology.
At 3.3 percent, the R & D rate – research and development spending as a percentage of Group sales – was slightly higher than the previous year (3.1 percent).
In 2018, we filed 87 patent applications (2017: 88). Our portfolio contains about 3,900 active patents worldwide, as well as 1,700 patent applications currently pending. We license very little R & D know-how from third parties. In our research partnerships with universities, the results are usually made available to us free of charge or by transfer of rights of use.
Our capital spending included new R & D laboratories, pilot reactors and lab facilities. For example, we built a scale-up lab in Burghausen and expanded laboratory space at WACKER POLYMERS in Korea. We also invested in measuring and analytical equipment, both at German sites and inter-national subsidiaries.
A large part of our R & D costs was for the development of new products and production processes. WACKER scientists are currently working on some 270 projects, 14 percent of which are key strategic projects. WACKER operates in highly promising fields, such as energy recovery and storage, electronics, automotive, construction, household products, medicine, health care, cosmetics, food and biotechnology.
The aim of our New Solutions initiative is to develop technically and commercially superior solutions for new applications. Combining expertise from across the company, we apply it where needed. This work accounts for about 5 percent of our projects. In 2018, we started a building-insulation project under this initiative.
Some of our research projects are subsidized by govern-ment grants. During the reporting period, these subsidized projects were centered on ongoing development of lithium- ion batteries.
Research and Development at Two LevelsWACKER conducts R & D at two levels: centrally at our Corpo-rate R & D department and locally at our business divisions. Corporate R & D coordinates activities on a company-wide basis and involves other departments, such as Corporate Engineering for process-development issues. There is a management process in place for organizing our R & D projects transparently across the Group. Further, we use Project System Innovation (PSI) software to steer the Group’s product and process innovations by systematically evaluating customer benefit, sales potential, profitability and technology position.
B.37 R&D Expenses
€ million 2018 2017 20161 2015 2014
Research and development expenses
1 Selling expenses reclassified to research and development costs as of 2016
164.6 153.1 150.0 175.3 183.1
B.38 Investments in R&D Facilities
€ million
2018 6.7
2017 5.5
2016 5.4
2015 7.5 1
2014 7.8 1
1 Including Siltronic AG
0
B.39 Breakdown of R&D Expenditures in 2018
42 % Product development
28 % Process and product
optimization
19 % Technology
development
11 % Basic
research
71
Combined Management Report – Further Information on R & D, Employees, Procurement, Production, Sales and Marketing
Wacker Chemie AG – Annual Report 2018

Strategic Collaboration with Customers and Research InstitutesOur business divisions conduct application-driven R & D. Their focus is on product and process innovations in sil-icone and polymer chemistry and biotechnology, as well as on new processes for producing polycrystalline silicon. We collaborate with customers, scientific institutions and universities to achieve successful research results more quickly and efficiently. In 2018, WACKER’s roughly 45 research projects saw us collaborating with 40 international research institutes on three continents. Our collaborative efforts cover topics that include electricity storage, process simulation and process development.
WACKER places great emphasis on fostering young scientific talent and maintaining close contact with universities. In 2018, we sponsored some 160 degree theses and internships with students at over 50 universities worldwide. Back in 2006, Wacker Chemie AG joined with the Technical University of Munich (TUM) to establish the Institute of Silicon Chemistry, located on TUM’s Garching research campus near Munich, and has funded the institute ever since.
Research Work at WACKERAs the hub of WACKER’s R & D activities, Corporate R & D has the task of developing new products and processes efficiently. The department is also key to opening up new business fields that complement the Group’s core com-petencies. Our scientists and engineers conduct basic research, develop new products and processes and improve existing processes. Our lab assistants and technicians in R & D, Applications Technology and Plant Engineering not only work in our labs, pilot plants and production facilities, but also support application trials at customer sites.
WACKER had 728 research and development staff in 2018 (2017: 728), accounting for 5.0 percent of the Group work-force (2017: 5.3 percent). Of these, 575 were employed in Germany and 153 abroad.
Alexander Wacker Innovation AwardThe Alexander Wacker Innovation Award, a € 10,000 prize bestowed annually since 2006, recognizes excellence in categories alternating between product innovation, pro-cess innovation and basic research. The 2018 award for product innovation was conferred on two chemists from the Burghausen site who developed binders enabling the production of especially high-performing adhesives and sealants, wood varnishes and coating materials. Fields of application include wood-flooring adhesives, joint mor-tars, crack-filling compounds, paints, tile adhesives and wear-resistant coatings for concrete floors. The binders are marketed under the GENIOSIL® STP-E brand.
Selected Corporate R & D Research TopicsOne focus of our basic research is the chemistry of low-valence silicon for medium-to-long-term use in industrial applications (such as catalysis). In this area, we are working very closely with the Institute of Silicon Chemistry at the Technical University of Munich. The goal of our research into lithium-ion batteries is to develop silicon-based high-capacitance anode materials in order to significantly increase the capacity and energy density of lithium-ion cells. Industrially fabricated test cells exhibit up to 30 percent higher capacity – depending on the cell format – than graphite-based reference cells. Relevant developmental products are currently being evaluated at leading cell manufacturers.
72
Wacker Chemie AG – Annual Report 2018
Combined Management Report – Further Information on R&D, Employees, Procurement, Production, Sales and Marketing
B.40 R & D Organization
Executive Board
Head of R & D
Central R & D(Consortium für
elektrochemische Industrie)
R & D Processes:Portfolio management
Public funding management Higher education
relationship management
Lithium-Ion Batteries
Technology Management
Divisional R & D:WACKER SILICONES WACKER POLYMERS
WACKER BIOSOLUTIONS WACKER POLYSILICON
Intellectual Property: licenses, patents
Corporate Engineering:
Process development

Another research focus is our work on ESETEC® 2.0, a micro-bial production system for the class of biopharmaceuticals known as antibody fragments. Additionally, WACKER is developing a new generation of ESETEC® strains to control protein production, folding and release more flexibly for new classes of pharmaceutical proteins. This new concept of ESETEC® 3.0 strains will make it possible to induce the release of a protein at just the right time in a process.
Selected Divisional Research ProjectsAt WACKER SILICONES, researchers have developed updates to multilayer systems of our ultra-precision silicone films. Using novel silicone electrode materials, they created multilayered laminates that, as actuators, can transform electrical signals into mechanical movement, for example. Further, we have developed self-adhesive elastomers that bond effectively – even at low temperatures – to diverse substrates. These novel adhesives, which are based on our highly reactive silane-terminated polymers, exhibit excellent binding power in combination with silicone resins.
We are working on principles to accomplish the controlled release of active substances from silicone-containing network structures of the kind used in wound-care and medical technology, for example. Our spherical silicone resin particles provide a new platform for versatile appli-cations in fields such as cosmetics. Composite materials, i.e. composites of silicone resins and natural fillers or high-strength fibers, remain a focus of our research. These materials can be used, for example, as artificial stone or as a structural component in the construction, energy and automotive industries.
At WACKER POLYMERS, one research priority is functional polymer binders for use in construction and other sectors. We are continually improving our VOC-free products. Renewable raw materials represent one focus. In the reporting period, we launched functionalized polymer dispersions, dispersible polymer powders and polymer resins that are used to manufacture enhanced dispersion paints, adhesives and cementitious building materials.
B.41 Key Product Launches in 2018
Product Description Application Sector
BELSIL® eco Biomethanol-based silicone fluid
Formulation of personal-care and cosmetics products
Consumer products, cosmetics industry
CAVAQ10® Cyclodextrin complex Coenzyme Q10 with enhanced stability and bioavailability
Nutritional supplements industry
DEHESIVE® SF 200 Silicone-containing paper coating
Release agent Paper and label industries
ELASTOSIL® R plus 4001/20 Soft, extremely flexible silicone rubber
Injection and compression molding of membranes and seals
Household appliances, food industry
ELASTOSIL® R plus 4001/90
Silicone rubber with thermoset properties
Injection and compression molding of seals, even in sensitive applications
Food industry, plastics industry
HDK® N20P PHARMA Pyrogenic silica Enhancement of pharmaceutical powder flowability
Pharmaceutical industry
PULPSIL® 956 S Polyether-modified silicone Surfactant for paper manufacturing
Paper industry
SEMICOSIL® 961 TC
Thermally conductive silicone gap filler
Heat-management solutions in batteries and power electronics of electric vehicles
Automotive and electronics industries
SEMICOSIL® 993 TC Thermally conductive silicone adhesive
Heat management in electronic devices
Electronics industry
SEMICOSIL® PASTE RS5
Silicone sealing paste
Sealing paste for reversible clo-sure of housing covers for large components such as battery trays
Automotive and electronics industries
VINNAPAS® 4240 N
Dispersible polymer powder based on vinyl acetate-ethylene copolymers
Adhesive and embedding mortars in external thermal insulation composite systems
Construction
VINNECO® Polymeric binders based on renewable resources
Paints, adhesives, textiles, carpeting
Paint, adhesives, textile and carpet industries
73
Combined Management Report – Further Information on R & D, Employees, Procurement, Production, Sales and Marketing
Wacker Chemie AG – Annual Report 2018

At WACKER BIOSOLUTIONS, research is geared to strength-ening the division’s biotech expertise. We are working on production methods and technologies to manufacture high-quality bioactives for use in the food industry and as nutritional supplements. We are developing our ESETEC® production platform to enable its use in the manufacture of pharmaceutical proteins that are not easily accessible. In cyclodextrins, we are working on applications for the pharmaceutical, agrochemical and industrial sectors.
In the field of solar modules, huge technological progress is being made at every step of the solar value chain. Cell efficiency is also rising continually. The highest cell efficiencies are attainable only with the kind of hyperpure polycrystalline silicon that WACKER POLYSILICON produces. Reference studies such as the International Technology Roadmap for Photovoltaics ( ITRPV ) show efficiencies of almost 22 percent for monocrystalline solar cells produced with PERC (passivated emitter rear cell ) technology. Effi-ciency is a measure of how much of the radiant energy absorbed by a solar cell is transformed into electricity. High-efficiency monocrystalline cells (such as hetero-junction or interdigitated back contact solar cells) achieve efficiencies of 22 – 24 percent. High-performance segments like these require WACKER-quality polysilicon.
As a manufacturing company, WACKER has a large contin-gent of industrial workers (49.4 percent), roughly one-eighth (11.8 percent) of whom are women.
Personnel expenses climbed 2.8 percent year over year to € 1,231.5 million.
They included outlays for social benefits and the company pension plan in the amount of € 244.9 million (2017: € 241.6 mil-lion). The rise in expenses stemmed from higher employee numbers and the increase in the standard pay scale. In September 2018, a collective-bargaining agreement was reached between the IG BCE labor union and chemical employers. As a result, the standard pay scale rose by 3.6 percent on November 1, 2018. In 2019, vacation pay will increase from € 614 to € 1,200 per annum. Compensation for apprentices also rose, by a total of 9.0 percent for the first two training years and by a total of 6.0 percent for the third and fourth years.
Employees
Workforce ExpandsWACKER’s workforce increased by 5.3 percent in 2018. The increase was prompted by high utilization rates at our production plants and by the integration of WACKER BIOSOLUTIONS’ new site in Amsterdam (Netherlands).
German sites accounted for 70.8 percent of WACKER’s employees and international sites for 29.2 percent.
B.42 Number of Employees at December 31
2018 2017 2016 20151 20141
Germany
International
Group
1 Including Siltronic AG
10,291 9,984 9,775 12,251 12,366
4,251 3,827 3,673 4,721 4,337
14,542 13,811 13,448 16,972 16,703
B.43 Number of Temporary Workers at December 31
2018 2017 2016 20151 20141
Germany
International
Group
1 Including Siltronic AG
75 138 138 358 393
34 31 40 54 134
109 169 178 412 527
B.44 Personnel Expenses
€ million 2018 2017 2016 20151 20141
Personnel expenses
1 Including Siltronic AG
1,231.5 1,198.0 1,101.2 1,350.1 1,246.9
74
Wacker Chemie AG – Annual Report 2018
Combined Management Report – Further Information on R & D, Employees, Procurement, Production, Sales and Marketing

Production
In 2018, production output was markedly higher than the year before, whereas production costs were down 3.1 per-cent. Overall capacity utilization at the chemical divisions was roughly 90 percent. At WACKER POLYSILICON, we sold lower quantities than a year earlier, one reason being the shutdown at Charleston. The Charleston site resumed production in May 2018.
Procurement and Logistics
WACKER’s procurement volume increased in 2018 to € 3.6 bil-lion (2017: € 3.2 billion). The main reasons were marked pro-duction output growth, increased prices for raw materials and energy, and higher capital spending on production facil-ities. At 73 percent, the procurement rate – raw materials, services and other materials as a percentage of sales – was above the prior-year level (2017: 62 percent). The number of suppliers remained stable at around 11,000 (2017: 11,500).
At € 2.1 billion, energy and raw-material procurement was 11 percent higher year over year (2017: € 1.87 billion), with quantities procured rising by a low-single-digit percentage. After years of falling market prices, many petrochemicals and metals have increased markedly in price since 2017, and 2018 saw further price increases for coal and oil. This drove up prices for electricity and natural gas procurement, as well as for many other raw materials. The Chinese author-ities’ environmental audits of raw-material companies and production outages for acetic acid pushed up the prices of several of WACKER’s key raw materials and caused other
price increases. Upward price pressure also came from the increase in the cost of CO2 certificates in the European Union.
Shipping Volumes Substantially HigherShipping volumes rose significantly versus the year before. Globally, WACKER shipped 2.3 million metric tons of finished and semi-finished products (2017: 2.2 million metric tons). Burghausen, the Group’s largest logistics hub, increased its shipping volume to around 920,000 metric tons (2017: 894,000 metric tons). Shipments totaled 45,000 truckloads and 16,000 overseas containers.
We employ digital systems to support the increasing worldwide networking of supply flows. Thanks to these logistical tracking systems, we are increasingly able to track our shipments in real time worldwide and to respond promptly to any problems.
Aside from a fixed base salary, WACKER employees usually receive variable compensation. This voluntary payment to employees on both the standard and above-standard pay scales is tied to the attainment of corporate goals. In 2018, variable compensation totaled € 81.1 million groupwide.
A WACKER company pension is an important compensation component. It is available at most of our German and inter-national sites, except for regions where the statutory pen-sion appears sufficient or legal provisions are inadequate. In Germany, WACKER employees receive a pension through Wacker Chemie AG’s pension fund (Pensionskasse der Wacker Chemie VVaG). The fund has around 17,800 mem-bers and provides pension payments to some 8,400 retirees. The average pension paid in the reporting period was around € 650 per month. WACKER pays in up to four times an employee’s annual pension contributions, with the exact amount being determined by the type of agreement. Employees can supplement their company pensions by making their own additional contributions. As provided for in the collective wage agreements, WACKER supports employees’ supplementary contributions. Employees in Germany also receive an additional supplementary pension for that portion of their salary that exceeds the pension insurance contribution assessment ceiling.
B.45 Procurement Volumes ( incl. Procurement for Capital Expenditures)
€ million 2018 2017 2016 20151 20141
Procurement volumes 3,629 3,168 2,904 3,220 3,187
1 Including Siltronic AG
B.46 Plant Utilization in 2018
% Plant Utilization
Rate
WACKER SILICONES 96
WACKER POLYMERS 89
WACKER POLYSILICON 100
75
Combined Management Report – Further Information on R & D, Employees, Procurement, Production, Sales and Marketing
Wacker Chemie AG – Annual Report 2018

Capital expenditures for 2018 amounted to € 460.9 million (2017: € 326.8 million). Maintenance costs totaled around € 480 million.
Priorities of Productivity ProgramThe ongoing Wacker Operating System (WOS) program helps us boost productivity along the entire value chain. The most important goal is to continue reducing specific operating costs each year. In 2018, we worked on approx-imately 600 projects, some 400 of which concerned oper-ations. The projects focused on improving raw-material yields and specific energy consumption. The WOS ACADEMY held 12 courses to train some 100 employees in the use of productivity methods such as Six Sigma and LEAN.
Sales and Marketing
Demand was strong for WACKER’s chemical products in 2018. We saw some products sell out, chiefly in silicones.
WACKER’s chemical business is geared to three customer groups: key accounts, customers and distributors. WACKER currently has some 36 key accounts, through which we generated around 24 percent of our total chemical sales in 2018. More than 50 percent of sales stemmed from about 8,000 active relationships with other customers. Around 23 percent came from distributors, with 20 key distributors accounting for about 50 percent of all distributor sales.
Marketing communication is central to strengthening WACKER’s branding and product advertising, and to effectively supporting the sale of products. In 2018, we spent € 17.8 million (2017: € 17.0 million) on marketing communication.
Attendance at 103 Tradeshows WorldwideIn 2018, WACKER’s global tradeshow presence grew once again. In total, we exhibited at 103 tradeshows (2017: 91). We carry out qualitative and quantitative analyses on how successful our tradeshow communication has been. In 2018 alone, we subjected 40 tradeshows to such analyses.
B.47 Key Start-Ups
Location Projects Year
Adrian, Michigan, USA Discontinuous emulsion plant
2018
Burghausen
Production facility for non-postcuring liquid silicone rubbers
2018
León, Spain Cysteine plant 2018
Jincheon, South Korea
New production facility for RTV silicone compounds
2018
Nanjing, China Capacity extension for VAE dispersions
2018
B.48 Breakdown of Marketing Costs
%
42% PR work 31% Tradeshows 12% Other
11 % Product communication 4% Advertising
B.49 Tradeshows
Number
29 Europe27 North and
Central America25 Asia
7 Middle East 6 Russia 5 Africa 4 South America
103 in total
29
27
25
7
65 4
€ 17.8 million
42
31
4
12
11
76
Combined Management Report – Further Information on R & D, Employees, Procurement, Production, Sales and Marketing
Wacker Chemie AG – Annual Report 2018

Management Report of Wacker Chemie AG(Additional Information Pursuant to the German Commercial Code)
The management report of Wacker Chemie AG and the Group management report for 2018 are combined in accor-dance with Section 315 (5) in connection with Section 298 (2) of the German Commercial Code (HGB). The annual financial statements of Wacker Chemie AG (prepared in accordance with the German Commercial Code) and the combined management report are published simultaneously in the electronic version of Germany’s Federal Gazette.
The combined management report includes a separate section covering all reporting elements pertaining to Wacker Chemie AG that are required by law. Further to our report on the WACKER Group, we explain developments at Wacker Chemie AG.
Wacker Chemie AG is the parent company of the WACKER Group and is headquartered in Munich, Germany. The parent company operates through four business divisions – WACKER SILICONES, WACKER POLYMERS, WACKER BIOSOLUTIONS and WACKER POLYSILICON – which generate a substantial portion of the Group’s sales. Wacker Chemie AG’s directly and indi-rectly held subsidiaries and investments located in Germany and abroad have a strong influence on its business. It has a total of 54 subsidiaries, joint ventures and associated companies, and also provides the Group with corporate functions. Wacker Chemie AG’s Executive Board exercises key management functions for the Group as a whole, which include determining the Group’s strategy, allocating resources (such as funds for investment spending), and bearing responsibility for managing executive personnel and corporate finances. Wacker Chemie AG’s Executive Board also oversees communication with important stakeholders, especially the capital markets and shareholders.
The key performance indicators used in corporate manage-ment are implemented groupwide in the business divisions. Corporate goals are defined and reported for the divisions on a groupwide basis. Even though Wacker Chemie AG is an independent entity, no separate key performance indicators are defined or reported for it. For more information, please refer to the respective details provided for the WACKER Group as a whole. The general business conditions of Wacker Chemie AG are essentially the same as those of the Group.
The annual financial statements of Wacker Chemie AG were prepared in accordance with the German Commercial Code (HGB) and the German Stock Corporation Act (AktG). These statements differ substantially from the IFRS figures in relation to fixed assets, depreciation and amortization, provisions for pensions, and deferred taxes. As regards EBITDA, there are only slight differences between IFRS and HGB figures.
Wacker Chemie AG’s Earnings Pursuant to the German Commercial CodeWacker Chemie AG’s earnings were marked by a decline in the operating result. Although operating performance edged up year over year, the operating result decreased, mainly due to the higher cost of materials. The result from investments in subsidiaries, joint ventures and associates was affected by the write-up of shares in subsidiaries in China. Overall, net income decreased from € 358.0 million to € 203.3 million.
B.50 Statement of Income
€ million 2018 2017
Sales
Changes in inventories
Other capitalized self-constructed assets
Operating performance
Other operating income
Cost of materials
Personnel expenses
Depreciation and amortization
Other operating expenses
Operating result
Result from investments in subsidiaries, joint ventures and associates ( incl. impairment losses and reversals thereof )
Net interest result
Other financial result
Financial result
Income before taxes
Income taxes
Net income
EBITDA*
* EBITDA is the operating result before depreciation, amortization and write-ups of fixed assets.
3,871.3 3,859.7
72.4 42.4
29.1 25.7
3,972.8 3,927.8
123.8 135.8
-2,087.6 -1,958.9
-908.2 -901.7
-238.9 -269.2
-747.6 -714.5
114.3 219.3
243.1 291.4
-75.8 -36.9
-5.4 -2.0
161.9 252.5
276.2 471.8
-72.9 -113.8
203.3 358.0
353.2 488.5
77
Combined Management Report – Management Report of Wacker Chemie AG
Wacker Chemie AG – Annual Report 2018

Wacker Chemie AG’s sales rose by a slight 0.3 percent to € 3.87 billion (2017: € 3.86 billion). WACKER SILICONES grew its sales by 16 percent to € 1.88 billion (2017: € 1.62 billion). WACKER POLYMERS lifted its sales by nearly 4 percent to € 802.1 million (2017: € 775.1 million). Sales decreased at WACKER POLYSILICON, falling 27 percent to € 825.0 million (2017: € 1.13 billion). WACKER BIOSOLUTIONS increased its sales to € 153.0 million (2017: € 139.4 million), a rise of 10 percent.
In 2018, the cost of materials climbed to € 2.09 billion (2017: € 1.96 billion), mainly due to higher procurement prices and volumes for strategic raw materials. The upward price trend continued for ethylene, methanol and vinyl acetate mono-mer. Silicon metal was markedly more expensive in 2018 and energy costs were also higher. Production resumed at the Charleston site of our subsidiary Wacker Polysilicon North America L. L. C. Due to contract manufacturing, the cost of ramping up the site’s production plants weighed on Wacker Chemie AG’s earnings in 2018. The loss of production is insured. Future insurance compensation payments have not yet been factored into polysilicon procurement costs. Overall, the material-to-sales ratio increased to 52.5 percent (2017: 49.9 percent).
At € 908.2 million, personnel expenses were roughly on par with the previous year (€ 901.7 million). Wage increases due to collective-bargaining agreements will be almost offset by the lower variable compensation component due for payment in 2019. As of December 31, 2018, Wacker Chemie AG had 10,033 employees (Dec. 31, 2017: 9,740). At 22.9 per-cent, the labor-to-sales ratio was more or less unchanged (2017: 23.0 percent).
Depreciation and amortization decreased again, to € 238.9 mil-lion (2017: € 269.2 million). That was a decline of 11 percent.
The other operating result (other operating income less other operating expenses) fell € 45.1 million to € –623.8 million (2017: € –578.7 million). Under other operating income, expir-ing reimbursements of expenses were offset by utilizing part of a compensatory payment made by Siltronic AG in 2014 for the transfer of employees to Wacker Chemie AG. Other operating expenses include not only exchange-rate losses, but also selling expenses, maintenance, other contractor work, rents, servicing costs, R & D costs and costs assumed on behalf of subsidiaries. In particular, expenses for maintenance and IT services were higher in 2018. The foreign currency result improved by € 3.5 million to € –5.1 million (2017: € –8.6 million).
The operating result came in at € 114.3 million, down from the previous year’s figure of € 219.3 million.
The result from investments in subsidiaries, joint ventures and associates contained income from profit-and-loss transfer agreements and dividend payments. This income of € 66.6 million was higher than the year-earlier figure of € 43.3 million and, for the first time, included dividends from Siltronic AG. In 2018, the result from investments in subsidiaries, joint ventures and associates was influenced by impairment-loss reversals totaling € 176.7 million on the carrying amounts of Dow Siloxane (Zhangjiagang) Holding Co. Private Ltd., Singapore, Wacker Chemicals Fumed Silica (Zhangjiagang) Holding Co. Ltd., Singapore, and Wacker Chemicals (China) Co. Ltd., Shanghai, China. This was due to the improved market situation and a modified transfer-price policy between WACKER’s Chinese companies and the two joint ventures. In the previous year, income from the disposal of shares in affiliated companies had come to € 258.1 million, due to the sale of shares in Siltronic AG.
The net interest result declined further, to € –75.8 million (2017: € –36.9 million), mainly due to interest expenses of € 84.0 million for pension obligations (2017: € 63.9 million). In addition, a loan to the subsidiary Wacker Chemical Corp., Adrian, Michigan (USA), was repaid during the year, reducing interest income compared with the year before.
Income tax expenses amounted to € 72.9 million (2017: € 113.8 million). This item included not only the current taxes paid by Wacker Chemie AG, but also the tax expenses for those domestic subsidiaries with which it has profit-and-loss transfer agreements.
Net income came to € 203.3 million. Retained profit for 2018 – calculated as the profit carried forward from the previous year less € 223.6 million in dividends paid – totaled € 1.48 billion (2017: € 1.50 billion).
Net Assets and Financial Position of Wacker Chemie AG in Accordance with the German Commercial CodeWacker Chemie AG’s total assets were 5 percent higher year over year, amounting to € 5.34 billion (Dec. 31, 2017: € 5.07 billion). The individual balance-sheet items did not develop uniformly.
78
Combined Management Report – Management Report of Wacker Chemie AG
Wacker Chemie AG – Annual Report 2018
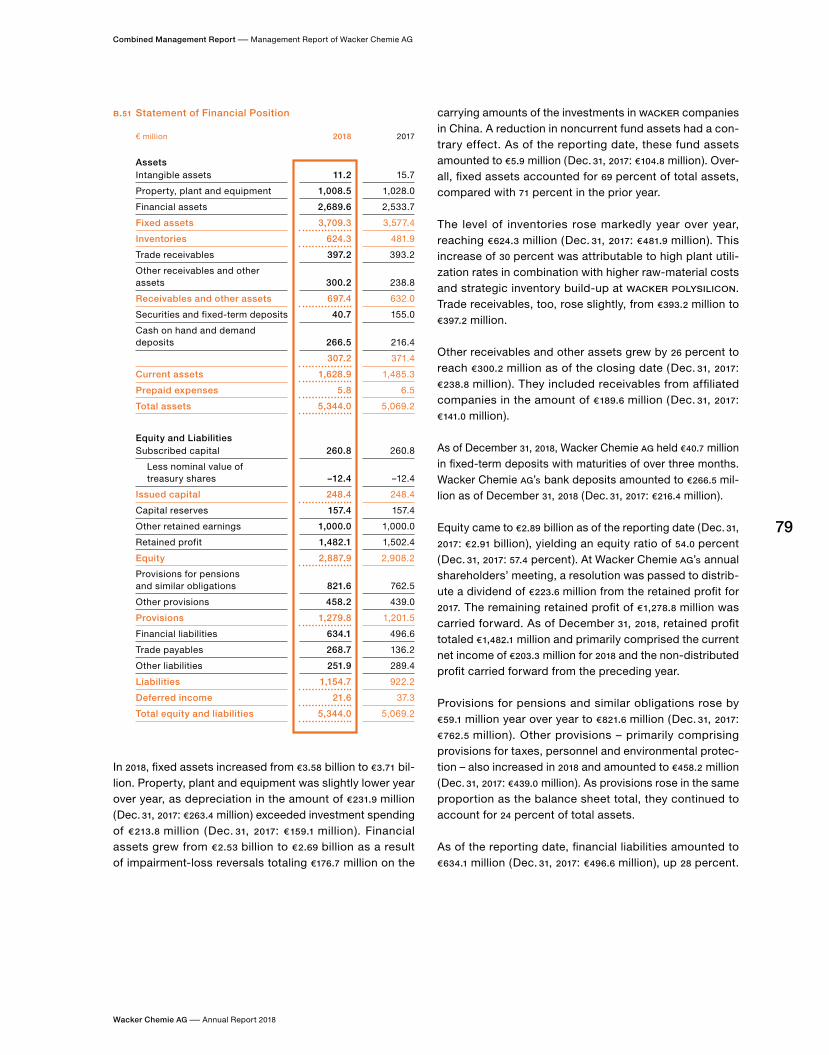
In 2018, fixed assets increased from € 3.58 billion to € 3.71 bil-lion. Property, plant and equipment was slightly lower year over year, as depreciation in the amount of € 231.9 million (Dec. 31, 2017: € 263.4 million) exceeded investment spending of € 213.8 million (Dec. 31, 2017: € 159.1 million). Financial assets grew from € 2.53 billion to € 2.69 billion as a result of impairment-loss reversals totaling €176.7 million on the
carrying amounts of the investments in WACKER companies in China. A reduction in noncurrent fund assets had a con-trary effect. As of the reporting date, these fund assets amounted to € 5.9 million (Dec. 31, 2017: € 104.8 million). Over-all, fixed assets accounted for 69 percent of total assets, compared with 71 percent in the prior year.
The level of inventories rose markedly year over year, reaching € 624.3 million (Dec. 31, 2017: € 481.9 million). This increase of 30 percent was attributable to high plant utili-zation rates in combination with higher raw-material costs and strategic inventory build-up at WACKER POLYSILICON. Trade receivables, too, rose slightly, from € 393.2 million to € 397.2 million.
Other receivables and other assets grew by 26 percent to reach € 300.2 million as of the closing date (Dec. 31, 2017: € 238.8 million). They included receivables from affiliated companies in the amount of € 189.6 million (Dec. 31, 2017: € 141.0 million).
As of December 31, 2018, Wacker Chemie AG held € 40.7 million in fixed-term deposits with maturities of over three months. Wacker Chemie AG’s bank deposits amounted to € 266.5 mil-lion as of December 31, 2018 (Dec. 31, 2017: € 216.4 million).
Equity came to € 2.89 billion as of the reporting date (Dec. 31, 2017: € 2.91 billion), yielding an equity ratio of 54.0 percent (Dec. 31, 2017: 57.4 percent). At Wacker Chemie AG’s annual shareholders’ meeting, a resolution was passed to distrib-ute a dividend of € 223.6 million from the retained profit for 2017. The remaining retained profit of € 1,278.8 million was carried forward. As of December 31, 2018, retained profit totaled € 1,482.1 million and primarily comprised the current net income of € 203.3 million for 2018 and the non-distributed profit carried forward from the preceding year.
Provisions for pensions and similar obligations rose by € 59.1 million year over year to € 821.6 million (Dec. 31, 2017: € 762.5 million). Other provisions – primarily comprising provisions for taxes, personnel and environmental protec-tion – also increased in 2018 and amounted to € 458.2 million (Dec. 31, 2017: € 439.0 million). As provisions rose in the same proportion as the balance sheet total, they continued to account for 24 percent of total assets.
As of the reporting date, financial liabilities amounted to € 634.1 million (Dec. 31, 2017: € 496.6 million), up 28 percent.
B.51 Statement of Financial Position
€ million 2018 2017
AssetsIntangible assets
Property, plant and equipment
Financial assets
Fixed assets
Inventories
Trade receivables
Other receivables and other assets
Receivables and other assets
Securities and fixed-term deposits
Cash on hand and demand deposits
Current assets
Prepaid expenses
Total assets
Equity and LiabilitiesSubscribed capital
Less nominal value of treasury shares
Issued capital
Capital reserves
Other retained earnings
Retained profit
Equity
Provisions for pensions and similar obligations
Other provisions
Provisions
Financial liabilities
Trade payables
Other liabilities
Liabilities
Deferred income
Total equity and liabilities
11.2 15.7
1,008.5 1,028.0
2,689.6 2,533.7
3,709.3 3,577.4
624.3 481.9
397.2 393.2
300.2 238.8
697.4 632.0
40.7 155.0
266.5 216.4
307.2 371.4
1,628.9 1,485.3
5.8 6.5
5,344.0 5,069.2
260.8 260.8
-12.4 -12.4
248.4 248.4
157.4 157.4
1,000.0 1,000.0
1,482.1 1,502.4
2,887.9 2,908.2
821.6 762.5
458.2 439.0
1,279.8 1,201.5
634.1 496.6
268.7 136.2
251.9 289.4
1,154.7 922.2
21.6 37.3
5,344.0 5,069.2
79
Combined Management Report – Management Report of Wacker Chemie AG
Wacker Chemie AG – Annual Report 2018

This increase was chiefly due to new bank loans raised, which amounted to € 583.9 million as of the reporting date (Dec. 31, 2017: € 298.0 million). Liabilities due to affiliated companies fell by € 150.6 million to € 46.6 million as of the reporting date (Dec. 31, 2017: € 197.2 million). The overall share of financial liabilities in total equity and liabilities increased to 12 percent (Dec. 31, 2017: 10 percent).
Trade payables increased by € 132.5 million year over year to € 268.7 million (Dec. 31, 2017: € 136.2 million). This rise was attributable to increased business volumes, higher invest-ment spending, and the inverse effects of prepayments made in 2017. As of the reporting date, other liabilities amounted to € 251.9 million (Dec. 31, 2017: € 289.4 million). This decrease was primarily due to the decline in advance payments received under polysilicon contracts, which fell by € 38.7 million to € 131.8 million in 2018 (Dec. 31, 2017: € 170.5 million).
Deferred income came to € 21.6 million as of the reporting date (Dec. 31, 2017: € 37.3 million) and mainly comprised a payment by Siltronic AG to Wacker Chemie AG for the transfer of employees. A portion of this item was reversed in 2018 when Siltronic AG ended its employee transfer program. The residual amount will be reversed over the remaining period of service of the transferred employees.
Cash flow from operating activities increased year over year, from € 106.1 million to € 129.8 million.
The cash outflow for investing activities came to € 662.7 mil-lion. The majority of this figure went toward enhancing the equity base of US subsidiary Wacker Polysilicon North America L. L. C., which in turn used the funds to pay down a long-term loan from Wacker Chemie AG. Funds were also used (via an intermediate holding) to increase the capital base of the subsidiaries Wacker Chemicals Norway AS, Holla, and Wacker Chemicals Korea Inc., Seoul, for the purpose of expanding production capacity at the two sites. The reduction in fund assets (WMM Universal-Fonds) and in fixed-term deposits had a contrary effect. In the prior year, Wacker Chemie AG had generated a cash inflow of € 42.6 million from its investing activities, the main compo-nent of which was € 438.2 million from the sale of shares in Siltronic AG.
As a result of these factors, net cash flow – defined as the sum of cash flow from operating activities excluding the change in advance payments received and cash flow from long-term investing activities (before fixed-term depos-its) – fell substantially in the year under review, coming in at € –729.0 million (2017: € 375.2 million).
Cash flow from financing activities, on the other hand, was clearly positive at € 582.9 million (2017: € –17.9 million). The main change in 2018 was the repayment of an intra-Group loan by the subsidiary Wacker Polysilicon North America L. L. C. On balance, bank loans of € 285.9 million were also raised in 2018, following the repayment of € 241.9 million in bank liabilities a year earlier. The dividend paid in 2018 led to a cash outflow of € –223.6 million.
Liquidity – defined as the sum of securities in current assets and in the fund WMM Universal-Fonds as well as cash on hand and demand deposits – decreased significantly, from € 476.2 million to € 313.1 million as of December 31, 2018. The balance of liquidity and liabilities to financial institutions was thus € –270.8 million (2017: net financial receivables of € 178.2 million).
Risks and Opportunities Wacker Chemie AG’s business performance is subject to essentially the same risks and opportunities as the WACKER Group. Wacker Chemie AG’s exposure to the risks associated with its subsidiaries and investments depends on the size of its stakes in the respective entities. The measurement of joint ventures and associates is affected in particular by the risks specified in the Risk Management Report. Through our subsidiaries and holdings, we could face impairments arising from legal or contractual con-tingencies (especially financing). These contingencies are explained in the Notes to the financial statements of Wacker Chemie AG. As the parent company of the WACKER Group, Wacker Chemie AG is integrated in the groupwide risk management system.
For further details, see the Financial Instruments section of this Annual
Report. A description of the internal control system for Wacker Chemie AG,
as mandated by Section 289 (5 ) of the German Commercial Code (HGB), can
be found in the section on the Internal Control System ( ICS) and the Internal
Control System for Accounting.
80
Combined Management Report – Management Report of Wacker Chemie AG
Wacker Chemie AG – Annual Report 2018

OutlookWACKER’s main planning assumptions relate to raw-material costs, energy costs, personnel expenses and exchange rates. For 2019, we anticipate a euro exchange rate of US$1.20. The expectations for Wacker Chemie AG’s business performance in the coming year are essentially the same as those for the WACKER Group, which are explained in full in the Group’s Outlook section.
We assume that sales will rise slightly year over year, and we expect Wacker Chemie AG to post a profit for the period below the level of last year.
PublicationThe annual financial statements of Wacker Chemie AG have been submitted to the publisher of the German Federal Gazette and can be viewed on the website of the German register of companies. KPMG AG Wirtschaftsprüfungs-gesellschaft, Munich, audited the annual financial state-ments and issued an unqualified audit certificate for them. The statement of financial position and statement of income are the main parts of the annual financial statements pub-lished in this Annual Report. Wacker Chemie AG’s annual financial statements are published together with those of the WACKER Group. The annual financial statements can be requested from Wacker Chemie AG, Hanns-Seidel-Platz 4, 81737 Munich, Germany. They can also be accessed on the internet at:
www.wacker.com
level of overall risk, the Executive Board decides which risks we should take to utilize opportunities available to the company. The goal of risk management at WACKER is to identify risks as early as possible, to evaluate them adequately and to take appropriate steps to reduce them. We define risks as internal and external events that may have a negative effect on the attainment of our targets and forecasts. Compared with the previous year, we made no fundamental changes to the existing risk management system in 2018. The scope of consolidation for risk reporting purposes comprises all WACKER majority shareholdings.
As a chemical company, we have a particular respon-sibility to ensure plant safety and protect human health and the environment. At all our production sites, there are employees who are responsible for plant and workplace safety and for health and environmental protection. Our risk management system complies with legal requirements and is integral to all our decisions and business processes. The Executive and Supervisory Boards are regularly informed about the current risk status in the Group and at each business division.
WACKER follows the “Three Lines of Defense” model to effectively manage corporate risks and ensure compliance with legal provisions and the ethical principles of corporate management.
See Figure B.52 on page 82
The first line of defense is centered on operational manage-ment, which involves coordinating, monitoring and manag-ing the risks that arise. It also includes the establishment of functioning internal control systems within the individual operational units.
The second line of defense is formed by risk and compliance management. Risk management systematically tracks the main risks facing operational units and reports on the risks to the Executive Board. Compliance management ensures that the ethical principles of corporate management are observed. It identifies the relevant legal requirements and amendments, forwards them to all affected corporate units and holds courses on compliance for employees. The tax compliance management system ensures that Wacker Chemie AG and its subsidiaries comply fully and punctually with their obligations under tax law. Early involvement of the tax department and checks on preliminary tax-related processes help minimize the corresponding risks.
A third line of defense is provided by the Corporate Auditing department, which acts as an independent monitoring body
Risk Management ReportDescription and Statement Relating to Risk and Compliance Management
Integrated Approach to Risk and Compliance Management
Risk and compliance management are an integral part of corporate management at WACKER. As a global company, we are exposed to numerous risks directly attributable to our operational activities. Starting from an acceptable
81
Wacker Chemie AG – Annual Report 2018
Combined Management Report – Management Report of Wacker Chemie AG– Risk Management Report

for the Executive Board. This department conducts audits at regular intervals to review the risk management activ-ities in place at the various corporate units and to check whether the internal control systems run by the operational units are effective. Corporate Auditing also liaises with the Compliance Management team, for example if anti-cor-ruption investigations are undertaken or related measures implemented.
Risk ManagementWACKER focuses on identifying, evaluating, managing and monitoring risks as part of a transparent risk management and control system for all company processes. The system is based on a defined risk strategy and an efficient report-ing procedure. It involves the Executive Board regularly reviewing and enhancing our risk strategy, particularly with regard to our groupwide processes for strategic planning and reporting. The Executive Board provides the Super-visory Board’s Audit Committee with regular briefings on existing risks.
All corporate areas are integrated into the risk management system. It consists of three intermeshed aspects:
– Division-specific risk management and early-warning systems
– Groupwide risk coverage– Groupwide risk mapping
The CFO has overall responsibility for the effectiveness and appropriateness of the risk management systems.
Risk Management Structures and ToolsThis groupwide system draws on existing organizational and reporting structures, supplemented by additional elements:
– The risk management manual: contains the system’s principles and processes. It explains reportable levels of risks and how risks are to be covered and mapped.
– The risk management regulation: stipulates groupwide reporting requirements, such as when a specific com-mittee must be informed.
– The risk management coordinator: oversees the risk management system and is supported by local risk coordinators.
– The risk list: contains specific risks that our business divisions and other corporate sectors face. Reporting is mandatory for individual risks where the effect on earnings would exceed € 5 million.
B.52 “Three Lines of Defense” Model
Supervisory Board
Executive Board
First line of defense Third line of defense
Internal control systems
Operational management
Direct coordination and monitoring
Risk management Risk monitoring
Second line of defense
Risk management
Compliance management
Policy on identifying specific risks
Training courses
Corporate Auditing
Audits
Number of risks
Aud
itors
82
Combined Management Report – Risk Management Report
Wacker Chemie AG – Annual Report 2018

Risk IdentificationWACKER identifies risks at two levels: for the individual divisions and at the Group level. We employ various instruments to detect and recognize risk. These include order-intake trends, market and competition analyses, customer talks, and ongoing observation and analysis of the economic environment.
Assessment, Quantification and Management of RisksWe analyze each identified risk’s probability of occurrence and potential effect on earnings. Corporate Controlling compiles a monthly report to inform the Executive Board of current and expected business developments and their associated risks. We evaluate risks and opportunities at regular meetings with our divisions and weigh them up against each other.
Corporate Controlling’s task is to ensure that our risk management standards are implemented and our risk management process enhanced. It not only records all substantial risks groupwide, but also evaluates them systematically on the basis of uniform criteria. Major risks and those endangering the continued existence of the company are communicated immediately via ad-hoc reports. Because the divisions are responsible for their own results, this process is closely interwoven with oper-ational controlling. Individual divisional risks are identified and evaluated on a monthly basis. Operational risk man-agement is thus firmly entrenched in the divisions. At the same time, Corporate Finance and Insurance, Corporate Accounting & Tax, Technical Procurement & Logistics,
Corporate Engineering, and Legal are involved in risk controlling at the Group level.
Financial risks are managed by Corporate Finance and Insurance. It is responsible for all measures relating to exchange-rate and interest-rate hedging transactions, and to securing adequate Group liquidity. The operational framework is set out in detailed specifications and regula-tions covering, for example, the separation of trading and settlement functions. Corporate Accounting & Tax monitors receivables management with respect to customers.
Internal Control System ( ICS) and Internal Control System for AccountingOur internal control system ( ICS) is an integral component of our risk management system.
The internal control system for accounting is aimed at ensuring consistent compliance with legal requirements, generally accepted accounting principles and International Financial Reporting Standards ( IFRSs), thus avoiding mis-statements in Group accounting and external reporting.
In addition to the ICS principles already mentioned, we perform assessments and analyses to help identify and minimize any risks that may directly influence financial reporting. We continually monitor changes in accounting standards and provide the employees handling them with regular and comprehensive training. We enlist external experts to reduce the risk of accounting misstatements in complex and challenging issues, such as pensions.
B.53 Risk Management System
Supervisory and Executive Boards
Risk identification: all business divisions and corporate departments
Risk management basis
Risk monitoring: internal control
system, Corporate Controlling
Risk coverage: Corporate
Finance and Insurance
Control of the risk management
process: Corporate Auditing
Risk list Risk management
manual
Risk management
regulation
83
Combined Management Report – Risk Management Report
Wacker Chemie AG – Annual Report 2018

Our internal accounting control system is designed to ensure that our accountants process every business transaction promptly, uniformly and correctly, and that reliable data on the Group’s earnings, net assets and financial position is available at all times. Our approach here complies with statutory provisions, accounting standards and internal accounting rules. A key accounting regulation is the accounting manual, which is applicable groupwide and available on the WACKER intranet. The man-ual specifies binding rules for groupwide accounting and assessment. The Group regulation on accounting contains uniform stipulations for the organizational responsibility of accounting- related topics. The organizational workflow is also defined in accounting and organizational regulations, and in book-entry instructions. A groupwide calendar of deadlines guarantees the complete and timely processing of financial statements. Corporate Accounting monitors compliance with reporting obligations and deadlines. By separating financial functions between accounting, state-ment analysis and strategy, we ensure that potential errors are identified prior to finalization of the statements and that accounting standards are complied with.
Our subsidiaries ensure that all regulations are imple-mented in their local regions. Corporate Accounting assists them in this task and monitors the process. In addition, country-specific accounting standards exist that must be complied with. The reported data is verified both by automatic system validation, and by reports and analyses. Data is checked for plausibility and then consolidated. We safeguard the effectiveness of controls not only by
gathering feedback from the employees involved, but also by continually monitoring key financial indicators in our monthly management reports and in system-based test runs. Moreover, regular external audits are carried out, as well as external reviews at year-end and for each quarter.
Each quarter, managers at our divisions, corporate depart-ments and subsidiaries confirm for their areas that all key issues for the quarterly and annual financial statements have been reported.
The Supervisory Board is also integrated into the internal control system through its Audit Committee. In particular, the Audit Committee monitors the accounting process, the effectiveness of the internal-control and risk- management systems, and the auditing procedures. Further, the Committee reviews the documents for Wacker Chemie AG’s separate financial statements and the WACKER Group’s annual and quarterly financial statements as well as the combined management report for these statements, and discusses them with the Executive Board and the auditors.
We protect all financial systems from misuse with user- authorization systems, data-release policies and access restrictions. Information Technology, a corporate department, carries out regular system backups and maintenance to minimize both the risk of data loss and of a breakdown of accounting-related IT systems. However, even with adequate and functioning systems in place, we cannot guarantee that the internal control system will be 100-percent effective.
B.54 Basis of Our Internal Control System ( ICS)
Regulations and work instructions
Systematically structured control measures within
business processes
Separation of functions
Complying with legislation and
WACKER regulations
Assuring the functionality and efficiency of
business processes
Preventing financial losses 1
Dual-control policy Job rotation
1 Possible financial losses due to the intentional or inadvertent misconduct of our employees or third parties
84
Combined Management Report – Risk Management Report
Wacker Chemie AG – Annual Report 2018
Compliance ManagementWACKER’s ethical principles of corporate management exceed the statutory requirements. The Compliance Management department is responsible for ensuring that these principles and all related legislation are observed throughout the company. Training courses on compliance raise employees’ awareness of the relevant risks and con-vey binding rules of behavior for daily work routines. These aspects are covered by WACKER’s compliance regulation. Employees are instructed to inform their supervisors, the compliance officers, the employee council or their designated HR contacts of any violations they notice. They also have the option of reporting suspected violations anonymously via a protected channel.
The Group’s compliance officers are responsible for imple-menting these rules and regulations, and are on hand to advise employees on all matters relating to compliance. The WACKER Group has 21 compliance officers around the world: in Germany, the USA, China, Japan, India, South Korea, Brazil, Mexico, Singapore, Russia, Norway and the United Arab Emirates. Compliance issues arising in countries not listed here are handled in Germany by the Chief Compliance Officer with assistance from the Legal department.
Prevention is a key aspect of the work of compliance officers. They train, inform and advise employees and management on, for example, strategies and measures to prevent corruption and other breaches of the law. In 2018, a focus of classroom-training sessions was on India, Lebanon, Saudi Arabia and the United Arab Emirates. In addition to our own staff, we trained some of our local distributors’ employees. In 2018, no major infringements of compliance were identified that involved an effect on earnings of more than € 5 million.
Internal AuditingThe third line of defense is provided by WACKER’s Corporate Auditing department, which acts as an independent monitoring body for the Executive Board. This department shares responsibility for effective internal control systems throughout the various operational processes and systems. When setting up an internal control system, the operational units must apply certain principles, such as a policy of dual control. These principles are defined in an internationally applicable regulation, where they are explained in more detail for critical functions.
On behalf of the Executive Board, Corporate Auditing performs regular – mainly process-specific – reviews of all relevant functions and corporate units, placing its focus on internal control systems. Audit topics are selected using a risk-driven approach. This takes account of risk man-agement reporting, as well as the reports and information provided by the corporate departments, business divisions and major joint ventures/associates. The auditing schedule is supplemented and approved by the Executive Board, and discussed with the Audit Committee. If necessary, the schedule is adjusted flexibly during the year to accommo-date any changes in underlying conditions.
In 2018, Corporate Auditing conducted audits at a number of subsidiaries and sites worldwide, examining the suitability, appropriateness and cost-effectiveness of key business processes, and the functionality of internal control systems. Another focus was on information technology, where audits were performed in the areas of IT security, IT infrastructure and license usage. Moreover, selected processes were audited in areas such as logistics, engineering, human resources and accounting.
Nothing came to our attention in the year under review that would endanger the proper functioning of the internal control systems or have an effect on earnings subject to the previously mentioned reporting threshold of more than € 5 million.
Any process-optimization measures derived from the audits are implemented and systematically monitored by the Corporate Auditing department. It provides the Executive Board and Audit Committee with regular reports on the results and implementation status of the various measures.
External ControlsWhen auditing our annual financial statements, the external auditors examine our early-warning system for detecting risks. The auditors then report to the Executive and Super-visory Boards.
In 2018, an external audit examined, among other things, whether our internal auditing system complied with Stan-dard 983 of the Institute of Public Auditors in Germany ( Institut der Wirtschaftsprüfer). The audit determined that Wacker Chemie AG’s Corporate Auditing department fulfills the International Professional Practices Framework ( IPPF) requirements.
85
Combined Management Report – Risk Management Report
Wacker Chemie AG – Annual Report 2018

Evaluation and Risk Assessment: Economists project that the world economy will continue to expand in 2019. The pace of growth, though, slowed noticeably during 2018. At the same time, the risks to the global economy clearly intensified, say the experts. That is mainly because of the trade tensions between the USA, on the one hand, and China and the European Union on the other. Further risks to the economy could result from too rapid a normalization of monetary policy by major central banks and from the impact of Brexit.
In our chemical business, we supply many customers from a wide range of industries across the globe. This enables us, as we have shown, to at least partially compensate for temporary weaknesses in individual industries and geographical regions.
The development of our polysilicon business will depend on the regulatory conditions surrounding solar-power use and international trade in photovoltaic systems and solar silicon. Economic trends are another factor influencing the underlying conditions.
Central Risk Areas
Defining the Probability and Impact of Risk OccurrenceWe have defined categories to describe the probability that risks we identify will occur. This provides a framework for understanding our assessment of individual areas of risk. In percentage terms, our categories define the range of probability as follows:
– Unlikely: under 25 percent– Possible: 25 – 75 percent– Likely: over 75 percent
We also use categories to describe how the occurrence of the risks listed might impact the Group’s earnings, net assets or financial position. We assess the possible effect on earnings using the net method, i.e. after taking appro-priate countermeasures, such as establishing provisions or hedging. The following categories define the ranges:
– Low: up to € 25 million– Medium: up to € 100 million– High: over € 100 million
The table shows our estimation of the probability of risks and of how the occurrence of those risks might impact the Group’s earnings, net assets or financial position. The statements refer to the forecast period, thus to fiscal 2019.
Overall Economic RisksScenario: Economic slowdown.
Impact on WACKER: Production-capacity utilization drops, specific manufacturing costs rise, and the Group’s sales and earnings decline.
Measures: We counter this risk by continuously monitoring economic trends in our key sales markets. Should the economy start slowing, we take early precautions to quickly adjust production capacities, resources and inventories to customer demand. In such a case, we concentrate capacity utilization on production locations with the best cost position, for example, and temporarily shut down some production facilities.
B.55 Probability and Possible Impact of Our Risks in 2019
Risk / Category Probability Possible Impact
Overall economic risks Possible Medium
Sales-market risksChemicals Possible Medium
Polysilicon Possible High
Procurement-market risks Possible Medium
Investment risks Unlikely Medium
Production and environmental risks Unlikely Medium
Financial risksCredit risk Unlikely Low
Currency-exchange and interest-rate risks Possible Medium
Liquidity risk Unlikely Low
Pensions Possible Medium
Legal risks Unlikely Low
Regulatory risksEnergy transition in Germany Possible Medium
Polysilicon trade restrictions Possible High
New regulations for production processes and products Likely Low
IT risks Unlikely Medium
Personnel-related risks Unlikely Low
External risks Unlikely Low
86
Combined Management Report – Risk Management Report
Wacker Chemie AG – Annual Report 2018
We presently see no specific signs that economic activity will diverge substantially from the forecasts of experts. Given the heightened risks, though, we consider it possible that, in 2019, the world economy could fall short of current projections. Should global economic activity prove weaker than currently anticipated, this would have a medium impact on WACKER’s earnings. The ramifications of Brexit would not have any direct material effects on WACKER’s earnings. There may be indirect effects, however, via Brexit’s impact on trade and the economy.
Sales-Market RisksScenario 1: Overcapacity at our chemical divisions.
Impact on WACKER: Price and volume pressures on our products.
Measures: We minimize this risk by aligning production with demand and by securing plant-utilization rates through quantity controls, structured price management, process optimization and the intense cultivation of growth markets. A key ongoing goal is to increase the share of cyclically resilient product groups in our portfolio and to rank among the global leaders in all our business fields. By cooperating closely with customers, we aim to quickly open the way to novel applications, thus fostering long-term customer loyalty.
Evaluation and Risk Assessment: We anticipate that the risk of overcapacity will basically remain unchanged for our products in 2019. At WACKER POLYMERS, we see over-capacity for dispersions and dispersible polymer powders in Asia. But we expect plant utilization to be high despite this overcapacity. In silicones, 2018 saw a strong rise in demand, which was not fully covered by silicone producers’ existing capacities. At the same time, customers began building up inventories beyond their actual needs. WACKER SILICONES expects the supply-and-demand situation to return to normal in the course of 2019. On balance, we do not anticipate overcapacity or lower plant utilization at WACKER SILICONES during the forecast period. As for our polymer products, we see opportunities to achieve higher prices in 2019. WACKER SILICONES expects price levels for 2019 to be uneven across individual product groups and geographical regions.
Generally, we consider it possible that individual areas of our chemical business will face overcapacity and resultant price pressure. We have already factored this possibility into our planning and forecasts. Any effects that go beyond this would have a medium impact on Group earnings.
Scenario 2: Overcapacity and price risks at our polysilicon business; difficult market conditions due to a rollback of government incentive programs; the tight financial situation of many customers, and the expiry of long-term supply contracts.
Impact on WACKER: Volume risks arise if excessive and hurried cuts to government solar incentives or limitations on new PV capacity negatively impact the photovoltaic market. The expiry of long-term contracts and new com-petitor capacities increase the capacity-utilization risk, while overcapacity may pressure margins via intense price competition. Both factors could lower sales and earnings.
Measures: We counter this risk by continuously improving our cost positions and by optimizing our product and customer portfolio in line with market developments. We counter customers’ liquidity problems by demanding collateral.
Evaluation and Risk Assessment: In all probability, the consolidation process in the solar industry will continue in 2019. As long as this trend persists and global production capacities exceed market demand, polysilicon prices are likely to remain volatile and under pressure. Such a trend has been factored into our planning and forecasts. Should solar-silicon demand clearly exceed supply, this would presumably lift earnings at WACKER POLYSILICON. Conversely, weakening demand for WACKER’s solar silicon would probably have a high impact on earnings in this business. In our view, the risk of prices falling is possible.
Procurement-Market RisksScenario: Higher raw-material and energy prices, bottle-necks in the supply of certain raw materials, and risks of tariffs.
Impact on WACKER: Earnings dampened by higher raw-ma-terial and energy prices. Any supply bottlenecks could lead to longer customer delivery times and volume losses.
87
Combined Management Report – Risk Management Report
Wacker Chemie AG – Annual Report 2018

Measures: We prepare systematic procurement plans for strategic raw materials and energy on an annual basis and, if necessary, ad hoc. Such plans include evaluations of the procurement risk. The latter also takes in risks stemming from trade barriers (such as mounting trade conflicts) or from the United Kingdom’s withdrawal from the European Union. Whenever possible, we take appropriate measures to counter any procurement risks that are classed as rel-evant. Such measures include not only long-term supply contracts with partners and a structured procurement policy involving multiple suppliers under contracts with differing maturities, but also the expansion of our supplier base and an increased level of safety stocks. In select cases, we have achieved partial backward integration and produce strategic raw materials ourselves. Our silicon-metal production site in Holla (Norway) and our captive vinyl acetate production facilities in Burghausen, for example, are reducing our dependence on external suppliers.
Evaluation and Risk Assessment: WACKER’s good position in energy and raw-material procurement enables us to effectively manage risks during economic upturns and downturns. If the world economy weakened markedly, our purchasing terms for buying key raw materials would allow us to adjust contractual volumes flexibly and – wherever possible – to benefit from price decreases through appro-priate pricing models. Should global growth become unex-pectedly strong, our volume guarantees are so extensive that we do not see any major risks to raw-material security. Prices can rise markedly in such situations. But experience has shown that we then have chances to compensate, at least partially, for additional costs by increasing the selling prices of our own products. Higher crude oil prices also increase the prices of raw materials derived from oil, as well as energy costs. Additionally, purchasing prices for certain raw materials might be impacted by punitive tariffs. Such import tariffs exist, for example, for silicon metal exported from China to Europe and the USA.
WACKER requires a number of highly specialized raw materi-als that only a few suppliers can provide. If these suppliers were unable to deliver, our production might be restricted. We minimize this risk by taking appropriate measures (e. g. backup suppliers, safety stocks, and contingency lists of substitute products).
Under current German law, energy-intensive companies are partially exempt from paying various surcharges and
additional costs. WACKER also benefits from these rules. Any restriction on the exemption rules would significantly reduce the competitiveness of specific business activities. In general, energy price trends (wholesale prices, infra-structure costs and ancillary costs) will remain heavily dependent on how German and European policymakers organize the energy transition.
On balance, we anticipate slightly lower raw-material costs for 2019 given the decline in economic momentum. These cost savings, though, are likely to be partially offset by higher electricity costs due to supply shortages following power-plant closures, and by high coal prices and more expensive natural gas. Such a scenario has been factored into our planning. From experience, we consider it possible that our raw-material suppliers could suffer production outages. The impact of such a bottleneck on our key raw materials and of higher-than-expected electricity costs would probably have a medium impact on the Group’s earnings.
Investment RisksScenario: Bad investments, higher-than-expected invest-ment costs, postponed plant start-ups, deterioration of original market projections, and assumption of risks from investments in joint ventures and associates.
Impact on WACKER: Bad investments cause costs for idle capacity and impair assets and equity investments. The possible effect on earnings could be substantial. Higher investment costs mean higher cash outflows and, in the future, higher depreciation expenses in our operating result. Postponed start-ups expose us to the risk of being unable to fulfill supply contracts and consequently posting lower sales and earnings. Should Siltronic AG’s market capitalization fall substantially, this could necessitate a corresponding impairment of the carrying amount of our equity-accounted investment, negatively impacting WACKER’s earnings.
Measures: WACKER has numerous measures in place for countering investment risks. We check the completeness and plausibility of plans for new projects with an investment sum of more than € 3 million. The Group’s corporate depart-ments participate in such checks. Economic feasibility is assessed using comparative studies that look at other plant projects, including those of competitors. Capital expendi-tures are approved in stages only. Stringent project-budget management helps prevent or minimize delays.
88
Combined Management Report – Risk Management Report
Wacker Chemie AG – Annual Report 2018
Evaluation and Risk Assessment: Our capital expendi-tures in 2019 will be lower than last year. The focus will be on expanding our production capacities in the chemical divisions, especially for silicones. We currently consider it unlikely that investment spending will exceed our expec-tations. Even if this risk did materialize, the impact on our earnings, net assets and financial position would probably be low. Similarly, we currently consider the risk of a contin-ued negative trend in Siltronic AG’s market capitalization to be unlikely. Were this risk to materialize, it would probably have a medium impact on our earnings, net assets and financial position.
Production and Environmental RisksScenario: Risks relating to the production, storage, filling and transport of raw materials, products and waste.
Impact on WACKER: Potential personal injury, property damage and environmental impairment; production down-times and operational interruptions; and the obligation to pay damages.
Measures: WACKER coordinates its operational processes through its integrated management system ( IMS). The system regulates workflows and responsibilities, attaching equal importance to productivity, quality, the environment, and health and safety. Our IMS is based on statutory regula-tions, and on national and international standards, such as Responsible Care® and the Global Compact, which go far beyond legally prescribed standards. We focus on securing the highest possible level of operational safety at our pro-duction sites by monitoring maintenance extensively and by performing regular plant inspections. We conduct thorough safety and risk analyses, from the design stage through to commissioning, to ensure the safety of our plants. We regularly hold seminars on plant and workplace safety and explosion protection. Every WACKER site has an emergency response plan in place to regulate cooperation between internal and external emergency response teams, and with the authorities. We are insured against loss events at our plants and the potential consequences of such events. Our insurance cover is in line with customary chemical-industry standards. When we work with logistics providers, we ensure that hazardous-goods transport vehicles are always checked prior to loading. Any faults are systematically recorded and tracked.
Evaluation and Risk Assessment: Experience has shown that risks stemming from the production, storage, filling and transport of raw materials, products and waste can never be completely ruled out. Although there is a general possibility
such risks will occur, we currently consider a serious loss event to be unlikely. Should such an event occur, it could have a medium impact on WACKER’s earnings.
Financial RisksWACKER is exposed to financial risks from ongoing oper-ations and financing. These include credit, market-price, financing and liquidity risks. They are managed by the individual WACKER departments responsible for them. We employ primary and derivative financial instruments to cover and control the financial requirements of our operations and the associated risks. Such financial instruments are not permitted, however, unless they are based on actual or planned operational activities. The Notes to the Consol-idated Financial Statements provide extensive information about risk hedging using derivative financial instruments.
Credit RiskScenario: Customers or business partners fail to meet their payment obligations.
Impact on WACKER: Losses on trade receivables, and failure of banks to fulfill their obligations to WACKER ( loan disbursements, repayment of deposits and compensatory payments arising from derivatives transactions).
Measures: We use a variety of instruments to reduce the risk of any loss on receivables. Depending on the nature of the product or service provided and the amount involved, we may demand collateral, including retention of title. Other preventive measures range from references and credit checks to the evaluation of historical data from our business relationship to date (particularly payment behav-ior). We limit default risks by means of credit insurance, advance payments and bank guarantees. We prevent counterparty risk with respect to banks and contractual partners by carefully selecting these partners. We transact cash investments and derivative dealings with banks that usually have a minimum rating of A– from Standard & Poor’s
B.56 Controlling Financial Risks
Risk Corporate Department Responsible
Credit risks
Corporate Finance and Insurance, Corporate Accounting and Tax
Currency-exchange and interest-rate risks
Corporate Finance and Insurance
Liquidity risk Corporate Finance and Insurance 89
Combined Management Report – Risk Management Report
Wacker Chemie AG – Annual Report 2018

or a comparable rating agency. Investment activities are additionally subject to maximum investment and term lim-its. In exceptional cases, investments or derivative dealings may be conducted with banks of lower creditworthiness within specified limits and terms.
Evaluation and Risk Assessment: We consider it unlikely that credit risks stemming from customer business will materialize. Thanks to our approach to counterparty risk, we consider our risk concentration with regard to bank failures to be low. If credit risks stemming from customer business or from a bank failure did unexpectedly occur, their impact on WACKER’s earnings would probably be low.
Currency-Exchange and Interest-Rate RisksScenario: Fluctuations in exchange rates and interest rates.
Impact on WACKER: Effect on earnings, liquidity, and financial assets and liabilities.
Measures: Currency risks essentially arise from exchange-rate fluctuations for receivables, liabilities, cash and cash equivalents, and financial liabilities not held in euros. The currency risk is of particular importance with respect to the US dollar and Chinese renminbi. WACKER hedges any net exposure above a certain level using derivative financial instruments. The use of such instruments is governed by WACKER’s foreign exchange management directive. We work with forward-exchange contracts, foreign-exchange swaps and currency-option contracts. Foreign exchange hedging is carried out mainly for the US dollar. We also counter exchange-rate risks through our non-eurozone production sites.
Interest-rate risks arise due to changes in market rates. Since such changes affect future interest payments for variable-rate loans and investments, they have a direct influence on the Group’s liquidity and financial assets. Once an exposure has been identified, interest-rate hedging is performed. The use of derivative financial instruments is governed by internal regulations that separate trading and settlement functions, and is subject to strict controls throughout the entire transaction process. We continually monitor the effectiveness of any measures taken.
Evaluation and Risk Assessment: We hedge part of our US dollar business. Possible gains or losses from exchange-rate fluctuations are partially cushioned by hedging measures. From today’s perspective, we consider
it possible that exchange-rate and interest-rate changes in 2019 will differ substantially from our planning assumptions. We believe that this would have a medium impact on Group earnings.
Liquidity RiskScenario: Lack of funds for payments, and tougher access to credit markets.
Impact on WACKER: Higher financing costs, and modifica-tions to further investment projects.
Measures: Liquidity risk is managed centrally at WACKER. Our Corporate Finance and Insurance department employs efficient systems for both cash management and rolling liquidity planning. In order to counter financing risks, WACKER holds adequate long-term, contractually agreed lines of credit, and has set aside sufficient liquidity. We invest liquid funds only in issuers or banks that have a credit rating within the sound investment-grade range. The investment of liquid funds is, moreover, subject to self-defined limits. By means of cash pooling, liquid funds are passed on internally within the Group as required.
Evaluation and Risk Assessment: WACKER’s liquidity totaled € 387.5 million as of the reporting date. At the same time, there were unused lines of credit with terms of over one year totaling € 600 million. We consider the occurrence of financing and liquidity risks to be unlikely. At the moment, we see no risks relating to financial-covenant infringements. If financial or liquidity bottlenecks did occur, their impact on Group earnings would be low. If unused lines of credit were tapped, net financial debt would rise.
PensionsScenario: Higher life expectancy of those entitled to a pen-sion; pay and pension adjustments; falling discount factors; significant changes in the composition of the invested fund assets and capital-market interest rates (environment of low interest rates).
Impact on WACKER: A rise in pension obligations, a decline in fund assets, and a possible injection of financial resources into the pension fund or into the plan assets will affect the financial position and earnings of the Group. In addition to the pension plan, defined-benefit pension plans exist in the form of direct commitments. Employees also have the option of converting part of their remuneration into direct benefit commitments. The greater life expectancy of pen-
90
Combined Management Report – Risk Management Report
Wacker Chemie AG – Annual Report 2018
sion-fund beneficiaries, adjustments to pay and pensions, and the discount factor (used to calculate the net present value of a final capital amount) also impact WACKER’s equity and earnings to a substantial degree.
Measures: A large portion of WACKER’s pension guarantees are covered by the Wacker Chemie VVaG pension fund, by pension-related funds and special-purpose assets, and by insurance plans. To ensure a sufficient rate of return and to limit investment risks, the fund diversifies its investment portfolio among various asset classes and regions. In man-aging its assets and liabilities, the pension fund controls and optimizes all asset items to attain the required return within specified risk limits. As one of the fund’s sponsoring entities, WACKER makes payments to it (when necessary), thereby ensuring sufficient coverage for pension obliga-tions. We periodically adjust the calculation parameters of the other defined-benefit pension commitments (e.g. life expectancy).
Evaluation and Risk Assessment: The life expectancy of pension-fund beneficiaries continues to rise, and capi-tal-market interest rates have declined to extremely low levels in recent years. The rate of return will probably be insufficient to fulfill pension obligations in the long term. Our contribution rate remained unchanged in the reporting year. We consider it possible that, in the future, we will have to continue making special payments into the Wacker Chemie VVaG pension fund and into fund assets, as we did in 2017, and that pension expenses and payments will also rise. This would have a medium impact on WACKER’s earnings, net assets and financial position.
See further details starting on page 146 of the Notes section.
Legal RisksScenario: Diverse legal risks related to tax, trademarks, patents, competition, antitrust proceedings, the environ-ment, labor and contracts could arise from our international business.
Impact on WACKER: Drawn-out legal disputes, which could impact our company’s operations, image and reputation, and which could be costly.
Measures: We limit legal risks through centralized contract management and reviews by our Legal department. Where necessary, we also seek legal advice from highly qualified external specialists.
Our Intellectual Property department protects and mon-itors patents, trademarks and licenses. Before initiating R & D projects, we conduct searches to determine whether existing third-party patents and intellectual property rights could prevent us from marketing any newly developed products, technologies or processes.
We use compliance programs to limit risks arising from possible legal infringements. WACKER’s Code of Conduct defines and stipulates binding rules of behavior for all employees. Through training programs, WACKER enhances awareness of these issues and attempts to prevent repu-tation-related risks.
Evaluation and Risk Assessment: Due to the varied nature of our business activities in all major regions across the globe, it is always conceivable that legal risks could arise. We currently do not foresee any legal disputes, patent infringements or other legal risks that could significantly influence our business, and consider the probability of such risks materializing to be fundamentally unlikely. Should such an individual case occur, we would expect its impact on WACKER’s earnings to be low.
Regulatory RisksEnergy Transition in GermanyScenario: The transition in Germany to 80 percent renew-able energy in the electricity sector by 2050 (known as the “Energiewende” or energy transition) creates a regulatory environment that will probably be marked by repeated legislative amendments (the German Renewable Energy Act, including relief for energy-intensive companies and self-generated electricity; grid-charge regulations; EU laws on state aid; EU Energy-Efficiency Directive; the emissions trading system; integrated energy).
Impact on WACKER: Additional energy costs due to rising electricity prices and federal levies, as well as higher grid-usage fees if the German government departs from its current policy of exempting energy-intensive industry from paying such levies and ancillary costs in full or in part.
Measures: We continually monitor regulatory activity in Germany and in the EU. Whenever we anticipate changes in the current legal situation, we try to introduce our view-point into legislative procedures through discussions with policymakers and by participating in trade associations. In addition, we search for, and take advantage of, market opportunities arising from regulatory changes (e.g. indus-trial demand-response management).
91
Combined Management Report – Risk Management Report
Wacker Chemie AG – Annual Report 2018

Evaluation and Risk Assessment: Changes regarding the exemption from grid fees and the calculation inputs for ancillary network costs already led to a lower level of relief from grid fees in 2018 than in previous years. We consider it possible that 2019 will see higher electricity prices and further amendments to legal provisions on energy supply (e. g. grid-usage fees). Such amendments would probably have a medium impact on WACKER’s earnings this year, but that impact could increase substantially over the coming years.
Polysilicon Trade RestrictionsScenario: The Chinese Ministry of Commerce (MOFCOM) concluded its anti-dumping proceedings against polysil-icon imports from the USA. On January 20, 2019, MOFCOM began an expiry review of the existing anti-dumping and anti-subsidy tariffs on US-made polysilicon. The review could take up to one year to complete. During that period, the Chinese tariffs on US-made polysilicon will remain in place. The trade disputes between the USA and China escalated significantly during 2018. In Europe, the European Commission allowed the restrictions on Chinese solar cells and modules to expire in September 2018. In turn, MOFCOM ended its restrictions on polysilicon manufactured in Europe. This means that WACKER’s European-made polysilicon can once again be imported into China without restrictions.
Impact on WACKER: Negative impact of anti-dumping and anti-subsidy tariffs on earnings, net assets and financial position; influence on sales volumes; impact on long-term customer relations.
Measures: Despite the escalating trade conflict between the USA and China, we are holding numerous discussions with policymakers in the two countries to mitigate or eliminate punitive solar-sector tariffs (US tariffs on Chinese solar modules and cells, and Chinese tariffs on polysil-icon from the USA) and, thus, to reduce or end Chinese anti-dumping and anti-subsidy tariffs on WACKER’s US-made polysilicon. In addition, we have the option under Chinese anti-dumping law to apply to have the tariffs reviewed individually and, if necessary, have separate tariffs set. This is because WACKER did not, in fact, import any polysilicon from the USA into China during the investigation period of the anti-dumping proceedings. We will apply for such a
New Shipper Review in due course. In addition, we will qualify the polysilicon produced at our Charleston site with our customers in the semiconductor industry.
Evaluation and Risk Assessment: As the Chinese tariffs on European-made polysilicon expired on October 31, 2018, WACKER can once again sell this material to China without restrictions of any kind. At least until MOFCOM’s above- mentioned expiry review has been completed, WACKER will not be able to export its Charleston-made polysilicon from the USA to China at competitive terms. Given the escalating trade disputes worldwide, we consider it possible that WACKER’s polysilicon business could be affected by further trade barriers and punitive tariffs. The potential impact on our 2019 earnings would then probably be high.
New Regulations for Production Processes and ProductsScenario: Due to new legislation, the production and use of chemical substances is regulated more strictly. New regulations make it necessary to modify our production processes or reformulate our products. They also impose more extensive information requirements on us and, in some cases, on our customers as well.
Impact on WACKER: Additional investments in production facilities, conversion costs, and revenue losses in individual application fields.
Measures: WACKER continually monitors the regulatory environment surrounding its products and production processes so that it can react promptly to impending changes. We are continuously optimizing our production processes. Any other necessary measures will be aligned with the regulatory changes in each specific situation.
Evaluation and Risk Assessment: It is always possible that new legal provisions necessitate modifications to our product portfolio or production processes. We consider it likely that new legal provisions will require additional investment in our production facilities or changes to our product portfolio. Should such changes occur, their short-term impact on WACKER’s earnings would probably be low. In the medium term, though, they could have a medium-to-high impact.
92
Combined Management Report – Risk Management Report
Wacker Chemie AG – Annual Report 2018
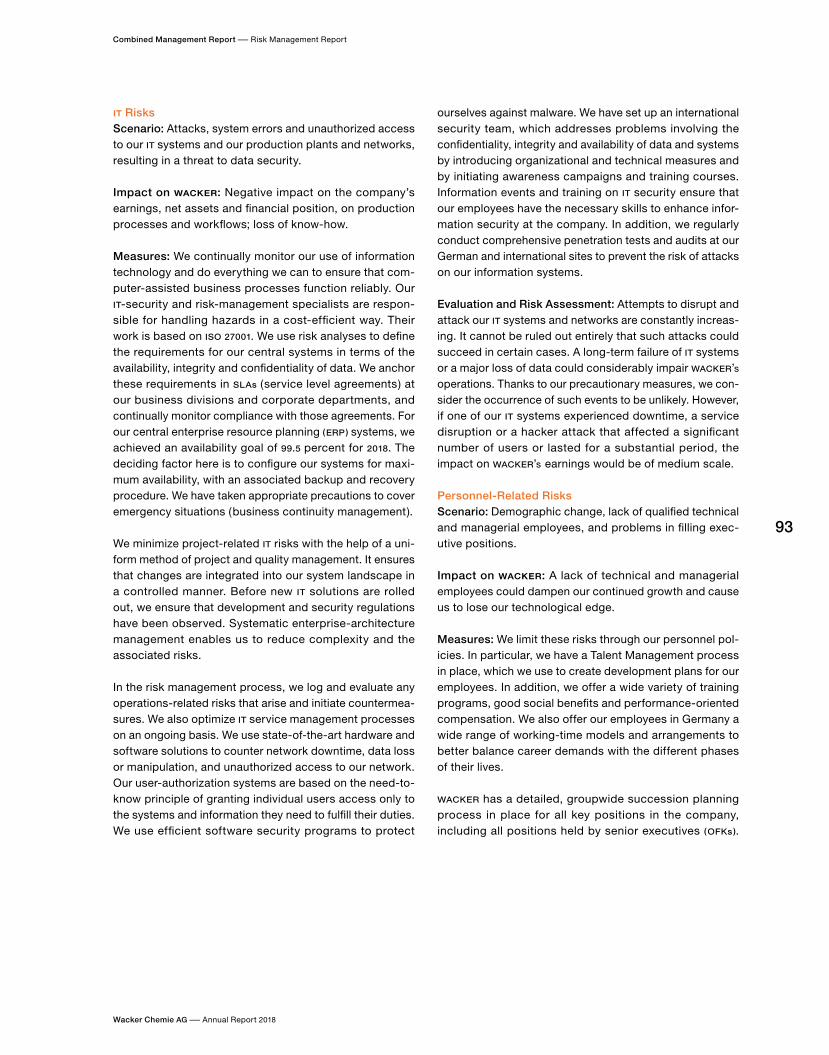
IT RisksScenario: Attacks, system errors and unauthorized access to our IT systems and our production plants and networks, resulting in a threat to data security.
Impact on WACKER: Negative impact on the company’s earnings, net assets and financial position, on production processes and workflows; loss of know-how.
Measures: We continually monitor our use of information technology and do everything we can to ensure that com-puter-assisted business processes function reliably. Our IT-security and risk-management specialists are respon-sible for handling hazards in a cost-efficient way. Their work is based on ISO 27001. We use risk analyses to define the requirements for our central systems in terms of the availability, integrity and confidentiality of data. We anchor these requirements in SLAs (service level agreements) at our business divisions and corporate departments, and continually monitor compliance with those agreements. For our central enterprise resource planning (ERP) systems, we achieved an availability goal of 99.5 percent for 2018. The deciding factor here is to configure our systems for maxi-mum availability, with an associated backup and recovery procedure. We have taken appropriate precautions to cover emergency situations (business continuity management).
We minimize project-related IT risks with the help of a uni-form method of project and quality management. It ensures that changes are integrated into our system landscape in a controlled manner. Before new IT solutions are rolled out, we ensure that development and security regulations have been observed. Systematic enterprise-architecture management enables us to reduce complexity and the associated risks.
In the risk management process, we log and evaluate any operations-related risks that arise and initiate countermea-sures. We also optimize IT service management processes on an ongoing basis. We use state-of-the-art hardware and software solutions to counter network downtime, data loss or manipulation, and unauthorized access to our network. Our user-authorization systems are based on the need-to-know principle of granting individual users access only to the systems and information they need to fulfill their duties. We use efficient software security programs to protect
ourselves against malware. We have set up an international security team, which addresses problems involving the confidentiality, integrity and availability of data and systems by introducing organizational and technical measures and by initiating awareness campaigns and training courses. Information events and training on IT security ensure that our employees have the necessary skills to enhance infor-mation security at the company. In addition, we regularly conduct comprehensive penetration tests and audits at our German and international sites to prevent the risk of attacks on our information systems.
Evaluation and Risk Assessment: Attempts to disrupt and attack our IT systems and networks are constantly increas-ing. It cannot be ruled out entirely that such attacks could succeed in certain cases. A long-term failure of IT systems or a major loss of data could considerably impair WACKER’s operations. Thanks to our precautionary measures, we con-sider the occurrence of such events to be unlikely. However, if one of our IT systems experienced downtime, a service disruption or a hacker attack that affected a significant number of users or lasted for a substantial period, the impact on WACKER’s earnings would be of medium scale.
Personnel-Related RisksScenario: Demographic change, lack of qualified technical and managerial employees, and problems in filling exec-utive positions.
Impact on WACKER: A lack of technical and managerial employees could dampen our continued growth and cause us to lose our technological edge.
Measures: We limit these risks through our personnel pol-icies. In particular, we have a Talent Management process in place, which we use to create development plans for our employees. In addition, we offer a wide variety of training programs, good social benefits and performance-oriented compensation. We also offer our employees in Germany a wide range of working-time models and arrangements to better balance career demands with the different phases of their lives.
WACKER has a detailed, groupwide succession planning process in place for all key positions in the company, including all positions held by senior executives (OFKs ).
93
Combined Management Report – Risk Management Report
Wacker Chemie AG – Annual Report 2018

Opportunities Report
Opportunity Management SystemWACKER’s opportunity management system remained unchanged from the previous year. It is both a divisional and Group-level instrument. We identify operational opportunities and leverage them in our business divisions, which possess the detailed product and market expertise required. We continuously use market observation and analysis tools to obtain a well-structured evaluation of market, industry and competitor data, for instance. In addition, we conduct customer interviews to evaluate future opportunities. The monitoring process – how WACKER seizes opportunities – is based on key indicators (such as rolling forecasts and current-status reporting).
Strategic opportunities of overriding importance – such as strategy adjustments, potential acquisitions, collaborations and partnerships – are handled at the Executive Board level. Such opportunities are incorporated into WACKER’s annual strategy-development and planning process, with current issues being discussed at regular Executive Board meetings. We generally elaborate different scenarios and risk-opportunity profiles before making decisions on such issues.
WACKER has identified a whole range of opportunities for advancing the Group’s success over the next few years.
and our internationally distributed production sites and sales offices help to limit the impact of local or regional damage on our business processes. As a result, we esti-mate that, even if such events occurred, the impact on WACKER’s earnings would be low.
For every upper management position, we observe and develop up to three candidates to assess their potential and performance. In its succession planning, WACKER distinguishes between short-term needs (up to two years) and medium-term needs (two to four years). In addition, WACKER has appointed deputies for senior executives (OFKs) in the event of a lengthy absence or illness.
Evaluation and Risk Assessment: Demographic change will increase the risk of not being able to find sufficiently qualified personnel for technical and managerial positions in the medium to long term. We consider it unlikely that risks to our personnel needs will arise in 2019. Should these risks materialize, the impact on Group earnings would probably be low.
External RisksScenario: Pandemic, natural disaster, war or civil war.
Impact on WACKER: Impairment of our company’s capacity to act, production downtimes, loss of trade receivables, impact on sales and earnings.
Measures: WACKER is a global operation with production facilities and technical centers in Europe, the Americas and Asia, and some 50 sales offices worldwide. Possible pandemics, natural disasters and acts of war in any of the countries or regions where we operate represent a potential risk to our business and production operations, product sales and noncurrent assets and, therefore, to our earnings, net assets and financial position. Our managerial entities and our sites have elaborated and published plans and measures to minimize the effects of a pandemic on the health of our employees and on our business processes. A pandemic-preparedness plan ensures a standardized, coordinated approach. The financial impact of damage to our production plants due to natural disasters is partly covered by insurance. Since WACKER has production sites on various continents, we can ensure manufacturing and delivery capability to some degree even if individual plants should fail.
Evaluation and Risk Assessment: Risks from pandemics, natural disasters, and acts of war or civil war can never be ruled out entirely. In our view, it is unlikely that WACKER would be affected by risks from pandemics, natural disas-ters, and acts of war or civil war. Our preparedness plan
B.57 Opportunity Management System
Opportunity Management System
Seizing operational opportunities through
our divisions
Seizing strategic opportunities at the
Group level
94
Combined Management Report – Risk Management Report
Wacker Chemie AG – Annual Report 2018

Overall Economic OpportunitiesIn addition to the growth projected for the world economy in 2019, WACKER sees good opportunities to again outpace global chemical production, especially in emerging markets and sales regions. The strongest momentum, in our view, will continue to come from China, India and Southeast Asia. We are continuously expanding our presence in these markets to seize the opportunities there. Our technical competence centers and the WACKER ACADEMY are pivotal in achieving WACKER’s high standard of service and customer proximity.
Sector-Specific OpportunitiesSector-specific opportunities primarily result from our broad product portfolio. It puts us in an excellent position to meet global megatrends. Examples are the advance of urbanization, the trend toward conserving natural resources and energy, the world’s increasing need for mobility, and the growing demand for products that enhance the quality of life. These trends remain as important as ever to our business.
Rising affluence in emerging-market economies, particu-larly in Asia, coupled with ever more stringent market and customer requirements, is fueling demand for products
incorporating high-value silicones. To benefit from this development, WACKER is continuing to lift the percentage of high-value specialty silicones in its portfolio versus standard products. Areas of special focus range from the automotive and cosmetics sectors, to personal care, health, medicine, electronics and clothing. We intend to satisfy this growth with innovative products and technologies in wound care, cosmetics, textile care, plastics processing, electronics and 3D printing.
We see good growth prospects for WACKER SILICONES in the electrical and electronics market, especially in automotive electronics. Growth is being spurred by digitalization, connectivity and electromobility. Electronic automotive assistance systems, for example, are becoming increasingly important and are indispensable for autonomous driving. Current studies predict that the number of largely auton-omous vehicles among new registrations will reach some 76 million by 2035. Silicone gels and silicone encapsulants are what protects the sensors and electronic components needed in such vehicles. During the next few years, electro-mobility is likely to gain further momentum. By 2025, the number of electric cars sold annually is expected to rise from 3 million to 25 million. Electric vehicles also require high-performance batteries. That is why we have devel-oped new, thermally conductive silicones. They enable effective thermal management to ensure long-lasting, maintenance-free batteries.
At WACKER POLYMERS, growth potential is fueled by rising affluence in emerging economies, by increasing urbaniza-tion, and by the trend toward conserving natural resources and reducing carbon dioxide emissions. The shift away from conventional building materials and construction methods to value-added systems will continue. A key aspect here is the use of dispersible polymer powders for modifying cement. Through the addition of these polymer powders, mortar mixtures are easier to process, can be applied more thinly and their properties can be substan-tially improved. So far, though, some 80 percent of dry-mix mortars used in the building sector are not modified. In many regions, construction experts have only just started to appreciate the benefits of polymer-modified dry-mix mortars. WACKER POLYMERS also sees further potential in environmentally friendly, water-based paints and coatings, and in its material-substitution business.
B.58 Overview of Business Opportunities
Overall economic opportunitiesGrowth in Asia and other emerging markets
Sector-specific opportunitiesExtensive product portfolio for future global trends
Urbanization, resource and energy efficiency, mobility and rising affluence
Strategic opportunitiesCost-effective expansion of capacities for downstream products
Positive cash flows via capital expenditures below depreciation
Extension of existing, and establishment of new, technical competence centers in the regions
Performance-related opportunitiesHigher plant productivity
95
Combined Management Report – Risk Management Report
Wacker Chemie AG – Annual Report 2018

At WACKER BIOSOLUTIONS, the main growth opportunities are anticipated from bioengineered products. A special focus will be on the production of pharmaceutical proteins. Our capacities in that field grew strongly with the division’s April 2018 acquisition of the Amsterdam site. At the same time, the new site’s expertise in live microbial products is a valuable addition to our technology portfolio. In cyclodex-trins, we are developing new applications (e. g. for egg-free baked goods and low-fat desserts). We also expect to see growth in cysteine and other fermentation-generated food products, such as vegetarian-grade meat flavors. Our large-scale fermentation plant in León, Spain, which started production in August 2018, will enable us to meet this rising demand over the long term.
Energy remains a key megatrend, with the photovoltaic industry at the forefront. The competitiveness of solar power relative to other energy sources continues to spur demand for photovoltaic systems. Across the globe, the use of renewable energy is increasing. China, India and the USA are where we still anticipate most new capacity to be added. We also see further growth potential in the increas-ing global trend toward highly efficient monocrystalline solar cells. WACKER POLYSILICON, a producer of hyperpure polysilicon and a cost and quality leader, will benefit from these developments.
Strategic OpportunitiesOur expansion of upstream-product capacity in recent years has given WACKER opportunities for further growth at its business divisions. Now, our focus – until at least 2020 – is on satisfying our customers’ growing demand, mainly by expanding existing plants cost-effectively, and on strengthening our capacity for downstream products. The capital expenditure for these projects will be below the level of depreciation. A project priority is to expand our silicone production. At Burghausen (Germany), Adrian (USA) and Zhangjiagang (China), we are adding production capacity for liquid silicone rubber, for high- and room-tem-perature-vulcanizing silicone, and for thermally conductive silicone compounds. At our Charleston site in the USA, we are building a pyrogenic silica plant, which is scheduled to come on stream this year. We are additionally looking into building a plant for high-temperature-vulcanizing silicone rubber there. The aim of these measures is to meet the high demand for silicones in key sectors such as the automotive, electronics and medical-technology industries. Currently, we are building new facilities for dispersions and dispers-ible polymer powders at Ulsan (South Korea), mainly to supply the construction sector.
Performance-Related OpportunitiesWACKER has a number of opportunities for improving its cost structures, processes and productivity. At WACKER POLYSILICON, we are continuing to implement our program to cut production costs. In our chemical divisions, we are tapping further cost-cutting potential with our productivity and efficiency program – the Wacker Operating System. Our various cost-cutting levers include the specific costs for auxiliaries, productivity advances on the manufacturing side, and broadening our choice of suppliers to secure more attractive purchasing terms.
Increasing digitalization opens up a multitude of possi-bilities to serve our customers more efficiently, to further reduce our production costs and to enhance the productiv-ity of our manufacturing process. For example, we use data flows from our production facilities to carry out predictive maintenance. Since early 2019, we have been using a new software system to manage our customer relationships. It will make our sales employees more flexible, intercon-nected and location-independent. We started our WACKER Digital program in 2017 to systematically promote and firmly entrench the digital transformation across the entire company. The program brings together new and ongoing digitalization projects, creating the basis for new ways of using digital technology.
Executive Board Evaluation of Overall Risk
The Executive Board evaluates the overall risk situation on the basis of information from the risk management system. The system compiles all risks identified by our divisions, corporate departments and regional entities. It is regularly reviewed by the Executive Board and discussed in Audit Committee meetings.
As of the publication date of this report, the Executive Board does not see any individual or aggregate risk that could seriously endanger WACKER’s future. The political developments described above have heightened overall economic risks compared with last year and the risks in our sales and procurement markets are also somewhat higher. We thus believe the overall risk level will also be slightly higher than in 2018. But, thanks to our extensive product portfolio and sound regional footing, we see good opportunities for expanding our leading market positions and achieving further growth. We remain confident that WACKER is strategically and financially so well placed that we can take advantage of any opportunities that arise.
96
Combined Management Report – Risk Management Report
Wacker Chemie AG – Annual Report 2018

Outlook
Underlying Economic Conditions
Economists project that the world economy will continue to expand in 2019, though it is navigating rough seas. They predict that the upturn will continue, but at a reduced pace. The main risks stem from global trade tensions, especially between the world’s two largest economies – the USA and China. Higher bilateral tariffs could slow trade and investment further. Additional pressure comes from geopolitical crises and political uncertainties such as the outcome of Brexit. Tighter monetary policies by the major central banks also have the potential to inhibit growth going forward. In addition, a number of emerging and developing countries are contending with rising financing difficulties as borrowing becomes more expensive.
The OECD estimates that global GDP growth has peaked – and will slow from 3.7 percent in 2018 to 3.5 percent in both 2019 and 2020. According to the IMF, the main drivers of growth are emerging markets at 4.5 percent. But momen-tum there, say the Fund’s analysts, will also slow in the
coming years. In advanced economies, economic output is expected to rise by 2.0 percent in 2019. The economy in the USA is forecast to grow by 2.5 percent (2018: 2.9 percent). For China, the Asian Development Bank projects growth of 6.3 percent in the coming year – after 6.6 percent in 2018. India’s growth, on the other hand, is expected to climb further.
Given the latest economic projections, our 2019 scenario is for the world economy to continue to expand. For 2020, we anticipate similar growth.
Sector-Specific Conditions
We expect economic trends in the sectors relevant to our business to be largely positive in 2019.
Chemical Industry Expected to Post Slight Gains in 2019After a good year in 2018, the German Chemical Industry Association ( VCI ) anticipates moderate growth for 2019. According to the VCI, chemical production will climb by 1.5 percent. The VCI forecasts that total sales will rise 2.5 percent. In addition to the weaker economy in Germany and diminished economic growth worldwide, the industry is confronted with political challenges such as the USA’s trade conflicts with the EU and China.
WACKER’s chemical divisions see major growth oppor-tunities in BRICS countries and other emerging markets. Rising affluence in emerging economies will continue to lift WACKER’s sales in countries such as China and India, as well as across Southeast Asia. WACKER’s portfolio has many value-added products that are in demand among new customer groups.
Construction Industry to Remain on Growth TrajectoryAccording to research institute B + L Marktdaten GmbH, the construction industry will continue expanding over the next few years. On average, construction volume is expected to rise by about 1.9 percent annually until 2021, with Asia as the main growth driver. B+L estimates that construction in Europe and South America is also on track for further growth, albeit at a slower pace than in Asia. North America’s construction market, on the other hand, is contracting slightly.
B.59 GDP Trends in 2019
%
Europe 1.8
Asia 5.8
China 6.3
India 7.6
Japan 1.0
USA 2.5
Sources – worldwide: IMF; Asia: ADB; China: ADB; India: ADB; Japan: OECD; USA: IMF; Europe: OECD
Worldwide 3.50
97
Combined Management Report – Outlook
Wacker Chemie AG – Annual Report 2018

In the coming years, renovation, energy-efficiency and sustainability projects will continue to offer WACKER good growth opportunities. At WACKER POLYMERS, we expect to grow our construction sales in every region during 2019. The main growth drivers, in our view, will be low-emission interior paints and dry-mix mortars. At WACKER SILICONES, we intend to carry on increasing the percentage of val-ue-added specialty products in a multitude of segments. Growth prospects are good for hybrid polymers (used to formulate high-performance adhesives and sealants) and for silicone sealants sold under our own brand.
Electrical and Electronics Sector Anticipates Moderate Growth in 2019The electrical and electronics industry expects global market volumes to expand by 4 percent in 2019. According to the German Electrical and Electronic Manufacturers’ Association ( ZVEI ), most expansion will be spurred by emerging economies and Asia, with slight gains anticipated in Europe and the Americas.
WACKER sees good growth prospects in silicone gels and silicone encapsulants for electronic components and in customized silicones for automotive applications, such as driver-assistance systems, sensors and optical displays.
Market Remains Challenging, But Installed PV Capacity Likely to Continue Growing in 2019Economic conditions for photovoltaics (PV ) will again be dynamic and challenging in 2019. On the one hand, intense competition is creating market uncertainty.
On the other, levelized costs for solar power continue to drop, strengthening the competitiveness of PV relative to other energy sources. In addition, solar energy has a key role to play in achieving global climate-protection targets,
B.61 Photovoltaic-Market Trend in 2019
Installation of New PV Capacity (MW)
2019 2018
Lower Range Upper Range
Germany 3,500 4,500 3,100
France 1,400 1,700 1,000
Rest of Europe 8,000 11,000 7,500
USA 11,000 14,000 11,100
Japan 6,000 7,000 7,000
China 40,000 45,000 43,000
India 11,000 12,000 9,500
Other regions 29,100 34,800 22,800
Total 110,000 130,000 105,000
Sources: PV market in 2019: Solar Energy Industries Association (SEIA), RTS Corporation, Bridge to India, market studies, WACKER’s own market research; PV market in 2018: Germany’s Federal Network Agency, Commissariat Général au Développement Durable, IHS, SEIA, RTS Corporation, China National Energy Agency, Ministry of New and Renewable Energy, Bridge to India, market studies, WACKER’s own market research
B.62 WACKER’s Key Customer Sectors
Sectors Trend in 2018 Trend in 2019
Chemicals Growth Growth
Construction Growth Growth
Energy and electrical Growth Growth
Photovoltaics Growth Growth amid intense competition
B.60 Construction-Industry Growth Rates by Region, 2019 to 2021
%
Asia 3.7
Eastern Europe 2.4
Middle East and Africa 1.5
South America 2.0
Western Europe 0.3
North America
Source: B + L Marktdaten GmbH, December 2018
0 Worldwide 1.9
–0.3
98
Combined Management Report – Outlook
Wacker Chemie AG – Annual Report 2018

The WACKER Group’s Prospects
According to our projected scenario, we expect the world economy to grow in 2019. Most momentum will come from emerging markets in Asia, with stable growth in Europe and the USA.
Investments and ProductionAs in the previous year, our capital expenditures in 2019 will focus on production plants for intermediates and downstream products. WACKER’s priority is to grow its business organically. We continue to see good organ-ic-growth potential for applications and in markets. Capital expenditures of around € 400 million in 2019 will be below the prior-year level and remain well below depreciation. Most investment spending will be for WACKER SILICONES. Just over 50 percent of capital expenditure is aimed at securing the continued growth of our operating activities, with the remainder dedicated to optimization and modernization projects.
At WACKER SILICONES, we are constructing a new pyro-genic-silica plant in Charleston, Tennessee (USA). Other projects include facilities to manufacture liquid silicone rub-ber in Burghausen (Germany) and Zhangjiagang (China). We are also building a new silicon-metal facility in Holla (Norway). At WACKER POLYMERS, we are expanding VAE dispersion plants in Nanjing (China) and investing in a new dispersion plant and spray dryer in Ulsan (South Korea).
In 2019, we will conclude several investment projects and bring the facilities on stream.
Maintenance costs will amount to about € 435 million in 2019.
Future Products and ServicesWACKER SILICONES is relying on a diverse range of appli-cations for the construction, electronics, automotive and personal care industries. The construction sector offers new prospects for the use of silane-modified hybrid polymers, which hold promise of high growth rates. This technology can be used to manufacture innovative sealants and adhesives as well as wear-resistant protective coatings for concrete floors. Marketing of a new silane oligomer for water-repellent fiber-cement panels has got off to a good start. Demand for specialty silanes for microelectronics is growing. Thermally conductive silicone elastomers are becoming an indispensable material for electromobility. Their cooling properties make specialty silicones an important thermal-management component for state-of-the-art battery cells.
WACKER POLYMERS is intensifying its activities in polymeric binders for sophisticated coating and construction applica-tions. A significant trend here is growing customer demand for sustainable, environmentally compatible solutions. The division is actively seizing these market opportunities by developing appropriate product lines. For example, WACKER POLYMERS has become the world’s first manufacturer capa-ble of using renewable resources to produce commercial quantities of dispersions based on vinyl acetate- ethylene copolymer.
since it significantly reduces specific carbon-dioxide emis-sions compared with fossil energy sources. New markets are opening up to PV due to its cost effectiveness and to political efforts to keep global warming below 2 ° C. The PV market is expected to deliver further growth. China will remain the world’s largest and most important market in 2019. Other markets likely to add large amounts of capacity include India, the USA, Europe and Japan. Regions with strong growth potential include Central and South America, Southeast Asia, the Middle East and Africa. Based on our own market surveys and those of third parties, WACKER expects newly installed PV capacity to range from 110 to 130 gigawatts (GW) in 2019.
B.63 Facility Start-Ups in 2019
Location Projects Year
Holla, Norway Production facility for silicon metal
2019
Ulsan, South Korea Dispersion reactor and spray dryer
2019
Charleston, USA Production facility for pyrogenic silica
2019
Nünchritz, Germany Capacity extension for production of siloxane
2019
Burghausen, Germany
Capacity extension for production of liquid silicone rubber
2019
99
Combined Management Report – Outlook
Wacker Chemie AG – Annual Report 2018
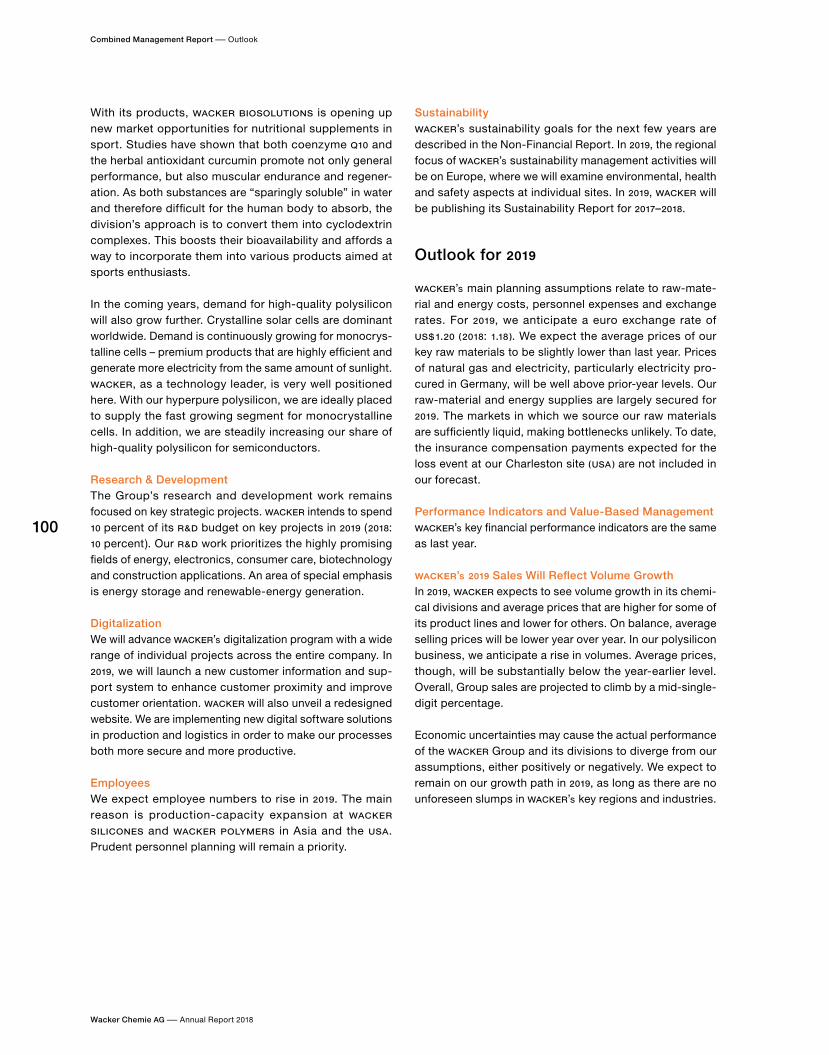
Outlook for 2019
WACKER’s main planning assumptions relate to raw-mate-rial and energy costs, personnel expenses and exchange rates. For 2019, we anticipate a euro exchange rate of US$ 1.20 (2018: 1.18). We expect the average prices of our key raw materials to be slightly lower than last year. Prices of natural gas and electricity, particularly electricity pro-cured in Germany, will be well above prior-year levels. Our raw-material and energy supplies are largely secured for 2019. The markets in which we source our raw materials are sufficiently liquid, making bottlenecks unlikely. To date, the insurance compensation payments expected for the loss event at our Charleston site (USA) are not included in our forecast.
Performance Indicators and Value-Based ManagementWACKER’s key financial performance indicators are the same as last year.
WACKER’s 2019 Sales Will Reflect Volume GrowthIn 2019, WACKER expects to see volume growth in its chemi-cal divisions and average prices that are higher for some of its product lines and lower for others. On balance, average selling prices will be lower year over year. In our polysilicon business, we anticipate a rise in volumes. Average prices, though, will be substantially below the year-earlier level. Overall, Group sales are projected to climb by a mid-single-digit percentage.
Economic uncertainties may cause the actual performance of the WACKER Group and its divisions to diverge from our assumptions, either positively or negatively. We expect to remain on our growth path in 2019, as long as there are no unforeseen slumps in WACKER’s key regions and industries.
With its products, WACKER BIOSOLUTIONS is opening up new market opportunities for nutritional supplements in sport. Studies have shown that both coenzyme Q10 and the herbal antioxidant curcumin promote not only general performance, but also muscular endurance and regener-ation. As both substances are “sparingly soluble” in water and therefore difficult for the human body to absorb, the division’s approach is to convert them into cyclodextrin complexes. This boosts their bioavailability and affords a way to incorporate them into various products aimed at sports enthusiasts.
In the coming years, demand for high-quality polysilicon will also grow further. Crystalline solar cells are dominant worldwide. Demand is continuously growing for monocrys-talline cells – premium products that are highly efficient and generate more electricity from the same amount of sunlight. WACKER, as a technology leader, is very well positioned here. With our hyperpure polysilicon, we are ideally placed to supply the fast growing segment for monocrystalline cells. In addition, we are steadily increasing our share of high-quality polysilicon for semiconductors.
Research & DevelopmentThe Group’s research and development work remains focused on key strategic projects. WACKER intends to spend 10 percent of its R & D budget on key projects in 2019 (2018: 10 percent). Our R & D work prioritizes the highly promising fields of energy, electronics, consumer care, biotechnology and construction applications. An area of special emphasis is energy storage and renewable-energy generation.
DigitalizationWe will advance WACKER’s digitalization program with a wide range of individual projects across the entire company. In 2019, we will launch a new customer information and sup-port system to enhance customer proximity and improve customer orientation. WACKER will also unveil a redesigned website. We are implementing new digital software solutions in production and logistics in order to make our processes both more secure and more productive.
EmployeesWe expect employee numbers to rise in 2019. The main reason is production-capacity expansion at WACKER SILICONES and WACKER POLYMERS in Asia and the USA. Prudent personnel planning will remain a priority.
SustainabilityWACKER’s sustainability goals for the next few years are described in the Non-Financial Report. In 2019, the regional focus of WACKER’s sustainability management activities will be on Europe, where we will examine environmental, health and safety aspects at individual sites. In 2019, WACKER will be publishing its Sustainability Report for 2017–2018.
100
Combined Management Report – Outlook
Wacker Chemie AG – Annual Report 2018

Outlook for Key Performance Indicators at the Group LevelFrom today’s perspective, the key performance indicators at the Group level will develop as follows.
EBITDA margin and EBITDA: the EBITDA margin is expected to be clearly lower than last year (2018: 18.7 percent). EBITDA will be 10 to 20 percent below last year’s level. The reasons are lower average prices for polysilicon, price reductions in standard products, and rising energy costs. We expect income from equity investments to be lower than last year. With an effective tax rate of under 20 percent, Group net income is projected to be substantially lower than a year earlier.
ROCE: due to a lower operating result, ROCE will be substan-tially below the prior-year level (2018: 5.9 percent).
Net cash flow: we expect net cash flow to be clearly positive in 2019 and substantially higher than last year, due to less usage of working capital.
Outlook for Supplementary Performance Indicators at the Group LevelCapital expenditures: at roughly € 400 million, capital expenditures will be lower than last year and remain below depreciation. At around € 525 million, depreciation in 2019 will also be below last year’s level. Investment projects include the construction of new facilities for pyrogenic silica and
liquid silicone rubber at Burghausen, the expansion of our capacities for downstream silicone and polymer products, and the construction of a new silicon-metal plant at Holla in Norway.
Net financial debt: net financial debt will be higher than in 2018 (€ 609.7 million) due to the first-time application of IFRS 16.
Divisional Sales and EBITDA TrendsAt WACKER SILICONES, we expect to increase sales in 2019 by a low-single-digit percentage versus last year. Sales growth will be fueled by a rise in volumes and by improvements to the product mix. Lower prices for standard products will have the opposite effect. We expect sales to rise in all regions. With capacity utilization high, our aim is for specialty products to account for a higher proportion of our sales volumes. Given the lower prices for standard products, EBITDA is anticipated to be markedly below last year amid lower prices for some raw materials. We expect an EBITDA margin of about 20 percent.
At WACKER POLYMERS, sales are projected to climb by a mid-single-digit percentage versus last year. Dispersions and dispersible polymer powders will both contribute to this growth. We anticipate sales gains in all regions. EBITDA is projected to be markedly above last year’s level amid lower raw-material costs and price increases. We forecast an EBITDA margin of about 14 percent.
B.64 Outlook for 2019
Reported for 2018
Outlook for 2019
Key Financial Performance IndicatorsEBITDA margin (%) 18.7 Substantially lower than a year ago
EBITDA (€ million) 930.0 10 to 20% lower than a year ago
ROCE (%) 5.9 Substantially below the prior-year level
Net cash flow (€ million) 124.7 Clearly positive, substantially higher than last year
Supplementary Financial Performance Indicators Sales (€ million) 4,978.8 Mid-single-digit percentage increase
Capital expenditures (€ million) 460.9 Around 400
Net financial debt (€ million) 609.7 Higher than last year
Depreciation (€ million) 540.4 Around 525
101
Combined Management Report – Outlook
Wacker Chemie AG – Annual Report 2018

At WACKER BIOSOLUTIONS, we expect sales to climb by a mid-single-digit percentage in 2019. Growth will be driven by higher capacity utilization at our Amsterdam production site and by higher sales volumes in other areas. EBITDA is likely to be substantially higher than a year ago, as integra-tion costs will be lower. We anticipate EBITDA of more than € 30 million.
In our polysilicon business, we expect to generate strong volume growth in 2019 after the decline reported in 2018. Sales are expected to rise by a low-double-digit percent-age. EBITDA is forecast to be balanced, and markedly lower than last year, reflecting substantially lower average prices for solar polysilicon and a stronger impact from energy prices.
Future DividendsOur goal is to distribute about half of Group net income to shareholders, provided that the business situation permits this and the decision-making bodies agree.
FinancingThe main features of our financing policy remain in place. We are confident that we have a strong financial profile with a sound capital structure and healthy maturities for our debt. As of December 31, 2018, WACKER had at its disposal unused lines of credit with residual maturities of over one year totaling € 600 million.
Executive Board Statement on Overall Business ExpectationsEconomic and political risks are significantly higher in 2019 than last year. The world economy is currently experiencing a downturn, the full extent of which cannot be determined at present. In the past two months, economists lowered their growth forecasts for the global economy, though they project it will continue to expand.
As regards our business in 2019, we expect a slight decline in raw-material costs, but a substantial increase in electricity prices in Germany, which will impact WACKER POLYSILICON’s earnings in particular. Given these underlying conditions, Group sales are expected to increase by a mid-single-digit percentage overall. All our business divisions are likely to lift their sales.
EBITDA, on the other hand, will be down substantially versus last year, and we expect the EBITDA margin to be consid-erably lower as well. The main factors in this decrease are substantially lower average polysilicon prices, lower prices for standard chemical products and rising energy costs. We anticipate a substantial decline in Group net income.
Capital expenditures of around € 400 million will again be significantly lower year over year. Depreciation will come in at around € 525 million, down slightly from last year. We expect net cash flow in 2019 to be clearly positive and markedly above last year, as a result of less working-capital usage. Net financial debt is expected to be higher than last year.
Solar-silicon overcapacities in China are slowing the earnings trend at WACKER POLYSILICON – and thus at the Group – despite our leading market and quality position. For our chemical divisions, we are confident that our excel-lent products will keep us on our growth path and that our capital expenditures will support market growth.
At the date on which which these financial statements were prepared, no changes had been made to our forecast.
102
Combined Management Report – Outlook
Wacker Chemie AG – Annual Report 2018

c
Co
nso
lida
ted
Fin
an
cia
l Sta
tem
en
ts
ConsolidatedFinancial Statements
WACKER BIOSOLUTIONS:the business division’s
new name underscores itsfuture orientation
2010:
Fine ChemicalsBecomes Biosolutions
103 180
13505_GB18_Kapiteltrenner_de_en.indd | v8 | 12. März 2019, 3:00 vorm.

c
Consolidated Financial Statements
Statement of Income 105 Statement of Comprehensive Income 106 Statement of Financial Position 107 Statement of Cash Flows 108 Statement of Changes in Equity 109 Reconciliation of Other Equity Items 110 Segment Information by Division 111 Segment Information by Region 112 Notes of the WACKER Group 113Declaration by the Executive Board on Accounting Methods and Auditing 174 Reproduction of the Independent Auditor ’s Report 175

Statement of IncomeJanuary 1 to December 31
C.1
€ million Notes 2018 2017*
Sales 01 4,978.8 4,924.2
Cost of goods sold 02 -4,104.1 -3,969.8
Gross profit from sales 874.7 954.4
Selling expenses -303.5 -292.4
Research and development expenses -164.6 -153.1
General administrative expenses -159.7 -148.5
Other operating income 02 96.0 84.2
Other operating expenses 02 -85.0 -64.8
Operating result 257.9 379.8
Result from investments in joint ventures and associates 03 131.7 42.0
Other investment income 03 – 1.9
EBIT (earnings before interest and taxes) 389.6 423.7
Interest income 03 8.0 7.5
Interest expenses 03 -22.1 -38.3
Other financial result 03 -51.1 -65.5
Financial result -65.2 -96.3
Income from continuing operations before income taxes 324.4 327.4
Income taxes 04 -64.3 -77.3
Net income from continuing operations 260.1 250.1
Net income from discontinued operations – 634.7
Net income for the year 260.1 884.8
Of whichAttributable to Wacker Chemie AG shareholders 246.1 866.7
Attributable to non-controlling interests 11 14.0 18.1
Earnings per common shareEarnings per common share (€ ) from continuing operations 4.95 4.85
Earnings per common share (€ ) from discontinued operations – 12.60
Earnings per common share (€ ) (basic / diluted) 18 4.95 17.45
* The items “other financial result” and “income taxes” have been adjusted on the basis of the ASCG (Accounting Standards Committee of Germany) Interpretation 4 ( IFRS) Accounting for Interest and Penalties Related to Income Taxes under IFRSs.
105
Wacker Chemie AG – Annual Report 2018
Consolidated Financial Statements – Statement of Income

Statement of Comprehensive Income January 1 to December 31
C.2
€ million 2018 2017
Before taxes
Deferred taxes
Before taxes
Deferred taxes
Net income for the year 260.1 884.8
Items not subsequently reclassified to the statement of incomeRemeasurement of defined benefit plans -149.3 36.7 -112.6 127.2 -29.9 97.3
Sum of items not reclassified to the statement of income -149.3 36.7 -112.6 127.2 -29.9 97.3
Of which result from investments accounted for using the equity method -14.3 -0.9 -15.2 -1.4 0.9 -0.5
Items subsequently reclassified to the statement of incomeDifference from foreign currency translation adjustment 64.3 – 64.3 -186.2 – -186.2
Of which recognized in profit or loss – – – 12.4 – 12.4
Changes in fair value of securities – FVOCI – – – -0.1 – -0.1
Impairments of securities – FVOCI – – – – – –
Changes in fair values of derivative financial instruments (cash flow hedge) -12.8 3.9 -8.9 17.4 -3.5 13.9
Of which recognized in profit or loss 0.5 -0.2 0.3 1.1 -0.2 0.9
Effects of net investments in foreign operations – – – -2.5 – -2.5
Of which recognized in profit or loss – – – -2.4 – -2.4
Sum of items reclassified to the statement of income 51.5 3.9 55.4 -171.4 -3.5 -174.9
Of which result from investments accounted for using the equity method -3.3 2.1 -1.2 -2.8 -1.3 -4.1
Income and expenses recognized in equity -97.8 40.6 -57.2 -44.2 -33.4 -77.6
Of whichAttributable to Wacker Chemie AG shareholders -96.7 40.6 -56.1 -56.7 -33.4 -90.1
Attributable to non-controlling interests -1.1 – -1.1 12.5 – 12.5
Total income and expenses reported in the fiscal year 202.9 807.2
Of whichAttributable to Wacker Chemie AG shareholders 190.0 776.6
Attributable to non-controlling interests 12.9 30.6
The share of comprehensive income attributable to Wacker Chemie AG shareholders consists of the following:
Continuing operations 190.0 133.3
Discontinued operations – 643.3
The share of comprehensive income attributable to non-controlling interests consists of the following:
Continuing operations 12.9 6.3
Discontinued operations – 24.3
106
Wacker Chemie AG – Annual Report 2018
Consolidated Financial Statements – Statement of Comprehensive Income

Statement of Financial Position As of December 31
C.3
€ million Notes Dec. 31, 2018 Dec. 31, 2017*
AssetsIntangible assets 05 38.3 41.5
Property, plant and equipment 05 3,525.5 3,500.4
Investment property 06 1.5 1.3
Investments in joint ventures and associates accounted for using the equity method 07 658.3 564.6
Securities 10 4.4 42.1
Other financial assets 09 109.3 106.8
Other receivables and assets 09 5.3 3.8
Deferred tax assets 04 520.9 452.6
Noncurrent assets 4,863.5 4,713.1
Inventories 08 1,010.7 783.6
Trade receivables 09 681.9 655.7
Other financial assets 09 30.1 78.3
Other receivables and assets 09 85.4 86.0
Income tax receivables 09 64.0 13.9
Securities and fixed-term deposits 10 42.0 218.2
Cash and cash equivalents 10 341.1 286.9
Current assets 2,255.2 2,122.6
Total assets 7,118.7 6,835.7
Equity and LiabilitiesSubscribed capital of Wacker Chemie AG 260.8 260.8
Capital reserves of Wacker Chemie AG 157.4 157.4
Treasury shares -45.1 -45.1
Retained earnings 3,328.0 3,303.9
Other equity items -613.9 -557.8
Equity attributable to Wacker Chemie AG shareholders 3,087.2 3,119.2
Non-controlling interests 58.3 50.1
Equity 11 3,145.5 3,169.3
Provisions for pensions 12 1,795.0 1,618.3
Other provisions 13 220.1 233.1
Income tax provisions 13 88.3 48.0
Financial liabilities 14 894.7 800.4
Other financial liabilities 15 0.4 0.5
Contract liabilities 15 64.1 112.5
Other liabilities 15 – 0.1
Deferred tax liabilities 04 9.8 4.2
Noncurrent liabilities 3,072.4 2,817.1
Other provisions 13 36.0 55.8
Income tax provisions 13 21.7 71.1
Financial liabilities 14 102.5 201.2
Trade payables 15 470.6 268.5
Other financial liabilities 15 23.3 15.0
Income tax liabilities 15 0.2 0.8
Contract liabilities 15 86.8 78.3
Other liabilities 15 159.7 158.6
Current liabilities 900.8 849.3
Liabilities 3,973.2 3,666.4
Total equity and liabilities 7,118.7 6,835.7
* The items “other provisions” (noncurrent and current) and “income tax provisions” (noncurrent and current) have been adjusted on the basis of the ASCG (Accounting Standards Committee of Germany) Interpretation 4 ( IFRS) Accounting for Interest and Penalties Related to Income Taxes under IFRSs.
107
Wacker Chemie AG – Annual Report 2018
Consolidated Financial Statements – Statement of Financial Position

Statement of Cash FlowsJanuary 1 to December 31
C.4
€ million Notes 2018 2017
Net income for the year 260.1 884.8
Income from discontinued operations – -634.7
Depreciation and impairment losses / reversals of fixed assets 540.4 590.4
Result from disposal of fixed assets 3.7 3.0
Other non-cash expenses and income 66.2 40.0
Result from equity accounting -131.7 -42.0
Net interest income 14.1 30.8
Interest paid -20.3 -41.2
Interest received 9.5 7.6
Income tax expense 64.3 77.3
Taxes paid -152.0 -92.8
Dividends received 23.1 2.6
Change in inventories -308.8 -97.7
Change in trade receivables -22.0 6.0
Change in non-financial assets -0.3 -34.5
Change in financial assets 45.0 -63.0
Change in provisions 13.5 74.6
Change in non-financial liabilities -3.4 38.6
Change in financial liabilities 150.0 -66.8
Change in contract liabilities -41.8 -70.0
Cash flow from operating activities (gross cash flow) – continuing operations 20 509.6 613.0
Cash flow from operating activities (gross cash flow) – discontinued operations – 44.1
Cash flow from operating activities (gross cash flow) 509.6 657.1
Investments in intangible assets, property, plant and equipment, and investment property -408.8 -328.2
Investments in financial assets -0.1 -0.1
Proceeds from the disposal of intangible assets, and property, plant and equipment 6.5 3.2
Proceeds from the disposal of investments – 0.1
Cash payments for acquisitions -21.0 –
Cash flow from long-term investing activities before securities -423.4 -325.0
Cash receipts from the disposal of securities and fixed-term deposits 587.8 245.0
Cash payments for the acquisition of securities and fixed-term deposits -373.8 -402.6
Cash flow from investing activities – continuing operations 20 -209.4 -482.6
Cash receipts from deconsolidation of Siltronic segment, less divested cash – 191.8
Cash flow from investing activities – discontinued operations – -26.0
Cash flow from investing activities -209.4 -316.8
Dividends paid -223.6 -99.4
Dividends paid to non-controlling interests -4.7 -4.6
Cash receipts from the change in ownership interests in Siltronic AG – 87.6
Bank loans raised 366.4 238.7
Bank loans repaid -374.3 -550.4
Other financial liabilities repaid -4.3 -5.0
Cash flow from financing activities – continuing operations 20 -240.5 -333.1
Cash flow from financing activities -240.5 -333.1
Change due to exchange-rate fluctuations -5.5 -3.8
Change in cash and cash equivalents 10 54.2 3.4
At the beginning of the year 286.9 283.5
At the end of the year 341.1 286.9
108
Wacker Chemie AG – Annual Report 2018
Consolidated Financial Statements – Statement of Cash Flows

Statement of Changes in EquityJanuary 1 to December 31
C.5
€ million Subscribed capital
Capital reserves
Treasury shares
Retained earnings
Other equity items
Total Non-controlling
interests
Total
Jan. 1, 2017 260.8 157.4 -45.1 2,488.7 -482.4 2,379.4 213.8 2,593.2
Net income for the year – – – 866.7 – 866.7 18.1 884.8
Income and expenses recognized in equity – – – – -90.1 -90.1 12.5 -77.6
Total comprehensive income – – – 866.7 -90.1 776.6 30.6 807.2
Dividends paid – – – -99.4 – -99.4 -4.6 -104.0
Change in ownership interests in Siltronic AG – – – 47.9 14.7 62.6 25.0 87.6
Changes in the scope of consolidation – – – – – – -214.7 -214.7
Dec. 31, 2017 260.8 157.4 -45.1 3,303.9 -557.8 3,119.2 50.1 3,169.3
Jan. 1, 2018, as reported 260.8 157.4 -45.1 3,303.9 -557.8 3,119.2 50.1 3,169.3
Effects of first-time appli-cation of new accounting standards* – – – 1.6 – 1.6 – 1.6
Jan. 1, 2018 260.8 157.4 -45.1 3,305.5 -557.8 3,120.8 50.1 3,170.9
Net income for the year – – – 246.1 – 246.1 14.0 260.1
Income and expenses recognized in equity – – – – -56.1 -56.1 -1.1 -57.2
Total comprehensive income – – – 246.1 -56.1 190.0 12.9 202.9
Dividends paid – – – -223.6 – -223.6 -4.7 -228.3
Dec. 31, 2018 260.8 157.4 -45.1 3,328.0 -613.9 3,087.2 58.3 3,145.5
* See explanations in the Notes; of which € 1.5 million from equity accounting of Siltronic.
109
Wacker Chemie AG – Annual Report 2018
Consolidated Financial Statements – Statement of Changes in Equity

Reconciliation of Other Equity ItemsJanuary 1 to December 31
C.6
€ million Changes in fair value of
securities – FVOCI
Impairments of securities
– FVOCI
Difference from foreign
currency translation adjustment
Change in fair values
of derivative financial
instruments (cash flow
hedge)
Remeasure-ment of defined
benefit plans
Effects of net invest-
ments in foreign
operations
Total
Attributable to Wacker Chemie AG shareholdersJan. 1, 2017 0.1 – 266.2 -5.2 -744.1 0.6 -482.4
Changes recognized in equity -0.1 – – 13.3 85.6 -1.8 97.0
Reclassification to the statement of income – – 12.4 -0.4 – -2.4 9.6
Change in ownership interests in Siltronic AG – – 1.6 0.1 13.1 -0.1 14.7
Changes in exchange rates – – -196.7 – – – -196.7
Dec. 31, 2017 – – 83.5 7.8 -645.4 -3.7 -557.8
Jan. 1, 2018 – – 83.5 7.8 -645.4 -3.7 -557.8
Changes recognized in equity – – – -9.2 -112.6 – -121.8
Reclassification to the statement of income – – – 0.3 – – 0.3
Changes in exchange rates – – 65.4 – – – 65.4
Dec. 31, 2018 – – 148.9 -1.1 -758.0 -3.7 -613.9
Attributable to non-controlling interestsJan. 1, 2017 – – -12.2 -1.9 -91.8 0.5 -105.4
Changes recognized in equity – – – -0.3 11.7 1.7 13.1
Reclassification to the statement of income – – – 1.3 – – 1.3
Change in ownership interests in Siltronic AG – – -1.6 -0.1 -13.1 0.1 -14.7
Changes in exchange rates – – -1.9 – – – -1.9
Changes in the scope of consolidation – – 11.3 1.0 93.2 -2.3 103.2
Dec. 31, 2017 – – -4.4 – – – -4.4
Jan. 1, 2018 – – -4.4 – – – -4.4
Changes in exchange rates – – -1.1 – – – -1.1
Dec. 31, 2018 – – -5.5 – – – -5.5
110
Wacker Chemie AG – Annual Report 2018
Consolidated Financial Statements – Reconciliation of Other Equity Items

Segment Information by DivisionJanuary 1 to December 31
C.7
€ million Silicones Polymers Biosolutions Polysilicon Other Discon-tinued
operations
Consoli-dation
Group
2018External sales 2,499.5 1,258.2 227.0 823.5 170.6 – – 4,978.8
Internal sales 0.1 24.0 – – – – -24.1 –
Total sales 2,499.6 1,282.2 227.0 823.5 170.6 – -24.1 4,978.8
EBIT 536.7 108.0 9.8 -257.3 -6.8 – -0.8 389.6
Depreciation and impairment losses / reversals 79.9 39.7 13.7 329.7 77.4 – – 540.4
EBITDA 616.6 147.7 23.5 72.4 70.6 – -0.8 930.0
EBIT includes:Result from investments in joint ventures and associates 31.8 – – – 99.9 – – 131.7
Impairment of fixed assets – -1.4 – – – – – -1.4
Asset additions1 222.7 71.0 17.9 62.2 87.1 – – 460.9
Additions to financial assets – – – – – – – –
Asset additions 222.7 71.0 17.9 62.2 87.1 – – 460.9
Assets (Dec. 31) 1,770.3 686.3 207.1 2,262.7 2,192.5 – -0.2 7,118.7
Liabilities (Dec. 31) 826.3 307.6 78.2 712.4 2,048.9 – -0.2 3,973.2
Net assets (Dec. 31) 944.0 378.7 128.9 1,550.3 143.6 – – 3,145.5
Investments in joint ventures and associates included in net assets (Dec. 31) 41.7 – – – 616.6 – – 658.3
Research and development expenses 60.9 30.0 6.3 32.8 34.6 – – 164.6
Employees (Dec. 31) 5,114 1,600 709 2,549 4,570 – – 14,542
Employees (average) 4,990 1,575 665 2,548 4,523 – – 14,301
2017External sales 2,200.0 1,225.6 205.8 1,101.3 150.8 – – 4,883.5
Internal sales 0.2 19.5 0.1 22.7 18.0 – -19.8 40.7
Total sales 2,200.2 1,245.1 205.9 1,124.0 168.8 – -19.8 4,924.2
EBIT 362.2 168.1 26.1 -87.6 -48.2 – 3.1 423.7
Depreciation and impairment losses / reversals 82.7 37.5 11.4 378.0 80.8 – – 590.4
EBITDA 444.9 205.6 37.5 290.4 32.6 – 3.1 1,014.1
EBIT includes:Result from investments in joint ventures and associates 2.0 – – – 40.0 – – 42.0
Impairment of fixed assets – – – – – – – –
Asset additions1 142.8 48.1 15.7 57.6 62.5 19.5 – 346.2
Additions to financial assets – – – – 0.1 – – 0.1
Asset additions 142.8 48.1 15.7 57.6 62.6 19.5 – 346.3
Assets (Dec. 31) 1,471.1 609.3 157.7 2,395.3 2,202.4 – -0.1 6,835.7
Liabilities (Dec. 31) 688.8 270.9 66.0 759.6 1,881.2 – -0.1 3,666.4
Net assets (Dec. 31) 782.3 338.4 91.7 1,635.7 321.2 – – 3,169.3
Investments in joint ventures and associates included in net assets (Dec. 31) 9.9 – – – 554.7 – – 564.6
Research and development expenses 58.6 29.3 6.0 22.6 36.6 – – 153.1
Employees (Dec. 31) 4,737 1,539 533 2,538 4,464 – – 13,811
Employees (average) 4,708 1,519 528 2,527 4,441 – – 13,723
1
Intangible assets; property, plant and equipment; investment property
The segment information by division is an integral part of the Notes to the Consolidated Financial Statements. For explanations of the key indicators, see Note 21.
111
Wacker Chemie AG – Annual Report 2018
Consolidated Financial Statements – Segment Information by Division

Segment Information by RegionJanuary 1 to December 31
C.8
€ million Germany Rest of Europe
The Americas
Asia Other regions
Discon-tinued
operations
Consoli-dation
Group
2018External sales by customer location 871.7 1,225.0 878.2 1,756.9 247.0 – – 4,978.8
External sales by Group company location 3,876.2 142.1 1,106.1 979.5 13.0 – -1,138.1 4,978.8
Asset additions1 220.4 63.1 99.5 77.8 0.1 – – 460.9
Additions to financial assets – – – – – – – –
Asset additions 220.4 63.1 99.5 77.8 0.1 – – 460.9
Assets (Dec. 31) 6,339.6 2,231.4 2,543.4 719.5 7.3 – -4,722.5 7,118.7
Liabilities (Dec. 31) 3,360.3 108.5 567.2 267.8 3.3 – -333.9 3,973.2
Net assets (Dec. 31) 2,979.3 2,122.9 1,976.2 451.7 4.0 – -4,388.6 3,145.5
Noncurrent assets 2 1,770.1 164.3 1,964.7 327.2 2.5 – – 4,228.8
Research and development expenses 165.0 0.5 16.3 12.7 – – -29.9 164.6
Employees (Dec. 31) 10,291 593 1,783 1,804 71 – – 14,542
2017External sales by customer location 820.5 1,149.9 838.7 1,886.2 228.9 – – 4,924.2
External sales by Group company location 3,910.0 119.5 1,167.7 859.5 12.1 – -1,144.6 4,924.2
Asset additions1 172.6 35.3 75.1 43.4 0.3 19.5 – 346.2
Additions to financial assets 0.1 – – – – – – 0.1
Asset additions 172.7 35.3 75.1 43.4 0.3 19.5 – 346.3
Assets (Dec. 31) 5,997.2 1,498.7 2,627.3 656.9 6.2 – -3,950.6 6,835.7
Liabilities (Dec. 31) 2,973.1 40.2 1,342.6 320.6 2.5 – -1,012.6 3,666.4
Net assets (Dec. 31) 3,024.1 1,458.5 1,284.7 336.3 3.7 – -2,938.0 3,169.3
Noncurrent assets2 1,721.5 87.0 2,015.6 284.8 2.7 – – 4,111.6
Research and development expenses 153.8 – 15.9 11.0 – – -27.6 153.1
Employees (Dec. 31) 9,984 407 1,676 1,678 66 – – 13,811
1
2 Intangible assets; property, plant and equipment; investment propertyNoncurrent assets as per IFRS 8 (excluding financial instruments, deferred tax assets and benefits after termination of the employment relationship)
The segment information by region is an integral part of the Notes to the Consolidated Financial Statements. For explanations of the key indicators, see Note 21.
112
Wacker Chemie AG – Annual Report 2018
Consolidated Financial Statements – Segment Information by Region

Notes of the WACKER Group
Accounting Principles and MethodsThe WACKER Group (WACKER) is a global chemical company with core activities in the fields of silicone and polymer chemistry, specialty and fine chemistry, and polysilicon production. The activities of the individual segments are explained in the management report. The Group’s parent company, Wacker Chemie AG, is a listed company under the laws of the Federal Republic of Germany and headquartered in Munich, Germany (entered in Munich’s commercial register under HRB 159705). Its registered office is at Hanns-Seidel-Platz 4, 81737 Munich, Germany.
The consolidated financial statements, the combined management report and any other documents subject to disclosure requirements are submitted to the publisher of the German Federal Gazette and published on WACKER’s website. KPMG AG Wirtschaftsprüfungsgesellschaft audited the consolidated financial statements and the combined management report of Wacker Chemie AG and issued an unqualified audit opinion for them.
www.wacker.com/annual-report
Wacker Chemie AG and its subsidiaries are included in the consolidated financial statements of Dr. Alexander Wacker Familiengesellschaft mbH, Munich. The consolidated financial statements of Dr. Alexander Wacker Familien-gesellschaft, Munich, are disclosed to the publisher of the German Federal Gazette.
The Executive Board and Supervisory Board of Wacker Chemie AG have submitted the declaration concerning the German Corporate Governance Code required by Section 161 of the German Stock Corporation Act (AktG) and made it accessible to the public on WACKER’s website.
www.wacker.com/corporate-governance
Wacker Chemie AG’s consolidated financial statements have been prepared in accordance with the International Financial Reporting Standards ( IFRS), as applicable in the European Union (EU), and the supplementary rules in
Section 315e (1) of the German Commercial Code (HGB). The interpretations of the International Financial Reporting Interpretations Committee ( IFRIC) that were applicable in the year under review have also been implemented.
The fiscal year corresponds to the calendar year. Assets and liabilities are reported in the statement of financial position in line with their maturities. The Group classifies assets and liabilities as current if it expects to realize or settle them within 12 months of the reporting date. The statement of income is prepared using the cost-of-sales method. To improve the clarity of presentation, various items in the statement of income and in the statement of financial position have been combined. These items are shown and explained separately in the Notes.
The Group’s functional currency is the euro. Unless stated otherwise, all amounts are shown in millions of euros (€ million). There may be slight deviations in the additions as all amounts have been rounded up to the nearest whole number after the decimal point.
Material events occurring after the reporting date are described in detail in Note 24. The Executive Board of Wacker Chemie AG approved the consolidated financial statements on March 5, 2019. They will be submitted to the Supervisory Board for approval at its meeting on March 13, 2019.
New Accounting StandardsIFRS 15, “Revenue from Contracts with Customers”IFRS 15, “Revenue from Contracts with Customers,” replaces the existing revenue-recognition standards IAS 18 (“ Revenue”) and IAS 11 (“Construction Contracts”) and related interpretations, and is applicable for reporting periods beginning on or after January 1, 2018. The new standard introduces a five-step model for the recognition of revenue from contracts with customers. IFRS 15 sets out that an entity shall recognize the revenue expected as consideration for transferring goods or services to the cus-tomer. Revenue recognition occurs when (or as) the entity satisfies its performance obligation and the customer has obtained control of the good or service either at a point in time or over a period of time. Moreover, IFRS 15 specifies the allocation of individual items to new balance-sheet items and to individual functional costs in the income statement and their presentation in gross or net form.
113
Wacker Chemie AG – Annual Report 2018
Consolidated Financial Statements – Notes of the WACKER Group

WACKER has introduced IFRS 15 on the basis of the modified retrospective approach, such that any transition effects as of January 1, 2018, are recognized cumulatively in retained earnings and the comparative period is presented according to previous accounting standards. All business models commonly used by the Group were reviewed in an implementation project for the new standard. These reviews did not result in any material adjustment effects that would have to be recognized in retained earnings. The low impact of IFRS 15 is due to the fact that WACKER’s customer contracts usually result in one performance obligation that is satisfied at a point in time. The transition effects are described below.
At WACKER SILICONES, there are transition effects from trans-actions as defined in IFRS 15.5 (d), such as non- monetary exchanges, e.g. of raw materials or products, between companies in the same line of business to facilitate sales to customers or to reduce transport costs. The transactions in question must be settled in the same period. Whereas WACKER used to report these transactions as revenue, they are no longer recognized as sales. As a consequence, sales were reduced by around € 50 million in 2018. These exchanges did not result in any margin effects.
At WACKER POLYMERS, minor transition effects arose from the supply of raw materials for toll manufacturing. These transactions were no longer recognized as revenue in 2018.
One business model at WACKER BIOSOLUTIONS consists in providing development services to the pharmaceutical industry under service contracts that are satisfied over time. These customer-specific services are rendered and documented based on contractual milestones. The recognition of revenue pursuant to IFRS 15 did not result in any changes here since the right to payment arises upon achievement of the milestones. WACKER BIOSOLUTIONS also manufactures customer-specific products in connection with product supply contracts for drug-related intermedi-ates. The right to payment in this case arises on acceptance by the customer. As of the reporting date, there were no material contract assets representing services not charged. WACKER continues to report these under inventories and explains them in the Notes.
Certain transport clauses give rise to a separate perfor-mance obligation since the freight / transport performance is not concluded until control has been transferred to the customer. The effect of postponing the share of revenue attributable to freight / transport performance to a later date amounted to € 3.1 million in 2017. Since WACKER reduced the corresponding transport costs at the same time, there was no effect on EBITDA.
As soon as a contracting party (customer or supplier ) has satisfied its contractual obligations, the entity must recognize the contract as a contract asset or contract liability depending on whether the entity has completed performance or the customer has made payment. The entity must show every unconditional right to receive consideration separately as a receivable. WACKER cur-rently recognizes only contract liabilities in the statement of financial position. These liabilities include advance payments made by customers for polysilicon deliveries and advance payments by WACKER BIOSOLUTIONS custom-ers. In 2017, advance payments received from customers were posted under non-financial liabilities. Furthermore, discount accruals that had been reported under other provisions in 2017 are now reported as contract liabilities.
IFRS 9, “Financial Instruments”IFRS 9, “Financial Instruments,” replaces IAS 39, “Financial Instruments: Recognition and Measurement,” and is effec-tive for reporting periods beginning on or after January 1, 2018. IFRS 9 introduces new requirements specifying how an entity should classify and measure financial assets. It also requires changes to the accounting of ‘own credit risk’ with respect to financial liabilities classified as measured at fair value, and it replaces the existing rules for impairment of financial assets and changes the requirements for hedge accounting.
The first-time application of IFRS 9 at WACKER led to minor impairment adjustments. The higher risk provisions for trade receivables and securities are partially offset by tax effects and reversals of existing valuation allowances, leading to a slight increase in equity. The effects are shown in a separate line item in equity. As the amounts concerned are minor, WACKER will not apply the resulting
114
Consolidated Financial Statements – Notes of the WACKER Group
Wacker Chemie AG – Annual Report 2018

changes from IFRS 9 to IAS 1 (classification of impairment losses and reversals as a separate item in the income statement). As in the past, the changes are shown under other operating expenses for trade receivables and under other financial result for other financial assets, and are described in the Notes.
Classification and Measurement of Financial InstrumentsIFRS 9 stipulates that each financial asset must be classified and measured on the basis of the entity’s business model and the asset’s contractual cash flow characteristics. On initial recognition, each financial asset is classified as measured either at fair value through profit or loss (FVPL), at amortized cost or at fair value through other comprehensive income (FVOCI). Since the new requirements under IFRS 9 diverge from the existing assessments under IAS 39, there are slight differences in the classification and measurement of financial assets. This includes the option of recognizing certain assets at fair value. The classification and meas-urement of financial liabilities remain largely unchanged under IFRS 9.
115
Consolidated Financial Statements – Notes of the WACKER Group
Wacker Chemie AG – Annual Report 2018

The reclassifications did not result in any change in carrying amounts. The classification of financial liabilities remained unchanged year over year.
To determine possible classification and measurement changes from the implementation of IFRS 9, WACKER carried out an analysis of the business models and assessed the contractual cash flow characteristics of the financial assets within these business models. As a result of this analysis, the Group identified financial assets that are measured either at amortized cost or at fair value through other comprehensive income, and that are therefore subject to the IFRS 9 impairment rules.
On initial recognition of an equity investment not held for trading, WACKER shall, in certain cases, exercise its irrevo-cable option to report the following changes in fair value in equity under “Other equity items.” WACKER did not make use of this option as of the transition date.
Impairment of Financial AssetsThe policies of IFRS 9 regarding impairments apply to debt instruments measured at amortized cost or at fair value through other comprehensive income (referred to collec-tively in the following as “financial assets”). The model for determining impairments and risk provisions has changed from one based on actual losses of receivables ( IAS 39) –
WACKER has assessed its financial assets using the underlying business model and the contractual cash flow characteristics of the assets and classified them as follows:
Reclassification of Financial Assets as of January 1, 2018
€ million
Measurement pursuant to IAS 39 Measurement pursuant to IFRS 9
Financial assets IAS 39 category IFRS 9 business model / measurement category
Balance sheet
carrying amount Dec. 31,
2017
Remea s-urement
Balance sheet
carrying amount
Jan. 1, 2018
(Amortized) cost Fair value through profit
or loss
Fair value through other
comprehensive income
Fair value as of
Dec. 31, 2017
(Amortized) cost Fair value through profit
or loss
Fair value through other
comprehensive income
Jan. 1, 2018
Trade receivables
Other financial assets
Other financial assets
Investments
Derivatives that do not qualify for hedge accounting
Derivatives that qualify for hedge accounting
Securities and fixed-term deposits
Fixed-term deposits
Available-for-sale securities
Cash and cash equivalents
Fixed-term deposits
Bank deposits
Total financial assets
*
**FVPL = financial assets measured at fair value through profit or lossFVOCI = financial assets (debt instruments) measured at fair value through other comprehensive income
Loans and receivables / amortized cost
Held to collect / amortized cost 655.7 – 655.7 655.7 655.7 655.7 655.7
185.1 – 185.1 171.7 8.4 5.0 174.0 160.6 19.5 5.0 185.1
Loans and receivables / amortized cost
Held to collect / amortized cost 160.6 160.6 160.6 160.6
Available for sale / at cost Trading / FVPL* 11.1 11.1 11.1
FVPL* FVPL* 3.0 3.0 3.0 3.0
5.4 5.0 10.4 5.4 5.0 10.4
260.3 – 260.3 156.8 103.5 260.3 156.8 103.5 260.3
Loans and receivables / amortized cost
Held to collect / amortized cost 156.8 156.8 156.8 156.8
Available for sale / FVOCI**Held to collect
and for sale / FVOCI** 103.5 103.5 103.5 103.5
286.9 – 286.9 286.9 286.9 286.9 286.9
Loans and receivables / amortized cost
Held to collect / amortized cost 187.1 187.1 187.1 187.1
Loans and receivables / amortized cost
Held to collect / amortized cost 99.8 99.8 99.8 99.8
1,388.0 1,388.0 1,376.9 1,388.0
116
Consolidated Financial Statements – Notes of the WACKER Group
Wacker Chemie AG – Annual Report 2018

under which these are recognized on occurrence of a defined loss event – to one based on expected losses of receivables ( IFRS 9). Under the latter, impairments for losses of receivables are recognized on initial recognition of the financial asset on the basis of the potential losses expected at that point in time. WACKER is exposed to an insignificant transition effect from the change in the model for losses of receivables because the majority of receivables are insured. A detailed description of the model can be found in the accounting and valuation principles for financial assets.
Hedge AccountingIFRS 9 also includes new rules for hedge accounting with the objective to bring it into line with risk management. In principle, some of the restrictions contained in the existing rules have been eliminated, meaning that a wider range of hedging instruments and hedged items qualifies for hedge accounting. IFRS 9 offers the option of postponing application of its accounting rules for hedging relationships and, instead, continuing to apply the corresponding IAS 39 rules. WACKER decided to exercise this accounting option and therefore did not apply the IFRS 9 hedge accounting rules as of January 1, 2018, the effective date of IFRS 9.
Reclassification of Financial Assets as of January 1, 2018
€ million
Measurement pursuant to IAS 39 Measurement pursuant to IFRS 9
Financial assets IAS 39 category IFRS 9 business model / measurement category
Balance sheet
carrying amount Dec. 31,
2017
Remea s-urement
Balance sheet
carrying amount
Jan. 1, 2018
(Amortized) cost Fair value through profit
or loss
Fair value through other
comprehensive income
Fair value as of
Dec. 31, 2017
(Amortized) cost Fair value through profit
or loss
Fair value through other
comprehensive income
Jan. 1, 2018
Trade receivables
Other financial assets
Other financial assets
Investments
Derivatives that do not qualify for hedge accounting
Derivatives that qualify for hedge accounting
Securities and fixed-term deposits
Fixed-term deposits
Available-for-sale securities
Cash and cash equivalents
Fixed-term deposits
Bank deposits
Total financial assets
*
**FVPL = financial assets measured at fair value through profit or lossFVOCI = financial assets (debt instruments) measured at fair value through other comprehensive income
Loans and receivables / amortized cost
Held to collect / amortized cost 655.7 – 655.7 655.7 655.7 655.7 655.7
185.1 – 185.1 171.7 8.4 5.0 174.0 160.6 19.5 5.0 185.1
Loans and receivables / amortized cost
Held to collect / amortized cost 160.6 160.6 160.6 160.6
Available for sale / at cost Trading / FVPL* 11.1 11.1 11.1
FVPL* FVPL* 3.0 3.0 3.0 3.0
5.4 5.0 10.4 5.4 5.0 10.4
260.3 – 260.3 156.8 103.5 260.3 156.8 103.5 260.3
Loans and receivables / amortized cost
Held to collect / amortized cost 156.8 156.8 156.8 156.8
Available for sale / FVOCI**Held to collect
and for sale / FVOCI** 103.5 103.5 103.5 103.5
286.9 – 286.9 286.9 286.9 286.9 286.9
Loans and receivables / amortized cost
Held to collect / amortized cost 187.1 187.1 187.1 187.1
Loans and receivables / amortized cost
Held to collect / amortized cost 99.8 99.8 99.8 99.8
1,388.0 1,388.0 1,376.9 1,388.0
117
Consolidated Financial Statements – Notes of the WACKER Group
Wacker Chemie AG – Annual Report 2018

Other accounting standards and interpretations applied for the first time in these consolidated financial statements are:
Standard / Interpretation
Mandatory from
Endorsed by EU
Impact on WACKER
Amendments to IAS 40
Transfers of Investment Property
Jan. 1, 2018
March 14, 2018
Investment property is held to earn rental income or for capital appre-ciation and not within the ordinary course of business. The amendments clarify that a change in use has occurred only if there is actual evidence of such a change. The mere intention of a change in use is not suffi-cient. As WACKER did not institute any changes in use in the 2018 fiscal year, the amendments did not lead to any changes in carrying amounts.
IFRIC 22 Foreign Currency Transactions and Advance Consideration
Jan. 1, 2018
March 28, 2018
The interpretation determines the exchange rate to be used on initial recognition of a foreign currency transaction in an entity’s functional currency when the entity pays or receives consideration in advance for the related asset, expense or income (or parts thereof ). WACKER makes investment-related advance payments to a minor extent only. The advance payments received to date for polysilicon deliveries have all been denominated in euros. The volume of other advance payments made is only minor. The application of this interpretation did not alter the WACKER Group’s earnings, net assets or financial position in the 2018 fiscal year.
Other standards and interpretations to be applied for the first time are not applicable due to the absence of relevant circumstances.
Accounting Standards / Interpretations Not Applied PrematurelyThe International Accounting Standards Board ( IASB) has published the following standards, interpretations, and amendments to existing standards, the application of which is not yet mandatory and which WACKER is not applying earlier than required. Only those standards that are relevant to WACKER are mentioned. WACKER evaluates every new standard to determine its impact on the consolidated financial statements.
118
Consolidated Financial Statements – Notes of the WACKER Group
Wacker Chemie AG – Annual Report 2018

Accounting Standards Published by the IASB, But Not Yet Applied
Standard / Interpretation
Publication by IASB
Mandatory from
Endorsed by EU
Anticipated Impact on WACKER
IFRS 16 – Leases
Lease Accounting
Jan. 13, 2016
Jan. 1, 2019
Oct. 31, 2017
IFRS 16, “Leases,” replaces the existing lease accounting standard IAS 17, “Leases,” and related interpretations. WACKER will use the modified retrospective approach to make the transition; the compar-ative figures for prior-year periods will not be restated. The analysis performed as part of the groupwide first-time application project has shown that IFRS 16 will have a material impact on the components of the consolidated financial statements and on the presentation of WACKER’s earnings, net assets and financial position.Statement of financial position: for lessees, IFRS 16 introduces a uniform approach to the accounting treatment of leasing in which, for all leases, right-of-use assets are capitalized and the corresponding payment obligations incurred are recognized as liabilities. WACKER makes use of the relief applied for leases of low-value assets and for short-term leases of less than twelve months. The requirements for lessors, on the other hand, remain largely unchanged, especially as regards the continuing requirement to classify leases pursuant to IAS 17. In leases that have previously been classified as operating leases in accordance with IAS 17, the lease liability is meas ured at the present value of the remaining lease payments and discounted at the lessee’s incremental borrowing rate at the date of initial appli-cation. The right-of-use asset is measured at an amount equal to the lease liability plus initial direct costs. The analysis performed in the groupwide first-time application project has shown that, as of Janu-ary 1, 2019, the transition is expected to result in the recognition of lease liabilities of some € 155 million and right-of-use assets of € 145 mil-lion in the statement of financial position. Upon first-time application, retained earnings will change only slightly. This balance sheet extension will reduce the equity ratio by around one percent. Given the material increase in lease liabilities, net financial debt will increase accordingly.Statement of income: as opposed to the previous presentation of expenses for operating leases, right-of-use assets will be depreciated, and interest expenses arising from accrued interest on the lease liabilities recognized. The changes will result in higher EBITDA. Based on the leases in place as of January 1, 2019, Group EBITDA is expected to increase by about € 35 million in 2019.Statement of cash flows: the changed presentation of operating-lease expenses will correspondingly improve cash flow from operating activities and diminish cash flow from financing activities. Net cash flow will thus improve by some € 30 million in 2019.
IFRIC 23 Uncertainty over Income Tax Treat-ments
June 7, 2017
Jan. 1, 2019
Oct. 23, 2018
The interpretation contains rules for recognizing and measuring uncer-tain tax positions and hence closes existing gaps in IAS 12, “Income Taxes.” Uncertain tax positions comprise all risk-related tax issues. This concerns uncertainties regarding acceptance by the tax author-ities. The recognition of an uncertain tax position (whether asset or liability) depends on whether a payment is assessed as being prob-able. An uncertain tax position can affect both current taxes and deferred taxes. Determining an uncertain tax position requires uniform estimates and assumptions. We assume that the interpretation will not result in any change in the WACKER Group’s earnings, net assets or financial position.
119
Consolidated Financial Statements – Notes of the WACKER Group
Wacker Chemie AG – Annual Report 2018

Standard / Interpretation
Publication by IASB
Mandatory from
Endorsed by EU
Anticipated Impact on WACKER
Annual Improve-ments to IFRSs, 2015 –2017 Cycle
Dec. 12, 2017
Jan. 1, 2019
2019 As part of the annual improvement process, the following clarifications have been made. IFRS 3, “Business Combinations,” and IFRS 11, “Joint Arrangements”: acquiring additional shares to obtain control in a former joint venture necessitates the remeasurement of the pre-viously held interests as an acquisition achieved in stages; if there is no change in the determination of a joint arrangement, the previously held interest is not remeasured. WACKER currently does not recognize any joint arrangements according to IFRS 11. Amendments to IAS 12, “Income Taxes,” relating to income tax consequences of dividend payments: these amendments have no impact on WACKER. Amend-ments to IAS 23, “Borrowing Costs”: WACKER has already been applying this clarification, which requires that borrowings that were directly attributed to a specific qualifying asset in accordance with IAS 23 after its completion and are reallocated to general borrowing costs and eligible for capitalization as part of IAS 23.
Amendments to IAS 19
Employee Benefits – Plan Amendment, Curtailment or Settlement
Feb. 7, 2018
Jan. 1, 2019
2019 The amendments relate to the determination of current service cost after an intervention in a defined benefit plan. For the time period between the intervention and the end of the reporting period, the current service cost and the net interest cost are remeasured using the actuarial assumptions and the net defined benefit liability deter-mined in case of plan amendment and at the time of the plan amend-ment. WACKER may be affected by these amendments, but at this time we are not anticipating any impact on earnings, net assets or financial position.
Amendments to IFRS 3
Business Combi-nations – Definition of a Business
Oct. 22, 2018
Jan. 1, 2020
2019 The amendments have changed the definition of a business in IFRS 3. A business exists only if, at a minimum, a substantive process contributing to creating outputs exists or has been acquired. If an acquisition’s fair value is focused solely on purchased assets, it is not considered a business and IFRS 3 is therefore not applied. WACKER will be affected by these amendments for future acquisitions.
Amendments to IAS 1 and IAS 8
Definition of Material
Oct. 31, 2018
Jan. 1, 2020
2019 The amendments clarify information is material if omitting or misstating it could reasonably be expected to influence decisions that the primary users of financial statements make. Primary users of financial state-ments are existing investors, lenders or other creditors. WACKER already applies these materiality criteria in its published consolidated financial statements.
Scope of ConsolidationThe consolidated financial statements include the financial statements of Wacker Chemie AG and all companies over which Wacker Chemie AG has direct or indirect control as defined in IFRS 10, or can exercise joint control as defined in IFRS 11. Depending on their structure, companies over which Wacker Chemie AG can exercise joint control are included in the consolidated financial statements either proportionately ( line-by-line) or are accounted for using the equity method. In the absence of other limiting contractual agreements, holding a majority of the voting rights usually leads to control. Joint control generally exists when voting rights are equally balanced, except if other (contractual ) rights result in control by one shareholder. Currently, one company with joint control is consolidated using the equity method.
Associates in which Wacker Chemie AG can exercise signifi-cant influence as defined in IAS 28 are likewise accounted for using the equity method. Significant influence is presumed if Wacker Chemie AG directly or indirectly holds 20 percent of the voting rights in the investment, unless it can be clearly demonstrated that this is not the case.
Structured entities are also consolidated in the manner described in IFRS 10 if the economic substance of the relationship indicates the existence of control. WACKER includes one such structured entity, a special fund, in its consolidated financial statements. Wacker Chemie AG has contributed assets to this fund. The fund was established exclusively for WACKER, and all shares in the fund are held by WACKER. Contractual provisions of this fund qualify it as a structured entity as defined in IFRS 10.
120
Consolidated Financial Statements – Notes of the WACKER Group
Wacker Chemie AG – Annual Report 2018

Companies in which Wacker Chemie AG has a shareholding of less than 20 percent or does not exercise significant influence are shown as other investments under noncurrent financial assets.
A detailed list of the companies included in the consolidated financial statements and of Wacker Chemie AG’s entire shareholdings is shown in the Breakdown of Shareholdings section in accordance with Sections 285 and 313 of the German Commercial Code.
See Note 22 to the Consolidated Financial Statements
A total of 55 companies were included in the consolidated financial statements as of December 31, 2018 (Dec. 31, 2017: 52 companies). Compared with December 31, 2017, the scope of consolidation changed as follows:
On April 16, 2018, WACKER acquired a production site for biopharmaceutical proteins in Amsterdam (Netherlands) from SynCo Bio Partners Luxembourg S. à. r. l., Luxem-bourg – along with the associated business portfolio.
WACKER Chemical Finance B. V., Zaanstad, Netherlands, a subsidiary of Wacker Chemie AG, concluded an agreement on December 14, 2017, to acquire all the shares in SynCo Bio Partners Holding B. V. Amsterdam, Netherlands. The closure of sale took effect (closing) on April 16, 2018. The above-mentioned is the parent company of the operating subsidiary SynCo Bio Partners B. V. Amsterdam, Netherlands. This subsidiary essentially operates two fermentation lines and a sterile fill-and-finish facility, and has around 100 employees. The facilities meet Good Manufacturing Prac-tice (GMP) quality standards, have already been inspected by the European Medicines Agency (EMA) and the US Food and Drug Administration (FDA), and have been certified for the manufacture of specific pharmaceutical proteins.
In closing this deal, WACKER gained control (as defined in IFRS 10) over SynCo Bio Partners Holding B. V. and its subsidiaries. WACKER intends to use these additional fermentation lines to further strengthen and expand its biotech business.
The purchase price of the company amounted to € 23.5 mil-lion and comprised a one-off payment in cash and an amount retained for subsequent adjustments, as well as the assumption of debt. These were accounted for in the purchase price allocation. Aside from this fixed amount, a contingent purchase price component (earn-out pay-ment) was determined. This is based on the company’s EBITDA through 2021. It was not included in the purchase price due to current sales and earnings trends, and future expectations.
The fair value of acquired assets at the time of the acqui-sition amounted to € 29.9 million, of which € 25.4 million was noncurrent assets and € 4.5 million current assets. Cash and cash equivalents accounted for € 1.0 million of the acquired assets. The fair value of the acquired liabilities, which are exclusively current liabilities, came to € 9.0 million. The purchase price allocation was concluded on December 31, 2018, and resulted in goodwill of € 2.6 million. The company achieved sales of € 4.3 million and EBITDA of € –6.4 million in 2018. The transaction costs, which were of a minor nature, were recognized as an expense.
Two acquired companies were renamed WACKER Biotech Holding B. V. and WACKER Biotech B. V.
On March 15, 2017, WACKER reduced its stake in Siltronic AG from 51.8 percent to 30.8 percent by means of a bookbuild-ing offering to institutional investors. As WACKER had lost
Composition of the Group
Number 2018 2017
Fully consolidated subsidiaries ( incl. parent company)
Germany
International
Companies accounted for using the equity method
Germany
International
Non-consolidated affiliated companies
Germany
International
Total
Germany
International
Structured entities
Germany
International
52 49
15 15
37 34
3 3
1 1
2 2
– –
– –
– –
55 52
16 16
39 36
1 1
1 1
– –
Change in the Scope of Consolidation
%
Additions, fully consolidated companies, April 16, 2018SynCo Bio Partners Holding B. V., Amsterdam, Netherlands
SynCo Bio Partners B. V., Amsterdam, Netherlands
SynCo Bio Partners Investment B. V., Amsterdam, Netherlands
100
100
100
121
Consolidated Financial Statements – Notes of the WACKER Group
Wacker Chemie AG – Annual Report 2018

control of Siltronic, the segment was deconsolidated as of March 15, 2017. The remaining stake of 30.8 percent in the associate was accounted for using the equity method. In accordance with IFRS 5, the Siltronic segment’s income in Q1 2017 was recognized as income from discontinued operations.
Legal, contractual or regulatory restrictions and protective rights concerning non-controlling interests can limit the Group in its ability to retain access to assets, transfer these to or from other companies unhindered within the Group, or to settle Group debts. The distribution of dividends can be limited by the need to prioritize retirement of shareholder loans. As of the reporting date, there were no significant restrictions due to protective rights to the benefit of non-controlling interests. For more information, please refer to the Equity / Non-Controlling Interests / Capital Structure Management section in these Notes.
See Note 11
In certain countries, regulatory requirements or local corpo-rate-law stipulations can limit the Group’s ability to transfer assets to or from other companies within the Group. Cash and cash equivalents are subject to local foreign-exchange restrictions in some Asian and South American countries. Capital may be exported from such countries only with prior approval from government authorities and by means of capital measures (dividends, capital reductions). There are no other significant limitations on assets’ utility within the Group.
Consolidation MethodsThe consolidated financial statements are based on the separate financial statements of Wacker Chemie AG and its consolidated subsidiaries, joint arrangements and struc-tured entities. The reporting date for all of these companies is December 31.
All key reporting data of these companies was audited by independent auditors prior to inclusion in the consolidated financial statements.
Business combinations are recognized by applying the purchase method as defined in IFRS 3. The acquisition costs are shown as the sum of fair values at the date of purchase of the assets transferred, of the liabilities incurred or assumed, and of any equity instruments issued in exchange for control of the entity acquired. In addition, they contain the fair values of assets and liabilities arising from contingent consideration arrangements. Assets, liabilities and contingent liabilities identified as part of the acquisition during initial consolidation are measured at fair value as of the acquisition date.
For each acquisition, the individual option exists of meas-uring any shares not acquired either at fair value or at the proportionate share of the fair value of the acquired entity’s net assets. These non-controlling interests are recognized in the statement of financial position under the line item of the same name.
Costs associated with the business combination are recognized as expenses insofar as they are not costs for issuing debt instruments or equity securities.
Goodwill is the amount on the acquisition date by which the sum of acquisition costs, any existing non-controlling interests and the fair value of any previously held equity interests exceeds the acquired entity’s net assets measured at fair value. Negative differences are recognized in profit or loss immediately after undertaking an additional review of the purchase price allocation.
Investments accounted for using the equity method are initially measured at acquisition cost when the acquisition is made. If the cost exceeds the pro rata share of equity, the difference (goodwill ) is included in the carrying amount of the investment. The carrying amount has to be tested for possible impairment losses as of the reporting date. If the cost is lower than the share of equity at the time of acqui-sition, this difference is included in the carrying amount and recorded in the statement of income as income from investments in joint ventures and associates. The carrying
122
Consolidated Financial Statements – Notes of the WACKER Group
Wacker Chemie AG – Annual Report 2018

amounts for these entities are increased or decreased annually to reflect their pro rata earnings, dividend payouts or other changes in equity. If there is any indication that the value of the investment has been permanently reduced, an impairment is recognized in profit or loss. Long-term interests that, in substance, form part of the investor’s net investment in the entity are included in the statement of changes in equity.
Interim results, sales, expenses, income, receivables and liabilities between the consolidated companies, as well as pro rata profits and losses resulting from transactions with associates, are eliminated. For those consolidation entries affecting income, the income tax effect is taken into account and deferred taxes recognized.
Estimates and Assumptions Used in Acquisitions and ConsolidationDetermining the fair values of the acquired assets and liabil-ities requires certain estimates and assumptions, especially concerning the acquired intangible assets and property, plant and equipment, as well as the liabilities assumed and the useful lives of the acquired intangible assets, property, plant and equipment.
Measurement is based to a large extent on anticipated cash inflows and outflows. If actual cash inflows and outflows vary from those used to calculate fair values, this may affect future Group net income.
For significant business combinations, the purchase price allocation is carried out with assistance from independent third-party valuation specialists. The valuations are based on information available at the acquisition date.
Discretionary decisions can be made whenever it is neces-sary to evaluate whether control, joint control or significant influence exists for entities in which WACKER holds less than 100 percent of the voting rights. Primarily in cases where WACKER holds 50 percent of the voting rights, it must be assessed whether there are additional contractual rights
or, in particular, factual circumstances that could result in WACKER having the authority to make decisions regarding the potential subsidiary, or whether joint control exists.
Changes to the contractual agreements or factual cir-cumstances are monitored and assessed in terms of their possible impact on the evaluation of whether control or joint control exists.
Foreign Currency TranslationIn the Group companies’ separate financial statements, all of the receivables and liabilities in foreign currencies are translated at the rate prevailing on the reporting date, regardless of whether or not they have been hedged. For-ward contracts that, from an economic point of view, are used for hedging are reported at fair value. The resulting translation differences are recognized in profit or loss or, if cash flow hedges are in place, in other equity items.
The financial statements of consolidated companies that are prepared in foreign currencies are translated on the basis of the functional currency principle using the modified reporting date rate method. This means that balances are translated from the functional currency to the reporting currency using the average rates of exchange prevailing on the reporting date, while income statement amounts are translated using the average exchange rates of the period. As the Group’s subsidiaries conduct their busi-ness in financial, economic and organizational autonomy, their functional currencies are basically identical to their respective local currencies. Any net gains or losses arising from the translation of equity are recognized in other equity items. Translation differences resulting from divergent exchange rates in the statement of income are likewise included there. If Group companies are removed from the scope of consolidation, any translation difference is reclassified from equity to profit or loss.
The exchange rates between the most important currencies reported in these financial statements and the euro were as follows:
ISO code Exchange rate as of Average exchange rate
Dec. 31, 2018
Dec. 31, 2017
2018 2017
US dollar
Chinese renminbi
USD 1.14 1.20 1.18 1.13
CNY 7.86 7.79 7.81 7.62
123
Consolidated Financial Statements – Notes of the WACKER Group
Wacker Chemie AG – Annual Report 2018

Estimates and Assumptions Used in Preparing Consolidated Financial StatementsThe preparation of the consolidated financial statements in compliance with IFRS necessitates assumptions and estimates affecting the amounts and the reporting of the recognized assets and debts, income and expenses, and contingent liabilities and contingent assets. These assumptions and estimates comply with the conditions and appraisals prevailing on the reporting date. In this regard, they also impact the amount of income and expenses rec-ognized for the fiscal years in question. The assumptions on which the estimates are based relate primarily to the uniform determination of useful lives throughout the Group, the ascertainment of fair values of financial instruments, the recognition and measurement of provisions, the realizability of future tax benefits, and the determination of discounted cash flows made in connection with impairment tests and purchase price allocations.
In individual cases, the actual values may differ from the assumptions and estimates that were made. Changes in value are recognized as soon as they become apparent and affect the net results for the period when the change occurred and, if applicable, in future reporting periods.
Intangible Assets and Property, Plant and Equipment / Investments in Associates Accounted for Using the Equity MethodThe expected useful lives of intangible assets and of prop-erty, plant and equipment, together with their amortization /depreciation schedules, are based on past experience, plans and estimates. This includes estimates of the period and allocation of future cash inflows derived from the investments made, as well as future technical advance-ments and ongoing replacement and development cycles.
Impairment tests are performed for assets if specific indicators point to a possible impairment loss or reversal of an impairment loss. In the case of a possible impairment, an estimate must be made of the recoverable amount of the affected asset that corresponds to the higher of either the fair value less costs to sell or the value in use. When determining the recoverable amount in the course of the impairment test, it is necessary to make estimates based on share prices, on prices of comparable transactions, or on the net present value method, other valuation methods or combinations thereof. That, in turn, calls for estimates and assessments by management. To ascertain the value in use, the discounted future cash flows of the affected asset must be determined. The estimate of the discounted future cash flows contains significant assumptions such
as, in particular, those regarding future selling prices and sales volumes, costs, and discount rates. Although WACKER assumes that the estimates of the relevant expected useful lives and of discounted future cash flows, as well as the assumptions regarding the general economic conditions and the development of the economic sectors, are rea-sonable, a change in the assumptions or circumstances might necessitate a change in the analysis. The trends in WACKER products’ sales prices and raw-material prices will have the most significant impact on future cash flows. This could result in significant deviations from the figures posted, which may lead to additional impairment losses or reversals of impairment losses.
See Note 05
Financial InstrumentsFinancial instruments are recognized at fair value, while other assets and liabilities are disclosed at fair value in the notes to the financial statements. Calculation of the fair value of financial instruments may require making estimates, which may be more or less extensive depending on the extent to which non-observable input parameters are taken into account. When calculating fair value, WACKER strives to include as many observable input parameters as possible and to keep the use of non-observable factors to a minimum. If the fair value cannot be calculated reliably, the carrying amount is taken as an approximate figure to determine it.
In accordance with IFRS 13, financial instruments that are measured or recognized at fair value in the consolidated financial statements must be measured and classified according to the fair value hierarchy. This hierarchy consists of three levels, to which the input parameters are assigned in accordance with the extent to which they are observable during the corresponding measurement process.
See Note 19
Impairments of Financial AssetsImpairments of financial assets are based on assumptions on credit-default risk and expected loss rates. When pre-paring these assumptions and selecting inputs to calculate impairment, WACKER exercises discretion based on past experience, current market conditions and forward-looking estimates as of the end of the reporting period. The most important assumptions and inputs are based on credit ratings and credit insurance, as well as on macroeconomic analyses, all of which provide the basis for classification in risk classes.
See Note 09
124
Consolidated Financial Statements – Notes of the WACKER Group
Wacker Chemie AG – Annual Report 2018

ProvisionsSignificant risks inherent in environmental protection provi-sions and in provisions for damages and onerous contracts include possible changes in future cost / benefit estimates, changes in the likelihood of their utilization, and enhanced statutory rules concerning the elimination and prevention of environmental damage. Changes in the discount rate also lead to adjustments when determining noncurrent provisions. The current environment of low interest rates leads to increases in the carrying amount of noncurrent provisions.
See Note 13
Pensions and similar obligations are accounted for in accordance with actuarial valuations, which are based on statistical and other factors in order to anticipate future events. The factors in question include the discount rate, expected salary and pension increases, the mortality rate and rate increases for preventive health care. If market and economic conditions change, these assumptions could vary considerably from actual developments, consequently leading to major changes in pension and similar obligations, as well as in associated future expenses. In particular, the current environment of low interest rates has an impact on the carrying amount of pension provisions.
See Note 12
The pension-obligation amount is determined by discount-ing the WACKER-specific, expected future cash flows. The discount rate is derived from the yield curve of high-grade, fixed-interest corporate bonds with maturities matching the pension obligations, as calculated at the reporting date. The bonds are all denominated in the same currency as their underlying pension obligations and have a rating of at least AA from one of the three major rating agencies. In Germany, the basis is a bond portfolio determined as of the closing date using Bloomberg and with a maturity that nearly matches the maturity of the pension obligation.
Tax provisions contain uncertain tax positions for cases where it might not be possible to realize amounts stated in tax returns. These are determined on the basis of past experience of external audits, with consideration given to the probability of occurrence (expected-value method).
Deferred TaxesAt the end of each reporting period, the Group assesses whether the probability of future tax benefits being realized is sufficient to recognize deferred tax assets. Among other things, this requires that management evaluate the tax benefits resulting from currently available tax strategies and future taxable income, and also to take additional positive and negative factors into account. In the case of compa-nies that have reported tax losses in the past, deferred tax assets are capitalized only in exceptional cases where there are substantive indications that they can be realized.
Accounting and Valuation PrinciplesThe financial statements of Wacker Chemie AG and its German and international subsidiaries are prepared in accordance with uniform accounting and valuation prin-ciples.
The accounting methods correspond to those used for the last consolidated financial statements as of the end of the previous fiscal year. They have been supplemented by new accounting standards to be applied for the first time in the reporting year. The Group’s consolidated financial statements are based on acquisition and production costs (historical costs), with the exception of items measured at fair value, which include financial assets measured at fair value, derivatives, and plan assets within the scope of pension obligations.
SalesSales comprise revenue from contracts with customers and from other sources. The consideration expected to be received in exchange for transferring goods or services to a customer in the ordinary course of business is reported as revenue from contracts with customers. Revenue is recognized when a performance obligation has been satisfied and the customer has obtained control of the good or service. This can occur either over a period of time or at a point in time and involves a five-step system. First, a contract with a customer and its performance obligations are identified. Then, the transaction price is determined and allocated. Revenue must be recognized for each individual performance obligation when the customer obtains control of the good or service. In certain transport clauses, trans-port costs represent a separate performance obligation since the freight/transport performance is not concluded until control has been transferred to the customer. Revenue
125
Consolidated Financial Statements – Notes of the WACKER Group
Wacker Chemie AG – Annual Report 2018

recognition usually takes place when the goods are trans-ferred to the customer or as stipulated in the agreed trans-port terms. Certain revenues from services are generated over a period of time, in which services are rendered and documented based on contractual milestones. Revenue recognition takes place when a milestone is completed, at which point the right to payment arises.
Other revenue concerns the proceeds of sales that are not from contracts with customers and are recognized at the fair value of the consideration received or receivable for the goods or services sold.
Such revenue is reported net of VAT and other taxes incurred in connection with the sales and after accounting for discounts and price reductions. Sales are not reported if there are risks attached to the receipt of the consideration. Provisions are recognized for risks from returns of finished goods and merchandise, warranties and other complaints using the principle of individual evaluation.
When a contracting party (customer or supplier) has fulfilled its contractual obligations, an entity must present the contract as a contract asset or contract liability depending on whether the entity has completed performance or the customer has made payment. An entity must show every unconditional right to receive consideration separately as a receivable. WACKER currently recognizes only contract liabilities in the statement of financial position. These liabilities include advance payments made by customers for polysilicon deliveries and advance payments by WACKER BIOSLOUTIONS customers. Customer-specific discount accru-als are similarly reported as contract liabilities. Discount accruals are contractually agreed discounts, granted when certain thresholds are exceeded, that reduce sales in the current period. These accruals are estimated on the basis of past experience and usually settled in the following period at the latest. Contract assets representing services not charged existed at WACKER BIOSOLUTIONS to an immaterial extent as of the reporting date. WACKER continues to report these contract assets as inventory and explains them in the Notes. The services in question fall due in the short term.
Information on sales performance by division and region is provided in the Segment Reporting section and in these Notes, which provide breakdowns by segment and by region, as well as by recognition in a time period or at a point in time.
In the comparative period, revenue was recognized at the fair value of the consideration received or receivable for the sale of goods or services. Revenue was recognized when the goods and services owed had been delivered and the main opportunities and risks of ownership had passed to the purchaser. WACKER had not conducted any business that required recognizing sales as long-term production contracts.
Functional CostsCost of goods sold shows the costs of the products, merchandise and services sold. In addition to directly attributable costs, such as material costs, personnel expenses and energy costs, it includes indirect costs such as depreciation and inventory write-downs. This item also includes the cost of outward freight. Selling expenses include costs incurred by the sales organization as well as the cost of advertising and market research. This item also includes commission expenses. General administrative expenses include the pro rata payroll and material costs of corporate control functions, human resources, accounting and information technology, unless they have been charged as an internal service to other cost centers and thus, in certain circumstances, to other functional areas.
Research and Development ExpensesResearch and development expenses include costs incurred in the development of products and processes. Research costs in the narrow sense are recognized as expenses when they are incurred, and are not capitalized. Development costs are capitalized only if all the prescribed recognition criteria have been met, the research phase can be separated clearly from the development phase, and the costs incurred can be allocated to the individual project phases without any overlaps. Additionally, there must be sufficient certainty that future cash inflows will take place.
Income TaxesIncome taxes include all domestic (German) and inter-national taxes that are based on taxable earnings. They include both current income taxes and deferred taxes. Current income taxes are calculated based on the taxable results and applicable tax regulations in each country in the reporting year. These taxes also contain adjustment amounts for any incurred tax payments or tax refunds from outstanding tax returns and from tax audits from prior years.
126
Consolidated Financial Statements – Notes of the WACKER Group
Wacker Chemie AG – Annual Report 2018

Tax provisions are established to cover cases in which it might not be possible to realize the amounts stated in tax returns (uncertain tax positions). The amount of these provisions is determined using the best estimate of the most probable tax payment.
Deferred tax assets and liabilities are recognized for temporary differences between tax bases and carrying amounts, and for consolidation measures recognized in the statement of income. The deferred tax assets include tax relief entitlements resulting from the anticipated use of existing loss carryforwards in future years, the realization of which is sufficiently probable. Deferred taxes are deter-mined on the basis of the tax rates which, under current law, will be applicable or are anticipated in the individual countries when they are realized. The deferred tax assets and liabilities are netted out only to the extent possible under the same tax authority. Deferred tax assets and liabilities are recognized in the statement of income. In cases where profits or losses are recognized directly in equity, the deferred tax asset or liability is likewise posted under other equity items.
Intangible AssetsPursuant to IAS 38, acquired and internally generated intangible assets are capitalized if it is probable that a future economic benefit can be associated with the use of the asset and the costs of the asset can be determined reliably. They are measured at cost and, if their useful lives can be determined, amortized on a straight-line basis. The useful life is taken to be between 3 and 15 years unless otherwise indicated, e. g. by the life of a patent. The useful life is reviewed annually and, if necessary, revised to cor-respond to new expectations. Amortization of intangible assets is allocated to the functional areas that use the assets. Intangible assets with indefinite useful lives undergo an annual impairment test. At present, no intangible assets with indefinite useful lives have been capitalized.
Goodwill is not amortized. Existing goodwill undergoes an annual impairment test. If the impairment test indicates a recoverable amount that is lower than the carrying amount, the goodwill is reduced to its recoverable amount and an impairment loss is recognized. If events or circumstances indicate possible impairment, the intrinsic value is also examined. Impairments of goodwill are presented under other operating expenses.
Property, Plant and EquipmentProperty, plant and equipment is capitalized at cost and depreciated on a straight-line basis over its expected economic life. The useful life is reviewed annually and, if necessary, revised to correspond to expectations. In addition to the purchase price, acquisition costs include incidental acquisition costs as well as any costs incurred in the demolition, dismantling and/or removal of the asset in question from its site, and in the restoration of that site. Any reductions in the price of acquisition reduce the acquisition costs. The cost of internally generated assets includes all costs directly attributable to the production process as well as an appropriate portion of the production-related overheads. Financing costs that were incurred in connec-tion with particular qualifying assets and which can be attributed directly or indirectly to them are capitalized as part of acquisition or production costs until the assets are used for the first time.
Day-to-day maintenance and repair costs are expensed as incurred. Costs for replacing parts or carrying out major overhauls of property, plant and equipment are capitalized if future economic benefits are likely to accrue to the Group and if the costs can be measured reliably.
Grants from third parties reduce acquisition and production costs. Unless otherwise indicated, these grants ( investment subsidies) are provided by government bodies. Income grants for which there are no future expenses are recog-nized as income. Until the funds have been received, grants are recognized as separate assets.
If property, plant and equipment is permanently shut down, sold or given up, the acquisition or production costs are derecognized, along with the corresponding accumulated depreciation. Any resulting gain or loss from the difference between the sale proceeds and the residual carrying amount is recognized under other operating income or expenses.
Property, plant and equipment also includes assets relating to leasing transactions. Items of property, plant and equipment financed by means of finance leases are recognized at fair value at their time of addition, unless the present values of the minimum lease payments are lower. The assets are depreciated on a straight-line basis over the expected useful life, or the contractual term if shorter.
127
Consolidated Financial Statements – Notes of the WACKER Group
Wacker Chemie AG – Annual Report 2018

The obligations resulting from future lease payments are recognized under financial liabilities. The lease installments to be paid are split up into a redemption component and an interest component, in accordance with the effective interest method.
Depreciation of property, plant and equipment is generally based on the following useful lives:
An impairment test is carried out when relevant events or changes in circumstances indicate that it might no longer be possible to realize the net carrying amount of intangible assets, or property, plant and equipment. At the end of every reporting period, WACKER checks whether there are triggering events for recognizing (or reversing) impairments. An impairment loss is then recognized in the amount by which the carrying amount exceeds the recoverable amount. The recoverable amount is the higher of either the fair value less costs to sell or the value in use. The value in use results from the present value of the estimated future cash flows from the use of the asset. In order to assess this value, pre-tax interest rates are used that have been adjusted to reflect the segment-specific risk. In order to determine the cash flow, assets are combined at the lowest level for which cash inflows can be identified separately (cash-generating units). If the reasons for recognizing impairments no longer exist, impairment losses are reversed as required. The revised amount cannot exceed the carrying amount that would have been determined had no impairment loss been recognized. Impairments are reported under other operating expenses and reversals of impairment losses under other operating income.
Investment PropertyLike property, plant and equipment, investment property is measured in accordance with the cost model. It consists of land and buildings that are held to earn rental income or for capital appreciation. The fair value of this property is regularly measured through external property valuations.
LeasesLeasing transactions are classified either as finance leases or as operating leases. Assets used under operating leases are not capitalized. Lease payments to be made are recog-nized in profit or loss in the period in which they fall due. A finance lease is a leasing arrangement in which essentially all of the risks and rewards inherent in the ownership of the property are transferred to the lessee. Assets used under finance leases are recognized at the present value of the minimum lease payments. Leases can be embedded within other contracts. Where IFRS stipulates separation of the embedded leasing arrangement, the contractual components are recognized and measured separately in accordance with the respective rules.
Investments, Associates and Joint VenturesShares in non-consolidated affiliated companies and invest-ments are measured at cost, unless divergent market values are available. Changes in market values are recognized in the consolidated statement of income upon realization through disposal or if the market value falls below the acquisition cost. Loans granted are measured at amortized cost, except for non-interest-bearing and low-interest loans, which are recognized at their present value.
Investments in joint ventures and associates are accounted for using the equity method, with the carrying amount generally reflecting the Group’s pro rata share of equity. Pro rata net profits and losses are recognized in the con-solidated statement of income, and the carrying amount is increased or decreased accordingly. Any changes in equity recognized directly in the investee’s equity are also recognized directly in equity in the consolidated financial statements. Dividends paid by joint ventures and associates reduce their equity and are therefore deducted from the carrying amount without affecting profit. If a joint venture or associate faces losses that have exhausted its equity, no further losses are taken into account unless there are noncurrent unsecured receivables against the company, or the Group has entered into additional obligations or made payments for the company. The carrying amount is not increased until the loss carryforward has been compen-sated for and the equity is positive again.
Additionally, an impairment test is carried out in the pres-ence of corresponding indications and, where necessary, an impairment loss is recognized. The recoverable amount is determined in accordance with IAS 36 regulations. Impair-ment losses are reported in the result from investments in joint ventures and associates.
In years Useful life
Production buildings
Other buildings and similar rights
Technical equipment and machinery
Motor vehicles
Factory and office equipment
10 to 40
10 to 30
6 to 12
4 to 10
3 to 12
128
Consolidated Financial Statements – Notes of the WACKER Group
Wacker Chemie AG – Annual Report 2018

Financial InstrumentsFinancial assets and liabilities are recognized in the consolidated financial statements when WACKER becomes a contracting party to the financial instrument. They are derecognized when the contractual rights or liabilities are fulfilled or rescinded or when they expire.
In the case of normal market purchases or sales, however, the settlement date – i. e. the date on which the asset is delivered to or by WACKER – is relevant for initial recognition and derecognition. In general, financial assets and financial liabilities are not netted. A net amount is presented in the statement of financial position if, and only if, the entity currently has a right to net the recognized amounts and intends to settle on a net basis. Where financial instruments are combined, liability and equity components are split up and presented separately by the issuer.
Financial instruments are measured at fair value on initial recognition. The transaction costs directly attributable to the acquisition must be taken into account for all financial assets and liabilities not subsequently measured at fair value through profit or loss. The fair values recognized in the statement of financial position generally correspond to the market prices of the financial assets and liabilities. If these are not directly available, they are calculated using standard valuation models on the basis of current market parameters.
Financial assets at WACKER include, in particular, cash and cash equivalents, trade receivables and derivatives, as well as financial assets that are held to collect and financial assets that are held for trading. Financial liabilities must generally be settled using cash or another financial asset. Financial liabilities include, in particular, the Group’s own bonds and other securitized liabilities, trade payables, lia-bilities to banks, finance lease liabilities, promissory notes (German Schuldscheine) and derivative financial liabilities.
WACKER does not use the option to measure financial assets and liabilities at fair value through profit or loss on initial recognition (fair value option).
Subsequent measurement of financial assets and financial liabilities in 2018 depends on the measurement categories of IFRS 9.
IFRS 9 stipulates that each financial asset must be classified and measured on the basis of the entity’s business model for managing financial assets and the asset’s contractual cash flow characteristics. On initial recognition, each financial asset is classified as measured either at fair value through profit or loss (FVPL), at amortized cost, or at fair value through other comprehensive income (FVOCI). The classification and measurement of financial liabilities remain largely unchanged under IFRS 9.
The “held to collect” and “held to collect and sell” business models both require that the cash flows from the financial instrument be solely payments of principal and interest (SPPI). Subject to the use of the fair value option, which is still available under certain circumstances, instruments that satisfy the SPPI test are measured at amortized cost in the “held to collect” business model, and at fair value through other comprehensive income in the “held to collect and sell” business model. Financial instruments that fail the SPPI test are measured at fair value through profit or loss and classified under the “trading” business model. IFRS 9 provides for an exception for interests that are not held for trading, such as company stock. Since they do not meet the SPPI test criteria, equity instruments must be measured at fair value, but upon initial recognition there is an irrevocable election to present subsequent changes in fair value in other comprehensive income. WACKER currently makes no use of this election.
At WACKER, trade receivables, as well as other financial receivables, fixed-term deposits, cash and cash equiva-lents, are assigned to the “held to collect” business model and measured at amortized cost. If it is both intended and, in economic terms, to be expected with sufficient certainty that a financial instrument will be held to collect, the instrument in question is measured at amortized cost using the effective interest method.
Securities are measured at fair value, provided they meet the SPPI criteria, with changes in fair value recognized in other comprehensive income (FVOCI). This concerns debt instruments held to collect. After adjusting for deferred taxes, unrealized gains and losses are recognized in other equity items. With derecognition of the financial instruments, the cumulative gains and losses recognized in equity are recognized in profit and loss.
129
Consolidated Financial Statements – Notes of the WACKER Group
Wacker Chemie AG – Annual Report 2018

As they generate cash flows from dividends and other distributions and thus do not satisfy the SPPI criterion, fund shares and investments in equity instruments are assigned to the “trading” business model and measured at fair value through profit or loss. The investments in equity instruments in question primarily concern small, regional investments in non-profit organizations that operate infrastructure facilities. No fair value exists for these companies since no active market values are available. WACKER considers the historical cost of these equity instruments to be the best approximation of their fair value.
Derivative financial instruments do not fall into any meas-urement category: they are measured at fair value through profit or loss. If they are designated for strategic hedging relationships, they are accounted for directly in equity.
Primary financial liabilities are subsequently measured at amortized cost using the effective interest method.
For the previous year, financial instruments were classified into the following categories as per IAS 39:Financial instruments can be “held for trading” or “held to maturity” and assigned to the “available for sale” or the “loans and receivables” category.
Financial instruments held for trading are measured at fair value through profit or loss. This category also includes all derivative financial instruments that do not qualify for hedge accounting.
If it is both intended and, in economic terms, to be expected with sufficient certainty that a financial instrument will be held to maturity, the instrument in question is measured at amortized cost using the effective interest method. Held-to-maturity financial investments include current and noncurrent securities, and components of items reported under other financial assets.
Loans and receivables are non-derivative financial assets that are not quoted in an active market. They are measured at amortized cost using the effective interest method. This category comprises trade receivables, the receivables and loans included in other financial assets, fixed-term deposits and cash and cash equivalents.
All other primary financial assets that are not loans or receivables are classified as available for sale and reported at fair value if it can be determined reliably. Basically, these assets comprise equity instruments, and also debt instruments not being held to maturity. After adjusting for deferred taxes, unrealized gains and losses are recognized in other equity items. If equity instruments have no price quoted on an active market and if their fair value cannot be determined reliably, they are measured at cost.
If the fair value of available-for-sale financial assets falls below the acquisition costs or there are objective signs that an asset’s value has been impaired, the cumulative loss recognized directly in equity is reversed and shown in the statement of income. The company bases its assessment of possible impairments on all available information, such as market conditions and prices, investment-specific factors, and the duration and extent of the drop in value below acquisition costs. Impairments affecting a debt instrument are reversed in subsequent periods, provided that the reasons for the impairment no longer apply. When the financial instruments are disposed of, the cumulative gains and losses recognized in equity are included in the statement of income.
Primary financial liabilities are subsequently measured at amortized cost using the effective interest method.
Impairment of Financial AssetsIFRS 9 stipulates that trade receivables and other financial assets must generally be recognized at amortized cost, except for derivative financial instruments. Securities are measured at fair value either through other comprehensive income or through profit or loss. Risk provisioning takes place in the form of impairments. Impairments for losses of receivables are recognized on initial recognition of the financial assets on the basis of the potential losses expected at that point in time. If the credit risk is not significantly higher on the reporting date than it was on initial recognition, WACKER recognizes a loss allowance in the amount of the 12-month expected credit losses (Level 1) – meaning the credit losses that can be expected to arise from possible default events within the next 12 months. IFRS 9 requires recognition of a loss allowance in the amount of the default of receivables expected over the
130
Consolidated Financial Statements – Notes of the WACKER Group
Wacker Chemie AG – Annual Report 2018

full remaining term to maturity for those financial assets whose credit risk has become significantly higher (Level 2) and of assets that are defaulted as of the reporting date (Level 3). WACKER considers the credit risk to have become significantly higher if the counterparty’s credit rating has been downgraded substantially and the receivable is more than 30 days past due. The main indicators WACKER uses to determine whether an asset has become defaulted (Level 3) are insolvency, internal dunning level 4 and more than 90 days past due. Regardless of this, each case must be assessed individually in line with the credit management process. In this process, the assets – particularly trade receivables – are assigned to internally defined risk classes. The internal credit classes contain forward-looking infor-mation and take account of both macroeconomic factors and payment behavior history.
WACKER applies the simplified approach when calculating impairments of trade receivables. Under this approach, the loss allowance is determined immediately upon origination on the basis of the lifetime expected credit losses. Further changes in the credit risk (expected credit loss, ECL) do not need to be tracked. The expected credit losses are determined using a provision matrix, which defines fixed default rates per past-due category on the basis of the risk classes of the past-due receivables.
The lifetime expected credit losses reflect all possible default events that could occur until the expected maturity of the financial asset. WACKER determines the expected credit loss by taking into account the entire contractual period during which the Group is exposed to the credit risk.
WACKER applies three key parameters to assess the expected credit loss for noncurrent and current interest- bearing receivables ( loans and fixed-interest securities): the probability of default (PD), the loss given default rate (LGD) and the estimated exposure at default (EAD). In the case of loans and fixed-interest securities, WACKER determines a loss allowance equivalent to the 12-month expected credit losses, as the former are financial instruments with a low credit risk.
A financial asset is derecognized if the company no longer has any expectation of receiving the corresponding out-standing cash flow. Before a receivable is derecognized,
a special assessment of the individual case is carried out. That includes offsetting recognized loss allowances against the gross value of the receivable – and thus utilizing – any impairments recognized. Expenses for expected impair-ments are recognized in other operating income.
In the previous year, trade receivables and other financial and non-financial assets, including income taxes paid (but excluding financial derivatives), were recognized at amortized cost as per IAS 39. Risks are taken into account by means of appropriate valuation allowances in separate valuation-allowance accounts. Valuation allowances for uninsured receivables – or for the deductible in the case of insured receivables – are made whenever collection of such receivables is assessed to be no longer probable according to the information available.
If payment of a receivable is no longer expected in the actual and legal circumstances, the gross receivable is derecognized and any valuation allowances made are reversed. Expenses from allowances and derecognition are reported under other operating expenses. Changes in income tax receivables are posted under income taxes in the statement of income. Noncurrent receivables that are non-interest-bearing or low-interest-bearing are discounted. WACKER is not a contractor for long-term production orders.
Cash and cash equivalents comprise cash in hand, demand deposits, and financial assets that can be converted into cash at any time, are subject to only slight fluctuations in value and have a residual term of up to three months. They are measured at amortized cost, which is equivalent to their nominal values.
The general impairment model is applied to demand depos-its and fixed-term deposits. These are classified as financial instruments with a low credit risk, given that WACKER enters into banking relationships only with investment-grade counterparties. In the case of banks covered by Germany’s Deposit Protection Fund, no impairments are determined as the deposits are secured via the Fund. Any impairments that arise are negligible.
If the contractual conditions of an asset are modified and the modification does not result in its derecognition under IFRS 9, a gain or loss is recognized in the income statement.
131
Consolidated Financial Statements – Notes of the WACKER Group
Wacker Chemie AG – Annual Report 2018

The amount recognized is the difference between the original contractual cash flows and the modified cash flows (both discounted using the original effective interest rate). For WACKER, however, modifications of this kind are exceptional, and none has arisen to date.
A financial asset is considered impaired on purchase or origination if there is objective evidence of such an impair-ment on initial recognition. Defaulted assets of this kind are classified as purchased or credit-impaired (POCI) and are initially recognized at fair value (generally the purchase price, taking lifetime expected losses into account). WACKER does not have any receivables of this kind.
Derivative Financial InstrumentsDerivative financial instruments are only used for hedging purposes with the sole aim of reducing the Group’s exposure to foreign-exchange rates, interest rates, and commodity-price risks arising from operating activities and the resulting financing requirements. Derivative financial instruments are recognized as of the trade date. They are always recognized at fair value, irrespective of the purpose or intention for which they were concluded. Positive fair values are recognized as receivables and negative fair values as liabilities. Differences resulting from fair value measurement are recognized in profit or loss outside of hedge accounting.
Where derivative financial instruments are used to hedge risks stemming from future cash flows and items in the statement of financial position, WACKER applies hedge accounting in accordance with the requirements of IAS 39. Changes in the market values of financial instruments used to hedge risks stemming from cash flows (cash flow hedges) are recognized in other equity items, taking deferred taxes into account, until the hedged item has been realized. The profit contribution of the hedging transaction is recognized in the statement of income under other operating income and expenses when the hedged item is realized. If such a derivative is sold or the hedging relationship is discontin-ued, the change in its value continues to be recognized in other equity items until the underlying transaction occurs. Ineffective parts of the hedging transaction are recognized immediately in profit or loss. Fair value hedges of recognized assets or liabilities and /or unrecognized fixed
contractual obligations entail the recognition in profit or loss of market value changes for both the hedged item and the financial derivative (as the hedging instrument). At the moment, WACKER does not hedge any net investments in foreign operations.
Contracts concluded for the purpose of receiving or delivering non-financial goods according to WACKER’s own needs are not recognized as derivatives, but rather as pending transactions.
Currency hedges for planned sales are recognized under other operating income and expenses, while interest rate hedges are recognized in net interest income. Currency hedges from intra-Group financing and foreign-exchange derivatives concluded to hedge external financial liabilities in foreign currencies are shown under other financial result. Changes in the fair value of raw-material hedges are rec-ognized under cost of goods sold.
InventoriesInventories are measured at cost using the average cost method. Lower net realizable values or prices as of the reporting date are taken into account by writing down inventories to the fair value less costs to sell. The cost of goods sold includes directly attributable costs, appro-priate portions of indirect material and labor costs, and straight-line depreciation. Due to the relatively short-term nature of the production processes, financing costs are not included. For production-related reasons specific to the chemical industry, unfinished and finished goods are reported together. Raw materials and supplies also include spare parts for the day-to-day maintenance of production facilities. They are measured according to their periods of storage and potential usability.
Emissions certificates allotted free of charge are measured at a nominal value of zero. Emissions allowances acquired against payment are carried at cost. If the fair value is lower as of the reporting date, the carrying amount is reduced accordingly. Utilization is determined via the running aver-age value of certificates, whether they were allotted free of charge or acquired against payment, and recognized pro rata as expenses under cost of goods sold on the basis of the quarterly emissions.
132
Consolidated Financial Statements – Notes of the WACKER Group
Wacker Chemie AG – Annual Report 2018

Income Tax Receivables and Other Non-Financial AssetsIncome tax receivables and other non-financial assets are recognized at amortized cost. Changes in income tax receivables are posted under income taxes in the statement of income. Noncurrent receivables that are non-interest- bearing or low-interest-bearing are discounted.
Provisions for Pensions and Similar ObligationsDefined-benefit pension commitments are measured in accordance with the projected unit credit method. This method takes account not only of pensions and entitle-ments to future pensions known as of the reporting date, but also of estimated increases in salaries and pensions. Moreover, the measurement is based on actuarial valuations and takes account of biometric and financial calculation principles. The fair value of the plan assets is subtracted from the present value of the pension obligations (defined benefit obligation, DBO), resulting in either a net liability or net assets of the defined benefit plans. The prior year’s underlying DBO assumptions are used to determine the current service cost. The net interest cost in the fiscal year is determined by applying the discount rate set at the beginning of the year to the net liability calculated at the same time. The net interest from the net pension liability is the difference between the calculated interest income from plan assets and the interest expense from the defined benefit obligation.
Remeasurements comprise actuarial gains and losses stemming from the difference between the estimate at the start of the period and actual developments during the period – or a newer estimate on the reporting date – in relation to probable mortality rates, retirement and salary trends, and discount rates. They are recognized directly in other comprehensive income. Similarly, differences between the interest income from plan assets calculated at the start of the period and the actual income from plan assets determined at the end of the period are recognized in other comprehensive income.
If the present value of a defined benefit obligation changes due to a plan modification or curtailment, WACKER rec-ognizes the resulting effect as past service cost. This is recognized in profit or loss as soon as it occurs. The profits and losses resulting from settlement are also recognized
in the statement of income as soon as settlement takes place. Administrative expenses that are not related to the management of plan assets are also recognized through profit or loss when incurred.
The expense from current and past service cost is allocated to the costs of the functional areas concerned. The net interest is shown under other financial result.
Provisions for phased early retirement and anniversaries are measured and recognized in accordance with actuarial appraisals. Owing to their structure, provisions for phased early retirement also constitute other noncurrent employee benefits in accordance with IAS 19 since they are linked to the rendering of future service. WACKER uses only a block model when structuring phased-early-retirement agreements. The corresponding provisions are recognized pro rata over the service period of the claim during the work phase.
ProvisionsProvisions are recognized in the statement of financial posi-tion for present legal or constructive obligations toward third parties if an outflow of resources to settle these obligations is probable and its amount can be estimated reliably. The amounts recognized are those estimated to be required to cover the Group’s future payment obliga-tions, identifiable risks and contingencies. Noncurrent provisions are measured at the discounted present value as of the reporting date. The discount rate applied is the market interest rate for risk-free investments with terms corresponding to the residual term of the obligation to be settled. Expected refunds, provided that they are suffi-ciently secure or legally enforceable, are not offset against provisions. Instead, they are capitalized as separate assets if their realization is virtually certain.
Provisions for restructuring costs are recognized if a detailed formal plan for restructuring has been drawn up and conveyed to the affected parties. Provisions for contingent losses arising from onerous contracts are recognized if the expected benefits to be derived from a contract are lower than the unavoidable costs of meeting the contractual obligations. Provisions for environmental protection are recognized if the future cash outflows for complying with environmental legislation or for cleanup
133
Consolidated Financial Statements – Notes of the WACKER Group
Wacker Chemie AG – Annual Report 2018

measures are likely, the costs can be estimated with sufficient accuracy and no future acquired benefit can be expected from the measures.
If an amended estimate results in a reduction in the scope of the obligations, a proportion of the provision is reversed and the earnings are allocated to the functional area originally charged with the expense when the provision was recognized.
Financial Liabilities and Other Financial LiabilitiesOn initial recognition, primary financial liabilities are meas-ured at fair value less any transaction costs incurred. They are subsequently measured at amortized cost using the effective interest method. Derivative financial instruments are recognized at fair value. Liabilities from finance lease agreements are shown as financial liabilities at the present value of the future lease installments.
Contingent Liabilities / Contingent AssetsContingent liabilities are potential obligations toward third parties or existing obligations for which an outflow of resources is unlikely or the amount of the obligation cannot be estimated with sufficient certainty. Contingent liabilities are not recognized in the statement of financial position.
Contingent assets are potential assets resulting from past events and whose existence will not be confirmed until the occurrence of one or more uncertain future events that are beyond the Group’s influence.
Changes in Accounting and Valuation MethodsOn September 5, 2018, the Accounting Standards Committee of Germany adopted ASCG Interpretation 4 ( IFRS), which stipulates that provisions established for the tax territory of Germany for interest and penalties related to income taxes is no longer to be presented as tax provisions, but as other provisions. This relates, among other things, to expected interest on uncertain tax positions, which may no longer be reported as income tax expense, and must instead be shown under other financial result. Accordingly, effective December 31, 2017, WACKER reclassified € 9.8 million in current tax provisions and € 1.5 million in noncurrent tax provisions to other provisions. In the statement of income, € 7.6 million was reclassified from income taxes to other financial result in 2017.
01 Revenue from Contracts with CustomersRevenues from sales comprise those from contracts with customers and those from other sources:
In principle, WACKER recognizes sales at a point in time. WACKER’s customary business model is to sell chemical products on the basis of binding individual orders from customers with or without framework agreements. Cus-tomer orders usually result in one specific performance obligation, which is to be satisfied at a certain point in time. Revenue is recognized when economic control has been transferred to the customer in accordance with Incoterms. WACKER POLYSILICON also has medium- and long-term sup-ply contracts for predefined purchase quantities. Revenues are recognized at a point in time here, too.
In the case of customer-specific orders at WACKER BIOSOLUTIONS, sales are recognized over time. The business model entails providing development services to the pharmaceutical industry under service contracts that are fulfilled and documented using milestones. The right to payment arises when a milestone is achieved. The Group also manufactures customer-specific products in connection with supply contracts for drug-related intermediates. The right to payment in this case arises on acceptance by the customer. In certain cases, customers effect payment before a product is delivered or provision of a service commences. WACKER BIOSOLUTIONS also concludes medium- term contracts.
Breakdown of Revenues
€ million 2018 2017
Revenues from contracts with customersProceeds from deliveries of products and merchandise
Proceeds from other services
Total revenues from contracts with customers
Other revenues
Total revenues
4,847.2 4,788.4
125.6 129.7
4,972.8 4,918.1
6.0 6.1
4,978.8 4,924.2
134
Consolidated Financial Statements – Notes of the WACKER Group
Wacker Chemie AG – Annual Report 2018

No long-term payment terms exist that could qualify as a financing component. As a general rule, the right to pay-ment falls due within 30 days. Deliveries to customers with poor credit ratings are contingent upon advance payment or provision of a bank guarantee. The statutory warranty obligations for quality defects apply at WACKER, and exact specifications are defined in framework agreements with customers.
Services are mainly posted under the segment “other” and comprise the supply of media to, and the administration of, chemical- industry parks on behalf of third-party companies, particularly at the site in Burghausen, Germany. Sales of salt
and lye are another component of the revenues recognized under other. For both media supply and deliveries of salt and lye, revenues are recognized at a point in time. Revenue recognition takes place at the time of delivery.
At WACKER, the sales revenue per segment corresponds to the Group’s different product categories. The differences between chemical products, and also between market and customer groups, are evident in the segments. The particular region to which WACKER supplies its products also has a major impact on revenue.
The following table shows the breakdown of revenues:
Trade receivables consist entirely of receivables from contracts with customers. See Note No. 9. At WACKER BIOSOLUTIONS, service contracts with the pharmaceutical industry result in only an insignificant amount of con-tract assets representing services not charged. WACKER continues to recognize these under inventories. As of the reporting date, these assets amounted to € 1.4 million and concern services that fall due in the short term.
The contract liabilities recognized by WACKER in its statement of financial position include advance payments
by customers for polysilicon deliveries and by WACKER BIOSOLUTIONS customers. Upon individual delivery to the customer, a specified share of advance payments received by WACKER POLYSILICON is recognized as revenue, thereby reducing the liability. At WACKER BIOSOLUTIONS, customer advance payments are recognized upon the achievement of designated milestones. Advance payments received mainly concern those by customers for polysilicon deliveries taking place over periods of up to 6 years. The major changes result from the reduction of advance payments for polysilicon deliveries.
Breakdown of Revenues
€ million WACKER SILICONES
WACKER POLYMERS
WACKER BIOSOLUTIONS
WACKER POLYSILICON
Other / consolidation
Total
2018 2017 2018 2017 2018 2017 2018 2017 2018 2017 2018 2017
Revenue by RegionEurope
The Americas
Asia
Other regions
Total
Of which revenues outside the scope of IFRS 15
Time of revenue recognitionPoint in time
Over time
Total
1,160.3 1,038.4 596.2 573.9 103.0 93.1 96.6 125.8 140.6 139.2 2,096.7 1,970.4
459.9 420.3 334.3 337.2 70.8 59.9 12.1 19.0 1.1 2.3 878.2 838.7
717.2 599.7 277.9 257.4 42.6 42.4 714.4 979.2 4.8 7.5 1,756.9 1,886.2
162.2 141.8 73.8 76.6 10.6 10.5 0.4 – – – 247.0 228.9
2,499.6 2,200.2 1,282.2 1,245.1 227.0 205.9 823.5 1,124.0 146.5 149.0 4,978.8 4,924.2
– – – – – – – – 6.0 6.1 6.0 6.1
2,499.6 2,200.2 1,282.2 1,245.1 185.0 173.4 823.5 1,124.0 146.5 149.0 4,936.8 4,891.7
– – – – 42.0 32.5 – – – – 42.0 32.5
2,499.6 2,200.2 1,282.2 1,245.1 227.0 205.9 823.5 1,124.0 146.5 149.0 4,978.8 4,924.2
135
Consolidated Financial Statements – Notes of the WACKER Group
Wacker Chemie AG – Annual Report 2018

Moreover, discount accruals that were included in other provisions in 2017 are now reported as contract liabilities. Discount accruals are contractually agreed discounts, granted when certain thresholds are exceeded, that reduce
sales in the current period. These accruals are estimated on the basis of past experience and usually settled in the following period at the latest.
Under multi-year framework agreements, WACKER guaran-tees some customers the availability of specific quantities per year. The actual quantities and prices are usually set for a maximum period of one year only and are agreed in detailed negotiations that take place during the year. Minimum purchase quantities result in future perfor mance obligations (orders on hand) with terms as shown in the following table:
€ million Orders on hand
Up to 2 years
Over 2 years to 3 years
Over 3 years to 4 years
Over 4 years to 5 years
Over more than 5 years
Total orders on hand
1,015.0
483.8
176.7
106.2
79.8
1,861.5
Development of Contract Liabilities
€ million Advance payments
received
Discount accruals
Total
As of Jan. 1, 2018
Revenues recognized as advance payments in prior period
Revenues less discounts
Reversals recognized in income
Cash receipts (+)
Revenues recognized in 2018 from cash receipts (–)
Cash payments (–)
Exchange-rate differences
Change in the scope of consolidation
As of Dec. 31, 2018
174.3 16.5 190.8
-42.9 - -42.9
- 13.8 13.8
-30.4 -2.2 -32.6
63.7 - 63.7
-28.8 - -28.8
- -13.2 -13.2
-0.1 0.2 0.1
- - -
135.8 15.1 150.9
136
Consolidated Financial Statements – Notes of the WACKER Group
Wacker Chemie AG – Annual Report 2018

02 Cost of Goods Sold / Other Operating Income / Other Operating Expenses
The business-interruption costs and production ramp-up costs at the Charleston, Tennessee site in 2018 were recognized under cost of goods sold.
03 Income from Investments in Joint Ventures and Associates / Other Investment Income / Net Interest Income / Other Financial Result
Income from investments in joint ventures and associates relates to the investments in Siltronic AG and in companies in China. This income includes not only the attributable net results for the year, but also the effects of the elimination of attributable interim profits and losses, of measurement gains and other Group adjustments.
Borrowing costs of € 2.2 million were capitalized in the reporting period, after € 1.3 million a year earlier, resulting in a corresponding improvement in the net interest result. The average borrowing interest rate applied by the Group in the reporting year was 2.0 percent, compared with 2.7 percent the year before.
The interest effect of interest-bearing provisions includes net interest expenses from the accumulation of interest on pension obligations and calculated returns from plan assets totaling € 33.2 million (versus € 32.5 million in the prior year) and interest expenses and interest income from the
€ million 2018 2017
Cost of goods sold
Cost of goods sold includes the following reversals (+) / recognitions (–) of valuation allowances of inventories
Other operating incomeIncome from currency transactions
Income from reversal of provisions
Insurance compensation
Income from reversal of valuation allowances for trade receivables
Income from disposal of property, plant and equipment and financial assets
Income from incentives /grants
Other operating income
Total
Other operating expensesLosses from currency transactions
Losses from valuation allowances for trade receivables
Losses from disposal of assets
Losses from impairment of fixed assets
Other operating expenses
Total
-4,104.1 -3,969.8
-91.3 14.1
41.3 30.9
7.2 9.8
2.3 1.0
0.1 1.3
0.9 3.0
0.9 5.2
43.3 33.0
96.0 84.2
-48.2 -40.6
-1.1 -0.9
-4.6 -6.0
-1.4 –
-29.7 -17.3
-85.0 -64.8
€ million 2018 2017
Result from investments in joint ventures and associates
Of which share of income from joint ventures
Of which share of income from associates
Other investment incomeOther investment expenses / investment income
Total
Net interest incomeInterest income
Of which from financial instruments (FVOCI)
Of which from financial instruments (amortized cost)
Interest expenses
Of which from financial liabilities (excluding finance leases)
Total
Other financial resultInterest effect of interest-bearing provisions / liabilities
Other financial expenses / income
Total
131.7 42.0
1.8 2.0
129.9 40.0
– 1.9
131.7 43.9
8.0 7.5
– –
8.0 7.5
-22.1 -38.3
-19.5 -35.0
-14.1 -30.8
-35.4 -38.6
-15.7 -26.9
-51.1 -65.5
137
Consolidated Financial Statements – Notes of the WACKER Group
Wacker Chemie AG – Annual Report 2018

accrual and discounting of provisions of € 2.3 million (versus € 6.1 million).
Other financial income and expenses primarily result from interest-rate effects in connection with financial transac-tions and their hedging, as well as expected interest on uncertain tax items.
04 Income TaxesThis item comprises income taxes paid or owed in the individual countries as well as deferred taxes. In Germany, in addition to a corporate tax of 15.0 percent (versus 15.0 percent a year earlier ), a solidarity surcharge of 5.5 percent applies (versus 5.5 percent). Trade income tax of 12.2 percent (versus 12.2 percent) must also be paid. It varies depending on the municipality in which a company is located.
Deferred taxes of German companies are therefore measured based on a total tax rate ( including solidarity surcharge) of 28.0 percent (versus 28.0 percent in the prior year). The current taxes of foreign subsidiaries are determined according to domestic tax laws and rates valid in the country in which the respective company is based. The respective current income tax rates applied in each country for our foreign companies ranged from 9.0 percent to 34.6 percent (versus 9.0 percent to 39.0 percent).
Deferred taxes on undistributed profits of subsidiaries were recognized only if distribution is planned. The amount of € 359.5 million is available for distribution, compared with € 297.7 million in the prior year.
Income taxes include current tax expenses of € 0.8 million from prior years (after € 18.2 million a year earlier ) and deferred tax income of € 0.0 million (after € 2.8 million).
One of the consequences of the interpretation of IFRS No. 4 adopted by ASCG on September 5, 2018, is that expected interest on uncertain tax positions is no longer reported under income tax expense, but rather under other financial result. The corresponding prior-year figures were adjusted accordingly. In 2017, current tax expenses were lower at € 7.6 million and reclassified to other financial result.
Due to the utilization of previously unrecognized temporary differences and previously unrecognized tax losses from earlier periods, the actual income tax expense was reduced by € 15.8 million in the prior year. Deferred tax income in the year under review contained an amount of € 7.6 million in previously unrecognized temporary differences and previously unrecognized tax losses from earlier periods.
Reconciliation of Actual Tax Result
€ million 2018 2017
Current taxes, Germany
Current taxes, international
Current taxes
Deferred taxes, Germany
Deferred taxes, international
Deferred taxes
Income taxes
Derivation of the effective tax rateIncome before taxes
Income tax rate for Wacker Chemie AG (%)
Expected tax expenses
Tax rate divergences
Tax effect of non-deductible expenses
Tax effect of tax-free income
Taxes relating to other periods (current earnings)
Effects of loss carryforwards and temporary differences
Group profit from investments in joint ventures and associates
Other differences
Total income tax
Effective tax rate (%)
-68.6 -108.2
-23.8 -10.3
-92.4 -118.5
25.8 29.1
2.3 12.1
28.1 41.2
-64.3 -77.3
324.4 327.4
28.0 28.0
-90.8 -91.7
-4.8 4.5
-31.4 -13.8
4.2 4.3
-0.8 -15.4
24.2 23.7
36.9 11.7
-1.8 -0.6
-64.3 -77.3
19.8 23.6
138
Consolidated Financial Statements – Notes of the WACKER Group
Wacker Chemie AG – Annual Report 2018

The changes in deferred tax assets and liabilities of € 28.1 million were recognized as income in the income statement (versus € 41.2 million a year earlier ), while € 40.6 million (versus € –33.4 million) was recognized directly in equity. This mainly consists of deferred tax assets from variations in actuarial gains and losses in relation to pension provisions. Changes in the scope of consolidation resulted in prior-year deferred tax assets of € 6.0 million that were disposed of and not recognized in the income statement, while prior-year disposals of deferred tax liabilities totaled € 2.5 million.
The existing tax loss carryforwards can be utilized as follows:
The total loss carryforwards generated amounted to € 62.1 million (versus € 106.0 million in the previous year). Of this amount, € 14.2 million (versus € 79.4 million) is expected to be non-realizable, which is why no deferred tax assets were recognized. If they had been recognized, however, they would have amounted to € 3.5 million (versus € 19.9 million). Of the loss carryforwards that are not realizable for tax pur-poses, the amount of € 6.7 million (€ 48.9 million) is unlimited as to time and amount. As of December 31, 2018, no deferred tax assets were recognized for tax-deductible temporary differences of € 191.7 million (€ 204.6 million).
Allocation of Deferred Taxes
€ million 2018 2017
Deferred tax assets
Deferred tax liabilities
Deferred tax assets
Deferred tax liabilities
Intangible assets
Property, plant and equipment
Financial assets
Sundry assets
Provisions for pensions
Other provisions
Liabilities
Loss carryforwards
Setting off for companies with group taxation
Total
Setoffs
Amount recorded in Statement of Financial Position
15.3 5.4 16.9 3.8
87.9 24.3 75.6 22.2
– 0.5 – 0.8
29.5 1.5 16.2 5.0
358.8 – 316.2 –
33.7 – 41.8 –
14.5 7.8 13.8 7.0
10.9 – 6.7 –
– – -3.4 -3.4
550.6 39.5 483.8 35.4
-29.7 -29.7 -31.2 -31.2
520.9 9.8 452.6 4.2
€ million 2018 2017
Within 1 year
Within 2 years
Within 3 years
Within 4 years
Within 5 years or later
Total
3.0 38.5
1.1 15.4
2.1 1.1
– 2.1
55.9 48.9
62.1 106.0
139
Consolidated Financial Statements – Notes of the WACKER Group
Wacker Chemie AG – Annual Report 2018

05 Intangible Assets and Property, Plant and Equipment
Intangible assets include industrial property rights, similar rights, software and other assets acquired against pay-ment. Acquisitions result in technologies, customer bases and order backlogs acquired against payment, which are amortized over a period of 3 to 9 years.
The acquisition costs of property, plant and equipment were reduced by investment grants totaling € 315.8 million (compared with € 313.7 million in the previous year).
In the reporting year, borrowing costs of € 2.2 million (€ 1.3 million in the prior year) were capitalized as part of the acquisition costs of qualifying assets. The average financing cost rate was 2.0 percent (2.7 percent a year earlier ). Property, plant and equipment also includes technical machinery and other equipment in the amount
of € 22.4 million (€ 26.8 million in the prior year) that underlie an embedded finance lease. Due to the structure of the underlying contracts, economic ownership is attributable to WACKER.
06 Investment PropertyWacker Chemie AG owns real estate at its production site in Cologne, Germany. This comprises land and infrastructure facilities (for energy, wastewater, etc.). The land is rented out or leased on a long-term basis. These properties and the associated infrastructure in Cologne are operated, maintained and looked after by third parties, who charge any costs incurred directly to the tenants or leaseholders. WACKER has undertaken to carry out future maintenance measures to the extent necessary in the next few years.
€ million Intangible assets
Land, buildings and similar rights
Technical equipment
and machinery*
Other equipment, factory and
office equipment
Assets under
construction
Property, plant and
equipment
*Of which assets from
finance leases
2018Balance as of Jan. 1, 2018
Additions
Disposals
Transfers
Changes in scope of consolidation
Exchange-rate differences
Gross carrying amount as of Dec. 31, 2018
Cumulative depreciation and impairments
Changes in the scope of consolidation
Carrying amount as of Dec. 31, 2018
Depreciation
2017Balance as of Jan. 1, 2017
Additions
Disposals
Transfers
Changes in scope of consolidation
Exchange-rate differences
Gross carrying amount as of Dec. 31, 2017
Cumulative depreciation and impairments
Changes in the scope of consolidation
Carrying amount as of Dec. 31, 2017
Depreciation
152.8 1,448.2 7,681.5 578.2 240.7 9,948.6 98.6
2.2 18.9 103.9 32.8 303.0 458.6 –
-3.1 -2.7 -53.3 -15.1 – -71.1 –
0.8 22.8 91.5 6.5 -121.7 -0.9 –
10.0 6.8 46.8 1.0 – 54.6 –
1.6 23.4 92.5 1.8 2.3 120.0 0.7
164.3 1,517.4 7,962.9 605.2 424.3 10,509.8 99.3
-126.0 -750.0 -5,734.8 -499.6 0.1 -6,984.3 -76.9
-1.2 -2.2 -32.7 -0.8 – -35.7 –
38.3 767.4 2,228.1 105.6 424.4 3,525.5 22.4
-13.4 -58.5 -434.9 -33.6 – -527.0 -4.9
205.3 2,265.7 10,336.5 691.5 174.0 13,467.7 101.2
10.6 11.5 91.9 25.3 206.9 335.6 –
-1.4 -2.1 -40.4 -22.8 -0.1 -65.4 –
1.6 5.5 58.3 20.5 -85.9 -1.6 0.3
-58.2 -753.9 -2,463.7 -130.6 -44.4 -3,392.6 –
-5.1 -78.5 -301.1 -5.7 -9.8 -395.1 -2.9
152.8 1,448.2 7,681.5 578.2 240.7 9,948.6 98.6
-111.3 -685.4 -5,284.2 -478.6 – -6,448.2 -71.8
53.0 532.5 2,224.4 122.3 0.1 2,879.3 –
41.5 762.8 2,397.3 99.6 240.7 3,500.4 26.8
-13.1 -66.3 -506.3 -34.0 – -606.6 -6.2
140
Consolidated Financial Statements – Notes of the WACKER Group
Wacker Chemie AG – Annual Report 2018

The rent and lease income is included in the following schedule.
The fair value is based on an opinion of an external expert and is updated periodically, most recently in 2018. From an economic standpoint, the only option open to a potential buyer would be to discontinue current operations and tear down the existing buildings to make the land available for a new use. The fair value was therefore determined using the market value based on potential proceeds from liquidation of the plant. This measurement took into account the current market situation and thus current prices. The measurement as fair value of investment property is allocated to Level 2 in the fair value hierarchy. The residual carrying amount relates to the land.
The valuation process has not been changed since the previous valuation date.
07 Investments in Joint Ventures and Associates Accounted for Using the Equity Method
The Group applies the equity method to account for joint ventures and associates. Since reduction of the company’s stake in Siltronic AG and deconsolidation of the latter as of March 15, 2017, the remaining share of 30.8 percent has been accounted for using the equity method. The Group considers its investment in Siltronic AG (and its subsidiaries) to be significant.
The Siltronic Group is one of the world’s leading producers of silicon wafers for the semiconductor industry. WACKER supplies Siltronic with polysilicon, the key base material for the production of silicon wafers.
Summarized Financial Information on Siltronic AG and Its Subsidiaries1 on a 100-Percent Basis:
€ million 2018 2017
Ownership interest (%)
Current assets
Noncurrent assets excluding goodwill
Current liabilities
Noncurrent liabilities
Net assets (100 percent)
Less share of non-controlling interests
Group’s share of net assets
Effects of consolidation
Goodwill
Carrying amount of share in associate
Sales 2
Group net income for the year 2
Other comprehensive income 2
Total 2
1
2
Consolidated financial statements of the Siltronic sub-group in accordance with IFRS Information based on figures for the period after March 15, 2017, due to first-time inclusion during the year
30.8 30.8
1,078.9 706.0
1,174.3 1,037.1
277.9 152.1
736.8 578.3
1,238.5 1,012.7
-41.2 -14.8
369.2 307.7
1.7 1.3
245.7 245.7
616.6 554.7
1,456.7 919.3
323.2 130.5
-48.3 -12.4
274.9 118.1
Significant Investments in Associates
Company’s name and registered office: Siltronic AG, Munich, Germany, and its subsidiaries
2018 2017
Ownership interest (%)
Proportion of voting rights (%)
Total non-controlling interests (shares)
Xetra closing price at year-end (€ )
Market capitalization of shares (€ million)
Dividends received (€ million)
30.83 30.83
30.83 30.83
9,250,000 9,250,000
72.20 121.30
667.9 1,122.0
23.1 –
€ million 2018 2017
Historical cost
Cumulative depreciation
Carrying amount as of Dec. 31, 2018
Fair value
Rental income
Costs
9.0 10.3
-7.5 -9.0
1.5 1.3
17.2 14.0
0.7 0.7
-0.2 -0.1
141
Consolidated Financial Statements – Notes of the WACKER Group
Wacker Chemie AG – Annual Report 2018

Taken individually, the remaining joint ventures and asso-ciates are immaterial for the Group’s earnings, net assets or financial position. The following table shows the reporting-period change in the total carrying amounts of investments:
If shareholders have granted loans to joint ventures or associates, the repayment of these generally takes priority over dividend distribution.
Deviations between the share of net income and the result from investments in joint ventures and associates, and between the share of equity and the carrying amount of investments in joint ventures and associates accounted for using the equity method, are primarily the result of fair value adjustments and consolidation measures.
In 2018, the carrying amount included the impairment loss reversal of the equity-accounted investment in the Chinese siloxane joint venture with DowDupont.
The following shows the key figures for companies accounted for using the equity method.
€ million 2018 2017
Total Attributable to WACKER
Total Attributable to WACKER
Key Figures for Joint VenturesProfit or loss from continuing operations
Other comprehensive income
Total
Key Figures for AssociatesProfit or loss from continuing operations
Other comprehensive income
Total
3.6 1.8 4.0 2.0
-0.2 -0.1 -1.2 -0.6
3.4 1.7 2.8 1.4
324.8 99.9 127.1 39.1
-47.9 -14.8 -35.9 -9.7
276.9 85.1 91.2 29.4
Summarized Pro Rata Financial Information for Associates That Are Immaterial Individually
€ million 2018 2017
Carrying amount of equity- accounted investments At the beginning of the year
Share of profit / loss for the period
Share of change in other equity
Overall result of the companies
Impairment loss reversal of equity-accounted investments
Loss in excess of investment as per IAS 28.38
At the end of the year
– –
0.4 0.3
0.1 -5.8
0.5 -5.5
29.6 –
– 5.5
30.1 –
Summarized Pro Rata Financial Information for Joint Ventures That Are Immaterial Individually
€ million 2018 2017
Carrying amount of equity- accounted investments At the beginning of the year
Share of profit / loss for the period
Share of change in other equity
Overall result of the companies
Dividends
Change in the scope of consolidation
At the end of the year
9.9 11.2
1.8 2.0
-0.1 -0.6
1.7 1.4
– -2.7
– –
11.6 9.9
Reconciliation of the Equity Carrying Amount
€ million 2018 2017
Carrying amount of equity- accounted investments At the beginning of the year
Share of profit / loss for the period
Other changes recognized in profit or loss
Change recognized in profit or loss
Dividends
Change in other equity
At the end of the year
554.7 518.6
99.5 38.7
0.4 1.3
99.9 40.0
-23.1 –
-14.9 -3.9
616.6 554.7
142
Consolidated Financial Statements – Notes of the WACKER Group
Wacker Chemie AG – Annual Report 2018

08 Inventories
Cost of goods sold includes inventories recognized as expenses totaling € 4.1 billion (after € 4.0 billion a year earlier). Valuation allowances recognized as expenses increased by € 91.3 million in the reporting period. In the previous year, there was an decrease of € –14.1 million.
09 Financial and Non-Financial Assets / Receivables
Trade receivables consist entirely of receivables from contracts with customers.
Insurance compensation of € 10.2 million in the previous year concerns insurance claims from the loss event at the Charleston production site.
Receivables are shown at amortized cost, which corre-sponds to their market value. Adequate loss allowances are set up to cover default risks, to the extent that these are not covered by insurance, bank guarantees or advance payments received.
WACKER takes the simplified approach when calculating impairments of trade receivables in accordance with IFRS 9. Under this approach, the loss allowance is determined immediately upon origination on the basis of the lifetime expected credit losses. Further changes in the credit risk (expected credit loss or ECL) do not need to be tracked. The expected credit losses are determined using a provision matrix, which defines fixed default rates per past-due category on the basis of the risk classes of the past-due receivables.
€ million 2018 2017
Total Of which noncurrent
Of which current
Total Of which noncurrent
Of which current
Trade receivables
Investments
Loans granted
Receivables from associates
Loan and interest receivables
Derivative financial instruments
Insurance compensation
Receivables from suppliers
Deposits
Restricted cash and cash equivalents
Sundry assets
Other financial assets
Prepaid expenses
Plan assets for phased early retirement
Advance payments made
Other tax receivables
Sundry assets
Other non-financial assets
Income tax receivables
681.9 – 681.9 655.7 – 655.7
11.3 11.3 – 11.1 11.1 –
89.6 89.6 – 90.5 90.5 –
1.3 – 1.3 1.3 – 1.3
– – – 1.6 – 1.6
10.7 4.7 6.0 13.4 1.5 11.9
– – – 10.2 – 10.2
21.0 – 21.0 4.6 – 4.6
3.3 2.7 0.6 3.1 2.5 0.6
0.8 – 0.8 0.2 – 0.2
1.4 1.0 0.4 49.1 1.2 47.9
139.4 109.3 30.1 185.1 106.8 78.3
8.2 0.9 7.3 10.2 1.2 9.0
0.2 – 0.2 0.3 – 0.3
16.9 3.6 13.3 9.1 2.3 6.8
60.3 0.8 59.5 63.7 0.3 63.4
5.1 – 5.1 6.5 – 6.5
90.7 5.3 85.4 89.8 3.8 86.0
64.0 – 64.0 13.9 – 13.9
€ million 2018 2017
Raw materials and supplies
Unfinished and finished products, merchandise
Services not charged
Total
Of which recorded at net realizable value if lower
315.5 245.0
691.8 537.3
3.4 1.3
1,010.7 783.6
205.6 80.5
143
Consolidated Financial Statements – Notes of the WACKER Group
Wacker Chemie AG – Annual Report 2018

The following table shows a breakdown of expected impair-ments of trade receivables:
The lifetime expected credit losses reflect all possible loss events that could occur until the expected maturity of the financial asset. WACKER determines the expected credit loss by taking into account the entire contractual period during which the Group is exposed to the credit risk.
WACKER applies three key parameters to assess the expected credit loss for noncurrent and current inter-est-bearing receivables ( loans and fixed-interest securities): the probability of default (PD), the loss given default (LGD) and the estimated exposure at default (EAD). In the case of loans and fixed-interest securities, WACKER determines a
loss allowance equivalent to the 12-month expected credit losses, as the former are financial instruments with a low credit risk.
Valuation allowances and past-due debts developed as follows:
The loss allowances exclusively concern revenue from contracts with customers.
Under IAS 39, valuation allowances were established in the prior year for identifiable credit risks and exchange-rate fluctuations. No valuation allowances were recognized for other financial assets in the prior year. There was no significant credit risk as of December 31, 2018.
We continuously monitor the creditworthiness of our debtors to assess the intrinsic value of the corresponding receivables; where appropriate, we take out credit default insurance. In addition, customers make advance payments and provide bank guarantees. The maximum default risk is equal to the carrying amount of the uninsured receivables. No loans or receivables were renegotiated to prevent an overdue debt or possible loss allowances. Based on past experience and on the conditions prevailing as of the reporting date, there are no restrictions with regard to credit quality.
Development of Past-Due Trade Receivables as of Dec. 31, 2018
€ million Carrying amount
Loss allowance
Expected loss rate (%)
Not past due
up to 30 days past due
31 to 60 days past due
61 to 90 days past due
Receivables impaired as uncollectible
Total
609.3 -0.7 -0.11
60.8 -0.7 -1.14
8.4 -0.2 -2.33
2.2 -0.2 -8.33
1.2 -1.5 -55.56
681.9 -3.3 -0.48
Development of Loss Allowances for Trade Receivables
€ million 2018 2017
As of Jan. 1 (as per IAS 39)
Effects of first-time application of new accounting standards
Opening balance of loss allowance as of Jan. 1 (as per IFRS 9)
Increase /decrease in loss allowances recognized in profit or loss
Receivables impaired as uncollectible
Change in scope of consolidation
Exchange-rate differences
As of Dec. 31
3.4 3.7
-0.1 –
3.3 3.7
0.1 –
– -0.1
– –
-0.1 -0.2
3.3 3.4
Development of Past-Due Trade Receivables as of Jan. 1, 2018
€ million Carrying amount
Loss allowance
Expected loss rate (%)
Not past due
up to 30 days past due
31 to 60 days past due
61 to 90 days past due
Receivables impaired as uncollectible
Total
513.3 -0.4 -0.08
120.6 -0.2 -0.17
10.2 -0.1 -0.97
11.4 -0.1 -0.87
0.2 -2.6 -92.86
655.7 -3.4 -0.52
144
Consolidated Financial Statements – Notes of the WACKER Group
Wacker Chemie AG – Annual Report 2018
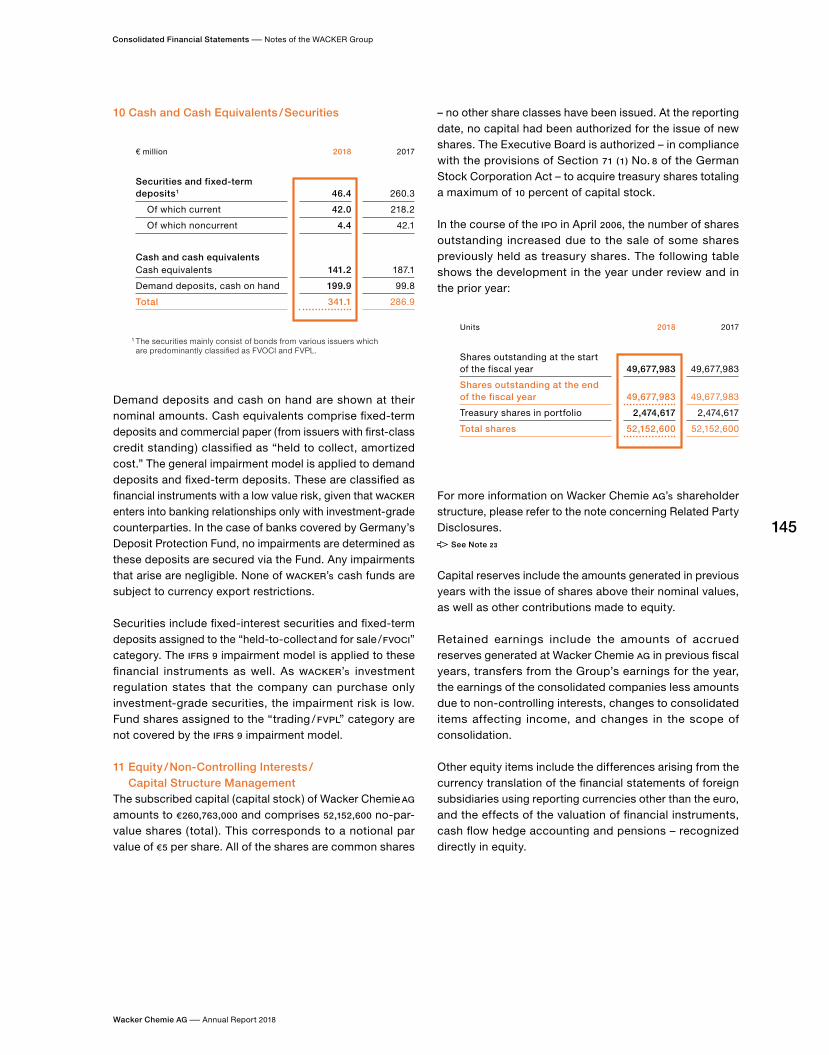
10 Cash and Cash Equivalents / Securities
Demand deposits and cash on hand are shown at their nominal amounts. Cash equivalents comprise fixed-term deposits and commercial paper (from issuers with first-class credit standing) classified as “held to collect, amortized cost.” The general impairment model is applied to demand deposits and fixed-term deposits. These are classified as financial instruments with a low value risk, given that WACKER enters into banking relationships only with investment-grade counterparties. In the case of banks covered by Germany’s Deposit Protection Fund, no impairments are determined as these deposits are secured via the Fund. Any impairments that arise are negligible. None of WACKER’s cash funds are subject to currency export restrictions.
Securities include fixed-interest securities and fixed-term deposits assigned to the “held-to-collect and for sale / FVOCI” category. The IFRS 9 impairment model is applied to these financial instruments as well. As WACKER’s investment regulation states that the company can purchase only investment-grade securities, the impairment risk is low. Fund shares assigned to the “trading / FVPL” category are not covered by the IFRS 9 impairment model.
11 Equity / Non-Controlling Interests / Capital Structure Management
The subscribed capital (capital stock) of Wacker Chemie AG amounts to € 260,763,000 and comprises 52,152,600 no- par-value shares (total ). This corresponds to a notional par value of € 5 per share. All of the shares are common shares
– no other share classes have been issued. At the reporting date, no capital had been authorized for the issue of new shares. The Executive Board is authorized – in compliance with the provisions of Section 71 (1) No. 8 of the German Stock Corporation Act – to acquire treasury shares totaling a maximum of 10 percent of capital stock.
In the course of the IPO in April 2006, the number of shares outstanding increased due to the sale of some shares previously held as treasury shares. The following table shows the development in the year under review and in the prior year:
For more information on Wacker Chemie AG’s shareholder structure, please refer to the note concerning Related Party Disclosures.
See Note 23
Capital reserves include the amounts generated in previous years with the issue of shares above their nominal values, as well as other contributions made to equity.
Retained earnings include the amounts of accrued reserves generated at Wacker Chemie AG in previous fiscal years, transfers from the Group’s earnings for the year, the earnings of the consolidated companies less amounts due to non-controlling interests, changes to consolidated items affecting income, and changes in the scope of consolidation.
Other equity items include the differences arising from the currency translation of the financial statements of foreign subsidiaries using reporting currencies other than the euro, and the effects of the valuation of financial instruments, cash flow hedge accounting and pensions – recognized directly in equity.
Units 2018 2017
Shares outstanding at the start of the fiscal year
Shares outstanding at the end of the fiscal year
Treasury shares in portfolio
Total shares
49,677,983 49,677,983
49,677,983 49,677,983
2,474,617 2,474,617
52,152,600 52,152,600
€ million 2018 2017
Securities and fixed-term deposits 1
Of which current
Of which noncurrent
Cash and cash equivalentsCash equivalents
Demand deposits, cash on hand
Total
1 The securities mainly consist of bonds from various issuers which are predominantly classified as FVOCI and FVPL.
46.4 260.3
42.0 218.2
4.4 42.1
141.2 187.1
199.9 99.8
341.1 286.9
145
Consolidated Financial Statements – Notes of the WACKER Group
Wacker Chemie AG – Annual Report 2018

The net result attributable to non-controlling interests is made up of the following profits and losses:
Non-controlling interests in equity primarily comprised the following companies:
The voting rights of non-controlling interests correspond to their equity share.
For further information on individual companies, please refer to the Breakdown of Shareholdings.
See Note 22
Information on Capital ManagementThe goal of the WACKER Group’s capital management policy is to ensure that the company remains a going concern in the long term and to generate an appropriate return on capital employed for the company’s shareholders. The capital management instruments employed to achieve this goal include dividend payments to shareholders and stock buybacks.
In managing its capital, Wacker Chemie AG complies with the legal stipulations on capital maintenance. The company’s Articles of Association do not stipulate any capital require-ments. No special capital terminology is used. The Group’s general dividend policy is to distribute about 50 percent of
Group net income to shareholders, provided the business situation permits and the committees responsible agree.
Above and beyond this, WACKER actively manages its debt capital with the aim of achieving a balanced financing portfolio, a diversified maturities profile and comfortable liquidity reserves. In addition, our corporate financial structures are designed to keep WACKER’s credit rating at least in the investment-grade range. In accordance with our policy of value-based management, net financial debt functions as a supplementary financial performance indicator.
See the Management Processes and Net Assets sections of the Group
management report.
As of the reporting date, the WACKER Group’s capital structure is as follows:
12 Provisions for PensionsVarious post-employment pension plans are available to WACKER Group employees. They depend on the legal, economic and fiscal conditions prevailing in the respective countries. These pension plans generally take account of the employees’ length of service and salary levels.
Company pension plans make a distinction between defined contribution and defined benefit plans. Defined contribution plans lead to no further obligation for the company beyond paying contributions to special-purpose funds. WACKER has both defined contribution and defined benefit plans, which are financed in part by Pensionskasse der Wacker Chemie VVaG or by funds. Pension obligations result from defined benefit plans in the form of entitlements to future pensions and ongoing payments for eligible active and former employees of the WACKER Group and their surviving dependents. The various pension plans basically guarantee
Capital Structure
€ million 2018 2017
Equity attributable to Wacker Chemie AG shareholders
Share of total capital (%)
Noncurrent financial liabilities
Current financial liabilities
Total
Share of total capital (%)
Total capital
3,087.2 3,119.2
75.6 75.7
894.7 800.4
102.5 201.2
997.2 1,001.6
24.4 24.3
4,084.4 4,120.8
Non-Controlling Interests
€ million 2018 2017
Wacker Asahi Kasei Silicone Co. Ltd., Tokyo, Japan
Wacker Metroark Chemicals Pvt. Ltd., Parganas, India
Wacker Chemicals Fumed Silica (ZJG) Holding Co. Private Ltd., Singapore1
Total
1 Including subsidiary
10.2 9.4
34.9 29.1
13.2 11.6
58.3 50.1
€ million 2018 2017
Profits
Losses
Net result attributable to non-controlling interests
14.0 18.6
– -0.5
14.0 18.1
146
Consolidated Financial Statements – Notes of the WACKER Group
Wacker Chemie AG – Annual Report 2018

employees either a life-long pension on the basis of their average salary during employment at WACKER (career average plan) or lump-sum payments.
The Group maintains the following retirement benefit plans:
Retirement Benefits Supplied by the Company Pension FundEmployees at Wacker Chemie AG and other German Group companies are granted a basic pension model via Pen-sions kasse der Wacker Chemie VVaG, a legally indepen-dent German pension fund. The pension fund is financed by member and company contributions. The payments comprise old-age, disability and surviving dependents’ benefits.
The pension fund is a small mutual insurance company within the meaning of Section 210 of the German Insurance Supervision Act and is regulated by Section 233 (1) of this act. It is thus subject to the regulations that apply to German insurers and is monitored by the Federal Financial Supervisory Authority (BaFin). There are statutory minimum financing obligations.
Employees who joined the pension plan before the end of 2004 receive guaranteed payments based on a defined benefit amount, which is to be taken into consideration in determining pension obligations. The pension payment is the same, regardless both of the employee’s age when paying contributions and of the interest generated from assets. A new basic-pension model applies to employees who joined the pension fund after 2004. Under that model, the benefits are based on guaranteed interest rates and the benefit amount depends on the age at which the employee pays contributions. Annual profit distributions can increase the future payment. In addition, employees in Germany may make voluntary payments to the “PK+” supplementary insurance fund of Pensionskasse der Wacker Chemie VVaG. The main items paid into the volun-tary supplementary insurance fund comprise contributions in connection with retirement benefit plans governed by the collective bargaining agreements and concerning one-off payments and retirement benefits, and “Working Life and Demography.”
Direct Commitments of the WACKER GroupIn addition to the pension fund commitments, employees in Germany receive direct commitments in the form of a supplementary pension. The supplementary pension insures that part of an employee’s salary that exceeds the pension insurance contribution assessment ceiling.
Employees who joined the company before the end of 2004 – and their surviving dependents – receive a pension. The amount of that pension depends on the average salary earned during the period of employment with WACKER (career average plan). For employees who joined the plan as of 2005, a certain percentage of the salary exceeding the pension insurance contribution assessment ceiling is paid in. The resulting capital accrues interest. The benefits may be paid out as a life-long pension or, in the case of commitments made from 2005 onward, as a lump sum. Employees and their surviving dependents are eligible to receive benefits. Employee entitlements are included when measuring pension obligations, regardless of whether the employees joined the company before the end of 2004 or after the beginning of 2005.
Executive Board members are granted individual pension commitments. For more information on Executive Board member pension plans, please refer to the Compensation Report.
See page 192
Employees in Germany with salaries above the standard pay scale may pay into an employee-financed pension plan (deferred compensation). This plan affords employees the option of converting part of their future salary claims into equivalent pension capital. Pension capital accrues interest according to the date the pension plan was entered into (commitment) at either 7 percent (1996 – 2001), 6 percent (2002 – 2010) or 5 percent (2011 – 2013). Plans bearing 7 percent or 6 percent interest may be drawn in the form of either a pension or a lump sum. Plans bearing 5 percent interest are paid out exclusively in lump-sum form. Since 2015, management employees have been able to contribute a portion of their salary to an employee-financed pension plan with a variable interest rate. The variable interest rate is linked to the five-year running yield on German bearer bonds and amounts to at least 2.5 percent and at most 5 percent. Disbursement is as a lump sum only. Pension commitments made before or on December 31, 2000 are measured ( in accordance with the projected unit credit method) at the present value of years’ service to date or years served to retirement, whereas any commitments made on or after January 1, 2001 are measured at the present value of the defined benefit obligation or at the equivalent of the accumulated capital.
Pension entitlements in Germany are protected against insolvency by the pension guarantee fund (Pensions-sicherungsverein a. G.). This insolvency insurance is capped. There are no statutory minimum financing obligations.
147
Consolidated Financial Statements – Notes of the WACKER Group
Wacker Chemie AG – Annual Report 2018

Pension Commitments outside of GermanyVarious pension plans are available to employees of foreign subsidiaries, subject to the statutory provisions applicable in the respective countries. Of these commitments, only the US pension plans are material to the Group.
In the US, defined benefit plans exist for employees of Wacker Chemicals Corporation, Adrian. These plans were closed for new applications effective December 31, 2003 and remain in force for legacy policies only. Retirement benefits are paid out from age 65 in the form of a monthly pension and are based on the last average salary paid. Special rules apply to early retirement as of age 55 depending on the employee’s years of service. In view of their pension-like character, obligations relating to medical care for retired employees and severance payments are likewise included under pension provisions. New employees in the USA are offered only defined contribution plans.
The present value of defined benefit plans may be recon-ciled with the provisions recognized in the balance sheet as follows:
Net Liability of Defined Benefit Obligations
€ million Dec. 31, 2018 Dec. 31, 2017
Germany International Total Germany International Total
Present value of the at least partially fund-financed defined benefit obligations
Fair value of plan assets
Funded status
Present value of unfunded defined benefit obligations
Provisions for pensions and similar obligations
2,446.0 96.1 2,542.1 2,236.3 96.6 2,332.9
-1,682.1 -84.4 -1,766.5 -1,625.5 -85.9 -1,711.4
763.9 11.7 775.6 610.8 10.7 621.5
1,006.3 13.1 1,019.4 984.6 12.2 996.8
1,770.2 24.8 1,795.0 1,595.4 22.9 1,618.3
148
Consolidated Financial Statements – Notes of the WACKER Group
Wacker Chemie AG – Annual Report 2018

Changes in the Net Liability of Defined Benefit Obligations
€ million Present value of pension
plan obligations
Market value of plan assets
Total
As of Jan. 1, 2017
Current service cost
Interest expense / income
Administrative expenses paid from plan assets
Past service cost
Effects of settlements
Remeasurements Gains (–) / losses (+) from plan assets without amounts already recognized in interest income
Gains (–) / losses (+) from changes in demographic assumptions
Gains (–) / losses (+) from changes in financial assumptions
Gains (–) / losses (+) from experience adjustments
Effects of exchange-rate differences
Contributions byEmployer
Pension plan beneficiaries
Pension payments
Settlements
Changes in scope of consolidation
As of Dec. 31, 2017
Current service cost
Interest expense / income
Past service cost
Remeasurements Gains (–) / losses (+) from plan assets without amounts already recognized in interest income
Gains (–) / losses (+) from changes in demographic assumptions
Gains (–) / losses (+) from changes in financial assumptions
Gains (–) / losses (+) from experience adjustments
Effects of exchange-rate differences
Contributions byEmployer
Pension plan beneficiaries
Pension payments
As of Dec. 31, 2018
4,202.4 -2,094.6 2,107.8
81.4 – 81.4
70.0 -35.4 34.6
– 0.2 0.2
0.5 – 0.5
-0.9 1.0 0.1
– -56.5 -56.5
– – –
-113.0 – -113.0
40.8 – 40.8
-15.9 11.8 -4.1
– -75.6 -75.6
20.9 -20.9 –
-77.7 51.6 -26.1
-0.5 – -0.5
-878.3 507.0 -371.3
3,329.7 -1,711.4 1,618.3
74.0 – 74.0
70.4 -37.2 33.2
-0.2 – -0.2
– -4.6 -4.6
62.6 – 62.6
67.6 – 67.6
9.2 – 9.2
4.9 -3.9 1.0
– -37.5 -37.5
21.1 -21.1 –
-77.8 49.2 -28.6
3,561.5 -1,766.5 1,795.0
149
Consolidated Financial Statements – Notes of the WACKER Group
Wacker Chemie AG – Annual Report 2018

AssumptionsThe pension obligations are calculated by taking account of company-specific and country-specific biometric calcula-tion principles and parameters. The calculations are based on actuarial reports that factor in the following parameters:
The basis for life-expectancy calculations for Germany was changed to Heubeck AG’s “Richttafeln 2018G” generation tables as of December 31, 2018. These take into account the latest life expectancy rates and socio- economic factors, and currently offer the best estimate of life expectancy.
Until December 31, 2017, the “Heubeck-Richttafeln 1998” guideline tables (with subsequent modifications) were used in terms of mortality and socioeconomic factors. In the USA, the calculation basis switched to the RP-2018 mortality table (MP-2018 projection scale) in 2018. The RP-2014 mor-tality table was projected back to the year 2006 (using the MP-2014 scale) and the MP-2018 table was used as a basis for future periods.
The discount rates and salary increase rates used in calculating the pension obligation were determined in line with the general economic conditions and derived according to uniform standards. The discount rate is based on a yield curve that is derived from the yields of coun-try-specific, high-grade, fixed-interest corporate bonds with maturities corresponding to the pension obligations. The discount rate takes account of the WACKER-specific, expected future cash flows for these obligations.
Sensitivity AnalysisThe following sensitivity analysis involves an adjustment of only one assumption – i. e. the other assumptions remain unchanged from the original valuation, so that the sensitivity of each individual assumption can be observed in isolation. As a consequence, possible correlation effects between the individual assumptions cannot be taken into consideration.
The following table shows the possible changes in the present value of pension obligations resulting from changes in the basic actuarial assumptions.
Sensitivity Analysis Dec. 31, 2018 Effect on defined benefit obligation
Dec. 31, 2017 Effect on defined benefit obligation
Defined benefit obligation in
€ million
Change (%)
Defined benefit obligation in
€ million
Change (%)
Present value of pension obligations as of the reporting date
Present value of pension obligations ifthe discount rate increases by 0.5 percentage points
the discount rate decreases by 0.5 percentage points
salaries increase by 0.5 percentage points
salaries decrease by 0.5 percentage points
future pension increases are 0.25 percentage points higher
future pension increases are 0.25 percentage points lower
life expectancy goes up by one year
3,561.5 3,329.7
3,232.6 -9.2 3,033.2 -8.9
3,942.3 10.7 3,671.6 10.3
3,593.2 0.9 3,358.6 0.9
3,533.3 -0.8 3,303.4 -0.8
3,668.1 3.0 3,426.5 2.9
3,460.0 -2.8 3,237.2 -2.8
3,685.7 3.5 3,456.3 3.8
Actuarial Assumptions
% 2018 2017
Germany Discount rate
Salary growth rate
Pension growth rate 1
Basic and supplementary pension
Deferred compensation
USA Discount rate
Salary growth rate
1 Varies according to the date on which the employee joined the company and/or the effective date of the different plan generations.
1.98 2.09
2.50 2.50
1.8 /1.0 1.8 /1.0
2.5 /1.0 2.5 /1.0
4.12 3.50
3.00 3.00
150
Consolidated Financial Statements – Notes of the WACKER Group
Wacker Chemie AG – Annual Report 2018

Composition of Plan AssetsPensionskasse der Wacker Chemie VVaG invests plan assets in accordance with statutory requirements and the terms of its by-laws. The company pension fund invests nearly half of its assets in equity funds and fixed-income funds. The other half is invested directly in promissory notes (German Schuldscheine), real estate, real estate loans, private debt and private equity. The remainder of the assets
are retained for liquidity purposes. The investment strategy follows the investment guideline provided by the board of the pension fund.
The plan assets of pension funds set up in the US are invested mainly in stocks and funds in accordance with the applicable investment rules. The composition of plan assets for the Group is shown in the following table:
The WACKER Group was utilizing € 105.2 million of plan assets for its own purposes as of December 31, 2018, compared with € 84.2 million in the prior year. This comprises the real estate used by Wacker Chemie AG for its headquarters in Munich.
RisksIn addition to the usual actuarial risks, the risk inherent in the defined benefit obligation relates in particular to financial risks in connection with plan assets. In Germany, substantial amounts of the defined benefit obligation are administered by the pension fund. As part of an annual asset-liability study, the current and future relationships between the portfolio structure and obligations are analyzed and projections made. The result is the long-term return required of the pension fund, on the basis of which the pension fund defines a strategic target portfolio. This leads to an annual review and coordination of the required return, company contributions of sponsoring entities and strategic asset allocation.
All capital investments are exposed to market price fluc-tuation risks. These risks may comprise shifts in interest rates, share prices or exchange rates. WACKER aims to limit losses to a pre-defined amount using overlay management. In some cases, derivatives are used for hedging purposes.
In addition to actuarial risks, the defined benefit plans used in the US are also subject to market-price fluctuation risks because plan assets are invested in stocks and funds.
Applicable statutes and by-laws require WACKER to reduce under-funding of pension plans by increasing the amount of company contributions in cash.
Risks arise in particular in connection with the life expec-tancy of the beneficiaries, the interest rate guarantee, and the salary and pension growth rates. The interest rate guarantee risk is regularly monitored as part of the risk management process. It constitutes a major focus of the company pension fund when determining the long-term interest requirements and how to fulfill them. Interest rate guarantee risks also affect the deferred compensation plans.
Pension Plan FinancingIn 2018, benefits in the amount of € 72.6 million (versus € 72.1 million a year earlier) were paid under pension plans in Germany and € 5.2 million (versus € 5.6 million) under pension plans outside of Germany. WACKER anticipates that pension payments will reach approximately € 82 million in the coming fiscal year. Current employer contributions to plan assets will amount to around € 40 million in 2019. The weighted
Composition of Plan Assets
€ million Dec. 31, 2018 Dec. 31, 2017
Quoted market prices
in an active market
No quoted market prices
in an active market
Total Quoted market prices
in an active market
No quoted market prices
in an active market
Total
Real estate
Loans / fixed-interest securities
Shares / funds
Cash and cash equivalents
Total
– 334.7 334.7 – 272.5 272.5
607.3 287.4 894.7 631.1 305.0 936.1
238.3 225.3 463.6 248.5 171.4 419.9
– 73.5 73.5 – 82.9 82.9
845.6 920.9 1,766.5 879.6 831.8 1,711.4
151
Consolidated Financial Statements – Notes of the WACKER Group
Wacker Chemie AG – Annual Report 2018

duration of pension obligations as of December 31, 2018 was 20.9 years in Germany (versus 20.2 years a year earlier) and 12.1 years in the US (versus 12.9 years).
13 Other Provisions / Income Tax Provisions
Provisions for PersonnelThese include obligations for anniversary payments and funeral expenses as well as provisions for early-retirement and phased-early-retirement plans. There is a continuous reduction in noncurrent provisions for anniversary pay-ments and provisions for phased-early-retirement plans. Interest-rate effects increased anniversary-payment provisions, while provisions for phased-early-retirement plans increased due to newly concluded agreements with employees still working for the company.
Sales / Purchasing ProvisionsThese provisions cover warranty and product-liability obligations as well as commissions payable to sales agents and contingent losses from contractual agreements. The major portion of the provisions will probably be used for payouts over the next two years. The decrease in this item is attributable to the utilization of provisions for onerous contracts and to the reclassification of discount accruals as contract liabilities.
Provisions for Environmental ProtectionProvisions for environmental protection are created for anticipated obligations regarding contaminated-site remediation, water pollution control, recultivation of land-fills, the clean-up of contaminated storage and production sites, and similar environmental measures. These provi-sions also include environmental protection charges likely to be imposed by government agencies. The noncurrent provisions for environmental protection are likely to be utilized within a period of 25 years.
Sundry ProvisionsThese provisions are formed for a multiplicity of identi-fiable individual risks and contingencies (e. g. damages, reimbursement claims, legal expenses). Beside risks in connection with property and wealth taxes, they cover risks stemming from interest and penalties not recognized under income taxes.
€ million 2018 2017
Total Of which noncurrent
Of which current
Total Of which noncurrent
Of which current
Personnel
Sales / purchasing
Environmental protection
Sundry
Other provisions
Income tax provisions
103.0 98.1 4.9 92.3 87.6 4.7
9.9 4.7 5.2 39.8 35.6 4.2
80.5 79.3 1.2 80.2 78.2 2.0
62.7 38.0 24.7 76.6 31.7 44.9
256.1 220.1 36.0 288.9 233.1 55.8
110.0 88.3 21.7 119.1 48.0 71.1
Composition of Pension Expenses
€ million 2018 2017
Current service cost from defined benefit plans
Past service cost / effects of settlements and curtailments
Administrative expenses for defined benefit plans paid from plan assets
Net interest expense for defined benefit plans
Defined contribution plan expenses
Other pension expenses
Contributions to state pensions
Total
-74.0 -81.4
0.2 -0.6
– -0.2
-33.2 -34.6
-6.8 -6.7
-2.3 -3.4
-57.0 -57.4
-173.1 -184.3
Expected Pension Payments Due
€ million Dec. 31, 2018 Dec. 31, 2017
Less than one year
One to two years
Two to three years
Three to four years
Four to five years
-81.6 -79.7
-88.5 -85.1
-91.6 -89.5
-96.8 -93.6
-101.0 -99.1
152
Consolidated Financial Statements – Notes of the WACKER Group
Wacker Chemie AG – Annual Report 2018

Income Tax ProvisionsThese contain amounts for current income tax obligations as well as for risks from tax audits and legal action. The existing noncurrent tax provisions will probably not be utilized for another four years.
Depending on the situation in the individual countries, discount rates of up to 5 percent were used to determine the provisions. These provisions were primarily those associated with purchasing, environmental provisions, pro-visions for phased-early-retirement plans and anniversary- payment provisions.
14 Financial Liabilities
In 2018, a new promissory note (German Schuldschein) of € 300 million was issued. Bank loans in the amount of US$ 250 million (€ 218.7 million) and CNY 100 million (€ 12.7 mil-lion) were repaid prematurely. As planned, the first install-ment of the private placement of US$ 70 million (€ 61.2 million) was repaid and a promissory note of € 50 million refinanced. Ongoing repayments of investment loans totaled € 16 million.
No collateral exists for the financial liabilities, nor are they secured through liens or similar rights. Some of the liabilities to banks are fixed-interest while others have variable interest rates. In certain cases, WACKER has fixed-interest loans with exercisable termination options. Due to the high penalties payable on early termination, these options currently have no positive value and their fair value is negligible. Thus, WACKER does not recognize these for reasons of immateri-ality. Moreover, some of the liabilities to banks were granted on condition that particular covenants be complied with.
€ million 2018 2017
Total Of which noncurrent
Of which current
Total Of which noncurrent
Of which current
Liabilities to banks
Liabilities from lease obligations
Other financial liabilities
Financial liabilities
675.0 582.9 92.1 633.5 499.8 133.7
26.3 22.2 4.1 29.8 25.6 4.2
295.9 289.6 6.3 338.3 275.0 63.3
997.2 894.7 102.5 1,001.6 800.4 201.2
Other Provisions / Income Tax Provisions
€ million Jan. 1, 2018 Utilization Reversal Addition Interest effect
Exchange-rate
differences
Other 1 Dec. 31, 2018
Personnel
Sales / purchasing
Environmental protection
Sundry
Other provisions
Income tax provisions
1 “Other” includes the change of € 7.5 million in plan assets for phased-early-retirement commitments within provisions for personnel.
92.3 -34.4 -1.0 52.6 0.9 0.1 -7.5 103.0
39.8 -4.0 -32.1 5.5 0.8 -0.1 – 9.9
80.2 -4.5 -1.2 5.3 0.4 0.3 – 80.5
76.6 -18.9 -4.2 9.8 0.2 -0.8 – 62.7
288.9 -61.8 -38.5 73.2 2.3 -0.5 -7.5 256.1
119.1 -38.8 -0.7 30.5 – -0.1 – 110.0
153
Consolidated Financial Statements – Notes of the WACKER Group
Wacker Chemie AG – Annual Report 2018

The liabilities to banks comprise the following:
Other financial liabilities comprise the following:
The carrying amounts of the current financial liabilities cor-respond to the repayment amounts. With the exception of the euro-denominated investment loan totaling € 32 million and another loan in the amount of € 1.9 million, all the loans fall due on maturity.
The following table shows the future repayment and interest payments for the bank liabilities and other financial liabil-ities.
There are also unused long-term lines of credit amounting to € 600.0 million (€ 901.1 million a year earlier), where all the conditions for utilization are met.
€ million 2019 2020 2021 2022 2023 to 2025
Repayment
Interest
98.4 145.6 3.4 200.0 523.5
16.5 12.0 10.6 9.9 5.4
€ million 2018 2017
Currency Carrying amount
€ million
Of which with variable
interest rates
Maturity by
Currency Carrying amount
€ million
Of which with variable
interest rates
Maturity by
Private placement (1st installment)
Private placement (2nd installment)
Private placement (3rd installment)
Sundry other financial liabilities
Total
Fair value
USD – – 2018 USD 58.5 – 2018
USD 113.5 – 2020 USD 108.4 – 2020
USD 174.5 – 2023 USD 166.6 – 2023
7.9 – 4.8 –
295.9 338.3
287.4 331.3
€ million 2018 2017
Currency Carrying amount
€ million
Of which with variable
interest rates
Maturity by
Currency Carrying amount
€ million
Of which with variable
interest rates
Maturity by
Investment loan*
Investment loan
Promissory note (German Schuldschein)
Promissory note (German Schuldschein)
Promissory note (German Schuldschein)
Bank loan
Bank loan
Bank loan
Bank loan
Operating loan
Other
Total
Fair value
* Of which €16 million will be due in the following year.
EUR 32.0 32.0 2020 EUR 48.0 48.0 2020
EUR 200.0 – 2022 EUR 200.0 – 2022
EUR 50.0 – 2023 EUR 50.0 – 2018
EUR 150.0 105.5 2023 – – –
EUR 150.0 43.0 2025 – – –
KRW 22.0 22.0 2019 KRW 15.7 15.7 2018
USD – – 2019 USD 208.9 208.9 2019
CNY 30.8 30.8 2019 CNY 33.4 33.4 2019
CNY 12.7 12.7 2020 CNY 25.7 25.7 2020
CNY 12.4 12.4 2019 CNY 38.3 38.3 2018
15.1 2.7 – 13.5 2.5 –
675.0 633.5
678.1 633.5
154
Consolidated Financial Statements – Notes of the WACKER Group
Wacker Chemie AG – Annual Report 2018

As of the reporting date, the future minimum lease pay-ments under finance lease agreements amounted to:
There are no conditional lease payments from finance leases.
Wacker Chemie AG has capitalized a finance lease for the leased CCGT (combined-cycle gas turbine) power station at its Burghausen site. The lease for the power station is due to expire in 2019 at the latest. WACKER has the right to acquire the power station at a price oriented to book values in accordance with German commercial law. If WACKER acquires this power station, it may not be sold to a third party for five years.
15 Financial and Non-Financial Liabilities
In addition, there are leases for some technical facilities that qualify as finance leases and have been capitalized by WACKER. Here, too, the Group in some cases has rights of preemption and rental extension options.
The lease agreements serve to simplify the procurement and financing of operating materials and fixed assets. The long-term commitment that they involve, however, leads to a constant future outflow of cash from which the company cannot extract itself.
€ million 2018 2017
Nominal value
Interest Present value
Nominal value
Interest Present value
Minimum lease payment within a year
Minimum lease payment between one and five years
Minimum lease payment over five years
Total
6.6 2.5 4.1 6.8 2.6 4.2
16.2 8.0 8.2 19.7 8.3 11.4
24.9 10.9 14.0 26.4 12.2 14.2
47.7 21.4 26.3 52.9 23.1 29.8
€ million 2018 2017
Total Of which noncurrent
Of which current
Total Of which noncurrent
Of which current
Trade payables
Liabilities due to associates
Derivative financial instruments
Sundry financial liabilities
Other financial liabilities
Payables relating to social security
Payroll liabilities
Variable compensation
Other personnel liabilities
Other tax liabilities
Deferred income
Sundry non-financial liabilities
Other non-financial liabilities
Advance payments received
Discount accruals
Contract liabilities
Income tax liabilities
470.6 – 470.6 268.5 – 268.5
– – – 0.9 – 0.9
11.2 0.3 10.9 0.7 0.4 0.3
12.5 0.1 12.4 13.9 0.1 13.8
23.7 0.4 23.3 15.5 0.5 15.0
6.7 – 6.7 4.1 – 4.1
8.7 – 8.7 6.9 – 6.9
74.8 – 74.8 90.0 – 90.0
22.8 – 22.8 21.5 – 21.5
23.8 – 23.8 22.7 – 22.7
15.0 – 15.0 1.8 – 1.8
7.9 – 7.9 11.7 0.1 11.6
159.7 – 159.7 158.7 0.1 158.6
135.8 64.1 71.7 174.3 112.5 61.8
15.1 – 15.1 16.5 – 16.5
150.9 64.1 86.8 190.8 112.5 78.3
0.2 – 0.2 0.8 – 0.8
155
Consolidated Financial Statements – Notes of the WACKER Group
Wacker Chemie AG – Annual Report 2018

In addition to those tax amounts for which Group companies are liable, tax liabilities include taxes paid for the account of third parties.
Payables relating to social security refer in particular to social-insurance contributions that have yet to be paid.
The other payroll liabilities include, in particular, vacation and flextime credits, as well other HR-related liabilities. The advance payments received relate primarily to future deliv-eries of polysilicon.
No collateral exists for other liabilities, nor are they secured through liens or similar rights.
16 Contingent Liabilities, Contingent Assets, Other Financial Obligations and Other Risks
The values assigned to contingent liabilities correspond to the extent of the liability as of the reporting date. At WACKER, contingent liabilities primarily concern incurred guarantees totaling € 0.3 million, versus € 0.5 million in the prior year. It is unlikely that the guarantees will be utilized.
Under rental agreements and operating leases, the Group leases property, plant and equipment, motor vehicles and IT equipment. These leases generally have terms of between three and five years. Tenancy agreements for office space, property, plant and equipment, etc. have considerably longer terms.
Due to the implementation of IFRS 16 in 2019, obligations from current and minor leases will not be recognized as right-of-use assets. WACKER estimates that the related liabilities totaled € 12.7 million on December 31, 2018.
Obligations from orders for planned investment projects (commitments) amounted to € 209.6 million, after € 192.5 million in the prior year, and concern the operating segments.
The Group ensures capacity utilization at its joint venture with DowDupont via long-term purchasing commitments of some € 100 million annually, versus € 95 million in the prior year.
As regards its current raw-material supplies, WACKER has entered into long-term agreements to purchase strategic raw materials, electricity and gas. Accordingly, in net terms, the company had other financial obligations in the amount of € 1.07 billion arising from significant minimum-purchasing arrangements in the reporting period, after € 1.16 billion the year before. The agreements have terms of between one and fifteen years.
The insurance compensation for the business interruption due to a hydrogen explosion at the production site in Charleston, Tennessee (USA) represents a contingent asset for WACKER. As the loss amount has yet to be determined, the insurance compensation does not qualify as a recogniz-able asset. WACKER received a prepayment of US$ 100 million in January 2018, which was netted against the property damage claims.
The Group receives grants and allowances for investing activities. These incentives are granted on condition that a certain number of jobs are created or maintained at certain sites. If these contractual commitments are not fulfilled, all or part of any funding received must be paid back. The period for which the Group has to fulfill its contractual commitments is limited.
WACKER is occasionally involved in legal or arbitration proceedings as well as official investigations and actions. Pending proceedings can have a negative impact on WACKER’s earnings, net assets and financial position. At the present time, WACKER does not expect any significant negative effects from pending proceedings.
17 Other DisclosuresSocial benefits relate mainly to the employer’s share of social insurance contributions and to contributions to the employers’ liability insurance association. The pension expenses consist mainly of contributions to state pensions and allocations to pension provisions. Related interest is shown in the financial result. The expenses incurred in transfers to external pension funds and pension plans are likewise included in pension expenses.
€ million 2018 2017
Obligations from rent and operating leasesDue within one year
Due between one and five years
Due after five years or more
Total
Lease payments due to operating leases
Total expected minimum lease payments from subleases
35.4 45.8
55.8 56.1
25.6 16.6
116.8 118.5
51.3 43.1
4.2 4.3
156
Consolidated Financial Statements – Notes of the WACKER Group
Wacker Chemie AG – Annual Report 2018
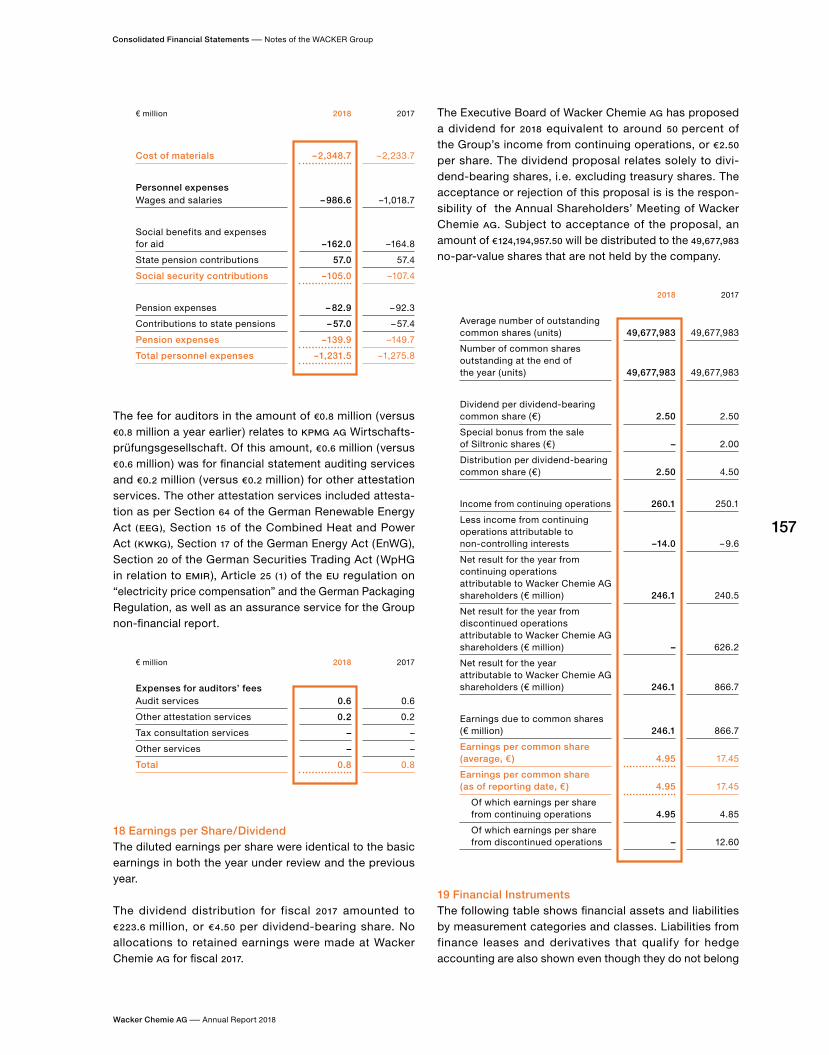
The fee for auditors in the amount of €0.8 million (versus €0.8 million a year earlier) relates to KPMG AG Wirtschafts-prüfungsgesellschaft. Of this amount, € 0.6 million (versus € 0.6 million) was for financial statement auditing services and € 0.2 million (versus € 0.2 million) for other attestation services. The other attestation services included attesta-tion as per Section 64 of the German Renewable Energy Act (EEG), Section 15 of the Combined Heat and Power Act (KWKG), Section 17 of the German Energy Act (EnWG), Section 20 of the German Securities Trading Act (WpHG in relation to EMIR), Article 25 (1) of the EU regulation on “electricity price compensation” and the German Packaging Regulation, as well as an assurance service for the Group non-financial report.
18 Earnings per Share / DividendThe diluted earnings per share were identical to the basic earnings in both the year under review and the previous year.
The dividend distribution for fiscal 2017 amounted to € 223.6 million, or € 4.50 per dividend-bearing share. No allocations to retained earnings were made at Wacker Chemie AG for fiscal 2017.
The Executive Board of Wacker Chemie AG has proposed a dividend for 2018 equivalent to around 50 percent of the Group’s income from continuing operations, or € 2.50 per share. The dividend proposal relates solely to divi-dend-bearing shares, i. e. excluding treasury shares. The acceptance or rejection of this proposal is is the respon-sibility of the Annual Shareholders’ Meeting of Wacker Chemie AG. Subject to acceptance of the proposal, an amount of € 124,194,957.50 will be distributed to the 49,677,983 no-par-value shares that are not held by the company.
19 Financial InstrumentsThe following table shows financial assets and liabilities by measurement categories and classes. Liabilities from finance leases and derivatives that qualify for hedge accounting are also shown even though they do not belong
€ million 2018 2017
Expenses for auditors’ feesAudit services
Other attestation services
Tax consultation services
Other services
Total
0.6 0.6
0.2 0.2
– –
– –
0.8 0.8
€ million 2018 2017
Cost of materials
Personnel expensesWages and salaries
Social benefits and expenses for aid
State pension contributions
Social security contributions
Pension expenses
Contributions to state pensions
Pension expenses
Total personnel expenses
-2,348.7 -2,233.7
-986.6 -1,018.7
-162.0 -164.8
57.0 57.4
-105.0 -107.4
-82.9 -92.3
-57.0 -57.4
-139.9 -149.7
-1,231.5 -1,275.8
2018 2017
Average number of outstanding common shares (units)
Number of common shares outstanding at the end of the year (units)
Dividend per dividend-bearing common share (€ )
Special bonus from the sale of Siltronic shares (€ )
Distribution per dividend-bearing common share (€ )
Income from continuing operations
Less income from continuing operations attributable to non-controlling interests
Net result for the year from continuing operations attributable to Wacker Chemie AG shareholders (€ million)
Net result for the year from discontinued operations attributable to Wacker Chemie AG shareholders (€ million)
Net result for the year attributable to Wacker Chemie AG shareholders (€ million)
Earnings due to common shares (€ million)
Earnings per common share (average, € )
Earnings per common share (as of reporting date, € )
Of which earnings per share from continuing operations
Of which earnings per share from discontinued operations
49,677,983 49,677,983
49,677,983 49,677,983
2.50 2.50
– 2.00
2.50 4.50
260.1 250.1
-14.0 -9.6
246.1 240.5
– 626.2
246.1 866.7
246.1 866.7
4.95 17.45
4.95 17.45
4.95 4.85
– 12.60
157
Consolidated Financial Statements – Notes of the WACKER Group
Wacker Chemie AG – Annual Report 2018

to any of the IFRS 9 measurement categories. WACKER has not pledged any financial assets as security.
The fair value of financial instruments measured at amor-tized cost is determined by means of discounting, taking
into account market-participant interest rates that are adequate to the inherent risk and correspond to the relevant maturity. The fair value of current items in the statement of financial position is seen as equivalent to their carrying amounts as the differences are immaterial.
Financial Assets and Liabilities by Measurement Category and Class as of Dec. 31, 2018
€ million
Measurement
pursuant to IFRS 9
Measurement
pursuant to IAS 17
Balance sheet
carrying amount
Dec. 31, 2018
(Amortized) cost
Fair value through
profit or loss
Fair value through other
comprehen-sive income
(Amortized) cost
Fair value as of
Dec. 31, 2018
Trade receivables
Other financial assets
Loans and other financial assets, measured at amortized cost
Investments in equity instruments (FVPL)
Derivatives that do not qualify for hedge accounting (FVPL)
Derivatives that qualify for hedge accounting
Securities and fixed-term deposits
Securities and fixed-term deposits (measured at amortized cost)
Securities (FVOCI)
Securities (FVPL)
Cash and cash equivalents (measured at amortized cost)
Total financial assets
Financial liabilities excluding finance leases (measured at amortized cost)
Liabilities from finance leases
Trade payables (measured at amortized cost)
Other financial liabilities
Financial liabilities recognized at amortized cost
Derivatives that do not qualify for hedge accounting (FVPL)
Derivatives that qualify for hedge accounting
Total financial liabilities
681.9 681.9 – – – 681.9
139.4 117.4 15.3 6.7 – 139.4
– 117.4 – – – 117.4
– – 11.3 – – 11.3
– – 4.0 – – 4.0
– – – 6.7 – 6.7
46.4 20.6 20.2 5.6 – 46.4
– 20.6 – – – 20.6
– – – 5.6 – 5.6
– – 20.2 – – 20.2
341.1 341.1 – – – 341.1
1,208.8 – – – – 1,208.8
970.9 970.9 – – – 965.5
26.3 – – – 26.3 26.3
470.6 470.6 – – – 470.6
23.7 12.5 4.8 6.4 – 23.7
– 12.5 – – – 12.5
– – 4.8 – – 4.8
– – – 6.4 – 6.4
1,491.5 – – – – 1,486.1
158
Consolidated Financial Statements – Notes of the WACKER Group
Wacker Chemie AG – Annual Report 2018

Trade receivables, other loans and fixed-term deposits as well as cash and cash equivalents are recognized at amortized cost. Cash and cash equivalents in foreign currency are measured at the conversion rate prevailing on the reporting date. Their carrying amounts correspond to their fair values. The fair value of loans corresponds to their present value and results from the present value of the expected future cash flows. Discounting is carried out on the basis of the interest rates valid on the reporting date.
Investments in exchange-traded fixed-interest securities are recognized at fair value through other comprehensive income (FVOCI). Certain securities (funds) and investments
in equity instruments are classified as fair value through profit or loss (FVPL). The investments in equity instruments are also recognized at fair value, the best approximation of which is their historical cost, as no observable prices on active markets are available.
The carrying amounts of trade payables and other financial liabilities correspond to their fair values. The fair values of financial liabilities constitute the present value of the expected future cash flows. Discounting is carried out on the basis of the interest rates valid on the reporting date. All other financial liabilities are valued at cost as no observable prices are available for them.
Financial Assets and Liabilities by Measurement Category and Class as of Dec. 31, 2017
€ million
Measurement
pursuant to IAS 39
Measurement
pursuant to IAS 17
Balance sheet
carrying amount
Dec. 31, 2017
(Amortized) cost
Fair value through
profit or loss
Fair value through other
comprehen-sive income
(Amortized) cost
Fair value as of
Dec. 31, 2017
Trade receivables
Other financial assets
Loans and other financial assets, measured at amortized cost
Investments in equity instruments (FVPL)
Derivatives that do not qualify for hedge accounting (FVPL)
Derivatives that qualify for hedge accounting
Securities and fixed-term deposits
Securities and fixed-term deposits (measured at amortized cost)
Securities (FVOCI)
Securities (FVPL)
Cash and cash equivalents (measured at amortized cost)
Total financial assets
Financial liabilities excluding finance leases (measured at amortized cost)
Liabilities from finance leases
Trade payables (measured at amortized cost)
Other financial liabilities
Financial liabilities recognized at amortized cost
Derivatives that do not qualify for hedge accounting (FVPL)
Derivatives that qualify for hedge accounting
Total financial liabilities
655.7 655.7 – – – 655.7
185.1 171.7 8.4 5.0 – 185.1
– 160.6 – – – 160.6
– 11.1 – – – 11.1
– – 3.0 – – 3.0
– – 5.4 5.0 – 10.4
260.3 156.8 – 103.5 – 260.3
– 156.8 – – – 156.8
– – – 103.5 – 103.5
– – – – – –
286.9 286.9 – – – 286.9
1,388.0 – – – – 1,388.0
971.8 971.8 – – – 964.8
29.8 – – – 29.8 29.8
268.5 268.5 – – – 268.5
15.5 14.8 0.7 – – 15.5
– 14.8 – – – 14.8
– – 0.7 – – 0.7
– – – – – –
1,285.6 – – – – 1,278.6
159
Consolidated Financial Statements – Notes of the WACKER Group
Wacker Chemie AG – Annual Report 2018

The following table shows the net gains and losses from financial instruments.
The net result of the category “financial assets measured at amortized cost” primarily comprised: net losses / gains from foreign currency translation; interest income from financial assets, fixed-term deposits and demand deposits; and loss allowances.
The “financial assets (FVOCI)” category comprises interest income and other changes in fixed-interest securities.
The gains and losses from changes in the fair value of foreign-exchange, interest-rate and commodity deriva-tives that do not fulfill the requirements of IAS 39 for hedge accounting are posted in the category “Assets / liabilities measured at fair value through profit or loss.” This item also reflects changes in value from the remeasurement of hedging transactions as part of fair value hedge accounting. It also contains distributions stemming from investments in equity instruments and funds.
The interest income from financial assets that are not recognized at fair value through profit or loss amounted to € 8.0 million, compared with the prior-year figure of € 7.5 million. This income mainly comprised interest on bank deposits, fixed-term deposits and loans.
The interest expense from financial liabilities that are not recognized at fair value through profit or loss amounted to € 21.2 million, versus € 38.3 million in the prior year. These interest expenses are mainly attributable to financial liabilities.
The net losses in the category “Financial liabilities meas-ured at amortized cost” primarily comprise interest expenses on bank liabilities and other financial liabilities, as well as net losses / gains from foreign currency translation.
Impairments of financial assets measured at fair value through other comprehensive income (FVOCI) amounted to € 0.02 million.
Neither in the year under review nor in the previous year were there any reclassifications of financial assets between those recognized at amortized cost and those recognized at market value or vice versa.
The derecognition of financial assets measured at cost did not result in any material gains or losses.
The financial assets and liabilities measured at fair value in the financial statements were allocated to one of three categories in accordance with the fair value hierarchy described in IFRS 13. Allocation to these categories reveals which of the fair values reported were settled through mar-ket transactions and the extent to which the measurement was based on models in the absence of observable market transactions.
The following are the levels of the hierarchy.
Level 1Financial instruments measured using quoted prices in active markets, the fair value of which can be derived directly from prices in active liquid markets and for which the financial instrument observable in the market is repre-sentative of the financial instrument being measured. These include fixed-interest securities and a mutual fund, both of which are traded in liquid markets.
Level 2Financial instruments measured using valuation methods based on observable market data, the fair value of which can be determined using similar financial instruments traded in active markets or using valuation methods all of whose parameters are observable. These include hedging and non-hedging derivative financial instruments, loans and financial liabilities.
Level 3Financial instruments measured using valuation methods not based on observable parameters, the fair value of which cannot be determined using observable market data and which require the application of different valuation methods. The financial instruments belonging to this category have a value component that is not market-observable and has a major impact on fair value. These include over-the-counter derivatives and unquoted equity instruments.
€ million 2018 2017
Net gains / losses from financial instrumentsFinancial assets measured at amortized cost
Financial assets measured at fair value through other comprehensive income (FVOCI)
Assets / liabilities measured at fair value through profit or loss (FVPL)
Financial liabilities measured at amortized cost
Total
16.6 -20.3
0.1 1.9
-33.9 46.4
-9.8 -86.6
-27.0 -58.6
160
Consolidated Financial Statements – Notes of the WACKER Group
Wacker Chemie AG – Annual Report 2018

The following table shows the categories in the fair value hierarchy to which the financial assets and liabilities meas-ured at fair value in the statement of financial position are allocated. The table also shows financial assets and liabilities measured at cost in the statement of financial position. Their fair values are given in the Notes:
Fair Value Hierarchy 2018
€ million Fair value hierarchy Total
Level 1 Level 2 Level 3
As of December 31, 2018Financial assets measured at fair valueFair value through profit or loss
Derivatives that do not qualify for hedge accounting (FVPL)
Investments in equity instruments – trading (FVPL)
Fair value through other comprehensive income / through profit or lossDerivatives that qualify for hedge accounting
Securities – both held-to-collect and for sale (FVOCI)
Securities – trading (FVPL)
Total
Financial assets measured at amortized costLoans – held-to-collect
Total
Financial liabilities measured at fair valueFair value through profit or loss
Derivatives that do not qualify for hedge accounting (FVPL)
Fair value through other comprehensive income / through profit or lossDerivatives that qualify for hedge accounting
Total
Financial liabilities measured at amortized costFinancial liabilities
Total
– 4.0 – 4.0
– – 11.3 11.3
– 6.7 – 6.7
5.6 – – 5.6
20.2 – – 20.2
25.8 10.7 11.3 47.8
– 89.6 – 89.6
– 89.6 – 89.6
– 4.8 – 4.8
– 6.4 – 6.4
– 11.2 – 11.2
– 965.5 – 965.5
– 965.5 – 965.5
161
Consolidated Financial Statements – Notes of the WACKER Group
Wacker Chemie AG – Annual Report 2018

WACKER regularly reviews whether its financial instruments are still allocated to the appropriate fair-value-hierarchy levels. As was the case in the previous year, no reclassifica-tions were carried out within the fair value hierarchy in 2018.
In the period under review, WACKER measured only financial assets and liabilities at fair value. The market values were calculated using market information available on the report-ing date and based on counterparties’ quoted prices or via appropriate valuation methodologies (discounted cash-flow or well-established actuarial methodologies, such as the par method).
Derivative financial instruments and financial assets (trading and held-to-collect and for sale) are recognized at fair value and are thus subject to a recurring fair value assessment.
The fair value of derivative financial instruments is calcu-lated based on market data such as exchange rates or yield curves in accordance with market-specific valuation methodologies. The calculation of the fair value contains our own and the counterparty’s default risk, using maturity-
matching and market-observable CDS values. The fair value of financial assets (trading and held-to-collect and for sale) can be derived from prices listed in active markets.
Loans and financial liabilities are measured at amortized cost. However, the fair values must be provided in the Notes.
The fair value of loans corresponds to the present value of expected future cash flows. Application of the discounted cash flow method using market interest rates means that the carrying amount of the loans corresponds to their fair value.
The fair value of financial liabilities is determined using the net present value method and is based on standard market interest rates.
WACKER measured equity instruments not held for trading in the amount of € 11.3 million at fair value pursuant to IFRS 9 and reallocated these to Level 3 of the fair value hierarchy. The equity instruments concerned consist of small, regional investments in companies that operate infrastructure
Fair Value Hierarchy 2017
€ million Fair value hierarchy Total
Level 1 Level 2 Level 3
As of December 31, 2017Financial assets measured at fair valueFair value through profit or loss
Derivatives that do not qualify for hedge accounting (FVPL)
Fair value through other comprehensive income / through profit or lossDerivatives that qualify for hedge accounting
Securities – both held-to-collect and for sale (FVOCI)
Securities – trading (FVPL)
Total
Financial assets measured at amortized costLoans – held-to-collect
Total
Financial liabilities measured at fair valueFair value through profit or loss
Derivatives that do not qualify for hedge accounting (FVPL)
Fair value through other comprehensive income / through profit or lossDerivatives that qualify for hedge accounting
Total
Financial liabilities measured at amortized costFinancial liabilities
Total
– 3.0 – 3.0
– 10.4 – 10.4
103.5 – – 103.5
– – – –
103.5 13.4 – 116.9
– 90.5 – 90.5
– 90.5 – 90.5
– 0.7 – 0.7
– – – –
– 0.7 – 0.7
– 964.8 – 964.8
– 964.8 – 964.8
162
Consolidated Financial Statements – Notes of the WACKER Group
Wacker Chemie AG – Annual Report 2018

facilities. No fair value exists for these companies since no active market values are available. WACKER considers the historical cost of these equity instruments to be the best approximation of their fair value. No further information is available that would enable a model-based measure-ment. Due to the non-profit nature of these entities, the noncurrent assets they hold and that are utilized by WACKER represent the best input factor for measuring fair value. A percentage of these assets is reflected in the acquisition costs. WACKER reviews the carrying amounts of investments in equity instruments once a year to counter the risk of an impaired asset. WACKER had no intention of selling any of the shares reported as of December 31, 2018.
The unilateral call option (Level 3 of the fair value hierarchy) held by WACKER for the purchase of 1 percent of the shares in the subsidiary WACKER Asahikasei Silicones Co. Ltd., Japan was recognized at cost as of December 31, 2018. The amortized cost best reflects the option’s fair value.
No changes were made to the valuation methodology compared with the previous year.
Management of Financial RisksIn the normal course of business, WACKER is exposed to credit, liquidity, and market risks from financial instruments. The aim of financial risk management is to limit risks from operations and the resultant financing requirements by using certain derivative and non-derivative hedging instruments.
The risks connected with the procurement, financing and selling of WACKER’s products and services are described in detail in the management report. WACKER counters financial risks via the risk management system it has in place. That system is monitored by the Supervisory Board The fundamental purpose of the risk management system is to identify, analyze, coordinate, monitor and communicate risks in a timely manner. The Executive Board receives regular analyses on the extent of those risks. The analyses focus on market risks, in particular on the potential impact of raw-material price risks, foreign-exchange risks and interest-rate risks on EBITDA and the interest result.
Credit Risk (Risk of Default)In terms of financial instruments, the Group is exposed to a default risk should a contractual party fail to fulfill its commitments. The maximum risk is therefore the amount of the respective financial instrument’s positive fair value. To limit the risk of default, particularly for investments of securities and cash, transactions are conducted only
within defined limits and with partners of very high credit standing. To ensure risks are managed as efficiently as possible, the market risks within the Group are controlled centrally. The transactions are concluded and managed in compliance with internal credit-risk principles and are subject to monitoring procedures that take account of the separation of duties. As for operations, outstanding receivables and default risks are continually monitored and hedged with trade credit insurance, advance payments and bank guarantees. Customer credit ratings and limits are based on generally available information from rating agencies and internal documents. No collateral exists for financial instruments. Receivables from major customers are not high enough to represent an extraordinary con-centration of risks. Default risks are accounted for by loss allowances and advance payments received are taken into account. For information on default risks, please refer to the Accounting and Valuation Principles and the Notes to the individual items of the statement of financial position.
Liquidity RiskA liquidity risk means that a company may not be able to meet its existing or future financial obligations due to inadequate funds. To ensure uninterrupted solvency and financial flexibility, the Group holds not only long-term lines of credit at financial institutions with high credit ratings, but also liquid funds based on multiyear financial planning and rolling liquidity planning.
To limit liquidity risk, WACKER keeps liquid reserves in the form of current investments and unused lines of credit. WACKER has also concluded agreements with a number of banks for long-term syndicated loans and bilateral loans.
For information on the maturity analysis for non-derivative financial liabilities, please refer to the note on Financial Liabilities.
See Note 14
Market RiskMarket risk refers to the risk that fair values or future cash flows of a primary or derivative financial instrument could fluctuate due to changing risk factors.
Foreign-Exchange RiskThe potential currency exposure to be hedged with derivative financial instruments is determined on the basis of the company’s major foreign-currency income and expenditure. The greatest risk results from the US dollar. US-dollar income is taken to mean all sales invoiced in US dollars, while all purchases in US dollars as well as site
163
Consolidated Financial Statements – Notes of the WACKER Group
Wacker Chemie AG – Annual Report 2018

costs incurred in US dollars are reported under US-dollar expenditure. The US dollar is the only relevant risk variable for the sensitivity analysis in accordance with IFRS 7, since the largest share of foreign-currency cash flows is in US dollars. By comparison, increases in the euro exchange rate against the renminbi (CNY) and yen (JPY ) have a minor impact. In determining sensitivity, we simulate a 10-percent US-dollar devaluation against the euro, taking as a starting point the exchange rate used in the forecast. Such a deval-uation would have had an effect on EBITDA of € –52 million as of December 31, 2018 and of € –50 million as of Decem-ber 31, 2017. The effect from cash-flow-hedge designated items would have increased equity before income taxes by € 15.8 million (versus € 22.2 million a year earlier ). The Group’s currency exposure amounted to € 516 million as of December 31, 2018 (versus € 498 million).
Interest-Rate RiskThe interest-rate risk results mainly from financial liabilities and interest-bearing investments. The Executive Board determines the mix of fixed- and variable-interest financial debt. Interest rate derivatives are concluded as required, taking account of the given structure. Depending on whether the instrument in question has a fixed or variable interest rate, the interest rate risks are measured on the basis of either market-value sensitivity or cash-flow sensi-tivity. As financial liabilities and fixed-interest investments are measured at amortized cost, under IFRS 7 they are not subject to any interest-rate risk. Fixed-interest securities are recognized at fair value. Due to their short maturities, they are not subject to a significant risk of changes in interest rates. Hedge accounting is not used for any of the interest-rate derivatives. Changes in market interest rates have an impact on the net interest income generated by variable-interest financial instruments and are thus included in the calculation of earnings-related sensitivity. Changes in the market interest rates of interest-rate derivatives affect the financial result, and are consequently included in any earnings-related sensitivity analysis. If the market interest rate on December 31, 2018 had been 100 base points lower (December 31, 2017: lower), the interest result would have been € 1.2 million (€ 1.4 million) lower ( lower).
Raw-Material Price RiskIn general, the company is faced with the risk that its sup-plies of raw materials may be inadequate and that potential increases in raw-material prices could threaten its results. These risks are covered by long-term contracts. Cash flow hedge accounting is used only to a minor degree for long-term energy needs in Norway. This item is recognized in profit or loss under the cost of goods sold.
Derivative Financial InstrumentsFinancial risks are also hedged using derivative financial instruments. The raw-material price risks that WACKER hedges against result principally from ongoing energy procurement. Electricity-supply prices are hedged via contracts for which the “own-use exemption” rules of IFRS 9 can generally be invoked. These contracts, which are concluded for the purpose of receiving or delivering non-financial goods according to WACKER’s own needs, are not recognized as derivatives, but rather as pending transactions.
In those cases where WACKER hedges against currency risks, it uses derivative financial instruments, in particular foreign-exchange forwards and swaps. Derivatives are used only if they are backed by positions, cash deposits and funding, or scheduled transactions arising from opera-tions. The scheduled transactions also include anticipated, but not yet invoiced, sales in foreign currencies.
Foreign-exchange hedging is carried out, in particular, for the US dollar. Potential interest rate hedges are based on the maturities of the underlying transactions.
Operational foreign-exchange hedging relates to the receivables and liabilities already recognized, and generally covers time horizons of between two and three months. The time horizon for strategic hedging is between three and a maximum of fifteen months. The hedged cash flows influence the statement of income at the time when sales are realized. The cash inflows are usually recorded shortly afterward, depending on the payment deadline. As well as receivables from and liabilities to third parties, intercom-pany financial receivables and liabilities are hedged.
The fair values refer to the repurchase values (redemption values) of the financial derivatives as of the reporting date and are calculated using recognized actuarial methods.
The derivatives are recognized at fair value, irrespective of their stated purpose. They are reported in the statement of financial position under other financial assets or other financial liabilities. Where permissible, cash flow hedge accounting is carried out for the strategic hedging of currency-exchange risks from future foreign-exchange positions. For further details, please refer to explanations in the Accounting and Valuation Principles. Depending on the nature of the underlying transaction, they are posted in the statement of income either under the operating result or, if financial liabilities are being hedged, under interest result or other financial result.
164
Consolidated Financial Statements – Notes of the WACKER Group
Wacker Chemie AG – Annual Report 2018

For strategic hedging purposes, the aim is to achieve a hedging ratio of some 50 percent in relation to the expected net exposure in US dollars. The expected net exposure for 2019 is about 45 percent hedged. The average hedging ratio for operational hedging in US dollars is around 50 percent.
In 2018, the accumulated income and expenses recorded directly in equity included a pre-tax result from cash flow hedges amounting to € –12.8 million (versus € 17.4 million in the prior year), of which € 0.8 million concerned closed cash flow hedges. During 2018, € 0.5 million was reclassified to the statement of income, after € 1.1 million in the prior year. WACKER determines the effectiveness of the economic relationship between the hedged underlying transaction and the hedging instrument based on maturities, currencies and nominal amounts, with the hedge ratio between the hedging instrument and underlying transaction always being 100 percent in hedge accounting. WACKER uses the hypothetical derivative method to monitor whether the designated derivatives effectively hedge the cash flows of underlying transactions. The credit risk of counterparties and changes in the timing of the highly probable future transactions hedged represent possible sources of inef-fectiveness. In the result for the period, no gains or losses from ineffective hedge accounting were recorded, as the hedging relationships were almost entirely effective and the changes in value of hedging instruments were thus almost contrary to those of the underlying transactions. The following table shows the effects on the Group’s earnings and net assets of the strategic hedging of currency risks from future foreign-currency positions:
The purpose of fair value hedges is to hedge against changes in the fair value of financial assets and liabilities due to exchange-rate risk ( foreign-exchange swaps). If the hedge is effective, the carrying amount of the corre-sponding underlying transaction is amended to reflect the changes in the fair value of the hedged risks. In fiscal 2018, WACKER recognized an expense of € 25.8 million from the realization and measurement of the hedging instruments under fair value hedges (versus income of € 59.7 million in the prior year). At the same time, income of € 18.0 million was realized on the underlying transactions (versus an expense of € –71.7 million a year earlier ). Both amounts were recognized in the financial result. The differences result from the US dollar-euro interest rate component of the hedges. The interest rate component has no influence on the effectiveness of the fair value hedge. The fair value hedge no longer existed as of December 31, 2018.
€ million Dec. 31, 2018 Dec. 31, 2017
Nominal values
Market values
Nominal values
Market values
Forward exchange contracts
Foreign exchange swaps
Interest rate derivatives
Other derivatives
Total
Market values of derivative financial instruments used for hedge accounting
447.7 -10.2 949.4 11.6
20.0 0.8 – –
60.0 0.7 – –
12.9 9.5 16.7 1.1
540.6 0.8 966.1 12.7
– -0.3 – 10.4
€ million 2018 2017
Forward exchange contracts for strategic hedgingCarrying amount liability
Carrying amount receivable
Nominal amount
Of which noncurrent
Change in value of hedged underlying transaction used to determine the effectiveness of hedging relationship
Average hedging rate USD / €
-5.9 –
– 4.2
-163.5 -189.7
-24.0 -12.0
5.9 -4.2
1.22 1.19
165
Consolidated Financial Statements – Notes of the WACKER Group
Wacker Chemie AG – Annual Report 2018

The foreign exchange derivatives mainly comprise forwards and swaps amounting to US$ 493.0 million, ¥ 1,400 million, CNY 75.0 million (versus US$ 392.0 million, ¥ 400.0 million and € 619.0 million a year earlier). Derivatives with market values of € –10.3 million are due in 2019.
The interest rate derivatives comprise an interest rate swap for a nominal amount of € 60.0 million that transforms the fixed interest rate of a loan into a variable interest rate. The swap expires in January 2023 and has the same maturity as the loan installment.
Other derivatives involve electricity futures traded on the Norwegian market for a nominal amount of € 12.9 million
(€ 16.7 million in the prior year). The electricity futures are used to limit the risk of rising spot-market prices for energy via structured price setting on the electricity market. The hedged amount represents up to 90 percent of the Holla (Norway) site’s future silicon-production power needs not covered by long-term supply contracts. The futures have maturities of between one and three years. Derivatives with maturities until 2021 were concluded. The average hedging rate was € 25.3/MWh (€ 25.3/MWh in the prior year).
The following table contains information on the netting of financial assets and liabilities in the consolidated statement of financial position.
In addition to the financial instruments complying with the provisions on netting pursuant to IAS 32, the table also includes those financial instruments that are subject to netting agreements or master netting agreements but may not be netted pursuant to IAS 32.
As a part of its strategic hedging activities, WACKER closes out forward-exchange contracts prior to maturity by means of offsetting transactions. The strategic forward-exchange contract and the corresponding offsetting forward- exchange transaction are recognized as a net amount in accordance with IAS 32 criteria. In addition, general offset-ting agreements, which apply only in cases of insolvency, have been concluded with a number of banks.
The net amount shows the amount of financial assets or lia-bilities that, despite netting and global netting agreements, is not received or must be paid in the event of insolvency.
20 Notes to the Statement of Cash FlowsCash flow from operating activities is calculated using the indirect method, which adjusts the relevant changes in statement-of-financial-position items for any exchange-rate effects and effects of changes in the scope of consolidation. This means that changes to the relevant statement-of-financial-position items cannot be reconciled with the corresponding values based on the published consolidated statements of financial position.
Construction-related borrowing costs that have to be capitalized were deducted from the interest payments recognized in cash flow from operating activities. These construction-related borrowing costs increased the capital expenditure included in cash flow from investing activities by € 2.2 million (versus € 1.3 million in the prior year).
Financial Assets / Liabilities Subject to Netting Agreements, Enforceable Global Netting Agreements and Similar Agreements
€ million Dec. 31, 2018 Dec. 31, 2017
Derivatives with a
positive market value
Derivatives with a
negative market value
Derivatives with a
positive market value
Derivatives with a
negative market value
I Gross amounts of recognized financial assets / liabilities
II Gross amounts of recognized financial assets / liabilities netted out in the statement of financial position
I + II Net amounts of financial assets / liabilities presented in the statement of financial position
Related amounts not netted out in the statement of financial positionFinancial Instruments
Net amount
11.7 -12.2 13.7 -1.0
-1.0 1.0 -0.3 0.3
10.7 -11.2 13.4 -0.7
-1.3 1.3 -1.6 –
9.4 -9.9 11.8 -0.7
166
Consolidated Financial Statements – Notes of the WACKER Group
Wacker Chemie AG – Annual Report 2018

In the case of cash flow from investing activities, the actual outflows of funds are reported. It is also not possible to reconcile these figures with the additions to investments in the consolidated statement of financial position. If sub-sidiaries or business activities are acquired or sold, the effects of these transactions are shown as separate items in the statement of cash flows. Investment in securities falling due in more than three months is reported sepa-rately under cash flow from investing activities because, in economic terms, these transactions are considered an element of liquidity.
The Group’s financing is predominantly provided through bank loans granted in the form of loan commitments. Within the defined approval limits for loan commitments, our utilization of credit may be subject to fluctuations both within a given year and over several years. Loans raised and repaid in foreign currencies are converted at the exchange rate prevailing on the transaction date. The following table shows a reconciliation of all cash inflows and outflows as well as other non-cash changes in financial liabilities:
Please see Note 10 for more details on the composition of funds comprising cash and cash equivalents.
See Note 10
Cash flow from discontinued operations includes the pro rata cash flow of the Siltronic segment, from both operating and investing activities, until the deconsolidation date.
21 Explanatory Notes on Segment ReportingThe Group’s segment reporting is in line with the internal organizational and reporting structure. WACKER reports on four operating segments (Silicones, Polymers, Biosolutions and Polysilicon), which are organized and managed auton-omously on the basis of the type of products they offer and their different risk and income structures. For a detailed description of the segments’ products and organization, please refer to the Management Report. Business segments are not combined. Any activities or results not assigned to an operating segment are shown under “Other,” including the result from the investment in Siltronic. Foreign currency gains and losses are also shown under “Other.”
Items in the statement of financial position and statement of income are assigned to the operating segments in accordance with economic power. Assets used jointly by several segments are generally shown under “Other” if they cannot be assigned clearly to a particular segment. A similar approach is adopted for external financing. The carrying amount of the strategic investment in Siltronic, which is accounted for using the equity method, is also recognized under “Other.” For the geographical regions, the assets and liabilities are assigned in accordance with where the respective Group company’s site is located. Sales are classified in accordance with both the customer’s location and the respective Group company’s site. The income from, and the carrying amount of, the equity-accounted invest-ment in Siltronic were assigned to the region “Germany.”
WACKER measures the segments’ success using the seg-ment profitability variable EBITDA. EBITDA is calculated by adjusting EBIT for depreciation and amortization, impair-ments, and write-ups. EBIT consists of the gross profit from sales, selling and general administrative expenses, research and development expenses, and other operating income and expenses, including income from investments in joint ventures and associates and other income from investments.
Cash and Non-Cash Changes in Financial Liabilities
€ million Jan. 1, 2018
Cash changes
Non-cash changes
Dec. 31, 2018
Acquisitions / disposals
Exchange- rate-related
changes
Other
Liabilities to banks
Lease obligations
Other financial liabilities
Financial liabilities
633.5 49.1 – -7.0 -0.6 675.0
29.8 -4.3 – 0.8 – 26.3
338.3 -57.0 – 11.4 3.2 295.9
1,001.6 -12.2 – 5.2 2.6 997.2
167
Consolidated Financial Statements – Notes of the WACKER Group
Wacker Chemie AG – Annual Report 2018

Asset additions, depreciation, amortization and reversals of impairment losses refer to intangible assets, to prop-erty, plant and equipment, to investment property and to financial assets. Internal sales show the sales that are generated between the segments. They are settled mainly on the basis of market prices or the planned cost of sales. Segment information is based on the same presentation and accounting methods used for the consolidated finan-cial statements. Receivables and liabilities, provisions, income, expenses, and results between the segments are eliminated in the course of consolidation.
Generally, the assets reported for the segments encompass all of their assets. Loans, cash and cash equivalents, and deferred tax assets, however, are allocated to the “Other” segment.
The liabilities shown for the segments represent all of their liabilities – except deferred tax liabilities, which are shown under “Other.” The Group’s financial liabilities are allocated to individual segments in proportion to the segment assets. Provisions for pensions are allocated in accordance with Group personnel ratios. Advance payments received are allocated directly to the individual segments.
Non-cash expenses and income are divided up between the individual segments as follows:
The decline in both advance payments received for poly-silicon deliveries and advance payments retained due to the termination of polysilicon contracts amounted to € 43.1 million (versus € 71.7 million in the prior year ). The increase of €1.3 million (versus a decrease of €0.5 million) was attributable to the Biosolutions segment. The “Other” segment grew by € 3.3 million in the year under review.
Important valuation changes not recognized through profit or loss concern changes in the market value of derivative financial instruments (cash flow hedging) and changes in value from the remeasurement of defined benefit pension plans.
Changes in the market value of derivative financial instruments from cash flow hedging were attributable to WACKER SILICONES, at € 4.6 million (after € 0.0 million in the prior year) and to the “Other” segment, at € –7.5 million (after € 8.4 million). A change of € –6.0 million (after € 5.5 million) in derivative financial instruments from the investment in Siltronic was also recognized under “Other.”
The changes in value due to the remeasurement of defined benefit plans are allocated to the segments as follows:
In addition to Germany, the USA and China are the only countries in which WACKER generates significant sales from a Group standpoint. Measured in relation to the headquar-ters of the selling unit, sales amounted to € 660.2 million in the USA (after € 627.2 million in the previous year) and € 517.4 million in China (after € 455.1 million). Measured by the customer location in the USA and China, the respective sales generated were € 670.4 million (after € 652.1 million) and € 940.9 million (versus € 1,044.9 million). WACKER has no major customer whose sales it is obliged to disclose.
Changes in Value from the Remeasurement of Defined Benefit Pension Plans
€ million 2018 2017
SILICONES
POLYMERS
BIOSOLUTIONS
POLYSILICON
Other
Total
-36.9 27.0
-12.7 9.8
-3.8 2.4
-22.5 18.2
-73.4 69.8
-149.3 127.2
Other Non-Cash Expenses (+) and Income (– )
€ million 2018 2017
SILICONES
POLYMERS
BIOSOLUTIONS
POLYSILICON
Other
Total
2.5 -0.9
-0.2 -0.5
-1.0 -3.3
77.1 -16.3
-12.2 61.0
66.2 40.0
168
Consolidated Financial Statements – Notes of the WACKER Group
Wacker Chemie AG – Annual Report 2018

The reconciliation of the segments’ aggregate results with the net income for the year is shown in the following list:
22 Breakdown of Shareholdings Unless otherwise stated, the following figures for interna-tional subsidiaries were calculated in accordance with IFRS.
Reconciliation of Segment Results (EBIT )
€ million 2018 2017
Operating result of reporting segments
Consolidation
Group EBIT
Financial result
Income before taxes
Income taxes
Net income from continuing operations
Net income from discontinued operations
Net income for the year
390.4 420.6
-0.8 3.1
389.6 423.7
-65.2 -96.3
324.4 327.4
-64.3 -77.3
260.1 250.1
– 634.7
260.1 884.8
Serial number Activity Identi-fier*
Equity in € ’000
Net income for the year
in € ’000
Capital share in %
Held by serial
number 1
Affiliated CompaniesGermany
1 Alzwerke GmbH, Munich
2 DRAWIN Vertriebs-GmbH, Hohenbrunn-Riemerling
3 Wacker-Chemie Versicherungsvermittlung GmbH, Munich
4 Wacker-Chemie Beteiligungsfinanzierungs GmbH, Munich
5 Wacker Polysilicon Geschäftsführungs GmbH, Nünchritz
6 Wacker-Chemie Erste Venture GmbH, Munich
7 Wacker-Chemie Zweite Venture GmbH, Munich
8 Wacker-Chemie Sechste Venture GmbH, Munich
9 Wacker Biotech GmbH, Jena
10 Wacker-Chemie Siebte Venture GmbH, Munich
11 Wacker-Chemie Achte Venture GmbH, Munich
12 Wacker-Chemie Zehnte Venture GmbH, Munich
13 Wacker-Chemie Elfte Venture GmbH, Munich
14 Wacker-Chemie Zwölfte Venture GmbH, Munich
Other a), b) 7,160 – 100.00 0
Silicones a), b) 5,013 -2 100.00 0
Other a), b) 26 – 100.00 0
– 29 – 100.00 0
– 26 -1 100.00 0
– 79 – 100.00 0
– 35 – 100.00 0
– 27 – 100.00 0
Biosolutions a), b) 290 – 100.00 0
– 24 – 100.00 0
– a), b) 2,753 – 100.00 0
– 24 -1 100.00 0
– 24 -1 100.00 0
– 24 -1 100.00 0
169
Consolidated Financial Statements – Notes of the WACKER Group
Wacker Chemie AG – Annual Report 2018
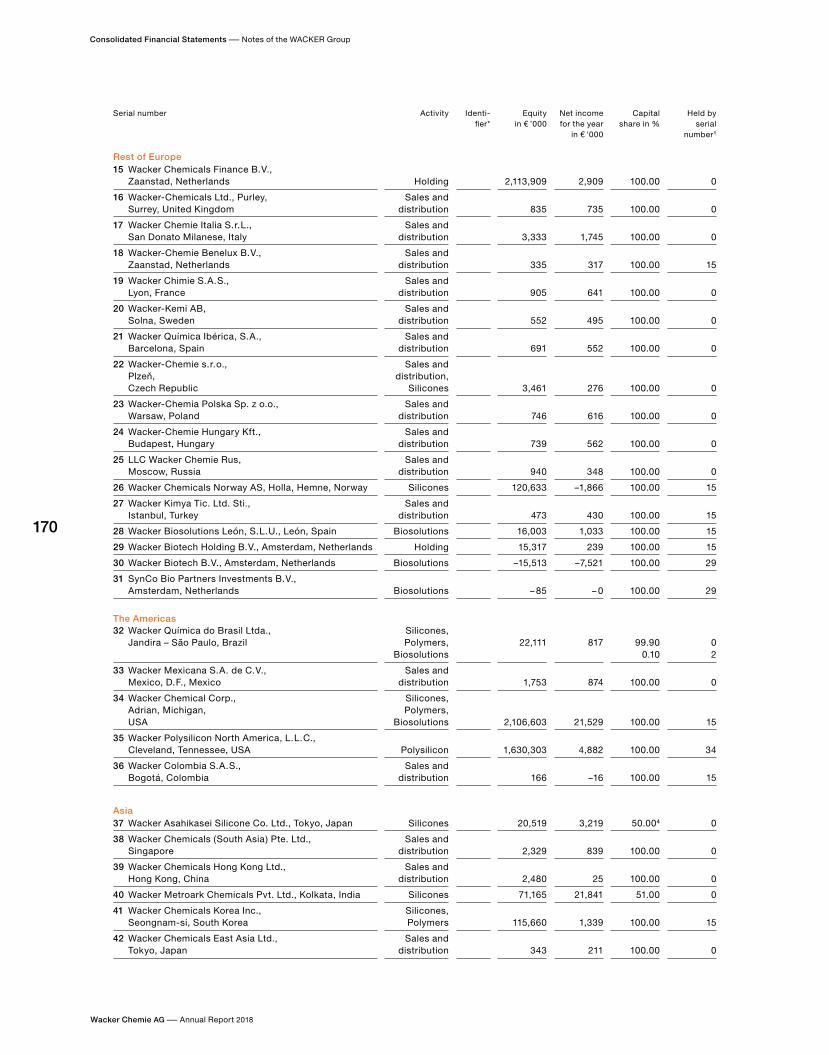
Serial number Activity Identi-fier*
Equity in € ’000
Net income for the year
in € ’000
Capital share in %
Held by serial
number 1
Rest of Europe15 Wacker Chemicals Finance B. V.,
Zaanstad, Netherlands
16 Wacker-Chemicals Ltd., Purley, Surrey, United Kingdom
17 Wacker Chemie Italia S. r. L., San Donato Milanese, Italy
18 Wacker-Chemie Benelux B. V., Zaanstad, Netherlands
19 Wacker Chimie S. A. S., Lyon, France
20 Wacker-Kemi AB, Solna, Sweden
21 Wacker Química Ibérica, S. A., Barcelona, Spain
22 Wacker-Chemie s. r. o., Plzeň, Czech Republic
23 Wacker-Chemia Polska Sp. z o.o., Warsaw, Poland
24 Wacker-Chemie Hungary Kft., Budapest, Hungary
25 LLC Wacker Chemie Rus, Moscow, Russia
26 Wacker Chemicals Norway AS, Holla, Hemne, Norway
27 Wacker Kimya Tic. Ltd. Sti., Istanbul, Turkey
28 Wacker Biosolutions León, S. L. U., León, Spain
29 Wacker Biotech Holding B. V., Amsterdam, Netherlands
30 Wacker Biotech B. V., Amsterdam, Netherlands
31 SynCo Bio Partners Investments B. V., Amsterdam, Netherlands
The Americas32 Wacker Química do Brasil Ltda.,
Jandira – São Paulo, Brazil
33 Wacker Mexicana S. A. de C. V., Mexico, D. F., Mexico
34 Wacker Chemical Corp., Adrian, Michigan, USA
35 Wacker Polysilicon North America, L. L. C., Cleveland, Tennessee, USA
36 Wacker Colombia S. A. S., Bogotá, Colombia
Asia37 Wacker Asahikasei Silicone Co. Ltd., Tokyo, Japan
38 Wacker Chemicals (South Asia) Pte. Ltd., Singapore
39 Wacker Chemicals Hong Kong Ltd., Hong Kong, China
40 Wacker Metroark Chemicals Pvt. Ltd., Kolkata, India
41 Wacker Chemicals Korea Inc., Seongnam-si, South Korea
42 Wacker Chemicals East Asia Ltd., Tokyo, Japan
Holding 2,113,909 2,909 100.00 0
Sales and distribution 835 735 100.00 0
Sales and distribution 3,333 1,745 100.00 0
Sales and distribution 335 317 100.00 15
Sales and distribution 905 641 100.00 0
Sales and distribution 552 495 100.00 0
Sales and distribution 691 552 100.00 0
Sales and distribution,
Silicones 3,461 276 100.00 0
Sales and distribution 746 616 100.00 0
Sales and distribution 739 562 100.00 0
Sales and distribution 940 348 100.00 0
Silicones 120,633 -1,866 100.00 15
Sales and distribution 473 430 100.00 15
Biosolutions 16,003 1,033 100.00 15
Holding 15,317 239 100.00 15
Biosolutions -15,513 -7,521 100.00 29
Biosolutions -85 -0 100.00 29
Silicones, Polymers,
Biosolutions 22,111 817 99.90
0.100 2
Sales and distribution 1,753 874 100.00 0
Silicones, Polymers,
Biosolutions 2,106,603 21,529 100.00 15
Polysilicon 1,630,303 4,882 100.00 34
Sales and distribution 166 -16 100.00 15
Silicones 20,519 3,219 50.004 0
Sales and distribution 2,329 839 100.00 0
Sales and distribution 2,480 25 100.00 0
Silicones 71,165 21,841 51.00 0
Silicones, Polymers 115,660 1,339 100.00 15
Sales and distribution 343 211 100.00 0
170
Consolidated Financial Statements – Notes of the WACKER Group
Wacker Chemie AG – Annual Report 2018

23 Related Party DisclosuresIAS 24 stipulates that a person or company which controls, or is controlled by, Wacker Chemie AG must be disclosed unless the party in question is already included in Wacker Chemie AG’s consolidated financial statements as a consolidated company. A shareholder is deemed to have control if the shareholder has more than half of the voting rights in Wacker Chemie AG or, by virtue of provisions in the Articles of Association or contractual arrangements, has the possibility of controlling the financial and business policy of the WACKER Group’s Executive Board.
In the year under review, the WACKER Group was affected by the disclosure obligations under IAS 24 in respect of the business relations with Wacker Chemie AG’s major share-holders and its Executive and Supervisory Board members. The principles of IAS 24 also apply to all transactions with non-consolidated subsidiaries, associates and joint ventures, since Wacker Chemie AG exercises significant influence over them.
Dr. Alexander Wacker Familiengesellschaft mbH, Munich, informed Wacker Chemie AG on June 7, 2006, that it holds over 50 percent of the voting shares in Wacker Chemie AG. Blue Elephant Holding GmbH, Pöcking, informed Wacker Chemie AG on April 12, 2006, that it holds over 10 percent of the voting shares in Wacker Chemie AG.
Other Regions50 Wacker Chemicals Australia Pty. Ltd.,
Melbourne, Australia
51 Wacker Chemicals Middle East FZE, Dubai, UAE
Joint Ventures / Associates 52 Dow Siloxane (Zhangjiagang) Holding Co.
Private Ltd., Singapore 2
53 Wacker Dymatic Silicones (Shunde) Co. Ltd., Foshan, China
54 Siltronic AG, Munich 2
Special-Purpose Entity55 WMM Universal-Fonds, Germany 3
*
a)
b)
1
2
3
4
Identifier:Wacker Chemie AG has concluded profit and loss transfer agreements with these entities.The shareholders of Wacker Chemie AG have agreed not to disclose the financial statements of these entities (Section 264 (3) of the German Commercial Code).
Serial number 0: Wacker Chemie AGOnly direct holdings in the relevant parent companies are listed; figures from consolidated financial statements in accordance with IFRSShare of special assets; as per IFRSControl on the basis of potential voting rights
Sales and distribution 672 372 100.00 0
Sales and distribution 3,286 479 100.00 0
Silicones 393,388 1,645 25.00 0
Silicones 23,071 3,421 50.00 46
Other 917,007 401,913 30.83 0
5,709 -52 100.00 0
43 Wacker Chemicals Fumed Silica (Zhangjiagang) Holding Co. Private Ltd., Singapore
44 Wacker Chemicals Fumed Silica (Zhangjiagang) Co. Ltd., Zhangjiagang, China
45 Wacker Chemicals (Zhangjiagang) Co. Ltd., Zhangjiagang, China
46 Wacker Chemicals (China) Co. Ltd., Shanghai, China
47 Wacker Chemicals (Nanjing) Co. Ltd., Nanjing, China
48 Wacker Chemie India Pvt. Ltd., Mumbai, India
49 PT. Wacker Chemicals Indonesia, Tangerang, Indonesia
Serial number Activity Identi-fier*
Equity in € ’000
Net income for the year
in € ’000
Capital share in %
Held by serial
number 1
Holding 47,939 -18 51.00 0
Silicones 26,911 3,411 100.00 43
Silicones 63,095 9,096 100.00 46
Sales and distribution 208,234 30,543 100.00 0
Polymers, Biosolutions 58,662 5,946 100.00 46
Sales and distribution
4,020 412 99.90 0.10
15 0
Silicones, Polymers,
Biosolutions 179 5 99.00
1.0015 2
171
Consolidated Financial Statements – Notes of the WACKER Group
Wacker Chemie AG – Annual Report 2018

The WACKER Group is controlled by its majority shareholder, Dr. Alexander Wacker Familiengesellschaft mbH, which holds over 50 percent of the voting shares in Wacker Chemie AG.
The provision of services between Wacker Chemie AG and its majority shareholder, Dr. Alexander Wacker Familien-gesellschaft mbH, as well as with the shareholders of Dr. Alexander Wacker Familiengesellschaft mbH and their close family members, is of subordinate importance, and concerns, to a minor extent, the renting of office space and exchange of services. None of these services is of significant business scope. These transactions are conducted at arm’s length.
Further, WACKER Group companies have not conducted any material transactions with members of Wacker Chemie AG’s Executive or Supervisory Boards or with any other key management personnel or with companies of whose executive or supervisory bodies these persons are mem-bers. The same applies to close family members of the aforementioned persons.
Wacker Chemie AG’s pension fund is also considered a related party pursuant to IAS 24. The provision of services takes place between the two entities in the area of company pension plan benefits. WACKER makes payments to plan assets to cover pension obligations. Wacker Chemie AG also rents the headquarters building and the land on which it stands from a subsidiary of the pension fund. Overall, expenditures amounted to € 37.1 million (versus € 36.6 million in the prior year). As of December 31, 2018, receivables amounted to € 0.0 million (versus € 31.5 million), while liabili-ties came to € 1.2 million (versus € 0.0 million).
Further detailed information has been published in the German register of companies.
www.unternehmensregister.de
Business with joint ventures and associates, the pension fund, and non-consolidated subsidiaries is conducted under conditions that are customary between outside third parties (arm’s length transactions). Contractually agreed transfer-price formulas have been defined for joint-venture and associated-company product shipments.
Transactions with joint ventures and associates relate to such supplies and services that arise in the normal course of business (for example in connection with sales revenue, license revenue and administrative expense allocations). Joint ventures and associates submitted invoices for material purchases and commissions. Any guarantees or other security pledges are reported under Other Financial Obligations.
See Note 16
In addition, there was a loan to an associate totaling € 89.6 million (€ 90.5 million in the prior year).
Related Party Disclosures
€ million 2018 2017
Income Expenses Receivables Liabilities Income Expenses Receivables Liabilities
Associates
Joint ventures
177.8 141.8 14.7 18.6 135.2 131.0 12.0 19.1
7.3 1.2 0.7 0.1 5.5 1.0 0.5 0.1
172
Consolidated Financial Statements – Notes of the WACKER Group
Wacker Chemie AG – Annual Report 2018

Information Regarding Compensation for the Supervisory and Executive Boards:
Detailed information about Executive Board compensation is contained in the compensation report, which forms part of the management report. German commercial law (HGB) requires the inclusion of this information in the notes to the consolidated financial statements.
Other business relations with members of the Supervisory and Executive Boards comprise the purchase and sale of shares in Wacker Chemie AG. Such transactions take place on customary market terms and conditions. These transactions were published both in the German register of companies and on the Wacker Chemie AG website.
www.wacker.com/directors-dealings
The members of Wacker Chemie AG’s Supervisory Board and Executive Board are listed in the “Further Information” section.
24 Events after the Balance Sheet DateNo major events subject to reporting requirements occurred between the balance sheet date (December 31, 2018) and the date of authorization of these financial statements (March 5, 2019). There were no material or fundamental changes in the WACKER Group’s overall economic and business environment.
The Group’s legal and organizational structure remained unchanged.
Munich, March 5, 2019 Wacker Chemie AG
Rudolf Staudigl Christian Hartel
Tobias Ohler Auguste Willems
Compensation for the Executive and Supervisory Boards
€ Fixed compensation
Variable compensation
Retirement benefit plan1
Total
Executive Board compensation 2018
Executive Board compensation 2017
Pension commitments for active members of the Executive Board 2018
Pension commitments for active members of the Executive Board 2017
Compensation for former members of the Executive Board and their surviving dependents 2018
Compensation for former members of the Executive Board and their surviving dependents 2017
Pension commitments for former members of the Executive Board and their surviving dependents 2018
Pension commitments for former members of the Executive Board and their surviving dependents 2017
Supervisory Board compensation 2018
Supervisory Board compensation 2017
1 The compensation for retirement benefits is based on service cost. Interest expense amounted to € 587,097, after € 535,197 in the prior year.
2,717,541 3,986,867 1,270,498 7,974,906
2,631,856 4,956,160 1,415,435 9,003,451
30,768,564
28,090,779
1,963,723
1,995,326
33,981,707
37,590,405
2,161,685 - - 2,161,685
2,152,945 - - 2,152,945
173
Consolidated Financial Statements – Notes of the WACKER Group
Wacker Chemie AG – Annual Report 2018

Declaration by the Executive Board on Accounting Methods and Auditing
The Executive Board is responsible for preparing Wacker Chemie AG’s consolidated financial statements and combined management report. WACKER’s consolidated financial statements were prepared in compliance with the rules published in London by the International Accounting Standards Board ( IASB) and endorsed by the European Union. WACKER has set up effective internal monitoring and steering systems to guarantee that the combined management report and the consolidated financial state-ments comply with the applicable rules and procedures of proper corporate reporting. The internal auditing division continuously examines the reliability and workability of the monitoring and steering systems on a worldwide basis. KPMG AG Wirtschaftsprüfungsgesellschaft has audited Wacker Chemie AG’s consolidated financial statements and Group management report and granted them an unqualified certificate. WACKER’s consolidated financial statements, its combined management report and the au-ditors’ report were discussed in detail by the Supervisory Board’s Audit Committee at its meeting on February 26, 2019. For information about the Supervisory Board’s audit, please refer to its report.
Assurance by the Legal Representatives in Accordance with Sections 297 (2) and 315 (1) HGBTo the best of our knowledge, and in accordance with the applicable reporting principles, the consolidated financial statements give a true and fair view of the Group’s net assets, earnings and financial position, and the combined management report includes a fair review of the develop-ment and performance of the business and the position of the Group, together with a description of the principal op-portunities and risks associated with the Group’s expected development.
Munich, March 5, 2019 Wacker Chemie AG
Rudolf Staudigl Christian Hartel
Tobias Ohler Auguste Willems
174
Wacker Chemie AG – Annual Report 2018
Consolidated Financial Statements – Declaration by the Executive Board on Accounting Methods and Auditing

Reproduction of the Independent Auditor’s Report
To Wacker Chemie AG, Munich
Report on the Audit of the Consolidated Financial Statements and of the Group Management Report
OpinionsWe have audited the consolidated financial statements of Wacker Chemie AG and its subsidiaries (the Group), which comprise the consolidated statement of financial position as at December 31, 2018, the consolidated income statement, the consolidated statement of comprehensive income, con-solidated statement of changes in equity and consolidated statement of cash flows for the financial year from January 1 to December 31, 2018 and notes to the consolidated financial statements, including a summary of significant accounting policies. In addition, we have audited the report on the position of the Company and the Group for the financial year from January 1 to December 31, 2018.
In our opinion, on the basis of the knowledge obtained in the audit,
– the accompanying consolidated financial statements comply, in all material respects, with the IFRSs as adopted by the EU, and the additional requirements of German commercial law pursuant to Section 315e (1) HGB [Handelsgesetzbuch: German Commercial Code] and, in compliance with these requirements, give a true and fair view of the assets, liabilities, and finan-cial position of the Group as at December 31, 2018, and of its financial performance for the financial year from January 1 to December 31, 2018, and
– the accompanying group management report as a whole provides an appropriate view of the Group’s po-sition. In all material respects, this group management
report is consistent with the consolidated financial statements, complies with German legal requirements and appropriately presents the opportunities and risks of future development. Our opinion on the group management report does not cover the content of the non-financial statement and the corporate gover-nance statement mentioned above.
Pursuant to Section 322 (3) sentence 1 HGB, we declare that our audit has not led to any reservations relating to the legal compliance of the consolidated financial statements and of the group management report.
Basis for the OpinionsWe conducted our audit of the consolidated financial statements and of the group management report in accor-dance with Section 317 HGB and the EU Audit Regulation No. 537/2014 (referred to subsequently as “EU Audit Regulation”) and in compliance with German Generally Accepted Standards for Financial Statement Audits promulgated by the Institut der Wirtschaftsprüfer [Institute of Public Auditors in Germany] ( IDW). Our responsibilities under those requirements and principles are further described in the “Auditor’s Responsibilities for the Audit of the Consolidated Financial Statements and of the Group Management Report” section of our auditor’s report. We are independent of the group entities in accordance with the requirements of European law and German commercial and professional law, and we have fulfilled our other German professional responsibilities in accordance with these requirements. In addition, in accordance with Article 10 (2) point (f ) of the EU Audit Regulation, we declare that we have not provided non-audit services prohibited under Article 5 (1) of the EU Audit Regulation. We believe that the evidence we have obtained is sufficient and appropriate to provide a basis for our opinions on the consolidated financial statements and on the group man-agement report.
Key Audit Matters in the Audit of the Consolidated Financial Statements Key audit matters are those matters that, in our professional judgment, were of most significance in our audit of the con-solidated financial statements for the financial year Janu-ary 1 to December 31, 2018. These matters were addressed in the context of our audit of the consolidated financial statements as a whole, and in forming our opinion thereon, we do not provide a separate opinion on these matters.
175
Wacker Chemie AG – Annual Report 2018
Consolidated Financial Statements – Reproduction of the Independent Auditor’s Report

Assessment on the evaluation of the insurance refund claim “Explosion at the Charleston production site”Please refer to the explanatory notes to the financial state-ments for further information on this audit matter. Further explanations can be found in the notes to the financial statements (Note 16 “Contingent Liabilities, Contingent Assets, Other Financial Obligations and Other Risks”) and in the combined management report (sections “Key Events Affecting Business Performance” and “Comparing Actual with Forecast Performance”).
THE FINANCIAL STATEMENT RISKThere was an explosion at a production plant unit in Charleston, Tennessee, in September 2017. This plant, as well as the plants in Burghausen and Nünchritz – all of which are part of the WACKER Group (‘WACKER’) – produce polysilicon. The Charleston plant resumed production in 2018 and returned to full rated capacity starting in Decem-ber 2018 once the facility had been restored. WACKER has insurance that covers damage to property and damage due to business interruption. Property damage insurance covers the costs to restore the plant to its original condition. The recognition of insurance refund claims requires judge-ment on the part of WACKER with regard to assessing the matter and an evaluation of whether the requirements for the recognition of an asset arising from insurance refund claims as a whole are fulfilled in accordance with financial reporting standards. Potential property damage refund claims were recognised as an asset as at 31 December 2018 and offset against the advance payment received from the insurance in financial year 2018. Regarding the claim for business interruption, a reliable estimation by Wacker Chemie AG according to the financial reporting requirements was not yet possible on the amount of damage at the date of preparation of financial statements. Meetings with the insurer did not result in a sufficiently specified claim due to the high complexity and short period of time since restoration to full production capacity until the date of financial statement preparation. As a result, no asset was recognised as at the reporting date based on business interruption insurance claims.
There is the risk for the consolidated financial statements that the insurance claims were not recognised in the correct amount.
OUR AUDIT APPROACHBy talking with the management board, representatives of the WACKER POLYSILICON division, Corporate Accounting and Corporate Controlling as well as the legal and insur-ance departments and plant management in Charleston, among others, we particularly obtained information on the current status of discussions with the insurer. We also evaluated the communication with the insurer and the experts of WACKER involved. We assessed the expert’s opinion in face-to-face interviews and through a third party confirmation. We also gained an understanding of the current uncertainties with regard to the measurement and recognition of these insurance refund claims.
With regard to the property damage refund claims rec-ognised, we examined the costs which WACKER considered refundable on a sample basis and assessed whether the costs are directly associated with restoration of the damaged plant and therefore covered by insurance.
We audited whether the management board’s assessment on the basis of communication with the expert and the insurer is reasonable with regard to potential business disruption claims.
Based on our knowledge and experience, we assessed application of the relevant financial reporting standards with regard to recognition and the reliability of estimates of the amount of property damage insurance and business disruption insurance refund claims.
OUR OBSERVATIONSWACKER’s assumptions with regard to recognition and assessment of the requirements for financial reporting of the anticipated refund claims are appropriate.
Impairment testing of property, plant and equipment in the WACKER POLYSILICON segmentFor further information on the presentation of the WACKER POLYSILICON division in the reporting year, please refer to ‘Segment Information by Division’ in the consolidated financial statements and ‘Segments’ reporting in the combined management report. Please refer to the presentation in the notes ( ‘Accounting and Valuation Principles’ ) for information on the accounting policies applied.
176
Consolidated Financial Statements – Reproduction of the Independent Auditor’s Report
Wacker Chemie AG – Annual Report 2018

THE FINANCIAL STATEMENT RISKThe carrying amount of the assets in the WACKER POLYSILICON segment was EUR 2.3 billion as at the reporting date. Business performance of the WACKER POLYSILICON segment was influenced in the past by fluctuating market prices for polysilicon and in financial year 2018 by a decline in market prices for polysilicon. In financial year 2018, the decision of China to curb further construction of photo-voltaic plants slowed the demand for solar panels. This de-cision had an impact on earnings of the WACKER POLYSILICON segment. The production plants in Burg hausen, Nünchritz and Charleston are assigned to this segment. An impair-ment loss on property, plant and equipment of the WACKER POLYSILICON segment was not recognised in the report-ing year.
Property, plant and equipment must be tested for impair-ment if there are specific indications of potential impairment. The recoverable amount of the item of property, plant and equipment (asset) concerned has to be estimated, i. e. the higher of its fair value less costs to sell and its value in use.
An indicator of potential impairment could be the current level of prices for polysilicon, which has a significant im-pact on the development of the division’s anticipated cash inflows and outflows according to the adopted operational plans. Operational planning and, thus, the assessment of whether property, plant and equipment of the WACKER POLYSILICON segment are impaired requires judgement and numerous forward-looking estimates – e. g. regarding the future demand of volumes based on the anticipated further construction of photovoltaic plants and development of the semiconductor market, price developments, global expansion of polysilicon production capacities and the cash inflows and outflows anticipated as a result. Against this background and due to the high level of investment, the risk of impaired property, plant and equipment in the WACKER POLYSILICON segment was of material significance during our audit.
OUR AUDIT APPROACHWe obtained an understanding of the Company’s process for the identification of indications of impairment as well as for the determination of recoverable amount based on explanations provided by staff of Corporate Accounting. We analysed the indications of impairment identified by the Company and, on the basis of information obtained
within the scope of our audit, assessed whether there are any indications of further impairment not identified by the Company. We received the impairment test prepared by the Company for the WACKER POLYSILICON segment. By talking with the management board, representatives of the WACKER POLYSILICON segment and Corporate Account-ing, among others, we obtained an understanding of the assumptions and parameters used for measurement. By involving our valuation experts, we assessed the Com-pany’s valuation model for compliance with IFRS in addition to computational accuracy. In addition, we compared the appropriateness of the assumptions underlying the antici-pated cash inflows and outflows of the WACKER POLYSILICON segment, together with the business plan approved by the supervisory board, with general and sector-specific market expectations (peer group comparison), especially the vol-ume and price developments in the area of photovoltaics and semiconductors. Among other approaches, we used information from prior periods as well as current interim results to analyse adherence to budget.
OUR OBSERVATIONSThe assumptions and parameters used by the Company for impairment testing of property, plant and equipment in the WACKER POLYSILICON segment, and the conclusions drawn therefrom, are appropriate
Other InformationManagement is responsible for the other information. The other information comprises the separate non-financial report and corporate governance statement which we obtained prior to the date of this independent auditor’s report, and the remaining parts of the annual report which will presumably be submitted to us after this date, with the exception of the audited consolidated financial statements and the report on the position of the Company and the Group and our auditor’s report.
Our opinions on the consolidated financial statements and on the group management report do not cover the other information, and consequently we do not express an opinion or any other form of assurance conclusion thereon.
In connection with our audit, our responsibility is to read the other information and, in so doing, to consider whether the other information
177
Consolidated Financial Statements – Reproduction of the Independent Auditor’s Report
Wacker Chemie AG – Annual Report 2018

– is materially inconsistent with the consolidated financial statements, with the group management report or our knowledge obtained in the audit, or
– otherwise appears to be materially misstated.
Responsibilities of Management and the Supervisory Board for the Consolidated Financial Statements and the Group Management ReportManagement is responsible for the preparation of the con-solidated financial statements that comply, in all material respects, with IFRSs as adopted by the EU and the additional requirements of German commercial law pursuant to Section 315e (1) HGB and that the consolidated financial statements, in compliance with these requirements, give a true and fair view of the assets, liabilities, financial posi-tion, and financial performance of the Group. In addition, management is responsible for such internal control as they have determined necessary to enable the preparation of consolidated financial statements that are free from material misstatement, whether due to fraud or error.
In preparing the consolidated financial statements, man-agement is responsible for assessing the Group’s ability to continue as a going concern. They also have the responsi-bility for disclosing, as applicable, matters related to going concern. In addition, they are responsible for financial reporting based on the going concern basis of accounting unless there is an intention to liquidate the Group or to cease operations, or there is no realistic alternative but to do so.
Furthermore, management is responsible for the prepa-ration of the group management report that, as a whole, provides an appropriate view of the Group’s position and is, in all material respects, consistent with the consolidated financial statements, complies with German legal require-ments, and appropriately presents the opportunities and risks of future development. In addition, management is responsible for such arrangements and measures (systems) as they have considered necessary to enable the prepa-ration of a group management report that is in accordance with the applicable German legal requirements, and to be able to provide sufficient appropriate evidence for the assertions in the group management report.
The supervisory board is responsible for overseeing the Group’s financial reporting process for the preparation of the consolidated financial statements and of the group management report.
Auditor’s Responsibilities for the Audit of the Consolidated Financial Statements and of the Group Management Report Our objectives are to obtain reasonable assurance about whether the consolidated financial statements as a whole are free from material misstatement, whether due to fraud or error, and whether the group management report as a whole provides an appropriate view of the Group’s position and, in all material respects, is consistent with the consol-idated financial statements and the knowledge obtained in the audit, complies with the German legal requirements and appropriately presents the opportunities and risks of future development, as well as to issue an auditor’s report that includes our opinions on the consolidated financial statements and on the group management report.
Reasonable assurance is a high level of assurance, but is not a guarantee that an audit conducted in accordance with Section 317 HGB and the EU Audit Regulation and in compliance with German Generally Accepted Standards for Financial Statement Audits promulgated by the Institut der Wirtschaftsprüfer ( IDW) will always detect a material misstatement. Misstatements can arise from fraud or error and are considered material if, individually or in the aggre-gate, they could reasonably be expected to influence the economic decisions of users taken on the basis of these consolidated financial statements and this group manage-ment report.
We exercise professional judgment and maintain profes-sional skepticism throughout the audit. We also:
– Identify and assess the risks of material misstatement of the consolidated financial statements and of the group management report, whether due to fraud or error, design and perform audit procedures respon-sive to those risks, and obtain audit evidence that is sufficient and appropriate to provide a basis for our opinions. The risk of not detecting a material mis-
178
Consolidated Financial Statements – Reproduction of the Independent Auditor’s Report
Wacker Chemie AG – Annual Report 2018
statement resulting from fraud is higher than for one resulting from error, as fraud may involve collusion, forgery, intentional omissions, misrepresentations, or the override of internal control.
– Obtain an understanding of internal control relevant to the audit of the consolidated financial statements and of arrangements and measures (systems) relevant to the audit of the group management report in order to design audit procedures that are appropriate in the circumstances, but not for the purpose of expressing an opinion on the effectiveness of these systems.
– Evaluate the appropriateness of accounting policies used by management and the reasonableness of esti-mates made by management and related disclosures.
– Conclude on the appropriateness of management’s use of the going concern basis of accounting and, based on the audit evidence obtained, whether a material uncertainty exists related to events or condi-tions that may cast significant doubt on the Group’s ability to continue as a going concern. If we conclude that a material uncertainty exists, we are required to draw attention in the auditor’s report to the related disclosures in the consolidated financial statements and in the group management report or, if such dis-closures are inadequate, to modify our respective opinions. Our conclusions are based on the audit evidence obtained up to the date of our auditor’s report. However, future events or conditions may cause the Group to cease to be able to continue as a going concern.
– Evaluate the overall presentation, structure and con-tent of the consolidated financial statements, includ-ing the disclosures, and whether the consolidated financial statements present the underlying trans-actions and events in a manner that the consolidated financial statements give a true and fair view of the assets, liabilities, financial position and financial per-formance of the Group in compliance with IFRSs as adopted by the EU and the additional requirements of German commercial law pursuant to Section 315e (1) HGB.
– Obtain sufficient appropriate audit evidence regarding the financial information of the entities or business activities within the Group to express opinions on the consolidated financial statements and on the group management report. We are responsible for the direc-tion, supervision and performance of the group audit. We remain solely responsible for our opinions.
– Evaluate the consistency of the group management report with the consolidated financial statements, its conformity with [German] law, and the view of the Group’s position it provides.
– Perform audit procedures on the prospective infor-mation presented by management in the group man-agement report. On the basis of sufficient appropriate audit evidence we evaluate, in particular, the signif-icant assumptions used by management as a basis for the prospective information, and evaluate the proper derivation of the prospective information from these assumptions. We do not express a separate opinion on the prospective information and on the assumptions used as a basis. There is a substantial unavoidable risk that future events will differ materi-ally from the prospective information.
We communicate with those charged with governance regarding, among other matters, the planned scope and timing of the audit and significant audit findings, including any significant deficiencies in internal control that we identify during our audit.
We also provide those charged with governance with a statement that we have complied with the relevant independence requirements, and communicate with them all relationships and other matters that may reasonably be thought to bear on our independence, and where appli-cable, the related safeguards.
179
Consolidated Financial Statements – Reproduction of the Independent Auditor’s Report
Wacker Chemie AG – Annual Report 2018

From the matters communicated with those charged with governance, we determine those matters that were of most significance in the audit of the consolidated financial statements of the current period and are therefore the key audit matters. We describe these matters in our auditor’s report unless law or regulation precludes public disclosure about the matter.
Other Legal and Regulatory Requirements
Further Information pursuant to Article 10 of the EU Audit RegulationWe were elected as group auditor by the annual general meeting on May 9, 2018. We were engaged by the super-visory board on December 15, 2018. We have been the group auditor of the Wacker Chemie AG without interruption since the financial year 2006.
We declare that the opinions expressed in this auditor’s report are consistent with the additional report to the audit committee pursuant to Article 11 of the EU Audit Regulation ( long-form audit report).
German Public Auditor Responsible for the Engagement
The German Public Auditor responsible for the engagement is Johannes Hanshen.
Munich, 5th March 2019 KPMG AG Wirtschaftsprüfungsgesellschaft
Original German version signed by:Andrejewski Hanshen Wirtschaftsprüfer Wirtschaftsprüfer [German Public Auditor] [German Public Auditor]
180
Consolidated Financial Statements – Reproduction of the Independent Auditor’s Report
Wacker Chemie AG – Annual Report 2018

d
181 220
Fu
rth
er
Info
rma
tio
n
FurtherInformation
Pharmaceutical business expands with the acquisition of a further production site,
in Amsterdam
2018:
New Sitein Amsterdam
13505_GB18_Kapiteltrenner_de_en.indd | v8 | 12. März 2019, 3:00 vorm.
d
Further InformationSupervisory Board, Executive Board,
Corporate Governance Report and Non-Financial Report
Supervisory Board 183 Executive Board 184 Corporate Governance Report and Declaration on Corporate Management 185 Separate Non-Financial Statement Combined for the WACKER Group and for Wacker Chemie AG 197Limited Assurance Report of the Independent Auditor 211
Multiyear Overview 213 Chemical Glossary / Financial Glossary 215 List of Tables and Figures 218 Index 219

Supervisory Board
Dr. Peter-Alexander Wacker 1, 2, 3
Chairman Bad Wiessee Former President & CEO of Wacker Chemie AG, businessman
Chairman of the Supervisory BoardBlue Elephant Energy AG
Chairman of the Administrative Council and Board of Trusteesifo Institute – Leibniz-Institut für Wirtschaftsforschung an der Universität München e. V.
Manfred Köppl *, 1, 2, 3
Deputy ChairmanKirchdorf Chairman of the Employee Council, Burghausen Plant, Wacker Chemie AG
Peter Áldozó *Burghausen Deputy Chairman of the Group Employee Council of Wacker Chemie AG
Dr. Andreas H. BiagoschMunich Managing Director of Impacting l GmbH & Co. KG and Impact GmbH
Member of the Board of DirectorsAshok Leyland, Chennai, India Hinduja Leyland Finance, Chennai, India
Member of the Supervisory BoardAixtron SE
Member of the Advisory BoardATHOS Service GmbH Lürssen Werft GmbH & Co. KG
Member of the Southern Regional Advisory CouncilCommerzbank AG
Dr. Gregor BieblMunich Director General Bavarian State Chancellery
Matthias BieblMunich Attorney and in-house lawyer UniCredit Bank AG
Dagmar Burghart *(until May 9, 2019)Kirchdorf Team Leader of Retirement Benefits Service Center, Wacker Chemie AG
Ingrid Heindl *(since May 9, 2018)Reischach Member of the Employee Council, Burghausen Plant, Wacker Chemie AG
Konrad Kammergruber *Burghausen Director of Infrastructure Services, Wacker Chemie AG
Jörg Kammermann *(since November 14, 2018)Burghausen District Chairman of the IG BCE labor union, Altötting
Member of the Supervisory BoardCeramTec GmbH
Eduard-Harald Klein *, 1
Neuötting Chairman of the Group and General Employee Councils of Wacker Chemie AG
Franz-Josef Kortüm 1, 2, 3
Munich Former Chairman of the Executive Board of Webasto SE
Chairman of the Supervisory BoardWebasto SE
Chairman of the Advisory CouncilBrose Fahrzeugteile GmbH & Co. KG
Member of the Board of DirectorsAutoliv Inc., USA
Barbara Kraller *Taching Deputy Chairwoman of the General Employee Council of Wacker Chemie AG
Deputy Chairwoman of the Employee Council, Burghausen Plant, Wacker Chemie AG
Seppel Kraus *Olching Regional head of the IG BCE labor union, Bavaria
Member of the Supervisory BoardNovartis Deutschland GmbH Hexal AG
183
Further Information – Supervisory Board
Wacker Chemie AG – Annual Report 2018

Harald Sikorski *(until October 31, 2018)Munich District Chairman of the IG BCE labor union, Westphalia
Deputy Chairman of the Supervisory BoardRAG Anthrazit Ibbenbüren GmbH (since June 1, 2018)
Member of the Supervisory BoardSiltronic AG Vivawest GmbH (since March 1, 2018) Vivawest Wohnen GmbH (since April 18, 2018) RAG AG (since July 1, 2018) RAG Deutsche Steinkohle (since July 1, 2018)
Dr. Thomas Strüngmann(until May 9, 2018)Bad Wiessee Co-Managing Director of ATHOS Service GmbH
Ann-Sophie Wacker(since May 9, 2018)Munich Trainee lawyer
Dr. Susanne WeissMunich Attorney and a partner in the law firm Weiss Walter Fischer-Zernin
Chairwoman of the Supervisory BoardROFA INDUSTRIAL AUTOMATION AG
Member of the Supervisory BoardPorr AG, Austria Schattdecor AG UBM Development AG, Austria
Chairwoman of the Advisory CouncilAlu-Sommer GmbH, Austria Wirtschaftlicher Verband der Stadt und des Landkreises Rosenheim e. V.
Prof. Ernst-Ludwig WinnackerMunich Professor emeritus of Biochemistry at LMU Munich
Executive Board
Dr. Rudolf StaudiglPresident & CEO
WACKER POLYSILICON Executive Personnel Corporate Development Corporate Communications Investor Relations Corporate Auditing Legal Compliance Retirement Benefits
Chairman of the Supervisory BoardPensionskasse der Wacker Chemie VVaG
Deputy Chairman of the Supervisory BoardGroz-Beckert KG
Member of the Supervisory BoardTÜV Süd AG (since July 13, 2018)
Member of the Advisory Council, BavariaDeutsche Bank AG
Dr. Christian Hartel
WACKER POLYMERS WACKER BIOSOLUTIONS (since July 1, 2018) Human Resources (Personnel Director) Corporate Engineering Corporate Research & Development (since July 1, 2018) Intellectual Property (since July 1, 2018) Region: Asia
Dr. Tobias Ohler
Corporate Accounting and Tax Corporate Controlling Corporate Finance and Insurance Information Technology Procurement & Logistics Region: The Americas
Chairman of the Supervisory BoardSiltronic AG
Member of the Supervisory BoardPensionskasse der Wacker Chemie VVaG
Auguste Willems
WACKER SILICONES Sales & Distribution Site Management Corporate Security Environment, Health, Safety Product Stewardship Regions: Europe, Middle East
Member of the Advisory Committee, GermanyTÜV Süd AG
* Employee representative; subject to the rules of the German Trade Union Confederation (DGB) and of the Association of Employed Academics and Executives in the Chemical Industry (VAA) concerning the transfer of supervisory board compensation
1 Mediation Committee (Chairman: Dr. Peter-Alexander Wacker) 2 Executive Committee (Chairman: Dr. Peter-Alexander Wacker) 3 Audit Committee (Chairman: Franz-Josef Kortüm)
184
Wacker Chemie AG – Annual Report 2018
Further Information – Supervisory Board – Executive Board

Corporate Governance Report and Declaration on Corporate Management
Corporate governance is an important part of a company’s success and of responsible corporate management and supervision. Wacker Chemie AG attaches great importance to the rules of proper corporate governance. In this report, the Executive Board provides details – also for the Super-visory Board – on corporate governance in accordance with Section 3.10 of the German Corporate Governance Code (the Code) and Sections 289f and 315d of the German Commercial Code (HGB).
Declaration of Conformity and Corporate Governance ReportingIn 2018, the Executive Board and the Supervisory Board dealt intensively with the company’s corporate governance and the recommendations of the Code in its currently valid version, published on February 7, 2017. The Executive and Supervisory Boards resolved in December 2018 to issue the following Declaration of Conformity, which is available to the general public on the company’s website.
Declaration of Conformity 2018 Issued by the Executive Board and Supervisory Board of Wacker Chemie AG1. General Declaration Pursuant to Section 161
of the German Stock Corporation Act (AktG)In December 2018, the Executive Board and the Supervisory Board of Wacker Chemie AG issued their most recent decla-ration of conformity pursuant to Section 161 of the German Stock Corporation Act (AktG). Since that time, Wacker Chemie AG has complied with the recommendations of the German Corporate Governance Code (the Code) as amended on February 7, 2017, with the exceptions listed in the following, and will continue to comply with the recom-mendations of the Code in said version, with the following exceptions.
2. Exceptionsa) D & O Insurance Deductible for Supervisory Board
Members (Section 3.8 (2))German law and a company’s articles of association set clear limits with regard to a supervisory board’s ability to exert influence on the business activities of a stock corporation. Pursuant to Section 76 (1) of the German Stock Corporation Act (AktG), the executive board has direct responsibility for managing the corporation. The supervisory board is instrumental in defining the main
features of corporate strategy. However, beyond this contribution, the supervisory board’s abilities are limited in terms of influencing the implementation of corporate strat-egy or operations. The same applies to measures taken to avert damage or loss to the company. Furthermore, since our Supervisory Board members receive only a relatively small amount for reimbursement of expenses compared to our Executive Board compensation, we do not deem the agreement of a deductible reasonable for members of our Supervisory Board.
b) Forward-Looking Assessment Basis for Variable Compensation of Executive Board Members (Section 4.2.3 (2))
The variable components of the Executive Board members’ compensation are calculated on a three-year assessment basis. Furthermore, 15 percent of the variable compensation is paid in the form of shares that are subject to a holding period of two years. Even if the assessment basis is not essentially forward-looking, we are of the opinion that our compensation system is balanced and suitable for setting the right incentives for a sustainable corporate policy. Our compensation system ensures that our Executive Board members participate in positive and negative developments at the company over a longer period – by means of the share component on the one hand and the average assessment over a three-year period on the other.
c) Formation of a Nomination Committee within the Supervisory Board (Section 5.3.3)
A supervisory board is required to establish a nomination committee that is exclusively composed of shareholder representatives and whose task it is to make recommen-dations to the supervisory board with regard to candidates suitable for proposal to the annual shareholders’ meeting.
We do not comply with this recommendation because, in view of our shareholder structure, we do not believe that the formation of such a committee is appropriate. Due to the majority situation, nominations to the Supervisory Board must be agreed with the majority shareholder in any case, so that an additional nomination committee would not serve to increase efficiency.
d) Defining Concrete Objectives Regarding the Number of Independent Members of the Supervisory Board (Section 5.4.1 (2))
The Supervisory Board of Wacker Chemie AG, as it is composed at present, meets the requirements of the Code regarding an adequate number of independent members. The Supervisory Board will continue to ensure that, in future elections, it recommends to the shareholders what it considers to be an appropriate number of independent candidates. Additionally defining a concrete objective in this regard would not only limit the choice of suitable
185
Further Information – Corporate Governance Report and Declaration on Corporate Management
Wacker Chemie AG – Annual Report 2018

candidates for the Supervisory Board, but also restrict the shareholders’ right to elect those Supervisory Board mem-bers whom they consider to be the most suitable. For these reasons, we do not comply with this recommendation.
e) Limit to Supervisory Board Members’ Term of Office (Section 5.4.1 (2))
According to this recommendation, the supervisory board shall determine a general limit to its members’ term of office. A generally applicable term limit of this sort is not required in our opinion, as we consider an individual analysis of our Supervisory Board members to be more effective. This par-ticularly applies, since the Code provides for self-inspection of the supervisory board and its members anyway as part of the regular examination of efficiency. Furthermore, a general term limit would restrict the majority shareholder’s freedom to choose representatives on the Supervisory Board at its own discretion in fulfillment of its corporate responsibility.
f ) Curriculum Vitae of Supervisory Board Members (Section 5.4.1 (5))
According to this recommendation, proposals for candi-dates for the supervisory board should be accompanied by a curriculum vitae, while the résumés of existing mem-bers should be published on the company’s website. We fulfill the legal requirements regarding the proposals for candidates. Furthermore, the annual report includes the essential information on our Supervisory Board members. We believe that such information is sufficient. We do not see what additional merit a curriculum vitae could have – in particular when taking into account the rights of privacy of our Supervisory Board members.
g) Time Limit Placed on Applications for the Judicial Appointment of a Supervisory Board Member (Section 5.4.3)
According to this recommendation, applications for the judicial appointment of a supervisory board member shall be limited in time up to the next annual shareholders’ meeting.
We do not comply with this recommendation. Proposals for candidates to be appointed by the court are agreed with the majority shareholder beforehand anyway. In view of the majority situation, the election of this same candidate at the next Annual Shareholders’ Meeting would merely constitute a confirmation of his /her appointment, which we consider redundant.
h) Announcement of Proposed Candidates for the Chair of the Supervisory Board to Shareholders (Section 5.4.3)
According to this recommendation, shareholders shall be informed of any candidates for the supervisory board chair even though, as a rule, the supervisory board has not
yet been appointed. Under German law, the supervisory board chair must be elected by, and from among, the supervisory board members. There is no legal requirement to announce the candidates for the chair from among a yet-to-be- appointed group of supervisory board members. Furthermore, this would result in a de facto predetermina-tion that is also not provided for under German law. For these reasons, we do not comply with this recommendation.
Corporate Governance ReportingShareholders and Annual Shareholders’ MeetingTransparent Information for Shareholders and the PublicWACKER’s aim is to inform all of the company’s target groups – shareholders, shareholder representatives, ana-lysts and the media – as well as the interested general pub-lic promptly and without preference. We regularly publicize important company dates in a financial calendar published in our Annual Report, in the interim reports and on our website. Capital market participants are in close contact with our Investor Relations team. We inform investors and analysts about the current and future development of business in telephone conferences held whenever a quar-terly report is published. We regularly attend roadshows and investors’ conferences. Once a year, we organize an event for analysts. Important presentations are available on the internet, as well as all press releases and ad-hoc disclosures in both German and English, the online version of the Annual Report, all interim reports and the Sustain-ability Report. Further information is provided by our online customer magazine, media library and Podcast Center.
www.wacker.com
Annual Shareholders’ MeetingThe Annual Shareholders’ Meeting provides an efficient and inclusive forum for informing shareholders about the company’s situation. Even before the Annual Shareholders’ Meeting begins, shareholders receive important information about the previous fiscal year in the Annual Report. The agenda items are described and the conditions of atten-dance explained in the invitation to the Annual Shareholders’ Meeting. The notice of the Annual Shareholders’ Meeting – together with all legally prescribed reports and documents, including the Annual Report (of which the consolidated financial statements and the combined management report form part) – as well as the annual financial statements of Wacker Chemie AG are also available on the company’s website. After the Annual Shareholders’ Meeting, we publish the attendance figures and the results of the votes on the internet. All these communication measures contribute to the regular exchange of information with our shareholders. WACKER helps its shareholders exercise their voting rights by giving them the option of casting their vote either in person or by proxy. Proxies are available to exercise shareholders’ voting rights as instructed and can also be contacted during the Annual Shareholders’ Meeting.
186
Further Information – Corporate Governance Report and Declaration on Corporate Management
Wacker Chemie AG – Annual Report 2018
Working Methods of the Executive and Supervisory BoardsWacker Chemie AG has a dual management system as prescribed by the German Stock Corporation Act (AktG). It consists of the Executive Board, which manages the company, and the Supervisory Board, which supervises and advises the Executive Board in its management of the company. These two bodies are kept strictly separate from one another with regard to both their membership and their spheres of competence. The Executive and Supervisory Boards collaborate closely, however, to ensure WACKER’s sustainable long-term success.
Executive BoardThe Executive Board currently consists of four members. It bears direct responsibility for managing the company and represents Wacker Chemie AG in all dealings with third parties. The Executive Board’s actions and decisions are driven by the company’s interest and the aim to sustainably increase the Group’s value. With this goal in mind, the Executive Board determines the WACKER Group’s strategic alignment. It then steers and monitors this by allocating funds, resources and capacities, and by supporting and overseeing the operating units. The Executive Board also ensures compliance with legal requirements and an appro-priate system of risk management and control.
While the members of the Executive Board bear joint responsibility for managing the company, each individual member is directly responsible for managing his /her respective unit. All Executive Board decisions require a simple majority. In the case of a tie of votes, the president & CEO has the deciding vote. However, he/she does not have the right to veto Executive Board resolutions.
Close Collaboration between the Executive Board and the Supervisory BoardThe Executive Board and the Supervisory Board work together closely to promote the interests of the company. Their common goal is the sustainable growth of the com-pany and the enhancement of its value. The Executive Board reports to the Supervisory Board and the Audit Committee regularly, promptly and comprehensively on all relevant issues of strategy, planning, business develop-ment, risk exposure, risk management and compliance. The Supervisory Board chairman likewise maintains contact with the Executive Board, in particular with the president & CEO, in the periods between meetings, con-sulting with that body on the above-mentioned issues. The Executive Board explains any deviations from approved business plans and objectives to the Supervisory Board and gives reasons for these deviations.
The Rules of Procedure for Wacker Chemie AG’s Executive Board stipulate that certain measures require the consent
of the Supervisory Board before their implementation. These include approving the annual budget ( including financial and investment planning), acquiring and disposing of shares in companies, establishing new production or business units, or suspending existing ones, and conclud-ing sizable long-term loans.
Supervisory BoardThe Supervisory Board appoints, oversees and advises the Executive Board and is directly involved in any decisions of crucial importance to WACKER. Fundamental decisions on the company’s development require Supervisory Board approval.
Supervisory Board CompositionThe Supervisory Board comprises 16 members. In compli-ance with the German Co-Determination Act (MitbestG), it has an equal number of shareholder and employee representatives. Shareholder representatives are elected by the Annual Shareholders’ Meeting and employee repre-sentatives by the employees, as stipulated by the German Co-Determination Act. As a rule, the term of office is about five years.
Targets for the Composition and Skills Profile of the Supervisory Board of Wacker Chemie AGWACKER has always placed importance on having highly qualified individuals sit on its Supervisory Board. In com-pliance with the recommendation made in Item 5.4.1 of the German Corporate Governance Code ( the Code), WACKER’s Supervisory Board resolved in 2010 to set itself concrete objectives with respect to its composition. In September 2017, the Supervisory Board revised these and resolved on the following new objectives for its composi-tion ( including a profile of skills for the entire Supervisory Board ), taking into account the recommendations of the Code:
The Supervisory Board shall be composed in such a way that all its members have the knowledge, skills and profes-sional experience required to properly perform their duties.
( I ) Targets for Composition1. International ExpertiseIn view of the international nature of the company’s business activities, the Supervisory Board shall have an appropriate number of members – but at least one – with international experience.
2. Prevention and Handling of Conflicts of InterestThe Supervisory Board’s Rules of Procedure already contain extensive provisions on members’ conflicts of interest. In addition, the Supervisory Board actively strives to prevent conflicts of interest that are material and not merely of a temporary nature, and takes this goal into
187
Further Information – Corporate Governance Report and Declaration on Corporate Management
Wacker Chemie AG – Annual Report 2018

consideration when making recommendations to the Annual Shareholders’ Meeting.
3. Age Limit for Supervisory Board MembersThe Supervisory Board’s Rules of Procedure provide for a standard retirement age of 80 for its members.
4. DiversityAs regards the diversity of its composition, the Supervisory Board strives to take account of different professional expe-rience, professional expertise and educational backgrounds and, in particular, to ensure appropriate representation of women and men. In accordance with Section 96 (2) of the German Stock Corporation Act (AktG), at least 30 percent of the members of the supervisory board must be women and at least 30 percent men.
( II ) Skills ProfileWhen filling the positions on our Supervisory Board, we strive to achieve a mix of young and old, industry insiders and those from other sectors, and different professional backgrounds. We expect all members to be willing and able to make the necessary commitment to their Supervisory Board duties. Beyond that, the Supervisory Board as a whole must have the skills, knowledge and experience that are important to the WACKER Group’s business activities and that enable it to properly oversee the company and provide professional advice to the Executive Board. This includes the following:
– The Supervisory Board should have sufficient members with the necessary expertise in corporate management, accounting, financial controlling, risk management, corporate governance and compliance.
– The Supervisory Board as a whole must be familiar with the chemical industry (Section 100 (5) AktG).
– At least one member of the Supervisory Board must have expertise in the fields of accounting or auditing (Section 100 (5) AktG).
The Supervisory Board does not comply with the recom-mendation made in Item 5.4.1 of the Code as amended on February 7, 2017, to set a general term limit for the length of service of its members. The reasons for this decision are given in the Declaration of Conformity of December 2018.
The Supervisory Board believes that it comprises an adequate number of independent members. All of its shareholder representatives are classed as independent within the meaning of Item 5.4.2 of the Code. For the reasons given in the Declaration of Conformity of December 2018, we
do not comply with the additional recommendation made in Item 5.4.2 of the Code as amended on February 7, 2017, to name a specific target number of independent members.
The Supervisory Board will take into account the objectives it has set as well as its profile of skills when making its nomination proposals to the Annual Shareholders’ Meeting. The current composition of the Supervisory Board complies with the objectives set in September 2017.
Committees Increase the Supervisory Board’s EfficiencyThe Supervisory Board has constituted three professionally qualified committees to help it perform its duties optimally. The work of those committees is reported on regularly at Supervisory Board meetings.
The Executive Committee prepares the Supervisory Board’s personnel decisions, especially the appointment and dis-missal of Executive Board members and the nomination of the president & CEO. In addition, it negotiates contracts with Executive Board members and develops a compensation system that the full Supervisory Board then uses as a basis for determining the compensation for Executive Board members. In 2018, the Executive Committee consisted of the Chairman of the Supervisory Board, Dr. Peter-Alexander Wacker, and Supervisory Board members Manfred Köppl and Franz-Josef Kortüm.
The Audit Committee does the groundwork for the Super-visory Board’s decision on the adoption of the annual financial statements and the approval of the consolidated financial statements. To this end, the committee is obliged to pre-audit the annual financial statements, the consoli-dated financial statements, the combined management report and the proposal on appropriation of profits. It is also tasked with pre-auditing the separate non-financial report (pursuant to Sections 289b and 315b of the HGB). In addition, it discusses and examines the half-yearly financial reports and the quarterly figures. The Audit Committee gives the Supervisory Board a well-founded recommendation as to which auditors it should propose to the Annual Shareholders’ Meeting. In accordance with the resolution of the Annual Shareholders’ Meeting, it awards the auditing contract to the auditors and determines the focus of auditing. It then monitors the audit, in particular the auditors’ independence and the services they deliver. Above and beyond that, the Audit Committee reviews the accounting process and the effectiveness of the internal control, risk management and auditing systems, as well as compliance-related issues. The members of this committee in 2018 were Franz-Josef Kortüm (as chairman), Dr. Peter- Alexander Wacker and Manfred Köppl.
188
Further Information – Corporate Governance Report and Declaration on Corporate Management
Wacker Chemie AG – Annual Report 2018

In addition, there is the Mediation Committee (mandated by Section 27 (3 ) of the German Co-Determination Act ( MitbestG)). Its duties are to prepare proposals for the Supervisory Board concerning the appointment, and revocation of appointments, of Executive Board members in cases where they fail to achieve the required two-thirds majority of the votes of the Supervisory Board members in the first ballot. In 2018, the committee comprised Dr. Peter-Alexander Wacker (as chairman), Manfred Köppl, Franz-Josef Kortüm and Eduard-Harald Klein.
Key Corporate Management PracticesCompliance as a Key Managerial Duty of the Executive BoardAt WACKER, managerial and monitoring duties include ensuring that the company complies with legal requirements and that employees observe internal company regulations. WACKER’s compliance management system is regularly reviewed and adapted.
These tasks are the responsibility of the compliance management department. For a detailed description of compliance management, please refer to the Risk Man-agement Report on page 181. The company has appointed and trained compliance officers in Germany, the USA, China, Japan, India, South Korea, Brazil, Mexico, Norway, Singapore, Russia and the United Arab Emirates, who hold regular training courses to inform employees of key legal provisions and internal regulations. They also serve as contacts whenever employees have questions or need advice, information and training relating to compliance.
Principles of Corporate Ethics– Beside our vision and goals, our ethical principles form
the third pillar of WACKER’s corporate policy guidelines. These principles – embedded in five separate codes – govern how the company goals should be achieved. A set of rules consisting of regulations and instructions supplement the codes.
– Code of Conduct: contains our principles for dealing with business partners and third parties. It also governs the handling of information, confidentiality and data security, the prevention of money laundering, and the separation of personal and business interests.
– Code of Innovation: specifies our principles concerning research and development, partnerships, patents and innovation management.
– Code of Teamwork & Leadership: outlines our under-standing of teamwork and leadership. Key aspects
here include trust and esteem, motivation and success, recognition and development, teamwork and equal opportunity, work-life balance and the positive example set by managerial employees.
– Code of Safety: defines our safety culture and sets safety guidelines for workplaces, facilities, and prod-ucts and their transport.
– Code of Sustainability: lists principles for sustainability to be adhered to by R & D, procurement and logistics, production and products, and describes our commit-ment to society.
The codes are available at: https://www.wacker.com/cms/en/wacker_
group/wacker_facts/policy/policy.jsp
Responsible Care® and the Global Compact – Integral Parts of Corporate ManagementTwo voluntary global initiatives form the basis for sus-tainable corporate management at WACKER: the chemical industry’s Responsible Care® initiative and the UN’s Global Compact. WACKER has been an active member of the Responsible Care® initiative since 1991. Program partici-pants undertake to continually improve health, safety and environmental performance on a voluntary basis – even in the absence of statutory requirements. WACKER is equally committed to the UN’s Global Compact initiative. We observe the Global Compact’s ten principles, which address social and environmental standards, anticorruption and the protection of human rights. We also expect our suppliers to respect the principles of the Global Compact, and we evaluate them on this point in our risk assessments.
In 2011, WACKER created an internal Corporate Sustainability department, which implements the company’s voluntary commitments under Responsible Care® and the Global Compact, and coordinates its sustainability activities worldwide.
Social CommitmentsCompanies can be commercially successful only if they have society’s trust. Consequently, WACKER is serious about its social responsibilities toward communities near its sites and wherever people are in need around the world. We regularly promote and support a wide variety of charitable projects, organizations and initiatives. Our commitment covers activities relating to science, education, sports and various charities.
189
Further Information – Corporate Governance Report and Declaration on Corporate Management
Wacker Chemie AG – Annual Report 2018

Further Information on Corporate Governance at WACKERCompliance with the Provisions of Art. 17 of MARWe comply with the provisions of Art. 17 of MAR (EU regula-tion No. 596 /2014 – Market Abuse Regulation). For a number of years, we have maintained an ad-hoc publicity coordina-tion unit in which representatives of various specialist areas examine issues for their ad-hoc relevance. In this way, we guarantee that potential insider information is handled in accordance with the law. Employees who have access to insider information as part of their jobs are included in insider lists.
Share Dealings by the Executive and Supervisory BoardsPersons discharging managerial responsibilities (at Wacker Chemie AG, these are members of the Executive and Super-visory Boards) as well as persons closely associated with them are obligated under Art. 19 of MAR to notify the German Financial Supervisory Authority (BaFin) and the company within three business days of transactions conducted on their own account relating to the shares or debt instru-ments of that company or to derivatives or other financial instruments linked thereto. A reporting obligation exists, however, only where the total volume of the transactions made by the person concerned reaches or exceeds € 5,000 within a calendar year.
The transactions reported to Wacker Chemie AG in 2018 were published in
the proper manner; more detailed information can be found at: www.wacker.
com/cms/en/investor-relations/corporate-governance/ directors_dealings/
directors_dealings.jsp
Dealing Responsibly with Opportunities and RisksDealing responsibly with risks is an important part of good corporate governance. WACKER has in place an opportunity and risk management system to regularly identify and monitor material risks and opportunities. Its objective is to recognize risks at an early stage and minimize them through systematic risk management. The Executive Board informs the Supervisory Board regularly about existing risks and their development. The Audit Committee regularly reviews the accounting process and the effectiveness of the internal control, risk management and auditing systems. It is also involved in auditing the financial statements. The opportunity and risk management system is continuously being enhanced and adapted to meet changing conditions.
Accounting and AuditingAs stipulated by the German Corporate Governance Code, we have agreed with the auditors, KPMG AG Wirtschafts-prüfungsgesellschaft, Munich, that the Chairman of the Supervisory Board shall be informed without delay during
the audit about any grounds for disqualification and /or bias. In addition, the auditors shall immediately report all signifi-cant discoveries and events which concern the Supervisory Board’s duties. If, in the course of their audit activities, the auditors establish facts that reveal errors in the Executive and Supervisory Boards’ Declaration of Conformity pur-suant to Section 161 of the German Stock Corporation Act (AktG), the Supervisory Board shall be notified accordingly and/or a note included in the audit report.
D & O InsuranceWACKER has concluded a financial liability insurance policy (D & O insurance) that covers the activities of the Executive Board and Supervisory Board members. This insurance provides for a statutory deductible for the members of the Executive Board.
Supporting the Participation of Women in Executive PositionsEffective May 1, 2015, the German Act on Equal Participation of Women and Men in Executive Positions in the Private and the Public Sector calls for supervisory boards – such as that of Wacker Chemie AG – to be composed of at least 30 percent female members and at least 30 percent male members. A supervisory board as a whole must comply with this gender ratio unless the representatives of either the shareholders or the employees object thereto pursuant to Section 96 (2) sentence 3 of the German Stock Corpo-ration Act (AktG). Both the shareholder and employee representatives on Wacker Chemie AG’s Supervisory Board objected to enforcement of the statutory gender ratio for the Supervisory Board as a whole. As a result, there must be at least two women and two men represented on both the shareholder representative and employee representa-tive sides of the Supervisory Board.
At the Annual Shareholders’ Meeting on May 9, 2018, two women were elected to the Supervisory Board as share-holder representatives. The employees and executives of Wacker Chemie AG had already determined their represen-tatives by a vote on February 28, 2018, likewise electing two women to the Supervisory Board.
The act also requires Wacker Chemie AG to specify target values for the proportion of women on the Executive Board and in the two management levels below the Exec-utive Board. The target values for the Executive Board are set by the Supervisory Board and those for the two management levels below the Executive Board are set by the Executive Board.
190
Further Information – Corporate Governance Report and Declaration on Corporate Management
Wacker Chemie AG – Annual Report 2018

Both the target value for the Executive Board (zero; deadline for implementation: June 30, 2022) and the respective target values for the two management levels below the Executive Board (target value for management level directly below the Executive Board: 16 percent; target value for the second management level below the Executive Board: 18 percent; deadline for implementation in both cases: December 31, 2019) have already been achieved or exceeded.
Diversity Strategy1. Diversity Strategy for the Executive BoardThe Executive Board of Wacker Chemie AG shall be composed in such a way that all its members have the knowledge, skills and experience required to manage a chemical company that is active in international markets. We are convinced that only a diverse group of individuals can do justice to this task. The decisive factor is achieving a balanced composition that reflects a cross-section of the duties involved.
Proceeding on this basis, the Supervisory Board mainly takes the following aspects of diversity into account when proposing new members of the Executive Board:
– High priority is accorded to different educational backgrounds and professional careers. The executive board of a chemical company must have members with scientific expertise and /or experience in the chemical industry. At the same time, knowledge and experience of accounting, financial management, corporate decision- making, planning and strategy are required, as is a profound understanding of the workings and requirements of the capital markets.
– What is more, in a global company like Wacker Chemie AG, different cultural backgrounds – or at least obvious international and intercultural experience – are essential.
– A balanced age structure across the entire Executive Board is also important. The Supervisory Board’s Rules of Procedure provide for a standard retirement age of 67, which must be taken into account when Executive Board members are appointed.
– We are convinced that mixed teams achieve better results – and that also means having women on the Executive Board. In this context, a whole range of measures has already been put in place across the company to raise the proportion of women in man-agement positions.
The goal of the diversity strategy described above is to give the Executive Board an optimal composition to ensure the company is managed in a manner that is both successful and sustainable. A diverse composition guarantees that the Executive Board can assess all relevant issues with the appropriate expertise, view all material aspects from different standpoints and set the right priorities. The standard retirement age for Executive Board members ensures that the company can profit from the longstanding professional and life experience of individual members. At the same time, it enables younger managers to advance to the Executive Board and contribute new ideas and impetus.
The full Supervisory Board takes the diversity strategy into account when making appointments to the Executive Board. The Executive Committee, which is tasked with preparing the personnel decisions of the Supervisory Board, regularly discusses long-term succession planning for the Executive Board, and also takes account of the company’s management staff planning in consultation with the Executive Board members.
The current composition of the Executive Board corre-sponds to the Supervisory Board’s diversity strategy.
2. Diversity Strategy for the Supervisory BoardThe diversity that the Supervisory Board wishes to see in its own composition is reflected in the goals and the profile of skills it adopted in September 2017.
See page 187
Accordingly, the diversity criteria of international and intercultural experience, a balanced age structure, and dif-ferent professional experience, expertise and educational backgrounds are considered when positions on the Super-visory Board are filled. In addition, the Supervisory Board’s Rules of Procedure provide for a standard retirement age of 80 for its members. In accordance with the statutory requirements, the Supervisory Board must also comprise at least 30 percent female members and 30 percent male members, and must have an equal number of shareholder and employee representatives.
The goal of the diversity strategy is to ensure that the Super-visory Board as a whole is able to effectively oversee and advise the Executive Board. A Supervisory Board whose members are diverse in line with above-mentioned criteria is better placed to assess topics from different standpoints, and to scrutinize the Executive Board’s management of the company, its decisions and its strategy in a constructive
191
Further Information – Corporate Governance Report and Declaration on Corporate Management
Wacker Chemie AG – Annual Report 2018

year, as well as on average overall target achievement in the two years prior to the reporting year. The targets are based on the following key indicators: business value contribution, cash flow, target return, and return on capital employed (ROCE). The computational target bonus in the event of 100-percent target achievement during the evalu-ation period depends on the Executive Board member in question and amounts to either 180 percent or 140 percent of the average annual base salary in the last year of the evaluation period. The maximum bonus, too, depends on the specific Board member and amounts to either 220 per-cent or 180 percent of the average annual base salary in the last year of the evaluation period. The Supervisory Board thus has the discretion to increase or reduce the calculated bonus by as much as 30 percent, taking into account all cir-cumstances and the Executive Board member’s individual performance. The Executive Board members are obligated to purchase Wacker Chemie AG shares for an amount equal to 15 percent of their annual gross bonus and to hold these for at least two years. First of all, the annual gross bonus is calculated, 15 percent of which is invested in shares. Any taxes payable are deducted from the remaining 85 percent of the annual gross bonus and the net amount disbursed to the Executive Board members. As a result, around 30 percent of the annual net bonus is accounted for by the stock component and has a forward-looking, multiyear assessment basis. The exact percentage depends on each Executive Board member’s personal tax situation.
( III ) A contribution to retirement benefits:The members of the Executive Board are entitled to payment of an annual retirement pension should the event insured against occur, i. e. reaching retirement age or suf-fering permanent occupational disability. The amount of the pension is calculated on the basis of the last pensionable fixed annual salary received and the length of Executive Board membership. A percentage of the pensionable base salary is defined as a basic amount and adjusted by means of an annual percentage rate of increase for each year of service. Entitlement to a pension presupposes at least five years of service on the Executive Board. Since 2016, increases in the annual salaries of Dr. Rudolf Staudigl and Auguste Willems have taken the form of additional fixed, non-pensionable salary components and thus have no influence on the calculation of their pensions – though they do have an effect on the calculation of their long-term bonuses (see ( II ) above).
The company grants the members of the Executive Board appropriate insurance coverage, in particular D & O insur-ance, with a deductible as stipulated in the German Stock Corporation Act (AktG).
Compensation ReportThe following compensation report forms part of the com-bined management report and of the audited consolidated financial statements.
Compensation System for the Executive BoardOn the basis of preparatory input from the Executive Committee, the full Supervisory Board is responsible for determining the individual compensation paid to members of Wacker Chemie AG’s Executive Board.
In accordance with the Executive Board compensation sys-tem in effect since January 1, 2010, the Executive Board’s compensation comprises the following key components:
( I ) A fixed annual salary:The fixed annual salary is paid in equal monthly installments.
( II ) A variable, performance-related bonus:The amount of the variable bonus ( long-term bonus), which is paid annually and in arrears, depends on the achievement of agreed annual Group targets set by the Supervisory Board for all Executive Board members. The bonus is calculated based on target achievement in the reporting
and comprehensive manner. The retirement-age provision enables members to contribute their longstanding profes-sional and life experience for the good of the company. At the same time, it ensures that younger individuals can advance to the Supervisory Board at regular intervals.
The Supervisory Board gives due consideration to this diversity strategy when presenting its recommendations for candidates to the Annual Shareholders’ Meeting; this occurred most recently at the Supervisory Board elections held in 2018. What is more, during its regular examinations of efficiency, the Supervisory Board conducts a self-evalua-tion that also includes aspects such as its own composition and diversity.
The Supervisory Board currently meets the targets as regards its composition and fulfills both the skills profile and diversity strategy. In particular, with the election of Ms. Ann-Sophie Wacker and the re-election of Dr. Susanne Weiss at the Annual Shareholders’ Meeting 2018, the Supervisory Board now has two female representatives of the shareholders’ interests. There are likewise two female representatives of the employees’ interests: Ms. Ingrid Heindl and Ms. Barbara Kraller. The number of women representatives thus increased from three to four in 2018 and complies with the statutory requirements.
192
Further Information – Corporate Governance Report and Declaration on Corporate Management
Wacker Chemie AG – Annual Report 2018

If they leave the company, Executive Board members are subject to a twelve-month obligatory waiting period, during which they are paid competitive-restriction compensation. The competitive-restriction compensation is calculated as 50 percent of the member’s latest overall annual compensa-tion (average of the last three years). Any pension received is set off against the competitive-restriction compensation.
If Executive Board membership is prematurely terminated without good cause, the contracts with Executive Board members specify that any compensatory payments shall be limited to a maximum of two full annual salaries. This is referred to as the severance payment cap.
Total Compensation for the Members of the Executive Board for 2018The current level of each Executive Board member’s compensation is listed in the tables below, which follow the model tables recommended by the German Corporate Governance Code.
With effect from October 1, 2018, Dr. Rudolf Staudigl’s gross fixed annual salary was increased from € 840,000 to € 880,000. This increase took the form of an additional fixed, non- pensionable salary component and thus has no influence on the calculation of his pension. It is taken into account, however, when calculating the long-term bonus.
With effect from November 1, 2018, Dr. Christian Hartel’s gross fixed annual salary was increased from € 400,000 to € 580,000. At the same time, the parameters for the target bonus were amended as follows: as of November 1, 2018, the computational target bonus in the event of 100-percent target achievement during the evaluation period amounts to 180 percent (January through October 2018: 140 percent) of the average annual base salary. The maximum bonus amounts to 220 percent (January through October 2018: 180 percent) of the average annual base salary.
All of the above-mentioned increases applied pro rata temporis for the year 2018.
193
Further Information – Corporate Governance Report and Declaration on Corporate Management
Wacker Chemie AG – Annual Report 2018

The following table shows the payments for fiscal 2018 from fixed compensation, additional benefits and variable compensation, as well as pension expenses.
Payments in the Year under Review (Compensation for 2018 and 2017)
€ 2018 2017 2018 2017
Dr. Rudolf StaudiglPresident & CEO
Auguste WillemsExecutive Board member
Fixed compensation 1
Additional benefits 2
Total
Multiyear variable compensation 3
Total
Pension expenses 4
Total compensation
Dr. Tobias OhlerExecutive Board member
Dr. Christian HartelExecutive Board member
Fixed compensation 1
Additional benefits 2
Total
Multiyear variable compensation 3
Total
Pension expenses4
Total compensation
1
2
3
4
Calculation of the pensionable portion of the compensation excluded an amount of € 50,000 (Dr. Staudigl ) and € 30,000 (Mr. Willems) in 2018.Additional benefits include the use of a company car, social insurance allowances and other cost reimbursements.Multiyear refers to the assessment basis. The Executive Board members purchase Wacker Chemie AG shares in the amount of 15 percent of their annual gross bonus (holding period of two years). Once determined, the fixed bonus amount calculated using a three-year assessment basis is not influenced by subsequent developments. Service cost, pursuant to IAS 19, from pension commitments and other pension-related benefits
850,000 840,000 610,000 610,000
93,416 54,644 49,838 48,406
943,416 894,644 659,838 658,406
1,411,000 1,774,080 1,012,600 1,288,320
2,354,416 2,668,724 1,672,438 1,946,726
- - 588,900 618,631
2,354,416 2,668,724 2,261,338 2,565,357
580,000 580,000 430,000 400,000
51,591 48,314 52,696 50,492
631,591 628,314 482,696 450,492
962,800 1,224,960 600,467 668,800
1,594,391 1,853,274 1,083,163 1,119,292
473,620 578,020 207,978 218,784
2,068,011 2,431,294 1,291,141 1,338,076
194
Further Information – Corporate Governance Report and Declaration on Corporate Management
Wacker Chemie AG – Annual Report 2018

The following table shows the value of compensation and benefits granted for fiscal 2018. It also lists the minimum and maximum attainable values.
Compensation and Benefits for the Year under Review (Targets)
€ 2018 (target) 2018 (min.) 2018 (max.) 2017 (target) 2018 (target) 2018 (min.) 2018 (max.) 2017 (target)
Dr. Rudolf StaudiglPresident & CEO
Auguste WillemsExecutive Board member
Fixed compensation 1
Additional benefits 2
Total
Multiyear variable compensation 3
Total
Pension expenses 4
Total compensation
Dr. Tobias OhlerExecutive Board member
Dr. Christian HartelExecutive Board member
Fixed compensation 1
Additional benefits 2
Total
Multiyear variable compensation 3
Total
Pension expenses 4
Total compensation
1
2
3
4
Calculation of the pensionable portion of the compensation excluded an amount of € 50,000 (Dr. Staudigl ) and € 30,000 (Mr. Willems) in 2018.Additional benefits include the use of a company car, social insurance allowances and other cost reimbursements.Multiyear refers to the assessment basis. The Executive Board members purchase Wacker Chemie AG shares in the amount of 15 percent of their annual gross bonus (holding period of two years). Once determined, the fixed bonus amount calculated using a three-year assessment basis is not influenced by subsequent developments. The actual level of target achievement in the two previous years was taken into consideration when the minimum and maximum values were calculated. The following values were set for 2018: a minimum value of 0 percent and a maximum value of either 220 percent or 180 percent. The theoretically achievable minimum or maximum values are also influenced by the Supervisory Board’s potential scope of discretion. Service cost, pursuant to IAS 19, from pension commitments and other pension-related benefits
850,000 850,000 850,000 840,000 610,000 610,000 610,000 610,000
93,416 93,416 93,416 54,644 49,838 49,838 49,838 48,406
943,416 943,416 943,416 894,644 659,838 659,838 659,838 658,406
1,623,500 779,450 2,265,250 1,545,600 1,165,100 559,370 1,625,650 1,122,400
2,566,916 1,722,866 3,208,666 2,440,244 1,824,938 1,219,208 2,285,488 1,780,806
- - - - 588,900 588,900 588,900 618,631
2,566,916 1,722,866 3,208,666 2,440,244 2,413,838 1,808,108 2,874,388 2,399,437
580,000 580,000 580,000 580,000 430,000 430,000 430,000 400,000
51,591 51,591 51,591 48,314 52,696 52,696 52,696 50,492
631,591 631,591 631,591 628,314 482,696 482,696 482,696 450,492
1,107,800 531,860 1,545,700 1,067,200 687,967 333,643 972,617 576,000
1,739,391 1,163,451 2,177,291 1,695,514 1,170,663 816,339 1,455,313 1,026,492
473,620 473,620 473,620 578,020 207,978 207,978 207,978 218,784
2,213,011 1,637,071 2,650,911 2,273,534 1,378,641 1,024,317 1,663,291 1,245,276
195
Further Information – Corporate Governance Report and Declaration on Corporate Management
Wacker Chemie AG – Annual Report 2018

Compensation of Supervisory Board MembersThe compensation of Wacker Chemie AG’s Supervisory Board members is governed by the company’s Articles of Association.
In return for their work, the members of the Supervisory Board receive fixed annual compensation in the amount of € 90,000, payable when the fiscal year expires, and are additionally refunded any VAT payable on their compensa-tion. Supervisory Board members who join, or depart from, the Supervisory Board during the fiscal year receive the corresponding compensation pro rata temporis.
The compensation is multiplied by a factor of 3 for the Chairman of the Supervisory Board, by a factor of 2 for the Vice Chairman and for chairs of committees, and by a factor of 1.5 for members of committees. Multiple functions are ignored in this calculation.
The members of the Supervisory Board are compensated for any outlays incurred in connection with the execution of their duties with an annual lump sum of € 20,000 and are also reimbursed for any VAT payable on that lump sum.
The company grants the members of the Supervisory Board appropriate insurance coverage; in particular, the company concludes a D & O insurance policy for the benefit of the Supervisory Board members.
Supervisory Board Compensation
€ 2018 2017
Fixed compensation 1, 2 2,161,685 2,152,945
Variable compensation – –
Total 2,161,685 2,152,945
1
2Fixed compensation includes the above-mentioned annual lump sum.The employee representatives are subject to the rules of the German Trade Union Confederation (DGB) and of the Association of Employed Academics and Executives in the Chemical Industry ( VAA) concerning the transfer of supervisory board compensation.
Pension Obligations for Executive Board Members
€ 2018 2017
Pension obligations for active Executive Board membersTotal 30,768,564 28,090,779
Pension obligations for former members of the Executive Board or their dependentsTotal 33,981,707 37,590,405
Compensation for Former Members of the Executive Board or Their Surviving Dependents
€ 2018 2017
Total 1,963,723 1,995,326
196
Further Information – Corporate Governance Report and Declaration on Corporate Management
Wacker Chemie AG – Annual Report 2018

Separate Non-Financial Statement Combined for the WACKER Group and for Wacker Chemie AG
Information on the WACKER Group
The Business Model of Wacker Chemie AGWACKER is a global company with state-of-the-art specialty chemical products. The Group’s business model and legal structure are described in detail in the combined manage-ment report in the Group Business Fundamentals section.
Report Framework and AuditingOur sustainability reporting, as well as this separate non- financial report combined for the Group (hereinafter the “Report” ), are guided by the sustainability reporting standards of the Global Reporting Initiative (GRI).
The Report constitutes the separate non-financial state-ment for 2018 for both the WACKER Group and Wacker Chemie AG – as defined in Sections 315b, 315c and 289b through 289e of the German Commercial Code (HGB). The Report was examined by the Supervisory Board of Wacker Chemie AG. In compliance with the revised International Standard on Assurance Engagements 3000 (ISAE 3000 (Revised): “Assurance Engagements Other Than Audits or Reviews of Historical Financial Information”), it was reviewed on behalf of the Executive Board by KPMG AG, Wirtschaftsprüfungsgesellschaft, to obtain a limited assurance engagement relating to the disclosures legally required in accordance with Sections 315b, 315c and 289b through 289e HGB.
All the references in this Report relate to more detailed information, with the exception of those relating to the Group management report.
Significance to WACKER of Sustainability and Other Non-Financial Performance IndicatorsSustainability has been firmly rooted in our business pro-cesses for many years. Sustainable development means balancing economic, ecological and social factors in everything we do. The fact that we have made sustainability one of our strategic goals emphasizes its importance. As an innovative chemical company, WACKER makes a vital con-
tribution to improving the quality of life around the world. We want to continue developing and supplying solutions that meet our own expectations of adding value for our customers and shareholders, and growing sustainably.
Sustainability also lies at the heart of our strategic medium- term plan for the WACKER Group through 2020, which we presented at the Capital Market Day in October 2016. One of our five strategic goals is to “focus even more strongly on sustainability.”
Responsible Care® and the UN Global CompactOur actions are guided by two voluntary global initiatives that form the basis for sustainable corporate management at WACKER: the chemical industry’s Responsible Care® initiative and the UN Global Compact. WACKER has been an active member of the Responsible Care® initiative since 1991 and, as a program participant, the company must act to continually improve health, safety and environmental performance on a voluntary basis – even in the absence of statutory requirements. As a member of the UN Global Com-pact, we actively support the goals of this, the world’s most important and extensive initiative for responsible corporate management. The Global Compact addresses the protection of human rights, social and environmental standards, and the fight against corruption. We submit a progress report every year in April. The progress reports of recent years can all be viewed on the UN Global Compact website.
The current progress report is also published on the WACKER website at:
www.wacker.com/cms/en/wacker_group/sustainability/selbstverpflichtungen/
global_compact.jsp
Principles of Corporate EthicsAside from our vision and goals, our ethical principles form the third pillar of WACKER’s corporate policy guidelines. These principles are laid down in five corporate codes – including the Code of Sustainability – and are supplemented by a body of regulations and directives. They are mandatory for all employees worldwide. The content of the codes is described in detail in the corporate governance report.
The codes can also be viewed on the WACKER website at: www.wacker.com/
cms/en/wacker_group/wacker_facts/policy/policy.jsp
Integrated Management SystemWe control operational processes via our integrated man-agement system ( IMS). This system stipulates uniform stan-dards throughout the Group for issues relating to quality, environmental protection, and health and safety. We have our Group management system certified by an international certification organization to ensure its compliance with ISO 9001 (quality) and ISO 14001 (environmental protection) and, at our German sites, also with ISO 50001 (energy).
197
Further Information – Separate Non-Financial Statement Combined for the WACKER Group and for Wacker Chemie AG
Wacker Chemie AG – Annual Report 2018

Environmental ConcernsBy setting quantifiable environmental targets, we intend to lower the environmental impact of our production activities.
Environmental ProtectionWACKER attaches particular importance to integrated envi-ronmental protection, which begins right at the product- development and plant-planning stage. WACKER constantly works to improve its production processes, with the aim of conserving resources. A key task is to close material loops and recycle byproducts from other areas back into production. This enables us to reduce or prevent energy
Our Group certification program ensures that all WACKER sites implement legal and customer-related rules as well as our corporate standards. Almost every WACKER production site is included in the ISO 9001 (quality) and ISO 14001 (environment) Group certificates. Exceptions are the Kolkata plant of Wacker Metroark Chemicals Pvt. Ltd., India, and the Tsukuba site of Wacker Asahi Kasei Silicone Co., Ltd., Tokyo, Japan, which have corresponding individ-ual certificates. The Charleston plant (USA) will be added to the ISO 14001 Group certificate in the spring of 2019. In the reporting period, we recertified all sites to the new specifications of ISO 9001:2015 and 14001:2015.
The regional focus of sustainability management in the reporting year was the Americas. Our sites at Charleston, Adrian, Eddyville and Calvert City underwent health and safety audits. In 2019, the regional focus will be Europe.
Analysis of Fundamental Sustainability IssuesWACKER communicates regularly with numerous stake-holder groups – ranging from employees, customers, suppliers, analysts, investors and journalists to scientists, neighbors, politicians, associations and NGOs. For years, WACKER has regularly held stakeholder surveys as part of its sustainability reporting. In 2018, our global survey identified which sustainability topics are vital to stakeholders and upper management. The five top issues for companies and stakeholders were the safety of production plants, product safety, competitiveness / value trends, occupational safety / employee health, and compliance.
As a chemical company, we also prioritize transport and storage safety, risk management, energy consumption, resource conservation and the development of new, sus-tainable products.
As part of our materiality analysis, we also took account in this report of the statutory definition of materiality pursuant to Sections 315 b, 315 c and 289 b through 289 e of the German Commercial Code (HGB). For major non-financial issues, we ensure that the relevant stakeholders are involved. The corresponding Executive Board committees deal with all key topics.
For more details about resource-saving production and sustainable
products, please refer to the section in the combined management report
entitled Further Information on R & D, Employees, Procurement, Production,
Sales and Marketing.
Every two years, we publish a sustainability report in order to inform our
stakeholders about WACKER’s sustainability work in an open and comprehen-
sive manner. In 2019, WACKER will publish its Sustainability Report for 2017/2018.
D.1 WACKER’s Environmental Targets through 2022
Region Key Environmental Indicator Base Year Targets for 2022 1 (%)
WACKER Germany
Weighted specific energy consumption (per metric ton of net production) 2
2007 -50
WACKER Germany
Specific carbon dioxide emissions (per metric ton of net production) 2
2012 -15
Group Specific dust emissions (per metric ton of gross production) 2
2012 -50
Group Specific emissions of relevant VOCs (volatile organic compounds; per metric ton of gross production) 2
2012 -25
Group Specific NOx emissions (nitrogen oxide; per metric ton of gross production) 2, 3
2012 -25
1
2
3
The target-related success level is not based on linear progression, but on individual projects that are implemented at different stages throughout the target period. This is why no intermediate results are reported.Gross production corresponds to the total production (target products and byproducts) of a plant or site. Net production is calculated by subtracting the internal reuse of products from the gross production of a plant or site.New target since 2018.
198
Further Information – Separate Non-Financial Statement Combined for the WACKER Group and for Wacker Chemie AG
Wacker Chemie AG – Annual Report 2018

and resource consumption, emissions and waste, and to integrate environmental protection into our production processes. At WACKER, we monitor resource and waste targets at site and divisional levels.
The production system is described in the Group Business Fundamentals
section of the combined management report.
Our Groupwide standards for protecting the environment apply to all our production sites and technical competence centers. The site managers ensure that environmental protection requirements and environmental standards are met at their particular locations. The Group Coordinator for the Environment looks at how sites implement environ-mental standards in practice and performs random checks to verify legal compliance.
In 2018, WACKER invested € 5.9 million in environmental pro-tection (2017: € 4.2 million). Environmental operating costs came to € 82.9 million (2017: € 78.3 million). Examples of capital expenditure on environmental protection include the process control system for the waste disposal center at Burghausen and modernization of the waste-disposal installations and control room at Nünchritz.
Assessment Using the Global Water Tool ™In 2018, we again used the Global Water Tool ™ (GWT ) developed by the World Business Council for Sustainable Development (WBCSD) – or the WRI Aqueduct contained in that tool – to analyze the relative water stress index of the countries where our main production sites are located. Beside the water stress index, we are checking whether other water-related risk factors used in this tool are of relevance to WACKER’s production sites. The current result is that 99 percent of our annual water use and over 91 per-cent of our production volume are in regions with adequate water availability levels.
In 2018, WACKER submitted its first Carbon Disclosure Project (CDP) Water Security report for the reporting year 2017, achieving a D (Disclosure). Registered CDP users can download the details.
https://www.cdp.net/en/data
As part of the Bavarian Environmental Pact, WACKER and seven other companies in Bavaria’s Chemical Triangle formed an association called “Naturnahe Alz” (Natural Alz)
to support the state of Bavaria in renaturalizing the Alz river and enhancing its ecosystem in the long term. In the report-ing year, the “Naturnahe Alz” association again donated € 60,000, bringing its total investment in nature conservation to € 200,000 since its foundation in 2015.
EnergyThe chemical industry is one of the most energy-intensive sectors. WACKER’s sites in Germany consume 3,976 GWh of electricity, representing approximately 0.8 percent of the country’s electricity consumption. WACKER is continually improving the energy efficiency of its processes. This enables us to remain globally competitive while at the same time contributing to climate protection.
Many chemical reactions generate heat that can be put to use in other production processes. In addition to recovering heat from such chemical reactions, we have been using integrated heat-recovery systems in Burghausen and Nünchritz for years and are continually improving and expanding them. In this way, we can reduce the amount of primary energy (natural gas) consumed by our power plants.
To enhance energy efficiency and reduce specific energy consumption (amount of energy per unit of net production output), the Executive Board has defined energy targets for WACKER Germany. We have set a goal of reducing specific energy consumption by 2022 to one-half of the 2007 level. Net production is calculated by subtracting the internal reuse of products from the gross production of a plant or site. Gross production corresponds to the total production (target products and byproducts) of a plant or site.
D.2 Environmental Protection Costs
€ million 2018 2017 2016
Operating costs
Capital expenditures
82.9 78.3 78.4
5.9 4.2 2.4
D.3 Electricity Supply
%
Group electricity consumption: 5,178 GWh 77 % Consumption in Germany 23 % Consumption abroad 1
Electricity consumption, Germany: 3,976 GWh 64 % Procured electricity 31 % CHP 2 5 % Hydropower 2
1
2
Outside Germany, we purchase electricity from third parties based on the local standard energy mix.Burghausen
23
77
64
31
5 199
Further Information – Separate Non-Financial Statement Combined for the WACKER Group and for Wacker Chemie AG
Wacker Chemie AG – Annual Report 2018

Our primary source of energy is climate-friendly natural gas. At Burghausen, our largest site, we produce steam and electricity using a cogeneration system. The highly efficient combined heat and power (CHP) plant operates at more than 85 percent fuel efficiency, which is significantly higher than that of conventional power plants. Additionally, Burghausen uses hydropower to generate electricity. At our Norwegian site in Holla, electricity comes mainly from hydropower.
WACKER’s German production sites accounted for 77 per-cent (2017: 72 percent) of its total electricity consumption. In 2018, we adopted energy-efficiency measures to further reduce specific energy consumption. These involved fur-ther enhancing the heat-recovery processes and integrated systems used in our production plants.
Our German power plants – the hydroelectric and CHP plants in Burghausen and the cogeneration plant in Nünchritz – produced 1,431 GWh of electricity in 2018 (2017: 1,481 GWh), meaning that WACKER covered about 36 percent of its total energy requirements in Germany from its own production. Groupwide, carbon dioxide emissions from captive power plants subject to emissions trading rules and from silicon-metal production in Holla totaled about 1.0 million metric tons in the reporting period (2017: 1.0 mil-lion metric tons).
WACKER is subject to the regulations of the EU emissions trad-ing system because of its power plants at the Burghausen and Nünchritz sites. We have covered shortfalls since 2014 by buying emission allowances for facilities subject to emissions trading.
Explanation of Environmental IndicatorsIn 2018, direct emissions of carbon dioxide (Scope 1 of the Greenhouse Gas Protocol ) declined by 3.6 percent year over year, mainly due to lower steam consumption at our Burghausen and Nünchritz sites. As a result, groupwide nitrogen oxide (NOx) emissions fell by 2.9 percent.
Maintenance and project work at the Holla site’s baghouse caused total dust emissions to rise by 2.4 percent year over year in 2018. We still reduced our specific dust emissions by 48 percent, already nearly achieving our target of halving them from 2012 to 2020.
The very warm summer of 2018 meant we had to increase the throughput of cooling water to keep process tempera-tures in our Burghausen production plants at the required levels. That led to a 15-percent increase in water consump-tion. By optimizing waste water treatment at Burghausen, we achieved a reduction of around 6 percent in chemical oxygen demand (COD) and of 14 percent in halogenated organic hydrocarbons (AOX).
The groupwide 13-percent increase in waste resulted from higher volumes of nonhazardous waste due to, for example, construction activities at Burghausen and the León, Spain site’s inclusion in the report.
Higher output at Burghausen and Nünchritz entailed the procurement of additional third-party electricity, thus rais-ing CO2 emissions. This was more than offset by reduced energy consumption at the Charleston site. The electricity to CO2 emissions conversion factors for power generation in Germany and the USA fell further (data as per CO2 Emis-sions from Fuel Combustion, 2018 Edition, International Energy Agency). Overall, these effects reduced indirect CO2 emissions from procured energy (Scope 2) by 8 percent.
D.4 Energy Consumption
GWh 2018 2017 2016
Electricity consumption
Heat consumption
Primary energy use (total )
Of which Natural gas
Solid fuels 1
Heat supplied by third parties 2
1
2Coal, charcoal and wood; used as reducing agents at the silicon-metal plant in Holla, Norway. Steam and district heating
5,178 5,460 5,199
3,120 3,505 3,827
5,703 6,055 6,405
4,827 5,056 5,378
640 750 769
236 249 258
200
Further Information – Separate Non-Financial Statement Combined for the WACKER Group and for Wacker Chemie AG
Wacker Chemie AG – Annual Report 2018

Plant, Transport and Product SafetyAn important goal at WACKER is to operate plants and processes in a manner that poses no risk to people or the environment. To this end, we have installed a groupwide safety management system that addresses both workplace and plant safety.
Plant SafetyThe first stage in ensuring the safety of our plants is to systematically identify risks and assess them. This includes analyzing not only how well we control the energy present in a process (e. g. pressure, heat), but also what effect a single error might have on a chain of events that could culminate in the escape of a substance or an accident. After completing this comprehensive analysis, we specify safety measures to prevent undesired events.
Measuring the Group’s carbon footprint is an important tool for improving climate protection. That is why – in addition to tracking our indirect greenhouse gas emissions from procured energy (Scope 2) since 2011 – we have been measuring, since 2012, all WACKER-relevant emissions along the value chain (Scope 3), generated, for example, by procured raw materials or by waste disposal and the transport of products.
In 2018, we once again forwarded our emissions data to the Carbon Disclosure Project (CDP), which WACKER joined in 2007. In the CDP’s Climate Change Report for the chemical sector, Wacker Chemie AG achieved a B (Management) on a scale from A (Leadership) to D (Disclosure). Registered CDP users can download the details.
https://www.cdp.net/en/data
D.5 Environmental Indicators
20183 2017 2016
AirCO2 emissions 1
Direct (kt)
Indirect (kt) 2
NOX nitrogen oxides (t)
Non-methane volatile organic compounds (NMVOCs) (t)
Dust (t)
WaterWater use (thousand m3)
Chemical oxygen demand (COD) (t)
Halogenated organic hydrocarbons (AOX) (t)
WasteDisposed of (t)
Recycled (t)
Hazardous (t)
Non-hazardous (t)
1
2
3
CO2 emissions are measured on the basis of the Greenhouse Gas Protocol (GHG Protocol: “A Corporate Accounting and Reporting Standard” ), published by the World Resources Institute and World Business Council for Sustainable Development. Scope 1: direct CO2 emissions. Scope 2: indirect emissions from purchased energy (converted into CO2 for purchased electricity, steam and heat). Conversion is based on emission factors of the International Energy Agency (electricity) and from the GEMIS database (steam and heat).The amount of electricity supplied by the affiliate Alzwerke GmbH is included in indirect CO2 emissions in a climate-neutral manner – because it is not fed into the public grid.The Amsterdam and León production sites were included in the reporting of environmental indicators in 2018 for the first time.
1,194 1,239 1,277
1,478 1,606 1,588
1,810 1,860 1,970
860 880 890
284 278 515
227,510 197,430 207,930
1,230 1,310 1,210
2.2 2.6 3.1
49,690 41,400 38,640
133,060 120,420 114,080
77,070 75,800 73,660
105,680 86,020 79,060
D.6 Environment- and Safety-Related Incidents
2018 2017 2016
Groupwide number of environment- and safety-related incidents 1
Groupwide environment- and safety-related incidents per 1 million hours worked 2
1
2According to European Chemical Industry Council (Cefic) criteria WACKER Process Safety Incident Rate (WPSIR)
37 22 44
1.7 1.0 2.1
201
Further Information – Separate Non-Financial Statement Combined for the WACKER Group and for Wacker Chemie AG
Wacker Chemie AG – Annual Report 2018

Product SafetyWACKER provides information on the safe use of its prod-ucts. It continually works to prevent or reduce the use in products of any substances harmful to human health and the environment. WACKER sells its products in compliance with the chemical legislation applicable in the country of destination.
As a guide for our product developers, we maintain a list of about 650 substances that WACKER products may no longer contain. In addition to prohibited and restricted chemicals (such as materials listed in Annexes XIV and XVII to the REACH Regulation), the list also includes substances that many companies find undesirable. As far as possible, we avoid substances on the European Chemicals Agency’s List of Substances of Very High Concern (SVHC).
The REACH Regulation, which came into force in 2007, governs the registration, evaluation, authorization and restriction of chemicals within the European Union. REACH involves the collection of extensive data and imposes stringent requirements on the manufacturers, importers and users of chemical products. All substances on the European market that are used or imported in annual quantities exceeding one metric ton must be registered and evaluated. The scope of evaluation work is largely determined by the quantity produced or imported and the
Safe Transport of Hazardous MaterialsWACKER ensures that its products are stored and trans-ported safely, especially where hazardous goods are involved. In 2018, we had around 12,000 hazardous-goods trucks inspected in the shipping areas at our sites and warehouses in Germany (2017: over 11,000). We turn away any that are defective. Failure rates have been extremely low for years now. The rate for 2018 was about 2.0 percent for hazardous goods shipments from Burghausen, our largest site in Germany (2017: 1.4 percent).
As elsewhere, we rely on well-trained personnel for transport safety. In the reporting year, 1,300 employees in Germany alone attended classroom-training sessions on the shipment of hazardous goods, while more than 900 completed online courses on securing freight.
We regularly discuss the issue of transport safety with our logistics providers in Germany, for example during our annual Supplier Day. If deficiencies are found, we agree improvements and then follow up on their implementation. WACKER uses in-house criteria and internationally recog-nized systems to select logistics providers and assess their performance. Via contractually defined specifications (such as a requirements profile for providers of road transport logistics), WACKER ensures that both its contractors and their subcontractors meet the company’s stringent safety requirements. As part of the annual audit plan, selected hazardous-goods shippers are audited for compliance with these requirements and, if necessary, improvement measures are agreed.
For products with a high hazard potential, we use packag-ing and tanks of the highest quality.
When monitoring the distribution of our products, we also record any transport incidents not involving hazardous goods, as well as those that have no negative impact on people or the environment. Such incidents are an important factor in the annual assessment of our logistics providers. In the year under review, we recorded a total of three transport incidents that did not involve hazardous goods.
Our safety management system focuses on prevention. Even so, safety-critical incidents cannot always be pre-vented. Across the Group, we promptly enter any incident relevant to safety, health or the environment in the IT system we use for sustainability reporting (SPIRIT ). The reports are evaluated and measures tracked. Incident reports that offer cross-division or cross-site learning effects are processed and forwarded to any company units with a similar risk potential.
Safety Training and InspectionsWACKER attaches particular importance to providing its safety experts with ongoing training. We hold regular training sessions, for example, on plant safety and explo-sion-damage protection. In 2018, we audited our sites at Charleston, Adrian, Eddyville and Calvert City in the USA. WACKER awards recognition to facilities that operate for sustained periods of time without a reportable accident.
D.7 Transport Accidents 1
Number of Accidents 2018 2017 2016
Road
Rail
Sea
Inland waterways
Air
1 Only Germany
3 6 2
– 2 4
– – –
– – 1
– – –
202
Further Information – Separate Non-Financial Statement Combined for the WACKER Group and for Wacker Chemie AG
Wacker Chemie AG – Annual Report 2018

Personnel MattersWACKER’s success is a team effort, involving the whole workforce. That is why WACKER – in the spirit of the UN’s Sustainable Development Goal 8: Decent Work and Eco-nomic Growth – encourages its employees to realize their potential, assume responsibility and contribute their own ideas. We support their endeavors by providing basic and advanced training opportunities. We want our employees to have secure jobs, generous employee benefits and a work culture that facilitates a positive work-life balance. It is important to us that they all enjoy equality of opportunity. Further, our aim is to ensure that any employees who are disabled or have chronic health issues are integrated in the workplace over the long term. Vocational training has always been a focus of WACKER’s personnel-development activities. We offer our employees attractive compensation, good promotion prospects and a share in our company’s success. And all key personnel matters are dealt with by the corresponding Executive Board committees.
In our Code of Conduct, we explicitly commit ourselves to the UN Global Compact’s Ten Principles. They include the principles on labor standards, namely upholding the freedom of association (Principle 3), eliminating all forms of forced labor (Principle 4), abolishing child labor (Principle 5)
and eliminating discrimination (Principle 6). We also make commitments to our customers to uphold these same labor standards.
The sanctions we impose for any proven misconduct in personnel matters are determined by the seriousness of the incident. There were no incidents of note in the reporting year.
Basic and Advanced Training at High LevelsWACKER has made vocational training a focus of its person-nel-development activities. In 2018, 191 young people began apprenticeships at WACKER or at the Burghausen Vocational Training Center (BBiW). With a total of 599 apprentices, the company employed almost as many as the year before (2017: 601). The percentage of apprentices (ratio of apprentices to Group employees in Germany) was 5.5 percent, marginally lower than the prior-year figure (5.7 percent). In 2018, WACKER kept on virtually all suitably qualified apprentices –157 graduates – hiring 130 on permanent contracts and 27 on temporary contracts. The Burghausen Vocational Training Center also provides training for partner companies outside the WACKER Group.
To keep abreast of demographic trends and offer young people long-term prospects, WACKER and the council of employee representatives agreed a new regulation about hiring qualified apprentices. The new company agreement provides that apprentices, if suitable, receive a job offer after graduating. If the offer is for a long-term position, hiring is permanent. For a temporary position, hiring is limited accordingly.
In 2018, WACKER invested a total of € 8.7 million in personnel- development activities and advanced training (2017: € 7.9 million).
Workplace SafetyWorkplace and plant safety are vitally important for WACKER. That is why WACKER defines safety targets together with its executives in Germany ( in upper and middle management) during its annual target-setting process.
WACKER’s processes and standards for workplace safety are aligned with the international OHSAS 18001 standard. Systematic workplace safety includes regular evaluation of hazards and work-area monitoring.
All our employees are given safety training tailored to their own work areas. WACKER Germany, for example, offers a total of 42 online courses on occupational safety issues. Topics range from general safety guidelines for office
expected risks. Particularly high-risk substances are sub-ject to regulatory approval. As part of REACH, WACKER had submitted 480 registration dossiers, including any revisions, to the European Chemicals Agency (ECHA) by the end of 2018. In the course of its regular evaluation activities, ECHA required additional information for many of the dossiers, all of which we provided on time in 2018.
WACKER’s close contact with its suppliers extends to matters relating to substances not yet registered under REACH. We systematically requested definitive statements from our suppliers about registration status and the further availability of raw materials, especially in view of the expira-tion of the final registration phase for phase-in substances (> 1 metric ton / year) on May 31, 2018.
To promote the safe use of chemicals, the International Council of Chemical Associations ( ICCA ) developed its Global Product Strategy (GPS), which is a guideline on how to assess chemical properties and provide product safety information. In Europe, most GPS requirements are satis-fied by REACH and by the CLP Regulation (Classification, Labeling and Packaging of Substances and Mixtures). By the end of 2018, we had published 75 Safety Summaries on the ICCA chemicals website for the substances we have registered under REACH.
203
Further Information – Separate Non-Financial Statement Combined for the WACKER Group and for Wacker Chemie AG
Wacker Chemie AG – Annual Report 2018

and laboratory workers to instruction on safe behavior in potentially explosive atmospheres and the classification of hazardous materials.
In the reporting year, we processed the findings concerning the 2017 explosion at Charleston (USA) in a safety program. All our units worldwide have to check their protection strategy for compressors and retrofit them by year-end 2019 if necessary.
We also significantly improved the safety of pipe bridges in 2018. A groupwide initiative for pipe bridges involves review-ing and adjusting technical designs, corrosion protection, organizational rules and emergency planning.
Workplace accident performance is one of the most important non-financial performance indicators. One of our workplace safety goals is to ensure that the number of workplace accidents per 1 million hours worked does not exceed 1.7 groupwide in 2020. In terms of reportable acci-dents (accidents with more than three workdays missed), WACKER’s numbers are far better than the German chemical industry average. The reportable accident rate at WACKER in 2018 was 1.3 per 1 million hours worked. In contrast, Germany’s Social Accident Insurance Institution for the raw materials and chemical industry (BG RCI) registered 9.3 reportable accidents per 1 million hours worked in chemical companies in 2017. In the reporting period, WACKER again had no fatal workplace accidents in its workforce.
Very few accidents at WACKER involve chemicals. The most common causes are tripping, slipping, falling and lack of care when performing manual activities. We are not satis-fied with our accident rate and are stepping up our safety efforts. In 2018, we reviewed how effectively our German
sites implement key safety regulations, for example those about the safety of partner-company employees or about working safely on ladders.
We are continuing to implement our WACKER Safety Plus (WSP) program, which looks at sites with particularly low accident rates and makes use of their successful safety measures, such as safety patrols, emergency drills and holding discussions with the workforce. The goal of WACKER Safety Plus is to recognize and avoid unsafe behavior.
Diversity and Equal OpportunityEqual opportunity: we view human diversity as an asset. We oppose discriminatory or derogatory treatment on the basis of gender, race, ethnicity, religion, ideology, disability, sexual orientation or age. These principles are valid across the WACKER Group and, as part of our corporate culture, are embodied in our Code of Teamwork & Leadership. Employees can notify their supervisors, even anonymously, of any potential discrimination or report it to a compliance officer, employee representative or designated HR contact person. Complaints are investigated and the reporting party informed of the outcome. Cases of potential discrimination are included in the monthly compliance report submitted to the Executive Board. In addition, they are listed in the regular reports submitted to the Supervisory Board. We require all employees at our German sites to complete an e-learning course to familiarize themselves with the country’s General Equal Treatment Act (AGG).
Promoting diversity: in 2015, WACKER launched a groupwide initiative to promote diversity and inclusion in its workforce, and also signed Germany’s nationwide Diversity Charter. Ever since then, WACKER has set yearly priorities to sensitize employees to the opportunities and challenges of a diverse
D.8 Workplace Accidents Involving Permanent Staff and Temporary Workers
2018 2017 2016
Accident rate across Group: Accidents 1 per 1 million hours worked
Europe
The Americas
Asia
Accident rate across Group: Reportable accidents 2 per 1 million hours worked
Fatal accidents
1
2Accidents leading to at least one day off workAccidents leading to over three days off work
2.9 2.8 3.0
3.6 3.3 3.8
1.5 2.2 0.7
0.4 0.4 0.8
1.3 1.4 1.6
– – –
204
Further Information – Separate Non-Financial Statement Combined for the WACKER Group and for Wacker Chemie AG
Wacker Chemie AG – Annual Report 2018

workforce. Our focus in 2018 was on inclusion, a topic that Germany’s Diversity Day also highlighted from multiple perspectives.
In the reporting year, the Bavarian Ministry of Social Affairs awarded Wacker Chemie AG its “Inclusion in Bavaria – We Work Together” emblem. This Bavarian government citation recognizes employers who contribute significantly to the inclusion of persons with disabilities into working life. WACKER’s goal is a prejudice-free work environment, where every employee can contribute to the company’s success – and where employees with severe disabilities or with an equivalent status are integrated over the long term.
At WACKER, special arrangements are in place for anyone who has severe disabilities, who is of equivalent status or whose health is impaired. To provide targeted support in line with local laws, WACKER’s workplace integration man-agement involves close cooperation between supervisors, employees, Human Resources, employee representatives, representatives of employees with disabilities and Health Services.
Alongside inclusion, diversity management at WACKER is focusing on the issues of gender and cultural background. People from 67 different nations work for WACKER. At the end of 2018, 37 out of a total of 172 senior executives group-wide were of non-German nationality – which corresponds to 21.5 percent of the total. Overall, 15 nationalities were represented at the senior executive level.
Proportion of Women in Executive PositionsWe have set a goal to significantly increase the proportion of women in middle and upper management positions in the medium to long term. WACKER’s talent-management process helps systematically identify and nurture women with management potential. The corporate governance report contains additional information about the proportion of women in management and, in particular, about how WACKER is implementing the German statute on equal opportunity for women and men in management that came into force on May 1, 2015.
Commended as Family-Friendly CompanyThe Bavarian government, in its “Successful. Family- Friendly” corporate competition, commended 20 com-panies, including WACKER, for their exemplary support in reconciling family life and work. 227 Bavarian companies from all industries and of all sizes participated in the competition.
WACKER won in the categories “family-oriented work conditions,” “service and support offers,” “personnel development and sustainability,” “information and com-munications” and “corporate and leadership culture.” WACKER offers its employees extensive opportunities to balance their private and professional lives. These range from multiple work-time models, childcare assistance, and school-vacation support at Burghausen (our largest site) through to one week of “family time” for parents of children under eight and support for employees caring for relatives.
D.9 Diversity, Inclusion and Equal Opportunity
2018 2017 2016
Workforce, groupwide
Of whom female
Female employees, groupwide (%)
Workforce in Germany
Of whom non-German
Non-German employees in Germany (%)
Employees in middle management, groupwide (managerial level 3)
Of whom female
Women in middle management, groupwide (%)
Senior executives (OFKs), groupwide 1
Of whom female senior executives
Female senior executives, groupwide (%)
1 Number of senior executives (OFKs) exclude inactive employment contracts and the Executive Board of Wacker Chemie AG
14,542 13,811 13,448
3,355 3,154 3,047
23.1 22.8 22.7
10,291 9,984 9,775
1,054 1,046 1,034
10.2 10.5 10.6
3,212 3,043 2,927
762 690 650
23.7 22.7 22.2
172 166 165
23 21 19
13.4 12.7 11.5
205
Further Information – Separate Non-Financial Statement Combined for the WACKER Group and for Wacker Chemie AG
Wacker Chemie AG – Annual Report 2018

In 2018, WACKER joined the “Familienpakt Bayern” network (Family Pact Bavaria) of the Bavarian government and Bavarian industry, a move that highlights our goal to foster a family-friendly corporate culture. About 600 companies have joined the Pact.
Global Employee SurveyAfter the 2015 employee survey in Germany, WACKER con-ducted its first worldwide survey in 2018, asking employees about the company’s culture and performance. The out-come showed that WACKER’s employees around the world identify strongly with their work and their employer. Glob-ally, workforce engagement was 82 percent – calculated as an average approval rating for questions about work enjoyment, coping with workloads, pride in the company, and commitment. That was a very positive result, especially when compared with the external provider’s benchmark, an industry average based on numerous surveys. In Germany, the score for the questions above beat the 2015 survey’s strong 74 percent by 6 percentage points.
Employee TurnoverGood social benefits, competitive compensation and motivating tasks make WACKER an attractive employer. That is evident in our employees’ long-standing allegiance to the company. The average length of service in Germany (permanent staff ) was 18.1 years (2017: 18.3 years). The average length of service of WACKER’s executive personnel was 21.6 years.
Employee RepresentationOur employees in Germany also make use of their option to unionize. Every WACKER site in Germany has employee representatives. Elections are held regularly, most recently in 2018. WACKER actively nurtures social partnership. In the
interests of the company’s employees, relations between management and employee representatives are close and constructive. Innovative and feasible company agreements are one result of this dialogue.
Internationally, employees are also free to unionize. If non-German sites have no (statutory or voluntary ) employee representation, HR staff members are the con-tacts for employee interests.
Social ResponsibilityWACKER sees itself as a corporate citizen – as part of the society in which we live and work. That is why we practice social responsibility, especially in the regions where our sites are located.
Social IssuesNeighbors: corporate citizenship is based on good relations with municipalities and neighbors. We speak openly about what happens behind our factory gates. Across the world, our sites address the public’s questions. Local residents who turn to us receive prompt, clear answers to their concerns. That’s why we operate local hotlines and have central contact persons in place.
In our environmental reports and brochures, we publish information about our sites. We hold open houses and other outreach events, including WACKER’s Knowledge Forum, Burghausen’s Environment Information Days and Nünchritz’s annual community meeting. In September 2018, three WACKER sites took part in a Germany-wide open house, where around 200 chemical and pharmaceutical companies opened their gates to the public. WACKER Burghausen alone welcomed some 20,000 site neighbors, interested citizens, and employees plus their families. At WACKER Nünchritz, the visitor count was 5,000. In Munich, some 500 toured our Consortium research facility, which had joined the open house for the first time for its 100th anniversary at its Munich address.
At many of our sites, we offer local communities free services, including health and eye checkups in India and a Household Hazardous Waste Day at Adrian (USA), where neighbors bring in household chemicals that are not allowed in trash cans.
D.10 Employee Turnover Rate
% 2018 2017 2016
Germany
International
Group
0.7 0.5 0.8
8.4 8.2 7.0
2.8 2.6 2.4
206
Further Information – Separate Non-Financial Statement Combined for the WACKER Group and for Wacker Chemie AG
Wacker Chemie AG – Annual Report 2018

Schools and universities: WACKER wants to get children and young people interested in technology and the natural sciences. Being a chemical company, we will need outstanding scientists in the future. To find them, we pursue multiple strategies. In 2018, we sponsored and organized the Young Scientists competition in Bavaria for the eleventh time.
WACKER supports progressive teaching methods and modern approaches to school management. We are one of the original members of the Bavarian Educational Pact, a foundation with 143 companies and the state of Bavaria as members. Its goal is to modernize the Bavarian educational system.
WACKER places great emphasis on fostering young scientific talent and maintaining close contact with universities. Our researchers are frequently invited to hold presentations and lectures at universities. University groups visit our locations to gain insights into work at an industrial company. Students can write their bachelor’s, master’s and doctor’s theses at WACKER, or work as interns or take vacation jobs.
We started conferring our WACKER Silicone Award in 1987. The award-winner in 2018 was Dr. Herbert W. Roesky, Emeritus Professor of Inorganic Chemistry at the Georg- August University of Göttingen. Presented during the ninth European Silicon Days, the research prize recognizes Dr. Roesky’s groundbreaking work in the field of low- valence silicon chemistry.
Respect for Human RightsRespect for human rights, and the elimination of human rights abuses, are fundamental to our activities. We are explicitly committed to the UN Global Compact’s Ten Prin-ciples and, thus, to protecting human rights and avoiding
complicity in human rights abuses. We condemn slavery and all other forms of forced or compulsory labor. In doing so, we follow the OECD Guidelines for Multinational Enter-prises, the ILO Core Labor Standards and the UN Guiding Principles on Business and Human Rights. We are currently in the process of implementing the requirements of the National Action Plan for Business and Human Rights.
Our efforts focus not only on working conditions in our company, but also on human-rights compliance in the supply chain. We expect our suppliers to follow the prin-ciples of both the Global Compact and the Responsible Care® initiative. It is a requirement that is anchored in our General Terms and Conditions of Procurement. To check compliance, we conduct assessments and audits in line with the criteria of the Together for Sustainability initiative.
Preventing Corruption and BriberyOur fundamental convictions also apply to corruption and bribery. Neither have any place in our business model. Our principles on this are contained in our Code of Conduct and all WACKER employees are required to follow them.
Training courses on compliance sensitize employees to specific risks and to the rules of conduct that apply at work. Since 2018, compliance courses have been manda-tory groupwide for all WACKER employees. Such courses previously targeted only employees with external business contacts. Recently, a compliance course was launched for all industrial workers in production, workshops, laboratories and logistics.
WACKER’s business activities are predominantly in coun-tries with a low or very low risk of corruption, according to the Corruption Perceptions Index (CPI) of Transparency International.
D.11 Corruption and Bribery Incidents
2018 2017 2016
PreventionNumber of organizational units examined for corruption / bribery risks
Percentage of legal entities examined for corruption / bribery risks
Corruption and Bribery IncidentsExamined
Concluded
Measures Taken as a Result of Corruption and Bribery Incidents1
Written warnings
Termination of employment contract
Number of lawsuits
Level of major fines 2 and number of non-monetary penalties
1
2WACKER Germany only Level of major fines: starting at € 10,000
31 26 26
20 17 19
2 4 2
1 4 1
– – –
– 1 1
– – 1
– – –
207
Further Information – Separate Non-Financial Statement Combined for the WACKER Group and for Wacker Chemie AG
Wacker Chemie AG – Annual Report 2018

Risk and Compliance ManagementManaging Corporate RisksRisk and compliance management at WACKER is presented in detail in the risk management report within the combined management report. The same apples to the central risk areas affecting WACKER’s business and how they are dealt with.
Overall, we see no serious risks that might arise from environmental concerns, personnel matters, social issues, human rights, corruption or bribery. Similarly, we see no serious sustainability risks that might arise from our business relationships or our products.
Information on Wacker Chemie AG
In addition to the information on the WACKER Group provided in the combined non-financial report, the key indicators for Wacker Chemie AG are given below.
Wacker Chemie AG is the parent company of the WACKER Group and is headquartered in Munich, Germany. It is divided into four business divisions: WACKER SILICONES, WACKER POLYMERS, WACKER BIOSOLUTIONS and WACKER POLYSILICON. Wacker Chemie AG also comprises corporate departments, which provide services to the Group as a whole. Key indicators used in management decision-mak-ing are applied across all of the Group’s business divisions. Corporate goals are defined and reported for the divisions on a groupwide basis. Even though Wacker Chemie AG is an independent entity, no separate key performance indicators are defined or reported for it. That also applies to matters such as sustainability and non-financial performance indi-cators. For more information, please refer to the respective details provided on the WACKER Group.
Sustainable Supply-Chain ManagementSince WACKER has production sites in Europe, the Americas and Asia, it procures goods and services from numerous countries. As a member of both the United Nations Global Compact and the chemical industry’s Responsible Care® initiative, we consider it vital to verify that our suppliers fulfill generally accepted sustainability principles. Issues that are potentially critical include working conditions, eth-ical standards, safety standards (especially for hazardous materials) and local-resource management (e. g. water use and energy consumption).
As verification is vital, WACKER joined the Together for Sustainability (TfS) initiative in January 2015. Launched by the chemical industry, this procurement initiative developed a process for auditing and assessing a supplier’s sustain-ability performance. Because results are standardized and accessible to all TfS members, the program is also attractive for suppliers.
The results of TfS audits and assessments are integral to our process of supplier evaluation. We discuss results with the supplier, especially if they are unsatisfactory, so that improvements are initiated. Reassessments or repeated audits are used to follow up on progress. Consistently poor results and lack of cooperation have consequences, and may ultimately lead to business relations being terminated. We take a risk-based approach when assessing our suppliers.
Our aim is to use TfS to evaluate the sustainability per-formance of all our key suppliers. Since joining TfS, we have made good progress along this path. Already, over 65 percent of our key suppliers, and over 80 percent of the procurement volume they account for, are covered by TfS. Overall, more than 60 percent of our global procurement volume in 2018 was covered by TfS – for raw materials and energy, the figure is even around 80 percent. A monthly management report tracks how successfully TfS goals are met.
Further, we expect our suppliers to use a management system that meets the requirements of ISO 9001 (quality) or comparable specifications such as GMP (Good Manufac-turing Practice). In the case of industrial suppliers, we also require certification to ISO 14001 (environmental protection).
208
Wacker Chemie AG – Annual Report 2018
Further Information – Separate Non-Financial Statement Combined for the WACKER Group and for Wacker Chemie AG

D.12 Energy Consumption
GWh 2018 2017 2016
Electricity consumption
Heat consumption
Primary energy use (total )
Of which Natural gas
Solid fuels 1
Heat supplied by third parties 2
1
2Coal, charcoal and woodSteam and district heating
D.15 Number of Employees and Temporary Workers as of December 31
2018 2017 2016
Employees
Temporary workers
D.14 Workplace Accidents Involving Permanent Staff and Temporary Workers
2018 2017 2016
Accident rate across Wacker Chemie AG: Accidents 1 per 1 million hours worked
Accident rate across Wacker Chemie AG: Reportable accidents 2 per 1 million hours worked
Fatal accidents
1
2Accidents leading to at least one day off workAccidents leading to over three days off work
D.13 Environment- and Safety-Related Incidents
2018 2017 2016
Number of environment- and safety-related incidents 1, Wacker Chemie AG
Environment- and safety-related incidents at Wacker Chemie AG per 1 million hours worked 2
1
2According to European Chemical Industry Council (Cefic) criteriaWACKER Process Safety Incident Rate (WPSIR)
3,974 3,944 3,788
1,936 2,204 2,240
4,494 4,729 4,762
4,472 4,707 4,740
– – –
22 22 22
30 14 16
1.9 0.9 1.1
3.4 3.1 3.3
1.4 1.5 1.5
– – –
10,033 9,740 9,539
75 138 137
209
Wacker Chemie AG – Annual Report 2018
Further Information – Separate Non-Financial Statement Combined for the WACKER Group and for Wacker Chemie AG

D.16 Environmental Indicators
2018 2017 2016
AirCO2 emissions 1
Direct (kt)
Indirect (kt) 2
NOX nitrogen oxides (t)
Non-methane volatile organic compounds (NMVOCs) (t)
Dust (t)
WaterWater use (thousand m3)
Chemical oxygen demand (COD) (t)
Halogenated organic hydrocarbons (AOX) (t)
WasteDisposed of (t)
Recycled (t)
Hazardous (t)
Non-hazardous (t)
1
2
CO2 emissions are measured on the basis of the Greenhouse Gas Protocol (GHG Protocol: “A Corporate Accounting and Reporting Standard” ), published by the World Resources Institute and World Business Council for Sustainable Development. Scope 1: direct CO2 emissions. Scope 2: indirect emissions from the consumption of purchased energy (converted into CO2 equivalents for purchased electricity, steam and heat). Conversion is based on emission factors of the International Energy Agency (electricity) and from the GEMIS database (steam and heat).The amount of electricity supplied by the affiliate Alzwerke GmbH is included in indirect CO2 emissions in a climate-neutral manner – because it is not fed into the public grid.
848 896 891
1,137 1,110 1,127
680 750 750
560 570 580
21 22 20
218,280 187,870 197,500
1,050 1,110 980
2.2 2.6 3.1
25,280 24,090 21,380
129,020 114,250 111,920
74,640 73,920 71,950
79,660 64,420 61,350
210
Wacker Chemie AG – Annual Report 2018
Further Information – Separate Non-Financial Statement Combined for the WACKER Group and for Wacker Chemie AG

Limited Assurance Report of the Independent Auditor regarding the Combined Separate Non-Financial Report 1
To the Executive Board of Wacker Chemie Aktiengesellschaft, Munich
We have performed an independent limited assurance engagement on the Combined Separate Non-Financial Report of Wacker Chemie Aktiengesellschaft, Munich and the Group (hereinafter “WACKER” ) as well as the following parts, qualified by reference, “Group Business Fundamentals”, “Further Information on R & D, Employees, Procurement, Production, Sales and Marketing” and “Risk Management Report” of the Combined Management Report (hereinafter “Report” ) according to Sections 315b and 315c in conjunction with 289b to 289e German Com-mercial Code (HGB) for the business year from January 1 to December 31, 2018.
Management’s ResponsibilityThe legal representatives of WACKER are responsible for the preparation of the Report in accordance with Sections 315b and 315c in conjunction with 289b to 289e HGB.
This responsibility of the legal representatives includes the selection and application of appropriate methods to prepare the Report and the use of assumptions and estimates for individual sustainability disclosures which are reasonable under the given circumstances. Further-more, this responsibility includes designing, implementing and maintaining systems and processes relevant for the preparation of the Report in a way that is free of – intended or unintended – material misstatements.
Independence and Quality Assurance on the Part of the Auditing Firm We are independent from the entity in accordance with the requirements of independence and quality assurance set out in legal provisions and professional pronouncements and have fulfilled our additional professional obligations in accordance with these requirements.
Our audit firm applies the national statutory provisions and professional pronouncements for quality assurance, in particular the professional code for German Public Auditors and Chartered Accountants ( in Germany) and the quality assurance standard of the German Institute of Public Audi-tors ( Institut der Wirtschaftsprüfer, IDW) regarding quality assurance requirements in audit practice ( IDW QS 1).
Practitioner’s ResponsibilityOur responsibility is to express a conclusion on the Report based on our work performed within our limited assurance engagement.
We conducted our work in accordance with the Interna-tional Standard on Assurance Engagements ( ISAE) 3000 (Revised): “Assurance Engagements Other than Audits or Reviews of Historical Financial Information” published by IAASB. This Standard requires that we plan and perform the assurance engagement to obtain limited assurance of whether any matters have come to our attention that cause us to believe that the Report for the period from January 1 to December 31, 2018, has not been prepared, in all material respects in accordance with Sections 315b and 315c in conjunction with 289b to 289e HGB. We do not, however, provide a separate conclusion for each disclosure. In a limited assurance engagement the evidence gathering pro-cedures are more limited than in a reasonable assurance engagement and therefore significantly less assurance is obtained than in a reasonable assurance engagement. The choice of audit procedures is subject to the auditor’s own judgement.
1 Our engagement applied to the German version of the Report 2018. This text is a translation of the Independent Assurance Report issued in the German, whereas the German text is authoritative.
211
Wacker Chemie AG – Annual Report 2018
Further Information – Limited Assurance Report of the Independent Auditor regarding the Combined Separate Non-Financial Report

Within the scope of our engagement, we performed amongst others the following procedures:
– Inquiries of personnel on the corporate level who are responsible for the materiality analysis to get an understanding of the process for identifying material topics and respective report boundaries for WACKER
– A risk analysis, including a media search, of relevant information about the sustainability performance of WACKER in the reporting period
– Evaluation of the design and implementation of systems and processes for the collection, processing and monitoring of information on environmental, employee and social matters, respect for human rights, and combating corruption and bribery, including data consolidation
– Inquiries of personnel on the corporate level who are responsible for the collection of the information on concepts, due diligence processes, results and risks, the conduction of internal controls and the information consolidation
– Evaluation of selected internal and external documents– Analytical evaluation of data and trends of quantitative
information which are reported by all sites on the corporate level
– Evaluation of local data collection and reporting processes and reliability of reported data via a sampling survey in Nünchritz (Germany)
– Assessment of the overall presentation of the information
ConclusionBased on the procedures performed and the evidence obtained, nothing has come to our attention that causes us to believe that the Report of WACKER for the business year from January 1 to December 31, 2018 is not prepared, in all material respects, in accordance with Sections 315b and 315c in conjunction with 289b to 289e HGB.
Restriction of Use / Clause on General Engagement TermsThis report is issued for the purposes of the Executive Board of Wacker Chemie Aktiengesellschaft, Munich only. We assume no responsibility with regard to any third parties.
Our assignment for the Executive Board of Wacker Chemie Aktiengesellschaft, Munich, and professional liability is governed by the General Engagement Terms for Wirt-schaftsprüfer and Wirtschaftsprüfungsgesellschaften (Allgemeine Auftragsbedingungen für Wirtschaftsprüfer und Wirtschaftsprüfungsgesellschaften) in the version dated January 1, 2017 (https://www.kpmg.de/bescheinigungen/ lib/aab_english.pdf ). By reading and using the information contained in this report, each recipient confirms having taken note of provisions of the General Engagement Terms ( including the limitation of our liability for negligence to EUR 4 million as stipulated in No. 9) and accepts the validity of the above-mentioned General Engagement Terms with respect to us.
Munich, March 5, 2019 KPMG AG Wirtschaftsprüfungsgesellschaft
Original German version signed by:Hanshen Hell Wirtschaftsprüfer [German Public Auditor]
212
Wacker Chemie AG – Annual Report 2018
Further Information – Limited Assurance Report of the Independent Auditor regarding the Combined Separate Non-Financial Report

Multiyear Overview
€ million 2018 Change in %
2017 2016 2015 2014
Sales
Income before taxes
Net income for the year
EBITDA
EBIT
Fixed assets
Intangible assets
Property, plant and equipment
Financial assets
Current assets, incl. deferred taxes + prepaid expenses
Liquidity
Equity
Subscribed capital
Capital reserves
Treasury shares
Retained earnings, consolidated net income, and other equity items
Non-controlling interests
Borrowed capital
Provisions
Liabilities, incl. deferred taxes + deferred income
Net financial debt (–) Net financial receivables (+)
Total assets
Employees (average for the year)
Employees (Dec. 31)
4,978.8 1.1 4,924.2 4,634.2 5,296.2 4,826.4
324.4 -3.2 335.0 246.4 406.7 365.2
260.1 -70.6 884.8 189.3 241.8 195.4
930.0 -8.3 1,014.1 955.5 1,048.8 1,042.3
389.6 -8.0 423.7 337.5 473.4 443.3
4,324.5 2.7 4,209.4 4,765.5 4,964.9 4,471.0
38.3 -7.7 41.5 50.4 32.1 32.9
3,527.0 0.7 3,501.7 4,596.4 4,800.6 4,312.8
759.2 14.0 666.2 118.7 132.2 125.3
2,794.2 6.4 2,626.3 2,696.1 2,299.5 2,476.2
341.1 18.9 286.9 283.5 310.5 325.9
3,145.5 -0.8 3,169.3 2,593.2 2,795.1 1,946.5
260.8 – 260.8 260.8 260.8 260.8
157.4 – 157.4 157.4 157.4 157.4
-45.1 – -45.1 -45.1 -45.1 -45.1
2,714.1 -1.2 2,746.1 2,006.3 2,195.1 1,549.3
58.3 16.4 50.1 213.8 226.9 24.1
3,973.2 8.4 3,666.4 4,868.4 4,469.3 5,000.7
2,161.1 5.8 2,042.8 2,550.7 1,996.7 2,137.7
1,812.1 11.6 1,623.6 2,317.7 2,472.6 2,863.1
-609.7 34.2 -454.4 -992.5 -1,074.0 -1,080.6
7,118.7 4.1 6,835.7 7,461.6 7,264.4 6,947.2
14,301 4.2 13,723 13,307 16,937 16,744
14,542 5.3 13,811 13,448 16,972 16,703
213
Further Information – Multiyear Overview
Wacker Chemie AG – Annual Report 2018

€ million 2018 Change in %
2017 2016 2015 2014
Key profitability figuresReturn on sales (EBIT ) = EBIT / sales (%)
Return on sales (EBITDA) = EBITDA / sales (%)
Return on equity = net income for the year / equity (as of Dec. 31) (%)
ROCE – return on capital employed = EBIT / capital employed (%)
Key statement-of-financial-position figuresInvestment intensity of fixed assets = fixed assets / total assets (%)
Equity ratio = equity / total assets (%)
Capital structure = equity / borrowed capital (%)
Cash flow and investmentsCash flow from operating activities
Cash flow from long-term investing activities – before securities
Cash flow from financing activities
Net cash flow = CF from operating activities + CF from investing activities – additions from finance leases
Investments
Share and valuationConsolidated net income
Earnings per share (€ ) = consolidated net income /number of shares
Market capitalization (total number of shares without treasury shares)
Number of shares
Price as of reporting date December 31
Dividend per share (€ )
Dividend yield (%)
Capital employed
7.8 n. a. 8.6 7.3 8.9 9.2
18.7 n. a. 20.6 20.6 19.8 21.6
8.3 n. a. 27.9 7.3 8.7 10.0
5.9 n. a. 7.5 6.4 8.1 8.4
60.7 n. a. 61.6 63.9 68.3 64.4
44.2 n. a. 46.4 34.8 38.5 28.0
79.2 n. a. 86.4 53.3 62.5 38.9
509.6 -16.9 613.0 621.0 617.2 485.2
-423.4 30.3 -325.0 -420.3 -815.6 -497.3
-240.5 -27.8 -333.1 -135.8 57.9 -88.6
124.7 -65.2 358.1 361.1 22.5 215.7
460.9 41.0 326.8 338.1 834.0 572.2
260.1 -70.6 884.8 189.3 241.8 195.4
4.95 -71.6 17.45 3.61 4.97 4.10
3,929.5 -51.2 8,057.8 4,910.7 3,851.0 4,523.2
49,677,983 – 49,677,983 49,677,983 49,677,983 49,677,983
79.10 -51.2 162.20 98.85 77.52 91.05
2.50 -44.4 4.50 2.00 2.00 1.50
2.1 n. a. 4.0 2.6 2.2 1.7
4,917.0 -4.3 5,138.3 5,300.4 5,875.4 5,260.7
214
Further Information – Multiyear Overview
Wacker Chemie AG – Annual Report 2018
Chemical Glossary
BiotechnologyBiotech processes use living cells or enzymes to transform or produce substances. Depending on the application, a distinction is made between red, green and white biotech-nology. Red biotechnology: medical and pharmaceutical applications. Green biotechnology: agricultural appli cations. White biotechnology: biotech-based products and industrial processes, e. g. in the chemical, textile and food industries.
ChlorosilanesCompounds of silicon, chlorine and, in some cases, hydro-gen. The semiconductor industry mainly uses trichlorosilane to make polysilicon and for the epitaxial deposition of silicon.
Combined Heat and Power PlantCombined heat and power (CHP) plants generate both electricity and useful heat. This system can be much more efficient at using the input energy (e.g. fuel oil or natural gas) than are conventional systems with separate facilities. Because primary energy is conserved, CHP plants emit significantly less carbon dioxide than conventional power plants.
CyclodextrinsCyclodextrins belong to the family of cyclic oligosaccharides ( i. e. ring-shaped sugar molecules). They are able to en capsulate foreign substances such as fragrances and to release active ingredients at a controlled rate. WACKER BIOSOLUTIONS produces and markets cyclodextrins.
CysteineCysteine is a sulfur-containing amino acid. It belongs to the non-essential amino acids, as it can be formed in the body. It is used, for example, as an additive in foods and cough mixtures. Cysteine and its derivatives are a busi-ness field at WACKER BIOSOLUTIONS.
Dispersible Polymer PowdersCreated by drying dispersions in spray or disc dryers. VINNAPAS® polymer powders are recommended as binders in the construction industry, e.g. for tile adhesives, self- leveling compounds and repair mortars. They improve adhesion, cohesion, flexibility and flexural strength as well as water-retention and processing properties.
DispersionsBinary system in which one component is finely dispersed in another. VINNAPAS® dispersions are vinyl-acetate-based copolymers and terpolymers in liquid form. They are mainly used as binders in the construction industry, e. g. for grouts, plasters and primers.
ElastomersPolymers that exhibit almost perfectly elastic behavior, i. e. they deform when acted upon by an external force and return to their exact original shape when the force is removed. While the duration of the force has no effect on perfectly elastic behavior, the temperature does.
EmissionSubstance outputs, noise, vibrations, light, heat or radiation emitted into the environment by an industrial plant.
EthyleneA colorless, slightly sweet-smelling gas that, under normal conditions, is lighter than air. It is needed as a chemical starting product for a great many synthetic materials, including polyethylene and polystyrene. It is used to make products for the household, agricultural and automotive sectors, among others.
Exterior Insulation and Finish Systems (EIFS) / External Thermal Insulation Composite Systems (ETICS)Systems for thermally insulating buildings and thus for increasing energy efficiency. These systems have a multi-layer structure: adhesive mortar, thermal insulating panels, embedding mortar, glass fiber mesh and finishing coat. VINNAPAS® polymer powders from WACKER POLYMERS ensure that the insulation material bonds firmly to the mortar and finish coat. As a result, the insulating system offers greater durability and much more resistance to weathering and wear.
FermentationIn biotechnology, fermentation means the conversion of biological materials by means of bacterial, fungal and cell cultures, or by the addition of enzymes. For example, prod-ucts such as insulin, many different antibiotics and amino acids (e.g. cysteine) can be synthesized on an industrial scale in bioreactors using microorganisms.
ImmissionSubstance inputs, noise, vibrations, light, heat or radiation that affect humans, animals, plants, soil, water, air, and cultural and other material assets.
215
Further Information – Chemical Glossary
Wacker Chemie AG – Annual Report 2018
PolymerA polymer is a large molecule made up of smaller molecular units (monomers). It contains between 10,000 and 100,000 monomers. Polymers can be long or ball-shaped.
Polymer BlendsThe result of mixing different polymers is known as a polymer blend (polymer alloy). If these polymer blends are composed of biopolymers (biodegradable and /or renewable raw materials), the VINNEX® binder system may enhance compatibility and hence their properties.
PolysiliconHyperpure polycrystalline silicon from WACKER POLYSILICON is used for manufacturing wafers for the electronics and solar industries. To produce it, metallurgical-grade silicon is converted into liquid trichlorosilane, highly distilled and deposited in hyperpure form at 1,000 ° C.
Primary EnergyPrimary energy is obtained from naturally occurring sources such as coal, gas or wind. Secondary energy, in contrast, is derived from primary energy via a transformation process (which often involves energy losses); examples include electricity, heat and hydrogen.
SilanesSilanes are used as monomers for the synthesis of silox-anes or sold directly as reagents or raw materials. Typical applications include surface treatment, agents (medically active substances) in pharmaceutical synthesis, and coupling agents for coatings.
SilicaCollective term for compounds with the general formula SiO2 • nH2O. Synthetic silicas are obtained from sand. On the basis of the method of production, a distinction is made between precipitated silicas and pyrogenic silicas (such as HDK®).
Silica, PyrogenicWhite, synthetic, amorphous silicon dioxide (SiO2) in pow-der form, made by flame hydrolysis of silicon compounds. Variously used as an additive for silicone rubber grades, sealants, surface coatings, pharmaceuticals and cosmetics.
SiliconAfter oxygen, silicon is the most common element in the earth’s crust. In nature, it occurs without exception in the form of compounds, chiefly silicon dioxide and silicates. Silicon is obtained through energy-intensive reaction of quartz sand with carbon and is the most important raw material in the electronics industry.
SiliconesGeneral term used to describe compounds of organic molecules and silicon. According to their areas of applica-tion, silicones can be classified as fluids, resins or rubber grades. Silicones are characterized by a myriad of out-standing properties. Typical areas of application include construction, the electrical and electronics industries, shipping and transportation, textiles and paper coatings.
SiloxanesSystematic name given to compounds comprising silicon atoms linked together via oxygen atoms and with the remaining valences occupied by hydrogen or organic groups. Siloxanes are the building blocks for the polymers (polysiloxane and polyorganosiloxane) that form silicones.
VINNAPAS®
VINNAPAS® is WACKER’s brand name for dispersions, dis-persible polymer powders, solid resins and their associated product solutions. VINNAPAS® dispersions and polymer powders are primarily used in the construction industry as polymeric binders, e.g. in tile adhesives, exterior insula-tion and finish systems (EIFS) / external thermal insulation composite systems (ETICS), self-leveling compounds, and plasters.
Volatile Organic Compounds (VOCs)Volatile organic compounds ( VOCs) are gaseous and vaporous substances of organic origin that are present in the air. They include hydrocarbons, alcohols, aldehydes and organic acids. Solvents, liquid fuels and synthetic substances can be VOCs, as can organic compounds originating from biological processes. High VOC concen-trations can be irritating to the eyes, nose and throat and may cause headaches, dizziness and tiredness.
Wacker Operating System (WOS)The Wacker Operating System (WOS) program bundles, promotes and processes corporate projects for system-atic process improvement. It is the basis for a groupwide improvement initiative by WACKER.
216
Further Information – Chemical Glossary
Wacker Chemie AG – Annual Report 2018

Financial Glossary
Business Value Contribution (BVC)BVC is a financial performance measurement that deter-mines the value created by the WACKER Group and its units once all capital costs have been deducted. BVC is the difference between profit (EBIT ) and cost of capital (WACC X CE). BVC is a profit variable that is adjusted to allow for extraordinary effects (e. g. sale of parts of the com-pany). This makes it an ideal tool for measuring business performance.
Capital Employed (CE)Capital employed is the sum of average noncurrent assets ( less noncurrent securities and deferred tax assets), plus inventories and trade receivables ( less trade payables). It is the variable used in calculating the cost of capital.
Cash FlowCash flow represents the movement of cash and cash equivalents into or out of a business activity during a finite period. Net cash flow is the sum of cash flow from operating activities (excluding changes in advance pay-ments received) and cash flow from long-term investing activities (before securities), including additions due to finance leases.
EBITEarnings before interest and taxes: EBIT is a good indicator for comparing companies’ profitability, since it is widely used across the corporate world.
EBITDAEarnings before interest, taxes, depreciation and amor-tization.
Equity RatioThe equity ratio is equity as a percentage of a company’s total assets. It is a measure of a company’s economic and financial stability.
IFRSThe International Financial Reporting Standards (until 2001 International Accounting Standards, IAS) are compiled and published by the London-based International Accounting Standards Board ( IASB). Since 2005, publicly listed EU-based companies have been required to use IFRS in accordance with IAS regulations.
Return on Capital Employed (ROCE)Return on capital employed is the profitability ratio relating to the capital employed. It is defined as earn-ings before interest and taxes (EBIT ) divided by capital employed. Investment income from Siltronic AG and the corresponding carrying amount in equity are not included when calculating ROCE. ROCE is a clear indicator of how profitably the capital required for business operations is being employed. It is influenced not only by profitability, but also by capital intensity with regard to noncurrent assets required for business operations and to working capital. ROCE is re viewed annually as part of our planning process and is a key criterion for managing our capital expenditure budget.
217
Further Information – Financial Glossary
Wacker Chemie AG – Annual Report 2018
List of Tables and Figures
CoverWACKER at a Glance U2
A For Our ShareholdersA.1 Facts & Figures on Wacker Chemie AG’s Stock 39A.2 WACKER Share Performance ( indexed to 100) 39A.3 Dividend Trends 39A.4 Useful Information on WACKER Stock 40A.5 Banks and Investment Firms Covering
and Rating WACKER 40
B Combined Management ReportB.1 Key Factors for Multidivisional Sites 43B.2 WACKER’s Production and Sales Sites and
Technical Competence Centers 44B.3 Executive Board Responsibilities 45B.4 Group Structure 45B.5 Group Structure in Terms of
Managerial Responsibility 46B.6 WACKER’s Competitive Positions 47B.7 Leading Operational Indicators 48B.8 Planned and Actual Figures 51B.9 ROCE and BVC 52B.10 Strategic and Operational Planning 52B.11 Information Required by Section 315a (1)
of the German Commercial Code (HGB) 53B.12 GDP Trends in 2018 54B.13 Growth Rate in Construction by Region in 2018 55B.14 Installation of New PV Capacity in 2017 and 2018 55B.15 Market-Price Trends for WACKER’s Key Raw Materials 56B.16 Expenses by Cost Type 58B.17 Comparing Actual with Forecast Performance 58B.18 Year-over-Year Sales Comparison 59B.19 Reconciliation of EBITDA to EBIT 60B.20 Reconciliation of EBIT to Net Income for the Period 60B.21 Key Data: WACKER SILICONES 61B.22 Key Data: WACKER POLYMERS 62B.23 Key Data: WACKER BIOSOLUTIONS 62B.24 Key Data: WACKER POLYSILICON 63B.25 Divisional Shares in External Sales 63B.26 External Sales by Customer Location 63B.27 External Sales by Group Company Location 64B.28 Trends: Assets 64B.29 Asset and Capital Structure 64B.30 Working Capital 65B.31 Trends: Equity and Liabilities 66B.32 Net Cash Flow 68B.33 Net Cash Flow – Continuing Operations 68B.34 Cash Flow from Operating Activities
(Gross Cash Flow) – Continuing Operations 68B.35 Cash Flow from Long-Term Investing Activities
Before Securities – Continuing Operations 69B.36 Net Financial Debt 69B.37 R&D Expenses 71B.38 Investments in R&D Facilities 71
B.39 Breakdown of R&D Expenditures in 2018 71B.40 R&D Organization 72B.41 Key Product Launches in 2018 73B.42 Number of Employees at December 31 74B.43 Number of Temporary Workers at December 31 74B.44 Personnel Expenses 74B.45 Procurement Volumes
( incl. Procurement for Capital Expenditures) 75B.46 Plant Utilization in 2018 75B.47 Key Start-Ups 76B.48 Breakdown of Marketing Costs 76B.49 Tradeshows 76B.50 Statement of Income 77B.51 Statement of Financial Position 79B.52 “Three Lines of Defense” Model 82B.53 Risk Management System 83B.54 Basis of Our Internal Control System ( ICS) 84B.55 Probability and Possible Impact of Our Risks in 2019 86B.56 Controlling Financial Risks 89B.57 Opportunity Management System 94B.58 Overview of Business Opportunities 95B.59 GDP Trends in 2019 97B.60 Construction-Industry Growth Rates by Region,
2019 to 2021 98B.61 Photovoltaic-Market Trend in 2019 98B.62 WACKER’s Key Customer Sectors 98B.63 Facility Start-Ups in 2019 99B.64 Outlook for 2019 101
C Consolidated Financial StatementsC.1 Statement of Income 105C.2 Statement of Comprehensive Income 106C.3 Statement of Financial Position 107C.4 Statement of Cash Flows 108C.5 Statement of Changes in Equity 109C.6 Reconciliation of Other Equity Items 110C.7 Segment Information by Division 111C.8 Segment Information by Region 112
D Further Information Supervisory Board, Executive Board, Corporate Governance Report and Non-Financial ReportD.1 WACKER’s Environmental Targets through 2022 198D.2 Environmental Protection Costs 199D.3 Electricity Supply 199D.4 Energy Consumption 200D.5 Environmental Indicators 201D.6 Environment- and Safety-Related Incidents 201D.7 Transport Accidents 202D.8 Workplace Accidents Involving Permanent Staff
and Temporary Workers 204D.9 Diversity, Inclusion and Equal Opportunity 205D.10 Employee Turnover Rate 206D.11 Corruption and Bribery Incidents 207D.12 Energy Consumption 209D.13 Environment- and Safety-Related Incidents 209D.14 Workplace Accidents Involving Permanent Staff
and Temporary Workers 209D.15 Number of Employees and Temporary Workers
as of December 31 209D.16 Environmental Indicators 210
218
Wacker Chemie AG – Annual Report 2018
Further Information – List of Tables and Figures

Index
A accounting and valuation methods, reporting principles 125, 134, 163-164, 174amortization 51, 77, 78, 124, 127, 167-168auditor’s report 37, 81, 113, 174 – 180
C capital expenditures, investments 29, 31, 35, 49 – 51, 57 – 58, 61 – 63,
65, 67 – 71, 75 – 76, 79, 88 – 89, 95-96, 99, 101 – 102, 108, 166, 199
cash flow 29, 35, 50 – 52, 57 – 58, 67 – 70, 80, 95, 101 – 102, 108, 10, 115-116, 119, 123-125, 128-132,
145, 150, 159, 162-168, 175, 192, 214, 217compensation 74 – 75, 173, 185, 188, 192 – 196, 206corporate governance 35-36, 46, 113, 175,
177, 185 – 196, 205
D depreciation 49 – 51, 58 – 61, 65, 68, 70, 77 – 79, 88,
95-96, 99, 101 – 102, 108, 111, 119, 124, 126 – 128, 132, 140-141, 167 – 168, 217
digitalization 31, 50, 95-96, 100dividend 30, 39, 65-66, 69-70, 78 – 80,
102, 108-109, 146, 157, 214
E earnings 59-64, 77-78, 84, 86, 89, 91 – 94, 142, 156earnings per share 39, 157, 214EBIT 51-52, 60 – 63, 105, 111, 169, 213, 217EBITDA 29 – 30, 48, 50 – 52, 57 – 63, 68, 70, 77, 101 – 102,
111, 114, 121, 163-164, 167, 213-214, 217economic trends 54employees 5, 58, 61 – 63, 74 – 75, 78, 93 – 94, 100, 111 – 112,
146 – 148, 150, 152, 197, 202 – 209, 213environmental protection 47, 125, 133, 152 – 153, 189,
197 – 199, 200-201,209-210equity 35, 64, 66, 70, 79-80, 91, 106 – 107,
109-110, 127 – 132, 139, 142, 145 – 146, 158-171, 175, 213-214, 217
events after the balance sheet date 173executive board 29 – 33, 35-37, 45 – 46, 70, 72,
96, 102, 157, 173-174, 184 – 196
F financial liabilities 51, 64, 66, 69, 79 – 80, 90, 107-108,
114-116, 128-130, 132, 134, 137, 146, 153 – 155, 158-164, 167-168
financial position, financial situation 35, 67 – 70, 78, 84, 86, 89 – 94financing measures 68fixed assets 60, 64 – 65, 77, 79, 108, 111, 137, 155
G glossaries 215-217group structure 45-46
I innovations 72 – 74intangible assets 64, 67, 79, 107 – 108, 123-124,
127, 139 – 140, 168, 213interest result, net interest income 60, 77 – 78, 108, 132, 137, 163-164inventories 59, 64 – 65, 77, 79, 107 – 108, 132, 143investments ( in joint ventures and associates) 59 – 60, 64 – 65, 68, 77-78, 80, 88,
105 – 107, 111, 116, 121 – 122, 124, 128, 130, 137-138, 141 – 143, 158 – 163, 167
investor relations 38 – 40
L liabilities 64 – 66, 69, 79 – 80, 90, 107 – 108, 111-116, 121-130,
132, 134, 136-137, 139, 141, 146, 153 – 172limited assurance report 211-212liquidity 65-69, 80, 90, 146, 151, 163, 213
Mmanagement processes 50 – 52management report 43 – 102
Nnet assets 64 – 67net financial debt 29, 35, 51, 57 – 58, 69 – 70, 90, 101 – 102noncurrent assets 51, 64-65, 94, 107, 112, 121, 141, 163notes to the consolidated financial statements 113 – 173
O opportunities report 94outlook 81, 97-102
219
Wacker Chemie AG – Annual Report 2018
Further Information – Index

P personnel expenses 70, 74, 77 – 78, 81, 100, 157procurement, purchasing 70, 75, 78, 83, 86-88, 96,
152 – 153, 156, 207-208products 3 – 26, 43, 46 – 50, 54 – 55, 61 – 62,
71 – 73, 76, 86 – 87, 92, 95, 97 – 102property, plant and equipment 64 – 65, 79, 107 – 108,
123-124, 127 – 128, 137, 139 – 140, 176- 177
provisions 60, 64, 66, 79, 86, 107 – 108, 114, 125, 133 – 134, 136 – 139, 152 – 153
provisions for pensions 64 – 66, 70, 79, 107, 125, 133, 139, 146, 148, 168, 173
R rating 70report of the supervisory board 34 – 37research and development 70 – 74, 100, 126, 189risk management system 37, 80 – 84, 96, 163
S sales trend 54, 59, 63scope of consolidation 81, 109 – 110, 120 – 123, 136,
139-140, 142, 144-145, 149, 166sectors, sector-specific 43, 46, 54, 73-74, 95 – 98segments, segment reporting 61 – 63, 167share price 36, 38-39, 70share, stock 30, 38 – 40, 70, 105, 145, 157
sites 5, 9-17, 43-44, 197 – 200, 202, 204social responsibility 189, 206statement of cash flows 108, 166 – 167statement of financial position 67, 79, 81, 107statement of income 77, 105statutory information on takeovers 53strategy 32, 35, 40, 43, 45, 49, 50, 52supervisory board 34 – 37, 39, 45 – 46, 52 – 53, 70,
81 – 85, 113, 163, 171-174, 177 – 178, 180, 183 – 192, 195 – 197, 204
sustainability 49, 98, 100, 189, 197- 210
T technical competence centers 5, 43 – 44training 202-203
W WACKER BIOSOLUTIONS 3 – 26, 45-48, 50, 54, 56 – 57,
59, 62-63, 69, 72 – 74, 77-78, 96, 100, 102, 134-135
WACKER POLYMERS 45 – 48, 50, 54 – 56, 59, 61 – 63, 71 – 73, 77-78, 87, 95, 98 – 101, 135
WACKER POLYSILICON 45 – 48, 50, 55, 57, 59, 62 – 63, 65, 70, 74 – 75, 77-78, 87, 96, 102,
134-135, 176 – 177 WACKER SILICONES 45 – 48, 50, 54-55, 57, 59,
61, 63, 65, 72 – 73, 77-78, 87, 95, 98 – 101, 135, 168
Our Annual Report was published on March 19, 2019. It is available in English and German and you can access both versions online.
www.wacker.com/annual-report
This Annual Report contains forward-looking statements based on assumptions and estimates of WACKER’s Executive Board. Although we assume the expectations in these forward-looking statements are realistic, we cannot guarantee they will prove to be correct. The as-
sumptions may harbor risks and uncertainties that may cause the actual figures to differ considerably from the forward-looking statements. Factors that may cause such discrepancies include, among other things, changes in the economic and business environment, variations in exchange and interest rates, the introduction of competing products, lack of acceptance for new products or services, and changes in corporate strategy. WACKER does not plan to update the forward- looking statements, nor does it assume the obligation to do so.
220
Wacker Chemie AG – Annual Report 2018
Further Information – Index

2019 Financial Calendar
ContactsPublishing Details
Investor RelationsJoerg HoffmannHead of Investor RelationsTel. +49 89 6279-1633
Media RelationsChristof BachmairTel. +49 89 6279-1830
PublisherWacker Chemie AG
Corporate CommunicationsHanns-Seidel-Platz 481737 Munich, GermanyTel. +49 89 6279-0
Fax +49 89 6279-1770
www.wacker.com
Overall ResponsibilityJörg Hettmann
Project CoordinationHeide Feja
Concept and Designhw.design, Munich, Germanywww.hwdesign.de
Interim Report on the 1st Quarter of 2019
Annual Shareholders’ Meeting
Interim Report on the 2nd Quarter of 2019
Interim Report on the 3rd Quarter of 2019
April
25
May
23
August
1
October
24

Wacker Chemie AGHanns-Seidel-Platz 481737 Munich, GermanyTel. + 49 89 6279 - 0Fax + 49 89 6279 -1770www.wacker.com