wage inequality and wage mobility in europe
TRANSCRIPT

RUHRECONOMIC PAPERS
Wage Inequality andWage Mobility in Europe
#386
Ronald BachmannPeggy BecharaSandra Schaff ner

Imprint
Ruhr Economic Papers
Published by
Ruhr-Universität Bochum (RUB), Department of EconomicsUniversitätsstr. 150, 44801 Bochum, Germany
Technische Universität Dortmund, Department of Economic and Social SciencesVogelpothsweg 87, 44227 Dortmund, Germany
Universität Duisburg-Essen, Department of EconomicsUniversitätsstr. 12, 45117 Essen, Germany
Rheinisch-Westfälisches Institut für Wirtschaftsforschung (RWI)Hohenzollernstr. 1-3, 45128 Essen, Germany
Editors
Prof. Dr. Thomas K. BauerRUB, Department of Economics, Empirical EconomicsPhone: +49 (0) 234/3 22 83 41, e-mail: [email protected]
Prof. Dr. Wolfgang LeiningerTechnische Universität Dortmund, Department of Economic and Social SciencesEconomics – MicroeconomicsPhone: +49 (0) 231/7 55-3297, email: [email protected]
Prof. Dr. Volker ClausenUniversity of Duisburg-Essen, Department of EconomicsInternational EconomicsPhone: +49 (0) 201/1 83-3655, e-mail: [email protected]
Prof. Dr. Christoph M. SchmidtRWI, Phone: +49 (0) 201/81 49-227, e-mail: [email protected]
Editorial Offi ce
Joachim SchmidtRWI, Phone: +49 (0) 201/81 49-292, e-mail: [email protected]
Ruhr Economic Papers #386
Responsible Editor: Christoph M. Schmidt
All rights reserved. Bochum, Dortmund, Duisburg, Essen, Germany, 2012
ISSN 1864-4872 (online) – ISBN 978-3-86788-441-9The working papers published in the Series constitute work in progress circulated to stimulate discussion and critical comments. Views expressed represent exclusively the authors’ own opinions and do not necessarily refl ect those of the editors.

Ruhr Economic Papers #386
Ronald Bachmann, Peggy Bechara, and Sandra Schaff ner
Wage Inequality andWage Mobility in Europe

Bibliografi sche Informationen der Deutschen Nationalbibliothek
Die Deutsche Bibliothek verzeichnet diese Publikation in der deutschen National-bibliografi e; detaillierte bibliografi sche Daten sind im Internet über: http://dnb.d-nb.de abrufb ar.
http://dx.doi.org/10.4419/86788441ISSN 1864-4872 (online)ISBN 978-3-86788-441-9

Ronald Bachmann, Peggy Bechara, and Sandra Schaff ner1
Wage Inequality and Wage Mobility in Europe
AbstractUsing data from the European Union Statistics on Income and Living Conditions (EU-SILC), this paper investigates wage inequality and wage mobility in Europe. Decomposing inequality into within and between group inequality, we analyse to what extent wage inequality and mobility can be explained by observable characteristics. Furthermore, we investigate which individual and household characteristics determine transitions within the wage distribution. Finally, we examine the importance of institutions for wage inequality, wage mobility, and wage transitions. We fi nd that overall, mobility reduces wage inequality. While a large part of wage inequality is due to unobservable characteristics, the equalizing eff ect of mobility mainly occurs within groups. Furthermore, both personal and household characteristics play an important role for wage transitions. Finally, our fi ndings reveal large cross-country diff erences across Europe, which are partly linked to the institutional set-up of the national labour markets.
JEL Classifi cation: J6; J31; P52
Keywords: Wage inequality; wage mobility; wage transitions; cross-country analysis
December 2012
1 Ronald Bachmann, RWI and IZA Bonn; Peggy Bechara and Sandra Schaff ner, RWI. – We are grateful to participants of the 2nd European User Conference for EU-LFS and EU-SILC, the 2012 Annual Conference of the European Society of Population Economics as well as of seminars at University of Mannheim and RWI for helpful comments. – All correspondence to Ronald Bachmann, RWI, Hohenzollernstr. 1-3, 45128 Essen, Germany, E-Mail: [email protected].

1 Introduction
The labour markets of the EU Member States feature remarkable differences with respect to their
degree of wage inequality (Koeniger et al., 2007, Gottschalk and Smeeding, 2000). However, the
inequality measures commonly used only provide a snapshot of the distribution of earnings at a
particular point in time. Even if there exists high earnings inequality, it is possible that life-time
earnings inequality is much smaller (Buchinsky and Hunt, 1999). Furthermore, measures of inequality
do not give any insights into whether the same workers are always at the bottom of the income
distribution or if those at the bottom of the income distribution have a chance of improving their
income position.
Wage mobility, i.e. the fact that individual earnings may change over time, plays a crucial role in
this context for several reasons. First, it can contribute to an equalization of earnings (Buchinsky and
Hunt, 1999; Dickens, 2000). Second, for a given wage distribution, the degree of wage mobility by itself
is important for worker welfare as high mobility is related to incentives to increase the own income
position but also to a greater uncertainty regarding future income. Third, especially for countries
that exhibit a high degree of wage mobility and thus a high degree of equality of opportunity, unequal
wages may be more acceptable (cf. Nozick, 1974; Rawls, 1999). Finally, wage mobility may have an
impact on the demand for redistributive policies (Benabou and Ok, 2001; Karabarbounis, 2011).
In this paper, we analyse the extent of wage inequality and wage mobility. We do so for almost
all EU Member States using a representative and internationally comparable micro data set on in-
dividual workers, the European Union Statistics on Income and Living Conditions (EU-SILC). After
providing an overview of wage inequality and wage mobility in the European Union, we decompose
both measures into their between-group and within-group components, i.e. the components which are
due to differences in observable characteristics and the components which remain unexplained. This
allows insights into the potential causes of the extent of wage inequality and wage mobility in the EU
Member States. This analysis is further extended by an in-depth investigation of the determinants of
mobility within the wage distribution at the level of the individual worker. Finally, we explore the
link between wage inequality and wage mobility on the one hand, and the institutional features of the
national labour markets on the other hand.
Our study thus contributes to the literature in several respects. First, we give an overview of
wage inequality and wage mobility for many EU Member States and thus update and complement
the literature which has done so for some European countries, using the predecessor of the EU-SILC
data set, the ECHP.1 Second, we provide evidence on the role of within and between effects for wage
inequality and wage mobility, as well as the individual-specific determinants of wage mobility. There-
1The next section provides a brief literature overview.
4

fore, we complement the results of Hofer and Weber (2002) and Raferzeder and Winter-Ebmer (2007)
for Austria, Cholezas and Tsakloglou (2007) for some further European countries, and Buchinsky and
Hunt (1999) for the US. Third, EU-SILC enables us to take into account household information in the
analysis of individual wage mobility, which provides interesting insights. Finally, we provide empirical
evidence on the link between labour market institutions for wage inequality and wage mobility at the
country level.
Given that the focus of the paper is on cross-national comparisons, it should be pointed out
that an “ideal” combination of wage inequality and wage mobility at the country level is unlikely
to exist. First, preferences between countries regarding these two concepts are likely to be different
(Alesina et al., 2004, Benabou and Tirole, 2006). Second, the way income inequality translates into
inequality in consumption greatly depends on the nature of credit and insurance markets (Krueger
and Perri, 2006). Given that the ability of these markets to smooth income fluctuations is likely to
be very different across the EU Member States, similar levels of income inequality in all likelihood
lead to different levels of consumption inequality, and hence different levels of social welfare. For
these reasons, normative judgements derived from a cross-country comparison of income inequality
and income mobility should be made with some care.
The paper is structured as follows. The next section gives an overview of the relevant literature.
The third section describes the data set used as well as the routines used to generate our variables of
interest, in particular monthly labour income. In the fourth section, we explain the measures of wage
inequality and wage mobility used in the analysis, as well as the econometric methodology. The fifth
section presents the empirical evidence. The final section summarizes and concludes the discussion.
2 Previous Research
Interest in the extent and evolution of inequality in industrialized countries has been fostered during
the last decades by the widening of the earnings distribution in many of these countries (see Atkinson,
2002, Katz and Autor, 1999, and Machin, 2008, for reviews of this strand of literature). Besides
numerous studies on individual countries, mainly focussing on the UK and the US (e.g. Blanchflower
and Slaughter, 1999, Goos and Manning, 2007, and Juhn et al., 1993), there exists a range of studies
comparing earnings inequalities across a usually small selection of OECD countries (Aaberge et al.,
2002; Cardoso, 2006; Burkhauser and Poupore, 1997; Hofer and Weber, 2002, e.g.). The empirical
findings of these studies reveal that there exist large country-specific differences, with the level of
inequality and its increase over time being modest in Nordic and Continental European countries and
exceptionally high in Anglo-Saxon countries.
The literature providing comparative evidence on wage inequality for a large set of countries is rel-
5

atively small (some of the few studies on this issue are Koeniger et al., 2007, Gottschalk and Smeeding,
2000, and Checchi and Garcia-Penalosa, 2008, for OECD countries; Sologon and O’Donoghue, 2012,
and Cholezas and Tsakloglou, 2007, for European countries). Two recent contributions are Checchi
et al. (2010) and Van Kerm and Pi Alperin (2010) who provide an overview of wage inequality using
EU-SILC data for 26 European countries. Both studies suggest that the most unequal earnings can be
observed for Portugal and Eastern European countries, while more compressed earnings distributions
can be found for the Scandinavian countries.
The number of studies addressing earnings dynamics and investigating the role of mobility in
equalizing the earnings distribution is relatively large. Most of the existing research covers the earnings
mobility in one specific country (e.g. Buchinsky and Hunt, 1999, for the US, Canto, 2000, for Spain,
and Jarvis and Jenkins, 1998, for Britain). The general evidence is that individual earnings mobility
leads to a convergence of wages and thus to a reduction of inequality. Moreover, mobility increases
with the length of the time period considered and tends to be larger at the bottom of the earnings
distribution that an the top.
Cross-country evidence on the impact of mobility on the earnings distribution is comparatively
scarce. This is due to the limited availability of personal longitudinal data which is needed to calculate
the percentage reduction in single-year inequality when earnings are averaged over several years (see
Section 4). Thus, comparative studies predominantly cover small sets of countries (e.g. Aaberge et al.,
2002, Burkhauser and Poupore, 1997, Gregg and Vittori, 2008, and Hofer and Weber, 2002). One of
the few studies providing evidence for a large number of countries is Van Kerm and Pi Alperin (2010)
employing recent EU-SILC data. The findings of these cross-country analyses reveal that despite the
large differences in earnings inequality, the patterns of earnings mobility are rather similar. Countries
with relatively unequal earnings exhibit somewhat lower mobility rates, while the opposite is the case
for countries with a more compressed earnings distribution.
Inequality can be driven by wage differentials between demographic groups such as age, skill
level and gender, as well as by wage differentials within these groups. Decomposing inequality into
these two components, Katz et al. (1995) show that Britain and the US both experienced substantial
increases in between- and within-group wage inequality in the 1980s. According to Buchinsky and
Hunt (1999), the larger part of inequality in the US is due to inequality within groups. Similarly to
inequality, wage mobility can be decomposed into a component which reflects the effect of mobility on
inequality within demographic groups, and a component which mirrors the effects on between-group
wage differences (cf. Section 4). Within-mobility seems to be decisive for the equalisation of wages in
the US (Buchinsky and Hunt, 1999).
Although the specific transitions within the wage distribution determine overall wage mobility,
6

evidence in this area is scarce. One of the few papers dealing with this issue is Raferzeder and Winter-
Ebmer (2007), who analyse the role of individual characteristics for the probability of making an
upward or downward transition in the earnings distribution in Austria. Their findings suggest that
the lower the starting position of an individual worker, the higher his chance of making an upward
transition. Furthermore, white-collar workers have advantages, and changing jobs entails a higher
probability of making an upward or downward transition.
There are two main explanations for the observed cross-country differences and the increasing disper-
sion of the wage distribution over time. The first explanation is the long-run growth in the relative
demand for skilled workers induced by globalization and technological change, which in the U.S. has
interacted with the rise in the relative supply of skilled workers (cf. Katz and Murphy, 1992). How-
ever, as the processes of globalization and technological change have been pervasive across developed
economies, these factors are not able to fully account for variations across countries (Acemoglu, 2003).
The second major explanation for differential inequality levels and trends are country differences
in institutional settings. Empirical studies investigating the impact of labour market institutions on
wage differentials for a particular country find that higher union density and higher minimum wages
tend to compress the earnings distribution (e.g. Card, 2001, for the US, Machin, 1997, for the UK, and
Edin and Holmlund, 1995, for Sweden). Cross-country evidence is provided for example by Koeniger
et al. (2007), Checchi and Garcia-Penalosa (2008) and OECD (2004). These studies, using aggregate
measures of earnings inequality for a panel of OECD countries and addressing a broader set of labour
market institutions, show that the institutional settings are significantly correlated with the earnings
distribution across countries. Moreover, they suggest that stronger institutions, in particular those
affecting the wage-setting process, as well as more generous redistributive policies tend to reduce the
dispersion of earnings.
Comparative studies that use micro-level data to investigate the relationship between earnings
mobility and institutional settings are scarce. Employing ECHP data on 14 European countries for
the time period 1994-2001, Sologon and O’Donoghue (2012) provide one of the few studies on the
role of labour market policies in explaining cross-country differences in inequality. Their findings
suggest that especially the strictness of employment protection legislation, the degree of corporatism
and union density as well as the interplay of these institutional factors are important in determining
the country-specific patterns in earnings inequality.
These studies thus suggest several institutions that may have an effect on wage inequality and
wage mobility. First, employment protection legislation reduces both layoffs and hirings (Lindbeck
and Snower, 1989; Lazear, 1990), which has a negative impact of worker flows, and thus potentially
7

on wage mobility. Second, trade unions may have an important impact on both the wage distribution
and wage mobility. On the one hand, unions tend to reduce wage dispersion (Lemieux, 2008), on the
other hand they define clear career progression rules, which generally reduce wage mobility (Cardoso,
2006).
Third, the tax wedge, i.e. income tax plus social security contributions relative to total labour
costs, reduces net wages relative to gross wages. It is therefore likely to increase reservation wages, and
thus lead to a reduction of wage inequality. Furthermore, a higher tax wedge implies that an increase
in gross wages translates into a lower increase in net wages. Therefore, the incentive to move up
the wage distribution is reduced, which may lead to lower wage mobility. However, gross wages may
adjust such as to undo the redistributive effects of the tax system (Feldstein and Wrobel, 1998). In
this case, one would not expect a clear link between the tax wedge and wage inequality and mobility.
Fourth, the net replacement rate, i.e. unemployment benefits relative to previous labour income, is
likely to compress the bottom of the wage distribution by raising workers’ reservation wages (Eckstein
and van den Berg, 2007). Finally, spending on education may increase income mobility and reduce
inequality (Sylwester, 2002). This is the case if the lower part of the income distribution is dominated
by low-skill employees and if those persons particularly benefit from spending on education.
3 Data
The empirical analysis in this paper is based on the European Union Statistics on Income and Living
Conditions (EU-SILC), which provide representative and internationally comparable cross-sectional
and longitudinal data for all EU Member States (except Malta) as well as for Norway and Iceland
(cf. EUROSTAT, 2010).2 Starting in 2004, the national statistical agencies of 15 countries either
collected the data through personal interviews or extracted them from administrative data sources.
The database was extended in 2005 to the remaining countries, with the exception of Bulgaria and
Romania which followed in 2006 and 2007, respectively. The data, collected at a yearly frequency,
are processed by Eurostat in order to ensure comparability across countries, e.g. by using the same
concepts and definitions as well as common classifications.
In this paper, we use the longitudinal version of EU-SILC, a rotational household panel, for the
time period 2004-2010. This data set provides information on individual household members for a
maximum of four years, which allows us to follow individuals over time. For all household members
aged 16 and above, the EU-SILC data provide three types of information: yearly information on various
individual characteristics (sex, age, skill level, ...) and household characteristics (size, composition, ...)
2The results and conclusions in this paper are ours and not those of Eurostat, the European Commission or any of
the national authorities whose data we use.
8

at the time of the interview; information on the employment status of the respondent for each month
of the calendar year preceding the interview; information on the labour income of the respondent for
the year preceding the interview, separately for income from paid work (which includes all types of
income from paid labour)3 and from unemployment insurance and other benefit payments. In order
to ensure international comparability and for reasons of data availability, we use the information on
gross income contained in the data set.
Given that the income information is provided on a yearly basis, we need to compute monthly
earnings in order to make this information comparable across individuals who are employed for a
differing number of months (cf. Engel and Schaffner, 2012). In order to do so, we exploit the fact that
the labour income and the employment status are reported for the same time period, i.e. the year
preceding the interview. We thus combine the information on yearly labour earnings and the monthly
employment status and assign labour income to the twelve calendar months as follows:
1. For workers with only one full-time or part-time employment spell, we divide earnings by the
number of months of this spell.
2. If a worker features at least one employment interruption during one year, we extrapolate the
monthly earnings computed in the first step to the following (previous) months of the next
(preceding) year if the employment status has not changed from one year to the next.
3. If after step 2, an employment spell remains which has not been assigned a monthly income,
yearly earnings are reduced by the sum of the earnings assigned to all other employment spells
in the respective year. This figure is divided by the number of months of this spell, which gives
the monthly income for the employment spell under consideration.
In the following analysis, we focus on full-time employed individuals aged between 16 and 64 living in
private households who are not working as soldiers (occupation group ”armed forces”). Due to data
shortcomings we also leave unconsidered Iceland, Ireland and Greece. In addition, our analysis of wage
mobility requires information on workers during three consecutive years. We therefore restrict our
analysis to individuals who are full-time employed in at least three consecutive years. This leads to a
drop in the number of observations and an exclusion of Germany and Sweden, as for both countries
information is available for less than three years.4 The final sample comprises 23 European countries
with a total of about 230,000 observations.
3For the sake of readbility, we use the terms “wages”, “earnings”, “labour income” and “pay” synonymously in the
following.4Table 1 in the appendix shows that the sample restricted to individuals who are full-time employed in three con-
secutive years and the unrestricted sample exhibit similar patterns with respect to individual characteristics. Moreover,
Figure B.1 illustrates that the restriction does not change the country-specific wage inequality and the respective ranking
substantially.
9

4 Measurement of Inequality and Mobility
In order to examine wage inequality, we calculate different inequality measures, each of them focussing
on specific parts of the earnings distribution (Cowell, 2011). While the mean log deviation (MLD)
gives disproportionate weight to inequality at the bottom and the Theil 2 index to inequality at
the top of the earnings distribution, the Theil 1 index is sensitive to inequality at both tails of the
distribution. The three indices under consideration are defined as follows:
Imld(w) =1
N
N∑i=1
log
(w
wi
), (1)
Itheil1(w) =1
N
N∑i=1
wi
wlog
(wi
w
), (2)
Itheil2(w) =1
2N
N∑i=1
[(wi
w
)2
− 1
], (3)
where wi refers to the earnings of individual i, and w to the mean earnings of all individuals.
These inequality measures provide a snapshot of inequality in a single time period, but they are
not informative about the persistence of inequality at the individual level. Individuals might change
their relative position in the distribution, leading to an equalization of earnings over time. Thus, it
is plausible that earnings averaged over several years are less unequal than single-year earnings. To
capture these dynamic influences, we follow Buchinsky and Hunt (1999) and calculate the mobility
index M , measuring the percentage reduction in single-year inequality when earnings are averaged
over T years:
M = 1− I( 1T
∑Tt=1 wt)
(∑T
t=1 ηtI(wt))(4)
where η are earnings occurring in year t as proportion of earnings occurring in the T -year time horizon,
and wt is the vector of individual wages in year t. In our empirical analysis, we use three-year averages,
because in most countries individuals cannot be observed for a longer time period. In practice, this
does not constitute a strong constraint for the analysis, as the inequality-reducing effect of mobility
has be shown to be highest when averaging wages over a few years. For the US, for example, taking
averages over a longer period of time does not lead to a strong additional reduction in inequality
(Buchinsky and Hunt, 1999).
A decomposition of inequality measures into between and within components allows us to in-
vestigate the quantitative importance of observable and unobservable characteristics in this context.
Inequality indices that belong to the family of generalized entropy measures can be decomposed as
10

follows (cf. Buchinsky and Hunt, 1999):5
I =∑k
vk
(wk
w
)Ik
︸ ︷︷ ︸IW
+1
k
k∑k=1
(wk
w
)log
(wk
w
)︸ ︷︷ ︸
IB
,
where w denotes mean earnings. vk is the weight and Ik is the inequality measure of group k. wk refers
to the group-specific mean earnings, which are predicted by regressing workers’ wages on the individual
characteristics sex, age and educational level. Using predicted wages instead of group mean wages has
the advantage that the problem of small group sizes is avoided. The part of overall inequality which
can be attributed to observable group characteristics is referred to as inequality between groups, IB .
On the other hand, the within component, IW is the earnings inequality that occurs within groups
and thus remains unexplained.
Similarly to the inequality measures, the wage mobility index can be decomposed into between
mobility (MB) and within mobility (MW ):
M =
⎡⎣1− IB
(1T
∑Tt=1 wt
)∑T
t=1 ηtIw(wt)
⎤⎦ ∑T
t=1 ηtIB(wt)∑T
t=1 ηtI(wt)︸ ︷︷ ︸MBSB
T
+
⎡⎣1− Iw
(1T
∑Tt=1 wt
)∑T
t=1 ηtIB(wt)
⎤⎦ ∑T
t=1 ηtIw(wt)∑T
t=1 ηtI(wt)︸ ︷︷ ︸MWSW
T
In contrast to wage inequality, which is additively decomposable, the two components of wage mobility
are weighted with the share of between and within inequality in total single-year inequality SBT and
SWT , respectively.
In order to gain further insights into wage mobility and its determinants, we examine individual
transitions between the deciles of the wage distribution. In order to do so, the country-specific wage
distribution of each year in the observation period is divided into deciles, based on which we rank
individuals in the earnings hierarchy. This allows us to generate transition matrices to capture the
patterns of wage mobility. From these transition matrices, we can identify whether, from one year to
the next, a worker stays in the same decile of the wage distribution, whether he experiences an up-
ward or whether he experiences a downward transition. We analyse the three corresponding transition
probabilities explicitly using a multinomial logit model. As explanatory variables we consider individ-
ual characteristics (gender, age, educational level, marital status), household characteristics (number
of small children, school-children and elderly in the household, employment status of partner), and
job-related characteristics (occupation, dummy variables indicating whether individual has changed
jobs directly or indirectly). To take into account time- and country-specific effects, we also include
time and country fixed effects.
5In this paper we only display the decomposition of inequality and mobility measures based on the Theil 1 index, as
it is most sensitive to inequality at both extremes of the earnings distribution.
11

5 Empirical Evidence
5.1 Summary measures of wage inequality and wage mobility
The aggregate measures of wage inequality and wage mobility are displayed in Table 2. A comparison
of wage inequality across EU Member States reveals that, independently of the selected type of index,
the pay distribution is most equal in Denmark. Low inequality with respect to all parts of the earnings
distribution can also be observed in Belgium, Finland, and the Netherlands. In Slovakia the mean log
deviation suggests that inequality is relatively low at the bottom of the wage distribution, while the
Theil 2 index indicates relatively unequal wages at the top. The highest inequality in all three indices
can be observed for Portugal, which is in line with OECD (2002) and OECD (2010). In addition, the
Baltic States are characterized by relatively high levels of inequality.
In order to examine the persistence of wage inequality as well as the equalising effect of wage
mobility, we calculate country-specific mobility indices as described in Section 3. These indices,
displayed in the three right-hand columns of Table 2, show that across all countries inequality is
reduced by between 10.10 percent (Theil 1 index) and 16.46 percent (Theil 2 index) when wages are
averaged over 3 years. With all three types of indices showing reductions of less than 10 percent,
Cyprus is the country with the highest persistence of wage inequality. It is followed by Portugal and
the Netherlands, exhibiting low wage mobility both at the bottom as well as at the top of the wage
distribution. The largest equalizing effect of mobility can be observed for Bulgaria, Hungary, Latvia,
and especially Austria, where mobility reduces wage inequality particularly at the top of the wage
distribution (a reduction by 27 percent for the Theil 2 index).
As inequality may be more acceptable with a higher degree of wage mobility, we analyse the link
between wage inequality and wage mobility. Figure B.2 illustrates this relationship for each country
of our data set. First of all, there is a weak positive relationship between inequality and mobility, with
Bulgaria and Portugal being outliers. Therefore, over the EU-SILC countries considered, higher wage
inequality at the country level is associated with lower inequality regarding 3-year-averaged wages.
Second, the relationship between inequality and wage mobility seems to be more favourable for some
country groups than for others. For example, Belgium, Italy and the Netherlands as well as the Scan-
dinavian countries display a relatively low inequality-to-mobility ratio. This is particularly true for
Bulgaria, featuring a relatively low degree of wage inequality and an exceptionally high degree of wage
mobility. By contrast, inequality relative to mobility is higher for Luxembourg, Cyprus, Poland, and
especially Portugal. These countries are characterized by high inequality and low mobility. Although
the preferences over inequality and income mobility may differ between countries, a combination of
high inequality and low mobility is in all likelihood the least favourable for social welfare.
12

5.2 Decomposing wage inequality and wage mobility
In order to investigate the quantitative importance of observable person characteristics, wage inequal-
ity and wage mobility are decomposed into within and between components. With respect to wage
inequality, the cross-country evidence reveals that for all countries in our data set, only a small part
of inequality is due to inequality between groups and can therefore be explained by sex, age and
educational level, while a much larger part occurs within groups and therefore remains unexplained
(Table 3).
The decomposition of wage inequality reveals large cross-country differences. The lowest inequality
between groups can be observed for Bulgaria, Slovakia, and Estonia, where about 12-20 percent of
wage inequality can be attributed to observable characteristics. In these countries, sex, age and skill
premia seem to play a minor role compared to other wage differentials by unobservables. This finding
is in line with Buchinsky and Hunt (1999) who also observe for the US that only a small part of
inequality is due to observables. By contrast, in Slovenia, Finland and the Netherlands the between
component is about 40 percent and thus much higher. However, the highest share of between-group
inequality can be found for Portugal (49 percent) and Luxembourg (64 percent). Here, almost half of
the differences in wages are due to gender, age and skill level of workers.
Similarly to inequality, wage mobility can be decomposed into a within and a between component.
The results, displayed in the two right-hand columns of Table 3, reveal that mobility leads to an
increase of wage inequality between groups.6 This means that the effect of wage mobility, which
is overall equalizing, is solely induced by the convergence of wages within groups, but not between
groups. Again, there exist large differences between countries.
Regarding within-group inequality and mobility, it can be seen in Figure B.3 that the Baltic States
as well as the UK are characterised by high within-group inequality, but also by relatively high within-
group mobility. Slovakia, Portugal and Poland feature similar levels of within-group wage inequality,
but lower within-group wage mobility. At the other end of the spectrum, one can find the Northern
European countries Denmark, Finland, and Norway, as well as the Continental European countries
Belgium, Luxemburg and Italy, which display relatively low levels of both within wage mobility and
within wage inequality.
In contrast to within-group inequality, between-group inequality is relatively similar between coun-
tries. Therefore, a clear link between between-group inequality and between-group mobility is more
difficult to establish (Figure B.4). Furthermore, it becomes apparent that most of the countries which
were seen to have high within-group inequality and mobility are characterized by low between-group
6Note that the estimated between and within mobility indices do not add up to the overall mobility measure since
they are not weighted by the shares of between and within inequality.
13
inequality and mobility. This is true for the Baltic States and for the UK. However, the countries with
low within-group inequality and mobility display intermediate levels of between-group inequality and
mobility. Therefore, it neither seems to be the case that countries with high between-group inequal-
ity and mobility are always characterised by high within-group inequality and mobility, nor that the
opposite is the case. Therefore, between-group inequality and mobility and within-group inequality
and mobility do not seem to be systematically correlated at the country level.
5.3 Transitions between wage deciles
In this section, we analyse the personal and household characteristics that are correlated with the
probability to move up or down the wage distribution. Furthermore, we want to gain better insights
into the importance of job mobility for pay transitions. In order to do so, in a first step we compute
a transition matrix for movements between earnings deciles from one year to the next (Table 4). It
becomes evident that pay transitions feature strong state dependence, i.e. between 40% and 80% of
all workers remain in the same decile of the earnings distribution from one year to the next, with the
10th decile featuring by far the highest figure.
In a second step, we present descriptive evidence and estimate a multinomial logit model examining
the following three categories: downward mobility (moving down the income distribution by one or
more deciles), upward mobility (moving up by one or more deciles) and no mobility (Tables 5 and
6). The descriptive evidence and the regression results for personal characteristics confirm the results
generally found in the literature. First, we find that men are more likely to move up the earnings
distribution than women. Second, the probability of moving down the income distribution is decreasing
with workers’ age. For upward transitions, the estimation results reveal lower transition probabilities
for medium-aged workers than for the other groups. Third, lower skills are correlated with a higher
probability of moving down the wage distribution, and a lower probability of staying in the same wage
decile or of making an upward transition. For high-skilled workers, the opposite is the case.
The analysis of the household variables yields some interesting insights. First, the presence of
an inactive or unemployed partner (relative to single households) is negatively correlated with the
probability of a downward transition. This suggests that in many countries under consideration, the
household head often plays the role of the only breadwinner in the household. Separate regressions
for men and women show that this effect is driven by the male individuals in the sample (Tables
7 and 8). Second, the presence of young children in the household seems to be a significant risk
factor, as households with more children display a lower earnings stability (i.e. a lower probability
of remaining in the same decile of the earnings distribution) and a higher probability of a downward
transition. However, the probability of an upward transition also significantly rises with more children
14

in the household, which is particularly true for women. Third, the presence of elderly persons in the
household is significantly correlated with an increased probability of a downward transition. This
could suggest that elderly persons in the household are another risk factor for the earnings dynamics
of an individual.
The fact that a worker has experienced a job change is also significantly correlated with the
probabilities of moving up or down the wage distribution. Relative to no job change, direct job changes
are positively correlated with the probability of making either an upward or a downward transition,
while indirect job changes only inrease the probability of a downward transition. Unsurprisingly, an
indirect job change is more strongly correlated with the probability of making a downward transition
than a direct job change. These results are quite intuitive, since direct job changes to a large part
probably occur for voluntary reasons, which reduces the probability of a downward transition. Indirect
job changes lead to a stronger decrease in wage since they are more likely to occur for involuntary
reasons.
5.4 Cross-country differences and institutions
The results of the analysis in the preceding section reveal large cross-country differences with respect
to wage inequality and wage mobility as well as the importance of specific wage transitions. This
becomes particularly clear from the country fixed effects of the multinomial logit model which yield
composition-adjusted estimates of the income persistence for every country. Figure B.5 shows that
France, Cyprus, the Netherlands, Finland and Luxembourg exhibit the highest degree of income
persistence. In contrast to this, workers in Bulgaria face the lowest probability of staying in the same
decile and the highest probability to change to lower as well as to higher income deciles. A relatively
high probability to move down the earnings distribution can also be observed for the other countries
in Central and Eastern Europe, such as Estonia, Slovakia, Romania, Lithuania and Latvia. Austria is
also comparable to these countries with respect to the probability to change between income deciles.
Given these large cross-country differences, it is of particular interest to investigate the role of the
labour market characteristics of the different countries in this context. In order to do so, we correlate
our measures of wage inequality and wage mobility with the following institutional indicators: The
extent of employment protection, the coverage rate of trade unions, the tax wedge, the net replacement
rate of the unemployment benefit system, and the share of education expenses in GDP. As these
correlations may be biased by the extreme values observed for three countries (Bulgaria, and Portugal),
we always report two correlations, one including and one excluding these outliers.
Regarding strictness in employment protection, a weak negative relationship with both inequality
and wage mobility can be observed when Portugal is not included (dashed line in Figure B.6). The
15

higher the protection of employed workers, the lower are the incentives for workers to change job and
the lower are the incentives for firms to fire workers and hire new ones. Thus, lower job mobility
seems to translate into lower wage mobility. Furthermore, firms hire less workers which reduces wage
inequality at the bottom of the wage distribution. However, when including Portugal, the relationship
turns positive. Therefore, the relationship between employment employment protection and wage
inequality and mobility does not appear particularly robust.
The relationship between inequality and bargaining coverage is displayed in Figure B.7. Two
specific country groups can be observed in the distribution of wage bargaining. On the one hand,
the group of the Scandinavian countries features high values of bargaining coverage. By contrast,
Eastern European countries are characterised by a very low degree of bargaining coverage. It can
be seen that inequality as well as wage mobility is lower in those countries with a high degree of
wage bargaining coverage. This is in all likelihood due to the fact that unions tend to compress
wage inequality. Furthermore, in these countries wages are highly regulated, which also lowers the
probability to experience a wage transition. For all the countries analysed, this results in strongly
and highly significantly negative relationships between bargaining coverage on the one hand and
wage inequality and mobility on the other hand. Furthermore, it becomes evident that the negative
relationship between inequality and bargaining coverage is mainly driven by within inequality (Figure
B.8). This could be due to wages based on collective agreements reducing the differences within
demographic groups, but much less so for worker groups which differ e.g. by gender or age.
Wage inequality and the tax wedge are weakly negatively correlated (Figure B.9). This could be
due to a higher tax wedge increasing the reservation wage of workers, which compresses the wage
distribution. Again, the group of central and nordic European countries is characterised by above-
average tax wedges. Regarding the relationship with wage mobility, a positive correlation can be
observed. High tax wedges may lead to low incentives to increase the position in the wage distribution
since the net increases are much smaller than the gross increases. However, our findings do not support
this hypothesis.
Besides taxes and social security contributions, the amount of benefits when unemployed can have
an effect on reservation wages and therefore inequality. Higher net replacement rates are associated
with higher reservation wages and can therefore lead to lower inequality. However, figure B.10 does
not show this expected relationship.
As seen in the previous section, inequality can be due to between-group and within-group factors.
A high quality of the educational system can decrease differences between abilities and therefore wages
of skill groups. This hypothesis is in line with Figure B.11 which shows that spending in education
is negatively correlated with inequality. Therefore, differences between skill groups seem to be lower
16

in countries with high spending. This becomes evident in Figure B.12 which shows that inequality
between groups is negatively correlated with spending on education. However, spending on education
does not seem to be positively correlated with wage mobility. This could be due to education having
an effect on income mobility in the long run only. This would not be captured by our measure of
income mobility, which covers a relatively short time horizon.
6 Conclusion
In this paper, we analyse the extent of wage inequality and wage mobility of employed workers in the
EU Member States. In doing so, we use a representative and internationally comparable panel data
set at the worker level. We decompose both wage inequality and wage mobility into their between and
within components, i.e. the components which are due to differences in observable characteristics and
the components which remain unexplained. Furthermore, we examine the determinants of mobility
within the wage distribution. Finally, we explore the link between wage inequality and wage mobility
on the one hand, and the institutional features of the national labour markets on the other hand.
Our findings suggest very different degrees of wage inequality and wage mobility in the EU Member
States. Overall, within-group inequality is larger than between-group inequality. Wage mobility is
found to reduce wage inequality in all countries, which is mainly due to mobility within, rather than
between, groups. This result indicates that wage differences due to unobservables become smaller
over time. This may be due to employer learning about the true productivity of workers, but could
also be explained by shocks (e.g. business cycle effects) being reduced over time. Additionally,
between-group inequality becomes a larger part of overall inequality when a longer time perspective is
applied. Therefore, regarding life-time income, skill and gender are more important determinants of
inequality than in cross-sections. Exploring which factors contribute to wage inequality, our analysis
of specific wage transitions identifies several factors which are associated with a higher risk of making a
downward transition: low skills, the presence of young children or of elderly persons in the household,
and involuntary job changes.
While there exist large differences with respect to both wage inequality and wage mobility across
the EU, several country clusters display very similar features. This is the case for the EU-15 countries
from Central and Northern Europe on the one hand, and for the Eastern European Member States
on the other hand. Within these country clusters, one can observe relatively similar labour market
institutions, especially with respect to the wage setting system, taxes and unemployment benefits. In
particular, the Central and Northern European country cluster displays high bargaining coverage, a
high tax wedge and a high coverage rate of the unemployment benefit system, as well as low degrees of
wage inequality and wage mobility. For the Eastern European country cluster, these three institutions
17

are much weaker, and both wage inequality and wage mobility are much higher.
From a policy point of view, this means that the wage inequality and the wage mobility in a given
country cannot be explained by a single institution. Instead, a whole set of institutions seems to be
associated with a given degree of wage inequality and wage mobility. This could be due either to
strong complementarities between different institutions, or to the culture and preferences of a society
which leads to the emergence of specific institutions. In any case, changing only one of the mentioned
institutions is unlikely to affect wage inequality and wage mobility to a great extent.
The results of our analysis raise at least two further research questions. First, given the importance
of within-group inequality, it would be interesting to explore which unobservable factors contribute to
earnings mobility. This would be possible with richer micro data sets containing relevant information,
e.g. on the locus of control of an individual person, or on the social context a person lives in. Second,
our analysis is confined to an equalization of earnings over a three-year horizon, which has been shown
to be the most relevant time period for earnings equalization by Buchinsky and Hunt (1999). Given
the large cross-country differences revealed in our analysis, it seems important to examine whether
the speed of equalization differs between countries. These questions are however beyond the scope of
this paper.
18

References
Aaberge, R., Bjorklund, A., Jantti, M., Palme, M., Pedersen, P. J., Smith, N. and Wen-
nemo, T. (2002). Income Inequality and Income Mobility in the Scandinavian Countries Compared
to the United States. Review of Income and Wealth, 48 (4), 443–469.
Acemoglu, D. (2003). Cross-Country Inequality Trends. Economic Journal, 116 (485), 121–149.
Alesina, A., Di Tella, R. and MacCulloch, R. (2004). Inequality and happiness: Are Europeans
and Americans different? Journal of Public Economics, 88 (9-10), 2009–2042.
Atkinson, A. B. (2002). The Distribution of Earnings in OECD Countries. International Labour
Review, 146 (1-2), 41–60.
Benabou, R. and Ok, E. A. (2001). Social Mobility and the Demand for Redistribution: The Poum
Hypothesis. The Quarterly Journal of Economics, 116 (2), 447–487.
— and Tirole, J. (2006). Belief in a just world and redistributive politics. The Quarterly Journal of
Economics, 121 (2), 699–746.
Blanchflower, D. and Slaughter, M. (1999). The Causes and Consequences of Changing Income
Inequality. In A. Fishlow and K. Parker (eds.), Growing Apart: The Causes and Consequences of
Global Wage Inequality, Council on Foreign Relation Press, pp. 67–94.
Buchinsky, M. and Hunt, J. (1999). Wage mobility in the United States. The Review of Economics
and Statistics, 81 (3), 351–368.
Burkhauser, R. and Poupore, J. (1997). A Cross-National Comparison of Permanent Inequality
in the United States and Germany. The Review of Economics and Statistics, 79, 10–17.
Canto, O. (2000). Income Mobility in Spain: How Much Is There? Review of Income and Wealth,
46 (1), 85–102.
Card, D. (2001). The Effect of Unions on Wage Inequality in the U.S. Labor Market. Industrial and
Labor Relations Review, 54 (2), 296–315.
Cardoso, A. R. (2006). Wage mobility: Do institutions make a difference? Labour Economics,
13 (3), 387–404.
Checchi, D. and Garcia-Penalosa, C. (2008). Labour Market Institutions and Income Inequality.
Economic Policy, 23 (56), 601–649.
19
—, Peragine, V. and Serlenga, L. (2010). Fair and Unfair Income Inequalities in Europe. IZA
Discussion Papers 5025, Institute for the Study of Labor (IZA).
Cholezas, I. and Tsakloglou, P. (2007). Earnings Inequality in Europe: Structure and Patterns
of Inter-Temporal Changes. IZA Discussion Papers 2636, Institute for the Study of Labor (IZA).
Cowell, F. A. (2011). Measuring Inequality. LSE Perspectives in Economic Analysis. Oxford: Ox-
ford University Press.
Dickens, R. (2000). Caught in a Trap? Wage Mobility in Great Britain: 1975-1994. Economica,
67 (268), 477–97.
Eckstein, Z. and van den Berg, G. (2007). Empirical labor search: A survey. Journal of Econo-
metrics, 136 (2), 531 – 564.
Edin, P.-A. and Holmlund, B. (1995). The Swedish Wage Structure: The Rise and Fall of Solidarity
Wage Policy? In R. B. Freeman and L. F. Katz (eds.), Differences and Changes in Wage Structures,
University of Chicago Press, pp. 307–343.
Engel, M. and Schaffner, S. (2012). How to use the EU-SILC-Panel to analyse monthly and
hourly wages. Ruhr Economic Paper forthcoming, Rheinisch-Westfalisches Institut fur Wirtschafts-
forschung.
EUROSTAT (2008a). Expenditure on education as percent of gdp or public expenditure. http:
//epp.eurostat.ec.europa.eu/portal/page/portal/education/data/database/.
— (2008b). Tax rate on low wage earners: Tax wedge on labour costs. http://epp.eurostat.ec.
europa.eu/portal/page/portal/labour_market/earnings/database/.
— (2010). Description of target variables: Cross-sectional and Longitudinal. EU-SILC 065 (2008
operation). Tech. rep., Directorate F: Social Statistics and Information Society, Luxembourg.
Feldstein, M. and Wrobel, M. V. (1998). Can state taxes redistribute income? Journal of Public
Economics, 68 (3), 369–396.
Goos, M. and Manning, A. (2007). Lousy and Lovely Jobs: The Rising Polarization of Work in
Britain. Review of Economics and Statistics, 89 (1), 118–133.
Gottschalk, P. and Smeeding, T. M. (2000). Empirical Evidence on Income Inequality in Indus-
trialized Countries. In A. B. Atkinson and F. Bourguignon (eds.), Handbook of Income Distribution,
North Holland, pp. 261–307.
20

Gregg, P. and Vittori, C. (2008). Exploring Shorrocks Mobility Indices Using European Data.
The Centre for Market and Public Organisation 08/206, Department of Economics, University of
Bristol, UK.
Hofer, H. and Weber, A. (2002). Wage mobility in Austria 1986-1999. Labour Economics, 9 (1),
563–577.
ICTWSS Database (2008). Bargaining (or union) coverage. http://www.uva-aias.net/208/.
Jarvis, S. and Jenkins, S. P. (1998). How much Income Mobility is there in Britain? The Economic
Journal, 108, 428–443.
Juhn, C., Murphy, K. and Pierce, B. (1993). Wage Inequality and the Rise in Returns to Skill.
Journal of Political Economy, 101, 401–442.
Karabarbounis, L. (2011). One Dollar, One Vote. The Economic Journal, 121 (553), 621–651.
Katz, L. F. and Autor, D. H. (1999). Changes in the Wage Structure and Earnings Inequality. In
O. Ahenfelter and D. Card (eds.), Handbook of Labor Economics, Elsevier, pp. 1463–1555.
—, Loveman, G. W. and Blanchflower, D. G. (1995). A Comparison of Changes in the Struc-
ture of Wages in Four OECD Countries. In Differences and Changes in Wage Structures, NBER
Chapters, National Bureau of Economic Research, Inc, pp. 25–66.
— and Murphy, K. M. (1992). Changes in Relative Wages, 1963-1987: Supply and Demand Factors.
Quarterly Journal of Economics, 107, 1232–1266.
Koeniger, W., Leonardi, M. and Nunziata, L. (2007). Labour Market Institutions and Wage
Inequality. Industrial and Labour Relations Review, 60 (3), 340–356.
Krueger, D. and Perri, F. (2006). Does income inequality lead to consumption inequality? evidence
and theory. Review of Economic Studies, 73 (1), 163–193.
Lazear, E. P. (1990). Job security provisions and employment. The Quarterly Journal of Economics,
105 (3), 699–726.
Lemieux, T. (2008). The changing nature of wage inequality. Journal of Population Economics,
21 (1), 21–48.
Lindbeck, A. and Snower, D. J. (1989). Macroeconomic policy and insider power. American
Economic Review, 79 (2), 370–76.
21

Machin, S. (1997). The Decline of Labour Market Institutions and the Rise in Wage Inequality in
Britain. European Economic Review, Papers and Proceedings, 41 (3-5), 647–658.
— (2008). An Appraisal of Economic Research on Changes in Wage Inequality. LABOUR, 22, 7–26.
Nozick, R. (1974). Anarchy, State, and Utopia. New York: Basic Books.
OECD (2002). OECD Employment Outlook 2002. Tech. rep., Paris: OECD Publishing.
— (2004). OECD Employment Outlook 2004. Tech. rep., Paris: OECD Publishing.
— (2008a). Net replacement rates during the initial phase of unemployment. http://www.oecd.org/
els/benefitsandwagesstatistics.htm.
— (2008b). Strictness of employment protection legislation: overall. http://stats.oecd.org/
BrandedView.aspx?oecd_bv_id=lfs-data-en&doi=data-00317-en/.
— (2010). OECD Employment Outlook 2010. Tech. rep., Paris: OECD Publishing.
Raferzeder, T. and Winter-Ebmer, R. (2007). Who is on the rise in Austria: Wage mobility and
mobility risk. Journal of Economic Inequality, 5 (1), 39–51.
Rawls, J. (1999). A Theory of Justice. Cambridge: Harvard University Press.
Sologon, D. M. and O’Donoghue, C. (2012). Equalizing or Disequalizing Lifetime Earnings Dif-
ferentials? Earnings Mobility in EU: 1994-2001. In J. Bishop (ed.), Inequality, Mobility, and Seg-
regation: Essays in Honor of Jacques Silber (Research in Economic Inequality, Vol 20), Emerald
Group Publishing Limited.
Sylwester, K. (2002). Can education expenditures reduce income inequality? Economics of Educa-
tion Review, 21 (1), 43–52.
Van Kerm, P. and Pi Alperin, M. N. (2010). Inequality, Growth and Mobility: The Inter-Temporal
Distribution of Income in European Countries 2003-2007. European Commission, Eurostat 4151,
Eurostat Methodologies and Working Papers.
22

This paper is based on the results of the project “Studies on “flexicurity” Lot 1: Study on various
aspects of labour market performance using micro data from the European Union Statistics on Income
and Living Conditions (EU-SILC)”. The publication is commissioned under the European Community
Programme for Employment and Social Solidarity - PROGRESS (2007-2013). The programme is
managed by the Directorate-General for Employment, Social Affairs and Equal Opportunities of the
European Commission. lt was established to financially support the implementation of the objectives
of the European Union in the employment and social affairs area, as set out in the Social Agenda,
and thereby contribute to the achievement of the Lisbon Strategy goals in these fields.
The seven-year programme targets all stakeholders who can help shape the development of appro-
priate and effective employment and social legislation and policies, across the EU-27, EFTA-EEA and
EU candidate and pre-candidate countries. PROGRESS mission is to strengthen the EU contribution
in support of Member States’ commitment. PROGRESS will be instrumental in:
• providing analysis and policy advice on PROGRESS policy areas,
• monitoring and reporting on the implementation of EU legislation and policies in PROGRESS
policy areas,
• promoting policy transfer, learning and support among Member States on EU objectives and
priorities, and
• relaying the views of the stakeholders and society at large.
For more information refer to: http://ec.europa.eu/progress. The information contained in this
publication does not necessarily reflect the position or opinion of the European Commission.
23

Appendix A Tables
Table 1: Sample comparison: Individual characteristics
Employed in Employed in
1 year (at least) 3 years (at least)
Female 42.9 41.9
Age 15-24 8.5 6.1
Age 25-54 81.6 84.3
Age 55-65 9.9 9.6
Low skilled 17.2 15.8
Medium skilled 55.5 56.2
High skilled 27.3 28.0
No. of obs. 412,909 229,346
Source: EU-SILC, own calculations.
Notes: In percent. Summary statistics in the left column are based
on the full sample of full-time employees, while statistics in the right
column are based on the sample which is restricted to individuals
full-time employed in three consecutive years.
24

Table 2: Wage inequality and mobility by country
Inequality Mobility
Country MLD Theil1 Theil2 MLD Theil1 Theil2
Austria 0.146 0.143 0.249 22.31 14.16 27.02
Belgium 0.079 0.085 0.102 11.28 9.49 9.12
Bulgaria 0.120 0.131 0.171 21.60 21.15 21.63
Cyprus 0.168 0.190 0.349 3.44 3.75 6.27
Czech Republic 0.111 0.123 0.167 10.97 9.51 10.32
Denmark 0.058 0.065 0.084 8.66 6.67 6.24
Estonia 0.181 0.200 0.282 10.49 11.25 16.41
Spain 0.121 0.122 0.146 17.75 12.25 10.94
Finland 0.090 0.102 0.157 5.31 4.52 13.14
France 0.125 0.126 0.162 14.60 8.98 10.95
Hungary 0.162 0.180 0.254 14.65 14.51 20.76
Italy 0.107 0.115 0.146 10.64 7.32 6.85
Lithuania 0.194 0.202 0.268 13.41 11.58 13.77
Luxembourg 0.171 0.180 0.260 5.50 5.44 14.62
Latvia 0.202 0.204 0.256 17.70 14.54 15.26
Netherlands 0.092 0.102 0.133 5.89 6.26 9.63
Norway 0.094 0.098 0.145 20.56 11.07 6.24
Poland 0.175 0.202 0.355 10.13 7.20 4.29
Portugal 0.235 0.295 0.650 6.20 5.81 6.75
Romania 0.142 0.151 0.199 13.21 10.85 12.26
Slovenia 0.145 0.158 0.231 12.38 8.43 11.70
Slovakia 0.124 0.169 1.005 19.06 13.81 28.92
United Kingdom 0.159 0.190 0.442 12.17 13.15 37.27
EU-SILC 0.139 0.154 0.270 12.40 10.10 16.46
Source: EU-SILC, own calculations.
Notes: The sample is restricted to individuals who are full-time employed in three
consecutive years. Wage mobility is measured as change in single year earnings
inequality when earnings are averaged over three years. “EU-SILC” is the unweighted
average of the respective country values.
25

Table 3: Decomposition of wage inequality and mobility
Inequality Mobility
Country total between within total between within
Austria 0.143 0.036 0.107 14.16 -15.30 24.06
Belgium 0.085 0.029 0.056 9.49 -3.08 16.04
Bulgaria 0.131 0.016 0.115 21.15 -42.14 30.21
Cyprus 0.190 0.062 0.128 3.75 -8.33 9.66
Czech Republic 0.123 0.034 0.089 9.51 -16.79 19.46
Denmark 0.065 0.017 0.047 6.67 -7.03 11.61
Estonia 0.200 0.040 0.160 11.25 -19.70 19.01
Spain 0.122 0.040 0.083 12.25 -4.50 20.28
Finland 0.102 0.039 0.064 4.52 -10.77 13.83
France 0.126 0.042 0.085 8.98 -6.10 16.45
Hungary 0.180 0.059 0.121 14.51 -4.34 23.65
Italy 0.115 0.039 0.076 7.32 -1.43 11.79
Lithuania 0.202 0.043 0.159 11.58 -29.14 22.50
Luxembourg 0.180 0.115 0.065 5.44 2.29 10.98
Latvia 0.204 0.043 0.161 14.54 -21.33 24.08
Netherlands 0.102 0.039 0.063 6.26 -15.89 19.80
Norway 0.098 0.022 0.076 11.07 -12.99 18.09
Poland 0.202 0.045 0.157 7.20 -22.91 15.84
Portugal 0.295 0.145 0.150 5.81 -4.99 16.22
Romania 0.151 0.053 0.098 10.85 -2.85 18.18
Slovenia 0.158 0.067 0.091 8.43 -3.11 16.83
Slovakia 0.169 0.029 0.140 13.81 -3.64 17.39
United Kingdom 0.190 0.042 0.147 13.15 -16.89 21.74
EU-SILC 0.154 0.048 0.106 10.10 -9.34 18.82
Source: EU-SILC, own calculations.
Notes: The measures of wage inequality and wage mobility are based on the Theil 1
index. “EU-SILC” is the unweighted average of the respective country values.
26
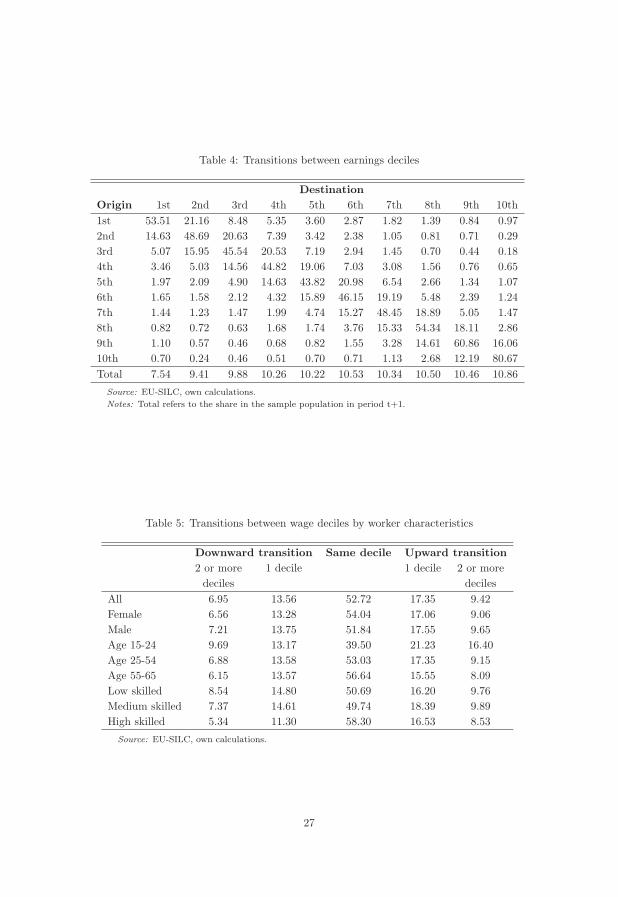
Table 4: Transitions between earnings deciles
Destination
Origin 1st 2nd 3rd 4th 5th 6th 7th 8th 9th 10th
1st 53.51 21.16 8.48 5.35 3.60 2.87 1.82 1.39 0.84 0.97
2nd 14.63 48.69 20.63 7.39 3.42 2.38 1.05 0.81 0.71 0.29
3rd 5.07 15.95 45.54 20.53 7.19 2.94 1.45 0.70 0.44 0.18
4th 3.46 5.03 14.56 44.82 19.06 7.03 3.08 1.56 0.76 0.65
5th 1.97 2.09 4.90 14.63 43.82 20.98 6.54 2.66 1.34 1.07
6th 1.65 1.58 2.12 4.32 15.89 46.15 19.19 5.48 2.39 1.24
7th 1.44 1.23 1.47 1.99 4.74 15.27 48.45 18.89 5.05 1.47
8th 0.82 0.72 0.63 1.68 1.74 3.76 15.33 54.34 18.11 2.86
9th 1.10 0.57 0.46 0.68 0.82 1.55 3.28 14.61 60.86 16.06
10th 0.70 0.24 0.46 0.51 0.70 0.71 1.13 2.68 12.19 80.67
Total 7.54 9.41 9.88 10.26 10.22 10.53 10.34 10.50 10.46 10.86
Source: EU-SILC, own calculations.
Notes: Total refers to the share in the sample population in period t+1.
Table 5: Transitions between wage deciles by worker characteristics
Downward transition Same decile Upward transition
2 or more 1 decile 1 decile 2 or more
deciles deciles
All 6.95 13.56 52.72 17.35 9.42
Female 6.56 13.28 54.04 17.06 9.06
Male 7.21 13.75 51.84 17.55 9.65
Age 15-24 9.69 13.17 39.50 21.23 16.40
Age 25-54 6.88 13.58 53.03 17.35 9.15
Age 55-65 6.15 13.57 56.64 15.55 8.09
Low skilled 8.54 14.80 50.69 16.20 9.76
Medium skilled 7.37 14.61 49.74 18.39 9.89
High skilled 5.34 11.30 58.30 16.53 8.53
Source: EU-SILC, own calculations.
27

Table 6: Estimation results: Up- and downward earnings transitions
Downward transition Same decile Upward transition
Marg. Effect t-value Marg. Effect t-value Marg. Effect t-value
Gender (Ref: Female)
Male 0.0015 1.43 -0.0092*** -9.37 0.0077*** 17.99
Age group (Ref: Age 15-24)
Age 25-54 -0.0040*** -2.61 0.0093*** 3.62 -0.0053*** -4.31
Age 55-65 -0.0048*** -3.72 0.0058*** 3.83 -0.0009 -1.16
Education level (Ref: Medium skilled (ISCED 3-4))
Low skilled (ISCED 0-2) 0.0096*** 16.16 -0.0059*** -6.16 -0.0037*** -5.05
High skilled (ISCED 5) -0.0107*** -13.70 0.0020*** 2.93 0.0086*** 21.99
Partner’s employment status (Ref: Single)
Inactive/unemployed -0.0054*** -6.59 0.0069*** 4.32 -0.0014 -1.58
Part-time employed -0.0097*** -8.54 0.0093*** 12.53 0.0005 0.95
Full-time employed -0.0046*** -9.02 0.0071*** 6.08 -0.0024*** -3.19
Household composition
Number of children (≤ 4) 0.0039*** 9.56 -0.0073*** -14.99 0.0034*** 17.89
Number of children (5-14) -0.0005*** -3.03 0.0008*** 3.08 -0.0003** -2.68
Number of elderly (≥ 65) 0.0032*** 6.93 -0.0023** -2.39 -0.0009 -1.24
Job change (Ref: no job change)
direct job change 0.0329*** 3.95 -0.0536*** -5.75 0.0207*** 15.97
indirect job change 0.0614*** 5.74 -0.0697*** -7.00 0.0083 1.20
Year (Ref: 2006)
2005 -0.0003 -0.20 0.0018 1.17 -0.0015 -1.37
2007 0.0094*** 2.94 -0.0079*** -2.61 -0.0015* -1.94
2008 0.0013 1.41 0.0027** 2.24 -0.0040*** -7.31
Original decile (Ref: 5th decile)
1 -0.2948*** -249.62 0.2829*** 126.63 0.0119*** 9.62
2 -0.0179*** -5.15 0.0164*** 4.57 0.0016*** 2.60
3 -0.0060* -1.92 0.0055* 1.91 0.0005 0.79
4 -0.0020 -1.28 0.0025** 2.21 -0.0005 -0.63
6 0.0023* 1.89 0.0026** 2.16 -0.0050*** -12.17
7 0.0020 1.06 0.0065*** 3.10 -0.0085*** -20.09
8 -0.0030* -2.12 0.0168*** 8.10 -0.0138*** -16.97
9 -0.0081*** -3.39 0.0276*** 7.19 -0.0195*** -12.61
10 -0.0056* -1.79 0.3746*** 109.12 -0.3689*** -721.92
Pseudo-R2 0.0951
Observations 227,001
Source: EU-SILC, own calculations.
Notes: Multinominal logit model; a***/**/* indicates a 1%/5%/10% level of significance
28

Table 7: Estimation results: Up- and downward earnings transitions, Men
Downward transition Same decile Upward transition
Marg. Effect t-value Marg. Effect t-value Marg. Effect t-value
Age group (Ref: Age 15-24)
Age 25-54 -0.0031 -1.25 0.0050* 1.75 -0.0019*** -3.25
Age 55-65 -0.0011 -0.42 0.0027 1.03 -0.0016*** -4.53
Education level (Ref: Medium skilled (ISCED 3-4))
Low skilled (ISCED 0-2) 0.0137*** 7.75 -0.0126*** -7.75 -0.0011*** -2.89
High skilled (ISCED 5) -0.0199*** -15.10 0.0149*** 11.83 0.0050*** 15.20
Partner’s employment status (Ref: Single)
Inactive/unemployed -0.0160*** -7.88 0.0157*** 7.02 0.0004 1.45
Part-time employed -0.0245*** -9.32 0.0238*** 9.82 0.0007*** 2.67
Full-time employed -0.0178*** -7.15 0.0175*** 6.60 0.0003* 1.70
Household composition
Number of children (≤ 4) 0.0035*** 3.83 -0.0041*** -4.82 0.0006*** 5.41
Number of children (5-14) -0.0007** -2.38 0.0004 1.50 0.0003*** 5.88
Number of elderly (≥ 65) 0.0043*** 3.53 -0.0043*** -3.53 0.0000 0.00
Job change (Ref: no job change)
direct job change 0.0602*** 4.69 -0.0702*** -5.26 0.0100*** 14.37
indirect job change 0.0916*** 10.87 -0.0922*** -12.29 0.0006 0.13
Year (Ref: 2006)
2005 0.0031 1.07 -0.0032 -1.14 0.0002 0.42
2007 0.0199** 2.54 -0.0192** -2.49 -0.0007*** -2.82
2008 0.0037** 2.07 -0.0024 -1.38 -0.0013*** -3.22
Original decile (Ref: 5th decile)
1 -0.2985*** -254.91 0.2905*** 172.51 0.0081*** 12.14
2 -0.0350*** -5.13 0.0332*** 5.28 0.0018*** 2.71
3 -0.0125** -2.16 0.0110** 2.00 0.0015*** 3.76
4 -0.0041 -1.39 0.0043 1.66 -0.0002 -0.41
6 0.0068* 1.83 -0.0038 -1.08 -0.0030*** -10.20
7 0.0069* 1.69 -0.0033 -0.77 -0.0036*** -12.00
8 0.0006 0.13 0.0051 1.02 -0.0057*** -11.22
9 -0.0157*** -3.95 0.0245*** 5.40 -0.0089*** -12.52
10 -0.0131*** -3.18 0.3981*** 119.30 -0.3850*** -338.31
Pseudo-R2 0.1088
Observations 131,479
Source: EU-SILC, own calculations.
Notes: Multinominal logit model; a***/**/* indicates a 1%/5%/10% level of significance
29

Table 8: Estimation results: Up- and downward earnings transitions, Women
Downward transition Same decile Upward transition
Marg. Effect t-value Marg. Effect t-value Marg. Effect t-value
Age group (Ref: Age 15-24)
Age 25-54 -0.0025*** -3.52 0.0228*** 5.08 -0.0203*** -5.02
Age 55-65 -0.0038*** -6.03 -0.0056 -1.55 0.0094** 2.46
Education level (Ref: Medium skilled (ISCED 3-4))
Low skilled (ISCED 0-2) 0.0059*** 8.01 0.0127*** 5.10 -0.0186*** -9.93
High skilled (ISCED 5) -0.0036*** -8.00 -0.0126*** -8.37 0.0162*** 8.96
Partner’s employment status (Ref: Single)
Inactive/unemployed -0.0005* -1.98 0.0104** 2.50 -0.0099** -2.50
Part-time employed -0.0034*** -3.08 -0.0062 -1.14 0.0095 1.51
Full-time employed 0.0006** 2.21 0.0134*** 3.89 -0.0140*** -3.81
Household composition
Number of children (≤ 4) 0.0038*** 20.99 -0.0329*** -15.77 0.0291*** 13.66
Number of children (5-14) 0.0000 0.00 0.0073*** 3.46 -0.0073*** -3.51
Number of elderly (≥ 65) 0.0016*** 6.72 0.0037 0.81 -0.0053 -1.16
Job change (Ref: no job change)
direct job change 0.0118** 2.58 -0.0582*** -10.14 0.0464*** 17.90
indirect job change 0.0259*** 3.46 -0.0810*** -3.42 0.0551*** 3.07
Year (Ref: 2006)
2005 -0.0010* -1.77 0.0128*** 2.92 -0.0119*** -2.60
2007 0.0025*** 3.72 0.0022 0.54 -0.0047 -1.12
2008 0.0001 0.30 0.0180*** 4.01 -0.0181*** -4.21
Original decile (Ref: 5th decile)
1 -0.2780*** -176.28 0.2529*** 37.45 0.0252*** 4.68
2 -0.0063*** -5.22 0.0087 1.50 -0.0023 -0.49
3 -0.0018* -1.67 0.0100*** 5.34 -0.0082*** -5.87
4 -0.0006 -1.04 0.0031 1.54 -0.0025 -1.23
6 0.0000 0.00 0.0045** 2.28 -0.0045** -2.26
7 0.0003 0.45 0.0286*** 17.82 -0.0289*** -15.27
8 -0.0023*** -9.75 0.0517*** 43.56 -0.0494*** -38.50
9 -0.0020* -1.83 0.0599*** 7.99 -0.0579*** -8.99
10 0.0013 0.44 0.3365*** 68.48 -0.3378*** -168.39
Pseudo-R2 0.0816
Observations 95,522
Source: EU-SILC, own calculations.
Notes: Multinominal logit model; a***/**/* indicates a 1%/5%/10% level of significance
30

Appendix B Figures
Figure B.1: Sample comparison: Wage inequality
Source: EU-SILC, own calculations.
Note: This figure compares the Theil 1 index based on the full sample of full-time employees with the Theil 1 index
based on the sample which is restricted to individuals full-time employed in three consecutive years.
31
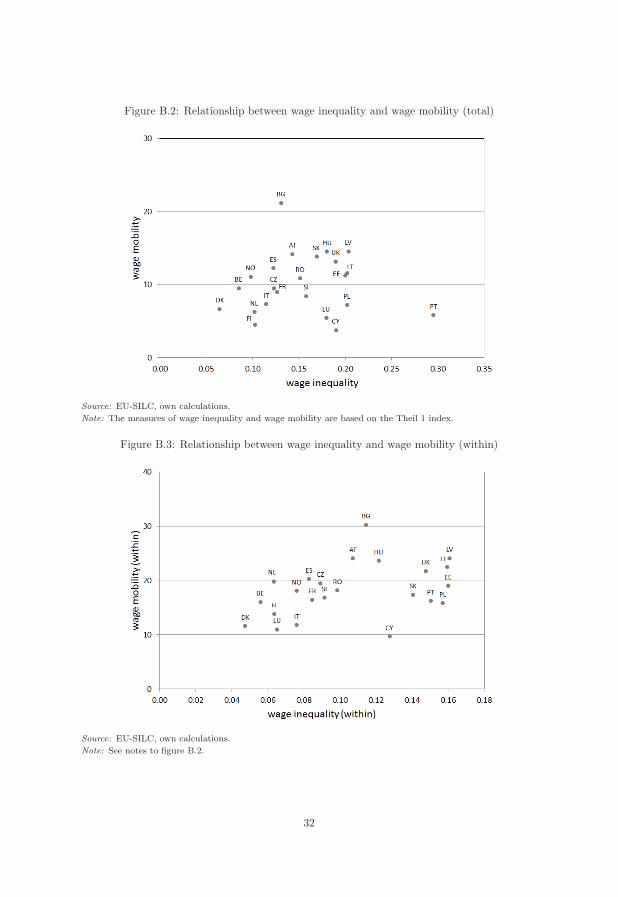
Figure B.2: Relationship between wage inequality and wage mobility (total)
Source: EU-SILC, own calculations.
Note: The measures of wage inequality and wage mobility are based on the Theil 1 index.
Figure B.3: Relationship between wage inequality and wage mobility (within)
Source: EU-SILC, own calculations.
Note: See notes to figure B.2.
32

Figure B.4: Relationship between wage inequality and wage mobility (between)
Source: EU-SILC, own calculations.
Note: See notes to figure B.2.
Figure B.5: Earnings transitions by country (Country FE)
Source: EU-SILC, own calculations.
Note: This figure displays the marginal effects of the country dummies obtained from estimating a multinomial
logit model. The country fixed effects are calculated as deviations from the grand mean and ordered by increasing
earnings persistence.
33

Figure B.6: Correlation between inequality, mobility and employment protection legislation
Source: EU-SILC, OECD (2008b), own calculations.
Note: Strictness of employment protection legislation (overall) is a synthetic indicator covering different aspects of
the strictness of regulation. ***/**/* indicates 1%/5%/10% level of significance; dashed line without Portugal.
Figure B.7: Correlation between inequality, mobility and bargaining coverage
Source: EU-SILC, ICTWSS Database (2008), own calculations.
Note: Bargaining coverage is defined as employees covered by wage bargaining agreements, expressed as a proportion
of all wage and salary earners in employment with the right to bargaining. ***/**/* indicates 1%/5%/10% level of
significance; dashed line without Bulgaria and Portugal.
34

Figure B.8: Correlation between within-inequality and bargaining coverage
Source: EU-SILC, ICTWSS Database (2008), own calculations.
Note: See notes to figure B.7.
Figure B.9: Correlation between inequality, mobility and the tax wedge
Source: EU-SILC, EUROSTAT (2008b), own calculations.
Note: Tax wedge on labour costs is defined as income tax on gross wage earnings plus social security contributions,
expressed as a proportion of total labour costs. The tax wedge refers to single persons without children earning
67% of the average wage. ***/**/* indicates 1%/5%/10% level of significance; dashed line without Bulgaria and
Portugal.
35

Figure B.10: Correlation between inequality, mobility and the net replacement rate
Source: EU-SILC, OECD (2008a), own calculations.
Note: Net replacement rate is defined as the benefit entitlement before tax in the first year of unemployment,
expressed as a percentage of previous earnings before tax. The net replacement rate refers to single persons without
children earning 100% of the average wage. ***/**/* indicates 1%/5%/10% level of significance; dashed line without
Bulgaria and Portugal.
Figure B.11: Correlation of inequality, mobility and spending on education
Source: EU-SILC, EUROSTAT (2008a), own calculations.
Note: Expenditure in education is expressed as % of GDP or public expenditure. ***/**/* indicates 1%/5%/10%
level of significance; dashed line without Bulgaria and Portugal.
36

Figure B.12: Correlation of between-inequality and spending on education
Source: EU-SILC, EUROSTAT (2008a), own calculations.
Note: See notes to figure B.11.
37