wall time collaborative - kff
TRANSCRIPT

1
The 8th Annual Behavioral Health Care SymposiumDecember 9, 2013
wall time collaborativea partnership to reduce ambulance patient off-load delays
Moderator
BJ BartlesonVice President, Nursing and Clinical ServicesCalifornia Hospital Association
Panelists
Kimberlee Roberts, MPHDirector, Clinical ServicesScripps Memorial Hospital
Bruce BartonDirector, Emergency Medical Services Agency (EMS)Riverside County Department of Public Health
Howard Backer, MD, MPHDirector California Emergency Medical Services Authority (EMSA)
Michael StanishDirector, Regional Policy AnalysisCalifornia Hospital Association 2
wall time collaborativea partnership to reduce ambulance patient off-load delays

2
Objective
• Understand what EMS patient off-load time is and the various ways it’s described
• Learn the impacts of off-load delays from the perspective of the state and local EMS agencies, hospitals, patients and the community
• Understand federal/state and accreditation laws, regulations and performance standards regarding off-load delays
• Learn about the CHA EMSA Wall Time Collaborative and progress to date on development of a best practice toolkit for use in local jurisdictions
• Dialogue with panelists on specific issues relevant to stakeholders and how collaboration and cooperation can co-create successful solutions
3
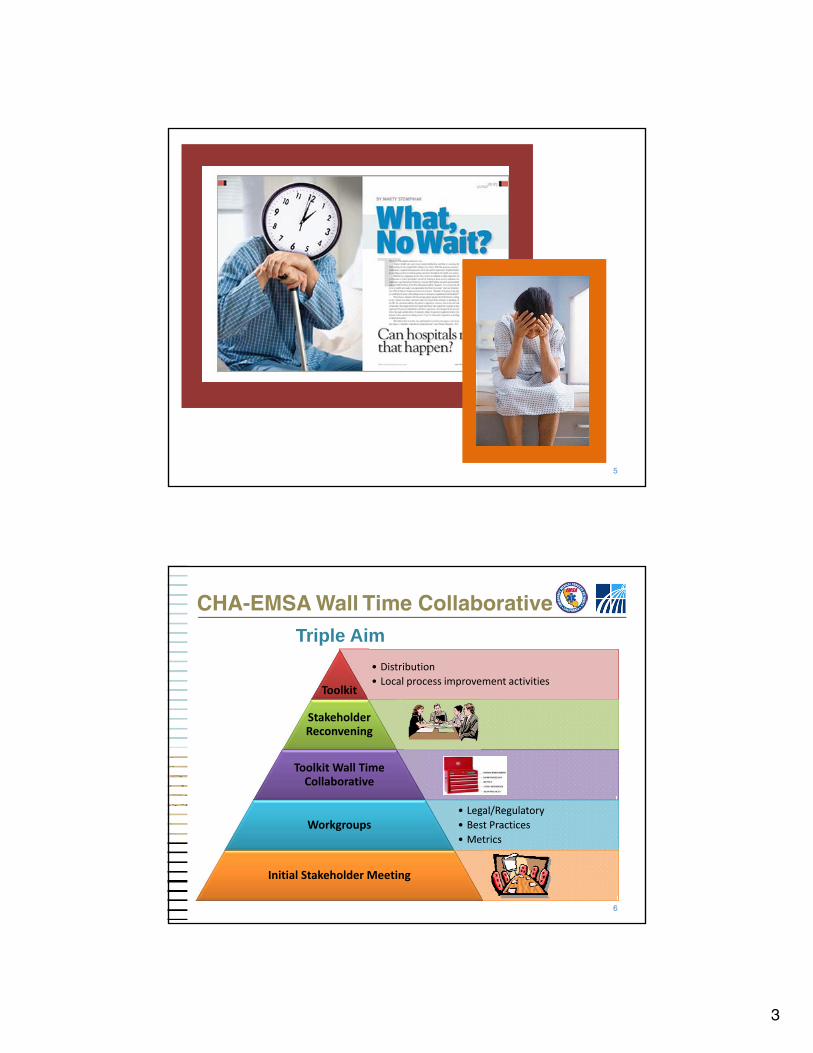
Ambulance Patient Off-load Delays
4
3
5
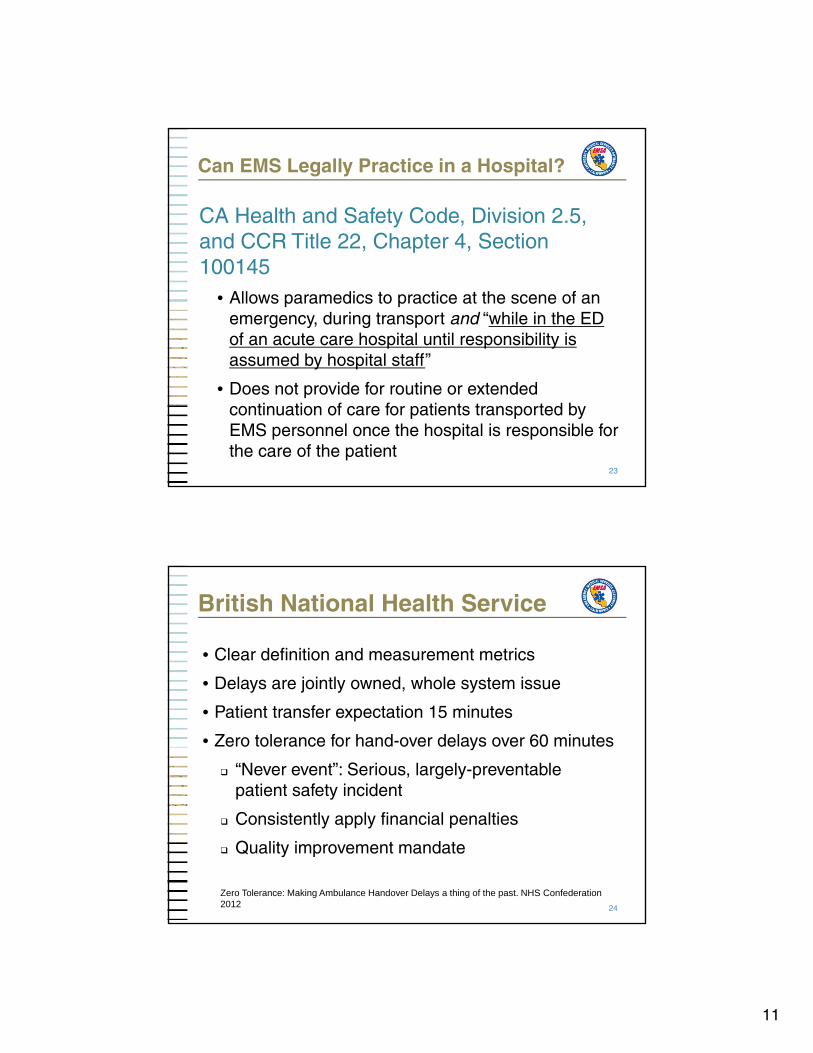
CHA-EMSA Wall Time Collaborative
• Distribution• Local process improvement activities
Toolkit
Stakeholder Reconvening
Toolkit Wall Time Collaborative
• Legal/Regulatory• Best Practices• Metrics
• Legal/Regulatory• Best Practices• Metrics
Workgroups
Initial Stakeholder Meeting
6
Triple Aim

4
EMS to ED Patient Transfer Delays
Delays: Impact and Options
Howard Backer, MD, MPHDirector, California Emergency Medical Services Authority
7
EMS Patient Off-load Time
AKA• Ambulance wall time• Ambulance wait times• EMS patient parking• Capture of emergency medical services• Patient handover delays• Patient off-load delays
The interval between arrival of an ambulance patient at the ED until the EMS and ED personnel transfer the patient to an ED stretcher and the ED staff assume the responsibility for care for the patient.
National Association of EMS Physicians position statement, 2011
8

5
9
LEMSA SurveyHow much of a problem is off-load delay?
0
2
4
6
8
10
12
14
16
18
Extemely Very Somewhat Neutral None
LEMSAs
10

6
Snapshot of Impact in CA County X
Hospital A• 17,408 hours of wall time in 2012
• $2.6 million in lost production time for crews
At time of communication• Two- to three-hour wait for a bed to off-load the
patient
• Four ambulances waiting
• Two other hospitals have ambulances that have been waiting more than 50 minutes
11
EMS System Costs (2012)
• Neighboring CA counties C and D logged approximately 20,535 total delay hours accounting for $3 million in lost unit hours
• County S Metro Fire Department: 17,345 hours of delays in patient off-load time in one hospital with a $2.6 million estimated system cost for this time
– When multiple ambulances are delayed, Metro Fire has to pull paramedic firefighters from other stations, meaning fire suppression units are unavailable to respond
12

7
Patient Impacts of Off-load Delay
ED Overcrowding demonstrated impacts:
• Delay to definitive care
• Poor pain control
• Delayed time to antibiotics
• Prolonged hospital stay
“Ultimately, there is a reasonable concern that ambulance off-load delay will compromise patient safety.”
Cooney DR, et al, National Association of EMS Physicians position statement. Prehosp EmergCare. 2011 Oct-Dec;15(4):555-61
15
EMS and Community Impacts
• Fewer units in community may result in longer response times
• Inability to meet contractual response obligations
• Costs shifted from hospital to EMS systems
• Readiness cost of paramedics and advanced life support (ALS) units absorbed by EMS system
16

8
ACEP Clinical Policy
American College of Emergency PhysiciansBoarding of Admitted and Intensive Care Patients in the Emergency Department, April 2011
• ED crowding is a direct result of diminished bed and resource capacity created by boarding
• A proxy for ED crowding is the time patients remain in the ED after the decision to admit
• Boarding of admitted patients in the ED contributes to lower quality of care and reduced patient satisfaction
• The problem is multifactorial with causes that span the entire health care delivery system 17
18
The Joint Commission, Agency for Healthcare Research and Quality (AHRQ) and CMS have all recognized the problem of patient flow in the Emergency Department, its root cause of hospital throughput and its association with patient safety

9
Joint Commission
Joint Commission Accreditation Standard For ED Patient Flow (LD.04.03.11)
• Goes into effect January 2, 2014
• Nine elements of performance (EP)
• Recommended that “boarding time frames not exceed four hours in the interest of patient safety and quality of care”
• The individuals who manage patient flow processes review measurement results to determine that goals were achieved
• Leaders take action to improve patient flow processes when goals are not achieved 19
Legal/Regulatory Issues
Emergency Medical Treatment and Labor Act (EMTALA)
• A hospital is responsible for the care of a patient when the patient or ambulance arrives on “hospital grounds”
• Requires initial assessment and triage of the patient without delay
• EMTALA does not specifically define the transfer of responsibility or the “formal acceptance” of the patient from EMS to ED staff
20

10
Legal/Regulatory Issues (cont.)
Center for Medicare and Medicaid Services (CMS) S&C-06-21, July 2006
“Parking” patients in hospitals and refusing to release EMS equipment or personnel jeopardizes patient health and impacts the ability of EMS personnel to provide emergency services to the rest of the community
Delaying ambulance ED off-load may result in a violation of EMTALA and raises serious concerns for patient care and the provision of emergency services in a community; additionally, this practice may also result in violation of the Conditions of Participation for Hospitals.…
21
Legal/Regulatory Issues (cont.)
Center for Medicare and Medicaid Services (CMS) S&C-07-20, April 2007
• Clarifies that S&C 06-21 does not mean that:
“a hospital will not necessarily have violated EMTALA if it does not, in every instance, immediately assume from the EMS provider all responsibility for the individual, regardless of any other circumstances in the ED … In some circumstances it could be reasonable for the hospital to ask the EMS provider to stay with the individual until such time as there were ED staff available to provide care to that individual.”
22
11
Can EMS Legally Practice in a Hospital?
CA Health and Safety Code, Division 2.5, and CCR Title 22, Chapter 4, Section 100145
• Allows paramedics to practice at the scene of an emergency, during transport and “while in the ED of an acute care hospital until responsibility is assumed by hospital staff”
• Does not provide for routine or extended continuation of care for patients transported by EMS personnel once the hospital is responsible for the care of the patient
23
British National Health Service
• Clear definition and measurement metrics
• Delays are jointly owned, whole system issue
• Patient transfer expectation 15 minutes
• Zero tolerance for hand-over delays over 60 minutes
“Never event”: Serious, largely-preventable patient safety incident
Consistently apply financial penalties
Quality improvement mandate
24
Zero Tolerance: Making Ambulance Handover Delays a thing of the past. NHS Confederation 2012

12
Improving Access to Emergency Services
Hospital Emergency Department and Ambulance Effectiveness Working Group, Ontario, Canada 2005
• Ambulance off-load time – from ambulance arrival to patient on ED stretcher
30 minutes (90th percentile)
• Emergency Department (ED) length of stay:
o Acuity Scale Level I-III (resuscitation, emergent, urgent)
< 6 hours (90th percentile)
o Acuity Scale Level IV-V (non-urgent, less urgent)< 4 hours (90th percentile)
25
Legislative Solutions
Nevada Senate Bill 458 (2005) created a standard of 30 minutes to transfer the care of patients from EMS to hospital staff
Massachusetts prohibited diversion in 2009• No increase in wait times has been seen through 2010
(based on review by AMA)• The legislation initially included fines if the time limit
was exceeded, but these were droppedEngland
• EMS agencies charge hospitals for delays in transfer of patients over 15 minutes
• Requires an ED throughput limit of 4 hours in 90% of patients
26

13
California Collaborative
California Hospital AssociationEmergency Medical Services AuthorityLocal Emergency Medical Services AdministratorsEMS, hospitals, health systems, professional organizations
1. Develop metrics and measure uniformly
2. Develop best practices to address problem
3. Dialogue with hospitals and medical systems
4. Encourage habitual offenders to improve
5. Observe impact of new Joint Commission metrics on hospital throughput
27
Additional Options
(Unpalatable to Collaborative)6. Incorporate metrics into contracts
7. Establish fines to reimburse EMS providers
8. Escalating levels of response locally
9. File EMTALA complaint(s)
10. Legislation
28
14
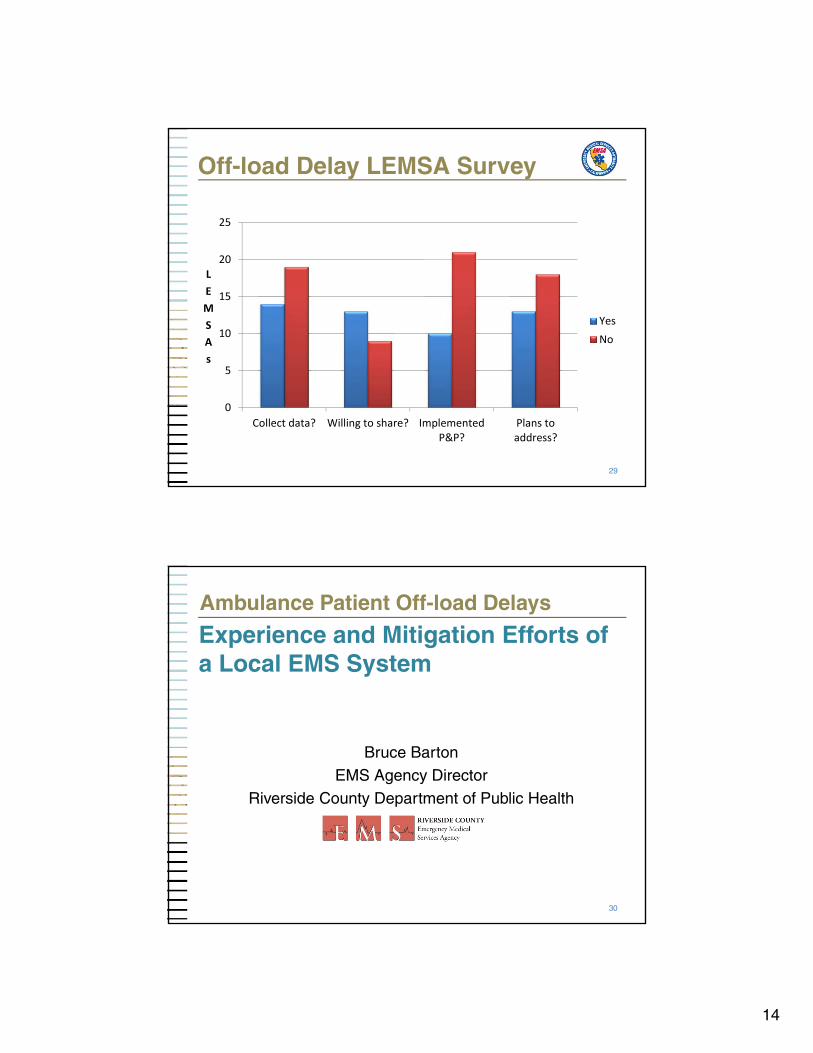
Off-load Delay LEMSA Survey
29
0
5
10
15
20
25
Collect data? Willing to share? ImplementedP&P?
Plans toaddress?
LEMSAs
YesNo
Ambulance Patient Off-load Delays
Experience and Mitigation Efforts of a Local EMS System
Bruce BartonEMS Agency Director
Riverside County Department of Public Health
30

15
Riverside County
• 7,303 square miles (4th largest in the State)
• 180 miles from east and west borders
• 2.2 million population
• 29 cities
• 506,781 households
• Temperature ranges from 28 to 118 degrees
• 96 square miles of water area
31
Riverside County EMS System
• 180,000 911 response annually
• 150,000 911 transports annually
• 80,000 non-emergency and inter-facility transports
• High performance ambulance contract
• Two-tiered ALS system
• 17 general acute care hospitals
• Specialty care programs for trauma, STEMI and Peds
• 600,000 ED encounters annually32

16
Delay / Time Interval
• The time interval between arrival of an ambulance patient in the ED until the EMS and ED personnel transfer the patient to an ED stretcher
• Riverside County patient off-load time interval standard is 30 minutes (25 minutes until April 2012)
• Delay is defined as the time interval the patient remains on the ambulance gurney in excess of the 30-minute standard
• Occurrences and cumulative hours are tracked by hospital
33
34

17
LEMSA Survey Off-load Delay Time Interval Standard
0
2
4
6
8
10
12
14
16
10 15 20 25 30 45 None
LEMSAs
35
Signs We Have a Problem
36

18
EMS System Impacts
• Ambulance resources are not available for extended periods of time
• 911 response times are effected
• First responders must remain on scene longer without a transport resource
• Delays in patient transport to definitive care
• Confusion with medical control and patient care
• Conflict between EMS and hospital personnel
• Lost unit hours $
37
Mitigation Efforts
• Improve data collection, analysis and reporting
• Reports distributed to all stakeholders quarterly
• Review performance in EMS Advisory Committees
• Letters to hospitals and EMS providers
• Meeting with hospital administrators
• Involvement of HASC Regional VP
38

19
We Still Have a Problem
39
40

20
Mitigation Efforts (cont.)
• Continue to refine data collection and reporting
• Partner with HASC and performing hospitals to communicate best practices
• Raise awareness with high ranking officials and elected officials
• Escalate the “tone” of letters
• Pre-hospital Receiving Center (PRC) policy
• Results still mixed
41
What We’ve Learned
• Focus on the issue does result in improvement
• ED staff are just as frustrated as EMS providers
• Improvement strategies must be driven from the top down
• Not entirely a capacity issue
• Evidence clearly shows improving overall hospital throughput is the most impactful and lasting mitigation strategy
42

21
Next Steps, Considerations and Controversies
• Continue to communicate best practices and work together as a system
• State coalition collaboration and deliverables
• Alternative EMS system design – alternative destinations, Emergency Medical Dispatch-based triage schemes, treat and release protocols
• Many stakeholders believe that only financial and regulatory disincentives will provide lasting change
43
10,000,000
10,500,000
11,000,000
11,500,000
12,000,000
12,500,000
13,000,000
2007 2008 2009 2010 2011 2012
An
nu
al E
D V
olu
me
California Hospitals' ED Volume
Source: OSHPD EMS Utilization Trends
12.5 Million
+5%
+7%+1%
+2%
+4%
10.4 Million ED Encounters
California Hospital’s ED Volume Grew by 20% Over Five Years

22
Non-admit ED Drives the Volume Increase and Growing at a Rate Greater than Admit ED
1,600,000
1,700,000
1,800,000
1,900,000
2,000,000
2,100,000
2,200,000
8,000,000
8,500,000
9,000,000
9,500,000
10,000,000
10,500,000
11,000,000
2007 2008 2009 2010 2011 2012
An
nu
al A
dm
its
thro
ug
h E
D
ED
No
n-A
dm
itte
d V
olu
me
California Hospital ED VolumeNon-Admit versus Admit
1.7 Million ED Admits
1.8 Million+3%
+7%+1%
+3%
+5%
+5%+2% +1% (-1%)8.7 Million
ED Non-Admit
10.7 Million
+6%
Source: OSHPD EMS Utilization Trends
Behavioral Health Related Diagnosis Significant Component of ED Growth in California
10.2 millionED Encounters
+1.8 millionadditional ED
-
2.0
4.0
6.0
8.0
10.0
12.0
2006 2011An
nu
al E
D E
nco
un
ters
(in
Mill
ion
s)
21% Behavioral Health
ED Growth all other Dx
710,000Behavioral Health related Diagnosis
1.1 millionBehavioral Health related Diagnosis
Behavioral Health Diagnosis account for 21% of the increase
in California ED volumebetween 2006 and 2011
Source: Stratasan analysis of OSHPD ED encounte
23
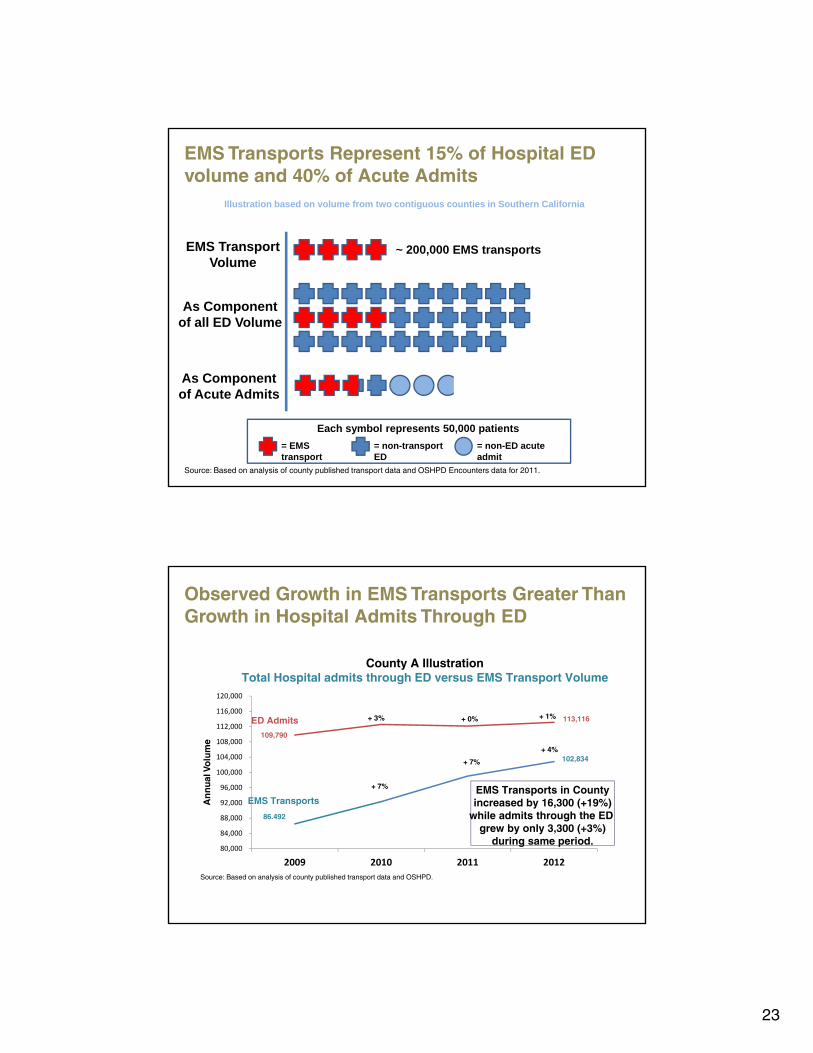
EMS Transports Represent 15% of Hospital ED volume and 40% of Acute Admits
Source: Based on analysis of county published transport data and OSHPD Encounters data for 2011.
EMS TransportVolume
As Componentof all ED Volume
As Componentof Acute Admits
Illustration based on volume from two contiguous counties in Southern California
= EMS transport
= non-transport ED
= non-ED acute admit
Each symbol represents 50,000 patients
~ 200,000 EMS transports
Observed Growth in EMS Transports Greater Than Growth in Hospital Admits Through ED
80,000
84,000
88,000
92,000
96,000
100,000
104,000
108,000
112,000
116,000
120,000
2009 2010 2011 2012
An
nu
al V
olu
me
County A IllustrationTotal Hospital admits through ED versus EMS Transport Volume
86,492
102,834
113,116
109,790
+ 3% + 0% + 1%
+ 4%
+ 7%
+ 7% EMS Transports in Countyincreased by 16,300 (+19%)
while admits through the ED grew by only 3,300 (+3%)
during same period.
EMS Transports
ED Admits
Source: Based on analysis of county published transport data and OSHPD.

24
Observed Growth in EMS Transports Greater Than Growth in Hospital Admits Through ED
90,000
94,000
98,000
102,000
106,000
110,000
114,000
118,000
122,000
2008 2009 2010 2011 2012
An
nu
al V
olu
me
108,264
120,169
98,725
95,289
+ 2% + 1%
+ 3%
(- 1%)
+ 1%+ 0%
EMS Transports
ED Admits
+ 4%
+ 6%
Source: Based on analysis of county published transport data and OSHPD.
EMS Transports in Countyincreased by 11,900 (+11%)
while admits through the ED grew by only 3,400 (+4%)
during same period.
County B IllustrationTotal Hospital admits through ED versus EMS Transport Volume
Hours Associated With Ambulance “Wall Time” Has Grown, Driven by Both Increased Transport Volume and Wait Times
400
500
600
700
800
900
1000
1100
1200
1300
1400
1500
1600
4,000
5,000
6,000
7,000
8,000
9,000
10,000
11,000
12,000
13,000
14,000
15,000
16,000
Jan Mar May Jul Sept Nov Jan Mar May Jul Sept Nov Jan Mar May Jul Sept Nov Jan Mar May Jul Sept Nov Jan Mar May Jul Sept
Mo
nth
ly H
ou
rs A
sso
ciat
ed w
ith
Del
ay (R
ed)
Tota
l Nu
mb
er o
f E
mer
gen
cy T
ran
spo
rt R
un
s (B
lue)
County A IllustrationTrend in EMS Transports vs. Hours associated with wall time
Total Transports Hours Delay
2012
While EMS transport have increased by 23% since 2009, the yearly hours associated with wall time delays has increased by 38%. This is driven by an increase in the average "delay time" from 20 minutes to 26 minutes
(delays are measured as time over the initial 25 minute delay threshold).
2009 2010 2011 2013
Source: Based on data in monthly reports published by county.
2009H1N1
2013Flu Season

25
As Transports Have Increased, Hospitals Have Managed to Keep the Number Ambulance Delays From Escalating
1,000
1,500
2,000
2,500
3,000
3,500
6,000
6,500
7,000
7,500
8,000
8,500
9,000
9,500
10,000
10,500
Jan Mar May Jul Sept Nov Jan Mar May Jul Sept Nov Jan Mar May Jul Sept Nov Jan Mar May Jul Sept Nov Jan Mar May Jul Sept
Nu
mb
er o
f E
MS
Iden
tifi
ed B
ed D
elay
Ru
ns
(Red
)
Tota
l Nu
mb
er o
f E
mer
gen
cy T
ran
spo
rt R
un
s (B
lue)
County A IllustrationTrend in EMS Transports vs. Transports with Delays
Total Transports Transports>25min wait
2009 2010 2011 2012
Despite increase in EMS transports of approximately 5% per year since 2009 (aggregate increase of 23%),the number of transports with a wait time greater than 25 minutes increased by 1% per year during
the same period. In 2013, however, the number of bed delays has increased by 18% over 2012 levels.
2013
Source: Based on data in monthly reports published by county.
When Delays are Viewed as a Ratio Of Overall Transports, Delays Have Actually Improved
0.1
0.15
0.2
0.25
0.3
0.35
0.4
0.45
0.5
6,000
6,500
7,000
7,500
8,000
8,500
9,000
9,500
10,000
10,500
Jan Mar May Jul Sept Nov Jan Mar May Jul Sept Nov Jan Mar May Jul Sept Nov Jan Mar May Jul Sept Nov Jan Mar May Jul Sept
% o
f Tra
nsp
ort
s >
25 m
inu
te W
ait T
ime
(Red
)
Tota
l Nu
mb
er o
f E
mer
gen
cy T
ran
spo
rt R
un
s (B
lue)
County A IllustrationTrend in EMS Transports vs Percent of Transports with
DelaysTotal Transports % with Delay
Despite increase in EMS transport volume of approximately 23% since 2009, the overall percent (ratio) of transports with a wait time greater than 25 minutes has decreased by 14% over the same period.
2010 20132009 2011 2012
Source: Based on data in monthly reportes published by county.

26
Use of Emergency Services in Counties is aMulti-faceted Issue that Does Not Lend Itself to a “One Size Fits All” Solution
CountyED Visits per 1,000 residents
% of ED Visits
Medi-Cal or Uninsured
MD Licenses per 100,000 residents
FQHCper 100,000residents
< 150% FPL
EMS Stations per 100,000residents
% of Population< 150% FPL
% of Population
> age 65
Imperial 516 57% 76 10 22 39% 11%Contra Costa 398 38% 287 3 25 18% 13%Kern 381 64% 129 9 19 38% 9%San Bernardino 370 50% 182 1 21 33% 10%Fresno 361 51% 199 6 20 42% 11%
Sacramento 359 50% 311 3 20 30% 12%Alameda 353 42% 305 11 22 21% 12%
California Avg. 333 45% 272 7 20 28% 12%
San Francisco 333 38% 747 9 20 23% 14%
Riverside 323 45% 128 3 18 30% 12%
Los Angeles 318 47% 285 6 18 31% 11%
San Diego 293 40% 311 10 20 25% 12%
San Mateo 280 28% 374 4 17 15% 14%
Orange 278 31% 306 3 22 22% 12%
Santa Clara 261 36% 405 7 15 18% 12%
= Unfavorable relative to characteristic driving ED volume
= Favorable relative to characteristic drving ED volume
Sources: OSHPD, California Department of Finance and US Census Bureau. All data represents 2012.
High EDRate
Lower EDRate
Mid
Off-load DelayReduction Strategies
Kimberlee Roberts, MPHDirector, Clinical Services
Scripps Memorial Hospital La Jolla
54

27
Scripps Health
• Four Emergency Departments• Two Trauma Centers: Level 1 and Level 2• Fiscal Year 2012: 184,011 Visits• Admissions: 38,203 Patients
55
What Was the Problem?
• January – April 2012 (La Jolla)• 95 hours of bypass• Lengthy delays in off-load• County “concerned”
56
28
What We Did
• Requested monthly data on “back in service” from San Diego Fire (85% of volume)
• Director and Manager – 8-hour ride-along with busy rig
• At quarterly Base Meeting, discussed with County opportunities for improvement
• Met with pre-hospital personnel for input and suggestions
• Administrative approval required for ED bypass
57
Process Changes
April 2012 – Present
• Discontinued practice of stopping paramedics in hallway to register
• Started tracking data and began reviewing all cases that were delayed > 20 minutes
• Implemented computer screen for pre-hospital staff to identify bed
• Requested paramedics notify charge nurse at 15-minute mark; field supervisor to contact ED leadership at 20 minutes
58

29
Off-load Delays La Jolla
59
0
50
100
150
200
250
300
350
400
450
500
0-10 11-20 21-30 31-40 41-50 51-60 60+
Pat
ien
t V
olu
me
Time/Minutes
June July August Sept Oct Nov Dec January February March April May
June 2012 − May 2013
County Contract
60
20 Minutes for Off-loadMonth % off-loaded % off-loaded
< 20 Min < 30 Min
June 2012 59% 86%
July 2012 54% 86%
August 2012 57% 84%
September 2012 56% 83%
October 2012 60% 89%
November 2012 61% 89%
December 2012 56% 87%
January 2013 55% 86%
February 2013 60% 87%
March 2013 62% 90%
April 2013 64% 93%
May 2013 58% 90%

30
Work in Progress
61
?
Questions
62

31
Thank you
BJ Bartleson951-358-5029
[email protected] [email protected] [email protected]
Howard [email protected]
Bruce [email protected]