wallkill river biological assessment 2008 survey
TRANSCRIPT

Division of Water
Wallkill River Biological Assessment
2008 Survey
New York State
Department of Environmental Conservation
BIOLOGICAL STREAM ASSESSMENT
Wallkill River
Orange and Ulster Counties, New York
Lower Hudson River Basin
Survey date: July 15, 2008
Report date: May 13, 2011
Diana L. Heitzman
Alexander J. Smith
Brian Duffy
Stream Biomonitoring Unit
Bureau of Water Assessment and Management
Division of Water
NYS Department of Environmental Conservation
Albany, New York

Table of Contents
Background ..................................................................................................................................... 1
Results and Conclusions ................................................................................................................. 1
Discussion ....................................................................................................................................... 2
Literature Cited ............................................................................................................................... 3
Figure 1. Biological Assessment Profiles ....................................................................................... 4
Table 1. Overview of Field Data.................................................................................................... 6
Table 2. Conductivity Values 1994 and 2008 ................................................................................ 6
Table 3. Station Locations .............................................................................................................. 7
Figure 2. Overview Map ................................................................................................................. 9
Figure 3. Site Location Maps ........................................................................................................ 10
Figure 4. Nutrient Biotic Index Values ......................................................................................... 17
Table 4. Impact Source Determination (ISD) ............................................................................... 18
Table 5. Macroinvertebrate Species Collected in Wallkill River ................................................. 19
Table 6. Macroinvertebrate Data Reports (MDR) ........................................................................ 20
Table 7. Laboratory Data Summary .............................................................................................. 27
Table 8. Field Data Summary ....................................................................................................... 29
Appendix I. Biological Methods for Kick Sampling .................................................................... 31
Appendix II. Macroinvertebrate Community Parameters ............................................................. 32
Appendix III. Levels of Water Quality Impact in Streams ........................................................... 33
Appendix IV-A. Biological Assessment Profile: Conversion of Index Values to a 10-Scale ...... 34
Appendix IV-B. Biological Assessment Profile: Plotting Values ................................................ 35
Appendix V. Water Quality Assessment Criteria ......................................................................... 36
Appendix VI. The Traveling Kick Sample ................................................................................... 37
Appendix VII-A. Aquatic Macroinvertebrates Usually Indicative of Good Water Quality ......... 38
Appendix VII-B. Aquatic Macroinvertebrates Usually Indicative of Poor Water Quality .......... 39
Appendix VIII. The Rationale of Biological Monitoring ............................................................. 40
Appendix IX. Glossary ................................................................................................................. 41
Appendix X. Methods for Calculation of the Nutrient Biotic Index ............................................ 42
Appendix XI. Impact Source Determination Methods and Community Models ......................... 45
Appendix XII. Biological Assessment Profile of Slow, Sandy Streams. ..................................... 51

1
Stream: Wallkill River
River Basin: Lower Hudson River Basin
Reach: Liberty Corners to Tuthill, NY
Background
The Stream Biomonitoring Unit sampled seven stations on the Wallkill River in the reach between
Liberty Corners and Tuthill, Orange and Ulster Counties, New York, on July 15, 2008. Sampling was
conducted to assess general water quality, particularly in relation to nonpoint source agricultural inputs. In
addition to the agricultural nature of this region, the Wallkill River passes through a number of small towns
and villages as it travels north from New Jersey until it reaches its confluence with the Rondout Creek.
Municipal wastewater discharges enter the river at a number of locations; the largest of these inputs occur
in Middletown, Wallkill, Montgomery, Walden, Shawangunk, Gardiner, and New Paltz.
To characterize water quality based on benthic macroinvertebrate communities, a traveling kick
sample was collected from riffle areas at each of the seven sites on the Wallkill River. Methods used are
described in the Quality Assurance document (Bode et al, 2002) and summarized in Appendix I. The
contents of each sample were field-inspected to determine major groups of organisms present, and then
preserved in alcohol for laboratory inspection of 100-specimen subsamples from each site.
Macroinvertebrate community parameters used in the determination of water quality were: species
richness, biotic index, EPT richness, Percent Model Affinity (PMA) and NCO richness (see Appendices II
and III). Amount of expected variability of results is stated in Smith and Bode (2004). In addition, the
Nutrient Biotic Index (NBI) (Smith et al. 2007) was used to evaluate impacts to the aquatic community
resulting from nitrogen and phosphorus inputs to the river. Table 3 provides a listing of sampling sites, and
Table 5 provides a listing of all species collected in the present survey. This is followed by
macroinvertebrate data reports, including raw data from each site.
Results and Conclusions
1. Water quality was found to be slightly impacted at each of the seven stations on the Wallkill River.
Water quality at all sites varied little from the previous survey of the Wallkill River in 1994.
2. There are still agricultural impacts in the Wallkill River, extending downstream from the “black
dirt” area, resulting in slightly impacted water quality.

2
Discussion
The Wallkill River flows 94 miles north from its source, Lake Mohawk in Sparta, New Jersey,
through two states and three counties, to Ulster County, NY where it enters the Hudson River. Lake
Mohawk is a man-made lake surrounded by a golf course and urban development. In New York State, the
region historically known as the “black dirt” area (a truck-farming region whose primary crop is onions)
extends from the New Jersey line to Pellets Island (Station 03), a distance of about 10 river miles. As the
river flows north, there are several small dams, more agriculture, and a number of small towns. These
features of the watershed may contribute pollutants to the Wallkill, such as nutrients, siltation, or pesticides.
Together with the Rondout Creek, the Wallkill is part of one of the largest tributary complexes to
the Hudson River. Besides its significant natural resource values, the Wallkill River has long been a source
of active and passive outdoor recreation for area residents.
On July 15, 2008, macroinvertebrate samples were collected from seven sites on the Wallkill River
in Orange and Ulster Counties, NY. These data were collected to assess overall water quality in this area,
which has not been compiled since 1994. (Bode et al, 1994). There is also regional concern about whether
discharges from wastewater treatment plants along the river’s corridor are affecting the water quality of the
Wallkill River. These systems are found in Middletown, Wallkill, Montgomery, Walden, Shawangunk, and
Gardiner.
Results of the 2008 SBU sampling found conditions of slightly impaired water quality at all seven
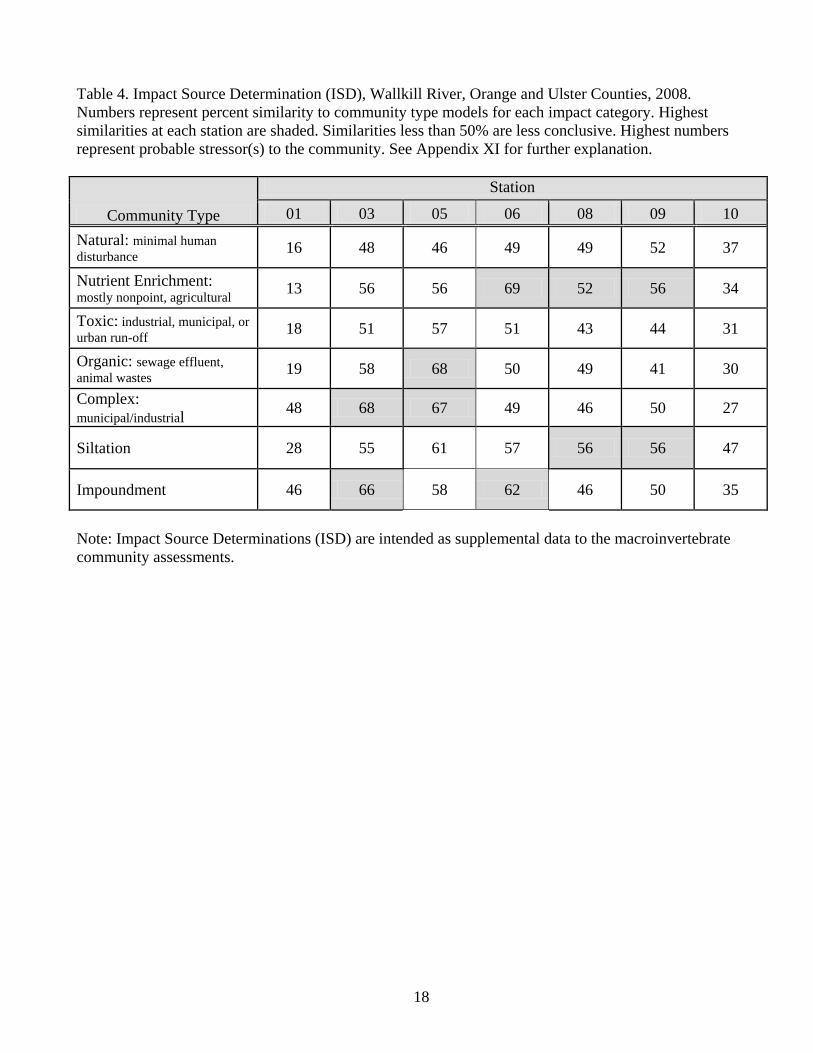
sites (Figure 1). Impact Source Determination (ISD) identified possible municipal/industrial influences at
Stations 03 and 05, as well as domestic wastes at Station 05. Enrichment impacts of development and
agriculture are evident in the water quality assessments of both 1994 and 2008. There were no differences
seen in the biological communities above and below any of the wastewater discharges to the Wallkill River.
The biological condition of the Wallkill River continues to reflect the land cover and land uses of this
watershed and has not varied much since the 1994 survey.
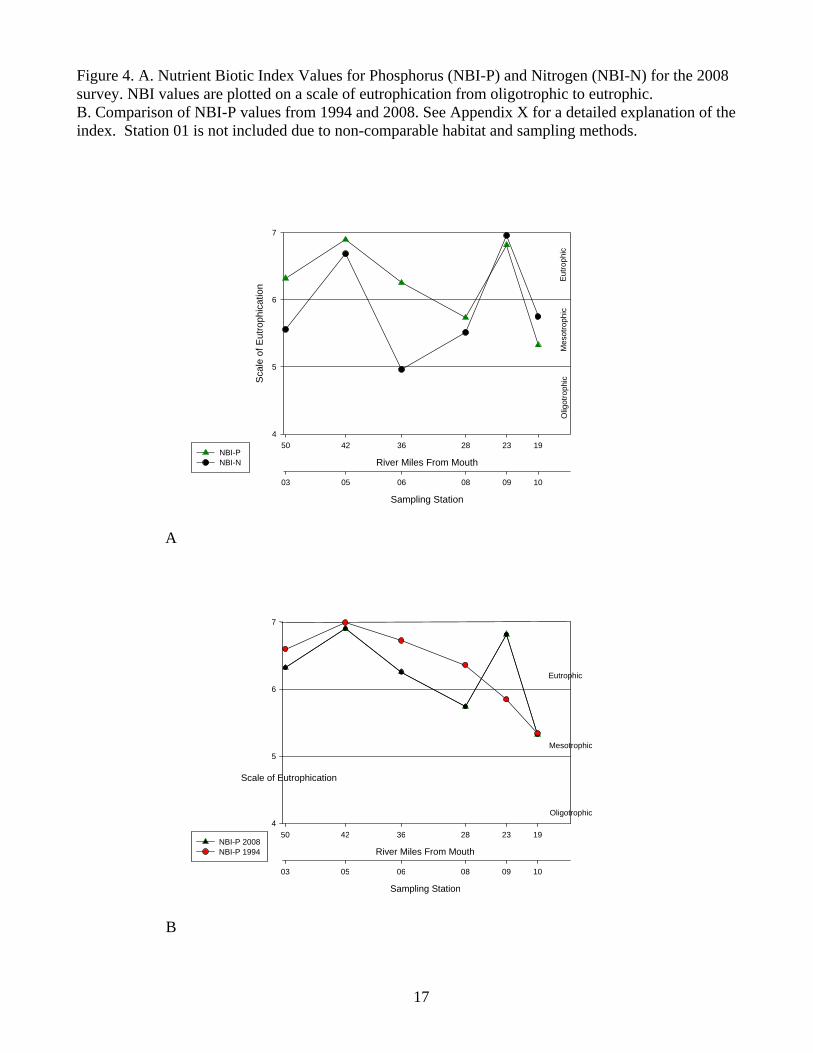
The Nutrient Biotic Index (NBI) (Smith et al. 2007) suggests conditions resulting from excess
phosphorus (NBI-P) and nitrogen (NBI-N) (Figure 4) at all sites except for Stations 08 and 10. Impact
Source Determination (ISD) identified nutrient enrichment, as well as sewage and municipal/industrial
inputs, as the source of water-quality impacts (Table 4). As this is a highly agricultural watershed, these
results are not unexpected and are consistent with the biological assessment of 1994. Agricultural practices
commonly change hydrology and increase sedimentation through erosion, nutrient loading, riparian
reduction and altered land cover (Allan 2004).
Specific conductance increased an average of 24% from 1994 to 2008 (Table 2), is an ongoing
concern in tributaries to the Hudson River (Novak and Bode, 2004). Future studies should monitor possible
increases in this water quality parameter.
3
Literature Cited
Allan, J. D. 2004. Landscapes and Riverscapes: The Influence of Land Use on Stream Ecosystems.
Annual Review of Ecology, Evolution and Systematics 35: 257-84.
Bode, R. W., M. A. Novak, L. E. Abele. 1994. Biological Stream Assessment of Wallkill River, Orange
and Ulster Counties, New York. New York State Department of Environmental Conservation,
Technical Report, 59 pages.
Bode, R. W., M. A. Novak, L. E. Abele, D. L. Heitzman, and A. J. Smith. 2002. Quality Assurance Work
Plan for Biological Stream Monitoring in New York State. New York State Department of
Environmental Conservation, Technical Report, 115 pages.
Novak, M.A., R.W. Bode. 2004. Thirty-year trends in water quality of Hudson river tributaries.
Conference: Rising Salt Concentrations in Tributaries of the Hudson River Estuary. Hudson River
Environmental Society, 2004.
Smith, A. J., and R. W. Bode. 2004. Analysis of Variability in New York State Benthic
Macroinvertebrate Samples. New York State Department of Environmental
Conservation, Technical Report, 43 pages.
Smith, A.J., R. W. Bode, and G. S. Kleppel. 2007. A nutrient biotic index for use with benthic
macroinvertebrate communities. Ecological Indicators 7(200):371-386.
Wallkill River Watershed Conservation and Management Plan, 2007, Orange County Soil and Water
Conservation District
4
Figure 1. Biological Assessment Profile (BAP) of index values, Wallkill River, Orange and Ulster
Counties, 2008. Values are plotted on a normalized scale of water quality. The BAP represents the mean of
the four values for each site, representing species richness (Spp), EPT richness, Hilsenhoff Biotic Index
(HBI), and Percent Model Affinity (PMA), or Non Chironomidae, Oligochaeta (NCO) richness (for Station
01). See Appendix IV for a more complete explanation.
Wa
ter
Qua
lity
Imp
act
River Miles From Mouth
60 50 42 36 28 23 19
Wate
r Q
ualit
y S
cale
0.0
2.5
5.0
7.5
10.0
Station Number
01 03 05 06 08 09 10
Spp
HBI
EPT
PMA
NCO
BAP
Se
ve
reM
ode
rate
Slig
ht
Non
5
Wa
ter
Qua
lity
Imp
act
River Miles From Mouth
60 50 42 36 28 23 19
Wa
ter
Qu
alit
y S
ca
le
0.0
2.5
5.0
7.5
10.0
Station Number
01 03 05 06 08 09 10
2008 BAP
1994 BAP Se
ve
reM
ode
rate
Slig
ht
Non
Figure 1a. Biological Assessment Profile (BAP) of index values, Wallkill River, Orange and Ulster
Counties, 1994 and 2008.
6
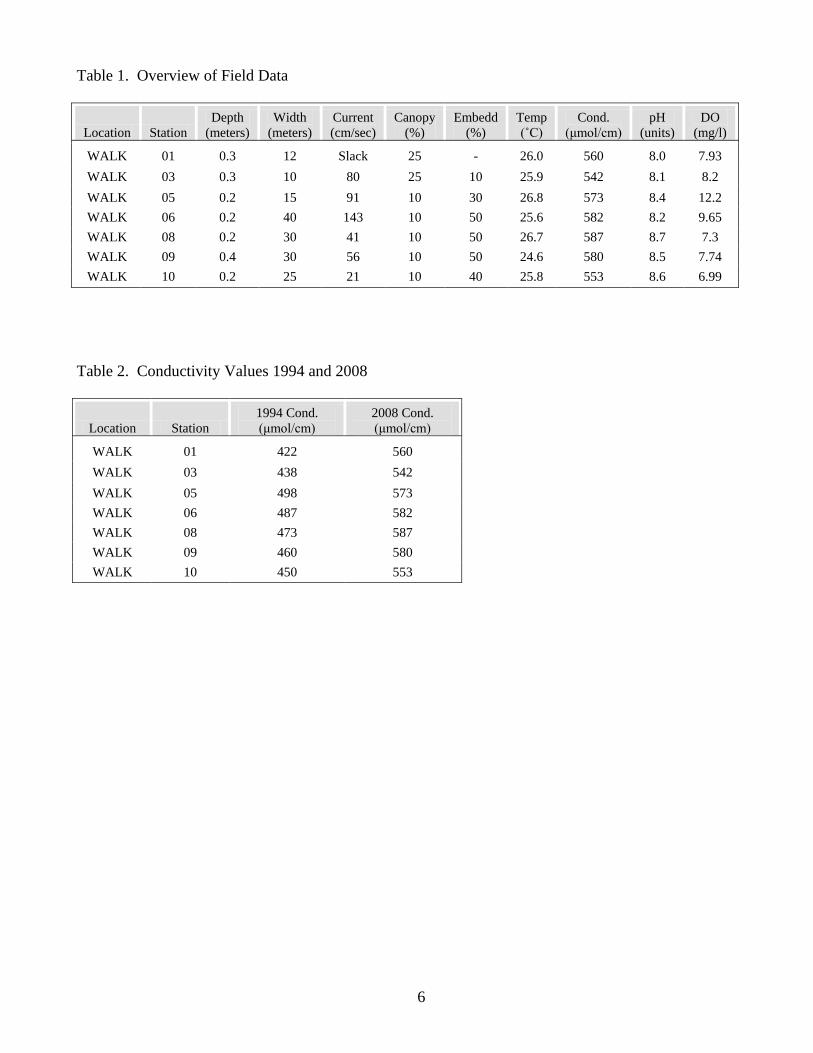
Table 1. Overview of Field Data
Location Station
Depth
(meters)
Width
(meters)
Current
(cm/sec)
Canopy
(%)
Embedd
(%)
Temp
(˚C)
Cond.
(μmol/cm)
pH
(units)
DO
(mg/l)
WALK 01 0.3 12 Slack 25 - 26.0 560 8.0 7.93
WALK 03 0.3 10 80 25 10 25.9 542 8.1 8.2
WALK 05 0.2 15 91 10 30 26.8 573 8.4 12.2
WALK 06 0.2 40 143 10 50 25.6 582 8.2 9.65
WALK 08 0.2 30 41 10 50 26.7 587 8.7 7.3
WALK 09 0.4 30 56 10 50 24.6 580 8.5 7.74
WALK 10 0.2 25 21 10 40 25.8 553 8.6 6.99
Table 2. Conductivity Values 1994 and 2008
Location Station
1994 Cond.
(μmol/cm)
2008 Cond.
(μmol/cm)
WALK 01 422 560
WALK 03 438 542
WALK 05 498 573
WALK 06 487 582
WALK 08 473 587
WALK 09 460 580
WALK 10 450 553
7
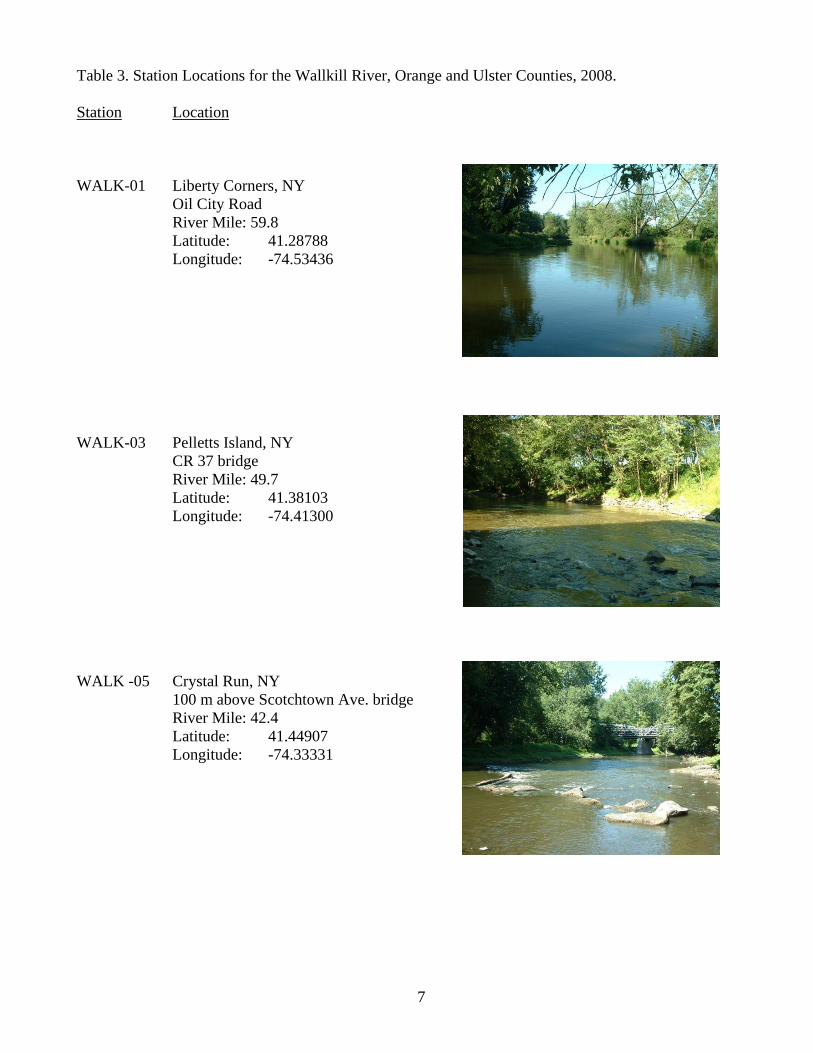
Table 3. Station Locations for the Wallkill River, Orange and Ulster Counties, 2008.
Station Location
WALK-01 Liberty Corners, NY
Oil City Road
River Mile: 59.8
Latitude: 41.28788
Longitude: -74.53436
WALK-03 Pelletts Island, NY
CR 37 bridge
River Mile: 49.7
Latitude: 41.38103
Longitude: -74.41300
WALK -05 Crystal Run, NY
100 m above Scotchtown Ave. bridge
River Mile: 42.4
Latitude: 41.44907
Longitude: -74.33331
8
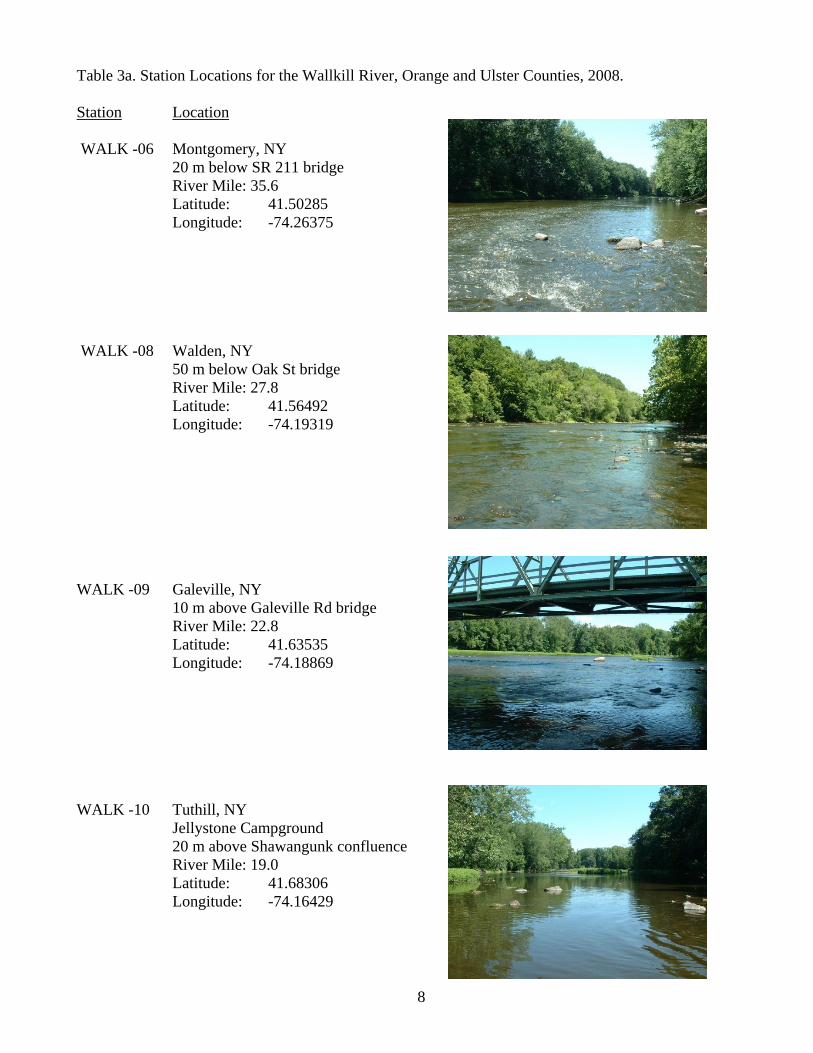
Table 3a. Station Locations for the Wallkill River, Orange and Ulster Counties, 2008.
Station Location
WALK -06 Montgomery, NY
20 m below SR 211 bridge
River Mile: 35.6
Latitude: 41.50285
Longitude: -74.26375
WALK -08 Walden, NY
50 m below Oak St bridge
River Mile: 27.8
Latitude: 41.56492
Longitude: -74.19319
WALK -09 Galeville, NY
10 m above Galeville Rd bridge
River Mile: 22.8
Latitude: 41.63535
Longitude: -74.18869
WALK -10 Tuthill, NY
Jellystone Campground
20 m above Shawangunk confluence
River Mile: 19.0
Latitude: 41.68306
Longitude: -74.16429
9
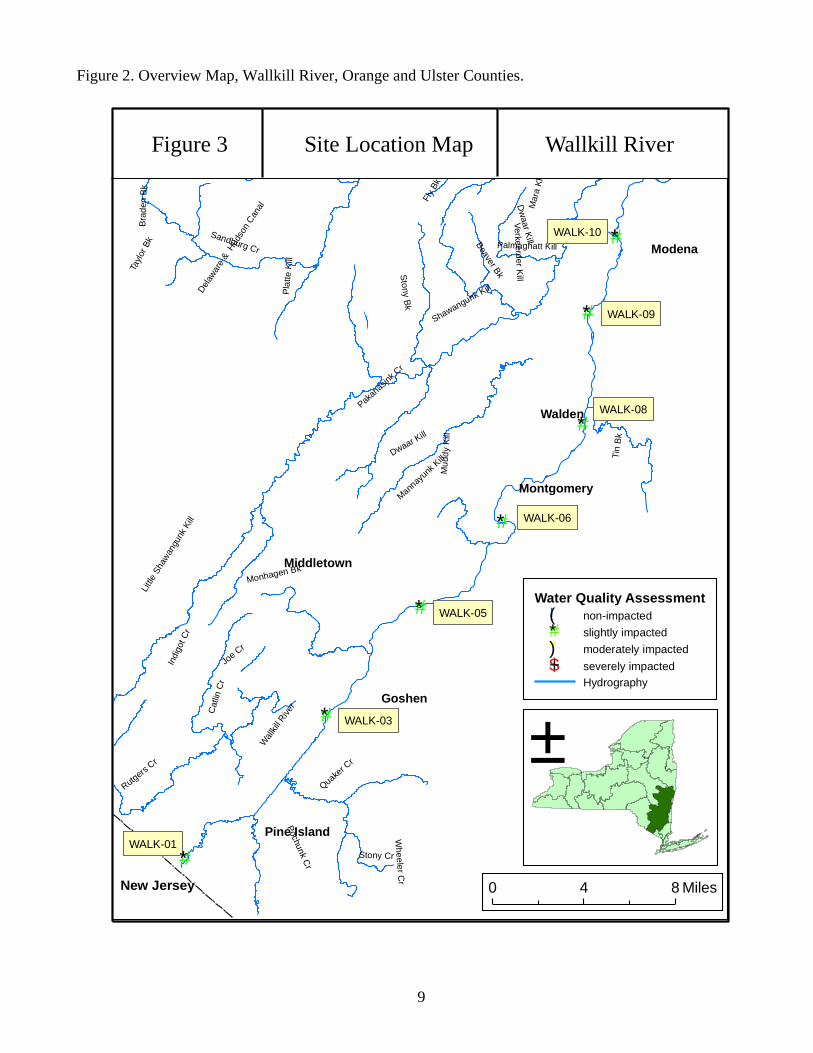
Figure 2. Overview Map, Wallkill River, Orange and Ulster Counties.
Figure 3 Site Location Map Wallkill River
Wal
lkill R
iver
Shawangunk Kill
Dwaar Kill
Tin
Bk
Sandburg Cr
Quake
r Cr
Pla
tte
Kill
Indig
ot C
r
Rutgers
Cr
Pakan
asink
Cr
Verk
eerd
er K
ill
Fly
Bk
Monhagen Bk
Catlin
Cr
Poch
unk C
r
Whe
ele
r Cr
Joe C
r
Mu
dd
y K
ill
Bea
ver B
kSto
ny B
k
Stony Cr
Tayl
or B
kB
rad
en
Bk
Mara
Kill
Palmaghatt Kill
Little
Shaw
angu
nk K
ill
Mann
ayunk
Kill
Del
aware
& H
uds
on
Can
al
Dw
aar K
ill
WALK-03#*
WALK-05#*
0 4 8 Miles
Water Quality Assessment
!( non-impacted
#* slightly impacted
") moderately impacted
$+ severely impacted
Hydrography
±
Modena
Walden
Montgomery
Middletown
New Jersey
Goshen
Pine Island
WALK-06#*
WALK-08
#*
WALK-01
#*
WALK-09#*
#*WALK-10
10
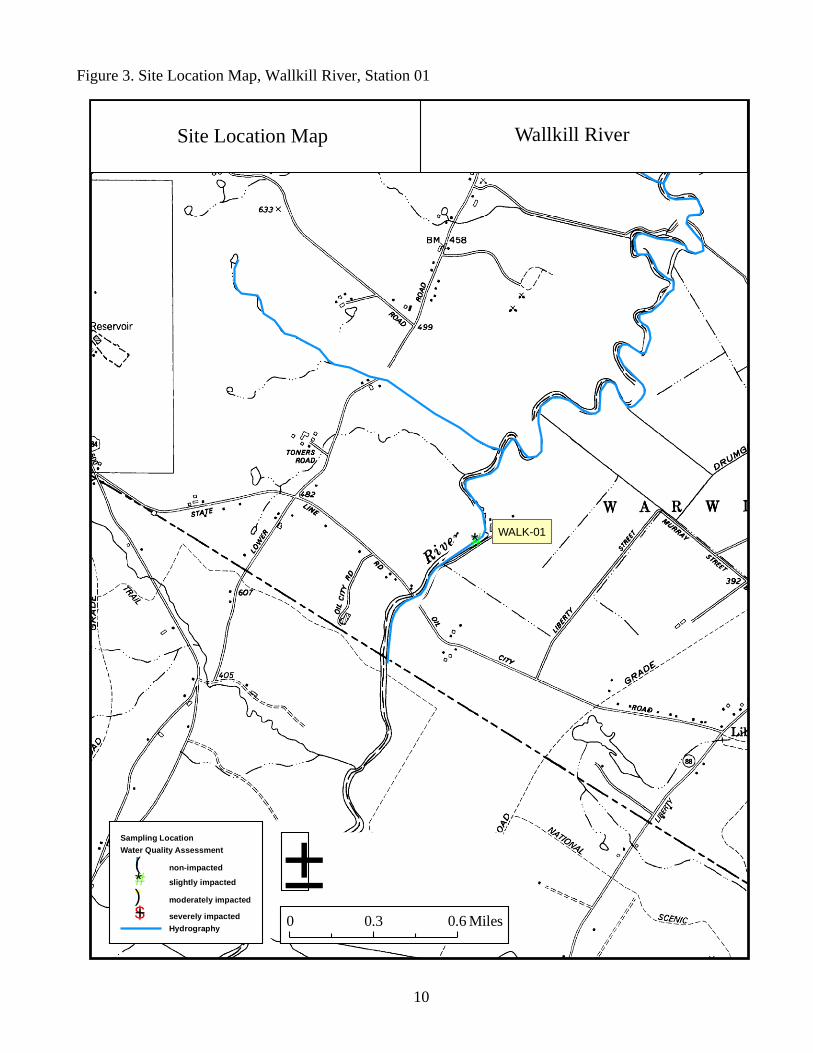
Figure 3. Site Location Map, Wallkill River, Station 01
#*WALK-01
Wallkill RiverSite Location Map
0 0.3 0.6 Miles
Sampling Location
Water Quality Assessment
!( non-impacted
#* slightly impacted
") moderately impacted
$+ severely impacted
Hydrography
±

11
#*WALK 03
Carmans RiverSite Location Map
Sampling Location
Water Quality Assessment
!( non-impacted
#* slightly impacted
") moderately impacted
$+ severely impacted
Hydrography
±0 0.3 0.6 Miles
Figure 3a. Site Location Map, Wallkill River, Station 03
12
Wallkill RiverSite Location Map
0 0.3 0.6 Miles
Sampling Location
Water Quality Assessment
!( non-impacted
#* slightly impacted
") moderately impacted
$+ severely impacted
Hydrography
±
WALK 05
#*
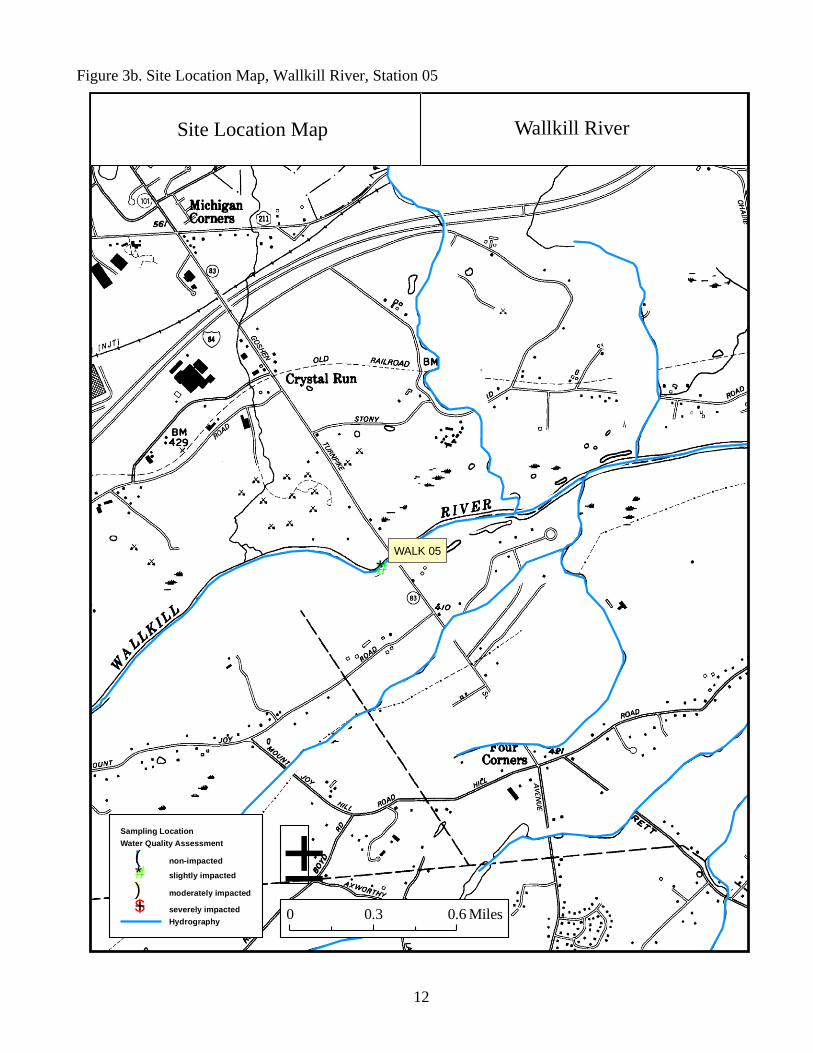
Figure 3b. Site Location Map, Wallkill River, Station 05
13
#*WALK 06
Wallkill RiverSite Location Map
0 0.3 0.6 Miles
Sampling Location
Water Quality Assessment
!( non-impacted
#* slightly impacted
") moderately impacted
$+ severely impacted
Hydrography
±
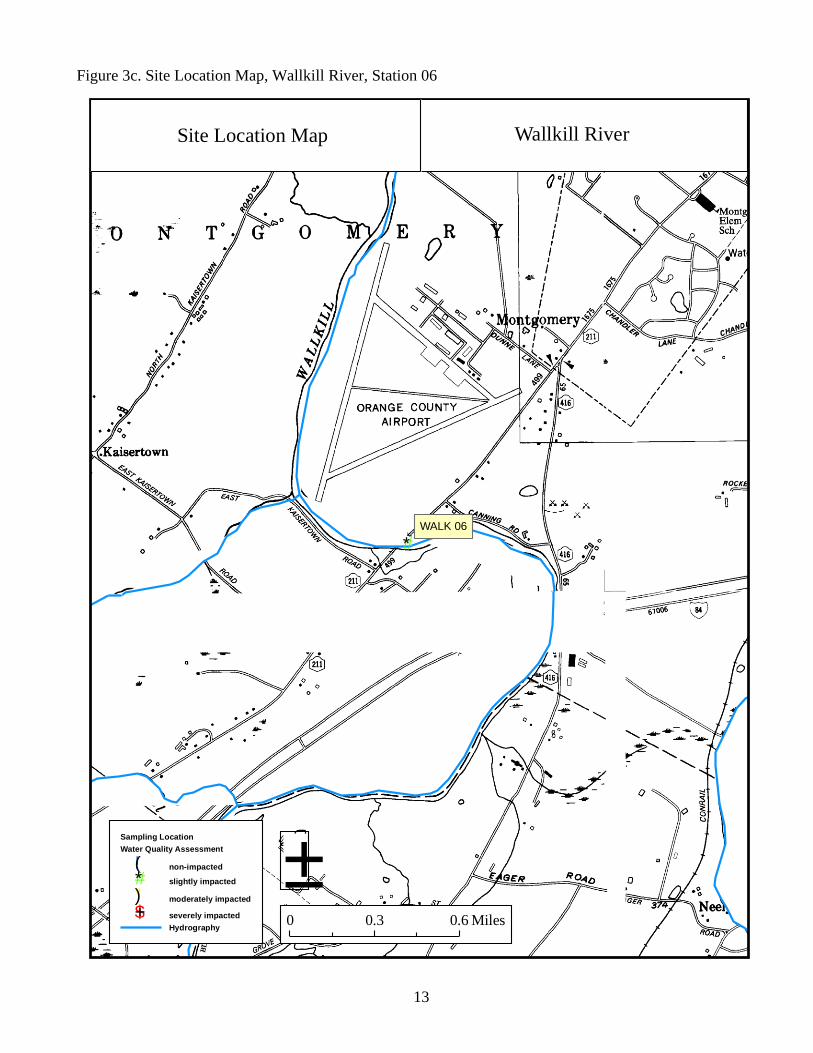
Figure 3c. Site Location Map, Wallkill River, Station 06
14
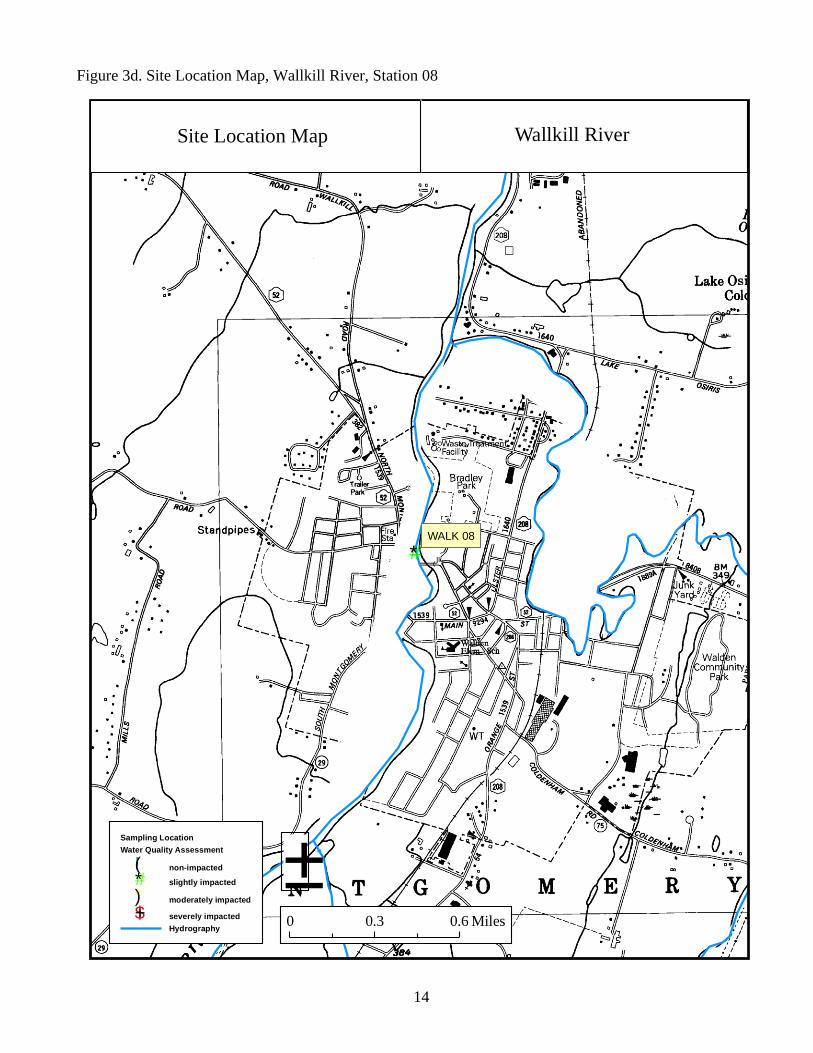
Figure 3d. Site Location Map, Wallkill River, Station 08
Wallkill RiverSite Location Map
WALK 08
#*
0 0.3 0.6 Miles
Sampling Location
Water Quality Assessment
!( non-impacted
#* slightly impacted
") moderately impacted
$+ severely impacted
Hydrography
±
15
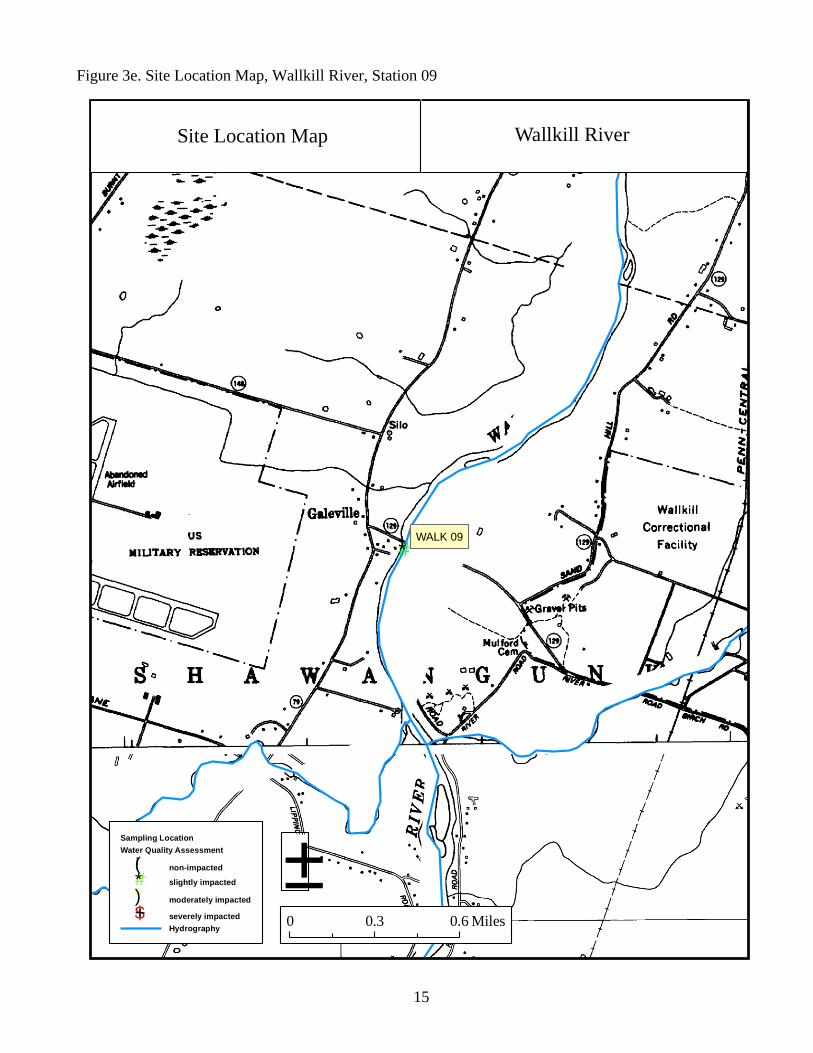
Figure 3e. Site Location Map, Wallkill River, Station 09
Wallkill RiverSite Location Map
0 0.3 0.6 Miles
Sampling Location
Water Quality Assessment
!( non-impacted
#* slightly impacted
") moderately impacted
$+ severely impacted
Hydrography
±
WALK 09
#*
16
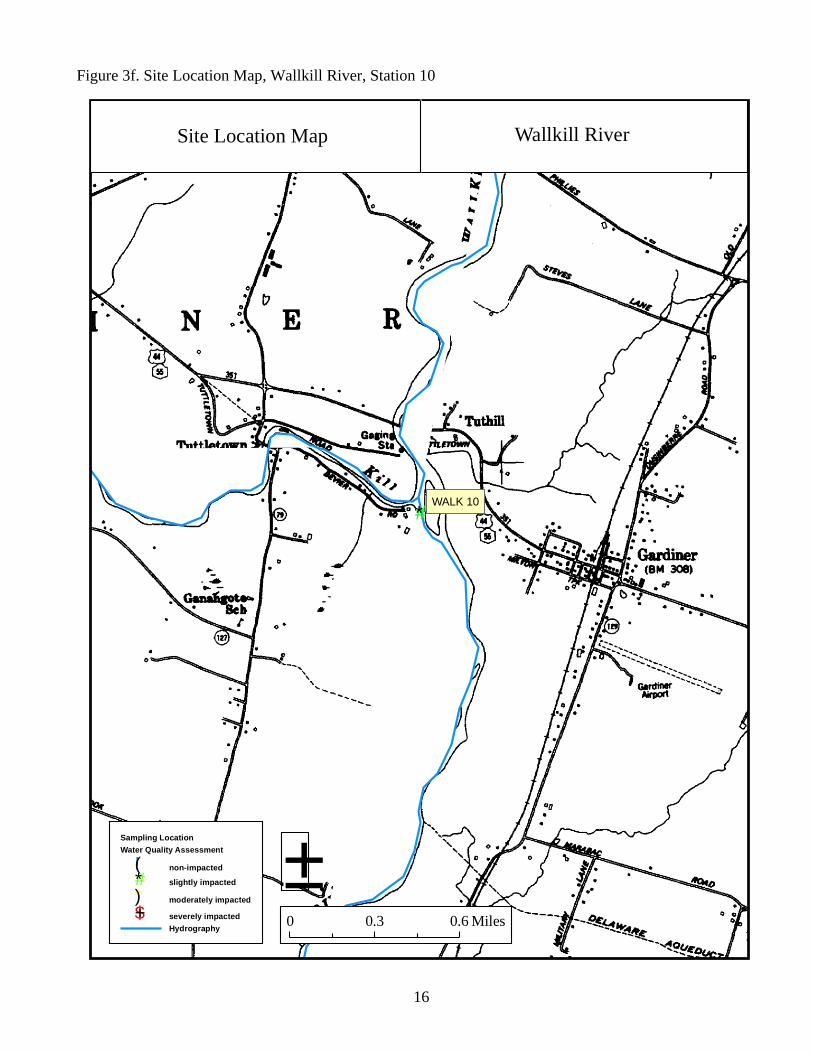
Figure 3f. Site Location Map, Wallkill River, Station 10
Wallkill RiverSite Location Map
0 0.3 0.6 Miles
Sampling Location
Water Quality Assessment
!( non-impacted
#* slightly impacted
") moderately impacted
$+ severely impacted
Hydrography
±
WALK 10
#*
17
Figure 4. A. Nutrient Biotic Index Values for Phosphorus (NBI-P) and Nitrogen (NBI-N) for the 2008
survey. NBI values are plotted on a scale of eutrophication from oligotrophic to eutrophic.
B. Comparison of NBI-P values from 1994 and 2008. See Appendix X for a detailed explanation of the
index. Station 01 is not included due to non-comparable habitat and sampling methods.
A
River Miles From Mouth
50 42 36 28 23 19
Scale
of
Eutr
ophic
ation
4
5
6
7
Sampling Station
03 05 06 08 09 10
NBI-P
NBI-N
Eu
tro
ph
icM
eso
tro
ph
icO
ligotr
oph
ic
B
River Miles From Mouth 50 42 36 28 23 19
Scale of Eutrophication
4
5
6
7
Sampling Station 03 05 06 08 09 10
NBI-P 2008 NBI-P 1994
Eutrophic
Mesotrophic
Oligotrophic
18
Table 4. Impact Source Determination (ISD), Wallkill River, Orange and Ulster Counties, 2008.
Numbers represent percent similarity to community type models for each impact category. Highest
similarities at each station are shaded. Similarities less than 50% are less conclusive. Highest numbers
represent probable stressor(s) to the community. See Appendix XI for further explanation.
Community Type
Station
01 03 05 06 08 09 10
Natural: minimal human
disturbance 16 48 46 49 49 52 37
Nutrient Enrichment: mostly nonpoint, agricultural
13 56 56 69 52 56 34
Toxic: industrial, municipal, or
urban run-off 18 51 57 51 43 44 31
Organic: sewage effluent,
animal wastes 19 58 68 50 49 41 30
Complex:
municipal/industrial 48 68 67 49 46 50 27
Siltation 28 55 61 57 56 56 47
Impoundment 46 66 58 62 46 50 35
Note: Impact Source Determinations (ISD) are intended as supplemental data to the macroinvertebrate
community assessments.
19
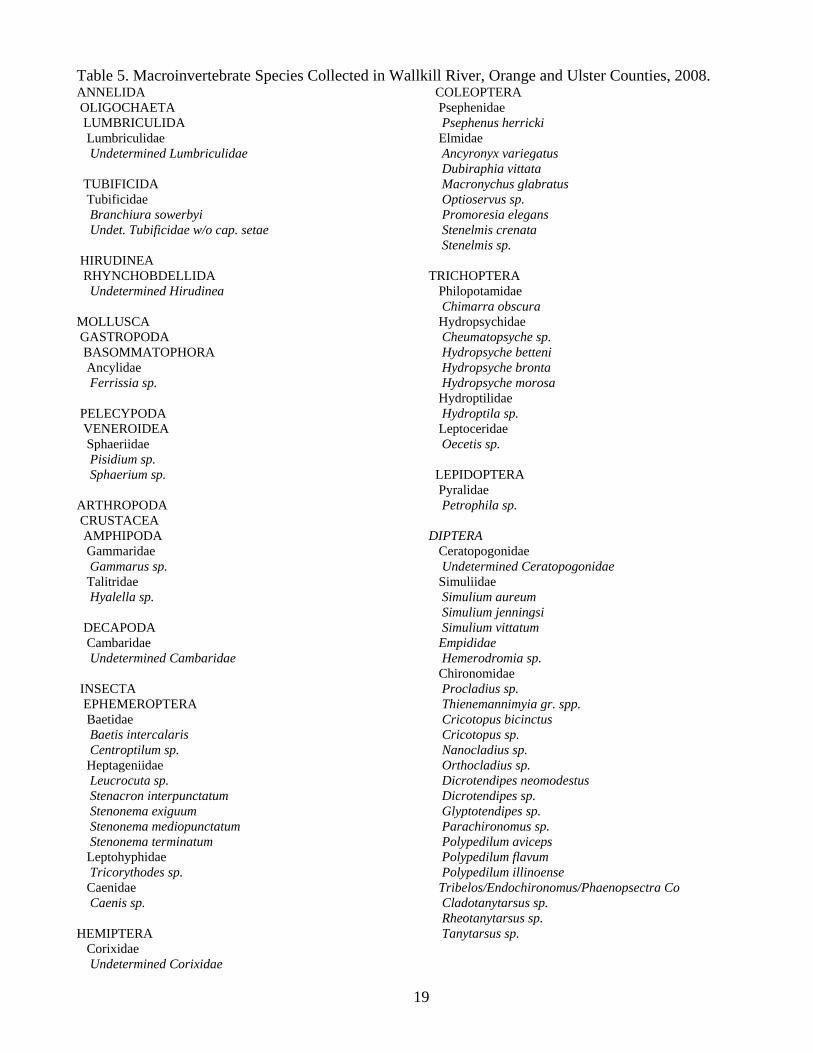
Table 5. Macroinvertebrate Species Collected in Wallkill River, Orange and Ulster Counties, 2008. ANNELIDA
OLIGOCHAETA
LUMBRICULIDA
Lumbriculidae
Undetermined Lumbriculidae
TUBIFICIDA
Tubificidae
Branchiura sowerbyi
Undet. Tubificidae w/o cap. setae
HIRUDINEA
RHYNCHOBDELLIDA
Undetermined Hirudinea
MOLLUSCA
GASTROPODA
BASOMMATOPHORA
Ancylidae
Ferrissia sp.
PELECYPODA
VENEROIDEA
Sphaeriidae
Pisidium sp.
Sphaerium sp.
ARTHROPODA
CRUSTACEA
AMPHIPODA
Gammaridae
Gammarus sp.
Talitridae
Hyalella sp.
DECAPODA
Cambaridae
Undetermined Cambaridae
INSECTA
EPHEMEROPTERA
Baetidae
Baetis intercalaris
Centroptilum sp.
Heptageniidae
Leucrocuta sp.
Stenacron interpunctatum
Stenonema exiguum
Stenonema mediopunctatum
Stenonema terminatum
Leptohyphidae
Tricorythodes sp.
Caenidae
Caenis sp.
HEMIPTERA
Corixidae
Undetermined Corixidae
COLEOPTERA
Psephenidae
Psephenus herricki
Elmidae
Ancyronyx variegatus
Dubiraphia vittata
Macronychus glabratus
Optioservus sp.
Promoresia elegans
Stenelmis crenata
Stenelmis sp.
TRICHOPTERA
Philopotamidae
Chimarra obscura
Hydropsychidae
Cheumatopsyche sp.
Hydropsyche betteni
Hydropsyche bronta
Hydropsyche morosa
Hydroptilidae
Hydroptila sp.
Leptoceridae
Oecetis sp.
LEPIDOPTERA
Pyralidae
Petrophila sp.
DIPTERA
Ceratopogonidae
Undetermined Ceratopogonidae
Simuliidae
Simulium aureum
Simulium jenningsi
Simulium vittatum
Empididae
Hemerodromia sp.
Chironomidae
Procladius sp.
Thienemannimyia gr. spp.
Cricotopus bicinctus
Cricotopus sp.
Nanocladius sp.
Orthocladius sp.
Dicrotendipes neomodestus
Dicrotendipes sp.
Glyptotendipes sp.
Parachironomus sp.
Polypedilum aviceps
Polypedilum flavum
Polypedilum illinoense
Tribelos/Endochironomus/Phaenopsectra Co
Cladotanytarsus sp.
Rheotanytarsus sp.
Tanytarsus sp.
20
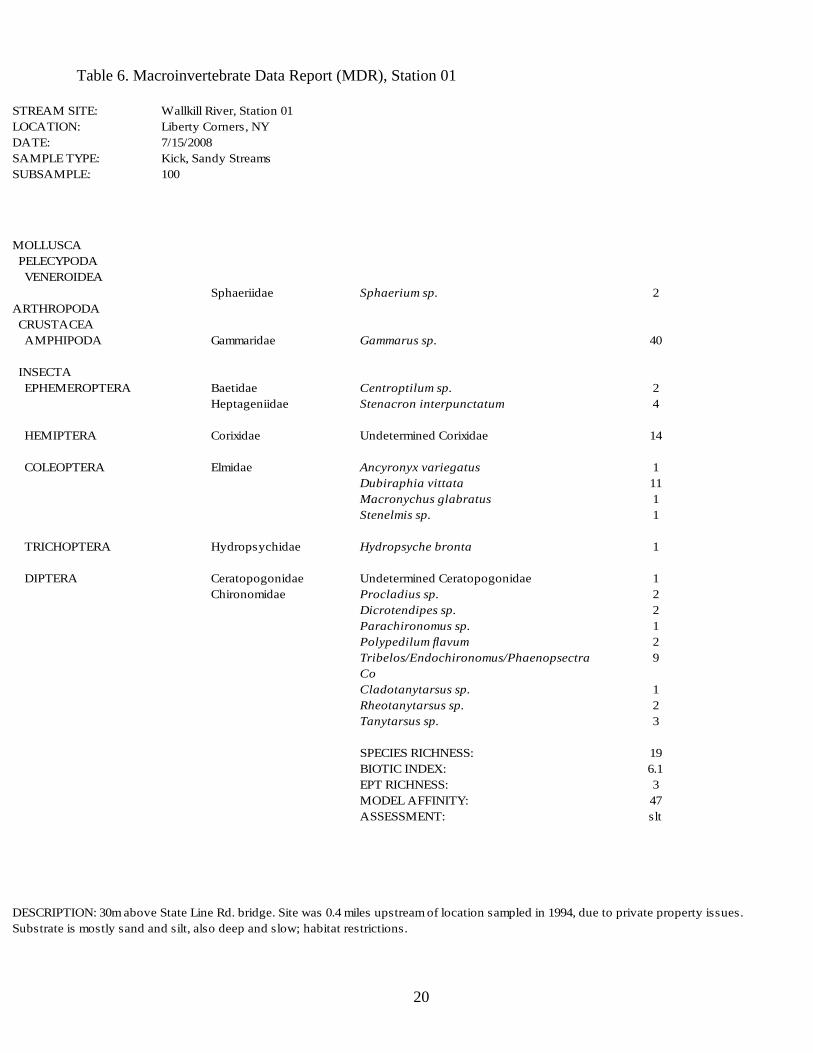
Table 6. Macroinvertebrate Data Report (MDR), Station 01
DESCRIPTION: 30m above State Line Rd. bridge. Site was 0.4 miles upstream of location sampled in 1994, due to private property issues.
Substrate is mostly sand and silt, also deep and slow; habitat restrictions.
STREAM SITE:
LOCATION:
DATE:
SAMPLE TYPE:
SUBSAMPLE:
Wallkill River, Station 01
Liberty Corners, NY
7/15/2008
Kick, Sandy Streams
100
MOLLUSCA
PELECYPODA
VENEROIDEA
ARTHROPODA
CRUSTACEA
AMPHIPODA
INSECTA
EPHEMEROPTERA
HEMIPTERA
COLEOPTERA
TRICHOPTERA
DIPTERA
Sphaeriidae
Gammaridae
Baetidae
Heptageniidae
Corixidae
Elmidae
Hydropsychidae
Ceratopogonidae
Chironomidae
Sphaerium sp.
Gammarus sp.
Centroptilum sp.
Stenacron interpunctatum
Undetermined Corixidae
Ancyronyx variegatus
Dubiraphia vittata
Macronychus glabratus
Stenelmis sp.
Hydropsyche bronta
Undetermined Ceratopogonidae
Procladius sp.
Dicrotendipes sp.
Parachironomus sp.
Polypedilum flavum
Tribelos/Endochironomus/Phaenopsectra
Co
Cladotanytarsus sp.
Rheotanytarsus sp.
Tanytarsus sp.
SPECIES RICHNESS:
BIOTIC INDEX:
EPT RICHNESS:
MODEL AFFINITY:
ASSESSMENT:
2
40
2
4
14
1
11
1
1
1
1
2
2
1
2
9
1
2
3
19
6.1
3
47
slt
21
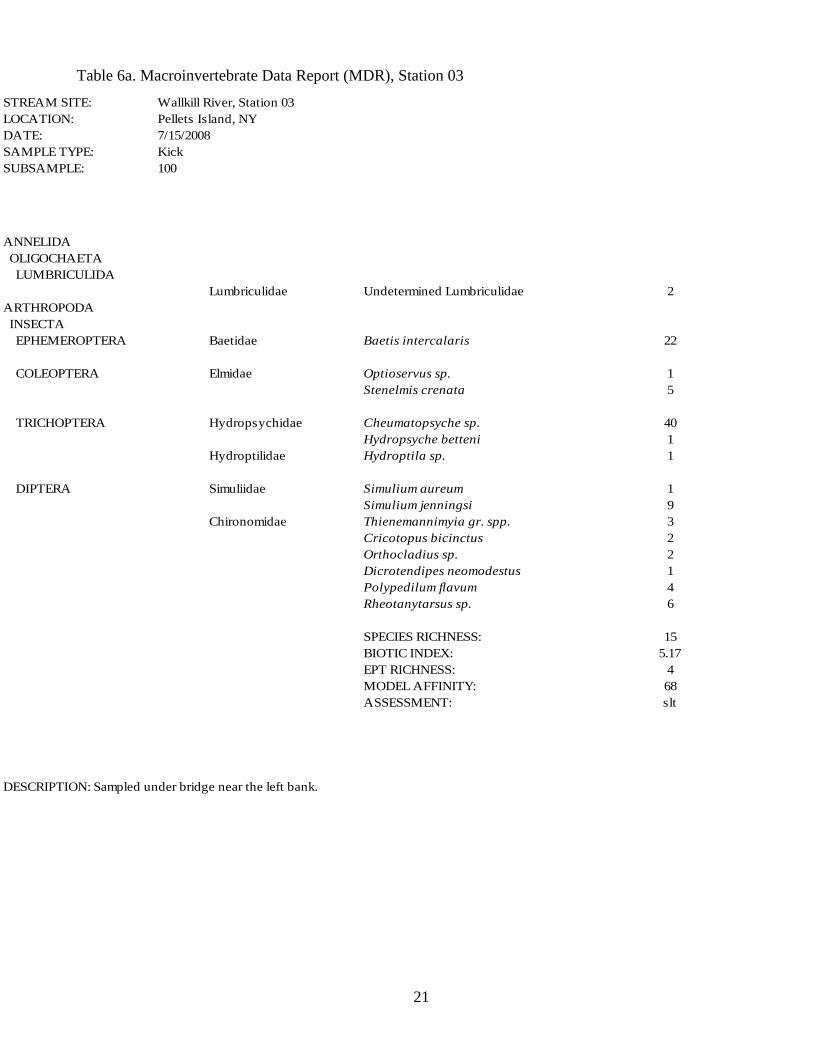
Table 6a. Macroinvertebrate Data Report (MDR), Station 03
DESCRIPTION: Sampled under bridge near the left bank.
STREAM SITE:
LOCATION:
DATE:
SAMPLE TYPE:
SUBSAMPLE:
Wallkill River, Station 03
Pellets Island, NY
7/15/2008
Kick
100
ANNELIDA
OLIGOCHAETA
LUMBRICULIDA
ARTHROPODA
INSECTA
EPHEMEROPTERA
COLEOPTERA
TRICHOPTERA
DIPTERA
Lumbriculidae
Baetidae
Elmidae
Hydropsychidae
Hydroptilidae
Simuliidae
Chironomidae
Undetermined Lumbriculidae
Baetis intercalaris
Optioservus sp.
Stenelmis crenata
Cheumatopsyche sp.
Hydropsyche betteni
Hydroptila sp.
Simulium aureum
Simulium jenningsi
Thienemannimyia gr. spp.
Cricotopus bicinctus
Orthocladius sp.
Dicrotendipes neomodestus
Polypedilum flavum
Rheotanytarsus sp.
SPECIES RICHNESS:
BIOTIC INDEX:
EPT RICHNESS:
MODEL AFFINITY:
ASSESSMENT:
2
22
1
5
40
1
1
1
9
3
2
2
1
4
6
15
5.17
4
68
slt
22
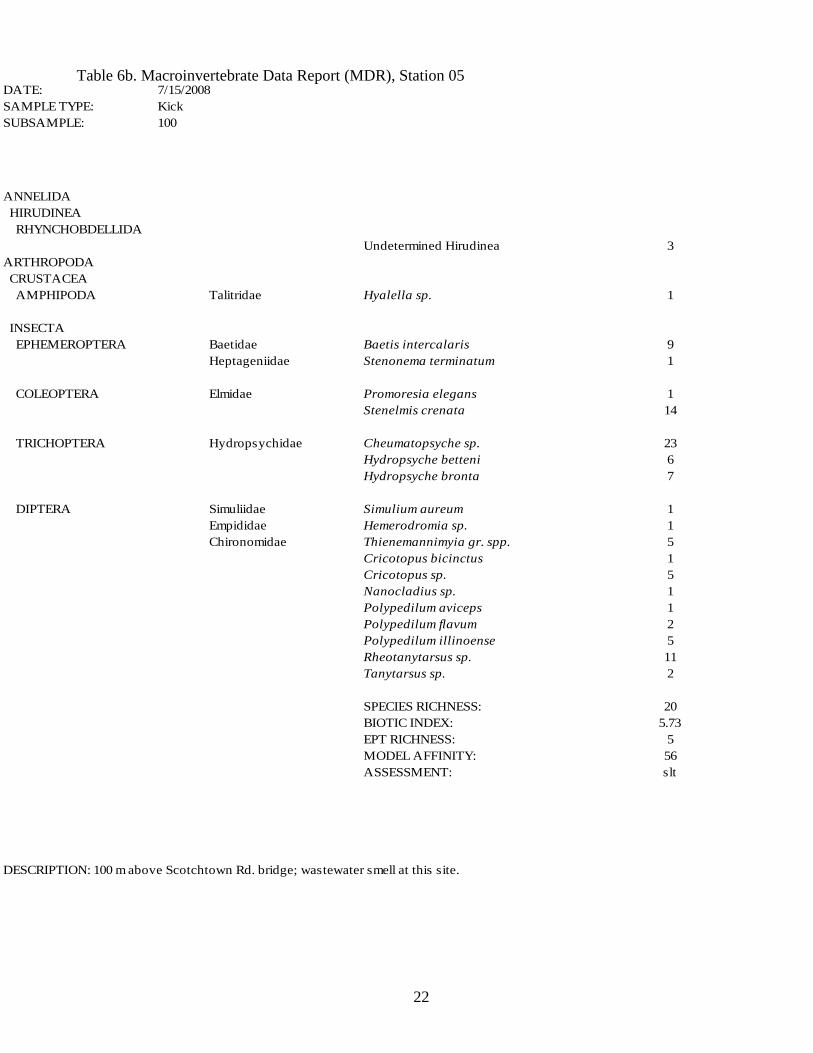
Table 6b. Macroinvertebrate Data Report (MDR), Station 05
DESCRIPTION: 100 m above Scotchtown Rd. bridge; wastewater smell at this site.
STREAM SITE:
LOCATION:
DATE:
SAMPLE TYPE:
SUBSAMPLE:
Wallkill River, Station 05
Crystal Run, NY
7/15/2008
Kick
100
ANNELIDA
HIRUDINEA
RHYNCHOBDELLIDA
ARTHROPODA
CRUSTACEA
AMPHIPODA
INSECTA
EPHEMEROPTERA
COLEOPTERA
TRICHOPTERA
DIPTERA
Talitridae
Baetidae
Heptageniidae
Elmidae
Hydropsychidae
Simuliidae
Empididae
Chironomidae
Undetermined Hirudinea
Hyalella sp.
Baetis intercalaris
Stenonema terminatum
Promoresia elegans
Stenelmis crenata
Cheumatopsyche sp.
Hydropsyche betteni
Hydropsyche bronta
Simulium aureum
Hemerodromia sp.
Thienemannimyia gr. spp.
Cricotopus bicinctus
Cricotopus sp.
Nanocladius sp.
Polypedilum aviceps
Polypedilum flavum
Polypedilum illinoense
Rheotanytarsus sp.
Tanytarsus sp.
SPECIES RICHNESS:
BIOTIC INDEX:
EPT RICHNESS:
MODEL AFFINITY:
ASSESSMENT:
3
1
9
1
1
14
23
6
7
1
1
5
1
5
1
1
2
5
11
2
20
5.73
5
56
slt
23
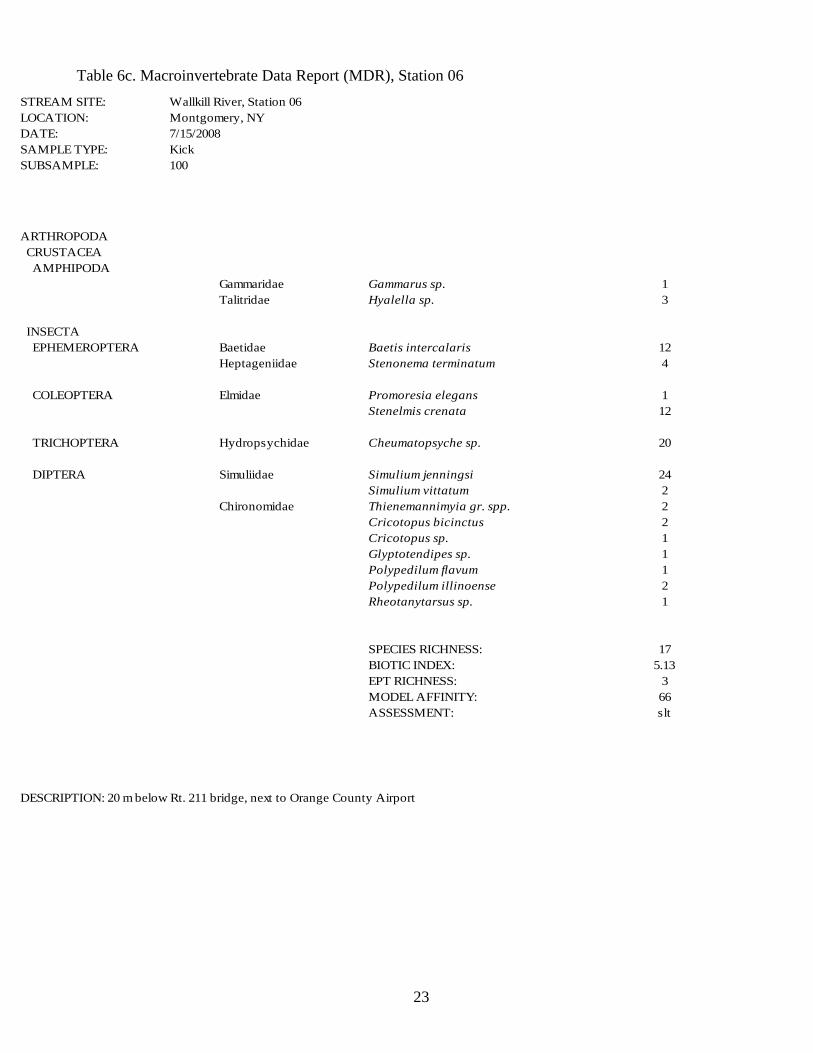
Table 6c. Macroinvertebrate Data Report (MDR), Station 06
DESCRIPTION: 20 m below Rt. 211 bridge, next to Orange County Airport
STREAM SITE:
LOCATION:
DATE:
SAMPLE TYPE:
SUBSAMPLE:
Wallkill River, Station 06
Montgomery, NY
7/15/2008
Kick
100
ARTHROPODA
CRUSTACEA
AMPHIPODA
INSECTA
EPHEMEROPTERA
COLEOPTERA
TRICHOPTERA
DIPTERA
Gammaridae
Talitridae
Baetidae
Heptageniidae
Elmidae
Hydropsychidae
Simuliidae
Chironomidae
Gammarus sp.
Hyalella sp.
Baetis intercalaris
Stenonema terminatum
Promoresia elegans
Stenelmis crenata
Cheumatopsyche sp.
Simulium jenningsi
Simulium vittatum
Thienemannimyia gr. spp.
Cricotopus bicinctus
Cricotopus sp.
Glyptotendipes sp.
Polypedilum flavum
Polypedilum illinoense
Rheotanytarsus sp.
SPECIES RICHNESS:
BIOTIC INDEX:
EPT RICHNESS:
MODEL AFFINITY:
ASSESSMENT:
1
3
12
4
1
12
20
24
2
2
2
1
1
1
2
1
17
5.13
3
66
slt
24
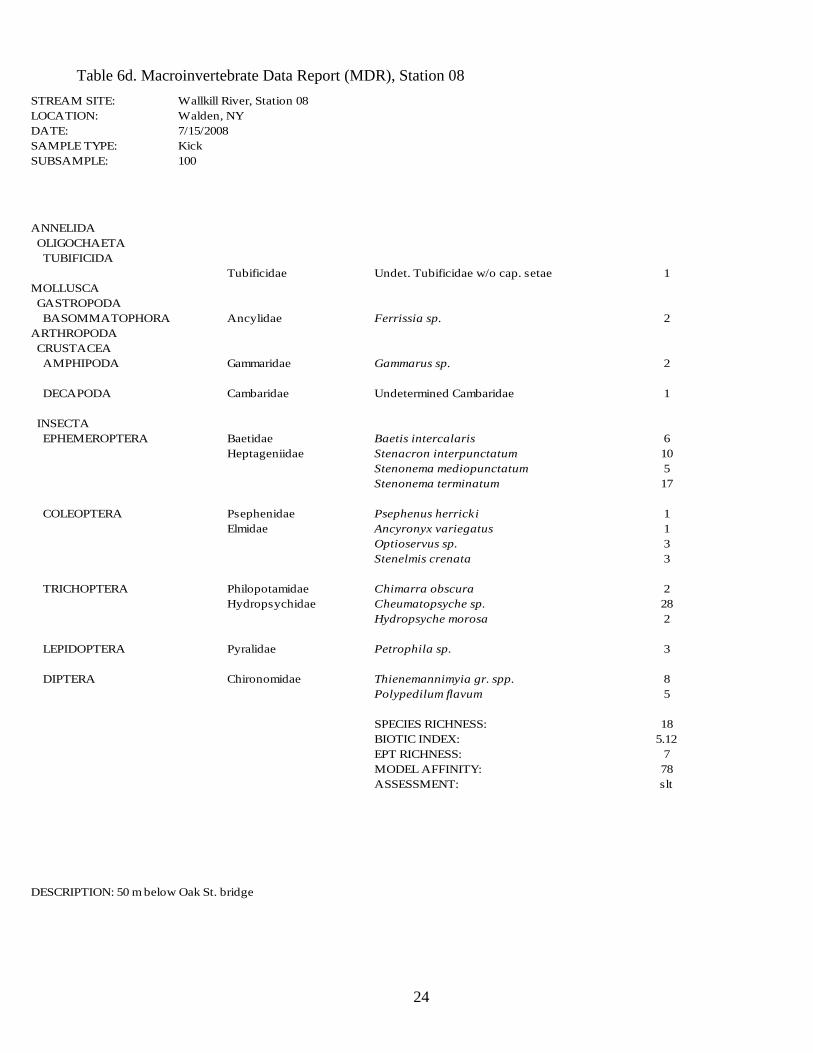
Table 6d. Macroinvertebrate Data Report (MDR), Station 08
DESCRIPTION: 50 m below Oak St. bridge
STREAM SITE:
LOCATION:
DATE:
SAMPLE TYPE:
SUBSAMPLE:
Wallkill River, Station 08
Walden, NY
7/15/2008
Kick
100
ANNELIDA
OLIGOCHAETA
TUBIFICIDA
MOLLUSCA
GASTROPODA
BASOMMATOPHORA
ARTHROPODA
CRUSTACEA
AMPHIPODA
DECAPODA
INSECTA
EPHEMEROPTERA
COLEOPTERA
TRICHOPTERA
LEPIDOPTERA
DIPTERA
Tubificidae
Ancylidae
Gammaridae
Cambaridae
Baetidae
Heptageniidae
Psephenidae
Elmidae
Philopotamidae
Hydropsychidae
Pyralidae
Chironomidae
Undet. Tubificidae w/o cap. setae
Ferrissia sp.
Gammarus sp.
Undetermined Cambaridae
Baetis intercalaris
Stenacron interpunctatum
Stenonema mediopunctatum
Stenonema terminatum
Psephenus herricki
Ancyronyx variegatus
Optioservus sp.
Stenelmis crenata
Chimarra obscura
Cheumatopsyche sp.
Hydropsyche morosa
Petrophila sp.
Thienemannimyia gr. spp.
Polypedilum flavum
SPECIES RICHNESS:
BIOTIC INDEX:
EPT RICHNESS:
MODEL AFFINITY:
ASSESSMENT:
1
2
2
1
6
10
5
17
1
1
3
3
2
28
2
3
8
5
18
5.12
7
78
slt
25
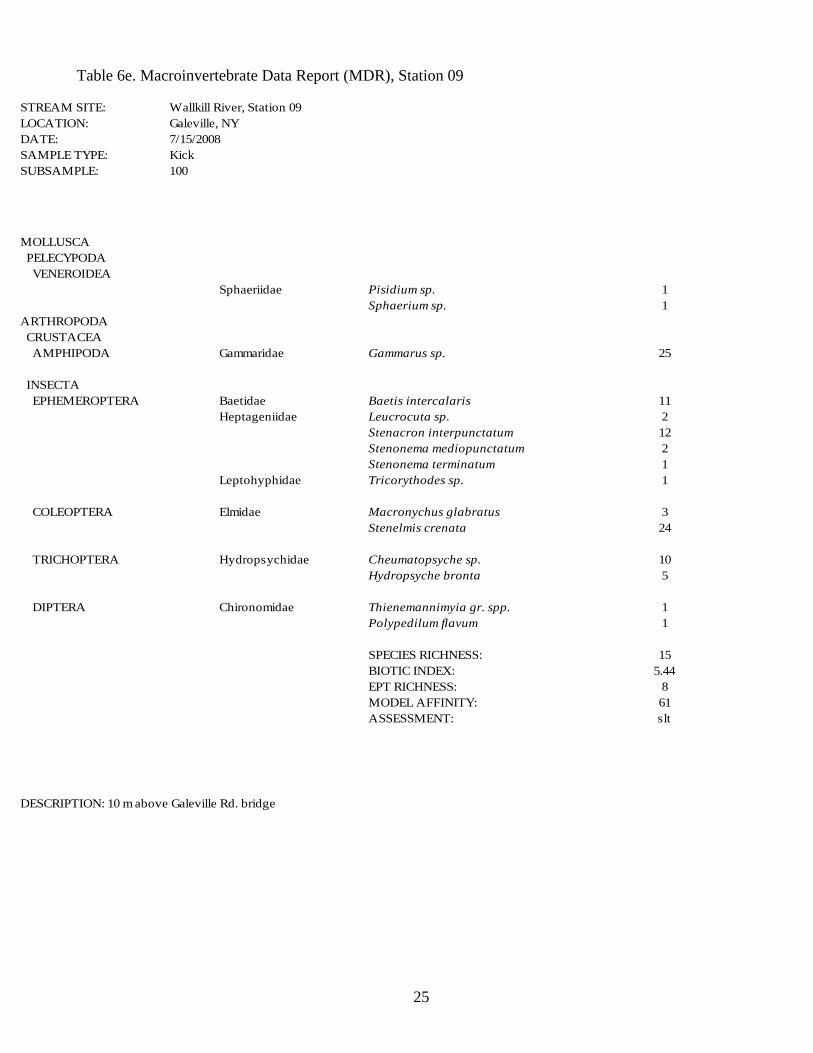
Table 6e. Macroinvertebrate Data Report (MDR), Station 09
DESCRIPTION: 10 m above Galeville Rd. bridge
STREAM SITE:
LOCATION:
DATE:
SAMPLE TYPE:
SUBSAMPLE:
Wallkill River, Station 09
Galeville, NY
7/15/2008
Kick
100
MOLLUSCA
PELECYPODA
VENEROIDEA
ARTHROPODA
CRUSTACEA
AMPHIPODA
INSECTA
EPHEMEROPTERA
COLEOPTERA
TRICHOPTERA
DIPTERA
Sphaeriidae
Gammaridae
Baetidae
Heptageniidae
Leptohyphidae
Elmidae
Hydropsychidae
Chironomidae
Pisidium sp.
Sphaerium sp.
Gammarus sp.
Baetis intercalaris
Leucrocuta sp.
Stenacron interpunctatum
Stenonema mediopunctatum
Stenonema terminatum
Tricorythodes sp.
Macronychus glabratus
Stenelmis crenata
Cheumatopsyche sp.
Hydropsyche bronta
Thienemannimyia gr. spp.
Polypedilum flavum
SPECIES RICHNESS:
BIOTIC INDEX:
EPT RICHNESS:
MODEL AFFINITY:
ASSESSMENT:
1
1
25
11
2
12
2
1
1
3
24
10
5
1
1
15
5.44
8
61
slt

26
Table 6f. Macroinvertebrate Data Report (MDR), Station 10
DESCRIPTION: Jellystone Park campground-20 m above Shawangunk Kill confluence.
STREAM SITE:
LOCATION:
DATE:
SAMPLE TYPE:
SUBSAMPLE:
Wallkill River, Station 10
Tuthill, NY
7/15/2008
Kick
100
ANNELIDA
OLIGOCHAETA
TUBIFICIDA
ARTHROPODA
CRUSTACEA
AMPHIPODA
INSECTA
EPHEMEROPTERA
COLEOPTERA
TRICHOPTERA
LEPIDOPTERA
DIPTERA
Tubificidae
Gammaridae
Baetidae
Heptageniidae
Leptohyphidae
Caenidae
Elmidae
Hydropsychidae
Leptoceridae
Pyralidae
Chironomidae
Branchiura sowerbyi
Gammarus sp.
Baetis intercalaris
Leucrocuta sp.
Stenacron interpunctatum
Stenonema exiguum
Stenonema mediopunctatum
Stenonema terminatum
Tricorythodes sp.
Caenis sp.
Stenelmis crenata
Cheumatopsyche sp.
Oecetis sp.
Petrophila sp.
Thienemannimyia gr. spp.
SPECIES RICHNESS:
BIOTIC INDEX:
EPT RICHNESS:
MODEL AFFINITY:
ASSESSMENT:
2
8
4
14
26
1
7
6
1
4
21
3
1
1
1
15
4.9
10
66
slt
27
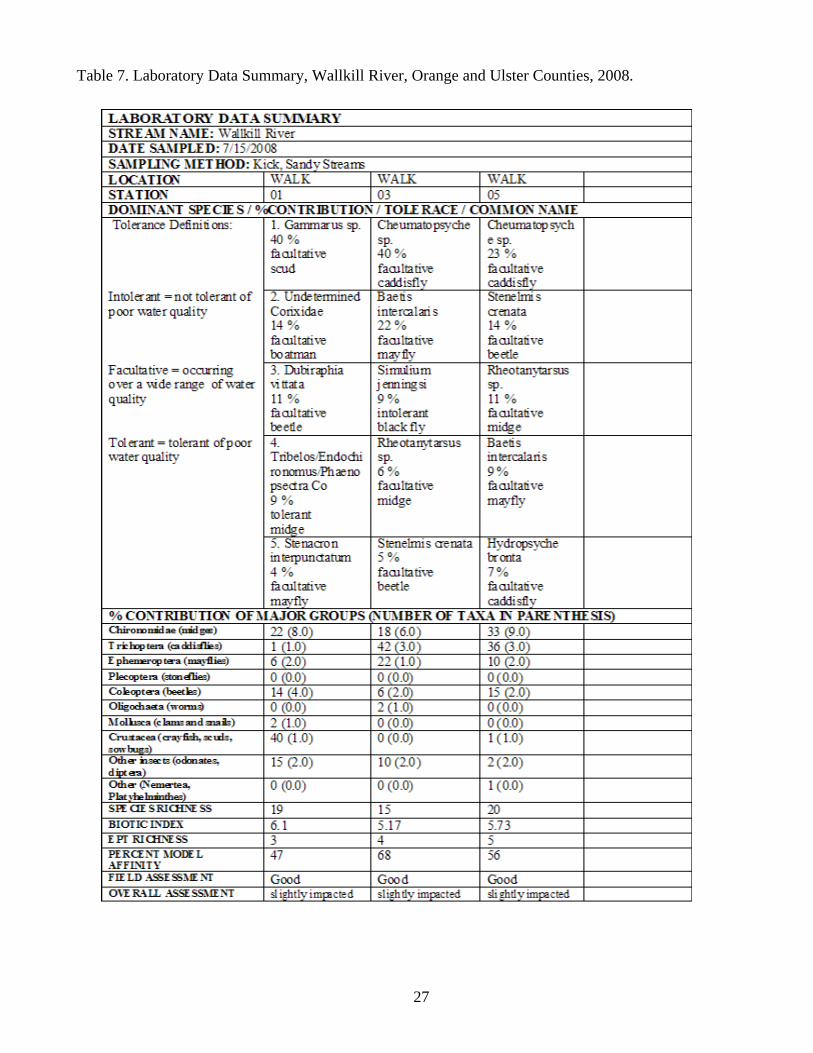
Table 7. Laboratory Data Summary, Wallkill River, Orange and Ulster Counties, 2008.
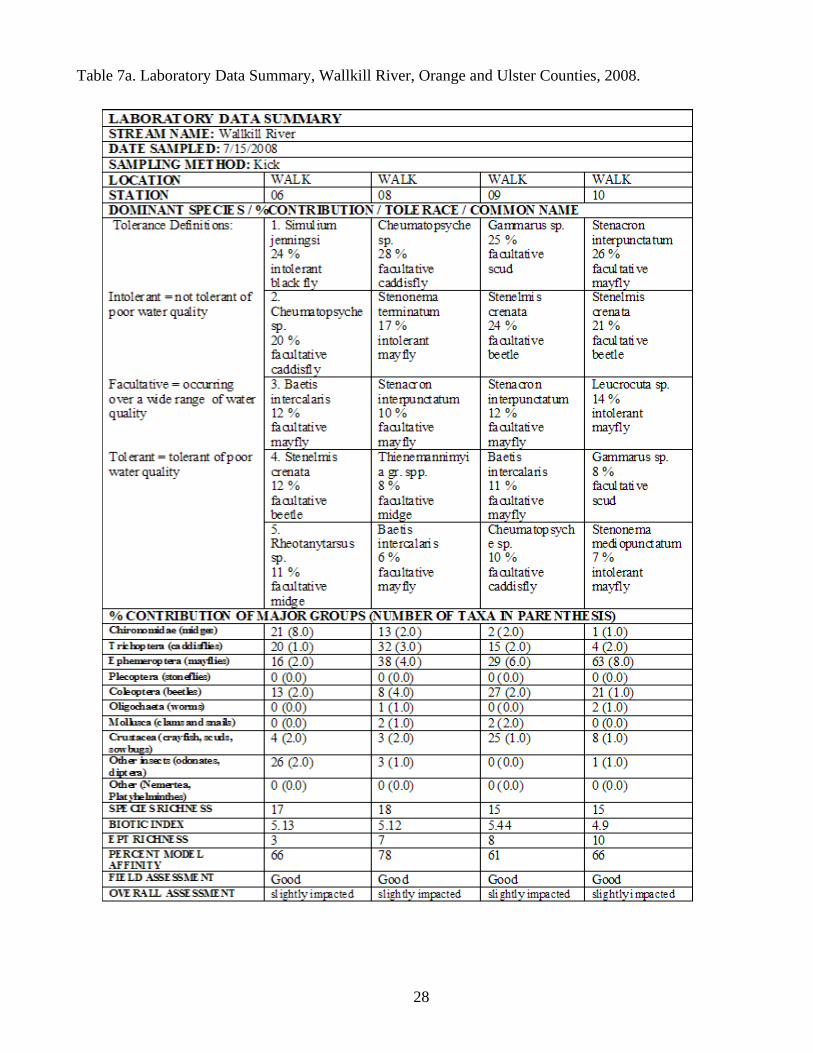
28
Table 7a. Laboratory Data Summary, Wallkill River, Orange and Ulster Counties, 2008.

29
Table 8. Field Data Summary, Wallkill River, Orange and Ulster Counties, 2008.

30
Table 8a. Field Data Summary, Wallkill River, Orange and Ulster Counties, 2008.

31
Appendix I. Biological Methods for Kick Sampling
A. Rationale: The use of the standardized kick sampling method provides a biological assessment technique
that lends itself to rapid assessments of stream water quality.
B. Site Selection: Sampling sites are selected based on these criteria: (1) The sampling location should be a
riffle with a substrate of rubble, gravel and sand; depth should be one meter or less, and current speed
should be at least 0.4 meter per second. (2) The site should have comparable current speed, substrate type,
embeddedness, and canopy cover to both upstream and downstream sites to the degree possible. (3) The
site should have safe and convenient access.
C. Sampling: Macroinvertebrates are sampled using the standardized traveling kick method. An aquatic
net is positioned in the water at arms' length downstream and the stream bottom is disturbed by foot, so that
organisms are dislodged and carried into the net. Sampling is continued for a specified time and distance in
the stream. Rapid assessment sampling specifies sampling for five minutes over a distance of five meters.
The contents of the net are emptied into a pan of stream water, examined, and the major groups of
organisms are recorded, usually on the ordinal level (e.g., stoneflies, mayflies, caddisflies). Larger rocks,
sticks, and plants may be removed from the sample if organisms are first removed from them. The contents
of the pan are poured into a U.S. No. 30 sieve and transferred to a quart jar. The sample is then preserved
by adding 95% ethyl alcohol.
D. Sample Sorting and Subsampling: In the laboratory, the sample is rinsed with tap water in a U.S. No. 40
standard sieve to remove any fine particles left in the residues from field sieving. The sample is transferred
to an enamel pan and distributed homogeneously over the bottom of the pan. A small amount of the sample
is randomly removed with a spatula, rinsed with water, and placed in a petri dish. This portion is examined
under a dissecting stereomicroscope and 100 organisms are randomly removed from the debris. As they are
removed, they are sorted into major groups, placed in vials containing 70 percent alcohol, and counted. The
total number of organisms in the sample is estimated by weighing the residue from the picked subsample
and determining its proportion of the total sample weight.
E. Organism Identification: All organisms are identified to the species level whenever possible.
Chironomids and oligochaetes are slide-mounted and viewed through a compound microscope; most other
organisms are identified as whole specimens using a dissecting stereomicroscope. The number of
individuals in each species and the total number of individuals in the subsample are recorded on a data
sheet. All organisms from the subsample are archived (either slide-mounted or preserved in alcohol). If the
results of the identification process are ambiguous, suspected of being spurious, or do not yield a clear
water quality assessment, additional subsampling may be required.
32
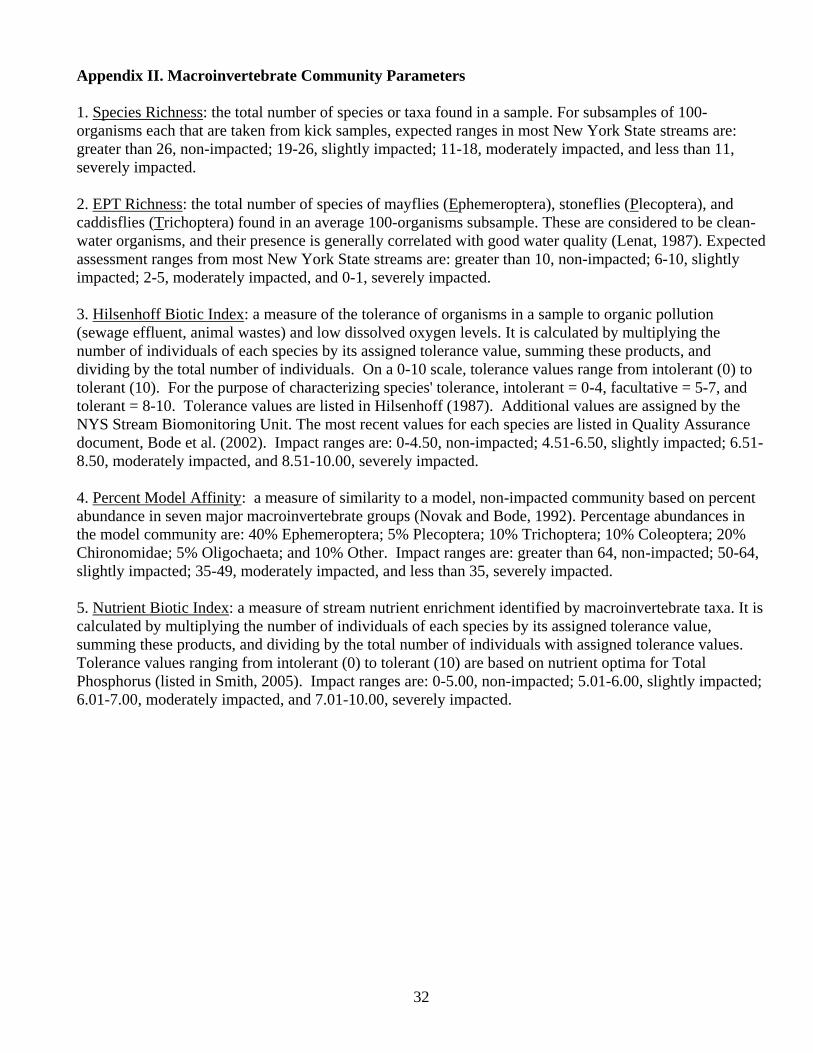
Appendix II. Macroinvertebrate Community Parameters
1. Species Richness: the total number of species or taxa found in a sample. For subsamples of 100-
organisms each that are taken from kick samples, expected ranges in most New York State streams are:
greater than 26, non-impacted; 19-26, slightly impacted; 11-18, moderately impacted, and less than 11,
severely impacted.
2. EPT Richness: the total number of species of mayflies (Ephemeroptera), stoneflies (Plecoptera), and
caddisflies (Trichoptera) found in an average 100-organisms subsample. These are considered to be clean-
water organisms, and their presence is generally correlated with good water quality (Lenat, 1987). Expected
assessment ranges from most New York State streams are: greater than 10, non-impacted; 6-10, slightly
impacted; 2-5, moderately impacted, and 0-1, severely impacted.
3. Hilsenhoff Biotic Index: a measure of the tolerance of organisms in a sample to organic pollution
(sewage effluent, animal wastes) and low dissolved oxygen levels. It is calculated by multiplying the
number of individuals of each species by its assigned tolerance value, summing these products, and
dividing by the total number of individuals. On a 0-10 scale, tolerance values range from intolerant (0) to
tolerant (10). For the purpose of characterizing species' tolerance, intolerant = 0-4, facultative = 5-7, and
tolerant = 8-10. Tolerance values are listed in Hilsenhoff (1987). Additional values are assigned by the
NYS Stream Biomonitoring Unit. The most recent values for each species are listed in Quality Assurance
document, Bode et al. (2002). Impact ranges are: 0-4.50, non-impacted; 4.51-6.50, slightly impacted; 6.51-
8.50, moderately impacted, and 8.51-10.00, severely impacted.
4. Percent Model Affinity: a measure of similarity to a model, non-impacted community based on percent
abundance in seven major macroinvertebrate groups (Novak and Bode, 1992). Percentage abundances in
the model community are: 40% Ephemeroptera; 5% Plecoptera; 10% Trichoptera; 10% Coleoptera; 20%
Chironomidae; 5% Oligochaeta; and 10% Other. Impact ranges are: greater than 64, non-impacted; 50-64,
slightly impacted; 35-49, moderately impacted, and less than 35, severely impacted.
5. Nutrient Biotic Index: a measure of stream nutrient enrichment identified by macroinvertebrate taxa. It is
calculated by multiplying the number of individuals of each species by its assigned tolerance value,
summing these products, and dividing by the total number of individuals with assigned tolerance values.
Tolerance values ranging from intolerant (0) to tolerant (10) are based on nutrient optima for Total
Phosphorus (listed in Smith, 2005). Impact ranges are: 0-5.00, non-impacted; 5.01-6.00, slightly impacted;
6.01-7.00, moderately impacted, and 7.01-10.00, severely impacted.

33
Appendix III. Levels of Water Quality Impact in Streams
The description of overall stream water quality based on biological parameters uses a four-tiered system of
classification. Level of impact is assessed for each individual parameter and then combined for all
parameters to form a consensus determination. Four parameters are used: species richness, EPT richness,
biotic index, and percent model affinity (see Appendix II). The consensus is based on the determination of
the majority of the parameters. Since parameters measure different aspects of the macroinvertebrate
community, they cannot be expected to always form unanimous assessments. The assessment ranges given
for each parameter are based on subsamples of 100-organisms each that are taken from macroinvertebrate
riffle kick samples. These assessments also apply to most multiplate samples, with the exception of percent
model affinity.
1. Non-impacted: Indices reflect very good water quality. The macroinvertebrate community is diverse,
usually with at least 27 species in riffle habitats. Mayflies, stoneflies, and caddisflies are well represented;
EPT richness is greater than 10. The biotic index value is 4.50 or less. Percent model affinity is greater than
64. Nutrient Biotic Index is 5.00 or less. Water quality should not be limiting to fish survival or
propagation. This level of water quality includes both pristine habitats and those receiving discharges
which minimally alter the biota.
2. Slightly impacted: Indices reflect good water quality. The macroinvertebrate community is slightly but
significantly altered from the pristine state. Species richness is usually 19-26. Mayflies and stoneflies may
be restricted, with EPT richness values of 6-10. The biotic index value is 4.51-6.50. Percent model affinity
is 50-64. Nutrient Biotic Index is 5.01-6.00. Water quality is usually not limiting to fish survival, but may
be limiting to fish propagation.
3. Moderately impacted: Indices reflect poor water quality. The macroinvertebrate community is altered to
a large degree from the pristine state. Species richness is usually 11-18 species. Mayflies and stoneflies are
rare or absent, and caddisflies are often restricted; the EPT richness is 2-5. The biotic index value is 6.51-
8.50. Percent model affinity is 35-49. Nutrient Biotic Index is 6.01-7.00. Water quality often is limiting to
fish propagation, but usually not to fish survival.
4. Severely impacted: Indices reflect very poor water quality. The macroinvertebrate community is limited
to a few tolerant species. Species richness is 10 or fewer. Mayflies, stoneflies and caddisflies are rare or
absent; EPT richness is 0-1. The biotic index value is greater than 8.50. Percent model affinity is less than
35. Nutrient Biotic Index is greater than 7.00. The dominant species are almost all tolerant, and are usually
midges and worms. Often, 1-2 species are very abundant. Water quality is often limiting to both fish
propagation and fish survival.
34
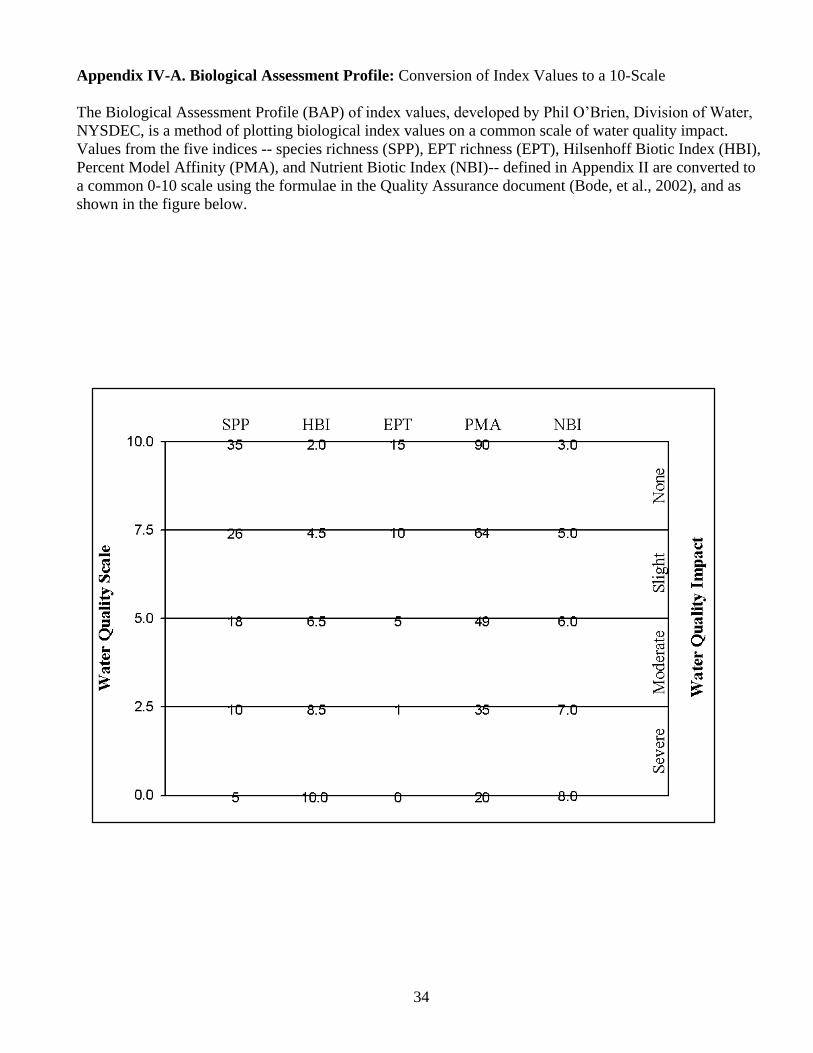
Appendix IV-A. Biological Assessment Profile: Conversion of Index Values to a 10-Scale
The Biological Assessment Profile (BAP) of index values, developed by Phil O’Brien, Division of Water,
NYSDEC, is a method of plotting biological index values on a common scale of water quality impact.
Values from the five indices -- species richness (SPP), EPT richness (EPT), Hilsenhoff Biotic Index (HBI),
Percent Model Affinity (PMA), and Nutrient Biotic Index (NBI)-- defined in Appendix II are converted to
a common 0-10 scale using the formulae in the Quality Assurance document (Bode, et al., 2002), and as
shown in the figure below.
35
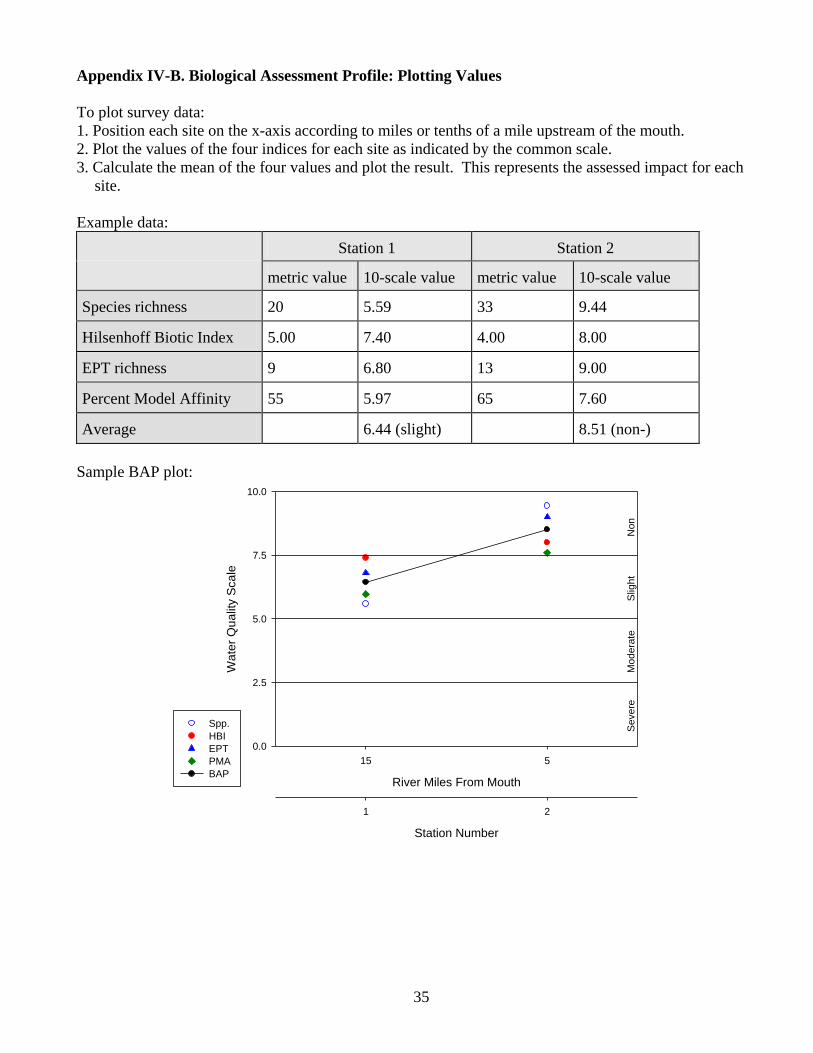
Appendix IV-B. Biological Assessment Profile: Plotting Values
To plot survey data:
1. Position each site on the x-axis according to miles or tenths of a mile upstream of the mouth.
2. Plot the values of the four indices for each site as indicated by the common scale.
3. Calculate the mean of the four values and plot the result. This represents the assessed impact for each
site.
Example data:
Station 1 Station 2
metric value 10-scale value metric value 10-scale value
Species richness 20 5.59 33 9.44
Hilsenhoff Biotic Index 5.00 7.40 4.00 8.00
EPT richness 9 6.80 13 9.00
Percent Model Affinity 55 5.97 65 7.60
Average 6.44 (slight) 8.51 (non-)
Sample BAP plot:
River Miles From Mouth
15 5
Wa
ter
Qu
alit
y S
ca
le
0.0
2.5
5.0
7.5
10.0
Station Number
1 2
Spp.
HBI
EPT
PMA
BAP
Severe
Modera
teS
light
Non
36
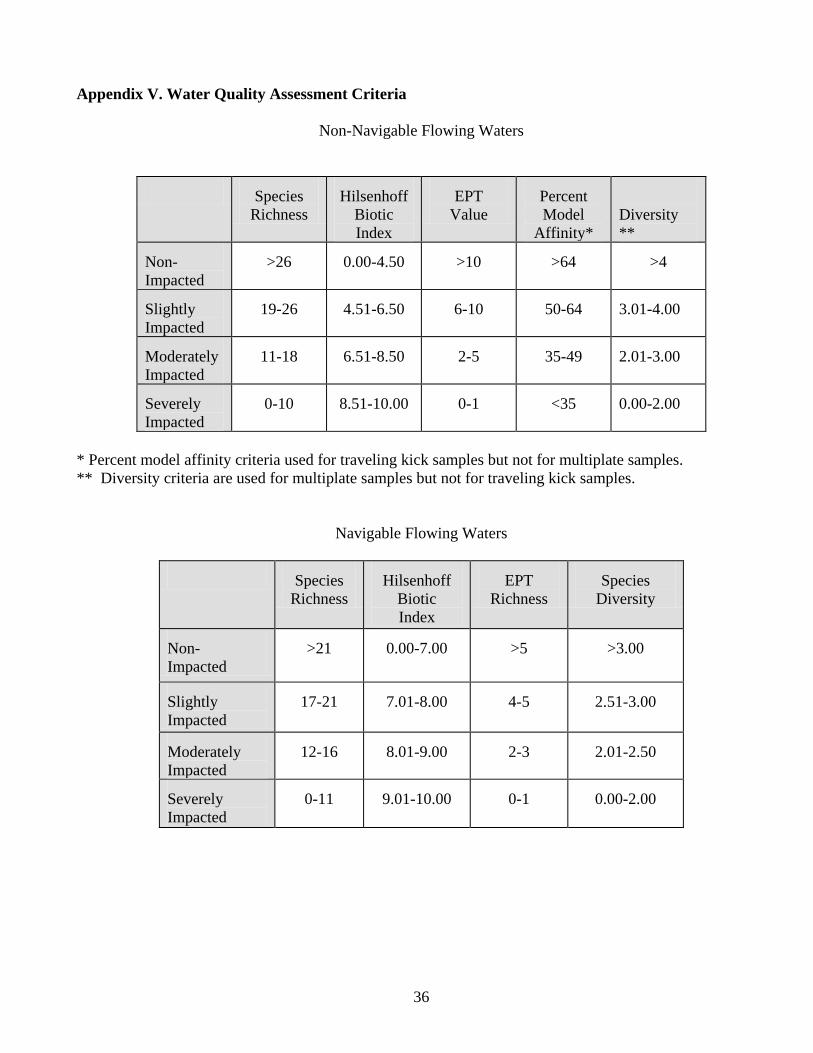
Appendix V. Water Quality Assessment Criteria
Non-Navigable Flowing Waters
Species
Richness
Hilsenhoff
Biotic
Index
EPT
Value
Percent
Model
Affinity*
Diversity
**
Non-
Impacted
>26 0.00-4.50 >10 >64 >4
Slightly
Impacted
19-26 4.51-6.50 6-10 50-64 3.01-4.00
Moderately
Impacted
11-18 6.51-8.50 2-5 35-49 2.01-3.00
Severely
Impacted
0-10 8.51-10.00 0-1 <35 0.00-2.00
* Percent model affinity criteria used for traveling kick samples but not for multiplate samples.
** Diversity criteria are used for multiplate samples but not for traveling kick samples.
Navigable Flowing Waters
Species
Richness
Hilsenhoff
Biotic
Index
EPT
Richness
Species
Diversity
Non-
Impacted
>21 0.00-7.00 >5 >3.00
Slightly
Impacted
17-21 7.01-8.00 4-5 2.51-3.00
Moderately
Impacted
12-16 8.01-9.00 2-3 2.01-2.50
Severely
Impacted
0-11 9.01-10.00 0-1 0.00-2.00
37
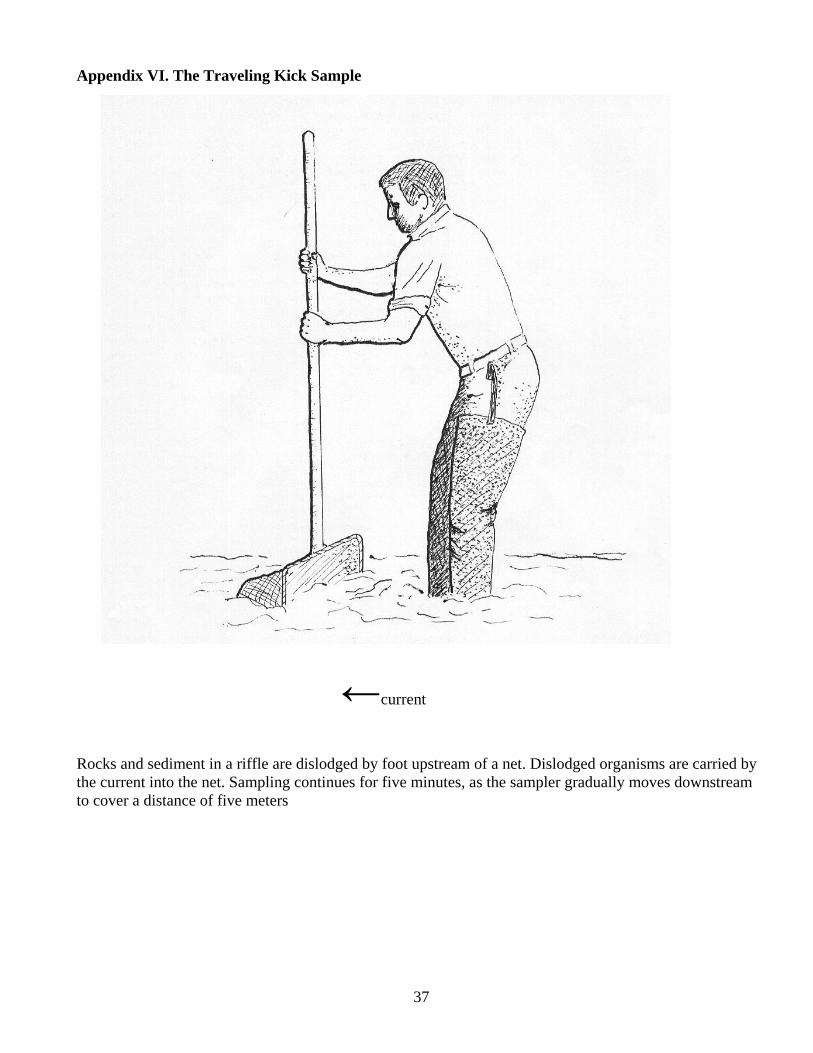
Appendix VI. The Traveling Kick Sample
Rocks and sediment in a riffle are dislodged by foot upstream of a net. Dislodged organisms are carried by
the current into the net. Sampling continues for five minutes, as the sampler gradually moves downstream
to cover a distance of five meters
←current
38
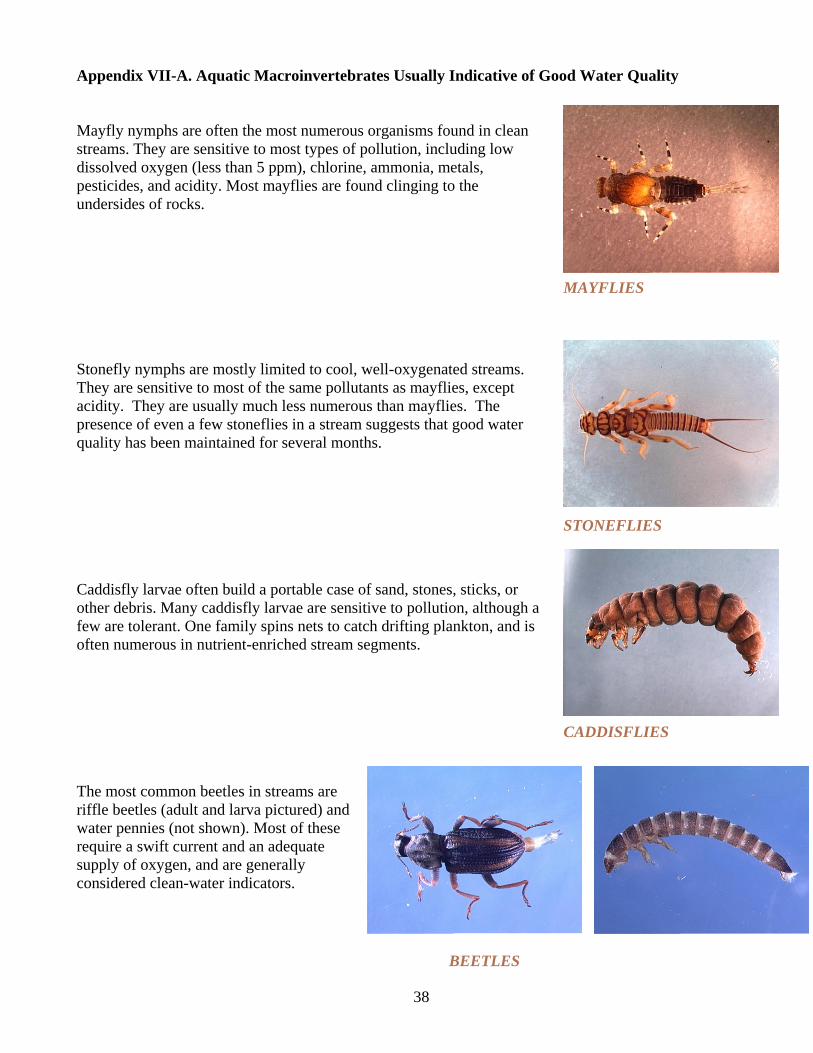
MAYFLIES
STONEFLIES
CADDISFLIES
Appendix VII-A. Aquatic Macroinvertebrates Usually Indicative of Good Water Quality
Mayfly nymphs are often the most numerous organisms found in clean
streams. They are sensitive to most types of pollution, including low
dissolved oxygen (less than 5 ppm), chlorine, ammonia, metals,
pesticides, and acidity. Most mayflies are found clinging to the
undersides of rocks.
Stonefly nymphs are mostly limited to cool, well-oxygenated streams.
They are sensitive to most of the same pollutants as mayflies, except
acidity. They are usually much less numerous than mayflies. The
presence of even a few stoneflies in a stream suggests that good water
quality has been maintained for several months.
Caddisfly larvae often build a portable case of sand, stones, sticks, or
other debris. Many caddisfly larvae are sensitive to pollution, although a
few are tolerant. One family spins nets to catch drifting plankton, and is
often numerous in nutrient-enriched stream segments.
The most common beetles in streams are
riffle beetles (adult and larva pictured) and
water pennies (not shown). Most of these
require a swift current and an adequate
supply of oxygen, and are generally
considered clean-water indicators.
BEETLES
39
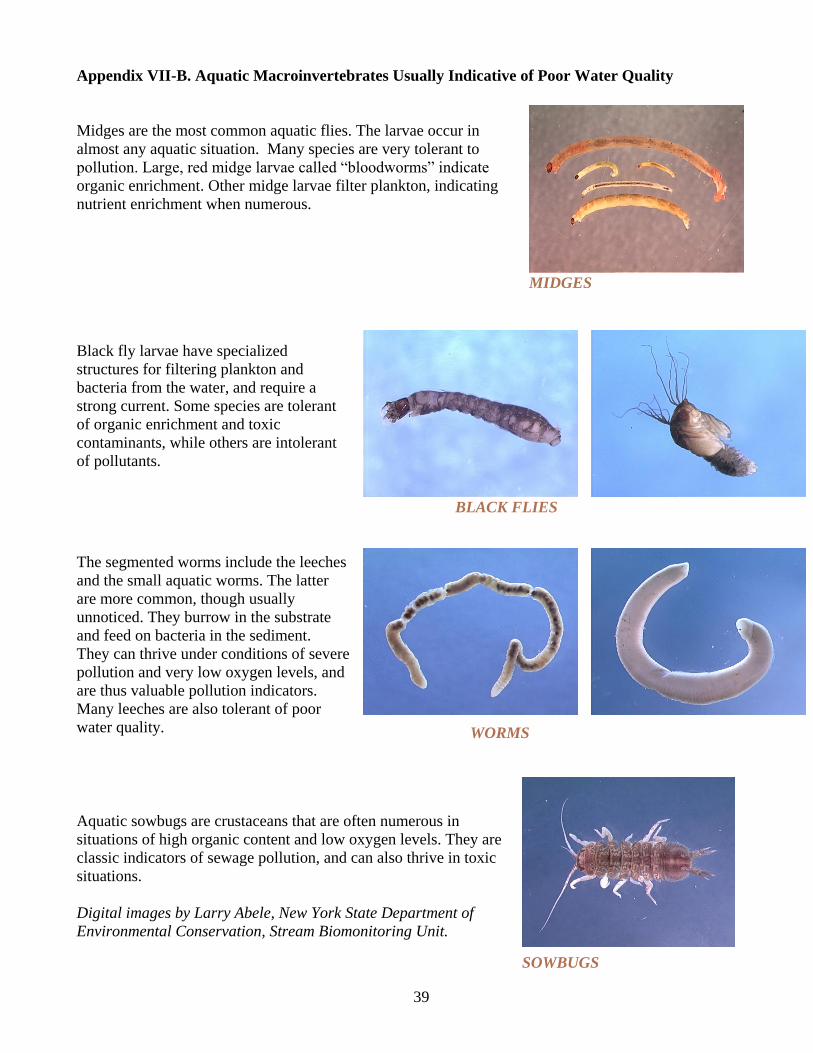
BLACK FLIES
Appendix VII-B. Aquatic Macroinvertebrates Usually Indicative of Poor Water Quality
Midges are the most common aquatic flies. The larvae occur in
almost any aquatic situation. Many species are very tolerant to
pollution. Large, red midge larvae called “bloodworms” indicate
organic enrichment. Other midge larvae filter plankton, indicating
nutrient enrichment when numerous.
Black fly larvae have specialized
structures for filtering plankton and
bacteria from the water, and require a
strong current. Some species are tolerant
of organic enrichment and toxic
contaminants, while others are intolerant
of pollutants.
The segmented worms include the leeches
and the small aquatic worms. The latter
are more common, though usually
unnoticed. They burrow in the substrate
and feed on bacteria in the sediment.
They can thrive under conditions of severe
pollution and very low oxygen levels, and
are thus valuable pollution indicators.
Many leeches are also tolerant of poor
water quality.
Aquatic sowbugs are crustaceans that are often numerous in
situations of high organic content and low oxygen levels. They are
classic indicators of sewage pollution, and can also thrive in toxic
situations.
Digital images by Larry Abele, New York State Department of
Environmental Conservation, Stream Biomonitoring Unit.
MIDGES
WORMS
SOWBUGS
40
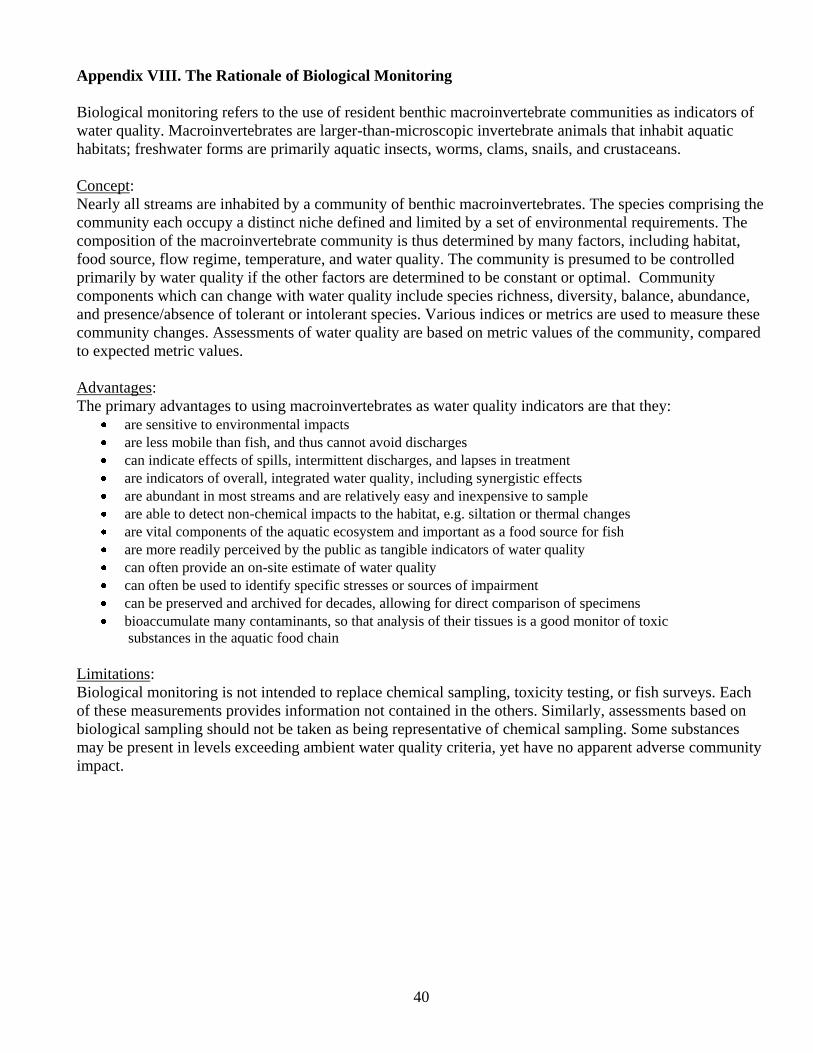
Appendix VIII. The Rationale of Biological Monitoring
Biological monitoring refers to the use of resident benthic macroinvertebrate communities as indicators of
water quality. Macroinvertebrates are larger-than-microscopic invertebrate animals that inhabit aquatic
habitats; freshwater forms are primarily aquatic insects, worms, clams, snails, and crustaceans.
Concept:
Nearly all streams are inhabited by a community of benthic macroinvertebrates. The species comprising the
community each occupy a distinct niche defined and limited by a set of environmental requirements. The
composition of the macroinvertebrate community is thus determined by many factors, including habitat,
food source, flow regime, temperature, and water quality. The community is presumed to be controlled
primarily by water quality if the other factors are determined to be constant or optimal. Community
components which can change with water quality include species richness, diversity, balance, abundance,
and presence/absence of tolerant or intolerant species. Various indices or metrics are used to measure these
community changes. Assessments of water quality are based on metric values of the community, compared
to expected metric values.
Advantages:
The primary advantages to using macroinvertebrates as water quality indicators are that they:
are sensitive to environmental impacts
are less mobile than fish, and thus cannot avoid discharges
can indicate effects of spills, intermittent discharges, and lapses in treatment
are indicators of overall, integrated water quality, including synergistic effects
are abundant in most streams and are relatively easy and inexpensive to sample
are able to detect non-chemical impacts to the habitat, e.g. siltation or thermal changes
are vital components of the aquatic ecosystem and important as a food source for fish
are more readily perceived by the public as tangible indicators of water quality
can often provide an on-site estimate of water quality
can often be used to identify specific stresses or sources of impairment
can be preserved and archived for decades, allowing for direct comparison of specimens
bioaccumulate many contaminants, so that analysis of their tissues is a good monitor of toxic
substances in the aquatic food chain
Limitations:
Biological monitoring is not intended to replace chemical sampling, toxicity testing, or fish surveys. Each
of these measurements provides information not contained in the others. Similarly, assessments based on
biological sampling should not be taken as being representative of chemical sampling. Some substances
may be present in levels exceeding ambient water quality criteria, yet have no apparent adverse community
impact.
41
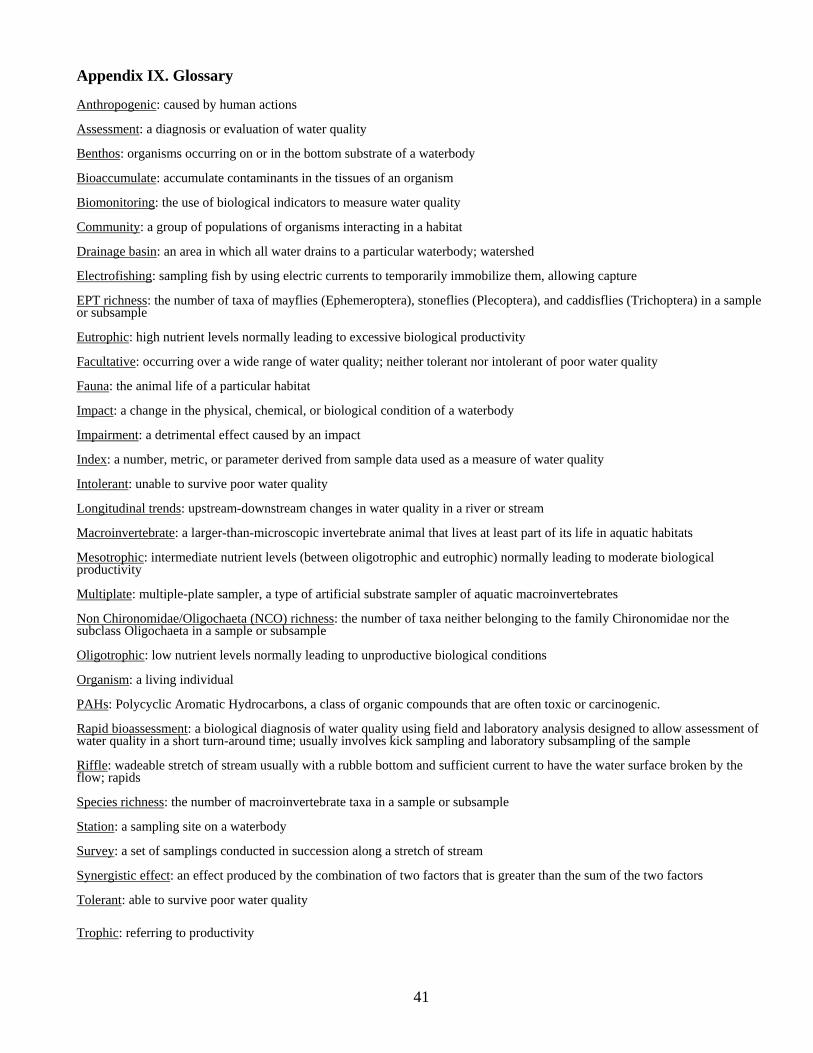
Appendix IX. Glossary Anthropogenic: caused by human actions Assessment: a diagnosis or evaluation of water quality Benthos: organisms occurring on or in the bottom substrate of a waterbody Bioaccumulate: accumulate contaminants in the tissues of an organism Biomonitoring: the use of biological indicators to measure water quality Community: a group of populations of organisms interacting in a habitat Drainage basin: an area in which all water drains to a particular waterbody; watershed Electrofishing: sampling fish by using electric currents to temporarily immobilize them, allowing capture EPT richness: the number of taxa of mayflies (Ephemeroptera), stoneflies (Plecoptera), and caddisflies (Trichoptera) in a sample or subsample Eutrophic: high nutrient levels normally leading to excessive biological productivity Facultative: occurring over a wide range of water quality; neither tolerant nor intolerant of poor water quality Fauna: the animal life of a particular habitat Impact: a change in the physical, chemical, or biological condition of a waterbody Impairment: a detrimental effect caused by an impact Index: a number, metric, or parameter derived from sample data used as a measure of water quality Intolerant: unable to survive poor water quality Longitudinal trends: upstream-downstream changes in water quality in a river or stream Macroinvertebrate: a larger-than-microscopic invertebrate animal that lives at least part of its life in aquatic habitats Mesotrophic: intermediate nutrient levels (between oligotrophic and eutrophic) normally leading to moderate biological productivity Multiplate: multiple-plate sampler, a type of artificial substrate sampler of aquatic macroinvertebrates Non Chironomidae/Oligochaeta (NCO) richness: the number of taxa neither belonging to the family Chironomidae nor the subclass Oligochaeta in a sample or subsample Oligotrophic: low nutrient levels normally leading to unproductive biological conditions Organism: a living individual PAHs: Polycyclic Aromatic Hydrocarbons, a class of organic compounds that are often toxic or carcinogenic. Rapid bioassessment: a biological diagnosis of water quality using field and laboratory analysis designed to allow assessment of water quality in a short turn-around time; usually involves kick sampling and laboratory subsampling of the sample Riffle: wadeable stretch of stream usually with a rubble bottom and sufficient current to have the water surface broken by the flow; rapids Species richness: the number of macroinvertebrate taxa in a sample or subsample Station: a sampling site on a waterbody Survey: a set of samplings conducted in succession along a stretch of stream Synergistic effect: an effect produced by the combination of two factors that is greater than the sum of the two factors Tolerant: able to survive poor water quality
Trophic: referring to productivity
42
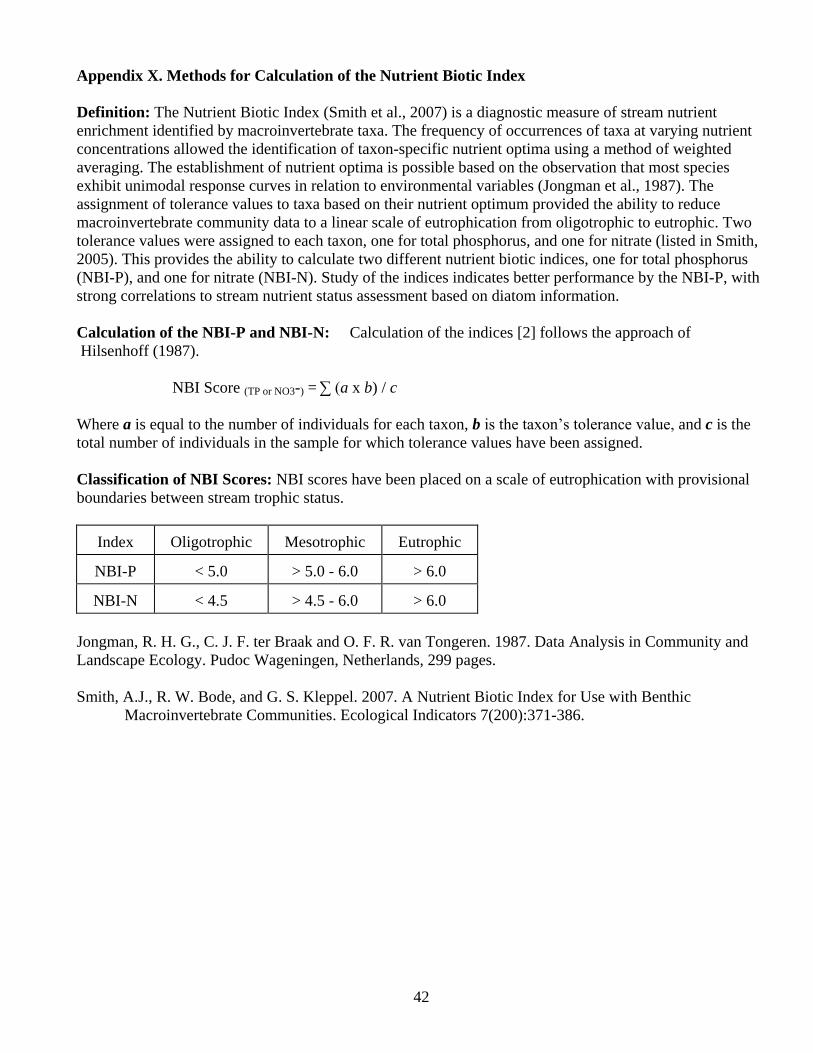
Appendix X. Methods for Calculation of the Nutrient Biotic Index
Definition: The Nutrient Biotic Index (Smith et al., 2007) is a diagnostic measure of stream nutrient
enrichment identified by macroinvertebrate taxa. The frequency of occurrences of taxa at varying nutrient
concentrations allowed the identification of taxon-specific nutrient optima using a method of weighted
averaging. The establishment of nutrient optima is possible based on the observation that most species
exhibit unimodal response curves in relation to environmental variables (Jongman et al., 1987). The
assignment of tolerance values to taxa based on their nutrient optimum provided the ability to reduce
macroinvertebrate community data to a linear scale of eutrophication from oligotrophic to eutrophic. Two
tolerance values were assigned to each taxon, one for total phosphorus, and one for nitrate (listed in Smith,
2005). This provides the ability to calculate two different nutrient biotic indices, one for total phosphorus
(NBI-P), and one for nitrate (NBI-N). Study of the indices indicates better performance by the NBI-P, with
strong correlations to stream nutrient status assessment based on diatom information.
Calculation of the NBI-P and NBI-N: Calculation of the indices [2] follows the approach of
Hilsenhoff (1987).
NBI Score (TP or NO3-) = ∑ (a x b) / c
Where a is equal to the number of individuals for each taxon, b is the taxon’s tolerance value, and c is the
total number of individuals in the sample for which tolerance values have been assigned.
Classification of NBI Scores: NBI scores have been placed on a scale of eutrophication with provisional
boundaries between stream trophic status.
Index Oligotrophic Mesotrophic Eutrophic
NBI-P < 5.0 > 5.0 - 6.0 > 6.0
NBI-N < 4.5 > 4.5 - 6.0 > 6.0
Jongman, R. H. G., C. J. F. ter Braak and O. F. R. van Tongeren. 1987. Data Analysis in Community and
Landscape Ecology. Pudoc Wageningen, Netherlands, 299 pages.
Smith, A.J., R. W. Bode, and G. S. Kleppel. 2007. A Nutrient Biotic Index for Use with Benthic
Macroinvertebrate Communities. Ecological Indicators 7(200):371-386.
43
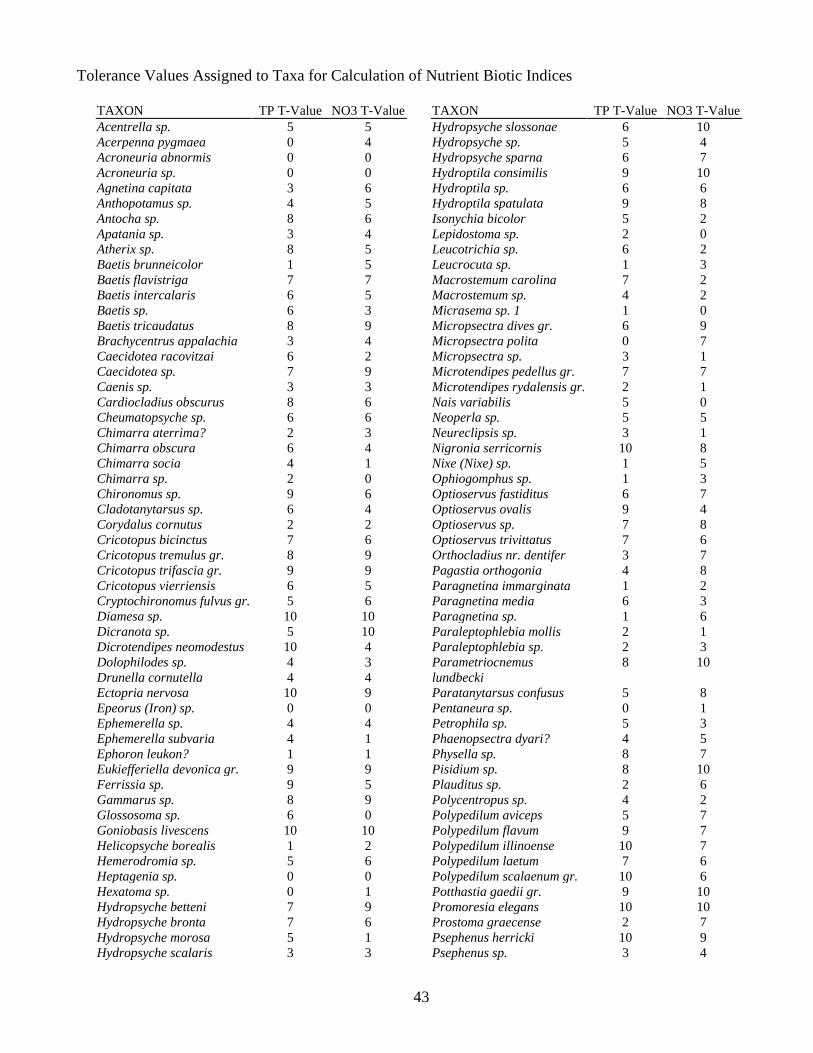
Tolerance Values Assigned to Taxa for Calculation of Nutrient Biotic Indices
TAXON TP T-Value NO3 T-Value
Acentrella sp. 5 5
Acerpenna pygmaea 0 4
Acroneuria abnormis 0 0
Acroneuria sp. 0 0
Agnetina capitata 3 6
Anthopotamus sp. 4 5
Antocha sp. 8 6
Apatania sp. 3 4
Atherix sp. 8 5
Baetis brunneicolor 1 5
Baetis flavistriga 7 7
Baetis intercalaris 6 5
Baetis sp. 6 3
Baetis tricaudatus 8 9
Brachycentrus appalachia 3 4
Caecidotea racovitzai 6 2
Caecidotea sp. 7 9
Caenis sp. 3 3
Cardiocladius obscurus 8 6
Cheumatopsyche sp. 6 6
Chimarra aterrima? 2 3
Chimarra obscura 6 4
Chimarra socia 4 1
Chimarra sp. 2 0
Chironomus sp. 9 6
Cladotanytarsus sp. 6 4
Corydalus cornutus 2 2
Cricotopus bicinctus 7 6
Cricotopus tremulus gr. 8 9
Cricotopus trifascia gr. 9 9
Cricotopus vierriensis 6 5
Cryptochironomus fulvus gr. 5 6
Diamesa sp. 10 10
Dicranota sp. 5 10
Dicrotendipes neomodestus 10 4
Dolophilodes sp. 4 3
Drunella cornutella 4 4
Ectopria nervosa 10 9
Epeorus (Iron) sp. 0 0
Ephemerella sp. 4 4
Ephemerella subvaria 4 1
Ephoron leukon? 1 1
Eukiefferiella devonica gr. 9 9
Ferrissia sp. 9 5
Gammarus sp. 8 9
Glossosoma sp. 6 0
Goniobasis livescens 10 10
Helicopsyche borealis 1 2
Hemerodromia sp. 5 6
Heptagenia sp. 0 0
Hexatoma sp. 0 1
Hydropsyche betteni 7 9
Hydropsyche bronta 7 6
Hydropsyche morosa 5 1
Hydropsyche scalaris 3 3
TAXON TP T-Value NO3 T-Value
Hydropsyche slossonae 6 10
Hydropsyche sp. 5 4
Hydropsyche sparna 6 7
Hydroptila consimilis 9 10
Hydroptila sp. 6 6
Hydroptila spatulata 9 8
Isonychia bicolor 5 2
Lepidostoma sp. 2 0
Leucotrichia sp. 6 2
Leucrocuta sp. 1 3
Macrostemum carolina 7 2
Macrostemum sp. 4 2
Micrasema sp. 1 1 0
Micropsectra dives gr. 6 9
Micropsectra polita 0 7
Micropsectra sp. 3 1
Microtendipes pedellus gr. 7 7
Microtendipes rydalensis gr. 2 1
Nais variabilis 5 0
Neoperla sp. 5 5
Neureclipsis sp. 3 1
Nigronia serricornis 10 8
Nixe (Nixe) sp. 1 5
Ophiogomphus sp. 1 3
Optioservus fastiditus 6 7
Optioservus ovalis 9 4
Optioservus sp. 7 8
Optioservus trivittatus 7 6
Orthocladius nr. dentifer 3 7
Pagastia orthogonia 4 8
Paragnetina immarginata 1 2
Paragnetina media 6 3
Paragnetina sp. 1 6
Paraleptophlebia mollis 2 1
Paraleptophlebia sp. 2 3
Parametriocnemus
lundbecki
8 10
Paratanytarsus confusus 5 8
Pentaneura sp. 0 1
Petrophila sp. 5 3
Phaenopsectra dyari? 4 5
Physella sp. 8 7
Pisidium sp. 8 10
Plauditus sp. 2 6
Polycentropus sp. 4 2
Polypedilum aviceps 5 7
Polypedilum flavum 9 7
Polypedilum illinoense 10 7
Polypedilum laetum 7 6
Polypedilum scalaenum gr. 10 6
Potthastia gaedii gr. 9 10
Promoresia elegans 10 10
Prostoma graecense 2 7
Psephenus herricki 10 9
Psephenus sp. 3 4
44
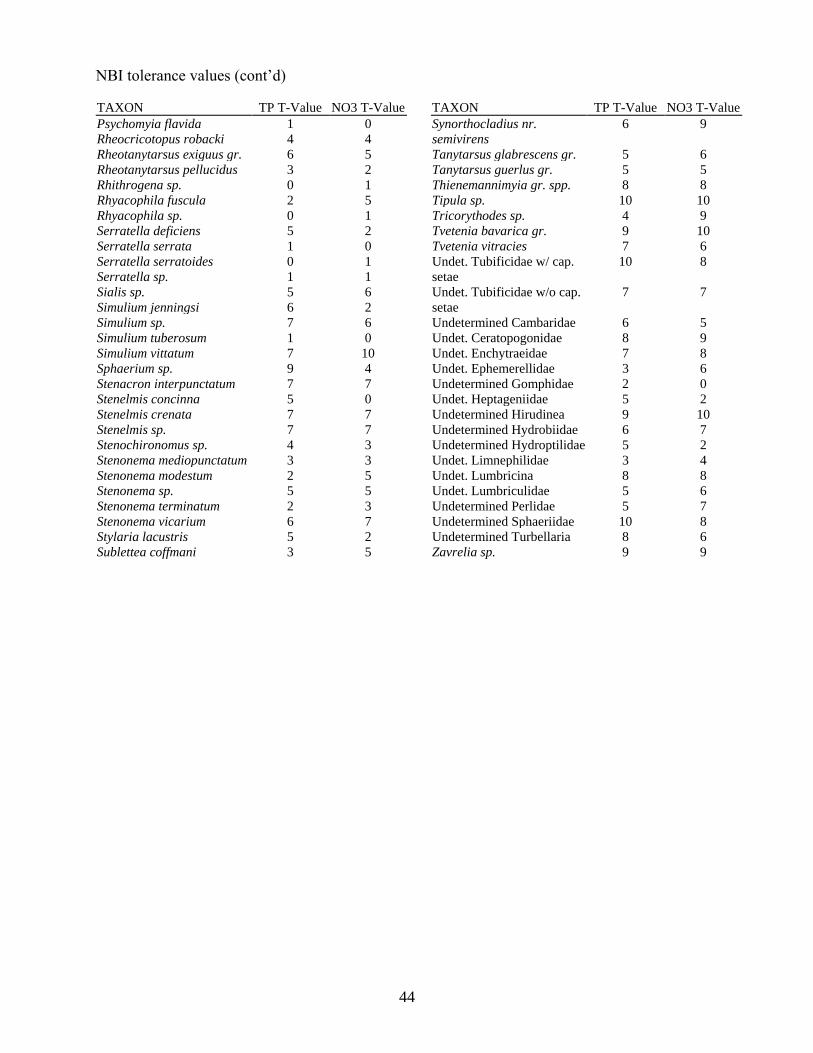
NBI tolerance values (cont’d)
TAXON TP T-Value NO3 T-Value
Psychomyia flavida 1 0
Rheocricotopus robacki 4 4
Rheotanytarsus exiguus gr. 6 5
Rheotanytarsus pellucidus 3 2
Rhithrogena sp. 0 1
Rhyacophila fuscula 2 5
Rhyacophila sp. 0 1
Serratella deficiens 5 2
Serratella serrata 1 0
Serratella serratoides 0 1
Serratella sp. 1 1
Sialis sp. 5 6
Simulium jenningsi 6 2
Simulium sp. 7 6
Simulium tuberosum 1 0
Simulium vittatum 7 10
Sphaerium sp. 9 4
Stenacron interpunctatum 7 7
Stenelmis concinna 5 0
Stenelmis crenata 7 7
Stenelmis sp. 7 7
Stenochironomus sp. 4 3
Stenonema mediopunctatum 3 3
Stenonema modestum 2 5
Stenonema sp. 5 5
Stenonema terminatum 2 3
Stenonema vicarium 6 7
Stylaria lacustris 5 2
Sublettea coffmani 3 5
TAXON TP T-Value NO3 T-Value
Synorthocladius nr.
semivirens
6 9
Tanytarsus glabrescens gr. 5 6
Tanytarsus guerlus gr. 5 5
Thienemannimyia gr. spp. 8 8
Tipula sp. 10 10
Tricorythodes sp. 4 9
Tvetenia bavarica gr. 9 10
Tvetenia vitracies 7 6
Undet. Tubificidae w/ cap.
setae
10 8
Undet. Tubificidae w/o cap.
setae
7 7
Undetermined Cambaridae 6 5
Undet. Ceratopogonidae 8 9
Undet. Enchytraeidae 7 8
Undet. Ephemerellidae 3 6
Undetermined Gomphidae 2 0
Undet. Heptageniidae 5 2
Undetermined Hirudinea 9 10
Undetermined Hydrobiidae 6 7
Undetermined Hydroptilidae 5 2
Undet. Limnephilidae 3 4
Undet. Lumbricina 8 8
Undet. Lumbriculidae 5 6
Undetermined Perlidae 5 7
Undetermined Sphaeriidae 10 8
Undetermined Turbellaria 8 6
Zavrelia sp. 9 9

45
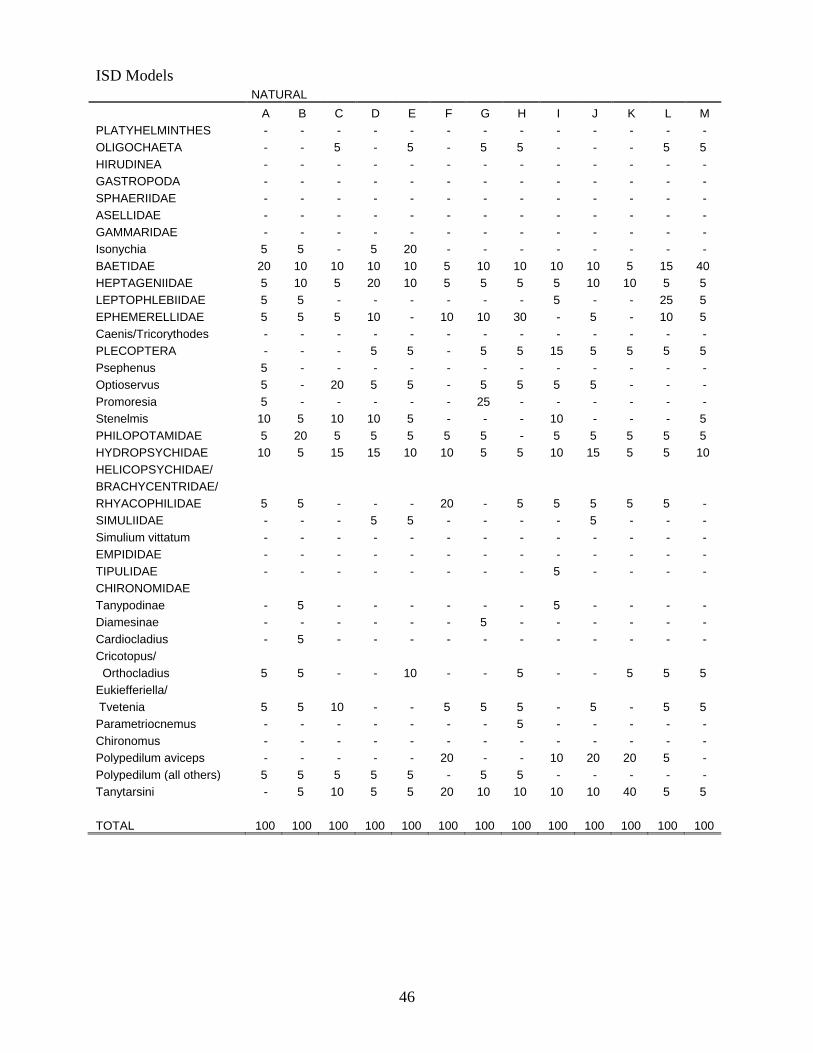
Appendix XI. Impact Source Determination Methods and Community Models
Definition: Impact Source Determination (ISD) is the procedure for identifying types of impacts
that exert deleterious effects on a waterbody. While the analysis of benthic macroinvertebrate
communities has been shown to be an effective means of determining severity of water quality
impacts, it has been less effective in determining what kind of pollution is causing the impact.
ISD uses community types or models to ascertain the primary factor influencing the fauna.
Development of methods: The method found to be most useful in differentiating impacts in New
York State streams was the use of community types based on composition by family and genus.
It may be seen as an elaboration of Percent Model Affinity (Novak and Bode, 1992), which is
based on class and order. A large database of macroinvertebrate data was required to develop
ISD methods. The database included several sites known or presumed to be impacted by specific
impact types. The impact types were mostly known by chemical data or land use. These sites
were grouped into the following general categories: agricultural nonpoint, toxic-stressed, sewage
(domestic municipal), sewage/toxic, siltation, impoundment, and natural. Each group initially
contained 20 sites.Cluster analysis was then performed within each group, using percent
similarity at the family or genus level. Within each group, four clusters were identified. Each
cluster was usually composed of 4-5 sites with high biological similarity. From each cluster, a
hypothetical model was then formed to represent a model cluster community type; sites within
the cluster had at least 50 percent similarity to this model. These community type models formed
the basis for ISD (see tables following). The method was tested by calculating percent similarity
to all the models and determining which model was the most similar to the test site. Some
models were initially adjusted to achieve maximum representation of the impact type. New
models are developed when similar communities are recognized from several streams.
Use of the ISD methods: Impact Source Determination is based on similarity to existing models
of community types (see tables following). The model that exhibits the highest similarity to the
test data denotes the likely impact source type, or may indicate "natural," lacking an impact. In
the graphic representation of ISD, only the highest similarity of each source type is identified. If
no model exhibits a similarity to the test data of greater than 50 percent, the determination is
inconclusive. The determination of impact source type is used in conjunction with assessment of
severity of water quality impact to provide an overall assessment of water quality.
Limitations: These methods were developed for data derived from subsamples of 100-organisms
each that are taken from traveling kick samples of New York State streams. Application of these
methods for data derived from other sampling methods, habitats, or geographical areas would
likely require modification of the models.
46
ISD Models NATURAL
A B C D E F G H I J K L M
PLATYHELMINTHES - - - - - - - - - - - - -
OLIGOCHAETA - - 5 - 5 - 5 5 - - - 5 5
HIRUDINEA - - - - - - - - - - - - -
GASTROPODA - - - - - - - - - - - - -
SPHAERIIDAE - - - - - - - - - - - - -
ASELLIDAE - - - - - - - - - - - - -
GAMMARIDAE - - - - - - - - - - - - -
Isonychia 5 5 - 5 20 - - - - - - - -
BAETIDAE 20 10 10 10 10 5 10 10 10 10 5 15 40
HEPTAGENIIDAE 5 10 5 20 10 5 5 5 5 10 10 5 5
LEPTOPHLEBIIDAE 5 5 - - - - - - 5 - - 25 5
EPHEMERELLIDAE 5 5 5 10 - 10 10 30 - 5 - 10 5
Caenis/Tricorythodes - - - - - - - - - - - - -
PLECOPTERA - - - 5 5 - 5 5 15 5 5 5 5
Psephenus 5 - - - - - - - - - - - -
Optioservus 5 - 20 5 5 - 5 5 5 5 - - -
Promoresia 5 - - - - - 25 - - - - - -
Stenelmis 10 5 10 10 5 - - - 10 - - - 5
PHILOPOTAMIDAE 5 20 5 5 5 5 5 - 5 5 5 5 5
HYDROPSYCHIDAE 10 5 15 15 10 10 5 5 10 15 5 5 10
HELICOPSYCHIDAE/
BRACHYCENTRIDAE/
RHYACOPHILIDAE 5 5 - - - 20 - 5 5 5 5 5 -
SIMULIIDAE - - - 5 5 - - - - 5 - - -
Simulium vittatum - - - - - - - - - - - - -
EMPIDIDAE - - - - - - - - - - - - -
TIPULIDAE - - - - - - - - 5 - - - -
CHIRONOMIDAE
Tanypodinae - 5 - - - - - - 5 - - - -
Diamesinae - - - - - - 5 - - - - - -
Cardiocladius - 5 - - - - - - - - - - -
Cricotopus/
Orthocladius 5 5 - - 10 - - 5 - - 5 5 5
Eukiefferiella/
Tvetenia 5 5 10 - - 5 5 5 - 5 - 5 5
Parametriocnemus - - - - - - - 5 - - - - -
Chironomus - - - - - - - - - - - - -
Polypedilum aviceps - - - - - 20 - - 10 20 20 5 -
Polypedilum (all others) 5 5 5 5 5 - 5 5 - - - - -
Tanytarsini - 5 10 5 5 20 10 10 10 10 40 5 5
TOTAL 100 100 100 100 100 100 100 100 100 100 100 100 100
47
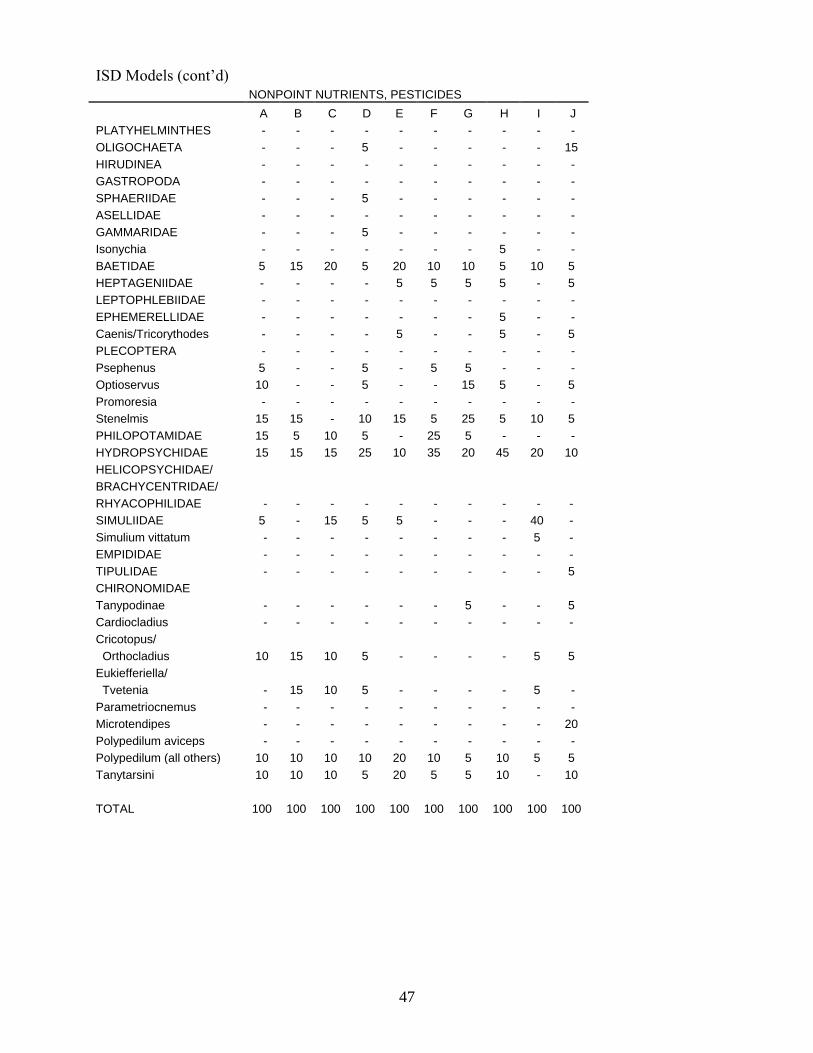
ISD Models (cont’d) NONPOINT NUTRIENTS, PESTICIDES
A B C D E F G H I J
PLATYHELMINTHES - - - - - - - - - -
OLIGOCHAETA - - - 5 - - - - - 15
HIRUDINEA - - - - - - - - - -
GASTROPODA - - - - - - - - - -
SPHAERIIDAE - - - 5 - - - - - -
ASELLIDAE - - - - - - - - - -
GAMMARIDAE - - - 5 - - - - - -
Isonychia - - - - - - - 5 - -
BAETIDAE 5 15 20 5 20 10 10 5 10 5
HEPTAGENIIDAE - - - - 5 5 5 5 - 5
LEPTOPHLEBIIDAE - - - - - - - - - -
EPHEMERELLIDAE - - - - - - - 5 - -
Caenis/Tricorythodes - - - - 5 - - 5 - 5
PLECOPTERA - - - - - - - - - -
Psephenus 5 - - 5 - 5 5 - - -
Optioservus 10 - - 5 - - 15 5 - 5
Promoresia - - - - - - - - - -
Stenelmis 15 15 - 10 15 5 25 5 10 5
PHILOPOTAMIDAE 15 5 10 5 - 25 5 - - -
HYDROPSYCHIDAE 15 15 15 25 10 35 20 45 20 10
HELICOPSYCHIDAE/
BRACHYCENTRIDAE/
RHYACOPHILIDAE - - - - - - - - - -
SIMULIIDAE 5 - 15 5 5 - - - 40 -
Simulium vittatum - - - - - - - - 5 -
EMPIDIDAE - - - - - - - - - -
TIPULIDAE - - - - - - - - - 5
CHIRONOMIDAE
Tanypodinae - - - - - - 5 - - 5
Cardiocladius - - - - - - - - - -
Cricotopus/
Orthocladius 10 15 10 5 - - - - 5 5
Eukiefferiella/
Tvetenia - 15 10 5 - - - - 5 -
Parametriocnemus - - - - - - - - - -
Microtendipes - - - - - - - - - 20
Polypedilum aviceps - - - - - - - - - -
Polypedilum (all others) 10 10 10 10 20 10 5 10 5 5
Tanytarsini 10 10 10 5 20 5 5 10 - 10
TOTAL 100 100 100 100 100 100 100 100 100 100

48
ISD Models (cont’d) MUNICIPAL/INDUSTRIAL TOXIC
A B C D E F G H A B C D E F
PLATYHELMINTHES - 40 - - - 5 - - - - - - 5 -
OLIGOCHAETA 20 20 70 10 - 20 - - - 10 20 5 5 15
HIRUDINEA - 5 - - - - - - - - - - - -
GASTROPODA - - - - - 5 - - - 5 - - - 5
SPHAERIIDAE - 5 - - - - - - - - - - - -
ASELLIDAE 10 5 10 10 15 5 - - 10 10 - 20 10 5
GAMMARIDAE 40 - - - 15 - 5 5 5 - - - 5 5
Isonychia - - - - - - - - - - - - - -
BAETIDAE 5 - - - 5 - 10 10 15 10 20 - - 5
HEPTAGENIIDAE 5 - - - - - - - - - - - - -
LEPTOPHLEBIIDAE - - - - - - - - - - - - - -
EPHEMERELLIDAE - - - - - - - - - - - - - -
Caenis/Tricorythodes - - - - - - - - - - - - - -
PLECOPTERA - - - - - - - - - - - - - -
Psephenus - - - - - - - - - - - - - -
Optioservus - - - - - - - - - - - - - -
Promoresia - - - - - - - - - - - - - -
Stenelmis 5 - - 10 5 - 5 5 10 15 - 40 35 5
PHILOPOTAMIDAE - - - - - - - 40 10 - - - - -
HYDROPSYCHIDAE 10 - - 50 20 - 40 20 20 10 15 10 35 10
HELICOPSYCHIDAE/
BRACHYCENTRIDAE/
RHYACOPHILIDAE - - - - - - - - - - - - - -
SIMULIIDAE - - - - - - - - - - - - - -
Simulium vittatum - - - - - - 20 10 - 20 - - - 5
EMPIDIDAE - 5 - - - - - - - - - - - -
CHIRONOMIDAE
Tanypodinae - 10 - - 5 15 - - 5 10 - - - 25
Cardiocladius - - - - - - - - - - - - - -
Cricotopus/
Orthocladius 5 10 20 - 5 10 5 5 15 10 25 10 5 10
Eukiefferiella/
Tvetenia - - - - - - - - - - 20 10 - -
Parametriocnemus - - - - - - - - - - - 5 - -
Chironomus - - - - - - - - - - - - - -
Polypedilum aviceps - - - - - - - - - - - - - -
Polypedilum (all others) - - - 10 20 40 10 5 10 - - - - 5
Tanytarsini - - - 10 10 - 5 - - - - - - 5
TOTAL 100 100 100 100 100 100 100 100 100 100 100 100 100 100
49
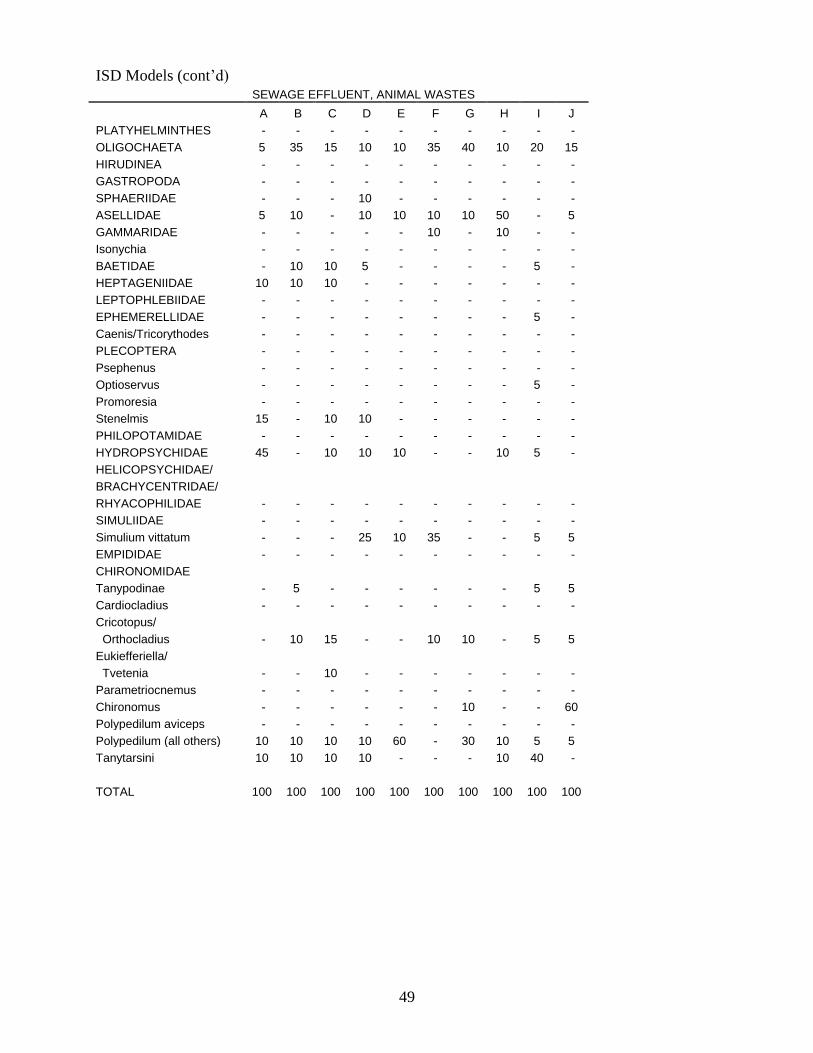
ISD Models (cont’d) SEWAGE EFFLUENT, ANIMAL WASTES
A B C D E F G H I J
PLATYHELMINTHES - - - - - - - - - -
OLIGOCHAETA 5 35 15 10 10 35 40 10 20 15
HIRUDINEA - - - - - - - - - -
GASTROPODA - - - - - - - - - -
SPHAERIIDAE - - - 10 - - - - - -
ASELLIDAE 5 10 - 10 10 10 10 50 - 5
GAMMARIDAE - - - - - 10 - 10 - -
Isonychia - - - - - - - - - -
BAETIDAE - 10 10 5 - - - - 5 -
HEPTAGENIIDAE 10 10 10 - - - - - - -
LEPTOPHLEBIIDAE - - - - - - - - - -
EPHEMERELLIDAE - - - - - - - - 5 -
Caenis/Tricorythodes - - - - - - - - - -
PLECOPTERA - - - - - - - - - -
Psephenus - - - - - - - - - -
Optioservus - - - - - - - - 5 -
Promoresia - - - - - - - - - -
Stenelmis 15 - 10 10 - - - - - -
PHILOPOTAMIDAE - - - - - - - - - -
HYDROPSYCHIDAE 45 - 10 10 10 - - 10 5 -
HELICOPSYCHIDAE/
BRACHYCENTRIDAE/
RHYACOPHILIDAE - - - - - - - - - -
SIMULIIDAE - - - - - - - - - -
Simulium vittatum - - - 25 10 35 - - 5 5
EMPIDIDAE - - - - - - - - - -
CHIRONOMIDAE
Tanypodinae - 5 - - - - - - 5 5
Cardiocladius - - - - - - - - - -
Cricotopus/
Orthocladius - 10 15 - - 10 10 - 5 5
Eukiefferiella/
Tvetenia - - 10 - - - - - - -
Parametriocnemus - - - - - - - - - -
Chironomus - - - - - - 10 - - 60
Polypedilum aviceps - - - - - - - - - -
Polypedilum (all others) 10 10 10 10 60 - 30 10 5 5
Tanytarsini 10 10 10 10 - - - 10 40 -
TOTAL 100 100 100 100 100 100 100 100 100 100

50
ISD Models (cont’d) SILTATION IMPOUNDMENT
A B C D E A B C D E F G H I J
PLATYHELMINTHES - - - - - - 10 - 10 - 5 - 50 10 -
OLIGOCHAETA 5 - 20 10 5 5 - 40 5 10 5 10 5 5 -
HIRUDINEA - - - - - - - - - 5 - - - - -
GASTROPODA - - - - - - - 10 - 5 5 - - - -
SPHAERIIDAE - - - 5 - - - - - - - - 5 25 -
ASELLIDAE - - - - - - 5 5 - 10 5 5 5 - -
GAMMARIDAE - - - 10 - - - 10 - 10 50 - 5 10 -
Isonychia - - - - - - - - - - - - - - -
BAETIDAE - 10 20 5 - - 5 - 5 - - 5 - - 5
HEPTAGENIIDAE 5 10 - 20 5 5 5 - 5 5 5 5 - 5 5
LEPTOPHLEBIIDAE - - - - - - - - - - - - - - -
EPHEMERELLIDAE - - - - - - - - - - - - - - -
Caenis/Tricorythodes 5 20 10 5 15 - - - - - - - - - -
PLECOPTERA - - - - - - - - - - - - - - -
Psephenus - - - - - - - - - - - - - - 5
Optioservus 5 10 - - - - - - - - - - - 5 -
Promoresia - - - - - - - - - - - - - - -
Stenelmis 5 10 10 5 20 5 5 10 10 - 5 35 - 5 10
PHILOPOTAMIDAE - - - - - 5 - - 5 - - - - - 30
HYDROPSYCHIDAE 25 10 - 20 30 50 15 10 10 10 10 20 5 15 20
HELICOPSYCHIDAE/
BRACHYCENTRIDAE/
RHYACOPHILIDAE - - - - - - - - - - - - - 5 -
SIMULIIDAE 5 10 - - 5 5 - 5 - 35 10 5 - - 15
EMPIDIDAE - - - - - - - - - - - - - - -
CHIRONOMIDAE
Tanypodinae - - - - - - 5 - - - - - - - -
Cardiocladius - - - - - - - - - - - - - - -
Cricotopus/
Orthocladius 25 - 10 5 5 5 25 5 - 10 - 5 10 - -
Eukiefferiella/
Tvetenia - - 10 - 5 5 15 - - - - - - - -
Parametriocnemus - - - - - 5 - - - - - - - - -
Chironomus - - - - - - - - - - - - - - -
Polypedilum aviceps - - - - - - - - - - - - - - - Polypedilum (all others) 10 10 10 5 5 5 - - 20 - - 5 5 5 5
Tanytarsini 10 10 10 10 5 5 10 5 30 - - 5 10 10 5
TOTAL 100 100 100 100 100 100 100 100 100 100 100 100 100 100 100
51
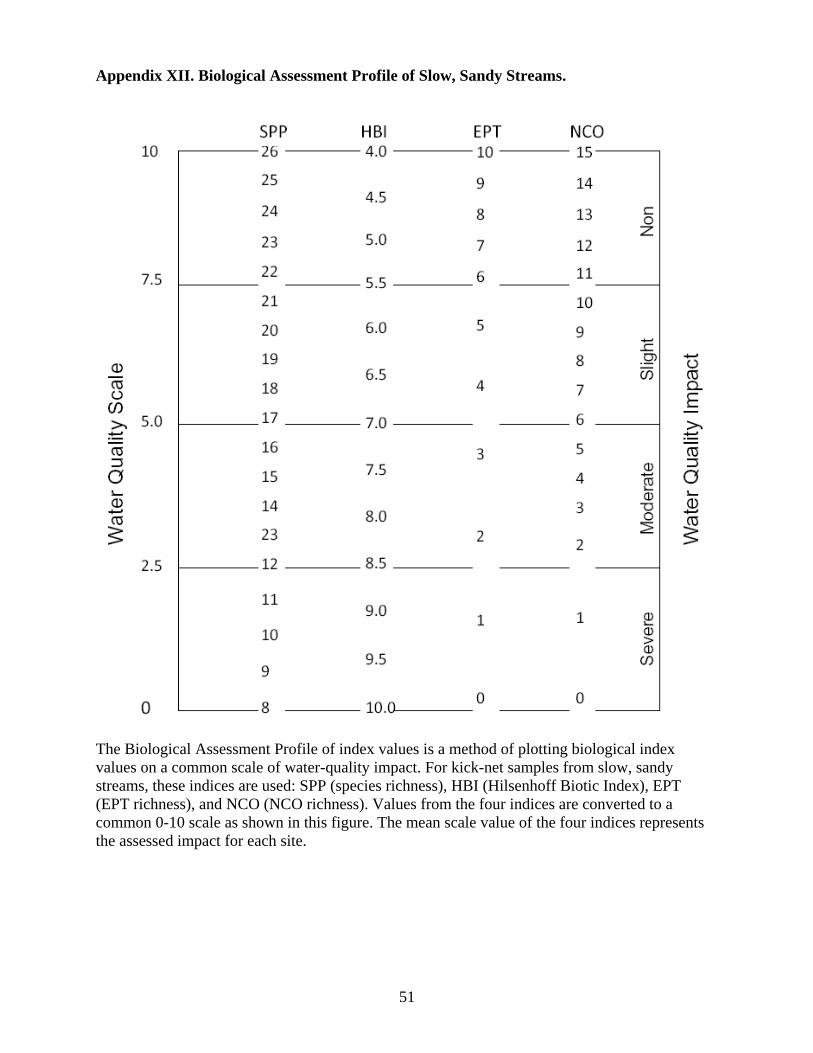
Appendix XII. Biological Assessment Profile of Slow, Sandy Streams.
The Biological Assessment Profile of index values is a method of plotting biological index
values on a common scale of water-quality impact. For kick-net samples from slow, sandy
streams, these indices are used: SPP (species richness), HBI (Hilsenhoff Biotic Index), EPT
(EPT richness), and NCO (NCO richness). Values from the four indices are converted to a
common 0-10 scale as shown in this figure. The mean scale value of the four indices represents
the assessed impact for each site.