walloon spin-offs
TRANSCRIPT

28
SPECIAL ECONOMY
Walloon spin-offs Who are they?
To what economic impact?
WHAT IS THE NUMBER OF ACTIVE SPIN-OFFS IN WALLONIA? HOW MANY OF
THEM HAVE BEEN CREATED IN RECENT YEARS? WHAT ARE THEIR ORIGINS
AND IN WHICH BUSINESS SECTORS DO THEY OPERATE? HOW MANY JOBS
HAVE BEEN CREATED BY THESE STRUCTURES? HOW ARE THESE SPIN-
OFFS DISTRIBUTED AMONG MICRO-, SMALL-, MEDIUM- AND LARGE-SIZED
COMPANIES? WHO ARE THE
CHAMPIONS? AND WHAT IS
THEIR DYNAMIC IN TERMS
OF JOB GROWTH?
by Benoît PETRE
A spin-off is a company that aims
to commercially exploit products,
processes or know-how developed
within an higher education research
department. These structures are important
as Wallonia seeks to reorient its economy
towards the production of high value added
goods and services
Our list of Walloon spin-offs was compiled
from two different sources. The first consists
of official listings sent by certain universities
themselves (Université de Mons, Université
Catholique de Louvain and Université de
Liège). An alternative method was used
for other higher education institutions
(Université libre de Bruxelles, Université de
Namur and High Schools).
This information is then correlated with that of
the LIEU system, a public body which deals, in
particular, with the coordination of university
administrations in charge of spin-offs.
A database was established from the
annual accounts submitted by the spin-offs
identified above to the Central Balance
Sheet Office between 2004 and 2013. The
accounts of majority owned subsidiaries
active in Wallonia have been consolidated
with those of their parent company.
This research identified 192 active spin-
offs over the period 2004-2013. Of these
150 were active in 2013(1). Of these,
150 were active in 2013. The spin-offs
generated more than €246 millions of
added value(2) and 2679 jobs (FTE). Half
of these jobs came from spin-offs active
in one of the following three sectors:
computer programming & consultancy;
manufacture of pharmaceutical products;
and manufacture of computer, electronic
and optical products. The spin-offs from the
UCL and ULG alone account for 78% of total
employment generated by these operations
in 2013 compared with 12% for the ULB and
4% for UNamur and UMons.
The evolution of added value and jobs
created between 2004 and 2013 is illustrated
in Graphic 01. Both have seen a steady
growth during the reporting period,
despite an often challenging external
economic environment in Europe, increasing
employment by 80% and added value by
108%. As well as this solid performance from
existing spin-offs, another 90 (74 still being
active in 2013) new operations were also
registered between 2004-2013.
The Walloon spin-offs are relatively
heterogeneous from the perspectives
of size and age. This is illustrated in
Graphic 02. The spin-offs active in 2013 are
primarily micro (66%) or small enterprises
(25%). Medium-size companies account for
only 6% of all active spin-offs in 2013. And
only one spin-off, namely IBA (493 jobs) can
be considered as a large company.
In terms of age, spin-offs are predominantly
young, with half of them under 10 years old.
Nevertheless, one spin-off in five was more
than 20 years old in 2013. The oldest spin-
off, Slegten, celebrated its 66th anniversary
this year.
(1) 2013isthemostrecentyearintermsofavailablefinancialstatementssincetheyaregenerallygivenwithanoffsetyear.Theannualaccounts2014willonlybepresentedin2015.
(2) Theaddedvalueproducedbyacompanyrepresentsthewealthgeneratedbyit.Itisequivalenttothedifferencebetweentheturn-overofthelatter,thatistosay,theproductofitssales,anditsintermediateconsumptionexpenses,thatistosaywhatitbuysfromitsproviders.Thiswealthwillbedistributedamongworkersaswagesas,theownersofthecompany’scapitalthroughdividendsandthestateintheformoftaxesandduties.
KEY-FIGURES (2013) Total (150 spin-offs)
Average Median
Jobs (ETP) 2.679 18 4
Added value (k€) 246.000 1.643 244
Age (year) 0-66 11 10

DYNAM!SME 01-02/2015
29
This heterogeneity has the consequence
that a relatively small number of them are
responsible for the majority of employment,
net job creation and total added value
created. This is illustrated in Graphic 03.
We see that the spin-offs belonging to
the top 10% of their respective category
(employment, net job creation and added
value) accounts for around 2/3 of aggregate
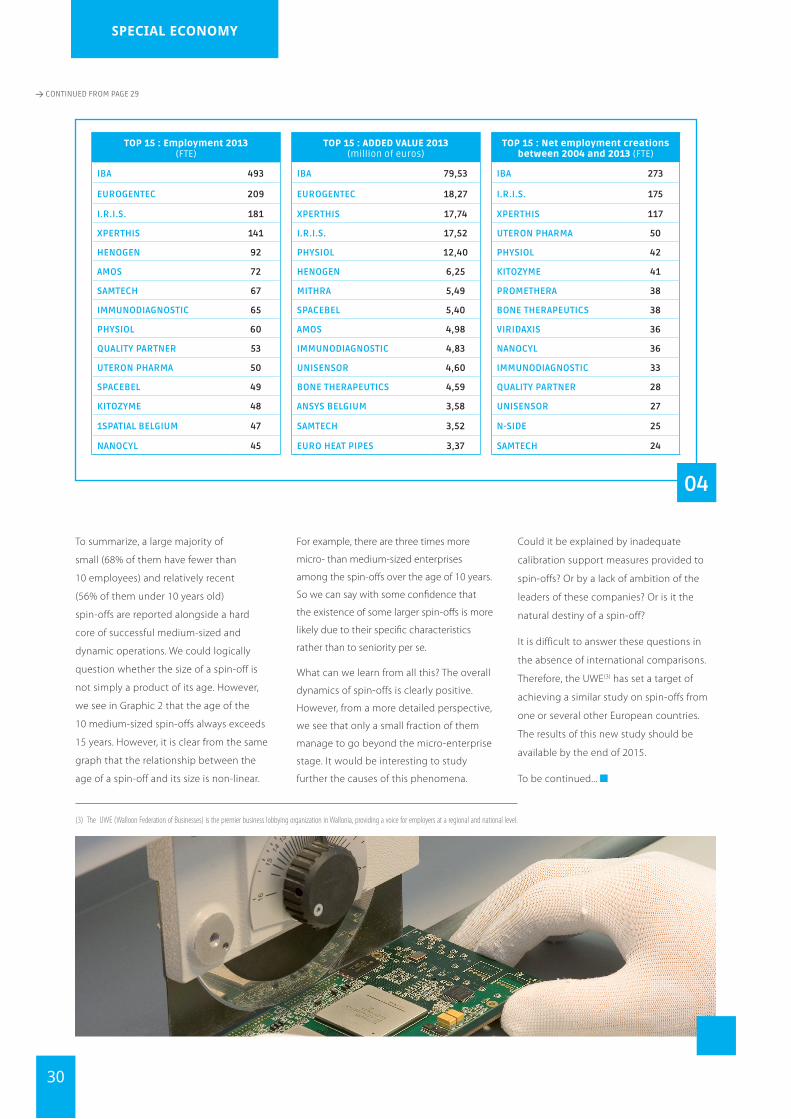
performance. A list of these fifteen spin-offs
that have distinguished themselves in a
particular area is shown in Table 04 (page 30)
The research also confirms that a spin-off
which excels in one area (employment,
net job creation and value added) is
typically very well placed in the other two
also. For example, IBA, IRIS, Xperthis and
Immunodiagnostic Systems feature in the
top 15 for each area. While this finding may
seem tautological, a spin-off cannot be
large without having experienced a period
of growth, it is important. Indeed, this
means that the positive dynamics in terms
of employment and added value created
by all the spin-offs between 2004 and 2013
is predominantly the result of just 15-20
spin-offs.
EVOLUTION OF TOTAL ADDED VALUE AND TOTAL EMPLOYMENT IN WALLOON SPIN-OFFS In full-time equivalent (FTE) or millions of euros (2004-2013)
01
DISTRIBUTION OF PIN-OFFS PER AGE AND EMPLOYMENT* - 150 ACTIVE SPIN-OFFS IN 2013*The results are similar with the added value as its correlation with employment is strong (R-squared = 85%)
02
DISTRIBUTION OF EMPLOYMENT, OF THE ADDED VALUE AND OF THE NET JOB CREATIONS IN THE SPIN-OFFS
03
0
500
1000
1500
2000
2500
3000
0
50
100
150
200
250
300
2004 2005 2006 2007 2008 2009 2010 2011 2012 2013Millions
Total added value (left) Total employment (right)
0 1-5 6-10 11-20 21-50 51-100 > 100
>21 3 3 2 5 4 4
16-20 1 1 3 2 2
11-15 7 10 3 6 7 2
6-10 9 11 11 9 2
>5 16 21 3 1 2
top 1562%
13538%
Répartition de l'emploi dans les spin‐offs en 2013
top 1568%
10232%
Répartition de la valeur ajoutée dans les spin‐offs dont la valeur ajoutée est positive en 2013
top 1564%
13536%
Répartition des création net d'emploi sur la période 2004‐2013Distribution of
employment in the spin-offs in 2013
Distribution of the added value in the spin-offs** in 2013 Distribution of the
net job creations in the period
2004-2013
FTE
AG
E
** Only the spin-offs whose added value is positive in 2013 (113 spin-offs).
> CONTINUED ON PAGE 30
Mill
ions
€
30
SPECIAL ECONOMY
To summarize, a large majority of
small (68% of them have fewer than
10 employees) and relatively recent
(56% of them under 10 years old)
spin-offs are reported alongside a hard
core of successful medium-sized and
dynamic operations. We could logically
question whether the size of a spin-off is
not simply a product of its age. However,
we see in Graphic 2 that the age of the
10 medium-sized spin-offs always exceeds
15 years. However, it is clear from the same
graph that the relationship between the
age of a spin-off and its size is non-linear.
For example, there are three times more
micro- than medium-sized enterprises
among the spin-offs over the age of 10 years.
So we can say with some confidence that
the existence of some larger spin-offs is more
likely due to their specific characteristics
rather than to seniority per se.
What can we learn from all this? The overall
dynamics of spin-offs is clearly positive.
However, from a more detailed perspective,
we see that only a small fraction of them
manage to go beyond the micro-enterprise
stage. It would be interesting to study
further the causes of this phenomena.
Could it be explained by inadequate
calibration support measures provided to
spin-offs? Or by a lack of ambition of the
leaders of these companies? Or is it the
natural destiny of a spin-off?
It is difficult to answer these questions in
the absence of international comparisons.
Therefore, the UWE(3) has set a target of
achieving a similar study on spin-offs from
one or several other European countries.
The results of this new study should be
available by the end of 2015.
To be continued...
TOP 15 : Employment 2013 (FTE)
TOP 15 : ADDED VALUE 2013 (million of euros)
TOP 15 : Net employment creations between 2004 and 2013 (FTE)
IBA 493 IBA 79,53 IBA 273
EUROGENTEC 209 EUROGENTEC 18,27 I.R.I.S. 175
I.R.I.S. 181 XPERTHIS 17,74 XPERTHIS 117
XPERTHIS 141 I.R.I.S. 17,52 UTERON PHARMA 50
HENOGEN 92 PHYSIOL 12,40 PHYSIOL 42
AMOS 72 HENOGEN 6,25 KITOZYME 41
SAMTECH 67 MITHRA 5,49 PROMETHERA 38
IMMUNODIAGNOSTIC 65 SPACEBEL 5,40 BONE THERAPEUTICS 38
PHYSIOL 60 AMOS 4,98 VIRIDAXIS 36
QUALITY PARTNER 53 IMMUNODIAGNOSTIC 4,83 NANOCYL 36
UTERON PHARMA 50 UNISENSOR 4,60 IMMUNODIAGNOSTIC 33
SPACEBEL 49 BONE THERAPEUTICS 4,59 QUALITY PARTNER 28
KITOZYME 48 ANSYS BELGIUM 3,58 UNISENSOR 27
1SPATIAL BELGIUM 47 SAMTECH 3,52 N-SIDE 25
NANOCYL 45 EURO HEAT PIPES 3,37 SAMTECH 24
04
> CONTINUED FROM PAGE 29
(3) TheUWE(WalloonFederationofBusinesses)isthepremierbusinesslobbyingorganizationinWallonia,providingavoiceforemployersataregionalandnationallevel.