wallpolla island hydraulic model calibration report
TRANSCRIPT

Mallee CMA Wallpolla Island Hydraulic Model
Calibration Report
Report No. J164/R03
March 2007

Mallee CMA
Wallpolla Island Hydraulic Model Calibration Report
Report No. J164/R03 March 2007
15 Business Park Drive Notting Hill VIC 3168 Telephone (03) 9558 9366 Fax (03) 9558 9365 ACN No. 093 377 283 ABN No. 60 093 377 283

Hydraulic Modelling for Lindsay Mulcra and Wallpolla Islands
J164/R03, 01 March 2007, Final Rev 2 Page i
DOCUMENT STATUS
Issue Revision Date Issued
To Prepared By
Reviewed By
ApprovedBy
DRAFT 0 11 Nov 2006 BT WAB
DRAFT 1 12 Dec 2006 BT WAB
FINAL 2 1 March 2007 BT WAB
QFORM-AD-18 REV 5 It is the responsibility of the reader to verify the currency of revision of this report.
Copyright ©
Water Technology Pty Ltd has produced this document in accordance with instructions from Mallee Catchment Management Authority for their use only. The concepts and information contained in this document are the copyright of Water Technology Pty Ltd. Use or copying of this document in whole or in part without written permission of Water Technology Pty Ltd constitutes an infringement of copyright. Water Technology Pty Ltd does not warrant this document is definitive nor free from error and does not accept liability for any loss caused, or arising from, reliance upon the information provided herein. s:\j164_lindsay_island\docs\report\stage2\j164f03_rev2.doc

Hydraulic Modelling for Lindsay Mulcra and Wallpolla Islands
J164/R03, 01 March 2007, Final Rev 2 Page ii
TABLE OF CONTENTS
1 Introduction ...................................................................................................................... 1 1.1 Background ................................................................................................................ 1
2 Hydraulic Analysis ........................................................................................................... 2 2.1 Numerical Modelling System..................................................................................... 2 2.2 Model Establishment.................................................................................................. 2
2.2.1 One dimensional model component (MIKE11) ................................................. 2 2.2.2 Two-dimensional model components (MIKE21) .............................................. 2
2.3 Lock & Weir Simulation ............................................................................................ 4
3 Calibration ........................................................................................................................ 5 3.1 Overview .................................................................................................................... 5 3.2 Selection of Calibration Events.................................................................................. 6
3.2.1 June – September 1988 ...................................................................................... 6 3.2.2 May – October 1989........................................................................................... 6 3.2.3 July – October 1993 ........................................................................................... 6
3.3 Calibration Results ..................................................................................................... 7 3.3.1 June – September 1988 ...................................................................................... 7
3.3.1.1 Gauge Results................................................................................................. 8 3.3.1.2 Flooding Extents ............................................................................................ 8
3.3.2 May – October 1989......................................................................................... 11 3.3.2.1 Gauge Results............................................................................................... 11 3.3.2.2 Flooding Extents .......................................................................................... 12
3.3.3 July – October 1993 ......................................................................................... 15 3.3.3.1 Gauge Results............................................................................................... 15 3.3.3.2 Flooding Extents .......................................................................................... 16
4 Discussion........................................................................................................................ 19 4.1 Model Capabilities ................................................................................................... 19 4.2 Nominal Accuracy.................................................................................................... 19
4.2.1 Levels and Flow Distributions ......................................................................... 19 4.2.2 Flood Extents.................................................................................................... 20
4.3 Recommendations .................................................................................................... 20 4.3.1 Hydrologic Data Collection ............................................................................. 20 4.3.2 Additional Survey ............................................................................................ 20 4.3.3 Floodplain Structures ....................................................................................... 21 4.3.4 Management Model.......................................................................................... 21

Hydraulic Modelling for Lindsay Mulcra and Wallpolla Islands
J164/R03, 01 March 2007, Final Rev 2 Page iii
LIST OF FIGURES
Figure 2-1 Wallpolla Island Hydraulic Model Structure
Figure 3-1 Comparison of Calibration Events
Figure 3-2 June – September 1988 Model Boundaries
Figure 3-3 Evapotranspiration for all Calibration Events
Figure 3-4 June – September 1988 Lock 9 Flow Calibration
Figure 3-5 June – September 1988 Lock 9 Level Calibration
Figure 3-6 June – September 1988 Flood Extent Calibration
Figure 3-7 May – October 1989 Model Boundaries
Figure 3-8 May – October 1989 Lock 9 Flow Calibration
Figure 3-9 May – October 1989 Lock 9 Level Calibration
Figure 3-10 May – October 1989 Flood Extent Calibration
Figure 3-11 July – October 1993 Model Boundaries
Figure 3-12 July – October 1993 Lock 9 Flow Calibration
Figure 3-13 July – October 1993 Lock 9 Level Calibration
Figure 3-14 July – October 1993 Flood Extent Calibration
LIST OF TABLES
Table 2-1 Approximate Lock 9 Operating Rules

Hydraulic Modelling for Lindsay Mulcra and Wallpolla Islands
J164/R03, 01 March 2007, Final Rev 2 Page 1
1 INTRODUCTION
This report describes the set-up and calibration of the Wallpolla Island Hydraulic Model. It is considered that the level of agreement achieved by the model with the observed flood behaviour of three historical flood events to date is more than appropriate to make very well-informed decisions on possible water management options for the floodplain. However it must be noted that due to a lack of topography data downstream of Lock 9, that the model is not suitable for simulations of high flow events where water escapes from the River Murray and Frenchman’s Creek banks filling the presently un-surveyed floodplain.
1.1 Background Water Technology have been commissioned by Mallee CMA to develop detailed hydraulic models of Lindsay, Mulcra and Wallpolla Islands to assist in the assessment of water management options and facilitate the development of flow enhancement strategies under the Living Murray initiative.

Hydraulic Modelling for Lindsay Mulcra and Wallpolla Islands
J164/R03, 01 March 2007, Final Rev 2 Page 2
2 HYDRAULIC ANALYSIS
2.1 Numerical Modelling System Hydraulic modelling of the study area has been undertaken utilising DHI Software’s MIKE FLOOD modelling system. MIKE FLOOD is a state of the art tool for floodplain modelling that combines the dynamic coupling of DHI’s one-dimensional MIKE11 river modelling and their fully two-dimensional MIKE21 modelling system. Through this coupling it is possible to accurately represent both river and floodplain processes through application of:
• A detailed 1D network of rivers and channels.
• A comprehensive range of hydraulic structures (including weirs, culverts, bridges, etc).
• A detailed 2D representation of the floodplain and its complex flow paths.
• Dynamic links between the 1D and 2D domains.
Further details on the capabilities of the MIKE FLOOD modelling system can be found at http://www.dhisoftware.com/mikeflood
2.2 Model Establishment The main structural components of the hydrodynamic model is discussed below and displayed in Figure 2-1.
2.2.1 One dimensional model component (MIKE11) • The SR&WSC (1977) cross-section survey of the River Murray was incorporated into
the MIKE11 model to represent the River Murray channel from just downstream of Lock 10 at Wentworth to just upstream of Lock 8.
• Major anabranches that connected to the River Murray were incorporated into the MIKE11 model. Where available, cross-section survey was employed to develop the model cross-sections and in other areas 1 m LiDAR data was used to derive creek cross-sections.
• Lock 9 was modelled as a ‘control structure’ within the MIKE11 model allowing the weir pool level to be simulated at low flows and the free overflow conditions to be modelled at high flows.
• The upstream model boundary immediately downstream of Lock 10 was modelled in MIKE11 as an historic time-series of flow. The downstream model boundary immediately upstream of Lock 8 was modelled in MIKE11 as an historic time-series of water surface elevation.
2.2.2 Two-dimensional model components (MIKE21) • The LiDAR data was interpolated onto a 25 m MIKE21 grid. This grid resolution is
relatively fine considering the study area and describes the topographic features within the study area well. A finer grid resolution would result in model run times that would be prohibitively long.
• Wallpolla Creek and the entire Wallpolla Island floodplain with its myriad of lagoons and small channels are represented directly in the MIKE21 topography. The MIKE11 branches were ‘coupled’ with the MIKE21 model to allow overbank channel flows to spread across the broader floodplain.

Hydraulic Modelling for Lindsay Mulcra and Wallpolla Islands
J164/R03, 01 March 2007, Final Rev 2 Page 3
Figure 2-1 Wallpolla Island Hydraulic Model Structure
Frenchmans Ck
Dedmans Ck
Moorna Ck
Downstream end of Wallpolla Ck (modelled in 1D)
Sandy Ck
Finnegan’s Ck
Upstream end of Wallpolla Ck (modelled in 1D)
River Murray
Wallpolla Ck (modelled in 2D)

Hydraulic Modelling for Lindsay Mulcra and Wallpolla Islands
J164/R03, 01 March 2007, Final Rev 2 Page 4
2.3 Lock & Weir Simulation The River Murray locks and associated weirs have a significant influence on the hydraulics of the River Murray and the Wallpolla Island floodplain. The accurate simulation of the locks is considered integral to modelling the hydraulic behaviour of the broader floodplain and wetlands. Locks 8 and 10 do not require explicit modelling in the Wallpolla Island hydraulic model as they are effectively used as boundary conditions, with historic records of flow and stage utilised. Lock 9 is modelled explicitly with the structure and operational rules built into the model. Lock 9 consists of the following major elements:
• A lock chamber
• A high flow navigable pass
• Sluice gate section with removal stop logs
Present lock operation rules require that a constant weir pool level is maintained during normal dry weather flows to enable navigation and to assist other water users along the river. During high flows, the stop-logs are progressively removed to allow for the free passage of flood waters down the river. During the receding limb of the flood, the stop logs are then progressively returned to reinstate the weir pool level. The operation of the locks by the Lock Masters is generally in response to the flow rates upstream. Discussions with SA Water officers indicated that the locks are not managed by precise individual operating rules but rather rely on the experience of the Lock Masters to determine the appropriate time to remove and replace stop logs during high flow events. Approximate guidelines for the removal and reinstatement of the Lock 9 weir stop logs are however provided in Table 2-1.
Table 2-1 Approximate Lock 9 Operating Rules
Removal of stop logs on rising limb
Reinstatement of stop logs on receding limb Weir Pool Level
(m AHD) Lowest Flow (Ml/d)
Highest Flow (Ml/d)
Lowest Flow
(Ml/d)
Highest Flow
(Ml/d)
27.4 48,000 88,000 55,000 65,000
To enable the simulation of Lock 9 in the hydraulic model, the lock was modelled as a ‘control structure’ in the MIKE11 model. The MIKE11 ‘control structure’ module allows complicated hydraulic structures and operating regimes to be accurately simulated. The operating logic within the control structure allows a constant water level to be maintained upstream during low flows and allows free overflow conditions when flow rates upstream reach a certain threshold value. Similarly, as the flow rate upstream reduces below the threshold value, the constant weir pool level is reinstated. Whilst the stop logs are removed during high flow events, the weir structure still impacts on the river profile through the locks. Adjustment of the head-loss factors describing the weir during high flows were therefore required in order to calibrate the free overflow description of the weirs.

Hydraulic Modelling for Lindsay Mulcra and Wallpolla Islands
J164/R03, 01 March 2007, Final Rev 2 Page 5
3 CALIBRATION
3.1 Overview The development of a hydraulic model of a large floodplain requires a rigorous calibration process to ensure the hydraulic model accurately reproduces the observed flooding behaviour.
The calibration process consists of systematically comparing observed flooding behaviour within the study area against the hydraulic models reproduction of that behaviour. This process incorporated comparisons between gauged stream flow data, gauged flood levels and areas of inundation as derived from analysis of satellite imagery. Where the model does not adequately represent the observed behaviour, reasons for the discrepancies are identified and inputs to the model adjusted. This process is repeated until a satisfactory result is achieved.
The historical floods used to calibrate the model were chosen on the following basis:
• A reasonable calibration data set of coincident flood information was available to make meaningful comparisons with the model; and
• The flood was of a significantly different magnitude to the other calibration floods to ensure the model was capable of accurately reproducing the flooding behaviour of the forest over a range of flood magnitudes.
Following a review of the data available on historical floods for Wallpolla Island, three historical floods were selected for calibration of the model:
1. June – September 1988
2. May – October 1989
3. July – October 1993
Figure 3-1 compares the flow downstream of Lock 10 and the level upstream of Lock 9 for the period including the three selected calibration events.
0
100
200
300
400
500
600
700
800
900
1000
1100
1200
1300
1400
1500
1600
1700
1800
Jan 1988 Jul 1988 Jan 1989 Jul 1989 Jan 1990 Jul 1990 Jan 1991 Jul 1991 Jan 1992 Jul 1992 Jan 1993 Jul 1993 Jan 1994
Time
Flow
(m3 /s
)
27
27.5
28
28.5
29
29.5
30
Leve
l (m
AH
D)
Flow Downstream of Lock 10
Level Upstream of Lock 9
Figure 3-1 Comparison of Calibration Events

Hydraulic Modelling for Lindsay Mulcra and Wallpolla Islands
J164/R03, 01 March 2007, Final Rev 2 Page 6
3.2 Selection of Calibration Events 3.2.1 June – September 1988 A minor flood was experienced in winter 1988. Flows at Lock 10 peaked on 28th of August 1998 at 49,919 Ml/d (578 m3/s).
A complete set of gauged records of flow and stage are available for Locks 8, 9 and 10 during the period of the flood. Satellite imagery flood extents were available for calibration a week before the peak on the 22nd of August 1988. At the time of the satellite image the flow was only 11 m3/s less than the maximum peak flow, so it is thought to be representative of the maximum flood extent.
The satellite imagery shows that the flood was mainly contained within the channel banks with limited flooding in a couple of the lower lying wetlands.
3.2.2 May – October 1989 A significant long duration flood event was experienced in late autumn through till mid spring 1989. Flows at Lock 10 peaked on 7th of August 1989 at 90,903 ML/d (1,052 m3/s).
A complete set of gauged records of flow and stage are available for Locks 8, 9 and 10 during the period of the flood. Satellite imagery flood extents were available for calibration a week and a half before the peak on the 26th of September 1989. At the time of the satellite image the flow was 41 m3/s less than the maximum peak flow. Although the satellite image was not taken at the peak of the flood all the low lying areas were inundated at the time. It would require a significantly larger flood to break into the higher elevation areas of the floodplain and increase the area of inundation, so it is thought to be representative of the maximum flood extent.
The satellite imagery shows that the flood inundated a great deal more area than the 1988 flood event, with most of the wetlands inundated and a greater connectivity of the small channels throughout Wallpolla Island occurred. Significantly a large area of floodplain downstream of Lock 9 not covered by the LiDAR was inundated. The calibration has revealed the requirement for further survey to improve the models suitability to simulate high River Murray flows such as this event.
3.2.3 July – October 1993 A significant flood event was experienced in mid winter 1993 through till mid summer 1994, inundating significant expanses of the River Murray floodplain. Flows at Lock 10 peaked on 13th of November 1993 at 140,320 ML/d (1,624 m3/s).
A complete set of gauged records of flow and stage are available for Locks 9 and 10 during the period of the flood, with limited data for Lock 8. The 1D model was truncated due to the lack of data with the downstream boundary trimmed to downstream of Lock 9. Satellite imagery flood extents were available for calibration a month before the peak on the 8th of October 1993. At the time of the satellite image the flow was 834 m3/s less than the maximum peak flow.
Although the satellite image was not taken at the peak of the flood and thus the flood extent used for calibration in no way represents the peak flood extent, it does have one advantage. At the time of the satellite image the flood had not yet reached the point where the unsurveyed floodplain downstream of Lock 9 was substantially inundated as was the case for the 1989 calibration event. The 1993 satellite image therefore offers an event for calibration without the confounding issue of not being able to correctly model the entire floodplain due to the lack of floodplain survey. At the time of the satellite imagery the flood inundated a number of additional wetlands as compared to the 1988 flood event.

Hydraulic Modelling for Lindsay Mulcra and Wallpolla Islands
J164/R03, 01 March 2007, Final Rev 2 Page 7
3.3 Calibration Results 3.3.1 June – September 1988 The recorded discharge hydrograph downstream of Lock 10 was applied to the models upstream boundary and the recorded level hydrograph upstream of Lock 8 was applied to the models downstream boundary from 20th of June to the 3rd of September 1988. The inflow hydrograph at Lock 10 and the level hydrograph at Lock 8 are presented in Figure 3-2.
Gauged evapotranspiration values were sourced from the Bureau of Meteorology site at Lake Victoria (047016) for Wallpolla Island and were applied to the model, Figure 3-3.
300
350
400
450
500
550
600
20/6/88 27/6/88 4/7/88 11/7/88 18/7/88 25/7/88 1/8/88 8/8/88 15/8/88 22/8/88 29/8/88
Time
Flow
(m3 /s
)
24.5
24.6
24.7
24.8
24.9
25
25.1
25.2
25.3
25.4
25.5
Leve
l (m
AH
D)
Flow Downstream of Lock 10
Level Upstream of Lock 8
Figure 3-2 June – September 1988 Model Boundaries
0
2
4
6
8
10
12
14
16
18
20
Jan 1988 Jul 1988 Jan 1989 Jul 1989 Jan 1990 Jul 1990 Jan 1991 Jul 1991 Jan 1992 Jul 1992 Jan 1993 Jul 1993 Jan 1994
Date
0470
16 D
aily
Eva
potr
ansp
iratio
n (m
m)
Figure 3-3 Evapotranspiration for all Calibration Events

Hydraulic Modelling for Lindsay Mulcra and Wallpolla Islands
J164/R03, 01 March 2007, Final Rev 2 Page 8
3.3.1.1 Gauge Results The gauge records for discharge over Lock 9 and the level upstream and downstream of Lock 9 were compared against the hydraulic model results. Although the gauged calibration data is limited one of the key components of the calibration is seen to be the operation of Lock 9, as this directly controls the flood level of lower Wallpolla Island. The calibration results are presented in Figure 3-4 and Figure 3-5. It is considered that good agreement with the gauge records has been achieved for this calibration flood.
The modelled flows are on average within 8% of the observed flows over the simulation period. The largest discrepancy in the flows late in the simulation can be explained by an observed diversion away from the loose operating rules of Lock 9 (the hydraulic model has strict operating rules whereas in reality the Locks are operated quite differently, using the experience of the Lock Master).
The modelled upstream and downstream levels at Lock 9 are within 0.1 to 0.2 m of the observed levels. This is considered an appropriate level of accuracy for the purposes of assessing future water management options.
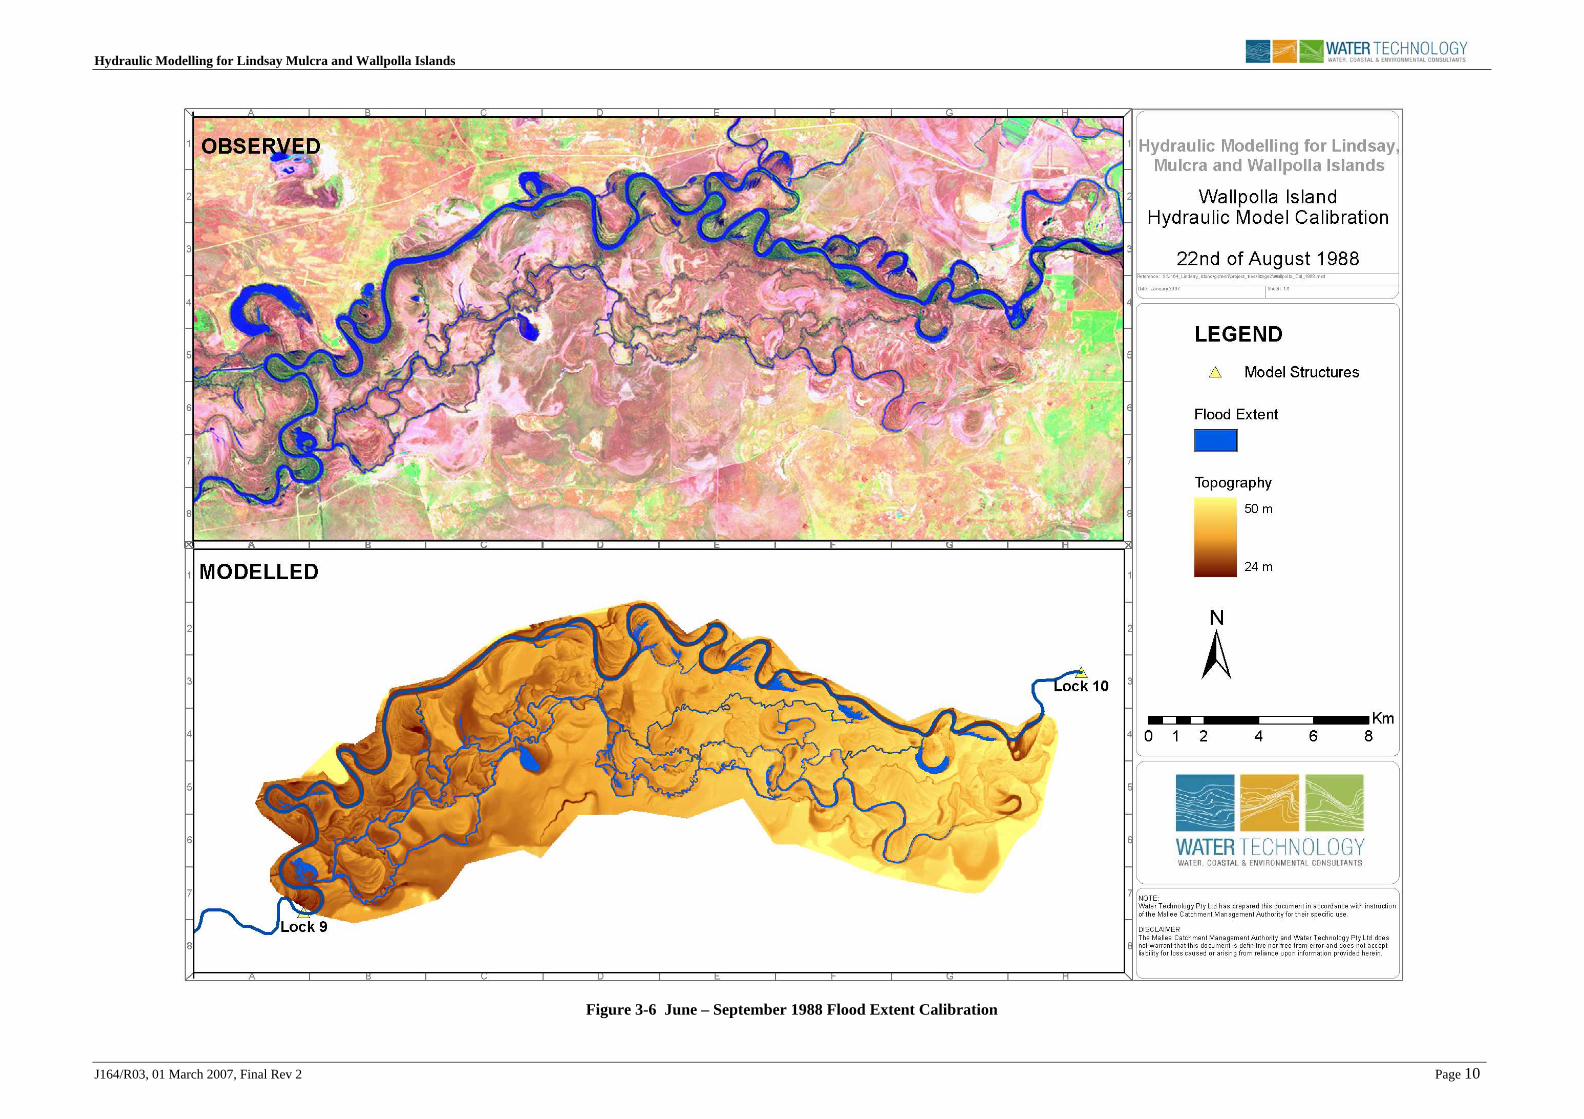
3.3.1.2 Flooding Extents With the lack of gauged data the comparison of modelled and observed flood extents is critical to the calibration process. Flood extents produced by the hydraulic model have been compared to the extent of flooding captured by satellite imagery on the 22nd of August 1988. The calibration results are presented in Figure 3-6 and show good agreement between the modelled and observed flood extents. Wetlands and small creeks throughout the island and scrolls along the River Murray that were inundated in the observed satellite image have been inundated in the model simulation, showing that the connectivity and critical sill levels of the system are well represented.

Hydraulic Modelling for Lindsay Mulcra and Wallpolla Islands
J164/R03, 01 March 2007, Final Rev 2 Page 9
0
50
100
150
200
250
300
350
400
450
500
550
600
20/6/88 27/6/88 4/7/88 11/7/88 18/7/88 25/7/88 1/8/88 8/8/88 15/8/88 22/8/88 29/8/88Time
Flow
(m3 /s
)
Gauged Flow
Modelled Flow
Figure 3-4 June – September 1988 Lock 9 Flow Calibration
25.0
25.2
25.4
25.6
25.8
26.0
26.2
26.4
26.6
26.8
27.0
27.2
27.4
27.6
27.8
28.0
20/6/88 27/6/88 4/7/88 11/7/88 18/7/88 25/7/88 1/8/88 8/8/88 15/8/88 22/8/88 29/8/88Time
Leve
l (m
AH
D)
Gauged Upstream Level
Modelled Upstream Level
Gauged Downstream Level
Modelled Downstream Level
Figure 3-5 June – September 1988 Lock 9 Level Calibration
Hydraulic Modelling for Lindsay Mulcra and Wallpolla Islands
J164/R03, 01 March 2007, Final Rev 2 Page 10
Figure 3-6 June – September 1988 Flood Extent Calibration

Hydraulic Modelling for Lindsay Mulcra and Wallpolla Islands
J164/R03, 01 March 2007, Final Rev 2 Page 11
3.3.2 May – October 1989 The recorded discharge hydrograph downstream of Lock 10 was applied to the models upstream boundary and the recorded level hydrograph upstream of Lock 8 was applied to the models downstream boundary from 16th of May to the 15th of October 1989. The inflow hydrograph at Lock 10 and the level hydrograph at Lock 8 are presented in Figure 3-7.
Gauged evapotranspiration values were sourced from the Bureau of Meteorology site at Lake Victoria (047016) for Wallpolla Island and were applied to the model, Figure 3-3.
300
350
400
450
500
550
600
650
700
750
800
850
900
950
1000
1050
1100
16/5/89
23/5/89
30/5/89
6/6/89 13/6/89
20/6/89
27/6/89
4/7/89 11/7/89
18/7/89
25/7/89
1/8/89 8/8/89 15/8/89
22/8/89
29/8/89
5/9/89 12/9/89
19/9/89
26/9/89
3/10/89
10/10/89
Time
Flow
(m3 /s
)
24.5
25
25.5
26
26.5
27
Leve
l (m
AH
D)
Flow Downstream of Lock 10
Level Upstream of Lock 8
Figure 3-7 May – October 1989 Model Boundaries
3.3.2.1 Gauge Results The gauge records for discharge over Lock 9 and the level upstream and downstream of Lock 9 were compared against the hydraulic model results. Although the gauged calibration data is limited one of the key components of the calibration is seen to be the operation of Lock 9, as this directly controls the flood level of lower Wallpolla Island. The calibration results are presented in Figure 3-8 and Figure 3-9. It is considered that good agreement with the gauge records has been achieved for this calibration flood. However for this flood there are complications with the suitability of the gauged data as described below in Section 3.3.2.2.
The modelled flows are on average within 4% of the observed flows over the simulation period. The largest discrepancy in the flows early on in the simulation can be explained by an observed diversion away from the loose operating rules of Lock 9 (the hydraulic model has strict operating rules whereas in reality the Locks are operated quite differently, using the experience of the Lock Master).
The modelled upstream and downstream levels at Lock 9 are within 0.1 to 0.2 m of the observed levels for the majority of the simulation but start to diverge away from the observed levels toward the peak of the flood. Generally, the model is within an appropriate level of accuracy for the purposes of assessing future water management options.

Hydraulic Modelling for Lindsay Mulcra and Wallpolla Islands
J164/R03, 01 March 2007, Final Rev 2 Page 12
3.3.2.2 Flooding Extents With the lack of gauged data the comparison of modelled and observed flood extents is critical to the calibration process. Flood extents produced by the hydraulic model have been compared to the extent of flooding captured by satellite imagery on the 26th of September 1989. The calibration results are presented in Figure 3-10 and show that whilst the calibration to the gauged data is acceptable, the modelled flood extent is greater than the observed satellite flood extent.
The observed flood extent is reproduced reasonably well in the modelling for the upper island, however the modelled flood extent for the lower island shows significantly more inundation. This is because floods of this magnitude bypass the gauge on Lock 9 by cutting a bend on the River Murray and via low-level sills off Frenchman’s Creek, inundating large areas of floodplain downstream of Lock 9. With no survey data to represent this floodplain, and no gauge data to indicate the magnitude of flow bypassing the Lock 9 gauge, it is difficult to model flood events of this magnitude correctly. As a result of these data gaps, the model shows an increased volume of water on the Wallpolla Island floodplain compared to the observed data.
To better model floods of this magnitude additional survey data of the floodplain between Wallpolla Island and Lindsay Island on both the Victorian and New South Wales banks is required.

Hydraulic Modelling for Lindsay Mulcra and Wallpolla Islands
J164/R03, 01 March 2007, Final Rev 2 Page 13
0
100
200
300
400
500
600
700
800
900
1000
15/5/89 29/5/89 12/6/89 26/6/89 10/7/89 24/7/89 7/8/89 21/8/89 4/9/89 18/9/89 2/10/89 16/10/89Time
Flow
(m3 /s
)
Gauged Flow
Modelled Flow
Figure 3-8 May – October 1989 Lock 9 Flow Calibration
25.025.225.425.625.826.026.226.426.626.827.027.227.427.627.828.028.228.428.628.829.029.229.429.629.830.0
15/5/89 29/5/89 12/6/89 26/6/89 10/7/89 24/7/89 7/8/89 21/8/89 4/9/89 18/9/89 2/10/89 16/10/89Time
Leve
l (m
AH
D)
Gauged Upstream Level
Modelled Upstream Level
Gauged Downstream Level
Modelled Downstream Level
Figure 3-9 May – October 1989 Lock 9 Level Calibration

Hydraulic Modelling for Lindsay Mulcra and Wallpolla Islands
J164/R03, 01 March 2007, Final Rev 2 Page 14
Figure 3-10 May – October 1989 Flood Extent Calibration

Hydraulic Modelling for Lindsay Mulcra and Wallpolla Islands
J164/R03, 01 March 2007, Final Rev 2 Page 15
3.3.3 July – October 1993 The recorded discharge hydrograph downstream of Lock 10 was applied to the upstream model boundary and the recorded level hydrograph downstream of Lock 9 was applied to the downstream model boundary from 20th of July to the 8th of October 1993. Note that the level hydrograph upstream of Lock 8 was not used as with the other calibration events as there was no gauged data during the 1993 event at Lock 8. The inflow hydrograph at Lock 10 and the level hydrograph at Lock 9 are presented in Figure 3-11.
Gauged evapotranspiration values were sourced from the Bureau of Meteorology site at Lake Victoria (047016) for Wallpolla Island and were applied to the model, Figure 3-3.
300
400
500
600
700
800
900
1000
1100
1200
1300
1400
1500
1600
1700
20/7/93 27/7/93 4/8/93 12/8/93 19/8/93 27/8/93 4/9/93 11/9/93 19/9/93 27/9/93 4/10/93 12/10/93 20/10/93 28/10/93 4/11/93 12/11/93 20/11/93 27/11/93
Time
Flow
(m3 /s
)
25.5
26.5
27.5
28.5
29.5
30.5
31.5
Leve
l (m
AH
D)
Flow Downstream of Lock 10
Level Downstream of Lock 9
Figure 3-11 July – October 1993 Model Boundaries
3.3.3.1 Gauge Results The gauge records for discharge over Lock 9 and the level upstream and downstream of Lock 9 were compared against the hydraulic model results. Although the gauged calibration data is limited one of the key components of the calibration is seen to be the operation of Lock 9, as this directly controls the flood level of lower Wallpolla Island. The calibration results are presented in Figure 3-12 and Figure 3-13. It is considered that good agreement with the gauge records has been achieved for this calibration flood.
The modelled flows are generally within 10% of the observed flows over the simulation period. The largest discrepancy in the flows mid simulation can be explained by an observed diversion away from the loose operating rules of Lock 9 (the hydraulic model has strict operating rules whereas in reality the Locks are operated quite differently, using the experience of the Lock Master).
The modelled upstream and downstream levels at Lock 9 are within 0.1 to 0.2 m of the observed levels. This is considered an appropriate level of accuracy for the purposes of assessing future water management options.

Hydraulic Modelling for Lindsay Mulcra and Wallpolla Islands
J164/R03, 01 March 2007, Final Rev 2 Page 16
3.3.3.2 Flooding Extents With the lack of gauged data the comparison of modelled and observed flood extents is critical to the calibration process. Flood extents produced by the hydraulic model have been compared to the extent of flooding captured by satellite imagery on the 8th of October 1993. The calibration results are presented in Figure 3-14 and shows good agreement between the modelled and observed flood extents. Similarly with the 1988 calibration, key wetlands and small creeks throughout the island and scrolls along the River Murray that were inundated in the observed satellite image have been inundated in the model simulation, showing that the connectivity and critical sill levels of the system are well represented. The modelled flood extent is perhaps a little greater than the observed flood extent but still provides a reasonable representation of the observed satellite image and is considered satisfactory for the purposes of the model.

Hydraulic Modelling for Lindsay Mulcra and Wallpolla Islands
J164/R03, 01 March 2007, Final Rev 2 Page 17
0
100
200
300
400
500
600
700
800
900
1000
1100
1200
1300
1400
1500
25/7/93 8/8/93 22/8/93 5/9/93 19/9/93 3/10/93 17/10/93 31/10/93 14/11/93 28/11/93Time
Flow
(m3 /s
)
Gauged Flow
Modelled Flow
Figure 3-12 July – October 1993 Lock 9 Flow Calibration
25.025.225.425.625.826.026.226.426.626.827.027.227.427.627.828.028.228.428.628.829.029.229.429.629.830.0
25/7/93 8/8/93 22/8/93 5/9/93 19/9/93 3/10/93 17/10/93 31/10/93 14/11/93 28/11/93Time
Leve
l (m
AH
D)
Gauged Upstream Level
Modelled Upstream Level
Gauged Downstream Level
Modelled Downstream Level
Figure 3-13 July – October 1993 Lock 9 Level Calibration

Hydraulic Modelling for Lindsay Mulcra and Wallpolla Islands
J164/R03, 01 March 2007, Final Rev 2 Page 18
Figure 3-14 July – October 1993 Flood Extent Calibration

Hydraulic Modelling for Lindsay Mulcra and Wallpolla Islands
J164/R03, 01 March 2007, Final Rev 2 Page 19
4 DISCUSSION
4.1 Model Capabilities Through the calibration process the hydraulic model has demonstrated its ability to reproduce the hydraulic behaviour of the floodplain well for a wide range of flows varying from approximately 25,000 ML/d up to 70,000 ML/d. For flows above 70,000 ML/d, such as the 1989 calibration event, the level of accuracy is diminished due to a lack of floodplain survey downstream of Lock 9. More specifically, the calibration process has demonstrated the following important capabilities:
• The ability to reproduce the operation of Lock 9 including the maintenance of the weir pool level in response to varying inflows and the removal and reinstatement of the weir during and following flood events.
• The ability to reproduce flood extents throughout the study area for a wide range of relevant flood magnitudes.
4.2 Nominal Accuracy There are numerous contributing factors to the ultimate output uncertainty in a complex hydraulic modelling exercise such as that undertaken for Wallpolla Island. Some of these factors, such as the level of agreement between the modelled and observed level at a particular gauge can be quantified quite precisely. Other factors however, such as the level of agreement between modelled and observed flood extents, are more subjective.
A distinction between absolute and relative accuracy should also be made when trying to attach a level of certainty to the hydraulic model outputs. The absolute accuracy is considered to be the ability to predict actual hydraulic conditions for any given situation or floodplain geometry. Relative accuracy however is the ability to accurately predict changes to hydraulic behaviour between two river/floodplain geometries (say existing conditions and a future water management option). In many situations the ability to predict relative changes in the hydraulics between two or more options is as important as the absolute level of accuracy.
4.2.1 Levels and Flow Distributions It is difficult to provide a precise degree of confidence in the simulated levels and flow distributions over the entire study area due to the lack of calibration data. However given the agreement achieved in the Lock 9 operation, the assumed accuracy of the underlying model topography, and the carefully developed model schematisation it is thought that a good representation of flood levels and flow splits has been achieved. It is considered that modelled levels should be predicted within 200 mm of actual flood levels. The accuracy of flows across the entire model are difficult to determine as there is only one gauged point at Lock 9, however throughout the calibration process it was found that modelled flows at Lock 9 were typically within 10% of gauged flows and the model is expected to be able to reproduce this level of agreement.

Hydraulic Modelling for Lindsay Mulcra and Wallpolla Islands
J164/R03, 01 March 2007, Final Rev 2 Page 20
4.2.2 Flood Extents At the floodplain scale, it is considered the hydraulic model is capable of producing good agreement with the pattern of inundation experienced on the floodplain in response to varying River Murray flows. The level of agreement achieved between modelled and observed hydraulic behaviour is considered more than adequate to provide confidence in the model results. This should allow well-informed decisions to be made by the Mallee CMA when considering different water management options at a floodplain scale.
At a more local wetland scale, the ability of the model to reproduce subtle changes in flood extents is limited by the resolution of the topography in the hydraulic model and the accuracy of the survey information to describe critical sill level thresholds. The modelled topography has adopted a reasonably fine grid scale of 25 m (at the extreme end of computing capabilities for a model area of this size). Sill levels for important effluents have been manually edited using the levels from the 1 m ALS data. This methodology has resulted in an accurate model representation of the Wallpolla Island floodplain.
4.3 Recommendations 4.3.1 Hydrologic Data Collection In order to expand the understanding of the hydrologic behaviour of Wallpolla Island it is recommended that further hydrologic data gathering be undertaken during appropriate flow conditions. Ideally, a contingency plan should be developed for future high flow events to ensure data collection exercises are implemented in a timely manner.
The following hydrologic data is recommended to be collected during future high flow events to expand the hydrologic knowledge base of Wallpolla Island.
• Extensive level and flow measurements at key effluents along the River Murray
• Level and flow measurements along Wallpolla Creek.
• Level measurements at key wetlands.
• Flood extent mapping either by aerial photography, satellite imagery (if available) or on-ground measurements (i.e., GPS). Additionally, it is recommended that multiple observations of flood extents are made with time to capture the temporal variation in the flood extents during the progression of the flood wave through the system including the recession period.
4.3.2 Additional Survey Additional survey is required if floods of a significant magnitude are to be modelled. A large portion of floodplain between Wallpolla Island and Lindsay Island was not captured in the original LiDAR along with data on the New South Wales floodplain. This missing floodplain is inundated during medium to large floods, impacting on the hydrodynamics of the flood event. Without this floodplain information the hydraulic model is limited to smaller events.
Critical sill levels of major effluents should also be surveyed in order to improve the model description of these systems.

Hydraulic Modelling for Lindsay Mulcra and Wallpolla Islands
J164/R03, 01 March 2007, Final Rev 2 Page 21
4.3.3 Floodplain Structures New or modified flow control structures on the Wallpolla Island floodplain should be included in the hydraulic model, to maintain its appropriateness. Given sufficiently detailed structural drawings and plans, additional hydraulic structures can readily be incorporated into the existing hydraulic model.
4.3.4 Management Model The fundamental hydraulic behaviour of Wallpolla Island at regulated flows up to small flow events (<50,000Ml/d), can be described accurately and efficiently with a one dimensional hydraulic model.
It is recommended that the Mallee CMA consider the option of developing their capacity to undertake basic hydraulic modelling analysis of the Wallpolla Island floodplain to assist in the water management of the floodplain.
Possible applications of the one-dimensional hydraulic model for the water management of the floodplain could include:
• Simulation of various lock raising and lowering operations to assist in the planning and approval processes.
• Simulation of expected future high flow events in advance to predict their likely impact and enable the operation of structures on the floodplain to be better planned in advance.
• Simulation of long term hydrologic time series to improve the understanding of the hydrologic behaviour of the floodplains in the past and future through the development of long term hydrological statistics for the floodplains.