walnut genome analysis - university of …walnutresearch.ucdavis.edu/2009/2009_35.pdf · walnut...
TRANSCRIPT

WALNUT GENOME ANALYSIS Jan Dvorak, Ming-Cheng Luo, Mallikarjuna Aradhya, Dianne Velasco, Charles A. Leslie, Sandie L. Uratsu, Monica T. Britton, Russell L. Reagan, Gale H. McGranahan and Abhaya M. Dandekar ABSTRACT The goal of this project is to build a set of comprehensive genomic tools for walnut. These will facilitate a more precise evaluation of breeding populations and will accelerate development of improved walnut cultivars to address the needs of both California growers and the consumers of this important agricultural commodity. Development of these tools includes (1) construction of a physical map of the walnut genome, (2) a detailed survey of walnut gene expression, and (3) fine-scale genetic and association mapping of economically important traits. Two bacterial artificial chromosome (BAC) libraries comprising a total of 129,024 clones (64,512 each) were constructed from Persian walnut (Juglans regia cv. Chandler) DNA. Average insert lengths were 135 kb (HindIII) and 120 kb (MboI) for the two libraries respectively, providing approximately 20x genome coverage. To date 124,890 BAC clones have been fingerprinted using the five-color SNaPshot HICF technology. The fingerprints have been edited, and 113,073 could be used for contig assembly with the FPC program. A total of 916 contigs and 4,830 singletons were obtained. A total of 54,912 BAC end sequences (BES) have also been produced, one BES per BAC. A mapping population of 265 progeny of the cross Chandler’ x ‘Idaho that segregates for all commercially important walnut traits was evaluated with 15 SSRs to verify the parentage of F1 progeny. In addition, the genetic structure of 399 trees among 204 diverse accessions, including 62 elite germplasm used for breeding, was employed in the development of a population for association mapping of walnut traits. A total of 21 cDNA libraries were constructed for the characterization of the walnut transcriptome using next generation DNA sequencing. These genomic tools will significantly strengthen ongoing California walnut breeding efforts by facilitating marker-assisted selection strategies. The use of well-defined markers will significantly increase selection efficiency, the discovery of new genes, and rapid integration of these genes into genetic backgrounds adapted to California environmental conditions, thus accelerating the development of improved walnut cultivars. PROJECT OBJECTIVES
1. Physical mapping of the walnut genome 2. Genetic and association mapping of economically important walnut traits 3. Functional mapping of the walnut genome 4. Development of a ‘Walnut Genome Resource (WGR)’, a web-based knowledge base of
walnut genomic information
California Walnut Board 35 Walnut Research Reports 2009

PROCEDURES Objective 1: Physical mapping of the walnut genome A physical map of the walnut genome will be built concurrent with development of the genetic map. To accomplish the construction of a physical map, walnut genomic DNA fragments were cloned in a bacterial artificial chromosome (BAC) vector. Each BAC clone was fragmented with different restriction enzymes and ordered into contiguous sequences based on the overlap of fragment patterns. Ends of the BAC clones were then sequenced using Sanger DNA sequencing technology. Each of the BAC end sequences (BES) generated by this process is collinear with the BAC segments and thus corresponds to the sequence of nucleotides along a walnut chromosome. The presence of gene sequence tags (GSTs) within the BES will be confirmed through their expression in walnut tissues (Objective 3). The physical map also provides a scaffold upon which to assemble the complete walnut genomic sequence when such sequencing is performed. Objective 2: Genetic and association mapping of economic traits in walnut. Two different approaches were proposed for walnut genome mapping: (1) Linkage analysis of a conventional mapping population derived from a cross between parents that differ for traits under consideration; and (2) Association genetic analysis of a natural population such as a germplasm collection with genotypes of unknown or mixed ancestry that represent a common gene pool. Extensive DNA libraries of both mapping and association mapping populations have been developed. We are currently developing genotypic data using microsatellite polymorphisms to validate the full-sib nature of the mapping population and to assess the genetic structure of the association mapping population. Objective 3: Functional mapping of the walnut genome Genetic and physical maps describe the structure of the genome, but it is also essential to precisely document gene expression and to link specific traits (Objective 2) and GSTs (Objective 1) to underlying metabolic and biochemical processes. A key step toward this is gene transcript sequencing to identify expressed genes. Twenty tissue-specific gene transcript libraries have been constructed using tissue samples collected over the 2008 growing season. These transcripts were copied into DNA, cloned and high-throughput Illumina Solexa sequencing is in progress to generate millions of Expressed Sequence Tags (ESTs). The ESTs will be deposited in public databases, compiled, and annotated with computer analysis to identify genes involved in important metabolic pathways. The ESTs will be analyzed to validate GSTs through their expression pattern in different walnut tissues. Objective 4: Development of a ‘Walnut Genome Resource (WGR)’, a web-based knowledge base of walnut genomic information. A web-based browser is being developed as data from Objectives 1, 2 and 3 begins to accumulate. The database will contain all physical and linkage mapping information as well as all EST sequences and their integration with the walnut physical and genetic maps to better inform the walnut research community and to provide access to these genomic resources.
California Walnut Board 36 Walnut Research Reports 2009

RESULTS AND DISCUSSION Objective 1: Physical mapping of the walnut genome Physical mapping consists of cloning large genomic DNA fragments in a suitable vector such as a BAC and ordering the fragments so that their sequence reflects the order of nucleotides in a chromosome. The first step in the construction of physical maps is the construction of BAC libraries. Two bacterial artificial chromosome (BAC) libraries were constructed from DNA isolated from in vitro grown shoots of Persian walnut (Juglans regia cv. Chandler). Walnut genomic DNA was fragmented with either HindIII or MboI restriction endonucleases. A total of 129,024 clones, 64,512 per BAC library, were arrayed in 336 384-well plates. The average insert size was around 135 kb and 120 kb for the HindIII and MboI libraries, respectively. Assuming the walnut genome is approximately 800 Mb, these two BAC libraries represent approximately 20x genome equivalents. Each BAC library has been stored in triplicate. BAC fingerprinting and BAC end sequencing were initiated in 2008. We are using a previously developed fluorescence-based, high-throughput BAC DNA fingerprinting technique (Luo et al. 2003) that sizes DNA fragments from each BAC clone by capillary electrophoresis, creating a unique fragment profile or BAC clone fingerprint for each BAC clone (Fig. 1). The “SNaPshot” fragment pattern for each BAC clone, using a different restriction endonuclease, is analyzed using a 96-capillary ABI3730XL robotic DNA sequence analyzer. These BAC fingerprints are rapidly edited using a previously developed computer software (GenoProfiler; You et al. 2006). Another computer program, FPC (Soderlund et al. 2000), searches for overlaps between BAC fingerprints, creating contiguous sequences of BAC clones (contigs). These contigs (Fig. 2) reflect the sequences of nucleotides along individual chromosomes. As of November 20, 2009, 124,890 BAC clones have been fingerprinted with the 5-dye SNaPshot fingerprinting technique. The fingerprints have been edited, and 113,073 could be used for contig assembly with the FPC program. A total of 916 contigs and 4,830 singletons were obtained. A total of 54,912 BAC end sequences (BES) have also been produced, one BES per BAC. Objective 2: Genetic and association mapping of economically important traits in walnut Genotyping of mapping populations to confirm their full-sib origin: The F1 mapping population consisting of 265 individuals of the cross “Chandler x Idaho” has been genotyped and parentage confirmed. We have augmented the DNA and it will be available for the SNP genotyping when the platform is ready in the first quarter of 2010. The phenotypic data on traits of breeding value: (1) Lateral vs. terminal bearing; (2) Leafing and harvesting dates; (3) Nut size; (4) Shell thickness; (5) Shell seal; (6) Plumpness; (7) Fill (nut/kernel ratio); (6) Kernel color and; (7) Yield have been recorded for the second year. Association mapping using the walnut germplasm collection: We have increased the association mapping population of English walnut to 452 trees and they have been genotyped using 21 microsatellite loci. A cluster analysis (CA) of the microsatellite data indicated mild genetic structure within cultivated walnut (Fig. 3). The elite germplasm consisting of cultivars, breeders’ selections, and germplasm frequently used in breeding programs showed moderate differentiation. The Chinese germplasm appeared to be unique and exhibited considerable
California Walnut Board 37 Walnut Research Reports 2009

divergence and closely allied with SE Asian germplasm. Walnuts from South Asia are found to be the most diverse and there was further evidence of differentiation within this group. A small group of West Asian germplasm is nested within this group. Both South and West Asian germplasm have been extensively used in the California breeding program. Overall, the cultivated walnut (Juglans regia) shows a marginal differentiation and is suitable for association genetic analysis. The principle component analysis (PCA) of the walnut microsatellite data basically confirmed the results of CA and however, the genetic differentiation among the groups is more amplified and elucidated lot clearly (Fig. 4). All the six groups illustrated in the CA were evident in the PCA, but there was significant overlapping among clusters and also the minimum spanning tree superimposed on the PC plot suggested that the there is still significant genetic affinity within and among the groups (Fig. 5). The data has been further analyzed to quantify and describe the genetic diversity in the collection. There is significant deficiency of heterozygotes at all loci as compared to Hardy-Weinberg expected frequencies (Table 1) indicating some level of population substructuring within the collection as illustrated in the cluster analysis. All the six groups exhibited in the CA and PCA showed significant inbreeding within groups suggesting a complex but still mild population structure within the walnut germplasm collection (Table 2). Orthogonal partitioning of genetic variation indicated that the most variation is locked up within groups among individuals (~87%) and only a small proportion of the total variation is explained by genetic differentiation among groups (13%) (Table 3). However, the FST indicated that there is still significant differentiation among groups. Objective 3: Functional mapping of the walnut genome Functional mapping represents a composite profile the transcriptome of walnut. The transcriptome represents the transcribed RNA of any particular organism. In plants, gene expression is both temporally and spatially regulated in different tissues and organ systems. A profile of the transcriptome in a plant organ such as fruit, for example, would sample all mRNA expressed in this organ, and thus represents all genes expressed in fruit. Since only the functional part of the genome is observed, this provides a rapid and direct way to analyze genes that regulate all of the different fruit traits expressed. The first step is the isolation of total RNA from the tissue. Messenger RNA that represents the transcripts of individual genes is about 1-3% of total RNA is first separated using magnetic beads with poly oligo-dT nucleotides that bind to the poly-A tails on mRNA molecules. The mRNA is then chemically fragmented and the single stranded mRNAs are converted to double-stranded cDNA via in vitro cDNA synthesis. Each mRNA population isolated from a particular walnut tissue and converted into a corresponding population of complimentary DNA (cDNA library) represents the mRNA population of a particular plant and tissue at a particular time during development. These cDNA libraries are ligated to adapters so that they can be PCR amplified to create sufficient quantities of molecules that then can be sequenced using the next generation of DNA sequencers that can profile an entire transcriptome in a single run using Solexa technology on an Illumina Genome Analyzer (http://genomecenter.ucdavis.edu/dna_technologies/uhtsequencing.html). Such new technologies are able to generate millions of sequences corresponding to a greater diversity of the mRNA
California Walnut Board 38 Walnut Research Reports 2009

population at a lower cost than traditional Sanger sequencing. A single library is loaded onto one lane in a GAII sequencer, which generates 10-20 million sequencing reads between 20-80 nucleotides in length from both ends of each cDNA molecule. The resulting sequences will be compiled to generate a reference walnut Unigene set, representing a high percentage of the walnut gene space. For this project, 16 samples of walnut tissue were gathered from Chandler trees in the Stuke block at UC Davis between April and October 2008 (Table 4). Four additional samples were taken from Chandler plant material maintained in the lab of Gale McGranahan. RNA isolation and construction of cDNA libraries for each sample has nearly been completed, with just two libraries remaining to be constructed (Table 4). Each cDNA sample will be sequenced separately so that the profile of genes expressed in each tissue can be determined. Paired-end (85bp x 85bp) sequencing is underway on an Illumina Genome Analyzer using Solexa technology. The sequencing of three libraries has just been completed, yielding 10-20 million paired-end sequences of 20-85 bp in length from each cDNA library. Bioinformatics for sequencing processing will be conducted at the UC Davis Genome Center Bioinformatics Core, where these sequences will be compiled with the 18,000 existing walnut ESTs to generate a Unigene set, which is expected to describe most of the expressed walnut genome. This set of genes will be annotated using Blast2GO (http://blast2go.bioinfo.cipf.es/; Götz et al. 2008). This software package was recently used to annotate the set of 8622 walnut genes compiled in our walnut-nematode project. There, Gene Ontology (GO) categories were assigned to 57% of the sequences, including 18% which were also matched to Enzyme Commission (EC) identifiers. The GO categories and EC identifiers can be used to map the associated proteins onto metabolic pathways. These data can then be used to determine which metabolic pathways are active in each tissue and at various time points in the growing season which is a functional map of the gene activities in walnut. Objective 4: Development of a ‘Walnut Genome Resource (WGR)’, a web-based knowledge base of walnut genomic information A genome resource or knowledgebase is a database that provides access to genetic, physical, and functional mapping data generated in this project. The resource, which is now web accessible (http://walnutgenome.ucdavis.edu/) will have two distinct components: one for visualizing the genetic map and one for visualizing the physical map. The database will provide access to all of the fingerprinting data along with the BAC end sequences (Fig. 1). Tools are available to integrate and represent this information as a physical map showing individual contigs (Fig. 2). The physical map is a scaffold on which we will integrate genetic mapping data of walnut phenotypic information, molecular markers, and expressed genes as that information becomes available. The main objective of functional mapping is gene annotation and functional categorization of ESTs, the first step toward linking specific traits and conditions to metabolic and biochemical processes. Every EST enters a functional mapping pipeline using Blast2GO to assign sequences to metabolic pathways, and in some cases, regulatory roles in quality traits, pathogen resistance and stress response. This data pipeline includes gene set enrichment, a statistical analysis to determine which pathways and functional classes are expressed at higher or lower levels,
California Walnut Board 39 Walnut Research Reports 2009

compared to the walnut Unigene set, in each tissue sample. Patterns in gene expression are visualized by unsupervised clustering, to reveal patterns in expression alone across several samples, and by functional visualizations. The Pathway Tools Omics Viewer (http://www.plantcyc.org; Zhang et al. 2005), and MapMan (http://mapman.gabipd.org; Thimm et al. 2004) visualization platforms can display high throughput expression data of individual genes and whole pathways in combination with standard pathway maps and graphical classifications of gene functions. We have used MapMan to visualize expression data from experiments on tomato, apple, citrus, and grape, in addition to walnut. REFERENCES Götz S, García-Gómez J.M., Terol J., Williams T.D., Nagaraj S.H., Nueda M.J., Robles M., Talón M.,
Dopazo J., Conesa A. (2008). High-throughput functional annotation and data mining with the Blast2GO suite. Nucleic Acids Res. 36:3420-3435.
Luo M.C., Thomas C., You F.M., Hsiao J., Ouyang S., Buell C.R., Malandro M., McGuire P.E., Anderson O.D., Dvorak J. (2003) High-throughput fingerprinting of bacterial artificial chromosomes using the SNaPshot labeling kit and sizing of restriction fragments by capillary electrophoresis. Genomics 82:378-389.
Soderlund C., Humphray S., Dunham A., French L. (2000) Contigs built with fingerprints, markers, and FPCV4.7. Genome Research 10:1772-1787.
Thimm, O., Blasing, O., Gibon, Y., Nagel, A., Meyer, S., Kruger, P., Selbig, J., Muller, L.A., Rhee, S.Y. Stitt, M. (2004). MAPMAN: a user-driven tool to display genomics data sets onto diagrams of metabolic pathways and other biological processes. The Plant Journal 37, 914-939.
Yu, J., Pressoir, G., Briggs, W.H., Bi, I.V., Yamasaki, M., Doebley, J.F., McMullen, M.D., Gaut, B.S., Nielsen, D.M., Holland, J.B., Kresovich, S. and Buckler, E.S. (2006). A unified mixed-model method for association mapping that accounts for multiple levels of relatedness. Nat. Genet., 38: 203-208.
Zhang, P., Foerster, H., Tissier, C., Mueller, L., Paley, S., Karp, P., Rhee, S.Y. (2005). MetaCyc and AraCyc. Metabolic Pathway Databases for Plant Research. Plant Physiology 138: 27-37.
California Walnut Board 40 Walnut Research Reports 2009

Table 1. Locus-wide genetic variability in walnut germplasm
Locus #Genotype H(o) H(e) P
WGA001 450 0.62222 0.80766 0.00000
WGA202 437 0.61327 0.83625 0.00000 WGA384 427 0.45902 0.58113 0.00000 WGA331 445 0.58652 0.65681 0.01330 WGA332 451 0.54767 0.64695 0.00011 WGA321 451 0.60310 0.72423 0.00000 WGA009 424 0.65566 0.77891 0.00000 WGA118 449 0.64588 0.79499 0.00000 WGA225 432 0.38889 0.49816 0.00000 WGA004 447 0.58166 0.68289 0.00000 WGA069 451 0.55876 0.81452 0.00000 WGA089 450 0.47778 0.66620 0.00000 WGA349 414 0.28986 0.82987 0.00000 WGA338 450 0.52000 0.55639 0.00975 WGA178 451 0.67184 0.74688 0.00657 WGA318 399 0.34837 0.82008 0.00000 WGA106 450 0.33556 0.42703 0.00011 WGA237 446 0.33632 0.59402 0.00000 WGA071 450 0.34222 0.38149 0.00010 WGA242 450 0.49556 0.65027 0.00000 WGA223 425 0.53412 0.82727 0.00000
California Walnut Board 41 Walnut Research Reports 2009

Table 2. Group specific fixation indices (inbreeding coefficient)
Group FIS P
China 0.08503 0.000000 SE Asia 0.14087 0.003910 Breeders’ gene pool 0.12687 0.000000 Bred 0.05423 0.076246 W Asia 0.09642 0.001955 S Asia 0.10898 0.000000
Table 3. Orthogonal partitioning of genetic variation within and among groups
Source of Sum of Variance Percentage Fixation variation d.f. squares components of variation index
Among groups 5 523.378 0.70793 13.37** 0.134** Within groups 898 4118.848 4.58669 86.63**
Total 903 4642.226 5.29462
California Walnut Board 42 Walnut Research Reports 2009

Table 4: Functional mapping of the walnut genome (Objective 3), walnut tissues gathered April to Nov 2008 for cDNA library construction and EST analysis Sample No
Tissue Source
Genotype Developmental Stage
Source Harvest Date
Code cDNA Library
RNA-seq done
1 Vegetative Bud
Chandler Vegetative Tree 4/1/08 VB Yes Done
2 Leaf - Young
Chandler Vegetative Tree 4/15/08 LY Yes Done
3 Root Chandler Vegetative Pot 8/27/08 RT Yes Done 4 Callus
Interior Chandler Vegetative In
Vitro 10/14/08 CI Yes Waiting
5 Callus Exterior
Chandler Vegetative In Vitro
10/14/08 CE Yes Done
6 Pistillate Flower
Chandler Vegetative Tree 4/17/08 FL Yes Done
7 Catkins Chandler Immature Tree 4/1/08 CK Yes Done 8 Somatic
Embryo Chandler Immature In
Vitro 10/14/08 SE Yes Done
9 Leaf- mature
Chandler Vegetative Tree 6/5/08 LM Yes Waiting
10 Leaves Chandler Vegetative Tree 4/17/08 LE Yes Waiting 11 Fruit
immature Mixed Immature Tree 6/5/08 IF Yes Waiting
12 Hull immature
Chandler Immature Tree 6/5/08 HL Yes Waiting
13 Packing Tissue
Chandler Immature Tree 6/5/08 PT Yes Waiting
14 Hull Peel Chandler Mature Tree 9/4/08 HP Yes Waiting 15 Hull
Cortex Chandler Mature Tree 9/4/08 HC Yes Waiting
16 Packing Tissue
Chandler Mature Tree 9/4/08 PK Yes Waiting
17 Pellicle Chandler Mature Tree 9/4/08 PL No No 18 Embryo Mixed Mature Tree 9/4/08 EM Yes Done 19 Leaf – late Chandler Senescent Tree 10/15/08 LS No No 20 Hull –
dehiscing Chandler Senescent Tree 10/15/08 HU Yes Waiting
21 Transition wood
J.nigra Transition Zone
Tree 04/02/08 KW Yes Waiting
California Walnut Board 43 Walnut Research Reports 2009
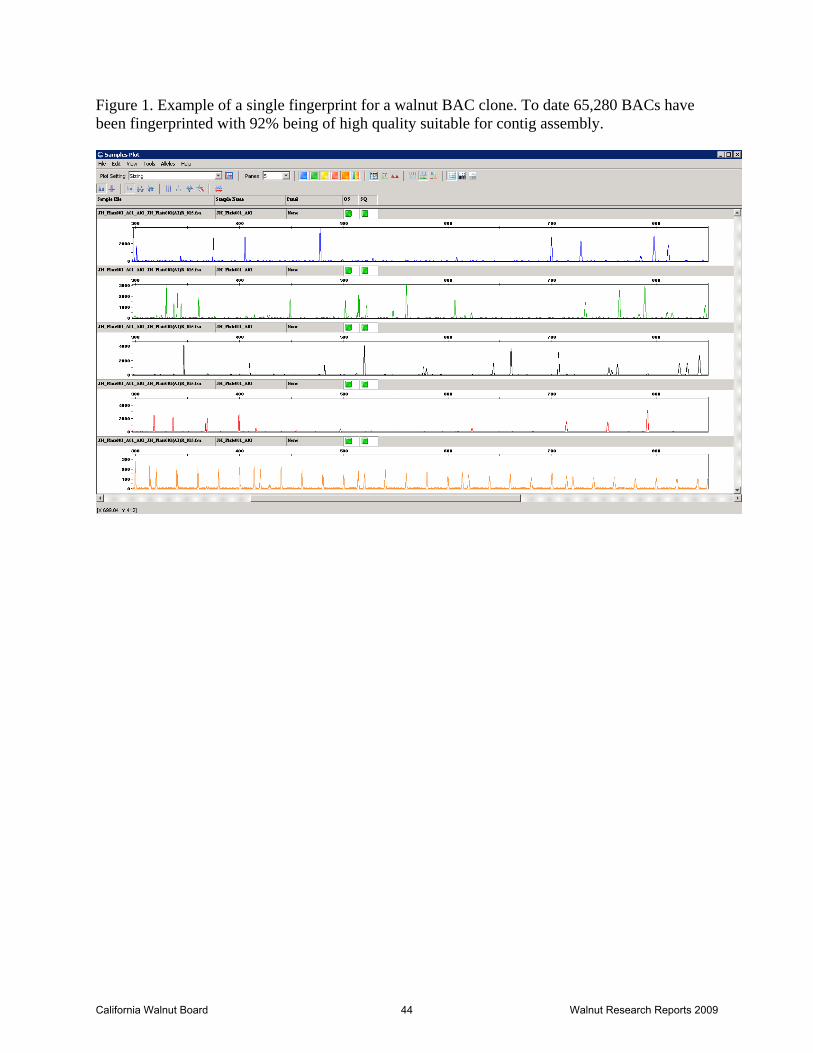
Figure 1. Example of a single fingerprint for a walnut BAC clone. To date 65,280 BACs have been fingerprinted with 92% being of high quality suitable for contig assembly.
California Walnut Board 44 Walnut Research Reports 2009
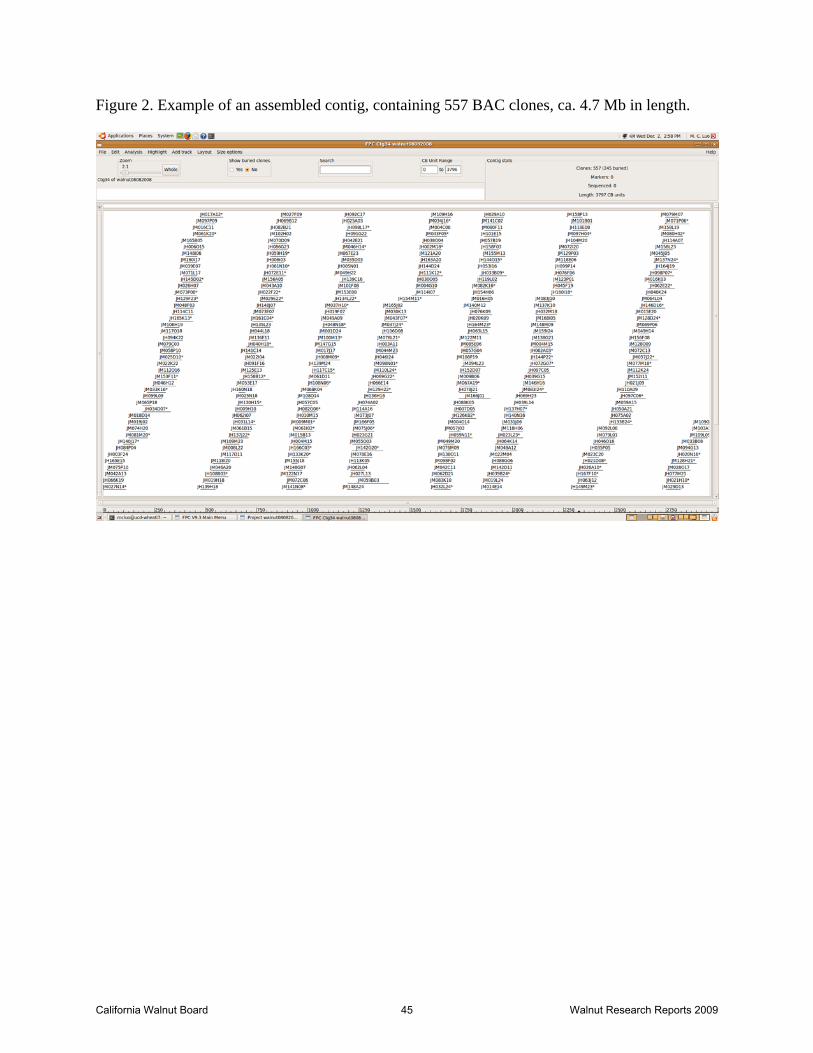
Figure 2. Example of an assembled contig, containing 557 BAC clones, ca. 4.7 Mb in length.
California Walnut Board 45 Walnut Research Reports 2009

0361 01 CHINA 0370 04 CHINA 0362 10 CHINA 0366 01 CHINA 0370 10 CHINA 0466 Xinjiang7 CHINA 0370 01 CHINA 0370 07 CHINA 0370 02 CHINA 0370 03 CHINA 0360 08 CHINA 0371 01 CHINA 0372 01 CHINA0348 01 CHINA 0348 04 CHINA 0349 01 CHINA
0350 04 CHINA0362 01 CHINA
0313 01 USSR
0377 03 CHINA0315 03 USSR 0315 04 USSR
0361 06 CHINA0361 09 CHINA 0361 03 CHINA
0373 03 CHINA 0373 05 CHINA
0375 10 CHINA
0383 02 CHINA0383 05 CHINA 0377 02 CHINA
0379 03 CHINA0379 06 CHINA
0379 02 CHINA
0379 04 CHINA0148 USSR
0334 04 CHINA
0162 unk
0338 02 CHINA85 8
Sexton
0351 01 CHINA
0381 07 CHINA
0382 02 CHINA
0373 01 CHINA
0381 01 CHINA
0350 05 CHINA
0350 06 CHINA 0364 02 CHINA
0381 05 CHINA
0363 03 CHINA
0345 01 CHINA
0347 03 CHINA
0361 07 CHINA
0347 01 CHINA
0347
04 CHINA01
22 04 P
AKISTAN
0347
02 CHINA
0347
07 CHIN
A
0355
03 CHIN
A
0377
12 C
HINA
0377
05 C
HINA
0332
01 C
HINA
0342
04 C
HINA
0375
07 C
HINA
0370
06 C
HINA
0375
02 C
HINA
0370
09 C
HINA
0375
03 C
HINA
0350
02 C
HINA
0376
05 C
HINA
0372
02 C
HINA
0381
04 C
HINA
0377
11 C
HINA
0373
04 C
HINA
0373
06
CHIN
A
0362
08
CHIN
A
0375
08
CHIN
A 0375
01
CHIN
A
0384
06
CHIN
A
0340
01
CHIN
A
0340
05
CHIN
A
0340
04
CHIN
A
0340
06
CHIN
A
0340
02
CHIN
A
0360
01
CHIN
A
0363
04
CHIN
A
0384
08
CHIN
A
0355
09
CHIN
A 0384
02
CHIN
A
0384
19
CHIN
A
0384
03
CHIN
A
0384
04
CHIN
A
0384
11
CHIN
A
0338
04
CHIN
A
0359
02
CHIN
A
0338
07
CHIN
A
0342
07
CHIN
A
0384
14
CHIN
A
0339
04
CHIN
A
0384
01
CHI
NA03
40 0
3 CH
INA
0342
02
CHI
NA
0378
05
CH
INA
0378
07
CH
INA
0378
08
CH
INA
0378
01
CH
INA
0378
04
CH
INA
0339
02
CH
INA
0343
02
CH
INA
0379
01
CH
INA
0378
02
CH
INA
0378
03
CH
INA 02
61 0
1 PA
KIS
TAN
0262
02
PAK
ISTA
N
0353
02
CH
INA
0353
11
CH
INA
0353
10
CH
INA
0354
05
CH
INA
0353
03
CH
INA
035 3
08
CH
INA
0354
03
CH
I NA
0354
06
CH
INA
0354
02
CH
INA
0 354
09
CH
INA
0353
09
CH
INA
0352
01
CH
INA
0355
01
CH
INA
0354
07
CH
INA
0353
01
CH
INA
0355
05
CH
INA
0355
06
CH
INA
0246
01
PAK
ISTA
N
0246
03
PAK
ISTA
N02
46 0
4 PA
KIS
TAN
0356
01
CH
INA
0356
03
CH
INA
0356
02
CHI
NA
0356
04
CHIN
A02
62 0
3 PA
KIS
TAN
0423
CH
INA
0464
Sha
nXi4
CHI
NA
0334
01
CHIN
A
0334
02
CHIN
A
0468
Yun
an1
CHIN
A
0469
Yna
n2 C
HINA
0338
06
CHIN
A
Man
regi
an01
01 D
18
6 CH
INA
0139
USS
R
0480
Cho
nwon
14 K
orea
0126
unk
0146
KO
REA
0151
KO
REA
0478
Yon
gdon
g6 K
ORE
A
0479
Yon
gdon
g24
KORE
A
0481
Yon
gdon
g lo
cal K
orea
0123
USS
R
0137
unk
0314
02
USSR
0141
unk
0153
unk02
57 0
3 PA
KIST
AN02
58 0
1 PA
KIST
AN
0256
01 P
AKIS
TAN
0260
05 P
AKIS
TAN
0240
01 P
AKIST
AN
0262
01 P
AKISTA
N
0383
06 C
HINA
0239
02 P
AKISTA
N
0259
02 P
AKISTA
N
0250
03 P
AKISTA
N
0250
05 P
AKISTA
N
0244
02 P
AKISTA
N
0253
04 P
AKISTA
N
0274
01 P
AKISTA
N
0270
02 PAKISTAN
0270
03 PAKISTAN
0133
USSR
0270
06 PAKISTAN
0086
01 U
SSR
0086
02 USSR
0315
01B USSR 02
72 05
PAKISTAN
0272
07 PAKISTAN
0085 01 NEPAL
0267 03 PAKISTAN
0267 06 PAKISTAN
0267 07 PAKISTAN
0267 02 PAKISTAN
0267 01 PAKISTAN
0267 04 PAKISTAN
0264 01 PAKISTAN
0267 05 PAKISTAN
0267 08 PAKISTAN
0269 04 PAKISTAN
0272 06 PAKISTAN
0272 03 PAKISTAN
0272 09 PAKISTAN0263 04 PAKISTAN
0263 06 PAKISTAN
0269 07 PAKISTAN
0269 08 PAKISTAN
0269 03 PAKISTAN
0269 06 PAKISTAN
0239 03 PAKISTAN
0487 Seri3 INDIA
0490 Seri2 INDIA
Earliest
0269 02 PAKISTAN
0258 02 PAKISTAN
0258 03 PAKISTAN
0275 01 PAKISTAN
0275 02 PAKISTAN
0275 05 PAKISTAN
0275 06 PAKISTAN
0275 03 PAKISTAN
0275 04 PAKISTAN
0253 01 PAKISTAN
0253 02 PAKISTAN
0255 02 PAKISTAN0255 03 PAKISTAN
0269 01 PAKISTAN
0269 05 PAKISTAN
0274 03 PAKISTAN
0274 05 PAKISTAN
0264 05 PAKISTAN
0264 03 PAKISTAN0272 08 PAKISTAN
0489 Tandari5sdlg2 INDIA
0122 23 PAKISTAN0122 26 PAKISTAN
0122 13 PAKISTAN0122 17 PAKISTAN
0122 19 PAKISTAN0266 03 PAKISTAN
0270 04 PAKISTAN0266 01 PAKISTAN
0266 04 PAKISTAN0266 02 PAKISTAN0266 05 PAKISTAN0250 04 PAKISTAN
0250 06 PAKISTAN0140 USSR
0251 01 PAKISTAN
0251 03 PAKISTAN0226 0 13 1048 AFGHANISTAN
0334 03 CHINA
0336 03 CHINA0085 02 NEPAL
0254 03 PAKISTAN0337 01 CHINA
0270 01 PAKISTAN0270 05 PAKISTAN
0088 01 USSR
0263 03 PAKISTAN
0246 02 PAKISTAN
0250 01 PAKISTAN
0244 01 PAKISTAN
0316 01 USSR
0252 01 PAKISTAN0247 04 PAKISTAN
0260 04 PAKISTAN
0247 01 PAKISTAN
0247 03 PAKISTAN
0247 02 PAKISTAN
0247 05 PAKISTAN
0268 02 PAKISTAN
0268 03 PAKISTAN
0259 01 PAKISTAN
0259 04 PAKISTAN
0257 02 PAKISTAN
0259 03 PAKISTAN
0257 01 PAKISTAN
0268 01 PAKISTAN
0265 01 PAKISTAN
0265 02 PAKISTAN
0265 03 PAKISTAN
0485 NagaBagh INDIA
0243 05 PAKISTAN
0255 01 PAKISTAN
0241 01 PAKISTAN
0243 01 PAKISTAN
0243 02 PAKISTAN
0243 04 PAKISTAN
0243 03 PAKISTAN
0243 07 PAKISTAN0243 06 PAKISTAN
0243 08 PAKISTAN
0191 03 USSR
0191 08 USSR
0191 01 USSR
0191 02 USSR0191
04 USSR
0191 06
USSR
0191
07 USSR
0191
05 USSR
0191
09 U
SSR
0224
0 38
1207
AFGHANISTAN
0192
05 U
SSR01
92 08
USSR
0192
03 U
SSR0192
01 U
SSR
0192
04 U
SSR
0192
06 U
SSR
0192
02 U
SSR
0192
07 U
SSR
0482
Tan
dari6
sdlg1
INDIA
0488
Tan
dari5
sdlg1
INDIA
0483
Tan
dari6
sdlg
4 INDIA
0274
02 P
AKISTA
N02
74 04
PAKI
STAN
0102
Indi
a IND
IA02
63 0
2 PAK
ISTA
N
0486
Lan
gTha
cha
INDI
A
0272
01
PAKI
STAN
0272
11
PAKI
STAN
0272
04
PAKI
STAN
0272
10
PAKI
STAN
0475
Hen
zal P
AKIS
TAN
0315
02
USSR
0189
01
USSR
0189
04
USSR
0239
01
PAKI
STAN
0333
01
CHIN
A02
73 0
1 PA
KIST
AN0273
03
PAKI
STAN
0471
Pak
ista
n231
PAK
ISTA
N
0472
Tile
PAK
ISTA
N
0416
Cha
seD9
USA
Chas
eD9
Adam
s10
Shar
key
Bada
joz
New
One
Casc
ade
Fern
ette
61 2
5Lara
56 2
24H
owar
d76
80
Cha
ndle
rFo
rde
95 2
6 22
Chi
coGill
ette
0254
02
PAK
ISTA
N03
38 0
8 C
HIN
AA
mig
o04
61 1
8256
E6 U
SATr
iplo
id03
16 0
2 U
SSR
0407
Geo
agiu
44 4
360
RO
MA
NIA
0147
unk
0491
Che
inov
o sd
BU
LGA
RIA
Che
inov
o sd
0410
Bul
garia
3 B
ULG
AR
IA00
98 S
inen
sis7
JAP
ANSi
n ens
is5
0143
USS
R0 4
1 3 N
n88G
ody n
PO
LAN
D01
45 U
SSR
0154
unk
0165
0 7
0 13
07 A
FGH
AN
ISTA
N0
20 1
072
0134
67
103
USA
67 1
3Tw
iste
rTu
lare
SirB
onSe
rr
0099
PI1
5956
8 A
FGH
AN
ISTA
N59
124
Sunl
and
0188
01
USS
R
0190
01
USS
R
0492
Kru
snsk
y sd
BU
LGAR
IA
0138
HU
NGAR
Y
0158
HU
NGAR
Y01
59 u
nk
0163
HUN
GAR
Y
0160
HUN
GAR
Y
0171
Idah
o US
A01
29 U
SSR
0150
HUN
GAR
Y
0152
USS
R
0125
USS
R01
32 u
nk
0144
USS
R0155
USS
R
0161
USS
R
0164
unk
Also
szen
t
0411
RVi
ii6 P
OLAN
D
0412
RXi
ii4 P
OLAN
D021
4 01
MEX
ICO
0214
02
MEX
ICO
0214
04
MEX
ICO
0214
03
MEX
ICO
0190
02
USSR
0190
03
USSR
0470
Jpur
pure
a GER
MANY
Red
Zing
er
Wee
per
Loze
ronn
e77 12
Ronde
de M
ont
0189
02 U
SSR
0189
03 U
SSR
0111
74 26
6 USA
0315
01C U
SSR
Gustin
e
March
ettiLo
mpocAsh
ley
Payne
49 46
Vina68 1
04
0170
Howe USA
0106
74 25
6 USA
0178 7
4 256
USA74 259
59 165
0108 74 253 USA
0109 74 245 USA
0228 53 128 unk
EarlyEhrhardt
Placentia
0180 Hartley CHINA
Klopping
PedroCisco
ConwayMayette
CarmelloPioneer
0229 61 12 unkPoe
0414 Verdot FRANCEConcha
0415 Meylannaise FRANCEMeylanXXXMayette
MoyerFranquetteFernor
0477 Elit YUGOSLAVIA
0173 ScharschFranquette USA
C0106 Franquette FRANCE0166 73 16 unk
0177 WFranquette FRANCE
GravesFranquette
0.02
Figure 3. An unrooted tree depicting the genetic structure and differentiation within the walnut (Juglans regia) germplasm collection based on 21 microsatellite loci.
California Walnut Board 46 Walnut Research Reports 2009

Figure 4. 3D projection of walnut germplasm along the first three principle axes.
California Walnut Board 47 Walnut Research Reports 2009

Figure 5. 3D projection of walnut germplasm accessions along the first three PC axes with minimum spanning tree superimposed.
California Walnut Board 48 Walnut Research Reports 2009