walter reed army medical center building t-2 …wrair walter reed army institute of research wramc...
TRANSCRIPT
WALTER REED ARMY MEDICAL CENTER BUILDING T-2 RADIOLOGICAL DECOMISSIONING FINAL STATUS SURVEY
Prepared by:
LTC John Mercier, Ph.D., WRAMC Health Physics Office and
Mr. Joseph Weismann, CHP, Cabrera Services
14 October 2004
WRAMC Building T-2 Final Status Survey 14 Oct 2004
EXECUTIVE SUMMARY WALTER REED ARMY MEDICAL CENTER (WRAMC)
FINAL STATUS SURVEY FOR RADIOLOGICAL DECOMMISSIONING OF BUILDING T-2
PURPOSE. To perform a Final Status Survey (FSS) on portions of the WRAMC Building T-2 to determine if it may be released for unrestricted use in accordance with U.S. Nuclear Regulatory Commission (NRC) regulations. CONCLUSIONS.
A. A FSS of nine Class 2 survey units was performed in former laboratories in Building T-2. The survey was designed and implemented in accordance with the MARSSIM manual (NRC NUREG 1575, August 2000).
B. All survey unit measurements were observed to be below the calculated DCGLW
values. C. The results of this FSS show that the current condition of Building T-2
satisfactorily meets the NRC release criteria for unrestricted use.
1
WRAMC Building T-2 Final Status Survey 14 Oct 2004
ACRONYMS AND ABBREVIATIONS DCGLW Derived Concentration Guideline Level, Average DCGLEMC Derived Concentration Guideline Level, Elevated Measurement Comparison FSS Final Status Survey HTDR Hard to detect radionuclide HPO Health Physics Office MARSSIM Multi-Agency Radiation Survey and Site Investigation Manual NIST National Institute of Standards and Technology ROC Radionuclide of Concern SU Survey unit WRAIR Walter Reed Army Institute of Research WRAMC Walter Reed Army Medical Center REFERENCES ISO, 1998 ISO-7503-1. International Standards Organization, Evaluation of Surface
Contamination – Part 1: Beta-emitters (maximum beta energy greater than 0.15 MeV) and alpha-emitters, ISO ISO-7503-1, 1988.
NRC, 1998 NUREG-1505. U.S. Nuclear Regulatory Commission, A Nonparametric Statistical Methodology for the Design and Analysis of Final Status Decommissioning Surveys, Interim Draft Report for Comment and Use, NUREG-1505 Rev.1 , 1998.
NRC, 1999 NUREG-5512. U.S. Nuclear Regulatory Commission, Residual Radioactive Contamination from Decommissioning Parameter Analysis, Draft Report for Comment, NUREG/CR-5512, Vol. 3, 1999.
NRC, 2000 NUREG-1575. U.S. Nuclear Regulatory Commission, Multi-Agency Radiation Survey and Site Investigation Manual (MARSSIM), NUREG-1575 Rev. 1, August 2000.
NRC, 2003 NUREG-1757. U.S. Nuclear Regulatory Commission, Consolidated NMSS Decommissioning Guidance, NUREG-1757, Vol. 1-3, September 2003.
PNNL, 2002 Visual Sample Plan Software, Version 2.2. Battelle Memorial Institute. 2002
2
WRAMC Building T-2 Final Status Survey 14 Oct 2004
INTRODUCTION Building T-2 houses former laboratories used for biomedical research and clinical investigation activities at Walter Reed Army Medical Center (WRAMC). Building T-2 is slated for demolition pending completion of FSS activities and release for unrestricted use. Following demolition, the site Building T-2 currently occupies is expected to be filled with a multi-level parking garage. This report documents the results and protocol of the completed Final Status Survey (FSS) performed for Building T-2. This FSS is designed to be compliant with the guidance found in the Multi-Agency Radiation Survey and Site Investigation Manual (MARSSIM, NRC, 2000). The MARSSIM provides standardized and consistent approaches for planning, conducting, evaluating and documenting radiological surveys, with a specific focus on FSS activities carried out to demonstrate compliance with license termination regulations. SCOPE OF FSS AND SUMMARY OF PROTOCOL This FSS is comprised of nine (9) survey units (SU), classified as MARSSIM Class 2, based on information found during performance of the Building T-2 Historical Site Assessment (HSA) dated 7 May 2004. This FSS will be used to demonstrate that the residual radionuclide concentrations following remediation comply with concentration and exposure-based criteria. The objective of FSS activities is to obtain data of sufficient quality and quantity to support an evaluation of the criteria for Building T-2. The scope of the surveys performed included:
• Interior beta scan surveys; • Fixed-point (static) measurements at designated locations; • Judgment static measurements for tritium (H-3) with a windowless gas proportional
detector; • Smear surveys for removable contamination at the same locations as the fixed-point
measurements; and • NaI gamma scoping surveys in each SU.
Detailed descriptions of FSS design and execution protocol governing this effort may be found in Appendix C. All instruments used during this investigation were monitored daily using sources traceable to the National Institute of Standards and Technology (NIST) and control charts. Control charts for each instrument and calibration certificates for the instruments and radioactive sources used during the project can be found in Appendix D.
3
WRAMC Building T-2 Final Status Survey 14 Oct 2004
SUMMARY OF RESULTS Fixed-Point Measurements at Systematic Locations One-minute counts were taken with a Ludlum 43-68 gas-flow proportional detector at each SU systematic location and logged on applicable FSS data sheets. There were a minimum of 20 fixed-point measurements performed in each SU. Each SU also had (5) 1-minute ambient background measurements collected in the center of the room. There were no measurements that exceeded the weighted DCGLW for any SU. The results of all fixed-point measurements are provided in column 7 of the FSS Summary Data Sheets in Appendix A. Fixed-Point Measurements at Biased Locations Biased locations were added to the systematic sampling grid if an Action Level was exceeded during the scan survey or at the discretion of the scanning operator if he deemed further investigation would be prudent. Biased fixed-point locations are noted at the bottom portion the results listed in column 7 of the FSS Data Summary Tables, provided as Appendix A. Biased locations are also notated on the FSS SU Maps provided in Appendix B. No biased location counts were observed to be greater than the SU-specific weighted DCGLW. Supplemental Fixed-Point Measurements for H-3 In addition to the systematic static measurements described above, judgment sampling for the presence of H-3 was also attempted using a windowless proportional detector. One-minute background and sample counts were collected in a sampling of Building T-2 SUs to supplement systematic measurements and removable swipe data in order to better report the potential presence of H-3 in these survey units. A summary of locations and results of each of these measurements is provided in Appendix A. Location markers are also provided on the FSS SU maps provided in Appendix B. It should be noted that the stated “H-3 Residual Activity” is conservatively assumed to be entirely due to H-3. In actual fact, a portion (or even all) of the gross residual count rate may be attributable to the ROCs. However, for the sake of evaluating potential H-3 contamination, this assumption was deemed appropriate.
4
WRAMC Building T-2 Final Status Survey 14 Oct 2004
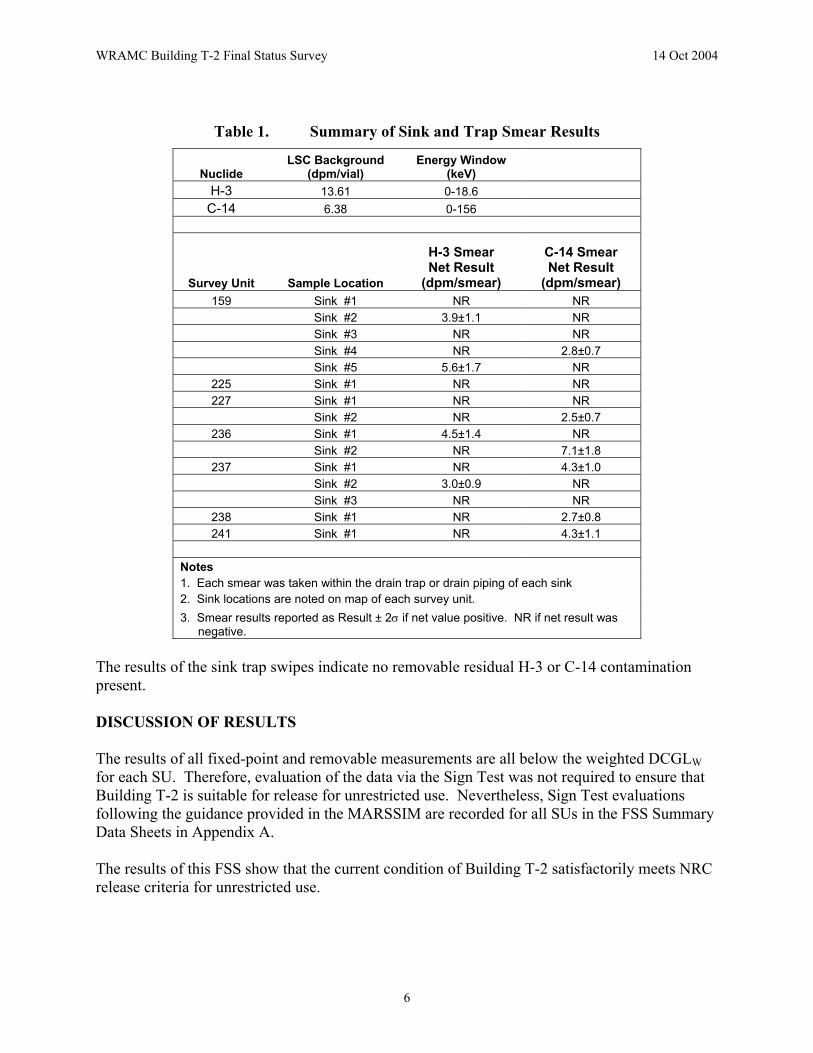
Floor Scan Surveys Scan surveys of floor surfaces were performed with a Ludlum Model 239-1F floor monitor in all SUs in accordance with protocol and coverage requirements prescribed in Appendix C. Locations of spots marked for follow-up static counts and swipes are noted on FSS SU maps in Appendix B. All scan survey results were less than instrument action levels. Wall and Work Surface Scan Surveys Wall and work surface surveys were performed using a Ludlum 43-68 gas-flow proportional detector at the coverage criteria stated in the protocol. 100% of work surfaces (e.g. countertops, sinks, hoods) and 25% of lower wall surfaces (< 2 meters, m) were scanned in each SU. No measurements in excess of instrument action limits were observed during these surveys. Gamma Scoping Surveys Gamma scans with a 3-inch by 3-inch (3×3) sodium-iodide (NaI) detector were performed in all SUs to supplement the prescribed beta static and removable swipe measurements. The scans were performed on all floor and work surfaces with a focus on detecting spots of contamination in excess of ambient background. No measurements in excess of instrument action limits were observed during these surveys. Measurements for Removable Contamination Swipes wetted with water were collected at each of the systematic and biased SU locations where fixed-point measurements were taken. The swipes were wetted to enhance collection of H-3 contamination. All swipes were prepared and counted in a Packard Tri-Carb TR2500 liquid scintillation analyzer for beta contamination. Gross alpha and beta contamination levels are reported by applying efficiencies to known calibration standards traceable to the NIST. Smear results are reported in columns 10 and 11 of the FSS Summary Data Sheets in Appendix A. The results are reported for H-3 and C-14 in units of dpm ± 2-sigma (σ) per 100 cm2. If the net swipe result was less than 1 dpm, the measurement was flagged as “NR” or “Not Reported.” All swipe results for H-3 and C-14 were less than 9.7 and 4.2 dpm per 100 cm2, respectively. In addition to the swipes collected at systematic and biased locations prescribed in the survey protocol, swipes were also collected from piping of all sinks located in impacted laboratories. Swipes were taken either from within the drain trap or within the drain piping that runs between the sink and trap, depending on accessibility. These swipes were collected to investigate the potential for residual contamination from nuclides that were disposed down lab sinks in the past. A summary of these swipe results are shown in Table 1.
5
WRAMC Building T-2 Final Status Survey 14 Oct 2004
Table 1. Summary of Sink and Trap Smear Results
Nuclide LSC Background
(dpm/vial) Energy Window
(keV) H-3 13.61 0-18.6 C-14 6.38 0-156
Survey Unit Sample Location
H-3 Smear Net Result
(dpm/smear)
C-14 Smear Net Result
(dpm/smear) 159 Sink #1 NR NR
Sink #2 3.9±1.1 NR Sink #3 NR NR Sink #4 NR 2.8±0.7 Sink #5 5.6±1.7 NR
225 Sink #1 NR NR 227 Sink #1 NR NR
Sink #2 NR 2.5±0.7 236 Sink #1 4.5±1.4 NR
Sink #2 NR 7.1±1.8 237 Sink #1 NR 4.3±1.0
Sink #2 3.0±0.9 NR Sink #3 NR NR
238 Sink #1 NR 2.7±0.8 241 Sink #1 NR 4.3±1.1
Notes 1. Each smear was taken within the drain trap or drain piping of each sink 2. Sink locations are noted on map of each survey unit. 3. Smear results reported as Result ± 2σ if net value positive. NR if net result was
negative. The results of the sink trap swipes indicate no removable residual H-3 or C-14 contamination present. DISCUSSION OF RESULTS The results of all fixed-point and removable measurements are all below the weighted DCGLW for each SU. Therefore, evaluation of the data via the Sign Test was not required to ensure that Building T-2 is suitable for release for unrestricted use. Nevertheless, Sign Test evaluations following the guidance provided in the MARSSIM are recorded for all SUs in the FSS Summary Data Sheets in Appendix A. The results of this FSS show that the current condition of Building T-2 satisfactorily meets NRC release criteria for unrestricted use.
6
WRAMC Building T-2 Final Status Survey 14 Oct 2004
CONCLUSIONS
A. A FSS of nine Class 2 survey units was performed in former laboratories in Building T-2. The survey was designed and implemented in accordance with the MARSSIM manual (NRC NUREG 1575, August 2000).
B. All survey unit measurements were observed to be below the calculated DCGLW
values. C. The results of this FSS show that the current condition of Building T-2
satisfactorily meets the NRC release criteria for unrestricted use.
7
WRAMC Building T-2 Final Status Survey 14 Oct 2004
APPENDIX A
Building T-2 FSS SU Data Sheets from May 2004 (Rooms 15, 159, 225, 227, 236, 237, 238, 240 and 241)
and Fixed Point Windowless Counter data for SUs with H-3 History
Survey Unit Final Status Survey Summary Data SheetWRAMC Building T2 Decommissioning
May 2004
Survey Date: 11-May-04 Survey Instruments Survey Type Ratemeter
S/NProbe
S/N
Window Density
Thickness (mg/cm2)
Total Efficiency1
Probe Active Area (cm2)
Planning MDC (dpm/100cm2)
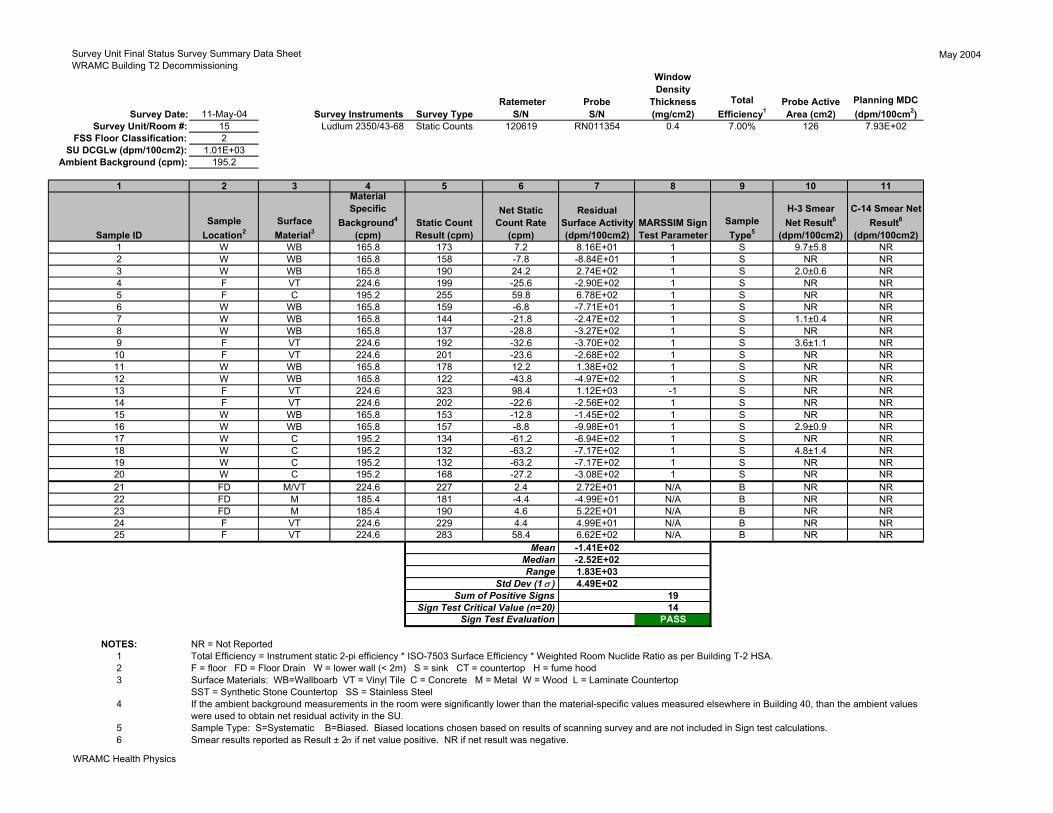
Survey Unit/Room #: 15 Ludlum 2350/43-68 Static Counts 120619 RN011354 0.4 7.00% 126 7.93E+02FSS Floor Classification: 2
SU DCGLw (dpm/100cm2): 1.01E+03Ambient Background (cpm): 195.2
1 2 3 4 5 6 7 8 9 10 11
Sample IDSample
Location2Surface Material3
Material Specific
Background4
(cpm)Static Count Result (cpm)
Net Static Count Rate
(cpm)
Residual Surface Activity(dpm/100cm2)
MARSSIM Sign Test Parameter
Sample Type5
H-3 SmearNet Result6
(dpm/100cm2)
C-14 Smear Net Result6
(dpm/100cm2)1 W WB 165.8 173 7.2 8.16E+01 1 S 9.7±5.8 NR2 W WB 165.8 158 -7.8 -8.84E+01 1 S NR NR3 W WB 165.8 190 24.2 2.74E+02 1 S 2.0±0.6 NR4 F VT 224.6 199 -25.6 -2.90E+02 1 S NR NR5 F C 195.2 255 59.8 6.78E+02 1 S NR NR6 W WB 165.8 159 -6.8 -7.71E+01 1 S NR NR7 W WB 165.8 144 -21.8 -2.47E+02 1 S 1.1±0.4 NR8 W WB 165.8 137 -28.8 -3.27E+02 1 S NR NR9 F VT 224.6 192 -32.6 -3.70E+02 1 S 3.6±1.1 NR10 F VT 224.6 201 -23.6 -2.68E+02 1 S NR NR11 W WB 165.8 178 12.2 1.38E+02 1 S NR NR12 W WB 165.8 122 -43.8 -4.97E+02 1 S NR NR13 F VT 224.6 323 98.4 1.12E+03 -1 S NR NR14 F VT 224.6 202 -22.6 -2.56E+02 1 S NR NR15 W WB 165.8 153 -12.8 -1.45E+02 1 S NR NR16 W WB 165.8 157 -8.8 -9.98E+01 1 S 2.9±0.9 NR17 W C 195.2 134 -61.2 -6.94E+02 1 S NR NR18 W C 195.2 132 -63.2 -7.17E+02 1 S 4.8±1.4 NR19 W C 195.2 132 -63.2 -7.17E+02 1 S NR NR20 W C 195.2 168 -27.2 -3.08E+02 1 S NR NR21 FD M/VT 224.6 227 2.4 2.72E+01 N/A B NR NR22 FD M 185.4 181 -4.4 -4.99E+01 N/A B NR NR23 FD M 185.4 190 4.6 5.22E+01 N/A B NR NR24 F VT 224.6 229 4.4 4.99E+01 N/A B NR NR25 F VT 224.6 283 58.4 6.62E+02 N/A B NR NR
Mean -1.41E+02Median -2.52E+02Range 1.83E+03
Std Dev (1σ ) 4.49E+02Sum of Positive Signs 19
Sign Test Critical Value (n=20) 14Sign Test Evaluation PASS
NOTES: NR = Not Reported1 Total Efficiency = Instrument static 2-pi efficiency * ISO-7503 Surface Efficiency * Weighted Room Nuclide Ratio as per Building T-2 HSA.2 F = floor FD = Floor Drain W = lower wall (< 2m) S = sink CT = countertop H = fume hood3 Surface Materials: WB=Wallboarb VT = Vinyl Tile C = Concrete M = Metal W = Wood L = Laminate Countertop
SST = Synthetic Stone Countertop SS = Stainless Steel4
5 Sample Type: S=Systematic B=Biased. Biased locations chosen based on results of scanning survey and are not included in Sign test calculations.6 Smear results reported as Result ± 2σ if net value positive. NR if net result was negative.
If the ambient background measurements in the room were significantly lower than the material-specific values measured elsewhere in Building 40, than the ambient values were used to obtain net residual activity in the SU.
WRAMC Health Physics
Survey Unit Final Status Survey Summary Data SheetWRAMC Building T2 Decommissioning
May 2004
Survey Date: 11-May-04 Survey Instruments Survey Type Ratemeter
S/NProbe
S/N
Window Density
Thickness (mg/cm2)
Total Efficiency1
Probe Active Area (cm2)
Planning MDC (dpm/100cm2)
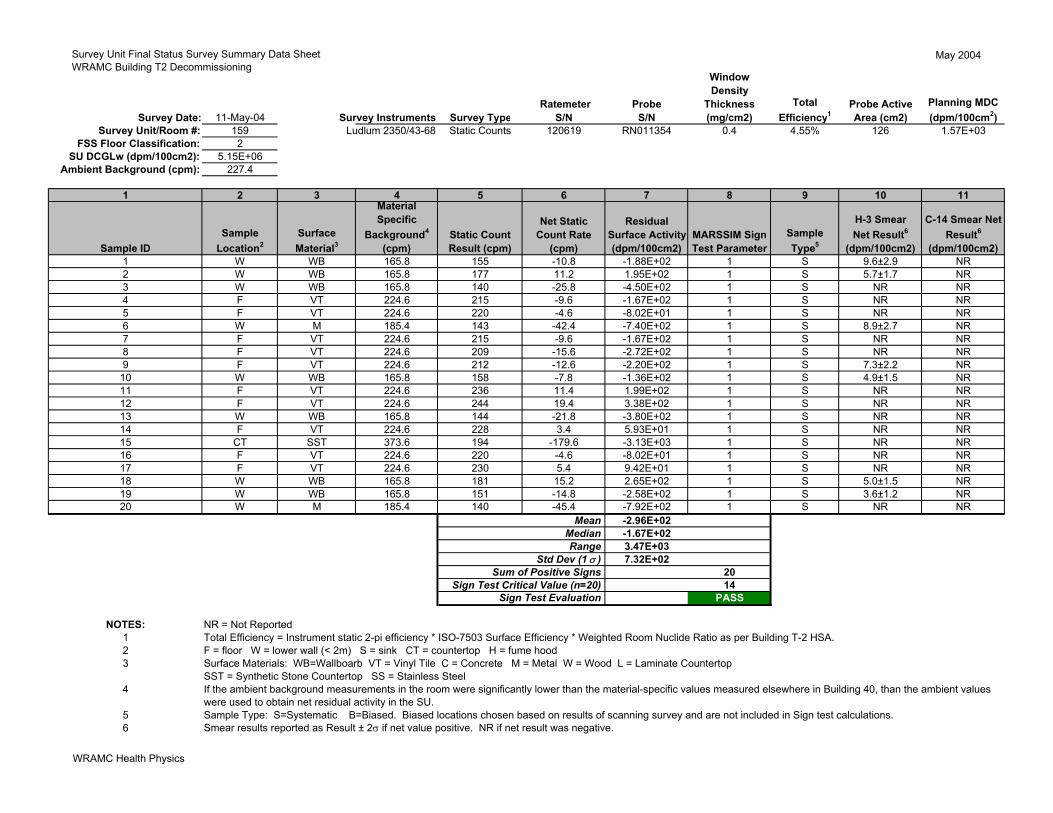
Survey Unit/Room #: 159 Ludlum 2350/43-68 Static Counts 120619 RN011354 0.4 4.55% 126 1.57E+03FSS Floor Classification: 2
SU DCGLw (dpm/100cm2): 5.15E+06Ambient Background (cpm): 227.4
1 2 3 4 5 6 7 8 9 10 11
Sample IDSample
Location2Surface Material3
Material Specific
Background4
(cpm)Static Count Result (cpm)
Net Static Count Rate
(cpm)
Residual Surface Activity(dpm/100cm2)
MARSSIM Sign Test Parameter
Sample Type5
H-3 SmearNet Result6
(dpm/100cm2)
C-14 Smear Net Result6
(dpm/100cm2)1 W WB 165.8 155 -10.8 -1.88E+02 1 S 9.6±2.9 NR2 W WB 165.8 177 11.2 1.95E+02 1 S 5.7±1.7 NR3 W WB 165.8 140 -25.8 -4.50E+02 1 S NR NR4 F VT 224.6 215 -9.6 -1.67E+02 1 S NR NR5 F VT 224.6 220 -4.6 -8.02E+01 1 S NR NR6 W M 185.4 143 -42.4 -7.40E+02 1 S 8.9±2.7 NR7 F VT 224.6 215 -9.6 -1.67E+02 1 S NR NR8 F VT 224.6 209 -15.6 -2.72E+02 1 S NR NR9 F VT 224.6 212 -12.6 -2.20E+02 1 S 7.3±2.2 NR10 W WB 165.8 158 -7.8 -1.36E+02 1 S 4.9±1.5 NR11 F VT 224.6 236 11.4 1.99E+02 1 S NR NR12 F VT 224.6 244 19.4 3.38E+02 1 S NR NR13 W WB 165.8 144 -21.8 -3.80E+02 1 S NR NR14 F VT 224.6 228 3.4 5.93E+01 1 S NR NR15 CT SST 373.6 194 -179.6 -3.13E+03 1 S NR NR16 F VT 224.6 220 -4.6 -8.02E+01 1 S NR NR17 F VT 224.6 230 5.4 9.42E+01 1 S NR NR18 W WB 165.8 181 15.2 2.65E+02 1 S 5.0±1.5 NR19 W WB 165.8 151 -14.8 -2.58E+02 1 S 3.6±1.2 NR20 W M 185.4 140 -45.4 -7.92E+02 1 S NR NR
Mean -2.96E+02Median -1.67E+02Range 3.47E+03
Std Dev (1 σ ) 7.32E+02Sum of Positive Signs 20
Sign Test Critical Value (n=20) 14Sign Test Evaluation PASS
NOTES: NR = Not Reported1 Total Efficiency = Instrument static 2-pi efficiency * ISO-7503 Surface Efficiency * Weighted Room Nuclide Ratio as per Building T-2 HSA.2 F = floor W = lower wall (< 2m) S = sink CT = countertop H = fume hood3 Surface Materials: WB=Wallboarb VT = Vinyl Tile C = Concrete M = Metal W = Wood L = Laminate Countertop
SST = Synthetic Stone Countertop SS = Stainless Steel4
5 Sample Type: S=Systematic B=Biased. Biased locations chosen based on results of scanning survey and are not included in Sign test calculations.6 Smear results reported as Result ± 2σ if net value positive. NR if net result was negative.
If the ambient background measurements in the room were significantly lower than the material-specific values measured elsewhere in Building 40, than the ambient values were used to obtain net residual activity in the SU.
WRAMC Health Physics

Survey Unit Final Status Survey Summary Data SheetWRAMC Building T2 Decommissioning
May 2004
Survey Date: 13-May-04 Survey Instruments Survey Type Ratemeter
S/NProbe
S/N
Window Density
Thickness (mg/cm2)
Total Efficiency1
Probe Active Area (cm2)
Planning MDC (dpm/100cm2)
Survey Unit/Room #: 225 Ludlum 2350/43-68 Static Counts 120619 RN011354 0.4 3.01% 126 2.37E+03FSS Floor Classification: 2
SU DCGLw (dpm/100cm2): 7.61E+06Ambient Background (cpm): 248.2
1 2 3 4 5 6 7 8 9 10 11
Sample IDSample
Location2Surface Material3
Material Specific
Background4
(cpm)Static Count Result (cpm)
Net Static Count Rate
(cpm)
Residual Surface Activity(dpm/100cm2)
MARSSIM Sign Test Parameter
Sample Type5
H-3 SmearNet Result6
(dpm/100cm2)
C-14 Smear Net Result6
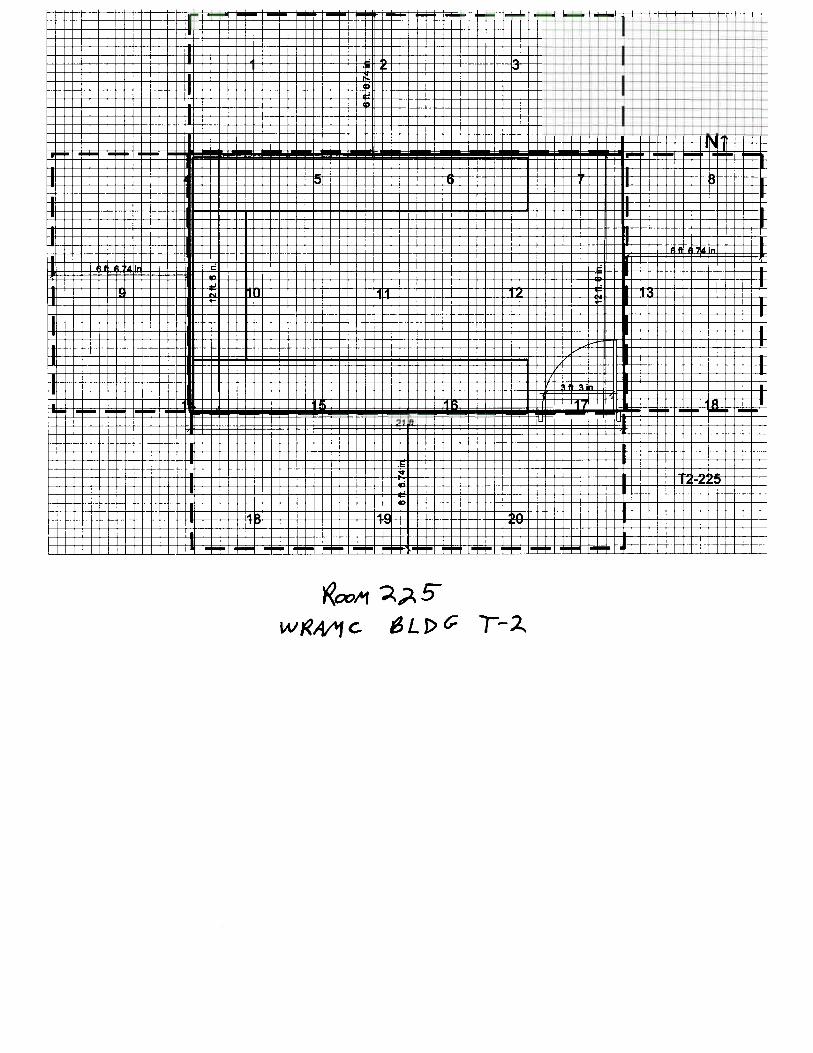
(dpm/100cm2)1 W WB 165.8 241 75.2 1.98E+03 1 S NR NR2 W WB 165.8 178 12.2 3.22E+02 1 S NR NR3 W WB 165.8 194 28.2 7.44E+02 1 S NR NR4 W WB 165.8 195 29.2 7.70E+02 1 S NR NR5 CT SST 373.6 389 15.4 4.06E+02 1 S NR 2.0±0.76 CT SST 373.6 437 63.4 1.67E+03 1 S NR NR7 F VT 224.6 245 20.4 5.38E+02 1 S NR NR8 W WB 165.8 151 -14.8 -3.90E+02 1 S NR NR9 W WB 165.8 177 11.2 2.95E+02 1 S NR NR10 F VT 224.6 249 24.4 6.43E+02 1 S NR 1.2±0.411 F VT 224.6 237 12.4 3.27E+02 1 S NR NR12 F VT 224.6 225 0.4 1.05E+01 1 S NR NR13 W WB 165.8 162 -3.8 -1.00E+02 1 S NR NR14 W WB 165.8 201 35.2 9.28E+02 1 S NR NR15 CT SST 373.6 421 47.4 1.25E+03 1 S NR 1.3±0.416 CT SST 373.6 431 57.4 1.51E+03 1 S NR NR17 F VT 224.6 228 3.4 8.96E+01 1 S NR NR18 W WB 165.8 156 -9.8 -2.58E+02 1 S NR 1.1±0.319 W WB 165.8 184 18.2 4.80E+02 1 S NR NR20 W WB 165.8 178 12.2 3.22E+02 1 S NR NR
Mean 5.77E+02Median 4.43E+02Range 2.37E+03
Std Dev (1 σ ) 6.35E+02Sum of Positive Signs 20
Sign Test Critical Value (n=20) 14Sign Test Evaluation PASS
NOTES: NR = Not Reported1 Total Efficiency = Instrument static 2-pi efficiency * ISO-7503 Surface Efficiency * Weighted Room Nuclide Ratio as per Building T-2 HSA.2 F = floor W = lower wall (< 2m) S = sink CT = countertop H = fume hood3 Surface Materials: WB=Wallboarb VT = Vinyl Tile C = Concrete M = Metal W = Wood L = Laminate Countertop
SST = Synthetic Stone Countertop SS = Stainless Steel4
5 Sample Type: S=Systematic B=Biased. Biased locations chosen based on results of scanning survey and are not included in Sign test calculations.6 Smear results reported as Result ± 2σ if net value positive. NR if net result was negative.
If the ambient background measurements in the room were significantly lower than the material-specific values measured elsewhere in Building 40, than the ambient values were used to obtain net residual activity in the SU.
WRAMC Health Physics
Survey Unit Final Status Survey Summary Data SheetWRAMC Building T2 Decommissioning
May 2004
Survey Date: 14-May-04 Survey Instruments Survey Type Ratemeter
S/NProbe
S/N
Window Density
Thickness (mg/cm2)
Total Efficiency1
Probe Active Area (cm2)
Planning MDC (dpm/100cm2)
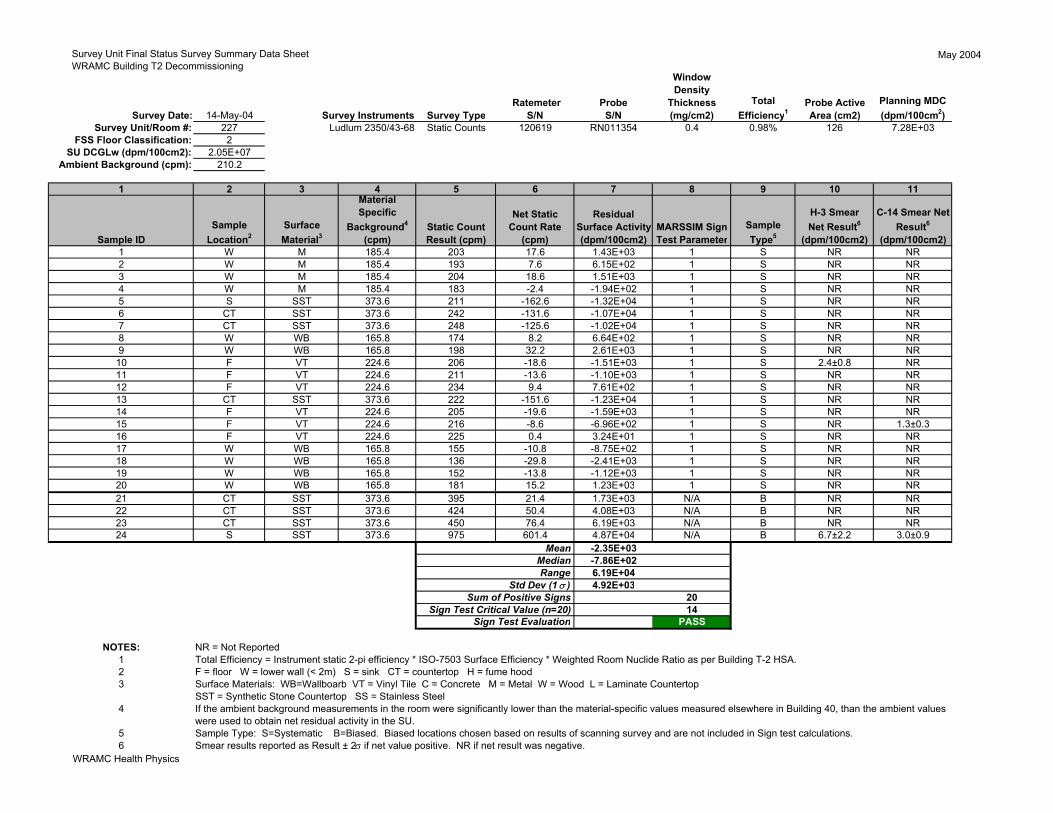
Survey Unit/Room #: 227 Ludlum 2350/43-68 Static Counts 120619 RN011354 0.4 0.98% 126 7.28E+03FSS Floor Classification: 2
SU DCGLw (dpm/100cm2): 2.05E+07Ambient Background (cpm): 210.2
1 2 3 4 5 6 7 8 9 10 11
Sample IDSample
Location2Surface Material3
Material Specific
Background4
(cpm)Static Count Result (cpm)
Net Static Count Rate
(cpm)
Residual Surface Activity(dpm/100cm2)
MARSSIM Sign Test Parameter
Sample Type5
H-3 SmearNet Result6
(dpm/100cm2)
C-14 Smear Net Result6
(dpm/100cm2)1 W M 185.4 203 17.6 1.43E+03 1 S NR NR2 W M 185.4 193 7.6 6.15E+02 1 S NR NR3 W M 185.4 204 18.6 1.51E+03 1 S NR NR4 W M 185.4 183 -2.4 -1.94E+02 1 S NR NR5 S SST 373.6 211 -162.6 -1.32E+04 1 S NR NR6 CT SST 373.6 242 -131.6 -1.07E+04 1 S NR NR7 CT SST 373.6 248 -125.6 -1.02E+04 1 S NR NR8 W WB 165.8 174 8.2 6.64E+02 1 S NR NR9 W WB 165.8 198 32.2 2.61E+03 1 S NR NR10 F VT 224.6 206 -18.6 -1.51E+03 1 S 2.4±0.8 NR11 F VT 224.6 211 -13.6 -1.10E+03 1 S NR NR12 F VT 224.6 234 9.4 7.61E+02 1 S NR NR13 CT SST 373.6 222 -151.6 -1.23E+04 1 S NR NR14 F VT 224.6 205 -19.6 -1.59E+03 1 S NR NR15 F VT 224.6 216 -8.6 -6.96E+02 1 S NR 1.3±0.316 F VT 224.6 225 0.4 3.24E+01 1 S NR NR17 W WB 165.8 155 -10.8 -8.75E+02 1 S NR NR18 W WB 165.8 136 -29.8 -2.41E+03 1 S NR NR19 W WB 165.8 152 -13.8 -1.12E+03 1 S NR NR20 W WB 165.8 181 15.2 1.23E+03 1 S NR NR21 CT SST 373.6 395 21.4 1.73E+03 N/A B NR NR22 CT SST 373.6 424 50.4 4.08E+03 N/A B NR NR23 CT SST 373.6 450 76.4 6.19E+03 N/A B NR NR24 S SST 373.6 975 601.4 4.87E+04 N/A B 6.7±2.2 3.0±0.9
Mean -2.35E+03Median -7.86E+02Range 6.19E+04
Std Dev (1σ ) 4.92E+03Sum of Positive Signs 20
Sign Test Critical Value (n=20) 14Sign Test Evaluation PASS
NOTES: NR = Not Reported1 Total Efficiency = Instrument static 2-pi efficiency * ISO-7503 Surface Efficiency * Weighted Room Nuclide Ratio as per Building T-2 HSA.2 F = floor W = lower wall (< 2m) S = sink CT = countertop H = fume hood3 Surface Materials: WB=Wallboarb VT = Vinyl Tile C = Concrete M = Metal W = Wood L = Laminate Countertop
SST = Synthetic Stone Countertop SS = Stainless Steel4
5 Sample Type: S=Systematic B=Biased. Biased locations chosen based on results of scanning survey and are not included in Sign test calculations.6 Smear results reported as Result ± 2σ if net value positive. NR if net result was negative.
If the ambient background measurements in the room were significantly lower than the material-specific values measured elsewhere in Building 40, than the ambient values were used to obtain net residual activity in the SU.
WRAMC Health Physics
Survey Unit Final Status Survey Summary Data SheetWRAMC Building T2 Decommissioning
May 2004
Survey Date: 13-May-04 Survey Instruments Survey Type Ratemeter
S/NProbe
S/N
Window Density Thickness (mg/cm2)
Total Efficiency1
Probe Active Area (cm2)
Planning MDC (dpm/100cm2)
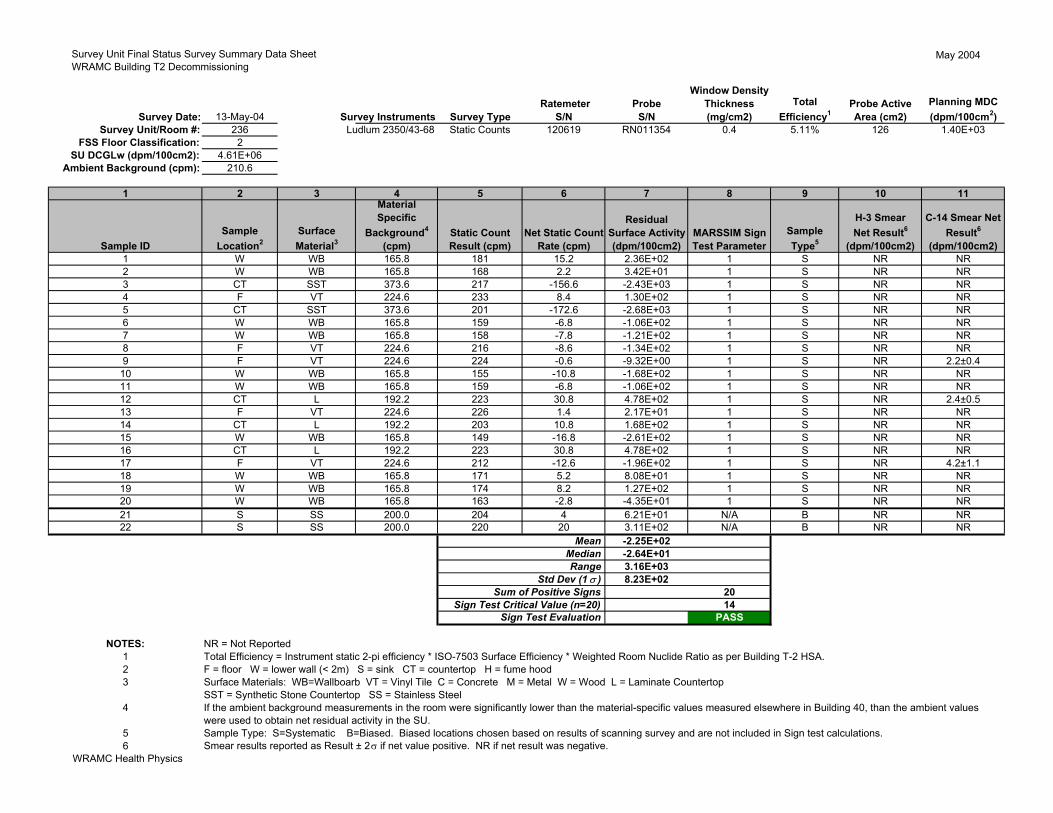
Survey Unit/Room #: 236 Ludlum 2350/43-68 Static Counts 120619 RN011354 0.4 5.11% 126 1.40E+03FSS Floor Classification: 2
SU DCGLw (dpm/100cm2): 4.61E+06Ambient Background (cpm): 210.6
1 2 3 4 5 6 7 8 9 10 11
Sample IDSample
Location2Surface Material3
Material Specific
Background4
(cpm)Static Count Result (cpm)
Net Static Count Rate (cpm)
Residual Surface Activity(dpm/100cm2)
MARSSIM Sign Test Parameter
Sample Type5
H-3 SmearNet Result6
(dpm/100cm2)
C-14 Smear Net Result6
(dpm/100cm2)1 W WB 165.8 181 15.2 2.36E+02 1 S NR NR2 W WB 165.8 168 2.2 3.42E+01 1 S NR NR3 CT SST 373.6 217 -156.6 -2.43E+03 1 S NR NR4 F VT 224.6 233 8.4 1.30E+02 1 S NR NR5 CT SST 373.6 201 -172.6 -2.68E+03 1 S NR NR6 W WB 165.8 159 -6.8 -1.06E+02 1 S NR NR7 W WB 165.8 158 -7.8 -1.21E+02 1 S NR NR8 F VT 224.6 216 -8.6 -1.34E+02 1 S NR NR9 F VT 224.6 224 -0.6 -9.32E+00 1 S NR 2.2±0.4
10 W WB 165.8 155 -10.8 -1.68E+02 1 S NR NR11 W WB 165.8 159 -6.8 -1.06E+02 1 S NR NR12 CT L 192.2 223 30.8 4.78E+02 1 S NR 2.4±0.513 F VT 224.6 226 1.4 2.17E+01 1 S NR NR14 CT L 192.2 203 10.8 1.68E+02 1 S NR NR15 W WB 165.8 149 -16.8 -2.61E+02 1 S NR NR16 CT L 192.2 223 30.8 4.78E+02 1 S NR NR17 F VT 224.6 212 -12.6 -1.96E+02 1 S NR 4.2±1.118 W WB 165.8 171 5.2 8.08E+01 1 S NR NR19 W WB 165.8 174 8.2 1.27E+02 1 S NR NR20 W WB 165.8 163 -2.8 -4.35E+01 1 S NR NR21 S SS 200.0 204 4 6.21E+01 N/A B NR NR22 S SS 200.0 220 20 3.11E+02 N/A B NR NR
Mean -2.25E+02Median -2.64E+01Range 3.16E+03
Std Dev (1 σ ) 8.23E+02Sum of Positive Signs 20
Sign Test Critical Value (n=20) 14Sign Test Evaluation PASS
NOTES: NR = Not Reported1 Total Efficiency = Instrument static 2-pi efficiency * ISO-7503 Surface Efficiency * Weighted Room Nuclide Ratio as per Building T-2 HSA.2 F = floor W = lower wall (< 2m) S = sink CT = countertop H = fume hood3 Surface Materials: WB=Wallboarb VT = Vinyl Tile C = Concrete M = Metal W = Wood L = Laminate Countertop
SST = Synthetic Stone Countertop SS = Stainless Steel4
5 Sample Type: S=Systematic B=Biased. Biased locations chosen based on results of scanning survey and are not included in Sign test calculations.6 Smear results reported as Result ± 2σ if net value positive. NR if net result was negative.
If the ambient background measurements in the room were significantly lower than the material-specific values measured elsewhere in Building 40, than the ambient values were used to obtain net residual activity in the SU.
WRAMC Health Physics

Survey Unit Final Status Survey Summary Data SheetWRAMC Building T2 Decommissioning
May 2004
Survey Date: 11-May-04 Survey Instruments Survey Type Ratemeter
S/NProbe
S/N
Window Density
Thickness (mg/cm2)
Total Efficiency1
Probe Active Area (cm2)
Planning MDC (dpm/100cm2)
Survey Unit/Room #: 237 Ludlum 2350/43-68 Static Counts 120619 RN011354 0.4 4.69% 126 1.18E+03FSS Floor Classification: 2
SU DCGLw (dpm/100cm2): 5.00E+06Ambient Background (cpm): 225
1 2 3 4 5 6 7 8 9 10 11
Sample IDSample
Location2Surface Material3
Material Specific
Background4
(cpm)Static Count Result (cpm)
Net Static Count Rate
(cpm)
Residual Surface Activity(dpm/100cm2)
MARSSIM Sign Test Parameter
Sample Type5
H-3 SmearNet Result6
(dpm/100cm2)
C-14 Smear Net Result6
(dpm/100cm2)1 W WB 165.8 152 -13.8 -2.34E+02 1 S NR NR2 W WB 165.8 156 -9.8 -1.66E+02 1 S NR NR3 W WB 165.8 167 1.2 2.03E+01 1 S NR NR4 W WB 165.8 169 3.2 5.42E+01 1 S NR NR5 F VT 224.6 264 39.4 6.67E+02 1 S NR NR6 F VT 224.6 224 -0.6 -1.02E+01 1 S NR NR7 F VT 224.6 250 25.4 4.30E+02 1 S NR NR8 W WB 165.8 171 5.2 8.80E+01 1 S NR NR9 F VT 224.6 211 -13.6 -2.30E+02 1 S NR NR10 F VT 224.6 205 -19.6 -3.32E+02 1 S NR NR11 F VT 224.6 238 13.4 2.27E+02 1 S NR NR12 W WB 165.8 162 -3.8 -6.43E+01 1 S NR NR13 W WB 165.8 164 -1.8 -3.05E+01 1 S NR NR14 F VT 224.6 251 26.4 4.47E+02 1 S NR NR15 F VT 224.6 214 -10.6 -1.79E+02 1 S NR NR16 F VT 224.6 181 -43.6 -7.38E+02 1 S NR 1.2±0.317 W WB 165.8 144 -21.8 -3.69E+02 1 S NR NR18 F VT 224.6 193 -31.6 -5.35E+02 1 S NR NR19 W WB 165.8 157 -8.8 -1.49E+02 1 S NR 1.2±0.320 W M 185.4 150 -35.4 -5.99E+02 1 B NR 1.0±0.2
Mean -8.51E+01Median -1.07E+02Range 1.40E+03
Std Dev (1 σ ) 3.54E+02Sum of Positive Signs 20
Sign Test Critical Value (n=20) 14Sign Test Evaluation PASS
NOTES: NR = Not Reported1 Total Efficiency = Instrument static 2-pi efficiency * ISO-7503 Surface Efficiency * Weighted Room Nuclide Ratio as per Building T-2 HSA.2 F = floor W = lower wall (< 2m) S = sink CT = countertop H = fume hood3 Surface Materials: WB=Wallboarb VT = Vinyl Tile C = Concrete M = Metal W = Wood L = Laminate Countertop
SST = Synthetic Stone Countertop SS = Stainless Steel4
5 Sample Type: S=Systematic B=Biased. Biased locations chosen based on results of scanning survey and are not included in Sign test calculations.6 Smear results reported as Result ± 2σ if net value positive. NR if net result was negative.
If the ambient background measurements in the room were significantly lower than the material-specific values measured elsewhere in Building 40, than the ambient values were used to obtain net residual activity in the SU.
WRAMC Health Physics

Survey Unit Final Status Survey Summary Data SheetWRAMC Building T2 Decommissioning
May 2004
Survey Date: 13-May-04 Survey Instruments Survey Type Ratemeter
S/NProbe
S/N
Window Density
Thickness (mg/cm2)
Total Efficiency1
Probe Active Area (cm2)
Planning MDC (dpm/100cm2)
Survey Unit/Room #: 238 Ludlum 2350/43-68 Static Counts 120619 RN011354 0.4 4.69% 126 1.18E+03FSS Floor Classification: 2
SU DCGLw (dpm/100cm2): 5.00E+06Ambient Background (cpm): 227.2
1 2 3 4 5 6 7 8 9 10 11
Sample IDSample
Location2Surface Material3
Material Specific
Background4
(cpm)Static Count Result (cpm)
Net Static Count Rate
(cpm)
Residual Surface Activity(dpm/100cm2)
MARSSIM Sign Test Parameter
Sample Type5
H-3 SmearNet Result6
(dpm/100cm2)
C-14 Smear Net Result6
(dpm/100cm2)1 W WB 165.8 192 26.2 4.43E+02 1 S 3.7±1.1 3.4±0.82 W WB 165.8 183 17.2 2.91E+02 1 S 1.4±0.4 2.5±0.63 W WB 165.8 151 -14.8 -2.50E+02 1 S 2.8±0.8 NR4 F VT 224.6 224 -0.6 -1.02E+01 1 S 6.7±2.0 NR5 F VT 224.6 203 -21.6 -3.66E+02 1 S NR 3.3±0.86 F VT 224.6 213 -11.6 -1.96E+02 1 S 3.5±1.1 4.9±1.27 W WB 165.8 156 -9.8 -1.66E+02 1 S 1.5±0.4 1.9±0.58 F VT 224.6 217 -7.6 -1.29E+02 1 S NR 4.7±1.29 F VT 224.6 222 -2.6 -4.40E+01 1 S 1.6±0.5 NR10 W WB 165.8 136 -29.8 -5.04E+02 1 S NR 3.0±0.711 W WB 165.8 161 -4.8 -8.12E+01 1 S 4.3±1.3 2.5±0.612 F VT 224.6 183 -41.6 -7.04E+02 1 S 8.7±2.6 NR13 F VT 224.6 213 -11.6 -1.96E+02 1 S 6.4±1.9 NR14 W WB 165.8 148 -17.8 -3.01E+02 1 S NR NR15 W WB 165.8 151 -14.8 -2.50E+02 1 S NR NR16 F VT 224.6 193 -31.6 -5.35E+02 1 S NR 3.0±0.817 CT L 192.2 201 8.8 1.49E+02 1 S NR 1.6±0.418 W WB 165.8 131 -34.8 -5.89E+02 1 S NR 2.4±0.619 W WB 165.8 169 3.2 5.42E+01 1 S 2.1±0.6 NR20 W WB 165.8 184 18.2 3.08E+02 1 S 6.6±2.0 2.5±0.6
Mean -1.54E+02Median -1.81E+02Range 1.15E+03
Std Dev (1 σ ) 3.07E+02Sum of Positive Signs 20
Sign Test Critical Value (n=20) 14Sign Test Evaluation PASS
NOTES: NR = Not Reported1 Total Efficiency = Instrument static 2-pi efficiency * ISO-7503 Surface Efficiency * Weighted Room Nuclide Ratio as per Building T-2 HSA.2 F = floor W = lower wall (< 2m) S = sink CT = countertop H = fume hood3 Surface Materials: WB=Wallboarb VT = Vinyl Tile C = Concrete M = Metal W = Wood L = Laminate Countertop
SST = Synthetic Stone Countertop SS = Stainless Steel4
5 Sample Type: S=Systematic B=Biased. Biased locations chosen based on results of scanning survey and are not included in Sign test calculations.6 Smear results reported as Result ± 2σ if net value positive. NR if net result was negative.
If the ambient background measurements in the room were significantly lower than the material-specific values measured elsewhere in Building 40, than the ambient values were used to obtain net residual activity in the SU.
WRAMC Health Physics

Survey Unit Final Status Survey Summary Data SheetWRAMC Building T2 Decommissioning
May 2004
Survey Date: 13-May-04 Survey Instruments Survey Type Ratemeter
S/NProbe
S/N
Window Density
Thickness (mg/cm2)
Total Efficiency1
Probe Active Area (cm2)
Planning MDC (dpm/100cm2)
Survey Unit/Room #: 240 Ludlum 2350/43-68 Static Counts 120619 RN011354 0.4 0.98% 126 5.65E+03FSS Floor Classification: 2
SU DCGLw (dpm/100cm2): 2.05E+07Ambient Background (cpm): 219
1 2 3 4 5 6 7 8 9 10 11
Sample IDSample
Location2Surface Material3
Material Specific
Background4
(cpm)Static Count Result (cpm)
Net Static Count Rate
(cpm)
Residual Surface Activity(dpm/100cm2)
MARSSIM Sign Test Parameter
Sample Type5
H-3 SmearNet Result6
(dpm/100cm2)
C-14 Smear Net Result6
(dpm/100cm2)1 W WB 165.8 167 1.2 9.72E+01 1 S 4.9±1.5 NR2 W WB 165.8 178 12.2 9.88E+02 1 S NR 2.0±0.33 W WB 165.8 188 22.2 1.80E+03 1 S NR 2.6±0.74 W WB 165.8 164 -1.8 -1.46E+02 1 S NR 3.8±1.05 W WB 165.8 167 1.2 9.72E+01 1 S NR 2.3±0.56 W WB 165.8 168 2.2 1.78E+02 1 S 2.4±0.7 3.9±1.07 F VT 224.6 223 -1.6 -1.30E+02 1 S 8.3±2.5 NR8 F VT 224.6 231 6.4 5.18E+02 1 S NR NR9 F VT 224.6 200 -24.6 -1.99E+03 1 S NR NR10 W WB 165.8 174 8.2 6.64E+02 1 S NR NR11 W WB 165.8 149 -16.8 -1.36E+03 1 S NR 3.0±0.812 W WB 165.8 145 -20.8 -1.68E+03 1 S NR NR13 W WB 165.8 162 -3.8 -3.08E+02 1 S 8.2±2.5 3.4±0.914 F VT 224.6 225 0.4 3.24E+01 1 S 2.2±0.7 NR15 F VT 224.6 224 -0.6 -4.86E+01 1 S 2.7±0.7 NR16 CT L 192.2 208 15.8 1.28E+03 1 S 3.0±0.9 NR17 CT L 192.2 202 9.8 7.94E+02 1 S NR 2.8±0.718 W WB 165.8 180 14.2 1.15E+03 1 S NR 2.2±0.319 W WB 165.8 173 7.2 5.83E+02 1 S 4.0±1.0 NR20 D W 159.6 133 -26.6 -2.15E+03 1 S NR 2.3±0.3
Mean 1.78E+01Median 9.72E+01Range 3.95E+03
Std Dev (1 σ ) 1.08E+03Sum of Positive Signs 20
Sign Test Critical Value (n=20) 14Sign Test Evaluation PASS
NOTES: NR = Not Reported1 Total Efficiency = Instrument static 2-pi efficiency * ISO-7503 Surface Efficiency * Weighted Room Nuclide Ratio as per Building T-2 HSA.2 F = floor W = lower wall (< 2m) S = sink CT = countertop H = fume hood3 Surface Materials: WB=Wallboarb VT = Vinyl Tile C = Concrete M = Metal W = Wood L = Laminate Countertop
SST = Synthetic Stone Countertop SS = Stainless Steel4
5 Sample Type: S=Systematic B=Biased. Biased locations chosen based on results of scanning survey and are not included in Sign test calculations.6 Smear results reported as Result ± 2σ if net value positive. NR if net result was negative.
If the ambient background measurements in the room were significantly lower than the material-specific values measured elsewhere in Building 40, than the ambient values were used to obtain net residual activity in the SU.
WRAMC Health Physics

Survey Unit Final Status Survey Summary Data SheetWRAMC Building T2 Decommissioning
May 2004
Survey Date: 13-May-04 Survey Instruments Survey Type Ratemeter
S/NProbe
S/N
Window Density
Thickness (mg/cm2)
Total Efficiency1
Probe Active Area (cm2)
Planning MDC (dpm/100cm2)
Survey Unit/Room #: 241 Ludlum 2350/43-68 Static Counts 120619 RN011354 0.4 0.98% 126 5.65E+03FSS Floor Classification: 2
SU DCGLw (dpm/100cm2): 2.05E+07Ambient Background (cpm): 214
1 2 3 4 5 6 7 8 9 10 11
Sample IDSample
Location2Surface Material3
Material Specific
Background4
(cpm)Static Count Result (cpm)
Net Static Count Rate
(cpm)
Residual Surface Activity(dpm/100cm2)
MARSSIM Sign Test Parameter
Sample Type5
H-3 SmearNet Result6
(dpm/100cm2)
C-14 Smear Net Result6
(dpm/100cm2)1 W WB 165.8 190 24.2 1.96E+03 1 S 5.5±1.7 NR2 W WB 165.8 172 6.2 5.02E+02 1 S 2.1±0.6 NR3 W WB 165.8 178 12.2 9.88E+02 1 S NR NR4 W WB 165.8 153 -12.8 -1.04E+03 1 S NR NR5 F VT 224.6 235 10.4 8.42E+02 1 S 2.3±0.6 NR6 F VT 224.6 222 -2.6 -2.11E+02 1 S NR NR7 F VT 224.6 224 -0.6 -4.86E+01 1 S 6.4±1.9 NR8 W WB 165.8 141 -24.8 -2.01E+03 1 S NR NR9 W WB 165.8 171 5.2 4.21E+02 1 S NR NR10 F VT 224.6 195 -29.6 -2.40E+03 1 S NR NR11 F VT 224.6 207 -17.6 -1.43E+03 1 S NR NR12 F VT 224.6 196 -28.6 -2.32E+03 1 S NR NR13 W WB 165.8 159 -6.8 -5.51E+02 1 S NR NR14 W WB 165.8 153 -12.8 -1.04E+03 1 S NR NR15 W WB 165.8 145 -20.8 -1.68E+03 1 S 6.8±2.0 NR16 W WB 165.8 157 -8.8 -7.13E+02 1 S NR NR17 W WB 165.8 171 5.2 4.21E+02 1 S NR NR18 W WB 165.8 155 -10.8 -8.75E+02 1 S NR NR19 W WB 165.8 168 2.2 1.78E+02 1 S NR NR20 W WB 165.8 161 -4.8 -3.89E+02 1 S NR NR
Mean -4.69E+02Median -4.70E+02Range 4.36E+03
Std Dev (1 σ ) 1.16E+03Sum of Positive Signs 20
Sign Test Critical Value (n=20) 14Sign Test Evaluation PASS
NOTES: NR = Not Reported1 Total Efficiency = Instrument static 2-pi efficiency * ISO-7503 Surface Efficiency * Weighted Room Nuclide Ratio as per Building T-2 HSA.2 F = floor W = lower wall (< 2m) S = sink CT = countertop H = fume hood3 Surface Materials: WB=Wallboarb VT = Vinyl Tile C = Concrete M = Metal W = Wood L = Laminate Countertop
SST = Synthetic Stone Countertop SS = Stainless Steel4
5 Sample Type: S=Systematic B=Biased. Biased locations chosen based on results of scanning survey and are not included in Sign test calculations.6 Smear results reported as Result ± 2σ if net value positive. NR if net result was negative.
If the ambient background measurements in the room were significantly lower than the material-specific values measured elsewhere in Building 40, than the ambient values were used to obtain net residual activity in the SU.
WRAMC Health Physics
WRAMC Building T-2 Final Status Survey
APPENDIX B
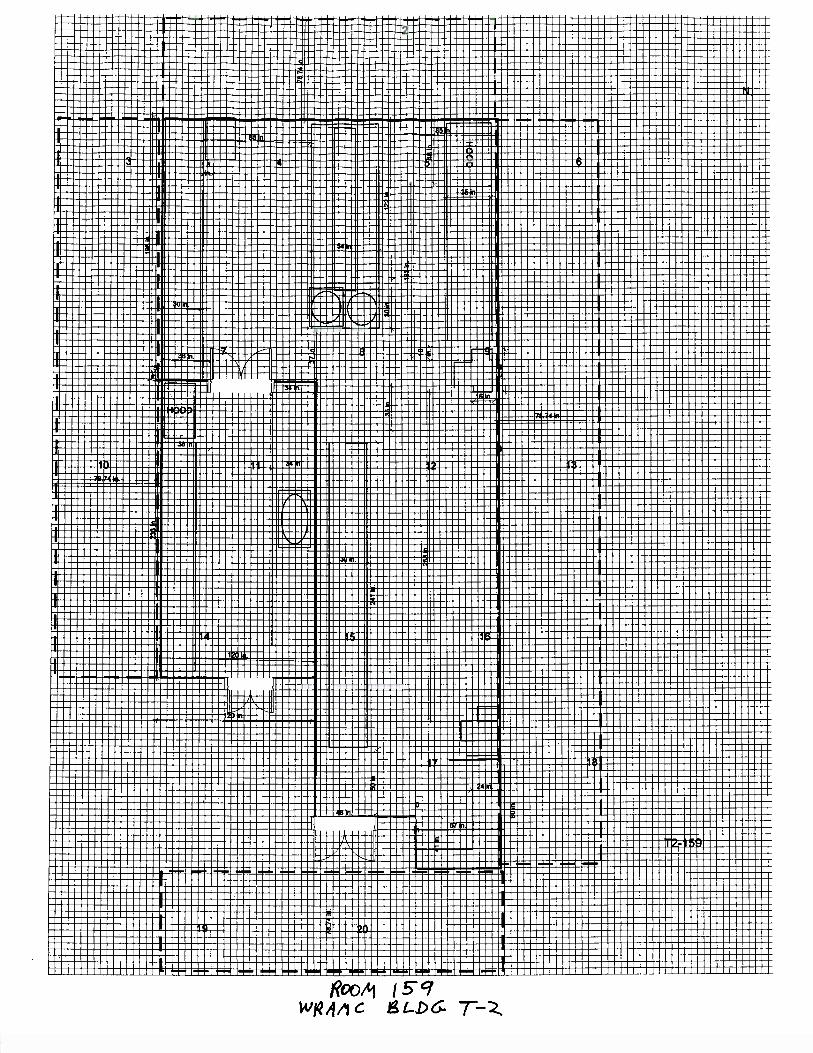
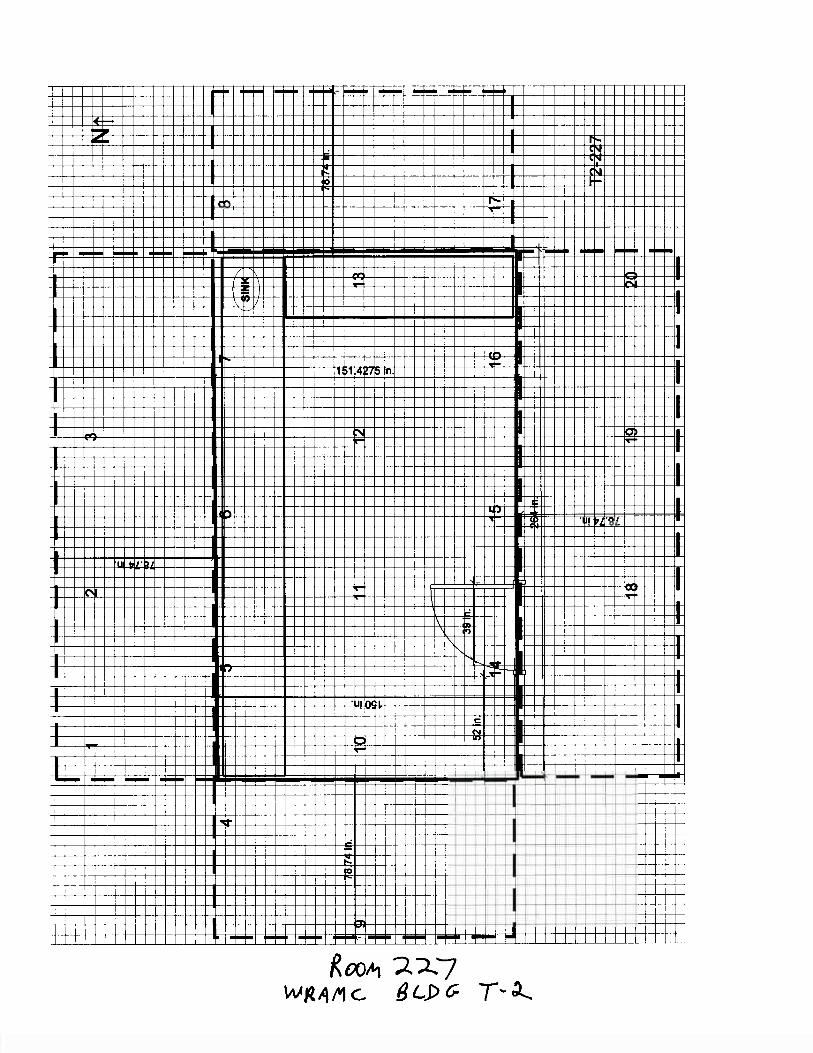
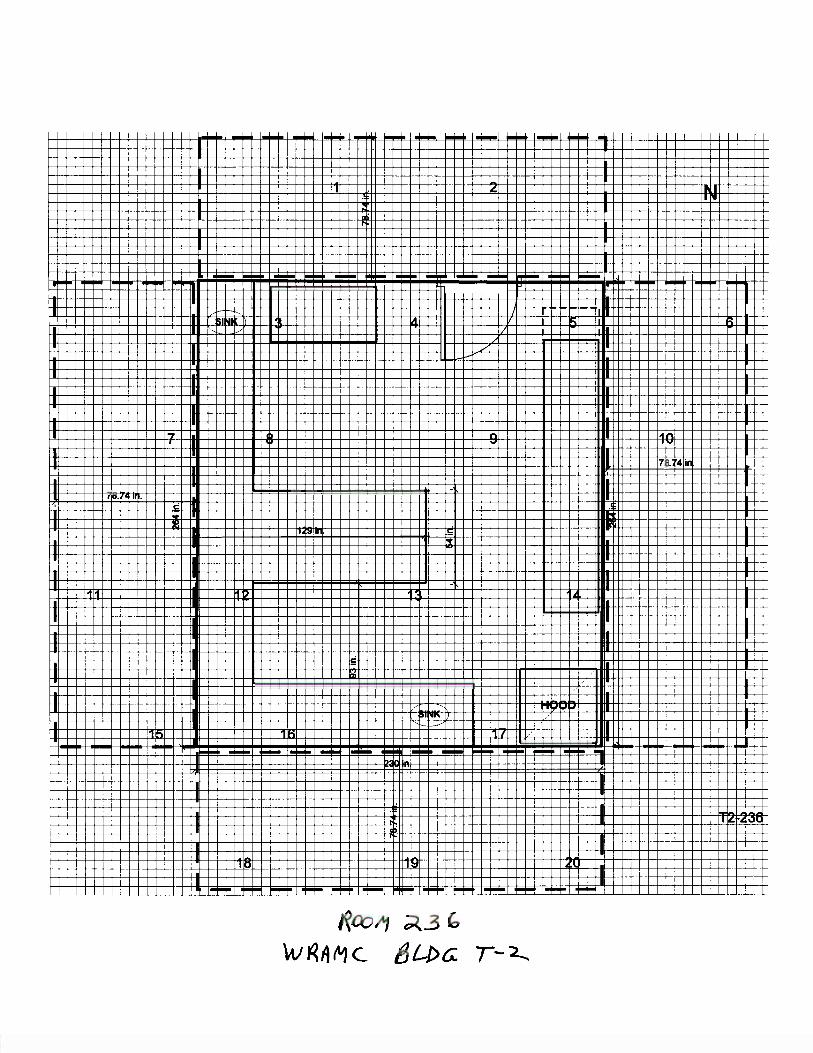
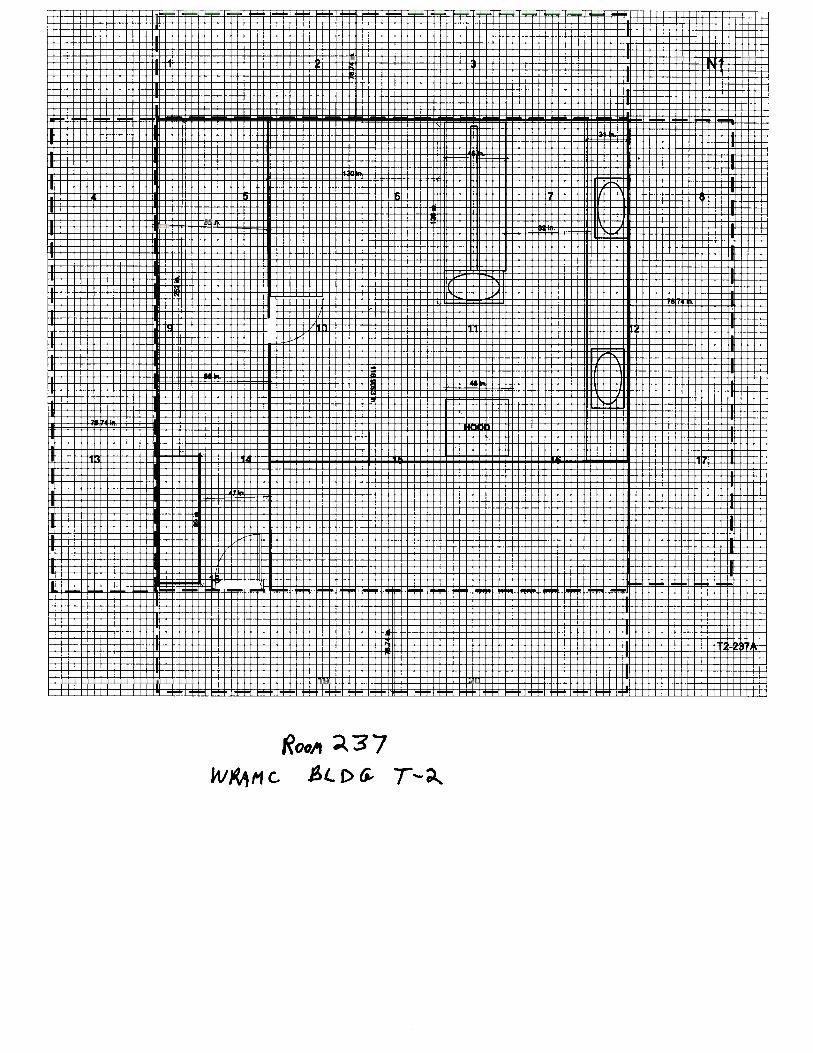
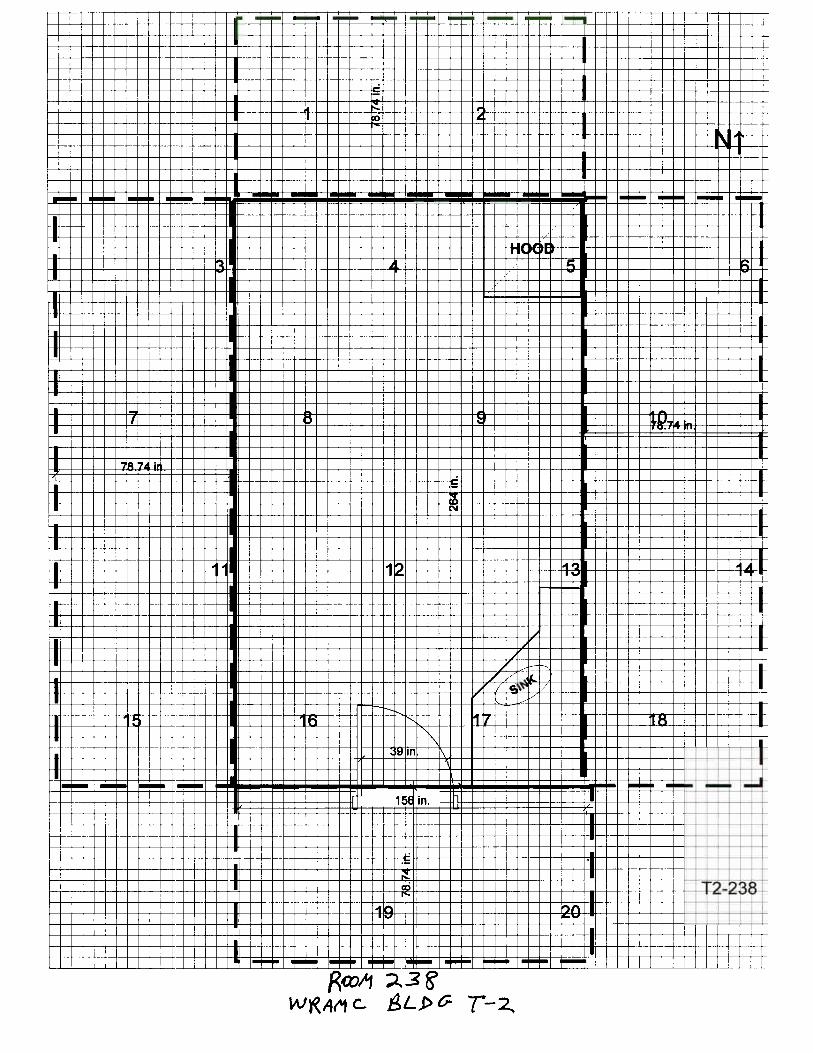
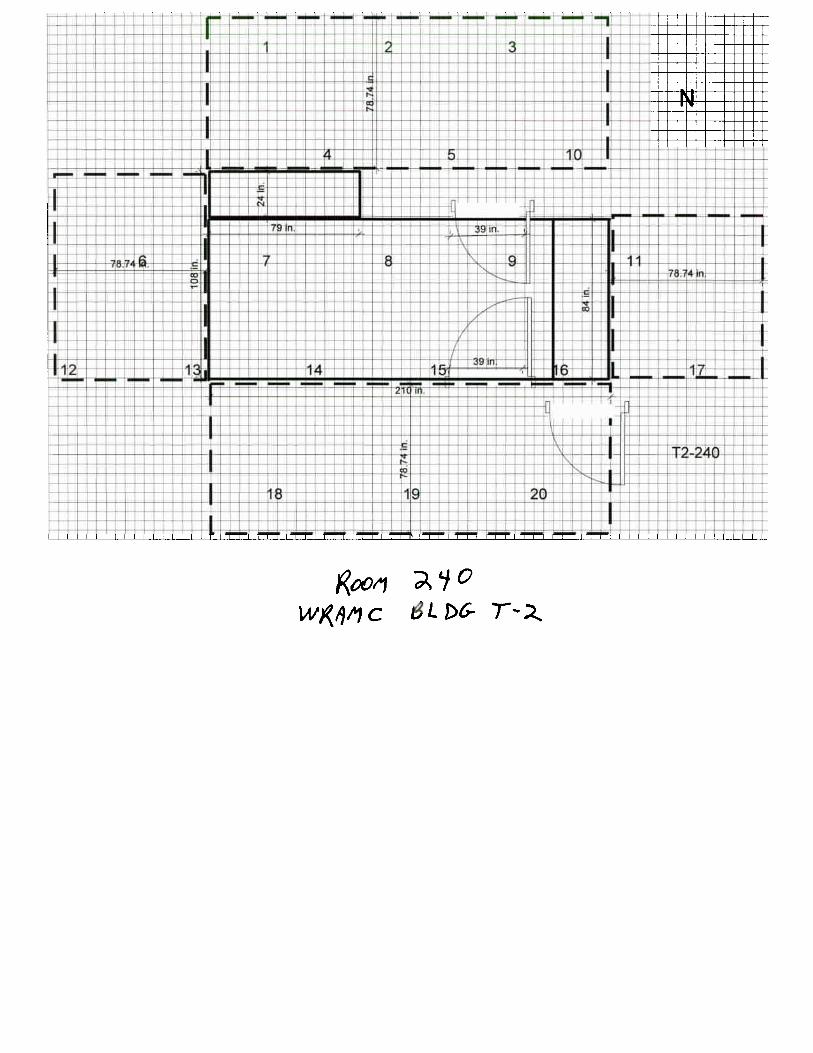
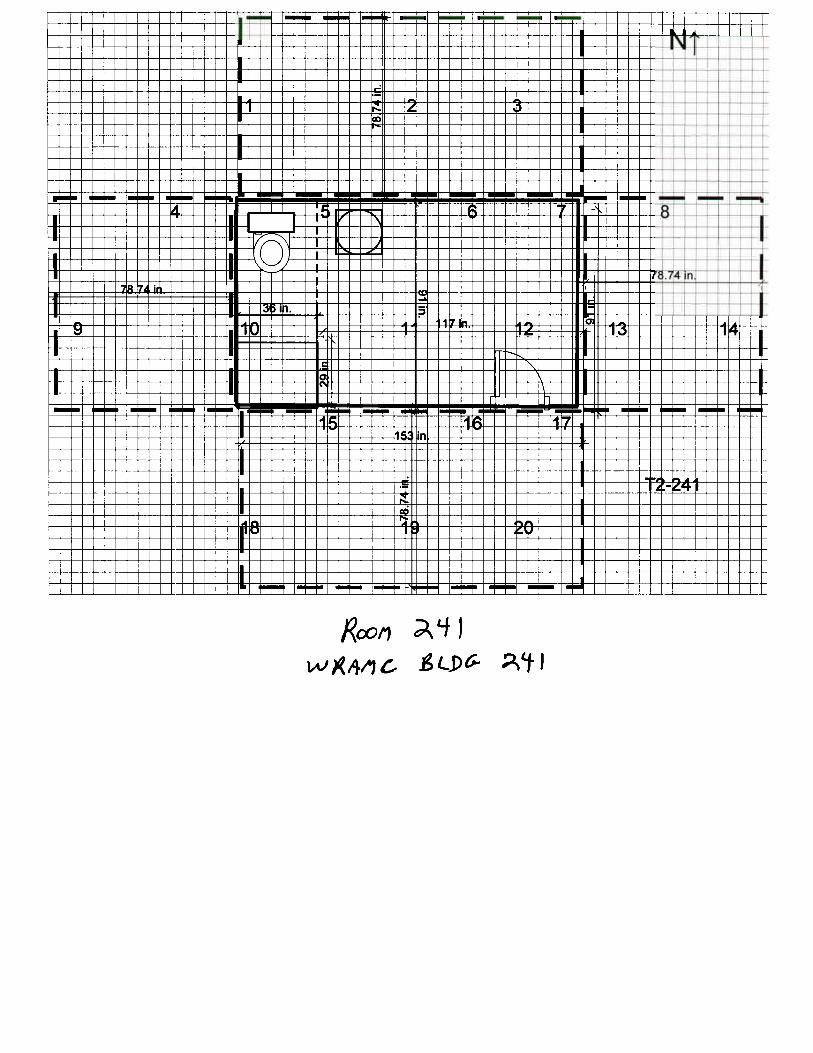
Building T-2 FSS SU Maps (Rooms 15, 159, 225, 227, 236, 237, 238, 240 and 241)
WRAMC Building T-2 Final Status Survey
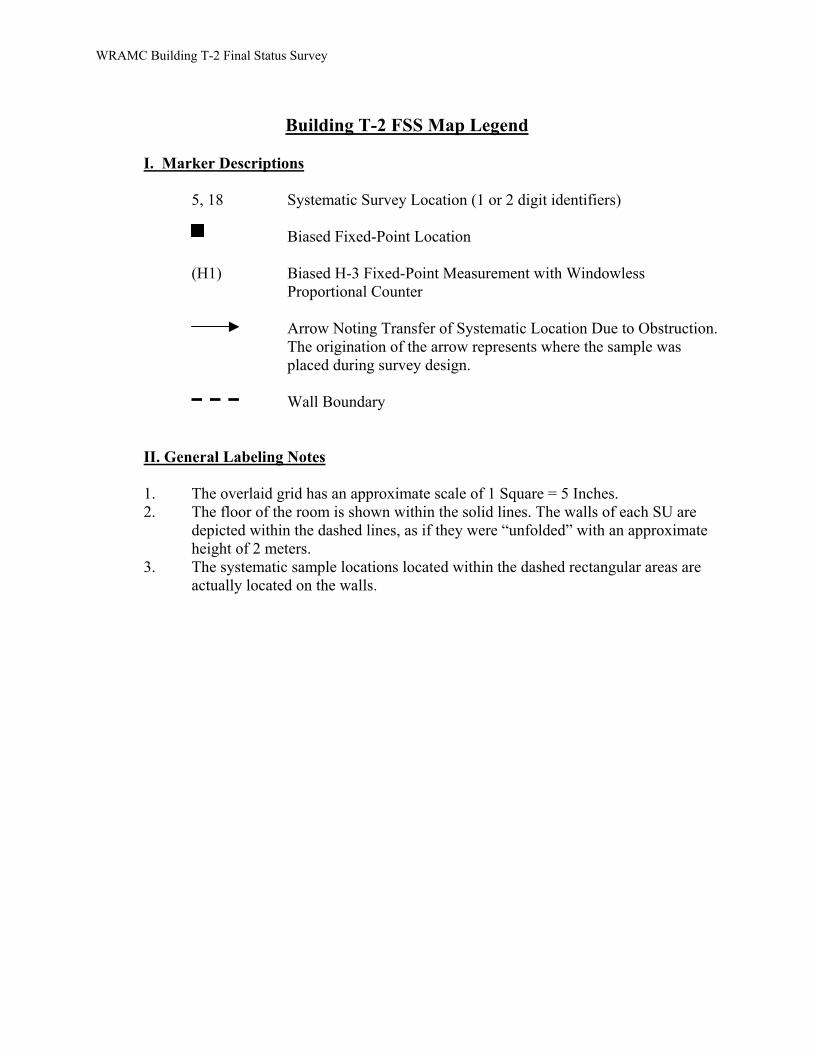
Building T-2 FSS Map Legend
I. Marker Descriptions
5, 18 Systematic Survey Location (1 or 2 digit identifiers)
Biased Fixed-Point Location (H1) Biased H-3 Fixed-Point Measurement with Windowless
Proportional Counter Arrow Noting Transfer of Systematic Location Due to Obstruction.
The origination of the arrow represents where the sample was placed during survey design.
Wall Boundary
II. General Labeling Notes 1. The overlaid grid has an approximate scale of 1 Square = 5 Inches. 2. The floor of the room is shown within the solid lines. The walls of each SU are
depicted within the dashed lines, as if they were “unfolded” with an approximate height of 2 meters.
3. The systematic sample locations located within the dashed rectangular areas are actually located on the walls.

WRAMC Building T-2 Final Status Survey
APPENDIX C
Building T-2 FSS Design and Protocol
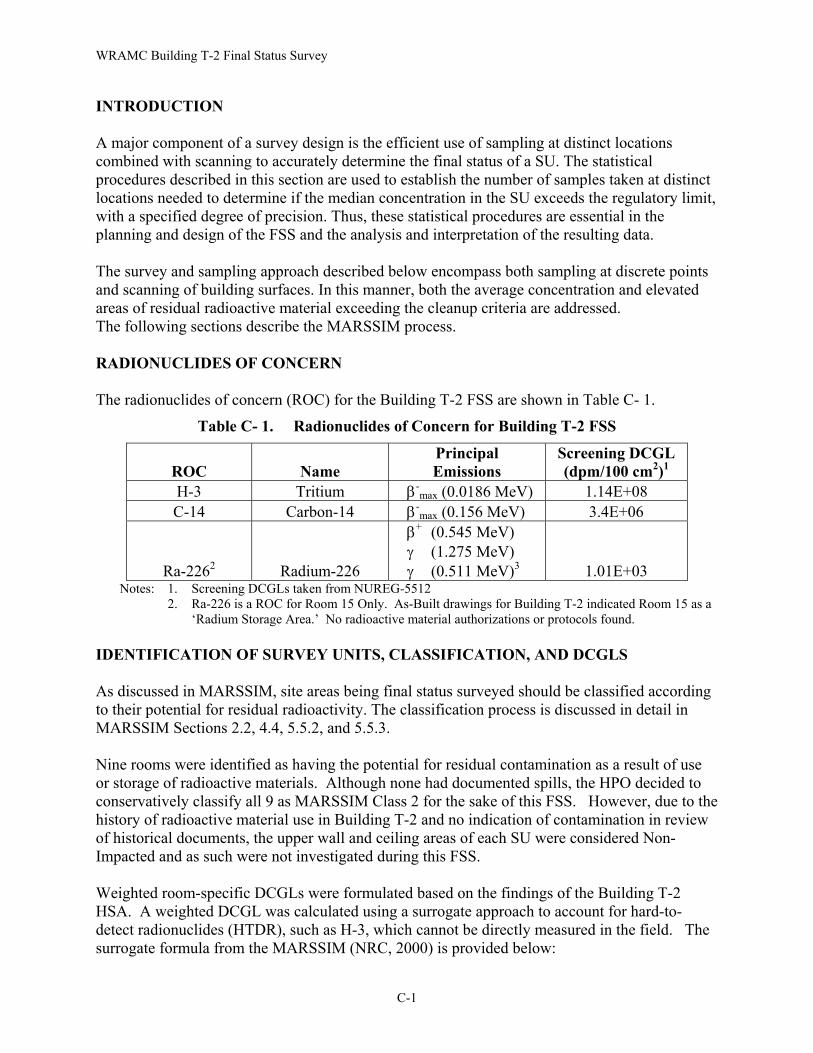
WRAMC Building T-2 Final Status Survey INTRODUCTION A major component of a survey design is the efficient use of sampling at distinct locations combined with scanning to accurately determine the final status of a SU. The statistical procedures described in this section are used to establish the number of samples taken at distinct locations needed to determine if the median concentration in the SU exceeds the regulatory limit, with a specified degree of precision. Thus, these statistical procedures are essential in the planning and design of the FSS and the analysis and interpretation of the resulting data. The survey and sampling approach described below encompass both sampling at discrete points and scanning of building surfaces. In this manner, both the average concentration and elevated areas of residual radioactive material exceeding the cleanup criteria are addressed. The following sections describe the MARSSIM process. RADIONUCLIDES OF CONCERN The radionuclides of concern (ROC) for the Building T-2 FSS are shown in Table C- 1.
Table C- 1. Radionuclides of Concern for Building T-2 FSS
ROC Name Principal Emissions
Screening DCGL (dpm/100 cm2)1
H-3 Tritium β-max (0.0186 MeV) 1.14E+08
C-14 Carbon-14 β-max (0.156 MeV) 3.4E+06
Ra-2262 Radium-226
β+ (0.545 MeV) γ (1.275 MeV) γ (0.511 MeV)3 1.01E+03
Notes: 1. Screening DCGLs taken from NUREG-5512 2. Ra-226 is a ROC for Room 15 Only. As-Built drawings for Building T-2 indicated Room 15 as a
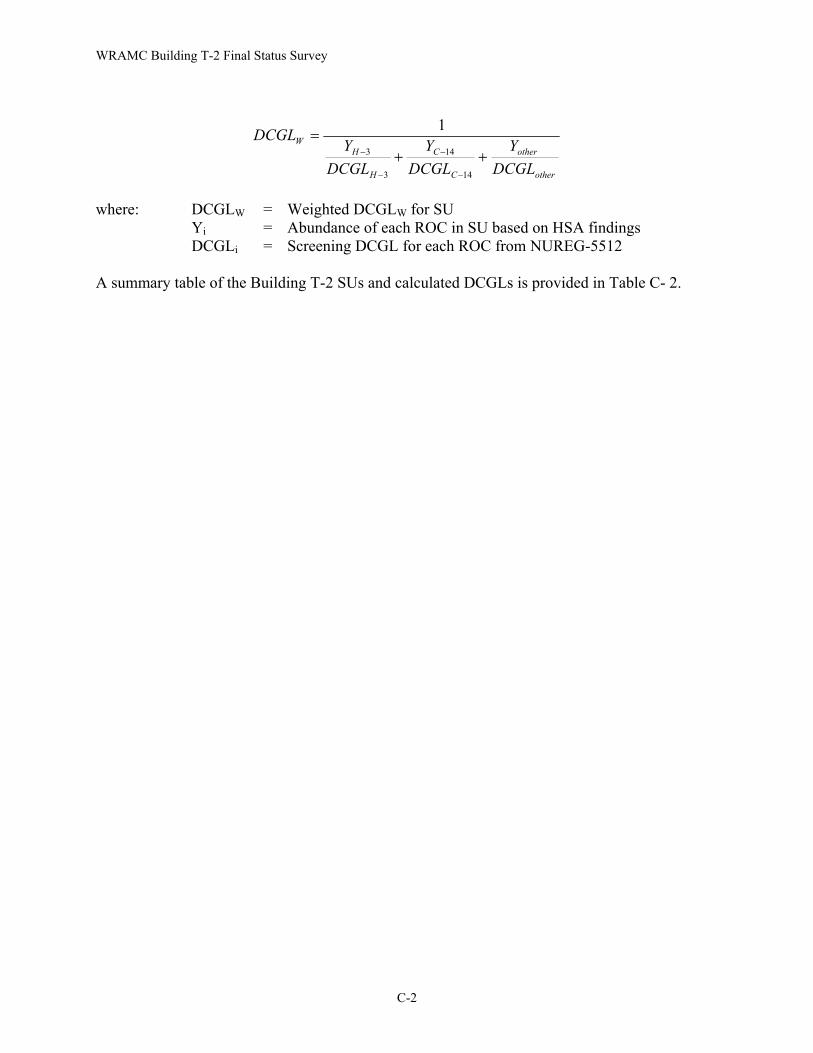
‘Radium Storage Area.’ No radioactive material authorizations or protocols found. IDENTIFICATION OF SURVEY UNITS, CLASSIFICATION, AND DCGLS As discussed in MARSSIM, site areas being final status surveyed should be classified according to their potential for residual radioactivity. The classification process is discussed in detail in MARSSIM Sections 2.2, 4.4, 5.5.2, and 5.5.3. Nine rooms were identified as having the potential for residual contamination as a result of use or storage of radioactive materials. Although none had documented spills, the HPO decided to conservatively classify all 9 as MARSSIM Class 2 for the sake of this FSS. However, due to the history of radioactive material use in Building T-2 and no indication of contamination in review of historical documents, the upper wall and ceiling areas of each SU were considered Non-Impacted and as such were not investigated during this FSS. Weighted room-specific DCGLs were formulated based on the findings of the Building T-2 HSA. A weighted DCGL was calculated using a surrogate approach to account for hard-to-detect radionuclides (HTDR), such as H-3, which cannot be directly measured in the field. The surrogate formula from the MARSSIM (NRC, 2000) is provided below:
C-1
WRAMC Building T-2 Final Status Survey
other
other
C
C
H
HW
DCGLY
DCGLY
DCGLY
DCGL++
=
−
−
−
−
14
14
3
3
1
where: DCGLW = Weighted DCGLW for SU Yi = Abundance of each ROC in SU based on HSA findings DCGLi = Screening DCGL for each ROC from NUREG-5512 A summary table of the Building T-2 SUs and calculated DCGLs is provided in Table C- 2.
C-2
WRAMC Building T-2 Final Status Survey
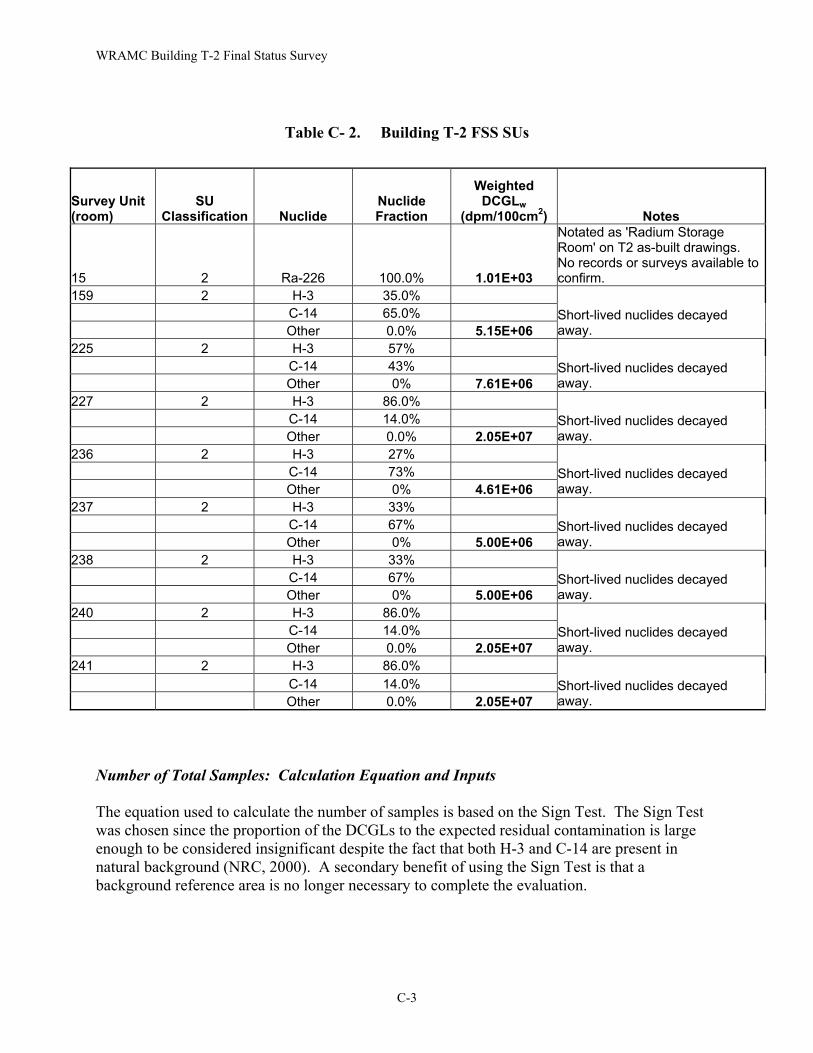
Table C- 2. Building T-2 FSS SUs
Survey Unit (room)
SU Classification Nuclide
Nuclide Fraction
Weighted DCGLw
(dpm/100cm2) Notes
15 2 Ra-226 100.0% 1.01E+03
Notated as 'Radium Storage Room' on T2 as-built drawings. No records or surveys available to confirm.
159 2 H-3 35.0% C-14 65.0%
Other 0.0% 5.15E+06 Short-lived nuclides decayed away.
225 2 H-3 57% C-14 43%
Other 0% 7.61E+06 Short-lived nuclides decayed away.
227 2 H-3 86.0% C-14 14.0%
Other 0.0% 2.05E+07 Short-lived nuclides decayed away.
236 2 H-3 27% C-14 73%
Other 0% 4.61E+06 Short-lived nuclides decayed away.
237 2 H-3 33% C-14 67%
Other 0% 5.00E+06 Short-lived nuclides decayed away.
238 2 H-3 33% C-14 67%
Other 0% 5.00E+06 Short-lived nuclides decayed away.
240 2 H-3 86.0% C-14 14.0%
Other 0.0% 2.05E+07 Short-lived nuclides decayed away.
241 2 H-3 86.0% C-14 14.0%
Other 0.0% 2.05E+07 Short-lived nuclides decayed away.
Number of Total Samples: Calculation Equation and Inputs The equation used to calculate the number of samples is based on the Sign Test. The Sign Test was chosen since the proportion of the DCGLs to the expected residual contamination is large enough to be considered insignificant despite the fact that both H-3 and C-14 are present in natural background (NRC, 2000). A secondary benefit of using the Sign Test is that a background reference area is no longer necessary to complete the evaluation.
C-3
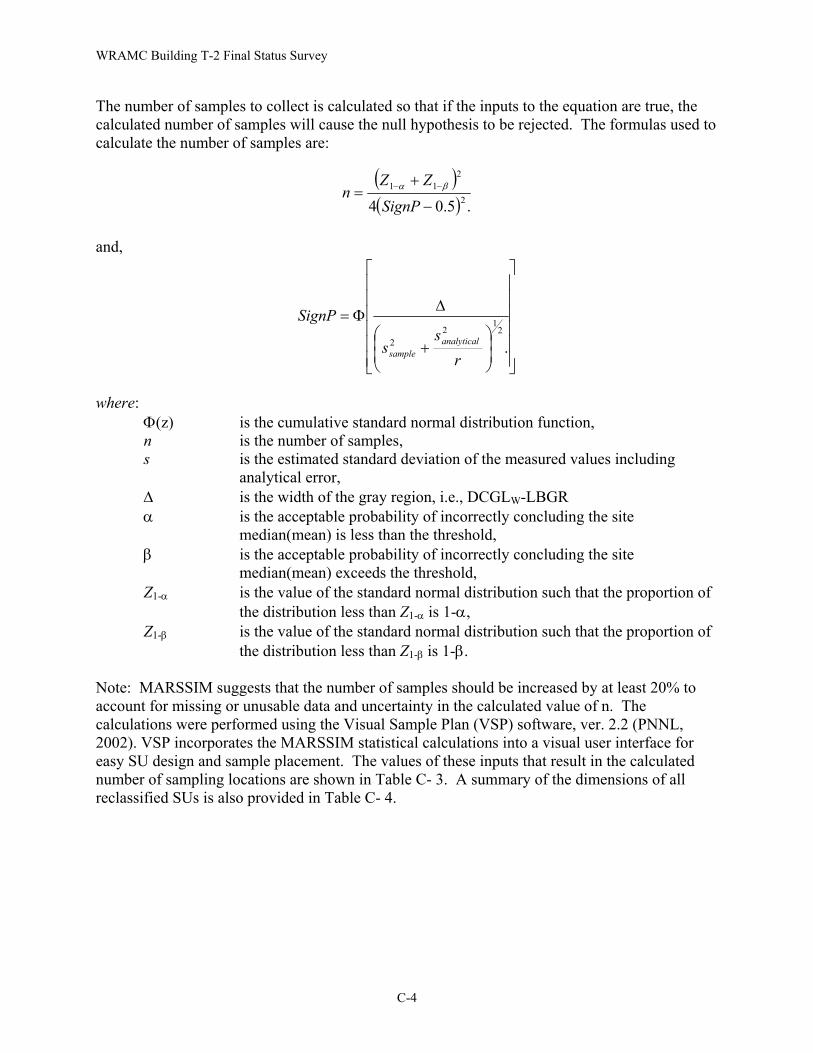
WRAMC Building T-2 Final Status Survey The number of samples to collect is calculated so that if the inputs to the equation are true, the calculated number of samples will cause the null hypothesis to be rejected. The formulas used to calculate the number of samples are:
( )( ) .5.04 2
211
−
+= −−
SignPZZ
n βα
and,
+
∆Φ=
.2
12
2
rs
s
SignPanalytical
sample
where:
Φ(z) is the cumulative standard normal distribution function, n is the number of samples, s is the estimated standard deviation of the measured values including
analytical error, ∆ is the width of the gray region, i.e., DCGLW-LBGR α is the acceptable probability of incorrectly concluding the site
median(mean) is less than the threshold, β is the acceptable probability of incorrectly concluding the site
median(mean) exceeds the threshold, Z1-α is the value of the standard normal distribution such that the proportion of
the distribution less than Z1-α is 1-α, Z1-β is the value of the standard normal distribution such that the proportion of
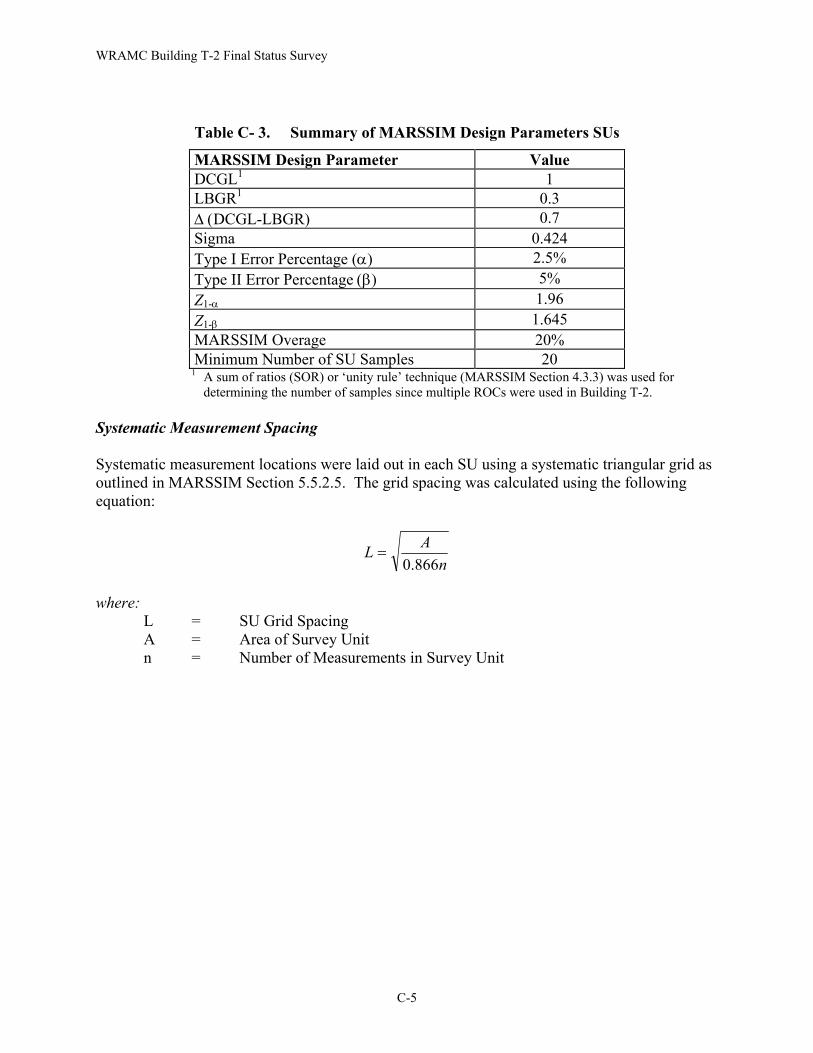
the distribution less than Z1-β is 1-β. Note: MARSSIM suggests that the number of samples should be increased by at least 20% to account for missing or unusable data and uncertainty in the calculated value of n. The calculations were performed using the Visual Sample Plan (VSP) software, ver. 2.2 (PNNL, 2002). VSP incorporates the MARSSIM statistical calculations into a visual user interface for easy SU design and sample placement. The values of these inputs that result in the calculated number of sampling locations are shown in Table C- 3. A summary of the dimensions of all reclassified SUs is also provided in Table C- 4.
C-4
WRAMC Building T-2 Final Status Survey
Table C- 3. Summary of MARSSIM Design Parameters SUs
MARSSIM Design Parameter Value DCGL1 1 LBGR1 0.3 ∆ (DCGL-LBGR) 0.7 Sigma 0.424 Type I Error Percentage (α) 2.5% Type II Error Percentage (β) 5% Z1-α 1.96 Z1-β 1.645 MARSSIM Overage 20% Minimum Number of SU Samples 20
1 A sum of ratios (SOR) or ‘unity rule’ technique (MARSSIM Section 4.3.3) was used for determining the number of samples since multiple ROCs were used in Building T-2.
Systematic Measurement Spacing Systematic measurement locations were laid out in each SU using a systematic triangular grid as outlined in MARSSIM Section 5.5.2.5. The grid spacing was calculated using the following equation:
nAL
866.0=
where:
L = SU Grid Spacing A = Area of Survey Unit n = Number of Measurements in Survey Unit
C-5
WRAMC Building T-2 Final Status Survey
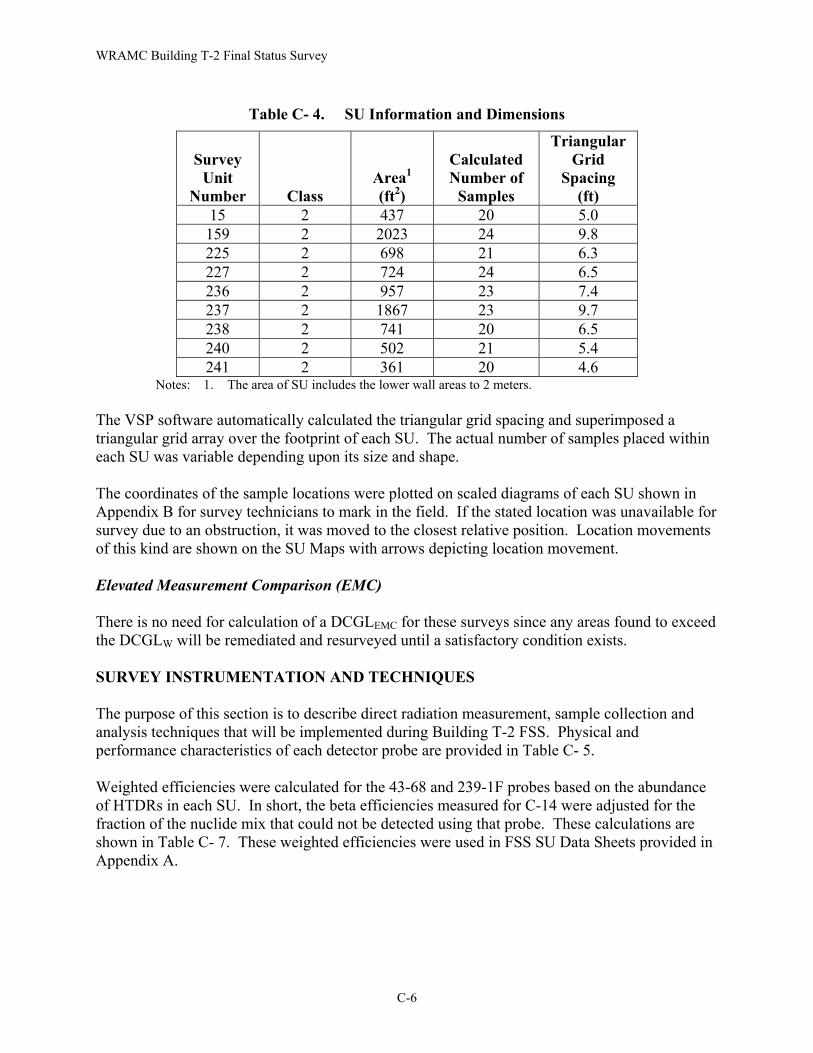
Table C- 4. SU Information and Dimensions
Survey Unit
Number Class Area1 (ft2)
Calculated Number of
Samples
Triangular Grid
Spacing (ft)
15 2 437 20 5.0 159 2 2023 24 9.8 225 2 698 21 6.3 227 2 724 24 6.5 236 2 957 23 7.4 237 2 1867 23 9.7 238 2 741 20 6.5 240 2 502 21 5.4 241 2 361 20 4.6
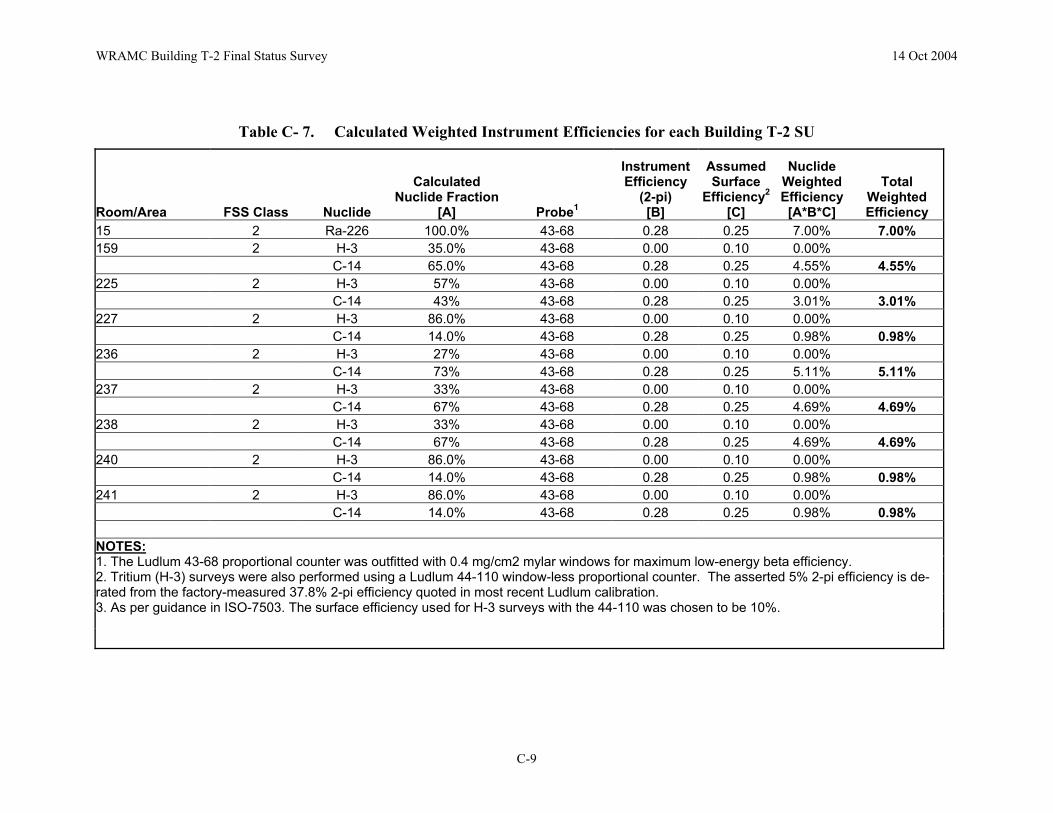
Notes: 1. The area of SU includes the lower wall areas to 2 meters. The VSP software automatically calculated the triangular grid spacing and superimposed a triangular grid array over the footprint of each SU. The actual number of samples placed within each SU was variable depending upon its size and shape. The coordinates of the sample locations were plotted on scaled diagrams of each SU shown in Appendix B for survey technicians to mark in the field. If the stated location was unavailable for survey due to an obstruction, it was moved to the closest relative position. Location movements of this kind are shown on the SU Maps with arrows depicting location movement. Elevated Measurement Comparison (EMC) There is no need for calculation of a DCGLEMC for these surveys since any areas found to exceed the DCGLW will be remediated and resurveyed until a satisfactory condition exists. SURVEY INSTRUMENTATION AND TECHNIQUES The purpose of this section is to describe direct radiation measurement, sample collection and analysis techniques that will be implemented during Building T-2 FSS. Physical and performance characteristics of each detector probe are provided in Table C- 5. Weighted efficiencies were calculated for the 43-68 and 239-1F probes based on the abundance of HTDRs in each SU. In short, the beta efficiencies measured for C-14 were adjusted for the fraction of the nuclide mix that could not be detected using that probe. These calculations are shown in Table C- 7. These weighted efficiencies were used in FSS SU Data Sheets provided in Appendix A.
C-6
WRAMC Building T-2 Final Status Survey
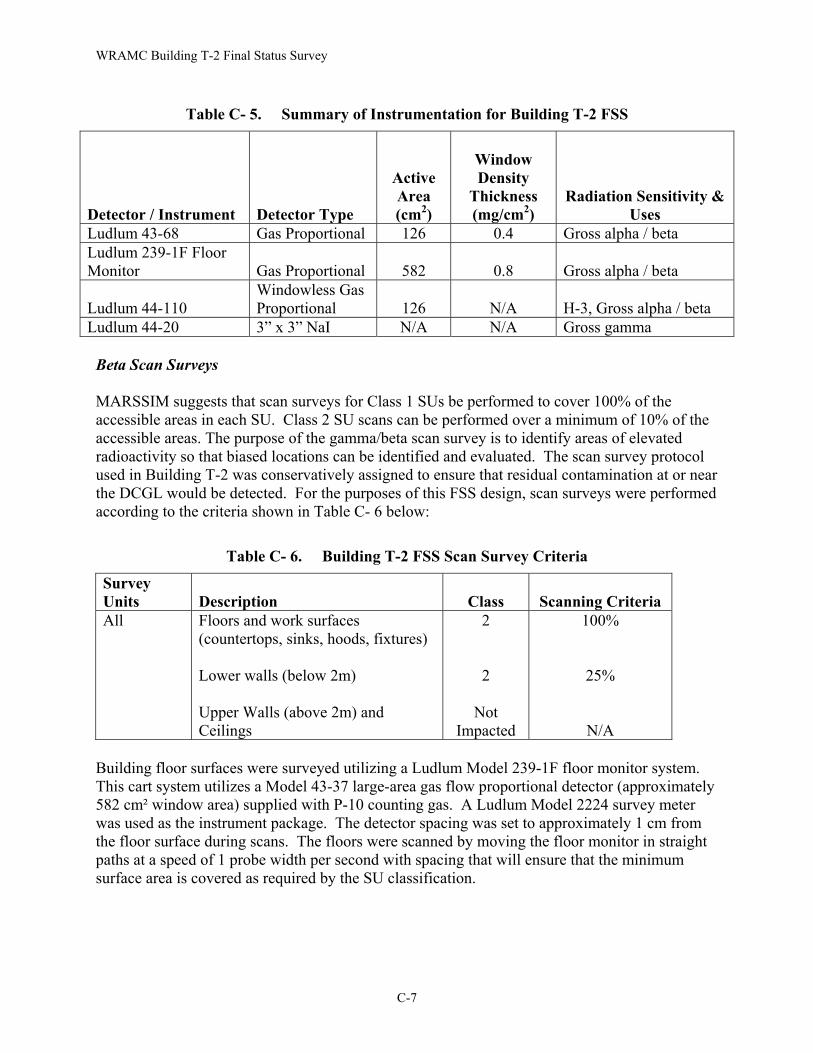
Table C- 5. Summary of Instrumentation for Building T-2 FSS
Detector / Instrument Detector Type
Active Area (cm2)
Window Density
Thickness (mg/cm2)
Radiation Sensitivity & Uses
Ludlum 43-68 Gas Proportional 126 0.4 Gross alpha / beta Ludlum 239-1F Floor Monitor Gas Proportional 582 0.8 Gross alpha / beta
Ludlum 44-110 Windowless Gas Proportional 126 N/A H-3, Gross alpha / beta
Ludlum 44-20 3” x 3” NaI N/A N/A Gross gamma Beta Scan Surveys MARSSIM suggests that scan surveys for Class 1 SUs be performed to cover 100% of the accessible areas in each SU. Class 2 SU scans can be performed over a minimum of 10% of the accessible areas. The purpose of the gamma/beta scan survey is to identify areas of elevated radioactivity so that biased locations can be identified and evaluated. The scan survey protocol used in Building T-2 was conservatively assigned to ensure that residual contamination at or near the DCGL would be detected. For the purposes of this FSS design, scan surveys were performed according to the criteria shown in Table C- 6 below:
Table C- 6. Building T-2 FSS Scan Survey Criteria
Survey Units Description Class Scanning Criteria All
Floors and work surfaces (countertops, sinks, hoods, fixtures) Lower walls (below 2m) Upper Walls (above 2m) and Ceilings
2 2
Not Impacted
100%
25%
N/A Building floor surfaces were surveyed utilizing a Ludlum Model 239-1F floor monitor system. This cart system utilizes a Model 43-37 large-area gas flow proportional detector (approximately 582 cm² window area) supplied with P-10 counting gas. A Ludlum Model 2224 survey meter was used as the instrument package. The detector spacing was set to approximately 1 cm from the floor surface during scans. The floors were scanned by moving the floor monitor in straight paths at a speed of 1 probe width per second with spacing that will ensure that the minimum surface area is covered as required by the SU classification.
C-7
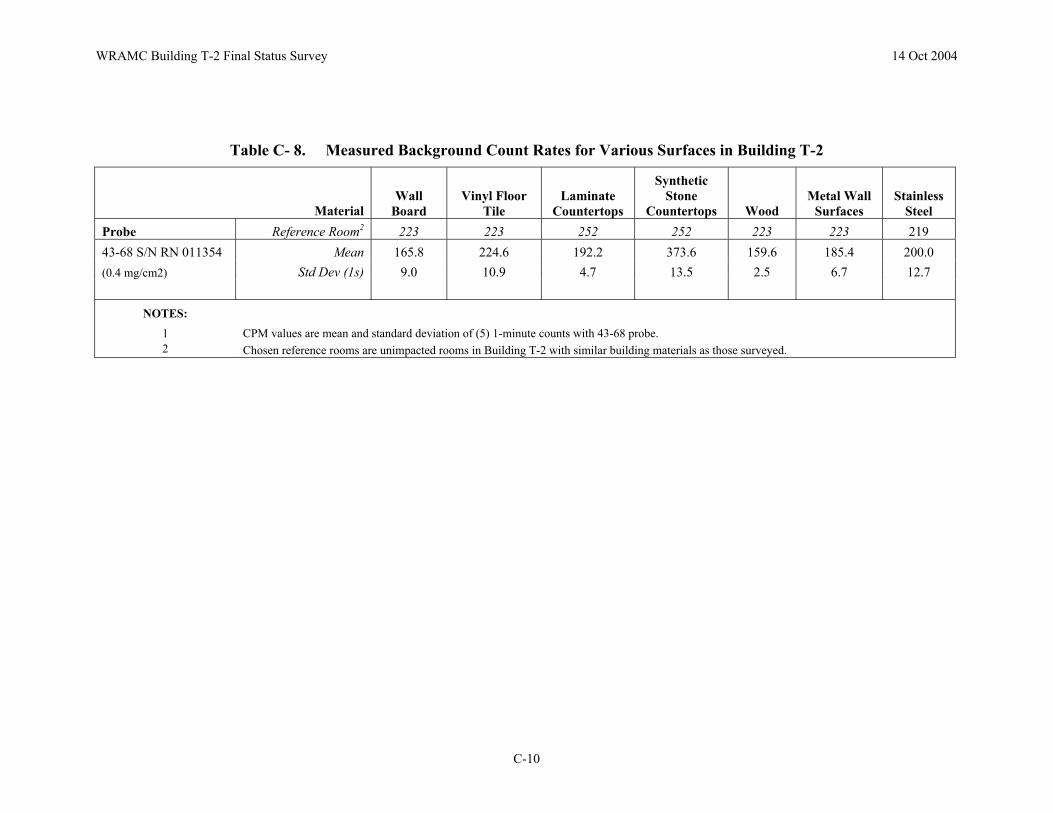
WRAMC Building T-2 Final Status Survey Floor monitor action levels were set to approximate 3-times the SU ambient background. Observed count rates in excess of this action level were flagged for investigation as a biased static count location. Wall, countertop, and sink scans were performed using Ludlum 43-68 gas-flow proportional detector with 126 cm² window area. The 43-68 probe was moved at a speed of 1 probe-width per second over the surface at a height of 1 cm. Instrument action levels were set to twice the SU material-specific background levels. Action levels served as a trigger for performing biased static counts and wet swipes. Gamma Scan Surveys Scans for gamma contamination were also performed within all SUs in Building T-2. A 3×3 NaI detector in gross count rate mode was used to scan floor, counter, and wall surfaces in all SUs. The intent of these surveys was to identify potential gamma contamination that beta-sensitive instrumentation cannot effectively measure. Particular attention was paid to areas and installed equipment with the highest potential for residual contamination. Examples being sinks, fume hoods, floor drains, piping, etc. Surveys were executed by installing the detector in a jig that allowed the operator to walk upright while suspending the detector approximately 1-inch off the surface of the floor. The operator used the audio output of the ratemeter to identify areas of elevated contamination. The action level for these surveys was 3-times the ambient background measurement taken in each room prior to beginning the survey. Fixed-Point Surface Radioactivity Measurements Fixed-point, or static, surface radioactivity measurements were performed with the same Ludlum Model 43-68 gas proportional detectors described above. Static counts were taken at all systematic, biased, and background survey locations in each SU as shown in Appendix A. All counts were 1-minute in duration with results recorded on the FSS Summary Data Sheets. Determination of Background Determination of background values is of the utmost importance in building decommissioning projects. Since ‘Net’ residual contamination values are used to assert whether Building T-2 satisfies release criteria for unrestricted use, both as direct comparison to DCGLW’s and as input into the Sign Test, application of accurate and applicable background values is crucial to proper decision-making. In this light, significant efforts were made to characterize the background levels in Building T-2. Both ambient count rates and surface emission count rates from various building materials were taken in each SU. At a minimum, five 1-minute ambient background measurements were taken in the center of the room with the proportional detectors facing upward. This data is recorded in the “Ambient Background” line on each SU FSS Data Sheet (see Appendix A). A summary of the compiled background data is shown in Table C-8. Values from the table were subtracted from each sample location before data analysis was attempted.
C-8
WRAMC Building T-2 Final Status Survey 14 Oct 2004
Table C- 7. Calculated Weighted Instrument Efficiencies for each Building T-2 SU
Room/Area FSS Class Nuclide
Calculated Nuclide Fraction
[A] Probe1
Instrument Efficiency
(2-pi) [B]
Assumed Surface
Efficiency2
[C]
Nuclide Weighted Efficiency [A*B*C]
Total Weighted Efficiency
15 2 Ra-226 100.0% 43-68 0.28 0.25 7.00% 7.00% 159 2 H-3 35.0% 43-68 0.00 0.10 0.00% C-14 65.0% 43-68 0.28 0.25 4.55% 4.55% 225 2 H-3 57% 43-68 0.00 0.10 0.00% C-14 43% 43-68 0.28 0.25 3.01% 3.01% 227 2 H-3 86.0% 43-68 0.00 0.10 0.00% C-14 14.0% 43-68 0.28 0.25 0.98% 0.98% 236 2 H-3 27% 43-68 0.00 0.10 0.00% C-14 73% 43-68 0.28 0.25 5.11% 5.11% 237 2 H-3 33% 43-68 0.00 0.10 0.00% C-14 67% 43-68 0.28 0.25 4.69% 4.69% 238 2 H-3 33% 43-68 0.00 0.10 0.00% C-14 67% 43-68 0.28 0.25 4.69% 4.69% 240 2 H-3 86.0% 43-68 0.00 0.10 0.00% C-14 14.0% 43-68 0.28 0.25 0.98% 0.98% 241 2 H-3 86.0% 43-68 0.00 0.10 0.00% C-14 14.0% 43-68 0.28 0.25 0.98% 0.98% NOTES: 1. The Ludlum 43-68 proportional counter was outfitted with 0.4 mg/cm2 mylar windows for maximum low-energy beta efficiency. 2. Tritium (H-3) surveys were also performed using a Ludlum 44-110 window-less proportional counter. The asserted 5% 2-pi efficiency is de-rated from the factory-measured 37.8% 2-pi efficiency quoted in most recent Ludlum calibration. 3. As per guidance in ISO-7503. The surface efficiency used for H-3 surveys with the 44-110 was chosen to be 10%.
C-9
WRAMC Building T-2 Final Status Survey 14 Oct 2004
Table C- 8. Measured Background Count Rates for Various Surfaces in Building T-2
Material Wall
Board Vinyl Floor
Tile Laminate
Countertops
Synthetic Stone
Countertops WoodMetal Wall
Surfaces Stainless
Steel Probe Reference Room2 223 223 252 252 223 223 219 43-68 S/N RN 011354 Mean 165.8 224.6 192.2 373.6 159.6 185.4 200.0(0.4 mg/cm2) Std Dev (1s) 9.0 10.9 4.7 13.5 2.5 6.7 12.7
NOTES: 1 CPM values are mean and standard deviation of (5) 1-minute counts with 43-68 probe. 2 Chosen reference rooms are unimpacted rooms in Building T-2 with similar building materials as those surveyed.
C-10
WRAMC Building T-2 Final Status Survey 14 Oct 2004 Minimum Detectable Concentrations (MDCs) Fixed-Point MDCs MDCs for fixed-point measurements were calculated using the conventional formula for equal background and sample count times of 1 minute.
( )26.1*
65.43100MDC 2
static EffR
cmdpm b+=
where: Rb is the background count rate in cpm Eff is the instrument 2-pi beta efficiency. 1.26 is the active area correction factor for the 43-68 probe MDC’s were calculated for the Ludlum 43-68 proportional detectors in each SU since the instrument total efficiency varied due to the effect of HTDRs. Planning MDCs were calculated for each SU based on the highest material-specific background value in each SU. These are shown at the top of each FSS Summary Data Sheet in Appendix A. Planning static MDCs ranged from 7.93E+02 to 2.55E+04 dpm per 100 cm2. The wide range of values was due to the fluctuating total efficiency of the 43-68, which varied inversely with the proportion of H-3 in the nuclide mix. Scan MDCs Planning Scan MDC’s were developed in accordance with guidance in NUREG-1507 for all detectors used for scanning purposes during the Building T-2 FSS. The instrument probe combinations used for scanning included the Ludlum Model 239-1F Floor Monitor with model 43-37 gas-flow proportional detector (582 cm2 active area) and Ludlum Model 2350 with Model 43-68 gas-flow proportional detectors (126 cm2 active area). The MDCs were calculated using maximum background count rates observed during initial QC activities and a nominal instrument total efficiency of 1%, taking into consideration the inability to detect H-3. The calculations for the Ludlum 239-1F floor monitor and the Ludlum 43-68 probe are provided below. Scan MDC calculations are also provided for Room 15 as a special case since Ra-226 is the only documented ROC. Therefore, the instrument efficiencies are not de-rated for the presence of HTDRs.
C-11
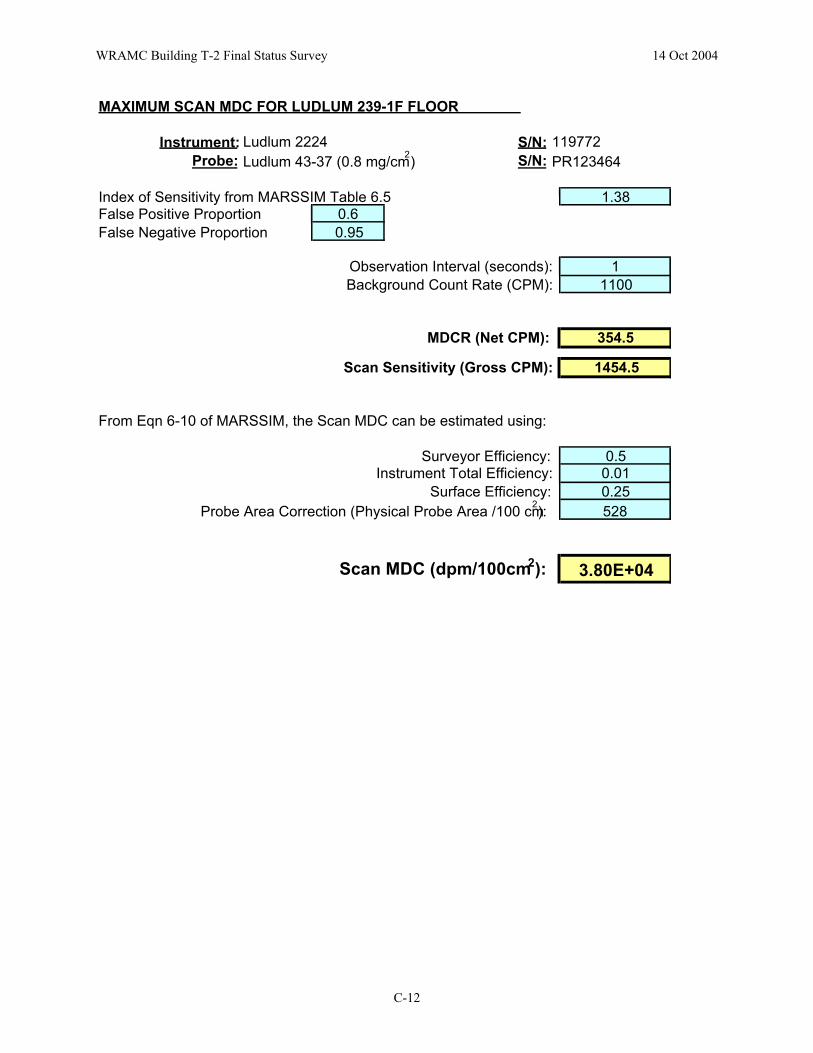
WRAMC Building T-2 Final Status Survey 14 Oct 2004 MAXIMUM SCAN MDC FOR LUDLUM 239-1F FLOOR
Instrument: Ludlum 2224 S/N:Probe: Ludlum 43-37 (0.8 mg/cm2) S/N:
Index of Sensitivity from MARSSIM Table 6.5 1.38 False Positive Proportion 0.6False Negative Proportion 0.95
Observation Interval (seconds): 1 Background Count Rate (CPM): 1100
MDCR (Net CPM): 354.5
Scan Sensitivity (Gross CPM): 1454.5
From Eqn 6-10 of MARSSIM, the Scan MDC can be estimated using:
Surveyor Efficiency: 0.5 Instrument Total Efficiency: 0.01
Surface Efficiency: 0.25 Probe Area Correction (Physical Probe Area /100 cm2): 528
Scan MDC (dpm/100cm2): 3.80E+04
119772 PR123464
C-12
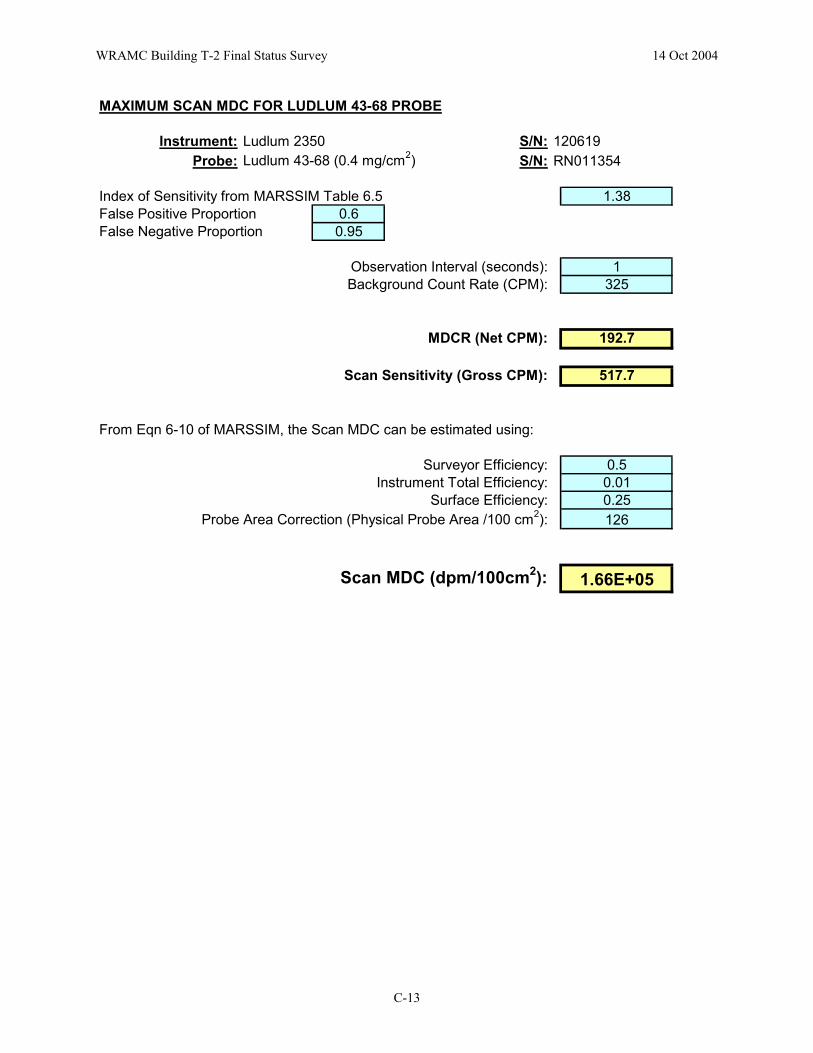
WRAMC Building T-2 Final Status Survey 14 Oct 2004 MAXIMUM SCAN MDC FOR LUDLUM 43-68 PROBE
Instrument: Ludlum 2350 S/N:Probe: Ludlum 43-68 (0.4 mg/cm2) S/N:
Index of Sensitivity from MARSSIM Table 6.5 1.38False Positive Proportion 0.6False Negative Proportion 0.95
Observation Interval (seconds): 1Background Count Rate (CPM): 325
MDCR (Net CPM): 192.7
Scan Sensitivity (Gross CPM): 517.7
From Eqn 6-10 of MARSSIM, the Scan MDC can be estimated using:
Surveyor Efficiency: 0.5Instrument Total Efficiency: 0.01
Surface Efficiency: 0.25Probe Area Correction (Physical Probe Area /100 cm2): 126
Scan MDC (dpm/100cm2): 1.66E+05
120619RN011354
C-13

WRAMC Building T-2 Final Status Survey 14 Oct 2004 ROOM 15 SCAN MDC FOR LUDLUM 239-1F FLOOR MONITOR (Ra-226)
Instrument: Ludlum 2224 S/N:Probe: Ludlum 43-37 (0.8 mg/cm2) S/N:
Index of Sensitivity from MARSSIM Table 6.5 1.38False Positive Proportion 0.6False Negative Proportion 0.95
Observation Interval (seconds): 1Background Count Rate (CPM): 1100
MDCR (Net CPM): 354.5
Scan Sensitivity (Gross CPM): 1454.5
From Eqn 6-10 of MARSSIM, the Scan MDC can be estimated using:
Surveyor Efficiency: 0.5Instrument Total Efficiency: 0.11
Surface Efficiency: 0.25Probe Area Correction (Physical Probe Area /100 cm2): 528
Scan MDC (dpm/100cm2): 3.45E+03
119772PR123464
C-14
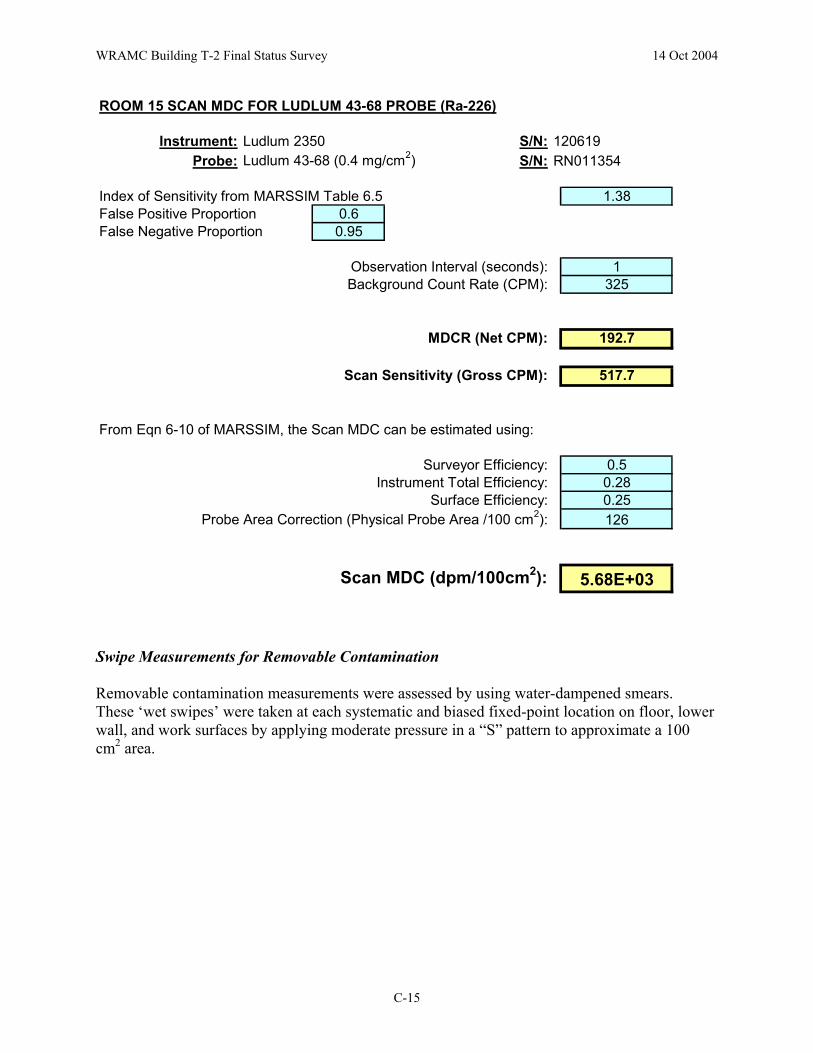
WRAMC Building T-2 Final Status Survey 14 Oct 2004 ROOM 15 SCAN MDC FOR LUDLUM 43-68 PROBE (Ra-226)
Instrument: Ludlum 2350 S/N:Probe: Ludlum 43-68 (0.4 mg/cm2) S/N:
Index of Sensitivity from MARSSIM Table 6.5 1.38False Positive Proportion 0.6False Negative Proportion 0.95
Observation Interval (seconds): 1Background Count Rate (CPM): 325
MDCR (Net CPM): 192.7
Scan Sensitivity (Gross CPM): 517.7
From Eqn 6-10 of MARSSIM, the Scan MDC can be estimated using:
Surveyor Efficiency: 0.5Instrument Total Efficiency: 0.28
Surface Efficiency: 0.25Probe Area Correction (Physical Probe Area /100 cm2): 126
Scan MDC (dpm/100cm2): 5.68E+03
120619RN011354
Swipe Measurements for Removable Contamination Removable contamination measurements were assessed by using water-dampened smears. These ‘wet swipes’ were taken at each systematic and biased fixed-point location on floor, lower wall, and work surfaces by applying moderate pressure in a “S” pattern to approximate a 100 cm2 area.
C-15
WRAMC Building T-2 Final Status Survey 14 Oct 2004 INSTRUMENT CALIBRATION All instruments used during the course of the survey were in current calibration traceable to the NIST. QUALITY CONTROL TRACKING Quality Control (QC) measurements were performed daily prior to any survey data being collected. A controlled area was used to perform these checks. The QC criteria for the instruments used during daily surveys were defined as follows: Tight quality controls were administered to ensure that the data reported is of the highest quality. If any single measurement were found to be outside of 3σ (Investigation Level), the measurement was repeated. If the second count was also found to be outside of 3σ, the instrument was investigated to assess if any external biases or instrument physical damage was present. Quantitative Instruments Instruments used in this category were the Ludlum model 2350 data logger and the Ludlum model 2221 scaler/ratemeter. These instruments were designated as ‘quantitative,’ meaning that activity determinations (i.e. dpm/100cm2) could be made using these instruments. Daily performance checks of these instruments included daily background and source checks with Carbon-14. These results were plotted on control charts and compared with ±2σ and ±3σ boundary markers. Administration of QC for the Ludlum 2350 was handled in the following manner. Each daily background and source measurement was recorded and the resulting counts plotted on the control chart. The tolerance bands on each control chart were determined from repeated baseline measurements taken at the beginning of the survey effort. If any point was found to reside outside of 3σ, the instrument could still be used provided that the condition did not occur on two consecutive tries. Control charts for each instrument are shown in the figures that follow.
D-1
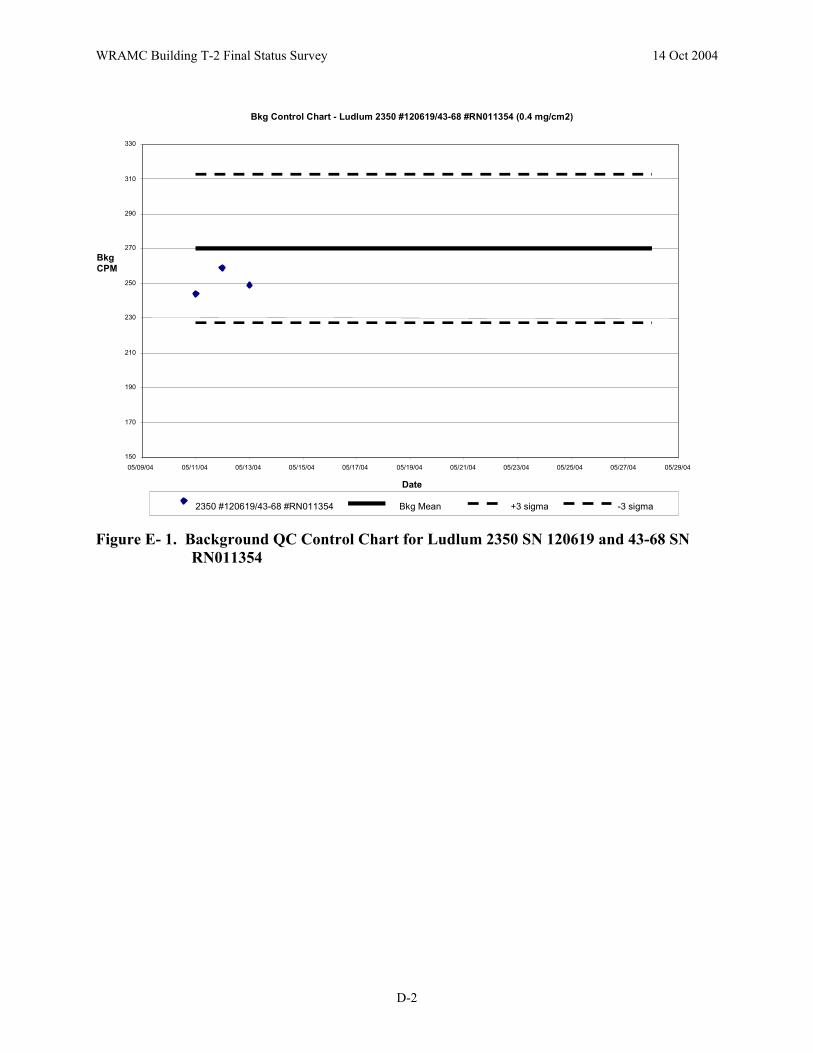
WRAMC Building T-2 Final Status Survey 14 Oct 2004
Bkg Control Chart - Ludlum 2350 #120619/43-68 #RN011354 (0.4 mg/cm2)
150
170
190
210
230
250
270
290
310
330
05/09/04 05/11/04 05/13/04 05/15/04 05/17/04 05/19/04 05/21/04 05/23/04 05/25/04 05/27/04 05/29/04
Date
Bkg CPM
2350 #120619/43-68 #RN011354 Bkg Mean +3 sigma -3 sigma
Figure E- 1. Background QC Control Chart for Ludlum 2350 SN 120619 and 43-68 SN RN011354
D-2
WRAMC Building T-2 Final Status Survey 14 Oct 2004
C-14 Control Chart - Ludlum 2350 #120619/43-68 #RN011354 (0.4 mg/cm2)
27000
27500
28000
28500
29000
29500
30000
30500
05/09/04 05/11/04 05/13/04 05/15/04 05/17/04 05/19/04 05/21/04 05/23/04 05/25/04 05/27/04 05/29/04
Date
C-14 Net CPM
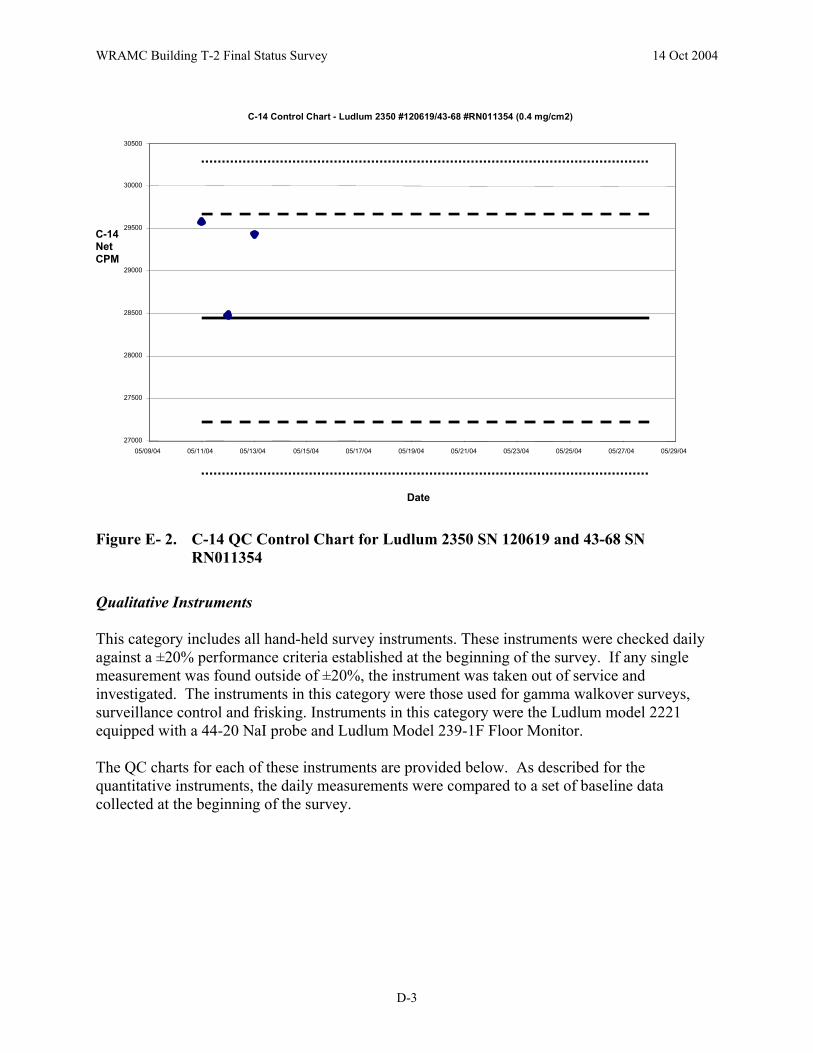
Figure E- 2. C-14 QC Control Chart for Ludlum 2350 SN 120619 and 43-68 SN
RN011354
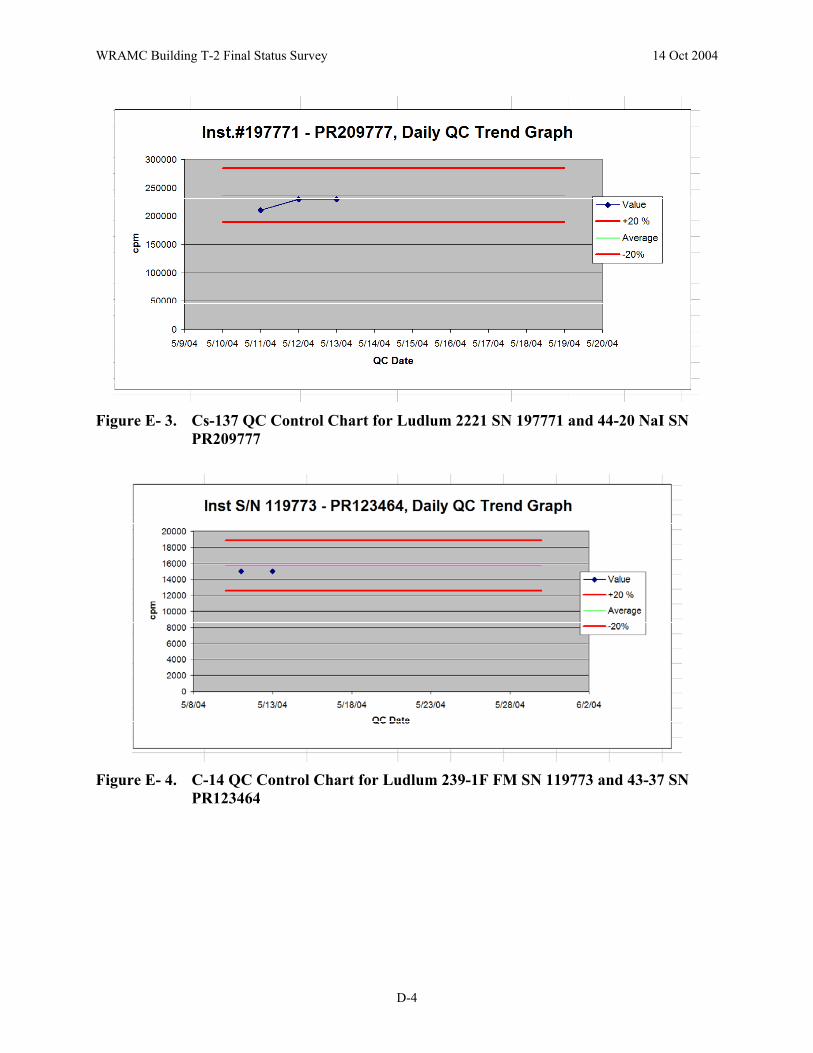
Qualitative Instruments This category includes all hand-held survey instruments. These instruments were checked daily against a ±20% performance criteria established at the beginning of the survey. If any single measurement was found outside of ±20%, the instrument was taken out of service and investigated. The instruments in this category were those used for gamma walkover surveys, surveillance control and frisking. Instruments in this category were the Ludlum model 2221 equipped with a 44-20 NaI probe and Ludlum Model 239-1F Floor Monitor. The QC charts for each of these instruments are provided below. As described for the quantitative instruments, the daily measurements were compared to a set of baseline data collected at the beginning of the survey.
D-3
WRAMC Building T-2 Final Status Survey 14 Oct 2004
Figure E- 3. Cs-137 QC Control Chart for Ludlum 2221 SN 197771 and 44-20 NaI SN
PR209777
Figure E- 4. C-14 QC Control Chart for Ludlum 239-1F FM SN 119773 and 43-37 SN
PR123464
D-4