war on crime vs the war on rugs - portland state university€¦ · jamein p. cunningham the war on...
TRANSCRIPT

Portland State University
Jamein P. Cunningham
Department of Economics
Portland State University
March 3rd, 2017
THE WAR ON CRIME VS THE WAR ON DRUGS
AN OVERVIEW OF RESEARCH ON INTERGOVERNMENTAL GRANT
PROGRAMS TO FIGHT CRIME
Economics Department Seminar

• The War on Crime vs The War on Drugs
“Law Enforcement Assistance Administration: The Introduction of the War on
Crime” w/ Sayak Khatua
“The Impact of Federal Law Enforcement Grants on Drug Arrests and Incarceration
Rates: Evidence from the Edward Byrne Program” w/ Robynn Cox
Outline
The War on Crime vs The War on DrugsJamein P. Cunningham

• Questions to be addressed:
Do National Crime Programs Change Local Government or Policing
Behavior?
How Effective are Nation Crime Programs at Reducing Crime or meeting
their stated goals?
Are there intended or unintended results related to race?
Jamein P. Cunningham
Outline
The War on Crime vs The War on Drugs

• The results indicate that:
National Crime Programs
National Program w/o enforcement mechanisms are not likely to influence size of
the police force as well as crime and arrests rates.
National Crime Programs that focused on narcotic control increased arrests related
to drug trafficking.─ 107 percent increase in white arrests for drug sales
─ 44 percent increase in black arrests for drug sales
Preview of Results
Jamein P. Cunningham The War on Crime vs The War on Drugs

OVERVIEW
Jamein P. Cunningham The War on Crime vs The War on Drugs

Overview
• The 1960’s was a decade of radical changes in the political and economic structure of the United
States.
War on Poverty, War on Crime, Expansion of Health Care for Poor and Elderly, Desegregation, Civil Rights
Act, Voting Rights Act, Fair Housing, many more….
0
1000
2000
3000
4000
5000
6000
7000
8000
9000
1960 1965 1970 1975 1980 1985 1990 1995
WOP
Established
Jamein P. Cunningham The War on Crime vs The War on Drugs

Overview
• Reported crime started to rise dramatically in mid 1960’s
Large Cohort of Juvenile between the age of 15 and 21
Exposure to lead
Civil Unrest and Riots
0
1000
2000
3000
4000
5000
6000
7000
8000
9000
1960 1965 1970 1975 1980 1985 1990 1995
WOP
Established
Jamein P. Cunningham The War on Crime vs The War on Drugs

Overview
• These reforms also occurred during the same time that crime rates, female household headship
rates, and divorce rates in the United States began to rise dramatically.
Reduction in State Mental Hospitals, Expansion of Public Assistance Programs, Black Migration and White
Flight, Urban Uprisings, Militarization of the Police
Incarcerates began to explode in the mid 1970s
0
1000
2000
3000
4000
5000
6000
7000
8000
9000
1960 1965 1970 1975 1980 1985 1990 1995
WOP
Established
Jamein P. Cunningham The War on Crime vs The War on Drugs

Overview
• New evidence suggest that mass incarceration was driven by policy changes not criminal
behavior (Raphael and Stoll, 2013).
War on drugs led to racial disparities within the criminal justice system (Benson and Rasmussen, 1996;
Blumenson and Nilsen, 1998).
Intergovernmental grants and other programs (e.g., asset forfeiture programs) (Alexander, 2010; Cox, 2015)
0
1000
2000
3000
4000
5000
6000
7000
8000
9000
1960 1965 1970 1975 1980 1985 1990 1995
WOP
Established
Jamein P. Cunningham The War on Crime vs The War on Drugs

Overview
Law Enforcement Assistance Administration (LEAA)
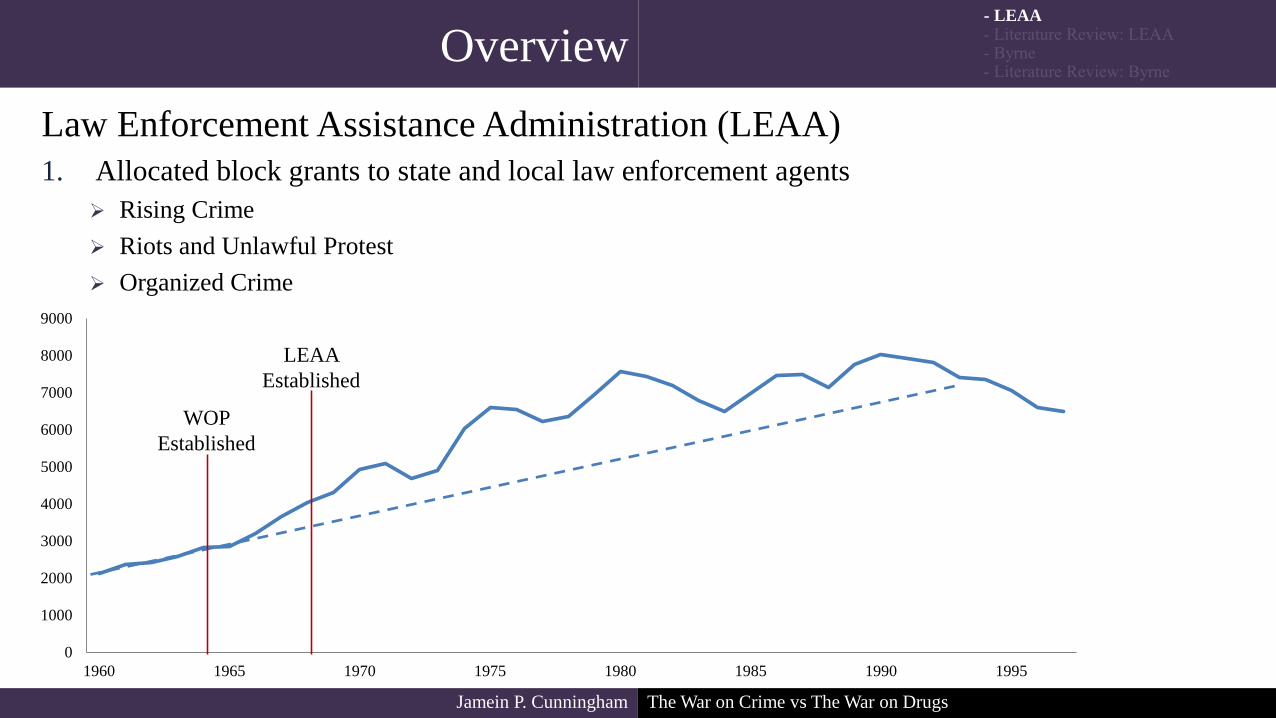
• Established under the Omnibus Crime Control and Safe Street Act of 1968 under Title 1.
0
1000
2000
3000
4000
5000
6000
7000
8000
9000
1960 1965 1970 1975 1980 1985 1990 1995
LEAA
Established
WOP
Established
Jamein P. Cunningham
- LEAA
The War on Crime vs The War on Drugs
Overview
Law Enforcement Assistance Administration (LEAA)
1. Allocated block grants to state and local law enforcement agents
Rising Crime
Riots and Unlawful Protest
Organized Crime
0
1000
2000
3000
4000
5000
6000
7000
8000
9000
1960 1965 1970 1975 1980 1985 1990 1995
LEAA
Established
WOP
Established
Jamein P. Cunningham
- LEAA
The War on Crime vs The War on Drugs

Overview
Law Enforcement Assistance Administration (LEAA)
2. Grants provided aid in training, equipment, hiring new police officers
• Although in existence until 1982, LEAA did not administer any grants after 1980.
0
1000
2000
3000
4000
5000
6000
7000
8000
9000
1960 1965 1970 1975 1980 1985 1990 1995
LEAA
Established
WOP
Established
LEAA Ended
Jamein P. Cunningham
- LEAA
The War on Crime vs The War on Drugs

• Initially LEAA grants were touted as the center piece on the War on Crime but support
of the program quickly began to wane.
• Public Criticism of LEAA (Horrock, 1975; Varon, 1975; “U.S. Anticrime”, 1976;
“Floundering”, 1977 ; Diegelman, 1982)
The lack of leadership,
Mission
Bureaucratic red tape
Simplistic
• LEAA criticized for inappropriate usage of Funds.
Little evidence that funds were used to increase the number of officers (“Crime Program”, 1972).
Funds were often unaccounted (Halloran, 1971; Varon, 1975; C.H., 1976; Diegelman, 1982).
Jamein P. Cunningham
- Literature Review: LEAAOverview
The War on Crime vs The War on Drugs

Overview
• By the 1980s the War on Crime was supplanted by the War on Drugs.
Violence surrounding the crack epidemic created bi-partisan agreement for a federal intervention (Kerr, 1986;
D’Amato, 1986).
0
1000
2000
3000
4000
5000
6000
7000
8000
9000
1960 1965 1970 1975 1980 1985 1990 1995
LEAA
Established
WOP
Established
LEAA Ended
Jamein P. Cunningham
- Byrne
The War on Crime vs The War on Drugs
Overview
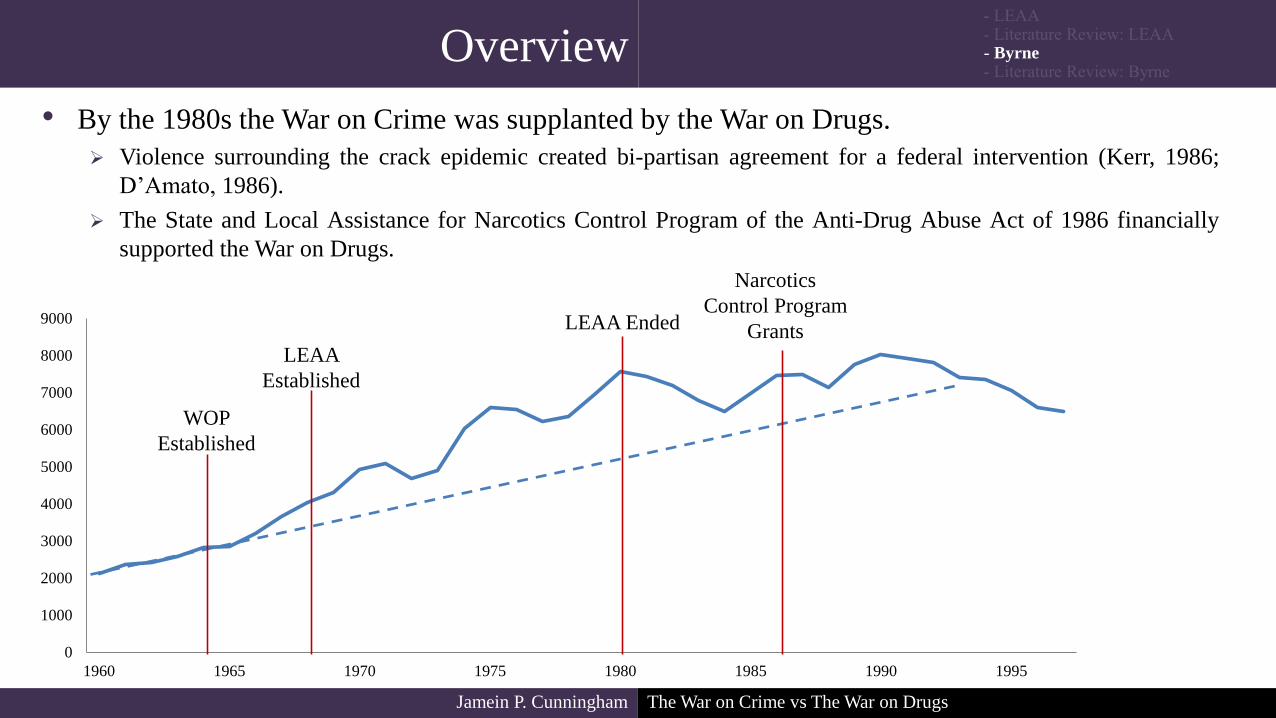
• By the 1980s the War on Crime was supplanted by the War on Drugs.
Violence surrounding the crack epidemic created bi-partisan agreement for a federal intervention (Kerr, 1986;
D’Amato, 1986).
The State and Local Assistance for Narcotics Control Program of the Anti-Drug Abuse Act of 1986 financially
supported the War on Drugs.
0
1000
2000
3000
4000
5000
6000
7000
8000
9000
1960 1965 1970 1975 1980 1985 1990 1995
LEAA
Established
WOP
Established
LEAA Ended
Narcotics
Control Program
Grants
Jamein P. Cunningham
- Byrne
The War on Crime vs The War on Drugs

Overview
• By the 1980s the War on Crime was supplanted by the War on Drugs.
The Anti-Drug Abuse Act of 1988 renamed the grant program the Edward Byrne Memorial State and Local
Law Enforcement Assistance Program.
0
1000
2000
3000
4000
5000
6000
7000
8000
9000
1960 1965 1970 1975 1980 1985 1990 1995
LEAA
Established
WOP
Established
LEAA Ended
Narcotics
Control Program
Grants
Renamed The
Edward Byrne
Memorial LEAP
Jamein P. Cunningham
- Byrne
The War on Crime vs The War on Drugs

Edward Byrne Memorial State and Local Law Enforcement Assistance
Program (Byrne)
Established by the Anti-Drug Abuse Act of 1986 and initially operated
as the State and Local Assistance for Narcotics Control Program.
1. To allocated block grants to state and local law enforcement agencies for drug
related offenses – focusing on:
Apprehension
Prosecution
Detention and rehabilitation
2. Grants provided aid in training, equipment, hiring new police officers.
Multijurisdictional drug task force units
Grants had to be match by local municipalities (3 to 1).
Jamein P. Cunningham
- ByrneOverview
The War on Crime vs The War on Drugs

• Byrne grants went to local municipalities for variety of areas to influence law
enforcement effectiveness but approximately half of all funds were used to establish
multijurisdictional drug task forces (MJDTF) between 1989 and 1993 (Dunworth et
al., 1996d).
• MJDTF were created to deal with drug trafficking that often involved multiple
jurisdictions.
Byrne grants through MJDTF have been championed as effective in improving communication
between law enforcement agencies (McGarrell and Schlegel, 1993; Jefferies et al, 1998).
By 1991, there existed 904 MJDTF which were responsible for over 250,000 arrests made in that
year (Blumenson and Nilsen, 1998).
• Despite the MJDTF covering 83 percent of the population, there is little evidence that
the Byrne grants influenced drug arrest (Smith et al., 2000; Mazerolle, 2007).
Jamein P. Cunningham
- Literature Review: ByrneOverview
The War on Crime vs The War on Drugs
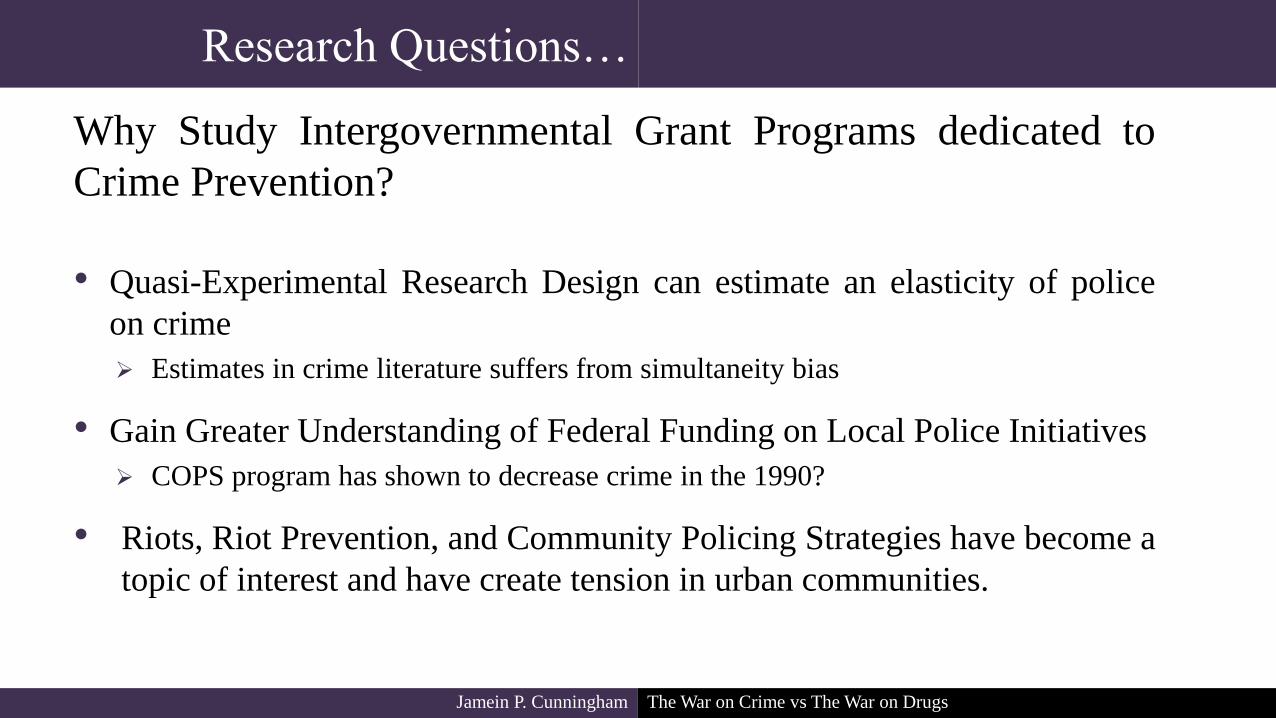
Why Study Intergovernmental Grant Programs dedicated to
Crime Prevention?
• Quasi-Experimental Research Design can estimate an elasticity of police
on crime
Estimates in crime literature suffers from simultaneity bias
• Gain Greater Understanding of Federal Funding on Local Police Initiatives
COPS program has shown to decrease crime in the 1990?
• Riots, Riot Prevention, and Community Policing Strategies have become a
topic of interest and have create tension in urban communities.
Jamein P. Cunningham
Research Questions…
The War on Crime vs The War on Drugs

What is the Impact of the Intergovernmental Crime Prevention
Grant Programs?
More Specifically
Impact of police on crime and arrest
How effective was the “War on Crime” and the “War on Drugs”?
How effective are these federal grant programs in enhancing local or community
policing?
Research Design
• Use variation in the timing & location of grants
Difference in Difference using event-study framework
─ Before and After design for description of pre-trends and dynamic response for cities that receive
grants
Jamein P. Cunningham
Research Questions…
The War on Crime vs The War on Drugs

The Event Study Research Design
Visual/statistical evaluation of pre-treatment trends (falsification test)
Describe dynamic, likely non-linear evolution of effects, reflecting set up costs, changes in
use, and changes in composition of population
Estimates of 𝜋 and 𝛿 will be unbiased even in the presence of pre-existing and permanent
difference between cities that receive grants and those that do not
Eliminates potential downward bias from averaging outcomes in newly funded location with
those from more established locations
Uncovers estimates of the elasticity of police on crime
Jamein P. Cunningham
𝑌𝑖,𝑡 = 𝛾𝑖 + 𝛼𝑡,𝑠(𝑖) + 𝑋𝑖,𝑡′ 𝛽 +
𝜏=1
𝑝
𝜋−𝜏 𝐷𝑖1 𝑡 − 𝑇𝑖∗ = −𝜏 +
𝜏=1
𝑞
𝛿𝜏 𝐷𝑖1 𝑡 − 𝑇𝑖∗ = 𝜏 + 휀𝑖,𝑡
- Empirical StrategyMethodology
The War on Crime vs The War on Drugs

: City (i) fixed effects
: State-by-Year fixed effects
X: Annual city level covariates from census linearly interpolated between
census years
𝑌𝑖,𝑡 = 𝛾𝑖 + 𝛼𝑡,𝑠(𝑖) + 𝑋𝑖,𝑡′ 𝛽 +
𝜏=1
𝑝
𝜋−𝜏 𝐷𝑖1 𝑡 − 𝑇𝑖∗ = −𝜏 +
𝜏=1
𝑞
𝛿𝜏 𝐷𝑖1 𝑡 − 𝑇𝑖∗ = 𝜏 + 휀𝑖,𝑡
Jamein P. Cunningham
- Empirical StrategyMethodology
The War on Crime vs The War on Drugs

Di1(): Dummies for 𝜏 years before & after grant is received (Ti*)
Year the grant was issued is omitted: 1(t-Ti* = 0)
: Pre-effects
Change in average difference in treated city outcomes 𝜏 years before establishment relative to
the untreated cities
: Post-effects
Change in the average difference in treated city outcomes 𝜏 years after establishment relative
to the untreated cities
Jamein P. Cunningham
𝑌𝑖,𝑡 = 𝛾𝑖 + 𝛼𝑡,𝑠(𝑖) + 𝑋𝑖,𝑡′ 𝛽 +
𝜏=1
𝑝
𝜋−𝜏 𝐷𝑖1 𝑡 − 𝑇𝑖∗ = −𝜏 +
𝜏=1
𝑞
𝛿𝜏 𝐷𝑖1 𝑡 − 𝑇𝑖∗ = 𝜏 + 휀𝑖,𝑡
- Empirical StrategyMethodology
The War on Crime vs The War on Drugs

Data on Federal Law Enforcement Assistance Administration
Grants
• Federal Outlays files
The date the grant was issued
Geographical Codes
Size of the Grants
• Focus on grants made from 1968 to 1975
Jamein P. Cunningham
- DataMethodology
The War on Crime vs The War on Drugs

Data on Edward Byrne Memorial State and Local Law
Enforcement Assistance Program Grants
• Consolidated Federal Funds Report Files
The date the grant was issued
Geographical Codes
Size of the Grants
• Focus on grants made from 1986 to 2004
Jamein P. Cunningham
- DataMethodology
The War on Crime vs The War on Drugs

Data on Reported Crime by City
• The Uniform Crime Reporting: Offenses Known and Clearance by Arrest (UCR),
provides information on offenses submitted by law enforcement agencies to the
Federal Bureau of Investigation (FBI).
• The Uniform Crime Reporting: Arrests by Age, Sex, and Race provide
information on arrest rates by offense for law enforcement agencies starting in
1980.
• The data compiled for the UCR is submitted voluntarily by city, county, and state
enforcement agencies.
Jamein P. Cunningham
- DataMethodology
The War on Crime vs The War on Drugs

• LEAA analysis will focus on crime rates
Sample Restrictions – Population greater than 25,000
• Byrne analysis will focus on crime and arrest rates by race
Sample Restrictions – Population greater than 50,000
• Technical notes
Weighted by population
Standard errors clustered by city
Jamein P. Cunningham
- DataMethodology
The War on Crime vs The War on Drugs

LEAA GRANTS
Jamein P. Cunningham The War on Crime vs The War on Drugs

LEAA Grants
Jamein P. Cunningham
All Cities LEAA Cities
Non-LEAA
Cities
T-Test of
Difference
A. 1960 City Characteristics
(N=609) (N=431) (N=178)
Means
Population 120,708 150,112 49,512 <0.01
Population per square mile 5,230 5,157 5,407 0.508
Median Income 6,180 6,008 6,599 <0.01
Proportion of residents
with 12 years of education 46.0 45.8 46.4 0.557
nonwhite 9.8 11.1 6.7 <0.01
male between 15-24 years of age 6.8 6.9 6.3 <0.01
male between 25-39 years of age 10.0 10.0 10.0 0.995
The War on Crime vs The War on Drugs

Jamein P. Cunningham
All Cities LEAA Cities
Non-LEAA
Cities
T-Test of
Difference
B. 1960 Offenses Known and Reported
(N=609) (N=431) (N=178)
Violent Crimes per 100,000 residents
Murder 7 8 5 <0.01
Rape 6 7 5 <0.05
Robbery 39 43 28 <0.01
Assault 179 188 138 <0.10
Property Crimes per 100,000 residents
Burglary 557 585 490 <0.01
Larcerny 1,550 1,631 1,349 <0.01
Motor Vehicle Theft 219 231 187 <0.01
Total Crimes per 100,000 residents 2,403 2,539 2,062 <0.01
Sworn Police per 1,000 residents 140 143 133 <0.05
Growth from 1960 to 1965
Total Crimes per 100,000 residents 0.30 0.31 0.29 0.386
Sworn Police per 1,000 residents 0.05 0.05 0.05 0.667
LEAA Grants
The War on Crime vs The War on Drugs

Jamein P. Cunningham
• Our identification strategy relies on pre-existing trends in crime
rates being exogenous from the date of the first grant.
• There is no statistically significant relationship between crime rates
and the date of the first grant.
LEAA Grants
The War on Crime vs The War on Drugs

Jamein P. Cunningham
y = 0.0003x - 0.3278
-1.5
-1
-0.5
0
0.5
1
1.5
1967 1968 1969 1970 1971 1972 1973 1974 1975 1976
Chan
ge
in t
he
Cri
me
Rat
e
1960 -
1965
Year of First Grant
Pre-Trend Relationship Between Date of LEAA Grant and Crime Rates
LEAA Grants
The War on Crime vs The War on Drugs

Preliminary Results: LEAA
Jamein P. Cunningham
Event Study Results – Police per 1,000
-0.06
-0.04
-0.02
0
0.02
0.04
0.06
-4 -2 0 2 4 6 8
Model 1: C & Y Model 2: C & SxY Model 3: C & SxY & Covariates
The War on Crime vs The War on Drugs

Preliminary Results: LEAA
Jamein P. Cunningham
Event Study Results – Police per 1,000
-0.06
-0.04
-0.02
0
0.02
0.04
0.06
-4 -2 0 2 4 6 8
Model 1: C & Y Model 2: C & SxY Model 3: C & SxY & Covariates
The War on Crime vs The War on Drugs

Preliminary Results: LEAA
Jamein P. Cunningham
Event Study Results – Police per 1,000
-0.06
-0.04
-0.02
0
0.02
0.04
0.06
-4 -2 0 2 4 6 8
Model 1: C & Y Model 2: C & SxY Model 3: C & SxY & Covariates
Pre-treatment Effects
Statistically Indistinguishable
from 0
The War on Crime vs The War on Drugs

Preliminary Results: LEAA
Jamein P. Cunningham
Event Study Results – Police per 1,000
-0.06
-0.04
-0.02
0
0.02
0.04
0.06
-4 -2 0 2 4 6 8
Model 1: C & Y Model 2: C & SxY Model 3: C & SxY & Covariates
The War on Crime vs The War on Drugs

Preliminary Results: LEAA
Jamein P. Cunningham
Event Study Results – Police per 1,000
-0.06
-0.04
-0.02
0
0.02
0.04
0.06
-4 -2 0 2 4 6 8
Model 1: C & Y Model 2: C & SxY Model 3: C & SxY & Covariates
Post-treatment Effects Statistically Indistinguishable from 0
The War on Crime vs The War on Drugs

Preliminary Results: LEAA
Jamein P. Cunningham
Event Study Results – Police per 1,000
-0.06
-0.04
-0.02
0
0.02
0.04
0.06
-4 -2 0 2 4 6 8
Model 3: C & SxY & Covariates
The War on Crime vs The War on Drugs

Preliminary Results: LEAA
Jamein P. Cunningham
-0.08
-0.06
-0.04
-0.02
0
0.02
0.04
0.06
0.08
0.1
0.12
0.14
-4 -2 0 2 4 6 8
Model 3: C & SxY & Covariates
Event Study Results –Total Crime per 100,000
The War on Crime vs The War on Drugs

Preliminary Results: LEAA
Jamein P. Cunningham
Event Study Results –Violent Crime per 100,000
-0.15
-0.1
-0.05
0
0.05
0.1
0.15
0.2
-4 -2 0 2 4 6 8
Model 2: Treated Only Sample
The War on Crime vs The War on Drugs
Preliminary Results: LEAA
Jamein P. Cunningham
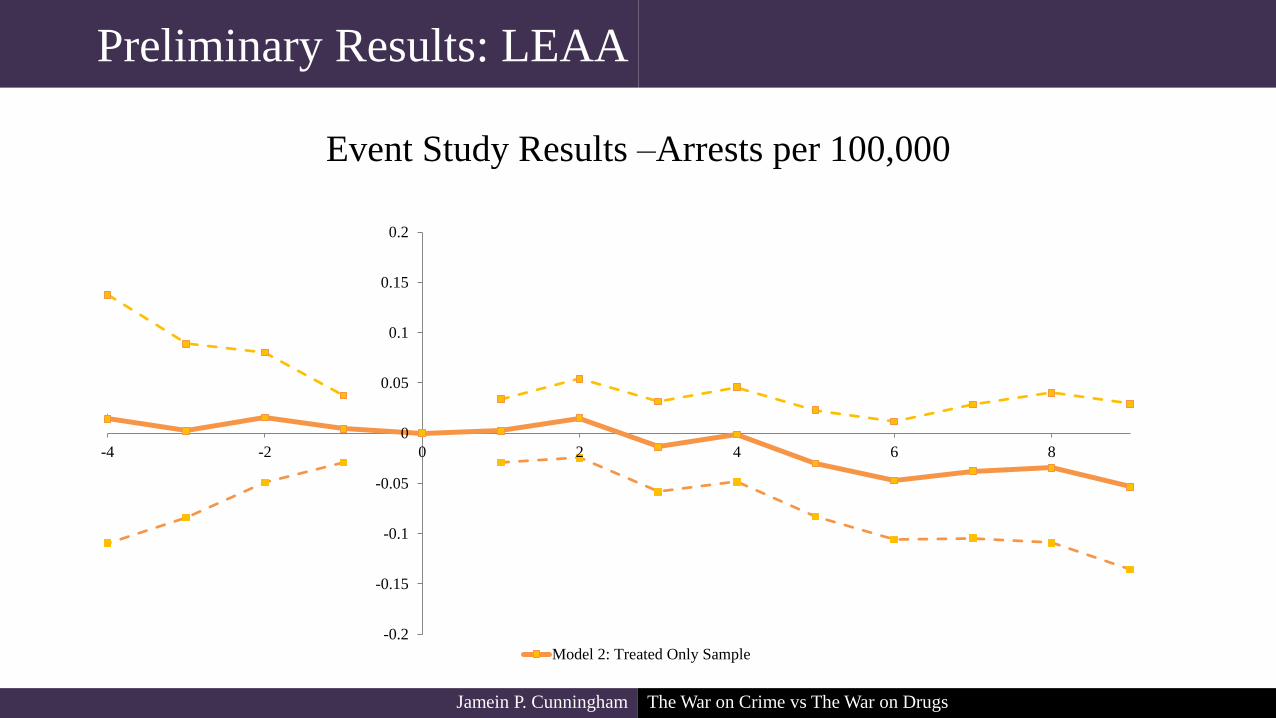
Event Study Results –Arrests per 100,000
-0.2
-0.15
-0.1
-0.05
0
0.05
0.1
0.15
0.2
-4 -2 0 2 4 6 8
Model 2: Treated Only Sample
The War on Crime vs The War on Drugs

• No Evidence that LEAA increased the number of police, reduced
crime, or even increased arrests.
Program lack mechanism to ensure proper utilization of funds.
• Police – Community interactions could have served as a local
mechanism for oversight.
Neighborhood Legal Service Program often filed lawsuits against local
police departments.
Funding could have been used to meet the demands of poverty
lawyers.
Jamein P. Cunningham
Preliminary Results: LEAA
The War on Crime vs The War on Drugs

Preliminary Results: LEAA
Jamein P. Cunningham
Event Study Results – Treatment Interacted w/ Legal Services
(1) (2) (3)
LSP & LEAA DV: Police
Years -4 to -1 -0.0246* -0.0142 -0.0136
[0.0132] [0.00883] [0.00894]
Years 1 to 3 0.00522 0.00545 0.00437
[0.0104] [0.00905] [0.00908]
Years 4 to 6 3.27e-05 0.00501 0.00342
[0.0200] [0.0142] [0.0144]
Years 7 to 9 0.0117 0.00118 -0.00277
[0.0193] [0.0154] [0.0158]
Observations 15,386 15,386 15,386
R-squared 0.834 0.888 0.892
Number of Cities 609 609 609
The War on Crime vs The War on Drugs

Preliminary Results: LEAA
Jamein P. Cunningham
Event Study Results – Treatment Interacted w/ Legal Services
(1) (2) (3)
LSP & LEAA DV: Total Crime
Years -4 to -1 0.0105 -0.0183 -0.0145
[0.0335] [0.0143] [0.0140]
Years 1 to 3 -0.00628 -0.00882 -0.0148
[0.0140] [0.0106] [0.0105]
Years 4 to 6 -0.0154 -0.0266 -0.0415*
[0.0251] [0.0225] [0.0228]
Years 7 to 9 -0.0275 -0.0125 -0.0359
[0.0297] [0.0335] [0.0338]
Observations 15,386 15,386 15,386
R-squared 0.834 0.888 0.892
Number of Cities 609 609 609
The War on Crime vs The War on Drugs

Preliminary Results: LEAA
Jamein P. Cunningham
Event Study Results – Treatment Interacted w/ Legal Services
(1) (2) (3)
LSP & LEAA DV: Violent Crime
Years -4 to -1 0.0651 0.0184 0.0247
[0.0761] [0.0473] [0.0427]
Years 1 to 3 -0.0203 -0.0110 -0.0179
[0.0251] [0.0211] [0.0186]
Years 4 to 6 -0.125*** -0.0881*** -0.0953***
[0.0401] [0.0295] [0.0306]
Years 7 to 9 -0.153*** -0.102** -0.113**
[0.0528] [0.0441] [0.0472]
Observations 15,386 15,386 15,386
R-squared 0.834 0.888 0.892
Number of Cities 609 609 609
The War on Crime vs The War on Drugs

Preliminary Results: LEAA
Jamein P. Cunningham
Event Study Results – Treatment Interacted w/ Legal Services
(1) (2) (3)
LSP & LEAA DV: Arrests
Years -4 to -1 0.0642 0.0394 0.0432
[0.0399] [0.0391] [0.0366]
Years 1 to 3 -0.00447 -0.00733 -0.0157
[0.0235] [0.0295] [0.0235]
Years 4 to 6 -0.0767** -0.0692* -0.0847***
[0.0298] [0.0362] [0.0263]
Years 7 to 9 -0.111*** -0.0978** -0.116***
[0.0402] [0.0464] [0.0349]
Observations 15,386 15,386 15,386
R-squared 0.834 0.888 0.892
Number of Cities 609 609 609
The War on Crime vs The War on Drugs

BYRNE GRANTS
Jamein P. Cunningham The War on Crime vs The War on Drugs

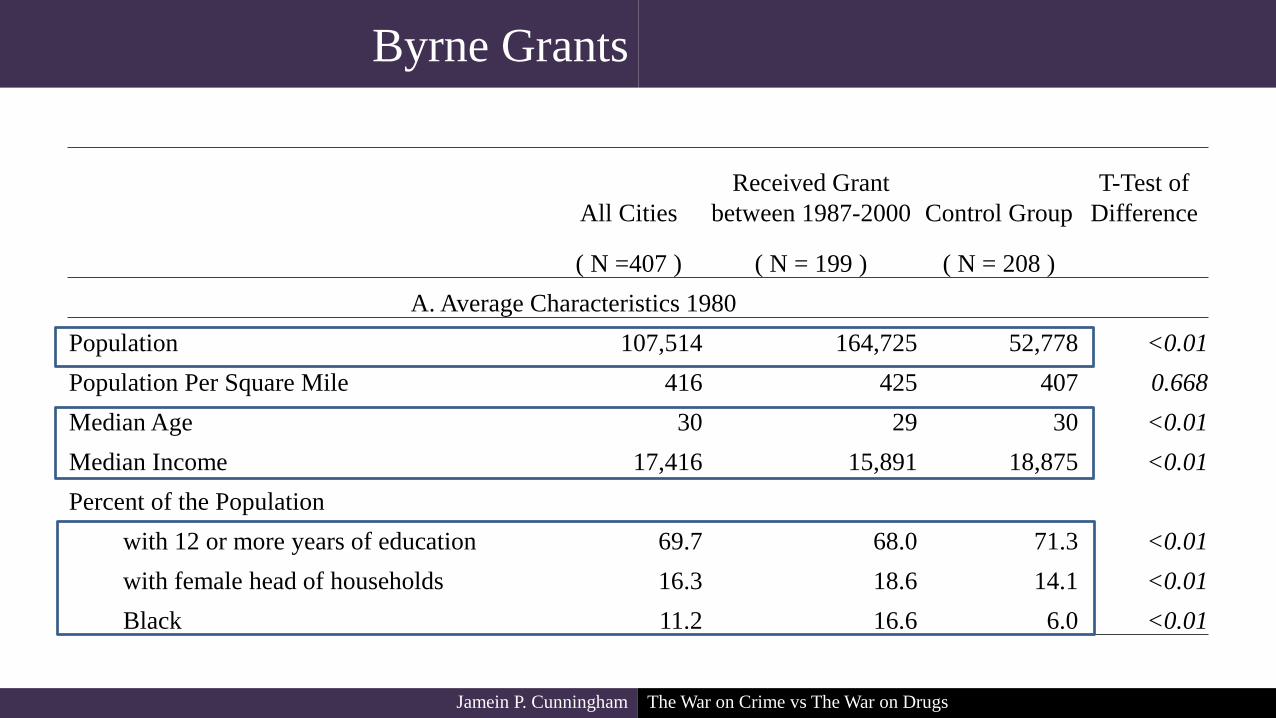
Byrne Grants
Jamein P. Cunningham
All Cities
Received Grant
between 1987-2000 Control Group
T-Test of
Difference
( N =407 ) ( N = 199 ) ( N = 208 )
A. Average Characteristics 1980
Population 107,514 164,725 52,778 <0.01
Population Per Square Mile 416 425 407 0.668
Median Age 30 29 30 <0.01
Median Income 17,416 15,891 18,875 <0.01
Percent of the Population
with 12 or more years of education 69.7 68.0 71.3 <0.01
with female head of households 16.3 18.6 14.1 <0.01
Black 11.2 16.6 6.0 <0.01
The War on Crime vs The War on Drugs

All Cities
Received Grant
between 1987-
2000 Control Group
T-Test of
Difference
( N =407 ) ( N = 199 ) ( N = 208 )
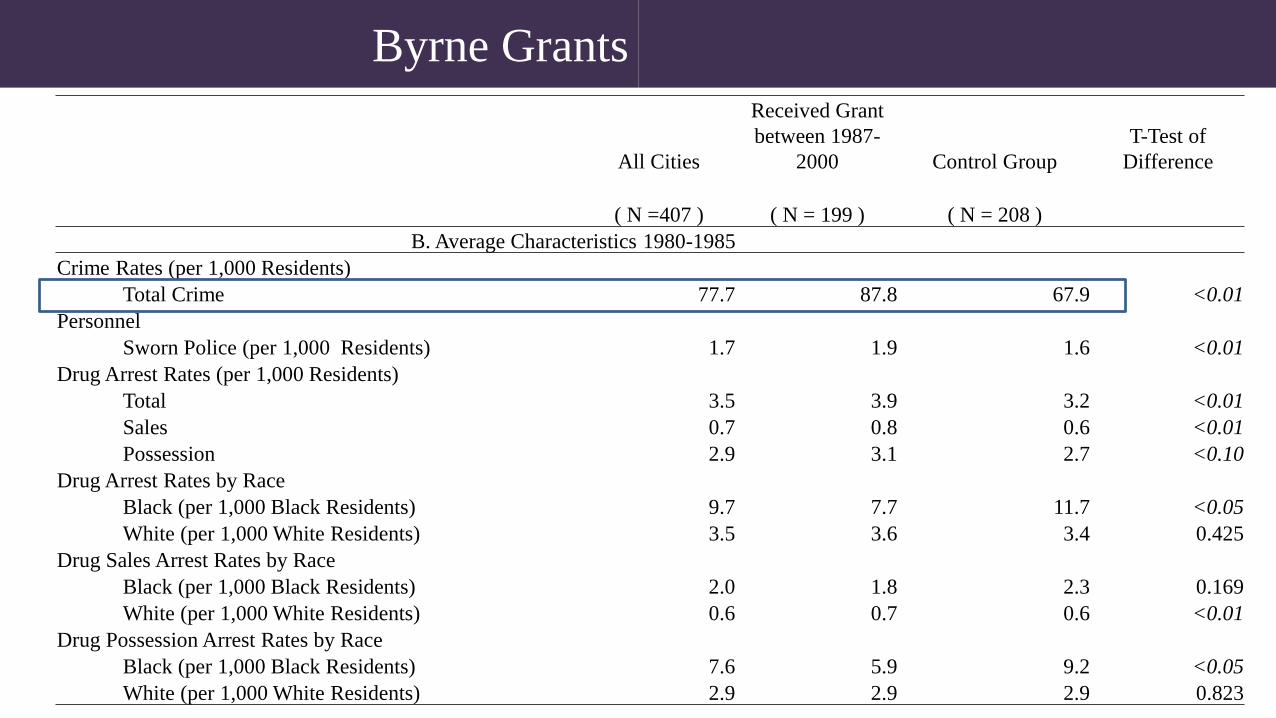
B. Average Characteristics 1980-1985
Crime Rates (per 1,000 Residents)
Total Crime 77.7 87.8 67.9 <0.01
Personnel
Sworn Police (per 1,000 Residents) 1.7 1.9 1.6 <0.01
Drug Arrest Rates (per 1,000 Residents)
Total 3.5 3.9 3.2 <0.01
Sales 0.7 0.8 0.6 <0.01
Possession 2.9 3.1 2.7 <0.10
Drug Arrest Rates by Race
Black (per 1,000 Black Residents) 9.7 7.7 11.7 <0.05
White (per 1,000 White Residents) 3.5 3.6 3.4 0.425
Drug Sales Arrest Rates by Race
Black (per 1,000 Black Residents) 2.0 1.8 2.3 0.169
White (per 1,000 White Residents) 0.6 0.7 0.6 <0.01
Drug Possession Arrest Rates by Race
Black (per 1,000 Black Residents) 7.6 5.9 9.2 <0.05
White (per 1,000 White Residents) 2.9 2.9 2.9 0.823
Byrne Grants
All Cities
Received Grant
between 1987-
2000 Control Group
T-Test of
Difference
( N =407 ) ( N = 199 ) ( N = 208 )
B. Average Characteristics 1980-1985
Crime Rates (per 1,000 Residents)
Total Crime 77.7 87.8 67.9 <0.01
Personnel
Sworn Police (per 1,000 Residents) 1.7 1.9 1.6 <0.01
Drug Arrest Rates (per 1,000 Residents)
Total 3.5 3.9 3.2 <0.01
Sales 0.7 0.8 0.6 <0.01
Possession 2.9 3.1 2.7 <0.10
Drug Arrest Rates by Race
Black (per 1,000 Black Residents) 9.7 7.7 11.7 <0.05
White (per 1,000 White Residents) 3.5 3.6 3.4 0.425
Drug Sales Arrest Rates by Race
Black (per 1,000 Black Residents) 2.0 1.8 2.3 0.169
White (per 1,000 White Residents) 0.6 0.7 0.6 <0.01
Drug Possession Arrest Rates by Race
Black (per 1,000 Black Residents) 7.6 5.9 9.2 <0.05
White (per 1,000 White Residents) 2.9 2.9 2.9 0.823
Byrne Grants

Jamein P. Cunningham
• Our identification strategy relies on pre-existing trends in crime
rates being exogenous from the date of the first grant.
• There is no statistically significant relationship between crime rates
and the date of the first grant.
Byrne Grants
The War on Crime vs The War on Drugs

Jamein P. Cunningham
Pre-Trend Relationship Between Date of First Byrne Grant and Crime Rates
y = 0.0001x - 0.3278
-0.8
-0.6
-0.4
-0.2
0
0.2
0.4
0.6
1986 1988 1990 1992 1994 1996 1998 2000 2002 2004
Chan
ge
in t
he
Cri
me
Rat
e
1980 -
1985
Year of First Grant
Byrne Grants
The War on Crime vs The War on Drugs

Jamein P. Cunningham
Results: Byrne
Event Study Results – Police per 1,000
-0.08
-0.06
-0.04
-0.02
0
0.02
0.04
0.06
0.08
0.1
0.12
-5 -4 -3 -2 -1 0 1 2 3 4 5
Model 1: C & Y Model 2: C & SxY Model 3: C & SxY & Covariates
The War on Crime vs The War on Drugs

Jamein P. Cunningham
Results: Byrne
Event Study Results – Police per 1,000
-0.08
-0.06
-0.04
-0.02
0
0.02
0.04
0.06
0.08
0.1
0.12
-5 -4 -3 -2 -1 0 1 2 3 4 5
Model 3: C & SxY & Covariates
The War on Crime vs The War on Drugs

• Using model 3 estimates, sworn per 1,000 residents increase by 2.4 (.0399/1.6719)
percent three years after treatment. Four and five years after treatment, the size of law
enforcement is steadily growing.
• The results are consistent with the grant utilization for additional personnel to conduct
wide-spread apprehension of persons in violation of local and state substance abuse
laws (U.S. Bureau of Justice Assistance, 1987).
Jamein P. Cunningham
Results: Byrne
The War on Crime vs The War on Drugs

Jamein P. Cunningham
Event Study Results – Arrests per 1,000
-4
-3
-2
-1
0
1
2
3
-5 -4 -3 -2 -1 0 1 2 3 4 5
Model 3: C & SxY & Covariates
Results: Byrne
The War on Crime vs The War on Drugs

Jamein P. Cunningham
(1) (2) (3) (4)
Dependent Variable Per 1,000 Residents
Violent Crime Total Crime
Treated Only Treated Only
Years -5 to -1 -0.233 -0.177 -1.588 -2.382*
[0.339] [0.508] [1.296] [1.234]
Years 1 to 2 0.0449 -0.00585 0.799 0.993
[0.340] [0.431] [0.866] [1.091]
Years 3 to 4 0.258 0.359 0.354 2.051
[0.513] [0.699] [1.577] [1.874]
Years 5 to 6 -0.476 -0.362 -0.650 1.587
[0.713] [1.028] [1.906] [2.375]
Observations 11,633 5,698 11,786 5,741
R-squared 0.298 0.527 0.705 0.767
Number of Cities 407 199 407 199
Results: Byrne
The War on Crime vs The War on Drugs

• Possible explanations for the insignificant post-treatment effects
Additional funding, it only represents a small fraction of total expenditures on public safety.
Also possible that Byrne grants had spillover implications for nearby untreated cities through the
establishment of multi-jurisdictional drug task forces.
― These multi-jurisdictional drug task forces could increase drug arrest in both treated and nearby untreated cities
and the full sample specifications would under estimate the effect of the Byrne Grant Program.
• Both the Anti-Drug Abuse Act of 1986 and the Anti-Drug Abuse Act of 1988 outlined the
grant purposes which included additional personnel, equipment, training, technical
assistance, and information for the more widespread apprehension, prosecution, and
rehabilitation of person who violate crime and drugs laws (Anti-Drug Abuse Act, Pub.L
100-690, 1988).
Disparities in incarceration by race stems from aggressive policing strategies in high crime areas where
narcotic trafficking occurs outdoors; creating the opportunity for wide-spread apprehension for drug
offenses (Johnson et al., 1977).
― Possibility of heterogeneous treatment effects.
Jamein P. Cunningham
Results: Byrne
The War on Crime vs The War on Drugs

Jamein P. Cunningham
(1) (2) (3) (4) (5) (6)
Dependent Variable Drug Possession Arrest Per 1,000 Residents
Total Arrests White Arrests Black Arrests
Treated
Only
Treated
Only
Treated
Only
Years -5 to -1 -0.232 -0.219 -0.0677 0.0362 -0.645 -0.749
[0.226] [0.228] [0.203] [0.224] [0.669] [0.681]
Years 1 to 2 -0.0634 -0.0779 -0.0692 0.0346 -0.537 -0.838
[0.247] [0.289] [0.238] [0.244] [0.788] [0.861]
Years 3 to 4 -0.254 -0.0818 0.0305 0.179 -1.264 -1.408
[0.323] [0.363] [0.320] [0.325] [1.026] [1.164]
Years 5 to 6 -0.429 -0.0513 0.0167 0.307 -2.087 -1.756
[0.376] [0.438] [0.396] [0.397] [1.400] [1.558]
Observations 11,732 5,709 11,400 5,544 11,400 5,544
R-squared 0.531 0.627 0.430 0.523 0.279 0.511
Number of Cities 407 199 407 199 407 199
Results: Byrne
The War on Crime vs The War on Drugs

Jamein P. Cunningham
(1) (2) (3) (4) (5) (6)
Dependent Variable Drug Sales Arrest Per 1,000 Residents
Total Arrests White Arrests Black Arrests
Treated Only Treated Only
Treated
Only
Years -5 to -1 -0.102 -0.102 -0.112 -0.122 -0.0216 0.227
[0.137] [0.166] [0.126] [0.162] [0.336] [0.429]
Years 1 to 2 0.416*** 0.416*** 0.136 0.178 1.161 1.148
[0.141] [0.150] [0.120] [0.111] [0.773] [0.703]
Years 3 to 4 0.455*** 0.543*** 0.317* 0.383** 0.130 0.0902
[0.170] [0.185] [0.166] [0.172] [0.505] [0.455]
Years 5 to 6 0.329* 0.505** 0.527** 0.642** -0.0818 0.0294
[0.184] [0.219] [0.211] [0.261] [0.536] [0.545]
Observations 9,868 5,023 9,524 4,853 9,524 4,853
R-squared 0.584 0.661 0.412 0.488 0.319 0.483
Number of Cities 407 199 407 199 407 199
Results: Byrne
The War on Crime vs The War on Drugs

• The joint treatment effect in year 1 and 2 indicates a 43 (0.416/0.956) percent increase in
drug sales arrest after the first grant is received.
• Arrest for drug sales increase by 9 percent 3 to 4 years after treatment.
The cumulative post-treatment effect implies a 126 (1.2/0.956) percent increase in drug sales arrests 6
years after the first Byrne grant.
• The post-treatment effects differ dramatically by race.
According to column 3, the cumulative post-treatment effect implies a 107 (0.98/0.916) percent increase
in drug sales arrests for whites compared to a 44 (1.643/3.708) percent increase in drug sales arrest for
blacks in column 5.
Evidence that funds were utilized in communities that may have been under policed. However, the
policy still could have exacerbated racial disparities in incarceration due to historically high arrest rates
for blacks.
Jamein P. Cunningham
Results: Byrne
The War on Crime vs The War on Drugs

Jamein P. Cunningham
(1) (2) (3) (4)
Dependent Variable Violent Crime Arrest
White Arrests Black Arrests
Treated Only Treated Only
Years -5 to -1 -0.218 -0.352 -0.0723 -0.596
[0.152] [0.226] [0.671] [0.751]
Years 1 to 2 0.240* 0.328* 0.175 0.182
[0.139] [0.174] [0.530] [0.644]
Years 3 to 4 0.345** 0.614** -0.0489 0.0717
[0.169] [0.246] [0.750] [0.886]
Years 5 to 6 0.482** 0.841*** -1.130 -0.675
[0.210] [0.321] [0.977] [1.130]
Observations 11,554 5,626 11,554 5,626
R-squared 0.526 0.592 0.276 0.555
Number of Cities 407 199 407 199
Results: Byrne
The War on Crime vs The War on Drugs

(1) (2) (3) (4) (5) (6) (7) (8) (9)
Per 1,000 White Residents Per 1,000 Black Residents
Treated
Only Treated Only
Treated
Only
A: Drug Possession
Byrne Grants per Capita 0.705 0.679 0.478 0.0121 0.0202 -0.125 1.959* 1.487 1.326
(in 2000 dollars) [0.433] [0.434] [0.463] [0.370] [0.367] [0.429] [1.057] [1.122] [1.218]
Covariates X X X X X X
R-squared 0.515 0.526 0.625 0.416 0.426 0.521 0.243 0.274 0.508
B: Drug Sales Arrest
Byrne Grants per Capita 0.424*** 0.405*** 0.252** 0.220 0.217 0.140 1.008** 0.808* 0.572
(in 2000 dollars) [0.157] [0.152] [0.114] [0.185] [0.180] [0.173] [0.452] [0.427] [0.470]
Covariates X X X X X X
R-squared 0.572 0.579 0.655 0.395 0.401 0.474 0.275 0.317 0.481
Number of Cities 407 407 199 407 407 199 407 407 199
Results: Byrne

• LEAA had minimum influence on crime and arrest rates.
• Some evidence that enforcement mechanism resulted in lower crime rates but evidence
is weak.
• The implementation of the Byrne Program resulted in an
An increase in police hiring,
An increase in drug arrests,
An increase in white drug arrests
However, an increase in black/white relative arrest rates that seems to be driven by an increase in the
black/white relative drug arrest rates.
• The Byrne Program provide evidence that funds were utilized in communities that may
have been under policed. However, the policy still could have exacerbated racial
disparities in mass incarceration.
• Although great racial disparities still exist with mass incarceration – the current policy
debate is related to police use of force.
Jamein P. Cunningham
Summary
The War on Crime vs The War on Drugs

THANK YOU FOR YOUR TIME
Jamein P. Cunningham The War on Crime vs The War on Drugs