ward base plan 2017/2018 26 - umhlathuze.gov.za · 6 | p a g e 5.1 war room representatives war...
TRANSCRIPT

1 | P a g e
WARD BASE PLAN
2017/2018
26

2 | P a g e
TABLE OF CONTENTS
1. INTRODUCTION ............................................................................................................................... 4
2. WARD VISION – DESIRED FUTURE .................................................................................................. 4
3. WARD CHALLENGIES – CURRENT REALITY ...................................................................................... 4
4. SIZE OF THE WARD .......................................................................................................................... 5
5. WARD COMMITTEE STRUCTURE ..................................................................................................... 5
5.1 War Room Representatives .................................................................................................... 6
6. DEMOGRAPHICS .............................................................................................................................. 7
6.1 Population ............................................................................................................................... 7
6.2 Age and Gender Profile ........................................................................................................... 7
6.3 Language ................................................................................................................................. 8
6.4 Age Groups in 5 years by Population group and Gender........................................................ 9
6.5 Child and Female Headed Household ................................................................................... 10
6.6 Marital and Civil Partnership Status ..................................................................................... 10
6.7 Parental Survival ................................................................................................................... 12
7. EDUCATION ................................................................................................................................... 12
8. AVERAGE ANNUAL HOUSEHOLD INCOME .................................................................................... 14
9. GENERAL HEALTH AND FUNCTIONING ......................................................................................... 14
10. OFFICIAL EMPLOYMENT ............................................................................................................ 16
11. HOUSEHOLD SERVICES .............................................................................................................. 17
11.1 Housing ................................................................................................................................. 17
11.2 Access to Water and Sanitation Services .............................................................................. 18
11.3 Access to Electricity /Energy ................................................................................................. 20

3 | P a g e
11.4 Access to refuse removal ...................................................................................................... 21
11.5 Household Goods .................................................................................................................. 21
12. COMMUNITY PRIORITIES .......................................................................................................... 23
List of Figures
Figure 1: Ward Challenges ........................................................ Error! Bookmark not defined.
Figure 2: Ward Committee .................................................................................................... 5
Figure 3: War Room: Objectives ........................................................................................... 6
Figure 4: Population by Population Group ............................................................................. 7
Figure 5: Age and Gender Pyramid ....................................................................................... 8
Figure 6: Language ............................................................................................................... 8
Figure 7: Marital Partnership ............................................................................................... 10
Figure 8: Average annual Income by Population Group ............ Error! Bookmark not defined.
Figure 9: Disability by type and degree of difficulty .............................................................. 14
Figure 10: Distribution of households by type of Dwelling ................................................... 17
Figure 11: Distribution of Households by Tenure Status ...................................................... 18
Figure 12: Household with access to piped water ............................................................... 18
Figure 13: Distribution of households by type of toilet facility ............................................... 19
Figure 14: Distribution of households by type of energy used for lighting ............................ 20
Figure 15 : Distribution of households by type of energy used for heating ........................... 20
Figure 16 : Distribution of Household by type of energy used for cooking ........................... 21
Figure 17: Percentage of households who have access to internet ..................................... 21

4 | P a g e
Figure 18 : Percentage distribution of households owning various households goods......... 22
List of Tables
Table 1: Age group in 5 years by population group and Gender ............................................................ 9
Table 2: Migration, Province of Birth by Region of Birth .............................................................. 11
1. INTRODUCTION
These Ward Profiles were prepared by the IDP Unit based on Census 2011 statistics.
These Profiles provide a portrait of the demographic, social and economic characteristics of
the people and households in each City Ward. The Census Profiles contain information on
population by age, households and dwelling types, families, and language groups etc.
2. WARD VISION – DESIRED FUTURE
“To be the community which is well developed, Self - Sustainable, Educated and Living In a
Secure, Healthy & Comfortable Environment”
3. WARD CHALLENGIES – CURRENT REALITY
Underdevelopment Untarred
Roads
Housing
Crime In adequate Recreational Facilities
Lack of Job Opportunities
Lack of Access to
Educational Facilities Illegal Dumping Water losses
Youth and Women
Empowerment
Trading Shelters

5 | P a g e
4. SIZE OF THE WARD
Ward 26 has an estimated population of 11526 as per Census 2011.
5. WARD COMMITTEE STRUCTURE
Ward 26 has a fully established ward committee with each member representing each
portfolio; the following are members of the ward committee:
Figure 1: Ward Committee
ASHRAFF
SHAIK
SAFETY&SECU
RITY
MUTHUSAMY
N MARIAPPEN
HOUSING&DE
VELOPMENT
DUNN SHELLA
AGNES
WATER
&SANITATION
CHRISTIAN
YENKIAH
SOCIAL
WELFARE
NTULI
THENJIWE
WATER&SANI
TATION
VILAKAZI
ZONKE
SAFETY&
SECURITY
NGCOBO
PHUMELELE
SOCIAL
WELFARE
NZUZA
SIBUSISO
SPORTS&REC
REATION
MKHWANAZI
SIYABONGA
STAINBANK
PHILLIP
HOUSING
&DEVELOPME
NT
CLR L.S
JOSEPH
CHAIRMAN

6 | P a g e
5.1 War Room Representatives
War Rooms are an integrated service delivery structure comprised of government,
municipality, CBOs, business and other stakeholders at ward level. Their main responsibility
is not limited to the following:
Figure 2: War Room: Objectives
The war room seat once fortnightly on Fridays at 10:00, it is championed by the Ward
Councillor and the following are executive members of Ward 26 War Room:
Supporting Data
collection by
cadres/ House
holds profiling
Supporting Data
collection by
cadres/ House
holds profiling
Support
Departmental
interventions
Ensure household
follow ups
Support trainings of
groups within
communities
Identify resources
within the wards for
use in OSS
7 | P a g e
6. DEMOGRAPHICS
6.1 Population
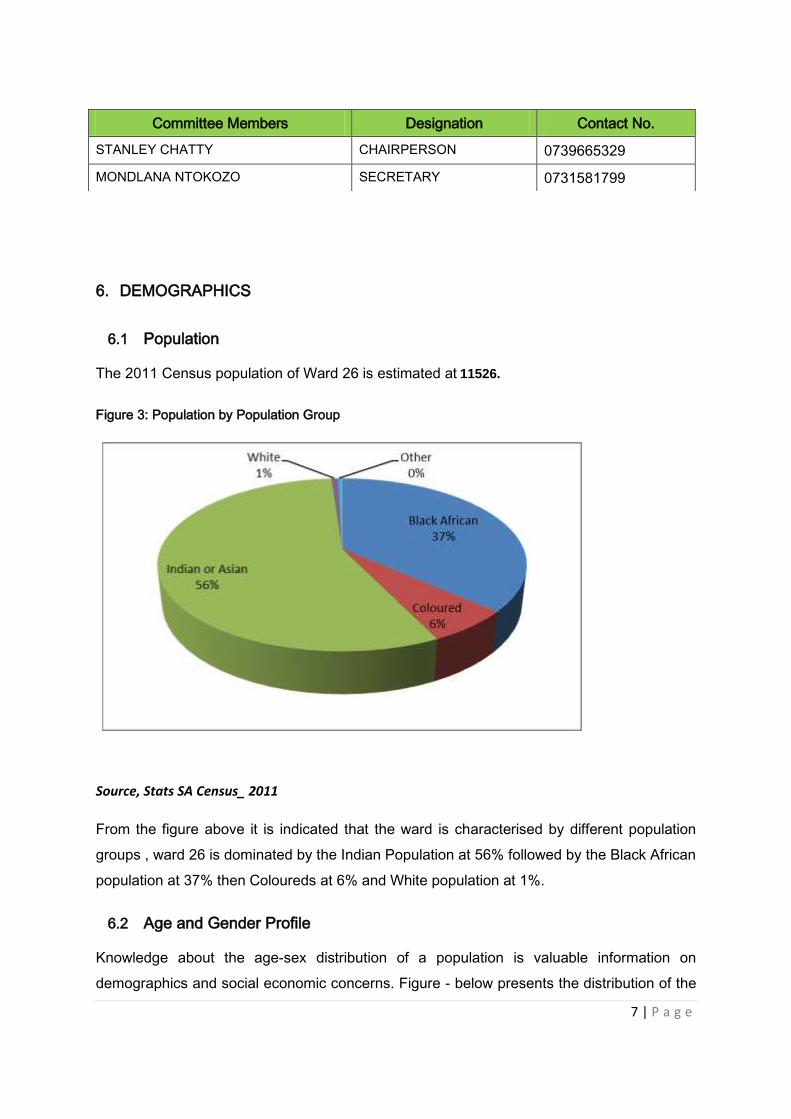
The 2011 Census population of Ward 26 is estimated at 11526.
Figure 3: Population by Population Group
Source, Stats SA Census_ 2011
From the figure above it is indicated that the ward is characterised by different population
groups , ward 26 is dominated by the Indian Population at 56% followed by the Black African
population at 37% then Coloureds at 6% and White population at 1%.
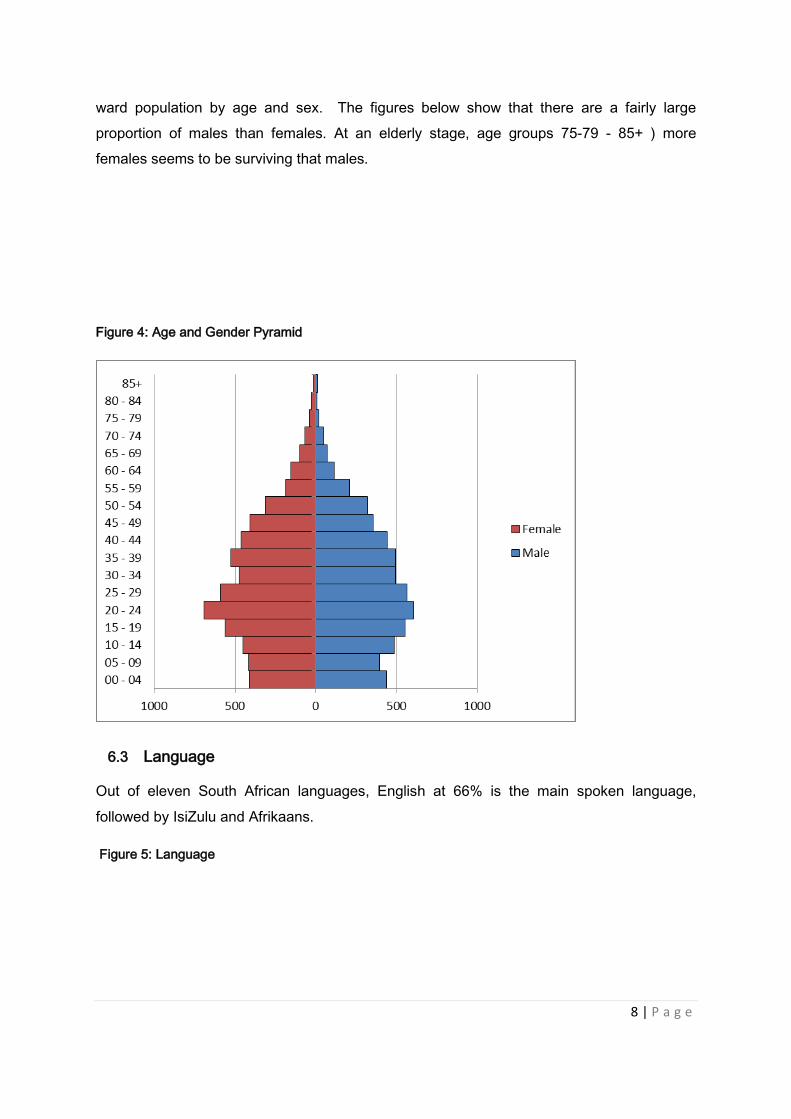
6.2 Age and Gender Profile
Knowledge about the age-sex distribution of a population is valuable information on
demographics and social economic concerns. Figure - below presents the distribution of the
Committee Members Designation Contact No.
STANLEY CHATTY CHAIRPERSON 0739665329
MONDLANA NTOKOZO SECRETARY 0731581799
8 | P a g e
ward population by age and sex. The figures below show that there are a fairly large
proportion of males than females. At an elderly stage, age groups 75-79 - 85+ ) more
females seems to be surviving that males.
Figure 4: Age and Gender Pyramid
6.3 Language
Out of eleven South African languages, English at 66% is the main spoken language,
followed by IsiZulu and Afrikaans.
Figure 5: Language

9 | P a g e
6.4 Age Groups in 5 years by Population group and Gender
Table 1: Age group in 5 years by population group and Gender
Black
AfricanColoured
Indian or
AsianWhite Other
Male Female Male Female Male Female Male Female Male Female
00 - 04 213 195 27 27 186 183 3 6 3 -
05 - 09 195 192 27 30 162 186 12 3 - -
10 - 14 228 189 30 24 225 228 - - - 6
15 - 19 204 207 39 33 306 321 - - 3 -
20 - 24 216 285 45 39 330 360 6 3 6 3
25 - 29 201 276 33 24 321 285 6 6 6 -
30 - 34 192 231 30 27 267 213 3 3 - -
35 - 39 192 225 33 30 264 267 3 - - 3
40 - 44 174 144 21 30 243 291 - - 3 -
45 - 49 87 93 27 24 243 285 - - - 3
50 - 54 69 69 9 12 234 225 6 3 - -
55 - 59 36 21 21 18 147 144 3 - - -
60 - 64 15 24 12 15 81 111 - - 3 -
65 - 69 6 9 6 - 57 90 - - - -
70 - 74 6 3 3 3 39 63 3 - - -
75 - 79 - 3 - 3 18 36 - - - -
80 - 84 - - - - 6 24 - - - -
85+ - 3 - 3 12 12 - - - -
From the figure above it can be deduces that the ward is dominated by young people as
depicted above. At elderly age group more surviving at age 85+ females can be found from
the Indian population.
10 | P a g e
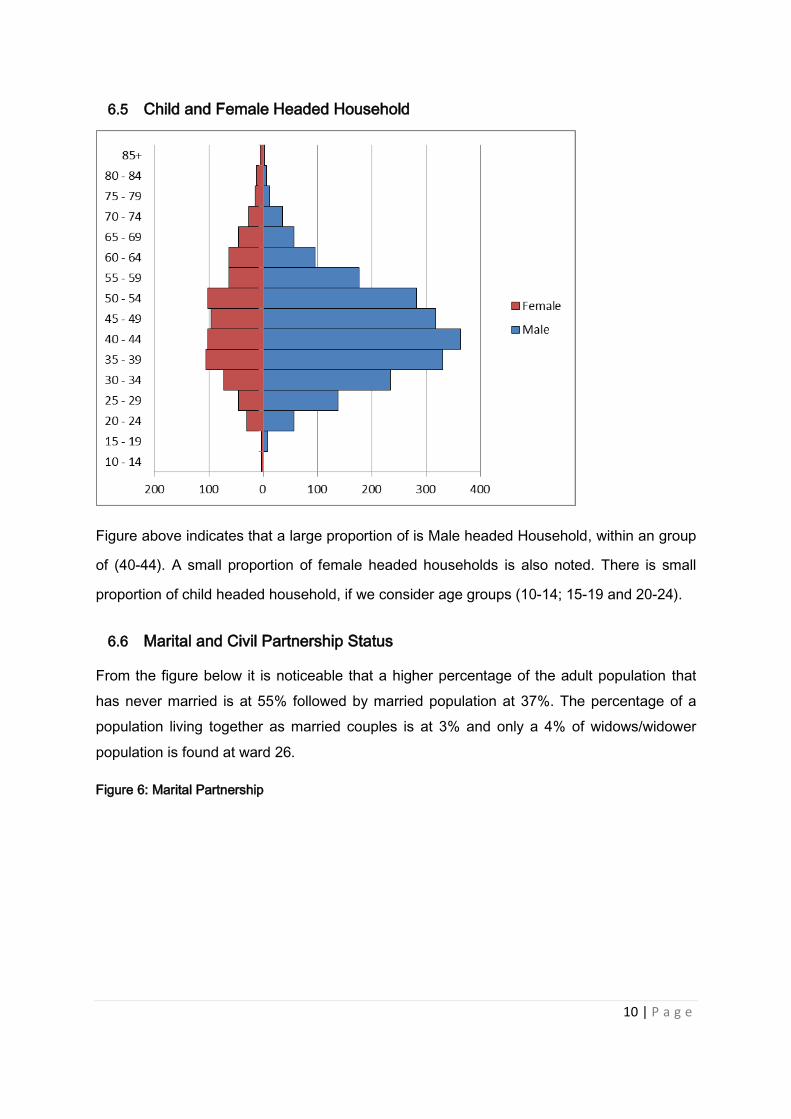
6.5 Child and Female Headed Household
Figure above indicates that a large proportion of is Male headed Household, within an group
of (40-44). A small proportion of female headed households is also noted. There is small
proportion of child headed household, if we consider age groups (10-14; 15-19 and 20-24).
6.6 Marital and Civil Partnership Status
From the figure below it is noticeable that a higher percentage of the adult population that
has never married is at 55% followed by married population at 37%. The percentage of a
population living together as married couples is at 3% and only a 4% of widows/widower
population is found at ward 26.
Figure 6: Marital Partnership

11 | P a g e
Table 2: Migration, Province of Birth by Region of Birth
Born in
South
Africa
SADCRest of
Africa
United
Kingdom
and
Europe
AsiaNorth
America
Latin
America
and
Caribbean
Oceania
Western Cape 39 - - - - - - -
Eastern Cape 96 - - - - - - -
Northern Cape 69 - - - - - - -
Free State 15 - - - - - - -
KwaZulu-Natal 10935 - - - - - - -
North West 18 - - - - - - -
Gauteng 36 - - - - - - -
Mpumalanga 48 - - - - - - -
Limpopo 27 - - - - - - -
Outside South
Africa - 48 9 - 9 - - -
The majority of the population is originally KZN born. There is a small population which was
born from other provinces and from SADC.

12 | P a g e
6.7 Parental Survival
Orphanhood estimates becomes critical with the advent of HIV which has resulted in an
upsurge in the numbers of children that are orphaned especially in Southern Africa, of which
South Africa is part.
These estimates provides an indication of the number of children who are vulnerable, even
though all age groups are indicated above , the focus is on children aged 0-19. The total
number of aged 0-19 who reported that they had lost one or both parents is , 162 have lost
their mother and 444 have lost their father, which is double the number of children without
mothers.
This figure above clearly shows that paternal orphanhood is consistently higher than
maternal orphanhood.
7. EDUCATION
Access to educational opportunities is a human right. This is one of the National
Development Plan Goals. Through education individuals are prepared for future engagement
in the labour market, which directly affects their quality of life as well as the economy of the
country. Schools are the building blocks for the learning socialisation.

13 | P a g e
The South African Schooling Act (1996) made schooling compulsory for children aged 7-15
years, while education Laws Amendment Act (2002) set the age admission into grade 1 as
the year which the child turns seven . Below a comparative overview of educational
attainment and attendance by contributing factors such as population group, age group, sex
is examined.
Black
AfricanColoured
Indian or
AsianWhite
Male Female Male Female Male Female Male Female
Gade 0 51 45 15 6 39 60 - 3
Grade 1 / Sub A 51 39 6 6 48 45 3 -
Grade 2 / Sub B 51 51 6 3 45 63 3 -
Grade 3 / Std 1/ABET 1Kha Ri
Gude;SANLI 42 54 6 6 42 48 - -
Grade 4 / Std 2 42 48 6 6 42 63 - -
Grade 5 / Std 3/ABET 2 57 57 6 9 51 66 - -
Grade 6 / Std 4 57 48 9 9 57 126 - -
Grade 7 / Std 5/ ABET 3 75 42 24 21 84 105 - -
Grade 8 / Std 6 / Form 1 81 93 21 18 180 255 - -
Grade 9 / Std 7 / Form 2/ ABET 4 60 63 15 24 144 129 - -
Grade 10 / Std 8 / Form 3 123 120 36 27 276 300 6 3
Grade 11 / Std 9 / Form 4 102 144 30 18 276 204 6 3
Grade 12 / Std 10 / Form 5 666 705 129 123 1377 1332 12 12
NTC I / N1/ NIC/ V Level 2 3 9 - 3 6 3 - -
NTC II / N2/ NIC/ V Level 3 9 3 - - 15 3 - -
NTC III /N3/ NIC/ V Level 4 15 3 - - 12 3 - -
N4 / NTC 4 18 9 6 - 15 6 - -
N5 /NTC 5 18 3 3 - 6 12 - -
N6 / NTC 6 15 9 3 - 15 9 - -
Certificate with less than Grade 12 /
Std 10 6 3 3 - 9 3 - -
Diploma with less than Grade 12 /
Std 10 3 9 3 3 6 9 - -
Certificate with Grade 12 / Std 10 42 36 3 6 21 24 - -
Diploma with Grade 12 / Std 10 78 111 9 15 30 42 - -
Higher Diploma 30 45 3 3 24 27 - -
Post Higher Diploma Masters;
Doctoral Diploma 12 33 - 3 15 9 - -
Bachelors Degree 51 90 3 3 24 42 - -
Bachelors Degree and Post
graduate Diploma 18 33 - - 15 9 - -
Honours degree 15 18 - - 3 9 - -
Higher Degree Masters / PhD 9 9 - - 3 3 - -
Other 12 3 3 - 9 6 - -
No schooling 18 36 - 6 60 126 3 -
The figure above shows that the proportion of persons with no schooling is estimated at 54
mostly from the black African population. There has also been an increase in the proportion
of individuals who have attained a level of education higher than grade 12 at 1371.

14 | P a g e
8. AVERAGE ANNUAL HOUSEHOLD INCOME
Figure 7: Average Annual Income by Sex of head of household
Black
AfricanColoured
Indian or
AsianWhite
Male Female Male Female Male Female Male Female
No income 54 57 18 6 120 36 - -
R 1 - R 4800 3 9 3 3 12 9 - -
R 4801 - R 9600 9 12 - - 21 6 - -
R 9601 - R 19 600 15 21 9 9 57 42 - -
R 19 601 - R 38 200 33 21 6 6 66 30 - -
R 38 201 - R 76 400 54 27 15 6 171 87 3 -
R 76 401 - R 153 800 141 81 24 6 282 78 - 3
R 153 801 - R 307 600 180 84 33 9 333 69 3 -
R 307 601 - R 614 400 135 15 18 - 195 33 3 -
R 614 001 - R 1 228 800 27 3 3 - 48 6 - -
R 1 228 801 - R 2
457 600 3 3 - - 9 - - -
R 2 457 601 or more 3 - - - - - - -
Figure shows that an average female headed household earn very little on the annual
income in 2011 as compared to their male counterparts. In the smaller income rank (R1–
R4800) female headed households are still dominant, while their male counterparts
dominate at the most upper income ranks. There is significantly higher proportion of no
income within the Indian Male Headed Households.
Figure reflects the significance differences in average annual income across the different
population groups.
9. GENERAL HEALTH AND FUNCTIONING
The inclusion of statistics on disability serves as a crucial role in the identification of persons
living with disabilities. This is one of the most marginalised and vulnerable groups in many
societies regardless of whether they are rich or poor. The disabled who comes from the
poorest cohorts of society inevitably have more serious problems than their wealthy
counterparts as they lack resources to ameliorate their circumstances. Disparities are
apparent between persons with impairments and those without. Disabled persons often have
inadequate access to education, transport, health and other basic services making them
vulnerable to the poverty trap and its associated vices.
Figure 8: Disability by type and degree of difficulty

15 | P a g e
Hearing 52802026:
Ward 26
No diff iculty 10353
Some diff iculty 138
A lot of diff iculty 12
Cannot do at all 15
Seeing 52802026:
Ward 26
No diff iculty 9537
Some diff iculty 921
A lot of diff iculty 39
Cannot do at all 18
Remembering 52802026:
Ward 26
No diff iculty 10224
Some diff iculty 138
A lot of diff iculty 30
Cannot do at all 21
Self Care 52802026:
Ward 26
No diff iculty 9660
Some diff iculty 72
A lot of diff iculty 24
Cannot do at all 45
Communication 52802026:
Ward 26
No diff iculty 10365
Some diff iculty 63
A lot of diff iculty 12
Cannot do at all 18
Walking 52802026:
Ward 26
No diff iculty 10272
Some diff iculty 126
A lot of diff iculty 27
Cannot do at all 27
Results indicate that most people in ward 26 (more than 90%) had no difficulty or limitation
that prevented them from carrying certain functions at the time of the Census. There is large
proportion that indicated a seeing difficulty, followed by those with a remembering difficulty
and hearing challenges.
Figure 9: Assistive Devices
A question was included in the Census to measure what extent does the population,
particularly those with disabilities access assistive devices to execute certain functions. The
figure above depicts that eye glasses and chronic medication were more used compared to
other assistive devices 21% and 10% respectively.

16 | P a g e
10. OFFICIAL EMPLOYMENT
Figure 10: Employment by Gender
Figure 11 above indicate that a large percentage of population employed in ward 26 are
males. A significant percentage of females are not economically active and they are also
unemployed.
Figure 11: Employment by Population Group

17 | P a g e
On the above figure the Indian population group is the highest in terms of employment. Black
population has high proportions on the unemployment, while not economically active is
dominated by the Indian population.
Figure 12: Employment by Sector
Employment is more on the formal sector followed by the informal sector and the least from
private household.
11. HOUSEHOLD SERVICES
Housing is one of the basic human needs and has both direct and indirect implications on
lives of households including health, welfare and social status in communities. This section
highlights Census findings relating to types of main dwellings and basic services which have
important policy implications.
11.1 Housing
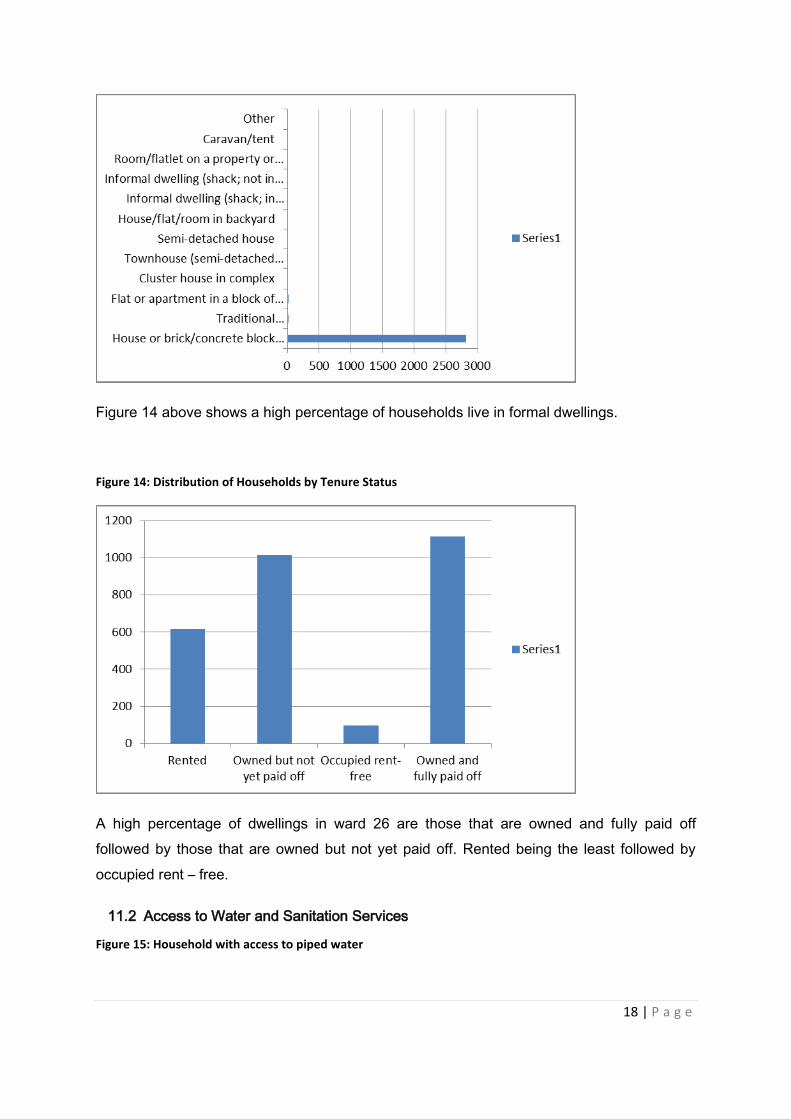
Figure 13: Distribution of households by type of Dwelling
18 | P a g e
Figure 14 above shows a high percentage of households live in formal dwellings.
Figure 14: Distribution of Households by Tenure Status
A high percentage of dwellings in ward 26 are those that are owned and fully paid off
followed by those that are owned but not yet paid off. Rented being the least followed by
occupied rent – free.
11.2 Access to Water and Sanitation Services
Figure 15: Household with access to piped water

19 | P a g e
The figure above shows that a relatively higher number of households have access to piped
water at ward 26.
Figure 16: Distribution of households by type of toilet facility
Source: Census 2011
The municipality has a mandate to improve sanitation to its residents. According to the graph
above, the proportion of households that have flush toilets connected to sewer systems is
very high.

20 | P a g e
11.3 Access to Electricity /Energy
Figure 17: Distribution of households by type of energy used for lighting
Figure 18 : Distribution of households by type of energy used for heating

21 | P a g e
Figure 19 : Distribution of Household by type of energy used for cooking
All figures above indicate that households in ward 26 are connected to electrification and uses
electricity for cooking, heating and lighting.
11.4 Access to refuse removal
Source: Stat SA, Census 2011
Figure above shows that the proportion of households that have refuse disposal service where
refuse is removed by local authority weekly is high in ward 26.
11.5 Household Goods
Figure 20: Percentage of households who have access to internet

22 | P a g e
The figure above shows the percentage of households who have access to internet; a small
proportion of households have no access to internet 39%. About 24 % percentage of
households reported that they access internet from their cell phones. A very small
percentage of households access internet from home at 18%, followed by those who access
from work and elsewhere at 12% and 7% respectively.
Figure 21 : Percentage distribution of households owning various
h
ouseholds goods

23 | P a g e
The charts above shows the proportion of households owning cellphone is 97% while the
proportion using landlines is 51%. The proportion owning radios is slightly lesser than those
owning television. Proportion of households with computers is very high and at 52%.
It is evident that in general there is improvement in the access to basic services. Such
improvements provide direct benefits to household in terms of better living conditions,
environmental and health standards.
12. COMMUNITY PRIORITIES
RESPONSIBLE DEPARTMENT
COMMUNITY REQUESTS 2014/2015
COMMUNITY REQUESTS 2015/2016
Infrastructure & Technical Services
Widening of roads form Johnross to Aquadene
Parking bays required at Richards BAY Secondary School(acciderent are being created)
Upgrade of sewer Brackenham and in Aquadene
Speedhumps at Brackenham and Aquadene
Installation of 3 Phase Electricity at the Hall
Traffic lights at Intersection of Nseleni Bridge
Doubling of road from Veld-en-Vlei traffic lights via Brackenham to Enseleni Bridge
Community Services
Library at Aquadene Attend to Aquadene community hall renovations
Skips Aquadene and Brackenham
Clinic Upgrade Aquadene
Car Parking at the Community Hall
Hall upgrade Brackenham

24 | P a g e
Provision of Aquadene Sportsfield
Upgrade Brackenham Sports Facility
Traffic Calming
Sport Facility at Nsezi /Nsese
City Development
Housing Development Shopping Complex Aquadene
Housing needed
Vegetable Garden facilities and equipment at Nsezi/Nsese