warrants for highway lightingonlinepubs.trb.org/onlinepubs/nchrp/nchrp_rpt_152.pdf · warrants for...
TRANSCRIPT
¶ c
152
IIETU..
;~42 FF
63/07 \
NATIONAL COOPERATIVE HIGHWAY RESEARCH PROGRAM
/ REPORT
WARRANTS FOR HIGHWAY LIGHTING
TRANSPORTATION RESEARCH BOARD NATIONAL RESEARCH COUNCIL

TRANSPORTATION RESEARCH BOARD 1974
Officers
JAY W. BROWN, Chairman MILTON PIKARSKY, First Vice Chairman W. N. CAREY, JR., Executive Director
Executive Committee
HENRIK E. STAFSETH, Executive Director, American Assn. of State Highway and Transportation Officials (ex officio) NORBERT T. TIEMANN, Federal Highway Administrator, U.S. Department of Transportation (ex officio) FRANK C. HERRINGER, Urban Mass Transportation Administrator, U.S. Department of Transportation (ex officio) ERNST WEBER, Chairman, Division of Engineering, National Research Council (ex officio) ALAN M. VOORHEES, President, Alan M. Voorhees and Associates (ex officio, Past Chairman 1972) WILLIAM L. GARRISON, Director, Inst. of Transp. and Traffic Eng., University of California (ex officio, Past Chairman 1973) JAY W. BROWN, Director of Road Operations, Florida Department of Transportation L. S. CRANE; Executive Vice President (Operations), Southern Railway System JAMES M. DAVEY, Managing Director, Wayne County Road CommissOn DOUGLAS B. FUGATE, Commissioner, Virginia Department of Highways ROGER H. GILMAN; Director of Planning and Development, The Port Authority of New York and New Jersey NEIL V. HAKALA, President, Exxon Research and Engineering Company ALFRED HEDEFINE, Senior Vice President, Parsons, Brinckerhofi, Quade and Douglas ROBERT N. HUNTER, Chief Engineer, Missouri State Highway Commission GEORGE KRAMBLES, General Operations Manager, Chicago Transit 'Authority
SCHEFFER LANG, Assistant to the President, Association of American Railroads BENJAMIN LAX, Director, Francis Bitter National Magnet Laboratory, Massachusetts Institute of Technology HAROLD L. MICHAEL, School of Civil Engineering, Purdue University D. GRANT MICKLE, President, Highway Users Federation for Safety and Mobility JAMES A. MOE, Executive Engineer, Hydro and Community Facilities Division, Bechtel, Inc. ELLIOTT W. MONTROLL, Professor of Physics, University of Rochester MILTON PIKARSKY, Chairman, Chicago Transit Authority J. PHILLIP RICHLEY, Director of Transportation, Ohio Department of Transportation RAYMOND T. SCHULER, Commissioner, New York State Department of Transportation
R. STOKES, Executive Director, American Public Transit Association ROBERT N. YOUNG, Executive Director, Regional Planning Council, Baltimore, Maryland
NATIONAL COOPERATIVE HIGHWAY RESEARCH PROGRAM
Advisory Committee
JAY W. BROWN, Florida Department of Transportation (Chairman) MILTON PIKARSKY, Chicago Transit Authority HENRIK E. STAFSETH, American Association of State Highway and Transportation Officials NORBERT T. TIEMANN, U.S. Department of Transportation ERNST WEBER, National Research Council ALAN M. VOORHEES, Alan M. Voorhees and Associates WILLIAM L. GARRISON, University of California W. N. CAREY, JR., Transportation Research Board
General Field of Traffic Area of Illumination and Visibility Advisory Panel G5-8
HAROLD L. MICHAEL, Purdue University (Chairman) SAMUEL E. LUEBBERT, Federal Highway Administration L. CROUCH, Illuminating Engineering Research Institute RICHARD E. STARK, Illinois Division of Highways
WARREN H. EDMAN, Holophane Company JAMES A. THOMPSON, Federal Highway Administration W. S. FARRELL, General Electric Company PETER L. YOUNG, City of Detroit DANIEL M. FINCH, University of California (Richmond) RICHARD N. SCHWAB, Federal Highway Administration ANTANAS KETVIRTIS, Foundation of Canada Engineering Corp. K. B. JOHNS, Transportation Resarch Board
Program Staff
K. W. HENDERSON, JR., Progra,n Director LOUIS M. MACGREGOR, Administrative Engineer HARRY A. SMITH, Projects Engineer JOHN E. BURKE, Projects Engineer DAVID K. WITHEFORD, Projects Engineer R. IAN KINGHAM, Projects Engineer HERBERT P. ORLAND, Editor ROBERT J. REILLY, Projects Engineer PATRICIA A. PETERS, Associate Editor

NATIONAL COOPERATIVE HIGHWAY RESEARCH PROGRAM REPORT
WARRANTS FOR HIGHWAY LIGHTING
NED E. WALTON AND NEILON J. ROWAN
TEXAS TRANSPORTATION INSTITUTE
TEXAS A&M UNIVERSITY
COLLEGE STATION,TEXAS
RESEARCH SPONSORED BY THE AMERICAN ASSOCIATION OF STATE HIGHWAY AND TRANSPORTATION OFFICIALS IN COOPERATION WITH THE FEDERAL HIGHWAY ADMINISTRATION
AREAS OF INTEREST:
HIGHWAY SAFETY
TRAFFIC CONTROL AND OPERATIONS
TRANSPORTATION RESEARCH BOARD NATIONAL RESEARCH COUNCIL
WASHINGTON, D.C. 1974

NATIONAL COOPERATIVE HIGHWAY RESEARCH PROGRAM
Systematic, well-designed research provides the most ef-fective approach to the solution of many problems facing highway administrators and engineers. Often, highway problems are of local interest and can best be studied by highway departments individually or in cooperation with their state universities and others. However, the accelerat-ing growth of highway transportation develops increasingly complex problems of wide interest to highway authorities. These problems are best studied through a coordinated program of cooperative research. In recognition of these needs, the highway administrators of the American Association of State Highway and Trans-portation Officials initiated in 1962 an objective national highway research program employing modern scientific techniques. This program is supported on a continuing basis by funds from participating member states of the Association and it receives the full cooperation and sup-port of the Federal Highway Administration, United States Department of Transportation. The Transportation Research Board of the National Re-search Council was requested by the Association to admin-ister the research program because of the Board's recog-nized objectivity and understanding of modern research practices. The Board is uniquely suited for this purpose as: it maintains an extensive committee structure from which authorities on any highway transportation subject may be drawn; it possesses avenues of communications and cooperation with federal, state, and local governmental agencies, universities, and industry; its relationship to- its parent organization, the National Academy of Sciences, a private, nonprofit institution, is an insurance of objectivity; it maintains a full-time research correlation staff of special-ists in highway transportation matters to bring the findings of research directly to those who are in a position to use them. The program is developed on the basis of research needs identified by chief administrators of the highway and trans-portation departments and by committees of AASHTO. Each year, specific areas of research needs to be included in the program are proposed to the Academy and the Board by the American Association of State Highway and Trans-portation Officials. Research projects to fulfill these needs are defined by the Board, and qualified research agencies are selected from those that have submitted proposals. Ad-ministration and surveillance of research contracts are responsibilities of the Academy and its Transportation Re-search Board. The needs for highway research are many, and the National Cooperative Highway Research Program can make significant contributions to the solution of highway transportation problems of mutual concern to many re-sponsible groups. The, program, however, is intended to complement rather than to substitute for or duplicate other highway research programs.
NCHRP Report 152
Project 5-8 FY 70 ISBN 0-309-02303-3 L. C. Catalog Card No. 74-17240
Price: $6.40
Notice
The project that is the subject of this report was a part of the National Cooperative Highway Research Program conducted by the Transportation Research Board with the approval of the Governing Board of the National Research Council, acting in behalf of the National Academy of Sciences. Such approval reflects the Governing Board's judgment that the program concerned is of national impor-tance and appropriate with respect to both the purposes and re-sources of the National Research Council. The members of the advisory committee selected to monitor this project and to review this report were chosen for recognized scholarly competence and with due consideration for the balance of disciplines appropriate to the project. The opinions and con-clusions expressed or implied are those of the research agency that performed the research, and, while they have been accepted as appropriate by the advisory committee, they are not necessarily those of the Transportation Research Board, the National Research Coun-cil, the National Academy of Sciences, or the program sponsors. Each report is reviewed and processed according to procedures established and monitored by the Report Review Committee of the National Academy of Sciences. Distribution of the report is ap-proved by the President of the Academy upon satisfactory comple-tion of the review process. The National Research Council is the principal operating agency of the National Academy of Sciences and the National Academy of Engineering, serving government and other organizations. The Transportation Research Board evolved from the 54-year-old High-way Research Board. The TRB incorporates all former HRB activities but also performs additional functions under a broader scope involving all modes of transportation and the interactions of transportation with society.
Published reports of the
NATIONAL COOPERATIVE HIGHWAY RESEARCH PROGRAM
are available from:
Transportation Research Board National Academy of Sciences 2101 Constitution Avenue, N.W. Washington, D.C. 20418
(See last pages for list of published titles and prices)
Printed in the United States of America.
F ORE WORD This report will be of particular interest to state and local public officials, whether administrators, traffic engineers, or designers, concerned with decision-making on
By Stafl street and highway lighting installations. The broad investigation reported here has
Transportation led to the development of warrants useful in determining the justifications for such
Research Board street and highway lighting installations. The report shows, furthermore, how to apply the warrants and how to make cost-effectiveness evaluations of lighting design alternatives.
Studies of the problems associated with nighttime visibility and highway illumi-nation have been a major part of NCHRP activities since the program's inception. This project, conducted by the Texas Transportation Institute, was directed to the development of warrants for highway lighting, giving consideration particularly to the visual requirements of nighttime drivers. The study was designed to meet a total of seven objectives that are listed in the summary that follows. It has produced a warrant and design procedure that may be used by highway lighting designers to achieve cost-effective solutions appropriate to the visibility problems being ad-dressed. After there has been a reasonable opportunity to test the validity of the recommended procedures in the field, it is anticipated that current design guides can be modified to incorporate the procedures advocated in this report.
CONTENTS
1 SUMMARY
PART I
2 CHAPTER ONE Introduction and Research Approach
The Problem Research Approach
3 CHAPTER TWO Findings
State-of-the-Art Summary Conceptual Framework Results of Field Studies Warrants and Priorities Design Guidelines for Fixed Lighting Cost-Effectiveness
49 CHAPTER THREE Interpretation, Appraisal, and Application
Interpretation and Appraisal Application
59 CHAPTER FOUR Conclusions and Suggested Research
59 REFERENCES
PART II
60 APPENDIX A State-of-the-Art Questionnaire Surveys
79 APPENDIX B Field Study Procedures and Questionnaires
91 APPENDIX C Driver Comfort Questionnaire
95 APPENDIX D Warranting Fixed Roadway Lighting from a Consideration of •Driver Information Needs
108 APPENDIX E Bibliography

ACKNOWLEDGMENTS
The research reported herein was performed under NCHRP Project 5-8 by the Texas Transportation Institute of Texas A&M University. Neilon J. Rowan and Ned E. Walton, re-spectively Research Engineer and Assistant Research Engineer, served as co-principal investigators.
The authors are indebted to each of the many persons who participated in the undertaking of this research. Special ac-knowledgment is given to those who assisted in the studies and the preparation of this report, including: Dr. D. L. Woods, Associate Research Engineer; Dr. C. J. Messer, As-sistant Research Engineer; Dr. W. F. McFarland, Assistant Research Economist; G. D. Weaver, Assistant Research Engi-neer; and Mrs. Jocille H. Johnson, Research Associate and Technical Writer.
Grateful appreciation also is expressed to the state highway departments, municipalities, and individual experts who so generously contributed their time and talents to the state-of-the-art effort.
Finally, acknowledgment is made to the state highway departments of Texas and Georgia, and to the cities of Dallas, Tex., and Atlanta, Ga., for their excellent cooperation in the conduct of the field studies.
WARRANTS FOR HIGHWAY LIGHTING'
SUMMARY A total design process for roadway lighting has been developed. The process is based on efficiency of night visual communications and traffic facility characteristics.
A cursory review of the literature and the detailed state-of-the-the-art study in roadway lighting research and practice revealed that extremely complex relation-ships exist within the over-all design process for roadway lighting. Requirements, guidelines, warranting conditions, benefits, priorities, and cost effectiveness are all interrelated to the extent that positive separation is difficult, if not impossible. Therefore, the total design process has been developed around one common frame-work or concept.
A conceptual framework has been established considering the purpose of light-ing itself—to improve the efficiency of night visual communications on traffic facilities through provision of informational needs.
Informational needs have been developed to correspond with the basic levels of driver performance, as follows:
Positional level—routine steering and/or speed adjustments necessary to maintain a desired speed and to remain within the lane.
Situational level—change in speed, direction of travel, or position on the roadway, required as a result of a change in the geometric, operational, and/or environmental situation.
Navigational level—selecting and following a route from the origin to the
destination of a trip.
Performance at one level affects performance at the other levels. The driver must attend to positional tasks first, then situational tasks and, finally, navigational tasks.
The diagnostic team approach was used to establish the informational needs. Most needs associated with night driving and lighting were of the situational type. The controlling informational needs were positional, as they determine the time available for situational task performance.
The informational needs developed in the research were classified as to the conditions producing them; i.e., on the basis of geometric, operational, and
environmental conditions. These three classes of conditions were used as parameters for traffic facility
classification. The classification was developed to be the manner in which a facility is evaluated for lighting needs and minimum warranting conditions.
The traffic facility classification developed in the research is nothing more than a method of determining visual information needs on a given traffic facility and, thus, justification (warrants) for lighting. Present guides for establishing warrants consist of traffic volumes, locational factors (suburban, urban, etc.), and accident history. The classification developed in the research is a more definite quantifica-tion of traffic conditions, geometric conditions, environmental conditions (loca-tional), and accident potential, as well as accident history. The minimum war-

ranting conditions are those for average conditions on a given functional classification.
A positive method for determining the design level of lighting intensity is suggested. It is quantitatively related to the magnitude of warranting conditions and, thus, visual information needs. It is not directly related to any specific visual task problem.
Cost effectiveness was determined as the only method available for economic analysis of roadway lighting. All other methods use monetary evaluations of effectiveness and not all lighting effectiveness can be measured in dollar terms.
This research suggests that benefits or effectiveness be measured in terms of supplying informational needs. As more needs are provided, the effectiveness of lighting increases.
The magnitude of warranting conditions on a given facility, which are depen-dent on the magnitude of informational needs, serves as the effectiveness measure in priority determination. A priority model was developed based on lighting effec-tiveness, vehicles or people served, light intensity, size of facility, and annual costs. The priority model favors those facilities with high warranting conditions that can be lighted most economically.
Use of the total design process is illustrated through typical examples taken from field study sites.
It is concluded that the total design process is a usable technique and that AASHTO's Informational Guide for Roadway Lighting should be revised to reflect these results. A trial implementation period of approximately one year by responsi-ble agencies has -been=suggested, withevaluation results to be incorporatedinto the final revision of the "Informational Guide."
CHAPTER ONE
INTRODUCTION AND RESEARCH APPROACH
THE PROBLEM
The following, taken from the project statement, effectively summarizes the general problem:
A need exists to establish warrants for fixed road-way lighting on the various classes of roadways in both urban and rural areas; whether the lighting should be continuous in nature or just at specific locations; and guidelines for the design of lighting. Much information on these matters is contained in the literature, but some additional research will be necessary where insufficient data exist. Benefits from fixed-source roadway illumi-nation, including driver performance, comfort, con-venience and accident prevention, need to be evaluated.
Warrants for fixed lighting on specific roadway classes and at local highway situations should include consideration of benefits and costs of lighting (initial and operating) to satisfy the visual requirements of the driver. A method or methods of evaluating costs and benefits of roadway lighting to maximize returns on
the investment should be developed for the designer in order to determine the specific design.
Seven research objectives were identified in the project statement, as follows:
Review and analyze worldwide research and practice in roadway lighting. Prepare a state-of-the-art summary of the review.
Develop requirements for a suitable visual environ-ment to be obtained by fixed roadway lighting for safe and efficient traffic operations. Provide guidelines for the de-sign of fixed roadway lighting to obtain this environment.
Evaluate the possible benefits derived when a suit-able visual environment is provided by fixed roadway lighting.
Determine warrants (the minimum conditions) for where fixed roadway lighting systems should be installed

for continuous lighting and at specific locations, including, but not limited to, interchanges and intersections.
Analyze the role of cost-effectiveness and other evaluation techniques in (a) establishing the need for fixed roadway lighting, (b) setting priorities for fixed lighting projects, and (c) evaluating alternative design of lighting.
Recommend a method of setting priorities for the installation of fixed lighting.
Provide typical example(s) of where lighting is war-ranted and demonstrate the practical application of objec-tives one through six.
RESEARCH APPROACH
State of the Art
Literature reviews, questionnaire surveys, and field visits with several states, municipalities, and European countries were used to determine the state of the art. Literature sources of both domestic and foreign origin were reviewed. Questionnaires involving warrants, guidelines, and practices were submitted to the 50 state highway departments, 50 municipalities, and 25 individual experts in the field of lighting. Responses were received from 44 states, 25 mu-nicipalities, and 20 experts.
The results of the state-of-the-art review were used to establish much of the direction of the remaining objectives. A state-of-the-art report was submitted as an interim re-port. A summary of that report, updated to include cur-rent research, is included in Chapter Two of this report.
Field Studies
The state-of-the-art review indicated complex relationships existing within the over-all design process for roadway lighting. Requirements, guidelines, warranting conditions,
benefits, and priorities are all interrelated to the extent that positive separation is difficult, if not impossible. Conse-quently, it was necessary for the research approach used in this effort to have a fundamental framework upon which all of the interrelated factors could be developed.
A conceptual framework, based on efficiency of night visual communications and trallic facility classification, was developed for conduct of field studies. The field studies had the purpose of providing subjective information for the development of requirements, guidelines, benefits, war-rants, and priorities.
The field studies consisted of subjective evaluations made through diagnostic studies. It was desired that the studies analyze, to the extent possible, the driving task informational needs and the resultant performance of the driver. In addition, some indication was needed as to the adequacy or inadequacy of the visual environment in pro-viding necessary visual inputs. Therefore, the field studies attempted to investigate the cause or nature of conditions, situations, and problems as related to the driving task. Finally, it was desirable to involve as many people as pos-sible in the development of the requirements of the visual environment. Thus, a team representing both professionals and lay people participated. A summary description of the field study approach would be: "A team of individuals representing professionals and lay drivers diagnosing the cause or nature of conditions, situations, or problems relating to the driving task at night."
The results of the field studies were used to develop a procedure for the analysis of given traffic facilities to determine the need for lighting, warranting conditions, resulting benefits, design guidelines, and priorities for installation of lighting systems.
Details of the field study techniques are reported in later sections.
CHAPTER TWO
FINDINGS
STATE-OF-THE-ART SUMMARY
Man's progress in the development of lighting has evolved from primitive uses of fire to modern-day illumination. The basic motivation of people desiring artificial lighting at night has remained unchanged over the years. Application of artificial lighting to streets and highways has also re-sulted from the same basic motivation, but emphasis on the application or objectives has changed. In order of chrono-logical development, the objectives of street and highway lighting are as follows:
I. Crime reduction.
Civic improvement. Traffic safety.
The history of street lighting dates back to the Fifteenth Century, when citizens of London and Paris began to carry their own lanterns at night. The provision of street lighting by the government was begun in Paris in 1866, when lan-terns were hung on ropes stretched across the streets. This practice also became popular in England and throughout the Continent. Changes in lamp innovations for street and roadway lighting took place over the years. Today, a number of light sources with efficiencies of from 25 to 175

4
lumens per watt are being used successfully in street lighting applications.
All of the earlier artificial lights for street lighting were normally mounted at heights of 10 to 20 ft. The power of the electric arc lamp gave rise to a number of early installa-tions involving extremely high poles or towers. In 1881 the City of Cleveland, Ohio, installed four 250-ft steel masts. But by 1883 it had been decided that higher mounting heights produced inefficient light, so the one tower that remained was reduced to a height of 100 ft. Many other cities installed towers as high as 90 to 165 ft, although none are now in existence except those in Austin, Tex.
Modern practice has seen mounting heights grow from 20 to 40, 50, or 60 ft. Many states now employ the high-intensity lighting sources and, consequently, are returning to extreme mounting heights of 60 to 200 ft for special lighting situations, such as complex interchanges.
The development of modern-day street lighting has been accompanied by significant events in other related areas, such as visual research, benefits of lighting, and guidelines for design and cost-effectiveness. These developments are presented in the following discussions.
Driver Performance and Visual Information Needs
One apparent problem involving roadway lighting is the definition of visibility. Most laboratory experiments in visibility have been psychophysical in nature. That is, the variables are physical (brightness, color, angle or retinal position, angular subtense or retinal size, contrast, duration, and period), and the response is usually some subjective judgment. In human factors and in physiology, other vari-ables such as vibration and emotional set are used, but there is a tendency toward less sophistication in specifying the physical parameters. On the roadway, the physical vari-ables are space, time, light distribution, and contrast, in addition to numerous human variables. The primary aim is to translate psychophysical results from the laboratory into physical design criteria for the roadway in a manner that will enhance proper human performance under night-driving conditions.
Of the several methods for determining visibility, the first is contrast. To a great extent, the recognition of objects is based on a discrimination of brightness dif-ferences (1). For night conditions an obstacle may ap-pear as a dark area against a bright background (silhou-ette) or it may appear as a bright area against a dark back-ground (reverse silhouette).
Contrast is a photometrically measurable and calculable
luminance difference of two areas, and the ability to dis-
tinguish luminance differences is defined as contrast sensi-tivity. The barely recognizable luminance difference of two
areas is the differential threshold, which changes during
adaptation and serves to measure the progress of adaptation.
The visibility of an object can fluctuate greatly with
position, headlights, and other sources of illumination. Under certain illumination conditions the target or object
of concern can be made to disappear entirely unless the target has zero reflectance, a condition not found in nature. Another important fact is that visibility is a function of
contrast at the corner of an object, it is possible for a relatively small portion of a large object to he far more visible than the rest of the object if the contrast difference along its border is very great (2).
Contrast sensitivity provides for the detection of objects, whereas the identification of an object is accomplished by visual acuity, which is the ability of the eye to resolve small detail. In the driving task, there are two types of visual acuity in operation.
Static visual acuity occurs when both the observer and the object are stationary. Clinical measurement of visual acuity is based on a size scale of black letters or numbers on a well-illuminated white background. If a person, from a standard distance, resolves a letter subtending 5 min of arc, of which each interspace or each width of letter bar subtends 1 miri of arc, this person has a visual acuity of 1.0. If he can resolve only letters, the critical details of which subtend 8 min of arc, he has one-eighth visual acuity. Thus, visual acuity is expressed by the reciprocal of the minutes of subtense of resolvable critical details. It is also expressed as a ratio of distances. A person has 20/20 vision when he can read letters that subtend 5 min of arc at a distance of 20 ft. Vehicle operators show a prevalence of 20/20 visual acuity (3).
With increasing level of illumination, visual acuity in-creases up to a background brightness of about 10 mL and then remains relatively constant. The eyes of older per-sons require more illumination for a visual acuity task than do those of young people (I).
When there is a relative motion between the observer and the object, such as occurs during driving, the resolving ability of the eye is termed dynamic visual acuity (1). It is usually measured by presenting a moving target, variable in size, and determining the size that can be resolved. Dynamic visual acuity is worse than static visual acuity because eye movements are not generally capable of hold-ing a steady image of the target on the retina. The image is blurred; therefore, its contrast decreases. The conditions favorable for dynamic visual acuity are slow movement, long tracking time, and good illumination (1).
Those factors which modify vision have been investi-gated extensively, and two primary modifiers of major concern have been identified—disability or physiological glare and discomfort or psychological glare. Disability glare reduces contrast sensitivity, whereas discomfort glare produces ocular discomfort.
Advancements in the knowledge of the effects of glare on driver performance, driver comfort, and visual per-
formance have made it possible to develop empirical tech-niques of glare evaluation (4, 5, 6, 7, 8). Use of these techniques allows engineers to objectively determine the amount of glare present in a given lighting system and to estimate the magnitude of its effects on the driver. Most
methods for appraising glare permit rapid evaluation and
may serve as a basis for practical use. It can be stated, however, that they do not include any recommendations as
to what extent glare in street lighting should be restricted.
Nearly all street lighting codes, both national and inter-national, deal with glare control in a generally vague man-ner. This important factor needs much greater attention
so that good street lighting can be designed which will benefit safety and night driving comfort.
Despite the tremendous literature on driver vision, one question remains paramount—what elements of the visual environment serve as input for proper vehicle control and operation? A number of attempts have been made to char-acterize driving performance in terms of the ways and means in which drivers extract information from the en-vironment and translate this information into vehicular control action. The purpose of information, whether through visual or other sense modalities, is to reduce uncertainty. In order to make rational decisions, the driver must reduce his uncertainty.
Driver information needs are a direct function of what the driver does in performance of the driving task. Thus, to define the requirements of a suitable night-driving visual environment, it becomes necessary to have a firm under-standing of the driving task and the associated visual information needs.
There are three basic levels in the driving task. During normal driving, all three are performed simultaneously. As the complexity of the driving task increases, there is a tendency to ignore the higher-order levels (level 3 then level 2) in order to concentrate on the lower-order level.
The three basic levels are defined operationally, as follows (9):
Positional level—Routine steering and! or speed ad-justments necessary to maintain a desired speed and to remain within the lane. These are two major subtasks at the positional level—steering control and speed control, with elements of each involved in all major levels of the driving task.
Situational level—Change in speed, direction of travel, or position on the roadway, required as a result of a change in the geometric, operational, and/or environmental situa-tion. Information needs at this level involve information relative to all aspects of the highway system, such as other cars, road geometrics, obstacles, weather conditions. Per-formance at this level is a function of the driver's percep-tion of a situation and his ability to respond in an appro-priate manner.
Navigational level—Selecting and following a route from the origin to the destination of a trip. The naviga-tional level takes into account the way in which a driver plans a trip and executes his trip plan in transit. This level consists of two basic categories. These include trip prepa-ration and planning, which is usually a pretrip activity, and direction-finding, which occurs while in transit.
From this brief review of driver tasks and informational needs, it is evident that drivers need certain levels of in-formation to perform the driving task adequately. From practice, this information is normally provided by the ve-hicle headlights, and fixed lighting is used to supplement the vehicle headlights where they do not adequately pro-vide visual information. Thus, the informational require-ments are the primary determinants in the establishment of positive guidelines or warranting conditions for fixed lighting.
Fixed Lighting Warrants
The literature is abundant with technology of fixed light-ing, benefits of these installations, and visual environments; however, it is almost totally void of any research dealing with warranting conditions. The lack of adequate research on fixed lighting warrants is evidenced in the rather arbi-trary nature of most published reports. The warrants cur-rently in use are based primarily on engineering experi-ence and judgment with little, if any, factual data base. Review of the roadway lighting warrants currently in use (10, 11, 12) reveals that three broad policies are being employed in establishing roadway illumination warrants:
Policy 1—Minimize sites warranting lighting. Fixed il-lumination is desirable on all classes of roadways but, due to the limitation of available funds, only a few sites should be warranted in order to have a firm basis for declining to light a section of roadway when requested to do so. Thus, the warranting conditions should be set very high.
Policy Il—Maximize sites warranting lighting. Fixed il-lumination is desirable on all classes of roadways, and avail-able funds will be provided for illumination on relatively few. To encourage the allocation of local funds to pay the installation, maintenance, and energy costs associated with fixed illumination, the warrants should be very liberal so that all roadways with a substantial volume of traffic warrant lighting.
Policy 111—Only where economically justified. Fixed illumination should be provided only at roadway points that are geometrically complex, because fixed illumination can-not be economically justified for most sections of roadway.
It is also apparent that most of the warrants currently in use are very arbitrary and are frequently without sub-stantial foundation. This is not to say that the warrants were not established by logical engineering evaluation of the problem. Rather, it appears that the warrants have been established from a broad philosophic position and logical deduction. Often the process of arbitration results in the final set of warrants which includes several philoso-phies, rather than just one. This suggests the possibility that several different sets of basic warrants may be de-sirable, each developed to be consistent with a particular design strategy. Such a system of warrants would be some-what cumbersome to administer, especially on a national scope.
Finally, all of the sets of warrants reviewed could justify lighting for any roadway carrying a substantial volume of traffic and, therefore, the functional value of the warrant concept may well have been lost. The warrants appear to be used more for establishing the actual governmental agen-cies that will participate in the financing of the lighting sys-tem, rather than for establishing the minimum conditions for which illumination can be expected to be effective.
As part of the state-of-the-art study, questionnaires were constructed to provide information on warrants, guidelines, and practices of roadway lighting. To identify any possible weakness in the AASHTO warrants, the attitudes of state highway engineers, public works departments, and other ex-perts in the field of roadway lighting toward the AASHTO guidelines were obtained from the questionnaire. The ques-

tionnaire was composed of 33 statements concerning the various guidelines from the AASHTO manual, An In for-mational Guide for Roadway Lighting. These statements covered warranting conditions and design values for the following areas:
Freeways. Highways other than freeways. Tunnels and underpasses. Interchanges and intersections of freeways and other highways.
Based on an analysis of the questionnaire, several con-clusions may be drawn concerning the sufficiency of the AASHTO guidelines. The most important conclusion was that, of the engineers surveyed, only a few appeared to support wholeheartedly the guidelines in their present form. Although there is general agreement with the guidelines, the responses of the participants indicate several areas of neces-sary improvement. There is a definite need for the develop-ment of relevant, objective design criteria for the installa-tion of lighting systems on freeways, interchanges and inter-sections, and streets and highways other than freeways. Furthermore, warranting criteria of an empirical nature should be determined and established on the basis of ob-jectively obtainable information. This would greatly facili-tate the setting of lighting job priorities and lighting system design. In addition, quantitative guidelines are required and should be developed for bridges and other specialized structures.
Fixed Lighting Guidelines and Practices
The parameters of illumination guidelines as determined in the state-of-the-art study are (10, 11, 13):
I. System requirements—objectives to be accomplished by fixed roadway lighting. This category was considered the most important, as its subtopics are presently receiving the most attention in the literature.
Design criteria—Realization of the system require-ments in terms of photometric quantities.
Design procedure and calculations—Realization of the design criteria.
Sources of illumination—Various types of lamps em-ployed in roadway lighting and the advantages or dis-advantages of each.
Hardware—Types of luminaires, poles, and bases used for roadway lighting, in terms of utility and safety.
Electric power considerations and maintenance.
System Requirements
To a large extent, one factor is uniquely distinguished and isolated by virtue of cost. That is, the roadway lighting system is confined to low levels of light in such a direction as to affect vision by silhouette. This has been the most fundamental and important guideline. Unquestionably, the provision of fixed lighting will make objects more visible. Ultimately, however, the visibility that a system produces depends directly on pavement reflectance, which is nor-mally beyond the control of the roadway illumination designer.
It should be noted that current design practice is based on maximizing the light on the roadway and minimizing the light off the roadway. Indeed, this is the most prudent use of available light, and is perhaps a desirable characteristic for lighting systems in residential areas; however, the bene-fits to be gained from light on the periphery of other road-ways must not be overlooked. These include orientation at critical decision points, as in the case of high-mast lighting; a panoramic view more closely resembling daytime condi-tions; and the provision of better uniformity and less glare.
Design Criteria
As previously stated, the purpose of the roadway illumina-tion system is to provide silhouette vision by making the horizontal component of illumination exceed the vertical component. The main performance criterion has become the physical measurement of horizontal footcandles and, quite naturally, specification thereof is an important cri-terion for design. Some objection to the use of horizontal footcandles has been reported, the criticism being that horizontal illumination does not produce visibility. It is stated that visibility at low light levels is due to brightness contrast and, therefore, brightness measurements would be a better performance criterion. Due to a widely proclaimed lack of reflectance data for various materials, brightness performance would be unwieldy for design. Present prac-tice involves specification of an average level of horizon-tal footcandles, with mounting height and luminaire sup-port spacing calculated to yield this level of illumination. Thus, brightness is not specified as a design or performance criterion.
Design Procedure and Calculations
Two distinct methods are used by state highway depart-ments to calculate luminaire support spacing. The first requires physicl measurement of the horizontal footcandle distribution at a particular mounting height for a particu-lar lamp and luminaire, from which isofootcandle contours are plotted. At least two clear-plastic overlaps are prepared from the contour plot, from which the contours correspond-ing to one-half the minimum level to be allowed are super-imposed along a plan of the roadway. As the values asso-ciated with each contour are added linearly, a graphic presentation of the horizontal illumination along the road-way is easily and readily established.
The other method (11, 13) shows that the spacing, 5, may be computed by
S = (L11 CTJ F.1 FM ) / ( WIt JAM) (I )
in which
L11 = horizontal lumens; Cu = coefficient of utilization; F.1. = temperature factor; FM = maintenance factor (dirt);
= roadway width; and fAM = average maintained horizontal footcandles.
It has been mentioned by Ketvirtis (11) and others that the spacing distance calculated by Eq. 1 may result in illumina-

tion levels quite different from the level that was intended. The formula does provide an initial approach to the spac-ing problem, once the mounting height and the average horizontal illumination have been determined. Its use was never intended to replace experience and professional judgment.
For years luminaire mounting heights of approximately 30 ft and lamp outputs on the order of 15,000 lumens served as the chief means of implementing illumination theory and practice. Strictly speaking, the only variable at the disposal of the roadway lighting designer was the spac-ing between the luminaire supports. As designers began seeking lower uniformity ratios, lamps of greater luminous output became available, and increased mounting height was deemed desirable. Today many lighting authorities specify 50-ft mounting heights with sources of 50,000 to 90,000 lumens. It is apparent that higher mounting heights and sources of greater intensity more closely achieve system requirements. For this reason, higher mounting heights and multiple light sources for interchanges, multi-level expressways, and other difficult roadway geometrics are much in evidence.
Sources of Illumination
Not taking power sources into consideration, the types of illumination sources preferred now are mercury vapor, color-improved mercury vapor, metal halide, and high-pressure sodium vapor. Reactions to each type include some mention of the color produced and, in the case of sodium, opinions ranging from tolerant to violent. Public reaction has been the most favorable toward the fluo-rescent variety. It is well known that sodium vapor lamps produce approximately twice the lumens per watt as mercury vapor.
Whatever the reasons for a particular preference, it has been experimentally verified that the lamp's color has little, if any, influence on visibility. This means that selection of a lamp for a particular color will not visually benefit the driver. It has, however, been mentioned that adaptation time is possibly less for sodium vapor lighting.
By far, mercury vapor lamps have been the most pre-ferred choice. Reasons for this include compact size, long life, and good lumen/watt efficiency. Widespread experi-ence with these lamps has resulted in standardization, inter-changeability, and quality control. For other sources to compete with mercury vapor, they must do so in terms of the foregoing reasons, without the sales/user experience, and may or may not have the same degree of standardiza-tion, interchangeability, or quality control. High-pressure sodium and metal halide lamps offer higher efficiency but considerably shorter lifetimes.
Hardware
A consideration that certainly deserves attention is the hardware used in lighting designs, especially for the sup-ports and the luminaires. The steel pole-cast aluminum "transformer base" combination is generally the most satis-factory in terms of breakaway characteristics and utility; however, such a flat statement regarding luminaires cannot
be made. Types from which to choose include open, sealed (sometimes semi-sealed) with or without filter, and integral ballast; all have varying degrees of cut-off. Refractor/ reflector design is another variable and must be considered in terms of light distribution.
Electric Power Considerations and Maintenance
Many lighting installations require enough electrical power to justify special distribution equipment and coordination with an electric power utility company. Usually the op-erating line voltage is available in multiples of 120, the upper limit being determined by the breakdown voltage of the insulation used in each component of the system.
Lamps used for roadway lighting are of the gas-discharge type and require current limiting while burning. This is accomplished by placing a coil of enough inductance, called a ballast, in series with the lamp. It is usual practice to incorporate an autotransformer with the ballast, so that voltage changes (step up or step down) are facilitated. To minimize line losses, the operating voltage must be as high as possible (that is, 480 v).
Reduction of light due to dirt and lumen depreciation of the lamp is too gradual to be observed daily. Thus, periodic cleaning and relamping are important maintenance requiremer)ts. It is reported that these maintenance inter-vals range from six months to four years, with the work usually being performed by an electric utility company. An increasing number of luminaires use polished aluminum as the reflector; this is easily tarnished or damaged. Men-tioned recently in a trade journal was a cleaning solution made especially for polished aluminum. This not only makes use of these reflectors more feasible, but also pro-vides for adequate maintenance.
Generally, the benefits of maintenance parallel the bene-fits of illumination in the first place, and the most effective cleaning schedule is based on an interval allowing a 20 per-cent reduction of light due to dirt. Lamp replacement should follow the same schedule. This amounts to approxi-mately 16,000 hr of service at rated conditions for mercury vapor lamps, making the four-year interval a tolerable period of time.
Benefits of Fixed Lighting
The benefits accruable to fixed roadway lighting may be classified according to effect into the following groups:
Driver comfort. Driver safety. Traffic operations. Socioeconomic factors.
in each of these groups, fixed lighting has been shown to have a beneficial effect. For example, fixed lighting often results in a decrease of 45 percent or more in the rate of nighttime accidents (14). Accompanying this decrease is a proportional reduction in the cost of injuries, property damage, and automobile repairs. Furthermore, there is some evidence that the nighttime capacity of freeways and highways may be increased when illumination is provided (15). This could be significant in areas where the peak period occurs during hours of darkness.

The psychological state of the driver, although difficult to quantify, has been shown to respond favorably to in-creased levels of roadway illumination. Several studies have provided evidence of an empirical nature that ade-quately substantiates this claim (16, 17).
There are a number of socioeconomic benefits associated with fixed illumination and these revolve around two basic precepts: the attraction of customers to shopping centers after dark, and the prevention of crime and pedestrian deaths during hours of darkness. The beneficial effects of illumination in these areas have also been well documentee (18. 19, 20, 21,22, 23).
The economic benefits of lighting are many and manifest themselves in such ways as reduced accident cost, reduced damage to roadway structures, and increased business in downtown areas. Many downtown areas, almost totally deserted after dark, have increased their aesthetic appeal and amount of business after the addition of improved lighting. Architects and city planners have found light to be a major source of economic stimulation and beautifica-tion for their downtown areas. In fact, many large cities across the country are once again opening their parks and recreation areas after dark because of the effects lighting has on the crime rate, business, and personal security. Police forces across the entire United States have praised and actively supported improved lighting to make their own jobs easier and more manageable.
Over the past 15 years, many aspects of the interaction between the driver and fixed roadway illumination have been studied, and many questions have been answered. It is now known that, almost without exception, improved lighting results in fewer deaths on the highways, reduc-tions in the cost of those accidents that do occur, increased economic stimulation of business, increased personal safety on the streets, and drastic reductions in crime. However, to date little is known as to the exact nature of the effects of lighting on driving performance. It is evident that il-lumination can result in better vehicle positioning, in-creased system capacity, and a more relaxed and stable emotional state on the part of the driver. However, how do these and other factors act to reduce the probability of an accident? Is increased visibility the only factor of any importance? These and many other questions concerning benefits are currently being studied by researchers through-out the world. Studies are being conducted involving the effects of glare from roadway illumination systems on vision and driving behavior, the effect of lighting on car following and lag acceptance, etc. Criteria are being de-veloped for the illumination of rural roadways, intersec-tions, bridges, and other types of highway structures. Al-ready several states are going to higher mounting heights to reduce glare, improve transition, and increase the il-lumination of the surrounding roadway environment. Studies are being conducted to discover the effect of il-lumination on depth perception, distance, speed, and time estimates, as well as many other psychological parameters of the driver and his environment. In any event, the future seems bright, at least so far as benefits and candlepower of roadway lighting are concerned.
The one negative comment that can be leveled at re-
search concerned with illumination is that little is known about the reasons why illumination affects the previously mentioned benefits. Several important questions remain un-answered. Why does illumination of a traffic facility result in a decrease in the number of accidents? Why do drivers feel more secure under illuminated conditions? Why are street crimes reduced under illuminated conditions? These and many other questions of this nature have not been answered or even thoroughly investigated in current times. Until these relationships are thoroughly established, it will be impossible to specify the nature of the interaction of illumination with any type of human performance variable.
CostEffectiveness and Other Evaluation Techniques
Several methods of evaluating lighting alternatives have been considered in the past. Use of all of these methods except one—the cost-effectiveness method—necessitates es-timation of the benefits of lighting in dollar terms.
The appropriateness of using methods that entail estima-tion of benefits in dollar terms depends on whether these benefits can in fact be estimated in such terms. The princi-pal benefits that usually are considered in comparison of lighting alternatives are changes in travel times, vehicle operating costs, numbers of accidents, comfort or dis-comfort, and crime. There exist fairly good estimates of the unit dollar values for time and operating costs, and also for the direct cost of accidents. There currently exists, however, no way of estimating in dollar terms the increase in driver comfort due to lighting. This seriously limits the use of methods that entail the estimation of the benefits of lighting in dollar terms.
On the other hand, the cost-effectiveness method of analysis, use of which does not necessitate estimation of benefits in dollar terms, can be used only for comparing alternatives that have the same level of effectiveness or cost. Therefore, the cost-effectiveness method gives only an in-direct indication of priorities for lighting.
In summary, a method of analysis that entails estimation of benefits in dollar terms, such as the benefit-cost method or the rate-of-return method, can be used for comparing alternatives and for determining priorities, but it must be recognized that all of the benefits cannot be estimated in dollar terms and, therefore, the use of such a method is at least partially inaccurate. What are probably the most im-portant benefits of lighting, reductions in driver discomfort, and increases in communications, cannot be estimated in dollar terms. Also, the cost of accidents can be estimated only partially in dollar terms.
European Practices and Technology
A discussion limited to those roadway lighting techniques and practices within the boundaries of the United States would not in itself provide a complete state of the art. Total consideration of the roadway lighting field must also reflect international considerations. Therefore, the advisory panel recommended that, as part of the project, a tour of seven European countries be conducted for the purpose of observing the latest practices and technology in roadway lighting.
It was found that, in general, a great amount of en-
9
thusiasm is exhibited by those associated with the field of roadway lighting in the various European countries. This was characteristic of all agencies involved, including the manufacturing, governmental, municipal, educational, and research representatives. Also, the qualifications of. people associated with public lighting are quite high. It does appear, however, that the lighting profession in Europe is more scientifically oriented than is the lighting profession in the United States.
Warrants
Few European countries have clearly defined warrants for roadway lighting. It is generally an established practice that all urban streets are to be lighted, and the quality of the lighting system is to be commensurate with the amount and quality of traffic flow on the facility. The Netherlands has a basic warrant for lighting motorways; simply stated, all motorways with three or more lanes in each direction shall be lighted. On the other hand, Great Britain uses a rigor-ous economic analysis of accident costs as related to the cost of the lighting system to determine warranting condi-tions for motorways and principal roadways. The economic analysis is based on an assumed 30% reduction in night accidents. Belgium uses strictly an average daily traffic of 10,000 vehicles as a warranting condition for main roads.
Guidelines for Design
Most of the continental European countries support the luminance concept of design, as recommended by the Com mission International de l'Eclairage; however, Great Britain believes that such a design procedure is far more scientific than is necessary. They believe that adoption of these recommendations would virtually place the design of light-ing in the hands of qualified consultants and the technical staffs of lighting manufacturers. Great Britain also believes that pavement reflectance and glare are important consid-erations and should definitely be integrated with a standard code of practice that can be used, without difficulty, by the typical lighting engineer.
Glare Considerations
As a whole, Europeans are extremely sensitive to glare. Practically all street-lighting equipment is of the complete cut-off type, and glare is a big factor in their design pro-cedures. There is a difference of opinion concerning glare among the experts in the field. Professor de Boer, of The Netherlands, is of the opinion that when discomfort glare has been taken care of, disability glare is no longer a sig-nificant problem. On the other hand, Dr. Adrian, of Karlsruhe University, is of the opinion that disability glare is the most important consideration.
Light Sources
Virtually all types of common light sources were found in various applications throughout all countries visited. There was a general tendency toward use of sodium sources in countries characteristically known for cold and foggy cli-mates, whereas the cool, white sources were more common
in the warm countries such as France and Italy. Low-pressure sodium was observed as the most popular light source because of its relative efficiency (up to 180 lumens per watt). High-pressure sodium is making a tremendous gain in popularity because it provides a relatively high efficiency with acceptable color rendition. Mercury light-ing remains fairly popular. Xenon sources have been used for special high-mast lighting applications in the past, but no new installations are anticipated. As to the future, it appears that high-pressure sodium is the most promising.
High-Mast Lighting
High-mast lighting has just been installed in a number of European countries, but is receiving the greatest enthusiasm in Great Britain. High-pressure sodium is the most com-monly used light source for new high-mast lighting installa-tions. The mounting height is normally about 100 ft, and light sources are 400- and 600-w units.
New Lighting Concepts
Catenary lighting is the newest lighting concept in Europe. It gets its name from the method of suspending lighting units from a catenary wire between successive masts. The lighting units are spaced at 1 to 1.5 mounting heights; the masts are spaced at 4 to 6 mounting heights. The Nether-lands has installed a substantial amount of catenary light-ing, using low-pressure sodium light sources mounted at 10-rn height and 12-rn spacing. A dual catenary system has been used in the outer separations of a large cloverleaf interchange with collector-distributor roads. Two sections of catenary lighting have been installed in Germany on an experimental basis. One employs mercury light sources, whereas the other uses fluorescent sources. Great Britain is in the process of installing its first system of catenary lighting (near London).
Belgium is considering 18-rn mounting heights and 54-m spacings of high-pressure sodium for continuous lighting. Switzerland is using 20-rn mounting heights and 80-rn spac-ings of high-pressure sodium for freeway lighting. The trend is definitely toward higher mounting heights for continuous roadway lighting.
CONCEPTUAL FRAMEWORK
It has been stated that the function of lighting is to improve the efficiency of night visual communications. The concep-tual framework upon which the project objectives were de-veloped was based on this function using visual information needs for night task performance as the basic measure of effectiveness.
The purpose of information, whether through visual or other sense modalities, is to reduce uncertainty. In order to make efficient and rational decisions, the driver must reduce his uncertainty.
Driver visual information needs are a direct function of what the driver does in performance of the driving task. Thus, to arrive at the requirements of a suitable visual environment, it becomes necessary to have a basic under-standing of the driving task.
10
Driving Task
There are three basic levels in the driving task: (1) posi-tional level, (2) situational level, and (3) navigational level. During normal driving all three are performed simul-taneously. As the complexity of the driving task increases there is a tendency to ignore the higher-order levels (level 3 then level 2) in order to concentrate on the lower-order level.
The three basic levels are defined operationally as follows:
Positional level—routine steering and! or speed adjust-ments necessary to maintain a desired speed and to remain within the lane.
Situational level—change in speed, direction of travel, or position on the roadway, required as a result of a change in the geometric, operational, and!or environmental situation.
Navigational level—selecting and following a route from the origin to the destination of a trip.
These levels can be ordered into a hierarchy that de-scribes the organizational content of the driving task (9) according to time scale and the level of cognitive activity. The levels differ in the time scale relevant to their per-formance and the level of cognition required by the driver. Analysis of the ordering reveals that performance at one level affects performance at the other levels.
An important characteristic of the driving task descrip-tion is that it describes which level the driver will and! or should attend to as a function of the demands of the situa-tion. When performance demands are minimal for levels in the ordering, these are performed with little conscious attention. In these cases, the driver's attention may be directed toward levels higher in the hierarchy. However, when high performance demands occur at any level, the driver should not attend to any level higher in the hier-archy, but still must attend to those lower in the hierarchy. Thus, the hierarchy describes the manner in which the driver behaves when he becomes overloaded by demands at any level of performance. In an overloaded situation, the driver sheds (work load shedding) all driving task levels higher, but not those lower.
The description permits establishing a priority (primacy) of task levels and their associated information needs; in-formation needs lower in the hierarchy have priority over needs higher in the hierarchy. This priority results from the load .shedding described previously.
Another important factor in describing the driving task is expectancy. The driver has an expectation of the ve-hicle response to his steering movements, learned by ex-perience. Similarly, he has expectations concerning the curvature of the roadway, the behavior of other vehicles, and the signs he will find to direct him on his route. The expectancies, which apply to short distances ahead for the positional level and long distances ahead for the naviga-tional level, play an important part in the integration of the driving task. When such expectancies are not fulfilled for one of the levels, performance of that level, and perhaps the lower levels, may be seriously disrupted, perhaps re-sulting in hazardous driving.
To summarize, there are three levels involved in the driving task. These levels are conceptually and empirically sound (9).
Visual Information Needs
Visual information needs associated with the driving task can be organized in accordance with the levels previously described. Although previous research has not made it possible to provide a complete inventory of visual informa-tion needs that take into account all possible trips and situations, it is possible to derive a list representative of the types of needs associated with typical levels. These needs, discussed in the context of the three levels of the driving task, are presented in the following.
Positional Information Needs
There are essentially two major positional subtasks at the positional level—steering control and speed control—with elements of each involved in all major levels of the driving task.
The major information needs associated with steering control involve vehicle response characteristics and vehicle location information, and all changes thereof. The follow-ing information needs, as determined through driver-vehicle task analysis (9), are those necessary for satisfying the requirements for steering control and speed control:
A. Steering control: Lateral position information with respect to the road, to apply minute steering corrections, thus maintaining a desired position. Spatial orientation with respect to the roadway immediately ahead to provide for location and relative lateral movement with respect to the roadway. Visual feedback of changes in position and orien-tation with respect to the road. Information on changes in vehicle response when high demands are placed on the steering task (non-visual information). Tactile and kinesthetic perception of accelerator, brake pedal, and vehicle response.
B. Speed control: Visibility of the roadway at a sufficient distance to bring the vehicle there at a safe speed. Visibility to reveal conditions on the roadway not consistent with the driver's expectancy. Integration of speed control with the steering control requirements.
Several research efforts provide details of those elements of the night-driving visual environment that satisfy the visual information needs listed for steering and speed con-trol. These details are as follows:
A. Steering control: 1. Lateral position information with respect to the
road: Lane marker on the lined road. Edge markers (edgelines) on the road. Curb delineation.
11
(d) Presentation of items a, b, and c at a mini-mum distance of 100 ft.
2. Spatial orientation with respect to the roadway immediately ahead:
Position of road edges. Position of lane division. Perception of roadside features. Presentation of items a, b, and c at a mini-mum distance of 100 ft.
3. Visual feedback of changes in position and orien-tation with respect to the road:
Position of road edges. Position of lane divisions. Perception of roadside features. Presentation of items a, b, and c at a mini-mum distance of 100 ft.
B. Speed control: I. Visibility of the roadway at a sufficient distance
to bring the vehicle there at a safe speed: Perception of movement relative to the vi-sual field. Perception of roadway and environmental cues. A priori information. Perception of speed limit signs. Perception of inclement weather conditions.
2. Visibility to reveal conditions of the roadway not consistent with the driver's expectancy:
Extremities of the roadway. Roadway boundaries. Road geometry as far ahead as possible, and desirable at least 1,000 ft ahead.
3. Integration of speed control with the steering control requirements: (a) No specific visual information needed.
Situational Information Needs
Situational information involves that information which indicates a need for a change in speed, direction of travel, or position on the roadway, required as a result of a change in the geometric, traffic, and/or environmental situation. Whereas the positional tasks and associated information needs are limited, the situational subtasks and information needs are as varied as the number and types of road and traffic situations encountered in traffic. Information needs at this level involve information relative to all aspects of the highway system, such as other cars, road geometrics, obstacles, weather conditions.
Performance at this level is a function of the driver's perception of a situation and his ability to respond in an appropriate manner. Therefore, the driver must have a store of a priori knowledge on which to base his control actions, as well as an understanding of what the situation demands.
Subtasks at the situational level of performance can be broken into three broad categories—car following, over-taking and passing, and other situational subtasks (9). The information needs that follow are presented as related to these three categories:
A. Car following—In car following the driver is con-stantly modifying his car's speed to maintain a safe gap between his car and the vehicle he is following. Thus, in this situation, he is time-sharing tracking with speed control activity. The minimal informa-tion needs are:
Lead car speed and changes in its speed. Following car speed and the relative distance between the driver's vehicle and the lead vehicle. Environmental information to maintain an ap-preciation of the dynamic situation.
B. Overtaking and passing—A second situational sub-task that commonly occurs is passing, which involves, in addition to speed control, modifications in the basic tracking activity. In passing, the driver is re-quired to know control information so as to ma-neuver his vehicle most safely. Minimal information needs are:
Control information on how fast the lead car is traveling and the acceptable gap. Environmental information to maintain an appre-ciation of the dynamic situation. Information to provide for judgment, prediction, estimation, and feedback to maintain an area of safe travel relative to the vehicle and other ele- ments of the highway system.
C. Other situational subtasks—Among the situational subtasks that may occur are avoidance of pedestrians or other objects and response to traffic signals, ad-visory signs, and other formal and informal informa-tion carriers. In all cases, the important point, in terms of information needs, is that the driver must receive information so that be is aware of the oc-currence of a situation and he knows what the situa-tion is. Minimal information needs are:
Information to maintain a complete appreciation of all events that could possibly offset safe travel. Visual information of the relationship of the driver's vehicle to the road, other vehicles, and the environment. Information from the environment and a priori knowledge that will provide for appropriate steer-ing and speed control responses, and feedback information that will indicate the adequacy of the response.
Navigational Information Needs
To fully describe informational needs in driving, the third level of performance, the navigational level, must be con-sidered. This level takes into account the way in which the driver plans a trip and executes his trip plan in transit. The navigational level consists of two basic categories—trip preparation and planning, which is usually a pretrip activity, and direction finding, which occurs while in transit.
A. Trip preparation and planning—Drivers use various means to formulate trip plans, depending on experi-ence, pretrip sources, and the nature of the trip. The means can be as formal as having the trip planned by a touring service, or as simple as using a route
12
used previously. However minimal the preparation, it is unlikely that a driver will attempt to get to some destination completely unprepared.
B. Direction finding—During this phase, the driver on the road must find his destination in the highway system in accordance with his trip plan and the di-rectional information received in transit. He must thus share navigational subtasks with subtasks at the other driving levels. The information needs asso-ciated with direction finding are:
In-trip visual information regarding guide and service signs, and other formal information sources. In-trip visual information regarding landmarks, the environment and other informal information sources.
The practical utility of the driving task description and associated information needs is the development of a driver
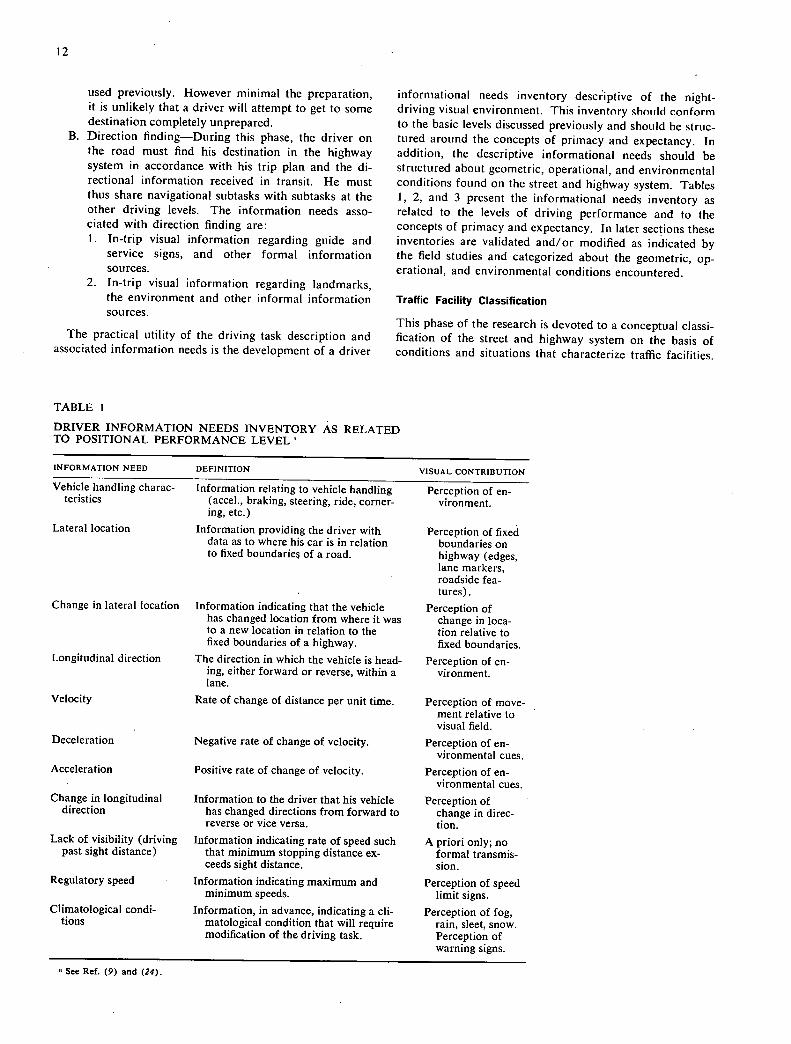
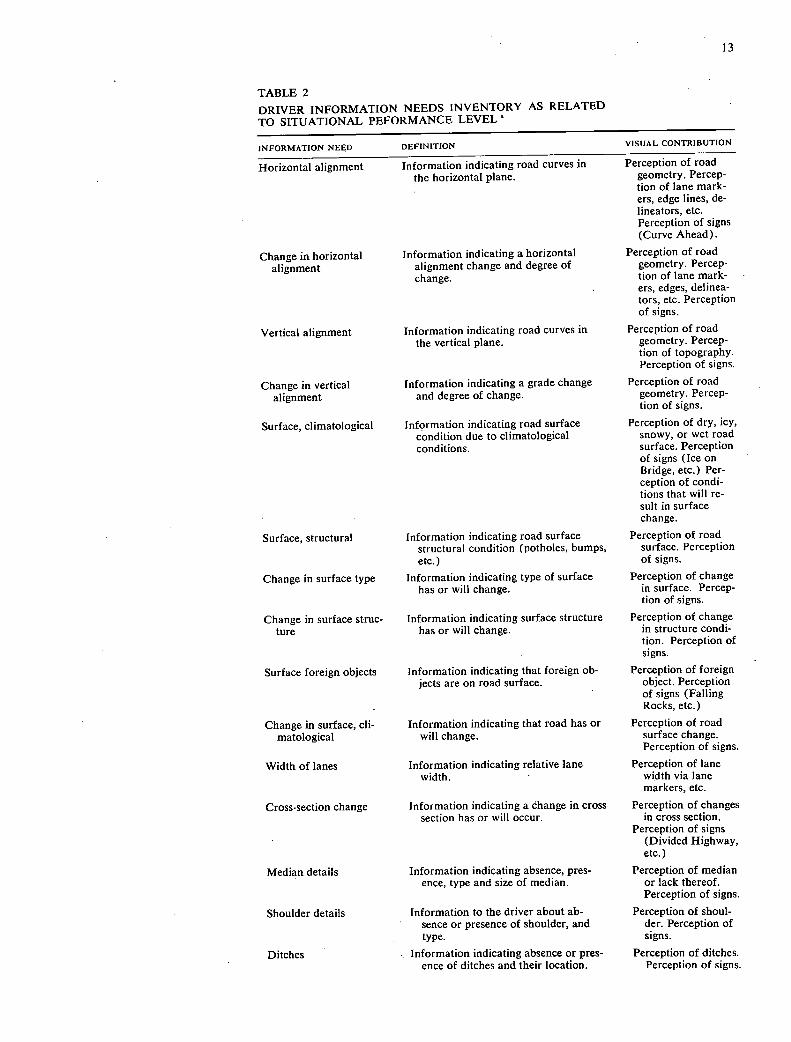
informational needs inventory descriptive of the night-driving visual environment. This inventory should conform to the basic levels discussed previously and should be struc-tured around the concepts of primacy and expectancy. In addition, the descriptive informational needs should be structured about geometric, operational, and environmental conditions found on the street and highway system. Tables 1, 2, and 3 present the informational needs inventory as related to the levels of driving performance and to the concepts of primacy and expectancy. In later sections these inventories are validated and/or modified as indicated by the field studies and categorized about the geometric, op-erational, and environmental conditions encountered.
Traffic Facility Classification
This phase of the research is devoted to a conceptual classi-fication of the street and highway system on the basis of conditions and situations that characterize traffic facilities.
TABLE 1
DRIVER INFORMATION NEEDS INVENTORY AS RELATED TO POSITIONAL PERFORMANCE LEVEL
INFORMATION NEED DEFINITION VISUAL CONTRIBUTION
Vehicle handling charac- Information relating to vehicle handling Perception of en- teristics (accel., braking, steering, ride, corner- vironment.
ing, etc.)
Lateral location Information providing the driver with Perception of fixed data as to where his car is in relation boundaries on to fixed boundaries of a road, highway (edges,
lane markers, roadside lea- tures).
Change in lateral location Information indicating that the vehicle Perception of has changed location from where it was change in loca- to a new location in relation to the tion relative to fixed boundaries of a highway, fixed boundaries.
Longitudinal direction The direction in which the vehicle is head- Perception of en- ing, either forward or reverse, within a vironment. lane.
Velocity Rate of change of distance per unit time. Perception of move- ment relative to visual field.
Deceleration Negative rate of change of velocity. Perception of en- vironmental cues.
Acceleration Positive rate of change of velocity. Perception of en- vironmental cues.
Change in longitudinal Information to the driver that his vehicle Perception of direction has changed directions from forward to change in direc-
reverse or vice versa. tion. Lack of visibility (driving Information indicating rate of speed such A priori only; no
past sight distance) that minimum stopping distance ex- formal transmis- ceeds sight distance. sion.
Regulatory speed Information indicating maximum and Perception of speed minimum speeds. limit signs.
Climatological condi- Information, in advance, indicating a cli- Perception of fog, tions matological condition that will require rain, sleet, snow.
modification of the driving task. Perception of warning signs.
See Ref. (9) and (24).
13
TABLE 2 DRIVER INFORMATION NEEDS INVENTORY AS RELATED TO SITUATIONAL PEFORMANCE LEVEL
INFORMATION NEED DEFINITION VISUAL CONTRIBUTION
Horizontal alignment Information indicating road curves in Perception of road the horizontal plane. geometry. Percep-
tion of lane mark- ers, edge lines, de- lineators, etc. Perception of signs (Curve Ahead).
Change in horizontal Information indicating a horizontal Perception of road
alignment alignment change and degree of geometry. Percep- change. tion of lane mark-
ers, edges, delinea- tors, etc. Perception of signs.
Vertical alignment Information indicating road curves in Perception of road the vertical plane. geometry. Percep-
tion of topography. Perception of signs.
Change in vertical Information indicating a grade change Perception of road
alignment and degree of change. geometry. Percep- tion of signs.
Surface, climatological Information indicating road surface Perception of dry, icy, condition due to climatological snowy, or wet road conditions. surface. Perception
of signs (Ice on Bridge, etc.) Per- ception of condi- tions that will re- suit in surface change.
Surface, structural Information indicating road surface Perception of road structural condition (potholes, bumps, surface. Perception etc.) of signs.
Change in surface type Information indicating type of surface Perception of change has or will change. in surface. Percep-
tion of signs.
Change in surface struc- Information indicating surface structure Perception of change ture has or will change. in structure condi-
tion. Perception of signs.
Surface foreign objects Information indicating that foreign ob- Perception of foreign jects are on road surface. object. Perception
• of signs (Falling Rocks, etc.)
Change in surface, cli- Information indicating that road has or Perception of road matological will change. surface change.
Perception of signs.
Width of lanes Information indicating relative lane Perception of lane width. . width via lane
markers, etc.
Cross-section change Information indicating a change in cross Perception of changes section has or will occur. in cross section.
Perception of signs (Divided Highway, etc.)
Median details Information indicating absence, pres- Perception of median ence, type and size of median. or lack thereof.
Perception of signs.
Shoulder details Information to the driver about ab- Perception of shoul- sence or presence of shoulder, and der. Perception of type, signs.
Ditches Information indicating absence or pres- Perception of ditches. ence of ditches and their location. Perception of signs.

14
TABLE 2 (Continued)
INFORMATION NEED DEFINITION VISUAL CONIRIBUlION
Roadside obstacles Information indicating absence or pres- Perception of obsta- ence of roadside obstacles (trees, des. signs, etc.) and their location.
Number of lanes Information indicating quantity of lanes. Perception of lanes via lane markers. Perception of signs.
At-grade intersection Information indicating that intersection Perception of inter- is approaching and its configuration. section. Perception
of signs. Railroad crossing Information indicating crossing, condi- Perception of railroad
tion, and whether or not occupied or crossing configura- train approaching. tion. Perception of
signals and signs. Perception of train.
Special features Information indicating special features Perception of physical ahead, signs of the feature.
Perception of signs. Change in road environ- Information indicating that road environ- Perception of change
ment ment has or will change. in road environ- ment. Perception of signs.
Bridge or tunnel Information indicating a bridge or tunnel Perception of bridge ahead requiring driving change. or tunnel. Percep-
tion of signs. Speed of in-lane traffic Information indicating speed of vehicles Perception of lead
in driver's lane, vehicle and estima-
- tion of relative - speed toown.
Front gap Information indicating distance between Perception of lead ye- driver's car and lead car. hide and estimation
of gap. Change in front gap Information indicating + or - change Perception of lead
in gap. vehicle and esti- mate of rate of change.
In-lane traffic behavior Indications of what the lead traffic will Perception of lead do (stop, speed up, turn, etc.) vehicle taillights,
turn signals, etc.
Change in in-lane traffic Indication of the occurrence and rate of Perception of lead speed change of speed between driver's car vehicle and estima-
and lead car. tion of rate of change of speed.
Lateral placement of ad- Indication of presence and location of Perception of vehicles joining lane traffic traffic in adjoining lanes relative to lane
markers, etc.
Speed of adjoining lane Indication of rate of speed of vehicle(s) Perception of vehicle traffic in adjoining lanes, speed relative to
own speed.
Adjoining lane traffic Indication of what lead and following Perception of vehicle behavior vehicle(s) in adjoining lanes will do and/or turn signals,
(stop, speed up, change lanes, etc.) lights, wheel orien- tation.
Adjoining lane traffic lag Indication of remaining gap alongside Perception of rear ye- and change in lag driver (for passing, lane change, etc.) hide(s) lag and
and change in gap. change of lag. Adjoining lane traffic, Indication that driver is being passed or Perception of traffic
passed by and passing passing traffic in adjoining lanes. passing. Perception of passing traffic.
Rear gap and change in Indication of distance between driver's Perception of rear gap rear and rear car's front and change. gap. Perception of
rate of change of rear gap.
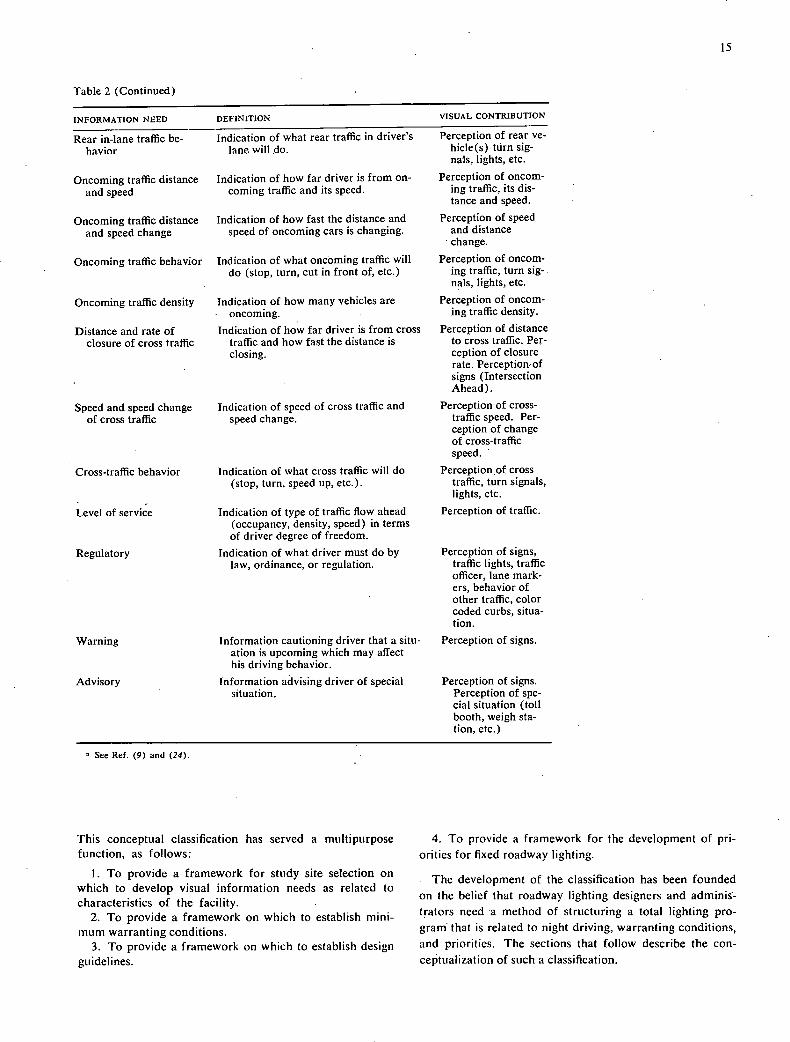
Table 2 (Continued)
INFORMATION NEED DEFINITION VISUAL CONTRIBUTION
Rear in-lane traffic be- Indication of what rear traffic in driver's Perception of rear ye- havior lane will do. hide(s) turn sig-
nals, lights, etc.
Oncoming traffic distance Indication of how far driver is from on- Perception of oncom- and speed coming traffic and its speed. ing traffic, its dis-
tance and speed.
Oncoming traffic distance Indication of how fast the distance and Perception of speed and speed change speed of oncoming cars is changing. and distance
change.
Oncoming traffic behavior Indication of what oncOming traffic will Perception of oncom- do (stop, turn, cut in front of, etc.) ing traffic, turn sig-.
nals, lights, etc.
Oncoming traffic density Indication of how many vehicles are Perception of oncom- - oncoming. ing traffic density.
Distance and rate of Indication of how far driver is from cross Perception of distance closure of cross traffic traffic and how fast the distance is to cross traffic. Per-
closing. ception of closure rate. Perceptionof signs (Intersection Ahead).
Speed and speed change Indication of speed of cross traffic and Perception of cross- of cross traffic speed change, traffic speed. Per-
ception of change of cross-traffic speed.
Cross-traffic behavior Indication of what cross traffic will do Perceptionof cross (stop, turn, speed up, etc.). traffic, turn signals,
- lights, etc.
Level of service Indication of type of traffic flow ahead Perception of traffic. (occupancy, density, speed) in terms of driver degree of freedom.
Regulatory Indication of what driver must do by Perception of signs, law, ordinance, or regulation. traffic lights, traffic
officer, lane mark- ers, behavior of other traffic, color coded curbs, situa- tion.
Warning Information cautioning driver that a situ- Perception of signs. ation is upcoming which may affect his driving behavior.
Advisory Information advising driver of special Perception of signs. situation.
Perception of spe- cial situation (toll booth, weigh sta-tion, etc.)
15
11 See Ref. (9) and (24)
This conceptual classification has served a multipurpose function, as follows:
To provide a framework for study site selection on which to develop visual information needs as related to characteristics of the facility.
To provide a framework on which to establish mini-mum warranting conditions.
To provide a framework on which to establish design guidelines.
To provide a framework for the development of pri-
orities for fixed roadway lighting.
The development of the classification has been founded
on the belief that roadway lighting designers and adminis-
trators need 'a method of structuring a total lighting pro-
gram' that is related to night driving, warranting conditions,
and priorities. The sections that follow describe the con-
ceptualization of such a classification.
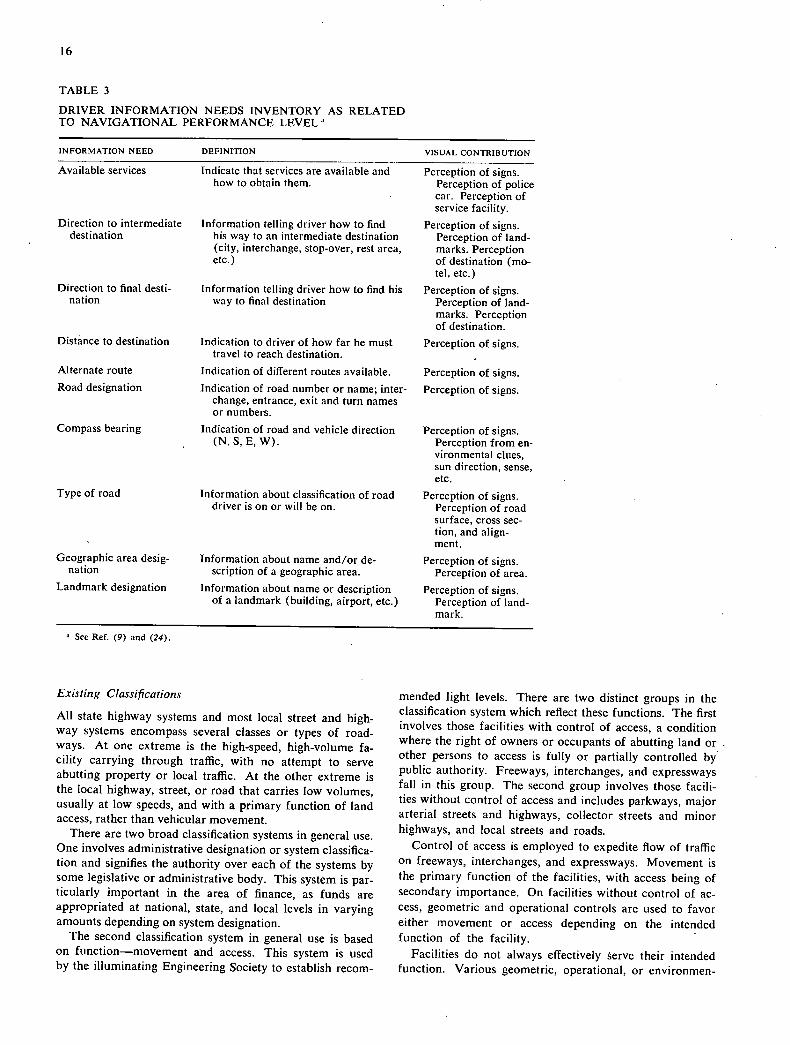
16
TABLE 3
DRIVER INFORMATION NEEDS INVENTORY AS RELATED TO NAVIGATIONAL PERFORMANCE LEVEL
INFORMATION NEED DEFINITION VISUAL CONTRIBUTION
Available services Indicate that services are available and Perception of signs. how to obtain them. Perception of police
car. Perception of service facility.
Direction to intermediate Information telling driver how to find Perception of signs. destination his way to an intermediate destination Perception of land-
(city, interchange, stop-over, rest area, marks. Perception etc.) of destination (mo-
tel, etc.)
Direction to final desti- Information telling driver how to find his Perception of signs. nation way to final destination Perception of land-
marks. Perception of destination.
Distance to destination Indication to driver of how far he must Perception of signs. travel to reach destination.
Alternate route Indication of different routes available. Perception of signs.
Road designation Indication of road number or name; inter- Perception of signs. change, entrance, exit and turn names or numbers.
Compass bearing Indication of road and vehicle direction Perception of signs. (N, S, E, W). Perception from en-
vironmental clues, sun direction, sense, etc.
Type of road Information about classification of road Perception of signs. driver is on or will be on. Perception of road
surface, cross sec- tion, and align- ment.
Geographic area desig- Information about name and/or de- Perception of signs. nation scription of a geographic area. Perception of area.
Landmark designation Information about name or description Perception of signs, of a landmark (building, airport, etc.) Perception of land-
mark.
See Ref. (9) and (24).
Existing Classifications
All state highway systems and most local street and high-
way systems encompass several classes or types of road-
ways. At one extreme is the high-speed, high-volume fa-cility carrying through traffic, with no attempt to serve
abutting property or local traffic. At the other extreme is
the local highway, street, or road that carries low volumes,
usually at low speeds, and with a primary function of land access, rather than vehicular movement.
There are two broad classification systems in general use.
One involves administrative designation or system classifica-tion and signifies the authority over each of the systems by
some legislative or administrative body. This system is par-
ticularly important in the area of finance, as funds are
appropriated at national, state, and local levels in varying amounts depending on system designation.
The second classification system in general use is based
on function—movement and access. This system is used by the illuminating Engineering Society to establish recom-
mended light levels. There are two distinct groups in the
classification system which reflect these functions. The first
involves those facilities with control of access, a condition
where the right of owners or occupants of abutting land or other persons to access is fully or partially controlled by
public authority. Freeways, interchanges, and expressways fall in this group. The second group involves those facili-
ties without control of access and includes parkways, major
arterial streets and highways, collector streets and minor
highways, and local streets and roads.
Control of access is employed to expedite flow of traffic
on freeways, interchanges, and expressways. Movement is
the primary function of the facilities, with access being of
secondary importance. On facilities without control of ac-
cess, geometric and operational controls are used to favor
either movement or access depending on the intended
function of the facility.
Facilities do not always effectively serve their intended function. Various geometric, operational, or environmen-

17
tal characteristics may influence movement and access, as well as the adequacy of visual communication with drivers. Thus, it is desirable to have a classification system that re-flects not only intended function and the degree to which the intended function is served, but also the adequacy of visual communication with drivers. The conceptual classi-fication system proposed herein attempts to reflect those characteristics of traffic facilities that influence visual communication.
Geometric Classification
Geometrics, to a large extent, determine the driving task and the information needs necessary to perform the task safely and efficiently. Geometric design standards are usually related to the functional classification of the fa-cility with higher (better) standards applicable to the higher-class facilities such as freeways. There are condi-tions, however, that often require higher or lower geo-metric standards for a given facility. It becomes necessary, therefore, that a given facility be classified on the basis of geometric sufficiency, characterized as follows:
Ideal geometrics—ThiS is seldom achieved except on the higher-class facilities and usually then only in rural areas. Ideal geometrics are considerably superior to minimum design standards.
Superior geometrics—This is often achieved on higher-class facilities and represents standards above minimum.
Minimum geometrics—This category represents mini-mum design standards for a given facility. A facility de-signed strictly in accordance with the minimum design controls in most standards would be placed in this category.
Critical geometrics—This represents situations where compromises in design have been made and, due to opera-
tional or other considerations, the geometrics no longer meet the minimum conditions for safe operations.
Extreme geometrics—This category applies to conditions that are obviously unsafe for the operating conditions. Ex-treme grades and horizontal alignment, button-hook ramps, and the like, would be placed in this category.
For each of these categories, a level of complexity or severity is evident (see Fig. 1). Descriptive terms for geometric classification may include quality of access, hori-zontal and vertical alignment, lane widths, lateral clear-ances, and number of lanes.
Operational Classification
Various methods have been used in the past to classify traffic facilities on the basis of traffic operations. Figures of merit have ranged from speed and volume to density and capacity, or some combination of all. In an indirect man-ner, driver comfort, performance, and convenience have been included in the classification. The level-of-service concept is currently used in an effort to describe the opera-tional characteristics for a given facility. This concept involves items such as comfort and convenience.
A similar type of classification is desirable from the night-driving environment standpoint. It is important, how-ever, to include in the operational classification an indica-tion of how well the facility operates to satisfy its intended function.
Ideal operations—This category can be roughly likened to level of service A in the level-of-service concept. This level of operation reflects free-flowing conditions with little, if any, restriction in the ability to maneuver. Volumes are low and speeds are relatively high for the various functional classifications.
LEVEL OF COi'LD(ITY OR SEVERIV'
GEOMETRIC
IDEAL GEETRICS SUPERIOR GECfIETRICS MINIIIJI GE1ETRICS CRITICAL GEa'IETRICS D(TRDE GEIETRICS
1 2 3 4 5
0 P E R A T I 0 N A L
IDEAL OPERATIONS SUPERIOR OPERATIONS SATISFACTORY OPERATIONS CRITICAL OPERATIONS D(TRUE OPERATIONS
1 2 3 4 5
ENVIRONMENTAL
IDEAL ENVIROI'IIENT SUPERIOR EN'/IROI'IIENT SATISFACTORY ENVIROItIEWT CRITICAL ENVIROI'ZIENT EXTREME ENVIROtIIENT
1 2 3 4 5
ACCIDENT
EXTREMELY LOW NIGHT NIGHT ACCIDENT RATE NIGHT ACCIDENT RATE EJAL NIGHT ACCIDENT RATE EXTREMELY HIGH NIGHT
ACCIDENT RATES LER THAN DAY RATE TO DAY RATE HIGHER THAN DAY RATE ACCIDENT RATE
Figure 1. Traffic facility classification.

18
Superior operations—This category is similar to the first, but somewhat more restricted with slightly lower-than-optimum speeds. The primary function of the facility may be served in a less-than-optimum manner.
Satisfactory operations—This level would be roughly that of level of service C in the level-of-service concept. Operations are stable, but speed and maneuverability are controlled by other vehicles in the traffic stream. Rela-tively satisfactory operations would be evident.
Critical operations—This level is characterized by ex-cessive limitations on speed and maneuverability. The pri-mary function of the facility is not served in a satisfac-tory manner. Accidents may occur frequently.
Extreme operations—Operation is unstable, primary and secondary functions of the facility are not served satisfac-torily, and speed and volume are not compatible with the facility. Accident experience may be high.
Figure 1 shows the level of complexity or severity assigned to each of the categories. Descriptive terms for operational conditions may include level of service (service volume/capacity), quality of flow (85% speed/design speed), speed differential (85%-15%), and interchanging traffic (number of maneuvers per mile/total volume per mile).
Environmental Classification
One of the greatest needs in evaluating the night-driving environment is a method to consider environmental effects on the driving task. It is recognized that such items as objectionable light sources make the driving task more difficult. Thus, a classification scheme for environmental conditions becomes necessary.
Ideal environment—This level is characterized by little, if any, adjacent land development. There are no objec-tionable or distracting light sources, and access entrances are at a minimum. Surrounding facilities are not illumi-nated.
Superior environment—Land-use development is minor, with few distracting light sources and access entrances.
Satisfactory environment—Adjacent land development approximates 50 percent, with some objectionable and distracting light sources. Access points are significant on at-grade facilities but do not predominate.
Critical environment—Land use is high, with frequent distracting and objectionable light sources. Access en-trances are numerous on at-grade facilities. Adjacent facilities are lighted.
Extreme environment—Adjacent land is completely de-veloped, with a high number of access entrances on at-grade facilities. Distracting and objectionable light sources predominate. All adjacent facilities are lighted.
The level of complexity or severity assigned to the five categories is shown in Figure 1. Descriptive terms for environmental conditions may include complexity of de-velopment, percent frontage devoted to access, effect of sign and environmental lighting, and proximity of development.
Accident Classification
Desirably, the end result of improving the night-driving visual environment will be a reduction in night accident rates and potential for accidents. Past night accident his-tory, therefore, should serve as a means of determining the need for fixed roadway lighting. Using a rating scheme similar to those in previous sections, it is possible to estab-lish a conceptual scale for the inclusion of accident history in the over-all classification concept. The scale representing this inclusion is shown in Figure 1.
Over-All Classification
The geometric, operational, environmental, and accident classification concepts are combined into one unit in Figure 1. Each functional type of facility may be repre-sented by the total scheme, with this type of classification serving as the basic framework for the development and analysis of the field studies.
RESULTS OF FIELD STUDIES
Purpose of Field Studies
Field studies were conducted to develop characteristics of a suitable visual environment. The results of these studies are presented in this section; details of the studies are included in Appendix B.
Visual In formation Needs
Data on visual information needs was obtained from three sources:
Driver interviews. Questionnaires. Conference sessions.
The driver interviews attempted to isolate visual task prob-lems as related to the driving tasks on the various study sections. In addition, the interviews elicited driver re-sponses regarding the adequacy of visual information and the need for fixed lighting for each of the three basic levels of driving performance.
All comments or responses made by the drivers were classified in accordance with the type of information in-volved (positional, situational, navigational). The com-ments were also coded in accordance with the subjects' desires for illumination, or for additional illumination in the case of the lighted sections.
The general analysis procedure was to contrast the re-sponses in the unlighted sections with those from the lighted. The length and complexity of the driving routes were somewhat different, and, therefore, the percentage response takes on greater significance.
Table 4 summarizes the d'rivers' comments for both the unlighted and lighted arterial study sections in Atlanta and Dallas. It is apparent that the primary use of fixed il-lumination by the driver is in association with the situa-tional driving tasks. Numerous comments were received on the other two levels of information need, but not to the extent of the situational level. Contrasting the unlighted and lighted responses, a substantially greater number of
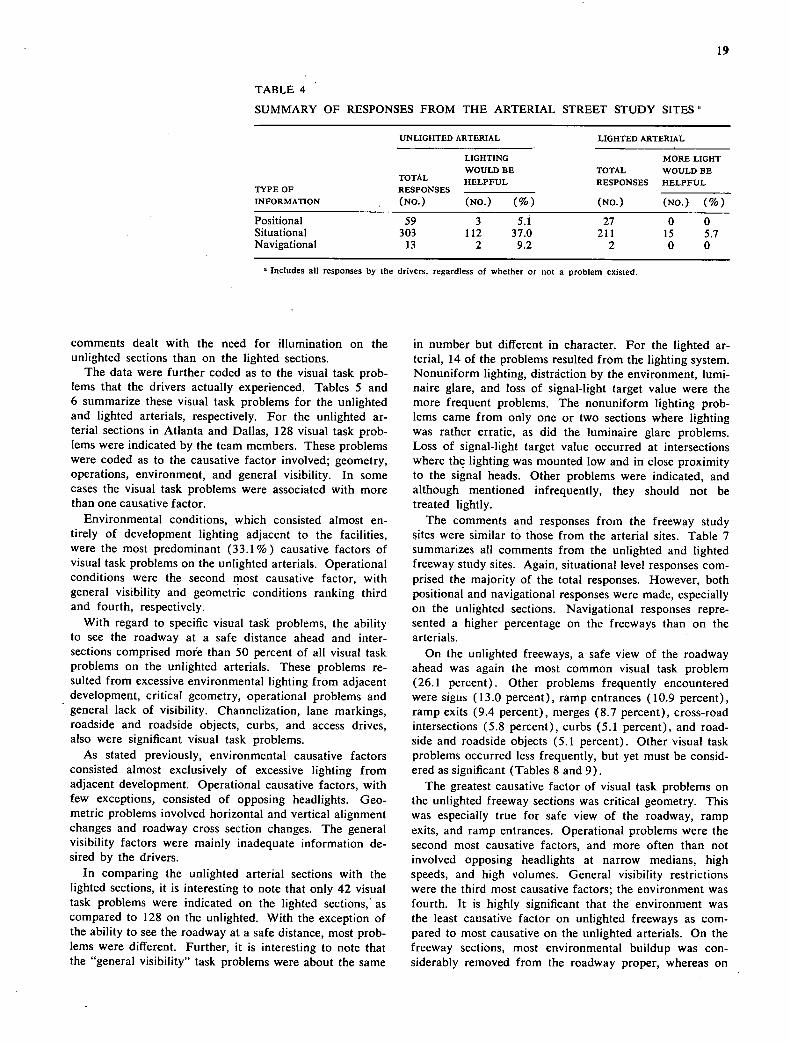
19
TABLE 4
SUMMARY OF RESPONSES FROM THE ARTERIAL STREET STUDY SITES"
UNLIGHTED ARTERIAL LIGHTED ARTERIAL
LIGHTING MORE LIGHT WOULD BE TOTAL WOULD BE
TOTAL HELPFUL RESPONSES HELPFUL TYPE OF RESPONSES INFORMATION (NO.) (NO.) (%) (NO.) (NO.) (%)
Positional 59 3 5.1 27 0 0 Situational 303 112 37.0 211 15 5.7 Navigational 13 2 9.2 2 0 0
Includes all responses by the drivers, regardless of whether or not a problem existed
comments dealt with the need for illumination on the unlighted sections than on the lighted sections.
The data were further coded as to the visual task prob-lems that the drivers actually experienced. Tables 5 and 6 summarize these visual task problems for the unlighted and lighted arterials, respectively. For the unlighted ar-terial sections in Atlanta and Dallas, 128 visual task prob-lems were indicated by the team members. These problems were coded as to the causative factor involved; geometry, operations, environment, and general visibility. In some cases the visual task problems were associated with more than one causative factor.
Environmental conditions, which consisted almost en-tirely of development lighting adjacent to the facilities, were the most predominant (33.1%) causative factors of visual task problems on the unlighted arterials. Operational conditions were the second most causative factor, with general visibility and geometric conditions ranking third and fourth, respectively.
With regard to specific visual task problems, the ability to see the roadway at a safe distance ahead and inter-sections comprised more than 50 percent of all visual task problems on the unlighted arterials. These problems re-sulted from excessive environmental lighting from adjacent development, critical geometry, operational problems and general lack of visibility. Channelization, lane markings, roadside and roadside objects, curbs, and access drives, also were significant visual task problems.
As stated previously, environmental causative factors consisted almost exclusively of excessive lighting from adjacent development. Operational causative factors, with few exceptions, consisted of opposing headlights. Geo-metric problems involved horizontal and vertical alignment changes and roadway cross section changes. The general visibility factors were mainly inadequate information de-sired by the drivers.
In comparing the unlighted arterial sections with the lighted sections, it is interesting to note that only 42 visual task problems were indicated on the lighted sections, as compared to 128 on the unlighted. With the exception of the ability to see the roadway at a safe distance, most prob-lems were different. Further, it is interesting to note that the "general visibility" task problems were about the same
in number but different in character. For the lighted ar-terial, 14 of the problems resulted from the lighting system. Nonuniform lighting, distraction by the environment, lumi-naire glare, and loss of signal-light target value were the more frequent problems. The nonuniform lighting prob-lems came from only one or two sections where lighting was rather erratic, as did the luminaire glare problems. Loss of signal-light target value occurred at intersections where the lighting was mounted low and in close proximity to the signal heads. Other problems were indicated, and although mentioned infrequently, they should not be treated lightly.
The comments and responses from the freeway study sites were similar to those from the arterial sites. Table 7 summarizes all comments from the unlighted and lighted freeway study sites. Again, situational level responses com-prised the majority of the total responses. However, both positional and navigational responses were made, especially on the unlighted sections. Navigational responses repre-sented a higher percentage on the freeways than on the arterials.
On the unlighted freeways, a safe view of the roadway ahead was again the most common visual task problem (26.1 percent). Other problems frequently encountered were signs (13.0 percent), ramp entrances (10.9 percent), ramp exits (9.4 percent), merges (8.7 percent), cross-road intersections (5.8 percent), curbs (5.1 percent), and road-side and roadside objects (5.1 percent). Other visual task problems occurred less frequently, but yet must be consid-ered as significant (Tables 8 and 9).
The greatest causative factor of visual task problems on the unlighted freeway sections was critical geometry. This was especially true for safe view of the roadway, ramp exits, and ramp entrances. Operational problems were the second most causative factors, and more often than not involved opposing headlights at narrow medians, high speeds, and high volumes. General visibility restrictions were the third most causative factors; the environment was fourth. It is highly significant that the environment was the least causative factor on unlighted freeways as com-pared to most causative on the unlighted arterials. On the freeway sections, most environmental buildup was con-siderably removed from the roadway proper, whereas on
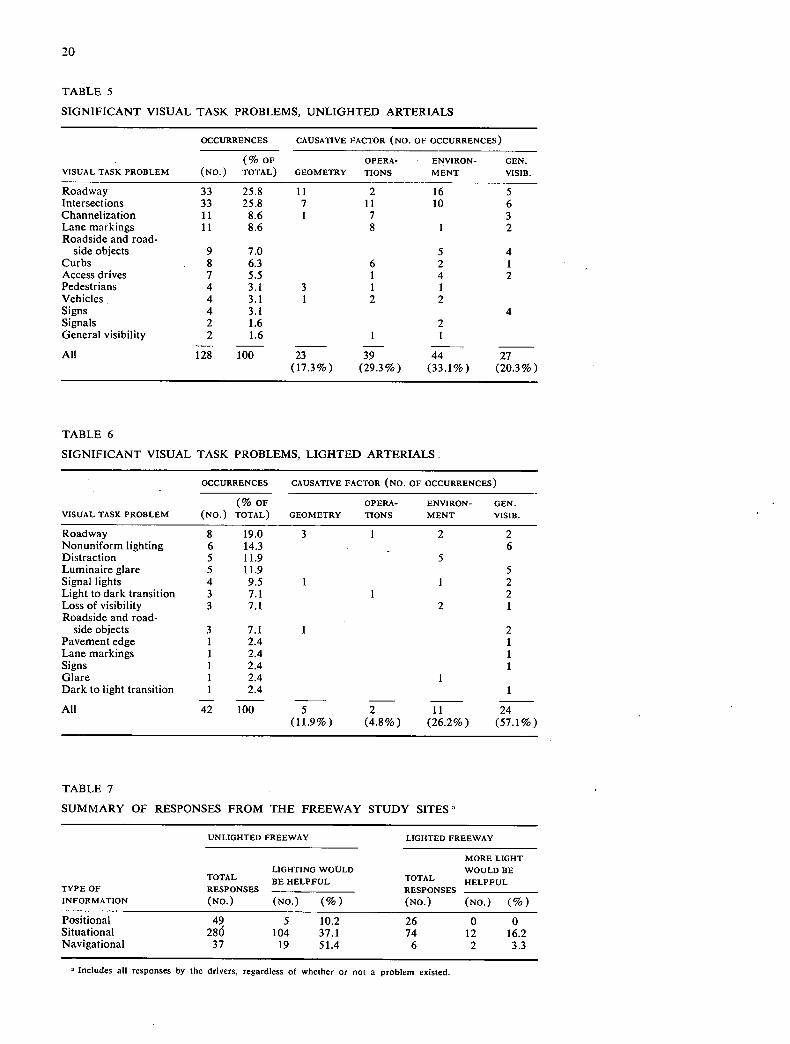
20
TABLE 5
SIGNIFICANT VISUAL TASK PROBLEMS, UNLIGHTED ARTERIALS
OCCURRENCES CAUSATIVE FACTOR (NO. OF OCCURRENCES)
VISUAL TASK PROBLEM (NO.) (% OF TOTAL) GEOMETRY
OPERA-
TIONS
ENVIRON-
MENT GEI4.
VISIB.
Roadway 33 25.8 11 2 16 5 Intersections 33 25.8 7 11 10 6 Channelization 11 8.6 1 7 3 Lane markings 11 8.6 8 1 2 Roadside and road-
side objects 9 7.0 5 4 Curbs 8 6.3 6 2 1 Access drives 7 5.5 1 4 2 Pedestrians 4 3.1 3 1 1 Vehicles 4 3.1 1 2 2 Signs 4 3.1 4 Signals 2 1.6 2 General visibility 2 1.6 1 1
All 128 100 23 39 44 27 (17.3%) (29.3%) (33.1%) (20.3%)
TABLE 6
SIGNIFICANT VISUAL TASK PROBLEMS, LIGHTED ARTERIALS
- OCCURRENCES CAUSATIVE FACTOR (NO. OF OCCURRENCES)
(% OF OPERA- ENVIRON- GEN. VISUAL TASK PROBLEM (NO.) TOTAL) GEOMETRY TIONS MENT VISIB.
Roadway 8 19.0 3 1 2 2 Nonuniform lighting 6 14.3 6 Distraction 5 11.9 5 Luminaire glare 5 11.9 5 Signal lights 4 9.5 1 1 2 Light to dark transition 3 7.1 1 2 Loss of visibility 3 7.1 2 1 Roadside and road-
side objects 3 7.1 1 2 Pavement edge 1 2.4 1 Lane markings 1 2.4 1 Signs 1 2.4 1 Glare 1 2.4 1 Dark to light transition 1 2.4 1
All 42 100 5 2 11 24 (11.9%) (4.8%) (26.2%) (57.1%.)
TABLE 7
SUMMARY OF RESPONSES FROM THE FREEWAY STUDY SITES
TYPE OF
INFORMATION
UNLIGHTED FREEWAY
LIGHTING WOULD TOTAL BE HELPFUL RESPONSES
(NO.) (NO.) (%)
LIGHTED FREEWAY
MORE LIGHT WOULD BE
TOTAL HELPFUL RESPONSES
(NO.) (NO.) (%)
Positional 49 5 10.2 26 0 0 Situational 280 104 37.1 74 12 16.2 Navigational 37 19 51.4 6 2 3.3
Includes all responses by the drivers, regardless of whether or not a problem existed.

01
arterial sections it was usually close and in competition for the driver's attention.
On the lighted freeway sections, no one visual task prob-lem was predominant. Of the 28 problems identified, 45.2 percent were caused by general visibility restrictions, 38.8 percent by critical geometry, 9.7 percent by the en-vironment, and 6.5 percent by operational problems. It is
significant to note that luminaire glare was identified as a problem only one time on the lighted freeway sections, and that occurred on a section of US 75 in Dallas where the units were mounted at a height of 30 ft.
The questionnaires, which were completed following each study site run, were tabulated to give general indications of driver attitudes and opinions on informational needs.
TABLE 8
SIGNIFICANT VISUAL TASK PROBLEMS, UNLIGHTED FREEWAYS
OCCURRENCES CAUSATIVE FACTOR (NO. OF OCCURRENCES)
(% OF OPERA- ENVIRON- GEN.
VISUAL TASK PROBLEM (NO.) TOTAL) GEOMETRY TIONS MENT VISIB.
Roadway 36 26.1 Signs 18 13.0 Ramp entrances 15 10.9 Ramp exits 13 9.4 Merges 12 8.7 Intersections 8 5.8 Curbs 7 5.1 Roadside and road-
side objects 7 5.1 Lane markings 4 2.9 On-ramps 4 2.9 Off-ramps 3 2.2 Vehicles 3 2.2 Delineation 2 1.4 Light transition 2 1.4 Channelization 2 1.4 Roadway objects 1 .7 Glare 1 .7
All 138 100
16 12 8 3 4 3 2 9 7 4 6
10 2 1 1 5 4 3 4 1 1 3 1 5 1
1 6 1 1 2
2 2 2 1 2 3
2 2
2
55 39 13 40 (37.4%) (26.5%) (8.8%) (27.2%)
TABLE 9
SIGNIFICANT VISUAL TASK PROBLEMS, LIGHTED FREEWAYS
OCCURRENCES CAUSATIVE FACTOR (NO. OF OCCURRENCES)
(% OF OPERA- ENVIRON- GEN. VISUAL TASK PROBLEM (NO.) TOTAL) GEOMETRY TIONS MENT VISIB.
Glare 4 14.3 1 1 2 2 Ramp exits 4 14.3 4 Merges 3 10.7 1 2 Signs 2 7.1 1 1 Roadside and road-
side objects 2 7.1 . 2 Pavement edge 2 7.1 2 Roadway 2 7.1 2 Ramp entrance 2 7.1 2 Distraction 1 3.6 1 Light to dark transition 1 3.6 1 Lane markings 1 3.6 1 Off-ramps 1 3.6 1 On-ramps 1 3.6 1 1 Luminaire glare 1 3.6 1 Non-uniform lighting 1 3.6 1
All 28 100 12 2 3 14 (38.8%) (6.5%) (9.7%) (45.2%)
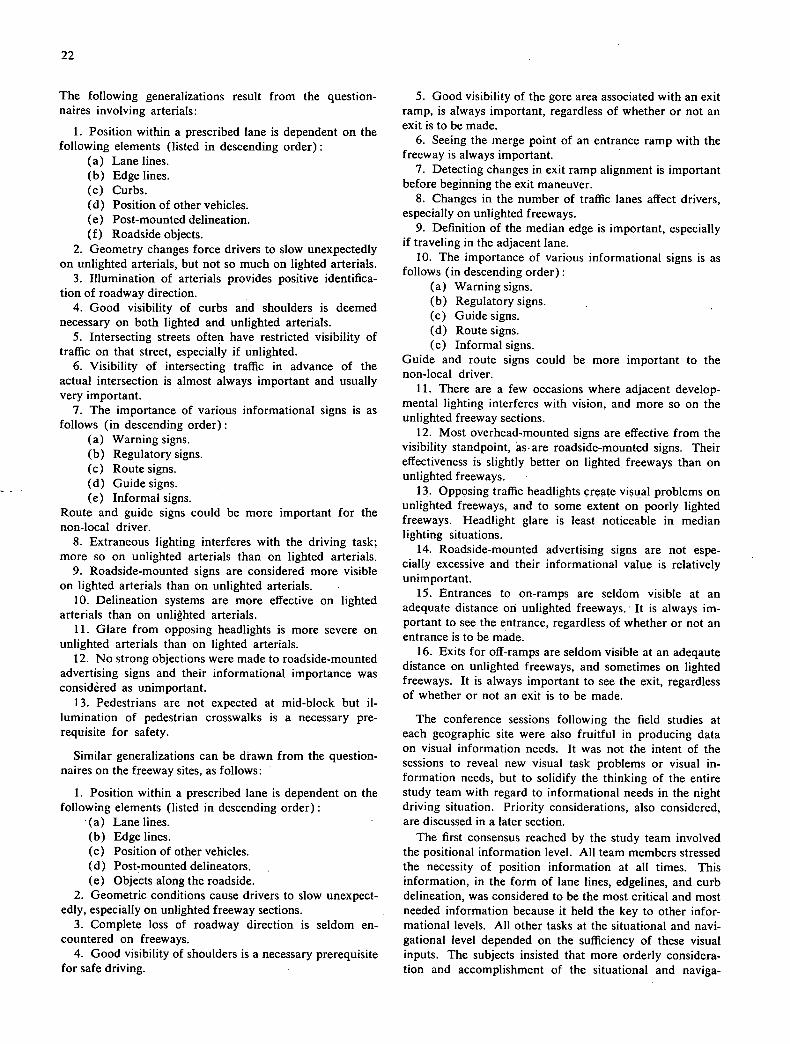
22
The following generalizations result from the question-naires involving arterials:
1. Position within a prescribed lane is dependent on the following elements (listed in descending order):
Lane lines. Edge lines. Curbs. Position of other vehicles. Post-mounted delineation. Roadside objects.
2. Geometry changes force drivers to slow unexpectedly on unlighted arterials, but not so much on lighted arterials.
3. Illumination of arterials provides positive identifica-tion of roadway direction.
4. Good visibility of curbs and shoulders is deemed necessary on both lighted and unlighted arterials.
5. Intersecting streets often have restricted visibility of traffic on that street, especially if unlighted.
6. Visibility of intersecting traffic in advance of the actual intersection is almost always important and usually very important.
7. The importance of various informational signs is as follows (in descending order):
Warning signs. Regulatory signs. Route signs. Guide signs. Informal signs.
Route and guide signs could be more important for the non-local driver.
8. Extraneous lighting interferes with the driving task; more so on unlighted arterials than on lighted arterials.
9. Roadside-mounted signs are considered more visible on lighted arterials than on unlighted arterials.
10. Delineation systems are more effective on lighted arterials than on unlighted arterials.
11. Glare from opposing headlights is more severe on unlighted arterials than on lighted arterials.
12. No strong objections were made to roadside-mounted advertising signs and their informational importance was considered as unimportant.
13. Pedestrians are not expected at mid-block but il-lumination of pedestrian crosswalks is a necessary pre-requisite for safety.
Similar generalizations can be drawn from the question-naires on the freeway sites, as follows:
I. Position within a prescribed lane is dependent on the following elements (listed in descending order):
Lane lines. - Edge lines. Position of other vehicles. Post-mounted delineators. Objects along the roadside.
Geometric conditions cause drivers to slow unexpect-edly, especially on unlighted freeway sections.
Complete loss of roadway direction is seldom en-countered on freeways.
Good visibility of shoulders is a necessary prerequisite for safe driving.
5. Good visibility of the gore area associated with an exit ramp, is always important, regardless of whether or not an exit is to be made.
6. Seeing the merge point of an entrance ramp with the freeway is always important.
7. Detecting changes in exit ramp alignment is important before beginning the exit maneuver.
8. Changes in the number of traffic lanes affect drivers, especially on unlighted freeways.
9. Definition of the median edge is important, especially if traveling in the adjacent lane.
10. The importance of various informational signs is as follows (in descending order):
Warning signs. Regulatory signs. Guide signs. Route signs. Informal signs.
Guide and route signs could be more important to the non-local driver.
11. There are a few occasions where adjacent develop-mental lighting interferes with vision, and more so on the unlighted freeway sections.
12. Most overhead-mounted signs are effective from the visibility standpoint, as-are roadside-mounted signs. Their effectiveness is slightly better on lighted freeways than on unlighted freeways.
13. Opposing traffic headlights create visual problems on unlighted freeways, and to some extent on poorly lighted freeways. Headlight glare is least noticeable in median lighting situations.
14. Roadside-mounted advertising signs are not espe-cially excessive and their informational value is relatively unimportant.
15. Entrances to on-ramps are seldom visible at an adequate distance on unlighted freeways. It is always im-portant to see the entrance, regardless of whether or not an entrance is to be made.
16. Exits for off-ramps are seldom visible at an adeqaute distance on unlighted freeways, and sometimes on lighted freeways. It is always important to see the exit, regardless of whether or not an exit is to be made.
The conference sessions following the field studies at each geographic site were also fruitful in producing data on visual information needs. It was not the intent of the sessions to reveal new visual task problems or visual in-formation needs, but to solidify the thinking of the entire study team with regard to informational needs in the night driving situation. Priority considerations, also considered, are discussed in a later section.
The first consensus reached by the study team involved the positional information level. All team members stressed the necessity of position information at all times. This information, in the form of lane lines, edgelines, and curb delineation, was considered to be the most critical and most needed information because it held the key to other infor-mational levels. All other tasks at the situational and navi-gational level depended on the sufficiency of these visual inputs. The subjects insisted that more orderly considera-tion and accomplishment of the situational and naviga-

23
tional task is possible when these items are readily avail-able. During the driving runs it was observed in too many cases that the drivers had to attend to positional tasks at the sacrifice of the situational and navigational levels. This was due primarily to worn and faded lane lines, absence of edgelines, non-painted curbs, and little contrast between pavement edges and shoulders.
Another consensus of both study teams involved geo-metrically induced visual task problems. Even as revealed in the interview sessions, both study teams supported the hypothesis that a view of the roadway surface is important at all times. Excessive geometric changes producing re-stricted longitudinal views of the roadway were considered as among the most critical and frequently occurring visual task situations.
The study teams also reached consensus on the matter of environmental development. Strong emphasis was placed on the detrimental effect of much environmental lighting on performance of the driving task. There was some disagreement, however, as to the characteristics of envi-ronmental lighting that made it detrimental. This dis-agreement obviously stemmed from the fact that on several occasions environmental lighting actually assisted in deter-mining roadway direction on unlighted arterials and di-rected light onto the roadway surface. Final agreement was reached that environmental lighting is detrimental un-less a considerable intensity of light actually reaches the pavement surface, and provided such sources of light are not in themselves distracting or glaring.
Another consensus reached by the study teams involved operations on the various traffic facilities. Higher speeds and higher volumes definitely were considered to be pro-ducers of visual task problems. First, it was agreed that opposing headlights introduced periods when vision was virtually obliterated and the problem increased as the num-ber of opposing vehicles increased. Lateral separation of vehicles and fixed lighting, especially median-mounted, were considered the best solutions to the problems. It was also agreed that all driving task accomplishment became more difficult as volumes and speeds increased, mainly because of the competition involved between the various informational needs.
Comfort Benefits
As stated previously, the field studies were also used for measuring subjective driver comfort. Study team members were asked to complete a specially designed questionnaire after driving each study site. Details of the studies are given in Appendix C.
The results of the studies indicate that drivers are com-fortable when operating on an illuminated traffic facility, rather than just ". . less uncomfortable than he would be when driving on a non-illuminated traffic facility."
It was hoped that the comfort studies would provide information allowing for the specification for a hierarchy of discomfort inducers as a function of different types of traffic facilities. However, the limited number of permitted field studies prevented this specification.
Traffic Facility Classification, Warrants, Priorities, and Design Guidelines
The conceptual classification scheme presented in an earlier section was used to classify visual information needs from the field studies and to identify characteristics producing information needs. This basic conceptual scheme, ex-panded to include the identified characteristics, serves as the over-all basis of the lighting process. This is discussed in later sections. (An alternate scheme for the lighting process is included in Appendix D.)
WARRANTS AND PRIORITIES
Basis for Warrants and Priorities
The discussion of the research approach for this effort mdi-cated a complex interrelationship existing within the over-all design process for roadway lighting. The approach, therefore, involved a fundamental framework of night visual communications efficiency and traffic facility classification.
The nature of the approach and the research problem suggested the need for a large number of field studies throughout the United States. As indicated previously, however, the studies were limited to two geographic areas and eighrstudy sites. This curtailment of studies has lim-ited the total development of driver information needs as well as complete information for weighting warranting fac-tors. It became necessary, therefore, to supplement the field study results with data from the literature and engi-neering judgment from the research staff. This in itself is desirable, as a broader range of professional expertise and judgment is represented in the final development of war-rants, design guides, and priorities. Nevertheless, it is noted that the basic input to the development has come from the field studies.
Requirements for the Suitable Visual Environment
A suitable visual environment for night operations is one in which there is readily available the visual information necessary for a given driving population to safely and efficiently perform the driving tasks under the prevailing night driving circumstances. The primary thrust of the field studies has been to identify those elements of the night-driving visual environment that are necessary for safe and efficient traffic operations. This identification has been necessary for a specification of the requirements for a suit-able visual environment to be obtained by fixed roadway lighting. Knowing those elements that are important to the driver as visual information tasks allows for orderly con-sideration of the illumination design requirements to satis-factorily accomplish the tasks.
This section summarizes the significant elements of the night-driving visual environment as determined from the literature and the field studies and suggests basic illumina-tion requirements for accomplishment of the related tasks.
Table 10 summarizes those elements of the total environ-ment that should always be visible to the driver of a motor vehicle. It is not suggested that this summary contains all possible elements for any and every traffic facility; rather it points out those elements considered important by the

24
TABLE 10
IMPORTANT ELEMENTS OF THE NIGHT-DRIViNG VISUAL ENVIRONMENT
ELEMENT TYPE OF INFORMATION DESCRIPTION
Roadway geometry Positional, situa- Perception of the roadway alignment, topog- tional raphy, and cross section at a distance com-
mensurate with travel speed.
Intersection Situational, navi- Perception of intersecting roadway ahead gational commensurate with travel speed.
Channelization Positional, situa- Perception of markings, curbs, medians, etc., tional that indicate an assigned path.
Lane markings Positional, situa- Perception of lane lines, edgelines, centerlines. tional
Roadside and roadside Positional, situa- Perception of the environment for dynamic objects tional, naviga- appreciation and recognition of possible
tional hazards.
Curbs Positional, situa- Perception of curb as an object and guide. tional
Access drives Situational Recognition of curb break, pavement contrast, or other features indicating an access open- ing.
Pedestrians Situational Perception of pedestrian on or adjacent to the roadway, and recognition as a possible con- flict.
Vehicles Positional, situa- Perception of other vehicles on the facility, tional their location and intended directions rela-
tive to own location and movement.
Signs Situational, navi- Perception and recognition of signs and their gational contents.
Signals Situational Perception of color and/or orientation of sig- nal heads indicating assignment of right-of- way.
Pavement edge Positional Perception of pavement boundaries, contrast between pavement and shoulder or roadside and edgelines.
Delineation Positional, situa- Perception of roadway delineation as indica- tional tive of roadway features.
Special geometric Positional, situa- Perception of conflict points, ramp exits and features tional entrances, merges, ramp configuration and
direction.
Roadway objects Situational Perception of hazardous objects on the road- way at a distance commensurate with travel speed.
Road condition Situational Perception of road surface indicating struc- tural and climatic conditions.
Special roadside Situational, navi- Perception of signs, landmarks, etc., indicat- features gational ing an intermediate or final destination.
driver as determined from the research. It is believed, however, that few situations will occur where elements significantly different from those listed will arise.
Many of the elements listed are made adequately visible by vehicle headlights. Also, in some cases no amount of fixed lighting will make elements visible if they are not present or properly maintained (lane lines, edgelines, de-lineators, etc.). Therefore, it is paramount to state that fixed lighting and traffic control measures cannot be con-sidered independently. It is first necessary to provide ade-
quate pavement markings, delineation, signing—and even design—because fixed lighting is an amplifier of these ele-ments. The major problem then is to determine the condi-tions that justify and quantify fixed lighting to supplement the other elements of the communication system.
It has been apparent from the literature and this re-search that the primary role fixed lighting can play in-volves situational tasks. These situational tasks consist primarily of roadway geometry and features including intersections, merges, channelization, curbs, access drives,
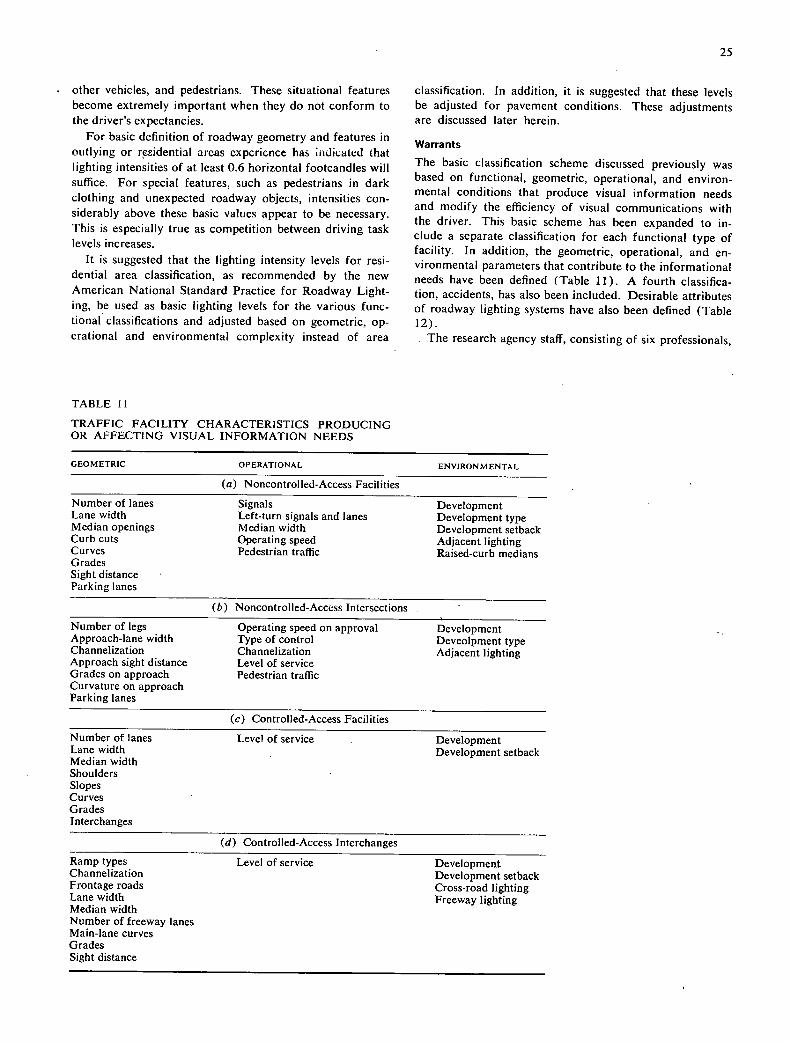
25
other vehicles, and pedestrians. These situational features classification. In addition, it is suggested that these levels become extremely important when they do not conform to be adjusted for pavement conditions. These adjustments the driver's expectancies. are discussed later herein.
For basic definition of roadway geometry and features in outlying or rsidentiat areas cxperience has indicated that lighting intensities of at least 0.6 horizontal footcandles will suffice. For special features, such as pedestrians in dark clothing and unexpected roadway objects, intensities con-siderably above these basic values appear to be necessary. This is especially true as competition between driving task levels increases.
It is suggested that the lighting intensity levels for resi-dential area classification, as recommended by the new American National Standard Practice for Roadway Light-ing, be used as basic lighting levels for the various func-tional classifications and adjusted based on geometric, op-erational and environmental complexity instead of area
Warrants
The basic classification scheme discussed previously was based on functional, geometric, operational, and environ-mental conditions that produce visual information needs and modify the efficiency of visual communications with the driver. This basic scheme has been expanded to in-clude a separate classification for each functional type of facility. In addition, the geometric, operational, and en-vironmental parameters that contribute to the informational needs have been defined (Table 11). A fourth classifica-tion, accidents, has also been included. Desirable attributes of roadway lighting systems have also been defined (Table 12).
The research agency staff, consisting of six professionals,
TABLE 11
TRAFFIC FACILITY CHARACTERISTICS PRODUCING OR AFFECTING VISUAL INFORMATION NEEDS
GEOMETRIC OPERATIONAL ENvIRONM ENTAL
(a) Noncontrolled-Access Facilities
Number of lanes Signals Development Lane width Left-turn signals and lanes Development type Median openings Median width Development setback Curb cuts Operating speed Adjacent lighting Curves Pedestrian traffic Raised-curb medians Grades Sight distance Parking lanes
(b) Noncontrolled-Access Intersections
Number of legs Operating speed on approval Development Approach-lane width Type of control Deveolpment type Channelization Channelization Adjacent lighting Approach sight distance Level of service Grades on approach Pedestrian traffic Curvature on approach Parking lanes
(c) Controlled-Access Facilities
Number of lanes Level of service - Development Lane width Development setback Median width Shoulders Slopes Curves Grades Interchanges
(d) Controlled-Access Interchanges
Ramp types Level of service Development Channelization Development setback Frontage roads Cross-road lighting Lane width Freeway lighting Median width Number of freeway lanes Main-lane curves Grades Sight distance

26
TABLE 12
DESIRABLE ATI'RIBUTES OF ROADWAY LIGHTING SYSTEMS
(a) Noncontrolled-Access Facilities
Uniform lighting on pavement surface Infrequent spacings to reduce glare High mounting heights to reduce glare Median location to reduce headlight glare Median location to light areas adjacent to roadway Gradual transitions from light to dark areas Gradual transitions from dark to light areas
(b) Controlled-Access Facilities
Uniform lighting on pavement surface Infrequent spacings to reduce glare High mounting heights to reduce glare Median location to reduce headlight glare Median location to light areas adjacent to roadway High-mast lighting in interchange areas Gradual transitions from light to dark areas Gradual transitions from dark to light areas
assigned weighting factors to each of the parameters. Justi-fication for the weighting factors came from collective judg-ment, field study results; and the literature (see "Traffic Control and Roadway Elements (25)). An unlighted and lighted weighting factor was assigned to each parameter. The difference between the two factors represents the degree of effectiveness provided by fixed lighting.
Tables 13, 14, 15, and 16 represent the final classifica-tion scheme for the various functional facilities considered. The minimum warranting condition is the total effective-ness achieved by lighting a traffic facility with an average rating of three on the subjective scale of 1 to 5. For exam-ple, the minimum warranting condition for continuous ar-terial lighting (Table 13) is 85 points. These 85 points represent a facility where all geometric, operational, envi-ronmental, and accident parameters have a rating of 3 (number of lanes, 6; median width, 10 to 20 ft; develop-ment, 30 to 60 percent; night-to-day accident rate, 1.2 to 5; etc.) The rating number 3, multiplied by the unlighted weight for each parameter and summed, minus the rating number 3 multiplied by the lighted weight for each parame-ter and summed, equals the minimum warranting number of points. If a given continuous arterial traffic facility re-ceived a 3 rating for each and every geometric, operational, environmental, and accident parameter, the facility would just meet the minimum requirements for lighting. Any combination of ratings that will produce a total of 85 points or more is, of course, warranted. The degree to which the total warranting points exceed the minimum (85 for con-tinuous arterial lighting) serves as the basis for setting priorities.
Justification for Ratings and Weighting Factors
As previously stated, a professional team rated and as-signed weightings to each of the classification factors. Justi-fication for the ratings and weightings came from the field
studies, literature, and collective judgment of the profes-sional team. Each member of the professional team was provided a transcript of the field study interviews, ques-tionnaire results, and critique sessions. In addition, each team member received a summary of accident rates for various traffic control and roadway element conditions. This summary was prepared from Traffic Control and Roadway Elements (25). After each team member had a sufficient opportunity to review this information in de-tail, eight three-hour work sessions were held to assign the ratings and relative weightings. Each assignment was dis-cussed and researched until a consensus of the five-member team was achieved. The following discussion describes the rationale involved in the ratings and weightings developed by the professional team. The ratings are highly judg-mental and experience gained through field application may lead to refinement and changes in the ratings and weightings.
Geometric Factors
Number of Lanes.—As the number of operating lanes in-creases, the ability of the headlights to effectively light the periphery of the roadway is greatly reduced, especially in inclement weather. Identification of the extremes of the roadway is an important element in driver orientation. Normal headlights are able to illuminate the traveled lane and one lane on either side to an acceptable degree. There-fore, with two lanes in one direction (total of four lanes) the driver should have little difficulty in locating the ex-tremes of the roadway and the condition would be ideal—a rating of 1. Three lanes in one direction would result in the drivers in the inside or outside lane being able to iden-ufy only one edge of the roadway—not critical, but cer-tainly not ideal. Thus, a rating of 3 seems appropriate. With four or more lanes in one direction, the orientation of the driver becomes a critical factor and the 5 rating is justified.
Lane Width.—As the effective width of the lane is re-duced, the problem of tracking becomes increasingly im-portant to the driver. This results in increased concentra-tion on the steering (positional) task and a reduction of a corresponding amount of time that can be devoted to the other elements of the driving task. Therefore, it is im-portant to provide an environment that minimizes the amount of time required to accomplish the nontracking aspects of driving. A lane width of 13 ft or more presents little difficulty and is, therefore, assigned the ideal rating of 1. A lane width of 9 ft or less is critical, as there is little leeway for tracking errors. A rating of 5 has been assigned to this condition. An 11-ft lane is acceptable for most operations and has been assigned a rating of 3, thus completing the scale of ratings for lane width for all classifications.
Number of Legs.—For at-grade intersections, the com-plexity of operations increases as the number of approach legs to the intersection increases. Ideally, there would be no intersecting legs (i.e., no intersection). Three inter-secting legs, such as a T or Y intersection, would be the smallest number of legs possible to have an intersection. This condition has received a rating of 2. Six or more legs, or traffic circles, represent the most complex condition and

27
TABLE 13
CLASSIFICATION FOR NONCONTROLLED-ACCESS FACILITY LIGHTING
CLASSIFICATION RATING !J&IT I4I(4T
LIGITED II4T
S0 01FF (TING
FACThR -- 2 3 4 . 5 (A) (B) (A-s$
GctETRI C FATORS
No. of lanes 4 or less - 6 - 8 or more 1.0 0.8 0.2
Lane Width '12 12' 11' 10' 1,10' 3.0 2.5 0.5
Median Openings '4.0 or one 4.0-8.0 8.1-12.0 12.0-15.0 '15.0 or no 5.0 3.0 2.0 per mile way operation access control
Curb Cuts <10% 10-20% 20-301 30-401 '401 5.0 3.0 2.0
Curves <3,00 3.1-6.0° 6.1.8.00 8.1-10.0° >100 13.0 5.0 8.0
Crades <3% 3.0-3.9% 4.0-4.91 5.0-6.91 71 or more 3.2 2.8 0.4
Sight Distance '700' 500-700' 300-500' 200-300' 4200, 2.0 1.8 0.2
Parking prohibited loading off-peak permitted permitted 0.2 0.1 0.1 both sides zones only only one side both sides
GB4Ffluc 1YTAI,
OPERATIONAL FACmRS -
Signals
Left turn lane
Median Width
Operating Speed
Pedestrian Traffic at night (peds/mi)
ENVll'ENTAL FAC1tRS
I Development
Predominant Type' Development
Setback Distance
Advertising or area lighting
Raised Curb Median
Crime Rate
all major substantial most major about half frequent non- intersections majority of intersections the intersec- signalized signalized intersections signalized tions intersections
signalized signalized
all major substantial most major about half infrequent intersections majority of intersections the major turn bays or or one way intersections intersections undivided operation streets
30' 20-30' 10-20' 4-10' 0-4'
25 or less 30 35 40 45 or greater
very few or 0-50 50-100 100-200 '200 none
0 0-301 30-60% 60-90% 1001
undeveloped residential half-residen- industrial strip Indus- or backup , tial and/or or corner- trial or design colirErcial cial cosriercisi
'200 150-200' 100-150' 50-100' <50
none 0-40% 40-60% 60-801 , essentially continuous
none continuous at all inter- at signalized a few, sections intersections locations
extremely lower than city aver, higher than. extremely low city aver, city aver, high
3.0 2.8 0.2
5.0 , 4.0 1.0
1.0 0.5 0.5
1.0 0.2 0.8
1.5 0.5 1.0
OPERATIONAL mTAL
O 's 0.3 0,2
0.5 0.3 0.2
0.5 0;3 0.2
3.0 1.0 2.0
1.0 0.5 0.5
1.0 0.5 1 0.5
F1lV1IO.FN1AL 1tYTAL
ACC IEENTS
Ratio of night to ' '1.0 day accident rates
°Continuous lighting warranted
1.0-1.2 1.2-1.5 1.5-2.0 2.0k
CIfl4ETRIC Tm'AL '
OPERATIONAL 1UTAL =
JOWl RC60-O'XrAL 1UTAL =
ACCIL1UMI mrAL
SUM = POINTS
WARRANTING CONDITION = 85 points
10.0 2.0 8.0
ACCIDH4T 'tOTAL

28
TABLE 14
CLASSIFICATION FOR INTERSECTION LIGHTING
L*.IT LIG{TED SCORE CLASSIFICATION ______ RA1J
4 5 WEIG4T WEI9{1 DIFF. IRATING
FAC1OR 1 2 (A) (B) (A-B) x(A-B))
GETRIC FAC1RS
NtrIer of legs 3 4 5 6 or more 3.0 2.5 0.5 (including traffic circles)
Approach lane Width 12' 12' II' - 10' 10' 3.0 2.5 0.5
Channclizat ion no turn lanes left turn lanes left turn lanes left and right left and right 2.0 I,.O 1.0 on major legs on all legs, turn lanes on turn lanes on
right turn major legs all legs lanes on major legs
Approach Sight .700' 500-700' 300-500' 200-300' '200' 2.0 1.8 0.2 Distance
Grades on Approach 0% 3.0-3.95 4.0-4.9% 5.0-6.9% 7% or more 3.2 2.8 0.4 Streets
Curvature on .3.0° 3.0-6.0° 6,1-8.0° 8.1-10.01 10° 13.0 5.0 8.0 Approach legs
Parking in Vicinity prohibited loading zones off-peak permitted one permitted 0.2 0.1 0.1 both sides only only side only both sides
(;ll*.rI'Rlc 'IOTAI.
OPERATI(4AL FAC1ORS
Operating Speed 25 mph or 30 mph 35 mph 40 mph 45mph or 1.0 0.2 0.8 - on Approach Legs less greater
Type of Control all phases left turn through traffic 4-way stop stop control 3.0 2.7 0.3 signalized lane signal signal control control to minor legs (md. turn control only or no control lane) -
Channelization left and right left and right left turn lane left turn lane no turn lane 3,0 2.0 1.0 signal control turn lane signal control signal control control
signal control on all legs on major legs on major legs
Level of Service A II C 1) 1.0 0.2 0.8 (Load Iactor) 0.0 0-0.1 0.1-0.3 0.3-0.7 0.7-1.0
Pedestrian Vol. very few or 0-SO 50-100 100-200 '200 1.5 0.5 1.0 (pcde/hr crossing) none
ol'IIlATIONAI. tOTAL
ENVIRCHVITAL FACTORS
Percent Adjacent 0 0-301 30-60% 60-90% 100% 0.5 0.3 0.2 Develo1xTnt
I'rcdoeinant undeveloped residential 50% residen- industrial or Strip industrial 0.5 0.3 0.2 lvelopment near tial - SOS Comm rclal or cmorcia1 Intersection industrial or (no circuity)
comae rc i a I
Lighting in Imanediate none 0-40% 40-60% 60-80% essentially 3.0 1.5 1.5 Vicinity continuous
Crime Rate extremely ler than city aver, higher than extremely 1.0 0.5 0.5 low city aver, city aver, hIgh
INV I I1ONMPNIAl, TOTAL
NCIENTS
Ratio of night to 1.0 1.0-1.2 1.2-1.5 1.5-2.0 2.11* 10.0 2.0 8.0 day accident rates
Act: I fllWf *lntersection lighting warranted
GlX69Tll IC 11TFM
Ol'IIlJtTIONAI, 'lITIAl. =
i-NV! ltfl4M139lAl. 1sTl\l.
A(:cl mi-Ni 10T,\l.
Sill = laliNiS
W,%IIRJV4TIN; CINDITION = 7poiuits

29
TABLE 15
CLASSIFICATION FOR. CONTROLLED-ACCESS FACILITY (FREEWAY) LIGHTING
CLA.SSIFICAU ON FACTOR - -
1 _ 2 - RATING _3__ 4 5
I3&IT LIG4TED WEIG{T IE14T
_(A) (B)
SCURE 01FF. IRATING (A-B)x(A-B)I
GE(TRIC _FACTORS
No. of Lanes 4 6 1.0 0.8 0.2
Lane Width '12' 12' 11' 10' <9' 3.0 2.5 0.5
Median Width '40' 24-39' 12-23' 4-I1' 0-3' 1.0 0.5 0.5
Shoulders 10' 8' 6' 4' 0' 1.0 0.5 0.5
Slopes <8:1 6:1 4:1 3:1 2:1 1.0 0.5 0.5
Curves 0-1/2° 1/2-1° 1-2° 2-3° 3-4° 13.0 5.0 8.0
Grades 3% 3-3.9% 4-4.9% 5-6.9% '7% 3.2 2.8 0.4,
Interchange Freq. 4 ci. 3 mi. 2 ci. 1 ci. 1 ml. 4.0 1.0 3.0
Gal'IITrRIc TOTAL
OPERATIONAL FACTORS
Level of Service A R C I) U 6.0 1.0 5.0 (any dark hour)
OPERATIONAL TOTAL
EI4VI R1'U4TAL FNTORS
Development 0% 25% 50% 75% 100% 3.5 0.5 3.0
Offset to Develop 200.' 150' 100' 50' 50' 3.5 0.5 3.0
114V1 I8Thfl4TAL TOTAL
ACC IW4TS
Ratio of night 1.0 1-1.2 1.2-1.5 1.5-2.0 2.0* 10.0 2.0 8.0 to day accident rates
*Continuous lighting warranted . . ACCIDt29T TOTAL
G1l4)7RTC TOTAL
OPERATIONAL 1571AL =
E74VIRON?434TAL TOTAl, =
ACCIDFI4T TOTAL =
51)1= mINTS
WARRANTING CX14DITION = 95 points
have been given the rating of 5. Uniform distribution has been used to assign ratings of 3 and 4.
Median Openings.-The control of access reduces the probability of accidents occurring between through and turning vehicles. As the number of access points is in-creased, the possibility of conflict increases; therefore, there is a greater need for lighting. Two-way noncontrolled-access streets with median openings at 1,000-ft or greater intervals, and one-way streets, have nearly ideal operation for this condition and therefore are given a rating of I. A block spacing of 500 ft (i.e., about ten openings per mile) is considered to be about the minimum condition for ac-ceptable street operation and has been assigned a rating of 3. A spacing of 300 ft or less between openings, or a
situation with no separator and two-way operation, results in a low quality of street operation. This condition has been given a rating of 5, as a good view of the vehicle maneuvers ahead is critical to safe and efficient vehicle operation. Also, the observed accident rate increases ra-ther slowly up to 15 openings per mile and a great deal more rapidly thereafter (25).
Curb Cuts.-The number and length of curb cuts deter-mine the number of vehicle maneuver points available and the degree of operational complexity on noncontrolled-access streets. Less than 10 percent curb openings will not substantially impair traffic operation; therefore, an ideal rating of 1 seems appropriate. When curb openings ap-proach 50 percent, the complexity of operation is critical;
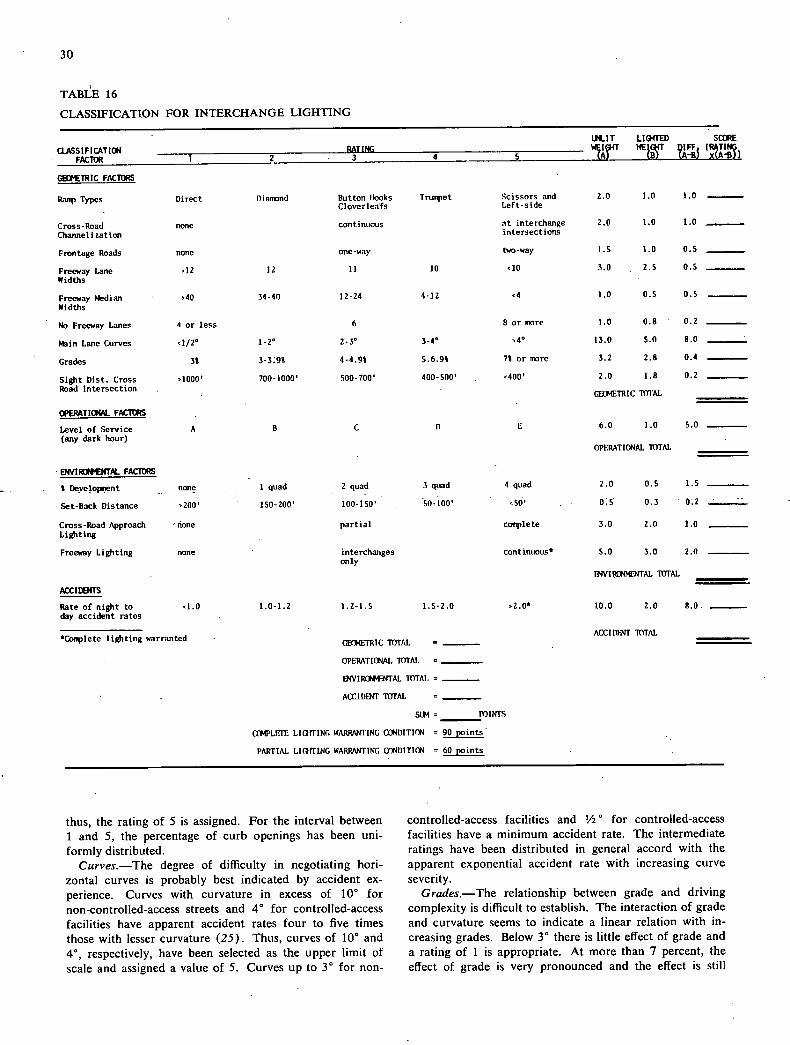
30
TABLE 16
CLASSIFICATION FOR INTERCHANGE LIGHTING
LNJT UGfTED SCORE
CLASSIFICATION RATING WI1T WE{T
1 2 3 01FF IRAT
FACTOR
ING 4 5 (A) (B) (ABi x(A'B) I
GEC8'ETRIC FAC1URS
Ramp Types Direct fliamond Button hooks Tnnnpet Scissors and 2.0 1.0 1.0 Cloverleaf's Left-side
Cross-Road none continuous at interchange 2.0 1.0 1.0
Channell zation intersections
Frontage Roads none one-way two-way 1.5 1.0 0.5
Freeway Lane '12 12 11 10 olO 3.0 2.5 0.5
Widths
Freeway Median o40 34-40 12-24 4-12 4 1.0 0.5 0.5
Widths
No Freeway Lanes 4 or less 6 8 or more 1.0 0.8 0.2
Mein Lane Curves '1/2° 1-2° 2-3° 340 140 13.0 5.0 8.0
Grades 3% 3-3.9% 4-4.9% 5.6.9% 71 or more 3.2 2.8 0.4
Sight 01st. Cross '1000' 7001000' 500-700' 400-500' '400' 2.0 1.8 0,2
Road Intersection GF1ETR!C 1U1'AL
OPERATIONAL. FACTORS
Level of Service A B C 0 Ii 6.0 1.0 5.0
(any dark hour) OPERATIONAL TOTAL
DfYIII'UlT_ FAcTORS
% Development - none -- 1 quad 2 quad 3 quad 4 quad 2.0 0.5 1.5
Set-Back Distance '200' 150-200' 100-150' 50-100' S0' 05 0.3 0.2
Cross-Road Approach 'none partial coqilete 3.0 2.0 1.0 Lighting
Freeway Lighting none interchanges continuous* 5.0 3.0 2.0 only
-. I3fVI 1B*4SINTAL TOTAL
ACCIIIffS
Rate of night to '1.0 1.0-1.2 1.2-1.5 1.5-2.0 ,2.0* 10.0 2.0 8.0 day accident rates
*Q,1ete lighting warrantedACCII)I-NT TOTAL
OPERATIONAL TOTAL
ENVIIB8'RTAL TOTAl.
ACCIDII4T 'IUFAL =
SUM = POINTS
(X4PLETE LIQITINC. WARRANTING CtI4DITION = 90 points
PARTIAL LIQITING WARRANTING O1NOITION = 60 points
thus, the rating of 5 is assigned. For the interval between 1 and 5, the percentage of curb openings has been uni-formly distributed.
Curves.-The degree of difficulty in negotiating hori-zontal curves is probably best indicated by accident ex-perience. Curves with curvature in excess of 100 for non-controlled-access streets and 4° for controlled-access facilities have apparent accident rates four to five times those with lesser curvature (25). Thus, curves of 10° and 4°, respectively, have been selected as the upper limit of scale and assigned a value of 5. Curves up to 3° for non-
controlled-access facilities and 1/2 ' for controlled-access facilities have a minimum accident rate. The intermediate ratings have been distributed in general accord with the apparent exponential accident rate with increasing curve severity.
Grades.-The relationship between grade and driving complexity is difficult to establish. The interaction of grade and curvature seems to indicate a linear relation with in-creasing grades. Below 3° there is little effect of grade and a rating of 1 is appropriate. At more than 7 percent, the effect of grade is very pronounced and the effect is still

31
appreciable on grades of more than 5 percent. Thus, 5 per-
cent was established as the upper bound of the minimum value and is assigned a rating of 3. The remaining gaps were distributed uniformly.
Sight Distance.—The operating speeds on arterial streets and the expected occurrence of conflicts reduce the need for extended sight distance. A sight distance of less than 200 ft would certainly be critical; greater than 700 ft would undoubtedly provide greater information than the driver could effectively use. These two extremes were assigned ratings of 1 and 5, respectively, and the ranges between these extremes have been distributed in a uniform manner. For controlled-access conditions, where higher speeds and less frequent expected conflicts exist, a sight distance of 400 ft has been assigned the critical rating, with 1,000 ft as the ideal. These two extremes were assigned ratings of 1 and 5, respectively, and the ranges between these ex-tremes have been distributed in a uniform manner.
Channelization.—From a geometric standpoint, chan-nelization at intersections and cross-road channelization at interchanges introduces visual task problems for the driver. The less frequent the channelization, the fewer visual task problems will be encountered. Thus, intersections with no channelization have been given the ideal rating of 1, whereas complete channelization on all approaches has been given the rating of 5. Uniform distribution has been used for the ranges between. For cross roads at inter-changes, the intersections without channelization have been rated at I. Continuous channelization of the crossroad has been given the middle rating of 3. Channelization at the interchange intersections only has been rated at 5. This was done to account for the unexpected occurrence of channelization after driving in an area with no chan-nelization.
Median Wjdth.—Median width has been included from the geometric standpoint on controlled-access facilities to describe the level of comfort associated with opposing vehicle separation. A separation of 40 ft or more is suffi-cient to eliminate interaction between opopsing vehicles and has been assigned the rating of I. Median widths of less than 4 ft represent the most undesirable condition, rated at 5. Relative uniform distribution has been used for the ranges between.
Parking.—The effect of parking on the need for lighting is directly related to the parking condition on the facility. Five basic conditions were identified and assigned to the rating scale, as follows:
PARKING RATING
CONDITION
Prohibited both sides 1 Loading zones only 2 Off-peak parking permitted 3 Parking permitted, one side 4 Parking permitted, both sides 5
Shoulders.—Although parking is prohibited on controlled-access facilities, there often are emergency situations where vehicles must take refuge adjacent to the through traffic lanes. For this reason shoulders or other areas of refuge are important. The absolute minimum shoulder width that can accommodate a stopped vehicle is approximately 6 ft, and this value has been given the rating of 3. An ideal situation would be 10 ft, assigned the rating of 1. The absence of shoulders represents an absolute critical condi-tion, assigned the value of 5.
Slopes.—For the high-speed operation of controlled-access facilities, it is desirable to provide gentle slopes for errant vehicles. Slopes of 4: 1 have been generally ac-cepted as the desirable minimum and thus have been assigned the rating of 3. Slopes of 2:1 have been accepted as the absolute maximum, assigned the value of 5. The ideal rating of 1 has been given to slopes of 8: 1 or greater, the current accepted desirable slope.
Interchanges.—Interchange frequency has been included in geometric conditions for controlled-access facilities to represent the geometric design problems that usually result when interchange spacings are close. It is desirable to have at least two miles between interchanges to develop accelera-tion and deceleration lanes and gentle vertical profiles. This spacing has been rated 3. Any spacing closer than one mile does not provide adequate distance for good geometric developmeit. Thus, spacings closer than one mile have been assigned the rating of 5. The ideal rating of 1 has been assigned to spacings of four miles on an arbitrary basis, but considering that this spacing is possible only in rural areas.
Ramp Types.—This category is included to represent the complexity of various ramp types. The most difficult of all ramp types to negotiate are the scissors and left-side exits. These have been rated at 5. The next most difficult are the trumpet ramps, rated at 4. Button-hook ramps and clover-leafs have been rated at 3, and diamond connections at 2. Direct connections have been given the 1 rating.
Frontage Roads.—The presence or absence of frontage roads on controlled-access facilities determines to a large extent the geometric design of ramps and the extent of activity adjacent to the facility. Two-way frontage roads are the most complex and have been rated at 5. Freeways without frontage roads preclude the problem and thus are rated at 1. One-way frontage roads have been rated at 3.
Operational Factors
Signals.—The presence or absence of traffic signals at major intersections is a major determinant in the need for external illumination. The lack of target value of signs increases the need for identification of the intersection area as well as decreasing the degree of difficulty of the track-ing task, thus permitting greater concentration on the operational situation. The descriptors represent the broad spectrum of conditions that exist on noncontrolled-access facilities.
Left-Turn Lane and Signal.—The presence or absence of a left-turn lane and protected signal phase are important contributors to smooth and efficient operation. When these

32
facilities are not provided, the identification of turning ve-hicles becomes a critical part of the night driving environ-ment. Again, lighting can do little to correct the basic problem except to reduce the complexity of the driving task on the approaches to the critical intersection. As the fre-qtiency of these critical intersections increases, the need also increases for a reduction in driving task difficulty to provide more time for concentration on other elements of the task. The descriptor reflects this need.
Median Width.—An increase in the width of the median increases operational efficiency on noncontrolled-access fa-cilities by reducing the effects of opposing headlights and providing an area to "shadow" turning and crossing vehi-cles. The critical dimension for turning vehicles is 10 ft; for crossing vehicles, 20 ft. Thus, for a median width of 30 ft or more, few serious operational problems exist, and a rating of 1 has been assigned to this condition. A median less than 4 ft in width would provide no space to "shadow" vehicles and, accordingly, has been assigned a rating of 5. Widths in the range of 10 to 20 ft provide space to shadow turning vehicles but not crossing vehicles, a condition con-sidered to be a minimum in this analysis. The remaining ratings were assigned values in accordance with these two conditions. Median width has also been rated for con-trolled-access facilities based on reduction of headlight glare. A median width of 3 ft would provide for an aver-age lateral displacement between drivers of 10 ft, the most critical separation from an opposing glare standpoint. This width has been assigned the rating of 5. Median width of 12 to 23 ft represents a lateral separation determined as the borderline between comfort and discomfort, and thus has been assigned the value rating of 3. A median width of 40 ft provides for no discomfort from opposing headlights and has been assigned the rating of 1.
Operating Speed.—The speed of operation on non-controlled-access street systems is a primary determinant in evaluating the need for lighting. Most modern head-lights will provide sight distance for safe operation up to 40 mph. Certainly, operating speeds in excess of this must be considered critical, as the use of high beams would be substantially restricted by the interference with opposing vehicles. A speed slightly below the critical value, say 35 mph, should be considered a minimum to provide some margin for error. Below 25 mph, the headlights should provide sufficient advance warning. The speed range for 25 through 45 mph was allocated to the five ratings in 5-mph increments.
Pedestrian Traffic at Nigh t.—An increase in the number of pedestrians crossing the roadway during the hours of darkness increases the relative hazard of driving on the facility. Two hundred crossings per night appeared to be sufficient to justify a rating of 5; no pedestrians would be the ideal condition of 1. The intermediate values were uniformly distributed between these two extremes.
Channelization.—The type of channelization and signal control at an intersection determines the smoothness of operation within the intersection. Five descriptors have been developed to represent this operation. Left- and right-turn lanes with signal control have been rated at 1. No
channelization or control received the rating of 5. The remaining descriptors were assigned to the intermediate values.
Level of Service.—Level of service is a method of de-scribing operations on controlled-access facilities and inter-sections. Level of service may range from A to F, with A representing ideal conditions. This level has been as-signed the rating of 1. Levels of service E and F represent critical operations and, thus, have been assigned the value of 5. The intermediate ratings were assigned to levels of service B, C, and D.
Environ,nental Factors
Percent Developed Frontage—For noncontrolled-access fa-cilities, the percentage of the roadside that is developed affects the number and frequency of vehicle maneuver points. The location of service drives and the identifica-tion of vehicles entering or leaving the roadway are factors of considerable importance in the driving task. As the percentage of development increases, the need for addi-tional lighting also increases. The range from 0 to 100 per-cent development has been distributed over the rating range by subjective judgment. The value of 60 percent as the upper bound of the minimum condition (rating of 3) seems reasonable.
For control led-access facilities the ratings are basically the same, with the exception of interchange areas. For interchanges the team elected to describe the percent de-velopment in terms of the number of quadrants in the interchange that are developed. The rating of 1 has been assigned to the condition of no development and the rating of 5 to all four quadrants developed. Uniform assignment has been made to the remaining ratings.
Predominant Develop,nent.—The type of development that most nearly is compatible with noncontrolled-access street operation is undeveloped or backup-type residential development, assigned a rating of I. The type least com-patible with good operation is strip commercial or indus-trial development, assigned a rating of 5. The other descriptors represent the various levels between these two extremes.
Setback Distance.—The setback distance to the develop-ment also affects the type of operation and the degree of interference from the development. For setback distances of 50 ft or less, the operation of vehicles on adjacent property will be essentially parallel to the traffic stream; thus, identification of potentially conflicting vehicles is con-siderably more difficult. With increasing setback distances, the degree of control of the vehicle entering and leaving the parking area is increased. For setbacks greater than 200 ft, control of access to and from the adjacent areas is complete. The rating of this factor was uniformly dis-tributed between these two extremes.
Advertising or Area Lighting.—When large segments of the roadside are lighted, the roadway can become the dark-est portion of the driving environment. This factor must be included in the warranting conditions. When 40 per-cent or less of the roadside is lighted, the problem will not be critical; when roadside lighting goes beyond 60 percent

33
the problem is drastically increased. The variation from no roadside lighting to continuous roadside lighting can pro-duce serious visual problems in driving. This range has been subjectively rated from 1 to 5.
Raised-Curb Mcdian.—Raiscd-curb medians have been included as an environmental factor because of the serious interaction between environmental lighting and the transi-tion to the median section. The frequency of these transi-tion problems is represented in the 1 to 5 ratings.
Other Fixed Lighting.—Cross-road approach lighting and freeway lighting have been included in environmental fac-tors for interchanges. It appears reasonable that continu-ous lighting on cross-roadways or the freeway should con-tribute to warranting lighting of the interchange. Thus, these conditions have the rating of 5. No lighting of the cross-roadway and freeway has been rated as 1, with partial lighting rated at 3.
Crime Rate.—Reduction in crime rate is one of the often mentioned benefits of fixed roadway lighting on surface streets in downtown urban areas. It appeared desirable, therefore, to include crime rate as a warranting condition. A crime rate equal to the city average has been given the 3 rating. The continuum from 1 to 5 has been rated in relation to the city average. It is suggested that the police department be asked to rate a given facility on this basis for use by the lighting designer.
Accidents
The ratio of night-to-day accident rates has been a' tradi-tional measure of the need for roadway lighting. Acci-dent experience should be weighted heavily in any war-ranting scheme. The ideal condition would be a ratio of 1: 1; that is, the total accident rate at night is the same as the total accident rate under daylight conditions. Under normal conditions a ratio of 1.5:1 is not unusual and has, therefore, been assigned a rating of 3. A ratio of 2:1 or more is critical, and lighting should be considered as being warranted for this site. Other ratios have been uniformly assigned to the ratings. Accident rate should include all types and severity of accidents and be expressed in terms of accidents per million vehicle-miles.
Weighting of Factors
The professional research team was used to establish weighting factors for each of the classification elements for lighted and unlighted conditions. Decisions were based on the compilation of accident rate data presented in Traffic Control and Roadway Elements—Their Relation-ship to Highway Safety/Revised (25). Where data were not available, the team used a combination of collective judgment and the relative importance of other factors for which data were available.
Priorities
It was previously stated that the extent to which the war-ranting points exceed the minimum warranting points serves as the basis for setting priorities. Priorities should also be related to the number of people that benefit from a lighting improvement. Therefore, the warranting num-
ber for a given traffic facility (unlighted vs lighted condi-tions) represents the effectiveness that can be achieved through the provision of fixed lighting. Thus, a generalized model for setting priorities would be
P1= WXADTN (2)
in which
P1= priority index; W = warranting number for a given facility;
ADTN = night average daily traffic; and C = cost of the lighting improvement.
This generalized model is developed more fully in the later section on "Cost-Effectiveness."
DESIGN GUIDELINES FOR FIXED LIGHTING
This phase of the research dealt with a detailed review of the current (and proposed) guidelines and practices, and comparison of these guidelines with the needs of the visual environment determined in this research. Specifically, this comparison is made with the "American National Standard Practice for Roadway Lighting" (13) and AASHTO's An Informational Guide for Roadway Lighting (10).
Many effective changes have been made in the latest (1971) revision of the American National Standard Prac-tice for Roadway Lighting as compared to the 1963 edition. In the design section, a concise "design process," or an outline of the steps in lighting design, that should prove helpful to the designer, has been included. However, there is some concern that the design section may be over-shadowed by the technical information on luminaire dis-tribution and roadway classification presented prior to the design process. These should be supplemental and thus presented following the design process.
The first step in the design process is:
Determination from roadway classification and adjacent land use (area classification) of the quantity of light desired, in average horizontal footcandles.
This "step" is supplemented with basically the same sug-gestions as contained in the 1963 edition, as follows:
It is important that roadway lighting be planned on the basis of traffic information, which includes the factors necessary to provide traffic safety and pedestrian security. Some of the factors applicable to the specific problem which are to be carefully evaluated are:
Type of land-use development (area classifica-tion) abutting the roadway or walkway. Type of route (roadway or walkway classifica-tion). Traffic accident experience. Street crime experience and security. Roadway construction features:
Width of pavement or number of traffic lanes. Character of pavement surface. Grades and curves. Location and width of curbs, sidewalks, and shoulders. Type and location of very high-volume driveways. Width and location of dividing and safety islands with channelizing curbs.

34
Intersections and interchanges. Underpasses and overpasses.
To this extent, the guideline makes mention of several pertinent traffic considerations, but there is no direction as to how these are to be scaled. There is the implication that roadway lighting serves the basic purpose of traffic safety (prevention of accidents), whereas this research effort has demonstrated the informational aspects of light-ing. It is logical that improvement in the communication system will improve efficiency of traffic operation, and traffic safety is a by-product of efficiency.
Constructively, the roadway classification system should be formulated as shown previously under "Warrants and Priorities" so that the important geometric, operational, and environmental parameters may be scaled or otherwise quantitatively considered. This classification scheme will facilitate the selection of lighting levels, considering a combination of quantitative and qualitative measures of factors relating to the character of the roadway, the traffic, and the informational system.
Illumination Levels
The recommended illumination levels included in the American National Standard Practice for Roadway Light-ing (1972) do not differ greatly from the 1963 edition. The new recommendations. are as given in Table 17, as described in the new classification scheme as follows:
1. CLASSIFICATION OF ROADWAYS AND AREAS
1.1 Roadway and Walkway Classifications. Major—The part of the roadway system that
serves as the principal network for through traffic flow. The routes connect areas of principal traffic generation and important rural highways entering the city.
Collector—The distributor and collector road-ways serving traffic between major and local roadways. These are roadways used mainly for traffic movements within residential, commercial and industrial areas.
Local—Roadways used primarily for direct ac-cess to residential, commercial, industrial, or other abut-.
TABLE 17
RECOMMENDATION FOR AVERAGE MAINTAINED HORIZONTAL ILLUMINATION
FOOTCANDLES (Lux) FOR
AREA CLASSIFIED AS
COMMER- INTERME- RESIDEN- CLASSIFICATION CIAL DIATE TIAL
Vehicular roadways: Freeway' 0.6 (6) 0.6 (6) 0.6 (6) Major and express-
way" 2.0 (22) 1.4 (15) 1.0 (11) Collector 1.2( 13) 0.9 (10) 0.6 (6) Local 0.9 (10) 0.6 (6) 0.4 (4) Alleys 0.6 (6) 0.4 (4) 0.2 (2)
Pedestrian walkways: Sidewalks 0.9 (10) 0.6 (6) 0.2 (2) Pedestrianways 2.0 (22) 1.0 (11) 0.5 (5)
Both mainline and ramps.
ting property. They do not include roadways carrying through traffic. Long local roadways will generally be divided into short sections by collector roadway systems.
Expressway—A divided major arterial highway for through traffic with full or partial control of access and generally with interchanges at major crossroads. Expressways for noncommercial traffic within parks and park-like areas are generally known as parkways.
Freeway—A divided major highway with full control of access and with no crossings at grade.
Alley—A narrow public way within a block, gen-erally used for vehicular access to the rear of abutting properties.
Sidewalks—Paved or otherwise improved areas for pedestrian use, located within public street rights-of-way which also contain roadways for vehicular traffic.
Pedestrian Ways—Public sidewalks for pedes-trian traffic generally not within rights-of-way for ve-hicular traffic roadways. Included are skywalks (pedes-trian overpasses), subwalks (pedestrian tunnels), walkways giving access to park or block interiors, and crossings near centers of long blocks.
1.2 Area Classifications.
Commercial—That portion of a municipality in a business development where ordinarily there are large numbers of pedestrians and a heavy demand for parking space during periods of peak traffic or a sustained high pedestrian volume and a continuously heavy demand for off-street parking space during business hours. This defi-nition applies to densely developed business areas out-side of, as well as those that are within, the central part of a municipality.
Intermediate—That portion of a municipality which is outside of a downtown area but generally within the zone of influence of a business or industrial development, characterized often by moderately heavy nighttime pedestrian traffic and a somewhat lower park-ing turnover than is found in a commercial area. This definition includes densely developed apartment areas, hospitals, public libraries, and neighborhood recreational centers.
Residential—A residential development, or a mix-ture of residential and commercial establishments, char-acterized by few pedestrians and a low parking demand or turnover at night. This definition includes areas with single-family homes, townhouses, and/or small apartments. Regional parks, cemeteries, and vacant lands are also included.
Although this classification scheme is more specific than that presented in the 1963 edition, it lacks a direct relation-ship to the effects of roadway, traffic, and environmental conditions.
It is believed that a more specific relationship between illumination levels and roadway classification and the modi-fying conditions can be achieved by using the classification system presented previously in this report. It is suggested that basic illumination levels be established for the various types of roadways and a scaling system be devised to in-crease the illumination level based on the modifying con-ditions. Logically these basic illumination levels would be the same as those presented for the residential area in the American National Standard Practice for Roadway Light- ing (1971), as given in Table 18. These are considered to be the basic values, because they normally represent a minimum of the modifying conditions (roadway, traffic, and especially environmental conditions).

35
The adjustment of the minimum values upward to com-pensate for existing conditions would be accomplished on the basis of a detailed study of those conditions on the roadway in question. The study guide is based on the previous classification scheme, in which the illumination level for a particular roadway is determined by comparing the rating of the roadway in question to the rating of the minimum conditions that justify lighting. This minimum condition was established by rating the facility classifica-tion to minimum or average conditions in the four classi-fication categories. Therefore, the base rating is 85 for continuous arterial lighting and illumination levels would be increased by the ratio
Warranting points for facility (3
Basic rating of 85
For example, consider an old major arterial through a highly developed area with high traffic density and high speeds, which may have 127 total warranting points. By using this value and the base value of 85, the required il-
lumination level may be computed as 127
(1.0) = 1.55 hfc. 85
Another important factor in establishing an illumination level for a given facility is the pavement reflectance. It is well recognized from the literature and lighting practices that pavement condition determines the actual luminance patterns for a given lighting system. Therefore, road-surface luminance provides the most accurate measure of the effective light in a lighting system. This is acknowl-edged by some lighting codes, which usually specify two illumination values for the same classification of facility—one for a "light" road surface and another for a "dark" surface. Other codes specify one illumination value and prescribe a suitable increase in the specified value if the road surface under consideration is dark.
The International Recommendations for the Lighting of Public Thoroughfares (26) gives approximate ratios of the average road-surface luminance in cd/rn2 to the average illumination in lux. These ratios are 0.06 (dark surfaces) and 0.11 (light surfaces) for semi-cut-off lighting units, the most predominantly used in U.S. lighting practice. These values, when converted to ratios of road-surface luminance in footlamberts to average illumination in footcandles, are 0.19 and 0.36, respectively, for dark and light pavements.
These factors can be applied to the design level of il-lumination to compensate for pavement surface properties. A pavement classification scheme similar to that for pre-vious traffic facility classifications can be used, as follows:
EX-
TREMELY ABOVE BELOW
LIGHT AVERAGE AVERAGE AVERAGE EXTREMELY
PAVE- PAVE- PAVE- PAVE- DARK
MENT MENT MENT MENT PAVEMENT
1 2 3 4 5 (0.34) (0.31) (0.27) (0.23) (0.19)
TABLE 18
RECOMMENDATIONS FOR AVERAGE MAINTAINED HORIZONTAL ILLUMINATION
FOOT- ROADWAY CLASS CANDLES (Lux)
Freeways, including major interchanges 0.6 (6.0) Primary arterials, expressways, major
highways 1.0 (11.0) Secondary arterials, major collectors,
secondary highways 0.6 (6.0) Minor collectors, minor commercial
roads 0.4 (4.0) Local roads, streets, alleys 0.2 (2.0)
By assigning a unit value to the average pavement condi-tion, a weighted multiplier for each of the five pavement classifications can be established, as follows:
EX-
TREMELY ABOVE
LIGHT AVERAGE AVERAGE BELOW EXTREMELY
PAVE- PAVE- PAVE- AVERAGE DARK
MENT MENT MENT PAVEMENT PAVEMENT
0.80 0.90 1.0 1.2 1.4
To use the multiplier, the illumination value determined previously and adjusted for geometric, operational, and environmental conditions is then corrected by use of the multiplier. For example, in previous paragraphs a value of 1.55 horizontal footcandles was determined. This value is for average pavement conditions. For extremely dark pavements this value would be increased by the factor 1.4, or the required illumination would be (1.55)(1.4) 2.17 hor. ft-cd. It is suggested that the required level of il-himination as determined in this process be rounded up to the nearest 0.10 hor. ft-cd (2.20 in this case).
There is no doubt that this scheme represents a simplifi-cation of pavement luminance, but it appears to be reason-ably responsive to the factors that relate significantly to the informational needs of the driver. This is sufficient, con-sidering the lighting designer has little control over pave-ment reflectance.
At some point, consideration should be given to con-trolling and/or providing sufficient light in the border areas. Because a distance of 30 ft from the traveled way has been established as a width of frequent excursions from the road-way, it is recommended that an illumination level of not less than 1Ao the design level be provided within 30 ft of the pavement edge, at a uniformity of 3 to 1.
Uniformity
Uniformity of light distribution has proven to be at least equally as valuable as the illumination level in providing a satisfactory night-driving environment. The Standard

36
Practice recommends an average-to-minimum ratio of 3: 1, whereas AASHTO specifies 3: 1 or 4: 1. The 3: 1 values are acceptable for normal street and roadway lighting, but it would be desirable to reduce this value to 2:1 for high-mast area lighting applications in interchange areas (27).
Luminaire Mounting Height
The new standard practice, as well as the AASHTO Guide, recognizes the value of increased mounting heights (40 to 60 ft) with the advent of larger and more efficient light sources. It is pointed out that higher mounting heights may reduce glare, depending on the light distribution from the luminaire.
High-mast lighting is recognized as having several ad-vantages at interchanges and other sites where area lighting is appropriate. Among the advantages are fewer poles, possible lower over-all system cost, increased safety, and increased comfort through improved uniformity and re-duced disability veiling brightness (DVB).
A later section deals with the design practices recom-mended for high-mast lighting.
Luminaire Spacing and Location
Although there are a number of environmental and road-way factors that affect the spacing and location of lumi-naire supports, the spacing is mainly dependent on the basic design criteria, average intensity, and uniformity. Two basic approaches now being used in spacing deter-mination are a design standards approach and a computa-tional approach. In the design standards approach the design agency establishes typical spacings of specific lumi-naire types for various design applications, based on pre-vious experience or testing. This approach is given in Table 19. These standard spacings are applied generally, and adjustments to fit roadway conditions are generally checked using a plastic overlay iso-footcandle curve to ensure adequate light coverage.
The design standards approach must be well supported by job specifications that require a specific distribution of light on a section of the roadway equal to the spacing of luminaires. Further, a positive sampling and testing pro-cedure must be established to ensure that the equipment meets the specifications.
The computational approach is well documented in the 1963 Standard Practice, and remains unchanged in the proposed revision. The basic formula for this approach is
Average illumination = LL X CU x LMF(4)
(footcandles) S >( W
in which
LL = Lamp lumens at replacement time; CU = Coefficient of utilization (the percentage that
can be utilized on the 'specified roadway using a given luminaire);
LMF = Luminaire Maintenance Factor (percentage of initial light output remaining after depreciation because of dirt accumulation and deteriora-tion);
TABLE 19
TYPICAL DESIGN STANDARDS FOR FREEWAY-TYPE FACILITIES, MEDIAN OR HOUSE-SIDE ARRANGEMENT
MOUNT- ING SPAC-
NO. OF LIGHT TYPE OF 1-IEIGHT INC LANES SOURCE LUMINAIRE (FT) (FT)
4 400 W MV Type II, me- dium dis- tribution 40 200
6 to 10 1000W MV Type III, me- dium dis- tribution 50 250
S = Luminaire spacing, in feet; and W = Width of street, in feet.
In some areas, other correction factors, such as tem-perature factors, may be included.
The uniformity of illumination is computed from data taken from an iso-footcandle diagram for a given type of I u m i nai re.
The computational procedure is a rational approach to design, but its rationality is dependent on the reliability of input data: specifically, the coefficient of utilization and the iso-footcandle diagram. Sometimes utilization curves and iso-footcandle diagrams are typical curves for a given IES-type luminaire. In other cases, the photometric data used in preparation of these data sources are collected by the manufacturer under well-controlled laboratory condi-tions. Allowances are not made for the loss in control of conditions when the equipment is placed in general service.
More realistic design data can be achieved by develop-ing utilization curves and iso-footcandle diagrams from actual field installations or full-scale field laboratory test-ing. In any case, a lighting project should have specific performance criteria supported by a testing program to ensure job quality.
Luminaire Location
The location of luminaires with respect to the roadway has been given considerable attention in both the Standard Practice and the AASHTO Guide. Emphasis is placed on the need to place the support as far from the travel lanes as is practicable. Further, it is recognized that most lumi-naires perform better when they are not mounted over the roadway; the uniformity of illumination is improved and glare is reduced when the luminaire is mounted at the edge of the lane or over the shoulder.
Both design guides recognize the value in location and base design of luminaire supports to reduce the probability of collision, and to reduce the severity of impact when a collision does occur. Most sources of information recognize the need for breakaway support bases when vehicle operat-ing speeds exceed 30 mph.

Design of High-Mast Lighting
Neither the Standard Practice nor the AASHTO Guide pro-vide any detail in the guidelines for design of high-mast lighting, but a design procedure is presented by Rowan and Walton (27). This procedure, however, is based largely on the use of iso-footcandle curves produced from field lab-oratory tests and judgment or experience. Considerably more rationale is contained in the procedure described in this section.
Illumination Levels
The Standard Practice and the AASHTO Guide do not specify illumination levels for interchanges other than for the freeway in general, except that the Standard Practice states:
Intersecting, converging, or diverging roadway areas re-quire higher illumination. The illumination within these areas should at least be equal to the sum of the values recommended for each roadway which forms the intersection.
This guide does not take into consideration the design and operational conditions; therefore, it is considered more ap-propriate that the illumination level for interchanges be determined on the basis of the rating scheme previously presented for interchanges.
Achieving a specified illumination level is a function of mounting height, type of light source, type of luminaire or floodlight, and number of luminaires or floodlights in a system (system refers to the assembly on a single mast). It is possible to estimate a trial number of units in a sys-tem by a computational process involving total lamp lu-mens, a coefficient of luminaire efficiency, and the area to be covered, but experience is extremely valuable in this process. In any case, the designer will likely determine by trial and error the number of units required to provide a given illumination level.
Location and Spacing of Masts
Preliminary spacing of masts in the interchange area should be made on a maximum spacing-to-mounting height ratio of 5: 1 if the objective is to achieve the same cut-off charac-teristics that are achieved using medium distribution lu-minaires in continuous lighting. Adjustments to spacing should be made on the basis of location criteria and com-putational procedures of illumination by the point-by-point method discussed later.
Certain considerations must be recognized in the location of masts in order to achieve the greatest effectiveness from the lighting system, as follows:
Masts should be located so that the driver's line of sight is not directly toward the light source in the range of 1,500 ft to two mounting heights from the source. Pref-erably, the line of sight would not be above the lower third-point of the mast while the line of sight is within 10° either side of the mast.
Masts should be located so that the light source will not at any time be in the direct line of sight with signs,
37
90°
4000 80°
6000 70°
3 0 0. S 0
12000 60°
0
16000
20000
50°
0° 100 20° 30° 40° Angle from Vertical
Figure 2. Typical candlepower distribution curve.
especially overhead signs, and other visual communication media.
Masts should not be placed at the end of long tangents or in other vulnerable locations where there is an appre-ciable probability of collision. If such a location is neces sary, adequate impact attenuation should be provided.
Masts are desirably located such that the highest lo-calized levels of illumination fall in the traffic conflict areas, such as ramp terminals. Otherwise, masts should be lo-cated a sufficient distance from the roadway to position the greatest uniformity of illumination on the pavement surface. This is done using plastic overlays of iso-footcandle curves of the light units to be used. This will normally result in the masts being placed a sufficient distance from the roadway to virtually eliminate the probability of collision.
Illumination Computational Procedures
Following the preliminary location and spacing of masts and the initial selection, of the number of units on each mast, it is necessary to check the distribution of illumina-tion against the established criteria. The most rational ap-proach to this check process is by computation of illumi-nation using a point-by-point procedure. To facilitate computations, the entire interchange area is superimposed with grid lines; intervals of 25 ft are desirable if a com-puter is used, whereas 50-ft intervals are more appropriate for hand calculations.
The point-by-point computation process uses a candle-power distribution curve (Fig. 2). Such curves normally are developed for single-unit Type V luminaires, in which case they must be multiplied by the number of luminaires in the system. Such a curve can be developed for all sym-metrical high-mast systems, whether they are made up of Type V units or individual floodlights arranged in a sym-metrical pattern.
The illumination in horizontal footcandles at a grid point
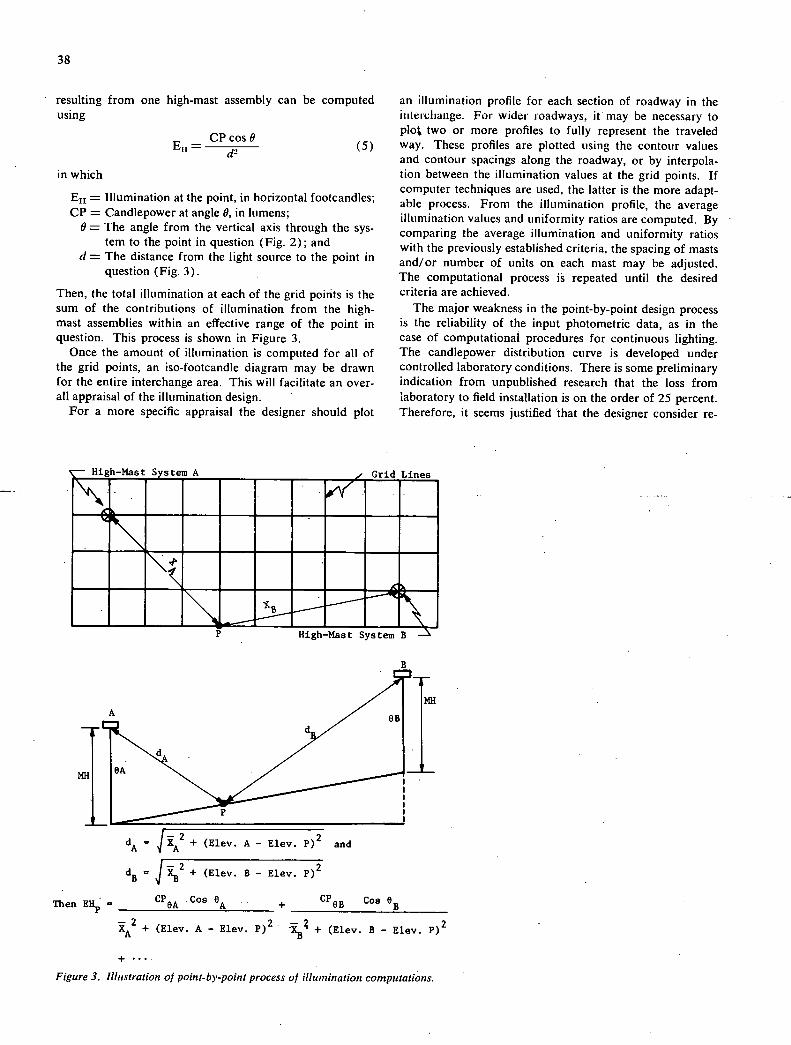
38
resulting from one high-mast assembly can be computed using
CP cos 0 E11 = d2
in which
E11 = Illumination at the point, in horizontal footcandles; CP = Candlepower at angle 0, in lumens;
0 = The angle from the vertical axis through the sys- tem to the point in question (Fig. 2); and
d = The distance from the light source to the point in question (Fig. 3).
Then, the total illumination at each of the grid points is the sum of the contributions of illumination from the high-mast assemblies within an effective range of the point in question. This process is shown in Figure 3.
Once the amount of illumination is computed for all of the grid points, an iso-footcandle diagram may be drawn for the entire interchange area. This will facilitate an over-all appraisal of the illumination design.
For a more specific appraisal the designer should plot
an illumination profile for each section of roadway in the interchange. For widet roadways, it may be necessary to plot two or more profiles to fully represent the traveled way. These profiles are plotted using the contour values and contour spacings along the roadway, or by interpola-tion between the illumination values at the grid points. If computer techniques are used, the latter is the more adapt-able process. From the illumination profile, the average illumination values and uniformity ratios are computed. By comparing the average illumination and uniformity ratios with the previously established criteria, the spacing of masts and/or number of units on each mast may be adjusted. The computational process is repeated until the desired criteria are achieved.
The major weakness in the point-by-point design process is the reliability of the input photometric data, as in the case of computational procedures for continuous lighting. The candlepower distribution curve is developed under controlled laboratory conditions. There is some preliminary indication from unpublished research that the loss from laboratory to field installation is on the order of 25 percent. Therefore, it seems justified that the designer consider re-
(5)
A ,- Grid Lines
01E A r1l SIM MEN
10110110010001010
0 E60 M__ . OW m WW__ W-0 0 k, m
dA = IXA + (Elev. A - Elev. P)2 and
dB =jXB 2 + (Elev. B - Elev. P)2
Then EE = CPOA .Cos 8A + CP8B Co8 8
+ (Elev. A - Elev. P)2 . + (Elev. B - Elev. P)2
+....
Figure 3. illustration of point-by-point process of illumination computations.

39
ducing the candlepower values by 25 percent unless there is evidence that he can be assured of achieving the light output indicated by the candlepower distribution curve.
COST-EFFECTIVENESS
The purpose of this section is to discuss and analyze the role of cost-effectiveness in (a) establishing the need for fixed roadway lighting, (b) setting priorities for fixed light-ing projects, and (c) evaluating alternative designs of lighting.
A state-of-the-art review was made with respect to dif-ferent methods of economic analysis that could be used in determining needs, choosing lighting designs, and setting priorities. These methods were: the cost-effectiveness method, the cost-of-time method, the benefit-cost method, the rate-of-return method, and the total-transportation-cost method. All except the cost-effectiveness method use mone-tary evaluations of effectiveness and could be used to es-tablish needs, determine best designs, and set priorities, if lighting effectiveness could be measured in dollar terms. Lighting needs would be defined as all projects that give more benefits than they cost. The choice of best designs and priorities would be determined simultaneously by choosing those projects and project increments that maxi-mized the net dollar benefit from lighting.
Unfortunately, it is not possible, with the current state of the art, even to measure in physical units the effects on motorists of different types and degrees of lighting in dif-ferent situations, much less to measure the value of changes in these physical units in dollar terms. Therefore, it was decided that the current state of the art limits economic analysis to the cost-effectiveness method employing the equal-cost or equal-effectiveness criteria, and augmented by
the decision-maker's judgment. Cost-effectiveness analysis can be used to help choose the
preferred lighting design for different situations in which lighting is warranted. It cannot be used to determine light-ing needs, even though information developed in the proc-ess of choosing designs and setting priorities should help the decision-maker become better aware of lighting needs.
Cost-effectiveness analysis also can be used to help set priorities; the recommended cost-effectiveness method for
setting priorities is discussed in the next section of this chapter. The purpose of this section is to discuss how the cost-effectiveness method, together with judgment, can be used to select the preferred lighting design for different
situations that warrant lighting.
In general, the cost-effectiveness procedure recommended for selecting a design for a particular situation is as
follows:
Specify several lighting designs that give the desired
level of lighting effectiveness. (For a more complete opti-mization procedure, consider several levels of effectiveness.)
For each feasible lighting configuration, specify dif-ferent circuits that are feasible for that configuration. Esti-
mate the cost of each of these circuits and suboptimize by choosing the least costly circuit for each design. (It is also possible to further suboptimize by considering different
user-utility ownership arrangements for each circuit and to choose the least costly (or "best" in some other sense) ownership arrangement for each circuit; then compare these least costly ownership arrangements to obtain the least
costly circuit for each lighting configuration.
Summarize the effectiveness and cost for each feasi-ble lighting design in a table and, using this summarized information together with judgment, choose the "best"
design. (This "best" design, together with its effectiveness
and cost, is the design that is used in priority determina-
tions.)
The cost-effectiveness procedure recommended for com-
paring alternative designs uses procedures developed by
Cassel and Medville (28), and makes use of forms (Figs.
6, 7, 8) developed by them. Five forms are to be com-pleted for each warranted situation (e.g., each continuous section of roadway, interchange, intersection). Each spe-cific facility is assigned an Identification Number, which appears on each form corresponding to that facility.
Form 1 (Fig. 4) gives identifying characteristics and de-sign variables, and also has a space for identifying the "best" design, chosen at the completion of the analysis.
Form 2 (Fig. 5) is for summarizing the cost and effective-
ness of each feasible design; one line applies to each feasi-ble configuration, each assigned an identifying number. Form 3 (Fig. 6) summarizes the characteristics of each feasible configuration. Form 4 (Fig. 7) provides spaces
FORM
Identification Number:
SUMMARY
Facility location: Facility type: Road length: Road width(s): Number of lanes (n): Affected lane-miles (L): Design average daily traffic: Design night average daily traffic (ADTN): Warranted illumination level, ave. maintained foot-
candles (w): Calculated lighting effectiveness or total warranting
points (E): Multip!ier= (E X ADTN X L)/(n X w): Analysis period (years): Interest rate ( % ) Desired uniformity ratio(s):
Best Design
Configuration number: Priority index(es):
Annualcost: Ave. maintained footcandles: Uniformity ratio(s):
Figure 4. Su,n,nary form.

FORM 2
COST AND EFFECTIVENESS SUMMARY FORM
IDBTIFICATION NLIIBER:
ANNUAL (liST- EFFECrIVESS
(1) Configu- ration Niz-ber
(2) Circuil Number
(3) Initial Capital Cost
(4) Equiv- alent
b Capital
(5) Mainte- nance and Power
(6) Sub- total (4)+(5)
(7) Light Pole Acci- dent
(8) Total (6)+(7)
(9) Ave. Foot Cand.les Actual
I (10) Mm. Foot Candles
(F)
(11) Ave.! Mm Ratio (9)1(10)
___ Priority Indexd
(12) Multiplier x Col. (9) S Col. (6)
(13) Multiplier x Col. (9)
Col. (8)
1
2
3
4
5
6
7
8
9
10
11uIIu.leL uosen as oest ror given contigurations. bColun (3) multiplied by capital recovery factor for chosen analysis period and interest rate. CFor 'best ownership arrangement considered.
drxlultiplierll is taken from Form 1.
Figure 5. Cost and eflectiveness summary form.
C

FORM 3
ROADWAY LIGHTING CONFIGURATION SUMMARY FORM
IDENTIFICATION NLJER
Configu- ration Number
Lamp tharacterist[cs Pole Characteristics Light Distri- bution Type
Arrange- ment
Spacing (feet)
Illumination (footcandles)
Unifor-inity Ratio
Type ASA
Designation
Light Output
(lumens) Power
(watts)
4ounting Height (feet)
O.rer hand (feet)
Lumi- nair Type Average Minimi.nn
1
2
3
4
6
7
8
9
10
aHB = horizontal burning SE = standard enclosed
Figure 6. Roadway lighting con figuration summary form.
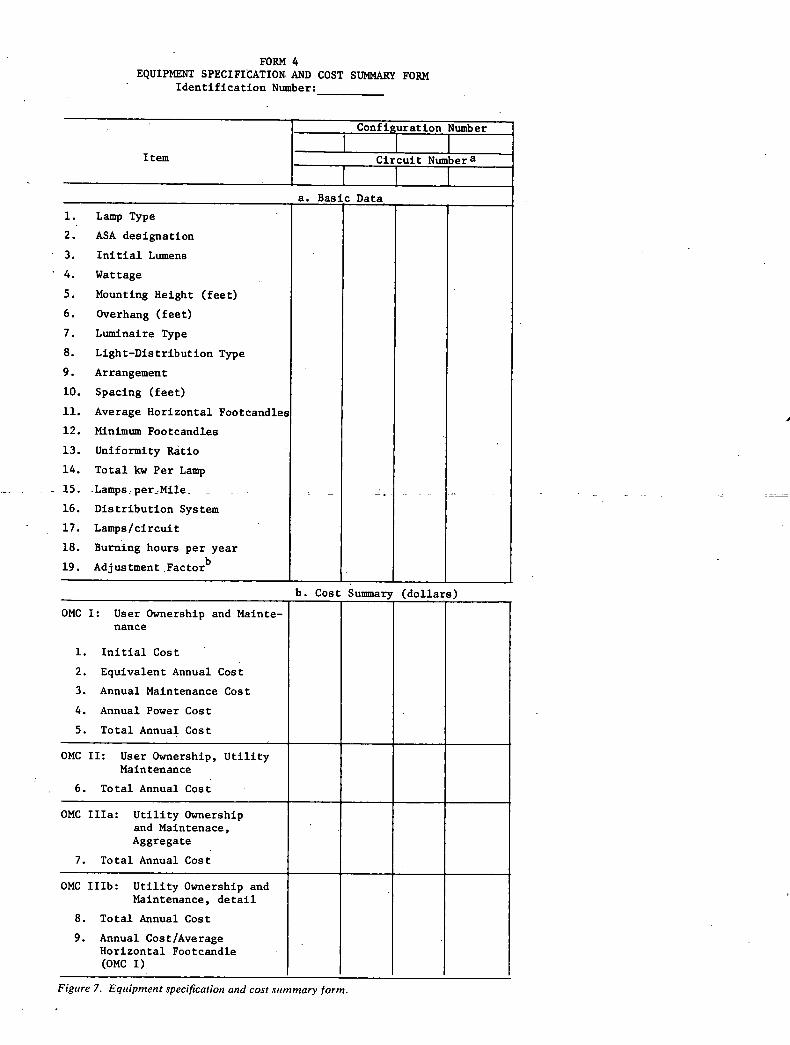
FORM 4 EQUIPMENT SPECIFICATION. AND COST SUMMARY FORM
Identification Number:___________
Configuration Number
Item Circuit Number a
a. Basic Data
Lamp Type
ASA designation
Initial Lumens
Wattage
Mounting Height (feet)
Overhang (feet)
Luminaire Type
Light-Distribution Type
Arrangement
Spacing (feet)
Average Horizontal Footcandles
Minimum Footcandles
Uniformity RAtio
Total kw Per Lamp
15.LampsperMile. -
Distribution System
Lamps/circuit
Burning hours per year
Adjustment Factorb
- b. Cost Summary (dollars)
OMC I: User Ownership and Mainte- nance
Initial Cost
Equivalent Annual Cost
Annual Maintenance Cost
Annual Power Cost
Total Annual Cost
OMC II: User Ownership, Utility Maintenance
Total Annual Cost
OMC lila: Utility Ownership and Maintenace, Aggregate
Total Annual Cost
OMC IlIb: Utility Ownership and Maintenance, detail
Total Annual Cost
Annual Cost/Average Horizontal Footcandle (OMC I)
Figure 7. Equipment specification and cost summary form.

c. Non-Distribution and Control
Pole:
Material
Arm Length (feet)
Wood Pole Bracket:
Material
Arm Length (feet)
Bracket Type
Slipfitter (inches)
Luminaire: -
Description
Ballast:
Des cription
d. Distribution and Control
1. Cable/conduit
Distribution
Type
Feet/Circuit
Connection
Type
Feet/Circuit
Pole
Type
Feet/Pole
2. Time Controls
Photoelectric control
and. receptacle
Time Switch
3. Transformers
Constant Current
Type
Primary Volts
Secondary Amps
KW Rating
Quantity/Circuit
Distribution
Low Voltage
High Voltage
KVA Rating V
Quantity/Circuit
Hanger Iron

44
I tern
d. Distribution and Control (nn-
4. Group—Control Equipment __________
Multiple Relay
Type
Quantity
Protective Relay
Type
Quantity
Remote-Control Oil Switch
Type
Quantity - Multiple Control Switch
Type
Quantity
Power-Factor-Correcting
Capacitor
Type
Quantity
Capacitor Mounting Brackets
Potential Transformer
Type
Quantity
Time-Delay-Lockout Relay
Type
Quantity
Fuse Cutout
Type
Quantity
Other (specify)
amere may be several circuits for each configuration number. bL /.l Lamps/circuit
Figure 7 (Continued)
for listing the equipment and cost of each circuit that is considered for each feasible configuration; each configura-tion may have one or more circuits. The cost summary information in section b of Form 4 (Fig. 7) is taken from Form 5 (Fig. 8), the detailed cost calculation form. A separate Form 5 is completed for each different circuit appearing in Form 4. (For a complete description of these
forms, for equipment and cost information, and for several example calculations, see Cassell and Medville [281.) Forms 4 and 5 are in terms of costs per mile of con-tinuous lighting, but can easily be modified to calculate the cost per facility; or, the cost per mile can be calculated and multiplied by the number of miles per facility. The use of these forms is discussed more fully in the following.
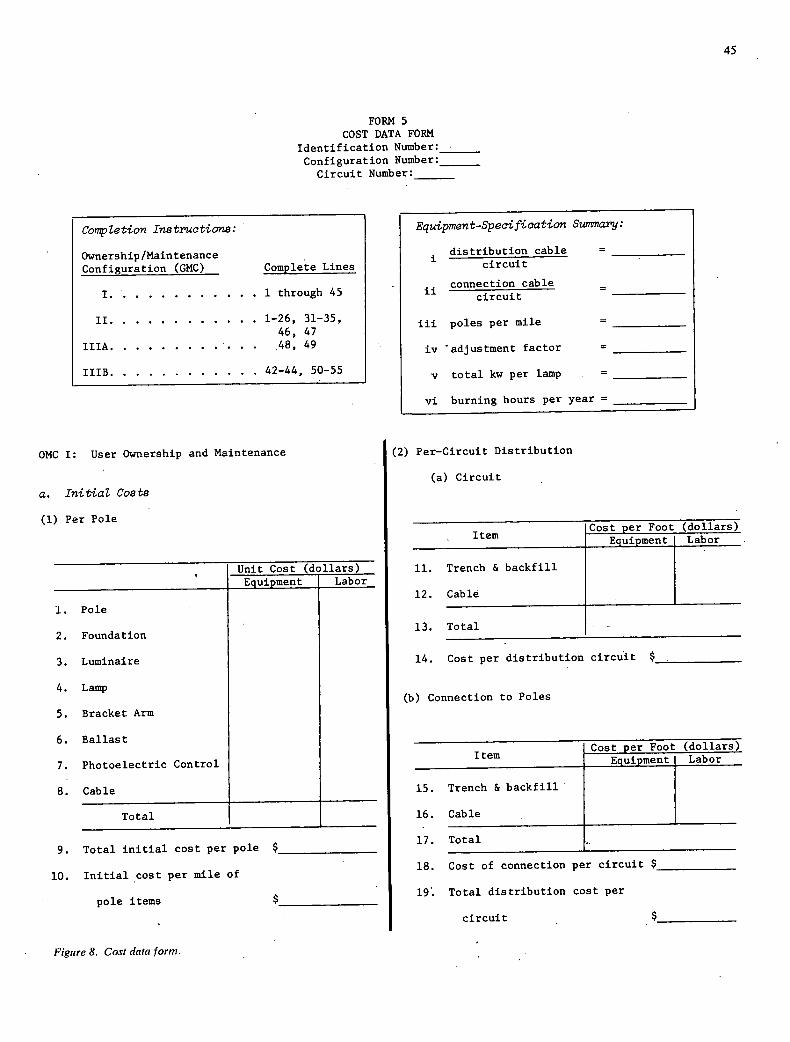
FORM 5 COST DATA FORM
Identification Number: Configuration Number:
Circuit Number:
45
Completion Instructions:
Ownership/Maintenance Configuration (GMC) Complete Lines
I.............1 through 45
II
. . . . . . . . . . . . 1-26, 31-35, 46, 47
lilA.............48, 49
IIIB . . . . . . . . . . . . 42-44, 50-55
Equipment-Specification Summary:
distribution cable = circuit
connection cable = circuit
poles per mile =
iv adjustment factor =
v total kw per lamp =
vi burning hours per year =
ONC I: User Ownership and Maintenance
a. Initial Coats
(1) Per Pole
Unit
Pole
Foundation
Luminaire
Lamp
Bracket Arm
Ballast
Photoelectric Control
Cable
Total
Total initial cost per pole $
Initial cost per mile of
pole items $
Figure 8. Cost data form.
(2) Per-Circuit Distribution
(a) Circuit
Cost per Foot (dollars) Item Eouioment I Labor
Trench & backfill
Cable
Total
Cost per distribution circuit $______________
(b) Connection to Poles
Cost per Foot (dollars Item Equipment Labor
Trench & backfill
Cable
Total
Cost of connection per circuit $_____________
19 Total distribution cost per
circuit $_____________
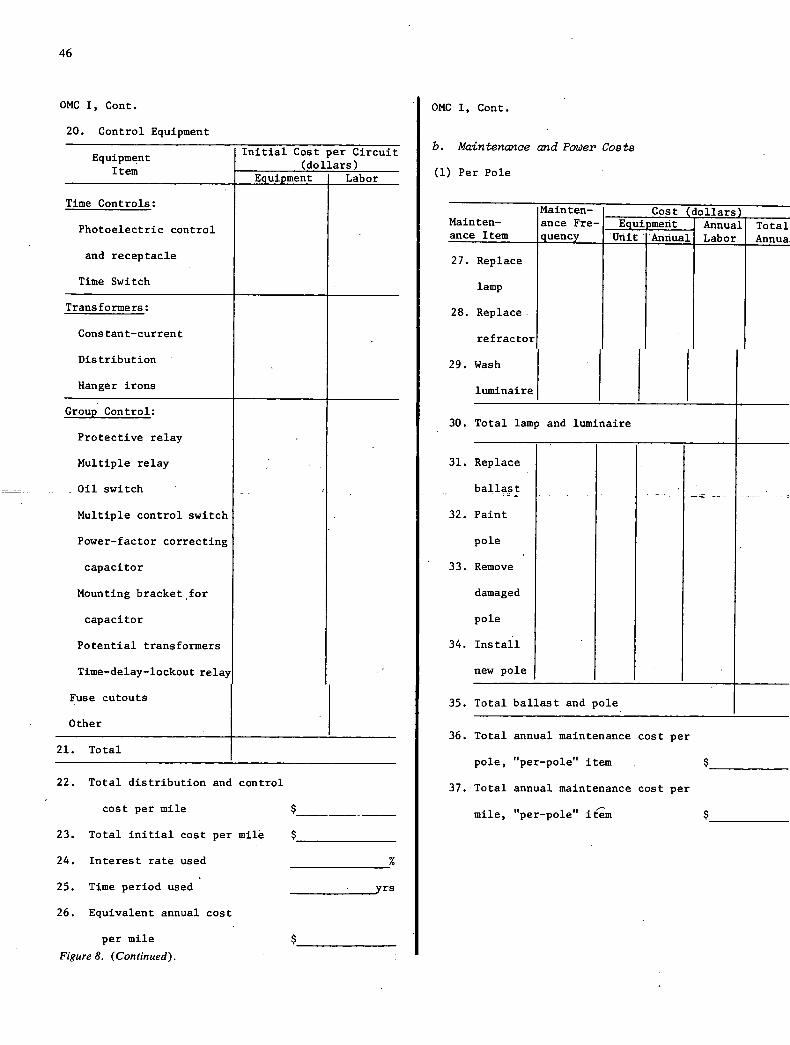
46
OMC I, Cont.
20. Control Equipment
Equipment Initial Cost per Circuit
Item I Equipment nt j Labor
Time Controls:
Photoelectric control
and receptacle
Time Switch
Transformers:
Constant-current
Distribution
Hanger irons
Group Control:
Protective relay
Multiple relay
Oil switch
Multiple control switch
Power-factor correcting
capacitor
Mounting bracket for
capacitor
Potential transformers
Time-delay-lockout relay
Fuse cutouts
Other
Total
Total distribution and control
cost per mile
Total initial cost per mile
Interest rate used
%
Time period used yrs
Equivalent annual cost
per mile
$
Figure 8. (Continued).
OMC I, Cont.
b. Maintenance and Power Co8tB
(1) Per Pole
Mainten- Cost (dollars) Mainten- ance Fre- Equipment Annual Total ance Item cjuency Unit Annual Labor I Annua
Replace
lamp
Replace
ref ractor
Wash
luminaire
Total lamp and luminaire
Replace
ballast
Paint
pole
Remove
damaged
pole
Install
new pole S
Total ballast and pole
Total annual maintenance cost per
pole, "per-pole" item $_
Total annual maintenance cost per
mile, "per-pole" im $

47
OMC I, Cont.
b. Maintenance and Power CoBt8, Cont.
(2) Per Circuit
Equipment
Maintenance Cost Type Per Circuit Per Year
(dollars)
Time Controls:
Photoelectric
control and
receptacle
Time switch
Transformers:
Distribution
Hanger irons
Group-Control:
Protective relay
Multiple relay
Oil switch
Multiple control
switch
Power-factor-
correcting
capacitor
Potential transformer
Time-delay-lockout
relay
Fuse cutouts
Other
Total
Total annual control equipment
cost per mile
Total annual maintenance cost
per mile
Energy rate per kwh
Kilowatts per mile
Total annual energy cost
per mile
Total annual cost per mile
OMC II: User. Ownership, Utility Maintenance
Cost per lamp per year $_______________
Total annual cost per mile $_______________
OMC lilA: Utility Ownership and Maintenance, Aggregate
Cost per lamp per year
Added Costs
Total annual cost per mile
$______________
$_______________
$_______________
OMC IIIB: Utility Ownership and Maintenance, Detail
Cost per lamp per year $______________
Added costs $________________
Cost per pole per year $________________
Total cost per unit per year
Total annual facility cost $_______________
Total annual cost per mile $_____________
Determination of Feasible Lighting Configurations Item (10) in Form I (Fig. 4), and also provides a uni-
Feasible lighting configurations can be determined in three formity ratio(s) equal to or less than the desired ratio.)
primary ways. (A feasible lighting configuration is one that The three ways of determining feasible designs are:
provides the minimum desired illumination, w, shown as (I) through use of a formula that relates unit spacing
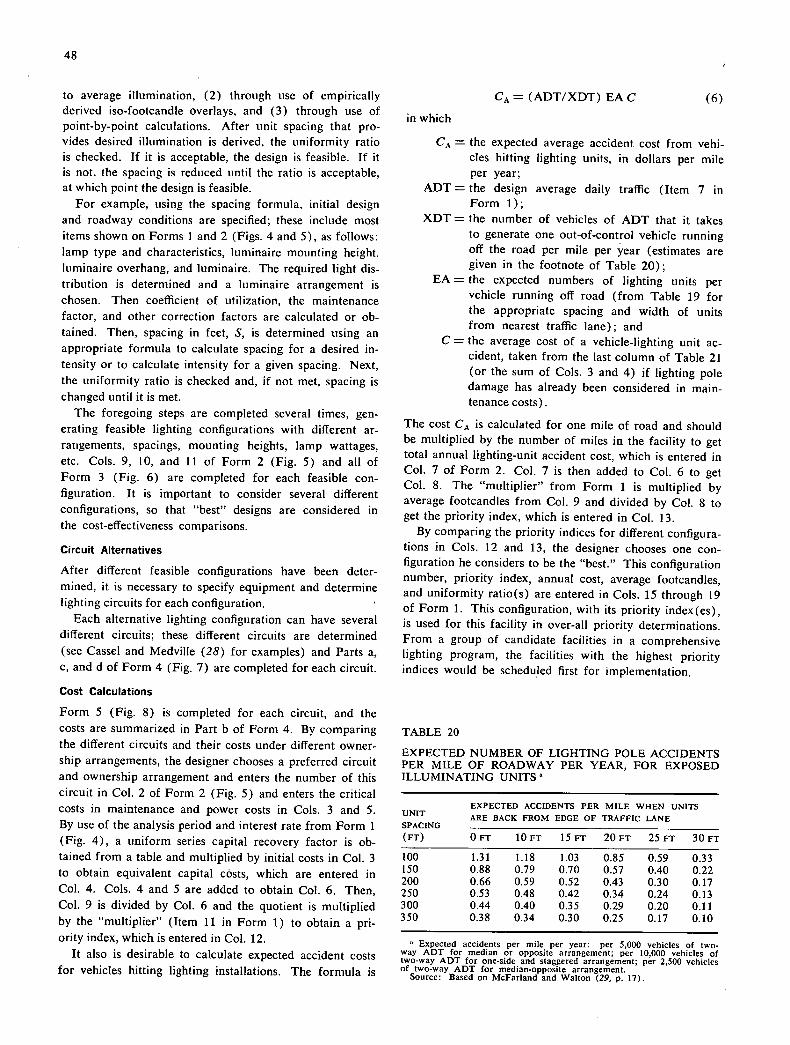
48
to average illumination, (2) through use of empirically derived iso-footcandle overlays, and (3) through use of point-by-point calculations. After unit spacing that pro-vides desired illumination is derived, the uniformity ratio is checked. If it is acceptable, the design is feasible. If it is not, the spacing is reduced until the ratio is acceptable, at which point the design is feasible.
For example, using the spacing formula, initial design and roadway conditions are specified; these include most items shown on Forms I and 2 (Figs. 4 and 5), as follows: lamp type and characteristics, luminaire mounting height, luminaire overhang, and luminaire. The required light dis-tribution is determined and a luminaire arrangement is chosen. Then coefficient of utilization, the maintenance factor, and other correction factors are calculated or ob-tained. Then, spacing in feet, S, is determined using an appropriate formula to calculate spacing for a desired in-tensity or to calculate intensity for a given spacing. Next, the uniformity ratio is checked and, if not met, spacing is changed until it is met.
The foregoing steps are completed several times, gen-erating feasible lighting configurations with different ar-railgements, spacings, mounting heights, lamp wattages, etc. Cols. 9, 10, and 11 of Form 2 (Fig. 5) and all of Form 3 (Fig. 6) are completed for each feasible con-figuration. It is important to consider several different configurations, so that "best" designs are considered in the cost-effectiveness comparisons.
Circuit Alternatives
After different feasible configurations have been deter-mined, it is necessary to specify equipment and determine lighting circuits for each configuration.
Each alternative lighting configuration can have several different circuits; these different circuits are determined (see Cassel and Medville (28) for examples) and Parts a, c, and d of Form 4 (Fig. 7) are completed for each circuit.
Cost Calculations
Form 5 (Fig. 8) is completed for each circuit, and the costs are summarized in Part b of Form 4. By comparing the different circuits and their costs under different owner-ship arrangements, the designer chooses a preferred circuit and ownership arrangement and enters the number of this circuit in Col. 2 of Form 2 (Fig. 5) and enters the critical costs in maintenance and power costs in Cols. 3 and 5. By use of the analysis period and interest rate from Form 1 (Fig. 4), a uniform series capital recovery factor is ob-tained from a table and multiplied by initial costs in Col. 3 to obtain equivalent capital costs, which are entered in Col. 4. Cols. 4 and 5 are added to obtain Col. 6. Then, Col. 9 is divided by Col. 6 and the quotient is multiplied by the "multiplier" (Item 11 in Form 1) to obtain a pri-ority index, which is entered in Col. 12.
It also is desirable to calculate expected accident costs for vehicles hitting lighting installations. The formula is
CA = (ADT/XDT) EA C (6)
in which
CA = the expected average accident cost from vehi-cles hitting lighting units, in dollars per mile per year;
ADT = the design average daily traffic (Item 7 in Form 1);
XDT = the number of vehicles of ADT that it takes to generate one out-of-control vehicle running off the road per mile per year (estimates are given in the footnote of Table 20);
EA = the expected numbers of lighting units per vehicle running off road (from Table 19 for the appropriate spacing and width of units from nearest traffic lane); and
C = the average cost of a vehicle-lighting unit ac-cident, taken from the last column of Table 21 (or the sum of Cols. 3 and 4) if lighting pole damage has already been considered in main-tenance costs).
The cost CA is calculated for one mile of road and should be multiplied by the number of miles in the facility to get total annual lighting-unit accident cost, which is entered in Col. 7 of Form 2. Col. 7 is then added to Col. 6 to get Col. 8. The "multiplier" from Form 1 is multiplied by average footcandles from Col. 9 and divided by Col. 8 to get the priority index, which is entered in Col. 13.
By comparing the priority indices for different configura-tions in Cols. 12 and 13, the designer chooses one con-figuration he considers to be the "best." This configuration number, priority index, annual cost, average footcandles, and uniformity ratio(s) are entered in Cols. 15 through 19 of Form 1. This configuration, with its priority index(es), is used for this facility in over-all priority determinations. From a group of candidate facilities in a comprehensive lighting program, the facilities with the highest priority indices would be scheduled first for implementation.
TABLE 20
EXPECTED NUMBER OF LIGHTING POLE ACCIDENTS PER MILE OF ROADWAY PER YEAR, FOR EXPOSED ILLUMINATING UNITS"
EXPECTED ACCIDENTS PER MILE WHEN UNITS UNIT ARE BACK FROM EDGE OF TRAFFIC LANE SPACING (FT) OFT lOFT 15FT 20FT 25FT 30FT
100 1.31 1.18 1.03 0.85 0.59 0.33 150 0.88 0.79 0.70 0.57 0.40 0.22 200 0.66 0.59 0.52 0.43 0.30 0.17 250 0.53 0.48 0.42 0.34 0.24 0.13 300 0.44 0.40 0.35 0.29 0.20 0.11 350 0.38 0.34 0.30 0.25 0.17 0.10
11 Expected accidents per mile per year: per 5,000 vehicles of two-way ADT for median or opposite arrangement; per 10,000 vehicles of two-way ADT for one-aide and staggered arrangement; per 2,500 vehicles of two-way ADT for median-opposite arrangement.
Source: Based on McFarland and Walton (29, p. 17).
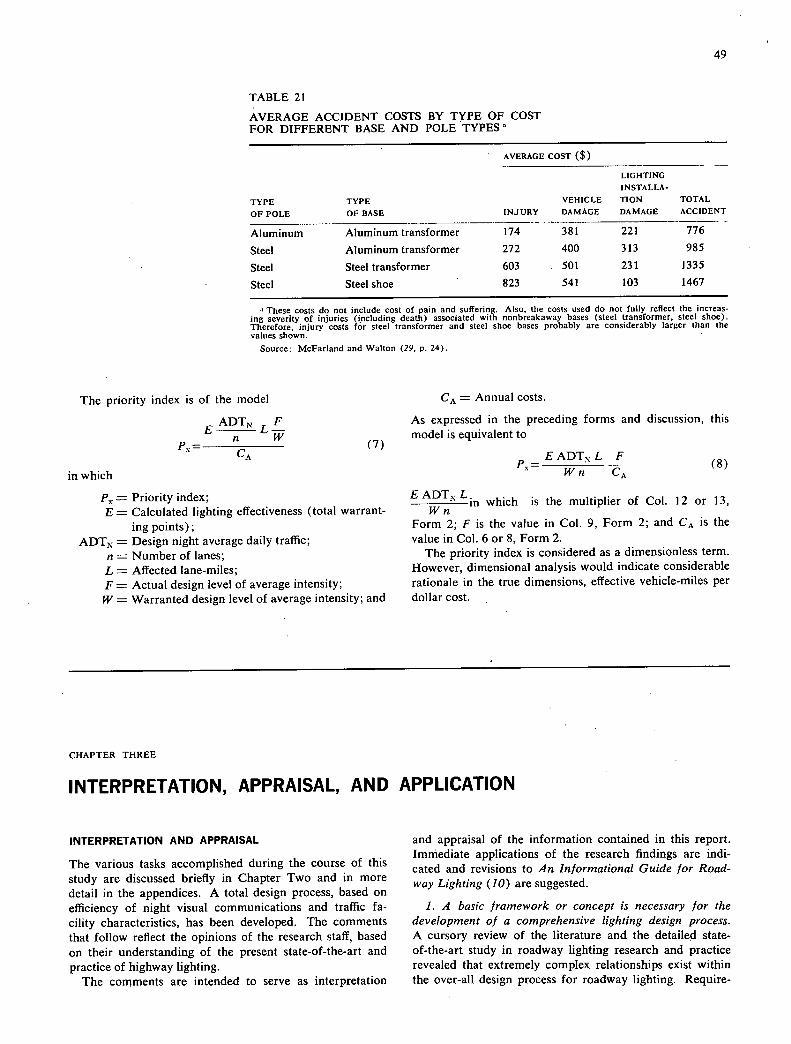
49
TABLE 21
AVERAGE ACCIDENT COSTS BY TYPE OF COST FOR DIFFERENT BASE AND POLE TYPES
AVERAGE COST ($)
LIGHTING
INSTALLA-
TYPE TYPE VEHICLE TION TOTAL
OF POLE OF BASE INJURY DAMAGE DAMAGE ACCIDENT
Aluminum Aluminum transformer 174 381 221 776
Steel Aluminum transformer 272 400 313 985
Steel Steel transformer 603 501 231 1335
Steel Steel shoe 823 541 103 1467
11 These costs do not include cost of pain and suffering. Also, the costs used do not fully reflect the increas-ing severity of injuries (including death) associated with nonbreakaway bases (steel transformer, steel shoe). Therefore, injury costs for steel transformer and steel shoe bases probably are considerably larger than the values shown.
Source: McFarland and Walton (29, p. 24).
The priority index is of the model
E ADTN
P= w
(7) CA
in which
P = Priority index; E = Calculated lighting effectiveness (total warrant-
ing points); ADTN = Design night average daily traffic;
n = Number of lanes; L = Affected lane-miles; F = Actual design level of average intensity;
W Warranted design level of average intensity; and
CA = Annual costs.
As expressed in the preceding forms and discussion, this model is equivalent to
EADT N L F (8
Wn )
EADTN L in which is the multiplier of Col. 12 or 13, Wn
Form 2; F is the value in Col. 9, Form 2; and CA is the
value in Col. 6 or 8, Form 2. The priority index is considered as a dimensionless term.
However, dimensional analysis would indicate considerable rationale in the true dimensions, effective vehicle-miles per dollar cost.
CHAPTER THREE
INTERPRETATION, APPRAISAL, AND APPLICATION
INTERPRETATION AND APPRAISAL
The various tasks accomplished during the course of this study are discussed briefly in Chapter Two and in more detail in the appendices. A total design process, based on efficiency of night visual communications and traffic fa-cility characteristics, has been developed. The comments that follow reflect the opinions of the research staff, based on their understanding of the present state-of-the-art and practice of highway lighting.
The comments are intended to serve as interpretation
and appraisal of the information contained in this report. Immediate applications of the research findings are indi-cated and revisions to An Informational Guide for Road-way Lighting (10) are suggested.
1. A basic framework or concept is necessary for the development of a comprehensive lighting design process. A cursory review of the literature and the detailed state-of-the-art study in roadway lighting research and practice revealed that extremely complex relationships exist within the over-all design process for roadway lighting. Require-
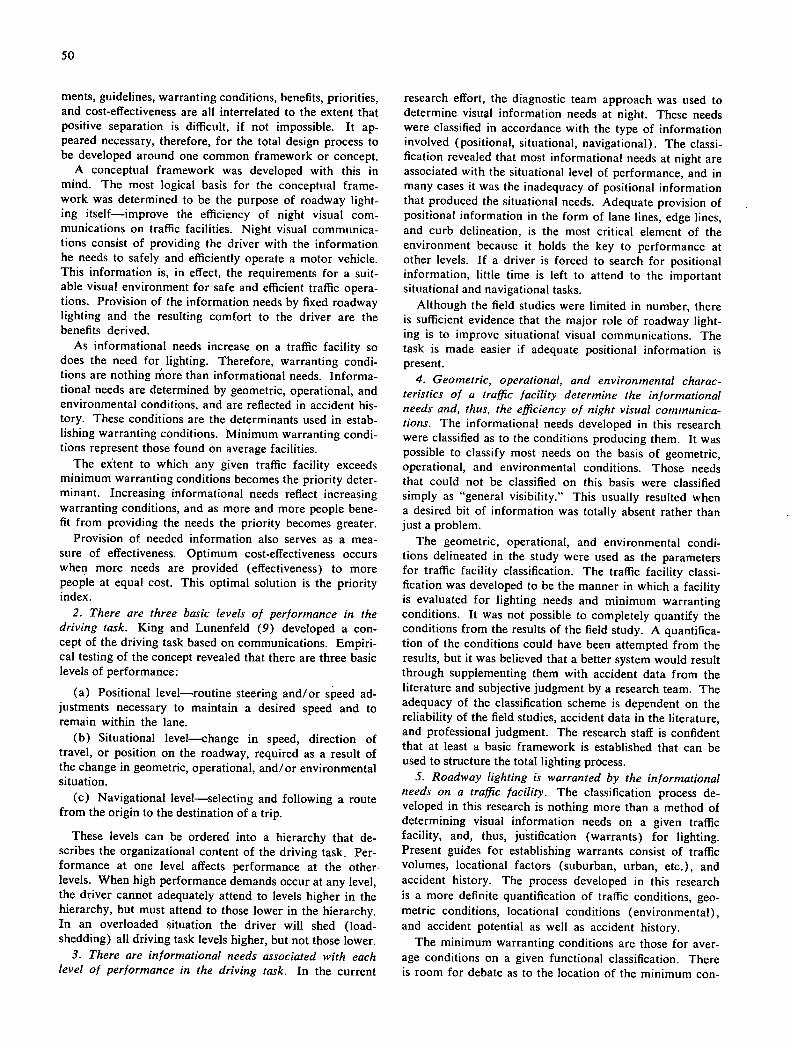
50
ments, guidelines, warranting conditions, benefits, priorities, and cost-effectiveness are all interrelated to the extent that positive separation is difficult, if not impossible. It ap-peared necessary, therefore, for the total design process to be developed around one common framework or concept.
A conceptual framework was developed with this in mind. The most logical basis for the conceptual frame-work was determined to be the purpose of roadway light-ing itself—improve the efficiency of night visual com-munications on traffic facilities. Night visual communica-tions consist of providing the driver with the information he needs to safely and efficiently operate a motor vehicle. This information is, in effect, the requirements for a suit-able visual environment for safe and efficient traffic opera-tions. Provision of the information needs by fixed roadway lighting and the resulting comfort to the driver are the benefits derived.
As informational needs increase on a traffic facility so does the need for lighting. Therefore, warranting condi-tions are nothing more than informational needs. Informa-tional needs are determined by geometric, operational, and environmental conditions, and are reflected in accident his-tory. These conditions are the determinants used in estab-lishing warranting conditions. Minimum warranting condi-tions represent those found on average facilities.
The extent to which any given traffic facility exceeds minimum warranting conditions becomes the priority deter-minant. Increasing informational needs reflect increasing warranting conditions, and as more and more people bene-fit from providing the needs the priority becomes greater.
Provision of needed information also serves as a mea-sure of effectiveness. Optimum cost-effectiveness occurs when more needs are provided (effectiveness) to more people at equal cost. This optimal solution is the priority index.
2. There are three basic levels of performance in the driving task. King and Lunenfeld (9) developed a con-cept of the driving task based on communications. Empiri-cal testing of the concept revealed that there are three basic levels of performance:
Positional level—routine steering and/or speed ad-justments necessary to maintain a desired speed and to remain within the lane.
Situational level—change in speed, direction of travel, or position on the roadway, required as a result of the change in geometric, operational, and/or environmental situation.
Navigational level—selecting and following a route from the origin to the destination of a trip.
These levels can be ordered into a hierarchy that de-scribes the organizational content of the driving task. Per-formance at one level affects performance at the other levels. When high performance demands occur at any level, the driver cannot adequately attend to levels higher in the hierarchy, but must attend to those lower in the hierarchy. In an overloaded situation the driver will shed (load-shedding) all driving task levels higher, but not those lower.
3. There are informational needs associated with each level of performance in the driving task. In the current
research effort, the diagnostic team approach was used to determine visual information needs at night. These needs were classified in accordance with the type of information involved (positional, situational, navigational). The classi-fication revealed that most informational needs at night are associated with the situational level of performance, and in many cases it was the inadequacy of positional information that produced the situational needs. Adequate provision of positional information in the form of lane lines, edge lines, and curb delineation, is the most critical element of the environment because it holds the key to performance at other levels. If a driver is forced to search for positional information, little time is left to attend to the important situational and navigational tasks.
Although the field studies were limited in number, there is sufficient evidence that the major role of roadway light-ing is to improve situational visual communications. The task is made easier if adequate positional information is present.
Geometric, operational, and environmental charac-teristics of a traffic facility determine the informational needs and, thus, the efficiency of night visual communica-tions. The informational needs developed in this research were classified as to the conditions producing them. It was possible to classify most needs on the basis of geometric, operational, and environmental conditions. Those needs that could not be classified on this basis were classified simply as "general visibility." This usually resulted when a desired bit of information was totally absent rather than just a problem.
The geometric, operational, and environmental condi-tions delineated in the study were used as the parameters for traffic facility classification. The traffic facility classi-fication was developed to be the manner in which a facility is evaluated for lighting needs and minimum warranting conditions. It was not possible to completely quantify the conditions from the results of the field study. A quantifica-tion of the conditions could have been attempted from the results, but it was believed that a better system would result through supplementing them with accident data from the literature and subjective judgment by a research team. The adequacy of the classification scheme is dependent on the reliability of the field studies, accident data in the literature, and professional judgment. The research staff is confident that at least a basic framework is established that can be used to structure the total lighting process.
Roadway lighting is warranted by the informational needs on a traffic facility. The classification process de-veloped in this research is nothing more than a method of determining visual information needs on a given traffic facility, and, thus, justification (warrants) for lighting. Present guides for establishing warrants consist of traffic volumes, locational factors (suburban, urban, etc.), and accident history. The process developed in this research is a more definite quantification of traffic conditions, geo-metric conditions, locational conditions (environmental), and accident potential as well as accident history.
The minimum warranting conditions are those for aver-age conditions on a given functional classification. There is room for debate as to the location of the minimum con-
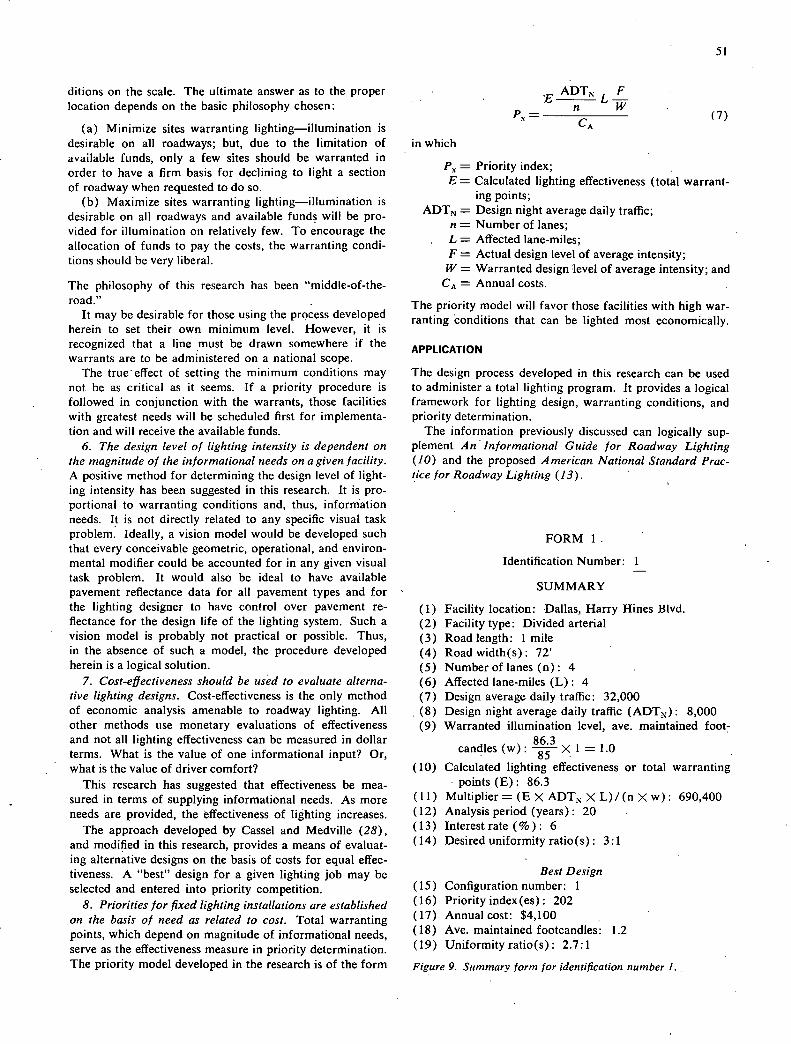
51
ditions on the scale. The ultimate answer as to the proper location depends on the basic philosophy chosen:
Minimize sites warranting lighting—illumination is desirable on all roadways; but, due to the limitation of available funds, only a few sites should be warranted in order to have a firm basis for declining to light a section of roadway when requested to do so.
Maximize sites warranting lighting—illumination is desirable on all roadways and available funds will be pro-vided for illumination on relatively few. To encourage the allocation of funds to pay the costs, the warranting condi-tions should be very liberal.
The philosophy of this research has been "middle-of-the-road."
It may be desirable for those using the process developed herein to set their own minimum level. However, it is recognized that a line must be drawn somewhere if the warrants are to be administered on a national scope.
The true effect of setting the minimum conditions may not be as critical as it seems. If a priority procedure is followed in conjunction with the warrants, those facilities with greatest needs will be scheduled first for implementa-tion and will receive the available funds.
The design level of lighting intensity is dependent on the magnitude of the informational needs on a given facility. A positive method for determining the design level of light-ing intensity has been suggested in this research. It is pro-portional to warranting conditions and, thus, information needs. It is not directly related to any specific visual task problem. Ideally, a vision model would be developed such that every conceivable geometric, operational, and environ-mental modifier could be accounted for in any given visual task problem. It would also be ideal to have available pavement reflectance data for all pavement types and for the lighting designer to have control over pavement re-flectance for the design life of the lighting system. Such a vision model is probably not practical or possible. Thus, in the absence of such a model, the procedure developed herein is a logical solution.
Cost-effectiveness should be used to evaluate alterna-tive lighting designs. Cost-effectiveness is the only method of economic analysis amenable to roadway lighting. All other methods use monetary evaluations of effectiveness and not all lighting effectiveness can be measured in dollar terms. What is the value of one informational input? Or, what is the value of driver comfort?
This research has suggested that effectiveness be mea-sured in terms of supplying informational needs. As more needs are provided, the effectiveness of lighting increases.
The approach developed by Cassel and Medville (28), and modified in this research, provides a means of evaluat-ing alternative designs on the basis of costs for equal effec-tiveness. A "best" design for a given lighting job may be selected and entered into priority competition.
Priorities for fixed lighting installations are established on the basis of need as related to cost. Total warranting points, which depend on magnitude of informational needs, serve as the effectiveness measure in priority determination. The priority model developed in the research is of the form
E ADTN L F
P= CA w
(7)
in which
= Priority index; E = Calculated lighting effectiveness (total warrant-
ing points; ADTN = Design night average daily traffic;
n = Number of lanes; L = Affected lane-miles; F = Actual design level of average intensity;
W = Warranted design level of average intensity; and CA = Annual costs.
The priority model will favor those facilities with high war-ranting conditions that can be lighted most economically.
APPLICATION
The design process developed in this research can be used to administer a total lighting program. It provides a logical framework for lighting design, warranting conditions, and priority determination.
The information previously discussed can logically sup-plement An' Informational Guide for Roadway Lighting (10) and the proposed American National Standard Prac-tice for Roadway Lighting (13).
FORM 1
Identification Number: 1
SUMMARY
Facility location: Dallas, Harry Hines Blvd. Facility type: Divided arterial Road length: 1 mile Road width(s): 72' Number of lanes (n): 4 Affected lane-miles (L): 4 Design average daily traffic: 32,000 Design night average daily traffic (ADTN ): 8,000 Warranted illumination level, ave. maintained foot-
candles (w): 86.3 x 1 = 1.0
Calculated lighting effectiveness or total warranting points (E): 86.3
Multiplier= (E X ADTN X L)/(n X w): 690,400 Analysis period (years): 20 Interest rate ( % ) : 6 Desired uniformity ratio(s): 3:1
Best Design Configuration number: 1 Priority index(es): 202 Annual cost: $4,100 Ave. maintained footcandles: 1.2 Uniformity ratio(s): 2.7:1
Figure 9. Summary form for identification number 1.

FORM 2
COST AND EFFECTIVENESS SUMMARY FORM
IDENTIFICATION NUIBER: 1 ANNUAL COST'- EFFECTIVE'ESS ____________________
(1) Configu- ration Nur-ber
(2) Circuij Number
(3) Initial Capital Cost
(4) Equiv- alent b Capital
(5) Mainte- nance and Power
(6) Sub- total (4)+(5)
(7) Light Pole Acci- dent
(8) Total (6)+(7)
(9) Ave. Foot Candles Actual
(10) Mm. Foot Candles
(F)
(11) Ave.! Min Ratio (9)1(10)
Priority Indexd (12)
Multiplier
x Col. (9)
Col. (6)
(13) Multiplier
x Col. (9)
Col. (8)
1 2 18,000 1,570 1,760 3,330 770 4,100 1.2 .45 2.7:1 248 202
2 1 25,000 2,180 2,500 4,680 1,080 5,760 1.3 .45 2.9:1 192 156
3
4
S
6
7
8
9
10
acircuit number chosen as best for given configurations. bc01 (3) multiplied by capital recovery factor for chosen analysis period and interest rate.
cFor 'best ownership arrangement considered.
d\Iultiplier; is taken from Form 1.
Figure 10. Cost and effectiveness summary form for identification number I

53
RAT 1M3 LILIT LIG41
CLASSIFICATION __________________________________________________________________
¶Ar Br ?A-S FACTOR 1 - 2 3 4 5 A-J
GE'TRIC FACTORS
D.f. No. of lanes ss 6 - 8 or more 1.0 0.8 0.2
1. 0 Lane Width '12' 11' 10' 10' 3.0 2.5 0.5
3.0 40 Median Openings '4.0 or one 4.0-8.0 8.1-12.0 lS.0 '15.0 or no 5.0 2.0 per mite Way Opera tion access control
/0:0 Curb Cuts 1011 10-20% 20-30% ' 30-401 5.0 3.0 2.0
Curves 3.1-6.0° 6.1-8.0° 8.1-10.0° 'IO 13.0 5.0 8.0
a. 4 Grades <3 3.0-3.9% 4.0-4.9% 5.0-6.9% 7% or more 3.2 2.8 0.4
Sight Distance '700' 500-700' 300-500' 200-300' c200' 2.0 1.8 0.2 0. Z-
Parking loading off-peak penilitted permItted 0.2 0.1 0.1 0. /
E~T zones only only one side both sides
C,IP4ETR1C TOTAL
OPERATIONAL. FACTORS
ô B Signals all major substantial most major a1f frequent non- 3.0 2.8 0.2 intersections majority of intersections the Intersec- signalized signalized intersections signalized tions intersections
signalized signalized
4.0 Left turn lane all major substantial most major about half infrequent 5.0 4.0 1.0 intersections majority of intersections the major turn 'bays or or one way intersections , intersections undivided operation
12' streets
0.5 Median Width 30' 10-20' 4-10' ' 0-4' 1.0 0.5
4.0 Operating Speed 25 or less 30 35 40 1.0 0.2 0.8
Pedestrian Traffic very few or 0-50 0 100- 200 '200 1.5 0.5 1.0 at night (peds/mi) none
OPERATIONAL TOTAL
VIIP*ENTAL FACTORS
1 0 .8 Development 0 0-30% 30-60% 60-901 0.5 0.3 0.2
Predominant Type undeveloped residential half-residen- industrial stHindus- 0.5 0.3 0.2 Development ' or backup tial and/or or camer- (trial or
design commercial cial
0.2 10, Setback Distance '200 150-200' (so' ' 50-100' 'SO 0.5 0.3
/0. 0 210 Advertising or none 0-40% 40-60% 60-80% ll 3.0 1.0 area lighting
t~tia
:E Raised Curb none at all inter- at signalized a few 1.0 0.5 0.5 1. 0 Median sections intersections locations
1. ° Crime Rate extremely city aver, higher than extremely 1.0 0.5 0.5 low citya'.,J city aver, high
FJ4vII9I4'RrAL TOTAL /4
AcCIIE4TS
Ratio of night to '1.0 1.0-1.2 L2-1.5 2.0k 10.0 2.0
day accident rates
5Continuoom lighting warranted 0 ' ACCIDR4T TOTAL
GIDIIiTRIC IUrAL
OPERATIONAL TOTAL =
F)1VIR(1D412,1AL TOTAL /4 Ac(:IDINT TorN. =
SUM ' RO-PO INTS
WARI1.MTINC CONDITION ' 85ppints
Figure 11. Example 1: Classification for noncontrolled-access facility lighting.
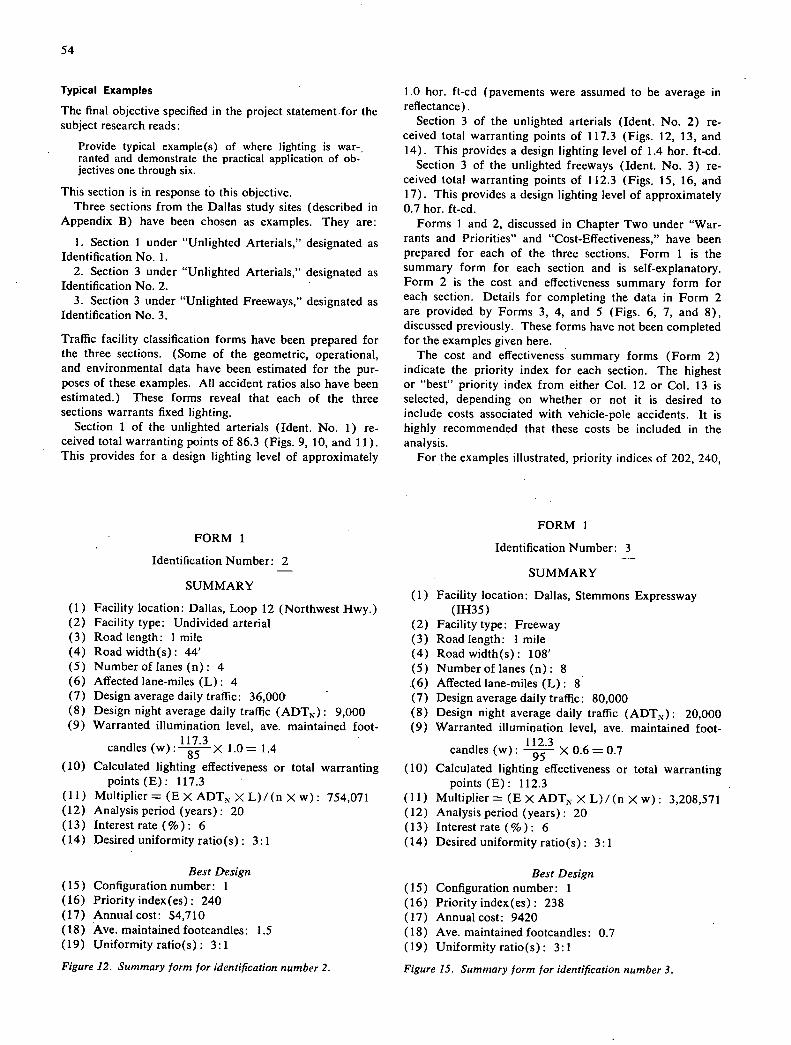
54
Typical Examples
The final objective specified in the project statement.for the subject research reads:
Provide typical example(s) of where lighting is war-ranted and demonstrate the practical application of ob-jectives one through six.
This section is in response to this objective. Three sections from the Dallas study sites (described in
Appendix B) have been chosen as examples. They are:
Section 1 under "Unlighted Arterials," designated as Identification No. 1.
Section 3 under "Unlighted Arterials," designated as Identification No. 2.
Section 3 under "Unlighted Freeways," designated as Identification No. 3.
Traffic facility classification forms have been prepared for the three sections. (Some of the geometric, operational, and environmental data have been estimated for the pur-poses of these examples. All accident ratios also have been estimated.) These forms reveal that each of the three sections warrants fixed lighting.
Section 1 of the unlighted arterials (Ident. No. 1) re-ceived total warranting points of 86.3 (Figs. 9, 10, and 11). This provides for a design lighting level of approximately
1.0 hor. ft-cd (pavements were assumed to be average in reflectance).
Section 3 of the unlighted arterials (Ident. No. 2) re-ceived total warranting points of 117.3 (Figs. 12, 13, and 14). This provides a design lighting level of 1.4 hor. ft-cd.
Section 3 of the unlighted freeways (Ident. No. 3) re-ceived total warranting points of 112.3 (Figs. 15, 16, and 17). This provides a design lighting level of approximately 0.7 hor. ft-cd.
Forms 1 and 2, discussed in Chapter Two under "War-rants and Priorities" and "Cost-Effectiveness," have been prepared for each of the three sections. Form I is the summary form for each section and is self-explanatory. Form 2 is the cost and effectiveness summary form for each section. Details for completing the data in Form 2 are provided by Forms 3, 4, and 5 (Figs. 6, 7, and 8), discussed previously. These forms have not been completed for the examples given here.
The cost and effectiveness summary forms (Form 2) indicate the priority index for each section. The highest or "best" priority index from either Col. 12 or Col. 13 is selected, depending on whether or not it is desired to include costs associated with vehicle-pole accidents. It is highly recommended that these costs be included in the analysis.
For the examples illustrated, priority indices of 202, 240,
FORM! FORM 1
Identification Number: 3 Identification Number: 2 -
— SUMMARY SUMMARY
(1) Facility location: Dallas, Stemmons Expressway Facility location: Dallas, Loop 12 (Northwest Hwy.) (1H35) Facility type: Undivided arterial (2) Facility type: Freeway
(3) Road length: 1 mile (3) Road length: 1 mile (4) Roadwidth(s): 44' (4) Roadwidth(s): 108' (5) Number of lanes (n): 4 (5) Number of lanes (n): 8 (6) Affected lane-miles (L): 4 (6) Affected lane-miles (L): 8 (7) Design average daily traffic: 36,000 (7) Design average daily traffic: 80,000 (8) Design night average daily traffic (ADTN): 9,000 (8) Design night average daily traffic (ADTN): 20,000 (9) Warranted illumination level, ave. maintained foot- (9) Warranted illumination level, ave. maintained foot-
117.3 candles (w):
85 1.0= 1.4 112.3
candles (w): --- X 0.6= 0.7 95
(10) Calculated lighting effectiveness or total warranting (10) Calculated lighting effectiveness or total warranting points (E): 117.3 points (E) : 112.3
(11) Multiplier = (E X ADTN XL)/(n Xw): 754,071 (11) Multiplier = (E X ADTN XL)/(n Xw): 3,208,571 (12) Analysis period (years): 20 (12) Analysis period (years): 20 (13) Interest rate ( % ) : 6 (13) Interest rate ( % ) : 6 (14) Desired uniformity ratio(s) : 3:1 (14) Desired uniformity ratio(s): 3:1
Best Design Best Design (15) Configuration number: 1 (15) Configuration number: 1 (16) Priority index (es) : 240 (16) Priority index (es) : 238 (17) Annual cost: $4,710 (17) Annual cost: 9420 (18) Ave. maintained footcandles: 1.5 (18) Ave. maintained footcandles: 0.7 (19) Uniformity ratio(s): 3:1 (19) Uniformity ratio(s): 3:1
Figure 12. Summary form for identification number 2. Figure 15. Summary form for identification number 3.

FORM 2
COST AND EFFECTIVENESS SUMMARY FORM
ID1TIFICATION NLtIBER: 2
ANNUAL(DSI' EFFEcrIV1ESS ____
(1) Configu- ration Nurber
(2) Circuil N.unber
(3) Initial Capital Cost
(4) Equiv- alent b Capital
(5) Mainte- nance and Power
(6) Sub- total. (4)#(5)
(7) Light Pole Acci- dent
(8) Total (6)+(7)
(9) Ave. Foot Candles Actual
(10) Mm. Foot Candles
(11) Ave.! Min Ratio (9)1(10)
Priority Index<1 (12)
Multiplier
x Cal. (9)
Col. (6)
(13) Multiplier x Cal. (9)
Cal. (8)
1. 1 23,000 2,010 1,750 3,760 950 4,710 1.5 .5 3:1 301 240
2 1 24,000 2,090 2,180 4,270 950 5,220 1.4 .5 2;8:1 247 202
3
4
S -
6
7
8
9
10
acircuit ni.mther chosen as best for given configurations. --
bColun (3) multiplied by capital recovery factor for chosen analysis period and interest rate.
CF0r "best ownership arrangement considered.
d\tultip1ierh1 is taken from Form 1.
Figure 13. Cost and effectiveness summary form for identification number 2.

56
CLASSIFICATION FACTOR
RATIM3 INST çy
LIONTED SCDRE
1 2 3 4 5
GEOMETRIC FACTORS O.Z No. of lanes ss - 6 - 8 or more 1.0 0.8 0.2
I.ane Width '12' 12' 10' <10' 3.0 2.5 0.5 _______
Median Openings >4.0 or one 4.0-8,0 8.1-12.0 12.0-15.0 CaD 5.0 3.0 2.0 per mile way operation
Curt) Cuts <10% 10-201 20-301 % >40% 5.0 3.0 2.0
Curves <3.00 3.1-6.0 6.18.00 8.1-10.0° 13.0 5.0 8.0
Grades '31 3.0-3.9% 4.0-4.91 5.0-6.9% 3.2 2.8 0.4 f 0
Sight Distance '700' 500- 700' 300-500' 0' >200' 2.0 1.8 0.2 O.R / Parking /t% loading off-peak pernitted pennitted 0.2 0.1 0.1
zones only only one side both sides
GB4ETRIC TOTAL
OPERATIONAL FAC10RS C)IZ Signals fo"\ substantial most major about half frequent non- 3.0 2.8 0.2
majority of intetsections the intersec- signalized ( , rsectio) intersections signalized
signalized tions intersections
signalized signalized
Left turn lane all major substantial most major about half uent 5.0 - 4.0 1.0 _______ intersections majority of intersections the major turn bays or or one way intersections intersections undivided operation . streets
5 Median Width 30' 20-30' 10-20' 4-10' 0-4' 10 05 05 -
40 Operating Speed 25 or less 30 35 40 reater 1.0 0.2 0:8
Pedestrian Traffic very few or 0-50 50-100 100-200 5o at night (peds/mi) none
1.5 0.5 1.0
OPERATIONAL TOTAL /6.7 ENVl1tI'EPiTAL FACTORS
% Development 0 0-301 30-601 60-901 1001 0.5 0.3 0.2 /.t? Predoninant Type undeveloped residential half-residen- Industrial 0.5 0.3 0.2 Development or backup tial and/or or ccsmaer- trial or -
design coniivrcial cial.
çin
cosriercial
Setback Distance >200 150-200' 100-ISO' 50-100' >50 0.5 0.3 0.2 /' 0 _____
Advertising or none 0-401 40-601 60-80% iaUy 3.0 1.0 2.0 /0.0 area lighting COntifluO
Raised Curb continuous at all inter- at signalized a few 1.0 0.5 0.5 0.5 Median sections intersections locations
Crime Rate lower than city aver, higher than extremely 1.0 0.5 0.5 CremelY city aver, city aver, high
rNVIR()84ENTAL TOTAL /4. 0
ACI1NTS
Ratio of night to 1.0 1.0-1.2 G' 1.5-2.0 2,0° day accident rates
10.0 2.0 8.0
*Continuous lighting warranted ACCIDINT TOTAL
(4ETR1C TOTAL
OPERATIONAL TOTAL = '7 VIRONl.0NFAL TOTAL = 0
= Z4.0 SlIM = /173 PoINTS
WARRJWF1NC CONDITION = 8Spoints
Figure 14. Example 2: Classification for noncon trolled-access facility lighting.

FORM 2
COST AND EFFECTIVENESS SUMMARY FORM
ITIFICATION NUIBER:
ANNUAL aiST- EPFECI'IVHJESS
(1) Configu- ration Number
(2) Circuil Number
(3) Initial Capital Cost
(4) Equiv- alent b Capital
(5) Mainte- nance and Power
(6) Sub- total (4)+(5)
(7) Light Pole Acci- dent
(8) Total (6)+(7)
(9) Ave. Foot Candles Actual
(10) Mm. Foot Candles
(F)
(11) Ave.! Min Ratio (9)/(10)
Priority Indexd (12)
Multiplier
x Col. (9)
Col. (6)
(13) Multiplier
x Col. (9)
Col. (8)
1 1 46,000 4,020 3,500 7,520 1,900 9,420 0.7 .23 3:1 299 238
2 3 39,000 3,400 3,990 7,390 2,170 9,560 0.7 .25 2.8.1 303 235
3 - 4
5
6
7
8
9
10
aCircuit number chosen as best for given configurations. bCo1u (3) multiplied by capital recovery factor for chosen analysis period and interest rate.
or "best ownership arrangement considered.
dMaltiplierht is taken from Form 1.
Figure 16. Cost and effectiveness summary form for identification number 3. LA
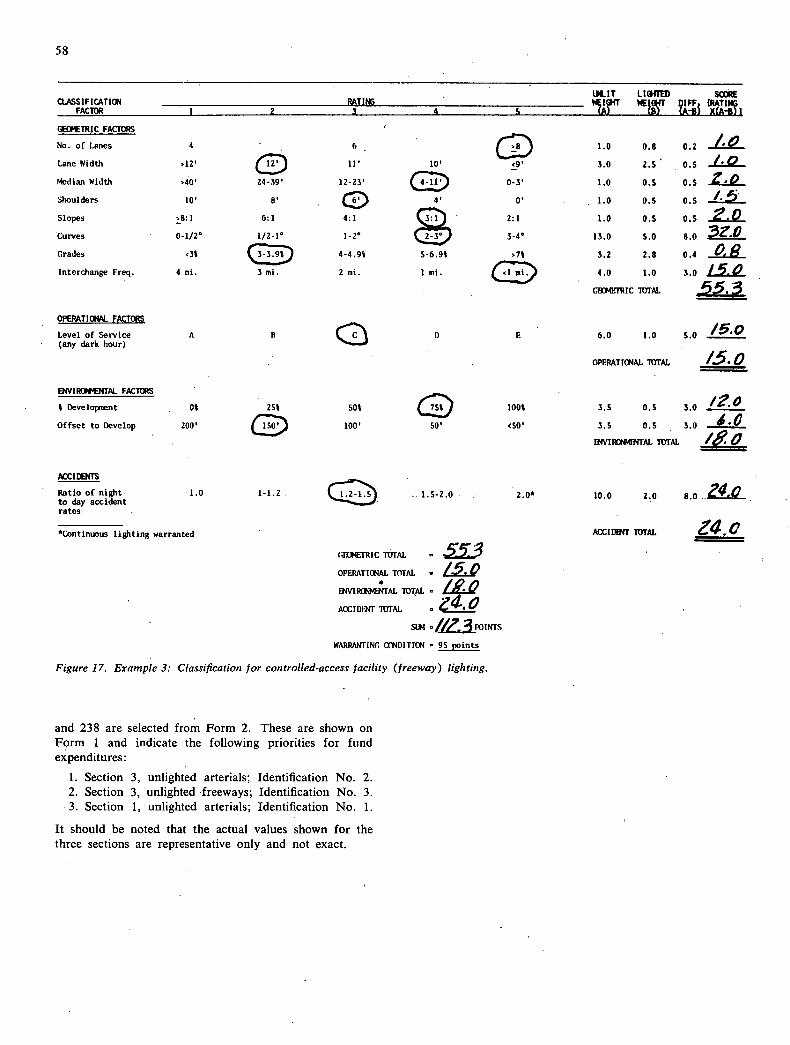
58
Q.ASIFICATI(R4 FACtOR 1 2
RATItI 3 4
LI&IT
WirT
UGITED 4T 01FF
(A-B
Sco RATING x(A-)1
GE(WE1RIC FACTORS
No. of Lanes 4 6 1.0 0.8 0.2
Lane Width '12' CE) 11' 10' '9' 3.0 2.5 0.5
Median Width '40' 24-39' 12-23' ()
0-3' 1.0 0.5 0.5
Shoulders to, 8' 4 0' 1.0 0.5 0.5
Slopes 8:1 6:1 4:1 2:1 1.0 0.5 0.5 2.0 Curves 0-1/2° 1/2-1° 1-2° 2-3 3-4° 13.0 5.0 8.0 30 Grades 3% % 4-4.9% 5-6.91 '1% 3.2 2.8 0.4
15.0 Interchange Freq. 4 mi. 3 mi. 2 mi. 1 mi. . 4.0 1.0 3.0
G€1RiC TOTAL
OPERATIONAL FACTORS
Level of Service A B U 0 6.0 1.0 5.0 (any dark hour)
OPERATIONAL 1OTAL
ENVI RGIVITAL FACTORS - Development 01 (j) 251 50% 1001 3.5 0.5 3.0
Offset to Develop 200' 100' 50' lesol 3.5 0.5 3.0
D4VII0TAL TTJIAL /80
ACCI4TS
Ratio of night - 1.0 1-1.2 24.0 to day accident
1.S 1.5-2.0 2.0* 10.0 2.0 8.0
rates
ACCIDENT 1UIAL aContjnUs lighting warranted
(flPTRJc 1UIAL .55:3 OPERATIONAL TITIAL /5. 0
I /A 0 RMNrAL IOTAL 4• 0 AcCIDENT 1UTAL
SUM
WARRANTING IXE4DITION 95 points
Figure 17. Example 3: Classification for controlled-access facility (freeway) lighting.
and 238 are selected from Form 2. These are shown on Form 1 and indicate the following priorities for fund expenditures:
Section 3, unlighted arterials; Identification No. 2. Section 3, unlighted freeways; Identification No. 3. Section 1, unlighted arterials; Identification No. 1.
It should be noted that the actual values shown for the three sections are representative only and not exact.

CHAPTER FOUR
CONCLUSIONS AND SUGGESTED RESEARCH
59
The procedures developed during this study should be used to develop a total lighting design process. A revision of An Informational Guide for Roadway Lighting (JO) should be prepared on the basis of current knowledge from the research and practice. It is recognized that setting policies and procedures for administration purposes is not within the province of research. However, it is believed that the current design guidelines and warrants should be rewritten.
It is concluded that the rational design approach out-lined in this report is a usable technique, and that the pro-cedures involved provide an insight into the interrelation-ships existing in the total lighting design problem. The approach should be evaluated closely by agencies responsi-ble for its use and administration, and the results should be furnished to lighting engineers to aid them in their
responsibilities. Specific research tasks suggested for evaluation of the
approach are as follows:
1. Preparation of an implementation procedure. It is rec-ommended that an implementation procedure be developed outlining the function and details of the total design proc-ess. This procedure should be styled after the basic format of An Informational Guide for Roadway Lighting (10). The function of the procedure would be to field evaluate the approach.
Field evaluation of the approach. Several states and municipalities should be selected to implement the ap-proach on a limited basis. Close evaluation of the approach would be made by the selected agencies and the results would be incorporated in the final revision of the Informa-tional Guide.
Revision of An Informational Guide for Roadway Lighting. It is recommended that, after a trial implementa-tion period of approximately one year, the basic approach be revised as appropriate to reflect the input of the agen-cies involved. The approach should then be presented as a revision of the Informational Guide, presenting details of the approach and implementation.
REFERENCES
SCHMIDT, I., "Visual Considerations of Man, the Ve-hicle, and the Highway, Part I." Pubi. SP-279, Soc. of Automotive Eng. (Mar. 1966). BLACKWELL, R. H., SCHWAB, R. N., and PRITCHARD, B. S., "Visibility and Illumination Variables in Road-way Visual Tasks." Ilium. Eng. (May 1964). BRYAN, W. E., and HOFSTETTER, H. W., "Vision of Automobile Drivers." I. Amer. Opt. Assoc., 29 (1958). GUTH, S. K., "A Method for the Evaluation of Dis-comfort Glare." Illum. Eng., Vol. 58, pp. 351-364 (May 1963). ADRIAN, W., and SCHREUDER, D. A., "A Simple Method for the Appraisal of Glare in Street Light-ing." Lighting Res. and Tech., Vol. 2, No. 2, pp. 61-73 (1970). BLACKWELL, H. R., "Evaluating the Significance of Reflected Glare." Ilium. Eng., pp. 217-243 (Apr. 1963). EINHORN, H. D., "Predetermination of Direct Dis-
comfort Glare." Ilium. Eng., Vol. 26, No. 4, pp. 154-164 (1961). DEBOER, J. B., Ed., Public Lighting. Philips Techni-cal Laboratory, Eindhoven, pp. 31-59 (1967). KiIG, G. F., and LUNENFELD, H., "Development of Information Requirements and Transmission Tech-niques for Highway Users." NCHRP Report 123 (197.1). An Informational Guide for Roadway Lighting. American Assn. of State Highway and Transportation Officials (1969). KETVIRTIS, A., Highway Lighting Engineering. Foun-dation of Canada Engineering Corporation Limited, Toronto (1967). Correspondence with state highway departments re-garding warranting guidelines. "American National Standard Practice for Roadway Lighting." Illuminating Engineering Society and American National Standards Assn. (unpubl.) (1971).

60
14. Box, P. C., "Relationship Between Illumination and Freeway Accidents." Project 85-67, Illuminating En- gineering Research Inst., New York (Apr. 1970). 23.
15. Box, P. C., "Effect of Highway Lighting on Night Capacity." Traffic Eng., Vol. 28, No. 4, pp. 9-15, 23 (Jan. 1958); Hwy. Res. Abst. (May 1958). 24.
16. WALKER, W. P., "Effects of Highway Lighting on Driver Behavior." Proc. HRB, Vol. 20 (1940) pp. 511-521.
17. WALTON, N. E., and ROWAN, N. J., "Final Report, Supplementary Studies in Roadway Lighting. Rep. 25. No. 75-13, Texas Transportation Inst., College Sta- tion,Tex. (1969).
18. "Down Go Accidents and Robberies." Amer. City, 26. Vol. 80, No. 11, p. 116 (Nov. 1965).
19. "Planned Light Prevents Crime and Reduces Acci- dents." Amer. City, Vol. 78, No. 3, pp. 125-126 27. (Mar. 1963).
20. MORRAY, J. H., "Atlanta Lighting Cuts Crime 5%, Averts 1700 Traffic Accidents." Amer. City, Vol. 67, 28. No. 9, pp. 157-161 (Sept. 1952).
21. LURKIS, A., "Good Lighting is Better Than Police- men." Amer. City, Vol. 77, No. 11, pp. 129, 135-136 29. (Nov. 1962).
22. "Lighting Pedestrian Crossings." Road Safety News-
letter (June, July, Aug. 1950); Hwy. Res. Abst. (Mar. 1951). CARMODY, D. J., "Lighted Crossings Are Safe." Rural and Urban Roads, Vol. 4, No. 9, pp. 90-91 (Sept. 1966). ROWAN, N. J., Woons, D. L., and JOHNSON, J. H., "A Summary Report of the Significant Points from the Diagnostic Field Studies on Highway Lighting." Res. Rep. No. 606-4, Texas Transportation Inst. (Sept. 1970). "Traffic Control and Roadway Elements—Their Rela-tionship to Highway Safety." Cbapters 1-12. Highway Users Federation for Safety and Mobility (1971). "International Recommendations for the Lighting of Public Thoroughfares." Pub!. C.I.E. No. 12 (E-3.3.1) (1965). WALTON, N. E., and ROWAN, N. J. "High-Mast Light-ing." Res. Rep. No. 75-12, Texas Transportation Inst. (1969). CASSEL, A., and MEDVILLE, D., "Economic Study of Roadway Lighting." NCHRP Report 20 (1966) 77 pp. MCFARLAND, W. F., and WALTON, N. E., "Cost-Effectiveness Analysis of Roadway Lighting Systems." Res. Rep. 137-1, Texas Transportation Inst. (1969).
APPENDIX A
STATE-OF-THE-ART QUESTIONNAIRE SURVEYS
QUESTIONNAIRE DEVELOPMENT AND OBJECTIVES
As part of the state-of-the-art study, questionnaires were constructed to provide information on current warrants, guidelines, and practices of roadway lighting. It was be-lieved that information concerning the prevailing attitudes of state highway engineers, municipal public works depart-ments, and other recognized experts in the field of roadway lighting toward current AASHTO guidelines would also be beneficial. With information gained from the question-naires, the project staff hoped to more easily pinpoint weaknesses, if any, in the current published version of AASHTO guidelines. Therefore, the questionnaires were submitted to practicing highway engineers and other job-related personnel, as these professionals would be familiar with, as well as knowledgeable of, these guidelines.
Thirty-three statements concerning the various empirical guidelines provided by AASHTO were selected at random from AASHTO's An Informational Guide for Roadway Lighting. These statements covered warranting conditions and design values for (a) freeways, (b) highways other than freeways, (c) tunnels and underpasses, and (d) inter-
changes and intersections of freeways and other highways. A scale of possible responses for each statement ranged from "strongly agree," through "agree," "undecided," and "disagree," to "strongly disagree." Each respondent was to check one of these responses to indicate his attitude toward the statement. Scores of 5, 4, 3, 2, and 1 were assigned to each of the response categories, respectively.
QUESTIONNAIRE FORMS
State Highway Departments
As previously stated, the first 31 "questions" were actually statements selected at random from the AASHTO Guide for Roadway Lighting. These items on which the response scores were based, and which were common to all three basic questionnaires, as explained later, were as follows:
Supplemental lighting is really not necessary for underpasses under 75 ft in length, with respect to traffic operations.
If traffic volume is the only consideration, continu-ous freeway lighting is only justified for sections of free-

61
way in urban and suburban areas where the average daily traffic (ADT) count is 60,000 or greater.
The application of transitional lighting in freeway lighting situations will enhance driver comfort and expedite traffic operations.
Continuous freeway lighting is desirable if local streets adjacent to the freeway are lighted, and are visible from the freeway.
One case where a continuous freeway lighting system is justified occurs where the width of the roadway is re-stricted for some significant reason.
Continuous freeway lighting is necessary when the freeway passes through residential, commercial,. or indus-trial areas that are lighted.
Rural intersections with raised channelizing or di-visional islands may require a greater illumination level than what is normally applicable.
In urban areas where several successive interchanges are in close proximity to one another, it is desirable to incorporate a continuous freeway lighting system.
Short underpasses can be adequately lighted from luminaires positioned outside the underpasses.
When cross streets, some of which are lighted, inter-sect with a freeway at relatively short intervals, the freeway should be lighted continuously.
Where crossroad approaches are lighted, the cross-road through traffic lanes should also be lighted at ap-proximately the same level.
Street lighting in general will contribute substantially to the efficiency, safety, and comfort of vehicular and pedestrian traffic in urban areas.
Consideration should be given to reducing the ef-fects of sudden light change on drivers as they enter and exit a partially lighted interchange.
The lighting of an interchange is justified when lights from commercial or industrial developments create visi-bility problems for drivers on the interchange.
One justification for lighting long bridges should be aesthetic appeal.
Tunnels within the range of 100 to 500 ft should have two levels of illumination (i.e., night and day).
Lighting may be necessary where resulting benefits, both tangible and intangible, are in the interest of the general public or local governmental agencies.
The level of illumination for ramps where complete interchange lighting is provided should correspond to the illumination level for freeway through traffic.
Bridges and overpasses should be lighted at the same level of illumination and uniformity ratio as other roadway areas adjoining the bridge.
The level of illumination for continuous freeway lighting conditions should not be less than 0.6 footcandles average.
When raised channelizing or divisional islands are located at the intersections of ramp terminals with a cross-road, partial interchange lighting is justified.
It is desirable to minimize variation in the level of illumination or in the uniformity ratio on a continuously lighted freeway.
For continuous freeway lighting installations, the
average-to-minimum uniformity of illumination ratio should approach 3:1.
24. The task of partial interchange lighting should be to illuminate the through traffic lanes and speed change lanes at diverging and merging locations.
25. Continuous freeway lighting is justified where, for a length of two or more miles, the freeway passes through a highly developed urban or suburban area.
26. Lighting should be provided for major arterials in urbanized areas, where the night-to-day accident ratio is high.
27. At locations where unusual weather conditions exist (i.e., abnormal amounts of fog, ice, or snow) lighting should be installed for the purpose of alleviating potential traffic problems.
28. From the perspective of traffic operations, there is little if any advantage to providing fixed-source lighting on long bridges, even though the approaches are unlighted.
29. Continuous freeway sections with a high night-to-day accident ratio should be lighted.
30. One instance where an interchange should be lighted is when the crossroads of that interchange are lighted for ½ mile or more on either side.
31. Three levels of illumination are required for long tunnels:
One for daytime entrance zones. One for daytime interior zones. One for night.
(The 33 statements previously mentioned are contained in the 31 items listed, as item 31 is a three-part statement.)
The remaining items (32 through 56), designed to elicit information concerning guidelines and practices of road-way lighting currently used by the state highway depart-ments, were as follows:
32. Do you use the same warrants for non-federally funded projects as you do for federally funded projects involving:
The installation of continuous lighting systems? ..Yes _No
If no, how do they differ? The installation of safety lighting systems?
_Yes _No If no, how do they differ? The installation of intersectional lighting sys-tems?
_Yes _No If no, how do they differ?
If the warrants are different, and second copies are available, please enclose a copy with the return.
33. Do you give any consideration to roadway geome-try, environmental conditions, or traffic conditions beyond the scope of AASHTO warrants?
_Yes _No If yes, to what extent and under what circumstances?
The following questions pertain to the procedure used for establishing a lighting design once lighting is found to be warranted. In answering the questions, please show the origin of information used in your answers. If this infor-
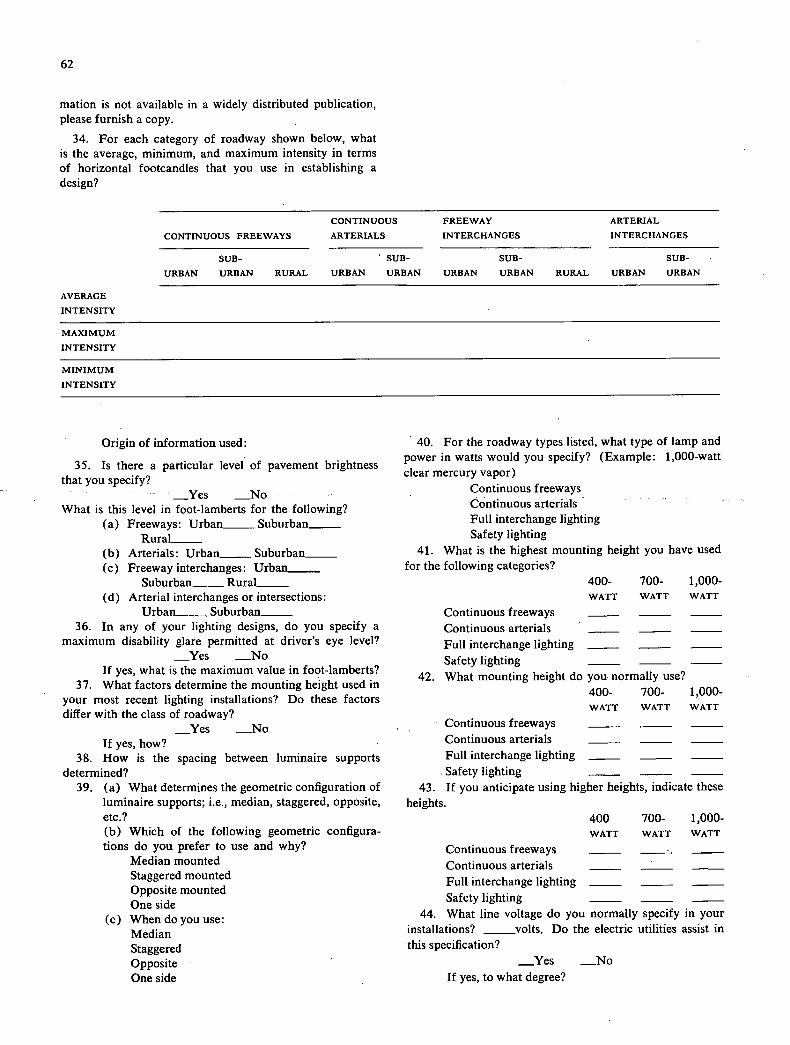
62
mation is not available in a widely distributed publication, please furnish a copy.
34. For each category of roadway shown below, what is the average, minimum, and maximum intensity in terms of horizontal footcandles that you use in establishing a design?
CONTINUOUS FREEWAY ARTERIAL
CONTINUOUS FREEWAYS ARTERIALS INTERCHANGES INTERCHANGES
SUB- I SUB- SUB- SUB-
URBAN URBAN RURAL URBAN URBAN URBAN URBAN RURAL URBAN URBAN
AVERAGE
INTENSITY
MAXIMUM
INTENSITY
MINIMUM
INTENSITY
Origin of information used:
35. Is there a particular level of pavement brightness that you specify?
_Yes o - What is this level in foot-lamberts for the following?
Freeways: Urban_____ Suburban_____ Rural_____
Arterials: Urban_____Suburban_____ Freeway interchanges: Urban
Suburban__ Rural_____ Arterial interchanges or intersections:
Urban_____ Suburban_____ 36. In any of your lighting designs, do you specify a
maximum disability glare permitted at driver's eye level? _Yes _No
If yes, what is the maximum value in foot-lamberts? 37. What factors determine the mounting height used in
your most recent lighting installations? Do these factors differ with the class of roadway?
_Yes _No If yes, how?
38. How is the spacing between luminaire supports determined?
39. (a) What determines the geometric configuration of luminaire supports; i.e., median, staggered, opposite, etc.?
Which of the following geometric configura- tions do you prefer to use and why?
Median mounted Staggered mounted Opposite mounted One side When do you use: Median Staggered Opposite One side
For the roadway types listed, what type of lamp and power in watts would you specify? (Example: 1,000-watt clear mercury vapor)
- Continuous freeways Continuous arterials - - - - Full interchange lighting Safety lighting
What is the highest mounting height you have used for the following categories?
400- 700- 1,000- WATT WATT WATT
Continuous freeways Continuous arterials Full interchange lighting Safety lighting What mounting height do you normally use?
400- 700- 1,000- WATT WATT WATT
Continuous freeways Continuous arterials _____ _____ Full interchange lighting Safety lighting If you anticipate using higher heights, indicate these
heights. 400 700- 1,000- WATT WATT WATT
Continuous freeways Continuous arterials Full interchange lighting Safety lighting What line voltage do you normally specify in your
installations? _______volts. Do the electric utilities assist in this specification?
_Yes _No If yes, to what degree?

63
The following questions pertain to your normal main-tenance and operation of lighting installations.
At what time intervals are cleaning and relamping performed on the following types of lighting installations?
Continuous freeway months Continuous arterial _____months Full interchange lighting months Safety lighting _____months Do you perform all of your own maintenance work
on lighting installations? _Yes No
If no, who does it for you, and what portion? Are you experiencing any difficulty with regard to
maintenance of a particular type of mounting or mounting height?
_Yes _No If yes, indicate the problem. Are you experiencing any difficulty with a specific
lamp type? _Yes _No
If yes, indicate what type and the difficulty. What ADT counts would you like to use in deter-
mining when to install continuous freeway lighting for the following areas?
Urban Suburban Rural What ADT ramp traffic counts would you like to
use in determining when to completely light an interchange for the following areas?
Urban Suburban Rural What ADT through traffic counts would you like to
use in determining when to install partial interchange light-ing for the following areas?
Urban Suburban Rural What ADT ramp traffic counts would you like to
use in determining when to partially light an interchange in the following areas?
Urban Suburban Rural
53. Following is a list of various types of luminaire support bases in use today. If you use the base, check the space to the left of it, and also check the appropriate box to the right indicating where you use it.
HIGH LOW
SPEED SPEED
(a)_Steel flange base, with guardrail protection exposed
(b)_Aluminum flange base, with guardrail protection exposed
(c)_Steel transformer base, with guardrail protection exposed
(d)_Aluminum transformer base, with guardrail protection exposed
(e)_Progressive shear base, with guardrail protection exposed
(f)_Slip base, with guardrail protection exposed
Your name (optional): Name and address of State Highway Department: Would you or one of your representatives be will-
ing to discuss further your lighting practices with repre-sentatives of Texas Transportation Institute, Texas A&M University?
_Yes _No If yes, is there a convenient date(s) between now and September 15?
Municipal Public Works Departments
For the questionnaire to municipal public works depart-ments, the first 31 items were the same as for the question-naire to the state highway departments. The remaining items (32 through 52), designed to elicit information con-cerning guidelines and practices of roadway lighting cur-rently used by municipal public works departments, were as follows: -
Do you give any consideration to roadway geome-try, environmental conditions, or traffic conditions in estab-lishing lighting needs?
_Yes _No If yes, to what extent and under what circumstances?
The following questions pertain to the procedure used for establishing a lighting design once lighting is found to be warranted. In answering the questions, please show the origin of information used in your answers. If this infor-mation is not available in a widely distributed publication, please furnish a copy.
For each category of roadway shown below, what is the average, minimum, and maximum intensity in terms of horizontal footcandles that you use in establishing a design?
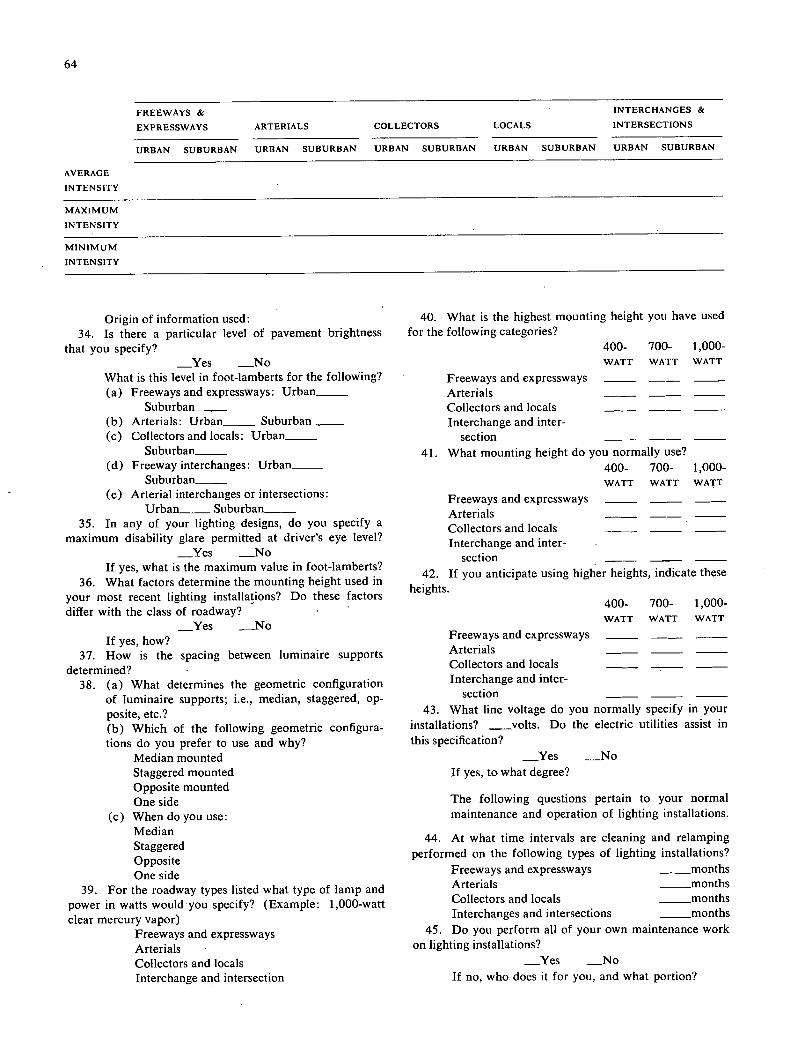
FREEWAYS & INTERCHANGES &
EXPRESSWAYS ARTERIALS COLLECTORS LOCALS INTERSECTIONS
URBAN SUBURBAN URBAN SUBURBAN URBAN SUBURBAN URBAN SUBURBAN URBAN SUBURBAN
64
AVERAGE
INTENSITY
MAXIMUM
INTENSITY
MINIMUM
INTENSITY
Origin of information used: 34. Is there a particular level of pavement brightness
that you specify? _Yes _No
What is this level in foot-lamberts for the following? Freeways and expressways: Urban_____
Suburban_____ Arterials: Urban_____ Suburban_____ Collectors and locals: Urban_.......
Suburban_____ Freeway interchanges: Urban_____
Suburban_____ Arterial interchanges or intersections:
Urban_____ Suburban_____ 35. In any of your lighting designs, do you specify a
maximum disability glare permitted at driver's eye level? _Yes _No
If yes, what is the maximum value in foot-lamberts? 36. What factors determine the mounting height used in
your most recent lighting installations? Do these factors differ with the class of roadway? .
_Yes _No If yes, how?
37. How is the spacing between luminaire supports determined?
38. (a) What determines the geometric configuration of luminaire supports; i.e., median, staggered, op-posite, etc.?
Which of the following geometric configura- tions do you prefer to use and why?
Median mounted Staggered mounted Opposite mounted One side When do you use: Median Staggered Opposite One side
39. For the roadway types listed what type of lamp and power in watts would you specify? (Example: 1,000-watt clear mercury vapor)
Freeways and expressways Arterials Collectors and locals Interchange and intersection
What is the highest mounting height you have used for the following categories?
400- 700- 1,000- WATT WATT WATT
Freeways and expressways Arterials Collectors and locals --Interchange and inter-
section -- What mounting height do you normally use?
400- 700- 1,000- WATT WATT WATT
Freeways and expressways Arterials Collectors and locals Interchange and inter-
section If you anticipate using higher heights, indicate these
heights. 400- 700- 1,000- WATT WATT WATT
Freeways and expressways -- Arterials Collectors and locals Interchange and inter-
section What line voltage do you normally specify in your
installations? ..volts. Do the electric utilities assist in this specification?
_Yes _No If yes, to what degree?
The following questions pertain to your normal maintenance and operation of lighting installations.
At what time intervals are cleaning and relamping performed on the following types of lighting installations?
Freeways and expressways months Arterials _____months Collectors and locals _____months Interchanges and intersections _____months Do you perform all of your own maintenance work
on lighting installations? _Yes _No
If no, who does it for you, and what portion?

65
Are you experiencing any difficulty with regard to maintenance of a particular type of mounting or mounting height?
_Yes No If yes, indicate the piobleiti: Are you experiencing any difficulty with 'a specific
lamp type?
_Yes No If yes, indicate what type and the difficulty. What traffic volumes (if applicable) do you use in
determining when to light for the following roadway categories.
URBAN SUBURBAN
Freeways and expressways Arterials Collectors _ Locals Interchanges Intersections
Following is a list of various types of luminaire sup-port bases in use today. If you use the base, check the space to the left of it, and also check the appropriate box to the right indicating where you use it.
HIGH LOW
SPEED SPEED
(a)_Steel flange base, with guardrail protection exposed
(b)_Aluminum flange base, with guardrail protection exposed
(c)_Steel transformer base, with guardrail protection exposed
(d)_Aluminum transformer base, with guardrail protection exposed
(e)_Progressive shear base, with guardrail protection exposed
(f)_.Slip base, with guardrail protection exposed
(g)_Other, with guardrail protection exposed
Your name (optional): Name and address of municipalities you represent: Would you or one of your representatives be will-
ing to discuss further your lighting practices with repre-sentatives of Texas Transportation Institute, Texas A&M University?
Yes No
If yes, is there a convenient date(s) between now and October 1?
Individual Experts
The questionnaire to individual experts consisted only of the first 31 items used for both the state highway depart-ment and the municipal public works department versions.
No further questions were included, as the type of infor-mation sought would not be applicable to this group of respondees.
QUESTIONNAIRE SURVEY RESULTS
General
Questionnaires of the proper make-up were sent, respec-tively, to the 50 state highway departments, 50 cities, and 25 individuals. Each respondent was assigned a score that was determined by summing the individual item scores (for the 33 common statement responses). This total score was then used as an indication of a respondent's attitude to-ward the AASHTO guidelines. if a respondent strongly agreed with all 33 statements, his total score was 165. Like-wise, if he agreed, 132; was undecided, 99; disagreed, 69; or strongly disagreed, 33. A frequency distribution of these total scores is shown in Figure A-I. The results indicated that 78 out of 90 respondents are in agreement with the AASHTO guidelines; however, this did not imply that there is no significant specific disagreement with the AASHTO guidelines.
Of the 125 questionnaires sent out, 90 were returned. A nonparametric analysis of variance for differences in total scores for the three categories of respondents was attempted, but was invalidated by the large number of tie scores in the data. However, it did not appear that the average total response score differed significantly for the three groups (Table A-i). The average total score for all respondents was 128.348, within the range of the "agree" category. In fact, average scores for all categories fell within this range.
An analysis of the questionnaire statements according to topic categories is presented in the following. Statements referring to freeways are discussed first, interchanges sec-ond, highways other than freeways third, and underpasses, overpasses, tunnels, and bridges last. The questions and statement scores for each category of respondent are pre-sented in Table A-2. The mean response and variance for each category of respondent are also reported in Table B-2 on a statement-by-statement basis.
Warrants
Freeways
Given a choice of two degrees of positive response (agree and strongly agree), a plurality of respondents chose "agree" rather than "strongly agree" for seven of the eleven statements related to the lighting of freeways. These seven statements included items 4, 5, 6, 10, 23, 25, and 29. This indicates an apparent unwillingness on the part of the re-spondents to strongly agree with the AASHTO guidelines as they pertain to freeway lighting installations. Statements 4 and 10 dealt with the lighting of streets adjacent to, or intersecting with, the freeway. Statements 6 and 25 were concerned with the lighting of a freeway that passes through highly developed property adjacent to the freeway. Three of the statements (2, 23, 29) dealt with various design values contained in the AASHTO guidelines. A surprising finding with regard to the average-to-minimum maintained
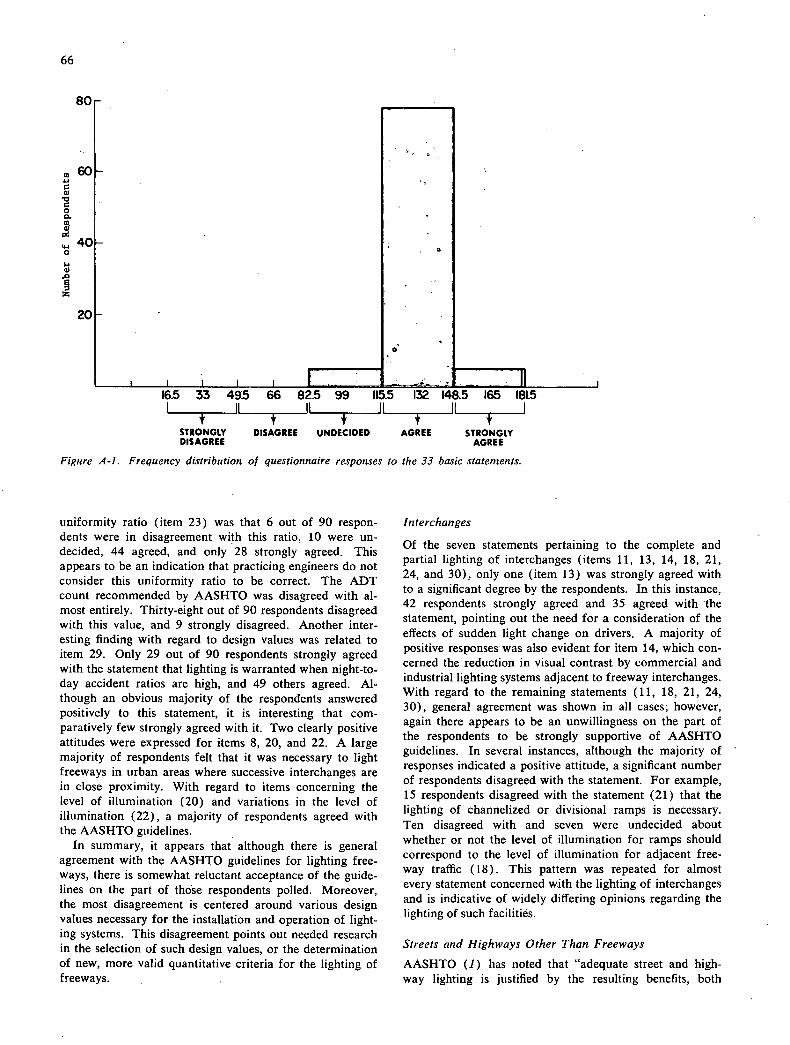
66
II II II II I 4,
STRONGLY DISAGREE UNDECIDED AGREE STRONGLY DISAGREE AGREE
Figure A-I. Frequency distribution of questionnaire responses to the 33 basic statements.
uniformity ratio (item 23) was that 6 out of 90 respon-dents were in disagreement with this ratio, 10 were un-decided, 44 agreed, and only 28 strongly agreed. This appears to be an indication that practicing engineers do not consider this uniformity ratio to be correct. The ADT count recommended by AASHTO was disagreed with al-most entirely. Thirty-eight out of 90 respondents disagreed with this value, and 9 strongly disagreed. Another inter-esting finding with regard to design values was related to item 29. Only 29 out of 90 respondents strongly agreed with the statement that lighting is warranted when night-to-day accident ratios are high, and 49 others agreed. Al-though an obvious majority of the respondents answered positively to this statement, it is interesting that com-paratively few strongly agreed with it. Two clearly positive attitudes were expressed for items 8, 20, and 22. A large majority of respondents felt that it was necessary to light freeways in urban areas where successive interchanges are in close proximity. With regard to items concerning the level of illumination (20) and variations in the level of illumination (22), a majority of respondents agreed with the AASHTO guidelines.
In summary, it appears that although there is general agreement with the AASHTO guidelines for lighting free-ways, there is somewhat reluctant acceptance of the guide-lines on the part of those respondents polled. Moreover, the most disagreement is centered around various design values necessary for the installation and operation of light-ing systems. This disagreement points out needed research in the selection of such design values, or the determination of new, more valid quantitative criteria for the lighting of freeways.
Interchanges
Of the seven statements pertaining to the complete and partial lighting of interchanges (items 11, 13, 14, 18, 21, 24, and 30), only one (item 13) was strongly agreed with to a significant degree by the respondents. In this instance, 42 respondents strongly agreed and 35 agreed with the statement, pointing out the need for a consideration of the effects of sudden light change on drivers. A majority of positive responses • was also evident for item 14, which con-cerned the reduction in visual contrast by commercial and industrial lighting systems adjacent to freeway interchanges. With regard to the remaining statements (11, 18, 21, 24, 30), general agreement was shown in all cases; however, again there appears to be an unwillingness on the part of the respondents to be strongly supportive of AASHTO guidelines. In several instances, although the majority of responses indicated a positive attitude, a significant number of respondents disagreed with the statement. For example, 15 respondents disagreed with the statement (21) that the lighting of channelized or divisional ramps is necessary. Ten disagreed with and seven were undecided about whether or not the level of illumination for ramps should correspond to the level of illumination for adjacent free-way traffic (18). This pattern was repeated for almost every statement concerned with the lighting of interchanges and is indicative of widely differing opinions regarding the lighting of such facilities.
Streets and Highways Other Than Freeways
AASHTO (1) has noted that "adequate street and high-way lighting is justified by the resulting benefits, both

67
tangible and intangible, to the general public." AASHTO has wisely stated, however, that "it is not practical at this time to establish specific warrants for the installation of roadway lighting to satisfy all prevailing conditions." The truth of this siatement is evidenced by the lack of workablc, objective criteria for the installation of street and highway illumination systems. In no other area of lighting is the engineer required to use so much subjective judgment. The recommendations of AASHTO in this area of lighting fur-ther point out the need for relevant objective design cri-teria. Furthermore, this lack of quantitative lighting cri-teria is reflected in the responses to statements 7, 12, 26, 27, and 3 regarding the lighting of streets and highways other than freeways. For three of the five statements (7, 27, 3) the response distribution is somewhat scattered, and the number of "undecided" responses is unusually large. However, the responses to statements 12 and 26 point out the major role of lighting in urbanized areas and heavily traveled streets and highways. Not only do the highly posi-tive responses to these statements serve to accent the great-est contribution of street lighting, they are also indicative of needed research in this area. Development of adequate design criteria and warrants should greatly reduce the inci-dence of crime, auto accidents, and pedestrian safety in urban areas.
Bridges, Underpasses, Overposses, and Tunnels
The lighting of bridges, underpasses, and other related structures is one of the more specialized areas of lighting and illumination system design. Each structure is unique; therefore, generalities in lighting design are small in scope compared to applications of other lighting techniques. In this section of the questionnaire, one statement (item 1) was the reverse of its AASHTO counterpart; that is, it was stated in terms opposite to those in the AASHTO guide-lines. Thus, those who disagreed with the statement agreed with the AASHTO guidelines. In this instance, 36 respon-dents indicated that they were in agreement with the state-ment concerning the necessity of supplemental lighting for underpasses 75 ft in length; however, 45 respondents were of the opinion that supplemental lighting was unnecessary. This polarization of responses is an indication of the lack of general design criteria for the lighting of certain high-way structures. There appears to be little disagreement with the statement (31) regarding the necessity for three levels of illumination in long tunnels. A definite majority of respondents indicated they felt separate illumination lev-els were required for daytime entrance zones, daytime in-terior zones, and nighttime. A polarization of responses is also evident for two statements (15 and 28) concerning the lighting of bridges. There is obvious disagreement among respondents as to the necessity of lighting bridges when the approaches are unlighted and the lighting of bridges for aesthetic appeal. This significant disagreement provides further supportive evidence of the need for quantitative and general design criteria for the lighting of bridges, over-passes, and underpasses.
TABLE A-i
TOTAL SCORES OF RESPONDENTS FROM STATE HIGHWAY DEPARTMENTS, MUNICIPAL PUBLIC WORKS DEPARTMENTS, AND INDIVIDUAL EXPERTS
RESPONDENT NO. 51W PWD IE
1 121 150 133 2 144 126 126 3 123 128 130 4 127 118 142 5 154 136 127 6 137 118 123 7 136 134 121 8 124 105 120 9 91 77 135
10 134 125 127 11 126 131 148 12 125 124 144 13 129 145 129 14 146 134 159 15 116 121 124 16 124 122 133 17 121 129 128 18 114 149 130 19 125 128 127 20 123 137 126 21 120 116 22 127 129 23 110 117 24 128 146 25 144 122 26 135 27 126 28 140 29 120 30 130 31 119 32 116 33 118 34 119 35 125 36 136 37 121 38 143 39 132 40 156 41 130 42 137 43 140 44 , 112
Avg. score 127.818 126.680 131.600 Over-all avg. score 128.348
Summary
Based on an analysis of the questionnaire, there appear to be several conclusions that may be drawn regarding the sufficiency of the AASHTO guidelines. Most important, of the engineers surveyed, only a few appeared wholeheartedly supportive of the AASHTO guidelines as they now stand. Although there is general agreement with these guidelines, the responses of the individuals indicate several areas in which improvement is needed. There is a definite need for development of relevant, objective design criteria for the

68
TABLE A-2
SUMMARY OF RESPONSES
NUMBER OF RESPONDENTS ANSWERING
GROUP STRONGLY UNDE- STRONGLY QUESTION TYPE ' AGREE AGREE CIDED DISAGREE DISAGREE
- X SL
(a) Statements Pertaining to Freeways
2. If traffic volume is the only considera- SHD 4 7 6 19 1 2.54 1.509 tion, continuous freeway lighting is PWD 1 7 2 12 3 2.48 1.260 only justified for sections of freeway IE 1 3 4 7 5 2.40 1.410 in urban and suburban areas where All 6 17 12 38 9 the average daily traffic (ADT) count is 60,000 or greater.
4. Continuous freeway lighting is desir- SHD 14 24 3 2 1 4.09 0.782 able if local streets adjacent to the PWD 6 15 2 2 0 4.00 0.667 freeway are lighted and are visible IE 8 10 1 1 0 4.25 0.618 from the freeway. All 28 49 6 5
5. One case where a continuous freeway SHD 14 20 6 4 0 4.00 0.837 lighting system is justified occurs where PWD 8 13 2 2 0 4.08 0.743 the width of the roadway is restricted IE 9 10 1 0 0 4.40 0.357 for some significant reason. All 43 9 6 0
6. Continuous freeway lighting is neces- SHD 9 27 2 5 1 3.86 0.911 sary when the freeway passes through PWD 6 14 2 3 0 3.92 0.827 residential, commercial, or industrial IE 9 9 2 0 0 4.35 0.450 areas that are lighted. All 50 6 8 1
8. In urban areas where several successive SHD 22 20 0 1 1 4.38 0.661 interchanges are in close proximity to PWD 13 11 1 0 0 4.44 0.507 one another, it is desirable to incorpo- IE 8 11 1 0 0 4.35 0.345 rate a continuous freeway lighting All T3 42 2 system.
10. When cross streets, some of which are SHD 11 16 11 5 1 3.70 1.096 lighted, intersect with a freeway at rel- PWD 6 15 3 1 0 4.04 0.540 atively short intervals, the freeway IE 6 13 1 0 0 4.25 0.303 should be lighted continuously. All 23 44 15 6 1
20. The level of illumination for continu- SHD 20 16 4 4 0 4.18 0.896 ous freeway lighting conditions should PWD 11 11 1 2 0 4.24 0.773 not be less than 0.6 footcandles aver- IE 10 4 2 2 2 3.90 1.989 age. All
22. It is desirable to minimize variation in SHD 24 17 0 3 0 4.41 0.666 the level of illumination or in the uni- PWD 8 13 1 3 0 4.04 0.873 formity ratio on a continuously lighted IE 7 10 2 1 0 4.15 0.661 freeway. All
23. For continuous freeway lighting instal- SHD 16 22 2 2 2 4.09 1.105 lations, the average-to-minimum uni- PWD 4 13 6 2 0 3.76 0.690 formity of illumination ratio should IE 8 9 2 0 0 4.20 0.695 approach 3: 1. All 28 44 4 2
25. Continuous freeway lighting is justified SHD 8 23 5 6 2 3.66 1.160 where, for a length of two or more PWD 3 17 2 3 0 3.80 0.666 miles, the freeway passes through a IE 6 11 8 0 0 4.15 0.450 highly developed urban or suburban All 17 51 15 9 2 area.
29. Continuous freeway sections with a SHD 14 23 5 2 0 4.11 0.615 high night-to-day accident ratio should PWD 7 14 3 1 0 4.08 0.576 be lighted. IE 8 12 0 0 0 . 4.40 0.253
All 29 49 8 3 0
(b) Statements Pertaining to Interchanges
11. Where crossroad approaches are lighted, SHD 11 25 4 3 1 3.95 0.835 the crossroad through traffic lanes PWD 4 14 2 5 0 3.68 0.977 should also be lighted at approxi- IE 7 11 1 1 0 4.20 0.589 mately the same level. All Y2 50 7 9 1
13. Consideration should be given to reduc- SHD 18 19 4 2 1 4.14 0.881 ing the effects of sudden light change on PWD 13 11 0 1 0 4.44 0.507 drivers as they enter and exit a partially IE 11 5 3 1 0 4.30 0.853 lighted interchange. All 42- 7 4 1

69
TABLE A-2 (Continued)
NUMBER OF RESPONDENTS ANSWERING
GROUP STRONGLY UNDE- STRONGLY - QUESTION TYPE AGREE AGREE CIDED DISAGREE DISAGREE X S
14. The lighting of an interchange is justi- SHD 18 23 0 2 1 4.25 0.750 tied when lights from commercial or in- PWD 10 11 1 3 0 4.12 0.943 dustrial developments create visibility IE 10 8 2 0 0 4.40 0.463 problems for drivers on the interchange. All
18. The level of illumination for ramps SHD 8 33 1 2 0 4.07 0.391 where complete interchange lighting is PWD 4 12 4 5 0 3.60 1.000 provided should correspond to the ii- IE 5 9 3 3 2 3.80 1.011 lumination level for freeway through All 17 54 8 10 2 traffic.
21. When raised channelizing or divisional SHD 11 17 3 13 0 3.59 1.364 islands are located at the intersections PWD 4 17 2 2 0 3.92 0.576
of ramp terminals with a crossroad, IE 5 10 4 0 1 3.70 1.484 partial interchange lighting is justified. All 9 15 1
24. The task of partial interchange lighting SHD 13 24 3 3 1 4.02 0.860 should be to illuminate the through PWD 3 17 2 3 0 3.80 0.666 traffic lanes and speed change lanes at IE 9 9 0 2 0 4.25 0.829 diverging and merging locations. All 5
30. One instance where an interchange SHD 8 26 6 3 1 3.75 1.122 should be lighted is when the cross- PWD 3 21 0 1 0 4.04 0.290 roads of that interchange are lighted IE 4 13 3 0 0 4.05 0.366 for ½ mile or more on either side. All 15 9 4 1
(c) Statements Pertaining to Highways Other Than Freeways
3. The application of transitional lighting SHD 11 21 7 5 0 3.86 0.864 in freeway lighting situations will en- PWD 6 15 2 2 0 4.00 0.667 hance driver comfort and expedite traf- IE 11 6 1 0 0 4.30 0.957 fic operations. All
7. Rural intersections with raised chan- SHD 12 16 5 10 1 3.63 1.399 nelization or divisional islands may re- PWD 5 17 1 2 0 4.00 0.583 quire a greater illumination level than IE 8 7 2 3 0 4.00 1.157 what is normally applicable. All 8 15 1
12. Street lighting in general will contribute SHD 22 17 3 1 1 4.32 0.780 substantially to the efficiency, safely, PWD 17 8 0 0 0 4.68 0.226 and comfort of vehicular and pedestrian IE 12 7 1 0 0 4.55 0.360 traffic in urban areas. All T, 32 4 1 1
26. Lighting should be provided for major SHD 21 22 1 0 0 4.45 0.300
arterials in urbanized areas, where the PWD 11 13 0 1 0 4.36 0.490 night-to-day accident ratio is high. IE 13 7 0 0 0 4.65 0.239
All 45 42 1 1 0
27. At locations where unusual weather con- SHD 8 16 11 9 0 3.52 1.046 ditions exist (i.e., abnormal amounts of PWD 6 15 4 0 0 4.08 0.410 fog, ice, or snow) lighting should be in- IE 8 8 4 0 0 4.20 0.589 stalled for the purpose of alleviating All - 19 9 0 potential traffic problems.
(d) Statements Pertaining to Underpasses, Overpasses, Bridges, and Tunnels
1. Supplemental lighting is really not nec- SHD 5 22 6 10 1 3.45 1.091 essary for underpasses under 75 ft in PWD 1 7 2 12 3 2.64 1.323 length, with respect to traffic operations. IE 2 8 0 6 4 2.90 1.989
All 8 37 8 28 8
9. Short underpasses can be adequately SHD 5 27 4 8 0 3.65 0.834 lighted from luminaires positioned out- PWD 4 11 4 5 1 3.32 1.727 side the underpasses. IE 1 11 2 4 2 3.25 1.355
All 10 49 10 17 3
15. One justification for lighting long SHD 3 10 8 15 8 2.73 1.459 bridges should be aesthetic appeal. PWD 0 5 4 13 3 2.44 0.923
IE 1 8 3 6 2 3.00 1.368
All 4 23 15 34 13

70
TABLE A-2 (Continued)
QUESTION GROUP TYPE '
NUMBER OF RESPONDENTS ANSWERING
STRONGLY UNDE- STRONGLY AGREE AGREE CIDED DISAGREE DISAGREE
- X S
16. Tunnels within the range of 100 to 500 SHD 11 21 7 5 0 3.86 0.865 ft should have two levels of illumination PWD 9 7 4 5 0 3.80 1.333 (i.e., night and day). IE 8 8 1 3 0 4.05 1.103
All 28 36 12 13 0 19. Bridges and overpasses should be SHD 11 31 0 2 0 4.16 0.416
lighted at the same level of illumina- PWD 5 15 1 4 0 3.84 0.890 tion and uniformity ratio as other road- IE 4 11 0 4 1 3.65 1.397 way areas adjoining the bridge. All YO - 1 i 1
28. From the perspective of traffic opera- SHD 1 20 4 12 7 2.91 1.387 tions, there is little if any advantage to PWD 0 5 5 13 2 2.52 0.843 providing fixed-source lighting on long IE 0 0 2 13 5 1.85 0.345 bridges, even though the approaches All - Ti 38 14 are unlighted.
3 1. Three levels of illumination are required for long tunnels:
(a) One for daytime entrance zones SHD 17 22 2 2 1 4.27 0.389 PWD 9 14 0 2 0 4.20 0.366 IE 14 6 0 0 0 4.70 0.221 All 40 42 2 4 1
(b) One for daytime interior zones. SHD 13 23 3 4 1 3.98 0.953 PWD 7 14 1 3 0 4.00 0.833 IE 11 9 0 0 0 4.55 0.261 All 31 46 4 7 1
(c) One for night. SHD 13 25 3 .2 1 4.07 0.763 PWD 8 13 2 2 0 4.08 0.743 IE 8 10 0 0 2 4.10 1.358 All 29 48 5 4 3
SHD = state highway departments; PWD = municipal public works departments; IE = individual experts
installation of lighting systems on freeways, interchanges and intersections, and streets and highways other than free-ways. Furthermore, warranting criteria of an empirical nature need to be determined and established on the basis of objectively obtainable information. This would make it possible to greatly facilitate the setting of lighting job pri-orities and lighting system design. In addition, quantita-tive guidelines are required and should be developed for bridges and other specialized structures.
Guidelines and Practices
State Highway Departments
Twenty questions (34-53) in the state highway department questionnaire were used to obtain data on guidelines and practices. These data are summarized and discussed in the following.
Lighting Intensity (Q. 34) .—This question asked for the average, minimum, and maximum intensities, in terms of horizontal footcandles, that are used in establishing a de-sign. Table A-3 summarizes the responses from the 44 states that replied. Some misunderstanding is evidenced in the tabulation; there was confusion as to the meanings of maximum intensity. The research agency staff desired
maximum and minimum design specifications, but some respondents answered in terms of maximum average and minimum average intensities.
Pavement Brightness (Q. 35) .—None of the 44 states responding indicated that pavement brightness is not speci-fied in design.
Glare (Q. 36) .--As with Question 35, none of the 44 states responding specify a maximum disability glare at driver's eye level. They are of the opinion either that the state of the art is not sufficient to make such a specifica-tion, or that it can be adequately controlled through other design considerations (such as choice of luminaire cut-off).
Factors Used to Determine Mounting Height (Q. 37).—This question requested a listing of those factors that deter-mined mounting height specifications in the most recent lighting installations. The responses are given in Table A-4. When asked if these factors differed with the class of road-way, 12 states responded yes, 32 states responded no. Of those responding yes, 6 cited standard practice, 2 cited utilization of existing utility poles, and one cited aesthetics, maintenance, economics, roadway width, land use, or installed by others.
Spacing Between Supports (Q. 38).—This question asked how the spacing between luminaire supports is de-
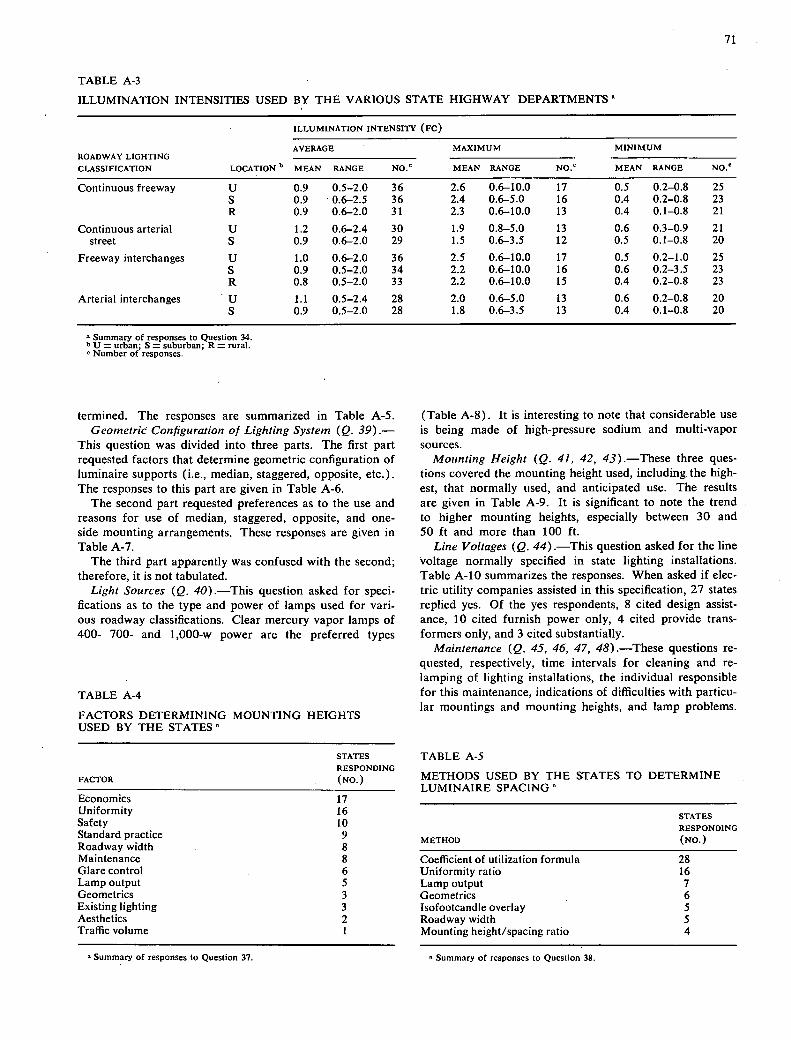
71
TABLE A-3
ILLUMINATION INTENSITIES USED BY THE VARIOUS STATE HIGHWAY DEPARTMENTS
ILLUMINATION INTENSITY (Ec)
AVERAGE
MAXIMUM
MINIMUM ROADWAY LIGHTING CLASSIFICATION
LOCATION" MEAN RANGE NO.0 MEAN RANGE NO.0 MEAN RANGE NO.
Continuous freeway U 0.9 0.5-2.0 36 2.6 0.6-10.0 17 0.5 0.2-0.8 25 S 0.9 0.6-2.5 36 2.4 0.6-5.0 16 0.4 0.2-0.8 23 R 0.9 0.6-2.0 31 2.3 0.6-10.0 13 0.4 0.1-0.8 21
Continuous arterial U 1.2 0.6-2.4 30 1.9 0.8-5.0 13 0.6 0.3-0.9 21 street S 0.9 0.6-2.0 29 1.5 0.6-3.5 12 0.5 0.1-0.8 20
Freeway interchanges U 1.0 0.6-2.0 36 2.5 0.6-10.0 17 0.5 0.2-1.0 25 S 0.9 0.5-2.0 34 2.2 0.6-10.0 16 0.6 0.2-3.5 23 R 0.8 0.5-2.0 33 2.2 0.6-10.0 15 0.4 0.2-0.8 23
Arterial interchanges U 1.1 0.5-2.4 28 2.0 0.6-5.0 13 0.6 0.2-0.8 20 5 0.9 0.5-2.0 28 1.8 0.6-3.5 13 0.4 0.1-0.8 20
Summary of responses to Question 34. b u = urban; S = suburban; R = rural.
Number of responses.
termined. The responses are Summarized in Table A-S. Geometric Configuration of Lighting System (Q. 39).-
This question was divided into three parts. The first part requested factors that determine geometric configuration of luminaire supports (i.e., median, staggered, opposite, etc.). The responses to this part are given in Table A-6.
The second part requested preferences as to the use and reasons for use of median, staggered, opposite, and one-side mounting arrangements. These responses are given in Table A-7.
The third part apparently was confused with the second; therefore, it is not tabulated.
Light Sources (Q. 40) .-This question asked for speci-fications as to the type and power of lamps used for vari-ous roadway classifications. Clear mercury vapor lamps of 400- 700- and 1,000-w power are the preferred types
TABLE A-4
FACTORS DETERMINING MOUNTING HEIGHTS USED BY THE STATES
STATES RESPONDING
FACTOR (No.)
Economics 17 Uniformity 16 Safety 10 Standard practice 9 Roadway width 8 Maintenance 8 Glare control 6 Lamp output 5 Geometrics 3 Existing lighting 3 Aesthetics 2 Traffic volume
(Table A-8). It is interesting to note that considerable use is being made of high-pressure sodium and multi-vapor sources.
Mounting Height (Q. 41, 42, 43).-These three ques-tions covered the mounting height used, including the high-est, that normally used, and anticipated use. The results are given in Table A-9. It is significant to note the trend to higher mounting heights, especially between 30 and 50 ft and more than 100 ft.
Line Voltages (Q. 44) .-This question asked for the line voltage normally specified in state lighting installations. Table A-10 summarizes the responses. When asked if elec-tric utility companies assisted in this specification, 27 states replied yes. Of the yes respondents, 8 cited design assist-ance, 10 cited furnish power only, 4 cited provide trans-formers only, and 3 cited substantially.
Maintenance (Q. 45, 46, 47, 48) .-These questions re-quested, respectively, time intervals for cleaning and re-lamping of lighting installations, the individual responsible for this maintenance, indications of difficulties with particu-lar mountings and mounting heights, and lamp problems.
TABLE A-S
METHODS USED BY THE STATES TO DETERMINE LUMINAIRE SPACING
STATES RESPONDING
METHOD (No.)
Coefficient of utilization formula 28 Uniformity ratio 16 Lamp output 7 Geometrics 6 Isofootcandle overlay 5 Roadway width 5 Mounting height/spacing ratio 4
Summary of responses to Question 37. " Summary of responses to Question 38.

72
TABLE A-6
FACTORS THAT DETERMINE LIGHTING SYSTEM GEOMETRIC CONFIGURATION USED BY THE STATES'
STATES
RESPONDING
FACTOR (No.)
Roadway width 24 Facility geometrics 12 Uniformity 12 Median width 10 Economics 9 Safety 6 Light intensity 5 Aesthetics 3 Mounting height 2
Summary of responses to Question 39a
The responses are summarized in Tables A-li, A-12, and A-13, respectively. In Table A-il, the large number of states having no regular maintenance schedule is surpris-ing, considering the importance of maintenance in roadway lighting. In Table A-l2 it is interesting that only four states perform all of their own maintenance. The items of inter-est in Table A-13 are the problems associated with heights greater than 30 ft.
Traffic Volumes (Q. 49, 50, 51, 52).—The state highway departments were given an opportunity in these questions to express their views concerning traffic volume as a war-ranting condition. Table A-14 summarizes these responses.
Luminaire Support Bases (Q. 53) .—Unless appropriate safety measures are included in lighting practices, much of the lighting designer's work can be for naught. This ques-tion requested information to determine safety practices
TABLE A-7
STATE PREFERENCES AND REASONS FOR VARIOUS GEOMETRIC CONFIGURATIONS
FACTOR
STATES RESPONDING (No.)
STAG- OPPO-
MEDIAN GERED SITE
ONE-
SIDE
Would not use 30 9 28 3 Better uniformity 1 26 1 3 Economics 0 8 0 5 Median considerations 8 4 0 4 Higher intensity 0 0 5 0 Geometric considerations 0 0 9 5 Delineation 0 1 0 2 Other factors 0 0 0 3
Summary of responses to Question 39b
involving luminaire Support bases. Table A-15 summarizes the use of various base types by the state highway depart-ments. It is gratifying to note the safety consciousness of the state highway departments as indicated by their use of acceptable breakaway features.
Municipal Public Works Departments
A questionnaire survey was also made of the largest mu-nicipality in each of the 50 states. The questionnaire was constructed to yield basically the same information as that desired from the state highway departments. The first 32 items were identical to corresponding items in the state questionnaire. The remaining questions (33-52), covering specific guidelines and practices in municipal applications, are discussed in the following. A total of 25 cities re-sponded to the questionnaire.
TABLE A-8
STATE HIGHWAY DEPARTMENT USE OF VARIOUS LAMP TYPES AND POWER"
LAMP
TYPE ROADWAY LIGHTING
CLASSIFICATION
STATES USING (No.)
175 w 250w 400w 700w 1,000w
Clear mercury Cont. freeways 0 1 14 16 18 vapor Cont. arterials 0 1 20 ii 12
Full interchange 0 1 21 11 12 Safety lighting 1 4 24 9 5
Color-improved Cont. freeways 0 0 2 1 2 mercury vapor Cont. arterials 0 0 4 1 1
Full interchange 0 0 3 1 2 Safety lighting 0 1 3 0
High-pressure Cont. freeways - 1 6 - - sodium Cont. arterials - 1 7 - -
Full interchange - 1 8 - - Safety lighting - 2 6 - -
Metal halide; Cont. freeways - - I - 4 multi-vapor Cont. arterials - - 1 - 3
Full interchange - - 1 - 6 Safety lighting - - 0 - 3
"Summary of responses to Question 40
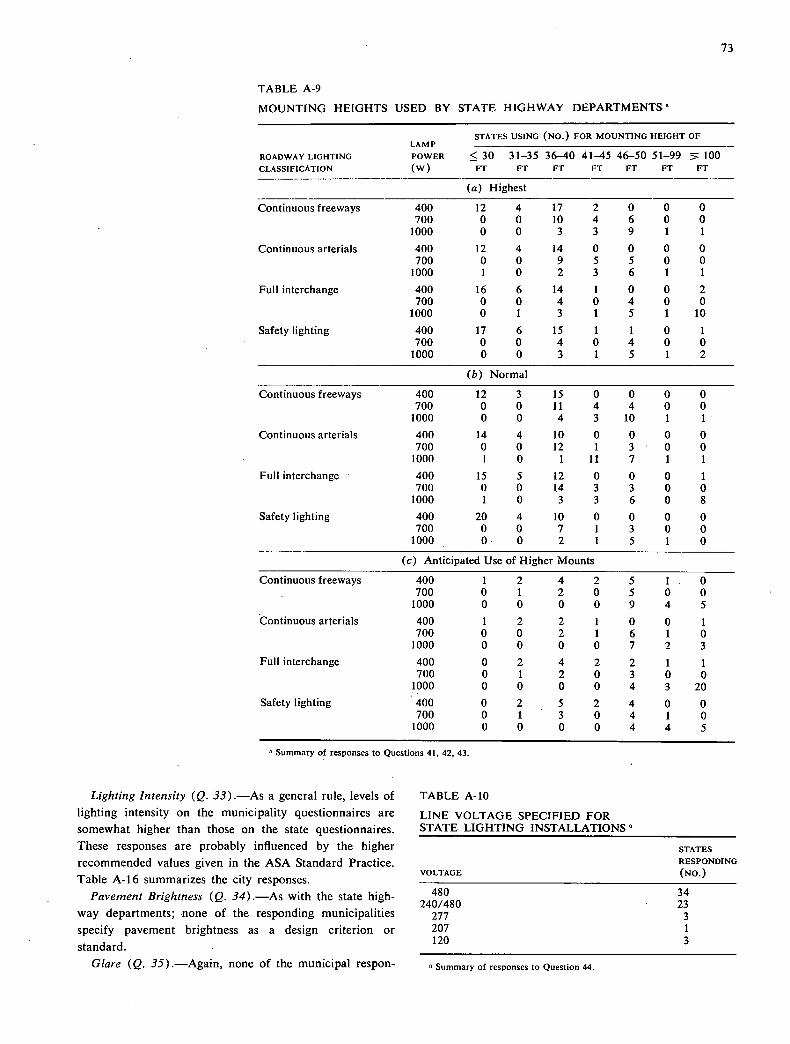
73
TABLE A-9
MOUNTING HEIGHTS USED BY STATE HIGHWAY DEPARTMENTS
STATES USING (No.) FOR MOUNTING HEIGHT OF LAMP
ROADWAY LIGHTING POWER < 30 31-35 36-40 41-45 46-50 51-99 5 100 CLASSIFICATION (W) FT FT FT FT FT FT FT
(a) Highest
Continuous freeways 400 12 4 17 2 0 0 0 700 0 0 10 4 6 0 0
1000 0 0 3 3 9 1 1
Continuous arterials 400 12 4 14 0 0 0 0 700 0 0 9 S 5 0 0
1000 1 0 2 3 6 1 1
Full interchange 400 16 6 14 1 0 0 2 700 0 0 4 0 4 0 0
1000 0 1 3 1 5 1 10
Safety lighting 400 17 6 15 1 1 0 1 700 0 0 4 0 4 0 0
1000 0 0 3 1 5 1 2
(b) Normal
Continuous freeways 400 12 3 15 0 0 0 0 700 0 0 11 4 4 0 0
1000 0 0 4 3 10 1 1
Continuous arterials 400 14 4 10 0 0 0 0 700 0 0 12 1 30 0
1000 1 0 1 11 7 1 1
Full interchange 400 15 5 12 0 0 0 1 700 0 0 14 3 3 0 0
1000 1 0 3 3 6 0 8
Safety lighting 400 20 4 10 0 0 0 0 700 0 0 7 1 3 0 0
1000 0 0 2 1 5 1 0
(c) Anticipated Use of Higher Mounts
Continuous freeways 400 1 2 4 2 5 1 0 700 0 1 2 0 5 0 0
1000 0 0 0 0 9 4 5
Continuous arterials 400 1 2 2 1 0 0 1 700 0 0 2 1 6 1 0
1000 0 0 0 0 7 2 3 Full interchange 400 0 2 4 2 2 1 1
700 0 1 2 0 3 0 0 1000 0 0 0 0 4 3 20
Safety lighting 400 0 2 5 2 4 0 0 700 0 1 3 0 4 1 0
1000 0 0 0 0 4 4 5
Summary of responses to Questions 41, 42, 43.
Lighting Intensity (Q. 33).—As a general rule, levels of TABLE A-b
lighting intensity on the municipality questionnaires are LINE VOLTAGE SPECIFIED FOR
somewhat higher than those on the state questionnaires. STATE LIGHTING INSTALLATIONS
These responses are probably influenced by the higher STATES
recommended values given in the ASA Standard Practice. RESPONDING
Table A-16 summarizes the city responses. VOLTAGE (NO.)
Pavement Brightness (Q. 34).—As with the state high- 480 34 240/480 23
way departments; none of the responding municipalities 277 3
specify pavement brightness as a design criterion or 207 1
standard. 120 3
Glare (Q. 35) .—Again, none of the municipal respon- Summary of responses to Question 44.
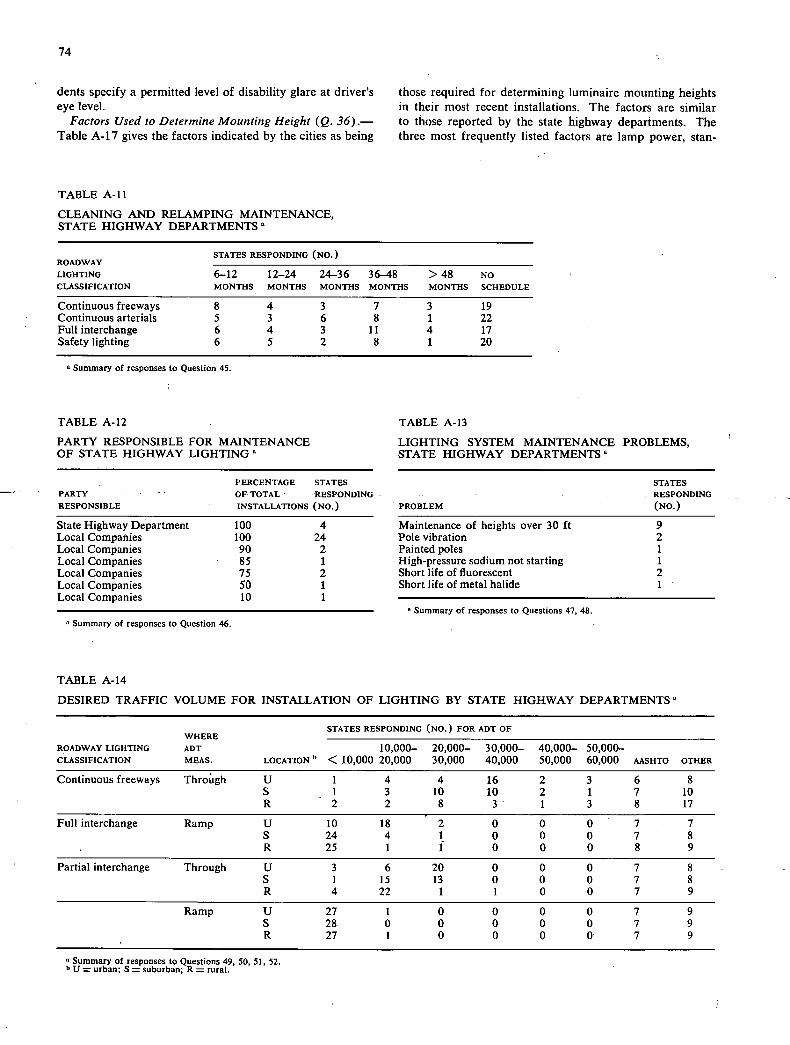
74
dents specify a permitted level of disability glare at driver's those required for determining luminaire mounting heights eye level, in their most recent installations. The factors are similar
Factors Used to Determine Mounting Height (Q. 36).— to those reported by the state highway departments. The Table A-i 7 gives the factors indicated by the cities as being three most frequently listed factors are lamp power, stan-
TABLE A-il
CLEANING AND RELAMPING MAINTENANCE, STATE HIGHWAY DEPARTMENTS
STATES RESPONDING (No.) ROADWAY LIGHTING 6-12 12-24 24-36 36-48 > 48 NO CLASSIFICATION MONTHS MONTHS MONTHS MONTHS MONTHS SCHEDULE
Continuous freeways 8 4 3 7 3 19 Continuous arterials 5 3 6 8 1 22 Full interchange 6 4 3 ii 4 17 Safety lighting 6 5 2 8 1 20
Summary of responses to Question 45.
TABLE A-12 TABLE A-13
PARTY RESPONSIBLE FOR MAINTENANCE LIGHTING SYSTEM MAINTENANCE PROBLEMS, OF STATE HIGHWAY LIGHTING" STATE HIGHWAY DEPARTMENTS
PERCENTAGE STATES PARTY - - - OF-TOTAL - -RESPONDING - - -
RESPONSIBLE INSTALLATIONS (No.) - PROBLEM
State Highway Department 100 4 Maintenance of heights over 30 ft Local Companies 100 24 Pole vibration Local Companies 90 2 Painted poles Local Companies 85 1 High-pressure sodium not starting Local Companies 75 2 Short life of fluorescent Local Companies 50 1 Short life of metal halide
STATES - RESPONDING
(No.)
9 2 1 1 2
L.UdI ...0IUpdIlICS 10 1
Summary of responses to Questions 47, 48.
Summary of responses to Question 46.
TABLE A-14
DESIRED TRAFFIC VOLUME FOR INSTALLATION OF LIGHTING BY STATE HIGHWAY DEPARTMENTS"
STATES RESPONDING (No.) FOR ADT OF WHERE
ROADWAY LIGHTING ADT 10,000— 20,000— 30,000— 40,000— 50,000— CLASSIFICATION MEAS. LOCATION" < 10,000 20,000 30,000 40,000 50,000 60,000 AASHTO OTHER
Continuous freeways Throigh U 1 4 4 16 2 3 6 8 S - 1 3 10 10 2 1 7 10 R 2 2 8 3 1 3 8 17
Full interchange Ramp U 10 18 2 0 0 0 - 7 7 S 24 4 1 0 0 0 7 8 R 25 1 1 0 0 0 8 9
Partial interchange Through U 3 6 20 0 0 0 7 8 S 1 15 13 0 0 0 7 8 R 4 22 1 1 0 0 7 9
Ramp U 27 1 0 0 0 0 7 9 S 28 0 0 - 0 0 0 7 9 R 27 1 0 0 0 0 7 9
"Summary of responses to Questions 49, 50, 51, 52 b U = urban; S = suburban; R = rural.

75
dard practice, and maintenance, whereas the states most frequently listed economics, uniformity, and safety. When asked if these factors differed with the class of roadway, 14 states responded yes. The three predominant responses were: (1) Higher speeds call for increased heights; (2) Use standard height for each class of road; (3) Varies with the width of the road.
Spacing Between Supports (Q. 37) .-The most fre-quently used factor for determining luminaire support spacing is the average illumination formula or coefficient of utilization formula. This was reported by 22 of the 25 cities responding. As a matter of comparison, 28 of the 44 states responding also reported this factor. Table A-18 summarizes the responses.
Geometric Configuration of Lighting System (Q. 38).-
The first part of this question concerned those factors that
TABLE A-15
STATE HIGHWAY DEPARTMENT USE OF VARIOUS LUMINAIRE SUPPORT BASES
STATES RESPONDING (No.)
WITH GUARDRAIL EXPOSED
BASE HIGH LOW HIGH LOW
TYPE SPEED SPEED SPEED SPEED
(a) Steelfiange 17 14 0 11 (b) Aluminum flange 18 17 12 17 (c) Steel transformer 9 8 0 8 (d) Aluminum transformer 23 20 36 31 (e) Progressive shear 2 1 S 3 (f) Slip 4 2 12 9
Summary of responses to Question 53.
TABLE A-16
ILLUMINATION INTENSITIES USED BY THE VARIOUS MUNICIPALITIES
ILLUMINATION INTENSITY (Ec)
AVERAGE MAXIMUM MINIMUM
ROADWAY LIGHTING
CLASSIFICATION
LOCA- TION MEAN RANGE NO.0 MEAN RANGE NO.0 MEAN RANGE NO.°
Freeways and U 1.2 0.6-2.0 15 2.2 1.0-5.0 8 0.7 0.2-1.0 7
expressways 5 0.9 0.6-1.0 11 1.5 1.0-2.0 5 0.7 0.6-0.8 4
Arterials U 1.6 0.6-2.0 18 6.1 2.0-16.0 9 0.9 0.5-1.5 8
S 1.0 0.9-1.2 11 2.4 1.5-5.0 5 0.8 0.6-1.0 4
Collectors U 1.1 0.5-2.0 18 2.2 0.9-5.0 8 0.7 0.4-1.2 8
5 0.8 0.6-1.0 11 1.3 1.0-2.0 5 0.6 0.6 4
Locals U 0.7 0.2-1.0 16 1.6 0.4-5.0 8 0.3 0.1-0.6 8
S 0.4 0.2-0.8 11 0.9 0.6-0.9 5 0.4 0.2-0.6 4
Interchanges and U 1.5 0.6-3.0 12 2.8 1.0-5.0 8 0.9 0.5-1.2 7
intersections S 1.2 0.6-2.0 7 2.2 1.0-3.0 5 0.8 0.6-1.0 4
Summary of responses to Question 33. ' U = urban; S = suburban.
Number of responses.
determine the geometric configuration of luminaire Sup-
ports. The cities' responses to this part are given in Table A-19. The second part involved the cities' preferences for the various geometric configurations. Table A-20 sum-marizeS the results. The third part was confused with the second part and is, therefore, not tabulated.
Light Sources (Q. 39).-This question involved the
cities' preference for various types and wattages of lamps. The results are similar to those from the state question-naires, with 1,000-, 700-, and 400-w clear mercury vapor being the most popular. Complete results are given in
Table A-21. Mounting Height (Q. 40, 41, 42) .-These three ques-
tions covered the mounting height used, including the high-est, that normally used, and anticipated use. The results are given in Table A-22. It is significant to note a trend toward higher heights, similar to those found in the state highway departments.
TABLE A-17
FACTORS DETERMINING MOUNTING HEIGHT USED BY MUNICIPALITIES
CITIES RESPONDING
FACTOR -- (No.)
Lamp power 9 Standard practice 6 Maintenance 4 Trees 3 Roadway type 2 Roadway width 2 Cost 2 Existing lighting 2 Uniformity 2 Spacing 2 Manufacturer recommendations 2 Glare 2 IES guide 1 Aesthetics 1
'Summary of responses to Question 36.

76
TABLE A-18
METHODS USED BY THE CITIES TO DETERMINE LUMINAIRE SPACING
CITIES
RESPONDING METHOD (NO.)
Coefficient of utilization formula 22 Trees and driveways 3 Spacing of existing utility poles 2
Summary of responses to Question 37
TABLE A-20
MUNICIPAL PREFERENCES AND REASONS FOR VARIOUS GEOMETRIC CONFIGURATIONS
MUNICIPALITIES RESPONDING (NO.)
STAG- OPPO- ONE- FACTOR MEDIAN GERED SITE SIDE
Economy .2 0 0 2 Safety 2 1 1 0 Uniformity 0 8 0 0 Higher intensity 0 0 4 0 Geometry 1 5 5 0 Maintenance 0 1 0 0 Other factors I 1 1 2
Summary of responses to Question 38b
TABLE A-19
FACTORS THAT DETERMINE LIGHTING SYSTEM GEOMETRIC CONFIGURATIONS USED BY THE MUNICIPALITIES
FACTOR
CITIES
RESPONDING
(NO.)
Roadway width 11 Cost 6 Restrictions (trees, driveways, etc.) 5 Safety 4 Lighting distribution 4 Lamp power 2 Pedestrian volume 2 Policy 2 Type of roadway
Summary of responses to Question 38a
Line Voltages (Q. 43) —This question asked for the line voltage normally specified in city lighting installations.
Table A-23 summarizes the responses. Of the cities re-sponding, 19 indicated that the electric utility companies assisted in the voltage specifications.
Maintenance (Q. 44, 45, 46, 47).—This series of ques-
tions involved the cities' maintenance practice and prob-
lems. Table A-24 gives maintenance schedules for cleaning
and relamping as practiced by the cities. Table A-25 gives
the party responsible for maintenance. Table A-26 sum-
marizes the maintenance problems being experienced by the cities.
Traffic Volumes (Q. 48) .—None of the cities respond-ing indicated that traffic volume is used in determining
when to light the various classifications of roadways.
Luminaire Support Bases (Q. 49) .—This question was designed to obtain information on the use of various pole
bases. The results are quite different from those obtained
from the states. A large number of cities reported use of
exposed unsafe bases under high-speed conditions. Com-
plete results are given in Table A-27.
TABLE A-21
MUNICIPALITY USE OF VARIOUS LAMP TYPES AND POWER
LAMP
TYPE ROADWAY LIGHTING
CLASSIFICATION
MUNICIPALITIES USING (NO.)
175 w 250w 400 w 800w 1,000 w
Clear mercury Freeways and expressways 0 0 8 3 9 vapor Arterials 0 0 16 4 4
Collectors and locals 11 S 8 0 0 Interch. and intersect. 2 2 8 0 8
Color-improved and expressways Freeways 1 1 1 1 1 mercury vapor Arterials 1 1 4 2 1
Collectors and locals 6 3 1 0 0 Interch. and intersect. 1 4 3 2 0
Summary of responses to Question 39

TABLE A-22.
MOUNTING HEIGHTS USED BY MUNICIPALITIES"
MUNICIPALITIES USING (No.),
FOR MOUNTING HEIGHT OF LAMP
ROADWAY LIGHTING POWER < 30 3 1-40 4 1-50 5 1-60 100
CLASSIFICATION (W) FT FT FT FT FT
(a) Highest
Freeways and expressways 400 7 9 2 0 0 700 1 5 1 0 0
1000 I 5 4 1 0
Continuous arterial 400 13 10 0 0 0 700 4 6 0 0 0
1000 I 10 1 0 0
Collectors and locals 400 13 7 0 0 0 700 1 I 0 0 0
1000 0 3 0 1 0
Interchanges and intersections 400 11 8 1 0 0 700 1 6 0 0 0
1000 0 7 0 1 0
(b) Normal
Freeways and expressways 400 11 7 1 0 0 700 2 6 .0 0 0
1000 1 5 3 0 0
Continuous arterial 400 17 6 0 0 0 700 3 5 0 0 0
1000 1 8 1 0 0
Collectors and locals . 400 18 5 0 0 0 700 2 2 0 0 0
1000 1 3 1 0 0
Interchanges and intersections 400 13 4 1 0 0 700 2 4 0 0 0
1000 0 5 2 0 0
(c) Anticipated Use of Higher Mounts
Freeways and expressways 400 0 4 3 0 0 700 0 1 1 1 0
1000 0 1 3 1 1
Continuous arterial 400 1 5 1 0 0 700 0 3 0 1 0
1000 0 3 2 2 0
Collectors and locals 400 1 4 0 0 0 700 0 2 0 0 0
1000 0 1 1 0 0
Interchanges and intersections 400 0 4 12 0 2 700 0 12 0 1 2
1000 0 0 2 2 5
"Summary of responses to Questions 40, 41, 42.
TABLE A-23
LINE VOLTAGES SPECIFIED FOR MUNICIPAL LIGHTING INSTALLATIONS"
MUNICI- PALITIES RESPONDING
VOLTAGE (NO.)
480 2 240 6 120 4
240/480 4 120/240/277/480 2
120/240 1 120/208 1
Det. by utility company 2
"Summary of responses to Question 43

78
TABLE A-24
CLEANING AND RELAMPING MAINTENANCE, MUNICIPAL PUBLIC WORKS DEPARTMENTS"
MUNICIPALITIES RESPONDING (NO.)
ROADWAY LIGHTING 6-12 12-24 24-36 36-48 > 48 NO CLASSIFICATION MONTHS MONTHS MONTHS MONTHS MONTHS SCHEDULE
Freeways 8 3 2 5 3 6 Arterials 9 3 2 5 3 5 Collectors and locals 9 3 2 5 3 5 Interchanges and intersections 9 3 2 5 3 S
"Summary of responses to Question 44.
TABLE A-25 TABLE A-26
PARTY RESPONSIBLE FOR MAINTENANCE LIGHTING SYSTEM MAINTENANCE PROBLEMS, OF MUNICIPAL LIGHTING SYSTEM" MUNICIPALITIES'
MUNICI- MUNICI- PERCENTAGE OF PALITIES PALITIES
PARTY TOTAL INSTAL- RESPONDING RESPONDING RESPONSIBLE LATIONS (NO.) PROBLEM (NO.)
City 100 6 Mounting heights over 35 ft City 20 1 Low-mounted rail lighting Local uilities 100 13 Pole vibration Local utilities 80 1 Short life of metal vapor Private contractor 100 2 Short life of high-pressure sodium
Fluorescents hard to maintain "Summary of responses to Question 45. -
"Summary of responses to Questions 46, 47.
TABLE A-27
MUNICIPAL PUBLIC WORKS DEPARTMENT USE OF VARIOUS LUMINAIRE SUPPORT BASES"
WITH GUARDRAIL EXPOSED
BASE HIGH LOW HIGH LOW TYPE SPEED SPEED SPEED SPEED
(a) Steel flange 8 4 5 8 (b) Aluminum flange 7 3 7 7 (c) Steel transformer 7 6 8 11 (d) Aluminum transformer 7 3 8 7 (e) Progressive shear 1 1 3 2 (f)Slip 0 0 0 0
.(g) Other 1 1 3 3
"Summary of responses to Question 49.
1 1 I 1 1 1

APPENDIX B
FIELD STUDY PROCEDURES AND QUESTIONNAIRES
79
Chapter Two provides a conceptual framework on which to develop the characteristics of the suitable visual environ-ment. In this connection, the field studies reported in this appendix outline the development of the characteristics and how they relate to the various objectives of the research program.
PURPOSE OF FIELD STUDIES
The field studies served a multi-purpose function, as follows:
To develop further driver visual information needs, especially as related to characteristics of specific traffic facilities.
To validate the conceptualization of traffic facility classification (developed in Chapter Two).
To determine subjective comfort benefits of roadway lighting.
To provide information for warranting conditions and priorities for roadway lighting.
To provide information on design guidelines.
These purposes are discussed individually in the following.
Visual Information Needs
The section on "Visual Information Needs" (Chapter Two) has established, in rather gross ways, those visual needs associated with the various levels of driver performance. One of the functions of the field studies was the investiga-tion of these, and possibly other informational needs, as they relate to night-driving task performance and to the geometric, operational, and environmental characteristics encountered on various traffic facilities. It was desired that the field studies provide some reinforcement of the infor-mational needs and determine how often these needs arise on the various types of facilities.
Traffic Facility Classification
For any comprehensive lighting program, the first need is a method of classifying the street and highway system. Thus, the field studies served the function of testing the conceptualization of traffic facility classification as devel- oped in Chapter Two.
Subjective Comfort Benefits
One of the objectives of the research program was to deter-mine the benefits accruable to fixed lighting. Thus, the field studies were planned to evaluate one measure of fixed-lighting benefits, subjective driver comfort.
Warrants and Priorities
Although the field studies were concerned primarily with the requirements of the suitable visual environment, some
emphasis was placed on the conditions warranting road-way lighting and priorities for installation of the same. It is evident that without visual task problems roadway light-ing is not warranted. Conversely, as visual task problems become apparent, so does the need for fixed lighting and the more problems that can be solved by lighting, the higher the priority should be. Therefore, the field studies attempted to identify some of the conditions that warrant fixed lighting.
Design Guidelines
The field studies also were planned to reveal indications of what the design guidelines should be for various traffic facility situations. Efforts were made to select study sites with varying design conditions for comparison purposes.
STUDY PROCEDURES
Field Study Concepts
The complexity of the night-driving environment has re-quired research concepts out of the ordinary for adequate study of the total system. Therefore, the methodology utilized in this effort involved unique approaches.
Among the names ascribed to the techniques of this re-search are "diagnostic studies," "team studies," and "driver task analysis studies." In actuality, all three are descriptive of the concepts involved. First, it was desired that the studies analyze the driving task informational needs and the resultant performance of the driver. Thus, driver task analysis studies were appropriate. Second, it was evident that some indication was needed as to the adequacy or inadequacy of the visual environment in providing neces-sary visual inputs. Therefore, an investigation or analysis of the cause or nature of a condition, situation or problem as related to the driving task was necessary (diagnostic studies). Third, it was desirable to involve as many people as possible in the development of the requirements of the visual environment. Thus, a team of participants, even similar to a medical team, was a part of the concept. The final description of the field study technique is "a team of individuals representing professionals and lay drivers diag-nosing the cause or nature of conditions, situations, or problems relating to the driving task at night."
Selection of Study Sites
It was originally anticipated that study sites would be se-lected from throughout the United States. However, by mutual agreement with the sponsor, only two geographic areas—Atlanta, Ga., and Dallas, Tex.—were represented. in the field studies. To accomplish the multi-purpose func-tion of the field studies, it became necessary to choose

j]
individual study sites carefully to include as many traffic facility classifications and situations as possible.
Eight individual study sites were selected, four in each of the two geographical areas. From a traffic'facility func-tional classification standpoint, these eight study sites in-corporated the more important classifications discussed in Chapter Two. In addition, the sites were selected to be representative of the various geometric, operational, and environmental conditions expected on the various func-tional classifications. Thus, each study site and sections within each study site were classified according to the scheme discussed under "Traffic Facility Classification" (Chapter Two), and in so doing provided some indication of the adequacy of the classification scheme.
Details of each individual study site are discussed in later sections of this appendix.
Selection of Study Teams
Interdisciplinary teams were selected for each of the two geographic areas. Each team consisted of eight members, four representing various professional disciplines and the other four representing lay drivers. The general guidelines for selection of team members were as follows:
All subjects should have an outgoing personality. Not more than three should be technically trained in
highway, traffic, or illumination engineering. At least two women should be included on the team. It was desirable to have state and city representatives. It was desirable to include someone in an administra-
tive position in the highway department.
With these requirements as guidelines, the City of Dallas, Tex., and the Georgia Division of Highways were each requested to engage seven volunteers to serve as subjects on the study teams. The eighth member of each team was a staff psychologist from the Texas Transportation Insti-tute. Details on each study team are given in later sections on the specific study areas.
Development of Questionnaires and Interview Procedures
Questionnaires were developed for use by the study team for two general classifications, as follows:
Freeways and expressways (including interchanges). Arterials and major highways (including intersec-
tions).
These questionnaires, for completion by the study teams, consisted of questions pertaining to informational needs in the driving tasks. Primary emphasis in their development was given to visual task problems as related to geometric, operational, and environmental conditions. The question-naire forms are given at the end of this appendix.
To assist in analysis of the driving task, interview forms were developed for use by the researchers. These forms outlined the various points that needed to be covered in the in-driving interviews.
Questionnaires also were developed for determining sub-jective comfort benefits ascribable to fixed roadway light-ing. The final choice on design of this questionnaire was based on several criteria (see Appendix C).
STUDY SITE DESCRIPTIONS
Atlanta, Georgia
(See Fig. B-i.)
A. Unlighted Arterial
The unlighted section of Peachtree-Industrial Road can be described as a suburban arterial street (Fig. B-2). Four distinct sections were included in the study site, as follows:
A four-lane undivided roadway approximately ¼ mile in length, including one major signalized intersection, several minor intersections, and one rather sharp sag verti-cal curve. Intermittent commercial development exists along the edge of the roadway.
A divided four-lane roadway approximately 0.6 miles in length, including two rather complicated channelized intersections (one with SR13 and one with the ramps from the diamond interchange with 1-285. Some commercial development is present at the intersection.
A section approximately ½ mile in length that had just been opened to traffic. This section is a four-lane divided roadway that flares to a seven-lane divided section at the major intersections. The property adjacent to the study section has not yet been developed.
A ½-mile segment of SR13 extending from Peach-tree-Industrial Road to SR23. The four-lane divided road-way has a wide median, serves two major automobile assembly plants, and contains three intersections with road-ways leading into the parking areas for these plants. The parking lots at the assembly plants are lighted to a relatively high level, with considerable spillover onto the roadway. Although there is some glare from the light sources, it is not excessive. The last ¼ mile of this section is curbed, has an overpassing structure with virtually no clearance from the edges of the roadway, merges with a diamond slip ramp from 1-285, and terminates in a lighted intersection with SR23. The roadway fronts on 1-285 through the study section and the only development on the other side con-sists of the two large automobile assembly plants. Some commercial activity exists at the intersection with SR23.
B. Lighted Arterial
The lighted arterial study site (Fig. B-3) is divided into three sections based primarily on illumination characteris-tics, as follows:
An undivided four-lane roadway approximately ½ mile in length with a staggered lighting system having a mounting height of 40 ft and average pole spacing of 120 ft. The average-to-minimum illumination ratio is about 4:1 and the maximum-to-minimum ratio is 11:1. Strip commercial development exists on both sides of the road-way throughout the segment.
A divided four-lane roadway approximately 11/4 miles in length with turn bays at major intersections. The one-side lighting system has 400-w luminaires mounted at a height of 30 ft with average pole spacing of 110 ft. The average-to-minimum illumination ratio is 3:1 and the maximum-to-minimum ratio is 8: 1. The development is primarily strip commmercial; however, a considerable por-

81
t-85
DNTOWN ATLANTA
Figure B-I. Location of field study sites, Atlanta, Ga.
tion is undeveloped. Three major signalized intersections, several minor street intersections, and a number of private driveways are included in the segment.
3. A divided four-lane roadway with very narrow (10 ft) lanes and curbed on both the left and right. This segment is approximately 0.7 mile in length. The lighting system can best be described as "erratic." Lighting- is provided from both sides, but no fixed pole spacing exists. Some of the luminaires are span-wire mounted. The luminaire mount-ing height varies from 23 ft to 30 ft. The orientation of the luminaires is not uniform, which results in a very spotted appearance. The luminaires are 400-w units with average spacing of about 200 ft. Average illumination is approxi-mately 1.4 footcandles, with an average-to-minimum ratio of 14:1 and a maximum-to-minimum ratio of 41:1. The roadway is adjacent to Oglethorpe College and parallels a railroad throughout much of the segment. The last 0.2 mile contains strip commercial development along both sides.
C. Unlighted Freeway
A portion of- 1-85 and 1-285, the site is essentially sub-urban in nature and residential development exists in close proximity to the freeway (Fig. B-4). Three distinct sec-tions were included in the study site, as follows:
On the 1-85 North section the majority of the en-vironmental buildup is commercial and centered around two major interchanges (Shallowford Road and Chamblee-Tucker Road). Although there is significant illumination from these commercial areas, they are far enough removed from the roadway proper that they have little influence on the driver. The freeway section is a four-lane divided facility with a 36-ft grass median without barrier. The road shoulders are unpaved and are bordered by a guardrail.
A second section on 1-85, 1-285 involving a short, unlighted four-lane divided section with two interchanges, both with safety lighting.

82
It(XJSTRIAL BLVD., SOUTHBOUND, FCIJR-LPJt DIVIDED lAY, NO BNLRCtNrAL BUILDUP.
PEACI'ffREE ROAD, SOIJTHBOWD, FOUR-L/J€ LJI1)IVIDEI), HEAW EJWIENAL BUILDUP.
S.L • - pp
- - .- .. -uw -- - - .
IN1tRCHPGE OF INCUSTRIPL BLVD. SOUTHBOUND & I 285, APPHING F€EiCFffE RcD.
Figure B-2. Unl,g/ited arterial study section, Atlanta, Ga.
star late
PEKJ{{REE RcWD S1ffF113OWU. FOUR-LANE U4i)IVIi)EW 115 (PH SF{ED LIMIT,
3. A section on 1-285. comprising a part of the ioop around the Atlanta metropolitan area. It is located in a rural area with virtually no environmental buildup; includes one non-illuminated interchange, a partial cloverleaf.
D. Lighted Freeway
The illuminated freeway study site can be described pri-marily as a suburban freeway (Fig. B-5). Three distinct sections were included in the site, as follows:
A four-lane divided facility (1-85) approximately 4 miles in length, with a portion passing through an area of extremely heavy environmental buildup. The illumina-tion system consists of 400-w clear mercury vapor sources mounted at 35 ft in a staggered configuration. Except for the one segment mentioned previously, there is little en-vironmental buildup. This section has two minor inter-changes and one major interchange. The median is ap-proximately 30 ft wide with no median barrier.
The interchange of 1-85 with 1-75 is of the partial cloverleaf type. The illumination system consists of 400-w clear mercury vapor sources mounted at 35 ft in a one-sided configuration. This interchange has extremely criti-cal geometrics; no acceleration lanes are provided.
The portion of 1-75 included in the study site is a four-lane facility divided by a New Jersey-type median barrier. The shoulders of this facility are curbed, and no shoulder lane is provided. The environmental buildup sur-
rounding this facility is suburban (housing fronts the fa-cility). The illumination system is of the same type as that on 1-85. The one interchange in this section is of the diamond type and is signalized.
Dallas, Texas (See Fig. 13.6.)
A. Unlighted Arterial
The unlighted arterial site in Dallas (Fig. B-7) can be broken into three distinct sections, as follows:
A four-lane divided highway with a wide curbed median and narrow noncontrasting shoulders, the section is approximately I mile in length and is designated as Harry Hines Boulevard (US77). Commercial develop-ment is intense along the entire section, but is removed a considerable distance from the edge of the roadway. There are few access driveways; rather, the access is mostly com-pletely open. There are two major intersections (one a traffic circle), and several minor intersections.
A four-lane divided highway designated Northwest Highway (Loop 12), with a narrow curbed median and curb and gutter on the outside (Fig. B-8). There is little development along this section, with few access drives: but there are two major intersections and one overpassing structure. Environmental lighting is low except in the area of the two major intersections. The only fixed lighting is safety lighting at the Bachman intersection. This section
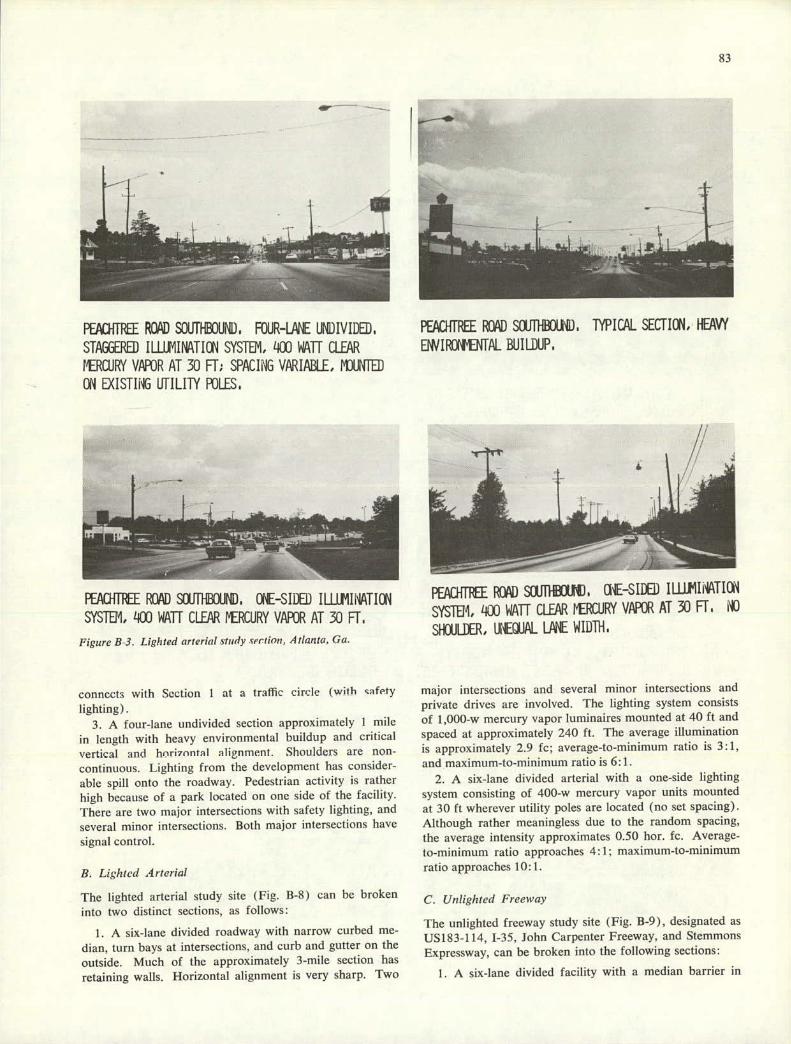
83
PEA&[rREE ROAD SOUTHBOUND. FOUR—LA'E UNDIVIDED,
STAGGERED IUif1INATICtl SYSTEJI, 400 WAlT CLEAR ERCURY VAPOR AT 30 Ff; SPACING VARIABLE, f"DWTED
ON EXISTING UTILITY FOLES.
PEACF[REE ROAD SO1f1FllWI). TYPICAL SECTION, HEAW
BWIENTAL BUILDUP,
FAO{f}ff ROAD SOUThBOUND, 0[—SIDEi) ILLLJ1IATION
SYSTEII, 400 WAlT CLEAR £fRCURY VAPOR AT 30 FT.
Figure B 3. Lighted arterial study section, Atlanta. Ga.
PEAu-mE ROAD ScIJrHBOli), ONE—ShE) IUJJIINATIUN
SlB11 400 WAlT CLEAR 1ERCURY VAPOR AT 30 Ff1 NO
SHOULDERI IX€C$JPL LP'[ WIDTh.
connects with Section 1 at a traffic circle (with safety lighting).
3. A four-lane undivided section approximately I mile in length with heavy environmental buildup and critical vertical and hori7nntal alignment. Shoulders are non-continuous. Lighting from the development has consider-able spill onto the roadway. Pedestrian activity is rather high because of a park located on one side of the facility. There are two major intersections with safety lighting, and several minor intersections. Both major intersections have signal control.
B. Lighted Arterial
The lighted arterial study site (Fig. B-8) can be broken into two distinct sections, as follows:
1. A six-lane divided roadway with narrow curbed me-dian, turn bays at intersections, and curb and gutter on the outside. Much of the approximately 3-mile section has retaining walls. Horizontal alignment is very sharp. Two
major intersections and several minor intersections and private drives are involved. The lighting system consists of I ,000-w mercury vapor luminaires mounted at 40 ft and spaced at approximately 240 ft. The average illumination is approximately 2.9 fc; average-to-minimum ratio is 3:1. and maximum-to-minimum ratio is 6:1.
2. A six-lane divided arterial with a one-side lighting system consisting of 400-w mercury vapor units mounted at 30 ft wherever utility poles are located (no set spacing). Although rather meaningless due to the random spacing, the average intensity approximates 0.50 hor. fc. Average-to-minimum ratio approaches 4:1: maximum-to-minimum ratio approaches 10:1.
C. Unlighted Freeway
The unlighted freeway study site (Fig. B-9), designated as US183-1 14. 1-35, John Carpenter Freeway, and Stemmons Expressway, can be broken into the following sections:
A six-lane divided facility with a median barrier in

84
w
I 85 NORTHBOUNDI FOUR-IN[ DIVILU) FNILITY, LITftE ENVIRONMENTAL BUILDUP, I 85 SOUTHBOUND $ TYPICAL SECFIC'1,
185 SO1f1}IBOUND, APPfCH TO SHALLOtFORD RCD I 1IERCHANGE. 4JTE GUARDRAIL AT SHOULDER.
Figure 8-4. Unlighted freeway study section, Atlanta, Ga.
185 SOLffHBOWD, 4 L'NE, DIVIJU) FACILITY, NO ENVIEDWNTAL BUILDP, 400 WAIF CLEAR t'[RCUI?( VAFOR ILLLMI1ATION SYSTE1 AT 30F1, 1'IJWTING HEIGHT,
185 SOUTHBOWD APPRDAUI3 HEAW ENVIItHENfPL BUILI1FS
185 SOU1I1BOIJND ELEVA1tD SECTION, ST3GEJU)
185 SOUTHBOUND TYPICAL SECTION WITH HEAW ILLIflINATION WNFIGURATION, ENVIR'ffNTPL BUILtXP.
Figure B-5. Lighted freeway study section. Atlanta. Ga.
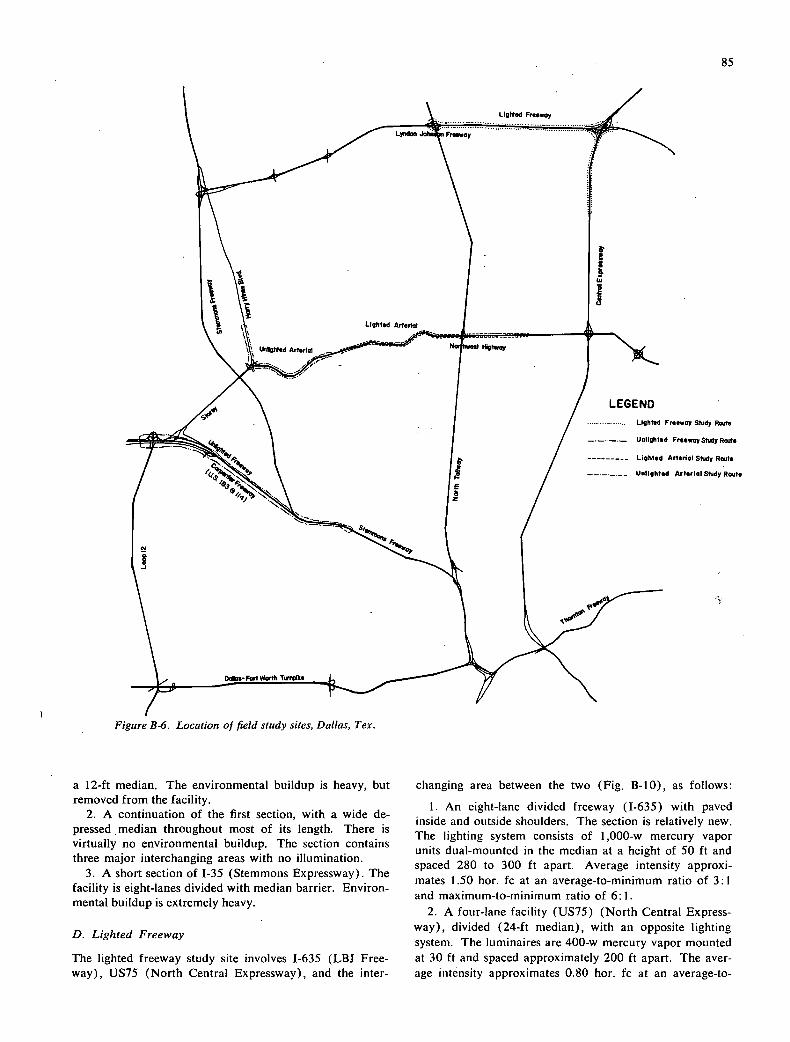
sway Study Raft
rsswoy, Study Rout.
taflal Study Rout.
A,tsriaI Study Rout.
85
Figure B-6. Location of field study sites, Dallas, Tex.
a 12-ft median. The environmental buildup is heavy, but removed from the facility.
A continuation of the first section, with a wide de-pressed median throughout most of its length. There is virtually no environmental buildup. The section contains three major interchanging areas with no illumination.
A short section of 1-35 (Stemmons Expressway). The facility is eight-lanes divided with median barrier. Environ-mental buildup is extremely heavy.
D. Lighted Freeway
The lighted freeway study site involves 1-635 (LBJ Free-way), US75 (North Central Expressway), and the inter-
changing area between the two (Fig. B-b), as follows:
An eight-lane divided freeway (1-635) with paved inside and outside shoulders. The section is relatively new. The lighting system consists of 1,000-w mercury vapor units dual-mounted in the median at a height of 50 ft and spaced 280 to 300 ft apart. Average intensity approxi-mates 1.50 hor. fc at an average-to-minimum ratio of 3:1 and maximum-to-minimum ratio of 6:1.
A four-lane facility (US75) (North Central Express-way), divided (24-ft median), with an opposite lighting system. The luminaires are 400-w mercury vapor mounted at 30 ft and spaced approximately 200 ft apart. The aver-age intensity approximates 0.80 hor. fc at an average-to-

- -
-
•
86
INSECTIC1 OF NORTFfST HIGHWAY WITH
TiPICAL SECTI(4 OF UNLIGHTED PORTION OF PACI1444 LP'1E I FOUR-LANE DIVIDED. JRTH[ST HIGHWAY. SAFElY LIGI{JING IN BEGINNING OF HEAW EWIRCETAL BUILDUP, USE AT ALL WUOR IF'ffEFECTI[XJS.
Figure 11-7. Unliglzied arterial study section, Dallas, Tar.
BEGINNING OF ILLtJ1INATED SECTION, QN'13ES FITh
VIE! OF SE FACILITY, IPPR)AQIING 1ST SIGNALIZED 2 LANE LNIJIVILED TO SIX LANE DIVItED,
INTEI&CTION. 'lER' LITTLE ENVIF()Nt'fNTI\L BUILDUP.
LIGHTING SYSTEI CLEAR ffRCUR' VPFOR, 1000 WATT AT 4OFT., 2Ff. SPACING,
TYPI CAL SECTION OF NORThEST N I S I;U\Y, GUARDRAI LS USED 1HfJU3iiO1Jf; NO SHOLLLEJ,
Figure B-8. Ligli ted arterial study section, Dallas, Tex.
OlE SHED ILLII1INATION SYSTE'1, 1031 IAII CLEAR IIRCURY VARDR AT 33FF, :io SET SPACING, BEGINNING
OF HEAW LiVI3iEffAL 3UILDUP,
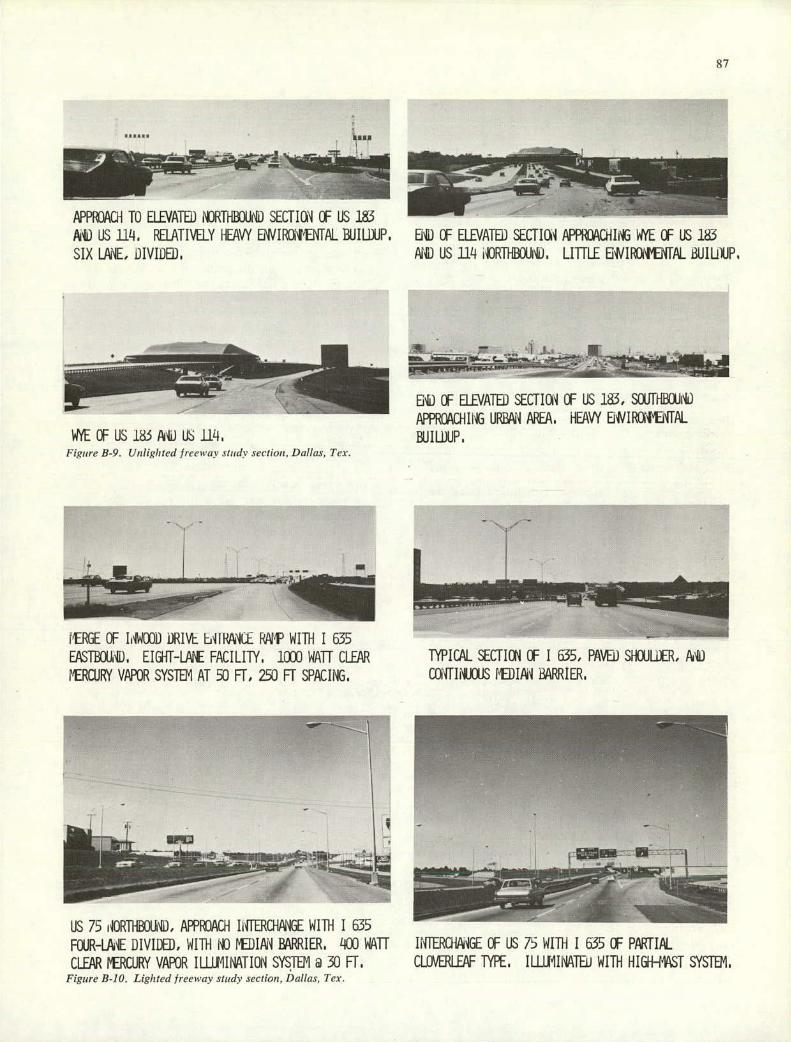
!&WIN 196"~%L
APPQI TO ELEVATED RTt-fl30thD SECT ICN OF US 183 M) US 114. RELATIVELY HEAW E'WIRCENFAL BUILDUP.
SIX [.ME1 DIVIDED.
U) OF ELEVATED SECTI04 APPROACHlit WYE OF US 183 ND US 114 1JRThB0Ui4ii, LITTLE 6IWIffAL BUIU4JP.
87
E OF US 183 MD U 1114, Figure B-9. Unligh ted free way studs' section. Dallas, Ter.
6'D OF ELEVATED SECTION OF US 183, JOJi1i) APPROACHING URB?ã4 AREA, HEAVY EJIR(Xt'ffAL BUILDUP.
- 2tTjrwi
tRGE OF IdWWD DRIVE bIIRPNLE RPi'P WITH I 635 EPSTBOW10. EIGHT-L[ FACILITY, 1000 WATT CLEAR
TYPICAL SECTION OF I 635, PAVED SHOULDER, MD
MERCURY VAPOR SYSTU1 AT 50 FT, 250 FT SPACING. CCIffINUOUS 1'EDIM P?RRIER.
US 75 iIORTUBOthI), APPF)ACH Ii1TERCHMGE WITH I 635 FOUR-LME DIVIDED1 WITH 140 tEDIM BARRIER, 40) 'LA1T CLEAR NERCURY VAPOR ILLLJ1II'.ATI0I' SYSTEN @ 30 FT.
Figure B-b. Lighted freet'ay study section, Dallas, Tex.
H{EROIGE OF US 75 WITH I 635 OF PARTIPL CLCNERLEAF TYPE. I LWIINLATEU WITH H IGH-IIAST SYSTEI1,
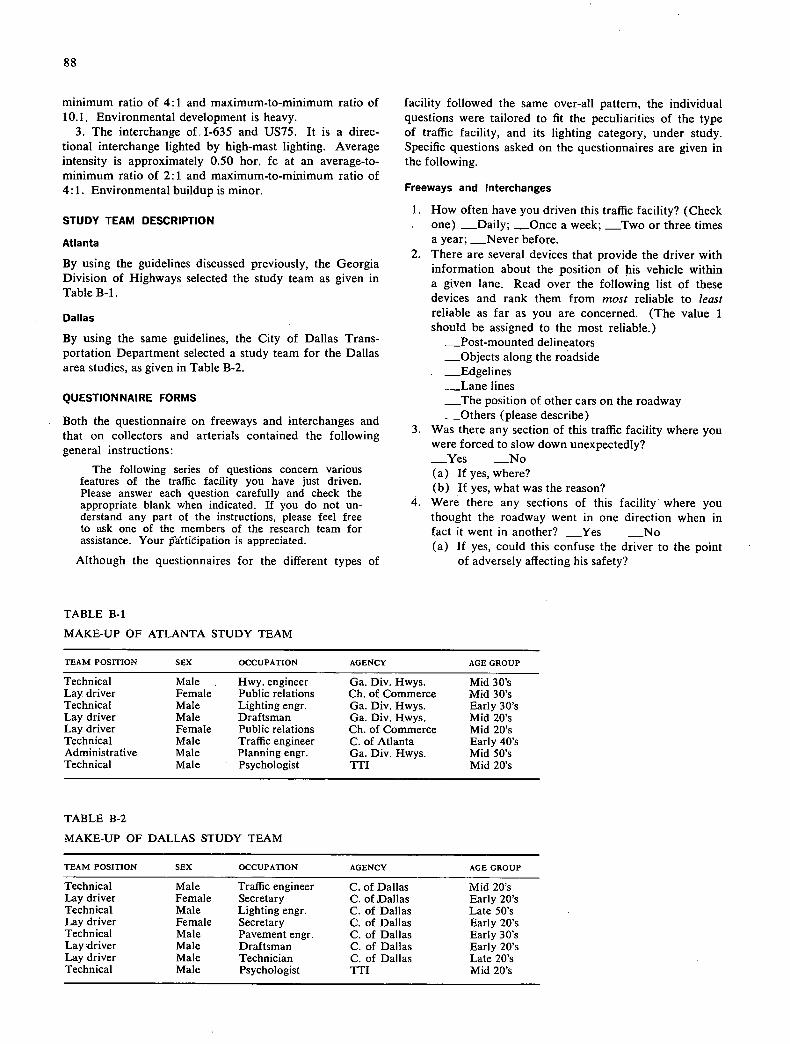
STUDY TEAM DESCRIPTION
Atlanta
By using the guidelines discussed previously, the Georgia Division of Highways selected the study team as given in Table B-i.
Dallas
By using the same guidelines, the City of Dallas Trans-portation Department selected a study team for the Dallas area studies, as given in Table B-2.
QUESTIONNAIRE FORMS
Both the questionnaire on freeways and interchanges and that on collectors and arterials contained the following general instructions:
The following series of questions concern various features of the traffic facility you have just driven. Please answer each question carefully and check the appropriate blank when indicated. If you do not un- 4. derstand any part of the instructions, please feel free to ask one of the members of the research team for assistance. Your ffrtidipation is appreciated.
Although the questionnaires for the different types of
88
minimum ratio of 4:1 and maximum-to-minimum ratio of 10.1. Environmental development is heavy.
3. The interchange of, 1-635 and US75. It is a direc-tional interchange lighted by high-mast lighting. Average intensity is approximately 0.50 hor. fc at an average-to-minimum ratio of 2:1 and maximum-to-minimum ratio of 4:1. Environmental buildup is minor.
facility followed the same over-all pattern, the individual questions were tailored to fit the peculiarities of the type of traffic facility, and its lighting category, under study. Specific questions asked on the questionnaires are given in the following.
Freeways and Interchanges
How often have you driven this traffic facility? (Check one) _Daily; _Once a week; _Two or three times a year; _Never before. There are several devices that provide the driver with information about the position of his vehicle within a given lane. Read over the following list of these devices and rank them from most reliable to least
reliable as far as you are concerned. (The value 1 should be assigned to the most reliable.)
_Post-mounted delineators Objects along the roadside
_Edgelines _Lane lines _The position of other cars on the roadway _Others (please describe)
Was there any section of this traffic facility where you were forced to slow down unexpectedly? _Yes _No
If yes, where? If yes, what was the reason?
Were there any sections of this facility where you thought the roadway went in one direction when in fact it went in another? _Yes _No (a) If yes, could this confuse the driver to the point
of adversely affecting his safety?
TABLE B-i
MAKE-UP OF ATLANTA STUDY TEAM
TEAM POSITION SEX OCCUPATION AGENCY AGE GROUP
Technical Male Hwy. engineer Ga. Div. Hwys. Mid 30's Lay driver Female Public relations Ch. of Commerce Mid 30's Technical Male Lighting engr. Ga. Div. Hwys. Early 30's Lay driver Male Draftsman Ga. Div. Hwys. Mid 20's Lay driver Female Public relations Ch. of Commerce Mid 20's Technical Male Traffic engineer C. of Atlanta Early 40's Administrative Male Planning engr. Ga. Div. Hwys. Mid SO's Technical Male Psychologist TTI Mid 20's
TABLE B-2
MAKE-UP OF DALLAS STUDY TEAM
TEAM POSITION SEX OCCUPATION AGENCY AGE GROUP
Technical Male Traffic engineer C. of Dallas Mid 20's Lay driver Female Secretary C. of Dallas Early 20's Technical Male Lighting engr. C. of Dallas Late 50's Lay driver Female Secretary C. of Dallas Early 20's Technical Male Pavement engr. C. of Dallas Early 30's Lay driver Male Draftsman C. of Dallas Early 20's Lay driver Male Technician C. of Dallas Late 20's Technical Male Psychologist Ti'! Mid 20's
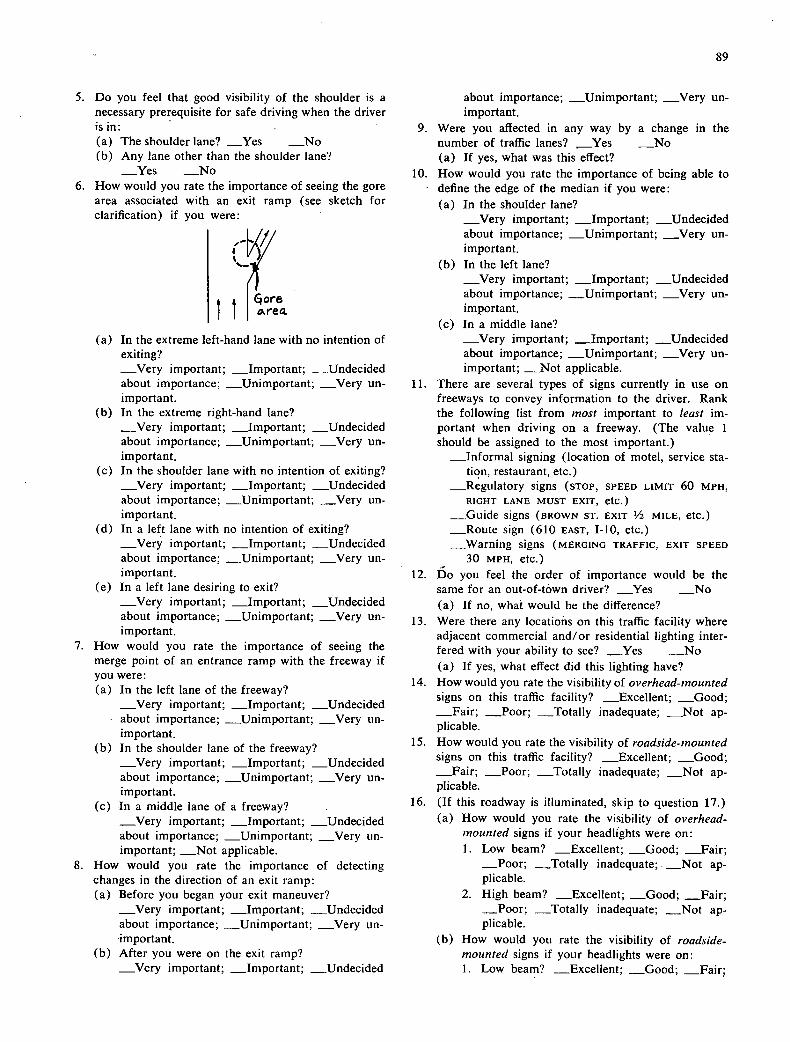
89
5. Do you feel that good visibility of the shoulder is a necessary prerequisite for safe driving when the driver is in:
The shoulder lane? __Yes _No Any lane other than the shoulder lane? _Yes _No
6. How would you rate the importance of seeing the gore area associated with an exit ramp (see sketch for clarification) if you were:
K area 1 1
In the extreme left-hand lane with no intention of exiting? _Very important; _Important; _Undecided about importance; _Unimportant; _Very un- important.
In the extreme right-hand lane? _Very important; _Important; _Undecided about importance; _Unimportant; _Very un- important.
In the shoulder lane with no intention of exiting? _Very important; _Important; _Undecided about importance; _Unimportant; _Very un- important.
In a left lane with no intention of exiting? _Very important; _Important; _Undecided about importance; _Unimportant; _Very un- important.
In a left lane desiring to exit? _Very important; _Important; _Undecided about importance; _Unimportant; _Very un- important.
How would you rate the importance of seeing the merge point of an entrance ramp with the freeway if you were:
In the left lane of the freeway? _Very important; _Important; _Undecided about importance; Unimportant; _Very un- important.
In the shoulder lane of the freeway? _Very important; _Important; _Undecided about importance; _Unimportant; _Very un- important.
In a middle lane of a freeway? _Very important; _Important; _Undecided about importance; _Unimportant; _Very un- important; _Not applicable.
How would you rate the importance of detecting changes in the direction of an exit ramp:
Before you began your exit maneuver? _Very important; _Important; _Undecided about importance; _Unimportant; _Very un- important.
After you were on the exit ramp? _Very important; _Important; Undecided
about importance; _Unimportant; _Very un-important.
9. Were you affected in any way by a change in the number of traffic lanes? __Yçs _No (a) If yes, what was this effect?
10. How would you rate the importance of being able to define the edge of the median if you were:
In the shoulder lane? _Very important; _Important; _Undecided about importance; _Unimportant; _Very un-important. In the left lane? _Very important; _Important; _Undecided about importance; Unimportant; _Very un- important. In a middle lane? _Very important; _Important; _Undecided about importance; _Unimportant; _Very un- important; Not applicable.
11. There are several types of signs currently in use on freeways to convey information to the driver. Rank the following list from most important to least im-portant when driving on a freeway. (The value 1 should be assigned to the most important.)
_Informal signing (location of motel, service sta-tion, restaurant, etc.)
_Regulatory signs (STOP, SPEED LIMIT 60 MPH,
RIGHT LANE MUST EXIT, etc.) Guide signs (BROWN ST. EXIT ½ MILE, etc.)
_Route sign (610 EAST, 1-10, etc.) __Warning signs (MERGING TRAFFIC, EXIT SPEED
- 30 MPH, etc.) 12. Do you feel the order of importance would be the
same for an out-of-town driver? _Yes _No (a) If no, what would be the difference?
13. Were there any locations on this traffic facility where adjacent commercial and/or residential lighting inter- fered with your ability to see? _Yes _No (a) If yes, what effect did this lighting have?
14. How would you rate the visibility of overhead -mounted signs on this traffic facility? Excellent; _Good; _Fair; _Poor; Totally inadequate; _Not ap- plicable.
15. How would you rate the visibility of roadside-mounted signs on this traffic facility? _Excellent; _Good;
Fair; _Poor; _Totally inadequate; _Not ap-plicable.
16. (If this roadway is illuminated, skip to question 17.) How would you rate the visibility of overhead-mounted signs if your headlights were on: I. Low beam? _Excellent; Good; Fair;
_Poor; Totally inadequate; _Not ap- plicable.
2. High beam? _Excellent; _Good; _Fair; Poor; _Totally inadequate; Not ap-
plicable. How would you rate the visibility of roadside-mounted signs if your headlights were on: I. Low beam? Excellent; Good; .Fair;
7
8.

90
._._Poor; _Totally inadequate; _Not ap-plicable.
2. High beam? Excellent; _Good; .__Fair; _Poor; _Totally inadequate; _Not ap-plicable.
How would you rate the effectiveness of the delinea-tion system on this traffic facility under present il-lumination conditions? _Very effective; _Effective; _Undecided about effectiveness; lneffective; _Very ineffective. How would you rate the legibility of externally il-luminated overhead-mounted signs (if present) vs the visibility of reflective-type signs? (Check one) _More visible; _Equal in visibility; _Less visible;
Not applicable. Did glare from opposing traffic headlights create a problem? _Yes _No Were posted speed limits reasonable under present illumination and traffic conditions? _Yes _No Comments: Did it appear to you that there were too many roadside-mounted advertising signs along this traffic facility? _Yes _No Comments: How would you rate the importance of the message from advertising signs?
_Very important; _Important; _Undecided about importance; __Unimportant; _Very un-important.
Were the entrances to on-ram ps clearly visible at an adequate distance? _Yes _No _Not ap- plicable. (a) If no, where? Comments:
24. How would you rate the importance of seeing the entrances to on-ramps if you were:
In the left lane with no intention of entering the ramp? _Very important; _Important; _Un-decided about importance; _Unimportant; _Very unimportant. In the shoulder lane intending to use the ramp? _Very important; _Important; _Undecided about importance; _Unimportant; _Very un-important. In the shoulder lane with no intention of using the ramp? _Very important; _Important; _Undecided about importance; _Unimportant; ..._Very unimportant. In the left lane intending to use the ramp? _Very important; _Important; _Undecided about importance; _Unimportant; _Very un-important.
25. Were you able to see far enough ahead to easily maneuver for entering position? _Yes _No Comments:
26. Were the entrances to oft-ramps clearly visible at a safe distance? _Yes _No Comments:
27. How would you rate the importance of seeing the entrances to off-ramps if you were: (a) In the left lane with no intention of entering the
ramp? Very important; _Important; _Un-
decided about importance; _Unimportant; _Very unimportant. In the shoulder (curb) lane intending to use the ramp? _Very important; ._Important; _Un- decided about importance; Unimportant; _Very unimportant. In the shoulder (curb) lane with no intention of using the ramp? _Very important; _Impor-tant; _Undecided about importance; _Un-important; _Very unimportant. In the left lane intending to use the ramp? .Very important; _Important; _Undecided about importance; _Unimportant; _Very un-important.
Collectors and Arterials
1. How often have you driven this traffic facility? (Check one) _Daily; _Once a week; _2 or 3 times a year; _Never before.
2. There are several devices that provide the driver with information about the position of his vehicle within a lane. Read over the following list of these devices and rank them from most reliable to least reliable as far as you are concerned. (The value 1 should be assigned to the most reliable.)
_Post-mounted delineators _Objects along the roadside _Edgelines
Lane lines _The position of other cars on the roadway _Curbs _Others (please describe)
(a) For the device you ranked No. 1, indicate the reason you chose it.
3. Was there any section of this traffic facility where you were forced to slow down unexpectedly? _Yes _No
If yes, where? If yes, what was the reason?
4. Were there any sections of this facility where you thought the roadway went in one direction when in fact it went in another? _Yes No (a) If yes, could this confuse the driver to the point
of adversely affecting his safety? 5. Do you feel that good visibility of the curb or shoulder
is a necessary prerequisite for, safe driving when the driver is in:
The extreme right-hand lane? Yes _No Any lane other than the extreme right-hand lane? _Yes _No
6. Were there any intersecting streets with restricted visi- bility of traffic on that street? _Yes _No
7. How would you rate the importance of seeing inter-secting traffic in advance of the actual intersection if:
They were required to stop and you were not? _Very important; _Important; _Undecided about importance; _Unimportant; _Very un-important. You were required to stop and they were not? _Very important; _Important; _Undecided

91
about importance; _Unimportant; _Very un-important. Both of you were required to stop? _Very im-portant; _Important; _Undecided about im-portance; _Unimportant; _Very unimportant. Neither of you were required to stop? _Very important; lmportant; _Undecided about im-portance; ._Unimportant; _Very unimportant.
There are several types of signs currently in use to convey information to the driver. Rank the following list from most important to least important in terms of the information they present, meeting your needs in driving this facility. (The value 1 should be assigned to the most important type.)
_Informal signs (location of business, advertise-ment, etc.) Regulatory signs (SPEED LIMIT 30 MPH, STOP,
etc.) _Guide signs (BROWN ST., etc.) ...._Route signs (610 EAST, 1-10, etc.) _Warning signs (CURVE AHEAD, DEAD END, etc.)
Do you feel the order of importance would be the same for an out-of-town driver? _Yes _No (a) If no, what would be the difference? Were there any locations on this traffic facility where adjacent commercial and/or residential lighting inter- fered with the driving task? _Yes _No (a) If yes, what did you feel was the major effect of
this lighting? How would you rate the visibility of roadside-mounted signs on this traffic facility? _Excellent; _Good; __Fair; _Poor; _Totally inadequate.
12. (If this roadway is illuminated, skip to question 13.) (a) How would you rate the visibility of roadside-
mounted signs if your headlights were on: Low beam? _Excellent; _Good; _Fair; _Poor; _Totally inadequate. High beam? _Excellent; _Good; _Fair; _Poor; _Totally inadequate.
13. How would you rate the effectiveness of the delinea-tion system on this traffic facility under present condi-tions? _Very effective; __Effective; _Undecided about effectiveness; _Ineffective; _Very ineffective.
14. Did glare from opposing traffic headlights create a problem? _Yes _No
15. Were posted speed limits reasonable under present illumination and traffic conditions? _Yes _No Comments:
16. Did it appear to you that there were too many roadside-mounted advertising signs along this traffic facility? _Yes _No Comments:
17. How would you rate the importance of the informa-tion on advertising signs? _Very important; _Im-portant; _Undecided about importance; _Un-important; _Very unimportant.
18. -Would you say you were constantly on the alert for pedestrians that might be crossing in the middle of the block? _Yes _No (a) If no, did you only look for pedestrians at desig-
nated pedestrian crosswalks? 19. Do you feel that illumination of pedestrian crosswalks
is a necessary prerequisite for safe pedestrian traffic? _Yes _No; _Not applicable Comments:
APPENDIX C
DRIVER COMFORT QUESTIONNAIRE
QUESTIONNAIRE DESIGN
The final choice of a questionnaire design and scaling method was based on several criteria, among which were:
1. The ability to distinguish between different levels of driver comfort and/or discomfort as a function of illumination.
2. Provide an indication of whether discomfort was a function of:
Geometric conditions. Driving task demands. Poor visibility. General anxiety.
3. Based on objectively derivable measures of effect.
Ability to apply appropriate statistical analysis. Ease of administration and scoring.
The design finally chosen was based on a questionnaire originally conceived by Perchonok and Hurst, 5 and many of the "questions" developed by these authors were used in the construction of this questionnaire.
However, a different scaling technique was chosen.
QUESTIONNAIRE CONSTRUCTION
The questionnaire consisted of 24 statements: seven were concerned with general apprehension, seven with visually
* Perchonok, K., and Hurst, P. M., 'Effects of illumination on Op-erating Characteristics of Freeways. Part IV. Driver Apprehension." NCHRP Report 60 (1968) pp. 93-105.

92
induced discomfort, five with geometry-induced.discomfort, and five with driving task discomfort. Under each state-ment appeared the following scale:
Strongly Agree 1 2 3 4 5 6 7 Strongly Disagree
The respondent's task in each case was to circle the num-ber that most closely expressed his feelings about the state-ment. The score for an individual was the sum of his item scores. By using a scale of this type, any total score less than 74 would indicate a relatively comfortable state, whereas total scores greater than 74 would indicate a relatively uncomfortable state.
Subjects
A total of 15 respondents filled out the questionnaire. They were the same subjects used in conjunction with the field studies discussed in Appendix B. Every attempt was made to include a cross section of the driving public.
Procedure
On the basis of previously determined criteria, two basic types of traffic facilities were selected as study sites. These consisted of an illuminated and a nonilluminated arterial, and an illuminated and a nonilluminated freeway, making four study sites in all. In each situation, two subjects and a member of the research team drove through the study site, with one subject serving as an observer and one subject driving: After the route had been traversed, the two sub-jects switched places so that the first observer drove while the first driver was given an opportunity to observe. The purpose of the research team member in all cases was to record the comments made by the subjects, to stimulate conversation, and to give verbal instructions as to the route to be driven. Immediately upon completion of the study route drive, the subjects were administered the question-naire. No conversation was allowed among the subjects until the questionnaire was completed. This procedure was repeated until all study sites had been driven and observed by each subject.
QUESTIONNAIRE FORM
The questionnaire contained identifier items such as the route designation of the study site, the location of the study site, the subject's name, and the date of administering the questionnaire. Also included were general instructions, as follows:
This questionnaire concerns driving comfort under nighttime driving conditions. Please read each state-ment carefully and then circle the number on the scale that is indicative of your feelings about the state-ment. For example, if you strongly agree with the statement: "The glare from the opposing car's head-lights was so bright it hurt my eyes," you would cir-cle the I on the scale. If you strongly disagree with this statement, you would circle the 7. If you were only in slight disagreement, you might want to circle the 5. The important thing to remember is that the end points of the scale represent the extreme attitudes toward the statement, and the numbers between 1 and 7 represent lesser degrees of agreement or disagree-ment with the statement. It is important that you re-
spond to all statements. If there is any statement about which you are undecided, circle the 4 to indicate that you are undecided.
If you have any questions, or cannot understand one of the statements, please ask a member of the research team for assistance. Your participation is appreciated.
Exan pie:
The glare from the opposing car's headlights was so bright it hurt 'my eyes.
STRONGLY 1 2) 3 4 5 6 7 STRONGLY AGREE DISAGREE Indication of rather strong agreement. Do not circle the descriptors.
"Questions"
There were times when I could not determine the direction of the road ahead. I did not feel that it was necessary to concentrate to an unusual degree on the driving task. I drove much more carefully than I would during the daytime. I felt slightly apprehensive at times. It did not bother me when the view of the roadway was blocked by an overpass or other object. There were times when I could not see everything I desired. I would not like to drive on this road at night any more than necessary. For the most part, I felt no great demands on my driving ability. Actually, the driving was not an easy task. I always felt confident that I was safe. Much of my driving consisted of rather automatic responses.
There were times when I experienced some difficulty seeing the edge of the road. I was not bothered to any appreciable degree by glare. from oncoming cars' headlights. Lights from commercial establishments along the road-way definitely bothered me. I would not have felt comfortable driving with my headlights on low beam only. The transition from one type of traffic facility to an-other (for example, from a freeway to a city street) was at times difficult to make. In actuality, it required all my concentration just to maintain good lane position. There were times when I experienced some difficulty seeing the edge of the road. I did not feel that the drive was particularly stressful. There were times when I just did not feel I could see far enough ahead. I was never surprised by sudden changes in direction of the roadway. There were several instances where I thought some risk was involved when making a maneuver. At no time did I actually feel uncomfortable while driving through this facility. Driving on this facility at night is more comfortable than driving it during the daytime.

TABLE C-i
DRIVER COMFORT SCALE, RAW SCORES
UNLIGHTED LIGHTED UNLIGHTED LIGHTED SUBJECT ARTERIAL ARTERIAL FREEWAY FREEWAY
1 84 46 99 51 2 95 136 139 98 3 99 27 153 32 4 77 110 122 103 5 87 64 107 50 6 66 53 133 53 7 89 86 146 88 8 86 58 102 63 9 92 73 109 86
10 84 42 83 56 11 75 56 74 57 12 80 67 102 87 13 86 46 91 56 14 97 74 113 99 15 74 39 45 38
Total 1271 977 1618 1017
Mean 84.73 65.13 107.87 67.80
QUESTIONNAIRE RESULTS
The raw (total) scores for each of the 15 subjects on each type of facility are presented in Table C-i. A Mann-Whitney U test was applied to these data; the results are given in Table C-2. As can be seen, the difference between illuminated and nonilluminated conditions is significant at the 0.01 level on both arterials and freeways. This indi-cates that the driver is more comfortable under illuminated conditions. Figure C-i illustrates this finding. In addition, it shows that although illuminated arterials do not differ greatly from illuminated freeways with regard to driver comfort, nonilluminated freeways are much more un-comfortable to drive than nonilluminated arterials.
Total scores for four general types of discomfort in-ducers (geometric conditions, driving task demands, poor visibility, general anxiety) are presented in Table C-3. The effect of illumination on the degree of comfort or dis-comfort manifested by a given type of inducer for a given type of facility was determined by comparing the amount of discomfort produced by each type of inducer for il-luminated vs nonilluminated situations (Table C-4). The statistical analysis procedure employed was the Mann-Whitney U test. As evidenced by Table C-4, the dis-
93
110
100
w 90
0 U 80 In
70 19 .0 60
so
40
0 z 30
20
10
0
ARTERIAL ARTERIAL FREEWAY FREEWAY
Figure C-I. Mean driving comfort scores.
comforting effect for all four types of discomfort inducers was less under illuminated conditions. An analysis of the data indicated there were no significant differences in the degree of discomfort manifested by the different inducers.
The finding that the driver is more comfortable under illuminated conditions is in line with other research findings in this area. The interesting point is that the mean scores for the illuminated conditions indicate that the driver is actually comfortable when operating on an illuminated traffic facility, rather than just less uncomfortable than he would be when driving on a nonilluminated traffic facility. As discussed earlier, a mean score of 74 represents the borderline between comfort and discomfort. From Figure C-i it is evident that the mean score for each of the il-luminated conditions is well below this value, and the mean score for each nonilluminated eondition is significantly above this value. It is also apparent from Figure Ci that although the driver is just as comfortable on an illuminated arterial as he is on an illuminated freeway, he is extremely more uncomfortable on nonilluminated freeways. This dif-ference in degree indicates that the illumination of free-ways would have a greater effect on the comfort state of the driver than would the illumination of arterials. Scores were reduced from an average of 106.63 for nonilluminated free-ways to 67.83 for lighted freeways, whereas scores were reduced from 84.68 for nonilluminated arterials to 64.60 for illuminated arterials. This difference in the effect of
TABLE C-2
COMPARISON OF DRIVER COMFORT SCORES ON ILLUMINATED AND NONILLUMINATED FACILITIES
T SIGNIFICANCE
CONDITION LARGER SMALLER N1 U LEVEL
Illuminated vs nonilluminated arterials 293.5' 157.5 15 171 p <0.01 Illuminated vs nonilluminated freeways 373.5" 151.5 15 171 p <0.01
Nonillummateci condition.
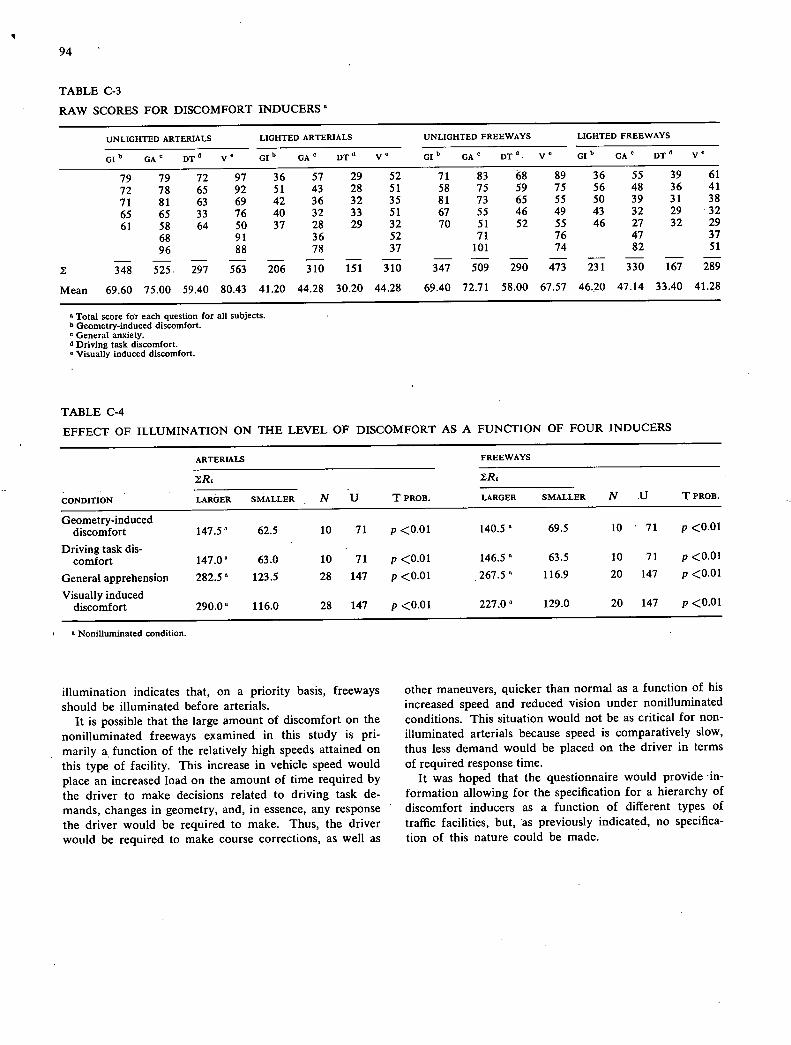
I
94
TABLE C-3
RAW SCORES FOR DISCOMFORT INDUCERS
UNLIGHTED ARTERIALS LIGHTED ARTERIALS UNLIGHTED FREEWAYS LIGHTED FREEWAYS
Gib GA 0 0T 6 V 0 GI 5 GA0 DTa V0 GIb GA 0 DT" V0 GIb GA° DTd v°
71 83 68 89 36 55 39 61 58 75 59 75 56 48 36 41 81 73 65 55 50 39 31 38 67 55 46 49 43 32 29 32 70 51 52 55 46 27 32 29
71 76 47 37 101 74 82 51
347 509 290 473 231 330 167 289
69.40 72.71 58.00 67.57 46.20 47.14 33.40 41.28
79 79 72 97 36 57 29 52
72 78 65 92 51 43 28 51 71 81 63 69 42 36 32 35 65 65 33 76 40 32 33 51 61 58 64 50 37 28 29 32
68 91 36 52 96 88 78 37
348 525. 297 563 206 310 151 310
Mean 69.60 75.00 59.40 80.43 41.20 44.28 30.20 44.28
0 Total score for each question for all subjects. b Geometry-induced discomfort. 0 General anxiety. d Driving task discomfort. 0 Visually induced discomfort.
TABLE C-4
EFFECT OF ILLUMINATION ON THE LEVEL OF DISCOMFORT AS A FUNCTION OF FOUR INDUCERS
ARTERIALS FREEWAYS
CONDITION LARGER SMALLER N U T PROB. LARGER SMALLER N U T PROB.
Geometry-induced discomfort 147.50 62.5 10 71 p <0.01 140.50 69.5 10 71 p <0.01
Driving task dis- comfort 147.00 63.0 10 71 p <0.01 146.5 0 63.5 10 71 p <0.01
General apprehension 282.50 123.5 28 147 p <0.01 .267.50 116.9 20 147 p <0.01
Visually induced discomfort 290.0 116.0 28 147 p <0.01 227.00 129.0 20 147 p <0.01
0 Nonilluminated condition.
illumination indicates that, on a priority basis, freeways should be illuminated before arterials.
It is possible that the large amount of discomfort on the nonilluminated freeways examined in this study is pri-marily a, function of the relatively high speeds attained on this type of facility. This increase in vehicle speed would place an increased load on the amount of time required by the driver to make decisions related to driving task de-mands, changes in geometry, and, in essence, any response the driver would be required to make. Thus, the driver would be required to make course ' corrections, as well as
other maneuvers, quicker than normal as a function of his increased speed and reduced vision under nonilluminated conditions. This situation would not be as critical for non-illuminated arterials because speed is comparatively slow, thus less demand would be placed on the driver in terms of required response time.
It was hoped that the questionnaire would provide in-formation allowing for the specification for a hierarchy of discomfort inducers as a function of different types of traffic facilities, but, 'as previously indicated, no specifica-tion of this nature could be made.

APPENDIX D
WARRANTING FIXED ROADWAY LIGHTING FROM A CONSIDERATION OF DRIVER INFORMATION NEEDS
95
It was desired in the research effort to investigate the possi-bility of using a vision model for warranting roadway light-ing. This appendix describes the limited effort in this re-gard. Although the concept has considerable potential and should be investigated further, limitations of time and funds precluded further action in this project.
WARRANT APPROACH
Fixed roadway lighting has many beneficial aspects. It im-proves roadway visibility and traffic operations, improves the criminal surveillance capabilities of the police, and may express the attitudes of the community. The relative bene-fits of fixed roadway lighting depend, then, on the objec-tives and values of the group in question. The premise of the warrant system presented here is that fixed roadway lighting is installed, where warranted, to increase the level of service afforded motorists at night to an acceptable level that is commensurate with safe and efficient traffic operations.
Installation of fixed roadway lighting in accordance with accepted design practices would almost never result in negative net benefits to the motoring public if someone else were paying for the costs of installation and operation. Thus, if some other governmental agency finds that fixed roadway lighting should be installed, based on its own socio, economic, or political considerations, installation of fixed roadway lighting should be permitted, even encouraged. However, the agency that finds that roadway lighting is needed to fulfill its objectives should be responsible for funding the installation and operations of the project. In the least, the distribution of costs to be charged various agencies should be made at a high administrative level and should not be the concern of the highway lighting engineer, whose primary concern should be in determining the motor-ing public's need for fixed roadway lighting.
The second premise of this warrant system is that traffic safety is a by-product of efficiency of traffic operations. Therefore, this warrant system is designed to evaluate whether efficient and effective vehicle control is probable within a given night driving environment. It is structured toward evaluating the problem causes rather than reacting to symptoms of the problem. It seeks to create a satisfac-tory night driving environment in which to perform the required driving tasks in an efficient manner rather than evaluating fatality statistics which may provide little guid-ance as to the probable causes.
In developing requirements for a suitable visual night driving environment for providing safe and efficient traffic operations, it is first necessary to provide a general defini-tion of "suitable visual night driving environment." The key to this definition is contained within the framework of
the roadway-driver-vehicle complex. Inasmuch as vision holds the veto power over the entire complex, there must be a reservoir of visual information available to the driver so that he may accomplish the driving task in operating a vehicle from one point to another. The following general definition has been adopted for the presentation of this research:
Suitable Visual Night Driving Environment—An en-vironment in which there is readily available the visual information necessary for a given driving population to safely and efficiently perform the driving tasks under the prevailing night driving conditions.
DRIVING TASKS
There are three basic levels in the driving tasks: (1) posi-tional level, (2) situatiohal level, and (3) navigational level. These levels have been ordered into a hierarchy that describes the manner in which a driver would behave if he became overloaded by the demands of the driving task. In an overloaded situation, the driver would "load-shed" higher-level tasks until an acceptable task load is reached. The information needs and priorities associated with each level are summarized as follows:
Positional level—lowest in the hierarchy; must always be satisfied before other levels can be attended to. Consists primarily of routine speed and lane position control.
Situational level—second in the hierarchy; must be satisfied before third level is attended to, but not before positional level is satisfied. Consists of change in speed, direction of travel, or position on the roadway as a result of a change in the geometric, operational, and/or environ- mental situation.
Navigational level—third in the hierarchy; performed only if levels 1 and 2 are satisfied. Consists of selecting and following a route from the origin to the destination of a trip.
Field study teams composed of lay and professional driv-ers were formed and driving task studies were conducted and analyzed to determine the cause or nature of condi-tions, situations, or problems found during the performance of the driving task at night. Most night driving problems were found to be related to problems associated with the driver's obtaining the information needed to safely and efficiently perform the driving task.
The first consensus reached by the study team involved the positional information level. All team members stressed the necessity of positional information at all times. This information (in the form of lane lines, edgelines, and curb delineation) was considered to be the most critical and most needed information because it held the key to other
96
informational levels. All other tasks at the situational and navigational level depended on the sufficiency of these visual inputs. The subjects were insistent that more orderly consideration and accomplishment of the situational and navigational tasks is possible when positional information is readily available.
Another consensus reached by the study teams involved operations on the various traffic facilities. Higher speeds and higher volumes were definitely considered to be pro-ducers of visual task problems. First, it was agreed that opposing headlights introduced periods when vision was virtually obliterated and that the problem increased as the number of opposing vehicles increased. Lateral separation of vehicles and fixed lighting, especially median-mounted, were considered the best solutions to the problems. It was also agreed that all driving task accomplishments became more difficult as volumes and speeds increased, mainly because of the competition involved between the various informational needs.
Provision of a Suitable Visual Night Driving Environment
Provision of a suitable visual night driving environment requires that a given driving population should always be able to perform all three levels of the driving task within a time frame such that safety and efficiency are not re-duced. An environment that causes the driver to load-shed certain driving tasks and information needs could not be considered a suitable night driving environment. To safely and efficiently perform the driving task, a driver must be able to perform navigational and situational tasks as well as positional control tasks.
Load-shedding by a driver results when the information processing and vehicle control demands exceed the capa-bilities of the driver to service and perform them. It is not specifically the amount of work that the driver is required to perform in satisfying the driving task that results in load-shedding, but rather the rate at which the work load must be accomplished.
The rate at which the driver must be capable of perform-ing depends on the information needed to safely and effi-ciently perform the various driving tasks, the time required to obtain the information, and the time available to obtain the information. The information needs can be related to the positional, situational, and navigational levels of the driving tasks. Whereas positional information is immedi-ately used to implement a steering or speed control action, most situational and navigational information tasks require only information processing or scanning actions on the part of the driver, with few overt control responses necessary. More situational information is needed as the complexity of the driving environment increases; also, navigational tasks increase as the number of alternate routes increases.
For a given operational and geometric situation, the drivers' information demands are fixed, with only the in-formation supply in time a variable. The information sup-ply in time depends on the length of roadway visible and varies inversely with the speed of the driver. The faster the motorist drives, the less the information supply. Fixed roadway lighting is one design variable that not only im-proves the information processing capabilities of the driver,
but also increases the supply of information available to the motorist by making a longer section of roadway visible to him. This increase in the supply of information available to the motorist reduces the rate at which driving work tasks must be done, thereby diminishing the possibilities of load-shedding, which results in a more suitable night driving environment.
Warranting Criterion
Thus, this model of night driver behavior is presented with the objectives of showing why fixed roadway lighting is warranted to provide for safe and efficient vehicle control and under what conditions this occurs. The basic criterion used for evaluating whether fixed roadway lighting is war-ranted is whether the model indicates that a suitable night driving environment is provided. For this model, a suitable night driving environment is defined as one that enables the driver to perform all three levels of the driving task without having to load-shed any of them. Load-shedding is as-sumed to occur when the information demands exceed the information supply.
The Design Driving Tasks
The driver is assumed to be driving on a roadway that does not have fixed roadway lighting. Information workload demands for varying traffic conditions will be compared to the information supply provided without fixed roadway lighting to determine if the information supply is adequate. If the information supply is not adequate, as indicated by the demand exceeding the supply, fixed roadway lighting is warranted.
The design driving tasks and the sequence in which the driver is assumed to service the information needs follow a cyclic order, as dictated by the primacy concept, and are as follows:
Positional information search and control. Situational informaticn search. Navigational information search. Positional information search and control. Etc.
The basic premise of this model is that safe and effective positional control of the vehicle can be maintained only if the driver can obtain redundant positional information of the roadway ahead each time he returns to the positional information search and control level. After the driver com-pletes a positional task, he is assumed to be traveling with-out additional positional information while he is performing situational and navigational information searches and until he returns and completes the following positional informa-tion search update. From a satisfactory design viewpoint, the driver should not be required to "fly blind" into a sec-tion of roadway he has never seen before. In this model, therefore, the driver must obtain positional information on the roadway ahead while he is still on a section previously evaluated during the last positional update.
Computation of Information Demand and Supply
The information demand will be the time required to ful-fill a sequence of positional, situational, navigational, and
97
redundant positional information searches. That is, the demand is
D=(P+S+N1 +P+1 ) (D-1)
in which
D = the information demand on a section of roadway, in seconds;
Pi = the time required to obtain positional information on cycle i;
Si = the time required to obtain situational information on cycle i;
N j = the time required to obtain navigational informa-tion on cycle i; and
P 1 = the next required positional information search up-date on cycle 4, which must be achieved within the section of roadway visible during P.
This model attempts to quantify the information demands arising from different geometric, operational, and environ-mental situations.
The information supply is given by
L 1.4717,
in which
C = information supply, in seconds; L = average visible length of roadway ahead without
fixed roadway lighting, in feet; and Vr = running speed of vehicle, in miles per hour.
Eq. D-2 shows that the information supply, in seconds, increases_with the installation of fixed roadway lighting, because L would increase appreciably, and decreases with increasing speeds.
To summarize, when the information demand, D, ex-ceeds the information supply, C, on a section of unlighted roadway, a suitable night driving environment has not been provided and fixed roadway lighting is warranted. If the demand, D, is divided by the supply, C, forming an infor-mation index ratio, I, roadway lighting is warranted when
1.47D V 1= >l (D-3)
Positional Information Needs
The field studies of this research effort have revealed that most of the positional information is obtained at night from lane lines, edge lines, curb lines, position of other vehicles, and a general view of the roadway. During good viewing conditions, the driver may usually obtain positional infor-mation with peripheral vision. However, Gordon (1) and Rockwell et al. (2) have shown with eye mark studies that under night driving conditions visual fixations of edge, curb, the roadway ahead, and shoulder lines are made more fre-quently, presumably to obtain positional information.
In general, the time required for the visual perception of an information source to occur is composed of latency, movement, and fixation times (3). Latency is the delay between the time the stimulus is presented and the time the
eyes begin to move. Normally, the latency time averages about 0.2 seconds. The stimulus in this model is not a light or object but a continuous objective of searching for in-formation to satisfy driving task needs. Thus, no latency time is assumed to exist in this model.
The time required for eye movement only varies between 0.029 and 0.10 sec for movements of 5 to 40 deg, respec-tively (3). A movement time of 0.05 sec was assumed due to the relatively small angular movements required.
After the eye has moved to the object, the eye must fix on it. The mean fixation time for observing road and lane markers was found by Mourant, Rockwell, and Rackoff (4) to be 0.28 sec. Luckeish and Moss (5) observed in the laboratory a mean fixation pause of 0.17 sec, with a range of 0.1 to 0.3 sec. It is believed that the Mourant data more accurately reflect the positional information demand,
P= 0.3 (P_+ 1)( S 7 ) (D-4)
in which
Pi = positional information demand, in seconds; D° = average degree of horizontal curvature; and W = average lane width, in feet.
Because the driver is obtaining redundant positional in-formation, it is assumed that only small steering control corrections would be necessary. To implement these small control corrections, a minimal amount of cognitive and physical effort would be required by the driver, thus per-mitting him to implement the physical control correction while he begins to search for his situational information needs. Therefore, no additional time would be required to effect a positional information search and control update.
Situational Information Search
Situational information needs arise due to changes in the geometric, operational, or environmental situation. Because the driver does not know when an actual hazard may occur, he is on the lookout for the possibility where he perceives hazardous areas to exist. The eye mark studies (1, 2) have shown that the driver believes that the roadway ahead is always a potentially hazardous area. The potential always exists that a stopped vehicle or an object may be in the lane ahead. The roadway ahead also offers the first clue to geometric changes.
Areas that may generate traffic movements that poten-tially conflict with the driver's desired path are also searched for situational information by the driver. Rockwells' eye mark studies, even with a small sample, indicate that the drivers scan more potentially hazardous areas as they in-crease in number (2). In the model presented here, these situational areas have been classified into (1) intersectional friction, (2) internal friction, (3) medial friction, and (4) marginal friction. These four types of hazards may arise on one or both sides of the driver in some cases, re-quiring two. eye movements. To ensure safe and efficient operation, the driver is assumed to be required to scan these areas if a potential hazard is present a certain per-centage of the time.
(D-2)

98
Intersectional Friction
Intersectional friction, as used here, may be caused by ve-hicles on a connecting facility approaching, desiring to enter, or crossing the driver's roadway. Normal at-grade. intersections may produce potentially hazardous areas on both sides, depending on the level of traffic volumes and exposure times of the conflicting traffic. Freeways are sub-ject to intersectional friction at ramps and connecting road-ways. In addition, at interchanges the crossing roadway may also cause intersectional scanning to occur due to the distracting influence of vehicles crossing the through fa-cility at night. (Drivers' eyes are involuntarily attracted to the movement of lights at night.)
The following analysis is presented to provide a basis for determining whether an intersection or ramp might experi-ence night intersectional friction due to cross traffic. It is assumed that the driver will scan one approach if vehicles are detectable on the average at least 25 percent of the time and will scan both sides, if possible, when vehicles are detectable at least 50 percent of the time.
It is assumed that a vehicle would be noticeable as it approaches the intersection at night if it is within 200 ft of the intersection. This implies that either the vehicle or its low-beam headlights would be visible. Using a comfortable deceleration rate of 5 fpsps and an initial approach speed of 35 mph, the crossing vehicle would be noticeable for 10 seconds before it stops at the intersection.
The average delay the crossing vehicle experiences before entering the intersection is assumed to be 5 sec. This value is thought to be reasonable for stop- and yield-controlled approaches and is not an unreasonable value for signalized intersections at night where the average delay is about one-eighth cycle.
Allowing a 3-sec interference time for crossing or enter-ing yields a total of 18 sec that the crossing vehicle would be noticeable or distracting to the driver. Thus, the mini-mum total cross-street intersection volumes to meet the
3,600 X 25% one-side criterion is q
= 18 sec = 50 vph. For both
sides to warrant 25 percent of the time, each side is re-quired to occur at a 50 percent rate; thus, the volume re-
3,600 x 50% quired to warrant both sides would be q =
= 18 sec
100 vph. These night volumes will be converted to average daily traffic by applying a K-factor, the ratio of the night design hourly volume to the 24-hour average daily traffic of 5 percent (6) to generalize and simplify the warranting analysis. The resulting equivalent average daily traffic is 1,000 vpd one side warrant, and 2,000 vpd both sides warrant, where possible (see Table D-1).
As noted previously, the traffic flowing on the roadway crossing a freeway may cause intersectional friction due to the involuntary attraction of the drivers' eyes to the moving lights on the crossing facility. It is assumed that the traffic on the crossing facility would be visible for 400 ft, or 200 ft on each side of the driver. The crossing traffic is assumed to be traveling at 40 mph. Thus, on each side of
the driver, each crossing vehicle would be visible for 3.41 sec. Again, assuming an average minimum exposure rate of 25 percent of the time for one side distraction, or a 50 percent rate for both sides occurring simultaneously, and a K-factor of 5 percent, the minimum average daily traffic volumes to warrant one- and two-sided intersectional
friction for interchanges are Q = 3,600 X 25%
3.41 sec X 0.05 = 5,300
(one side) and Q = 3,600 X 50%
3.41 < 005 = 10,600 (both sides).
Working values of 5,000 and 10,000 vehicles per day are recommended.
Intersectional friction may also be caused by traffic de-siring to turn left at an intersection from the roadway being evaluated. The distraction time to other vehicles caused by the left-turning vehicle would be: approximately 18 sec (10 sec slowing to a stop, 5 sec average stop delay, and 3 sec to cross as before). Thus, the minimum total left-turning volume per hour from the roadway of interest to meet the 25 percent time criterion would be q = 3,600 X 25%
=50 vph. 18 sec
For a section of roadway to be considered to have inter-sectional friction from the driver's viewpoint, the inter-section should be visible and the intersectional activity pre-viously discussed would have to fall initially in the driver's peripheral field of view. Under these considerations, inter-sectional friction is assumed to affect a 500-ft section of approaching roadway.
For a continuous section of roadway to cause any con-sistent increase in the driver's situational information work load, the roadway will frequently have to have the type of situational activity being considered. Here the activity is intersectional friction. For the continuous warranting of intersectional friction scan areas, a minimum of two war-ranting intersections per mile is recommended. Because freeway interchanges affect a larger area, the continuous warranting of intersectional friction would require one warranting interchange every 11/2 miles.
Internal Friction
Internal traffic friction may arise on either side of the driver due to the possibility and act of improper lane changing by other motorists traveling in the same direc-tion of flow. The number of lanes, type of traffic flow, and traffic volumes are the important determinants inevaluat-ing the probabilities for improper lane changing. Road-ways with four or more lanes could have internal traffic friction on one side and facilities with six or more lanes could have internal friction on both sides. Consideration of oncoming traffic is handled as medial friction with respect to the assumed direction of flow.
With the objective of quantifying the likelihood that a motorist would scan the traffic on one or both sides of his vehicle for possible hazardous lane-changing maneuvers into his lane, the following analyses are presented. Two types of traffic flow conditions are considered: continuous
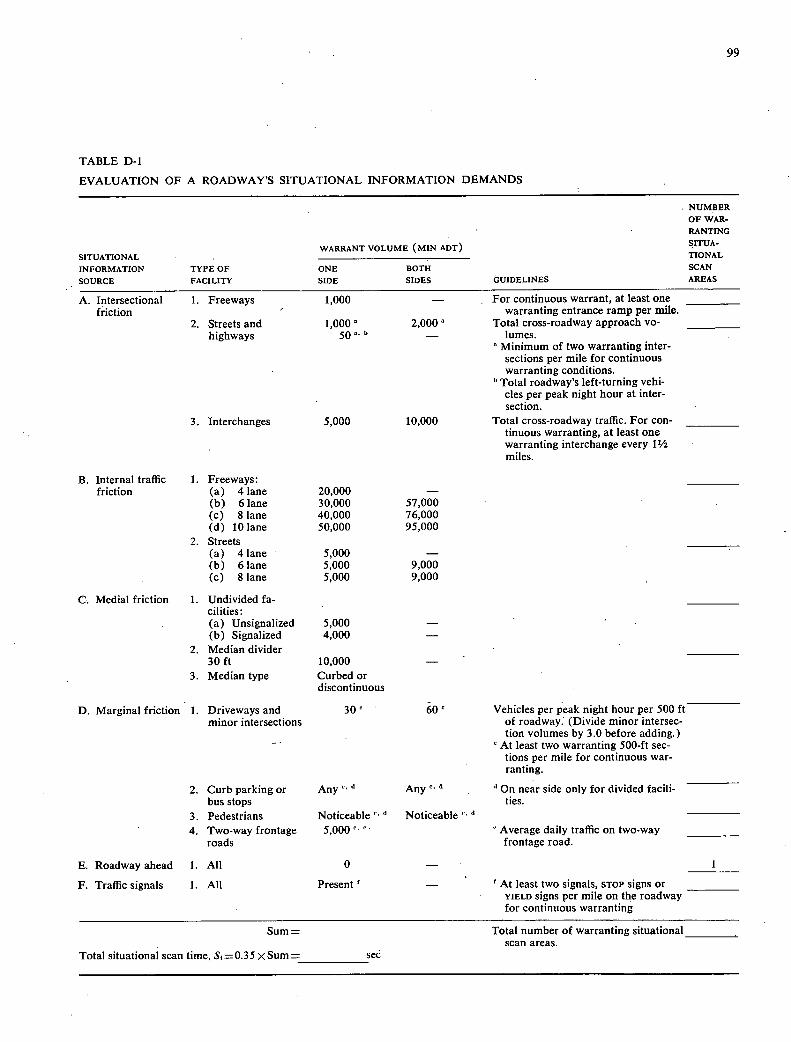
TABLE D-1
EVALUATION OF A ROADWAY'S SITUATIONAL INFORMATION DEMANDS
SITUATIONAL INFORMATION SOURCE
TYPE OF FACILITY
WARRANT VOLUME (MIN ADT) ________________________ ONE BOTH SIDE SIDES
•
GUIDELINES
NUMBER OF WAR-RANTING SITUA-TIONAL SCAN AREAS
A. Intersectional Freeways 1,000 - For continuous warrant, at least one friction warranting entrance ramp per mile.
Streets and 1,000' 2,000' Total cross-roadway approach vo- highways 500 b - lumes.
Minimum of two warranting inter- sections per mile for continuous warranting conditions.
'Total roadway's left-turning vehi- cles per peak night hour at inter- section.
Interchanges 5,000 10,000 Total cross-roadway traffic. For con- tinuous warranting, at least one warranting interchange every 11/2 miles.
B. Internal traffic 1. Freeways: friction 4 lane 20,000 -
6 lane 30,000 57,000 8 lane 40,000 76,000
10 lane 50,000 95,000 2. Streets
4 lane 5,000 - 6 lane 5,000 9,000 8 lane 5,000 9,000
C. Medial friction 1. Undivided fa- cilities:
Unsignalized 5,000 - Signalized 4,000 -
2. Median divider 30ft 10,000 -
3. Median type Curbed or discontinuous
D. Marginal friction Driveways and 30 60 Vehicles per peak night hour per 500 ft minor intersections of roadway: (Divide minor intersec-
tion volumes by 3.0 before adding.) At least two warranting 500-ft sec- tions per mile for continuous war- ranting.
Curb parking or Any " Any a "On near side only for divided facili- bus stops ties.
Pedestrians Noticeable " Noticeable Two-way frontage 5,000 ' Average daily traffic on two-way
roads frontage road.
E. Roadway ahead 1. All 0 - 1
F. Traffic signals I. All Present - r At least two signals, STOP signs or YIELD signs per mile on the roadway for continuous warranting
Sum = Total number of warranting situational_________ scan areas.
Total situational scan time, S,=0.35 xSum= sec
99
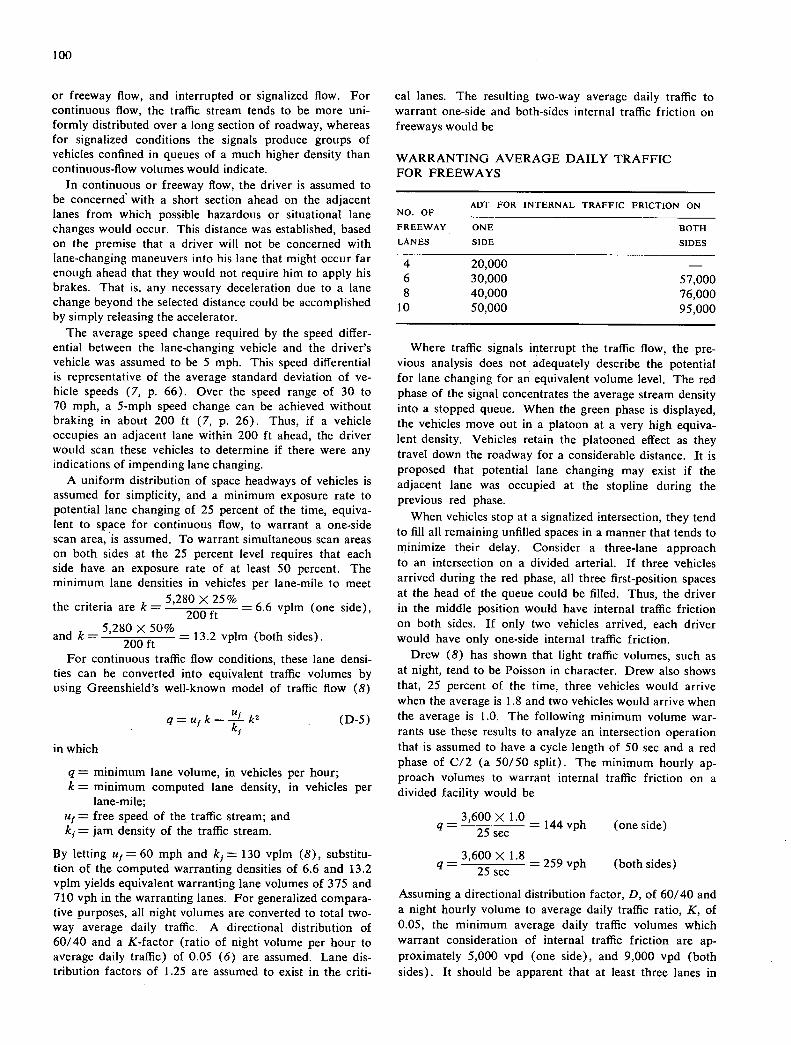
100
or freeway flow, and interrupted or signalized flow. For continuous flow, the traffic stream tends to be more uni-formly distributed over a long section of roadway, whereas for signalized conditions the signals produce groups of vehicles confined in queues of a much higher density than continuous-flow volumes would indicate.
In continuous or freeway flow, the driver is assumed to be concerned with a short section ahead on the adjacent lanes from which possible hazardous or situational lane changes would occur. This distance was established, based on the premise that a driver will not be concerned with lane-changing maneuvers into his lane that might occur far enough ahead that they would not require him to apply his brakes. That is, any necessary deceleration due to a lane change beyond the selected distance could be accomplished by simply releasing the accelerator.
The average speed change required by the speed differ-ential between the lane-changing vehicle and the driver's vehicle was assumed to be 5 mph. This speed differential is representative of the average standard deviation of ve-hicle speeds (7, p. 66). Over the speed range of 30 to 70 mph, a 5-mph speed change can be achieved without braking in about 200 ft (7, p. 26). Thus, if a vehicle occupies an adjacent lane within 200 ft ahead, the driver would scan these vehicles to determine if there were any indications of impending lane changing.
A uniform distribution of space headways of vehicles is assumed for simplicity, and a minimum exposure rate to potential lane changing of 25 percent of the time, equiva-lent to space for continuous flow, to warrant a one-side scan area, is assumed. To warrant simultaneous scan areas on both sides at the 25 percent level requires that each side have an exposure rate of at least 50 percent. The minimum lane densities in vehicles per lane-mile to meet
5,280X25% the criteria are k
= 200 ft = 6.6 vplm (one side),
5,280 X 50% and k=
200 ft = 13.2 vplm (both sides).
For continuous traffic flow conditions, these lane densi-ties can be converted into equivalent traffic volumes by using Greenshield's well-known model of traffic flow (8)
q=u,k_1_k2 (D-5) ki
in which
q = minimum lane volume, in vehicles per hour; k = minimum computed lane density, in vehicles per
lane-mile; u f = free speed of the traffic stream; and k. = jam density of the traffic stream.
By letting u1 = 60 mph and k, = 130 vplm (8), substitu-tion of the computed warranting densities of 6.6 and 13.2 vplm yields equivalent warranting lane volumes of 375 and 710 vph in the warranting lanes. For generalized compara-tive purposes, all night volumes are converted to total two-way average daily traffic. A directional distribution of 60/40 and a K-factor (ratio of night volume per hour to average daily traffic) of 0.05 (6) are assumed. Lane dis-tribution factors of 1.25 are assumed to exist in the criti-
cal lanes. The resulting two-way average daily traffic to warrant one-side and both-sides internal traffic friction on freeways would be
WARRANTING AVERAGE DAILY TRAFFIC FOR FREEWAYS
ADT FOR INTERNAL TRAFFIC FRICTION ON NO. OF
FREEWAY ONE BOTH
LANES SIDE SIDES
4 20,000 -
6 30,000 57,000
8 40,000 76,000
10 5.0,000 95,000
Where traffic signals interrupt the traffic flow, the pre-vious analysis does not adequately describe the potential for lane changing for an equivalent volume level. The red phase of the signal concentrates the average stream density into a stopped queue. When the green phase is displayed, the vehicles move out in a platoon at a very high equiva-lent density. Vehicles retain the platooned effect as they travel down the roadway for a considerable distance. It is proposed that potential lane changing may exist if the adjacent lane was occupied at the stopline during the previous red phase.
When vehicles stop at a signalized intersection, they tend to fill all remaining unfilled spaces in a manner that tends to minimize their delay. Consider a three-lane approach to an intersection on a divided arterial. If three vehicles arrived during the red phase, all three first-position spaces at the head of the queue could be filled. Thus, the driver in the middle position would have internal traffic friction on both sides. If only two vehicles arrived, each driver would have only one-side internal traffic friction.
Drew (8) has shown that light traffic volumes, such as at night, tend to be Poisson in character. Drew also shows that, 25 percent of the time, three vehicles would arrive when the average is 1.8 and two vehicles would arrive when the average is 1.0. The following minimum volume war-rants use these results to analyze an intersection operation that is assumed to have a cycle length of 50 sec and a red phase of C/2 (a 50/50 split). The minimum hourly ap-proach volumes to warrant internal traffic friction on a divided facility would be
3,600 X 1.0 q=
25 sec =l44vph (one side)
3,600 X 1.8 q
= 25 sec 259 vph (both sides)
Assuming a directional distribution factor, D, of 60/40 and a night hourly volume to average daily traffic ratio, K, of 0.05, the minimum average daily traffic volumes which warrant consideration of internal traffic friction are ap-proximately 5,000 vpd (one side), and 9,000 vpd (both sides). It should be apparent that at least three lanes in

one direction are required to generate this type of internal friction on both sides of a driver. In general, a six-lane arterial would be the minimum facility to experience this level of friction. It follows that a four-lane facility is the required minimum to generate internal friction on one side.
Medial Friction
Medial friction arises due to the interaction between oppos-ing traffic streams and the interface between them. Any median that is curbed, discontinuous, or less than 30 ft in width with an average daily traffic volume of 10,000 vpd or more should be considered to present one marginal friction scan area.
On undivided streets and highways, the effects of the headlights of approaching vehicles are pronounced on un-lighted facilities and the possibilities of head-on collisions exist. Although only one oncoming vehicle is required to have a head-on collision or to produce glare, one approach-ing vehicle would not realistically describe the information work load brought about by drivers being required to scan oncoming traffic for improper lane positioning.
It is assumed that when an oncoming vehicle is within 500 ft the driver will experience medial traffic friction. As before, an exposure rate of 25 percent of the time for average conditions is used. For continuous flow, the mini-mum average density to meet the criterion would be k = 25% X 5,280
500 ft =2.64 vpm (left side). Again, by use of
Greenshield's model to convert this density into equivalent volumes with k. = 130 vplm, u1 = 60 mph, and by use of a directional distribution factor of 60 percent and a night hourly volume ratio of the average daily traffic of 0.05, the minimum total average daily traffic warranting vol-ume for medial traffic friction for undivided highways, regardless of the number of lanes, would be about Q = 60(2.4) - (60/130)(2.4)2
0.6 X 0.05 = 4,750 vpd. A working value
of 5,000 vpd is recommended. On undivided facilities hav-ing interrupted or signalized traffic flow, a minimum left-side internal traffic volume warrant of 4,000 vpd is rec-ommended. This accounts for the additional exposure oncoming vehicles exhibit for a given traffic volume due to the delay time at signals.
Marginal Friction
Marginal friction may arise due to curb parking and un-loading, driveway use, and pedestrian traffic. Examples of land-use activities that create high night marginal friction are shopping centers, convenience stores, restaurants, clubs, motels, and service stations. Because these types of estab-lishments tend to cluster on both sides of the roadway, they may produce marginal-friction hazard areas on both sides of the driver unless a barrier median or other protective separation is provided.
To determine if a section of roadway is subjected to marginal friction, an approach similar to that previously presented is used. To be classified as marginal friction from the driver's viewpoint, the activity area should be restricted to a distance of 500 ft ahead. If it were not, the driver would obtain the information as he scans ahead, if visible,
and would not require a scan into the marginal area. If it is assumed that vehicle movements in the marginal area (entering, parking, and unloading and vice-versa) would be noticeable for 30 sec, the minimum average night drive-
way volume per hour per 500 ft would be q = 30
= 30 vph per 500 ft, using a 25 percent exposure rate as before. A vehicle entering and leaving a business would be considered two counts. Sixty vehicles per hour would war-rant both sides, where possible. No equivalent average daily traffic should be assigned, because the night activity is highly dependent on the related commercial business class.
Intersection approach volumes that were not used to suc-cessfully warrant an intersection within a section should be considered in the analysis of marginal friction. However, to qualify as marginal friction a much lower effective vol-ume must be used due to the differences in marginal ex-posure times. Minor intersection marginal exposure times are probably no more than 10 sec. Thus, intersection approach volumes should be divided by three before being added to the driveway volumes.
It is recommended that two 500-ft sections per mile must warrant marginal friction before the roadway can be con-sidered to have a sufficient marginal friction situational information work task. Curbside parking and bus stop operations occurring at night within a 500-ft section would automatically warrant the section as having marginal fric-tion on the side presented on undivided facilities.
A summary of the situational task scan areas, the war-ranting conditions, and recommended guidelines is pre-sented in Table D-1. Six types of situational information sources are considered. Intersectional, internal, medial, and marginal friction have been previously described. The fifth, the roadway ahead, is always a situational scan area.
Traffic signals, stop signs, and yield control devices create an additional situational scan area. At least two per mile are required on a roadway for continuous warranting of this situation. Thus, almost all streets in an urban area have at least two situational scan areas—the road ahead and traffic control devices that allocate the right-of-way.
Due to the increased complexity of the object and scene being viewed, the mean fixation durations of situational information tasks are slightly longer than for positional tasks. Mourant et al. (4) found that the mean fixation durations of vehicles, signs, and other objects were about 0.31 sec. Because several scan areas are considered, each somewhat close to the next, the visual angle required to shift from one to another is relatively small. As a conse-quence, the visual eye movement time is assumed to be 0.04 sec. Thus, the total time required to satisfy the situa-tional level information tasks is obtained by multiplying the total number of warranting situational information scan areas from Table D-1 by 0.35 sec.
Navigational Information Tasks
In following the concept of the primacy of information, only after the positional and situational information needs of the driving tasks have been serviced and found satis-factory can the driver proceed to search for navigational information that he may need. The type of information

sought would consist of the directional finding information that the driver requires to reach his selected destination. The amount of directional finding information required de-pends. on the driver's previous driving experience in reach-ing his destination, his a priori information with respect to the route selected, and the complexity of the required navigational decisions.
Mourant et al. (4) found that the average fixation time of drivers on roadside signs was about 0.31 sec. Mitchell and Forbes (9) derived an expression for the time to read three familiar words on a sign to be N/3, or 0.33 sec per word. A value of 0.32 sec per word is used here. This value does not include an eye movement time, which is assumed to be 0.03 sec. Thus, each word requires an average of 0.35 sec to find and read.
It would seem reasonable to assume that an "informed" driver, most likely a local driver who is informed due to his previous driving experience on a particular facility, needs only one visual cue or one word to satisfy his navigational needs. That is, once he is aware of his location along the facility, he knows how and when to make any necessary traffic maneuvers to continue along his desired route. The informed driver would then require only about 0.35 sec to satisfy his navigational needs. The geometric complexity of the intersection or interchange would have little effect on the navigational information needs of the informed mo-torists. All junctions should provide for at least this navigational task capability.
The "uninformed" or nonlocal motorist requires more time and information or navigational "words" to make an efficient navigational decision than does an informed mo-torist. In searching for the desired information, the un-informed motorist may read at least one uninformative word for each lane except one. This, is because most multi-lane facilities, especially freeways, have one overhead guide sign per lane approaching an interchange. After locating the correct overhead guide sign, the motorist would need to read at least two informative navigational words describ-ing the appropriate route number or control city and the direction or lane assignment. Thus, the time, TN, required by an uninformed motorist to satisfy his navigational in-formation needs at an interchange or intersection would be
TN = 0.35(-i-, + i) (D-6)
in which 1 is the total number of through lanes of the roadway.
For an interchange or intersection to warrant "un-informed motorists" conditions, it is recommended that at least one uninformed motorist would have to arrive at the interchange for each direction of flow on the roadway at least once per minute 75 percent of the time during the night design hour. If Poisson arrivals are assumed, this criterion requires a minimum of 230 uninformed motorists per hour for both directions. It is assumed that uninformed traffic on freeways is 25 percent in rural areas, 20 percent in suburban areas, and 15 percent in urban areas. The ratio of the night design hourly volume to average daily traffic for all cases is assumed to be 0.05 sec as before.
It is recognized that the geometric complexity of the
interchange and the expectance of the driver should also be considered in evaluating the navigational information task difficulties and needs. DiamOnd interchanges are per-haps the most expected and the easiest to evaluate and navigate. Cloverleafs are assumed to be approximately one-third more demanding. Partial cloverleafs, wyes, trum-pets, and directional interchanges are not expected by the uninformed driver and frequently are more difficult to negotiate. These types of interchanges are assumed to be 50 percent more demanding than the simple diamond inter-change. In essence, what is being implied is that only one-half the traffic volume would be required to warrant a partial cloverleaf interchange than would be required to warrant a diamond.
Table D-2 gives the minimum average daily traffic volume required to warrant an uninformed motorist navi-gational task time. This volume includes the sum of the roadway's through, exiting, and entering volume for each direction at the interchange.
As before, at least two warranting intersections per mile are required to achieve consideration for a continuous war-ranting of lighting conditions. Consideration of warrant-ing continuous lighting on freeways requires at least one warranting interchange every 11/2 miles.
COMPUTATION OF THE POSITIONAL INFORMATION
SUPPLY WITHOUT FIXED ROADWAY LIGHTING
The supply of positional information in the form of lane lines, edgelines, and curb delineation was considered by the participants in the diagnostic study phase of this research to be the most critical and most needed information. All other tasks at the situational and navigational levels de-pended on the sufficiency of these visual inputs. The sub-jects insisted that more orderly consideration and accom-plishment of the situational and navigational task was possi-ble when positional information was readily available.
Model of Positional Information Supply
The supply in time of positional information is computed from
C= 1.47Vr (D-7)
in which C is the positional information supply, in seconds; yr is the running speed of the traffic, in miles per hour; and L is the average visibility distance of the critical source of positional information ahead of the driver without fixed roadway lighting. It is apparent that the supply of posi-tional information increases with increasing visibility dis-tances and decreases as the speed of the driver increases. The critical source of positional information in this model is assumed to be the lane lines.
The visibility distance of a lane line is known to depend on its contrast, its brightness as determined by the vehicles headlights on dim, its width, and the amount of disability glare in the driver's field of view. This model is developed from visibility research findings and theory of others and then calibrated with data obtained in a controlled field

103
study to ensure that satisfactory visibility distances would be obtained.
The basic visibility equation was developed from re-search presented by Adrian (10). The relationships be-tween brightness differences, between the target and its background, and the minimum size of the target that would have a 100 percent probability of detection were presented. In this model, the target is the lane lines and the back-ground is the pavement surface. The following equation was developed from Adrian's research, which, relates the visual angle to the brightness and brightness differences:
1 .66B00327 a = ( B1 - B)°654
(D-8)
in which
a = The minimum visual angle, in minutes of arc;
B = The brightness of the background pavement, in foot-lamberts; and
B1 = The brightness of the lane lines, in foot-lamberts.
The visual angle of the target is assumed to be deter-mined by the width of the lane line, R, in inches, and the resulting visibility distance of the lane line, L. Substituting for a a value of 287 R/L results in the following equation for the visibility distance, L:
R(B I p — B )0.654 L = 173
B 0.327 (D-9) p
The effects of glare can be included in the visibility dis-tance equation by adding the disability veiling brightness, G, to the initial brightness of the object and background. The glare, G, is the sum of all the glare effects from glare sources in the driver's field of view. The visibility equation thus becomes
L = 173 R[B 1 + G - (B + G)]°654
(B + G)° 321
R[B1 - B]0651 (D-1O) = 173 [B + G]°327
The intensity of the low-beam headlight illumination on the lane lines and pavement surface near the anticipated visibility distance was estimated from photometric headlight data provided by a national manufacturer of highway sign-ing materials. These data suggested that the illumination in foot-candles could be estimated by
5,000 E=
d2 (D-11)
in which d is the distance from the vehicle to the location on the lane line where the intensity of illumination is de-sired. Here, this desired distance is the visibility distance, L.
With E, the intensity of illumination (in foot-candles) known, the brightness of the lane line was computed from
B j =p j E (D-12)
in which m is the reflectance factor of the lane lines, and the brightness of the pavement surface was computed from
B=pE (D-13)
TABLE D-2
MINIMUM AVERAGE DAILY TRAFFIC TO WARRANT UNINFORMED MOTORISTS' NAVIGATIONAL INFORMATION TASK b. C, d,
TYPE
MINIMUM ADT REQUIRED
RURAL SUBURBAN LOCATION LOCATION
URBAN LOCATION
Interchanges: -
Diamond 18,000 23,000 30,000 Cloverleaf 13,000 17,000 22,000 Directionals 9,000 11,000 15,000 Parclos 9,000 11,000 15,000 Wyes 9,000 11,000 15,000 Trumpets 9,000 11,000 15,000
Intersections 5,000 10,000 15,000
"Sum of roadway's six volumes: two through, two off, and two on. b All intersections and interchanges warrant at least 0.4-sec naviga-
tional information task time. A minimum of two warranting intersections every mile and one war-
ranting interchange every 11h miles is required for consideration of con-tinuous lighting warranting.
The crossing roadway must have an ADT at least 20 percent of the value shown.
o When warranted, Ni = T' = 0.35 (f + . in which I is the number
of lanes on the facility.
in which Pp is the reflectance of the pavement surface. Thus, the visibility equation becomes
173R [ 5,000Pi 5,000P0
V L
- L2 (D-14)
- 5 °°0Pp 0.327
L2 +G]
The disability veiling brightness or glare was computed from the generalized Holladay-Stiles formula:
G= 107rE1
(D-15) on
in which
G = Disability veiling brightness, in foot-lamberts; E = The illumination striking the plane of the driver's
eyes; U = Incident angle of the glare source, in degrees; and n = Generalized exponent.
The amount of oncoming vehicle headlight glare is de-pendent on the lateral separation, s, between an oncoming vehicle and the vehicle affected, and the longitudinal sepa-ration, X, between the two vehicles. The distance between the two vehicles would then be
h='/X2 +s2 (D-16)
The average effective left-side candlepower for dim lights was assumed to be 2,000 at the driver's eye height based on the headlight data available. It is recognized that vehicle headlights form a directionally oriented beam of light and do not act exactly as a point source of light. However, to simplify the calculations, the point source was assumed and the effective candlepower was determined by calibration to
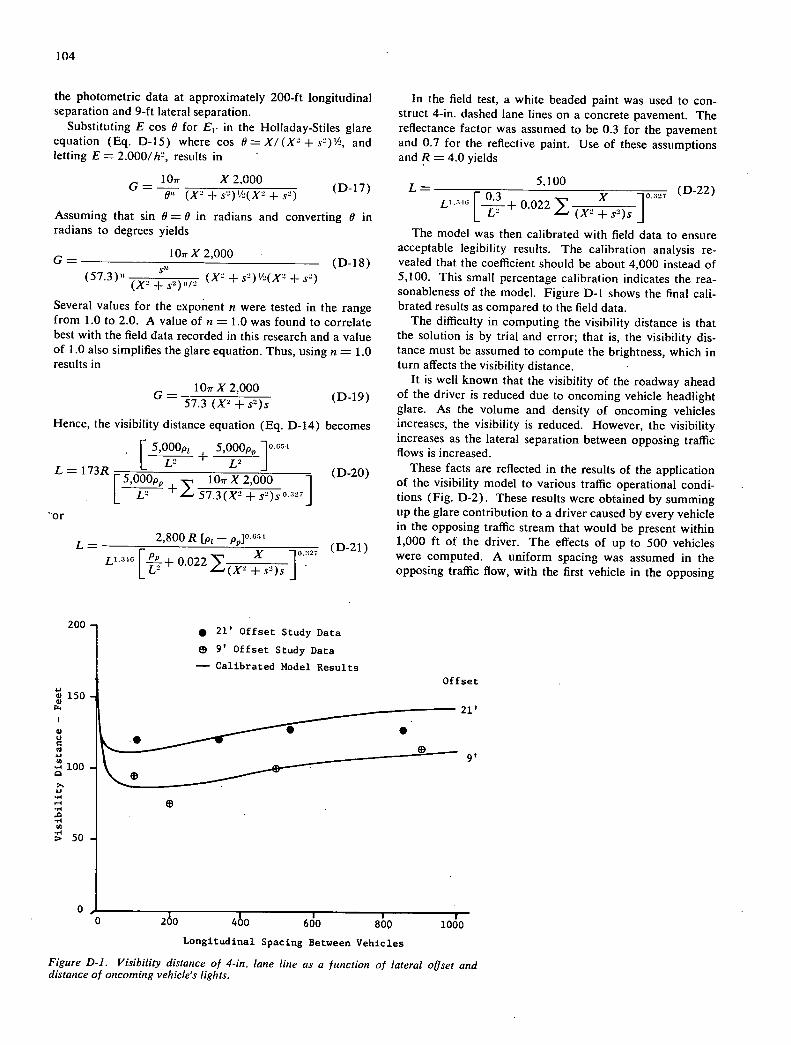
200
it
150
a C) a cli 1.1
100
104
the photometric data at approximately 200-ft longitudinal separation and 9-ft lateral separation.
Substituting E cos 0 for E1. in the Holladay-Stiles glare equation (Eq. D-15) where cos 0 = X/(X2 + s2)½, and letting E = 2,000/h2, results in
X2,000 0 (X 2 + S2)½(X2 + 2) (D-17)
Assuming that sin 0 = 0 in radians and converting 0 in radians to degrees yields
G= 107rX 2,000
(D-18)
(X- + s -
,)"-
(57.3)11 ', (X2 + s2)½(X2 + 2)
Several values for the exponent n were tested in the range from 1.0 to 2.0. A value of n = 1.0 was found to correlate best with the field data recorded in this research and a value of 1.0 also simplifies the glare equation. Thus, using n = 1.0 results in
lOirX 2,000
G = 57.3 (X + s2)s
(D-19)
Hence, the visibility distance equation (Eq. D-14) becomes
5,000,, + 5000p
L L2 L 2 L = 173R
[ 5'°°°Pp +
(D-20)
lOir X 2,000 1 2 57.3(X2 + S2 S 0.327]
or
2,800 R [p - ]0.65:t L= p (D-21)
L'31° [+ 0.022(x2 +s2)s
]0*327
In the field test, a white beaded paint was used to con-struct 4-in, dashed lane lines on a concrete pavement. The reflectance factor was assumed to be 0.3 for the pavement and 0.7 for the reflective paint. Use of these assumptions and R = 4.0 yields
0.3 5.100
L—
L1310[+ 0.022 (X ±s2)s
]0.:127 (D -2 2)
The model was then calibrated with field data to ensure acceptable legibility results. The calibration analysis re-vealed that the coefficient should be about 4,000 instead of 5,100. This small percentage calibration indicates the rea-sonableness of the model. Figure D-1 shows the final cali-brated results as compared to the field data.
The difficulty in computing the visibility distance is that the solution is by trial and error; that is, the visibility dis-tance must be assumed to compute the brightness, which in turn affects the visibility distance.
It is well known that the visibility of the roadway ahead of the driver is reduced due to oncoming vehicle headlight glare. As the volume and density of oncoming vehicles increases, the visibility is reduced. However, the visibility increases as the lateral separation between opposing traffic flows is increased.
These facts are reflected in the results of the application of the visibility model to various traffic operational condi-tions (Fig. D-2). These results were obtained by summing up the glare contribution to a driver caused by every vehicle in the opposing traffic stream that would be present within 1,000 ft of the driver. The effects of up to 500 vehicles were computed. A uniform spacing was assumed in the opposing traffic flow, with the first vehicle in the opposing
Longitudinal Spacing Between Vehicles
Figure D-1. Visibility distance of 4-in, lane line as a function of lateral offset and distance of oncoming vehicle's lights.

200
150
C) a
j 100
0 100 200 300 400 )UU
105
Vehicles Per Mile
Figure D-2. Low-beam positional visibility distance as a function of oncoming vehicle density and lateral separation.
traffic flow positioned one-half of the average spacing in front of the affected motorist.
Discussion
In essence, the oncoming vehicle headlights are sources of light that produce glare in the driver's eyes. Environmental lighting could also be considered similarly. Certainly, the glare caused by different roadside establishments varies widely. On the other hand, it seems impractical to require that they be counted or that their effects be measured di-rectly. The objective, then, is to develop a practical method of incorporating roadside lighting into the approach being developed.
If it is assumed that 52.8 ft of frontage of an establish-ment that is lighted at night has a glare equivalent of 1 on-coming vehicle, a traffic facility that has 100 percent road-side lighted development on one side would be equivalent to a vehicle light source density (as in Fig. D-2) of 100 vehicles per mile, or a 100 percent lighted development on both sides of 200 vehicles per mile. A 50 percent develop-ment on both sides would be equivalent to 100 vehicles per mile, etc.
To simplify the computation, the roadside lighting is assumed to be located at the same offset as the oncoming vehicle headlights. Although this assumption may seem to be unjustified, the principal objective is to include the road-side environmental effects in some reasonable way rather than to neglect them entirely.
Procedure for Computing Positional Information Supply
The procedure for computing the positional information supply, in seconds, is presented in the following and sum-
marized in Figure D-3. The procedure considers general visibility, as previously discussed, including oncoming ve-hicle glare and roadside development. Also considered are the percentage of time the driver will be using high and low beams as related to traffic flow conditions, the average horizontal alignment, and the average running speed of the driver.
Step A. The first step in the procedure is to compute the visibility distance of the lane lines, as shown in Figure D-3a. Four items of data are required: (1) Q, the opposing traf-fic stream volume during the night design hour; (2) V0, the operating speed of the opposing flow for the previous volume; (3) the average lateral offset of the opposing stream flow with respect to the inside lane in the driver's flow; and (4) the average percentage development along the facility.
To illustrate, assume that the facility being analyzed is a 4-lane divided arterial having 12-ft lanes and a median width of 18 ft. The lateral offset is 3 + 18 + (24/2) = 33 ft. The directional volume, Q, is assumed to be 300 ve-hicles iier hour during the night design hour. Due to sig-nalization, the operating speed in the opposing flow, V0,
which includes delay time, is 30 mph. To simplify compu-tation, the flow or speed is assumed to be the same in each direction of flow. The average roadside development that has exterior lighting is 45 percent for both sides.
Referring again to Figure D-3a, the number of glare sources per mile is (Q/ V0 ) + 200 X % development, or (300/30) + 200 X 45% = 100. Use of this result and the 33-ft lateral offset in Figure D-3a gives low-beam visibility distance of 100 ft. This answer is used later in the procedure in Figure D-34.
Step B. A driver traveling along a roadway at night gen-

175 50
a) a) 150 A
I a) 0
a).i
0 -4 125, 4- o 0
3 CC.D 1-I a)
Offset 0J. et
Offs
1.1 100 ø - a) 2
1-lw 57a) -
.ra) 75 00
33 c )-. 0
1 r4 (1) - -'-10 i . 4
50 I I I' • I H 0 .100 200 300 400 50 150 250 .350 Glare Sources Per Mile High Beam Visibility Distance Q/V + 200&% Developed
0 0-- HighBeam • Visibility
/ 20 Distance
r1 a) 4U. 40
4-I Oa)
1JC 60. 60
- - - - -
80.. 80 X Low Beam 100 Visibility Distance y._I
- 100 0 5 10 15 20 Average Oncoming Vehicle
50 150 250 350 Average Visibility Distance - Feet
Spacing=Q/V . 5 V Running r E
20 Speed 4
40 Positional 60 Information.
3 Supply - Seconds
2
1
50 • 1 0 250 350 Figure D-3. Information supply. Average Visibility Distance - Feet

107
erally uses both his high- and low-beam headlights. On low-volume rural highways, the driver would use his high beams a large percentage of the time, whereas in urban areas low-beam use would predominate. This must be taken into account in estimating the average positional information supply. Figures D-3b and D-3d were devel-oped to satisfy this requirement.
Figure D-3b shows the average percentage of time a driver would be using his low-beam headlights as a func-tion of the traffic volume in the opposing direction of flow,
Q, and its average operating speed, V0. This figure is based
on the assumption of Poisson flow and on the assumption that opposing drivers dim their lights at a 1,000-ft longi-tudinal separation distance. Again, using the data given
(Q = 300, 170 = 30) Figure D-3b indicates that 80 percent of the time the affected driver would be using his low-beam headlights. This answer is transferred across to Figure
D-3d.
Step C. The next step is to compute the average high-beam positional visibility distance. The maximum high-beam. visibility distance of positional information on a straight roadway is assumed to be 400 ft without fixed-source roadway lighting. However, as the average degree of curvature of the roadway increases, the visibility of the pavement surface and lane lines is reduced, because the roadway is curving away from the headlights. Figure D-3c is based on the assumption that a vehicle's high-beam head-light pattern will permit lane lines to be visible up to a 2° angle of divergence with the longitudinal axis of the vehicle.
The average degree of curvature of a roadway is com-puted by summing the degree of curvature at each 100-ft station and dividing the sum by the number of stations considered. In this example, it is assumed that the average
curvature was found to be 1.5°. From Figure D-3c, a 1.5°
curvature results in an average high-beam visibility distance
of 270 ft.
Step D. As shown in Figure D-3d, after the visibility distances for high beams (270 ft) and low beams (100 ft) are plotted at 0 percent and 100 percent low beam used, an average positional visibility distance, L, of 134 ft is com-
puted for the 80 percent low-beam operation existing in the example. This figure solves the equation
L= % low beam (L) + (100% - % low beam) (L111, beam) (D23)
Step E. The final step is to compute the positional in-formation supply, in seconds, knowing the average visi-
bility distance in feet, L (here 134 ft) and the average run-
ning speed, 11r' which for the example is assumed to be 40 mph. Figure D-3e shows that the positional informa-
tion supply, C, is 2.3 sec. Figure E-3e solves the equation
L (D-24)
1 .47V,
APPLICATION OF DRIVER INFORMATION MODEL IN WARRANTING FIXED ROADWAY LIGHTING
Fixed roadway lighting has many beneficial aspects. It im-proves roadway visibility and traffic operations, improves the criminal surveillance capabilities of the police, and may
express the objectives and attitudes of the community. The value of fixed roadway lighting, then, depends on the values
of the group in question.
Warranting Fixed Roadway Lighting
The approach used here to warrant fixed roadway lighting is based on the driver's information needs to perform his driving task on the facility in question within the driving environment present. From this viewpoint, fixed roadway lighting is warranted along a section of roadway or at inter-changes or intersections when the information demand ex-ceeds the information supply without fixed roadway lighting.
The information demand is the time required to fulfill the sequence of positional, situational, navigational, and redundant positional information searches. That is, the
demand is
(D-25)
in which
D = information demand, in seconds, on a section of
roadway; P = Time required to obtain positional information on
cycle i; Si = Time required to obtain situational information on
cycle i; N j = Time required to obtain navigational information
on cycle i; and
P 1 = The next required positional information search
update on cycle i = 1, which must be achieved within the section of roadway visible during P.
= P in time.)
The time required by the driver to make a positional
update, P, is computed from Eq. D-4. However, two po-sitional updates are required, each of the same duration, within a given supply time. The time required to satisfy the situational information needs, S, for a facility is com-puted by use of Table D-1. The time required to make a navigational update is 0.0 between junctions, 0.4 sec where intersections and interchanges do not warrant a higher
level, and 0.35(--+ i) seconds where this higher level is
warranted, as given in Table D-2.
Substitution of the results from Eq. D-4 for both P and
P, determination of S from Table D-1, and evaluation of
N from Table D-2, gives the information demand, D, as
D= 1.5 +s,+ [0.0, 0.4, 0.35 (-+ i)]
(D-26)
in which
D = Information demand, in seconds;
D° = Average degree of horizontal curvature, in degrees;
W = Average lane width (for a one-lane turning road-way use pavement width - 5 ft);
Si= Situational information time demand (Table D-2);
and = Number of facility lanes.
The positional information supply depends on the suit-

108
ability of the night driving environment without fixed road-way lighting. The positional information supply in sec-onds, C, is computed from Figure D-3.
To check a section of roadway to determine if fixed roadway lighting is warranted, the information index, I, is computed as
D (information demand) (D-27) = C (information supply)
and fixed roadway lighting is warranted if 1> 1. It is recommended that 500-ft sections of roadway be analyzed.
Noncontinuous Warranting
On roadways that will not warrant continuous lighting, the interchanges or intersections should be evaluated without the continuous warranting requirements. The interchanges and intersections that will warrant lighting (where the road-way itself does not warrant continuous lighting) should be considered to warrant complete area lighting. Partial inter-change lighting might be based on an individual movement analysis.
Establishing Priorities
The decision-maker, who allocates funds to various com-peting warranting lighting projects, needs a rational ap-proach to use in allocating funds so as to maximize the benefits to the motoring public. One such approach is to compute an equivalent priority index, P,, for any warrant-ing lighting project, X, and to compare it to all other com-peting projects. With all competing priority indices ranked in order from highest to lowest, selections would be made from the top until either all the available funds were ex-pended or until some minimum acceptable spending level of priority was reached based on historical needs.
The recommended procedure for computing the priority index for a warranting lighting project is
Qd
Px= =' Ci
(D-28)
in which
Px = Priority index of warranted lighting, project X; I j = Information index of warranted roadway, section
Qj = Average daily traffic on roadway, section i; di = Length of warranted roadway, section i; D = Number of sections warranted on roadway; and C = Present-worth cost of lighting, operating, and
maintaining the complete project.
REFERENCES
GORDON, D. A., "Experimental Isolation of the Driv-er's Visual Input." Hwy. Res. Record No. 122 (1966) pp. 19-34. ROCKWELL, T. H., ERNST, R. L., and RULON, M. J., "Visual Requirements in Night Driving." NCHRP Report 99 (1970). MATSON, T. M., SMITH, W. S., and Huim, F. W., Traffic Engineering. McGraw-Hill (1955) p. 14. MOURANT, R. R., ROCKWELL, T. H., and RACKOFF, N. J., "Drivers' Eye Movements and Visual Work-load." Hwy. Res. Record No. 292 (1969) pp. 1-10. LUCKEISH, M., and Moss, F. H., "Applied Science of Seeing." Ilium. Eng., Vol. 28, No. 10 (1933). WILBUR SMITH AND ASSOCIATES, "Transportation and Parking for Tomorrow's Cities." pp. 100 (1966). Traffic Engineering Handbook. Inst. of Traffic Engi-neers (1965). DREW, D. R., Traffic Flow Theory and Control. McGraw-Hill (1968). MITCHELL, A., and FORBES, T. W., "Design of Sign Letter Sizes." ASCE Proc., Vol. 68, No. 1 (1942). ADRIAN, W., "The Principles of Disability and Dis-comfort Glare." Presented at Symposium on Visi-bility in the Driving Task, Texas A&M Univ. (1968).
APPENDIX E BIBLIOGRAPHY
VISUAL CONSIDERATIONS
I. ADLER, F. H., Physiology of the Eye. Fourth Ed., Mosby Co., St. Louis, Mo. (1965).
2. ADRIAN, W., and SCHREUDER, D. A., Discussion of J. M. Waldram, "A Simple Method for the Appraisal of Glare in Street Lighting." Lighting Res. and Tech., Vol. 2, No. 2, pp. 61-73 (1970).
ALLEN, M. J., and LYLE, W. M., "Relationship Be-tween Driving Ability and Amount of Light Needed for Specific Performance on a Low-Contrast Target." Amer. J. Opt., Vol. 44, No. 5, pp. 311-318 (May 1967). AULHORN, E., and HARMS, H., "Untersuchungen Uber das Wesen des Grenzkontrastes." Berichte Dtsch. Opthalm. Ges., Heidelberg, 60 (1956).
109
AULHORN, E., "Uber die Beziehung Zwischen Licht-sinn und Sehscharfe." A. V. Graefe's Archiv. /. Opthalm., 4 (1964). BARTLEY, S. H., Principles of Perception. Harper
(1958). BLACKWELL, H. R., "Visual Detection at Low Lumi-nance Through Optical Filters." HRB Bull. 89 (1954) pp. 43-61. BLACKWELL, H. R., and BLACKWELL, 0. M., "The Effect of Illumination Quantity Upon the Perform-ance of Different Visual Tasks." Ilium. Eng., Vol. 63,
No. 4, pp. 143-152 (Apr. 1968).
BLACKWELL, H. R., "Contrast Thresholds of the Human Eye." J. Opt. Soc. Amer., Vol. 36, No. 11, pp. 624-643 (Nov. 1946). BLACKWELL, H. R., "Evaluating the Significance of Reflected Glare." Ilium. Eng., Vol. 58, No. 4, pp. 217-243 (Apr. 1963). BLACKWELL, R. H., SCHWAB, R. N., and PRITCHARD, B. S., "Illumination Variables in Visual Tasks of Driv-ers." Pub. Roads, Vol. 33, No. 11, pp. 237-248 (Dec. 1965). BLACKWELL, H. R., SCHWAB, R. N., and PRITCHARD, B. S., "Visibility and Illumination Variables in Road-way Visual Tasks." Ilium. Eng., Vol. 59, No. 5 (Sec. 1), pp. 277-308 (May 1964). BONVALLET, G. G., et al., "Visibility Distance as Affected by Roadway Lighting Parameters." Ilium.
Eng., Vol. 60, No. 5, pp. 355-363 (May 1965): BOUMA, P. J., "Characteristics of the Eye with Special Reference to Road Lighting." Philips Tech. Rev., Vol. 1, No. 4, pp. 102-106 (Apr. 1936). BOUMA, P. J., "Measurements Carried Out on Road Lighting Systems Already Installed." Philips Tech. Rev., Vol. 4, No. 10, pp. 292-301 (Oct. 1939). BOUMA, P. J., "Perception on the Road when Visi-bility is Low." Philips Tech. Rev., Vol. 9, No. 5, pp. 149-157 (May 1947). BRYAN, W. E., and HOFSTETTER, H. W., "Vision of Automobile Drivers." J. Amer. Opt. Assn., Vol. 29, No. 5, pp. 495-499 (1958). BURG, A., "Vision and Driving: A Summary of Re-search Findings." Hwy. Res. Record No. 216 (1968) pp. 1-12. BURG, A., and SLADE, H., "Dynamic Visual Acuity as Related to Age, Sex, and Static Acuity." I. App!.
Psych., Vol. 45, No. 2, pp. 111-116 (1961). BURG, A., "An Investigation of Some Relationships Between Dynamic Visual Acuity, Static Visual Acuity, and Driving Record." UCLA Rep. No. 64-18, Univ. California at Los Angeles (Apr. 1964). CHRIsTIE, A. W., and FISHER, J., "The Effect of Glare from Street Lighting Lanterns on the Vision of Driv-ers of Different Ages." Trans. JES, Vol. 31, No. 4, pp. 93-108 (1966). CLEVELAND, D. E., "Driver Tension and Rural Inter-section Illumination." Traffic Eng., Vol. 32, No. 1, pp. 11-15 (Oct. 1961). DANIELSON, R. W., "Relationship of Fields of Vision
to Safety in Driving." Traffic Safety Res. Rev., Vol. 2, No. 3, pp.. 8-25 (Sept. 1958).
24., DE BOER, J. B., et al., "Appraisal of the Quality of Public Lighting Based on Road Surface Luminance and Glare." P-59.23, N. V. Philips Gloeilampen-fabrieken, Eindhoven, The Netherlands (June 1959). DE BOER, J. B., and VERMEULEN, D., "On Measuring the Visibility with Motor-Car Headlighting." AppI.
Sci. Res., Vol. B2, No. 1, pp. 1-32 (1951). DE BOER, J. B., "Public Lighting." N. V. Philips Gloeilampenfabrieken, Eindhoven, The Netherlands (1967). DEUTSCH, J. A., and DEUTSCH, D., Physiological Psy-chology. Dorsey Press, Homewood, Ill. (1966). DIAMOND, A. L., SCHEIBLE, H., SCHWARTZ, E., and YOUNG, R., "A Comparison of Psychophysical Meth-ods in the Investigation of Foveal Simultaneous Bright-ness Contrast." J. Exper. Psych., Vol. 50, No. 3, pp. 17-174 (1955). EINHORN, H. D., "Pre-Determination of Direct Dis-comfort Glare." Trans. IES, Vol. 26, No. 4, pp. 154-164 (Apr. 1961). EYSENCK, H. J., GRANGER, G. W., and BRENGELMANN, J. C., Perceptual Processes and Mental Illness. Ox-ford Univ. Press, London (1957). FELDHAUS, J. L., JR., "Dynamic Visual Acuity—Ef-fect on Night Driving and Highway Accidents." HRB
Bull. 298 (1961) pp. 1-2. FINCH, D. M., "Lighting Design for Night Driving." Ilium. Eng., Vol. 45, No. 6, pp. 371-381 (June 1950). FORBES, T. W., SNYDER, T. E., and PAIN, R. F., "Traf-fic Sign Requirements." Hwy. Res. Record No. 70
(1965) pp. 48-56. FORBES, T. W., "Some Factors Affecting Driver Ef-ficiency at Night." HRB Bull. 255 (1960) pp. 61-71. FOWLE, A. W., and KAERCHER, R. L., "Light Dis-tribution for Effective Control of Glare in Roadway Lighting." Illum. Eng., Vol. 57, No. 5, pp. 336-348 (May 1962). FOWLE, A. W., and KAERCHER, R. L., "Roadway Brightness and Illumination as Related to Luminaire Distributions." Ilium. Eng., Vol. 56, No. 4, pp. 279-290 (Apr. 1961). FRY, G. A., "Numerical Assessment of the Capacity of a Single Glare Source to Produce Discomfort." Illu,n. Eng., Vol. 51, No. 11, pp. 722-728 (Nov. 1956). FRY, G. A., "The Scissors Curve Method for Evaluat-ing Discomfort Glare." Ilium. Eng., Vol. 63, No. 9, pp. 477-484 (Sept. 1968). FRY, G. A., "Prescribing Levels of Illumination." Illu,n. Eng., Vol. 58, No. 7, pp. 486-489 (July 1963).
GIBsON, J. J., The Perception of the Visual World. Riverside Press, Cambridge, Mass. (1950). GORDON, D. A., "Perceptual Basis of Vehicular Guid-ance." Pub. Roads, Vol. 34, No. 3, pp. 53-68 (Aug. 1966). GORDON, D. A., "Experimental Isolation of the Driv-er's Visual Input." Hwy. Res. Record No. 122 (1966) pp. 19-34.

110
GUTH, S. K., and MCNELIS, J. F., "A Discomfort Glare Evaluator." Ilium. Eng., Vol. 54, No. 6, pp. 398-405 (June 1959). GUTH, S. K., "A Method for the Evaluation of Dis-comfort Glare." Ilium. Eng., Vol. 58, No. 5, pp. 351-364 (May 1963). GUTH, S. K., "Quality of Lighting." Ilium. Eng., Vol. 50, No. 6, pp. 279-285 (June 1955). HOLLADAY, L. L., "The Fundamentals of Glare and Visibility." I. Opt. Soc. Amer., Vol. 12, No. 6, pp. 830-836 (1926). HOPKINSON, R. G., "Evaluation of Glare." Ilium. Eng., Vol. 52, No. 6, pp. 305-316 (June 1957). KITE, C. R., and KING, J. N., "A Survey of the Fac-tors Limiting the Visual Fields of Motor Vehicle Driv- ers in Relation to Minimum Visual Field and Visi-bility Standards." Brit. J. Physiol. Optics, Vol. 18, No. 1, pp. 97-105 (1961). KNUDSEN, B., "Comparison of Street Lighting Codes." Light and Lighting, Vol. 57, No. 8, pp. 242-244 (1964). Lighting Handbook, 3rd. Ed. Illuminating Engineer-ing Society (1962). LUDVIGH, E., and MILLER, J. M., "Study of Visual Acuity During the Ocular Pursuit of Moving Test Objects." J. Opt. Soc. Amer., Vol. 48, No. 3, pp. 262-269 (1958).
MCCOLGIN, F. H., "Movement Thresholds in Pe-ripheral Vision." J. Opt. Soc. Amer., Vol. 50, No. 8, pp.774-779 (1960).
MCFARLAND, R. A., and DOMEY, R. G., "Experimen-tal Studies of Night Vision as a Function of Age and Changes in Illumination." HRB Bull. 191 (1958) pp. 17-32.
MONJE, M., "Die Abhangigkeit der Sehscharfe von der Darbietungsaeit." Berichte Dtsch. Opthalm. Ges., 55, Heidelberg (1949).
MooN, P., and SPENDER, D. E., "The Visual Effect of Non-Uniform Surrounds." I. Opt. Soc. Amer., Vol. 35, No. 3, pp. 233-248 (Mar. 1945). MULLIN, E. F., "The Part Visibility Could Play in Road Design." Australian Road Res., Vol. 2, No. 9, pp. 15-43 (Sept. 1966). NAGARAJA, N. S., "Effect of Luminance Noise on Contrast Thresholds." I. Opt. Soc. Amer., Vol. 54, No. 7, pp. 950-955 (1964). PECKHAM, R. H., and HART, W. M., "Retinal Sensi-tivity and Night Visibility." HRB Bull. 226 (1959) pp. 1-6.
REID, K. M., and TOENJES, D. A., "Appraisal of Dis-comfort Glare on Lighted Streets." Ilium. Eng., Vol. 47, No. 3, pp. 143-148 (Mar. 1952). REID, K. M., and CHANON, H. J., "Evaluation of Street Lighting." Trans. I.E.S., Vol. 34, No. 10, pp. 1209-1232 (Dec. 1939).
REID, J. A., and TYLER, J. W., "Reflective Devices as Aids to Night Driving." Hwys. and Traffic Eng., Vol. 37, No. 1715, pp. 34-42 (July 1969).
REX, C. H., "Effectiveness Ratings for Roadway Light-ing." Ilium. Eng., Vol. 58, No. 7, pp. 501-516 (July 1963). REX, C. H., "New Developments in the Field of Road-way Lighting." Traffic Eng., Vol. 30, No. 6, pp. 15-25 (Mar. 1960).
RICHARDS, 0. W., "Visual Needs and Possibilities for Night Automobile Driving." American Optical Corp. (1967).
ROCKWELL, T. H., ERNST, R. L., and RULON, M. J., "Research on Visual Requirements in Night Driving." Final Rep. EES 254-1, Ohio State Univ. (Apr. 1967). ROPER, V. J., "Seeing with Motor Car Headlamps." Trans. I.E.S., Vol. 33, No. 5, pp. 417-438 (May 1938).
ROWAN, N. J., JENSEN, H. C., and WALTON, N. E., "An Interim Report on a Study of Disability Veiling Brightness." Res. Rep. 75-5, Texas Transportation Inst., College Station, Tex. (1967). RUMAR, K., "Night Driving Visibility." Traffic Eng. and Control, Vol. 5, No. 10, pp. 61 1-615 (Feb. 1964). SCHMIDT, I., "Visual Considerations of Man, the Ve-hicle, and the Highway. Part I." Pub!. SP-279, Soc. of Automotive Eng., (Mar. 1966). SCHOBER, A. W., "Influence of Disability Glare on Highway Visibility in Fatigued and Normal Observers. Ilium. Eng., Vol. 60, No. 6, pp. 414-418 (June 1965). SCHROEDER, S. R., and HOLLAND, J. G., "Operant Con-trol of Eye Movements During Human Vigilance." Science, Vol. 161, No. 3838, pp. 292-293 (July 19, 1968).
SCHWAB, R. N., "Night Visibility for Opposing Driv-ers with High and Low Headlight Beams." Ilium. Eng., Vol. 60, No. 5, pp. 364-373 (May 1965). SCHVARTS, L. A., "Raising the Sensitivity of the Visual Analyser." In B. Simon (ed.), Psychology in the Soviet Union. Stanford Univ. Press, p. 101 (1957). SENDERS, J. W., "The Attentional Demand of Auto-mobile Driving." Rep. No. 1482, Bolt, Beranek and Newman, Inc. (Mar. 1967).
"1964 Survey of State Requirements for Motor Ve-hicle Operators." American Optical Company, South-bridge, Mass.
TEMPLETON, A. E., "Eye Movements and Inter-change Driving." Res. Rep. 13 7-3, Texas Transporta-tion Inst., College Station, Tex. (1970). THOMAS, J. P., "Relation of Brightness Contrast to Inducing Stimulus Output. I. Opt. Soc. Amer., Vol. 53, No. 9, pp. 1033-1037 (Sept. 1963). TURNER, H. J., "The Inferaction Between Fixed Light-ing and Vehicle Headlights." Australian Road Res., Vol. 2, No. 3, pp. 3-22 (1965). WAGMAN, I. H., and BATTERSBY, W. S., "Neural Limi-tations of Visual Excitability: II. Retrochiasmal Inter-action." Amer. I. Physiol., Vol. 197, No. 6, pp. 1237- 1242 (1959). cl
WALD, G., "On the Mechanism of the Visual Thresh-old and Visual Adaptation." Science, Vol. 119, No. 3104, pp. 887-892 (1954).

111
81. WALDRAM, J. M., "Visual Problems in Streets and 11. "The Glaremerk G8: A Luminaire Characteristic.
Motorways." Ilium. Eng., Vol. 57, No. 5, pp. 361- E.3.3.1, C.I.E. (Aug. 1969).
375 (May 1962). 12. HARRIS, A. J., and CHRISTIE, A. W., "The Revealing 82. WALTON, N. E., and ROWAN, N. J., "An Interim Re- Power of Street Lighting Installations and Its Calcula-
port on Roadside Sign Visibility." Res. Rep. i.)-3, tion." Trans. IES. (London), Vol. 16, No. 5, pp. 120- Texas Transportation Inst., College Station, Tex. 128 (1951). (1967). 13. HARRIS, A. J., and CHRISTIE, A. W., "Research on
83. WALTON, N. E:, and ROWAN, N. J., "Final Report, Two Aspects of Street Lighting: Accident Statistics Supplementary Studies in Roadway Lighting." Rep. and Road Surface Characteristics." Pub. Lighting, No. 75-13, Texas Transportation Inst., College Station, Vol. 19, No. 83, pp. 553-563 (1954). Tex. (Aug. 1969). 14. HARTMANN, E., "The Threshold of Disability Glare."
84. WARREN, R. M., and WARREN, R. P., "Basis for Judg- Light and Lighting, Vol. 57, No. 3, p. 88, Mar. 1964. ments of Relative Brightness." J. Opt. Soc. Amer., 15. JAIN5KI, P., "Contrast Sensitivity in Case of Glare Vol. 48, No. 7, pp. 445-450 (1958). Phenomena Produced by Different Kinds of Light."
WILLIAMS, C. H., "Legibility of Numbers as a Func- Lichtrechnik (Helios-Verlag Grub H, Eichborndamm tion of Contrast and Illumination." Human Factors, 144-167, Berlin-Borsigwalde), Vol. 14, No. 2, pp. 60- Vol. 9, No. 5, pp. 455-460 (1967). 65 (1962).
WOODS, D. L., ROWAN, N. J., and JOHNSON, J. H., 16. KETVIRTIS, A., Highway Lighting Engineering. Foun- "A Summary Report, Significant Points from the dation of Canada Engineering Corp. Ltd., Toronto Diagnostic Field Studies." Res. Rep. 606-4, Texas
(1967). Transportation Inst., College Station, Tex. (Sept.
17. KETVIRTIS, A., "Increased Safety and Efficiency 1970).
Through Higher Luminaire Mounting Heights." Foun- dation of Canada Engineering Corp. Ltd., Toronto,
GUIDELINES AND PROCEDURES pp. 1-6 (June 1967).
1. An Informational Guide for Roadway Lighting. 18. KNUDSEN, B., "Comparison of Street Lighting Codes."
American Assn. of State Highway Officials, Washing- Light and Lighting, Vol. 57, No. 8, pp. 242-244
ton, D.C. (Mar. 1969). (1964). 2. BELLCHAMBERS, H. E., LAMBERT, G. K., and RUFF, 19. MAINWARING, G., and STAINSBY, A. G., "The Effect
H. R., "Modern Aids to Lighting Design—Computer of Lantern Light Distribution in a Street Lighting In- Techniques." Trans. IES (London), Vol. 26, No. 3, stallation." Trans. IES. (London), Vol. 33, No. 3, pp. 107-126 (1961). pp. 98-116 (1968).
3. CHRISTIE, A. W., and FISHER, A. J., "The Effect of 20. MARTINEZ, J. E., "An Analytical Solution of the Im- Glare from Street Lighting Lanterns on the Vision of pact Behavior of Luminaire Support Assemblies." Res. Drivers of Different Ages." Trans. IES (London), Rep. 75-9, Texas Transportation Inst., College Station, Vol. 31, No. 4, pp. 93-108 (1966). Tex. (Aug. 1967).
4. DE BOER, J. B., "Road Surface Luminance and Glare 21. NAGEL, G. A., "A Highway Lighting Test Installa- Limitation in Highway Lighting." HRB Bull. 298 tion." Ilium. Eng., Vol. 52, No. 3, pp. 155-165 (Mar. (1961) pp. 56-73. 1957).
5. DE B0ER, J. B., and SCHREUDER, D. A., "Glare as a 22. PUTNAM, R. C., and BOWER, K. D., "Discomfort Criterion for Quality in Street Lighting." Trans. IES Glare at Low Adaptation Levels. Part III. Multiple (London), Vol. 32, No. 2, pp. 117-135 (1967). Sources." IlIum. Eng., Vol. 53, No. 4, pp. 174-184
6. EASTMAN, A. A., and MCNELIS, J. F., "An Evalua- (Apr. 1958). tion of Sodium, Mercury and Filament Lighting for 23. REID, K. M., and CHANNON, H. J., "Evaluation of Roadways." Ilium. Eng., Vol. 57, No. 9, p. 597 (Sept. Street Lighting." Trans. IES (London), Vol. 34, 1962). No. 10, pp. 1209-1232 (1939).
7. EDMAN, W. H., "Analysis of Visual Elements in Road- 24. REID, K. M., and TOENJES, D. A., "Appraisal of Dis-
way Lighting." Trans. A lEE, Vol. 77, Pt. 2 (Applica- comfort Glare on Lighted Streets." Ilium. Eng., Vol.
tions and Industry), No. 39, p. 447 (Nov. 1958). 47 No. 3, pp. 143-148 (Mar. 1952).
8. FOWLE, A. W., and KAERCHER, R. L., "Theoretical 25. REX, C. H., "Technical and Practical Aspects of High- and Practical Light Distributions for Roadway Light-
way Lighting." Proc. Inst. Traffic Eng., Vol. 8, p. 41 ing." Ilium. Eng., Vol. 54, No. 5, pp. 277-285 (May 1959).
(1937).
9. FOWLE, A. W., and KAERCHER, R. L., "Roadway 26. REX, C. H., "Luminaire Light Distribution Principles."
Brightness and Illumination as Related to Luminaire Ilium. Eng., Vol. 50, No. 12, pp. 587-613 (Dec.
Distributions." Illu,n. Eng., Vol. 56, No. 4, pp. 279- 1955).
290 (Apr. 1961). 27. REX, C. H., "Principles and Figures of Merit for
10. FOWLE, A. W., and KAERCHER, R. L., "Light Distri- Roadway Lighting as an Aidto Night Motor Vehicle
butions for Effective Control of Glare in Roadway Transportation." HRB Bull. 146 (1957) pp. 67-82.
Lighting." Ilium. Eng., Vol. 57, No. 5, pp. 336-342 28. REX, C. H., "Computation of Relative Comfort and
(May 1962). Relative Visibility Factor Ratings for Roadway Light-
112
ing." Ilium. Eng., Vol. 54, No. 5, pp. 291-310 (May 1959). REX, C. H., and FRANKLIN, J. S., "Relative Visual Comfort Evaluation of Roadway Lighting." Ilium. Eng., Vol. 55, No. 3, p. 161 (Mar. 1960). ROWAN, N. J., and WALTON, N. E., "Photometric Studies of the Austin 'Moonlight' Tower Lighting Systems." Res. Rep. 75-4, Texas Transportation Inst., College Station, Tex. (Oct. 1966). RUFF, H. R., and LAMBERT, G. K., "Relative Impor-tance of the Variables Controlling Street Lighting Per-formance." Pub. Lighting, Vol. 22, No. 97, p. 177 (1957). SIMMONS, A. E., and FINCH, D. M., "Uniformity of Illumination in Highway Lighting." Ilium. Eng., Vol. 46, No. 4, pp. 199-208 (Apr. 1951). SIMMONS, A. E., and FINCH, D. M., "An Instrument for the Evaluation of Night Visibility on Highways." Ilium. Eng., Vol. 48, No. 10, pp. 517-523 (Oct. 1953). Street Lighting Manual, 2nd Ed., Edison Electric Inst. (1969). SWETLAND, R. M., and LINDSAY, J. S., "Effective Prac-tice in Lighting Hazardous or Irregular Areas." Ilium. Eng., Vol. 46, No. 2, pp. 77-85 (Feb. 1951). THOMPSON, J. A., and FANSLER, B. I., "Criteria for Highway Tunnel Lighting Design." Pub. Roads, Vol. 35, No. 4, pp. 77-79 (Oct. 1968). TURNER, H. J., "The Interaction Between Fixed Light-ing and Vehicle Headlights." Austral. Road Res., Vol. 2, No. 3, p. 3 (Mar. 1965). WALBAUER, W. M., "Highway Lighting Without Glare." Ilium. Eng., Vol. 54, No. 1, pp. 53-66 (Jan. 1959).
WALDRAM, J. M., "Visual Problems on Motorways." Trans. JES (London), Vol. 26, No. 4, pp. 66-78 (1961).
WALDRAM, J. M., "The Revealing Power of Street Lighting Installations." Trans. JES (London), Vol. 33, No. 2, p. 173 (1938). WALDRAM, J. M., "The Design of the Visual Field in Streets: The Visual Engineer's Contribution." Trans. IES (London), Vol. 31, No. 1, pp. 7-26 (1966). WALSH, J. W. T., Photometry, 3rd Ed. Constable and Co. (London) (1958).
WALTON, N. E., and ROWAN, N. J., "High-Mast Light-ing." Res. Rep. 75-12, Texas Transportation Inst., College Station, Tex. (Feb. 1969). WOJCIK, H. L., "Highway Lighting—Design Di-lemma." Cons. Eng., Vol. 22, No. 3, pp. 100-105 (Mar. 1964).
YOUNG, J. W., "Europe's Streets and Highways." Ilium. Eng., Vol. 56, No. 4, pp. 253-261 (Apr. 1961).
BENEFITS
I. "Accidents, Crime Reduced by Lighting Downtown." Amer. City, Vol. 4, No. 10, pp. 35-36 (Oct. 1959).
2. "Adequate Lighting Can Save Lives." Amer. City, Vol. 81, No. 1, p. 126 (Jan. 1966).
ASMUSSEN, E., "Lighting of Roads Outside Built-Up Areas." Internat. Rd. Sat. Trafi. Rev., Vol. 12, No. 4, pp. 19-30,32 (1964). "Auto Accidents Quadruple At Night." Amer. City, Vol. 76, No. 9, p. 143 (Sept. 1961). BALDWIN, D. M., "Light and Night Traffic Accidents." Ilium. Eng., Vol. 48, No. lO, pp. 515-516 (Oct. 1953). BERRY, 0., "Effect of Lighting on Flow and Safety." Traffic Eng. and Control, Vol. 2, No. 1, pp. 67-69 (May 1960). BLOOMER, R. H., "Perceptual Defense, Vigilance, and Driving Safety." Traffic Quart., Vol. 16, No. 4, pp. 549-558 (1962). BLYTHE, J. D., "Highway Lighting and Accidents in Indiana." HRB Bull. 146 (1957) pp. 1-7. Box, P. C., "Effect of Highway Lighting on Night Capacity." Traffic Eng., Vol. 28, No. 4, pp. 9-15, 23 (Jan. 1958); HR Abst. (May 1958) p. 10. Box, P. C., "Modern Lighting, Fewer Accidents." Street Eng., Vol. 3, No. 9, pp. 13-15 (Sept. 1958). "Bridge Lighting Eases Traffic Flow." Street and Highway Lighting, Vol. 13, No. 1, p. 21 (1963); HR Absir., Vol. 33, No. 6 (June 1963) p. 6. BUFFEVENT, M. D., "Influence of Lighting on Safety on the Autoroute de L'Ouest." Roads and Road Constr., Vol. 35, No. 409, pp. 20-221 (Jan. 1957). CARMODY, D. J., "Lighted Crossings AreSafe. Rural and Urban Roads, Vol. 4, No. 9, pp. 90-9 1 (Sept. 1966).
CHRISTIE, A. W., "Street Lighting and Road Safety." Traffic Eng. and Control, Vol. 8, No. 4, pp. 229-233 (Aug. 1966). CHRISTIE, A. W., and MooRE, R. L., "Street Lighting from the Point of View of Traffic and Safety." Pub. Lighting, Vol. 23, No. 102, pp. 242-251 (1958). CEVELAND, D. E., "Driver Tension and Rural Inter-section Illumination." Traffic Eng., Vol. 32, No. 1, pp. 11-16 (Oct. 1961). CLEVELAND, D. E., and KEESE, C. J., "Intersections at Night." Traffic Quart., Vol. 15, No. 3, pp. 480-498 (July 1961).
COLLINS, P. A., "Police and Lighting and Its Impact on Crime Prevention." Pub. Lighting, Vol. 32, No. 139, pp. 285-292 (Dec. 1967). CORK, H. F., "Impact of Street Lighting on Road Accidents." Traffic Eng. and Control, Vol. 9, No. 6, pp. 297-299 (Oct. 1967). CROSS, W. L., JR., MJLLAR, P. S., and SIMPSON, R. E., "The Vital Importance of Fixed Lighting of Public Ways." Ilium. Eng., Vol. 41, No. 8, pp. 609-625 (Sept. 1946).
CROUCH, C. L., and BUTTOLPH, L. J., "For Safer Night Driving." Mag. of Standards, Vol. 35, No. 3, pp. 234-236 (Aug. 1964).
DARRELL, J. E. P., and DUNNETTE, M. D., "Driver Performance Related to Interchange Marking and Nighttime Visibility Conditions." HRB Bull. 255 (1960) pp. 128-137. DE BOER, J. B., "Lighting of Traffic Routes." Philips Tech. Rev., Vol. 23, No. 8/9, pp. 258-272, 1962.

113
DICKERSON, A. F., "Review of Life Saving With Traffic Safety Lighting." Amer. City, Vol. 67, No. 5,
p. 165 (May 1952). DICKERSON, A. F., "Street Lighting at Its Best and I-low to have It." A,nei. City, Vol. 67, No. 12, pp. 147-149 (Dec. 1952). "Down Go Accidents and Robberies." Amer. City, Vol. 80, No. 11, p. 116 (Nov. 1965). "Evaluation of Minor Improvements." California Div. of Highways. HR Abstr. (Apr. 1968) p. 3. FALLON, H. G., "National Importance of Lighting Our Traffic Routes." Austral. Eng., Vol. 47, No. 12, pp. 85-88, 121, 123, 125, 127-129 (Dec. 1954). See also Elec. Eng. and Merchandiser, Vol. 32, No. 1, pp. 3-8 (Apr. 15, 1955). FARBER, E., "Passing Behavior on Public Highways Under Daytime and Nighttime Conditions." Hwy. Res. Record No. 292 (1969) pp. 11-23. FORBES, T. W., "Some Factors Affecting Driver Ef-ficiency at Night." HRB Bull. 255 (1960) pp. 61-71. FORSTER, A., "You Don't Have to Be' in the Dark About Night Driving." Amer. Youth, Vol. 4, No. 2, pp. 6-7 (Mar.-Apr. 1963). FRANKLIN, J. S., "Good Streetlighting Equals Visi-bility Plus Comfort." Gen. Elec. Rev., Vol. 59, No. 2, pp. 44-48 (Mar. 1956). GONSETH, A. T., "Effectiveness of Holland Tunnel Transitional Lighting During the Winter Months." HRB Bull. 255 (1960) pp. 79-91. HARRIS, A. J., and CHRISTIE, A. W., "Research on Two Aspects of Street Lighting: Accident Statistics and Road Surface Characteristics." Pub. Lighting, Vol. 19, No. 83, pp. 553-569 (1954). HARRIS, A. J., and CHRISTIE, A. W., "Street Lighting and Accidents." Roads and Road Constr., Vol. 32, No. 382, p. 321 (Oct. 1954). HARTLEY, J. E., "Street Lighting as a Tool for Traffic Safety and Efficiency." Street Eng., Vol. 4, No. 5, pp. 30-32 (May 1959). HIRscH, P., "Lights, Signs, and Traffic Markings Help Reduce Expressway Accidents." Pub. Works, Vol. 86, No. 23 p. 68 (Feb. 1955). HIRSCH, P., The Night-Time Accident Problem. Pag-eant Press (New York), 110 pp. (1957); Road Abstr., Vol. 25, No. 3, p. 66 (Mar. 1958); HR Abstr. (Sept. 1958) p. 6. HOLICH, G., "Drastic Night Accident Reduction on Chicago's South State Street." Street Eng., Vol. 3, No. 1, p. 28 (Oct. 1958). HOSEA, H. R., "Fatal Accidents on Completed Sec-tions of the Interstate Highway System." Pub. Roads, Vol. 35, No. 10, pp. 217-224 (Oct. 1969). HOWARD, E., "Public Lighting and Road Safety." Surveyor, Vol. 111, No. 3159, p. 595 (Sept. 1952). HUBER, M. J., "Traffic Operation and Driver Perform-ance as Related to Various Conditions of Nighttime Visibility." HRB Bull. 336 (1962) pp. 37-50. IVES, H. S., "Does Highway Illumination Affect Acci-dent Occurrence," Traffic Quart., Vol. 16, No. 2, pp. 229-241 (April 1962).
JAINSKI, P., "Visibility on Streets with Different Types of Lighting." Strasse u. Autobahn, Vol. 13, No. 6, pp. 193-198 (1962) (in German). KAMINSKI, G., "Between Dusk and Dawn." Traffic Safety, Vol. 56, No. 1, pp. 22-25 (Jan. 1960). KARNS, E. B., "Good Street Lighting Will Reduce Nighttime Fatalities." Amer. City, Vol. 67, No. 6, p. 145 (June 1952). KEESE, C. J., CLEVELAND, D. E., and ROWAN, N. J., "Intersection and Sign Illumination For Highway Safety and Efficiency." Res. Rep. No. 5-9 (Final), Texas Transportation Inst., College Station, Tex. (Aug. 1966); HR Abstr. (Apr. 1967) p. 2. "Light for Night Danger." I. Amer. Insur., Vol. 44, No. 2, pp. 8-20 (Mar.-Apr. 1968). "Light up Your Streets for Safety." Traffic Safety, Vol. 54, No. 7, pp. 22-24 (July 1958). "Light up Your Traffic Hazards." Traffic Safety, Vol. 54, No. 7, p. 25 (July 1958). LURKIS, A., "Good Lighting Is Better Than Police-men." Amer. City, Vol. 77, No. 11, pp. 129, 135-1 36 (Nov. 1962). MARSH, B. W., "Report of Committee on Light as Affecting Highway Travel At Night." Proc. HRB, Vol. 19 (1939) pp. 271:274. "More Lights, Fewer Fatalities." Street Eng., Vol. 6, No. 3, p. 26 (Mar. 1961). MORRISON, J. H., "Lighting of Motorways 'A Neces-sity.'" Surveyor, Vol. 121, No. 3668, pp. 1167-1168 (Sept. 22, 1962). MORRAY, J H., "Atlanta Lighting Cuts Crime 50%, Averts 1700 Traffic Accidents." Amer. City, Vol. 67, No. 9, pp. 157-161 (Sept. 1952). OPPENLANDER, J. C., and WRIGHT, J. M., "Evaluation of Intersection Illumination." Purdue Univ., p. 32 (Feb. 1965). OWENS, W. H., "Highway Lighting and Traffic Safety." Rd. Internat., Vol. 48, pp. 43-46 (Apr. 1963). PERCHONOK, K., and HURST, P. M., "Driver Appre-hension." NCHRP Rep. 60 (1968) Part IV, pp. 93-105. "Planned Light Prevents Crime and Reduces Acci-dents." Amer. City, Vol. 78, No. 3, pp. 125-126 (Mar. 1963). PUTNAM, R. C., and BOWER, K. D., "Discomfort Glare at Low Adaptation Levels. Part III. Multiple Sources." Ilium. Eng., Vol. 53, No. 4, pp. 174-184 (Apr. 1958). REX, C. H., "Improving Seeing Efficiency with Road-way Lighting." Traffic Eng., Vol. 27, No. 11, pp. 467-483, 492 (Aug. 1956). RICHARDS, 0. W., "Vision at Levels of Night Road Illumination. III. Literature 1956-1957." HRB Bull. 191 (1958) pp. 57-61. RICHARDS, 0. W., "Vision at Levels of Night Road Illumination. VII. Literature 1961." HRB Bull. 336
(1962) pp. 12-21.
114
64. RICHARDS, 0. W., "Vision at Levels of Night Road 83. TARAGIN, A., and RUDY, B. M., "Traffic Operations Illumination. X. Literature 1964." Hwy. Res. Rec- as Related to Highay Illumination and Delineation." ord No. 90 (1965) pp. 67-73. HRB Bull. 255 (1960) pp. 1-29.
65. ROUTH, W., "Lighted Bypass Promotes Safety in Small 84. TECHNICAL COMMITTEE 4D OF ILLUMINATING EN- City." Street Eng., Vol. 3, No. 10, pp. 14-15 (Oct. GINEERING SOCIETY, "Effect of Adequate Street Light- 1958). ing in Reducing Night Traffic Accidents." Traffic
66. SAWYER, E. B., "Some Social and Economical As- Eng., Vol. 28, No. 8, pp. 42-44 (May 1958).
pects of Street Lighting." Pub. Lighting, Vol. 26, 85. TURNER, H. J., "The Influence of Road Lighting on No. 115, pp. 280-288 (1961). Traffic Safety and Service." Proc. First Conf. of
67. SCHMIDT, W., "Lighting of High-Speed Roads and Australian Road Research Board, pp. 596-613 (1962).
Motorways." Lichttechnik, Vol. 15, No. 1, pp. 15-23 86. TURNER, H. J., "The Interaction Between Fixed Light-
(1963). ing and Vehicle Headlights." J. Austral. Road Res.
68. SCHRENK, L. J., "Effect of Light Changes on Traffic Board, Vol. 2, No. 3, pp. 3-22 (1965); HR Abstr., Accidents Shown in Detroit Lighting Report." Ilium.
Vol. 35, No. 9, p. 7 (Sept. 1965). Eng., Vol. 42, No. 9, pp. 890-892 (Nov. 1947). 87. VEY, A. H., "The Relation of Highway Lighting to
69. SCHRENK, L. J., "Protecting Pedestrians with Highway ' Highway Accidents." Proc. HRB, Vol. 14 (1934)
70. Lighting." Proc. Inst. Traffic Eng. (1938) pp. 43-50.
pp. 429-441. WALDRAM, J. M.,/"Visual Problems' on Motorways." SCHWAB, "Night R. N., Visibility for Opposing Drivers Trans. IES (London), Vol. 26, No. 4, 66-78 ,,pp.
with High and Low Headlight Beams." Ilium. Eng., (1961). / Vol. 60, No. 5, pp. 364-372 (May 1965). WALTON, N. E., and ROWAN N I i" valuation of 71. SEBURN, T. J., "Street Lighting—Traffic Accidents— High-Mast Interchange Area Lighting' Two South
Crime." Ilium. Eng., Vol. 46, No. 9, pp. 482-483 Dakota Locations." Res. Rep. 593-1 ITexas Trans- (Sept. 1951). portation Inst., College Station, Tex. (11969).
72. SHERRY, I. A., "Improved Street Lighting Halves WARD, T. H., "Ten Years of Safet S(1reet Lighting." Traffic Accidents." Elec. Light and Power, Vol. 37, Street Eng., Vol. 4, No. 9, pp/27-2 (dept. 1959). No. 15, p. 100 (Aug. 1, 1959). WEST, B., and PARKS, E. E. "Moe dars and Light-
73. SIELSKI, M. C., "Relationship of Roadway Lighting Fewer Deaths." Amer. CitY,V0i>74' No. 7, pp. 104- and Traffic Accidents." HRB Spec. Rep. 93 (1967) 105 (July 1960). pp. 172-177. 92. WILCOCK, A., "Cities at Night." Pub. Lighting, Vol.
74. SIMMONS, A. E., "An Instrument for the Assessment 33, No. 140, pp. 26-30 (Mar. 1968). of Visibility Under Highway Lighting Conditions." 93. WITHEFORD, D. K., "The Economic Analysis of Free- HRB Bull. 336 (1965) pp. 76-94. way Lighting." Traffic Quart., Vol. 21, No. 2, pp.
75. SIMPSON, R. E., "Double Street Lighting and Avert 289-303 (Apr. 1967). Traffic Casualties." Trans. IES, Vol. 28, No. 8, pp. 94. WYATT, F. D., and LozANo, E., "Effect of Street Light- 651-657 (Sept. 1933) and No. 9, pp. 775-781 (Nov. ing on Night Traffic Accident Rate." Ilium. Eng., 1933). Vol. 50, No. 12, pp. 619-623 (Dec. 1955).
76. SIMPsON, R. E., "Public Safety as Affected by Street 95. Yu, J. C., "Driver Performance Related to Median Lighting." Trans. IES, Vol. 30, No. 1, pp. 3 1-48 Visibility." Accident Anal. and Prevention, Vol. 1, (Jan. 1935). No. 2, pp. 143-151 (Oct. 1969).
77. "Sodium Vapor Reduces Accidents at Traffic Circle." Amer. City, Vol. 64, No. 5, p. 163 (May 1949). COST-EFFECTIVENESS AND OTHER
78. STARKS, H. J. H., GARWOOD, F., JEFFCOTE, G. D., and EVALUATION TECHNIQUES
SMEED, R. J., "Research into Highway Traffic Acci- 1. ADKINS, W. 0., WARD, A. W., and MCFARLAND, dents." Traffic Eng. and Control, Vol. 3, No. 8, PP W. F., "Values of Time Savings of Commercial Ve- 493-498 (Dec. 1961). hides." NCHRP Rep. 33 (1967) 74 pp.
79. STEEL, R. W., "Lighting in Rural Areas." Pub. Light- 2. ASHTON, H., "The Time Element in Transportation." ing, Vol. 25, No. 108, pp. 4547 (1960). Amer. Econ. Rev., Vol. 37, No. 2, pp. 430-440 (Mar.7
80. "Street Lighting at Its Best." Amer. City, Vol. 67, May 1947). No. 12, pp. 147-149 (Dec. 1952); HR Abstr., Vol. 23, 3. BECKER, G. S., "A Theory of the Allocation of Time." No. 1 (Jan. 1953) p. 26. Econ. J., Vol. 75, No. 299, pp. 493-517 (Sept. 1965).
81. TANNER, I. C., and HARRIS, A. J., "Comparison of 4. BEESLEY, M. E., "The Value of Time Spent in Travel- Accidents in Daylight and Darkness." Internat. Road ing: Some New Evidence." Economica (New Series), Safety and Traffic Rev., Vol. 4, pp. 11-14, 39 (1956). Vol. 32, No. 126, pp. 174-185 (May 1965).
82. TARAGIN, A., and RUDY, B. M., "Traffic Operations as 5. BILLINGSLEY, C. M., and JORGENSON, D. P., "Direct Related to Highway Illumination and Delineation." Costs and Frequencies of 1958 Illinois Motor-Vehicle Pub. Roads, Vol. 31, No. 3, pp. 59-66, 71 (Aug. Accidents." Hwy. Res. Record No. 12 (1963) pp. 1960). 48-76.

16.
115
BOEREBOOM, A., "Lighting of Public Thoroughfares in ENKE, S., "Using Costs to Select Weapons." Amer.
European Countries." Proc. Inst. of Traffic Engineers Econ. Rev., Vol. 55, No. 2, pp. 416-426 (May 1965).
(1965) pp. 235-257. ENKE, S. (Ed.), Defense Management. Prentice-Hall
CASSEL, A., and MEDVILLE, D., "Economic Study of (1967). Roadway Lighting." NCIJRP Rep. 20 (1966) 77 pp. FALK, N., "New Solution for Effectively Lighting
CHASE, S. B., JR. (Ed.), Probleins in Public Expendi- Underpasses." Ilium. Eng., Vol. 59, No. 2, pp. 127-
lure Analysis. Brookings Inst., D.C. (1969). 131 (Feb. 1964).
CHRISTENSEN, M., "A Method of Determining Mini- FISHER, G. H., "The Analytical Bases of Systems
mum Cost of Relamping." Ilium. Eng., Vol. 59, No. Analysis." P-3363, The RAND Corporation (May
ll,.pp. 741-746 (Nov. 1964). 1966).
CHRISTIE, A. W., "An Experimental Low-Cost Light- FLEISCHER, G. A., "A Technique for Determination
ing System for Rural Highways. Light and Lighting, of Project Priority when Considering Irreducibles."
Vol. 55, No. 9, pp. 270-273 (Sept. 1962). Eng. Econ., Vol. 2, No. 2, pp. 13-18 (Winter 1966).
CHRISTIE, A. W., "Street Lighting and Road Safety." FLEISCHER, G. A(, "Cost Effectiveness and Highway
Traffic Eng. and Control, Vol. 8, No. 4, pp. 229-23 3 Safety." Rep. No. ICO, U.S.C.I.S.E., Univ. of South-
(Aug. 1966). ern California, Los Angeles (Feb. 1969).
CLAFFEY, P. J., "Characteristics of Passenger Car Fox, P. D., "A Theory of Cost Effectiveness for Mili-
Travel on Toll Roads and Comparable Free Roads. tary Systems Analysis." Oper. Res., Vol. 13, No. 2,
HRB Bull. 306 (1961) pp. 1-22. pp. 191-200 (Mar.-Apr. 1965).
CLAFFEY, P. J., "Running Cost of Motor Vehicles as GOLDMAN, T. A. (Ed.), Cost-Effectiveness Analysis:
Affected by Highway Design." NCHRP Rep. 13 New Approaches in Decision-Making. Frederick A.
(1965) 43 pp. Praeger (1967).
CLARK, F., "Economical Street Light Maintenance." GRANT, E. L., and IREs0N, W. G., Principles of Engi-
Ilium. Eng., Vol. 59, No. 11, pp. 741-746 (Nov. neering Economy, 4th Ed. Ronald Press (1960).
1964). GRIFFITH, J. W., "Applications of Engineering Eco-
CLEVELAND, D. E., "Illumination." Ch. 3 of Traffic nomics to Integrated Lighting." Ilium. Eng., Vol. 57,
Control and Roadway Elements-Their Relationship No. 12, pp. 785-790 (Dec. 1962).
to Highway Safety. Revised. Automotive Safety Foun- GROSSE, R. N., "An Introduction to Cost-Effectiveness dation (1969). Analysis." RAC-P-5, Research Analysis Corp. (July
CURRY, D. A., "Use of Marginal Cost of Time in 1965).
Highway Economy Studies." Hwy. Res. Record No. GROSSE, R. N., Principles of Cost Effectiveness Analy- 77 (1963) pp. 48-121. sis. Industrial College of the Armed Forces, Washing- "Direct Costs of California State Highway Accidents." ton, D.C. (1965). Traffic Dept., California Div. of Highways (1967). HANEY, D. G., and THOMAS, T., "The Value of Time." DON VITO, P. A., "Annotated Bibliography on Sys- Stanford Res. Inst. I., No. 22, pp. 12-16 (Oct. 1968). tems Cost Analysis." RM-4848-1-PR, The RAND HANING, C. R., and MCFARLAND, W. F., "Value of Corporation (Mar. 1967). Time Saved to Commercial Vehicles Through Use of DRAKE, G. L., and KRAFT, M. A., "Motor Vehicle Improved Highways." Bull. No. 23, Texas Transpor- Accident Costs in the Washington Metropolitan Area." tation Inst., College Station, Tex. (1963). Hwy. Res. Record No. 188 (1967) pp. 127-139. HEUSTON, M. C., and OGAWA, G., "Observations on DUDEK, C. L., "Cost-Effectiveness Methodology in the theoretical Basis of Cost Effectiveness." Oper.
Highway Research." Texas Transp. Res., Vol. 6, Res., Vol. 14, No. 2, pp. 242-266 (Mar.-Apr. 1966). No. 1, pp. 11-13 (Jan. 1970). HEYMONT, I., BRYK, 0., LINSTONE, H., and SURMEIER, ECKSTEIN, 0., Water Resource Development: The J., "Guide for Reviewers of Studies Containing Cost- Economics of Project Evaluation. Harvard Univ. Effectiveness Analysis." Study 63.2, Research Analy- Press (1958). sis Corp. (Oct. 1965) 67 pp.
"Economic Comparison, Highway Lighting: 0.60 HIRSCHLEIFER, J., "Minimum Attractive Rate of Re- Footcandles vs 1.0 Footcandles." Publ. OLP-1199, turn for Public Investments." P-3912, The RAND General Electric Co. (1965). Corporation (Aug. 1968).
"Economic Comparison of Methods of Roadway HITCH, C. J., "An Appreciation of Systems Analysis." Lighting." PubI. MV-455A, Sylvania Electric Prod- P-699, 25 pp. The RAND Corporation (Aug. 1955); ucts (1964). also, J. Oper. Res. Soc. Amer., Vol. 3, No. 4, pp. 466-
EDMAN, W. H., "Roadway Lighting." Proc. Inst. of 481 (Nov. 1955). Traffic Eng. (1965) pp. 258-274. HITCH, C. J., and MCKEAN, R. N., The Economics of
EDWARDS, T. C., MARTINEZ, J. E., MCFARLAND, W. F., Defense in the Nuclear Age. Harvard Univ. Press and Ross, H. E., JR., "Development of Design Criteria (1960). for Safer Luminaire Supports." NCHRP Rep. 77 HOAG, M. W., "An Introduction to Systems Analysis." (1969) 82 pp. RM-1678-PR, The RAND Corporation (Apr. 1956).
116
HUFSCHMIDT, H., KRUTILLA, J., and MARGOLIS, J., "Standards and Criteria for Formulating and Evaluat-ing Federal Water Resources Developments." Report to the Bureau of the Budget. U.S. Gov't. Printing Office (June 1961). IvEs, H. S., "Highway Illumination Warrants-Design-Maintenance Costs." Amer. Highways, Vol. 40, No. 3, pp. 21-25 (July 1961). JOHANNESSON, S., Highway Economics. McGraw-Hill (1931). JOHNsON, C. W., "Maintenance of Highway Lighting Systems." Connecticut State Highway Dept. (1964). JoHNsoN, W. H., and ENOS, H. A., "Does Mercury Street Lighting Cost More Than Incandescent?" Elect. World, Vol. 133, No. 15, pp. 94-95 (Apr. 10, 1950). JORGENSON, Roy, AND ASSOCIATES AND WESTAT RE-SEARCH ANALYSTS, "Evaluation of Criteria for Safety Improvements on the Highways." Gaithersburg, Md. (1966). KAZANOWSKI, A. D., "Cost-Effectiveness Methodology and Limitations." Space and Information Systems Div., North American Aviation, Inc. (Oct. 1964). KNORR, K., "On the Cost-Effectiveness Approach to Military R and D: A Critique." P-3390, The RAND Corporation (1966). LARGE, J. P. (Ed.), "Concepts and Procedures of Cost Analysis." RM-3589-PR, The RAND Corporation (June 1963). LAWTON, L., "Evaluating Highway Improvements on Mileage and Time Cost. Traffic Quart., Vol. 4, No. 1, pp. 102-125 (Jan. 1950). LEININGER, W. J., ET AL., Development of a Cost-Effectiveness System for Evaluating Accident Counter-measures (6 vols.) Operations Research, Inc., Silver Spring, Md. (Dec. 1968). Lighting Handbook, 3rd Ed. Illuminating Engineer-ing Soc. (1962). LISCO, T. E., "Value of Commuters' Travel Time - A Study in Urban Transportation." Hwy. Res. Rec-ord No. 245 (1968) p. 36. LITTLE, A. D., INC., "Cost-Effectiveness in Traffic Safety." Frederick A. Praeger, publ. (1968). MCCULLOUGH, J. D., "Cost Analysis for Planning-Programming-Budgeting Cost-Benefit Studies." P-3479, The RAND Corporation (Nov. 1966). MCDONALD, G. P., "A Study of Street Lighting Sys-tems." Arizona Public Service Co. (1962). MCDONALD, G. P., "Mercury Vapor vs Incandescent Street Lighting." Arizona Public Service Co. (1963). MCFARLAND, W. F., and WALTON, N. E., "Cost-Effectiveness Analysis of Roadway Lighting Systems." Res. Rep. 13 7-1, Texas Transportation Inst., College Station, Tex. (1969). MCKEAN, R. N., Efficiency in Government Through Systems Analysis. Wiley (1958). "Mercury Vapor Street Lighting Compared to In-candescent Street Lighting." Indianapolis Power and Light Co. (1964),
MOHRING, H., and HARWITZ, M., Highway Benefits: An Analytic'al Fra,nework. Northwestern Univ. Press (1962). PREST, A. R., and TIJRVEY, R., "Cost-Benefit Analy-sis: A Survey." In Surveys of Economic Theory, Vol. III, pp. 155-207, Macmillan (London) (1966). "Public Lighting Needs." Special report for the U.S. Senate, Institute of Traffic Engineers and the Illumi-nating Engineering Society Joint Committee of Public Lighting Needs, (Feb. 1966). QUADE, E. S. (Ed.), Analysis for Military Decisions. Rand McNally (1964). RECHT, J. L., "How to Do a Cost-Benefit Analysis of Motor Vehicle Accident Countermeasures." National Safety Council (Sept. 1966). Road User Benefit Analyses for Highway Improve-ments. American Assn. of State Highway Officials, Washington, D.C. (1960). ST. CLAIR, G. P., and LIEDER, N., "Evaluation of the Unit Cost of Time and the Strain and Discomfort Cost of Non-Uniform Driving." HRB Spec. Rep. 56, (1960) pp. 116-126. Sr. CLAIR, G. P., TODD, T. R., and BOSTICK, T. A., "The Measurement of Vehicular Benefits." Hwy. Res. Record No. 138 (1966) pp. 1-17. SCHMIDT, E. L., "Economics of Alignment, Grade and Width." Proc. ASCE, Vol. 63, pp. 1786-1797 (Nov. 1937). SIELSKI, M. C., "Relationships of Roadway Lighting and Traffic Accidents." HRB Spec. Rep. 93 (1967) pp. 172-177. SOBIN, B., "Cost-Effectiveness Analysis." Weapons System Evaluation Group, Inst. for Defense Analyses (Nov. 1962). STOVER, V., GOODKNIGHT, J., and ADKINS, W., "Guide-lines for Medial and Marginal Access Control on Major Roadways." Texas Transportation Inst., Col-lege Station, Tex. (1969). SUMMERS, T., JR., "Estimating the Cost of a Roadway Lighting System." Ilium. Eng., Vol. 53, No. 5, pp. 269-277 (May 1958). TANNER, J. C., and CHRISTIE, A. W., "Reduction of Accidents by Improved Street Lighting." Light and Lighting, Vol. 51, No. 11, pp. 353-355 (Nov. 1958). TENZER, A. J., "Cost Sensitivity Analysis." P-3097, The RAND Corporation (Mar. 1965). THOMPSON, J. A., and FANSLER, B. I., "Economic Study of Various Mounting Heights 'for Highway Lighting." Hwy, Res. Record No. 179 (1967) pp. 1-15. TUCKER, H., and LEAGER, M. C., Highway Economics. International Textbook Co. (1942). U.S. Cong., Joint Economic Committee, Subcommittee on Economy in Government, "Interest Rate Guide-lines for Federal Decision-Making." U.S. Gov't. Print. Office (1968). U.S. Cong., Joint Economic Committee, Subcommittee on Evaluation Standards, "Proposed Practices for Eco-
117
nomic Analysis of River Basin Projects." Report to Inter-Agency Committee on Water Resources, Rev. Ed., U.S. Gov't. Print. Office (May 1958). WEISBROD, B. A., Economics of Public Health. Univ. of Pennsylvania Press (1961). WEST, M. H., "Economic Value of Time Savings in Traffic." Proc. Inst. of Traffic Engineers, Vol. 17, pp. 144-148 (1946).
WILKINSON, K. M., "Virginia Study Shows Accident Drop After Lighting Nine Highway Locations." Street and Hwy. Lighting, Vol. 13, No. 2, p. 25 (1963). WINFREY, R., Economic Analysis for Highways. Inter-national Textbook Co. (1969). WITHEFORD, D. K., "The Economic Analysis of Free-way Lighting." Traffic Quart., Vol. 21, No. 2, pp. 289-303 (Apr. 1967).
Published reports of the Rep.
NATIONAL COOPERATIVE HIGHWAY RESEARCH PROGRAM No. Title
20 Economic Study of Roadway Lighting (Proj. 5-4), are available from: 77 p., $3.20
Highway Research Board 21 Detecting Variations in Load-Carrying Capacity of
National Academy of Sciences Flexible Pavements (Proj. 1-5), 30 p., $1.40
2101 Constitution Avenue 22 Factors Influencing Flexible Pavement Performance
Washingtnn, DC 20418 (Proj. 1-3(2)), 69 p., $2.60 23 Methods for Reducing Corrosion of Reinforcing
Steel (Proj. 6-4), 22 p., $1.40 Rep. 24 Urban Travel Patterns for Airports, Shopping Cen- No. Title ters, and Industrial Plants (Proj. 7-1), 116 p., -* A Critical Review of Literature Treating Methods of $5.20
Identifying Aggregates Subject to Destructive Volume 25 Potential Uses of Sonic and Ultrasonic Devices in Change When Frozen in Concrete and a Proposed Highway Construction (Proj. 10-7), 48 p., $2.00 Program of Research—Intermediate Report (Proj. 26 Development of Uniform Procedures for Establishing 4-3(2)), 81 p., $1.80 Construction Equipment Rental Rates (Proj. 13-1),
1 Evaluation of Methods of Replacement of Deterio- 33 p., $1.60 rated Concrete in Structures (Proj. 6-8), 56 p., 27 Physical Factors Influencing Resistance of Concrete $2.80 to Deicing Agents (Proj. 6-5), 41 p., $2.00
2 An Introduction to Guidelines for Satellite Studies of 28 Surveillance Methods and Ways and Means of Com- Pavement Performance (Proj. 1-1), 19 p., $1.80 municating with Drivers (Proj. 3-2), 66 p., $2.60
2A Guidelines for Satellite Studies of Pavement Per- 29 Digital-Computer-Controlled Traffic Signal System formance, 85 p.+9 figs., 26 tables, 4 app., $3.00 for a Small City (Proj. 372), 82 p., $4.00
3 Improved Criteria for Traffic Signals at Individual 30 Extension of AASHO Road Test Performance Con- Intersections—Interim Report (Proj. 3-5), 36 p., cepts (Proj. 1-4(2)), 33 p., $1.60 $1.60 31 A Review of Transportation Aspects of Land-Use
4 Non-Chemical Methods of Snow and Ice Control on Control (Proj. 8-5), 41 p., $2.00 Highway Structures (Proj. 6-2), 74 p., $3.20 32 Improved Criteria for Traffic Signals at Individual
5 Effects of Different Methods of Stockpiling Aggre- Intersections (Proj. 3-5), 134 p., $5.00 gates—Interim Report (Proj. 10-3), 48 p., $2.00 33 Values of Time Savings of Commercial Vehicles
6 Means of Locating and Communicating with Dis- (Proj. 2-4), 74 p., $3.60 abled Vehicles—Interim Report (Proj. 3-4), 56 p. 34 Evaluation of Construction Control Procedures— $3.20 Interim Report (Proj. 10-2), 117 p., $5.00
7 Comparison of Different Methods of Measuring 35 Prediction of Flexible Pavement Deflections from Pavement Condition—Interim Report (Proj. 1-2), Laboratory Repeated-Load Tests (Proj. 1-3(3)), 29p., $1.80 117p., $5.00
8 Synthetic Aggregates for Highway Construction 36 Highway Guardrails—A Review of Current Practice (Proj. 4-4), 13 p., $1.00 (Proj. 15-1) 2 33 p., $1.60
9 Traffic Surveillance and Means of Communicating 37 Tentative Skid-Resistance Requirements for Main with Drivers—Interim Report (Proj. 3-2), 28 p., Rural Highways (Proj. 1-7), 80 p., $3.60 $1.60 38 Evaluation of Pavement Joint and Crack Sealing Ma-
10 Thcoretical Analysis of Structural Behavior of Road terials and Practices (Proj. 9-3), 40 p., $2.00 Test Flexible Pavements (Proj. 1-4), 31 p., $2.80 39 Factors Involved in the Design of Asphaltic Pave-
11 Effect of Control Devices on Traffic Operations— ment Surfaces (Proj. 1-8), 112 p., $5.00 Interim Report (Proj. 3-6), 107 p., $5.80 40 Means of Locating Disabled or Stopped Vehicles
12 Identification of Aggregates Causing Poor Concrete (Proj. 3-4(1)), 40 p., $200 Performance When Frozen—Interim Report (Proj. 41 Effect of Control Devices on Traffic Operations 4.3(1)), 47p., $3.00 (Proj. 3-6), 83p., $3.60
13 Running Cost of Motor Vehicles as Affected by High- 42 Interstate Highway Maintenance Requirements and way Design—Interim Report (Proj. 2-5), 43 p., Unit Maintenance Expenditure Index (Proj. 14-1), $2.80 144 p., $5.60
14 Density and Moisture Content Measurements by 43 Density and Moisture Content Measurements by Nuclear Methods—Interim Report (Proj. 105), Nuclear Methods (Proj. 10-5), 38 p., $2.00
15 32 p., $3.00 Identification of Concrete Aggregates Exhibiting
44 Traffic Attraction of Rural Outdoor Recreational
Frost Susceptibility—Interim Report (Proj. 4-3(2)), 45 Areas (Proj. 7-2), 28 p., $1.40 Development of Improved Pavement Marking Ma-
16 66 p., $4.00 Protective Coatings to Prevent Deterioration of Con- terials—Laboratory Phase (Proj. 5-5), 24 p., crete by Deicing Chemicals (Proj. 6-3), 21 p.,
$1.40
$1.60 46 Effects of Different Methods of Stockpiling and 17 Development of Guidelines for Practical and Realis- Handling Aggregates (Proj. 10-3), 102 p.,
tic Construction Specifications (Proj. 10-1), 109 p., $4.60 $6.00 47 Accident Rates as Related to Design Elements of
18 Community Consequences of Highway Improvement Rural Highways (Proj. 2-3), 173 p., $6.40 (Proj. 2-2) 2 37 p., $2.80 48 Factors and Trends in Trip Lengths (Proj. 7-4),
19 Economical and Effective Deicing Agents for Use on 70 p., $3.20 Highway Structures (Proj. 6-1), 19 p., $1.20 49 National Survey of Transportation Attitudes and
Behavior—Phase I Summary Report (Proj. 20-4), * Highway Research Board Special Report 80. 71 p., $3.20
Rep. Rep. No. Title No. Title 50 Factors Influencing Safety at Highway-Rail Grade 76 Detecting Seasonal Changes in Load-Carrying Ca-
Crossings (Proj. 3-8), 113 p., $5.20 pabilities of Flexible Pavements (Proj. 1-5(2)), 51 Sensing and Communication Between Vehicles (Proj. 37 p., $2.00
3-3), 105 p., $5.00 77 Development of Design Criteria for Safer Luminaire 52 Measurement of Pavement Thickness by Rapid and Supports (Proj. 15-6), 82 p., $3.80
Nondestructive Methods (Proj. 10-6), 82 p., 78 Highway Noise—Measurement, Simulation, and $3.80 Mixed Reactions (Proj. 3-7), 78 p., $3.20
53 Multiple Use of Lands Within Highway Rights-of- 79 Development of Improved Methods for Reduction of Way (Proj. 7-6), 68 p., $3.20 Traffic Accidents (Proj. 17-1), 163 p., $6.40
54 Location, Selection, and Maintenance of Highway 80 Oversize-Overweight Permit Operation on State High- Guardrails and Median Barriers (Proj. 15-1(2)), ways (Proj. 2-10), 120 p., $5.20 63 p., $2.60 81 Moving Behavior and Residential Choice—A Na-
55 Research Needs in Highway Transportation (Proj. tional Survey (Proj. 8-6), 129 p., $5.60 20-2), 66 p., $2.80 82 National Survey of Transportation Attitudes and
56 Scenic Easements—Legal, Administrative, and Valua- Behavior—Phase II Analysis Report (Proj. 20-4), tion Problems and Procedures (Proj. 11-3), 174 p., 89 p., $4.00 $6.40 83 Distribution of Wheel Loads on Highway Bridges
57 Factors Influencing Modal Trip Assignment (Proj. (Proj. 12-2), 56 p., $2.80 8-2), 78 p., $3.20 84 Analysis and Projection of Research on Traffic
58 Comparative Analysis of Traffic Assignment Tech- Surveillance, Communication, and Control (Proj. niques with Actual Highway Use (Proj. 7-5), 85 p., 3-9), 48 p., $2.40 $3.60 85 Development of Formed-in-Place Wet Reflective
59 Standard Measurements for Satellite Road Test Pro- Markers (Proj. 5-5), 28 p., $1.80 gram (Proj. 1-6), 78 p., $3.20 86 Tentative Service Requirements for Bridge Rail Sys-
60 Effects of Illumination on Operating Characteristics tems (Proj. 12-8), 62 p., $3.20 of Freeways (Proj. 5-2) 148 p., $6.00 87 Rules of Discovery and Disclosure in Highway Con-
61 Evaluation of Studded Tires—Performance Data and demnation Proceedings (Proj. 11-1(5)), 28 p., Pavement Wear Measurement (Proj. 1-9), 66 p., $2.00 $3.00 88 Recognition of Benefits to Remainder Property in
62 Urban Travel Patterns for Hospitals, Universities, Highway Valuation Cases (Proj. 11-1(2)), 24 p., Office Buildings, and Capitols (Proj. 7-1), 144 p., $2.00 $5.60 89 Factors, Trends, and Guidelines Related to Trip
63 Economics of Design Standards for Low-Volume Length (Proj. 7-4), 59 p., $3.20 Rural Roads (Proj. 2-6), 93 p., $4.00 90 Protection of Steel in Prestressed Concrete Bridges
64 Motorists' Needs and Services on Interstate Highways (Proj. 12-5), 86 p., $4.00 (Proj. 7-7), 88 p., $3.60 91 Effects of Deicing Salts on Water Quality and Biota
65 One-Cycle Slow-Freeze Test for Evaluating Aggre- —Literature Review and Recommended Research gate Performance in Frozen Concrete (Proj. 4-3(1)), (Proj. 16-1), 70 p., $3.20
21 p., $1.40 92 Valuation and Condemnation of Special Purpose 66 Identification of Frost-Susceptible Particles in Con- Properties (Proj. 11-1(6)), 47 p., $2.60
crete Aggregates (Proj. 4-3(2)), 62 p., $2.80 93 Guidelines for Medial and Marginal Access Control 67 Relation of Asphalt Rheological Properties to Pave- on Major Roadways (Proj. 3-13), 147 p.,
ment Durability (Proj. 9-1), 45 p., $2.20 $6.20 68 Application of Vehicle Operating Characteristics to 94 Valuation and Condemnation Problems Involving
Geometric Design and Traffic Operations (Proj. 3 Trade Fixtures (Proj. 11-1(9)), 22 p., $1.80 10), 38 p., $2.00 95 Highway Fog (Proj. 5-6), 48 p., $2.40
69 Evaluation of Construction Control Procedures— 96 Strategies for the Evaluation of Alternative Trans- Aggregate Gradation Variations and Effects (Proj. portation Plans (Proj. 8-4), 111 p., $5.40 10-2A), 58 p., $2.80 . 97 Analysis of Structural Behavior of AASHO Road
70 Social and Economic Factors Affecting Intercity Test Rigid Pavements (Proj. 1-4(1)A), 35 p., Travel (Proj. 8-1), 68 p., $3.00 $2.60
71 Analytical Study of Weighing Methods for Highway 98 Tests for Evaluating Degradation of Base Course Vehicles in Motion (Proj. 7-3), 63 p., $2.80 Aggregates (Proj. 4-2), 98 p. $5.00
72 Theory and Practice in Inverse Condemnation for 99 Visual Requirements in Night Driving (Proj. 5-3), Five Representative States (Proj. 11-2), 44 p., 38 p., $2.60 $2.20 100 Research Needs Relating to Performance of Aggre-
73 Improved Criteria for Traffic Signal Systems on gates in Highway Construction (Proj. 4-8), 68 p., Urban Arterials (Proj. 3-5/1), 55 p., $2.80 $3.40 74 Protective Coatings for Highway Structural Steel 101 Effect of Stress on Freeze-Thaw Durability of Con-
(Proj. 4-6), 64 p., $2.80 crete Bridge Decks (Proj. 6-9), 70 p., $3.60 74A Protective Coatings for Highway Structural Steel— 102 Effect of Weldments on the Fatigue Strength of Steel
Literature Survey (Proj. 4-6), 275 p., $8.00 Beams (Proj. 12-7), 114.p., $5.40 74B Protective Coatings for Highway Structural Steel— 103 Rapid Test Methods for Field Control of Highway
Current Highway Practices (Proj. 4-6), 102 p., Construction (Proj. 10-4), 89 p., $5.00 $4.00 104 Rules of Compensability and Valuation Evidence
75 Effect of Highway Landscape Development on for Highway Land Acquisition (Proj. Il-I), Nearby Property (Proj. 2-9), 82 p., $3.60 77 p., $4.40

Rep. No. Title
105 Dynamic Pavement Loads of Heavy Highway Vehi- cles (Proj. 15-5), 94 p., $5.00
106 Revibration of Retarded Concrete for Continuous Bridge Decks (Proj. 18-1), 67 p., $3.40
107 New Approaches to Compensation for Residential Takings (Proj. 11-1(10)), 27 p., $2.40
108 Tentative Design Procedure for Riprap-Lined Chan- nels (Proj. 15-2), 75 p., $4.00
109 Elastomeric Bearing Research (Proj. 12-9), 53 p., $3.00
110 Optimizing Street Operations Through Traffic Regu- lations and Control (Proj. 3-11), 100 p., $4.40
111 Running Costs of Motor Vehicles as Affected by Road Design and Traffic (Proj. 2-5A and 2-7), 97 p., $5.20
112 Junkyard Valuation—Salvage Industry Appraisal Principles Applicable to Highway Beautification (Proj. 11-3(2)), 41 p., $2.60
113 Optimizing Flow on Existing Street Networks (Proj. 3-14), 414 p., $15.60
114 Effects of Proposed Highway Improvements on Prop- erty Values (Proj. 11-1(1)), 42 p., $2.60
115 Guardrail Performance and Design (Proj. 15-1(2)), 70 p., $3.60
116 Structural Analysis and Design of Pipe Culverts (Proj. 15-3), 155 p., $6.40
117 Highway Noise—A Design Guide for Highway En- gineers (Proj. 3-7), 79 p., $4.60
118 Location, Selection, and Maintenance of Highway Traffic Barriers (Proj. 15-1(2)), 96 p., $5.20
119 Control of Highway Advertising Signs—Some Legal Problems (Proj. 11-3(1)), 72.p., $3.60
120 Data Requirements for Metropolitan Transportation Planning (Proj. 8-7), 90 p., $4.80
121 Protection of Highway Utility (Proj. 8-5), 115 p., $5.60
122 Summary and Evaluation of Economic Consequences of Highway Improvements (Proj. 2-11), 324 p., $13.60
123 Development of Information Requirements and Transmission Techniques for Highway Users (Proj. 3-12), 239 p., $9.60
124 Improved Criteria for Traffic Signal Systems in Urban Networks (Proj. 3-5), 86 p., $4.80
125 Optimization of Density and Moisture Content Mea-surements by Nuclear Methods (Proj. 10-5A), 86 p., $4.40
126 Divergencies in Right-of-Way Valuation (Proj. 11- 4), 57 p., $3.00
127 Snow Removal and Ice Control Techniques at Inter- changes (Proj. 6-10), 90 p., $5.20
128 Evaluation of AASHO Interim Guides for Design of Pavement Structures (Proj. 1-11), 111 p., $5.60
129 Guardrail Crash Test Evaluation—New Concepts and End Designs (Proj. 15-1(2)), 89 p., $4.80
130 Roadway Delineation Systems (Proj. 5-7), 349 p., $14.00
131 Performance Budgeting System for Highway Main- tenance Management (Proj. 19-2(4)), 213 p., $8.40
132 Relationships Between Physiographic Units and Highway Design Factors (Proj. 1-3(1)), 161 p., $7.20
Rep. No. Title
133 Procedures for Estimating Highway User Costs, Air Pollution, and Noise Effects (Proj. 7-8), 127 p., $5.60
134 Damages Due to Drainage, Runoff, Blasting, and Slides (Proj. 11-1(8)), 23 p., $2.80
135 Promising Replacements for Conventional Aggregates for Highway Use (Proj. 4-10), 53 p., $3.60
136 Estimating Peak Runoff Rates from Ungaged Small Rural Watersheds (Proj. 15-4), 85 p., $4.60
137 Roadside Development—Evaluation of Research (Proj. 16-2), 78 p., $4.20
138 Instrumentation for Measurement of Moisture—Literature Review and Recommended Research (Proj. 21-1), 60 p., $4.00
139 Flexible Pavement Design and Management—Sys- tems Formulation (Proj. 1-10), 64 p., $4.40
140 Flexible Pavement Design and Management—Ma- terials Characterization (Proj. 1-10), 118 p., $5.60
141 Changes in Legal Vehicle Weights and Dimensions—Some Economic Effects on Highways (Proj. 19-3), 184.p., $8.40
142 Valuation of Air Space (Proj. 11-5), 48 p., $4.00
143 Bus Use of Highways—State of the Art (Proj. 8-10), 406 p., $16.00
144 Highway Noise—A Field Evaluation of Traffic Noise Reduction Measures (Proj. 3-7), 80 p., $4.40
145 Improving Traffic Operations and Safety at Exit Gore Areas (Proj. 3-17) 120 p., $6.00
146 Alternative Multimodal Passenger Transportation Systems—Comparative Economic Analysis (Proj. 8-9), 68 p., $4.00
147 Fatigue Strength of Steel Beams with Welded Stiff- eners and Attachments (Proj. 12-7), 85 p., $4.80
148 Roadside Safety Improvement Programs on Freeways —A Cost-Effectiveness Priority Approach (Proj. 20- 7), 64 p., $4.00
149 Bridge Rail Design—Factors, Trends, and Guidelines (Proj. 12-8), 49 p., $4.00
150 Effect of Curb Geometry and Location on Vehicle Behavior (Proj. 20-7), 88 p., $4.80
151 Locked-Wheel Pavement Skid Tester Correlation and Calibration Techniques (Proj. 1-12(2)), 100 p., $6.00
152 Warrants for Highway Lighting (Proj. 5-8), 117 p., $6.40
Synthesis of Highway Practice
No. Title 1 Traffic Control for Freeway Maintenance (Proj. 20-5,
Topic 1), 47 p., $2.20 2 Bridge Approach Design and Construction Practices
(Proj. 20-5, Topic 2), 30 p., $2.00 3 Traffic-Safe and Hydraulically Efficient Drainage
Practice (Proj. 20-5, Topic 4), 38 p., $2.20 4. Concrete Bridge Deck Durability (Proj. 20-5, Topic
3), 28 p., $2.20 5 Scour at Bridge Waterways (Proj. 20-5, Topic 5),
37 p., $2.40 6 Principles of Project Scheduling and Monitoring
(Proj. 20-5, Topic 6), 43 p., $2.40 7 Motorist Aid Systems (Proj. 20-5, Topic 3-01),
28 p., $2.40 8 Construction of Embankments (Proj. 20-5, Topic 9),
38 p., $2.40 9 Pavement Rehabilitation—Materials and Techniques
(Proj. 20-5, Topic 8), 41 p., $2.80 10 Recruiting,'Training, and Retaining Maintenance and
Equipment Personnel (Proj. 20-5, Topic 10), 35 p., $2.80 0
11 Development of Management Capability (Proj. 20-5, Topic 12), .50 p., $3.20
12 Telecommunications Systems for Highway Admin-istration and Operations (Proj. 20-5, Topic 3-03), 29 p., $2.80
13 Radio Spectrum Frequency Management (Proj. 20-5, Topic 3-03), 32 p., $2.80
14 Skid Resistance (Proj. 20-5, Topic 7), 66 p., $4.00
15 Statewide Transportation. Planning—Needs and Re- quirements (Proj. 20-5, Topic 3-02), 41 p., $3.60
16. Continuously Reinforced Concrete Pavement (Proj. 20-5, Topic 3-08), 23 p., $2.80
17 Pavement Traffic Marking—Materials and Applica-tion Affecting Serviceability (Proj. 20-5, Topic 3- 05), 44 p., $3.60
18 Erosion Control on Highway Construction (Proj. 20-5, Topic 4-01), 52 p., $4.00
19 Design, Construction, and Maintenance of PCC Pavement Joints (Proj. 20-5, Topic 3-04), 40 p., $3.60 .
20. Rest Areas (Proj. 20-5, Topic 4-04), 38 p., $3.60 . . . ..
21 Highway Location Reference Methods (Proj. 20-5, 0
Topic 4-06), 30 p., $3.20 22 Maintenance Management of Traffic Signal Equip-
ment and Systems (Proj. 20-5, Topic 4-03) 41 p., $4.00 0
23 Getting Research Findings into Practice (Proj. 20-5, Topic!!) 24p., . $3.20 0 -
24 Minimizing Deicing Chemical Use (Proj. 2075, •- Topic 4-02), 58 p., $4.00
25 Reconditioning High-Volume Freeways in Urban Areas (Proj. 20-5, Topic 5-01), 56 p., $4.00

THE TRANSPORTATION RESEARCH BOARD is an agency of the National Research Council, which serves the National Academy of Sciences and the National Academy of Engineering. The Board's purpose is to stimulate research concerning the nature and performance of transportation systems, to disseminate information that the research produces, and to encourage the application of appropriate research findings. The Board's program is carried out by more than 150 committees and task forces composed of more than 1,800 administrators, engineers, social scientists, and educators who serve without compensation. The program is supported by state transportation and highway departments, the U.S. Department of Transportation, and other organizations interested in the development of transportation. -
The Transportation Research Board operates within the Commission on Sociotechnical Systems of the National Research Council. The Council was organized in 1916 at the request of President Woodrow Wilson as an agency of the National Academy of Sci-ences to enable the broad communityof scientists and engineers to associate their efforts with those of the Academy membership. Members of the Council are appointed by the president of the Academy and are drawn from academic, industrial, and governmental organizations throughout the United States. .
The National Academy of Sciences was established by a congressional act of incorpo-ration signed by President Abraham Lincoln on March 3, 1863, to further science and its use for the general welfare by bringing together the most qualified individuals to deal with scientific and technological problems of broad significance. It is a private, honorary organization of more than 1,000 scientists elected on the basis of outstanding contribu-tions to knowledge and is supported by private and public funds. Under the terms of its congressional charter, the Academy is called upon to act as an official—yet indepen-dent—advisor to the federal government in any matter of science and technology, although it is not a government agency and its. activities are not limited to those on behalf of the government.
To share in the tasks of furthering science and engineering and of advising the federal government, the National Academy of Engineering was established on December 5, 1964, under the authority of the act of incorporation of the National Academy of Sciences. Its advisory activities are closely coordinated with those of the National Academy of Sciences, but it is independent and autonomous in its organization and election of members.
TRANSPORTATION RESEARCH BOARD National Research Council
2101 Constitution Avenue, N.W. Washington, D.C. 20418
ADDRESS CORRECTION REQUESTED
NON-PROFIT ORG.
U.S. POSTAGE
PAID
WASHINGTON, D.C.
PERMIT NO. 42970