warren roane jamie hicks mary kay gianoutsos humble isd warren roane jamie hicks mary kay gianoutsos...
TRANSCRIPT

Warren RoaneJamie Hicks
Mary Kay GianoutsosHumble ISD
Warren RoaneJamie Hicks
Mary Kay GianoutsosHumble ISD
EOC and Algebra I:A District
Perspective
EOC and Algebra I:A District
Perspective
http://www.humbleisd.net/Page/38302

Brief HistoryImpact on District and District
ResponseImpact on Teachers and Teacher
ResponseImpact on StudentsFuture implications
Outline

Voluntary EOC ca. 1994-1999Required EOC ca. 1999-2001
Required TAKS 2002-2011Voluntary EOC 2005-2010
Required 2012 EOC with 15% requirement
Brief History of EOC Algebra

Brief History of EOC Algebra

Legislation DecisionsSTAAR15% Moratorium on 15%
Live testsRelease of EOC resultsEOC to TAKS bridge study
Timeline of EOC Events

Voluntary Field Test
Mandatory Field Test
Field Testing

Live TestsRelease of EOC resultsBridge Study Release
Spring 2012

Mandatory SamplingData file (who will test)
Sending Receiving
Live testing mixed with mandatory sampling
Makeup testing
District Testing

Retesting Information:District Testing
Assessment Minimum needed for cumulative score
Students are REQUIRED to retest if score is below:
Level II Students are RECOMMENDED to retest if score is in the range of:
Level III
English I Reading 1813 1813 1875 1813-2000 2304
English II Reading 1806 1806 1875 1806-2102 2328
English III Reading 1808 1808 1875 1808-2005 2135
English I Writing 1798 1798 1875 1798-2000 2476
English II Writing 1807 1807 1875 1807-2142 2408
English III Writing 1808 1808 1875 1808-2015 2155
Algebra I 3371 3371 3500 3371-3791 4333
Geometry 3362 3362 3500 3362-3964 4397
Algebra II 3350 3350 3500 3350-3790 4080
Biology 3367 3367 3500 3367-3801 4576
Chemistry 3348 3348 3500 3348-4054 4607
Physics 3346 3346 3500 3346-4000 4499
World Geography 3383 3383 3500 3383-3809 4404
World History 3326 3326 3500 3326-4067 4634
U.S. History 3372 3372 3500 3372-3970 4440
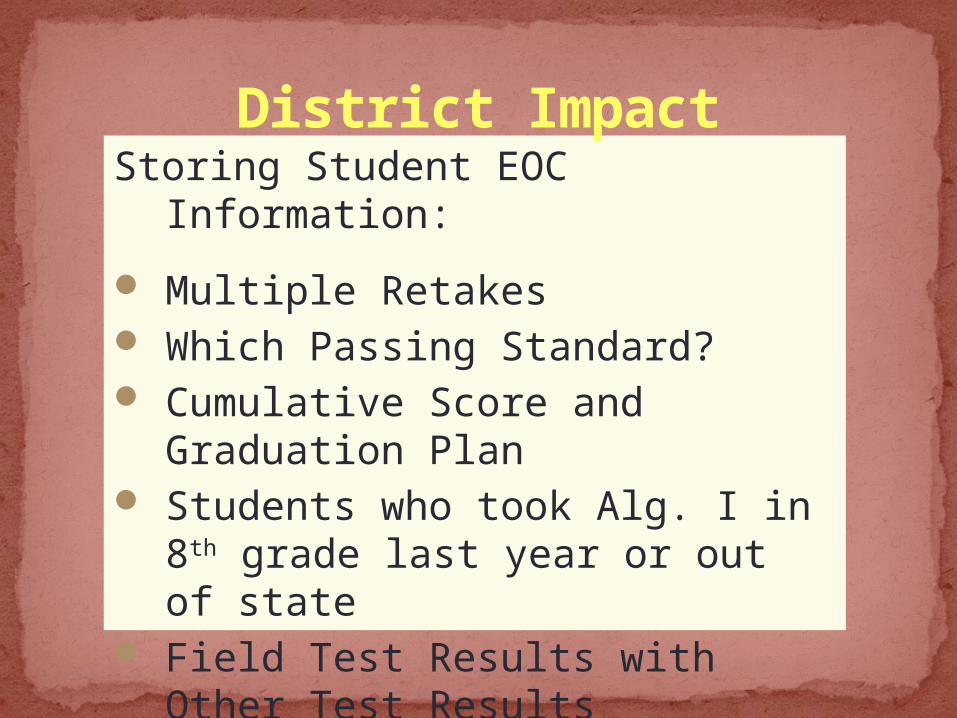
Storing Student EOC Information:
Multiple Retakes Which Passing Standard? Cumulative Score and Graduation Plan Students who took Alg. I in 8th grade last
year or out of state Field Test Results with Other Test Results
District Impact

15% Grading Requirement:OPTION 1: Semester 1 average: 42.5% weight
Semester 2 average: 42.5% weightConverted EOC score: 15% weight
OPTION 2:Semester 1 average: 50% weightSemester 2 average: 35% weightConverted EOC score: 15% weight
OPTION 3:Semester 1 grades at 85% with EOC 15%Semester 2 grades at 85% with EOC
15%Results averaged for the final course
grade
District Impact

Other Decisions for 15%: Will 15% be included for GPA/Class Rank? Will retake scores be permitted to improve a
student’s grade? Will semester credit be given? When awarded? Timing of results – when will grades be
finalized? Will the district give semester tests in EOC-
tested courses? What impact will this have on gradebook
software and report cards?
District Impact

Accelerated Instruction:
District required to provide for all students not achieving Level 2 on EOC
How to notify student in a timely manner? How can we remediate with students when
we do not yet receive detailed results?
District Impact

District and State field test results Projections from field test 2012 District and State results 2012 District and State EOC to
TAKS bridge study results
District Results

District and State Results:Field Test 2010-2011

Campus Study: Projections from Field Test

District Curriculum Impact: Projections from the Field Test
EOC Math TAKS Math
Obj_score_math1
raw_score_math m_obj1 m_raw
EOC math
Obj_score_math1
Pearson Correlation
1 .793** .315** .503**
Sig. (2-tailed)
.000 .000 .000
N 2035 1849 1559 1537
Obj_score_math7
N 243 243 242 240
raw_score_math
Pearson Correlation
.793** 1 .369** .582**
Sig. (2-tailed)
.000
.000 .000
N 1849 1849 1374 1358
TAKS Math
m_obj1 Pearson Correlation
.315** .369** 1 .687**
m_raw Pearson Correlation
.503** .582** .687** 1
Sig. (2-tailed)
.000 .000 .000
N 1537 1358 3720 3720
**. Correlation is significant at the 0.01 level (2-tailed).*. Correlation is significant at the 0.05 level (2-tailed).

Alg. I Course Grade by Grade Level: Projections from the
Field TestKPHS Algebra EOC Av. Alg final
report cardAll grades 29.7 82.08th grade 41.1 87.69th grade 24.4 79.5

District 15% Policy:Projections from the Field TestFormer TAKS terms
STAAR terms
Raw score HUM
Raw Score NEISD
Method 1NEISD
Method 2 Method 3 Method 4
Fails to meet Level I 0-20 0-26 67 68 68 68Fails to meet Level I
min. eligible
21-23 27-30 67 68 68 68
Met standard Level II 24-38 31-44 70 80 80 85Commended Level III 39-53 45-53 90 90 95 95Perfect score 54 54 100 100 100 100
Former TAKS terms
STAAR terms Raw scoreNEISD
KPHS 8th KPHS 9th KPHS All grades
Fails to meet Level I 0-26 0% 0-64% (64%) 0-44% (44%)Fails to meet Level I min.
eligible27-30 0-5% (5%) 65-78% (13%) 45-55% (10%)
Met standard Level II 31-44 6-67% (61%) 79-100% (21%) 56-88% (32%)Commended Level III 45-53 68-100% (32%) 0% 89-100% (11%)Commended Level III 54 0% 0% 0%

District and State Results:EOC 2011-12 Raw Score
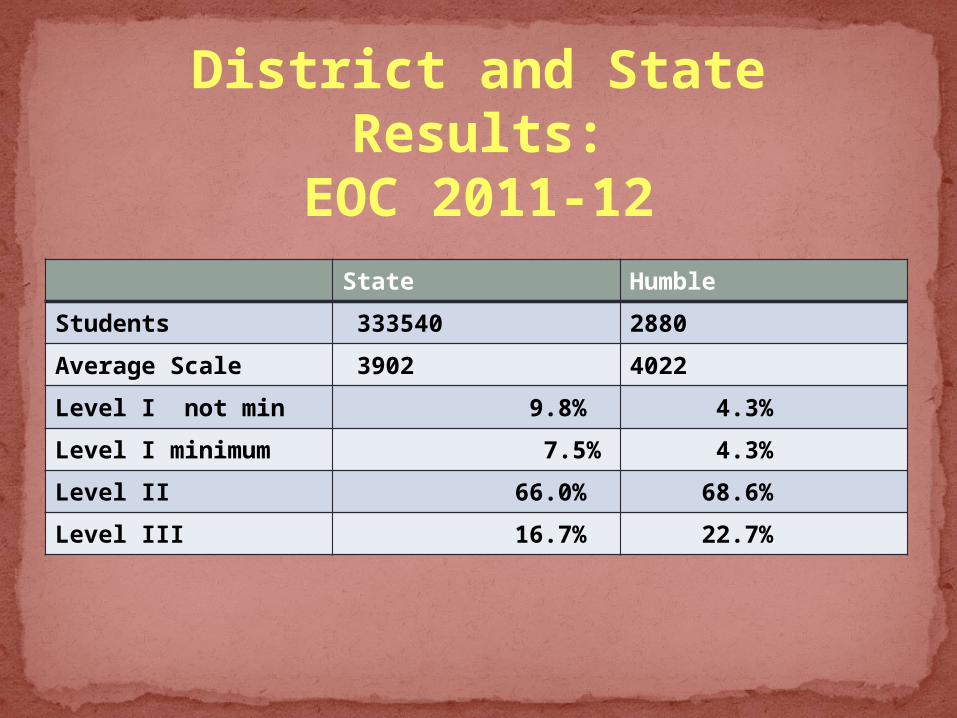
District and State Results:EOC 2011-12
State Humble
Students 333540 2880
Average Scale 3902 4022
Level I not min 9.8% 4.3%
Level I minimum 7.5% 4.3%
Level II 66.0% 68.6%
Level III 16.7% 22.7%

District and State Results:EOC 2011-12
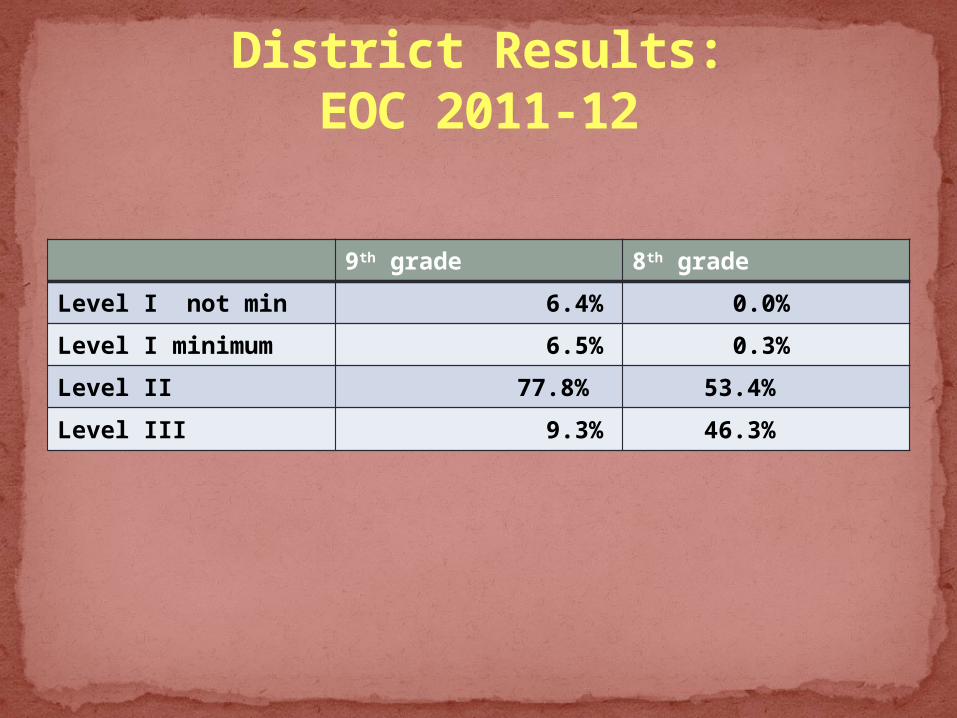
District Results:EOC 2011-12
9th grade 8th grade
Level I not min 6.4% 0.0%
Level I minimum 6.5% 0.3%
Level II 77.8% 53.4%
Level III 9.3% 46.3%

District Results:EOC 2011-12

2012 District and State Results:Percent Met Standard TAKS, STAAR
Bridge Study (Raw Score 15)
9097.6 96.4 100
82.791.4 87.1
100
0
20
40
60
80
100
120
State (All) Humble (All) Humble (9th) Humble (8th)
TAKS
STAAR

District and State Results:EOC 2011-12 and TAKS 2012
State (all students) Failing TAKS 10% but 17.3 % below Level II
District (all students)Failing TAKS at 2.4% but 8.6% below Level II

Who should test
Who tested Online- 78 Paper- 30
District Summer Testing
STAAR EOC Exams Retest Mandatory Retest Recommended Retest Optional
English I, II, III Reading English I: Below 1813English II: Below 1806English III: Below 1808
English I: 1813-2000English II: 1806-2004English III: 1808-2006
English I: 2304 or aboveEnglish II: 2328 or aboveEnglish III: 2135 or above*
English I, II, III Writing English I: Below 1798English II: Below 1807English III: Below 1808
English I: 1798-2000English II: 1807-2019English III: 1808-2020
English I: 2476 or aboveEnglish II: 2408 or aboveEnglish III: 2155 or above*
Algebra I, Geometry, Algebra II
Algebra I: Below 3371Geometry: Below 3362Algebra II: Below 3350
Algebra I: 3371-3791Geometry: 3362-3779Algebra II: 3350-3767
Algebra I: 4333 or aboveGeometry: 4397 or aboveAlgebra II: 4080 or above*
Biology, Chemistry, Physics Biology: Below 3367Chemistry: Below 3348Physics: Below 3346
Biology: 3367-3801Chemistry: 3348-3787Physics: 3346-3785
Biology: 4576 or aboveChemistry: 4607 or abovePhysics: 4499 or above
World Geography, World History, U.S. History
W. Geography: Below 3383W. History: Below 3326U.S. History: Below 3372
W. Geography: 3383-3809W. History: 3326-3745U.S. History: 3372-3791
W. Geography: 4404 or aboveW. History: 4634 or aboveU.S. History: 4440 or above
Required to Retest
Recommended to Retest
Alg I 125 796

TAKS versus EOC curriculum New EOC teaching materials Accountability by class period Value-added model: teacher name
to student
Impact on Teachers

Repetition/summer school Additional testing Cumulative testing record Graduation type 15% impact on: graduation, GPA,
class rank, college admission, summer school, tutoring
Impact on Students

Graduation rates-more difficult (AYP, State Accountability)
College admission—fairness of diverse retesting/15% policies
Money-Summer school/accelerated instruction budget
Future Implications

Questions?Contact informationJamie Hicks, Coordinator of Student
[email protected] Roane, Director of [email protected] Kay Gianoutsos, Assistant Director of Data

Questions?
PowerPoint Informationhttp://www.humbleisd.net/Page/38302