was ist szientometrie - unigraz · 3 recommended reading seidlmeier heinrich: prozessmodellierung...
TRANSCRIPT

1
Applied Business Informatics 2/
Applied Information Systems 2:
Business Process Modeling
(WS 2016/17)
Assoc. Prof. DI. Dr. Christian Schlögl
Institute of Information Science and
Information Systems
Universitätsstraße 15/F3
8010 Graz
Objectives
Students should
1. be aware of critical aspects with regards to the performance
of business processes
2. have basic knowledge about business process modeling
3. be able to use ARIS method to model business processes
4. be able to perform a business modeling project
2
Part 1:
• Requirements analysis (DATA-ID-method)
• Process modeling
– modeling the current state of a process (ARIS)
– analysing it by means of various operating figures
– modelling the target process
• Process organisation
• Tools for process modeling: Visio, ARIS Express
Part 2:
• Realisation of a process modeling project
Content
Teaching and learning method / assessment
Teaching and learning method:
• Presentations by course instructor
• Practical excerises during the course and at home
• Realisation of a process modeling project
Exam method and evaluation:
• Home excerises (approximately 5 home exercises)
• Written exam
• Project report and project presentation
Final assessment:
– grade of the project report and presentation (50 %)
– grade of the exam (50 %)
– plus/minus one grad on the basis of the participation in the course and home exercises

3
Recommended Reading
Seidlmeier Heinrich: Prozessmodellierung mit ARIS. 2. Aufl., Vieweg, 2006 (only in German)
Scheer August-Wilhelm: Architecture of integrated information systems : foundations of enterprise modelling, Springer, 1992.
Scheer August-Wilhelm: Business process engineering : reference models for industrial enterprises, Springer, 1994.
Scheer August-Wilhelm, Nüttgens Markus: ARIS Architecture and Reference Models for Business Process Management. In: Lecture Notes in Computer Science, Volume 1806, 2000, available at: http://www.wiso.uni-hamburg.de/fileadmin/WISO_FS_WI/EPK-
Community/LNCS_Geschaeftsprozessarchitektur.pdf (accessed March 9th, 2015), S. 376 – 389.
Turban Efraim, Volonino Linda: Information Technology for Management, 8. Aufl. - Kapitel 13 (Business Process Management and Systems Development), Wiley, 2012.
COLLECTION OF REQUIREMENTS / PRESENT STATUS
DATA-ID-Method:
1. Identification of concerned organisational units
2. Identification of affected tasks and the organisational units
which are concerned with tehm
3. Identification of staff members which are to be interviewed
4. Collection of requirements with regards to
– objectives
– activities/functions
– data
– events
in so-called „Requirement Collection Forms“
4
Collection of requirements / present status
5. Filtering/Condensing of „Requirement Collection Forms“
6. Generation of three specific forms (on the basis of the filtered
requirement collection form):
– 1. Data Forms: characterised by words like „is", „has",
„consists of", „concerns", ...
– 2. Operation Forms: characterised by activity words/verbs
like „make", „execute", ...
– 3. Event Forms: characterised by words like „if", „in the case
7. Filtering/condensing the data, operation and event forms
Example: see Excel-file.
BUSINESS PROCESS MODELING
Several process modeling approaches / information architecture approaches have been suggested.
Examples:
• ARIS („Architecture of Integrated Information Systems“) (Scheer)
• Holistic Information System Architecture Model (Modell der ganzheitlichen Informationssystem-Architektur (ISA) (Krcmar)
• Information Engineering (James Martin)
• Kölner Integration Model (KIM) (Grochla)
• CIM-OSA-Architecture
• IFIP WG 8.1-Architecture
• AD/CYCLE (IBM)

5
ISA Model by Krcmar
Essentially, an information systems architecture consists of
• data architecture
• application/function architecture
• communication architecture
It forms a buffer between
• business strategy and
• process architecture (operational structuring) and organisation
structure an the one hand AND
• technological infrastructure on the other hand
Architecture of Integrated Information Systems (ARIS)
3 (4) different „views“:
• Data view
• Functional view
• Organizational view
• Control view (process view)
6
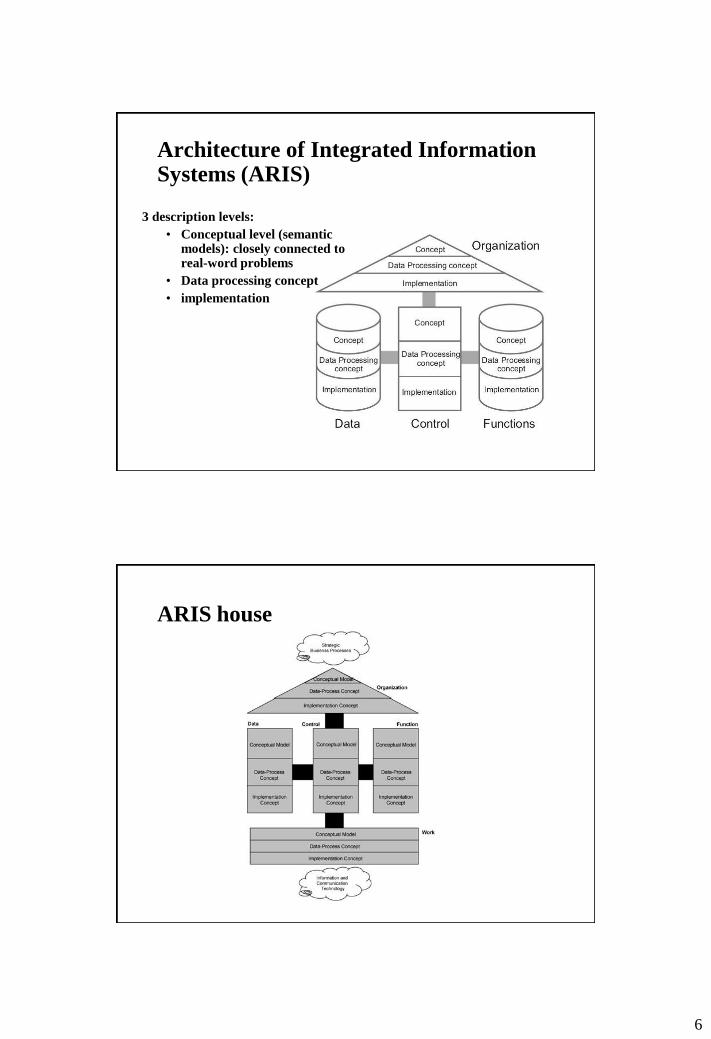
Architecture of Integrated Information Systems (ARIS)
3 description levels:
• Conceptual level (semantic models): closely connected to real-word problems
• Data processing concept
• implementation
ARIS house
7
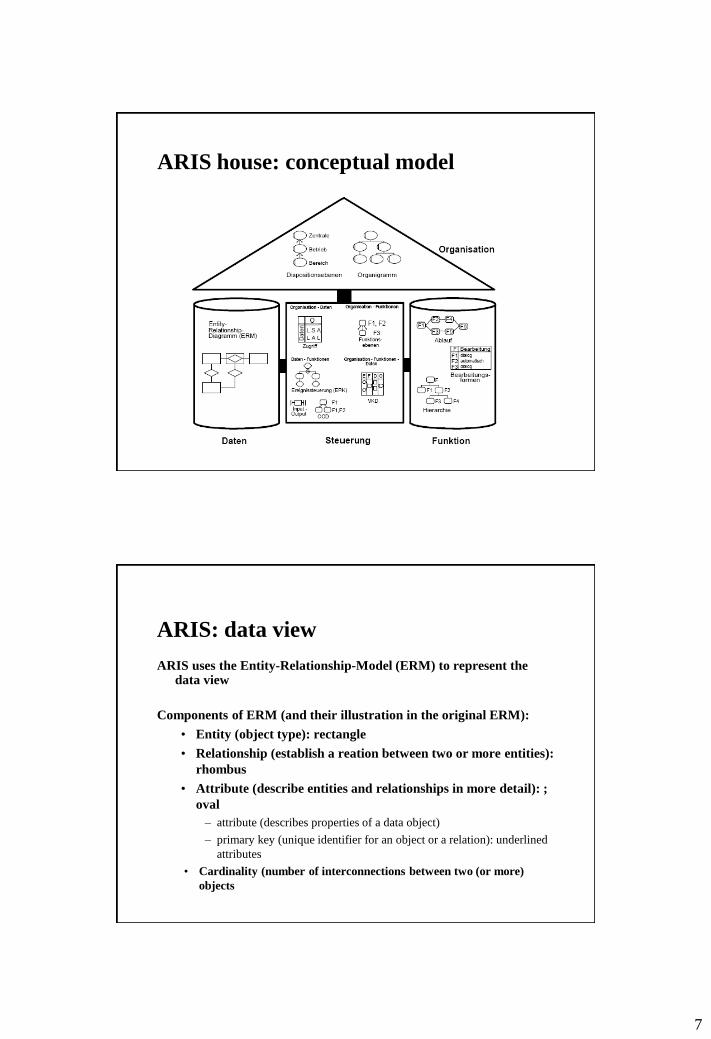
ARIS house: conceptual model
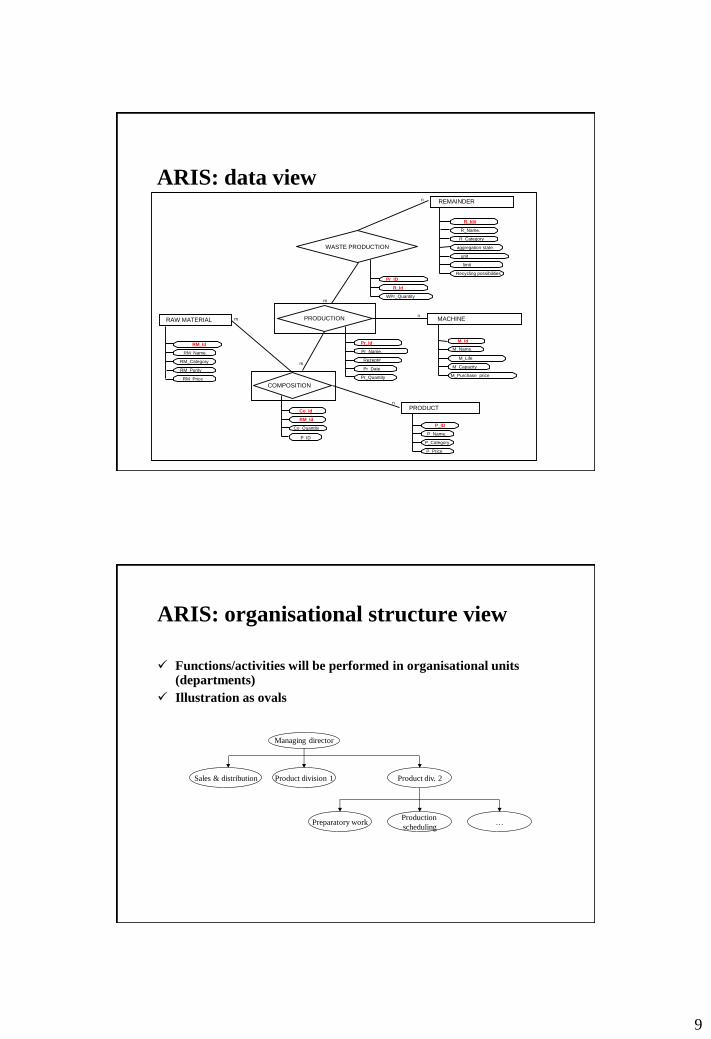
ARIS: data view
ARIS uses the Entity-Relationship-Model (ERM) to represent the data view
Components of ERM (and their illustration in the original ERM):
• Entity (object type): rectangle
• Relationship (establish a reation between two or more entities):
rhombus
• Attribute (describe entities and relationships in more detail): ;
oval
– attribute (describes properties of a data object)
– primary key (unique identifier for an object or a relation): underlined
attributes
• Cardinality (number of interconnections between two (or more)
objects

8
ARIS: data view
REMAINDER
(WASTE) COMPANY ENTSOR-
GUNG
R_Id
R_Name
Aggregation state
limit
unit
Comp_Id
address
Call number
R_Id
Comp_Id
ERM – example:
aggregation state: solid, liquid, gaseous
unit: kilo, liter, cubic meter
N M
ARIS: data view
Components of ERM (and their illustration in the original ERM):
• Cardinality (number of interconnections between two (or more)
objects:
– 1:1: 1 object of the first object type is connected with (0 or) 1 object
of the second object type; 1 object of the second object type is
conneted with (zero or) 1 object of the first object type
– 1:N: 1 object of the first object type is connected with (0,) 1, 2, … N
objects of the second object type; 1 object of the second object type is
connected with (0 or) 1 object of the first object type
– M:N: 1 object of the first object type is connected with (0,) 1, 2, … N
objects of the second object type; 1 object of the second object type is
connected with (0,) 1, 2 … M objects of the first object type
9
ARIS: data view
RAW MATERIAL
PRODUCT
COMPOSITION
RM_Id
RM_Name.
RM_Category .
RM_Purity
Co_Id
RM_Id
Co_Quantity
MACHINE
REMAINDER
PRODUCTION
WASTE PRODUCTION
P_ID
P_Name.
P_Category.
P_Price
RM_Price
M_Id
M_Name.
M_Life
M_Purchase price
M_Capacity
R_Id#
R_Name.
R_Category
aggregation state.
unit
limit
Recycling possibilities
Pr_Id
Pr_Name.
Rezept#
Pr_Date
Pr_Quantity
Pr_ID
R_Id
WPr_Quantity
m
n
m
n
m
n
P_ID
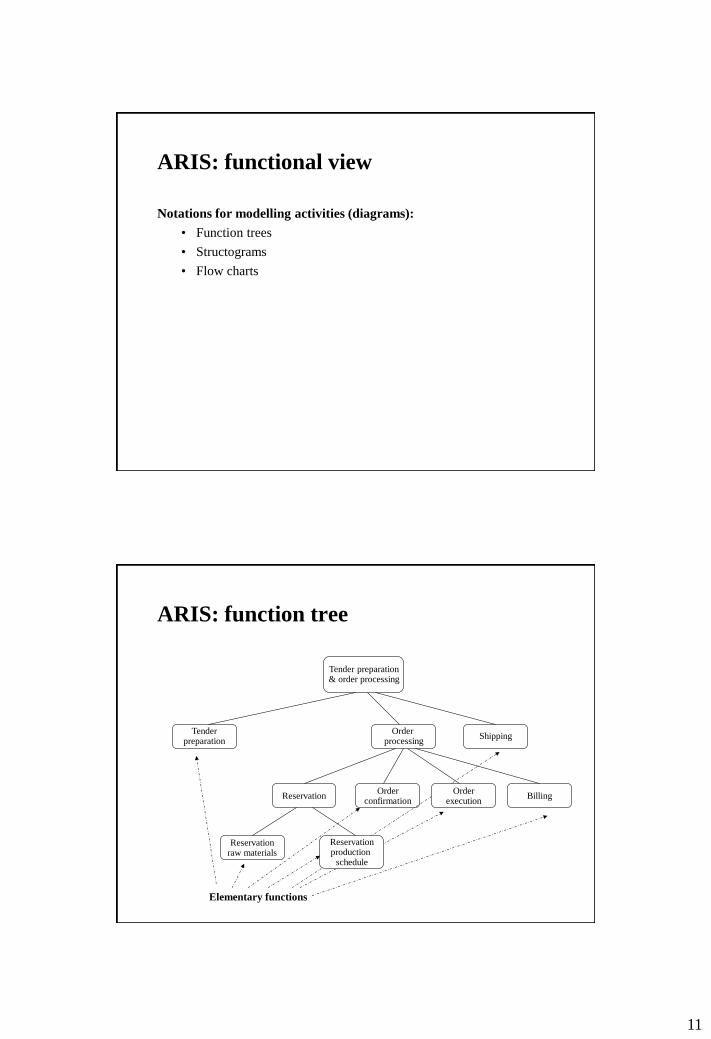
ARIS: organisational structure view
Functions/activities will be performed in organisational units (departments)
Illustration as ovals
Managing director
Sales & distribution Product division 1 Product div. 2
Preparatory work Production
scheduling …

10
ARIS: organisational view
Further modelling elements:
• department
• role / position („Stelle“): persons can be assigned to a role but also directly to a department
• staff member / holder of a position
Product div. 2
Preparatory work
Production
scheduling
Work preparer
Head of prod.
scheduling
Work scheduler
Ms. Meier
Mr. Tatscher
Mr. Höller
Mr. Müller Mr. Meister
ARIS: functional view
Activities (functions):
• Indicate an action/operation, for example: „compile/generate an invoice“
• Usually they need, change or produce data (objects) during their execution
• They are performed by organizational units.
• Distinction among complex functions, sub-functions, and elemantary functions
• Elementary functions are activities where it does not make sense to further decompose them.
• Activities can be described by attributes:
– Quantities: e.g., number of inquiries per day
– Time specifications: - Adjustment period
- Actual processing time
- Wait/lay time
- ...
– ...
11
ARIS: functional view
Notations for modelling activities (diagrams):
• Function trees
• Structograms
• Flow charts
ARIS: function tree
Tender preparation & order processing
Reservation raw materials
Billing Order
confirmation Reservation
Order processing
Shipping Tender
preparation
Elementary functions
Reservation production
schedule
Order execution

12
ARIS: structogram
Structogram = for presenting algorithms graphically
Control structures:
• pass or operation
• sequence: series of operations, which are performed one after the
other (consecutively)
• selection: as result of a condition a corresponding sequence (of
operations) will be performed
IF condition THEN sequence1 ELSE sequence 2
• Loop (iteration): DO WHILE condition (is TRUE):
perform sequence of operations
ARIS: structogram
Operation und sequence:
Operation 1
Operation 2
Operation 3
Selection / IF … THEN … ELSE:
Condition? TRUE FALSE
Sequence 1 Sequence 2
13
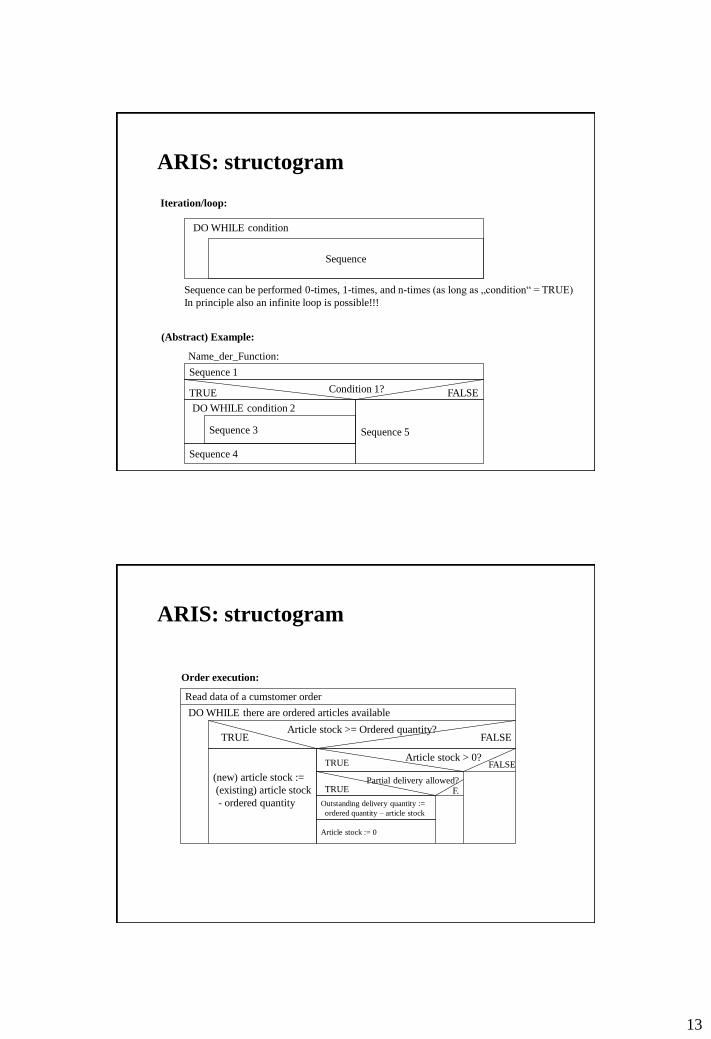
ARIS: structogram
Iteration/loop:
(Abstract) Example:
Condition 1? TRUE FALSE
Sequence 5
Sequence
DO WHILE condition
Sequence 1
Sequence 3
DO WHILE condition 2
Sequence 4
Sequence can be performed 0-times, 1-times, and n-times (as long as „condition“ = TRUE)
In principle also an infinite loop is possible!!!
Name_der_Function:
ARIS: structogram
Read data of a cumstomer order
Article stock >= Ordered quantity? TRUE FALSE
Article stock > 0?
Partial delivery allowed?
Outstanding delivery quantity :=
ordered quantity – article stock
Article stock := 0
DO WHILE there are ordered articles available
(new) article stock :=
(existing) article stock
- ordered quantity
TRUE
TRUE FALSE
F.
Order execution:
14
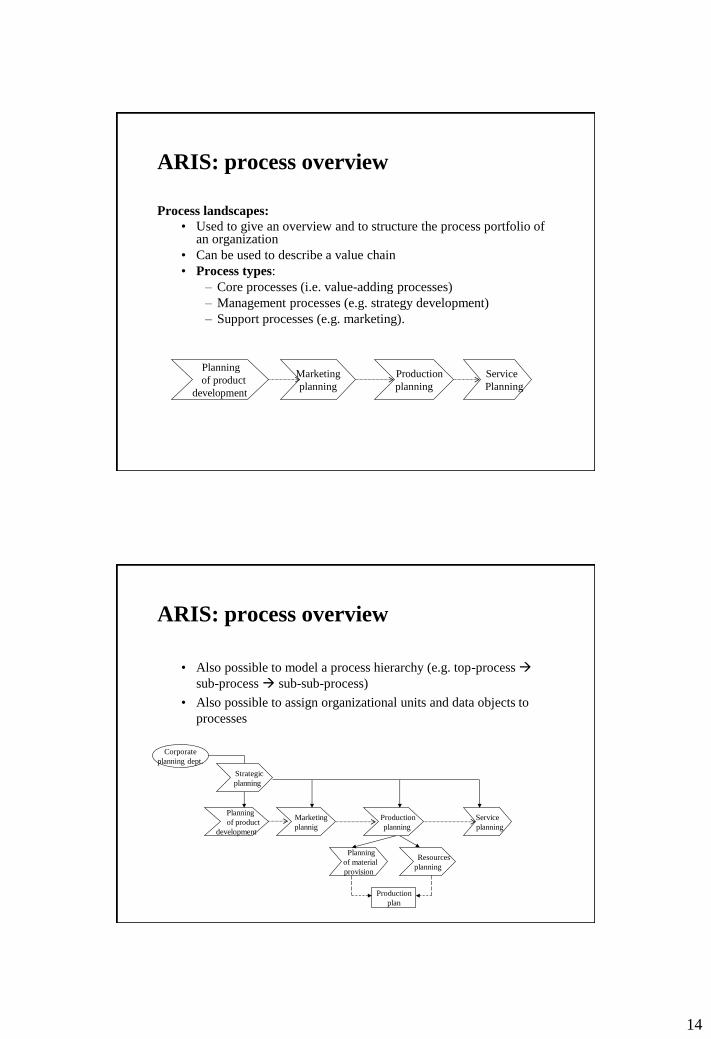
ARIS: process overview
Process landscapes:
• Used to give an overview and to structure the process portfolio of an organization
• Can be used to describe a value chain
• Process types:
– Core processes (i.e. value-adding processes)
– Management processes (e.g. strategy development)
– Support processes (e.g. marketing).
Planning
of product
development
Marketing
planning
Production
planning
Service
Planning
ARIS: process overview
• Also possible to model a process hierarchy (e.g. top-process
sub-process sub-sub-process)
• Also possible to assign organizational units and data objects to
processes
Planning
of product
development
Marketing
plannig
Production
planning
Service
planning
Strategic
planning
Planning
of material
provision
Resources
planning
Production
plan
Corporate
planning dept.

15
ARIS: Control view (process view)
The control view merges the 3 other views (data, functions, organization)
Notation (modeling language) used: Event-driven Process Chains (EPC)
Each process is initiated by an event, each process leads to a certain result (event); this is the same for activities
Level of detailedness:
• Events and activities/functions
• Events and activities/functions and data
• Events and activities/functions, data, organization units
• Events and activities/functions, data, organization units, and various additional information (e.g. kind of processing type (batch or interactive, access authorization, …)
ARIS: control view
XOR
Event
Activity (Operation)
Connector
Information (data) object, Materials orbject or other resource object
Control flow
Information or materials flow
Organization unit (department)
Assignment of resources or organzational units to activities
... describes the logical sequence of activities and events
... describes how (AND, OR, XOR) two or more events/
activities are connected with each other
... Indicate if an activity requires information (input),
produces information (output) or updates information (both)
Event-driven Process Chain (EPC) - icons:
... 1) initiates an activity, 2) is result of an activity
refers to a point in time (is punctual)
Information object (e.g. entity or relation of an ERM)
Information object (document – in print)
... illustration of real-world objects
16
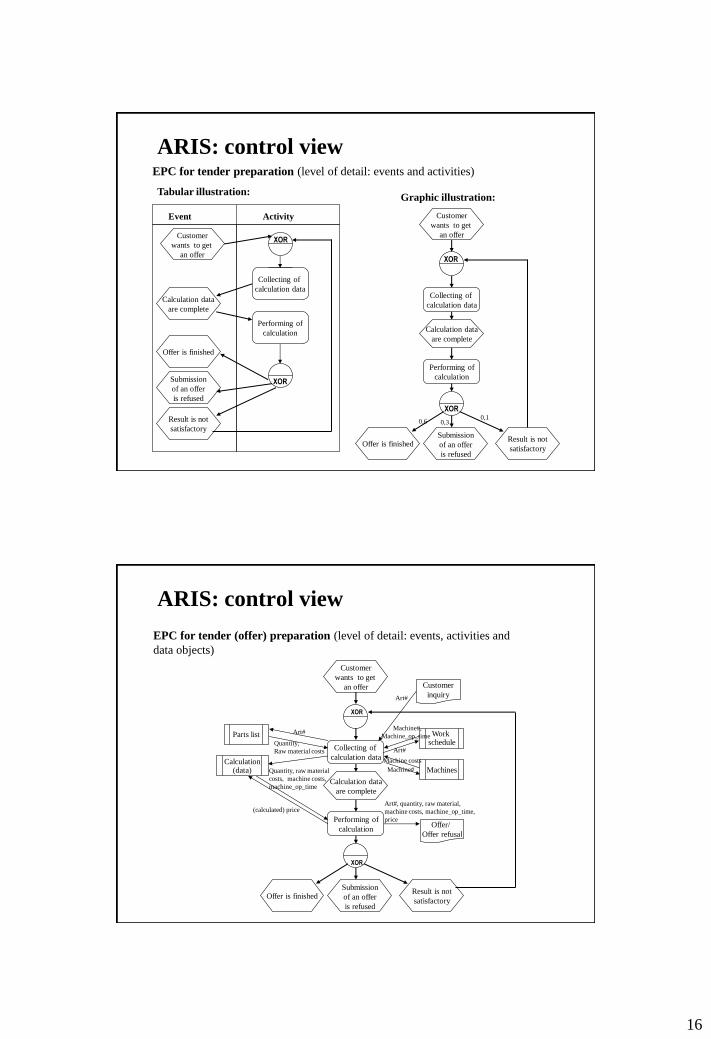
ARIS: control view
Customer
wants to get
an offer
Collecting of
calculation data
Calculation data
are complete
Performing of
calculation
Offer is finished
Submission
of an offer
is refused
Result is not
satisfactory
XOR
Event Activity Customer
wants to get
an offer
XOR
Collecting of
calculation data
Calculation data
are complete
Performing of
calculation
XOR
Offer is finished Submission
of an offer
is refused
Result is not
satisfactory
Tabular illustration: Graphic illustration:
EPC for tender preparation (level of detail: events and activities)
0,6 0,3 0,1
XOR
ARIS: control view
Customer
wants to get
an offer
XOR
Collecting of
calculation data
Calculation data
are complete
Performing of
calculation
XOR
Offer is finished Submission
of an offer
is refused
Result is not
satisfactory
EPC for tender (offer) preparation (level of detail: events, activities and
data objects)
Parts list
Calculation (data)
Work schedule
Machines
Quantity,
Raw material costs
Machine#,
Machine_op_time
Machine costs
Art#, quantity, raw material,
machine costs, machine_op_time,
price
(calculated) price
Quantity, raw material
costs, machine costs,
machine_op_time
Offer/
Offer refusal
Customer
inquiry Art#
Art#
Art#
Machine#

17
ARIS: control view
Connectors: Use:
• If one event is followed by at least two activities
• If one activity is followed by at least two events
if one event/activity is followed by one activity/event, a connector is
not neccessary Connector types:
... Boolean AND: z. B. both (all) activities must be performed, both (all) events must occur , XOR... Exclusive OR: either the one or the other activity (but NOT both) must be performed, ... ... Boolean OR: either the one or the other activity or BOTH must be performed, ...
ARIS: control view
Connectors:
1 event initiates two activities:
E
A1 A2
The completion of an activity is followed by two events:
A
E2 E1
Input
Output
Output connectors (if a branch splits):
After occurrance of event E, the activities A1 and A2 must be performed.
The completion of activity A results in the two events E1 and E2.
To distiniguish if a branch splits or merges, there is a distinction between
Input and output connectors:
• output connector (lower half of a circle): one input, several outputs
• input connector (upper half): several inputs, one output

18
ARIS: control view
Connectors:
The occurrance of both event E1 and E2 initiates activity A
E1 E2
A
E1 E2
A1 A2
The occurrance of either event E1 or E2 or both, initiates both activity A1 and A2
Input (and output) connectors:
ARIS: control view
Articles have
arrived
Inspecting of
articles
XOR
Articles are
approved
Articles are
locked Articles are
refused
EPC for stock receipt (incl. organizational view):
Order
Shipping note
Inspection protocol
Goods receiving point
PRODUCTION QUALITY
INSPECTION
19
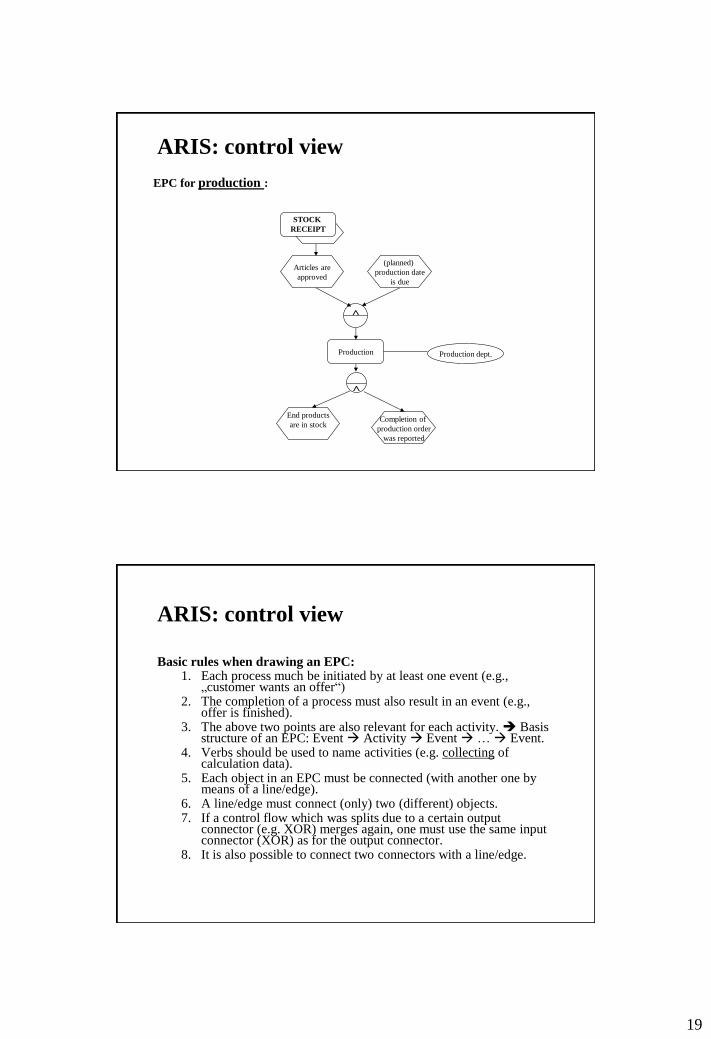
ARIS: control view
Articles are
approved
End products
are in stock
(planned)
production date
is due
EPC for production :
STOCK
RECEIPT
Completion of
production order
was reported
Production
Production dept.
ARIS: control view
Basic rules when drawing an EPC: 1. Each process much be initiated by at least one event (e.g.,
„customer wants an offer“) 2. The completion of a process must also result in an event (e.g.,
offer is finished). 3. The above two points are also relevant for each activity. Basis
structure of an EPC: Event Activity Event … Event. 4. Verbs should be used to name activities (e.g. collecting of
calculation data). 5. Each object in an EPC must be connected (with another one by
means of a line/edge). 6. A line/edge must connect (only) two (different) objects. 7. If a control flow which was splits due to a certain output
connector (e.g. XOR) merges again, one must use the same input connector (XOR) as for the output connector.
8. It is also possible to connect two connectors with a line/edge.
20
ARIS: control view
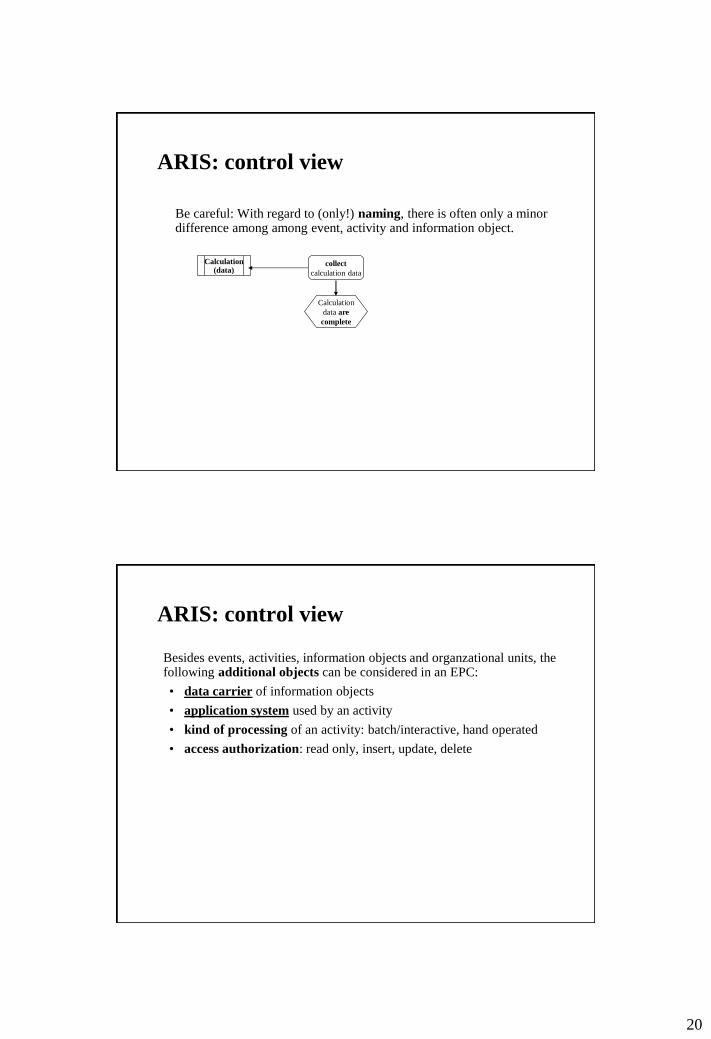
Be careful: With regard to (only!) naming, there is often only a minor difference among among event, activity and information object.
collect
calculation data
Calculation
data are
complete
Calculation (data)
ARIS: control view
Besides events, activities, information objects and organzational units, the following additional objects can be considered in an EPC:
• data carrier of information objects
• application system used by an activity
• kind of processing of an activity: batch/interactive, hand operated
• access authorization: read only, insert, update, delete

21
ARIS: control view
Icons for data carriers:
document
card index
file
ring binder
fax
Icons for application systems:
diskette
SAP R/3
Ex
specific application system
Text proc. x
type of application system
ARIS: goal chart
modelling of the goal system of an organization
Goal chart:
• Hierarchic illustration of the goals of an enterprise and/or a project
• goal hierarchy: top/superior goals intermediary goals sub-
goals
• Goals can be quantify by assigning of success factors (e.g.
performance figures
• Goals will be reached by means of functions (function view)
• which makes it possible to connect the goal system with the other
views (models)

22
ARIS: goal chart
higher
profatibility
decreasing
costs
increasing
sales
increasing
market
share
performing
sales campaigns
performing
sales promo-
tions
Sales Market share
Goal chart with functions and success factors
PROCESS MODELLIING: general aspects
Project
preparation
Collecting
of actual
process state
Process
analysis
To-be
conception
Presentation
of results
• project selection
and definion
• defining project
goals and project
organization
• defining tasks and
schedule for project
• ...
• data collection
(organisational
structure, functions,
data, processes)
• process modelling
• verification
• calculation of
performance
figures (times,
costs, ...)
• ...
• realization of weak
points
• analysis of
performance figures
• discussion/revision
• suggestions for
improvement
• ...
• modelling of one or
more target processes
• assessment of target
processes
- necessary actions
- investments
/expenditures
- time for
implementation
• consequences for
structural organi-
sation
• ...
General procedure model:

23
PROCESS MODELLING: general aspects
Interview guide for collecting the actual process state (1)
Aim: Collection of the actual state of process …
Triggers + Events
• Which event starts the process?
• How or by whom you are informed that you have to spring into action in the process?
• How many times is the process initiated?
• What is the result of the process?
Input
• Which documents must be available in which quality?
• Which data (records) must be provided by the application system?
Process structure
• Please describe the varous operations/functions. Which operations must be performed in
which sequence?
• Which are the preceding operations and which the subsequent activities?
Staff involved in the process
• Which staff members are involved in the process? (Who collaborates with whom?)
• Which departments/organizational units are involved?
PROCESS MODELLING: general aspects
Interview guide for collecting the actual process state (2)
Process output
• Which documents are produced? Which documents are relevant?
• How long does it take to produce a document?
Process interfaces
• Is it necessary to communicate with other departments in order to perform the operation?
If yes, how does this communication process take place?
Necessary resources
• Which resources (e.g. technical equipment) do you need?
• Which data are required by which application system when, where and in which form for
which function/operation? How are the data processed for the relevant function/operation?
Possible improvements
• Where occur often problems/difficulties in the process? How often do they occur? How
severe are they?
• When arise waiting and idle times?
• Which operations are not properly supported by application systems?
• Do you have any other ideas how to improve the process?
• Is there a course of action in case of critical incidents? Are the necessary responsibilites
determined?
24
PROCESS MODELLING: general aspects
Process analysis – performance figures (1):
• Lead time/throughput time:
– processing time + time for information/data transfer + waiting time
+ idle time (=Liegezeite)
– Usually processing time is only a small fraction of lead time!!!
– Notation: mean value or median, in addition minimum and
maximum values (ev. distribution function)
• Process costs:
– All labour costs, material costs and other costs which can be directly
attributed to a process
– Much more transparent and pricise picture of the actual cost
situation (unlike overhead/indirect costs which are more or less
randomly assigned to a cost unit)
PROCESS MODELLING: general aspects
Process analysis – performance figures (1):
• Alternation between departments/roles (%):
:= number of alternations between different organisational
units/roles divided by the total number of possible alternations (=
total number of functions – 1)
(usually a high percentage leads to a high lead time (in particular
waiting and idle times)
• Degree of automatization (%):
:= number of functions which are computer-supported (fully
automated) divided by total number of functions
• Alternation between application systems (%):
:= number of alternations between different application systems
divided by the total number of possible alternations (= total number
of functions – 1)
(usually a high percentage leads to a high lead time (in particular
information/data transfer time)