was there really a hawthorne effect at the hawthorne … · · 2011-12-05was there really a...
TRANSCRIPT
NBER WORKING PAPER SERIES
WAS THERE REALLY A HAWTHORNE EFFECT AT THE HAWTHORNE PLANT?AN ANALYSIS OF THE ORIGINAL ILLUMINATION EXPERIMENTS
Steven D. LevittJohn A. List
Working Paper 15016http://www.nber.org/papers/w15016
NATIONAL BUREAU OF ECONOMIC RESEARCH1050 Massachusetts Avenue
Cambridge, MA 02138May 2009
¸˛Thanks to Sonia Jaffe, Andrew Hogue, and Colin Spitz for incredible research assistance. Financialsupport came from the National Science Foundation and the Sherman Shapiro Research Fund. Theviews expressed herein are those of the author(s) and do not necessarily reflect the views of the NationalBureau of Economic Research.
NBER working papers are circulated for discussion and comment purposes. They have not been peer-reviewed or been subject to the review by the NBER Board of Directors that accompanies officialNBER publications.
© 2009 by Steven D. Levitt and John A. List. All rights reserved. Short sections of text, not to exceedtwo paragraphs, may be quoted without explicit permission provided that full credit, including © notice,is given to the source.
Was there Really a Hawthorne Effect at the Hawthorne Plant? An Analysis of the OriginalIllumination ExperimentsSteven D. Levitt and John A. ListNBER Working Paper No. 15016May 2009JEL No. A0,C91,C92,C93,D03,L22
ABSTRACT
The “Hawthorne effect,” a concept familiar to all students of social science, has had a profound influenceboth on the direction and design of research over the past 75 years. The Hawthorne effect is namedafter a landmark set of studies conducted at the Hawthorne plant in the 1920s. The first and most influentialof these studies is known as the “Illumination Experiment.” Both academics and popular writers commonlysummarize the results as showing that every change in light, even those that made the room dimmer,had the effect of increasing productivity. The data from the illumination experiments, however, werenever formally analyzed and were thought to have been destroyed. Our research has uncovered thesedata. We find that existing descriptions of supposedly remarkable data patterns prove to be entirelyfictional. There are, however, hints of more subtle manifestations of a Hawthorne effect in the originaldata.
Steven D. LevittDepartment of EconomicsUniversity of Chicago1126 East 59th StreetChicago, IL 60637and [email protected]
John A. ListDepartment of EconomicsUniversity of Chicago1126 East 59thChicago, IL 60637and [email protected]
Was there Really 3
Was there Really a Hawthorne Effect at the Hawthorne Plant?
An Analysis of the Original Illumination Experiments
“The experiments started with, continued with, and ended with attention focused on one
thing and one thing only, what people do. This was the new procedure and it was
revolutionary, in the same way that Galileo’s or Mendel’s procedure was revolutionary in
the science of their time.” (Hart, 1943)
“In the history of science, certain contributions stand out as signal events in the sense that
they influence a great deal of what follows. The Hawthorne Experiments exemplify this
phenomenon in the field of industrial work and have been the subject of serious
subsequent commentary and reanalysis.” (Bloombaum, 1983)
When the National Research Council initiated a set of experiments at Western Electric’s
Hawthorne Plant in Cicero, Illinois in 1924, its objective was to answer a narrow question: does
better lighting enhance worker productivity? The results of these experiments, however, have
had a profound influence on research in the social sciences ever since. According to Blalock and
Blalock (1982, p. 72), to the surprise of the researchers, “each time a change was made, worker
productivity increased…..As a final check, the experimenters returned to the original unfavorable
conditions of poor lighting….Seemingly perversely, productivity continued to rise.” Spurred by
these initial findings, a series of experiments were conducted at the plant over the next eight
years. New empirical results reinforced the initial findings. Freedman (1981, p. 49) summarizes
the results of the next round of experiments as follows: “Regardless of the conditions, whether
there were more or fewer rest periods, longer or shorter workdays…the women worked harder
and more efficiently.”
From these two sets of experiments came the “Hawthorne effect,” and the original
illumination studies are commonly recognized among the most influential experiments in social
science, helping to spawn the development of a new field of study—Industrial Psychology.
Their influence extends well beyond academic circles, as illustrated by Peters and Waterman’s
Was there Really 4
(1982, pp. 5-6) business writing: “For us, the very important message of the research…is that it
is attention to employees, not work conditions per se, that has the dominant impact on
productivity (Many of our best companies, one friend observed, seem to reduce management to
merely created ‘an endless stream of Hawthorne effects’).”
In this paper, we revisit the illumination studies. While these experiments represent key
early evidence of the Hawthorne effect, the actual data have never been examined and experts
thought that they were destroyed. In fact, however, we discovered that the original data from the
illumination experiment do exist, preserved in two library archives. Our analysis of the newly
found data reveals little evidence to support the existence of a Hawthorne effect as commonly
described; i.e., there is no systematic evidence that productivity jumped whenever changes in
lighting occurred. On the other hand, we do uncover some weak evidence consistent with more
subtle manifestations of Hawthorne effects in the data. In particular, output tends to be higher
when experimental manipulations are ongoing relative to when there is no experimentation.
Also consistent with a Hawthorne effect is that productivity is more responsive to experimenter
manipulations of light than naturally-occurring fluctuations.
We conclude that the evidence for a Hawthorne effect in the studies that gave the
phenomenon its name is far more subtle than has been previously acknowledged. Although a
parallel is often drawn between the Hawthorne effect and the Heisenberg Uncertainty Principle,
our analysis highlights a critical distinction: unlike in quantum mechanics, the Hawthorne effect
is not a guaranteed methodological heuristic. Rather, its presence and magnitude depend heavily
on economic and psychological features of the environment that can only be understood with
further theoretical and empirical modeling.
Was there Really 5
Experimentation at the Hawthorne Plant
The Western Electric Company was the monopoly supplier of telephone equipment to
AT&T in the 1920s. Western’s “Hawthorne Works” factory, located in the suburbs of Chicago,
was the main supplier for this contract. The Hawthorne plant was considered to be one of the
most advanced manufacturing facilities in America at the time, and employed roughly 35,000
people, mainly first- and second-generation immigrants (Gale, 2004). Always open to new
techniques to improve efficiency, officials of Western agreed to collaborate with the National
Research Council’s Committee on Industrial Lighting, which had expressed interest in testing the
impact of improved lighting on productivity. The NRC committee included an impressive
collection of prominent engineers, including Thomas Edison as its honorary chairman.
Western Electric dispatched two engineers, George Pennock and Clarence Stoll to the
Hawthorne plant from 1924-1927 to oversee the experiments in concert with members of the
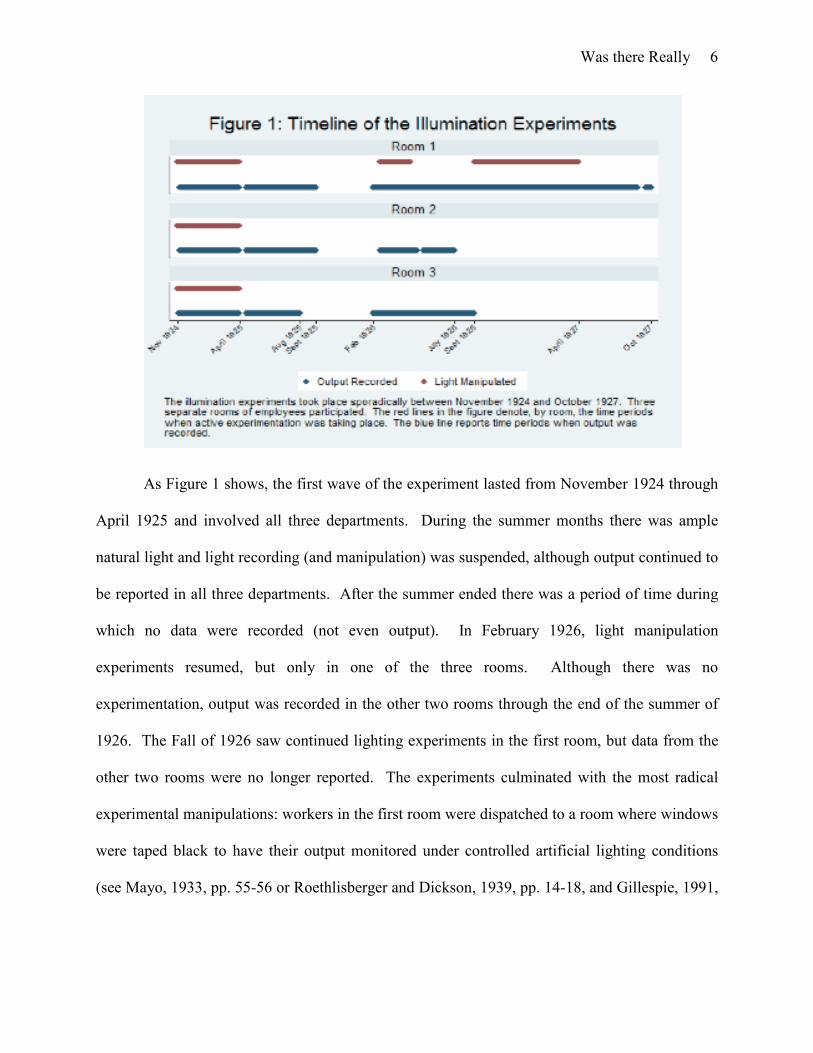
NRC committee (Gale, 2004). These experiments, which are summarized in Figure 1, are known
as the “illumination experiments” because they varied the amount of light in the workplace to
study how such variation influenced productivity. Figure 1 provides a timeline summarizing the
various phases of the illumination experiments, noting for each department the periods during
which light was varied experimentally, as well as the periods when output was recorded.
Workers in these three departments were women who primarily assembled relays and wound
coils of wire, and their output was measured as units completed per unit of time.1
1 A relay was a switching device activated in the telephone exchange as each number was dialed. It took about a
minute’s worth of work to assemble a single relay.
Was there Really 6
As Figure 1 shows, the first wave of the experiment lasted from November 1924 through
April 1925 and involved all three departments. During the summer months there was ample
natural light and light recording (and manipulation) was suspended, although output continued to
be reported in all three departments. After the summer ended there was a period of time during
which no data were recorded (not even output). In February 1926, light manipulation
experiments resumed, but only in one of the three rooms. Although there was no
experimentation, output was recorded in the other two rooms through the end of the summer of
1926. The Fall of 1926 saw continued lighting experiments in the first room, but data from the
other two rooms were no longer reported. The experiments culminated with the most radical
experimental manipulations: workers in the first room were dispatched to a room where windows
were taped black to have their output monitored under controlled artificial lighting conditions
(see Mayo, 1933, pp. 55-56 or Roethlisberger and Dickson, 1939, pp. 14-18, and Gillespie, 1991,
Was there Really 7
for more complete accounts). April 1927 marked the end of the illumination experiments,
although researchers continued to monitor output in the first room through October 1927.
Unfortunately, data from these illumination experiments were never examined and
summarized appropriately, and are broadly believed to have been destroyed. Rice (1982)
laments this fact by noting that “the original [illumination] research data somehow disappeared.”
Gale (2004, p. 439) reinforces this notion by stating that “these particular experiments were
never written up, the original study reports were lost, and the only contemporary account of them
derives from a few paragraphs in a trade journal.”2 Gillespie (1991, pp. 46-47) speculates that
the reason the experiments were not written up was due to the fact that the findings did not
assuage industry: “the final report would have recommended a basic lighting level of 7 to 10
foot candles….(which)….clearly failed to satisfy the electrical industry’s expectations that the
research would provide the scientific justification….for higher levels of illumination.”
Following on the heels of the illumination studies, a series of further experiments were
undertaken. Western Electric brought in academic consultants, most prominently Elton Mayo, in
1928. Experiments were carried out on workers whose jobs were to make relays, split mica, and
assemble telephones. The experiments lasted until June 1932, when the women in the test room
received their notices due to the poor economy.3 The market crash led to one in ten US phones
to be disconnected in 1932, leading to an 80% decrease in Western Electric’s profits.
This second series of experiments provided a wealth of data, summarized in Mayo
(1933). His findings have been interpreted as suggesting that individuals are more productive
when they know that they are being studied. Importantly, together with the illumination studies,
2 The trade journal article to which Gale refers is authored by Snow (1927), and as Gale correctly notes it only
provides a brief description of the experiment. 3 Except the most exceptional worker, Jennie Sirchio, who worked in the office for a few months before being let go
(Gale, 2004).
Was there Really 8
these experiments lead to a new understanding of the workplace as a system that was first and
foremost social, and composed of several interdependent parts. In this manner, both sets of
experiments have served to influence dramatically research in organizational development and
behavior, leadership, human relations, and workplace design. Carey (1967) describes their
influence as follows: “There can be few scientific disciplines or fields of research in which a
single set of studies…has exercised so great an influence.”
A Data Discovery
Even to the most conservative eye the Hawthorne experiments have proved seminal, yet a
prominent piece of the puzzle—data from the illumination experiments—has been unfortunately
missing. While most believed the data had been destroyed, we were able to trace the data to a
microfiche room in a small library in Milwaukee, WI. At this location, however, we only found
records for one of the three departments included in the illumination experiments. Further
inquiry lead us to a second forgotten archive maintained in Boston, which contained the records
for the other two departments involved in the experiments. To our best knowledge, these
illumination data have never previously been coded and statistically examined.4
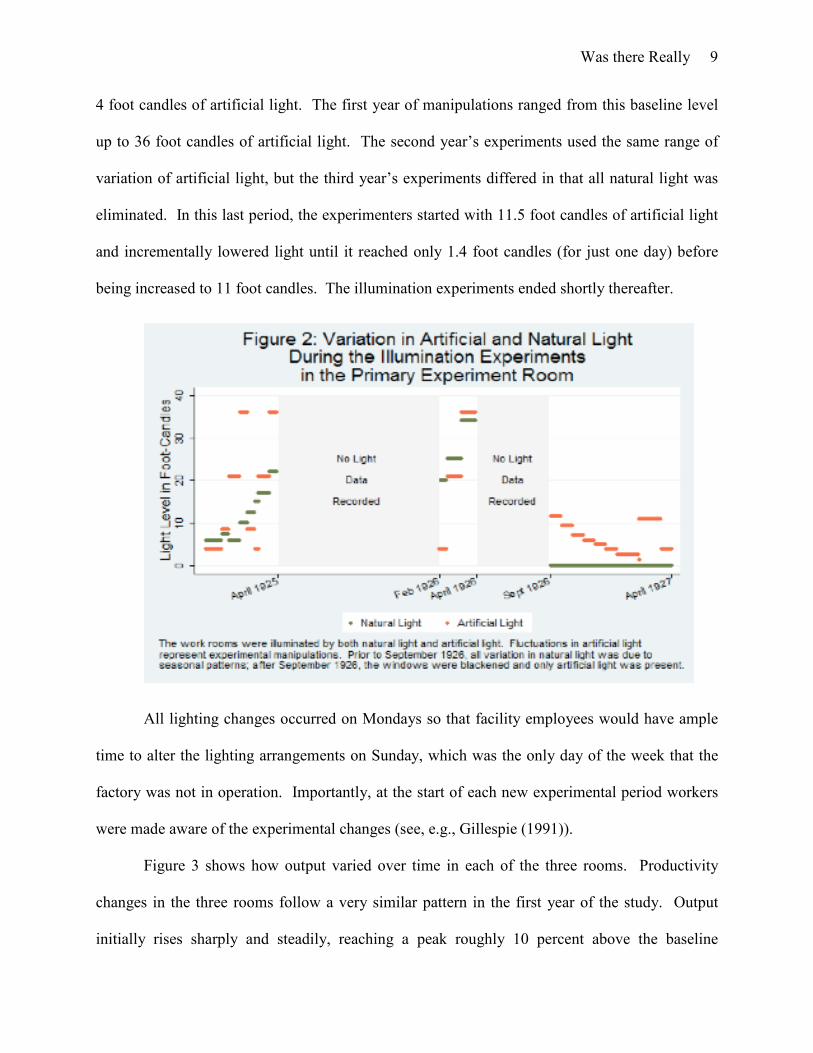
Figure 2 shows how light varied over time in Room 1, where the primary experimental
manipulation of illumination occurred. Figure 2 reports both the average levels of natural and
artificial light over time. Natural light varies with the seasons and is not manipulated by the
experimenters, except at the end of the study when the windows were blackened so there was no
natural light. The original lighting system in place at the beginning of the experiments provided
4 The illumination data were presented graphically. We extracted the information from the graphs and placed it into
spreadsheet form. The raw data and summary statistics for all variables used in this analysis are available from the
authors on request. In addition to the illumination data, we also discovered relay data at the daily level for the first
thirteen periods of the second round of experiments, thus we are able to extend previous research on these data (e.g.,
Jones, 1992) by analyzing for the first time the daily data generated by the second set of experiments. We briefly
discuss these results below.
Was there Really 9
4 foot candles of artificial light. The first year of manipulations ranged from this baseline level
up to 36 foot candles of artificial light. The second year’s experiments used the same range of
variation of artificial light, but the third year’s experiments differed in that all natural light was
eliminated. In this last period, the experimenters started with 11.5 foot candles of artificial light
and incrementally lowered light until it reached only 1.4 foot candles (for just one day) before
being increased to 11 foot candles. The illumination experiments ended shortly thereafter.
All lighting changes occurred on Mondays so that facility employees would have ample
time to alter the lighting arrangements on Sunday, which was the only day of the week that the
factory was not in operation. Importantly, at the start of each new experimental period workers
were made aware of the experimental changes (see, e.g., Gillespie (1991)).
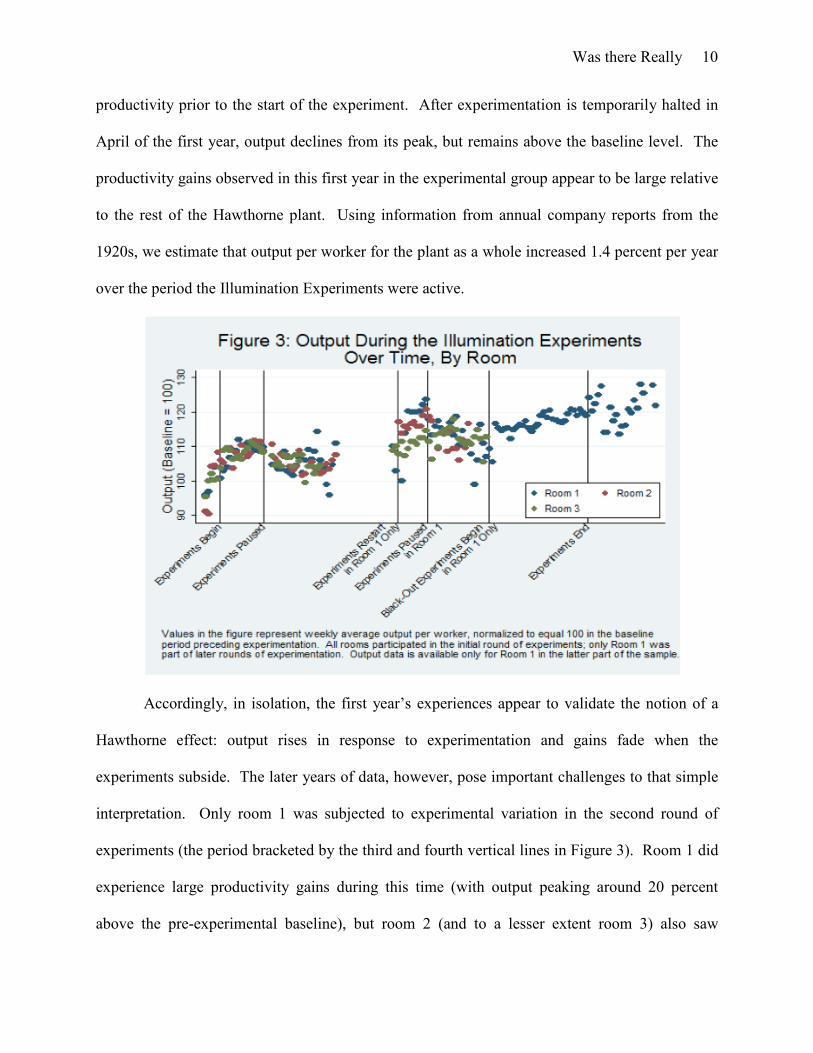
Figure 3 shows how output varied over time in each of the three rooms. Productivity
changes in the three rooms follow a very similar pattern in the first year of the study. Output
initially rises sharply and steadily, reaching a peak roughly 10 percent above the baseline
Was there Really 10
productivity prior to the start of the experiment. After experimentation is temporarily halted in
April of the first year, output declines from its peak, but remains above the baseline level. The
productivity gains observed in this first year in the experimental group appear to be large relative
to the rest of the Hawthorne plant. Using information from annual company reports from the
1920s, we estimate that output per worker for the plant as a whole increased 1.4 percent per year
over the period the Illumination Experiments were active.
Accordingly, in isolation, the first year’s experiences appear to validate the notion of a
Hawthorne effect: output rises in response to experimentation and gains fade when the
experiments subside. The later years of data, however, pose important challenges to that simple
interpretation. Only room 1 was subjected to experimental variation in the second round of
experiments (the period bracketed by the third and fourth vertical lines in Figure 3). Room 1 did
experience large productivity gains during this time (with output peaking around 20 percent
above the pre-experimental baseline), but room 2 (and to a lesser extent room 3) also saw
Was there Really 11
substantial increases in output over this interval of time despite the fact that those workers were
no longer included in the experiment. When experimentation in room 1 was temporarily
suspended for the second time (the period between vertical lines four and five), output in all
three rooms declined, just as it had in the previous summer.
This data pattern suggests that the decline reflects a seasonal regularity (lower summer
productivity), rather than a response to ceasing experimentation. In the final two periods shown
in Figure 3, output was tracked only for room 1, making it difficult to estimate the experimental
impact. Output steadily increased during this last phase of experimentation, rose sharply when
the experiments stopped, fell sharply during the following summer, but then rebounded to all-
time highs towards the end of the sample period when no experimentation was ongoing.
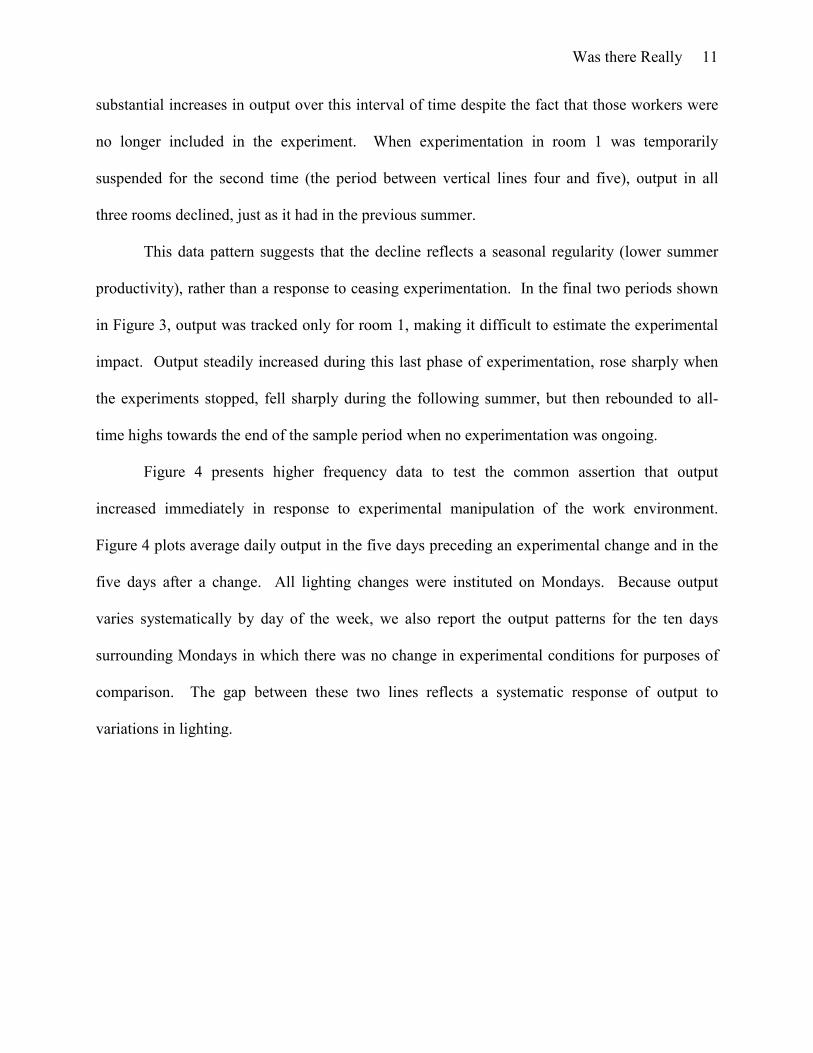
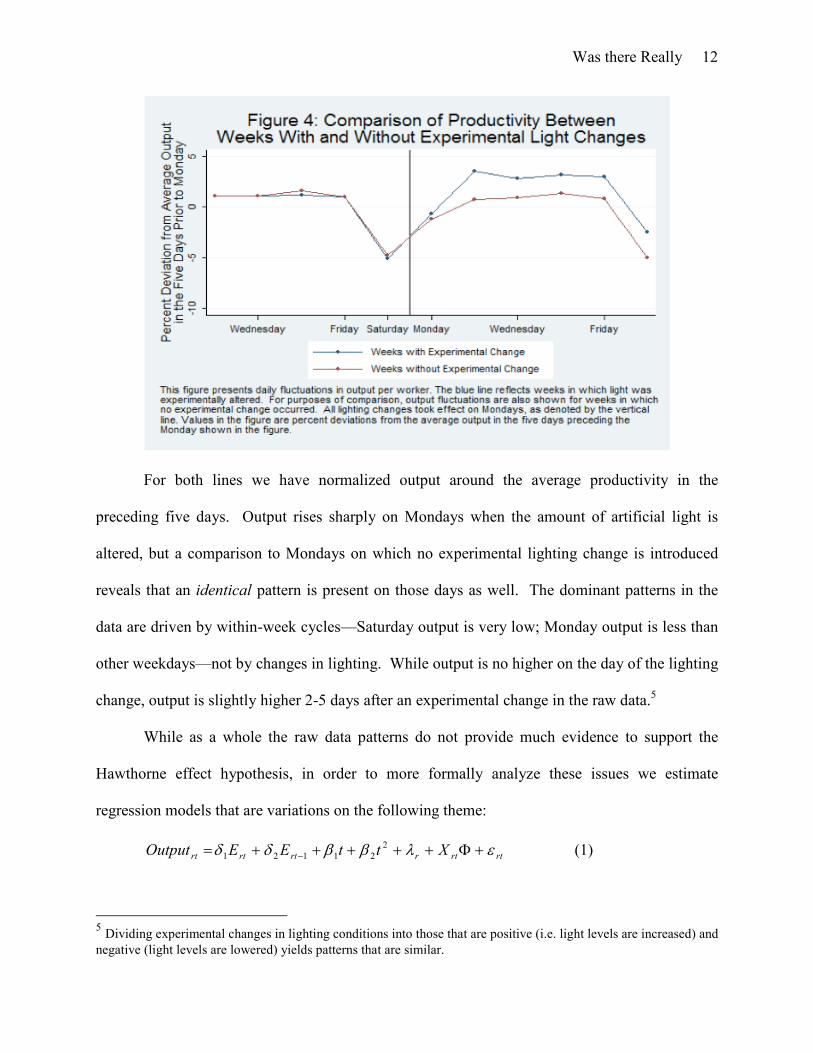
Figure 4 presents higher frequency data to test the common assertion that output
increased immediately in response to experimental manipulation of the work environment.
Figure 4 plots average daily output in the five days preceding an experimental change and in the
five days after a change. All lighting changes were instituted on Mondays. Because output
varies systematically by day of the week, we also report the output patterns for the ten days
surrounding Mondays in which there was no change in experimental conditions for purposes of
comparison. The gap between these two lines reflects a systematic response of output to
variations in lighting.
Was there Really 12
For both lines we have normalized output around the average productivity in the
preceding five days. Output rises sharply on Mondays when the amount of artificial light is
altered, but a comparison to Mondays on which no experimental lighting change is introduced
reveals that an identical pattern is present on those days as well. The dominant patterns in the
data are driven by within-week cycles—Saturday output is very low; Monday output is less than
other weekdays—not by changes in lighting. While output is no higher on the day of the lighting
change, output is slightly higher 2-5 days after an experimental change in the raw data.5
While as a whole the raw data patterns do not provide much evidence to support the
Hawthorne effect hypothesis, in order to more formally analyze these issues we estimate
regression models that are variations on the following theme:
rtrtrrtrtrt XttEEOutput ελββδδ +Φ+++++= −
2
21121 (1)
5 Dividing experimental changes in lighting conditions into those that are positive (i.e. light levels are increased) and
negative (light levels are lowered) yields patterns that are similar.
Was there Really 13
where r and t index a room and time, respectively. E is an indicator variable reflecting whether
there was an experimentally driven change in artificial light on the day in question. We estimate
effects for the day of a change and the following day. We control for both linear and quadratic
trends in output over time, as well as room fixed-effects. X is a vector of controls that includes
weather conditions, indicators for the day of the week and the month, as well as indicators for
days before and after a work-canceling holiday, and days in which the inputs were denoted as
defective. We also include the frequency with which output is checked and whether workers are
located in their original room in the vector of controls. In some specifications we add
room*month*year interactions so that treatment effect identification comes solely from
comparisons of observations in the same room, month, and year.
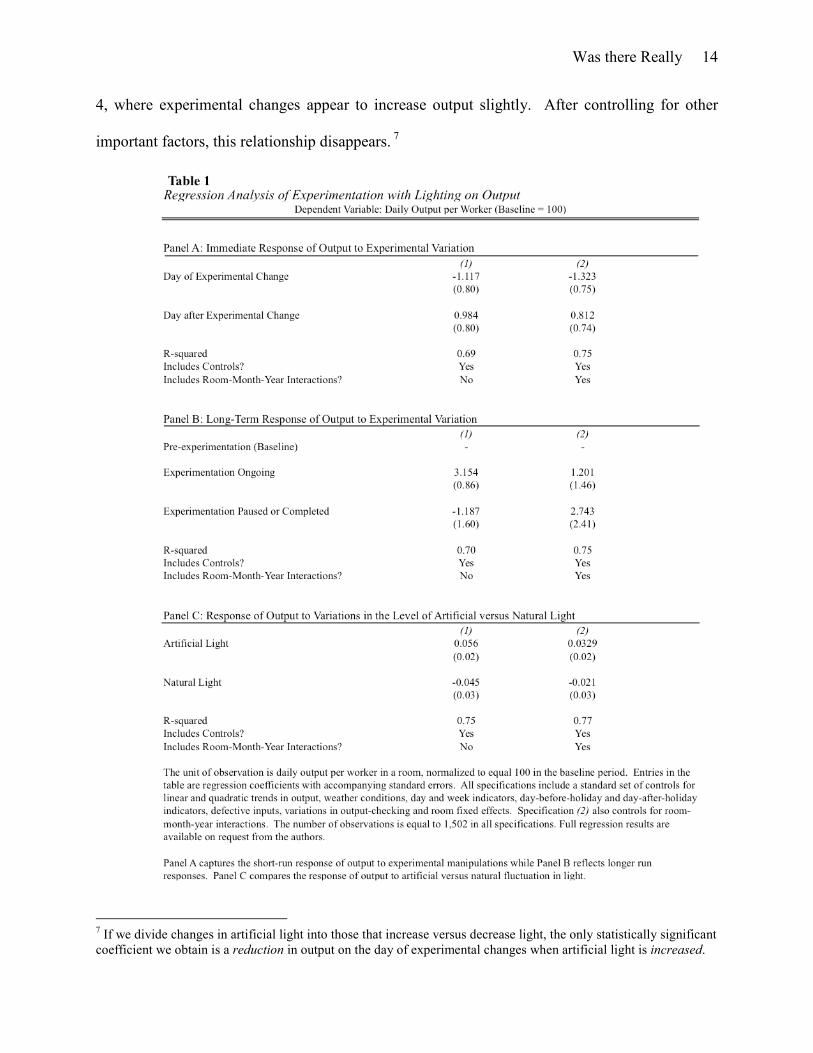
The coefficients of primary interest from the estimation are presented in the top panel of
Table 1. Column 1 include all control variables except the room*month*year interactions, which
are added in column 2.6 Columns 1 and 2 in Panel A contain the results the coefficient
associated with implementing an experimental lighting change on that day. Columns 1 and 2
differ only in that Column 1 excludes month-year interactions as controls, whereas Column 2
includes month-year interactions. In both columns we find statistically insignificant immediate
responses in output to experimental changes in lighting. The point estimate is negative on the
first day light is changed and positive on the following day. The combined impact is negative,
but close to zero. Note that these results differ somewhat from the raw data presented in Figure
6 Estimated coefficients on these control variables are not presented in Table 1 for parsimony, but full results are
available upon request. The trend in output over time is positive, but concave. The estimated coefficients on the
control variables are intuitive, and imply that output responds positively to light, negatively to high temperatures,
and is low after holidays, when the inputs used are defective, and when the workers are moved to a new room.
Was there Really 14
4, where experimental changes appear to increase output slightly. After controlling for other
important factors, this relationship disappears. 7
7 If we divide changes in artificial light into those that increase versus decrease light, the only statistically significant
coefficient we obtain is a reduction in output on the day of experimental changes when artificial light is increased.
Was there Really 15
Panel B of Table 1 takes a different approach to testing for the Hawthorne Effect. Rather
than focusing on immediate changes in output in response to experimental changes, in these
specifications we simply divide all observations into one of three mutually exclusive categories:
the baseline period prior to the start of experimentation, times when active experimentation is
ongoing,8 and times when experimentation has been suspended. We include indicator variables
for the latter two of these classifications; thus the period before experimentation begins is the
omitted category against which the other effects are measured. The same set of controls
employed in Panel A is also included in these regressions. Column 2 adds month-year
interactions, which are omitted from column 1.
Results from the specification in Column 1 are supportive of a Hawthorne effect. When
experimentation is ongoing, output is 3-4 percent higher than in the pre-experimentation
baseline, even after controlling for other factors including linear and quadratic time trends and
the amount of light. The primary source of identification in this specification is between room 1
and the other rooms, since room 1 continued with the experiments after they were stopped in the
other two rooms.
While a Hawthorne effect is one explanation for the results in Column 1, an alternative
story is that output in room 1 was rising for other reasons not controlled for in our data.
Consistent with this alternative, when we include room by month and month by year interactions
in the specification, the result disappears (Column 2 in Panel B). This implies that there is not an
abrupt jump up or down in output associated with turning the experiment on and off (i.e. in
months when experimentation comes to an end, there is no significant difference before and after
8 This variable is equal to one in the first round of experimentation in all three rooms and in the later rounds of
experimenting for room 1 only.
Was there Really 16
the switch). Whether the results in the previous column are due to longer term effects of
experimentation or are spuriously driven by unobservables remains an open question.
The empirical results presented so far do not exploit the information we have on how
total light is composed. One manner in which a Hawthorne effect might manifest itself is with
output being more responsive to changes in artificial light than to fluctuations in natural light.
The logic for this argument is that workers know that the experimenter does not control
fluctuations in natural light which are driven by weather and seasonal changes. Only changes in
artificial light are manipulated, and thus if workers are particularly influenced by experimental
variation, they should be more responsive to artificial light. In addition, changes in artificial
light were brought to the attention of the workers on the morning of the new treatment, whereas
weather driven changes in natural light were not reported to the workers. As such, one might
even expect to see productivity rise in response to experimentally induced reductions in man-
made light if the Hawthorne effect is stronger than any direct impact of reduced light on the
production process.
Panel C in Table 1 presents results that test this new Hawthorne hypothesis. Empirical
specifications in Panel C report results for all observations where data are available on the
amount of artificial and natural light.9 In Panel C, we follow the previous panels by including
our standard set of controls and Column 2 adds month-year interactions. In both Columns 1 and
2, artificial light enters positively (in one case statistically significant but not in the other)
whereas natural light is negative and insignificant in both columns. The actual magnitude of the
impact of fluctuations in artificial light is not particularly large, however. A one-standard
9 When we do not separate natural and artificial light, but rather combine the two to obtain total light, each foot-
candle of additional light is associated with a statistically significant, but relatively small, increase of 0.0865 units of
output. Thus, a one standard deviation increase in light raises output by 1-2 percent. Yet, adding month by year
interactions yields a coefficient that is statistically insignificant and trivial in magnitude.
Was there Really 17
deviation change in artificial light increases output by less than one percent. While clearly
circumstantial, this pattern is directionally consistent with a Hawthorne Effect because the
increase in output in response to artificial light is greater than for natural light.10
Epilogue
The Hawthorne Plant studies, and the concept of a Hawthorne effect that emerged from
this seminal research, stand among the most influential social science research of the 20th
century. The purported influence of observation on measured treatment effects in these
experiments has lead to a proliferation of research and methodologies to control for the
confounding influence that scrutiny can have (e.g., Cook 1962; Harrison and List 2004). Outside
of the academy, results from the Hawthorne studies spawned the human relations movement,
considerably influenced employee/employer relations, and remain an important influence on the
optimal incentive schemes employed in the workplace.
This study returns to the very evidence that induced this contemporary wave of thought
by examining new data that was presumed lost. Ironically, there is little evidence of the type of
Hawthorne effect widely attributed to these data when one subjects them to careful analysis. We
propose and test a new manifestation of the Hawthorne effect: whether workers differentially
respond to natural and man-made light. We find some weak evidence that workers respond more
acutely to the experimental manipulations than to naturally occurring fluctuations in light. This
coupled with the fact that there is some evidence that output was higher during times of
experimentation represent our strongest evidence of a Hawthorne effect in the original
Hawthorne illumination studies.
10 As noted earlier, we also discovered data at the daily level in the library archives for the first thirteen periods of
the second round of experiments. The results obtained are in the spirit of Jones (1992), and consistent with our
analysis of the illumination data: we find little support for the Hawthorne effect when the data are properly
interpreted. We find, however, that a naïve misreading of the data might lead someone to falsely conclude that a
Hawthorne effect is present.
Was there Really 18
References
Blalock, A.B. & Blalock Jr., H.M. (1982). Introduction to social research. Englewood Cliffs,
N.J.: Prentice-Hall.
Bloombaum, M. (1983). The Hawthorne experiments: a critique and reanalysis of the first
statistical interpretation by Franke and Kaul. Sociological Perspectives, January,
26(1), 71-88.
Carey, A. (1967). The Hawthorne studies: a radical criticism. American Sociological Review,
June, 32(3), 403-416
Cook, D.L. (1962). The Hawthorne effect in education research. Phi Delta Kappan, 44, 116-122.
Freedman, J.L., Sears, D.O., & Carlsmith, J. M. (1981). Social psychology, 4th ed. Englewood
Cliffs, N.J.: Prentice-Hall.
Gale, E.A.M. (2004). The Hawthorne studies – a fable for our times? Quarterly Journal of
Medicine, July, 97(7), 439-449.
Gillespie, R. 1991. Manufacturing knowledge: a history of the Hawthorne experiments. New
York: Cambridge University Press.
Harrison, G.W. & List, J.A. (2004). Field experiments. Journal of Economic Literature,
December, 42(4), 1009-55.
Hart, C.W.M. (1943): The Hawthorne experiments. The Canadian Journal of Economics
and Political Science, May, 9(2), 150-163
Jones, S.R.G. (1992). Was there a Hawthorne effect? The American Journal of Sociology,
November, 98(3), 451-468.
Mayo, E. (1933). The human problems of an industrial civilization. New York: The Macmillan
Company.
Was there Really 19
Peters, T.J. & Waterman, R.H. (1982). In search of excellence: lessons from America’s best-run
companies. New York: Harper & Row.
Rice, B. (1982). The Hawthorne effect: persistence of a flawed theory. Psychology Today, 16,
71-74.
Roethlisberger, F.J. & W.J. Dickson (1939). Management and the worker. Cambridge, Mass:
Harvard University Press.
Snow, C.E. (1927). Research on industrial illumination. The Tech Engineering News, November,
257-282 (intermittingly).