(wash) and health water, sanitation, hygiene qualitative ... · qualitative methods for water,...
TRANSCRIPT
©2015 The Water Institute
Slide 1
Qualitative Methods for Water, Sanitation, Hygiene
(WaSH) and Health
Vidya Venkataramanan
©2015 The Water Institute
Slide 2
Objectives
• Understand the purpose of qualitative research methods
• Compare qualitative and quantitative methods
• Understand the strengths and limitations of qualitative methods
• Learn about the basic data collection methods of qualitative research
This module introduces qualitative research methods, which can be used for monitoring and evaluating WaSH programs. • By the end of this module, you should be able to describe:
• The purpose of qualitative research methods • The kinds of questions and contexts when qualitative methods are appropriate • The differences (and similarities) between quantitative and qualitative methods • The strengths and limitations of qualitative methods • The types of methods available, and how to gather data • The basic approach to analyzing your data and presenting your findings

©2015 The Water Institute
Slide 3
WHAT IS QUALITATIVE RESEARCH?

©2015 The Water Institute
Slide 4
First, a few questions…
What kind of study would you design to research these questions?
• How do communities cope with lack of access to clean water?• How do communities perceive the importance of sanitation?• Why do water systems fail? • Why do community WaSH committees not meet regularly?• Why don’t people pay their water bills?• Why do hygiene behavior change approaches work well in some
communities but not in others?• How do different stakeholders perceive the strengths and
weaknesses of a particular WaSH project?
Let’s start with a few research questions one might be interested in asking when monitoring or evaluating a WaSH project. Think about how you would answer these questions using quantitative methods, such as household surveys. You would need to know all the potential responses a respondent might give so you can develop categories in advance for your survey. You will probably have to add an “Other” option. However, many responses that end up as “Other” may tell critical parts of the story that you weren’t able to capture.
©2015 The Water Institute
Slide 5
What is qualitative research?
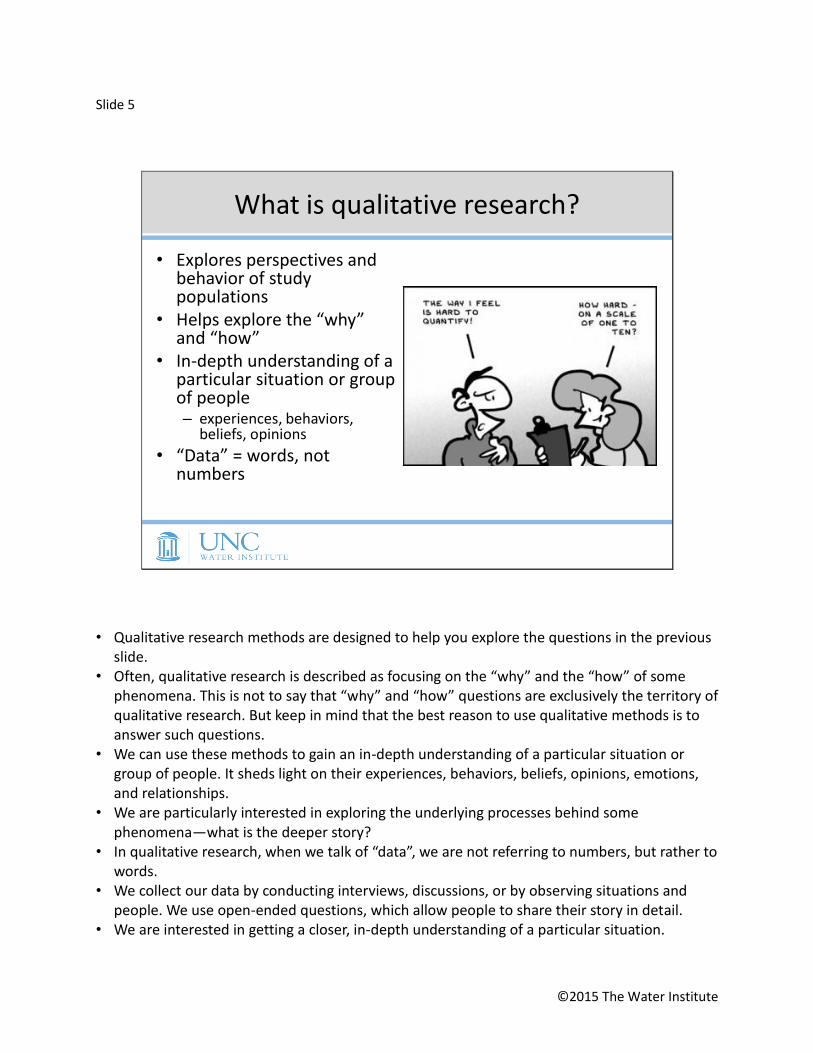
• Explores perspectives and behavior of study populations
• Helps explore the “why” and “how”
• In-depth understanding of a particular situation or group of people– experiences, behaviors,
beliefs, opinions
• “Data” = words, not numbers
• Qualitative research methods are designed to help you explore the questions in the previous slide.
• Often, qualitative research is described as focusing on the “why” and the “how” of some phenomena. This is not to say that “why” and “how” questions are exclusively the territory of qualitative research. But keep in mind that the best reason to use qualitative methods is to answer such questions.
• We can use these methods to gain an in-depth understanding of a particular situation or group of people. It sheds light on their experiences, behaviors, beliefs, opinions, emotions, and relationships.
• We are particularly interested in exploring the underlying processes behind some phenomena—what is the deeper story?
• In qualitative research, when we talk of “data”, we are not referring to numbers, but rather to words.
• We collect our data by conducting interviews, discussions, or by observing situations and people. We use open-ended questions, which allow people to share their story in detail.
• We are interested in getting a closer, in-depth understanding of a particular situation.

©2015 The Water Institute
Slide 6
Quantitative vs. Qualitative Methods
Criteria Quantitative Methods Qualitative Methods
PurposeTest hypothesis, look at cause & effect, make predictions
Understand social interactions incommunity, or individual motivations
Sample size Large and random sample Smaller and purposive sample
Data Collection
Numbers, categories Words, images, or objects
Data Analysis
Identify statistical relationships Identify patterns, features, themes
One way to explain qualitative methods is to compare it to quantitative methods. The next two slides review the main differences between these two methods. Purpose: • Quantitative methods: you are testing hypotheses, looking at cause and effect.
• You implemented a project. Did it work? • You may also want to make predictions using inferential statistics.
• Qualitative methods: you want to understand or interpret situations, social interactions, or individual motivations.
Sample size: • Quantitative methods: you want a larger group, and you want them sampled randomly, so
that you can use this to make inferences using statistics about the larger population. • Qualitative methods: the sample you study is generally smaller. You don't randomly select
them. You select them purposively because you have a specific reason for wanting to talk to them and you want them to able to describe the experiences in detail. You care more about depth rather than breadth.
©2015 The Water Institute
Data collection: • Quantitative methods: you convert your data to numbers and categories. You are counting. • Qualitative methods: you collect words, images, or objects as data. Data analysis: • Quantitative methods: you use statistics to describe your data, or to predict or infer about
the larger population. • Qualitative methods: you are looking at patterns, features, or themes. We call this thematic
analysis.

©2015 The Water Institute
Slide 7
Quantitative vs. Qualitative Methods
Criteria Quantitative Methods Qualitative Methods
Objectivity vs.Subjectivity
Objectivity is critical Subjectivity is expected
Scientific Method Confirmatory/top-down: test hypothesis with data
Exploratory/bottom–up: generate hypothesis & theory from data
Presentingfindings
Use tables and figures as evidence; generate descriptive statistics, correlations, regressions
Use direct quotes as evidence; narrative report by themes, with rich, contextual descriptions
Quality Measured with validity/reliability tests; depends largely on measurement tools
Measured with credibility, neutrality, consistency, and transferability, depends on skill and rigor of researcher
Objectivity vs. subjectivity: • Quantitative methods: objectivity is critical because any subjectivity you introduce will bias
your findings, and you have to adjust for this. • Qualitative methods: you expect subjectivity. This will be discussed in more detail, but it's
understood that there will be subjectivity because of how because of how much time the researcher spends interviewing the respondent and reading through transcripts when analyzing data.
Scientific method: • Quantitative methods: you have a hypothesis or theory, and you want test and confirm it
using your data. • Qualitative methods: in general, it is more bottom-up in nature. You collect your data, and
you generate your theories or hypothesis based on what you are learning. Presenting findings: • Quantitative methods: you use tables and figures to show evidence of your data. You report
descriptions, averages, ranges. You look at correlations between x and y.
©2015 The Water Institute
• For example, is education level correlated with a community’s ability to end open defecation? Are geographical conditions correlated with availability of water?
• Qualitative methods: you present a narrative report, with rich description of your findings. You organize your report into themes.
• You may not see many tables in a qualitative report. You use direct quotes from people to show evidence of your data.
Quality: • Quantitative methods:
• Validity refers to the accuracy of your results • Reliability refers to the replicability of your results • These depend largely on your measurement tools (surveys). The way they are
designed, the way they are applied, the way the population is sampled, the way the questions are structured, and how interviewers are trained can all be used to measure validity and reliability.
• Qualitative methods: • Qualitative research experts argue that validity and reliability are quantitative
constructs, and cannot be used directly to test the quality of qualitative data. • This is mainly because qualitative research explores perspectives of people, and there
may be countless ways of perceiving the same experience. Depending on when you ask someone a question, you may get different answers, and it is up to the researcher to provide that context when presenting findings.
• Instead, we try to measure quality through credibility, neutrality, consistency, and transferability. We’ll talk about ways to ensure quality throughout this module. The final slide explains these 4 terms and summarizes techniques to show that you have conducted high quality research.
©2015 The Water Institute
Slide 8
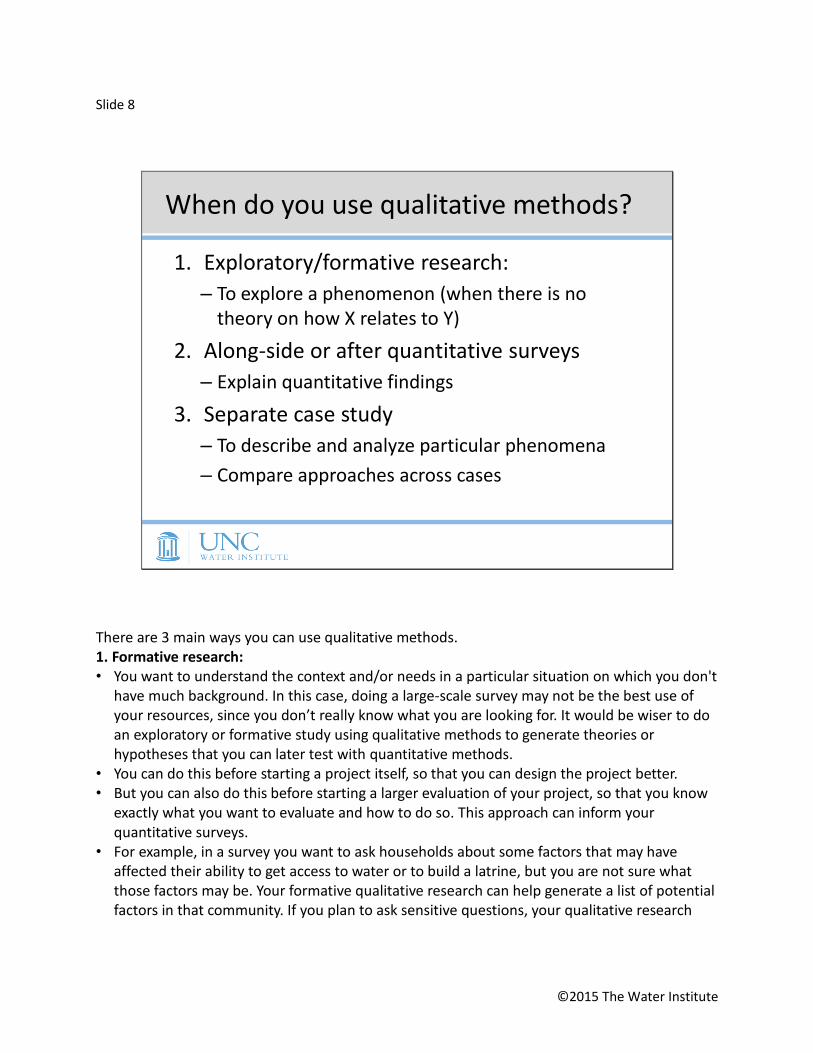
When do you use qualitative methods?
1. Exploratory/formative research:
– To explore a phenomenon (when there is no theory on how X relates to Y)
2. Along-side or after quantitative surveys
– Explain quantitative findings
3. Separate case study
– To describe and analyze particular phenomena
– Compare approaches across cases
There are 3 main ways you can use qualitative methods. 1. Formative research: • You want to understand the context and/or needs in a particular situation on which you don't
have much background. In this case, doing a large-scale survey may not be the best use of your resources, since you don’t really know what you are looking for. It would be wiser to do an exploratory or formative study using qualitative methods to generate theories or hypotheses that you can later test with quantitative methods.
• You can do this before starting a project itself, so that you can design the project better. • But you can also do this before starting a larger evaluation of your project, so that you know
exactly what you want to evaluate and how to do so. This approach can inform your quantitative surveys.
• For example, in a survey you want to ask households about some factors that may have affected their ability to get access to water or to build a latrine, but you are not sure what those factors may be. Your formative qualitative research can help generate a list of potential factors in that community. If you plan to ask sensitive questions, your qualitative research

©2015 The Water Institute
may also shed light on what types of questions will be appropriate and what types will not be appropriate in that context.
Along-side or after quantitative surveys: • You can also use qualitative methods after you have analyzed quantitative surveys. • For example, you find that only 45% of households in your project area continue to use their
latrines 6 months after building them, but you don’t know why. In your survey, you have asked people to choose from, say, 5 reasons. But this is not helping you figure out how to improve outcomes.
• You could follow up with a qualitative study to dig deeper and explore why these problems are occurring, what is the context in which these problems are occurring, and what are people doing to fix them. You can get perspectives of different members of the community to see if targeting particular groups within the community can help you improve latrine use in the entire community.
Stand-alone approach / case study • You can also do a stand-alone qualitative study if you are purely interested in describing a
phenomenon and understanding particular elements of it (i.e. a case study). You can explore strengths and weaknesses, and barriers and enablers. You can also compare your approach in different locations (projects, villages, etc.) to identify which one may work best in a particular context.
• Qualitative methods will help you describe this in a rich and complex way.
©2015 The Water Institute
Slide 9
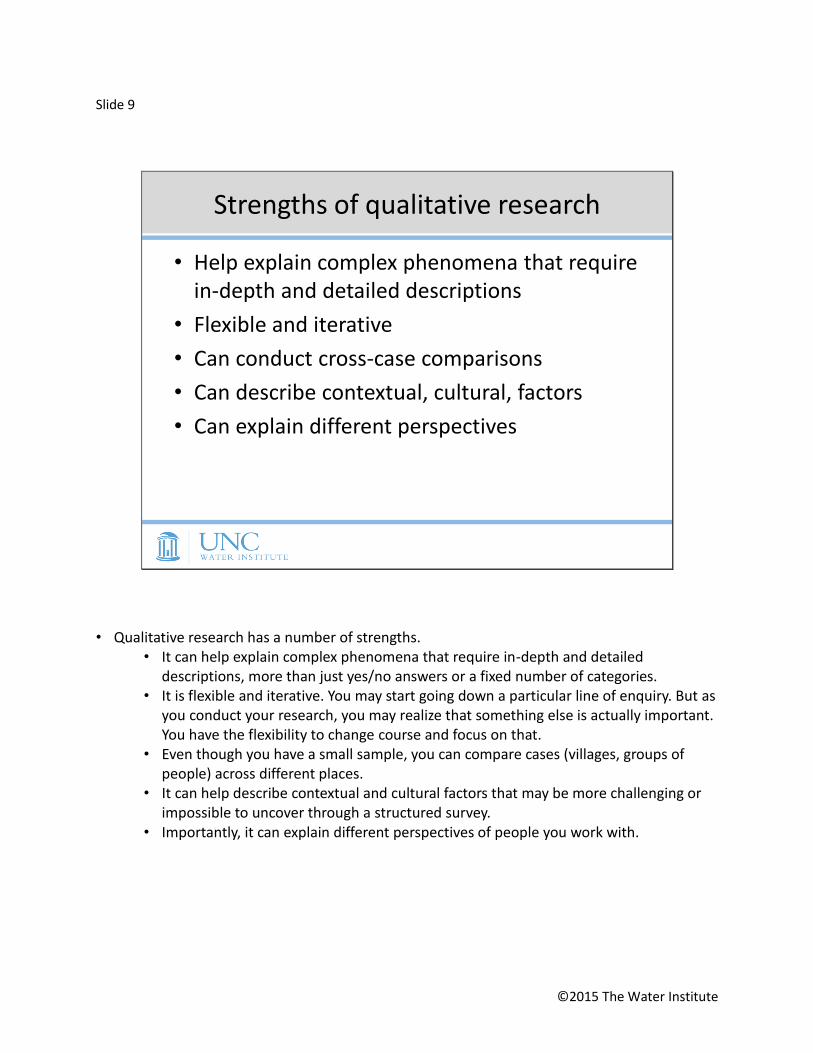
Strengths of qualitative research
• Help explain complex phenomena that require in-depth and detailed descriptions
• Flexible and iterative
• Can conduct cross-case comparisons
• Can describe contextual, cultural, factors
• Can explain different perspectives
• Qualitative research has a number of strengths. • It can help explain complex phenomena that require in-depth and detailed
descriptions, more than just yes/no answers or a fixed number of categories. • It is flexible and iterative. You may start going down a particular line of enquiry. But as
you conduct your research, you may realize that something else is actually important. You have the flexibility to change course and focus on that.
• Even though you have a small sample, you can compare cases (villages, groups of people) across different places.
• It can help describe contextual and cultural factors that may be more challenging or impossible to uncover through a structured survey.
• Importantly, it can explain different perspectives of people you work with.
©2015 The Water Institute
Slide 10
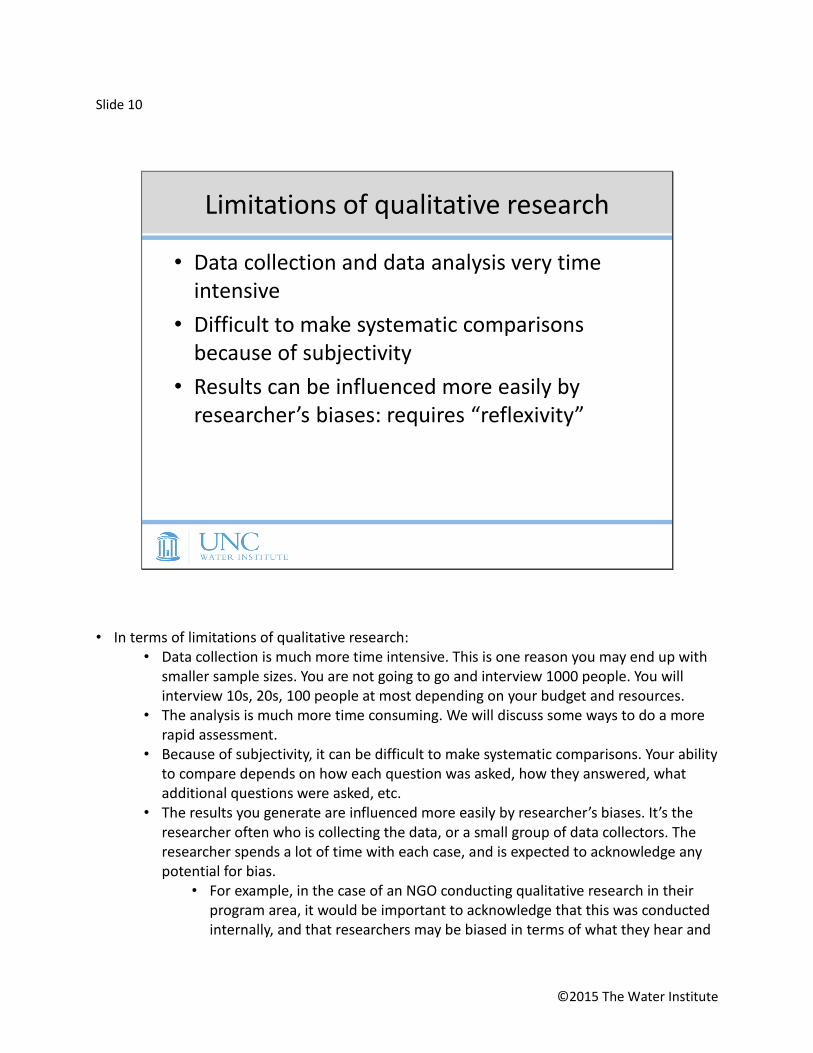
Limitations of qualitative research
• Data collection and data analysis very time intensive
• Difficult to make systematic comparisons because of subjectivity
• Results can be influenced more easily by researcher’s biases: requires “reflexivity”
• In terms of limitations of qualitative research: • Data collection is much more time intensive. This is one reason you may end up with
smaller sample sizes. You are not going to go and interview 1000 people. You will interview 10s, 20s, 100 people at most depending on your budget and resources.
• The analysis is much more time consuming. We will discuss some ways to do a more rapid assessment.
• Because of subjectivity, it can be difficult to make systematic comparisons. Your ability to compare depends on how each question was asked, how they answered, what additional questions were asked, etc.
• The results you generate are influenced more easily by researcher’s biases. It’s the researcher often who is collecting the data, or a small group of data collectors. The researcher spends a lot of time with each case, and is expected to acknowledge any potential for bias.
• For example, in the case of an NGO conducting qualitative research in their program area, it would be important to acknowledge that this was conducted internally, and that researchers may be biased in terms of what they hear and

©2015 The Water Institute
analyze. They have a vested interest in the process. In qualitative research, when the researcher describes this in their findings, it is called “reflexivity.”

©2015 The Water Institute
Slide 11
Limitations of qualitative research
• More difficult to generalize findings to a broader population
• Quality depends on skills of researcher/data collector; cannot “validate” studies in a quantitative manner
– Some agreed upon techniques exist to ensure quality
• In terms of limitations of qualitative research: • It is more difficult to generalize findings to a broader population (that is also not the
aim of qualitative research). • You have small sample sizes and you are not randomly sampling people. • You may be able to generalize certain aspects of your findings, but be cautious
about how far you can take this generalization. • The quality of your research depends more heavily on the skills of researcher and
data collector, as there are fewer hard and fast rules on how to analyze and present your data.
©2015 The Water Institute
Slide 12
QUALITATIVE METHODS
©2015 The Water Institute
Slide 13
Qualitative methods and tools
Methods
• Observation– Structured / unstructured
– Direct / indirect
• Focus group discussions (FGD)
• In-depth interviews (IDI)– Structured
– Semi-Structured
– Unstructured
Tools
• Checklists
• Field notes
• Interview guides
• Focus group guides
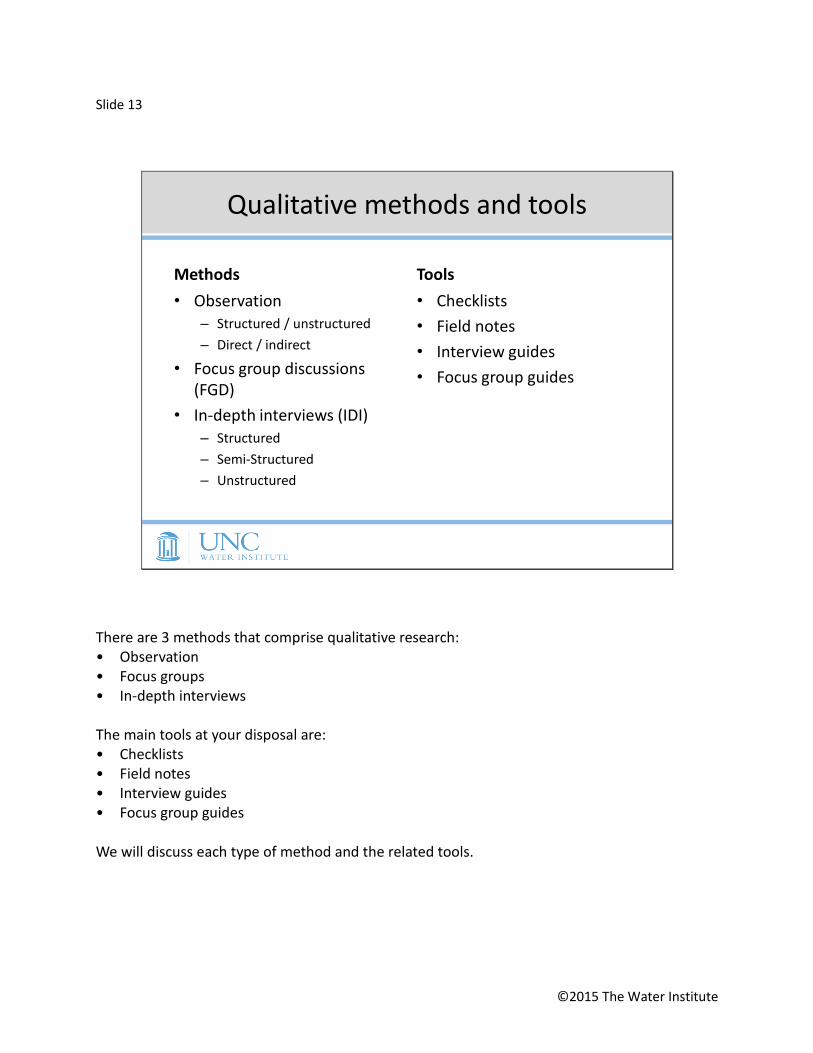
There are 3 methods that comprise qualitative research: • Observation • Focus groups • In-depth interviews The main tools at your disposal are: • Checklists • Field notes • Interview guides • Focus group guides We will discuss each type of method and the related tools.

©2015 The Water Institute
Slide 14
Sampling in qualitative research
• Define your sampling frame
• Purposive sampling: snowball, quota, convenience sampling
Source: Health Services Research Methods: http://www.hsrmethods.org/Glossary/Terms/S/Snowball%20Sampling.aspx
• First, a note on sampling. • You need to define whose perspectives you want to learn about. This will determine whether
you try to speak to a wide range of people, or a specific group of people. • In qualitative research, we use what is called purposive/purposeful sampling. This is where
you select the most appropriate people for your study; those who are most knowledgeable on your topic of interest.
• Random sampling is not encouraged because the idea is to learn about the experiences of a specific set of people. If you want to learn men’s perceptions about latrine use and decide to randomly sample households in a village during the day, you may find that all the men are in the fields. Or if you want to interview community leaders, you may not have enough in a village to randomly sample them.
• A common way to purposively sample a population is to use snowball sampling. This is where you identify a few participants who are appropriate to study, and they help you identify other participants. The key limitation as you may have noticed already, is that it may limit you to people who are all part of the same network. To avoid this, you can start with more key

©2015 The Water Institute
informants at the first stage, who can lead you to more diverse participants within your category of interest.
• A convenience sample is the most commonly used in rapid evaluations in the WaSH sector. As the name suggests, this where you select those who are conveniently available when you visit the location. Be careful in how freely you use this method, as it can affect the validity of your results.
©2015 The Water Institute
Slide 15
1. Observation
• Structured observation: – Checklists common in WASH M&E
– Examples:• Observe school children’s handwashing behavior
• Observe cleanliness and hygiene of latrine
• Walk with people to water source to measure distance, time, and weight of containers
• Unstructured participant observation:– ethnographic method using detailed field notes
– Example: observe community hand pump at different times of day
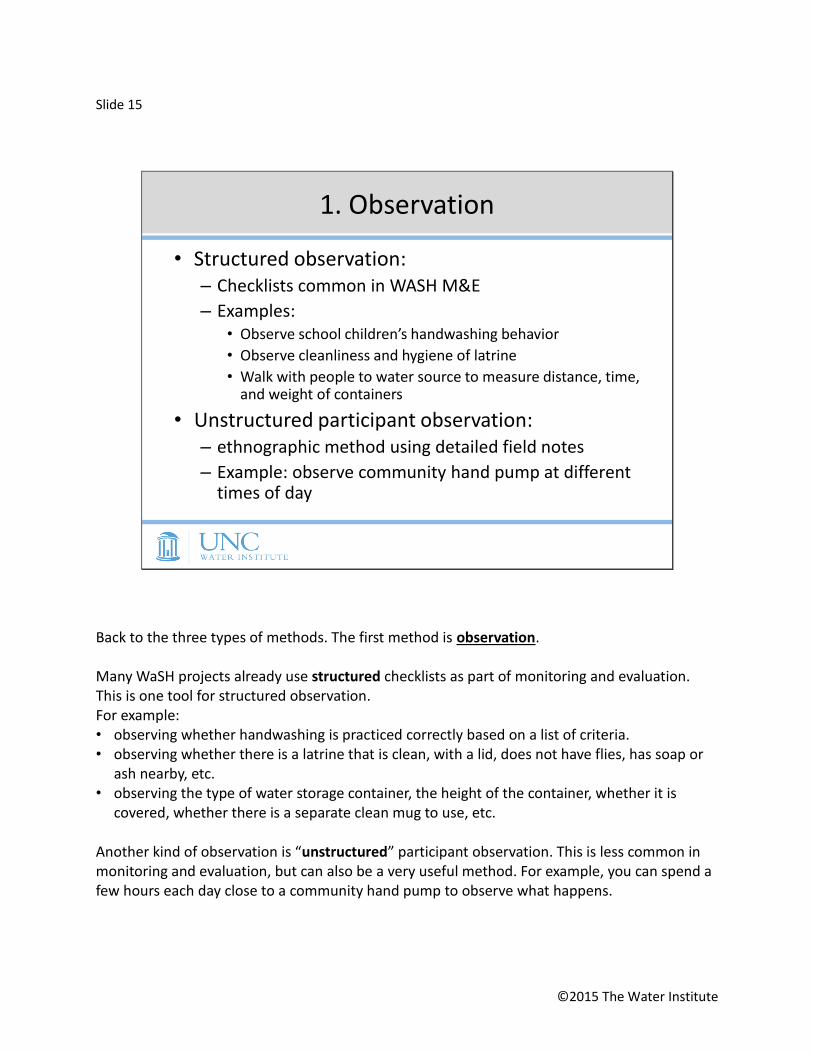
Back to the three types of methods. The first method is observation. Many WaSH projects already use structured checklists as part of monitoring and evaluation. This is one tool for structured observation. For example: • observing whether handwashing is practiced correctly based on a list of criteria. • observing whether there is a latrine that is clean, with a lid, does not have flies, has soap or
ash nearby, etc. • observing the type of water storage container, the height of the container, whether it is
covered, whether there is a separate clean mug to use, etc. Another kind of observation is “unstructured” participant observation. This is less common in monitoring and evaluation, but can also be a very useful method. For example, you can spend a few hours each day close to a community hand pump to observe what happens.

©2015 The Water Institute
• You would take detailed notes on everything you observe: time, place, number and type of people, details of what happens at the site, sights, sounds, smells, personal reflections, conversations and questions.
• This can shed light on behaviors and patterns. You may notice that only a certain age group or gender comes to this hand pump, or that it differs at certain times of day. You may notice that this is always a group activity. You may notice that people multitask when coming to fetch water. Such observations, when combined with other M&E tools at your disposal, may help you better design or modify your intervention to be more useful to the beneficiaries.
©2015 The Water Institute
Slide 16
2. Focus Group Discussions (FGDs)
• Conduct FGDs when you want to understand:
– issues of a broader concern to a group
– group behavior regarding a specific topic
– cultural dynamics in a community
• Useful for formative research
• The second method commonly used in evaluations are focus group discussions. • We will introduce:
• When it is appropriate to use them • How to conduct them • Strengths and limitations
• We use focus groups to understand group behavior, cultural dynamics, or issues that are of a broader concern to a group, not necessarily just an individual.
• These are particularly useful in formative research, when you want to understand specific aspects of the group or community before designing surveys.

©2015 The Water Institute
Slide 17
2. Focus Group Discussions (FGDs)
• 1-2 hour meetings with a specific group of people
• No more than 4-8 participants
• Topic should be focused -- too broad loses value
• Data collection team: 1-2 notetakers + experienced moderator (ideal)
• FGD guide: 5-10 open-ended questions with probes/prompts
• FGDs are closed meetings with a specific group of people. You want to understand their perspectives as a group on a water and sanitation. It’s also useful if you want to study the interaction and dynamics between the group members.
• Examples: Women between 18-30 years. High school children. Farmers. Masons. WaSH user committees. Village heads.
• You don’t want more than 4-8 participants in a focus group. • More than that is unmanageable and reduces the value of the interaction.
• The topic should be focused. • If it is very broad, it can take hours and hours to conduct, and not give you the value
you desire. • The data collection team should consist of 1-2 note takers, and an experienced moderator
who can manage the crowd, get people to speak one at a time, and get people to share their opinions in detail.
• Use a focus group guide with 5-10 open-ended questions. • The questions should have probes, or prompts, so that the moderator can ask for
more detail

©2015 The Water Institute
Slide 18
2. Focus Group Discussions (FGDs)
• Strengths: – Quick way to understand perspectives of many people
in one shot
– Can save time and money compared to individual interviews
• Limitations– Hard to organize
– Hard to control and manage the group
– Participants may feel pressure to agree with dominant view
– Harder to analyze than individual interviews
The strengths of a focus group are that it enables you to get the perspectives of many people at the same time. • You do not need to conduct individual interviews one at a time, and then find patterns
between them. • You can bring all participants into a meeting and immediately identify those similarities. • It's a quick way to understand perspectives, and can save you time and money compared to
individual interviews. However, focus groups are very difficult to do well. • It is hard to identify the right group of people to conduct a successful FGD. You need to have
a very good moderator who can set the ground rules and have a cooperative group. • The moderator has to make sure that everyone in the group is willing to share their opinions. • It is possible that some opinions may get drowned out because of the majority view point. • It is also more challenging to analyze focus groups because of so many perspectives.

©2015 The Water Institute
Slide 19
3. In-depth interviews (IDIs)
• Conduct IDIs when you want to understand:
– individual perspectives
– Get rich and complex detail about a topic
UnstructuredSemi-
structuredStructured
• IDIs are arguably the most common method in qualitative research. • These are used to understand individual perspectives. • They can be unstructured, structured, or semi-structured. Unstructured interviews: understand someone’s life history Structured interviews: always ask questions in the same way and in the same order.
Open-ended questionnaire Semi-structured interviews: most common
Interview guide with ~10 open-ended questions Acceptable to modify or skip questions
• Unstructured IDIs are relatively rare in water and sanitation, especially in evaluations. • These are mostly used in anthropology and sociology, where you want to understand
someone’s life story, without a structure to your interview. • Structured interviews are on the other end of the spectrum.
©2015 The Water Institute
• You ask open-ended questions, but you want the interviewer to always ask questions in the same way and in the same order.
• This may be a practical way to conduct IDIs in an evaluation when you have a large data collection team who are all doing interviews separately. In that case, you may want to ensure consistency in how questions are asked.
• The third and most common way is the semi-structured interview. • You use an interview guide that may have ~10 open-ended questions you are
interested in asking, with probes and prompts throughout. • The questions are there to guide you through the interview. • It is called semi-structured because you do not have to ask the questions exactly the
same way and you are not constrained to asking exactly these questions. • It is perfectly acceptable to modify or skip questions depending on the interview.
©2015 The Water Institute
Slide 20
3. In-depth interviews (IDIs)
• Ideally individual interviews
• 30 minutes to 2 hours
• Use open-ended questions, with prompts/probes
• In general, IDIs are ideally conducted individually because you want the perspectives of one person.
• They tend to range between 30 minutes to 2 hours. • All of the following interview types use open-ended questions, with prompts/probes

©2015 The Water Institute
Slide 21
3. In-depth interviews (IDIs)
• Strengths: – Learn great detail about one person's experience.– “Key informants” can shed light on community/group's
perspectives, but in more detail than FGD.– Can help discover other aspects of your research/evaluation
question without necessarily expecting it.
• Limitations– Time consuming– Depend on respondent’s ability to communicate well on one
occasion– If large data collection team, hard to ensure consistency in semi-
structured interviews– Need to conduct sufficient number of interviews to be confident
that interviews represent views of community and not only individual.
Strengths: • You can learn great detail about one person's experience. • If they know a lot about their community or a topic, we refer to them as “key informants”
• They can shed light on the community or group's perspectives as well, but give you more detail than an FGD may give.
• Semi-structured IDIs allow you to discover other aspects of your research/evaluation question without necessarily expecting it.
• For example, you may be interested in knowing how people have paid for latrines in the past. In a survey, you may ask “Has any other organization provided free or subsidized latrines in your community?” or “Who paid for your latrine?” Through IDIs, you may discover that the more important point here is that people are using microcredit schemes or donations to build latrines. You may learn that youth groups are coming together to build latrines. You may also discover that some people are fined for not using latrines. These won't emerge from a few survey questions.
Limitations:
©2015 The Water Institute
• IDIs are very time consuming because they are done at the individual level • They depend on a respondent’s ability to speak and communicate thoughts comfortably on
that one occasion. • In large data collection teams, it is hard to ensure consistency in the way that semi-structured
interviews are conducted. • You have to do a sufficient number of interviews in a community to be able to be confident
that the common threads across interviews represent the views of the community rather than the individual.
©2015 The Water Institute
Slide 22
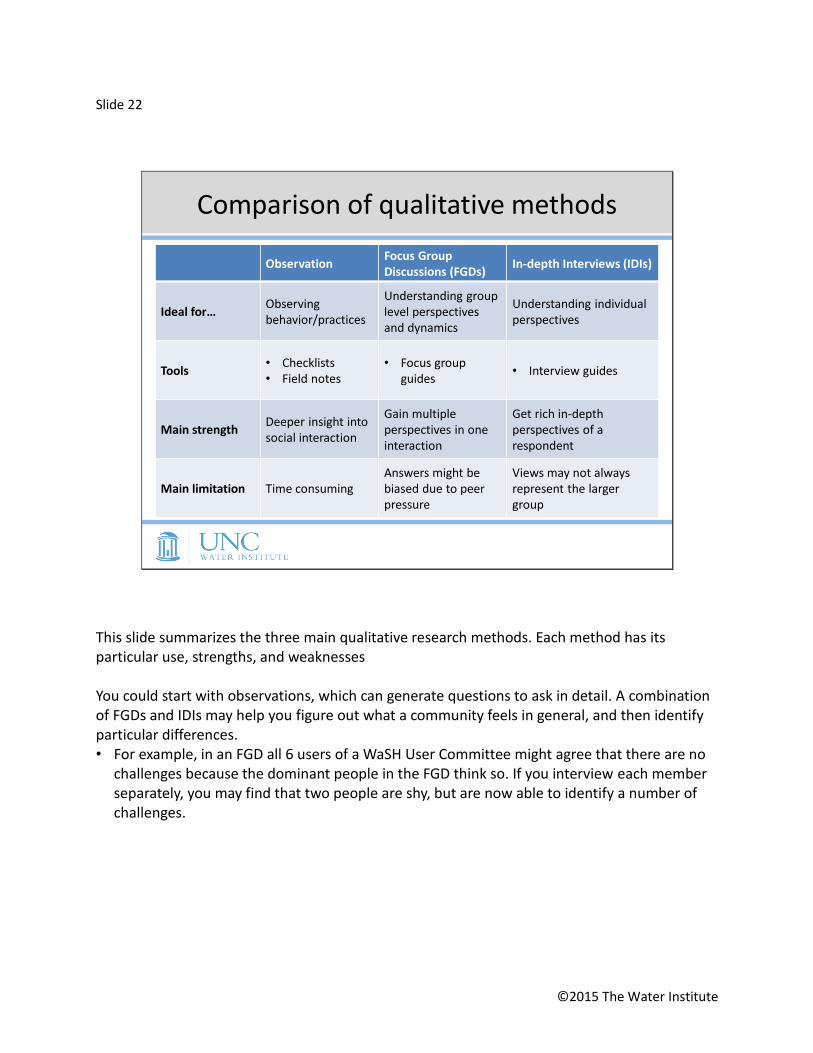
Comparison of qualitative methods
ObservationFocus GroupDiscussions (FGDs)
In-depth Interviews (IDIs)
Ideal for…Observing behavior/practices
Understanding group level perspectives and dynamics
Understanding individual perspectives
Tools• Checklists• Field notes
• Focus group guides
• Interview guides
Main strengthDeeper insight into social interaction
Gain multiple perspectives in one interaction
Get rich in-depth perspectives of a respondent
Main limitation Time consumingAnswers might be biased due to peer pressure
Views may not always represent the larger group
This slide summarizes the three main qualitative research methods. Each method has its particular use, strengths, and weaknesses You could start with observations, which can generate questions to ask in detail. A combination of FGDs and IDIs may help you figure out what a community feels in general, and then identify particular differences. • For example, in an FGD all 6 users of a WaSH User Committee might agree that there are no
challenges because the dominant people in the FGD think so. If you interview each member separately, you may find that two people are shy, but are now able to identify a number of challenges.
©2015 The Water Institute
Slide 23
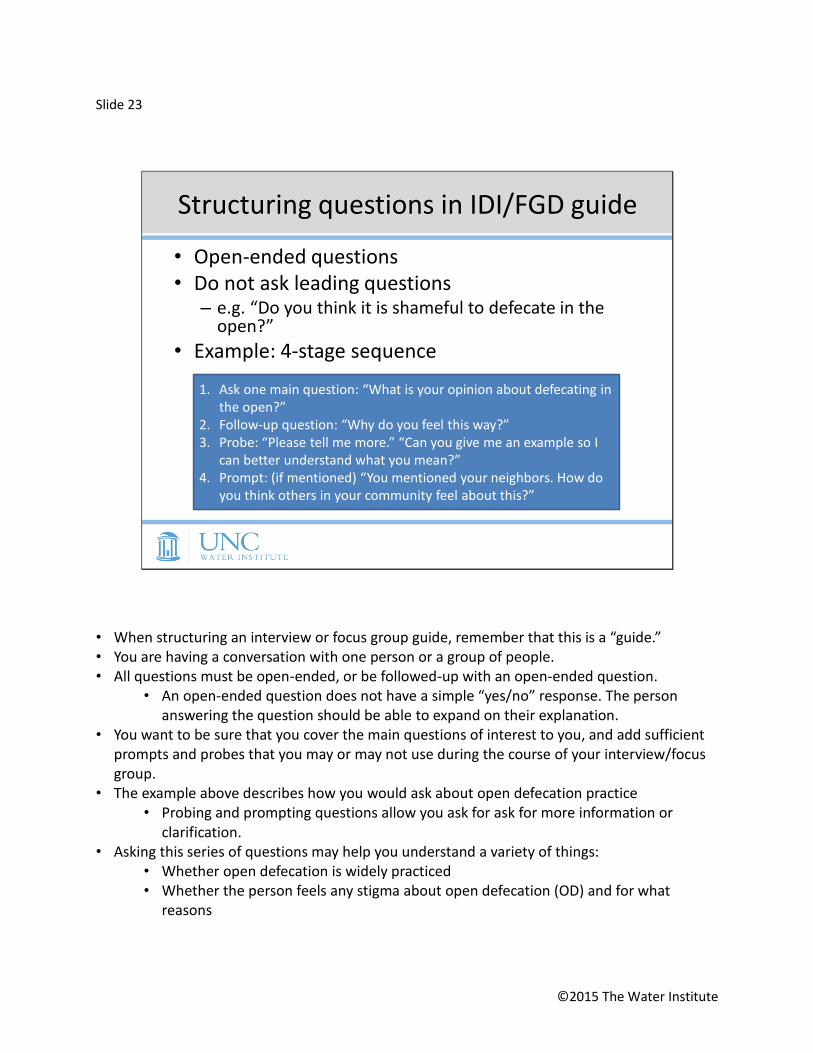
Structuring questions in IDI/FGD guide
• Open-ended questions• Do not ask leading questions
– e.g. “Do you think it is shameful to defecate in the open?”
• Example: 4-stage sequence
1. Ask one main question: “What is your opinion about defecating in the open?”
2. Follow-up question: “Why do you feel this way?”3. Probe: “Please tell me more.” “Can you give me an example so I
can better understand what you mean?”4. Prompt: (if mentioned) “You mentioned your neighbors. How do
you think others in your community feel about this?”
• When structuring an interview or focus group guide, remember that this is a “guide.” • You are having a conversation with one person or a group of people. • All questions must be open-ended, or be followed-up with an open-ended question.
• An open-ended question does not have a simple “yes/no” response. The person answering the question should be able to expand on their explanation.
• You want to be sure that you cover the main questions of interest to you, and add sufficient prompts and probes that you may or may not use during the course of your interview/focus group.
• The example above describes how you would ask about open defecation practice • Probing and prompting questions allow you ask for ask for more information or
clarification. • Asking this series of questions may help you understand a variety of things:
• Whether open defecation is widely practiced • Whether the person feels any stigma about open defecation (OD) and for what
reasons

©2015 The Water Institute
• Maybe there is no stigma and there is instead a preference for OD, which is why people don’t want to use latrines.
• Whether there is a societal stigma for open defecation? • Maybe there is strong societal stigma, but the person you’re interviewing
doesn’t feel any shame about OD, so they are an outlier in the community.
©2015 The Water Institute
Slide 24
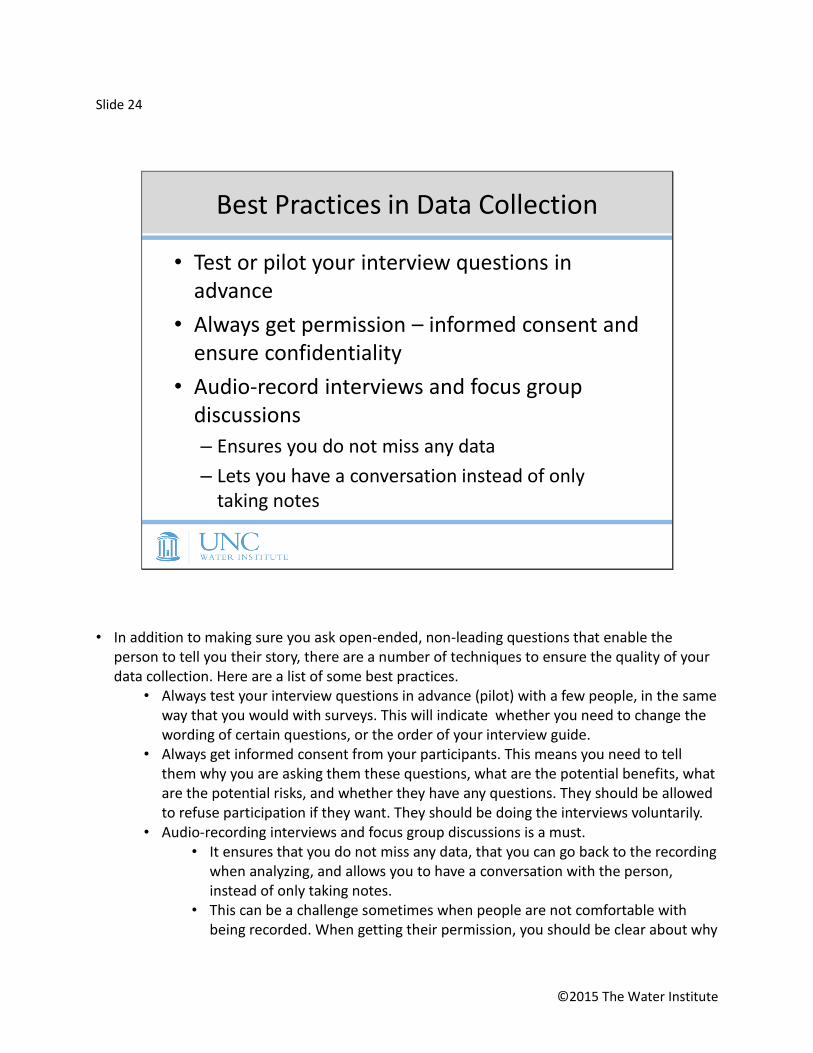
Best Practices in Data Collection
• Test or pilot your interview questions in advance
• Always get permission – informed consent and ensure confidentiality
• Audio-record interviews and focus group discussions
– Ensures you do not miss any data
– Lets you have a conversation instead of only taking notes
• In addition to making sure you ask open-ended, non-leading questions that enable the person to tell you their story, there are a number of techniques to ensure the quality of your data collection. Here are a list of some best practices.
• Always test your interview questions in advance (pilot) with a few people, in the same way that you would with surveys. This will indicate whether you need to change the wording of certain questions, or the order of your interview guide.
• Always get informed consent from your participants. This means you need to tell them why you are asking them these questions, what are the potential benefits, what are the potential risks, and whether they have any questions. They should be allowed to refuse participation if they want. They should be doing the interviews voluntarily.
• Audio-recording interviews and focus group discussions is a must. • It ensures that you do not miss any data, that you can go back to the recording
when analyzing, and allows you to have a conversation with the person, instead of only taking notes.
• This can be a challenge sometimes when people are not comfortable with being recorded. When getting their permission, you should be clear about why

©2015 The Water Institute
you would like to record them, that no one outside the research team will be able to listen to the recordings, and that they can ask you to turn off the recording at any point.
• For example, it is normal for some respondents, especially in the government, to ask for the recording to be turned off for a few minutes so they can share something “off the record.” You should confirm whether they are okay with you taking notes on this portion of the interview.
• You can still interview a person if they do not want to be recorded. Ask them to speak slowly so that you can take notes. Better yet, have a separate note-taker next to you.
©2015 The Water Institute
Slide 25
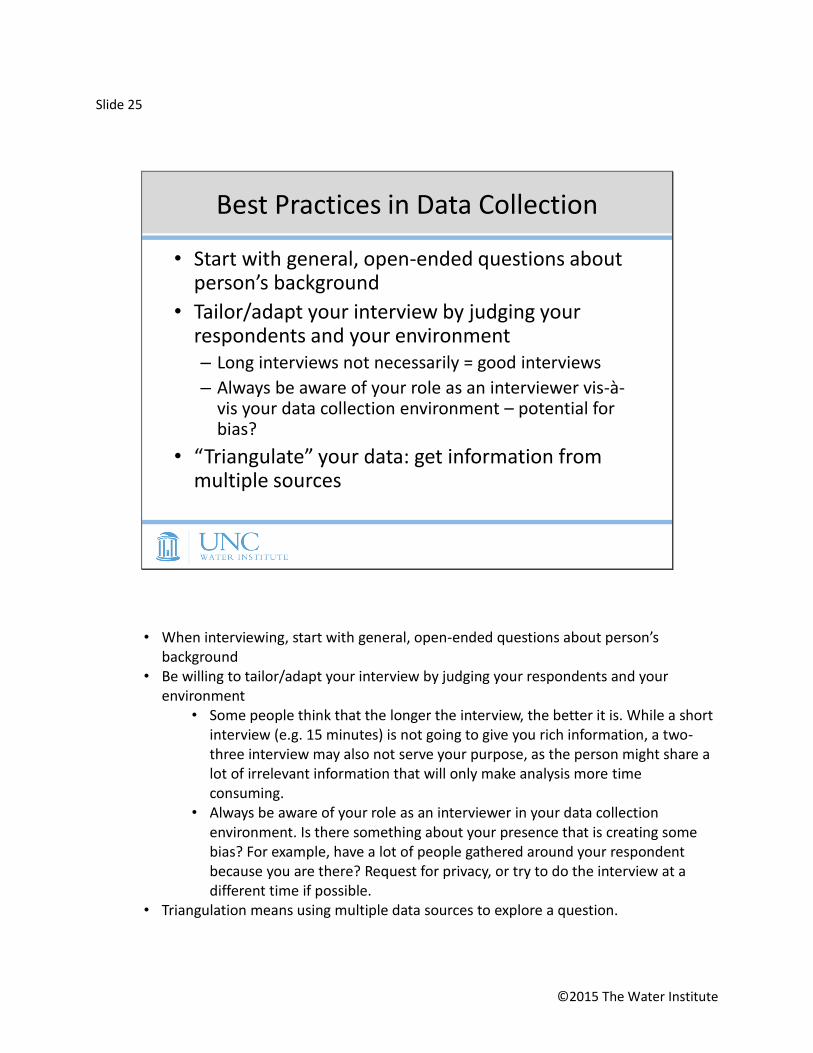
Best Practices in Data Collection
• Start with general, open-ended questions about person’s background
• Tailor/adapt your interview by judging your respondents and your environment– Long interviews not necessarily = good interviews
– Always be aware of your role as an interviewer vis-à-vis your data collection environment – potential for bias?
• “Triangulate” your data: get information from multiple sources
• When interviewing, start with general, open-ended questions about person’s background
• Be willing to tailor/adapt your interview by judging your respondents and your environment
• Some people think that the longer the interview, the better it is. While a short interview (e.g. 15 minutes) is not going to give you rich information, a two-three interview may also not serve your purpose, as the person might share a lot of irrelevant information that will only make analysis more time consuming.
• Always be aware of your role as an interviewer in your data collection environment. Is there something about your presence that is creating some bias? For example, have a lot of people gathered around your respondent because you are there? Request for privacy, or try to do the interview at a different time if possible.
• Triangulation means using multiple data sources to explore a question.

©2015 The Water Institute
• This can mean interviewing different types of stakeholders (project staff, village leaders, regular community members), or
• Using different data types (interviews, focus group discussions, observations, monitoring data)
• This may not necessarily get you a more “valid” response, because people’s opinions may differ!

©2015 The Water Institute
Slide 26
Best Practices in Data Collection
• Summarize and reflect on your interviews at the end of each day
• Always review your notes at the end of each day, and be prepared to modify your process
• Observe when “data reach saturation”
• Summarize and reflect on your interviews at the end of each day • Your notes from this reflection can be part of your data analysis
• Always review your notes at the end of each day, and be prepared to modify your process; this is key to qualitative data collection
• Once you have conducted a number of interviews with a similar group of people, you will start to hear the same thing over and over again. We call this “data reaching saturation”. In qualitative research, you can decide that you have confirmed a certain theme from multiple people and you don’t need to ask any more people that question. You can now skip it and instead focus on questions that are not yet “saturated.”

©2015 The Water Institute
Slide 27
Analysis: Best Practice
• Transcribe recordings
• Review all transcripts closely alongside recordings to ensure accuracy
• Use Computer-Assisted Qualitative Data Analysis Software (CAQDAS) to analyze transcripts and field notes
• Atlas.ti, Nvivo, Dedoose, QDA Miner, etc.
• So now that you have collected all these data, what do you do with them? • As the topic of analysis is very involved, this will just serve as an introduction. • We will review the ideal way to analyze qualitative data and consider practical advice on how
to more rapidly analyze data as part of an evaluation. • Here is the ideal scenario / best practice:
• Record all interviews and focus group discussions. • Transcribe all recordings and review these transcripts alongside recordings to ensure
accuracy. • Use qualitative analysis software to analyze the transcripts and field notes.
• Atlas and NVivo – paid products, expensive • Dedoose - online, pay by use • QDA Miner - free software
©2015 The Water Institute
Slide 28
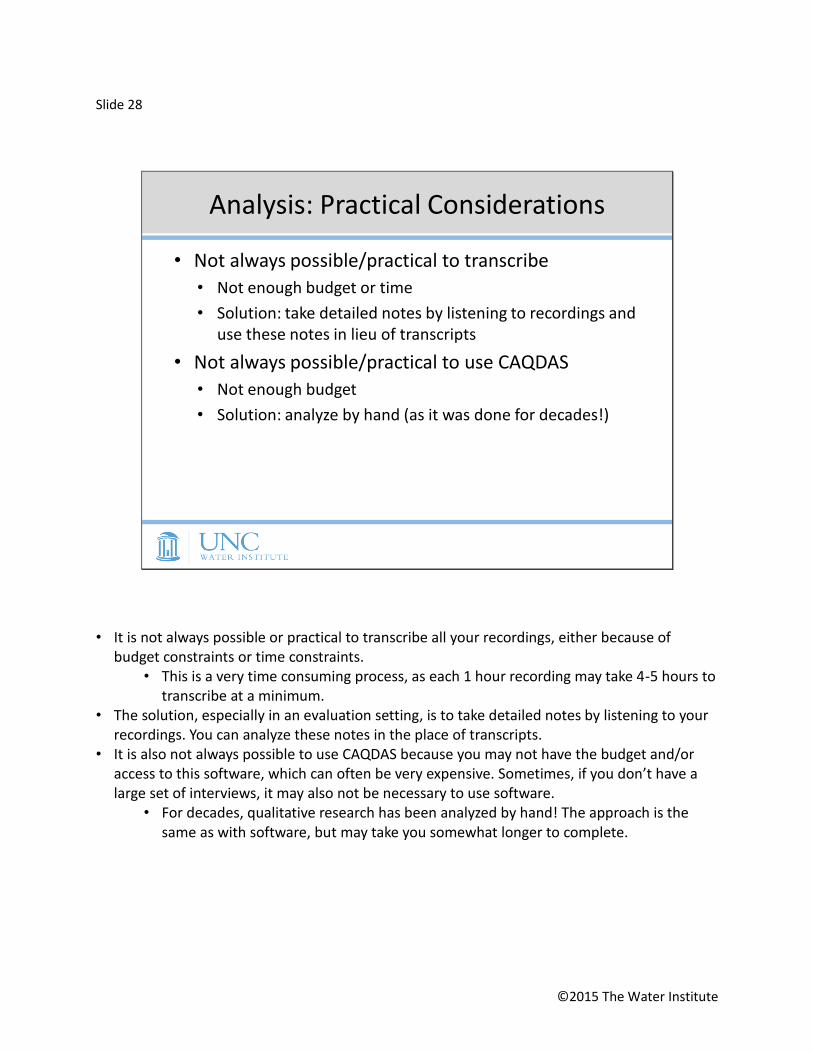
Analysis: Practical Considerations
• Not always possible/practical to transcribe
• Not enough budget or time
• Solution: take detailed notes by listening to recordings and use these notes in lieu of transcripts
• Not always possible/practical to use CAQDAS
• Not enough budget
• Solution: analyze by hand (as it was done for decades!)
• It is not always possible or practical to transcribe all your recordings, either because of budget constraints or time constraints.
• This is a very time consuming process, as each 1 hour recording may take 4-5 hours to transcribe at a minimum.
• The solution, especially in an evaluation setting, is to take detailed notes by listening to your recordings. You can analyze these notes in the place of transcripts.
• It is also not always possible to use CAQDAS because you may not have the budget and/or access to this software, which can often be very expensive. Sometimes, if you don’t have a large set of interviews, it may also not be necessary to use software.
• For decades, qualitative research has been analyzed by hand! The approach is the same as with software, but may take you somewhat longer to complete.

©2015 The Water Institute
Slide 29
Basic approach to analysis
• Look for common threads, emerging themes and patterns in data
• Compare and contrast experiences, perspectives, opinions
• Summarize, “code,” develop matrices
• “Code” data, and re-code and re-code
– Deductive and/or inductive
– Descriptive and analytical
• Look for common threads, emerging themes and patterns in data • The goal is to compare and contrast experiences, perspectives, opinions • We do this by summarizing the main points of the interview, “coding” sentences into
paragraphs, or developing matrices with key information
©2015 The Water Institute
Slide 30
Analysis process
• Read the transcripts or notes over
• Codes: ‘tags’ that describe words, sentences, or paragraphs– Multiple rounds of coding
– Inductive coding: start with a blank slate
– Deductive coding: develop list of codes beforehand using codebook
• Organize codes into sub-categories and look at relationships to identify themes/patterns
• Organize using matrix
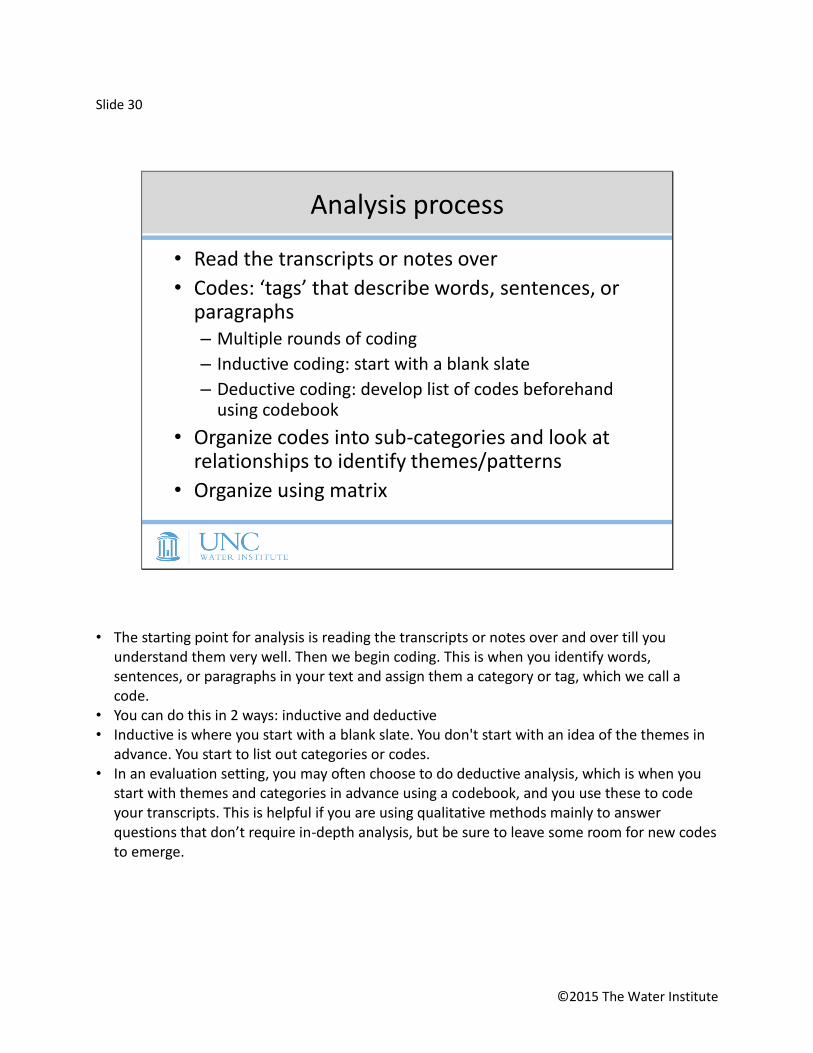
• The starting point for analysis is reading the transcripts or notes over and over till you understand them very well. Then we begin coding. This is when you identify words, sentences, or paragraphs in your text and assign them a category or tag, which we call a code.
• You can do this in 2 ways: inductive and deductive • Inductive is where you start with a blank slate. You don't start with an idea of the themes in
advance. You start to list out categories or codes. • In an evaluation setting, you may often choose to do deductive analysis, which is when you
start with themes and categories in advance using a codebook, and you use these to code your transcripts. This is helpful if you are using qualitative methods mainly to answer questions that don’t require in-depth analysis, but be sure to leave some room for new codes to emerge.
©2015 The Water Institute
Slide 31
Analysis process
• Example quote from transcript:
– “I am unable to afford chlorine tablets to purify my water, but I would really like to use them.”
– Possible codes: "purification" "financial challenge" "desire/demand"
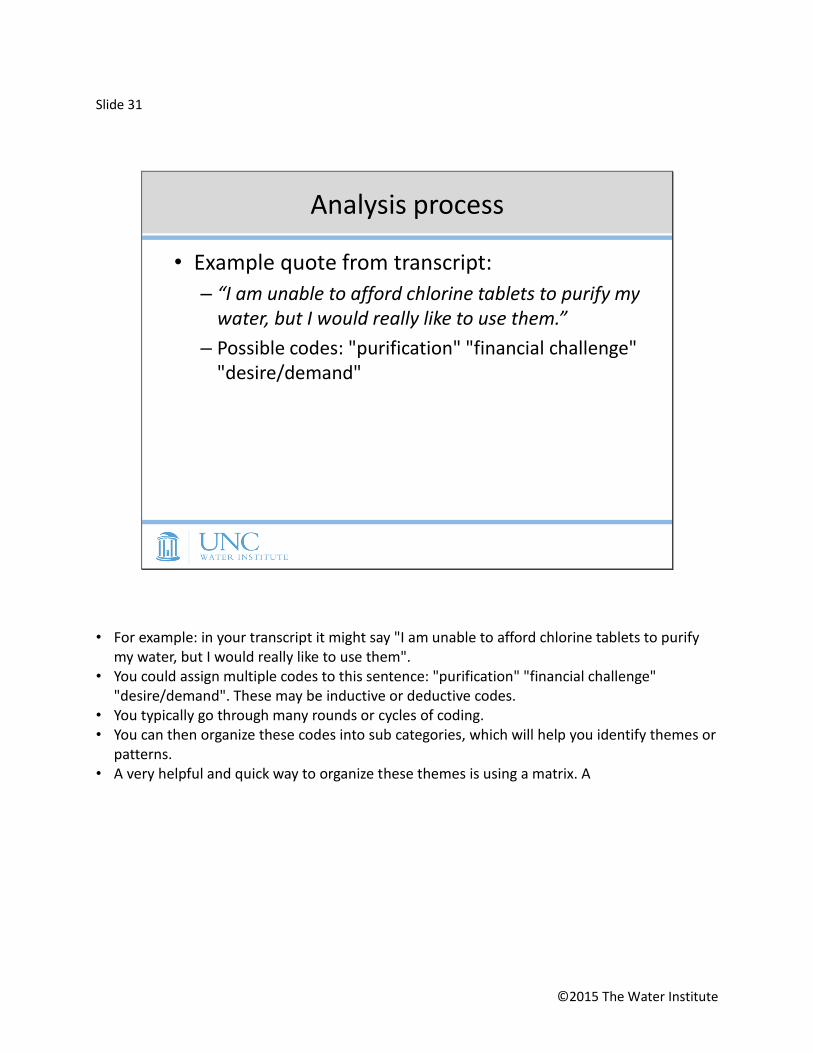
• For example: in your transcript it might say "I am unable to afford chlorine tablets to purify my water, but I would really like to use them".
• You could assign multiple codes to this sentence: "purification" "financial challenge" "desire/demand". These may be inductive or deductive codes.
• You typically go through many rounds or cycles of coding. • You can then organize these codes into sub categories, which will help you identify themes or
patterns. • A very helpful and quick way to organize these themes is using a matrix. A
©2015 The Water Institute
Slide 32
Example of matrix
Themes
Case Background Perspectiveon water source
Latrine use Main Challenges
Interview 1 Village chief Positive Uses own latrine Financial: [quote from interview]
Interview 2 Community leader
Negative Open defecation Logistical: [quote from interview]
Interview 3 Farmer Neutral Sometimes uses neighbor’s latrine; otherwise OD
Financial: [quote from interview]
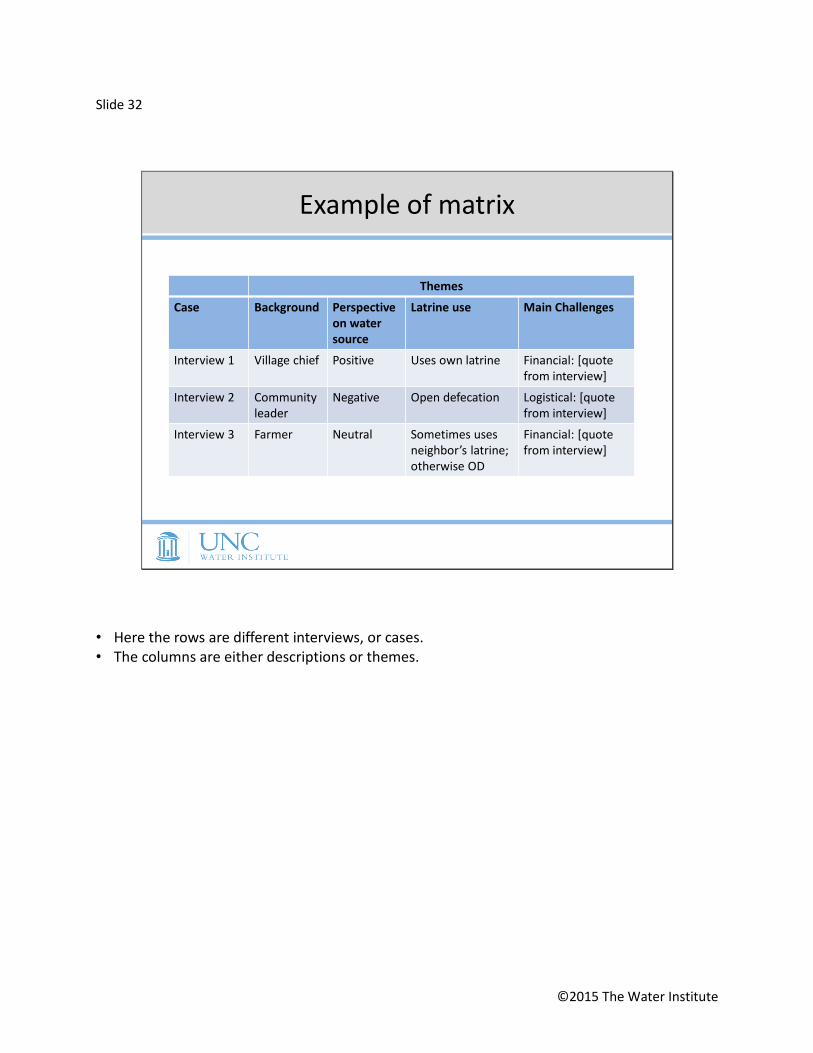
• Here the rows are different interviews, or cases. • The columns are either descriptions or themes.

©2015 The Water Institute
Slide 33
Presenting your findings
• Organize findings by themes– Describe findings – what did people say?
– Interpret – what does this mean?
– Discuss implications– why does this matter?
• Be careful not to conclude or generalize beyond what is possible
• Use direct quotes to illustrate your points
• “Member-checking” can be a useful way to ensure quality– Do your respondents concur with your findings?
– Use caution with this approach if analyzing perspectives
• Ultimately, findings can be presented by the various themes. For example: • Theme 1: Communities do not have a preference for open defecation
• You would describe/summarize what community members said, with a few illustrative quotes.
• You would interpret what this means / why this matters. • You would describe the implications for your project; what should you do
differently and why? • It is good practice to take your findings back to the respondents to see whether they agree
with you. This practice has many names, but is commonly called “member checking.” • This can be a useful way to show that your findings are actually credible • However, you then have to assume that there is “one truth.” If you are analyzing
perspectives of different groups of people, it may not be possible to get everyone to agree with your findings.
• For example, maybe you are doing an external evaluation, and you have asked various stakeholders about their opinion of the NGO implementing the project (including the NGO). Doing a member-checking exercise with the NGO before publishing your report

©2015 The Water Institute
is good practice, but it’s possible that they may not agree with your findings. They may provide you some feedback that makes you rethink some of your analysis, which would be beneficial. But if you have enough evidence to support your analysis, then you would be correct to maintain your findings.

©2015 The Water Institute
Slide 34
Ensuring Quality of Data
Criteria What does this mean? How can we ensure this?
Credibility Confidence in 'truth' of findings
• Spending sufficient time on data collection
• Triangulation• Member checking / debriefing*• Working in a team
Neutrality Extent to which findings are shaped by respondents and not researcher’s bias/ interest
• Triangulation• Reflexivity• External Audit*• Working in a team
ConsistencyYour findings could be repeated (given that conditions/context don’t change)
• External Audit*
Transferability Your findings can be applied to other contexts
• Thick description of findings and context
Adapted from: Lincoln, YS. & Guba, EG. (1985). Naturalistic Inquiry. Newbury Park, CA: Sage Publications.
• Finally, a note on quality of your data collection and analysis. Qualitative research experts argue that “validity” and ‘reliability” cannot be used directly to test the quality of qualitative data.
• e.g. How can you say there is 1 “valid” perspective? • The four terms many qualitative researchers use when talking about quality are credibility,
neutrality, consistency, and transferability. • It is good practice to describe your attempts to fulfill these criteria when presenting your
work. • Credibility refers to confidence in the 'truth' of the findings. • Neutrality refers to the extent to which your findings are shaped by the respondents
and not the researcher’s bias or interest. • Consistency or dependability refers to whether you can show that your findings could
be repeated (given that conditions/context doesn’t change) • Transferability refers to whether you can show that your findings can be applied to
other contexts.

©2015 The Water Institute
• The third columns lists some ways to ensure that you can meet these criteria. In addition to practicing them during the research process, it is common to describe these techniques when you present your findings. That way, a reader or audience member knows that you followed some systematic procedures.
• For example, triangulating data from multiple sources or member-checking your results, whether they tell you the same information or contradictory information, is a strong method that can improve credibility of your findings.
• Reflexivity occurs when the researcher describes their biases and the manner in which they attempted to remove these bias from their analysis.
• An external audit occurs when you ask someone else to review your data and results to evaluate whether your findings are supported by your data.
• * NOTE: that the items that have a star next to them are assuming that there is “one truth.” If
you’re analyzing and presenting perspectives, these techniques may not be a useful way to ensure quality.