washington, d.c. 205492012/01/16 · on january 9, 2012, alcoa inc. held its fourth quarter 2011...
TRANSCRIPT

UNITED STATES SECURITIES AND EXCHANGE COMMISSION
Washington, D.C. 20549
FORM 8-K
CURRENT REPORT
PURSUANT TO SECTION 13 OR 15(d) OF THE SECURITIES EXCHANGE ACT OF 1934
Date of Report (Date of earliest event reported): January 12, 2012 (January 9, 2012)
ALCOA INC. (Exact name of Registrant as specified in its charter)
Office of Investor Relations 212-836-2674 Office of the Secretary 212-836-2732
(Registrant’s telephone number, including area code)
(Former Name or Former Address, if Changed Since Last Report)
Check the appropriate box below if the Form 8-K filing is intended to simultaneously satisfy the filing obligation of the Registrant under any of the following provisions:
Pennsylvania 1-3610 25-0317820(State or Other Jurisdiction
of Incorporation) (CommissionFile Number)
(I.R.S. Employer Identification Number)
390 Park Avenue, New York, New York 10022-4608
(Address of Principal Executive Offices) (Zip Code)
� Written communications pursuant to Rule 425 under the Securities Act (17 CFR 230.425)
� Soliciting material pursuant to Rule 14a-12 under the Exchange Act (17 CFR 240.14a-12)
� Pre-commencement communications pursuant to Rule 14d-2(b) under the Exchange Act (17 CFR 240.14d-2(b))
� Pre-commencement communications pursuant to Rule 13e-4(c) under the Exchange Act (17 CFR 240.13e-4(c))
For
per
sona
l use
onl
y
On January 9, 2012, Alcoa Inc. held its fourth quarter 2011 earnings conference call, broadcast live by webcast. A transcript of the call and a copy of the slides presented during the call are attached hereto as Exhibits 99.1 and 99.2, respectively, and are hereby incorporated by reference.
* * * * *
The information in this Current Report on Form 8-K, including Exhibits 99.1 and 99.2, is being furnished in accordance with the provisions of General Instruction B.2 of Form 8-K.
Forward-Looking Statements Certain statements in this report relate to future events and expectations, and as such constitute forward-looking statements within the meaning of the Private Securities Litigation Reform Act of 1995. Forward-looking statements also include those containing such words as “anticipates,” “estimates,” “expects,” “forecasts,” “intends,” “outlook,” “plans,” “projects,” “should,” “targets,” “will,” or other words of similar meaning. All statements that reflect Alcoa’s expectations, assumptions, or projections about the future other than statements of historical fact are forward-looking statements, including, without limitation, forecasts concerning global demand growth for aluminum, end-market conditions, and growth opportunities for aluminum in automotive, aerospace and other applications, trend projections, targeted financial results or operating performance, and statements about Alcoa’s strategies, outlook, and business and financial prospects. Forward-looking statements are subject to a number of known and unknown risks, uncertainties, and other factors and are not guarantees of future performance. Actual results, performance, or outcomes may differ materially from those expressed in or implied by those forward-looking statements. Important factors that could cause actual results to differ materially from those expressed or implied in the forward-looking statements include: (a) material adverse changes in aluminum industry conditions, including global supply and demand conditions and fluctuations in London Metal Exchange-based prices for primary aluminum, alumina, and other products; and fluctuations in indexed-based and spot prices for alumina; (b) deterioration in global economic and financial market conditions generally; (c) unfavorable changes in the markets served by Alcoa, including automotive and commercial transportation, aerospace, building and construction, distribution, packaging, defense, and industrial gas turbine; (d) the impact of changes in foreign currency exchange rates on costs and results, particularly the Australian dollar, Brazilian real, Canadian dollar, euro, and Norwegian kroner; (e) increases in energy costs, including electricity, natural gas, and fuel oil, or the unavailability or interruption of energy supplies; (f) increases in the costs of other raw materials, including calcined petroleum coke, caustic soda, and liquid pitch; (g) Alcoa’s inability to achieve the level of revenue growth, cash generation, cost savings, improvement in profitability and margins, fiscal discipline, or strengthening of competitiveness and operations (including moving its alumina refining and aluminum smelting businesses down on the industry cost curves and increasing revenues in its Flat-Rolled Products and Engineered Products and Solutions segments) anticipated from its restructuring programs and productivity improvement, cash sustainability, and other initiatives; (h) Alcoa’s inability to realize expected benefits from newly constructed, expanded, or acquired facilities or from international joint ventures as planned and by targeted completion dates, including the joint venture in Saudi Arabia, the upstream operations in Brazil, and the investments in hydropower projects in Brazil; (i) political, economic, and regulatory risks in the countries in which Alcoa operates or sells products, including unfavorable changes in laws and governmental policies, civil unrest, and other events beyond Alcoa’s control; (j) the outcome of contingencies, including legal proceedings, government investigations, and environmental remediation; (k) the business or financial condition of key customers, suppliers, and business partners; (l) adverse changes in tax rates or benefits; (m) adverse changes in discount rates or investment returns on pension
2
Item 2.02. Results of Operations and Financial Condition.
For
per
sona
l use
onl
y

assets; and (n) the other risk factors summarized in Alcoa’s Form 10-K for the year ended December 31, 2010 and other reports filed with the Securities and Exchange Commission. Alcoa disclaims any obligation to update publicly any forward-looking statements, whether in response to new information, future events or otherwise, except as required by applicable law.
The following are furnished as exhibits to this report:
3
Item 9.01. Financial Statements and Exhibits.
(d) Exhibits.
99.1 Transcript of Alcoa Inc. fourth quarter 2011 earnings call.
99.2 Slides presented during Alcoa Inc. fourth quarter 2011 earnings call.
For
per
sona
l use
onl
y

SIGNATURES
Pursuant to the requirements of the Securities Exchange Act of 1934, the Registrant has duly caused this report to be signed on its behalf by the undersigned hereunto duly authorized.
Dated: January 12, 2012
4
ALCOA INC.
By: /s/ GRAEME W. BOTTGER Graeme W. Bottger Vice President and Controller
For
per
sona
l use
onl
y

EXHIBIT INDEX
5
Exhibit No. Description
99.1 Transcript of Alcoa Inc. fourth quarter 2011 earnings call.
99.2 Slides presented during Alcoa Inc. fourth quarter 2011 earnings call.
For
per
sona
l use
onl
y

Exhibit 99.1
THOMSON REUTERS STREETEVENTS
EDITED TRANSCRIPT
AA - Q4 2011 ALCOA INC. EARNINGS CONFERENCE CALL
EVENT DATE/TIME: JANUARY 09, 2012 / 10:00PM GMT
OVERVIEW: AA reported 4Q11 loss from continuing operations of $193m or $0.18 per share.
1
THOMSON REUTERS STREETEVENTS | www.streetevents.com | Contact Us © 2012 Thomson Reuters. All rights reserved. Republication or redistribution of Thomson Reuters content, including by framing or similar means, is prohibited without the prior written consent of Thomson Reuters. ‘Thomson Reuters’ and the Thomson Reuters logo are registered trademarks of Thomson Reuters and its affiliated companies.
For
per
sona
l use
onl
y

JANUARY 09, 2012 / 10:00PM GMT, AA - Q4 2011 Alcoa Inc. Earnings Conference Call CORPORATE PARTICIPANTS Kelly Pasterick Alcoa Inc. - Director, IR
Chuck McLane Alcoa Inc - EVP and CFO
Klaus Kleinfeld Alcoa Inc - Chairman and CEO
CONFERENCE CALL PARTICIPANTS Dave Gagliano Barclays Capital - Analyst
Kuni Chen CRT Capital Group - Analyst
Timna Tanners BofA Merrill Lynch - Analyst
Paretosh Misra Morgan Stanley - Analyst
Sal Tharani Goldman Sachs - Analyst
Brian Yu Citigroup - Analyst
David Lipschitz Credit Agricole Securities - Analyst
PRESENTATION Operator Good day, ladies and gentlemen, and welcome to the fourth quarter 2011 Alcoa Incorporated earnings conference call. My name is Amesia and I will be your operator for today. At this time, all participants are in a listen-only mode. We will conduct a question-and-answer session toward the end of the conference. (Operator Instructions) I would now like to turn the call over to Kelly Pasterick, Director of Investor Relations. Please proceed. Kelly Pasterick - Alcoa Inc. - Director, IR Thank you. Good afternoon, and welcome to Alcoa’s fourth (inaudible) Klaus Kleinfeld, Chairman and CEO and Chuck McLane, Executive Vice President and CFO. After comments by Chuck and Klaus, we will take your questions. Before we begin, I would like to remind you that today’s discussion will contain forward-looking statements related to future events and expectations. You can find factors that could cause the Company’s actual results to differ materially from these projections listed in today’s press release and presentation and in the most recent SEC filings.
In addition, we have included some non-GAAP financial measures in our discussion. Reconciliations to the most directly comparable GAAP financial measures can be found in today’s press release, in the appendix of today’s presentation, and on our website at www.alcoa.com under the “Invest” section. Any reference in our discussion today to EBITDA means adjusted EBITDA for which we have provided calculations and reconciliations in the Appendix. And with that, I’d like to turn this over to Chuck McLane. Chuck McLane - Alcoa Inc - EVP and CFO Thanks, Kelly, and we really appreciate everyone taking the time to join us today. As we start to review the financials, we’ve got several objectives we’d like to accomplish. First of all is a clear understanding of our recent actions along with their associated charges. Next, to provide you with some insight on our operational cash performance in the quarter, and lastly to provide commentary on our 2012 cash sustainability targets. With that being said, let’s turn to the fourth quarter.
Our loss from continuing operations in the quarter was $193 million, or $0.18 per share. Restructuring and other special items totaled negative $159 million, which brings us to a loss of $0.03 per share. In just a second, I’ll detail the restructuring special items for you. A 13% drop in the LME combined with continued European weakness contributed to the decrease in revenues on a sequential basis. On a year-over-year basis, sales increased 6% despite an 11% drop in LME as the aerospace, automotive and commercial transportation markets all showed greater than 20% increases in revenue.
2
THOMSON REUTERS STREETEVENTS | www.streetevents.com | Contact Us © 2012 Thomson Reuters. All rights reserved. Republication or redistribution of Thomson Reuters content, including by framing or similar means, is prohibited without the prior written consent of Thomson Reuters. ‘Thomson Reuters’ and the Thomson Reuters logo are registered trademarks of Thomson Reuters and its affiliated companies.
For
per
sona
l use
onl
y

JANUARY 09, 2012 / 10:00PM GMT, AA - Q4 2011 Alcoa Inc. Earnings Conference Call Free cash flow in the quarter was $656 million, bringing the cash generated this year to $906 million. We achieved the lowest days working capital in our history at 27 days, or three days lower than our previous record set in 2010, roughly equivalent to $200 million in cash. Remember, this is on top of the 13-day improvement achieved in the previous two years. Our debt-to-capital ratio stood at 35%, or flat with the fourth quarter of 2010, despite a 1-percentage-point increase related to pension plan discount rates. During the quarter, we reduced our net debt by $547 million, and liquidity remains strong with cash on hand of $1.9 billion. Lastly, we achieved all of our 2011 cash sustainability targets as we continued to improve liquidity and strengthen our balance sheet.
Now let’s move to the income statement. The loss for the quarter of $0.18 per share was primarily driven by restructuring and other charges which I will detail in the next slide. The COGS and SG&A percent of sales increases were essentially driven by a decline in revenue which was a function of the falling metal prices. Our effective tax rate in the quarter was 31%, or 36% excluding discrete items. This brings our year-to-date operational tax rate to 24%. With increasing uncertainty across our markets, we will continue to experience swings in the rate, as profit drivers with each taxing jurisdiction remain volatile.
For 2012, we expect our ETR run rate to be approximately 27%. Let’s now move on to a review of the special items in the fourth quarter. Restructuring and special items in the fourth quarter totaled an unfavorable $159 million. As announced last week, we’ve taken decisive action to close or curtail 531,000 metric tons of smelting capacity. These closures and curtailments represent $141 million of the total restructuring charges. The remaining restructuring relates to headcount reductions in other businesses and an asset write-off in Australia.
The other special items in the quarter were favorable non-cash mark-to-market adjustments on energy contracts and a gain on the sale of land in Australia. These two were completely offset by discrete tax items associated with legislative actions in various jurisdictions and uninsured losses, primarily due to flooding at our Bloomsburg, Pennsylvania facility. Now let’s move on to the sequential earnings bridge.
The negative net impact of the LME and currency for the quarter was $125 million, driven primarily by a sequential drop in metal prices of 13%. Ongoing productivity improvements across our businesses were insufficient to overcome slowing market conditions and prevailing cost headwinds. However, we were able to maintain our rate of productivity improvements on a sequential basis and capture $221 million of improved productivity compared with the fourth quarter of last year. To get a clearer understanding of these significant movements, let’s move on to the segment bridges and we’ll start off with alumina. While our alumina business is experiencing significant pressure due to falling market prices, our performance actions have more than offset raw material and cost increases. Alumina production increased this quarter by 1% sequentially, achieving a new quarterly production record driven by Point Comfort and Australia.
Market effects for the quarter were almost entirely driven by changes in LME and they lowered profitability by $94 million. Higher index pricing and our focus on productivity drove a $53 million increase in performance. Energy moderated for us during the quarter, while costs have continued to have an increased impact on our costs due to its three- to six-month lag. We are beginning to see a softening in certain regions in the caustic market and as a result expect to see lower prices which will begin to improve results by the second quarter. Lastly, for the fourth quarter, we sold a plot of land in Australia which contributed $30 million. Looking to the first quarter, we anticipate 33% of our third party shipments will be on a spot or alumina index basis. The first quarter is also when we undergo significant maintenance in our Australian operations which will impact the segment results by $20 million. Raw material inflation will continue in the first quarter and as you have come to expect, we will fight for every productivity dollar available.
Let’s now move to the primary segment. In Primary Metals, we continue to experience significant headwinds in our business. Production was flat, third party shipments were up 7% sequentially, and realized pricing was down 12%. Effects of regional premiums on the quarter were muted as the mix of our product sales improved from Q3. However, as we look towards next quarter this will have an increasing impact on our realized price.
We were able to generate $21 million in performance improvements this quarter to partially mitigate the higher cost. Energy and raw materials reduced profitability $36 million, as we experienced a planned outage at our Rockdale energy facility, and we continue to see the impact of rising carbon and alumina prices. We managed our working capital to a record level. We dropped seven days from last quarter and four days from the year-ago quarter. As we look to Q1, we will see the full impact of falling regional premiums as well as a number of seasonal effects on our energy costs.
In raw material prices, we are seeing important signs of improvements in the market. Our announced curtailments, as well as number of other global reductions of supply, have taken regional supply demand balance for calcined coke from short to long. While we do not expect to see a strong impact in the first quarter due to inventory flows, we do believe this will provide relief in the following quarter.
Now let’s move to global rolled products. The story for global rolled products this quarter was volume. Seasonal beverage can volume declined as expected in North America and Russia with volumes down 12% and 23%, respectively. European demand also continued to remain weak in the fourth quarter with a 16% drop from Q3. Aerospace and automotive demand remained stable. This
For
per
sona
l use
onl
y

segment was also negatively impacted by customer credit losses.
We continue to drive productivity improvements across the business and in spite of the lower volumes generated $4 million in savings. This segment had a record quarter in free cash flow, while continuing to invest in growth projects and they were able to reduce their working capital an astounding 10 days sequentially. Solid
3
THOMSON REUTERS STREETEVENTS | www.streetevents.com | Contact Us © 2012 Thomson Reuters. All rights reserved. Republication or redistribution of Thomson Reuters content, including by framing or similar means, is prohibited without the prior written consent of Thomson Reuters. ‘Thomson Reuters’ and the Thomson Reuters logo are registered trademarks of Thomson Reuters and its affiliated companies.
For
per
sona
l use
onl
y

JANUARY 09, 2012 / 10:00PM GMT, AA - Q4 2011 Alcoa Inc. Earnings Conference Call progress was made towards our 2013 $2.5 billion incremental revenue target. In fact, we’ve already achieved 55% of our targeted increase in 2011. Next quarter we expect to see continued demand strength in aerospace and automotive and seasonal increases in packaging. Our outlook in Europe remains soft.
Now let’s turn to Engineered Products and Solutions. While down sequentially, Engineered Products and Solutions delivered another solid quarter. Revenue was slightly down quarter-over-quarter and improved by $140 million compared to the prior year quarter. Profitability declined sequentially, but increased by $9 million compared to the fourth quarter of 2010. Our year-over-year improvement has been driven by management actions to improve our portfolio and better leverage the strengths of our innovative products.
Productivity improvements were slightly offset by cost increases during the quarter, driven by a Cleveland press outage and lower yield in certain businesses. We remain on target towards the 2013 incremental revenue target of $1.6 billion. We achieved 48% of the increase in 2011. Looking ahead, we anticipate incremental improvements in all of our markets, with the exception of commercial transportation in Europe and building and construction in Europe and North America. We also anticipate better quarter-over-quarter productivity gains.
Now let’s move to the cash flow statement. We ended the fourth quarter with exceptional cash results. We generated cash from operations of $1.1 billion, more than a $650 million improvement over last quarter. This improvement was driven by significant reductions in working capital. We currently stand at 27 days, which is 11 days lower on a sequential basis and three days lower than last year. Free cash flow in the quarter was $656 million, bringing the full year to $906 million.
Our debt-to-capital increased to 35%, primarily due to lower discount rates that impacted the remeasurement of our pension plan obligations. With $1.9 billion cash on hand, we moved forward into 2002 [Alcoa Correction:2012] with a strong liquidity position. Now if we could, let’s take a step back, take a look at our businesses on a full year basis. On a quarterly basis, each of our businesses faced challenges ranging from lower realized prices to market weakness and rising costs. However, when you examine the full year results it shows strong performance and in most cases exceeded prior year results. Alumina not only finished the year with higher EBITDA per ton, but also exceeded the historical average of $66 per ton.
The move to alumina index pricing for approximately 20% of third party shipments helped the business achieve year-over-year improvements in the face of difficult market conditions. In Primary Metals, EBITDA per metric ton was lower than prior year as the segment faced cost headwinds and significantly declining prices in the second half. We have reacted to this situation by aggressively acting to shutter uncompetitive plants permanently, and to curtail locations with higher power. The global rolled products business faced challenges in the second half of 2011 due to demand destruction from market weakness in Europe, and expected fourth quarter seasonal declines. However, year-over-year performance has improved on an EBITDA per metric ton basis exceeding both prior year as well as the historical average. It is also important to note that global rolled products achieved 55% of the 2013 revenue growth target in year one.
Engineered Products and Solutions finished the year with an 18% EBITDA margins, our best performance ever. Like global rolled products, Engineered Products also made great strides against their 2013 target, achieving 48% in the first year. Overall, a challenging second half driven by declining prices and rising costs, but our businesses remain focused on driving profitable growth and managing cash. Now let’s turn to the year-over-year bridge. Total cost increases of $1 billion created significant headwinds to our operations.
Whether it was raw material inflation, ramp-up issues, pot relinings or maintenance overhaul we battled the entire year to offset these increases. We did so through actions designed to increase market share, improve pricing, as well as our mix of products, and generate ideas in our operations which led to significant productivity improvements. These actions essentially overcame the higher costs and allowed the net benefit of higher prices and currency to hit the bottom line.
Now let’s move on to the full year cash flow. 2011 was another solid year in terms of generating cash and improving liquidity. Cash from operations was $2.2 billion, which included $336 million in pension contributions. Capital expenditures for the year were roughly $1.3 billion, or $213 million below our target. After generating $1.2 billion of free cash flow in 2010, we generated another $906 million in 2011. The formula for success continues to be solid operating performance and disciplined capital management.
Underpinning the operating performance is the exceptional performance in working capital which is demonstrated on the next slide. We continue to make tremendous progress in achieving sustained improvement in our days working capital. In 2011, we established a new record, 27 days. We’ve been able to reduce days working capital by 16 days, an equivalent of $1.1 billion since 2008 and three days since 2010. That one-year improvement equates to roughly $200 million in cash. These results demonstrated not only an improvement but a sustainable reduction.
Stable operating practices and a relentless focus on cash has been the hallmark of our businesses. As you will see from our 2012 targets, we’re going to continue this effort. Now let’s move on to a report on our 2011 financial targets. For the third consecutive year, we’ve achieved all of our cash sustainability targets. We continue to take a disciplined approach to capital spending which is
For
per
sona
l use
onl
y

demonstrated by our results for both sustaining and growth CapEx. Our investment in the Ma’aden-Alcoa joint venture also came in below target at $249 million.
4
THOMSON REUTERS STREETEVENTS | www.streetevents.com | Contact Us © 2012 Thomson Reuters. All rights reserved. Republication or redistribution of Thomson Reuters content, including by framing or similar means, is prohibited without the prior written consent of Thomson Reuters. ‘Thomson Reuters’ and the Thomson Reuters logo are registered trademarks of Thomson Reuters and its affiliated companies.
For
per
sona
l use
onl
y

JANUARY 09, 2012 / 10:00PM GMT, AA - Q4 2011 Alcoa Inc. Earnings Conference Call Construction is progressing as planned and continues to be on schedule and on budget. Debt-to-capital remains at our target range and we achieved our goal of being free cash flow positive, ending the year with $906 million. These results have us starting 2012 in an improved liquidity position as shown on the next slide. As you can see, our performance has improved markedly from the end of the 2008 time period. First, we have significantly improved our free cash flow generation and free cash flow positive the last two years. We’ve been disciplined in our capital spending while still investing in growth opportunities.
We have been able to significantly improve our liquidity by maintaining significant cash on hand. At the same time, we have reduced our debt position by more than $1.2 billion and our net debt position by $2.4 billion. We’ve also reduced our debt-to-capital by more than 700 basis points. One area that has generated increased concern has been the funding of our pension plan. With that in mind, let’s take a look at the next slide and we’ll discuss that topic.
Despite a challenging investment environment, Alcoa increased the market value of its assets with an estimated 9% return in 2011. And our pension contributions continue to meet the ERISA 80% threshold for funding requirements. We have historically used cash to fund pension obligations, with the exception being 2010 and 2011. Even in this time frame we contributed $449 million in cash. We are anticipating the use of cash to fund 2012 requirements. Should economic conditions change, we will obviously reassess our options.
Let’s now move on to our 2012 view and cash sustainability targets. In the second half of 2011, we faced headwinds influenced by the volatile economic environment. As a result, we entered 2012 managing for cash. I have just elaborated on where we stand from a liquidity position, yet our goal as we enter 2012 is to utilize these categories of capacity optimization, cost and productivity gains, working capital, and liquidity initiatives to enable us to finish the year cash flow positive.
We set our targets to accomplish this overarching objectives which are listed on the next page. Alcoa will focus on maximizing cash in 2012, and the following targets have been established as part of our new cash sustainability program. We’ve already discussed the capacity optimization targets and announced we will close or curtail roughly 12% of Alcoa’s global smelting capacity. We have a target to capture productivity gains of $800 million, and overhead savings of $50 million in 2012. Even though we’ve set a record on days working capital, we’ve set a goal to achieve another 1.5-day reduction over 2011. Alcoa will target positive free cash flow in 2012 and follow a disciplined approach to capital spending with specific targets established for sustaining CapEx, growth CapEx, and spend on the Ma’aden-Alcoa JV investment.
Lastly, is our debt-to-capital target. We will continue to manage our capital structure and maintain a ratio in the range of 30% to 35%. Ever since the downturn of ‘08 and ‘09 we have taken a very disciplined and aggressive approach in managing for cash. As we enter 2012, we are positioned and committed to meeting the challenge of this current environment. With that, I’d like to turn the floor over to Klaus. Klaus Kleinfeld - Alcoa Inc - Chairman and CEO Thank you, Chuck. So let’s start with a short review of 2011. Let’s go through the market and then the Alcoa performance and then we go into 2012. Let’s start with the market, the aluminum demand continued to grow substantially. It started strong into the year and weakened in the second half. As you may remember, we projected originally 12% growth.
We believe the market has finished with a growth rate of 10% in the last year. So that’s where it leaves us. Let’s go to the supply demand picture for 2011 and also close that. On the left-hand side, you see the primary aluminum side, the market has ended with a slight surplus of 150,000 tons, and the alumina market, as we projected, is in a balanced supply/demand situation.
Let’s move on to the 2011 Alcoa performance and — can we have the next shot, please? As you see there, the four major segments, right, you see on the alumina side the EBITDA per metric ton finished 2011 strong, stronger than 2010 with $70, slightly above the historic average of $66. Various sectors have contributed to the alumina pricing index. Introducing a market pricing system is certainly one of those. And also our strategic investments helped to improve our business despite very difficult market conditions.
On the Primary Metals side, the lower left corner here, the EBITDA per metric ton, lower than the prior year basically due to cost headwinds and a substantial price decline in the second half of the year. It basically underlines the importance of our strategic targets as those that follow us for a long, long time remember last year we put out a 10% improvement, 10-percentage-point improvement on the cost curve target in the next five years for our Primary business, and this is well underway, and as it shows here it’s really important.
The recent curtailment actions also clearly show our commitment to this and we have also learned a lot to respond quickly and cash sensitively in the changing market conditions. This is an important skill that we’ve acquired in the 2008/2009 time frame, particularly in today’s very volatile time. If you look at the Flat-Rolled upper right hand corner, we faced challenges in the second half of the year with the demand destruction in Europe. However, as you look at the annual performance it has improved compared to last year, with the EBITDA per metric ton and it’s above historic levels. In addition, what you can’t see here on this slide but I’ll tell you is Flat-
For
per
sona
l use
onl
y

Rolled product also has a strategic target to grow $2.5 billion until 2013 and it has achieved 50% of that in the first year.
5
THOMSON REUTERS STREETEVENTS | www.streetevents.com | Contact Us © 2012 Thomson Reuters. All rights reserved. Republication or redistribution of Thomson Reuters content, including by framing or similar means, is prohibited without the prior written consent of Thomson Reuters. ‘Thomson Reuters’ and the Thomson Reuters logo are registered trademarks of Thomson Reuters and its affiliated companies.
For
per
sona
l use
onl
y

JANUARY 09, 2012 / 10:00PM GMT, AA - Q4 2011 Alcoa Inc. Earnings Conference Call Engineered Products and Solutions business improved margins here, reached 18% EBITDA margin for the full year. This is our best ever performance. Also showed great performance on the growth side. There is a strategic target to grow $1.6 billion in the three years until 2013, and they have achieved 48% of that in the first year. If you look at this chart alone, which tells a good story of what has happened in 2011, so the business has remained very focused on profitable growth and like in the last downturn, they do not let their eye off the strategic directions and let me just quickly give you some views on what has happened on the strategic side there, starting with Primary.
Our new bauxite mine in Juruti, Brazil improved production by more than 50%, at the same time cash came down by 30%. The refinery in Sao Luis is now at nameplate capacity with 3.5 million tons. Our hydro dam, at Estreito, also in Brazil, physical structure is built, four of eight turbines are in place. It will be completed this year and it will give us 277 megawatts. This year will bring our costs down on the cost curve for the worldwide system by 1-percentage-point, this action alone. That’s a good thing.
In our Saudi Arabia joint venture, here are some recent pictures. It’s the lowest cost, as you may remember, and as you can see here it’s nicely coming out of the ground. It’s on time, it’s on budget, and that’s an important thing to see and very important for our strategic direction. GRP, on the global rolled product side, also been focusing nicely on our growth regions and nicely on some of the growth segments. Russia, if I want to highlight that, 23% year-on-year volume growth. It’s when you look at 2008, and to today, $150 million turnaround in profits.
When you look at China, also, capacity utilization coming up, 70% we expect by 2012. We are a good player in some of the key markets, already in brazing sheets, and we are going into other growing markets like consumer electronics. That’s a good thing. And then talking about Davenport. Davenport is strongly profiting and looking forward to the growth in automotive as well as the sustained growth and increased growth in aerospace. Last year we announced a $300 million investment there to meet the US auto demand.
And at aerospace, we see clearly a growing capacity with a higher aerospace build rate, and this very fundamental decision that was made in 2011 by Airbus to have the A320 new and by Boeing to have the 737 max as an all aluminum plane. That’s very, very important. Right? Last but not least, you see the strategic things on EPS. We continue to drive innovation and acquisitions as the major driver for our downstream profitable growth.
On the innovation side, I really almost don’t know where to start. We are number one in fasteners, 90% of the fasteners are specialty fasteners, 55% are patented. We’re number one in blades going into jet engines and gas turbines. We have a great innovative capability, let’s just mention the 3D multi-wall airfoil cooling, what does it lead to? It allows for higher firing temperatures in the chambers and that basically means it increases the engine efficiency and brings the emission down at the same time.
We are number one. And just to give you an impression here, if you replace the aluminum wheels, the steel wheels with aluminum wheels here in this example, this alone can lead to a 3% to 5% fuel saving on a truck and trailer combination. EcoClean has made headlines, actually it was just very positively mentioned as one of the biggest innovations happening last year. It’s an active facade. If you have 10,000 square feet of EcoClean, it’s the equivalent of the pollution reduction that you get from 80 trees per day.
And in addition to that, we have the bolt-on acquisitions on the fastener side, Van Petty, Republic, TransDigm. We expanded our footprint, 4% EBITDA margin improvement, percentage points, and 4% to 7% market share gains depending on where you go. Traco, the acquisition on the windows side, increased our North American commercial window share by 18%. So that said, on the operational side, if you look here at the financial targets, and I don’t want to go through all of them, we basically achieved all of them. Achieved or over achieved all of them, together with on the right hand side the strategic targets and that will continue.
We’re going strong into 2012 and we’re well-trained and capable to act fast in the face of changing market conditions. Let’s go into 2012 and the outlook. Again, we start with the end market perspective, then we go to aluminum and alumina, then we talk about the Alcoa actions. So let’s go into the end markets that we cater to. So we actually see on the global scale growth, be positive in 2012 in those end markets that we serve, and at the same time there are some specific headwinds in certain regions that will prevail. So let’s go through it in the usual way.
Aerospace for 2012, we believe positive momentum is going to continue. We expect 10% to 11% growth driven strongly by large commercial aircraft. We now have an increased confidence in the delivery rates because 2011, the net orders came out to be 2,183 for large commercial aircraft. That’s obviously Boeing and Airbus together, second highest in aviation history. The combined backlog of both firms now is 8.2 years, so I think there is good reason to be optimistic about that market.
Automotive, another pretty good story. With the exception of Western Europe, we expect on a global basis to have growth between 3% to 8%. So let’s look in some of the major regions. North America, it looked in the summer as though we would see a slowdown but then the fourth quarter came on strong with 13.4 million vehicles. We expect this momentum to continue into 2012 and driven very strongly by the average vehicle age that’s currently at 10.6 years, whereas the 10-year average is 9.4 years. So we anticipate a growth here between 5% to 10% in 2012.
For
per
sona
l use
onl
y

6
THOMSON REUTERS STREETEVENTS | www.streetevents.com | Contact Us © 2012 Thomson Reuters. All rights reserved. Republication or redistribution of Thomson Reuters content, including by framing or similar means, is prohibited without the prior written consent of Thomson Reuters. ‘Thomson Reuters’ and the Thomson Reuters logo are registered trademarks of Thomson Reuters and its affiliated companies.
For
per
sona
l use
onl
y

JANUARY 09, 2012 / 10:00PM GMT, AA - Q4 2011 Alcoa Inc. Earnings Conference Call One interesting aspect that I want to mention here specific to our industry is that we’ve been seeing that the aspect of fuel efficiency plays a much, much more important role today in the consumer choice but it’s different from what it was 10 years ago. 10 years ago, the consumer really only had the choice to scale down, go for a vehicle in a lower class. But today you have fuel efficient choices in each segment. Light weighting, obviously, with aluminum plays an important role here, as it shaves off 10% of fuel efficiency.
So this different, this changed consumer preference together with the strong fuel efficiency legislation drives the companies, the automotive companies into that type of direction. Automotive Europe, sales in European markets, EU27, was down 2% in 2011 driven by positive momentum in Germany, plus 9%. Eastern Europe, plus 20%, driven by all of that overcompensated by the reduction in most other countries, France, Italy, Spain, UK, all together comes to down with a combined 7% of these countries. Driven by — given the strength in exports, the production is expected to be just 5% in 2011, with a substantially weaker second half and we expect for 2012 an overall production to be around zero to minus 5%.
On China automotive, we expect to have — we expect that China has achieved a gain of around 3% in 2011 impacted by the elimination of government stimulus as well as new vehicle registration limits in some major cities. In 2012, we expect growth to be between 3% to 8%. On the heavy trucks and trailer, the next segment in commercial transportation we expect mixed results. In total, we believe it’s going to be, growth between 2% to 5% driven very much by North America and China.
North America, commercial trucks and trailer, we do see a total 305,000 units for 2011, so that’s up 69% compared to the year before. Production has increased by 64%, we’re still positive for this sector. However, we agree with the industry consensus for 2012 of a growth between 2% and 7%. Europe, commercial transportation, 2011 has brought roughly 28% growth, the second half was weak, actually a production decline of 19%. We’ve seen the austerity measures as well as the overall economic issues in the Eurozone are impacting this market obviously. We anticipate a production decline between 8% to 13% in 2012.
In China, the Chinese commercial truck market has substantially come down from its enormous high of 1 million vehicles in 2010, 865,000 trucks in 2011. We’re looking forward to 2012 because we anticipate a growth between 3% to 8%, to 2011. Chinese government is expected to enforce stricter engine requirements in the second half so this is going to cause also some positive momentum here in this market. Next segment, beverage can and packaging, global demand will stay at 2011 growth levels, so we expect a 2% to 3% increase worldwide. Commercial building and construction, the next segment here, the picture has really not changed much. The markets in Europe and North America are further in decline, we believe 3% to 5% in 2012.
China is anticipated to grow 8% to 9% growth in the retail sector in Tier 2 cities through an increase of the middle class demand as the most strong driver here. Last segment here, industrial gas turbines, we believe the market has seen a very steep decline in 2009 and slowly in recovery. We expect build rates to increase by 5% to 10%, however, that’s very important to us. As a blade manufacturer, we expect a reduction in spare parts, the market we believe is going to be flat overall in 2012. So what does that all mean?
If you add it all up and bring it together for the aluminum demand picture, let’s go to the next slide. We’ve seen a 10% growth last year, just show that to you and we believe the growth rate for this year is going to be 7%. So this shows you a breakdown of the different regions and you do see there is strong growth coming from China. We believe China is going to have about 12% growth, obviously, on a higher basis, by the way, last year 15%. Asia, 9%, without China. Asia, 9%; India, 10%. These are the strong growth drivers.
Then we see on the contrast, Europe with no growth but also no decline as we believe. So let’s move to some more details here, the regional premiums and the inventory situation. On the left-hand side you see the regional premiums broken down, different regions here. Metal premiums have declined a little, but if you compare that to the historic levels, they are still well above historic levels and this continues to be a good reflection of the physical demand, physical demand continues to be strong.
If you move to the right-hand side here, you do see the inventory levels broken down into different type of inventories. This has increased compared to the third quarter. The inventory levels have increased by four days from 53 to 57 days of consumption. And part of the increase is, obviously, driven by the slowdown of demand and part of it is by metal moving from off-warrant to on-warrant. Let’s take a more detailed look at that.
On the left-hand side, here on this chart, we tried to generate an overview of the total global inventory. What you saw before on that slide, the visible part, as well as now an estimate of the invisible inventory, we believe that if you compare the third quarter to the fourth quarter, that we’ve seen a slight increase of about 400,000 tons here on the inventory side. So some chunk, about 200,000 tons, comes from the slowing in demand. So the producers are selling into the LME or increasing as you can see here their own inventory. The second chunk is China. China’s increasing by about 100,000 tons.
7
THOMSON REUTERS STREETEVENTS | www.streetevents.com | Contact Us © 2012 Thomson Reuters. All rights reserved. Republication or redistribution of Thomson Reuters content, including by framing or similar means, is prohibited without the prior written consent of Thomson Reuters. ‘Thomson Reuters’ and the Thomson Reuters logo are registered trademarks of Thomson Reuters and its affiliated companies.
For
per
sona
l use
onl
y

JANUARY 09, 2012 / 10:00PM GMT, AA - Q4 2011 Alcoa Inc. Earnings Conference Call This is pretty much almost exclusively the Shanghai metal exchange year end liquidation adjustments. And then last, but not least, you see about 200,000 tons moving from off-warrant to on-warrant. And to see that phenomenon a little bit more clearly, we’ve generated that odd looking chart on the right-hand side but it’s actually pretty simple. If you look at the blue curve, the blue curve shows you the three-month spread and you do see what happened in the last year, the contango narrowed and what happens when the contango narrows and you’re about to renew your metal contract and you are off-warrant, you want to come on-warrant to just be more liquid, so that’s exactly what happened. But we’ve also seen that the contango going into the end of the year widened again.
That’s why we also put the right — the red curve in here too. The red curve shows the canceled warrants. So you can see the canceled warrants shoots up immediately after the contango widens and that basically is a good indicator. Warrants get cancelled, so going forward you should see the trend from off-warrant to on-warrant pretty soon getting reversed.
So let’s move now to the supply/demand picture. That’s what we see. And that’s obviously a very, very important picture and we haven’t generated that as you well know lightheartedly. We are projecting an overall deficit for the primary metal in 2012. We believe China will curtail about 1.1 million tons and I’ll elaborate on that. We’ll see curtailments in the West of around 700,000 tons. I’ll give you some more color on that. Before we do that, let’s talk about the right-hand side. Not as exciting as the left-hand side.
But aluminum markets we believe will continue to be in balance as we’ve seen that in 2011 also. So let’s take a more detailed look on China aluminum situation. So what we see here on the left-hand side, we have done a very thorough analysis and looked through all the smelters that we see in China and made a calculation of where we believe they are standing with the current China metal exchange pricing, as well as the substantial increase in power cost. We believe that about a third of the total production in China is cash negative. This is a calculation on a cash basis.
So it’s cash negative. So it’s bleeding money. And we’re talking about 5.7 million tons. On the right-hand side here, you see a breakdown into which provinces are affected by that. If I remind you on the previous slide our assumption for the 600,000 deficit, ton deficit in the primary market, our assumption is that 1.1 million of this 5.7 million unprofitable leading cash capacity, which basically is 20% of that, will be taken offline in China.
So if you believe that that estimate is a little bit too conservative, obviously, everything else will add to the deficit. As a reference point, I’d like to give you the 2008-2009 reference which was the time when China took about 3.5 million tons off from the net. All right. So much about the demand/supply situation.
Let’s also briefly talk about alumina’s [Alcoa correction: aluminum’s] attractiveness as an asset class. Alumina [Alcoa correction: aluminum] continues to be attractive as an asset class and we’ve taken here a look at the Dow UBS Commodity Index which has about $90 billion under management. So let’s take a look at the left-hand side here and look at that stacked bars here. The base metal in that fund makes up — made up in 2011 17.8% of the total composition of this fund. And it’s expected with the rebalancing that is happening, that this will go up to 18.6%. So on the right-hand side you can see here the composition inside of the base metals, and interestingly enough, aluminum is the second most important asset inside of the base metal after copper was a percentage share of 29% in there.
The expectation is after the rebalancing for this to go up to 31.7%. So if you multiply that out, $90 billion roughly of asset under management and, again, this is just one of the funds, we’re talking about $5.3 billion, basically in aluminum through this fund alone and a delta of roughly $600 million coming in, in addition after the rebalancing. This is obviously good news and another indicator that aluminum continues to be an attractive asset class. So if you want to put all these things together, and the reason why we’ve been putting these charts together is to give you a feel for where could pricing end up and, obviously, when you want to make this calculation, you would be looking at where is physical demand, supply. We talked about that’s a deficit. Right?
What’s the asset attractiveness? This is what you can see here on this. And the last remaining piece of information is all of the speculative investment that obviously goes on in all of the commodity sectors and a lot of that is based on the macroeconomics. Last time we talked a little bit about the pretty massive amount of shorting that’s going on in there, and, again, most of it is based on macroeconomic indicators. So that’s why we put this chart here together. And if you focus your view first on the lower right-hand quadrant here which shows the prices of different metals, you can see that the second half was not a good second half for a lot of the base metals here.
But let’s also take a look at the kind of indicators that have been driving that. The upper left hand side is the Eurozone crisis, a good indicator for the Eurozone crisis is as we believe the five-year bond yields, and as you can see, the five-year bond yields have been going up in those critical countries massively in the last year and that triggered a lot of shorting. But what you have been seeing over the course of the end of the year, this has been coming down. If you look at the last weeks it’s been coming down pretty substantially.
So it seems that some of the actions that have been taken and are continuing to be taken in Europe seems to have led to a more positive view on that. You can also take a look here on the upper right-hand side, the consumer confidence, consumer confidence massively weakened in 2011. But if you look at the US, for instance, here, it’s been substantially down until basically August last
For
per
sona
l use
onl
y

year and since then it’s been rebounding in a nice, nice fashion. Last but not least, a very good indicator, a very good early indicator is the manufacturing purchasing managers’ index, which you see on the left lower side, for the three regions and after a strong decline in 2011 you see that all indices are improving.
8
THOMSON REUTERS STREETEVENTS | www.streetevents.com | Contact Us © 2012 Thomson Reuters. All rights reserved. Republication or redistribution of Thomson Reuters content, including by framing or similar means, is prohibited without the prior written consent of Thomson Reuters. ‘Thomson Reuters’ and the Thomson Reuters logo are registered trademarks of Thomson Reuters and its affiliated companies.
For
per
sona
l use
onl
y

JANUARY 09, 2012 / 10:00PM GMT, AA - Q4 2011 Alcoa Inc. Earnings Conference Call US and China is already in positive. US never left it. China just dipped in a little bit and has come out of it right away. Europe is still below it but looks as though the decline has been stopped.
So let’s summarize what we believe we are seeing here on the general market side in our markets. 7% global growth in aluminum, we believe, for 2012. For primary aluminum, it’s balance moves to a deficit. We talked about that. The asset class of aluminum continues to be attractive and the macroeconomic indicators, I would say, are showing some first positive signals. So what is our approach in this still very volatile market?
We will maximize our optionality and increase our speed of execution. Chuck already talked to this slide, I just want to use it to reemphasize that. We basically have a new cash sustainability program for 2012. We are in the middle of executing this and we will obviously do that very fast. It has this element of capacity optimization, liquidity initiatives, working capital improvement, cost and productivity gains, but we will not let our eye off our true north which are the three strategic priorities, profitable growth, Alcoa Advantage and disciplined execution.
So let me just very briefly, because I know that there’s a lot of questions on, and maybe I can answer this question right away before even the Q&A session, talk about the curtailment here and remind you that why have we done that. We’ve done that basically for two reasons. One is to improve our competitiveness. So this is a strategic element.
The second one is adjusting flexible to the current market conditions. And also may I remind you on the left-hand side — this chart you’ve seen in 2008, 2009 — this is our approach that we developed at that time to have multiple options, how to go through curtailment steps, and it’s well tested. We know how to do it fast and we know how to do it with a keen eye on cash. It has those elements. It goes — the maximum is the permanent shutdown which we just announced for Tennessee and for two lines in Rockdale, 291,000 tons. Full plant curtailment which we’re planning to do for Portovesme and partial curtailment which we are planning to do for La Coruna and Aviles. And then there’s other elements of relining.
So all of those decisions are never easy and we are working very, very hard to find solutions that minimize the impact on the communities as well as on our employees that are affected by it. So last but not least, our cash sustainability program 2012 has operational as well as financial goals. Here are the operational and the financial goals. It goes from capacity optimization, productivity gains of $800 million, overhead, continued improvement, working capital, another 1.5 days to the financial targets which you see here on the right-hand side. So this gives us all a good idea on how we see 2012 and what we’re planning to do. So let me close with that and open it up for Q&A.
QUESTION AND ANSWER Operator (Operator Instructions) The first question comes from the line of Dave Gagliano with Barclays. Please proceed. Dave Gagliano - Barclays Capital - Analyst Thanks for taking my question. It’s related to the $800 million cost savings target. It’s a three-part question. I was wondering if, first, you could talk about the volume that’s tied to that target. Secondly, I was wondering if you could divide that up into each of the major segments in terms of the $800 million contribution from each segment. And somewhat related, if you could divide it into the major contributors, such as raw material versus labor versus volume reductions, et cetera? Thanks. Klaus Kleinfeld - Alcoa Inc - Chairman and CEO Okay, Dave. The way we do that is we basically build a matrix and the matrix is a matrix that has every business and every region and then breaks it down, and every lever in that, right. So procurement, it’s overhead, it’s operational efficiencies, right. I don’t think that we are going to break that further down other than what we’ve done here already and basically segregated it into the financial and the operational ones, and inside of the operational. We’ve broken out the overhead one as well as the working capital improvements, which are obviously cash related only and the $800 million productivity.
But you can absolutely rest assured that the breakdown of that is down to the site level and I would be stunned if you were to meet and run into an Alcoan who is on a decent level that they would not know what their productivity expectations are.
9
THOMSON REUTERS STREETEVENTS | www.streetevents.com | Contact Us © 2012 Thomson Reuters. All rights reserved. Republication or redistribution of Thomson Reuters content, including by framing or similar means, is prohibited without the prior written consent of Thomson Reuters. ‘Thomson Reuters’ and the Thomson Reuters logo are registered trademarks of Thomson Reuters and its affiliated companies.
For
per
sona
l use
onl
y

JANUARY 09, 2012 / 10:00PM GMT, AA - Q4 2011 Alcoa Inc. Earnings Conference Call Dave Gagliano - Barclays Capital - Analyst I guess my question is, is there a volume cut associated with that $800 million cost savings year-over-year? Chuck McLane - Alcoa Inc - EVP and CFO No, it’s not, Dave. Dave Gagliano - Barclays Capital - Analyst Okay. Fair enough. Chuck McLane - Alcoa Inc - EVP and CFO In other words, every time we do productivity, I think I’ve got your question a little bit clearer now, every time we do a productivity as we did previous cash sustainability and procurement, et cetera, we adjust it for volume changes. So if we’ve got less spend in an area that’s just due to taking volume out, that’s not counted as productivity on our part. Dave Gagliano - Barclays Capital - Analyst Okay. Thanks very much. Chuck McLane - Alcoa Inc - EVP and CFO You’re welcome. Operator And the next question comes from the line of Kuni Chen with CRT Capital Group. Please proceed. Kuni Chen - CRT Capital Group - Analyst Hi. Good evening, everyone. Klaus Kleinfeld - Alcoa Inc - Chairman and CEO Hi, Kuni. Kuni Chen - CRT Capital Group - Analyst Thanks for taking my question. Just a quick one on the overall market here. You talked about your expectations for capacity cuts out of China and the rest of the world. Can you just give us some view on the timing of those cuts and how long you think some of these underwater smelters can continue to hang on if there’s no rebound in the metal price? Thanks.
10
THOMSON REUTERS STREETEVENTS | www.streetevents.com | Contact Us © 2012 Thomson Reuters. All rights reserved. Republication or redistribution of Thomson Reuters content, including by framing or similar means, is prohibited without the prior written consent of Thomson Reuters. ‘Thomson Reuters’ and the Thomson Reuters logo are registered trademarks of Thomson Reuters and its affiliated companies.
For
per
sona
l use
onl
y

JANUARY 09, 2012 / 10:00PM GMT, AA - Q4 2011 Alcoa Inc. Earnings Conference Call Klaus Kleinfeld - Alcoa Inc - Chairman and CEO Yes, Kuni, happy to do so. Let me first break down the 1.1 million that we have assumed will come offline and that we believe is going to be pretty soon. So it’s broken down into three segments. One is the Hunan Province, and that’s 280,000 tons, and there it’s very strongly driven by the drought conditions that exist there. So obviously having an impact on the hydro capabilities there. We believe that this is going to happen pretty soon.
Then the second chunk, about 630,000 tons, which is based also on a report and which is even more broken down by the China economic information center. We also believe that this is a most likely going to come down pretty soon. And then there’s a third chunk which is about 200,000 tons, which has already been discussed and where we believe the actions are in the progress. And if you want to go further, we believe the next — this is the 1.1 million that we have assumed is going to come offline, right? So if you want to go the next level, we believe the next logical tranche will be the — what’s considered the old inefficient smelters, so the ones that have old technology, under 200 kA, and we believe that out of the 5.7 million in total that’s underwater, this is another 1.2 million tons.
Anybody who would care for how to use the resources wisely would take these things offline rather sooner than later. All right. That’s always assuming the current Shanghai metal price situation. Kuni Chen - CRT Capital Group - Analyst Thank you. Chuck McLane - Alcoa Inc - EVP and CFO Can we have the next question, please. Operator And the next question comes from the line of Timna Tanners with Bank of America. Please proceed. Timna Tanners - BofA Merrill Lynch - Analyst Yes, hi, Happy New Year. Klaus Kleinfeld - Alcoa Inc - Chairman and CEO Thank you, Timna. Timna Tanners - BofA Merrill Lynch - Analyst I just wanted to go through the assumptions on cash if we could real quick and get a little bit more details perhaps. It seems that there’s a lot of growth projects and the sustaining CapEx, so just wanted to see if I’m missing something with the free cash flow estimates, if that assumes Ma’aden, Davenport, the Quebec investment, then some of these additional closure costs. So I’m just wondering if you’ve given any detail on the further closure costs, what’s the minimum amount of cash that you might need and what kind of assumptions go into your hope to be able to pay down the pension with cash? Thanks. Chuck McLane - Alcoa Inc - EVP and CFO Okay. Let me start off, Timna, on that. Basically, if you looked at our targets which we covered, the sustaining CapEx, you can see that it’s still running at a very low level as a percent of depreciation. We had two years that it was right at 39% in 2009 and 2010. It popped up to 62% in 2011. And it’s going to be back under 60% in 2012.
And that includes projects like relocating the Australian crusher at our mining site which is a significant project which has to be done, and the overhaul of the wharf in Baie Comeau. So those are some big sustaining projects that are included in the $725 million that we’ve got as a target. With regards to the growth CapEx, you can see the biggest change between 2011, which was pretty low growth CapEx numbers, 2012 was $625 million, is the Davenport expansion which is a couple hundred million dollars in 2012. And then we’ve got the Saudi Arabia at $350 million.
11
THOMSON REUTERS STREETEVENTS | www.streetevents.com | Contact Us © 2012 Thomson Reuters. All rights reserved. Republication or redistribution of Thomson Reuters content, including by framing or similar means, is prohibited without the prior written consent of Thomson Reuters. ‘Thomson Reuters’ and the Thomson Reuters logo are registered trademarks of Thomson Reuters and its affiliated companies.
For
per
sona
l use
onl
y

JANUARY 09, 2012 / 10:00PM GMT, AA - Q4 2011 Alcoa Inc. Earnings Conference Call So as we look forward to the year, and go through our assumptions around pricing, raw material cost, these spend categories and the $650 million in pension, that’s where we get to the point that we think we’re going to be able to do that and be cash flow positive. Now are things going to happen during the course of the year positive and negative to offset that, but we’re approaching it from the standpoint that we want to be neutral, no worse than neutral, free cash flow positive. So that we’re masters of our own destiny, so-to-speak, regardless of the situation, just like the actions we took on curtailments. Timna Tanners - BofA Merrill Lynch - Analyst Got it. And do have you a time frame for when the pension needs to be paid and an estimate for the additional cost? Chuck McLane - Alcoa Inc - EVP and CFO Pension will be spread out during the course of the year, not exactly 25% each quarter but close to it. Timna Tanners - BofA Merrill Lynch - Analyst Okay. Great. Thank you. Chuck McLane - Alcoa Inc - EVP and CFO You’re welcome. Operator The next question comes from the line of Paretosh Misra with Morgan Stanley. Please proceed. Paretosh Misra - Morgan Stanley - Analyst Hi, good evening. Klaus Kleinfeld - Alcoa Inc - Chairman and CEO Hello, Paretosh. Paretosh Misra - Morgan Stanley - Analyst So the sensitivity aluminum price that you provide on slide 46, I noticed that it went up to $220 million. Any particular thing that is driving that increase? Chuck McLane - Alcoa Inc - EVP and CFO It was mostly about the restarts that were taking place in the US, nothing more than that. It had been a while since we updated. It was originally $220 million. We kind of pulled it down and probably a little lax in going back to the $220 million. As you can see this time it’s closer to that range than not. So that’s really all.
12
THOMSON REUTERS STREETEVENTS | www.streetevents.com | Contact Us © 2012 Thomson Reuters. All rights reserved. Republication or redistribution of Thomson Reuters content, including by framing or similar means, is prohibited without the prior written consent of Thomson Reuters. ‘Thomson Reuters’ and the Thomson Reuters logo are registered trademarks of Thomson Reuters and its affiliated companies.
For
per
sona
l use
onl
y

JANUARY 09, 2012 / 10:00PM GMT, AA - Q4 2011 Alcoa Inc. Earnings Conference Call Paretosh Misra - Morgan Stanley - Analyst Got it. Thank you. Chuck McLane - Alcoa Inc - EVP and CFO You’re welcome. Operator The next question comes from the line of Sal Tharani with Goldman Sachs. Please proceed. Sal Tharani - Goldman Sachs - Analyst Thank you. Good afternoon, guys. Klaus Kleinfeld - Alcoa Inc - Chairman and CEO Hello, Sal. Sal Tharani - Goldman Sachs - Analyst In Italy, you had a dispute on the electricity contracts and you were taking a $250 million charge in the past and there was, I think you put out a statement at that time that you might have to pay $300 million to $500 million. With the closure you think you may have accelerate the payment and you have to pay this year that amount? Klaus Kleinfeld - Alcoa Inc - Chairman and CEO Theoretically, Sal, these are two very different things. The one is referring to a decision by the European Union that they believe we have received, improperly received subsidies here and that’s the amount that you’ve been referring to, and the second thing are the closings here. We will see where this comes out. There’s legal proceedings underway and very hard to predict where this will come out. But as you know, we’ve legally gone against that decision and very strongly believe that we have the law on our side here. Sal Tharani - Goldman Sachs - Analyst Okay. Klaus Kleinfeld - Alcoa Inc - Chairman and CEO But to be clear, the European regulation is as such that you first have to pay and then you have to fight it in court, right. So we’ll see where it comes out. Sal Tharani - Goldman Sachs - Analyst Okay. And next question is the alumina capacity, which you may have to take down along with aluminum capacity taking down, any thoughts on that, which regions would that be and what would the cost associated with that will be? Klaus Kleinfeld - Alcoa Inc - Chairman and CEO No, we’ve actually already said that we will work through that. There’s also a different situation on that, depending on where things are in the cost curve. So you have to take these things into account and we will publish that whenever we make the decision, we obviously watching where the market is going.
13
THOMSON REUTERS STREETEVENTS | www.streetevents.com | Contact Us © 2012 Thomson Reuters. All rights reserved. Republication or redistribution of Thomson Reuters content, including by framing or similar means, is prohibited without the prior written consent of Thomson Reuters. ‘Thomson Reuters’ and the Thomson Reuters logo are registered trademarks of Thomson Reuters and its affiliated companies.
For
per
sona
l use
onl
y

JANUARY 09, 2012 / 10:00PM GMT, AA - Q4 2011 Alcoa Inc. Earnings Conference Call Sal Tharani - Goldman Sachs - Analyst Okay. Great. Thank you very much. Klaus Kleinfeld - Alcoa Inc - Chairman and CEO Thank you, Sal. Operator The next question comes from the line of Brian Yu with Citi. Please proceed. Brian Yu - Citigroup - Analyst Thanks. Good evening. Klaus Kleinfeld - Alcoa Inc - Chairman and CEO Hello, Brian, hi. Brian Yu - Citigroup - Analyst Hi. My question has to do with the downstream operations. You’ve stuck to the revenue growth targets for 2013. Engineered Products is still showing pretty good margin expansion. Flat Rolled, it looks like that stalled out for a couple quarters now. How are you looking at 2012 for those two businesses and the margin outlook? Klaus Kleinfeld - Alcoa Inc - Chairman and CEO Well, let’s start with the downstream, the downstream business. In fact, I think that I would rather be positive to — as you saw, we only showed the total year. You saw that on a total year basis, the margin that we’ve achieved in the Engineered Products and Solutions business is a historic high with 18%. The fourth quarter has been a little lower than that and we’ll see what this year brings, but we clearly have the intention to keep the margin levels at where we have achieved them, right. And with the positive situation in the aerospace segment as well as the innovative potential that we have with Engineered Products and Solutions business, I’m cautiously optimistic that that will happen, but you obviously also have to see where the environment is going.
With the midstream business, to be precise, you said stalled a couple of quarters. I would say it can be correlated — if you look at the total year, you see on the slide that we showed that the EBITDA per metric ton has continued to go up and it’s at a higher level than last year which is a great achievement, and obviously it’s an achievement of having substantially changed also the mix. We have the intention to continue to do that. The impact that we’ve seen in the last quarter is basically coming through the euro crisis, plus the — how do you call it — seasonal impact on the can side. So, again, also here we have the intention to bring that back up to those levels with the actions that we are taking. Brian Yu - Citigroup - Analyst Okay. And then just a follow-up on, I think it was your answer to Kuni’s. You mentioned that the 600,000-ton deficit forecast for this year that that’s based on spot aluminum prices. Is that correct?
14
THOMSON REUTERS STREETEVENTS | www.streetevents.com | Contact Us © 2012 Thomson Reuters. All rights reserved. Republication or redistribution of Thomson Reuters content, including by framing or similar means, is prohibited without the prior written consent of Thomson Reuters. ‘Thomson Reuters’ and the Thomson Reuters logo are registered trademarks of Thomson Reuters and its affiliated companies.
For
per
sona
l use
onl
y

JANUARY 09, 2012 / 10:00PM GMT, AA - Q4 2011 Alcoa Inc. Earnings Conference Call Klaus Kleinfeld - Alcoa Inc - Chairman and CEO I mentioned that on the 5.7 million tons that I showed with the analysis, the China analysis, how much of that is underwater. I just want to make sure that we do it on a cash basis and don’t include non-cash items like depreciation or so because in the end the pain level comes when you really see cash flowing out the door. That’s why we did it. And it comes out with 5.7 million tons of the total Chinese production being cash negative as we speak. And that’s where the 600,000 is based on, basically then rolling into the 1.1, you’re absolutely correct. Brian Yu - Citigroup - Analyst Okay. So if we assume that, if we can assume that aluminum prices are too low, hopefully, they go up from here, we could see that 600,000-ton deficit forecast start to also come down too as prices go up? Klaus Kleinfeld - Alcoa Inc - Chairman and CEO Well, but that’s why I — okay. Yes, you can always — the world is a dynamic place so that statement is always true in general, but the question is always a question of likelihood. So don’t take the 600, take the 1.1 million tons that we have put into what leads to the 600 of curtailments in China. And as I said, 5.7 million tons in China are underwater, cash-wise. We took 1.1 as the estimate of what comes offline.
I personally believe that this is a very conservative estimate and even if metal price comes up a little bit, that does not mean that immediately everything in China is rosy. The Chinese aluminum industry, as we all know, has a structural problem that will not go away and that will lead to some structural consequences, almost independent of where the metal price is because there’s some other considerations also coming in, mainly the energy. How do you use the energy in a country that is not energy-rich and then the question of sustainability given that almost all refineries and all smelters are using coal-fired power. Brian Yu - Citigroup - Analyst Thank you. Klaus Kleinfeld - Alcoa Inc - Chairman and CEO Thank you. To be continued. Operator The next question comes from the line of David Lipschitz with CLSA. Please proceed. David Lipschitz - Credit Agricole Securities - Analyst Good evening, everybody. Chuck McLane - Alcoa Inc - EVP and CFO Hey, Dave. David Lipschitz - Credit Agricole Securities - Analyst Quick question on the — back to the productivity gains. Were any of these done in 2010 when you talked about $3 billion of overhead and procurement savings or where — why weren’t these done before? Is this something new? How are we getting the incremental $800 million?
15
THOMSON REUTERS STREETEVENTS | www.streetevents.com | Contact Us © 2012 Thomson Reuters. All rights reserved. Republication or redistribution of Thomson Reuters content, including by framing or similar means, is prohibited without the prior written consent of Thomson Reuters. ‘Thomson Reuters’ and the Thomson Reuters logo are registered trademarks of Thomson Reuters and its affiliated companies.
For
per
sona
l use
onl
y

JANUARY 09, 2012 / 10:00PM GMT, AA - Q4 2011 Alcoa Inc. Earnings Conference Call Klaus Kleinfeld - Alcoa Inc - Chairman and CEO David, you are always asking the right question. I think the good news is here we’re doing it in addition to the things that we’ve done before, and I think many of you that have been around and followed us also in the 2008-2009 time frame at the time when we put the first cash sustainability program out, which was for two years, and had very aggressive target, we’re saying, my God, can you keep that level when the economy comes back. The economy came back. Unfortunately, only for too short a time here, right.
And we have been able to lock these achievements in. The bridge that Chuck showed here from 2010 to 2011 is the probably the best proof of it. Chuck, what is it — Chuck McLane - Alcoa Inc - EVP and CFO $632 million. Klaus Kleinfeld - Alcoa Inc - Chairman and CEO $632 million of productivity and that’s no child’s game. Obviously, without that the whole situation would have looked much, much grimmer. I think what we’ve learned and what the people that are in the operations have learned is how to do it on a regular basis, how to continuously push for the next level. In many of the businesses, the centers of excellence that we established are playing a substantial role in basically picking up best practice wherever it is around the world and making sure that it is next day on, done in that way across the system that we have. So those are things. Working capital, when you see the working capital improvement, honestly, when you see 16 days, that’s amazing, absolutely amazing achievement. Chuck McLane - Alcoa Inc - EVP and CFO And on the working capital, same thing, started out when we first put the targets out as far as make some changes, they’re going to be critical, crisis type of changes but it’s going to come back on you. So we sustained those. We gave — we’ve improved it each year, gotten up to the 16, three last year, we’re asking for another day and a half. Maintain where you are and another day and a half. Klaus Kleinfeld - Alcoa Inc - Chairman and CEO And, obviously, these things, with the working capital, they vary over the quarter-to-quarter but the most important thing is you have to compare it with the respective quarter a year ago and we do see that we have been able to lock these improvements in. David Lipschitz - Credit Agricole Securities - Analyst Just a final question then. What changes the outlook for this business, to be honest? In terms of, every time there’s a little downturn the aluminum price really corrects pretty substantially. What changes? What keeps stuff online permanently? How does this work? How do we get to a sustained where we stay at $1.10, $1.15, $1.20 or higher price? Klaus Kleinfeld - Alcoa Inc - Chairman and CEO Well, there’s a lot of factors that go into that. I thought that in the presentation that Chuck and I put together we mentioned some of those. The physical supply and demand picture is obviously one that you will start with and you do see that that is a substantial change, 7% growth, plus, and a deficit situation here. So that’s a substantial change that you’re seeing. The second question is how attractive in general is aluminum as an asset class. And the third one is all this macro speculation going in here where in the end of the last year we’ve seen that a lot of people have been projecting that the world is going to come down and, therefore, take a short position. That has an impact in our industry as it has in other metals and commodity industries. David Lipschitz - Credit Agricole Securities - Analyst Okay. Thanks.
16
THOMSON REUTERS STREETEVENTS | www.streetevents.com | Contact Us © 2012 Thomson Reuters. All rights reserved. Republication or redistribution of Thomson Reuters content, including by framing or similar means, is prohibited without the prior written consent of Thomson Reuters. ‘Thomson Reuters’ and the Thomson Reuters logo are registered trademarks of Thomson Reuters and its affiliated companies.
For
per
sona
l use
onl
y

JANUARY 09, 2012 / 10:00PM GMT, AA - Q4 2011 Alcoa Inc. Earnings Conference Call Klaus Kleinfeld - Alcoa Inc - Chairman and CEO Pleasure. Operator Ladies and gentlemen, this concludes the question-and-answer session for today’s call. I would now like to hand the call over to Klaus Kleinfeld for closing remarks. Klaus Kleinfeld - Alcoa Inc - Chairman and CEO Well, thank you very much. And, obviously, to be continued and as I hope you see, you can see by our action, Alcoa is moving swiftly to address the changing market conditions and improve our competitiveness. As you are used to and as we are used to, we will continue to drive for innovation and productivity wherever we can, and our outlook is relatively positive here. So thank you for joining us and stay tuned, and I’m looking forward, as Chuck and others, to a continued conversation. Thank you very much. Operator Thank you for your participation in today’s conference. This concludes the presentation. You may now disconnect.
DISCLAIMER Thomson Reuters reserves the right to make changes to documents, content, or other information on this web site without obligation to notify any person of such changes.
In the conference calls upon which Event Transcripts are based, companies may make projections or other forward-looking statements regarding a variety of items. Such forward-looking statements are based upon current expectations and involve risks and uncertainties. Actual results may differ materially from those stated in any forward-looking statement based on a number of important factors and risks, which are more specifically identified in the companies’ most recent SEC filings. Although the companies may indicate and believe that the assumptions underlying the forward-looking statements are reasonable, any of the assumptions could prove inaccurate or incorrect and, therefore, there can be no assurance that the results contemplated in the forward-looking statements will be realized.
THE INFORMATION CONTAINED IN EVENT TRANSCRIPTS IS A TEXTUAL REPRESENTATION OF THE APPLICABLE COMPANY’S CONFERENCE CALL AND WHILE EFFORTS ARE MADE TO PROVIDE AN ACCURATE TRANSCRIPTION, THERE MAY BE MATERIAL ERRORS, OMISSIONS, OR INACCURACIES IN THE REPORTING OF THE SUBSTANCE OF THE CONFERENCE CALLS. IN NO WAY DOES THOMSON REUTERS OR THE APPLICABLE COMPANY ASSUME ANY RESPONSIBILITY FOR ANY INVESTMENT OR OTHER DECISIONS MADE BASED UPON THE INFORMATION PROVIDED ON THIS WEB SITE OR IN ANY EVENT TRANSCRIPT. USERS ARE ADVISED TO REVIEW THE APPLICABLE COMPANY’S CONFERENCE CALL ITSELF AND THE APPLICABLE COMPANY’S SEC FILINGS BEFORE MAKING ANY INVESTMENT OR OTHER DECISIONS.
© 2012 Thomson Reuters. All Rights Reserved.
17
THOMSON REUTERS STREETEVENTS | www.streetevents.com | Contact Us © 2012 Thomson Reuters. All rights reserved. Republication or redistribution of Thomson Reuters content, including by framing or similar means, is prohibited without the prior written consent of Thomson Reuters. ‘Thomson Reuters’ and the Thomson Reuters logo are registered trademarks of Thomson Reuters and its affiliated companies.
For
per
sona
l use
onl
y
4th Quarter Earnings ConferenceJanuary 9th, 2012
Exhibit 99.2
For
per
sona
l use
onl
y

Cautionary Statement
2
Forward-Looking Statements
This presentation contains statements that relate to future events and expectations and as such constitute forward-looking statements. Forward-looking statements include those containing such words as “anticipates,” “estimates,” “expects,” “forecasts,” “intends,” “outlook,” “plans,” “projects,” “should,”“targets,” “will,” or other words of similar meaning. All statements that reflect Alcoa’s expectations, assumptions, or projections about the future other than statements of historical fact are forward-looking statements, including, without limitation, forecasts concerning global demand growth for aluminum, end-market conditions, and growth opportunities for aluminum in automotive, aerospace and other applications, trend projections, targeted financial results or operating performance, and statements about Alcoa’s strategies, outlook, and business and financial prospects. Forward-looking statements are subject to a number of known and unknown risks, uncertainties, and other factors and are not guarantees of future performance. Important factors that could cause actual results to differ materially from those in the forward-looking statements include: (a) material adverse changes in aluminum industry conditions, including global supply and demand conditions and fluctuations in London Metal Exchange-based prices for primary aluminum, alumina, and other products, and fluctuations in indexed-based and spot prices for alumina; (b) deterioration in global economic and financial market conditions generally; (c) unfavorable changes in the markets served by Alcoa, including automotive and commercial transportation, aerospace, building and construction, distribution, packaging, defense, and industrial gas turbine; (d) the impact of changes in foreign currency exchange rates on costs and results, particularly the Australian dollar, Brazilian real, Canadian dollar, euro, and Norwegian kroner; (e) increases in energy costs, including electricity, natural gas, and fuel oil, or the unavailability or interruption of energy supplies; (f) increases in the costs of other raw materials, including calcined petroleum coke, caustic soda, and liquid pitch; (g) Alcoa’s inability to achieve the level of revenue growth, cash generation, cost savings, improvement in profitability and margins, fiscal discipline, or strengthening of competitiveness and operations (including moving its alumina refining and aluminum smelting businesses down on the industry cost curves and increasing revenues in its Flat-Rolled Products and Engineered Products and Solutions segments) anticipated from its restructuring programs and productivity improvement, cash sustainability, and other initiatives; (h) Alcoa's inability to realize expected benefits from newly constructed, expanded, or acquired facilities or from international joint ventures as planned and by targeted completion dates, including the joint venture inSaudi Arabia, the upstream operations in Brazil, and the investments in hydropower projects in Brazil; (i) political, economic, and regulatory risks in the countries in which Alcoa operates or sells products, including unfavorable changes in laws and governmental policies, civil unrest, or other events beyond Alcoa’s control; (j) the outcome of contingencies, including legal proceedings, government investigations, and environmental remediation; (k) the business or financial condition of key customers, suppliers, and business partners; (l) adverse changes in tax rates or benefits; (m) adverse changes in discount rates or investment returns on pension assets; and (n) the other risk factors summarized in Alcoa's Form 10-K for the year ended December 31, 2010 and other reports filed with the Securities and Exchange Commission (SEC). Alcoa disclaims any obligation to update publicly any forward-looking statements,whether in response to new information, future events or otherwise, except as required by applicable law.
Non-GAAP Financial Measures
Some of the information included in this presentation is derived from Alcoa’s consolidated financial information but is not presented in Alcoa’s financial statements prepared in accordance with U.S. generally accepted accounting principles (GAAP). Certain of these data are considered “non-GAAP financial measures” under SEC rules. These non-GAAP financial measures supplement our GAAP disclosures and should not be considered an alternative to the GAAP measure. Reconciliations to the most directly comparable GAAP financial measures and management’s rationale for the use of the non-GAAP financial measures can be found in the Appendix to this presentation and on our website at www.alcoa.com under the “Invest” section. Any reference during the discussion today to EBITDA means adjusted EBITDA, for which we have provided calculations and reconciliations in the Appendix and on ourwebsite.
For
per
sona
l use
onl
y

Chuck McLaneExecutive Vice President and Chief Financial Officer
For
per
sona
l use
onl
y
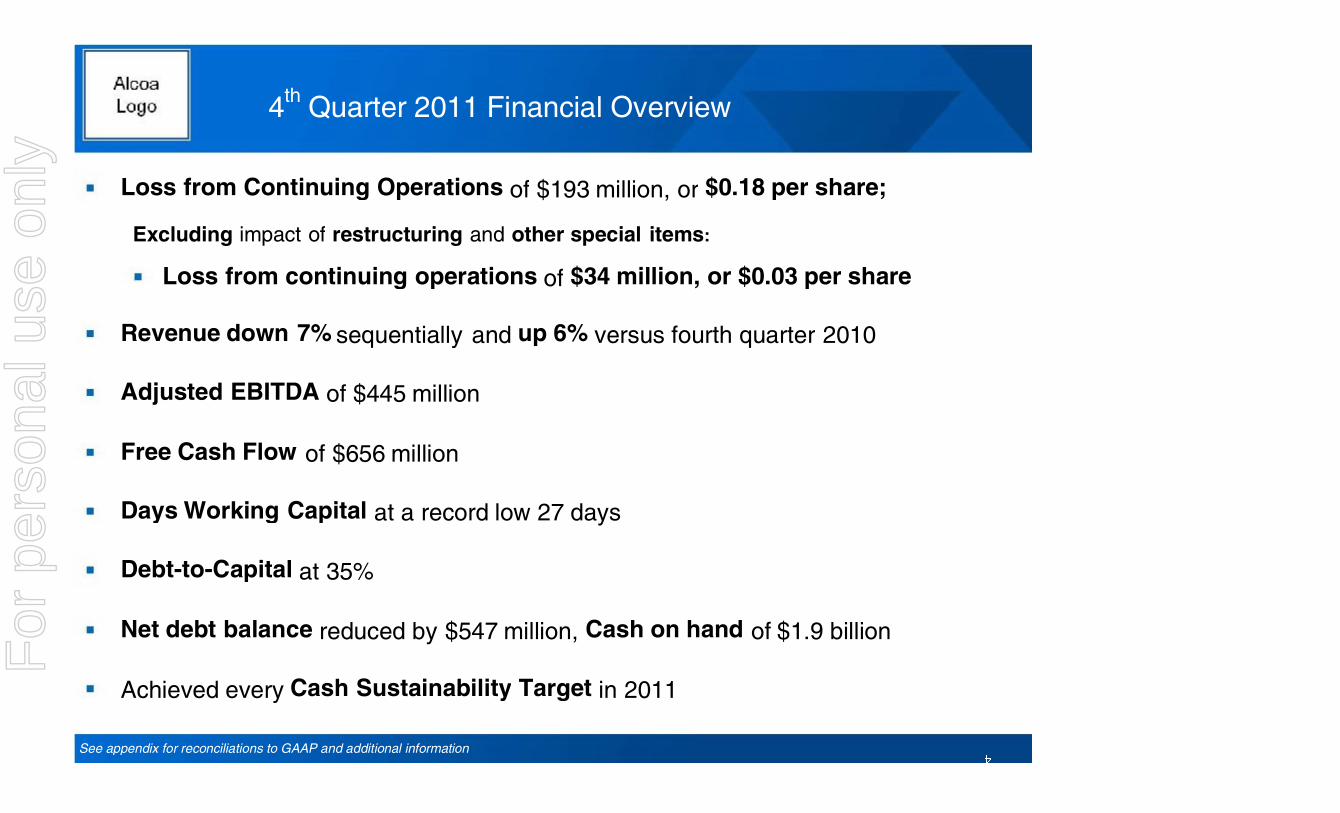
4
4th Quarter 2011 Financial Overview
Loss from Continuing Operations of $193 million, or $0.18 per share;
Excluding impact of restructuring and other special items:
Loss from continuing operations of $34 million, or $0.03 per share
Revenue down 7% sequentially and up 6% versus fourth quarter 2010
Adjusted EBITDA of $445 million
Free Cash Flow of $656 million
Days Working Capital at a record low 27 days
Debt-to-Capital at 35%
Net debt balance reduced by $547 million, Cash on hand of $1.9 billion
Achieved every Cash Sustainability Target in 2011
See appendix for reconciliations to GAAP and additional information
For
per
sona
l use
onl
y

5
Income Statement Summary
$ Millions, except per-share amounts 4Q’10 3Q’11 4Q’11 Year
ChangeSequential
Change
Sales $5,652 $6,419 $5,989 $337 ($430)
Cost of Goods Sold $4,538 $5,290 $5,228 $690 ($62)
COGS % Sales 80.3% 82.4% 87.3% 7.0 % pts. 4.9 % pts.
Selling, General Administrative, Other $282 $261 $268 ($14) $7
SGA % Sales 5.0% 4.1% 4.5% (0.5 % pts.) 0.4 % pts.
Restructuring and Other Charges ($12) $9 $232 $244 $223
Effective Tax Rate 16.1% 19.6% 31.0% 14.9 % pts. 11.4 % pts.
Income (Loss) from Continuing Operations $258 $172 ($193) ($451) ($365)
Income (Loss) Per Diluted Share $0.24 $0.15 ($0.18) ($0.42) ($0.33)For
per
sona
l use
onl
y

6
Restructuring and Other Special Items
$ Millions, except for per-share amounts 4Q’10 3Q’11 4Q’11
Income (Loss) from Continuing Operations $258 $172 ($193)
Income (Loss) Per Diluted Share $0.24 $0.15 ($0.18)
Restructuring Related $8 ($5) ($159)
Discrete Tax Items $18 $10 ($12)
Mark-to-Market Energy Contracts $9 $13 $8
Australia Asset Sale - - $18
Uninsured Losses - ($11) ($14)
Special Items $35 $7 ($159)
Income (Loss) from Continuing Ops excl Special Items $223 $165 ($34)
Income (Loss) per Diluted Share excl Special Items $0.21 $0.15 ($0.03)
See appendix for Adjusted Income (Loss) reconciliation
For
per
sona
l use
onl
y

4th Quarter 2011 vs. 3 rd Quarter 2011 Earnings Bridge
7See appendix for Adjusted Income (Loss) reconciliation
-$125m +$5m -$79m
Income (Loss) from Continuing Operations Excluding Restructuring & Other Special Items ($ millions)
For
per
sona
l use
onl
y

Alumina
4Q 10 3Q 11 4Q 11
Production (kmt) 4,119 4,140 4,178
3rd
Party Shipments (kmt) 2,433 2,256 2,378
3rd
Party Revenue ($ Millions) 759 879 847
ATOI ($ Millions) 65 154 125
8
4th Quarter Results
1st Quarter Outlook
4th Quarter Business Highlights
Days working capital down 3 days from 3Q 2011 and 4Q 2010
Performance gains more than offset cost increases
Caustic inflation continued
Land sale in Australia contributed positively tosegment ATOI
4th Quarter Performance Bridge
See appendix for reconciliations to GAAP and additional information
33% of 3rd
party shipments on spot or alumina price index
Other pricing to follow two-month lag on LME
Raw materials inflation to continue with $10 million ATOI impact
Australian maintenance and overhauls with $20 million ATOI impact
Productivity improvements to continue
For
per
sona
l use
onl
y

Primary Metals
4Q 10 3Q 11 4Q 11
Production (kmt) 913 964 962
3rd
Party Shipments (kmt) 743 754 805
3rd
Party Revenue ($ Millions) 1,970 2,124 1,991
3rd
Party Price ($/MT) 2,512 2,689 2,374
ATOI ($ Millions) 178 110 (32)
9
4th Quarter Results 4th Quarter Business Highlights
1st Quarter Outlook
Realized pricing down 12% sequentially
Higher raw materials cost, principally alumina
Record days workingcapital, down 7 days from 3Q 2011 and 4 days from 4Q 2010
4th Quarter Performance Bridge$ Millions
See appendix for reconciliations to GAAP and additional information
-$115m +$21m -$48m
market performance cost increases
Pricing to follow 15-day lag to LME
Falling regional premiums will impact ATOI by $20 million at current levels
Seasonal increases in smelting energy and scheduled maintenance at power plants for $25 million ATOI impact
Productivity improvements continue
For
per
sona
l use
onl
y

10
1st
Quarter Outlook
4th
Quarter Business Highlights4th
Quarter Results
ATOI $ Millions 4Q 10 3Q 11 4Q 11
Flat-Rolled Products,excl Russia, China & Other
55 57 32
Russia, China & Other (2) 3 (6)
Total ATOI 53 60 26
4th
Quarter Performance Bridge
Global Rolled Products
See appendix for reconciliations to GAAP and additional information
$ Millions
Seasonal decline in beverage can volumes in North America and Russia (NA -12%, RUS -23%)
European market declined 16%
Aerospace and automotive demand remain stable
Productivity improvements generated $4m
$5m impact from customer credit losses
Aerospace and automotive demand expected to remain strong
Productivity improvements will continue
Can stock demand expected to recover from seasonal low
European outlook continues to be weak
Negative impacts from higher energy and transportation costs
For
per
sona
l use
onl
y

$ Millions 4Q 10 3Q 11 4Q 11
3rd Party Revenue 1,215 1,373 1,355
ATOI 113 138 122
Adjusted EBITDA Margin 17% 18% 16%
Engineered Products and Solutions
11
4th Quarter Performance Bridge
4th Quarter Business Highlights4th Quarter Results12% revenue growth year-over-year and down 1% sequentially
8% improvement in ATOI year-over-year and down 12% sequentially
Favorable productivity driven by process improvements and procurement savings
Cost increases driven by Cleveland press outage andlower yield at certain businesses
Other non-operational cost predominantly obsolete inventory
1st Quarter Outlook
See appendix for reconciliations to GAAP and additional information
Productivity gains quarter-over-quarter
Aerospace market remains strong
Building & Construction market continuing to decline
Commercial Transportation market remains soft in Europe
Share gains through innovation continue across all market sectors
For
per
sona
l use
onl
y

($ Millions) 4Q’10 3Q’11 4Q’11
Net Income $292 $225 ($163)
DD&A $371 $377 $368
Change in Working Capital $569 ($93) $797
Pension Contributions ($43) ($114) ($119)
Taxes / Other Adjustments $181 $94 $259
Cash from Operations $1,370 $489 $1,142
Dividends to Shareholders ($31) ($33) ($33)
Change in Debt ($113) $72 $52
Distributions to Noncontrolling Interest ($102) ($66) ($4)
Contributions from Noncontrolling Interest $41 $8 $33
Other Financing Activities $4 ($8) $1
Cash from Financing Activities ($201) ($27) $49
Capital Expenditures ($365) ($325) ($486)
Other Investing Activities ($109) ($42) ($97)
Cash from Investing Activities ($474) ($367) ($583)
12
4Q’11 FCF$656 million
$1.9 billionof cash
Debt-to-Cap at 35%
DWC at historical low in 4Q
2011
See appendix for Free Cash Flow reconciliation
4th Quarter 2011 Cash Flow Overview
For
per
sona
l use
onl
y

Solid Performance in a Turbulent Year
13See appendix for Adjusted EBITDA reconciliations
For
per
sona
l use
onl
y
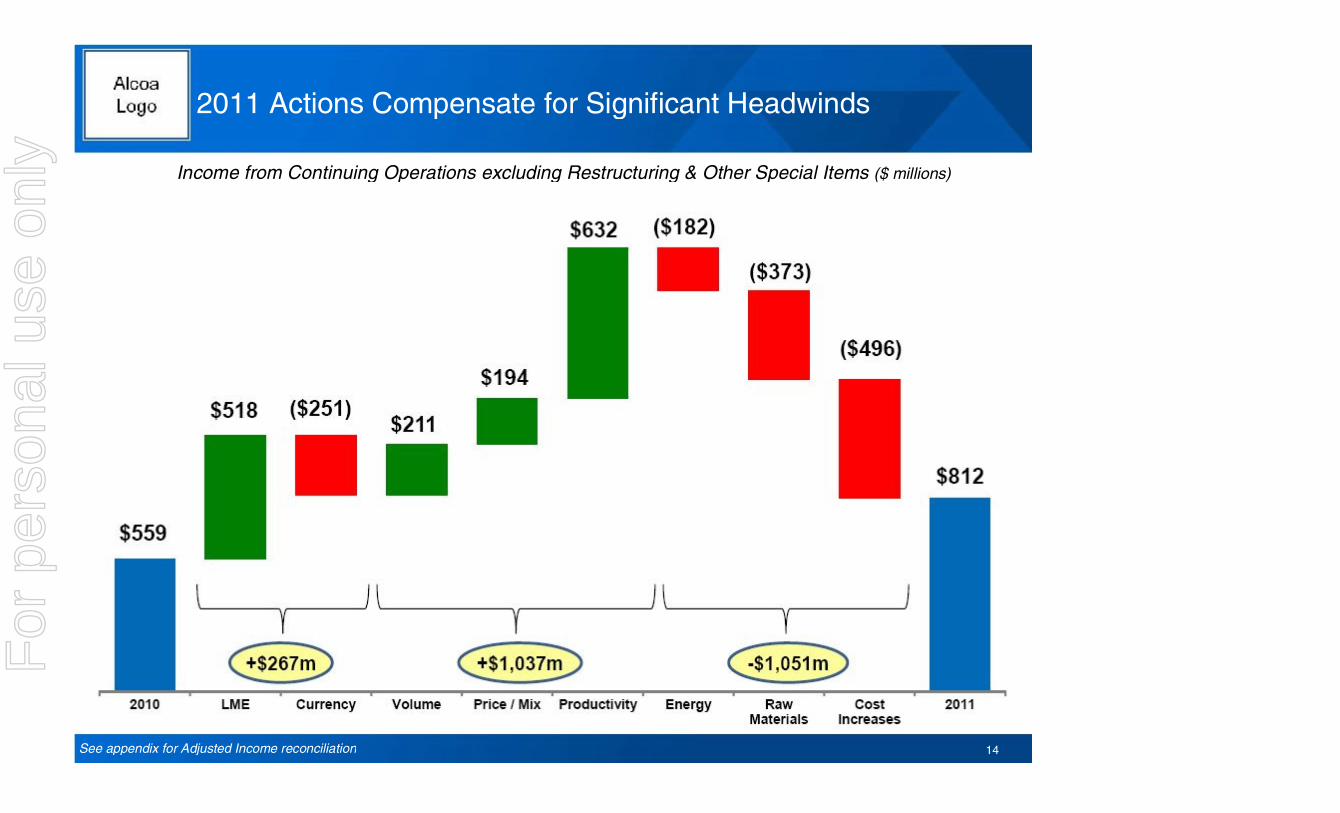
2011 Actions Compensate for Significant Headwinds
14See appendix for Adjusted Income reconciliation
Income from Continuing Operations excluding Restructuring & Other Special Items ($ millions)
For
per
sona
l use
onl
y

2011 Cash from Ops
$2.2 billion
2011 Cash on Hand
$1.9 billion
($ Millions) 2010 2011
Net Income $392 $805
DD&A $1,451 $1,481
Change in Working Capital $9 ($60)
Pension Contributions ($113) ($336)
Taxes / Other Adjustments $522 $303
Cash from Operations $2,261 $2,193
Dividends to Shareholders ($125) ($131)
Change in Debt ($675) $255
Distributions to Noncontrolling Interest ($256) ($257)
Contributions from Noncontrolling Interest $162 $169
Other Financing Activities ($58) $26
Cash from Financing Activities ($952) $62
Capital Expenditures ($1,015) ($1,287)
Other Investing Activities ($257) ($565)
Cash from Investing Activities ($1,272) ($1,852)
15
2010 FCF$1.2 billion
2011 FCF$906 million
See appendix for Free Cash Flow reconciliation
Full Year 2011 Cash Flow Overview
For
per
sona
l use
onl
y
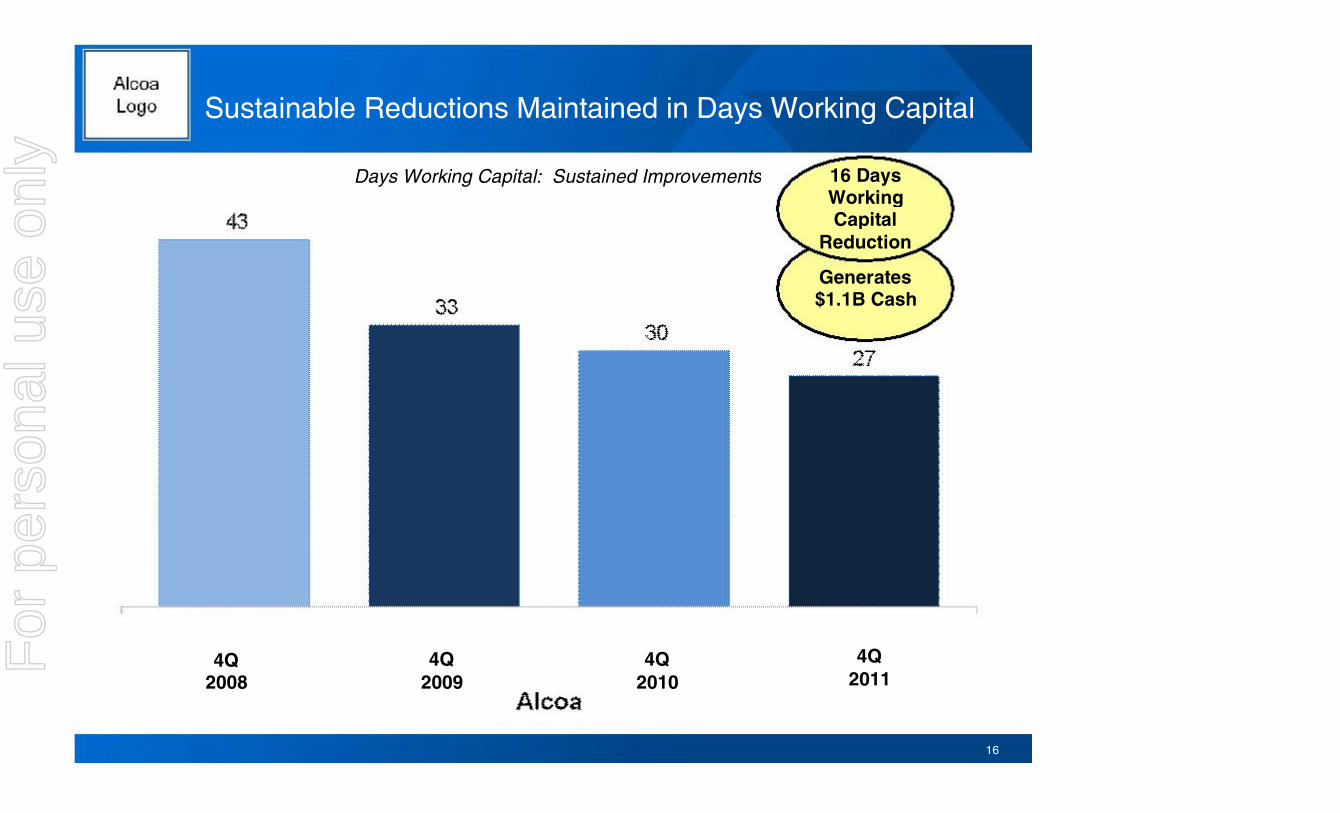
Generates $1.1B Cash
Sustainable Reductions Maintained in Days Working Capital
16
16 Days Working Capital
Reduction
4Q 2009
4Q 2010
4Q 2011
4Q 2008
Days Working Capital: Sustained Improvements
For
per
sona
l use
onl
y
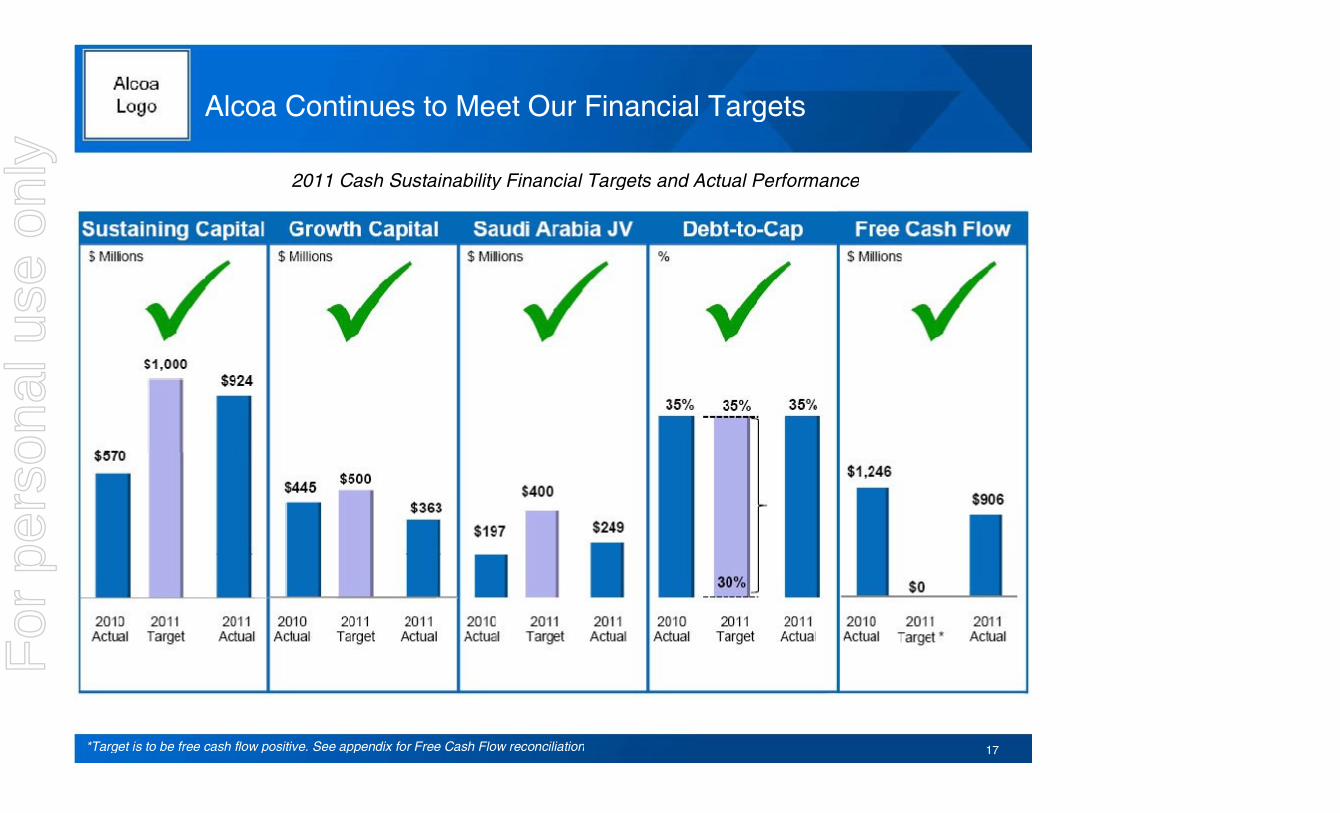
2011 Cash Sustainability Financial Targets and Actual Performance
Alcoa Continues to Meet Our Financial Targets
17*Target is to be free cash flow positive. See appendix for Free Cash Flow reconciliation
For
per
sona
l use
onl
y

Balance Sheet Is Strong: Alcoa Enters 2012 Managing for Cash
18See appendix for Free Cash Flow reconciliation
For
per
sona
l use
onl
y

Alcoa Meets Required Funding Status With Cash and Equity
19
For
per
sona
l use
onl
y

Alcoa Enters 2012 Managing for Cash: Cash Sustainability
20
3 Strategic Priorities & Key Levers of Cash Sustainability Program 2012
For
per
sona
l use
onl
y

Working CapitalDWC reduction
Operational Targets Financial Targets
Swift Action Taken: Improved Cost Structure and Balance Sheet
New Aggressive Targets to Maximize Cash Through 2012
21
Capacity Optimization
Productivity GainsCost savings in 2012
Controlled OverheadCost savings in 2012
Positive Free Cash Flow
Disciplined Capital Spend
Sustaining Capex
Growth Capex
Saudi Arabia JV
Maintain Capital StructureDebt-to-Capital Ratio
30-35%
$725M
$625M
$350M
$800M
$50M
1.5 days
531 kmt closed or curtailed
For
per
sona
l use
onl
y

Klaus KleinfeldChairman and Chief Executive Officer
For
per
sona
l use
onl
y

2011 YEAR IN REVIEW
23
For
per
sona
l use
onl
y

15%
1%
6%
10%
15%10%
3%4%
5.3
3.3
1.81.00.9
China
Europe
North America
Asia ex. China
Other
IndiaBrazil
Russia
19.0
6.7
5.7
2011Forecast
2010 Global DemandGrowth Rate: 13 %
2011 Global DemandGrowth Rate 10% vs. 2010
(2011 ex China: 7%)
*Other consists of: Middle East, Latin America ex Brazil and Rest of the World
2011 Projected Primary Aluminum Consumption (mmt) and Growth Rates (%) by Region
Global Demand Remains Strong, 2H11 Experienced Slowdown
43.72011 Estimated Consumption
24
For
per
sona
l use
onl
y

Overall Supply/Demand Balance Meets Projections
25
Primary Aluminum
Source: Alcoa estimates, Brook Hunt, CRU, CNIA, IAI
(000 mt) China Rest of World
Supply 17,800 26,000
Demand (19,000) (24,650)
Net Balance (1,200) 1,350
Alumina
(000 mt) China Rest of World
Supply 34,100 52,200
Demand (34,100) (52,200)
Net Balance 0 0
2011 Supply/Demand Balance (in kmt)
For
per
sona
l use
onl
y

Solid Performance in a Turbulent Year
26See appendix for Adjusted EBITDA reconciliations
For
per
sona
l use
onl
y

Leveraging Our Strategic Growth Investments
Juruti, Brazil – Bauxite Mine Sao Luis – Refinery Estreito – Hydro Dam
Strategic Investments: Driving Profitable Growth
27
Saudi Arabia Joint Venture
30% Cash Cost Reduction
At NameplateCapacity
Lowest Cost Integrated Facility
277 MW by 2012
On TimeOn Budget
For
per
sona
l use
onl
y

GRP Growth Projects Capturing Global Opportunity
28
Russia Grows Profitably China Positioned For Growth Davenport Growth
Capacity utilization will reach 70% by 2012
Key domestic supplier into growing markets
Positive EBITDA in 2011, focusing on differentiation
End & Tab Line, Samara Bohai Flat Rolled Products Davenport Rolling Mill
$300M investment to meet rising US auto demand
Capturing 7.5x increase in autosheet demand 2011-2020
Growing capacity to supporthigher aerospace build rates
Improving cost position
Improving mix of products
23% YOY increase in volume
$150 million turnaround in Russia profit from 2008
For
per
sona
l use
onl
y
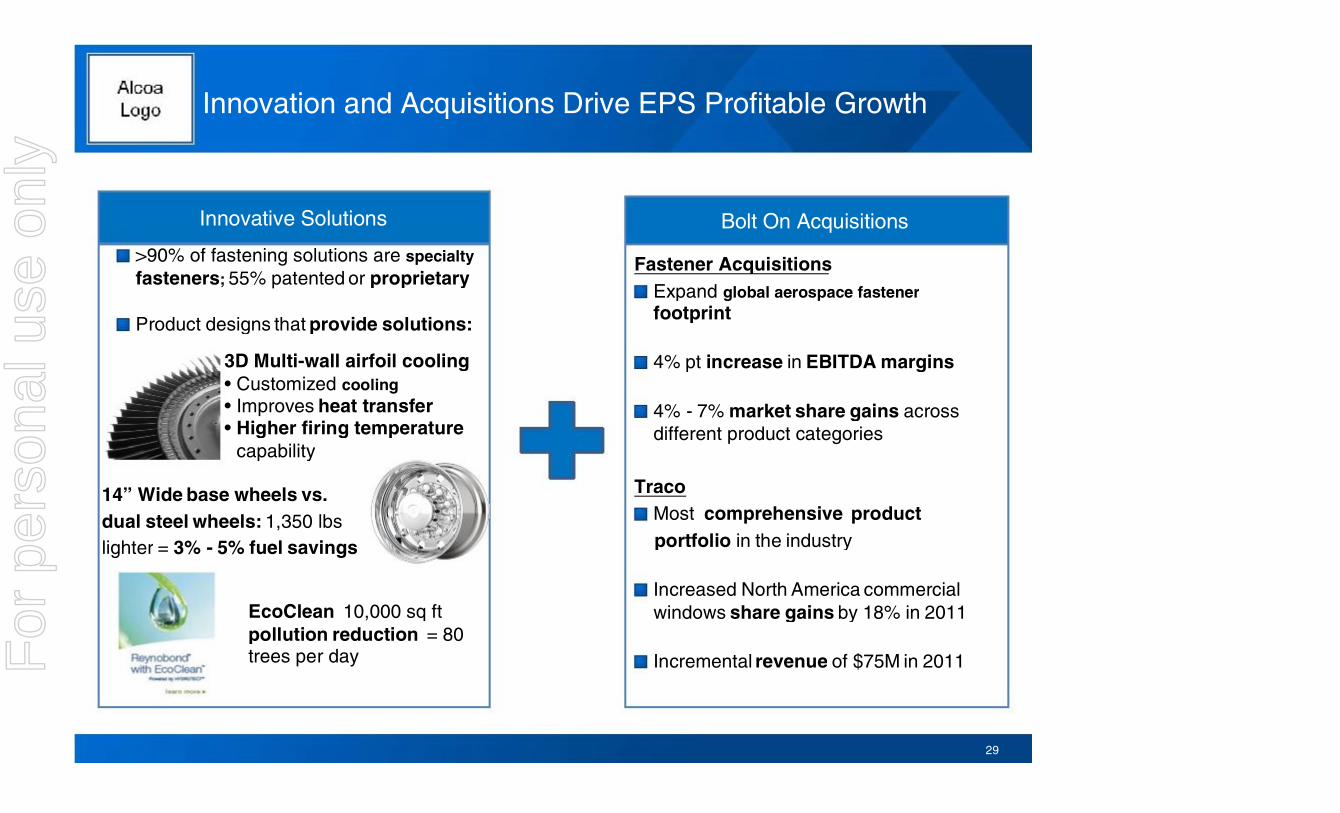
Innovation and Acquisitions Drive EPS Profitable Growth
29
Innovative Solutions
Fastener AcquisitionsExpand global aerospace fastenerfootprint
4% pt increase in EBITDA margins
4% - 7% market share gains across different product categories
TracoMost comprehensive productportfolio in the industry
Increased North America commercial windows share gains by 18% in 2011
Incremental revenue of $75M in 2011
Bolt On Acquisitions
>90% of fastening solutions are specialty fasteners; 55% patented or proprietary
Product designs that provide solutions:
3D Multi-wall airfoil cooling• Customized cooling• Improves heat transfer• Higher firing temperature
capability
EcoClean 10,000 sq ft pollution reduction = 80 trees per day
14” Wide base wheels vs.dual steel wheels: 1,350 lbslighter = 3% - 5% fuel savings
For
per
sona
l use
onl
y

Achieved 2011 Financial Targets
Met Aggressive Targets for Third Consecutive Year
30
• Sustaining Capex
• Growth Capex
• Saudi Arabia JV
• Debt to Capital
• Free Cash Flow
Target: $1.0b
Actual: $924m
Target: $500m
Actual: $363m
Target: $400m
Actual: $249m
Target: 30-35%
Actual: 35%
Target: $0
Actual: $906m
For
per
sona
l use
onl
y

2012 OUTLOOK
31
For
per
sona
l use
onl
y
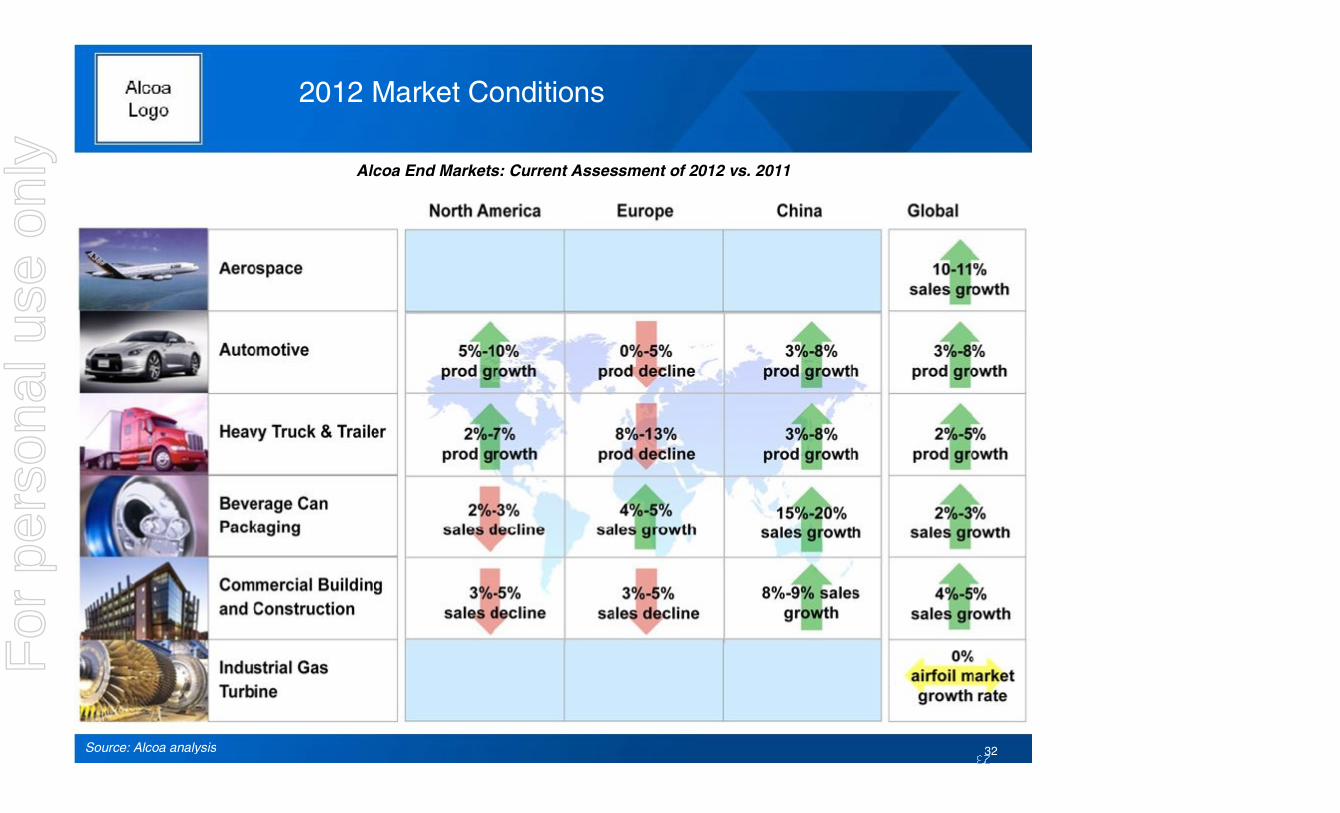
2012 Market Conditions
3232
Alcoa End Markets: Current Assessment of 2012 vs. 2011
Source: Alcoa analysis
For
per
sona
l use
onl
y

0%
6% 3%
2012
15% 12%
1%
3%10%10%
5%
9%10%
4% 4%
2011
5%
China
Europe
North America
Asia ex. China
Other
India
BrazilRussia
21.3
6.7
5.9
5.8
3.41.9
1.00.9
2011 Forecast
2012 Forecast
2011 Global DemandGrowth Rate: 10 %
2012 Global DemandGrowth Rate 7% vs. 2011
(2012 ex China: 4 %)
*Other consists of: Middle East, Latin America ex Brazil and ROW
2012 Projected Primary Aluminum Consumption (mmt) Growth Rates (%) by Region
2012 Demand Growth Continues, But at a Slower Pace
47.02012 Estimated Consumption
33
15%
For
per
sona
l use
onl
y

Inventories 4 Days Higher Year-on-YearPremiums Off Highs But Strong Historically
Premiums Decline But Remain Strong, Inventory Increases
34
$112 /MT
$170 /MT
$163 /MT
Source: Alcoa estimates, LME, SHFE, IAI, Marubeni, Platt’s Metals Week and Metal Bulletin
LME at 40 days
Non-LME at17 days
Global Inventories
Rose 4 days vs. 3Q’11
57 days of consumption
Regional Premiums and Aluminum Inventories
For
per
sona
l use
onl
y
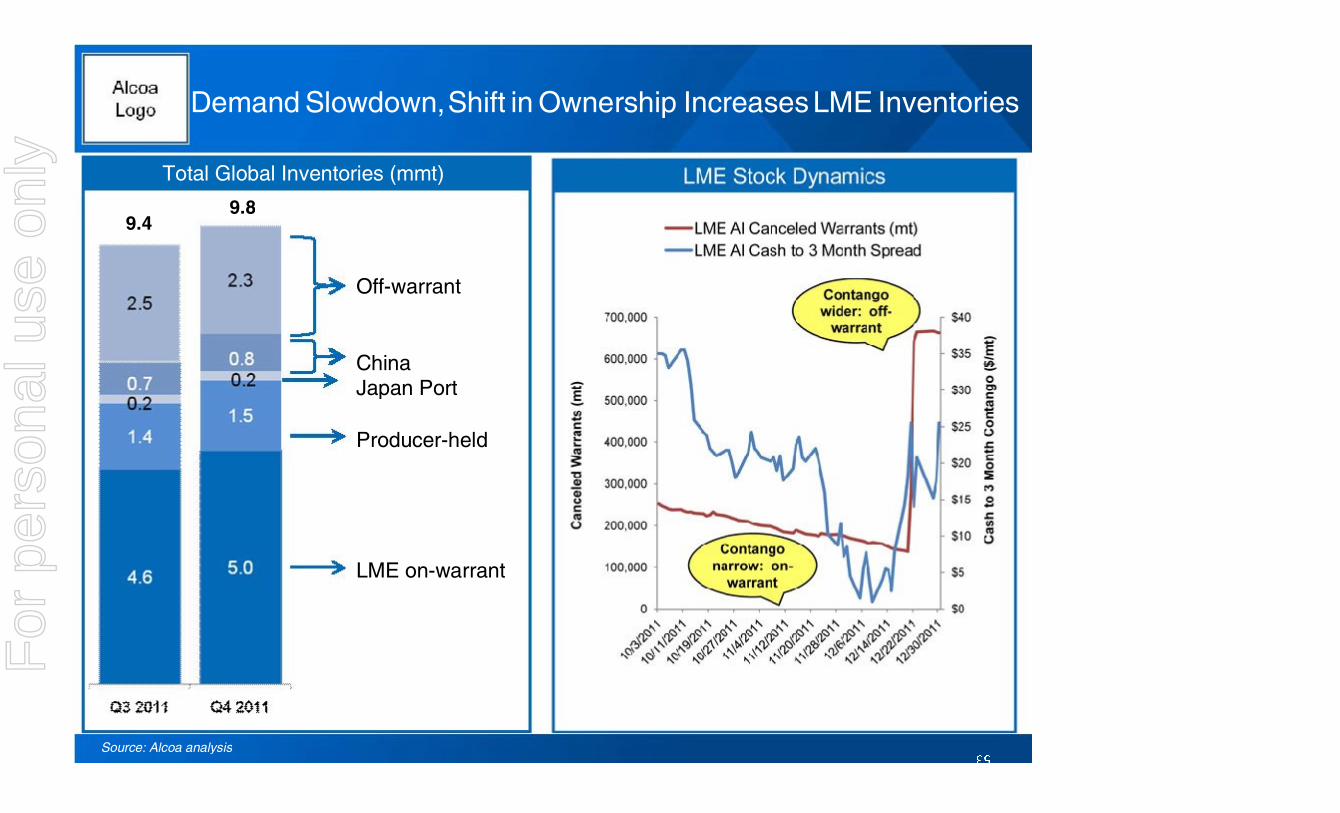
Demand Slowdown,Shift in Ownership IncreasesLME Inventories
35
Off-warrant
China Japan Port
Producer-held
LME on-warrant
Total Global Inventories (mmt)
Source: Alcoa analysis
9.49.8
For
per
sona
l use
onl
y

2012 Primary Aluminum Moves into Deficit, Alumina Balanced
36
Primary Aluminum
Source: Alcoa estimates, Brook Hunt, CRU, CNIA, IAI
(000 mt) China Rest of World
2011 Production Run Rate 17,800 26,000
2012 Production Additions 3,750 700
2012 Capacity Curtailments (1,100) (700)
Total Supply 20,450 26,000
Demand (21,300) (25,750)
Net Balance (850) 250
Alumina
(000 mt) China Rest of World
Supply 36,700 57,200
Demand (39,200) (54,700)
Net Balance (2,500) 2,500
Import/(Exports) 2,500 (2,500)
Net Balance 0 0
2012E Supply/Demand Balance (in kmt)
For
per
sona
l use
onl
y

Chinese Primary Metal Production by Full Operating Cost (million, tonnes)
Unprofitable Smelter Production byProvince (million, tonnes)
Estimate More Than 1/3 of Chinese Smelters Operating Under Water at End of 2011
* 17% VAT inclusive in the price and cost** Full operating cost excludes depreciation and capital charge 37Source: CRU, AMM, Aladdiny, Alcoa analysis
Henan
Guizhou
Yunnan
Sichuan
Shandong
Guangxi
Shaanxi
Liaoning
Zhejiang
Unprofitable
Costs At Or AboveSHFE $2,4005.7MnT, 32%
Profitable
Costs BelowSHFE $2,400
12.1MnT, 68%
For
per
sona
l use
onl
y

Aluminum Continues to Be an Attractive Asset Class
Sources: Bloomberg, Dow UBS, Reuters, Marketwatch 38
Asset Allocation By Commodity SectorDow UBS Commodity Index $90B
Composition of Base Metal Sector
For
per
sona
l use
onl
y

Macro Environment Putting Downward Pressure on Prices
39Sources: Bloomberg, *Confidence figures set at 100 in January 2011 for comparability ; 1EC Commission EU Confidence, 2National Bureau of Statistics China Consumer Confidence, 3 University of Michigan Consumer Sentiment . PMI: Institute for Supply Management , Markit, China Federation of Logistics & Purchasing
For
per
sona
l use
onl
y

Combination of Factors Signals Likely Pricing Rebound
7% global aluminum demand growth in 2012
Primary aluminum balance moves to deficit
Aluminum continues to be an attractive asset class
Macro economic indicators showing positive signals
40
For
per
sona
l use
onl
y

Taking Decisive Action With Cash Sustainability Program
41
3 Strategic Priorities & Key Levers of Cash Sustainability Program 2012
For
per
sona
l use
onl
y

Maximize cash position for ramp down and ramp up, considering:
• Operational flexibility
• Power flexibility
• Repowering impact
• Community impact
Smelting: Utilize material in inventory to reline, but do not restart pots
Targeted smaller curtailmentsbased upon cost & strategicsituation
Full curtailment of selected plants
Permanent shutdowns of selected plants
Curtailment Steps
Production Curtailments: Tiered Approach
Guiding Principle
Curtailments Improve Cost Position and Competitiveness
42
PortovesmeDependent on business conditions
TennesseeRockdale (2 lines)
Curtailment: 5%Shutdown: 7%
Refinery output matched to curtailments and market conditions
La CoruñaAvilésF
or p
erso
nal u
se o
nly
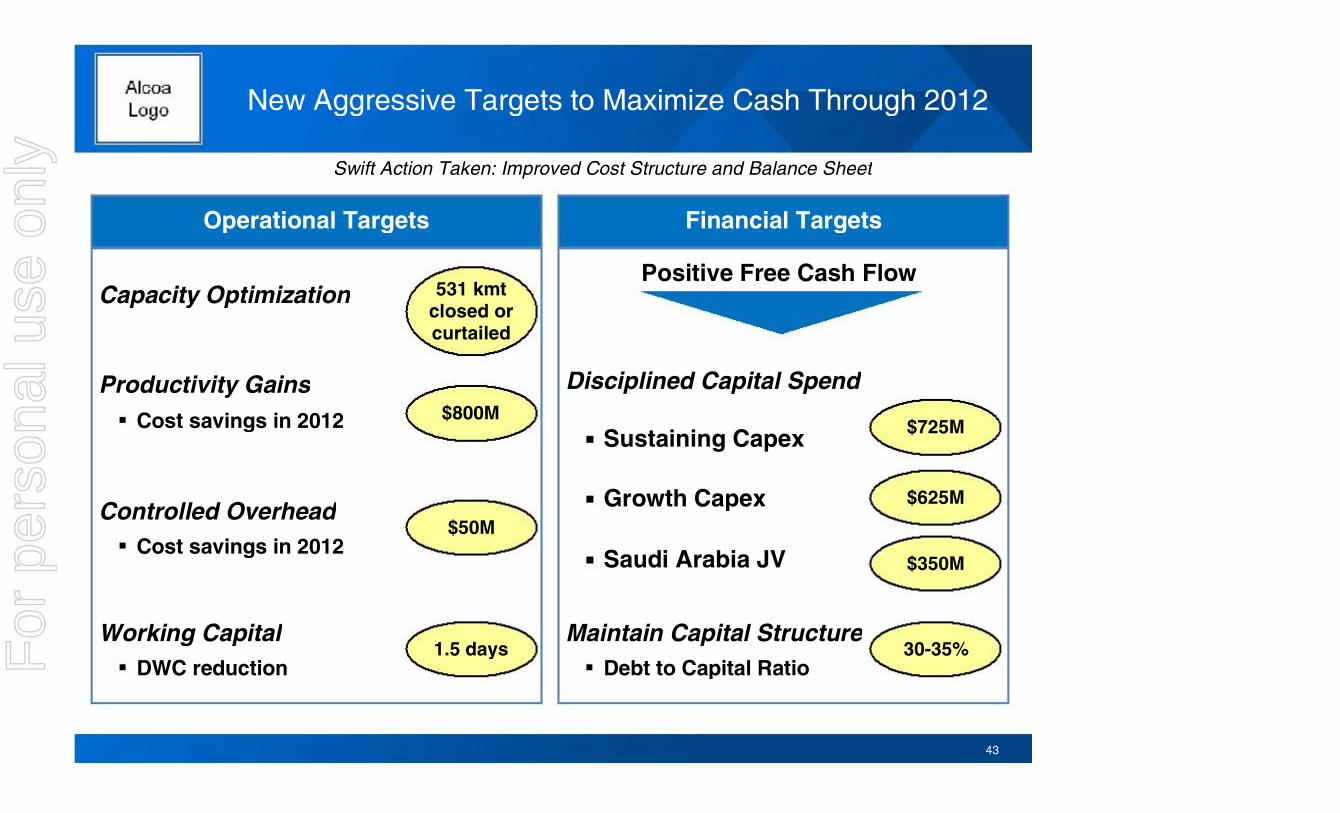
Working CapitalDWC reduction
Operational Targets Financial Targets
Swift Action Taken: Improved Cost Structure and Balance Sheet
New Aggressive Targets to Maximize Cash Through 2012
43
Capacity Optimization
Productivity GainsCost savings in 2012
Controlled OverheadCost savings in 2012
Positive Free Cash Flow
Disciplined Capital Spend
Sustaining Capex
Growth Capex
Saudi Arabia JV
Maintain Capital StructureDebt to Capital Ratio
30-35%
$725M
$625M
$350M
$800M
$50M
1.5 days
531 kmt closed or curtailed
For
per
sona
l use
onl
y

For
per
sona
l use
onl
y

Additional Information
Kelly PasterickDirector, Investor RelationsAlcoa390 Park AvenueNew York, NY 10022-4608Telephone: (212) 836-2674www.alcoa.com
45
For
per
sona
l use
onl
y
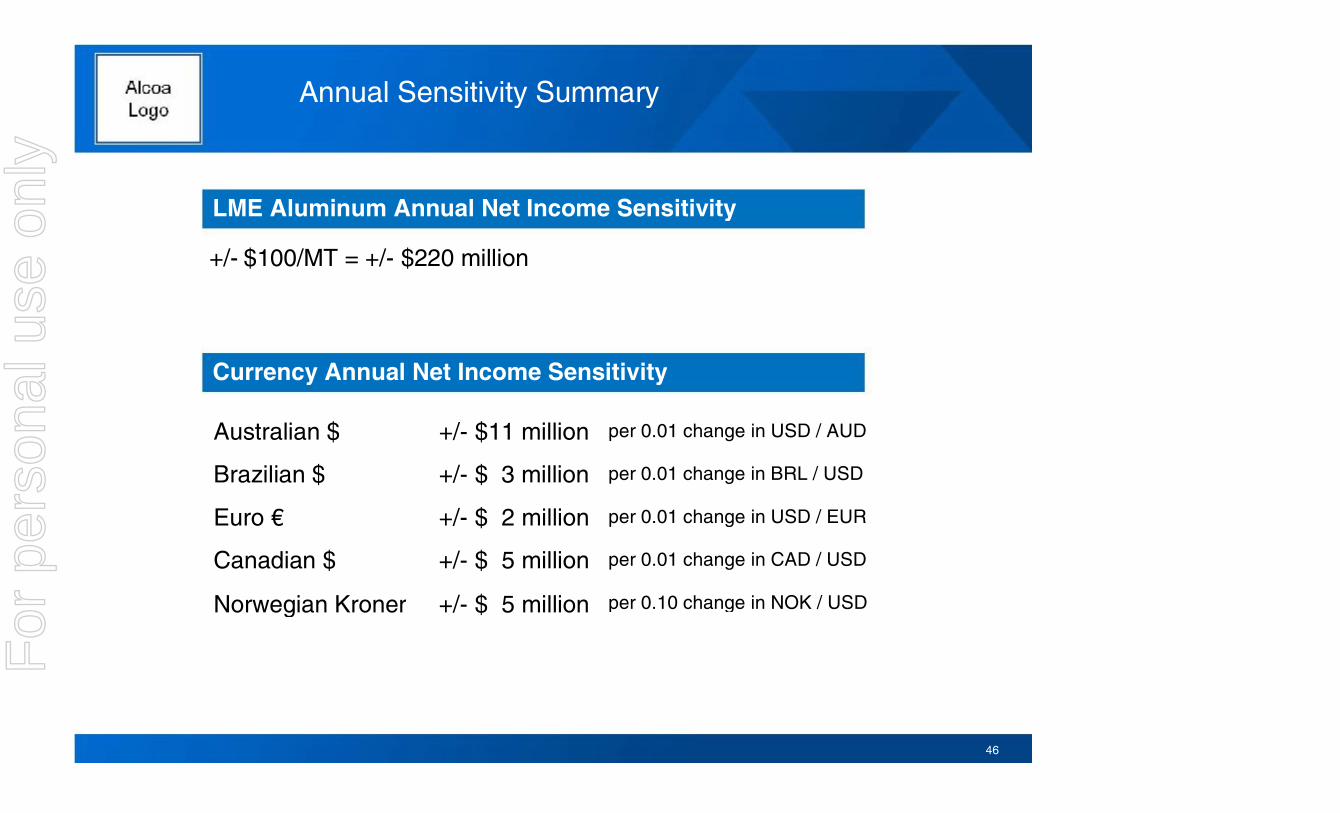
Annual Sensitivity Summary
46
Currency Annual Net Income Sensitivity
+/- $100/MT = +/- $220 million
LME Aluminum Annual Net Income Sensitivity
Australian $ +/- $11 million per 0.01 change in USD / AUD
Brazilian $ +/- $ 3 million per 0.01 change in BRL / USD
Euro €€ +/- $ 2 million per 0.01 change in USD / EUR
Canadian $ +/- $ 5 million per 0.01 change in CAD / USD
Norwegian Kroner +/- $ 5 million per 0.10 change in NOK / USD
For
per
sona
l use
onl
y

Reconciliation of Effective Tax Rate
47
Effective tax rate, excluding discrete tax items is a non-GAAP financial measure. Management believes that the Effective tax rate, excluding discrete tax items is meaningful to investors because it provides a view of Alcoa’s operational tax rate.
($ in millions) 4Q’11 2011
(Loss) income from continuing operations before income taxes ($239) $1,063
(Benefit) provision for income taxes ($74) $255
Effective tax rate as reported 31.0% 24.0%
Discrete tax charges (benefits) $11 ($2)
(Benefit) provision for income taxes excluding discrete tax items ($85) $257
Effective tax rate excluding discrete tax items 35.6% 24.2%
For
per
sona
l use
onl
y

Revenue Change by Market
5%
(2%)
(15%)
(8%)
(15%)
1%
(17%)
(7%)
(4%)
(6%)
21%
22%
(7%)
30%
2%
(6%)
2%
(8%)
12%
1%
4Q’11 Third-Party RevenueSequential
ChangeYear-Over-Year
Change
48
For
per
sona
l use
onl
y

Reconciliation of ATOI to Consolidated Net Income (Loss) Attributable to Alcoa
(in millions)
4Q10 2010 1Q11 2Q11 3Q11 4Q11 2011
Total segment ATOI $ 409 $ 1,424 $ 555 $ 635 $ 462 $ 241 $ 1,893 Unallocated amounts (net of tax): Impact of LIFO 3 (16) (24) (27) 2 11 (38) Interest expense (76) (321) (72) (106) (81) (81) (340) Noncontrolling interests (34) (138) (58) (55) (53) (28) (194) Corporate expense (94) (291) (67) (76) (76) (71) (290) Restructuring and other charges 8 (134) (6) (22) (7) (161) (196) Discontinued operations – (8) (1) (4) – 2 (3) Other 42 (262) (19) (23) (75) (104) (221) Consolidated net income (loss) attributable to
Alcoa $ 258 $ 254 $ 308 $ 322 $ 172 $ (191) $ 611
49
For
per
sona
l use
onl
y
Reconciliation of Adjusted Income
50
For
per
sona
l use
onl
y
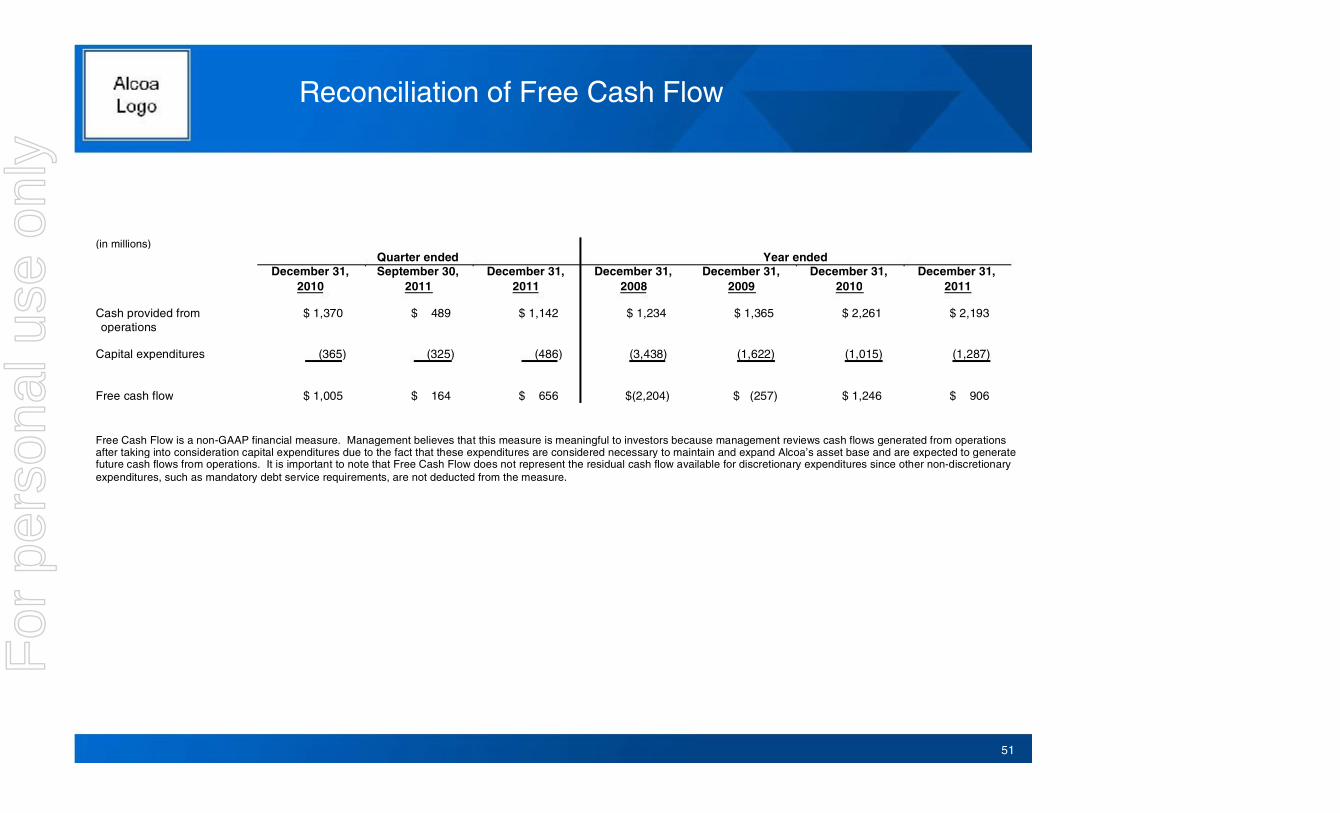
Reconciliation of Free Cash Flow
51
(in millions) Quarter ended Year ended
December 31, 2010
September 30, 2011
December 31, 2011
December 31, 2008
December 31, 2009
December 31, 2010
December 31, 2011
Cash provided from operations
$ 1,370 $ 489 $ 1,142 $ 1,234 $ 1,365 $ 2,261 $ 2,193
Capital expenditures (365) (325) (486) (3,438) (1,622) (1,015) (1,287)
Free cash flow $ 1,005 $ 164 $ 656 $(2,204) $ (257) $ 1,246 $ 906
Free Cash Flow is a non-GAAP financial measure. Management believes that this measure is meaningful to investors because management reviews cash flows generated from operations after taking into consideration capital expenditures due to the fact that these expenditures are considered necessary to maintain and expand Alcoa’s asset base and are expected to generate future cash flows from operations. It is important to note that Free Cash Flow does not represent the residual cash flow available for discretionary expenditures since other non-discretionary expenditures, such as mandatory debt service requirements, are not deducted from the measure.
For
per
sona
l use
onl
y
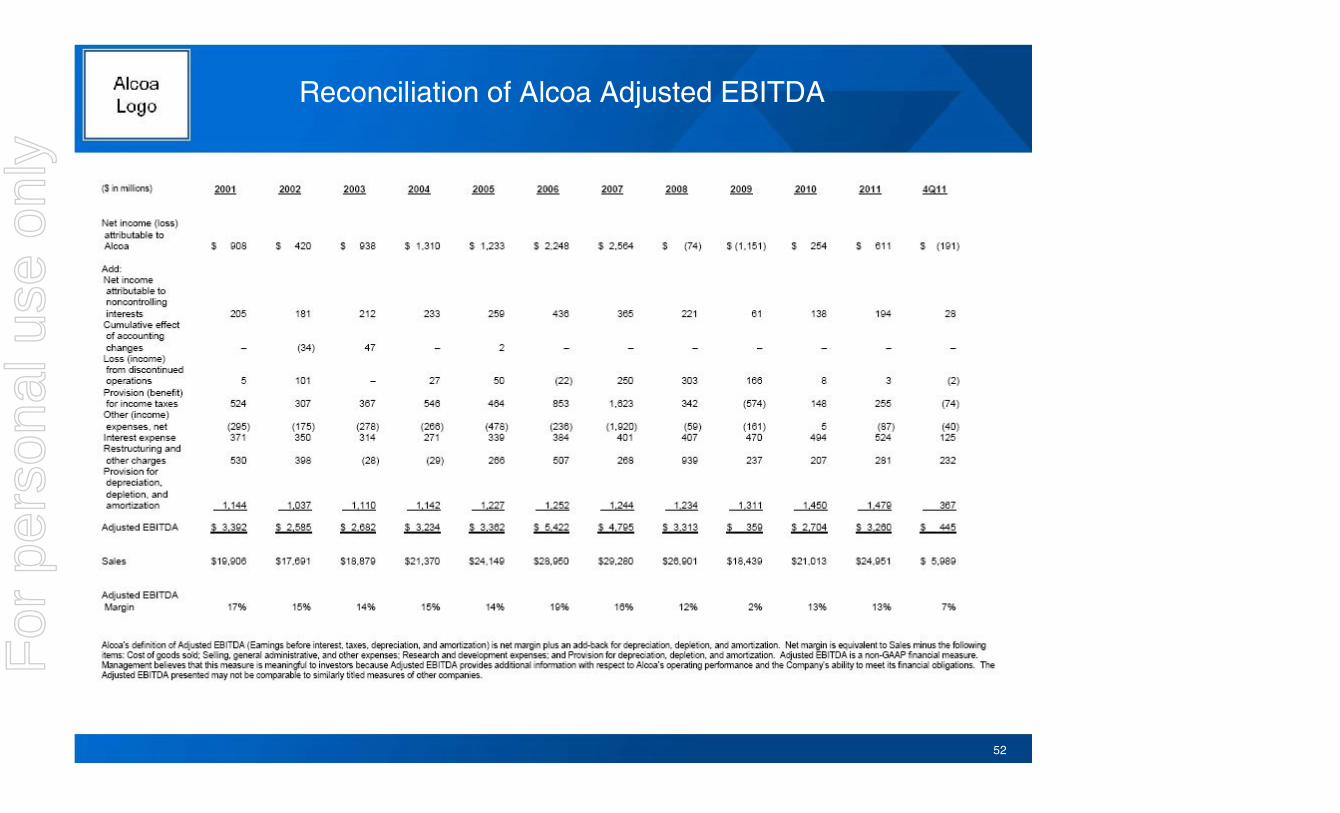
Reconciliation of Alcoa Adjusted EBITDA
52
For
per
sona
l use
onl
y

Reconciliation of Alumina Adjusted EBITDA
53
For
per
sona
l use
onl
y

Reconciliation of Primary Metals Adjusted EBITDA
54
For
per
sona
l use
onl
y

Reconciliation of Flat-Rolled Products Adjusted EBITDA
55
For
per
sona
l use
onl
y

Reconciliation of Engineered Products and SolutionsAdjusted EBITDA
56
For
per
sona
l use
onl
y

Reconciliation of Net Debt
57
(in millions) Quarter ended
December 31, 2008
September 30, 2011
December 31, 2011
Short-term borrowings $ 478 $ 57 $ 62 Commercial paper 1,535 107 224 Long-term debt due within one year
56
489
445
Long-term debt, less amount due within one year
8,509
8,658
8,640
Total debt 10,578 9,311 9,371
Less: Cash and cash equivalents 762 1,332 1,939
Net debt $ 9,816 $ 7,979 $ 7,432
Net debt is a non-GAAP financial measure. Management believes that this measure is meaningful to investors because management assesses Alcoa’s leverage position after factoring in available cash that could be used to repay outstanding debt.
For
per
sona
l use
onl
y