washington, d.c. 20549 form 10-q · lehman brothers holdings inc. - 3 - available information...
TRANSCRIPT

UNITED STATES SECURITIES AND EXCHANGE COMMISSION
Washington, D.C. 20549
FORM 10-Q
(Mark One)
QUARTERLY REPORT PURSUANT TO SECTION 13 OR 15(d) OF THE SECURITIES EXCHANGE ACT OF 1934
For the quarterly period ended May 31, 2008
OR
���� TRANSITION REPORT PURSUANT TO SECTION 13 OR 15(d) OF THE SECURITIES EXCHANGE ACT OF 1934
For the transition period from ____________ to ____________
Commission file number 1-9466
Lehman Brothers Holdings Inc. (Exact name of registrant as specified in its charter)
Delaware 13-3216325 (State or other jurisdiction of (I.R.S. Employer incorporation or organization) Identification No.) 745 Seventh Avenue, New York, New York 10019 (Address of principal executive offices) (Zip Code)
(212) 526-7000 (Registrant’s telephone number, including area code)
Indicate by check mark whether the registrant (1) has filed all reports required to be filed by Section 13 or 15(d) of the Securities Exchange Act of 1934 during the preceding 12 months (or for such shorter period that the registrant was required to file such reports), and (2) has been subject to such filing requirements for the past 90 days. Yes No � Indicate by check mark whether the registrant is a large accelerated filer, an accelerated filer, a non-accelerated filer, or a smaller reporting company. See the definitions of “large accelerated filer,” “accelerated filer” and “smaller reporting company” in Rule 12b-2 of the Exchange Act. Large accelerated filer Accelerated filer � Non-accelerated filer � (Do not check if a smaller reporting company) Smaller reporting company � Indicate by check mark whether the registrant is a shell company (as defined in Rule 12b-2 of the Exchange Act). Yes � No As of June 30, 2008, 694,401,926 shares of the Registrant’s Common Stock, par value $0.10 per share, were outstanding.

[This page intentionally left blank.]

LEHMAN BROTHERS HOLDINGS INC.
FORM 10-Q
FOR THE QUARTER ENDED May 31, 2008
Contents
Page Number
Available Information ..................................................................................................................................................... 3
Part I. FINANCIAL INFORMATION
Item 1. Financial Statements—(unaudited)
Consolidated Statement of Income— Three and Six Months Ended May 31, 2008 and 2007 ........................................................................ 4
Consolidated Statement of Financial Condition— May 31, 2008 and November 30, 2007 ................................................................................................... 5
Consolidated Statement of Cash Flows— Six Months Ended May 31, 2008 and 2007............................................................................................ 7
Notes to Consolidated Financial Statements ......................................................................................... 8
Report of Independent Registered Public Accounting Firm .............................................................. 53
Item 2. Management’s Discussion and Analysis of Financial Condition and Results of Operations ...................................................................................... 54
Item 3. Quantitative and Qualitative Disclosures About Market Risk ................................................................. 109
Item 4. Controls and Procedures ................................................................................................................................. 109
Part II. OTHER INFORMATION
Item 1. Legal Proceedings........................................................................................................................................... 110
Item 1A. Risk Factors ..................................................................................................................................................... 112
Item 2. Unregistered Sales of Equity Securities and Use of Proceeds................................................................ 113
Item 4 Submission of Matters to a Vote of Security Holders............................................................................. 114
Item 6. Exhibits ............................................................................................................................................................ 115
Signatures .......................................................................................................................................................................... 117
Exhibit Index.................................................................................................................................................................... 118

LEHMAN BROTHERS HOLDINGS INC.
- 3 -
AVAILABLE INFORMATION Lehman Brothers Holdings Inc. (“Holdings”) files annual, quarterly and current reports, proxy statements and other information with the United States Securities and Exchange Commission (“SEC”). You may read and copy any document Holdings files with the SEC at the SEC’s Public Reference Room at 100 F Street, NE, Washington, DC 20549, U.S.A. You may obtain information on the operation of the Public Reference Room by calling the SEC at 1-800-SEC-0330 (or 1-202-551-8090). The SEC maintains an internet site that contains annual, quarterly and current reports, proxy and information statements and other information regarding issuers that file electronically with the SEC. Holdings’ electronic SEC filings are available to the public at http://www.sec.gov.
Holdings’ public internet site is http://www.lehman.com. Holdings makes available free of charge through its internet site, via a link to the SEC’s internet site at http://www.sec.gov, its annual reports on Form 10-K, quarterly reports on Form 10-Q, current reports on Form 8-K and amendments to those reports filed or furnished pursuant to Section 13(a) or 15(d) of the Securities Exchange Act of 1934, as amended (the “Exchange Act”), as soon as reasonably practicable after it electronically files such material with, or furnishes it to, the SEC. Holdings also makes available through its internet site, via a link to the SEC’s internet site, statements of beneficial ownership of Holdings’ equity securities filed by its directors, officers, 10% or greater shareholders and others under Section 16 of the Exchange Act.
In addition, Holdings currently makes available on http://www.lehman.com its most recent annual report on Form 10-K, its quarterly reports on Form 10-Q for the current fiscal year, its most recent proxy statement and its most recent annual report to stockholders, although in some cases these documents are not available on that site as soon as they are available on the SEC’s site.
Holdings also makes available on http://www.lehman.com (i) its Corporate Governance Guidelines, (ii) its Code of Ethics (including any waivers therefrom granted to executive officers or directors) and (iii) the charters of the Audit, Compensation and Benefits, and Nominating and Corporate Governance Committees of its Board of Directors. These documents are also available in print without charge to any person who requests them by writing or telephoning:
Lehman Brothers Holdings Inc. Office of the Corporate Secretary 1271 Avenue of the Americas
42nd Floor New York, New York 10020, U.S.A.
1-212-526-0858
In order to view and print the documents referred to above (which are in the .PDF format) on Holdings’ internet site, you will need to have installed on your computer the Adobe® Acrobat® Reader® software. If you do not have Adobe Acrobat, a link to Adobe Systems Incorporated’s internet site, from which you can download the software, is provided.

LEHMAN BROTHERS HOLDINGS INC.
PART I—FINANCIAL INFORMATION
- 4 -
ITEM 1. Financial Statements
LEHMAN BROTHERS HOLDINGS INC.
Consolidated Statement of Income
(Unaudited)
Three Months Ended May 31, Six Months Ended May 31,
In millions, except per share data 2008 2007 2008 2007
Revenues Principal transactions $(3,442) $ 2,889 $(2,670) $ 5,810
Investment banking 858 1,150 1,725 2,000 Commissions 639 568 1,297 1,108
Interest and dividends 7,771 10,558 17,405 19,647
Asset management and other 414 414 853 809
Total revenues 6,240 15,579 18,610 29,374
Interest expense 6,908 10,067 15,771 18,815
Net revenues (668) 5,512 2,839 10,559
Non-Interest Expenses
Compensation and benefits 2,325 2,718 4,166 5,206
Technology and communications 309 287 612 553
Brokerage, clearance and distribution fees 252 201 504 395
Occupancy 188 152 373 298
Professional fees 100 120 198 218
Business development 87 100 175 184
Other 158 55 235 127
Total non-personnel expenses 1,094 915 2,097 1,775
Total non-interest expenses 3,419 3,633 6,263 6,981
Income before taxes (4,087) 1,879 (3,424) 3,578
Provision for income taxes (1,313) 606 (1,139) 1,159
Net income $(2,774) $ 1,273 $(2,285) $ 2,419
Net income applicable to common stock $(2,873) $ 1,256 $(2,408) $ 2,385
Earnings per common share:
Basic $ (5.14) $ 2.33 $ (4.33) $ 4.42
Diluted $ (5.14) $ 2.21 $ (4.33) $ 4.17
Dividends paid per common share $ 0.17 $ 0.15 $ 0.34 $ 0.30
See Notes to Consolidated Financial Statements.

LEHMAN BROTHERS HOLDINGS INC. Consolidated Statement of Financial Condition
(Unaudited)
- 5 -
At
In millions May 31, 2008 Nov 30, 2007
Assets
Cash and cash equivalents $ 6,513 $ 7,286
Cash and securities segregated and on deposit for regulatory and other purposes 13,031 12,743
Financial instruments and other inventory positions owned (includes $43,031 in 2008 and $63,499 in 2007 pledged as collateral) 269,409 313,129
Collateralized agreements:
Securities purchased under agreements to resell 169,684 162,635
Securities borrowed 124,842 138,599
Receivables:
Brokers, dealers and clearing organizations 16,701 11,005
Customers 20,784 29,622
Others 4,236 2,650
Property, equipment and leasehold improvements (net of accumulated depreciation and amortization of $2,697 in 2008 and $2,438 in 2007) 4,278 3,861
Other assets 5,853 5,406
Identifiable intangible assets and goodwill (net of accumulated amortization of $361 in 2008 and $340 in 2007) 4,101 4,127
Total assets $639,432 $691,063
See Notes to Consolidated Financial Statements.

LEHMAN BROTHERS HOLDINGS INC. Consolidated Statement of Financial Condition—(Continued)
(Unaudited)
- 6 -
At In millions, except share data May 31, 2008 Nov 30, 2007
Liabilities and Stockholders’ Equity
Short-term borrowings and current portion of long-term borrowings
(including $9,354 in 2008 and $9,035 in 2007 at fair value) $ 35,302 $ 28,066
Financial instruments and other inventory positions sold but not yet purchased 141,507 149,617
Collateralized financings:
Securities sold under agreements to repurchase 127,846 181,732
Securities loaned 55,420 53,307
Other secured borrowings
(including $13,617 in 2008 and $9,149 in 2007 at fair value) 24,656 22,992
Payables:
Brokers, dealers and clearing organizations 3,835 3,101
Customers 57,251 61,206
Accrued liabilities and other payables 9,802 16,039
Deposit liabilities at banks
(including $10,252 in 2008 and $15,986 in 2007 at fair value) 29,355 29,363
Long-term borrowings
(including $27,278 in 2008 and $27,204 in 2007 at fair value) 128,182 123,150
Total liabilities 613,156 668,573
Commitments and contingencies
Stockholders’ Equity
Preferred stock 6,993 1,095
Common stock, $0.10 par value:
Shares authorized: 1,200,000,000 in 2008 and 2007;
Shares issued: 612,948,910 in 2008 and 612,882,506 in 2007;
Shares outstanding: 552,704,921 in 2008 and 531,887,419 in 2007 61 61
Additional paid-in capital 11,268 9,733
Accumulated other comprehensive loss, net of tax (359) (310)
Retained earnings 16,901 19,698
Other stockholders’ equity, net (3,666) (2,263)
Common stock in treasury, at cost
(60,243,989 shares in 2008 and 80,995,087 shares in 2007) (4,922) (5,524)
Total common stockholders’ equity 19,283 21,395
Total stockholders’ equity 26,276 22,490
Total liabilities and stockholders’ equity $639,432 $691,063
See Notes to Consolidated Financial Statements.
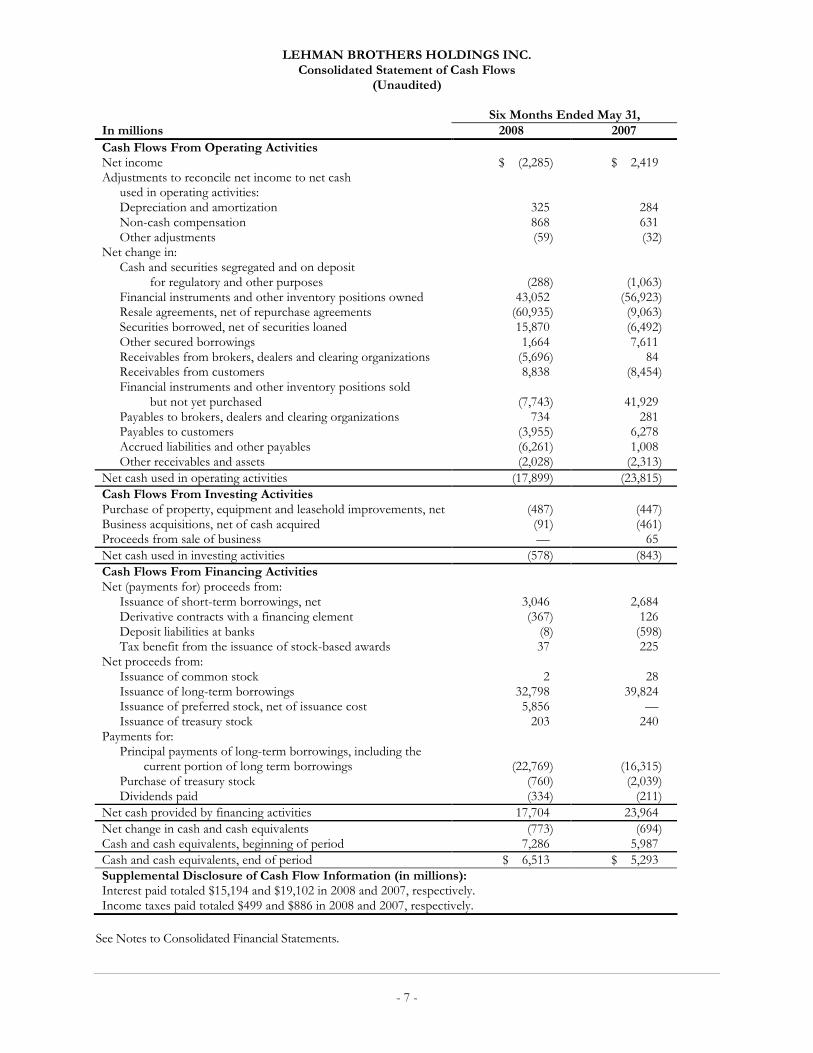
LEHMAN BROTHERS HOLDINGS INC. Consolidated Statement of Cash Flows
(Unaudited)
- 7 -
Six Months Ended May 31, In millions 2008 2007
Cash Flows From Operating Activities Net income $ (2,285) $ 2,419 Adjustments to reconcile net income to net cash used in operating activities: Depreciation and amortization 325 284 Non-cash compensation 868 631 Other adjustments (59) (32) Net change in: Cash and securities segregated and on deposit for regulatory and other purposes (288) (1,063) Financial instruments and other inventory positions owned 43,052 (56,923) Resale agreements, net of repurchase agreements (60,935) (9,063) Securities borrowed, net of securities loaned 15,870 (6,492) Other secured borrowings 1,664 7,611 Receivables from brokers, dealers and clearing organizations (5,696) 84 Receivables from customers 8,838 (8,454) Financial instruments and other inventory positions sold but not yet purchased (7,743) 41,929 Payables to brokers, dealers and clearing organizations 734 281 Payables to customers (3,955) 6,278 Accrued liabilities and other payables (6,261) 1,008 Other receivables and assets (2,028) (2,313)
Net cash used in operating activities (17,899) (23,815)
Cash Flows From Investing Activities Purchase of property, equipment and leasehold improvements, net (487) (447) Business acquisitions, net of cash acquired (91) (461) Proceeds from sale of business — 65
Net cash used in investing activities (578) (843)
Cash Flows From Financing Activities Net (payments for) proceeds from: Issuance of short-term borrowings, net 3,046 2,684 Derivative contracts with a financing element (367) 126 Deposit liabilities at banks (8) (598) Tax benefit from the issuance of stock-based awards 37 225 Net proceeds from: Issuance of common stock 2 28 Issuance of long-term borrowings 32,798 39,824 Issuance of preferred stock, net of issuance cost 5,856 — Issuance of treasury stock 203 240 Payments for: Principal payments of long-term borrowings, including the current portion of long term borrowings (22,769) (16,315) Purchase of treasury stock (760) (2,039) Dividends paid (334) (211)
Net cash provided by financing activities 17,704 23,964
Net change in cash and cash equivalents (773) (694) Cash and cash equivalents, beginning of period 7,286 5,987
Cash and cash equivalents, end of period $ 6,513 $ 5,293 Supplemental Disclosure of Cash Flow Information (in millions): Interest paid totaled $15,194 and $19,102 in 2008 and 2007, respectively. Income taxes paid totaled $499 and $886 in 2008 and 2007, respectively.
See Notes to Consolidated Financial Statements.

LEHMAN BROTHERS HOLDINGS INC. Notes to Consolidated Financial Statements
(Unaudited)
- 8 -
Contents
Page Number
Note 1 Summary of Significant Accounting Policies .................................................. 9
Note 2 Business and Geographic Segments.................................................................. 21
Note 3 Financial Instruments and Other Inventory Positions ................................. 24
Note 4 Fair Value of Financial Instruments.................................................................. 27
Note 5 Securities Received and Pledged as Collateral ................................................. 34
Note 6 Securitizations and Special Purpose Entities ................................................... 34
Note 7 Borrowings and Deposit Liabilities ................................................................... 38
Note 8 Commitments, Contingencies and Guarantees .............................................. 39
Note 9 Earnings per Common Share ............................................................................ 43
Note 10 Income Taxes ......................................................................................................... 44
Note 11 Employee Benefit Plans ....................................................................................... 45
Note 12 Regulatory Requirements ..................................................................................... 45
Note 13 Condensed Consolidating Financial Statement Schedules........................... 46
Note 14 Subsequent Events ................................................................................................ 52

LEHMAN BROTHERS HOLDINGS INC. Notes to Consolidated Financial Statements
(Unaudited)
- 9 -
Note 1 Summary of Significant Accounting Policies
Description of Business
Lehman Brothers Holdings Inc. (“Holdings”) and subsidiaries (collectively, the “Company,” the “Firm,” “Lehman Brothers,” “we,” “us” or “our”) serves the financial needs of corporations, governments and municipalities, institutional clients and high net worth individuals worldwide with business activities organized in three segments: Capital Markets, Investment Banking and Investment Management. Founded in 1850, Lehman Brothers maintains market presence in equity and fixed income sales, trading and research, investment banking, asset management, private investment management and private equity. The Firm is headquartered in New York, with regional headquarters in London and Tokyo, and operates in a network of offices in North America, Europe, the Middle East, Latin America and the Asia-Pacific region. The Company is a member of all principal securities and commodities exchanges in the U.S., and holds memberships or associate memberships on several principal international securities and commodities exchanges, including the London, Tokyo, Hong Kong, Frankfurt, Paris, Milan and Australian stock exchanges.
Basis of Presentation
The Consolidated Financial Statements are prepared in conformity with U.S. generally accepted accounting principles and include the accounts of Holdings, its subsidiaries, and all other entities in which the Company has a controlling financial interest or are considered to be the primary beneficiary. In the opinion of management, all normal recurring adjustments have been included for a fair statement of this interim financial information. All material inter-company accounts and transactions have been eliminated upon consolidation. Certain prior-period amounts reflect reclassifications to conform to the current year’s presentation.
Use of Estimates
In preparing the Consolidated Financial Statements and accompanying notes, management makes various estimates that affect reported amounts and disclosures. Broadly, those estimates are used in:
• measuring fair value of certain financial instruments;
• accounting for identifiable intangible assets and goodwill;
• establishing provisions for potential losses that may arise from litigation, regulatory proceedings and tax examinations;
• assessing the Company’s ability to realize deferred taxes; and
• valuing equity-based compensation awards.
Estimates are based on available information and judgment. Therefore, actual results could differ from estimates and that difference could have a material effect on the Consolidated Financial Statements and notes thereto.
Consolidation Policies
The Consolidated Financial Statements include the accounts of Holdings and the entities in which the Company has a controlling financial interest. The Company determines whether it has a controlling financial interest in an entity by first determining whether the entity is a voting interest entity (sometimes referred to as a non-VIE), a variable interest entity (“VIE”) or a qualified special purpose entity (“QSPE”).
Voting Interest Entity. Voting interest entities are entities that have (i) total equity investment at risk sufficient to fund expected future operations independently; and (ii) equity holders who have the obligation to absorb losses or receive residual returns and the right to make decisions about the entity’s activities. In accordance with Accounting Research Bulletin (“ARB”) No. 51, Consolidated Financial Statements, and Statement of Financial Accounting Standards (“SFAS”) No. 94, Consolidation of All Majority—Owned Subsidiaries )(“SFAS 94”), voting interest entities are consolidated when the Company has a controlling financial interest, typically more than 50% of an entity’s voting interests.
Variable Interest Entity. VIEs are entities that lack one or more voting interest entity characteristics. The Company consolidates VIEs in which it is the primary beneficiary. In accordance with Financial Accounting Standards Board (“FASB”) Interpretation (“FIN”) No. 46, Consolidation of Variable Interest Entities (revised December 2003)—an interpretation of ARB No. 51 (“FIN 46(R)”), the Company is the primary beneficiary if it has a variable interest, or a combination of variable interests, that will either (i) absorb a majority of the VIE’s expected losses; (ii) receive a majority of the VIE’s expected residual returns; or (iii) both. To determine if the Company is the primary beneficiary of a VIE, the Company reviews,

LEHMAN BROTHERS HOLDINGS INC. Notes to Consolidated Financial Statements
(Unaudited)
- 10 -
among other factors, the VIE’s design, capital structure, contractual terms, which interests create or absorb variability and related party relationships, if any. Additionally, the Company may calculate its share of the VIE’s expected losses and expected residual returns based upon the VIE’s contractual arrangements and/or position in the VIE’s capital structure. This type of analysis is typically performed using expected cash flows allocated to the expected losses and expected residual returns under various probability-weighted scenarios.
Qualified Special Purpose Entity. QSPEs are passive entities with limited permitted activities. SFAS No. 140, Accounting for Transfers and Servicing of Financial Assets and Extinguishments of Liabilities—a replacement of FASB Statement No. 125 (“SFAS 140”), establishes the criteria an entity must satisfy to be a QSPE, including types of assets held, limits on asset sales, use of derivatives and financial guarantees, and discretion exercised in servicing activities. In accordance with SFAS 140 and FIN 46(R), the Company does not consolidate QSPEs.
For a further discussion of the Company’s involvement with VIEs, QSPEs and other entities, see Note 6, “Securitizations and Special Purpose Entities,” to the Consolidated Financial Statements. For a further discussion regarding potential changes to consolidation-related accounting standards, see “Accounting and Regulatory Developments—Elimination of QSPEs and Changes in the FIN 46(R) Consolidation Model” below.
Equity-Method Investments. Entities in which the Company does not have a controlling financial interest (i.e., non-consolidated entities) but in which the Company exerts significant influence (generally defined as owning a voting interest of 20% to 50%, or a partnership interest greater than 3%) are accounted for either under Accounting Principles Board (“APB”) Opinion No. 18, The Equity Method of Accounting for Investments in Common Stock or SFAS No. 159, The Fair Value Option for Financial Assets and Financial Liabilities (“SFAS 159”). For further discussion of the Company’s adoption of SFAS 159, see “Accounting and Regulatory Developments—SFAS 159” below.
Other. The Company has formed various non-consolidated private equity or other alternative investment funds with third-party investors that are typically organized as limited partnerships. The Company typically acts as general partner for these funds, and when third-party investors have (i) rights to either remove the general partner without cause or to liquidate the partnership; or (ii) substantive participation rights, the Company does not consolidate these partnerships in accordance with Emerging Issue Task Force (“EITF”) No. 04-5, Determining Whether a General Partner, or the General Partners as a Group, Controls a Limited Partnership or Similar Entity When the Limited Partners Have Certain Rights.
A determination of whether the Company has a controlling financial interest in an entity and therefore a consolidation assessment of that entity is initially made at the time the Company becomes involved with the entity. Certain events may occur which cause the Company to re-assess its initial determination of an entity. These re-assessments focus on whether an entity is a VIE or non-VIE, whether the Company is the primary beneficiary (if the entity is a VIE) and ultimately its consolidation assessment of that entity. Those events generally are:
• The entity’s governance structure is changed such that either (i) the characteristics or adequacy of equity at risk are changed, or (ii) expected returns or losses are reallocated among the participating parties within the entity.
• The equity investment (or some part thereof) is returned to the equity investors and other interests become exposed to expected returns or losses.
• Additional activities are undertaken or assets acquired by the entity that were beyond those anticipated previously.
• Participants in the entity acquire or sell interests in the entity.
• The entity receives additional equity at risk or curtails its activities in a way that changes the expected returns or losses.
When the Company does not consolidate an entity or apply the equity method of accounting, the Company presents its investment in the entity at fair value.

LEHMAN BROTHERS HOLDINGS INC. Notes to Consolidated Financial Statements
(Unaudited)
- 11 -
Currency Translation
Assets and liabilities of subsidiaries having non-U.S. dollar functional currencies are translated at exchange rates at the applicable Consolidated Statement of Financial Condition date. Revenues and expenses are translated at average exchange rates during the period. The gains or losses resulting from translating non-U.S. dollar functional currency into U.S. dollars, net of hedging gains or losses, are included in Accumulated other comprehensive income/(loss), net of tax, a component of Stockholders’ equity. Gains or losses resulting from non-U.S. dollar currency transactions are included in the Consolidated Statement of Income.
Revenue Recognition Policies
Principal transactions. Realized and unrealized gains or losses from Financial instruments and other inventory positions owned and Financial instruments and other inventory positions sold but not yet purchased, as well as the gains or losses from certain short- and long-term borrowing obligations, principally certain hybrid financial instruments, and certain deposit liabilities at banks that the Company measures at fair value are reflected in Principal transactions in the Consolidated Statement of Income.
Investment banking. Underwriting revenues, net of related underwriting expenses, and revenues for merger and acquisition advisory and other investment banking-related services are recognized when services for the transactions are completed. In instances where the Investment Banking segment provides structuring services and/or advice in a capital markets-related transaction, the Company records a portion of the transaction-related revenue as Investment Banking fee revenues.
Commissions. Commissions primarily include fees from executing and clearing client transactions on equities, options and futures markets worldwide. These fees are recognized on a trade-date basis.
Interest and dividends revenue and interest expense. The Company recognizes contractual interest on Financial instruments and other inventory positions owned and Financial instruments and other inventory positions sold but not yet purchased, excluding derivatives, on an accrual basis as a component of Interest and dividends revenue and Interest expense, respectively. The Company accounts for its secured financing activities and certain short- and long-term borrowings on an accrual basis with related interest recorded as interest revenue or interest expense, as applicable. Contractual interest expenses on all deposit liabilities and certain hybrid financial instruments are recorded as components of Interest expense.
Asset management and other. Investment advisory fees are recorded as earned. In certain circumstances, the Company receives asset management incentive fees based upon fund performance. Incentive fees are generally based on investment performance over a twelve-month period and are not subject to adjustment after the measurement period ends. Accordingly, the Company recognizes incentive fees when the measurement period ends.
The Company also receives private equity incentive fees when the returns on certain private equity or other alternative investment funds’ investments exceed specified thresholds. Private equity incentive fees typically are based on investment results over a period greater than one year. If the funds underperform in the future, previously distributed fees could be required to be returned. Accordingly, the Company recognizes these incentive fees when all material contingencies have been substantially resolved.
Income Taxes
The Company accounts for income taxes in accordance with SFAS No. 109, Accounting for Income Taxes. The Company recognizes the current and deferred tax consequences of all transactions that have been recognized in the Consolidated Financial Statements using the provisions of the enacted tax laws. Deferred tax assets are recognized for temporary differences that will result in deductible amounts in future years and for tax loss carry-forwards. The Company records a valuation allowance to reduce deferred tax assets to an amount that more likely than not will be realized. Deferred tax liabilities are recognized for temporary differences that will result in taxable income in the future.
The Company recognizes and measures its unrecognized tax benefits in accordance with FIN 48, Accounting for Uncertainty in Income Taxes—an Interpretation of FASB Statement No. 109 (“FIN 48”). Based on their technical merits, the Company estimates the likelihood, that tax positions will be sustained upon examination based on the facts, circumstances and information available at the end of each period. The Company adjusts the level of unrecognized tax benefits when there is more information available, or when an event occurs requiring a change. The reassessment of unrecognized tax benefits could have a material impact on the Company’s effective tax rate in the period in which it occurs. For a discussion of the impact of FIN 48, see “Accounting and Regulatory Developments—FIN 48” below.

LEHMAN BROTHERS HOLDINGS INC. Notes to Consolidated Financial Statements
(Unaudited)
- 12 -
Earnings per Share
The Company computes earnings per share (“EPS”) in accordance with SFAS No. 128, Earnings per Share. Basic EPS is computed by dividing net income applicable to common stock by the weighted-average number of common shares outstanding, which includes restricted stock units (“RSUs”) for which service has been provided. Diluted EPS includes the components of basic EPS and also includes the dilutive effects of RSUs for which service has not yet been provided and employee stock options.
Financial Instruments and Other Inventory Positions
Substantially all of the Company’s Financial instruments and other inventory positions owned and Financial instruments and other inventory positions sold but not yet purchased are reported at fair value. The Company accounts for these assets and liabilities at fair value under various accounting literature and applicable industry guidance, namely broker-dealer and investment company accounting guidance. The Company categorizes Real estate held for sale positions as a component of Financial instruments and other inventory positions owned. Real estate held for sale positions are reported by the Company at the lower of carrying amount or fair value less cost to sell.
The Company early adopted the provisions of SFAS No. 157, Fair Value Measurements (“SFAS 157”), in the first quarter of 2007. SFAS 157 defines fair value, establishes a framework for measuring fair value, establishes a fair value hierarchy based on the quality of inputs used to measure fair value and enhances disclosure requirements for fair value measurements. Prior to December 1, 2006, the Company followed the American Institute of Certified Public Accountants (“AICPA”) Audit and Accounting Guide, Brokers and Dealers in Securities, when determining fair value for financial instruments. The AICPA Audit and Accounting Guide permitted the recognition of a discount to the quoted price when determining the fair value for a substantial block of a particular security as long as the quoted price was not considered to be readily realizable (i.e., a block discount).
SFAS 157 defines fair value as the price that would be received to sell an asset or paid to transfer a liability in an orderly transaction between market participants at the measurement date, or an “exit” price. Generally, assets (long positions) are marked to bid prices and liabilities (short positions) are marked to offer prices. Neither the bid nor the offer prices are adjusted for transactional costs. Fair value differs from cost accounting in that cost accounting would value financial instruments at their acquisition price—not at their value if currently sold in the market, or fair value.
When observable prices are not available, the Company either uses implied pricing from similar instruments or valuation models based on net present value of estimated future cash flows, adjusted as appropriate for liquidity, credit, market and/or other risk factors. New and/or complex instruments may have immature or limited markets. As a result, the pricing models used by the Company for valuation may incorporate significant estimates and assumptions that market participants would use in pricing the instrument. For instance, the Company may apply extrapolation methods for long-dated and illiquid contracts where observed market data is utilized in order to estimate inputs and assumptions that are not directly observable. Assumptions used by the Company in valuation models may impact the results of operations reported in the Consolidated Financial Statements. As the markets for products develop, the Company continually refines its pricing models to correlate more closely to the market price of the instruments.
Derivative Contracts. A derivative is a financial instrument whose value is based on an underlying asset (e.g., Treasury bond), index (e.g., S&P 500) or reference rate (e.g., LIBOR). Derivative financial instruments include futures, forwards, swaps, option contracts or other financial instruments with similar characteristics. A derivative contract generally represents a future commitment to exchange interest payment streams or currencies based on the contract terms, or notional amount, (e.g., interest rate swaps or currency forwards) or to purchase or sell financial instruments at specified terms or dates (e.g., option to buy or sell securities). An exchange traded derivative is a standardized contract transacted through regulated exchanges and includes futures and certain option contracts that are listed on an exchange. An over-the-counter (“OTC”) derivative financial instrument is a privately negotiated contractual agreement that may include forward, swaps and certain options.
Derivative contracts held by the Company are presented as a component of Financial instruments and other inventory positions owned or Financial instruments and other inventory positions sold but not yet purchased in the Consolidated Statement of Financial Condition. Derivatives are presented net-by-counterparty when the Company believes legal right of offset exists; net across different products or positions when applicable provisions are stated in a master netting agreement; and/or net of cash collateral received or paid on a counterparty basis, provided legal right of offset exists. As a component of the Company’s Financial instruments and other inventory positions owned or Financial instruments and other inventory positions sold but not yet purchased in the Consolidated Statement of Financial Condition, derivatives are presented at fair value. The fair value for OTC derivative financial instruments (forwards, options and swaps) is calculated as the present value of the estimated future payments the Company would receive or remit from or to a

LEHMAN BROTHERS HOLDINGS INC. Notes to Consolidated Financial Statements
(Unaudited)
- 13 -
market participant in settlement of the OTC derivative instrument (i.e., the amount the Company would expect to receive when disposing of a derivative asset or would expect to pay to have a derivative liability assumed).
Prior to the Company’s adoption of SFAS 157, the Company followed EITF Issue No. 02-3, Issues Involved in Accounting for Derivative Contracts Held for Trading Purposes and Contracts Involved in Energy Trading and Risk Management Activities (“EITF 02-3”). Under EITF 02-3, recognition of a trading profit at inception of a derivative transaction was prohibited unless the fair value of that derivative was obtained from a quoted market price supported by comparison to other observable inputs or based on a valuation technique incorporating observable inputs. Subsequent to the inception date (“Day 1”), the Company recognized trading profits deferred at Day 1 in the period in which the valuation of the instrument became observable. The adoption of SFAS 157 nullified the guidance in EITF 02-3 that precluded the recognition of a trading profit at the inception of a derivative contract, unless the fair value of such derivative was obtained from a quoted market price or other valuation technique incorporating observable inputs.
The Company enters into derivative contracts for trading purposes and as an end user. In instances where the Company enters into derivatives in a trading capacity, it is to facilitate a client transaction, execute a proprietary trading strategy or economically hedge market or credit risk exposures incurred as a result of other trading activities. For these trading-related derivatives, margins on futures contracts are included in Receivables and Payables from/to brokers, dealers and clearing organizations, as applicable.
Derivative contracts into which the Company enters as an end-user are primarily designed to economically hedge the Company’s exposure to market risk and/or credit risk. These end-user derivative contracts generally:
• Attempt to achieve efficient financing costs on the Company’s borrowing and deposit liabilities by converting the underlying interest rate basis or variability of payments.
• Mitigate the impact to the Company of changes in exchange rates that may impact the Company’s investment in foreign operations and/or financial instruments in inventory denominated in non-U.S. currencies.
• Manage price risk or the change in fair value of an asset or liability. These economic hedges may be micro (on specific inventory positions or specific trading books) or macro (generally intended to mitigate the overall risks present in the businesses in which the Company operates). The Company may enter into a derivative contract whose value is based upon a specific financial instrument class, an index that references that financial instrument class or a rate that impacts the financial instrument’s value. The Company’s position in that contract is typically designed such that it mitigates changes in the fair value of the instrument.
In instances where the Company specifically designates a derivative position as a hedge, the Company accounts for the position under the provisions of SFAS No. 133, Accounting for Derivative Instruments and Hedging Activities (“SFAS 133”). The Company assesses, both at the inception of the hedge and on an ongoing basis, whether the derivative contract designated as an accounting hedge is effective. When the Company determines that a derivative contract is not effective as an accounting hedge, the Company discontinues hedge accounting.
Certain of the derivative contracts entered into by the Company qualify as accounting hedges under the guidance of SFAS 133. The following generally summarizes those contracts as well as the assessment made for effectiveness:
• Derivative contracts that are designated as an interest rate hedge (including hedges on foreign currency movements) because they are intended to hedge the variability of interest rates to be received or paid related to the recognized assets or liabilities. Changes in the fair value of derivatives that are designated and qualify as accounting hedges of interest rate risk, along with the gain or loss on the hedged asset or liability that is attributable to the hedged risk are recorded within Interest revenue or expense. At inception of an accounting hedge risk and on an ongoing basis, the Company assesses effectiveness on a prospective basis by comparing the expected change in the price of the hedge instrument to the expected change in the value of the hedged item under various interest rate assumptions. Effectiveness is also assessed on a retrospective basis by performing regression analyses. Ineffectiveness for derivative contracts that the Company designated as interest rate hedges were immaterial for all periods presented.
• Derivative contracts that are designated as a cash flow hedge because they intend to hedge the variability of cash flows to be received or paid related to an asset or liability. Changes in the fair value of derivatives that are designated and qualify as effective cash flow hedges are recorded in Accumulated other comprehensive income/(loss), net of tax, in Stockholders’ equity. At inception of an accounting hedge and on an ongoing basis., the Company assesses effectiveness on a prospective basis by comparing the present value of the projected cash flows on the derivative contract to the present value of the projected cash flows of the hedged item under various

LEHMAN BROTHERS HOLDINGS INC. Notes to Consolidated Financial Statements
(Unaudited)
- 14 -
interest rate and prepayment assumptions. Effectiveness is also assessed on a retrospective basis by performing regression analyses. Ineffectiveness for derivative contracts that the Company designated as cash flow hedges were immaterial for all periods presented.
The Fair Value Hierarchy. While SFAS 157 does not prescribe which valuation technique the Company should use to measure the fair value of an asset or a liability, SFAS 157 does require the Company to select an appropriate valuation technique for the market conditions and for which sufficient, reliable data inputs are available. SFAS 157 distinguishes between inputs that are based on market data obtained from independent sources and inputs that reflect assumptions from one market participant as to actions of other market participants and emphasizes that valuation methodologies maximize inputs based on market data. A determination of what constitutes “observable market data” requires significant judgment. The Company considers observable or market-based data to be data that can be characterized as not proprietary, readily available or based on consensus within reasonably narrow ranges, regularly distributed or updated, reliable and verifiable and provided by multiple, independent sources that are involved in the relevant market.
Inputs to valuation techniques used by the Company to determine the fair value of an asset or a liability are prioritized based upon the SFAS 157 hierarchy. The SFAS 157 hierarchy gives priority to observable inputs in the marketplace that are more objective, rather than inputs that are more subjective because they have been derived through extrapolation or interpolation from market data. The basis of a financial instrument level within the fair value hierarchy is the lowest level of any input that is significant to the fair value measurement. The categorization of an asset or liability within the SFAS 157 hierarchy is based upon the pricing transparency of the financial instrument and does not necessarily correspond to the perceived risk of the asset or liability. The following describes the three levels of the fair value hierarchy under SFAS 157, provides general characteristics and examples of measurement inputs associated with each hierarchical level as well as valuation techniques used by the Company for components of its financial instrument inventory.
Level 1 — Level 1 inputs are quoted prices (unadjusted) for identical assets or liabilities in active markets. A quoted price for an identical asset or liability in an active market (e.g., an equity security traded on the New York Stock Exchange) provides the most reliable fair value measurement because it is directly observable to the market. The types of assets and liabilities valued based on quoted market prices in active markets and categorized by the Company as Level 1 within the fair value hierarchy generally include equities listed in active markets, G-7 government and agency securities, investments in publicly traded mutual funds with quoted market prices and listed derivatives.
Level 2 — Level 2 inputs are inputs that are observable, either directly or indirectly, but do not qualify as Level 1 inputs. Level 2 inputs may include:
• Quoted prices for similar assets or liabilities in active markets
• Quoted prices for identical or similar assets or liabilities in markets that are not active, that is, markets in which there are few transactions for the asset or liability, the prices are not current, or price quotations vary substantially either over time or among market makers (e.g., some brokered markets), or in which little information is released publicly (e.g., a principal-to-principal market)
• Inputs other than quoted prices that are observable for the asset or liability (e.g., interest rates and yield curves observable at commonly quoted intervals, volatilities, prepayment speeds, loss severities, credit risks, and default rates)
• Inputs that are derived principally from or corroborated by observable market data through correlation or by other means (market-corroborated inputs)
The types of assets and liabilities that trade in markets that are not considered to be active, but are valued based on quoted market prices, broker or dealer quotations, or alternative pricing sources with reasonable levels of price transparency include non-G-7 government securities, municipal bonds, certain hybrid financial instruments, certain mortgage and asset backed securities, certain corporate debt, certain commitments and guarantees, certain private equity investments, including equity interests in investment managers, and certain derivatives. Level 2 derivatives are valued using pricing models based on the net present value of estimated future cash flows and directly observed prices from exchange-traded derivatives, other OTC derivative contracts, or external pricing services, while taking into account either the Company’s or counterparty’s creditworthiness, as appropriate. Determining the fair value for Level 2 derivative contracts can require a significant level of estimation and management judgment.
Financial instruments categorized as Level 2 within the SFAS 157 hierarchy are generally presented, at

LEHMAN BROTHERS HOLDINGS INC. Notes to Consolidated Financial Statements
(Unaudited)
- 15 -
inception, using the transacted price. Thereafter, the Company generally values Level 2 assets and liabilities based upon comparable market prices or other relevant information from market transactions involving identical or comparable assets and liabilities.
Level 3 — Level 3 inputs reflect the Company’s assumptions that it believes market participants would use in pricing the asset or liability. The Company develops Level 3 inputs based on the best information available in the circumstances, which may include indirect correlation to a market value, combinations of market values or the Company’s proprietary data. Level 3 inputs generally include information derived through extrapolation or interpolation of observable market data.
At May 31, 2008, the Company included within Level 3 certain assets and liabilities that were components of the following inventory classifications:
• Certain Mortgage and asset-backed securities which, at inception, may be reflected at the original transaction cost. However, they subsequently may be reflected at a value based upon valuation methodologies that incorporate a variety of inputs including prices observed from execution of a number of trades in the marketplace; ABX, CMBX and similar indices that track the performance of a series of credit default swaps based upon specific types of mortgages; and other market information, such as data on remittances received and updated cumulative loss data on underlying obligations. These asset types include mortgage whole loans, asset-backed securities, and private label or agency collateralized mortgage obligations.
• Certain corporate debt positions which generally are initially presented at the original transaction price. Thereafter, the fair value of these positions are generally estimated by using executed transactions on comparable positions and anticipated market prices based upon pricing indications from syndicate banks and customers. The valuation of these positions also takes into account certain fee income, third-party credit ratings of counterparties and underlying movements in credit spreads of the counterparties. These asset types include non-performing loan portfolios, loans to counterparties that do not have correlation to market prices, and other loans held and awaiting securitization or syndication.
• Certain corporate equities, generally unlisted or private placement positions, which generally are originally reflected at their transaction price. Thereafter, these positions are subsequently valued based on third-party investments, pending transactions or changes in financial ratios (e.g., earnings multiples). These asset types include private equity and principal investment positions in addition to equity interests in corporations or investment vehicles.
• Derivative positions that were originally recorded based upon valuation models using initial trade prices. Changes in the valuations thereafter are not a result of changes in model methodology but changes in model inputs (e.g., interest rates, credit spreads and volatilities). Model inputs are updated only when those inputs can be corroborated with other market data. These asset types include interest rate option contracts, credit default swaptions, structured volatility derivatives and other forward starting contracts that are generally long-tenured.
For further discussion of the adoption of SFAS 157, see “Accounting and Regulatory Developments—SFAS 157” below. For further discussion of Financial instruments and other inventory positions, see Note 3, “Financial Instruments and Other Inventory Positions,” to the Consolidated Financial Statements. Firm-owned securities pledged to counterparties who have the right, by contract or custom, to sell or repledge the securities are classified as Financial instruments and other inventory positions owned and are disclosed as pledged as collateral. For further discussion of securities received and pledged as collateral, see Note 5, “Securities Received and Pledged as Collateral,” to the Consolidated Financial Statements.
Securitization activities. In accordance with SFAS 140, the Company recognizes transfers of financial assets as sales, if control has been surrendered. The Company determines control has been surrendered when the following three criteria have been met:
• The transferred assets have been isolated from the transferor, or put presumptively beyond the reach of the transferor and its creditors, even in bankruptcy or other receivership (i.e., a true sale opinion has been obtained);
• Each transferee (or, if the transferee is a QSPE, each holder of its beneficial interests) has the right to pledge or exchange the assets (or beneficial interests) it received, and no condition both constrains the transferee (or holder)

LEHMAN BROTHERS HOLDINGS INC. Notes to Consolidated Financial Statements
(Unaudited)
- 16 -
from taking advantage of its right to pledge or exchange and provides more than a trivial benefit to the transferor; and
• The transferor does not maintain effective control over the transferred assets through either (i) an agreement that both entitles and obligates the transferor to repurchase or redeem them before their maturity or (ii) the ability to unilaterally cause the holder to return specific assets.
Collateralized Lending Agreements and Financings
Treated as collateralized agreements and financings for financial reporting purposes are the following:
• Repurchase and resale agreements. Securities purchased under agreements to resell and securities sold under agreements to repurchase are collateralized primarily by government and government agency securities and are carried net by counterparty, when permitted, at the amounts at which the securities subsequently will be resold or repurchased plus accrued interest. The Company takes possession of securities purchased under agreements to resell. The fair value of the underlying positions is compared daily with the related receivable or payable balances, including accrued interest. The Company requires counterparties to deposit additional collateral or return collateral pledged, as necessary, to ensure the fair value of the underlying collateral remains sufficient.
• Securities borrowed and securities loaned. Securities borrowed and securities loaned are carried at the amount of cash collateral advanced or received plus accrued interest. The Company values the securities borrowed and loaned daily and obtains additional cash as necessary to ensure these transactions are adequately collateralized. When the Company acts as the lender of securities in a securities-lending agreement and the Company receives securities that can be pledged or sold as collateral, the Company recognizes an asset, representing the securities received and a liability, representing the obligation to return those securities.
• Other secured borrowings. Other secured borrowings principally reflect transfers accounted for as financings rather than sales under SFAS 140. Additionally, Other secured borrowings includes non-recourse financings of entities that the Company has consolidated because the Company is the primary beneficiary of such entities.
Long-Lived Assets
Property, equipment and leasehold improvements are recorded at historical cost, net of accumulated depreciation and amortization. Depreciation is recognized using the straight-line method over the estimated useful lives of the assets. Buildings are depreciated up to a maximum of 40 years. Leasehold improvements are amortized over the lesser of their useful lives or the terms of the underlying leases, which range up to 30 years. Equipment, furniture and fixtures are depreciated over periods of up to 10 years. Internal-use software that qualifies for capitalization under AICPA Statement of Position 98-1, Accounting for the Costs of Computer Software Developed or Obtained for Internal Use, is capitalized and subsequently amortized over the estimated useful life of the software, generally three years, with a maximum of seven years. The Company reviews long-lived assets for impairment periodically and whenever events or changes in circumstances indicate the carrying amounts of the assets may be impaired. If the expected future undiscounted cash flows are less than the carrying amount of the asset, an impairment loss is recognized to the extent the carrying value of the asset exceeds its fair value.
Identifiable Intangible Assets and Goodwill
Identifiable intangible assets with finite lives are amortized over their expected useful lives, which range up to 15 years. Identifiable intangible assets with indefinite lives and goodwill are not amortized. Instead, these assets are evaluated at least annually for impairment. Goodwill is reduced upon the recognition of certain acquired net operating loss carryforward benefits.
Cash Equivalents
Cash equivalents include highly liquid investments not held for resale with maturities of three months or less when the Company acquires them.
Accounting and Regulatory Developments
The following summarizes accounting standards that have been issued during the periods covered by the Consolidated Financial Statements and the effect of adoption on results of operations, if any, actual or estimated.
SFAS 157. In September 2006, the FASB issued SFAS 157. SFAS 157 defines fair value, establishes a framework for measuring fair value, outlines a fair value hierarchy based on inputs used to measure fair value and enhances disclosure

LEHMAN BROTHERS HOLDINGS INC. Notes to Consolidated Financial Statements
(Unaudited)
- 17 -
requirements for fair value measurements. SFAS 157 does not change existing guidance as to whether or not an instrument is carried at fair value.
SFAS 157 also (i) nullifies the guidance in EITF 02-3 that precluded the recognition of a trading profit at the inception of a derivative contract, unless the fair value of such derivative was obtained from a quoted market price or other valuation technique incorporating observable inputs; (ii) clarifies that an issuer’s credit standing should be considered when measuring liabilities at fair value; (iii) precludes the use of a liquidity or block discount when measuring instruments traded in an active market at fair value; and (iv) requires costs related to acquiring financial instruments carried at fair value to be included in earnings as incurred.
The Company elected to early adopt SFAS 157 at the beginning of the 2007 fiscal year and recorded the difference between the carrying amounts and fair values of (i) stand-alone derivatives and/or certain hybrid financial instruments measured using the guidance in EITF 02-3 on recognition of a trading profit at the inception of a derivative; and (ii) financial instruments that are traded in active markets that were measured at fair value using block discounts, as a cumulative-effect adjustment to opening retained earnings. As a result of adopting SFAS 157, the Company recognized a $45 million after-tax ($78 million pre-tax) increase to opening retained earnings. For additional information regarding the Company’s adoption of SFAS 157, see Note 4, “Fair Value of Financial Instruments,” to the Consolidated Financial Statements.
SFAS 158. In September 2006, the FASB issued SFAS No. 158, Employers’ Accounting for Defined Benefit Pension and Other Retirement Plans (“SFAS 158”), which requires an employer to recognize the over- or under-funded status of its defined benefit postretirement plans as an asset or liability in its Consolidated Statement of Financial Condition, measured as the difference between the fair value of the plan assets and the benefit obligation. For pension plans, the benefit obligation is the projected benefit obligation; while for other postretirement plans the benefit obligation is the accumulated postretirement obligation. Upon adoption, SFAS 158 requires an employer to recognize previously unrecognized actuarial gains and losses and prior service costs within Accumulated other comprehensive income/(loss), net of tax, a component of Stockholders’ equity. In accordance with the guidance in SFAS 158, the Company adopted this provision of the standard for the year ended November 30, 2007. The adoption of SFAS 158 reduced Accumulated other comprehensive loss by $210 million after-tax ($344 million pre-tax) at November 30, 2007.
SFAS 159. In February 2007, the FASB issued SFAS 159 which permits certain financial assets and financial liabilities to be measured at fair value, using an instrument-by-instrument election. The initial effect of adopting SFAS 159 must be accounted for as a cumulative-effect adjustment to opening retained earnings for the fiscal year in which the Company applies SFAS 159. Retrospective application of SFAS 159 to fiscal years preceding the effective date is not permitted.
The Company elected to early adopt SFAS 159 beginning in the 2007 fiscal year and to measure at fair value substantially all hybrid financial instruments not previously accounted for at fair value under SFAS No. 155, Accounting for Certain
Hybrid Financial Instruments—an amendment of FASB Statements No. 133 and 140, as well as certain deposit liabilities at the Company’s U.S. banking subsidiaries. The Company elected to adopt SFAS 159 for these instruments to reduce the complexity of accounting for these instruments under SFAS 133. As a result of adopting SFAS 159, the Company recognized a $22 million after-tax increase ($35 million pre-tax) to opening retained earnings as of December 1, 2006, representing the effect of changing the measurement basis of these financial instruments from an adjusted amortized cost basis at November 30, 2006 to fair value. For additional information regarding the adoption of SFAS 159, see Note 4, “Fair Value of Financial Instruments,” to the Consolidated Financial Statements.
SFAS 141(R). In December 2007, the FASB issued SFAS No. 141(R), Business Combinations (“SFAS 141(R)”). SFAS 141(R) expands the definition of transactions and events that qualify as business combinations; requires that the acquired assets and liabilities, including contingencies, be recorded at the fair value determined on the acquisition date and changes thereafter reflected in revenue, not goodwill; changes the recognition timing for restructuring costs; and requires acquisition costs to be expensed as incurred. Adoption of SFAS 141(R) is required for combinations after December 15, 2008. Early adoption and retroactive application of SFAS 141(R) to fiscal years preceding the effective date are not permitted. The Company is evaluating the impact of adoption on its Consolidated Financial Statements.
SFAS 160. In December 2007, the FASB issued SFAS No. 160, Noncontrolling Interest in Consolidated Financial Statements (“SFAS 160”). SFAS 160 re-characterizes minority interests in consolidated subsidiaries as non-controlling interests and requires the classification of minority interests as a component of equity. Under SFAS 160, a change in control will be measured at fair value, with any gain or loss recognized in earnings. The effective date for SFAS 160 is for annual periods beginning on or after December 15, 2008. Early adoption and retroactive application of SFAS 160 to fiscal years preceding the effective date are not permitted. The Company is evaluating the impact of adoption on its Consolidated Financial Statements.

LEHMAN BROTHERS HOLDINGS INC. Notes to Consolidated Financial Statements
(Unaudited)
- 18 -
SFAS 161. In March 2008, the FASB issued SFAS No. 161, Disclosures about Derivative Instruments and Hedging Activities (“SFAS 161”). SFAS 161 requires specific disclosures regarding the location and amounts of derivative instruments in the Company’s financial statements; how derivative instruments and related hedged items are accounted for; and how derivative instruments and related hedged items affect the Company’s financial position, financial performance, and cash flows. SFAS 161 is effective for financial statements issued and for fiscal years and interim periods after November 15, 2008. Early application is permitted. Because SFAS 161 impacts the Company’s disclosure and not its accounting treatment for derivative instruments and related hedged items, the Company’s adoption of SFAS 161 will not impact the Consolidated Financial Statements.
SFAS 162. In May 2008, the FASB issued SFAS No. 162, The Hierarchy of Generally Accepted Accounting Principles (“SFAS 162”). SFAS 162 identifies a consistent framework, or hierarchy, for selecting accounting principles to be used in preparing financial statements that are presented in conformity with U.S. generally accepted accounting principles for nongovernmental entities (the “Hierarchy”). The Hierarchy within SFAS 162 is consistent with that previously defined in the AICPA Statement on Auditing Standards No. 69, The Meaning of Present Fairly in Conformity With Generally Accepted Accounting Principles (“SAS 69”). SFAS 162 is effective 60 days following the United States Securities and Exchange Commission’s (the “SEC”) approval of the Public Company Accounting Oversight Board amendments to AU Section 411, The Meaning of Present Fairly in Conformity With Generally Accepted Accounting Principles. The adoption of SFAS 162 will not have a material effect on the Consolidated Financial Statements because the Company has utilized the guidance within SAS 69.
SFAS 163. In May 2008, the FASB issued SFAS No. 163, Accounting for Financial Guarantee Insurance Contracts—an interpretation of FASB Statement No. 60 (“SFAS 163”). SFAS 163 requires recognition of an insurance claim liability prior to an event of default when there is evidence that credit deterioration has occurred in an insured financial obligation. SFAS 163 is effective for financial statements issued for fiscal years beginning after December 15, 2008, and all interim periods within those fiscal years. Early application is not permitted. The Company’s adoption of SFAS 163 will not have a material effect on the Consolidated Financial Statements.
FIN 48. In June 2006, the FASB issued FIN 48. FIN 48 sets out a framework for management to use to determine the appropriate level of tax reserves to maintain for uncertain tax positions. FIN 48 uses a two-step approach wherein a tax benefit is recognized if a position is more likely than not to be sustained, and the amount of benefit is then measured on a probabilistic approach, as defined in FIN 48. FIN 48 also sets out disclosure requirements to enhance transparency of an entity’s tax reserves. The Company adopted FIN 48 at the beginning of the 2008 fiscal year and recognized a decrease to opening retained earnings of approximately $178 million. For additional information regarding the adoption of FIN 48, see Note 10, “Income Taxes,” to the Consolidated Financial Statements.
SOP 07-1. In June 2007, the AICPA issued Statement of Position (“SOP”) No. 07-1, Clarification of the Scope of the Audit and Accounting Guide Investment Companies and Accounting by Parent Companies and Equity Method Investors for Investments in Investment Companies ("SOP 07-1"). SOP 07-1 addresses when the accounting principles of the AICPA Audit and Accounting Guide Investment Companies must be applied by an entity and whether those accounting principles must be retained by a parent company in consolidation or by an investor in the application of the equity method of accounting. The effective date for SOP 07-1 was initially for fiscal years beginning on or after December 15, 2007; however, in February 2008, the FASB directed the FASB Staff to issue SOP 07-1-1 Effective Date of AICPA Statement of Position 07-1, which indefinitely delays the effective dates for SOP 07-1 and FASB Staff Position (“FSP”) FIN 46(R)-7, Application of FASB Interpretation No. 46(R) to Investment Companies which was effective upon adoption of SOP 07-1.
EITF Issue 07-4. In March 2008, the FASB ratified the consensus reached in EITF 07-4, Application of the Two-Class Method under FASB Statement No. 128 to Master Limited Partnerships (“EITF 07-4”). This issue relates to the application of the two-class method under SFAS No. 128, Earnings Per Share, to master limited partnerships (“MLPs”). EITF 07-4 applies to MLPs that are required to make incentive distributions when certain thresholds have been met and that are accounted for as equity distributions. EITF 07-4 is effective for financial statements issued for fiscal years beginning after December 15, 2008, and interim periods within those fiscal years. Earlier application is not permitted. Adoption of EITF Issue 07-4 will not have a material effect on the Consolidated Financial Statements.
EITF Issue 07-6. In December, 2007, the FASB ratified the consensus reached in EITF 07-6, Accounting for the Sale of Real Estate Subject to the Requirements of FASB Statement No. 66, When the Agreement Includes a Buy-Sell Clause (“EITF 07-6”). This issue relates to accounting for the sale of real estate subject to the requirements of SFAS No. 66, Accounting for Sales of Real Estate. The Task Force reached a conclusion that the selling investor of real estate should determine whether a buy-sell clause constitutes an option or other form of prohibited continuing involvement by considering facts and circumstances such as those that might effectively compel the buyer to sell its interest and those that might effectively compel the selling investor to reacquire the real estate, such as negative tax implications, favorable arrangements with the

LEHMAN BROTHERS HOLDINGS INC. Notes to Consolidated Financial Statements
(Unaudited)
- 19 -
venture, or strategic needs to own the property. EITF 07-6 is effective prospectively and for new arrangements entered into, and assessments performed, in fiscal years beginning after December 5, 2007, and interim periods within those fiscal years. Early application is not permitted. Adoption of EITF 07-6 will not have a material effect on the Consolidated Financial Statements.
FSP FAS 140-3. In February 2008, the FASB directed the FASB Staff to issue FSP No. FAS 140-3, Accounting for Transfers of Financial Assets and Repurchase Financing Transactions (“FSP FAS 140-3”). Under FSP FAS 140-3, it is presumed that an initial transfer of a financial asset and a repurchase entered into contemporaneously or in contemplation of each other are considered part of the same arrangement, known as a linked transaction. However, if certain criteria are met, the initial transfer and repurchase financing are not evaluated as a linked transaction and must be evaluated separately under FAS 140. FSP FAS 140-3 will be effective for financial statements issued for fiscal years beginning after November 15, 2008, and interim periods within those fiscal years. Earlier application is not permitted. The Company is evaluating the impact of adopting FSP FAS 140-3 on the Consolidated Financial Statements.
FSP FAS 142-3. In April 2008, the FASB directed the FASB Staff to issue FSP No. FAS 142-3, Determination of the Useful Life of Intangible Assets (“FSP FAS 142-3”). FSP FAS 142-3 amends the factors that should be considered in developing a renewal or extension assumptions used for purposes of determining the useful life of a recognized intangible asset under FASB Statement No. 142, Goodwill and Other Intangible Assets (“SFAS 142”). FSP FAS 142-3 is intended to improve the consistency between the useful life of a recognized intangible asset under SFAS 142 and the period of expected cash flows used to measure the fair value of the asset under SFAS 141(R) and other U.S. generally accepted accounting principles. FSP FAS 142-3 is effective for fiscal years beginning after December 15, 2008. Earlier application is not permitted. The Company believes the impact of adopting FSP FAS 142-3 will not have a material effect on the Consolidated Financial Statements.
FSP FIN 39-1. In April 2007, the FASB directed the FASB Staff to issue FSP No. FIN 39-1, Amendment of FASB Interpretation No. 39 (“FSP FIN 39-1”). FSP FIN 39-1 modifies FIN No. 39, Offsetting of Amounts Related to Certain Contracts, and permits companies to offset cash collateral receivables or payables with net derivative positions under certain circumstances. FSP FIN 39-1 is effective for fiscal years beginning after November 15, 2007, with early adoption permitted. FSP FIN 39-1 does not affect the Consolidated Financial Statements because it clarified the acceptability of existing market practice, which the Company uses, of netting cash collateral against net derivative assets and liabilities.
FSP FIN 48-1. In May 2007, the FASB directed the FASB Staff to issue FSP No. FIN 48-1, Definition of “Settlement” In FASB Interpretation No. 48 (“FSP FIN 48-1”). Under FSP FIN 48-1, a previously unrecognized tax benefit may be subsequently recognized if the tax position is effectively settled and other specified criteria are met. The Company adopted FSP FIN 48-1 upon adoption of FIN 48.
FSP APB 14-1. In May 2008, the FASB directed the FASB Staff to issue FSP APB 14-1, Accounting for Convertible Debt Instruments That May Be Settled in Cash upon Conversion (Including Partial Cash Settlement) (“FSP APB 14-1”). FSP APB 14-1 applies to convertible debt instruments that, by their stated terms, may be settled in cash (or other assets) upon conversion, including partial cash settlement of the conversion option. FSP APB 14-1 requires bifurcation of the instrument into a debt component that is initially recorded at fair value and an equity component. The difference between the fair value of the debt component and the initial proceeds from issuance of the instrument is recorded as a component of equity. The liability component of the debt instrument is accreted to par using the effective yield method; accretion is reported as a component of interest expense. The equity component is not subsequently re-valued as long as it continues to qualify for equity treatment. FSP APB 14-1 is effective for financial statements issued and for fiscal years and interim periods after December 15, 2008. Early adoption is not permitted. The Company is evaluating the impact of adopting FSP APB 14-1 on the Consolidated Financial Statements.
SAB 109. In November 2007, the SEC issued Staff Accounting Bulletin (“SAB”) No. 109, Written Loan Commitments Recorded at Fair Value Through Earnings (“SAB 109”). SAB 109 supersedes SAB No. 105, Loan Commitments Accounted for as Derivative Instruments (“SAB 105”), and expresses the view, consistent with the guidance in SFAS 156 and SFAS 159, that the expected net future cash flows related to the associated servicing of the loan should be included in the measurement of all written loan commitments that are accounted for at fair value through earnings. SAB 105 also expressed the view that internally-developed intangible assets (such as customer relationship intangible assets) should not be recorded as part of the fair value of a derivative loan commitment. SAB 109 retains that view and broadens its application to all written loan commitments that are accounted for at fair value through earnings. Adoption of SAB 109 did not have a material effect on the Consolidated Financial Statements.
Effect of Adoption. The table presented below summarizes the impact of adoption from the accounting developments summarized above on the results of operations:

LEHMAN BROTHERS HOLDINGS INC. Notes to Consolidated Financial Statements
(Unaudited)
- 20 -
Accumulated Other
Comprehensive Retained Earnings
In millions Date of Adoption Income/(Loss) Increase/(Decrease)
Year Ended November 30, 2007
SFAS 157 December 1, 2006 $ 45
SFAS 158 November 30, 2007 $(210)
SFAS 159 December 1, 2006 22
Six Months Ended May 31, 2008
FIN 48 December 1, 2007 (178)
Elimination of QSPEs and Changes in the FIN 46(R) Consolidation Model. In April of 2008, the FASB voted to eliminate QSPEs from the guidance in SFAS 140 and to remove the scope exception for QSPEs from FIN 46(R). This will require that VIEs previously accounted for as QSPEs will need to be analyzed for consolidation according to FIN 46 (R). While the revised standards have not been finalized and the Board's proposals will be subject to a public comment period, this change may affect the Company’s Consolidated Financial Statements as the Company may lose sales treatment for assets previously sold to a QSPE (i.e., no longer be able to de-recognize the assets from its Statement of Financial Condition), as well as for future sales. The proposed revisions could be effective as early as January 2009. The Company will continue to evaluate the impact of these changes on its financial statements once the changes to U.S. generally accepted accounting principles are completed.
The ASF Framework. On December 6, 2007, the American Securitization Forum (“ASF”), working with various constituency groups as well as representatives of U.S. federal government agencies, issued the Streamlined Foreclosure and Loss Avoidance Framework for Securitized Subprime Adjustable Rate Mortgage Loans (the “ASF Framework”). The ASF Framework provides guidance for servicers to streamline borrower evaluation procedures and to facilitate the use of foreclosure and loss prevention efforts in an attempt to reduce the number of U.S. subprime residential mortgage borrowers who might default in the coming year because the borrowers cannot afford to pay the increased loan interest rate after their U.S. subprime residential mortgage variable loan rate resets. The ASF Framework requires a borrower and its U.S. subprime residential mortgage variable loan to meet specific conditions to qualify for a modification under which the qualifying borrower’s loan’s interest rate would be kept at the existing rate, generally for five years following an upcoming reset period. The ASF Framework is focused on U.S. subprime first-lien adjustable-rate residential mortgages that have an initial fixed interest rate period of 36 months or less, are included in securitized pools, were originated between January 1, 2005 and July 31, 2007, and have an initial interest rate reset date between January 1, 2008 and July 31, 2010 (defined as “Segment 2 Subprime ARM Loans” within the ASF Framework). On June 11, 2008, ASF revised the ASF Framework to permit application, in appropriate circumstances, to any rate reset on Segment 2 Subprime ARM Loans rather than only the initial rate reset.
On January 8, 2008, the SEC’s Office of Chief Accountant (the “OCA”) issued a letter (the “OCA Letter”) addressing accounting issues that may be raised by the ASF Framework. Specifically, the OCA Letter expressed the view that if a Segment 2 Subprime ARM Loan is modified pursuant to the ASF Framework and that loan could legally be modified, the OCA will not object to continued status of the transferee as a QSPE under SFAS 140. Concurrent with the issuance of the OCA Letter, the OCA requested the FASB to immediately address the issues that have arisen in the application of the QSPE guidance in SFAS 140. Any loan modifications the Company makes in accordance with the ASF Framework will not have a material impact on its accounting for U.S. subprime residential mortgage loans nor securitizations or retained interests in securitizations of U.S. subprime residential mortgage loans.
At May 31, 2008, the Company has not yet modified a significant volume of loans using the ASF Framework. Additionally and at May 31, 2008, the Company does not believe its application of the ASF Framework will impact the off-balance sheet status of the Company sponsored QSPEs that hold Segment 2 Subprime ARM Loans.
Basel II. As of December 1, 2005, the Company became regulated by the SEC as a consolidated supervised entity (“CSE”). This supervision subjects the Company to group-wide supervision and examination by the SEC, minimum capital requirements on a consolidated basis and reporting (including reporting of capital adequacy measurement consistent with the standards adopted by the Basel Committee on Banking Supervision) and notification requirements. CSE capital requirements for the Company are principally driven by market, credit and operational risk amounts computed using methodologies developed by the Company and approved by the SEC.
The Basel Committee on Banking Supervision published an updated framework to calculate risk-based capital requirements in June 2006 (“Basel II”). In September 2006, U.S. federal bank regulators announced their intent to implement Basel II in
LEHMAN BROTHERS HOLDINGS INC. Notes to Consolidated Financial Statements
(Unaudited)
- 21 -
the U.S. On December 10, 2007, the U.S. federal bank regulators published final rules to implement new risk-based capital requirements in the U.S. for large, internationally active (core) banking organizations.
The CSE regulations are intended to provide consolidated supervision of investment bank holding companies that is broadly consistent with U.S. federal bank regulatory oversight of bank holding companies. Basel II is meant to be applied on a consolidated basis for banking institutions or bank holding companies that have consolidated total assets of $250 billion or more and/or consolidated total on-balance-sheet foreign exposure of $10 billion or more. Basel II provides two broad methods for calculating minimum capital requirements related to credit risk: (i) a standardized approach that relies heavily upon external credit assessments by major independent credit rating agencies; and (ii) an internal ratings-based approach, at foundation or advanced levels that permits the use of internal rating assessments in determining required capital.
Beginning January 2008, certain of the Company’s subsidiaries in Europe, became subject to the Basel II requirements. The time frame in which Basel II requirements would become effective for U.S. banking institutions or bank holding companies is contemplated to be on or after (i) completion of four consecutive quarterly parallel calculations, in which an entity would remain subject to existing risk-based capital rules but also calculate its risk-based capital requirements under the new Basel II framework; and (ii) a series of transitional periods during which an entity would report under the new framework, subject to supervisory mandated minimum regulatory capital requirements.
Additionally, and as an increasing number of global banking organizations become subject to Basel II, new interpretations may arise, and harmonization among regulators could impact the regulatory capital standards under which the Company operates as a CSE, as well as the requirements for some of the Company’s regulated subsidiaries. For further discussion of the Company’s CSE capital ratios, see “Management’s Discussion and Analysis of Financial Condition and Results of Operations— CSE Regulatory Capital” in this Report.
Note 2 Business and Geographic Segments
Business Segments
The Company organizes its business operations into three business segments: Capital Markets, Investment Banking and Investment Management.
The business segment information for the periods ended May 31, 2008 and 2007 is prepared using the following methodologies and generally represents the information that is relied upon by management in its decision-making processes:
• Revenues and expenses directly associated with each business segment are included in determining income before taxes.
• Revenues and expenses not directly associated with specific business segments are allocated based on the most relevant measures applicable, including each segment’s revenues, headcount and other factors.
• Net revenues include allocations of interest revenue, interest expense and revaluation of certain long-term and short-term debt measured at fair value to securities and other positions in relation to the cash generated by, or funding requirements of, the underlying positions.
• Business segment assets include an allocation of indirect corporate assets that have been fully allocated to the segments, generally based on each segment’s respective headcount figures.
Capital Markets
The Capital Markets segment is divided into two components:
Fixed Income — The Company makes markets in and trades municipal and public sector instruments, interest rate and credit products, mortgage-related securities and loan products, currencies and commodities. The Company also originates mortgages and structures and enters into a variety of derivative transactions. The Company provides research covering economic, quantitative, strategic, credit, relative value, index and portfolio analyses. Additionally, the Company provides financing, advice and servicing activities to the hedge fund community, known as prime brokerage services. The Company engages in certain proprietary trading activities and in principal investing in real estate that are managed within this component.

LEHMAN BROTHERS HOLDINGS INC. Notes to Consolidated Financial Statements
(Unaudited)
- 22 -
Equities — The Company makes markets in and trades equities and equity-related products and enters into a variety of derivative transactions. The Company also provides equity-related research coverage as well as execution and clearing services for clients. Through capital markets prime services, the Company provides prime brokerage services to the hedge fund community. The Company also engages in proprietary trading activities and private equity and other related investments.
Investment Banking
The Company takes an integrated approach to client coverage, organizing bankers into industry, product and geographic groups within the Investment Banking segment. Business services provided to corporations and governments worldwide can be separated into:
Global Finance — The Company serves clients’ capital raising needs through underwriting, private placements, leveraged finance and other activities associated with debt and equity products.
Advisory Services — The Company provides business advisory services with respect to mergers and acquisitions, divestitures, restructurings and other corporate activities.
Investment Management
The Investment Management business segment consists of:
Asset Management — The Company provides customized investment management services for high net worth clients, mutual funds and other institutional investors. Asset Management also serves as general partner for private equity and other alternative investment partnerships and has minority stake investments in certain alternative investment managers.
Private Investment Management — The Company provides investment, wealth advisory and capital markets execution services to high net worth and institutional clients.
Business Segments
Capital Investment Investment In millions Markets Banking Management Total
Three Months Ended May 31, 2008 Gross revenues $ 4,522 $ 858 $ 860 $ 6,240 Interest expense 6,896 ― 12 6,908
Net revenues (2,374) 858 848 (668) Depreciation and amortization expense 121 14 30 165 Other expenses 2,014 651 589 3,254
Income before taxes $(4,509) $ 193 $ 229 $(4,087)
Segment assets (in billions) $ 629.3 $ 1.3 $ 8.8 $ 639.4
Three Months Ended May 31, 2007 Gross revenues $13,616 $1,150 $ 813 $15,579 Interest expense 10,022 ― 45 10,067
Net revenues 3,594 1,150 768 5,512 Depreciation and amortization expense 109 12 26 147 Other expenses 2,132 800 554 3,486
Income before taxes $ 1,353 $ 338 $ 188 $ 1,879
Segment assets (in billions) $ 595.5 $ 1.3 $ 9.1 $ 605.9

LEHMAN BROTHERS HOLDINGS INC. Notes to Consolidated Financial Statements
(Unaudited)
- 23 -
Capital Investment Investment In millions Markets Banking Management Total
Six Months Ended May 31, 2008 Gross revenues $15,033 $1,725 $1,852 $18,610 Interest expense 15,736 ― 35 15,771
Net revenues (703) 1,725 1,817 2,839 Depreciation and amortization expense 237 28 60 325 Other expenses 3,332 1,323 1,283 5,938
Income before taxes $(4,272) $ 374 $ 474 $ (3,424)
Segment assets (in billions) $ 629.3 $ 1.3 $ 8.8 $ 639.4
Six Months Ended May 31, 2007 Gross revenues $25,838 $2,000 $1,536 $29,374 Interest expense 18,742 ― 73 18,815
Net revenues 7,096 2,000 1,463 10,559 Depreciation and amortization expense 211 22 51 284 Other expenses 4,163 1,450 1,084 6,697
Income before taxes $ 2,722 $ 528 $ 328 $ 3,578
Segment assets (in billions) $ 595.5 $ 1.3 $ 9.1 $ 605.9
Geographic Net Revenues
The Company organizes its operations into three geographic regions:
• Europe and the Middle East, inclusive of operations in Russia and Turkey;
• Asia-Pacific, inclusive of operations in Australia and India; and
• the Americas.
Net revenues presented by geographic region are based upon the location of the senior coverage banker or investment advisor in the case of Investment Banking or Asset Management, respectively, or where the position was risk managed within Capital Markets and Private Investment Management. Certain revenues associated with U.S. products and services that result from relationships with international clients have been classified as international revenues using an allocation process. The methodology for allocating the Firm’s revenues to geographic regions is dependent on the judgment of management. Additionally, because certain components of revenues reflect the overall performance of the Company as well as the performance of individual business units, performance in one segment may be affected by the performance of other segments.
The following presents, in management’s judgment, a reasonable representation of each region’s contribution to net revenues.
Geographic Net Revenues
Three Months Ended May 31, Six Months Ended May 31, In millions 2008 2007 2008 2007
Europe and the Middle East $(499) $1,829 $ 261 $ 3,197
Asia-Pacific 57 762 1,405 1,356
Total Non-Americas (442) 2,591 1,666 4,553
U.S. (290) 2,888 1,052 5,916
Other Americas 64 33 121 90
Total Americas (226) 2,921 1,173 6,006
Net revenues $(668) $5,512 $2,839 $10,559

LEHMAN BROTHERS HOLDINGS INC. Notes to Consolidated Financial Statements
(Unaudited)
- 24 -
Note 3 Financial Instruments and Other Inventory Positions
Financial instruments and other inventory positions owned and Financial instruments and other inventory positions sold but not yet purchased were comprised of the following:
Owned Sold But Not Yet Purchased
In millions May 31, 2008 Nov 30, 2007 May 31, 2008 Nov 30, 2007
Mortgage and asset-backed securities $ 72,461 $ 89,106 $ 351 $ 332 Government and agencies 26,988 40,892 63,731 71,813 Corporate debt and other 49,999 54,098 8,344 6,759 Corporate equities 47,549 58,521 43,184 39,080 Real estate held for sale 20,664 21,917 — — Commercial paper and other money market instruments 4,757 4,000 12 12 Derivatives and other contractual agreements 46,991 44,595 25,885 31,621
$269,409 $313,129 $141,507 $149,617
Mortgage and asset-backed securities. Mortgage and asset-backed securities include residential and commercial whole loans and interests in residential and commercial mortgage-backed securitizations. Also included within Mortgage and asset-backed securities are securities whose cash flows are based on pools of assets in bankruptcy-remote entities, or collateralized by cash flows from a specified pool of underlying assets. The pools of assets may include, but are not limited to mortgages, receivables and loans. Additionally, the Company’s mortgage-related trading positions consist of loans purchased as non-performing loans, equity interests in commercial properties and asset-backed securities that are backed by mortgage loans or other assets.
It is the Company’s intent to sell through securitization or syndication activities, residential and commercial mortgage whole loans the Company originates, as well as those acquired in the secondary market. The Company originated approximately $0.5 billion and $2 billion of residential mortgage loans for the three and six months ended May 31, 2008, respectively, compared to the $17 billion and $32 billion for the three and six months ended May 31, 2007, respectively. The Company originated approximately $2 billion and $4 billion of commercial mortgage loans for the three and six months ended May 31, 2008, respectively, compared to the $19 billion and $32 billion for the three and six months ended May 31, 2007, respectively.
Balances reported for Mortgage and asset-backed securities include approximately $11.7 billion and $11.9 billion at May 31, 2008 and November 30, 2007, respectively, of loans transferred to securitization vehicles where such transfers were accounted for as secured financings rather than sales. The securitization vehicles issued securities that were distributed to investors. The Company considers itself to have economic exposure only to the securities retained from those securitization vehicles; the Company does not have economic exposure to the underlying assets in those securitization vehicles. For further discussion of securitization activities, see Note 6, “Securitizations and Special Purpose Entities,” to the Consolidated Financial Statements.

LEHMAN BROTHERS HOLDINGS INC. Notes to Consolidated Financial Statements
(Unaudited)
- 25 -
At May 31, 2008 and November 30, 2007, the Company’s inventory of Mortgage and asset-backed-related positions, excluding those to which the Company does not have economic exposure, which were approximately $11.7 billion and $11.9 billion at May 31, 2008 and November 30, 2007, respectively, generally included the following types of assets:
In millions May 31, 2008 November 30, 2007
Residential: Securities(1) $ 14,986 $ 16,709 Whole loans 8,250 14,235 Servicing and other 1,666 1,235 $ 24,902 $ 32,179 Commercial: Whole loans $ 19,862 $ 26,200 Securities and other(2) 9,528 12,738 $ 29,390 $ 38,938 Other asset-backed (3) $ 6,482 $ 6,163 Total $ 60,774 $ 77,280
(1) At May 31, 2008, includes approximately $5.3 billion of investment grade interests in securitizations which the Company underwrote (“retained interests”); approximately $1.2 billion of non-investment grade retained interests in securitizations; and the remaining portion were acquired by the Company in the secondary market. At November 30, 2007, includes approximately $7.1 billion of investment grade retained interests in securitizations); approximately $1.6 billion of non-investment grade retained interests in securitizations; and the remaining portion were acquired by the Company in the secondary market.
(2) At May 31, 2008, includes approximately $1.6 billion of investment grade interests in securitizations which the Company originated and $0.1 billion of non-investment grade retained interests in securitizations at May 31, 2008; and the remaining portion were acquired by the Company in the secondary market. At November 30, 2007, includes approximately $2.4 billion of investment grade retained interests in securitizations; approximately $0.03 billion of non-investment grade retained interests in securitizations; and the remaining portion were acquired by the Company in the secondary market.
(3) Included within this line are securities as well as whole loans. Specifically, these positions include franchise-related whole business financings, small business loans, and various asset-backed positions related to student loans, credit cards and auto loans.
At May 31, 2008 and November 30, 2007, the Company’s portfolio of U.S. subprime residential mortgages, excluding those to which the Company does not have economic exposure, generally included the following types of assets:1
In millions May 31, 2008 November 30, 2007
U.S. residential subprime mortgages Whole loans(1) $1,048 $ 3,226 Securities 1,686 1,995 Other 21 55 Total $2,755 $ 5,276
(1) Excludes loans to which the Company does not have economic exposure, which were approximately $2.0 billion and $2.9 billion at May 31, 2008 and November 30, 2007, respectively.
Government and agencies. Included within these balances are instruments issued by a national government or agency thereof, denominated in the country’s own currency or in a foreign currency (e.g., sovereign) as well as municipals.
Corporate debt and other. Longer-term debt instruments, generally with a maturity date falling at least a year after their issue date, not issued by governments and may or may not be traded on major exchanges, are included within this component.
Non-derivative, physical commodities are reported as a component of this line item and were approximately $527 million and $308 million in May 31, 2008 and November 30, 2007, respectively.
Corporate equities. Balances generally reflect held positions in any instrument that has an equity ownership component, such as equity-related positions, public ownership equity securities that are listed on public exchanges, private equity-related positions and non-public ownership equity securities that are not listed on a public exchange.
1 The Company generally defines U.S. subprime residential mortgage loans as those associated with borrowers having a credit score in the range of
620 or lower using the Fair Isaac Corporation’s statistical model, or having other negative factors within their credit profiles. Prior to its closure in the third quarter of fiscal 2007, the Company originated subprime residential mortgage loans through BNC Mortgage LLC (“BNC”), a wholly-owned subsidiary of the Company’s U.S. regulated thrift Lehman Brothers Bank, FSB. BNC served borrowers with subprime qualifying credit profiles but also served borrowers with stronger credit history as a result of broker relationships or product offerings and such loans are also included in the Company’s subprime business activity. For residential mortgage loans purchased from other mortgage originators, the Company uses a similar subprime definition as for its origination activity. Additionally, second lien loans are included in the Company’s subprime business activity.

LEHMAN BROTHERS HOLDINGS INC. Notes to Consolidated Financial Statements
(Unaudited)
- 26 -
Real estate held for sale. The Company makes equity and debt investments in entities (including voting-interest entities and VIEs) whose underlying assets are real estate. Real estate held for sale positions are reported by the Company at the lower of carrying amount or fair value less cost to sell. The Company consolidates those entities in which it either controls the entity under SFAS 94 or is the primary beneficiary in accordance with FIN 46(R). At May 31, 2008 and November 30, 2007, the Company had approximately $20.7 billion and $21.9 billion, respectively, of real estate positions (parcels of land and/or related physical property). The Company considers itself to have economic exposure only to its direct investments in these entities; the Company does not have economic exposure to the total underlying assets in these entities. The Company’s net investment positions related to real estate, excluding the amounts that have been consolidated but for which the Company does not have economic exposure, was approximately $10.4 billion and $12.8 billion at May 31, 2008 and November 30, 2007, respectively.
At May 31, 2008, the Company held approximately $2.6 billion of real estate-related positions that did not qualify as held for sale pursuant to SFAS No. 144, Accounting for the Impairment or Disposal of Long-Lived Assets. Accordingly, the Company recorded accumulated depreciation expense of approximately $80 million in the second quarter of 2008 for these assets. This expense represents the cumulative depreciation for those positions since their inception through May 31, 2008. This amount is a component of Other non-interest expenses in the Consolidated Statement of Income. These positions are reported by the Company at the lower of carrying amount or fair value less cost to sell. Of the approximately $2.6 billion, the amount that has been consolidated but for which the Company does not have economic exposure, was approximately $0.9 billion at May 31, 2008. Of the approximately $80 million of accumulated depreciation expense, approximately $32 million related to the $0.9 billion for which the Company does not have economic exposure.
Commercial paper and other money market instruments. Commercial paper and other money market instruments include short-term obligations, generally issued by financial institutions or corporations, with maturities within a calendar year of the financial statement date. These instruments may include promissory notes, drafts, checks and certificates of deposit.
Derivatives and other contractual agreements. These balances generally represent future commitments to exchange interest payment streams or currencies based on contract or notional amounts or to purchase or sell other financial instruments or physical assets at specified terms on a specified date. Both over-the-counter and exchange-traded derivatives are reflected.
The following table presents the fair value of Derivatives and other contractual agreements at May 31, 2008 and November 30, 2007. Assets included in the table represent unrealized gains, net of unrealized losses, for situations in which the Company has a master netting agreement. Similarly, liabilities represent net amounts owed to counterparties. The fair value of derivative contracts represents net receivable/payable for derivative financial instruments before consideration of securities collateral. Asset and liabilities are presented below net of cash collateral of approximately $23.8 billion and $21.6 billion, respectively, at May 31, 2008 and $19.7 billion and $17.5 billion, respectively, at November 30, 2007.
Fair Value of Derivatives and Other Contractual Agreements
May 31, 2008 November 30, 2007 In millions Assets Liabilities Assets Liabilities
Over-the-Counter: (1) Interest rate, currency and credit default swaps and options $ 25,648 $ 9,733 $ 22,028 $ 10,915 Foreign exchange forward contracts and options 2,383 2,270 2,479 2,888 Other fixed income securities contracts (including TBAs and forwards) 10,341 5,692 8,450 6,024 Equity contracts (including equity swaps, warrants and options) 6,022 6,391 8,357 9,279 Exchange Traded: Equity contracts (including equity swaps, warrants and options) 2,597 1,799 3,281 2,515 $ 46,991 $ 25,885 $ 44,595 $ 31,621
(1) The Company’s net credit exposure for OTC contracts is $37.4 billion and $34.6 billion at May 31, 2008 and November 30, 2007, respectively, representing the fair value of OTC contracts in a net receivable position, after consideration of collateral.
At May 31, 2008, commodity derivative assets and liabilities were $4.1 billion and $3.4 billion, respectively. At November 30, 2007, commodity derivative assets and liabilities were both approximately $1.5 billion.
LEHMAN BROTHERS HOLDINGS INC. Notes to Consolidated Financial Statements
(Unaudited)
- 27 -
Concentrations of Credit Risk
A substantial portion of securities transactions are collateralized and are executed with, and on behalf of, financial institutions, which includes other brokers and dealers, commercial banks and institutional clients. The Company’s exposure to credit risk associated with the non-performance of these clients and counterparties in fulfilling their contractual obligations with respect to various types of transactions can be directly affected by volatile or illiquid trading markets, which may impair the ability of clients and counterparties to satisfy their obligations to the Company.
Financial instruments and other inventory positions owned include U.S. government and agency securities, and securities issued by non-U.S. governments, which in the aggregate represented 4% and 6% of total assets at May 31, 2008 and November 30, 2007, respectively. In addition, collateral held for resale agreements represented approximately 27% and 24% of total assets at May 31, 2008 and November 30, 2007, respectively, and primarily consisted of securities issued by the U.S. government, federal agencies or non-U.S. governments. The Company’s most significant industry concentration is financial institutions, which includes other brokers and dealers, commercial banks and institutional clients. This concentration arises in the normal course of business.
Note 4 Fair Value of Financial Instruments
Financial instruments and other inventory positions owned, excluding Real estate held for sale, and Financial instruments and other inventory positions sold but not yet purchased, are presented at fair value. In addition, certain long and short-term borrowing obligations, principally certain hybrid financial instruments, and certain deposit liabilities at banks, are presented at fair value.
Fair value is defined as the price at which an asset could be exchanged in a current transaction between knowledgeable, willing parties. A liability’s fair value is defined as the amount that would be paid to transfer the liability to a new obligor, not the amount that would be paid to settle the liability with the creditor. Where available, fair value is based on observable market prices or parameters or derived from such prices or parameters. In instances where valuation models are applied, inputs are correlated to a market value, combinations of market values or the Company’s proprietary data. These valuation techniques involve some level of management estimation and judgment, the degree of which is dependent on the price transparency for the instruments or market and the instruments’ complexity.
Assets and liabilities recorded at fair value in the Consolidated Statement of Financial Condition are categorized based upon the level of judgment associated with the inputs used to measure their fair value. Hierarchical levels, defined by SFAS 157 and directly related to the amount of subjectivity associated with the inputs to fair valuation of these assets and liabilities, are as follows:
Level 1 — Level 1 inputs are quoted prices (unadjusted) for identical assets or liabilities in active markets. A quoted price for an identical asset or liability in an active market (e.g., an equity security traded on the New York Stock Exchange) provides the most reliable fair value measurement because it is directly observable to the market. The types of assets and liabilities valued based on quoted market prices in active markets and categorized by the Company as Level 1 within the fair value hierarchy generally include equities listed in active markets, G-7 government and agency securities, investments in publicly traded mutual funds with quoted market prices and listed derivatives.
Level 2 — Level 2 inputs are inputs that are observable, either directly or indirectly, but do not qualify as Level 1 inputs. Level 2 inputs may include:
• Quoted prices for similar assets or liabilities in active markets.
• Quoted prices for identical or similar assets or liabilities in markets that are not active, that is, markets in which there are few transactions for the asset or liability, the prices are not current, or price quotations vary substantially either over time or among market makers (e.g., some brokered markets), or in which little information is released publicly (e.g., a principal-to-principal market).
• Inputs other than quoted prices that are observable for the asset or liability (e.g., interest rates and yield curves observable at commonly quoted intervals, volatilities, prepayment speeds, loss severities, credit risks, and default rates).
• Inputs that are derived principally from or corroborated by observable market data through correlation or by other means (market-corroborated inputs).

LEHMAN BROTHERS HOLDINGS INC. Notes to Consolidated Financial Statements
(Unaudited)
- 28 -
The types of assets and liabilities that trade in markets that are not considered to be active, but are valued based on quoted market prices, broker or dealer quotations, or alternative pricing sources with reasonable levels of price transparency include non-G-7 government securities, municipal bonds, certain hybrid financial instruments, certain mortgage and asset backed securities, certain corporate debt, certain commitments and guarantees, certain private equity investments, including equity interests in investment managers, and certain derivatives. Level 2 derivatives are valued using pricing models based on the net present value of estimated future cash flows and directly observed prices from exchange-traded derivatives, other OTC derivative contracts, or external pricing services, while taking into account either the Company’s or counterparty’s creditworthiness, as appropriate. Determining the fair value for Level 2 derivative contracts can require a significant level of estimation and management judgment.
Financial instruments categorized as Level 2 within the SFAS 157 hierarchy are generally presented, at inception, using the transacted price. Thereafter, the Company generally values Level 2 assets and liabilities based upon comparable market prices or other relevant information from market transactions involving identical or comparable assets and liabilities.
Level 3 — Level 3 inputs reflect the Company’s assumptions that it believes market participants would use in pricing the asset or liability. The Company develops Level 3 inputs based on the best information available in the circumstances, which may include indirect correlation to a market value, combinations of market values or the Company’s proprietary data. Level 3 inputs generally include information derived through extrapolation or interpolation of observable market data.
At May 31, 2008, the Company included within Level 3 certain assets and liabilities that were components of the following inventory classifications:
• Certain Mortgage and asset-backed securities which, at inception, may be reflected at the original transaction cost. However, they subsequently may be reflected at a value based upon valuation methodologies that incorporate a variety of inputs including prices observed from execution of a number of trades in the marketplace; ABX, CMBX and similar indices that track the performance of a series of credit default swaps based upon specific types of mortgages; and other market information, such as data on remittances received and updated cumulative loss data on underlying obligations. These asset types include mortgage whole loans, asset-backed securities, and private label or agency collateralized mortgage obligations.
• Certain corporate debt positions which generally are initially presented at the original transaction price. Thereafter, the fair value of these positions are generally estimated by using executed transactions on comparable positions and anticipated market prices based upon pricing indications from syndicate banks and customers. The valuation of these positions also takes into account certain fee income, third-party credit ratings of counterparties and underlying movements in credit spreads of the counterparties. These asset types include non-performing loan portfolios, loans to counterparties that do not have correlation to market prices, and other loans held and awaiting securitization or syndication.
• Certain corporate equities, generally unlisted or private placement positions, which generally are originally reflected at their transaction price. Thereafter, these positions are subsequently valued based on third-party investments, pending transactions or changes in financial ratios (e.g., earnings multiples). These asset types include private equity and principal investment positions in addition to equity interests in corporations or investment vehicles.
• Derivative positions that were originally recorded based upon valuation models using initial trade prices. Changes in the valuations thereafter are not a result of changes in model methodology but changes in model inputs (e.g., interest rates, credit spreads and volatilities). Model inputs are updated only when those inputs can be corroborated with other market data. These asset types include interest rate option contracts, credit default swaptions, structured volatility derivatives and other forward starting contracts that are generally long-tenured.
The Company makes certain valuation adjustments (e.g., credit adjustments) at a portfolio level. In determining fair value, the Company considers both the credit risk of counterparties, as well as its own creditworthiness. The Company attempts to mitigate credit risk to third parties by entering into netting and collateral arrangements. Net exposure is then measured with consideration of a counterparty’s creditworthiness and is incorporated into the fair value of the respective

LEHMAN BROTHERS HOLDINGS INC. Notes to Consolidated Financial Statements
(Unaudited)
- 29 -
instruments. In the calculation of the credit risk adjustment for derivatives, the Company attempts to use observable market credit spreads. The impact of our credit risk is incorporated into the fair valuation, even when credit risk is not readily observable in the pricing of an instrument, such as in OTC derivatives contracts.
Valuation allowances are generally recorded on an aggregate basis. For a portfolio of assets or liabilities, the Company attributes valuation adjustments to individual transactions for financial reporting purposes. Management believes the methodology adopted to allocate valuation adjustments on a portfolio to individual positions is reasonable and consistently applied during the periods presented.
Fair Value on a Recurring Basis
Assets and liabilities measured at fair value on a recurring basis and which were categorized as Level 3 at May 31, 2008 and November 30, 2007 were approximately $37.9 billion, compared to $38.9 billion at November 30, 2007.
At In millions May 31, 2008 Nov 30, 2007
Level 3 assets $ 41,344 $ 41,979 Less: Level 3 derivative liabilities (3,433) (3,095) Level 3 assets (net derivatives) $ 37,911 $ 38,884
Assets and liabilities measured at fair value on a recurring basis are categorized in the tables below based upon the lowest level of significant input to the valuations.
Assets at Fair Value as of May 31, 2008
In millions Level 1 Level 2 Level 3 Total
Mortgage and asset-backed securities(1) $ 347 $ 51,517 $ 20,597 $ 72,461
Government and agencies 11,002 15,986 — 26,988
Corporate debt and other 77 44,332 5,590 49,999
Corporate equities 26,785 10,606 10,158 47,549
Commercial paper and other money market instruments 4,757 — — 4,757
Derivative assets(2) 2,597 39,395 4,999 46,991
$ 45,565 $161,836 $41,344 $248,745
Liabilities at Fair Value as of May 31, 2008
In millions Level 1 Level 2 Level 3 Total
Mortgage and asset-backed securities $ — $ 351 $ — $ 351
Government and agencies 60,689 3,042 — 63,731
Corporate debt and other 5 8,339 — 8,344
Corporate equities 42,356 828 — 43,184
Commercial paper and other money market instruments 12 — — 12
Derivative liabilities(2) 1,799 20,653 3,433 25,885
$104,861 $33,213 $3,433 $141,507 (1) Includes loans transferred to securitization vehicles where such transfers were accounted for as secured financings rather than sales of
approximately $11.7 billion at May 31, 2008. The securitization vehicles issued securities that were distributed to investors. The Company does not have economic exposure to the underlying assets in those securitization vehicles beyond the Company’s retained interests. The loans are reflected as an asset within Mortgages and asset-backed positions and the proceeds received from the transfer are reflected as a liability within Other secured borrowings. These loans are classified as Level 2 assets.
(2) Derivative assets and liabilities are presented on a net basis by level. Inter- and intra-level cash collateral, cross-product and counterparty netting at May 31, 2008 were approximately $45.6 billion and $43.4 billion, respectively.

LEHMAN BROTHERS HOLDINGS INC. Notes to Consolidated Financial Statements
(Unaudited)
- 30 -
Assets at Fair Value as of November 30, 2007
In millions Level 1 Level 2 Level 3 Total
Mortgage and asset-backed securities(1) $ 240 $ 63,914 $ 24,952 $ 89,106
Government and agencies 25,393 15,499 — 40,892
Corporate debt and other 324 50,692 3,082 54,098
Corporate equities 39,336 10,812 8,373 58,521
Commercial paper and other money market instruments 4,000 — — 4,000
Derivative assets(2) 3,281 35,742 5,572 44,595
$ 72,574 $176,659 $41,979 $291,212
Liabilities at Fair Value as of November 30, 2007
In millions Level 1 Level 2 Level 3 Total
Mortgage and asset-backed securities $ — $ 332 $ — $ 332
Government and agencies 67,484 4,329 — 71,813
Corporate debt and other 22 6,737 — 6,759
Corporate equities 39,080 — — 39,080
Commercial paper and other money market instruments 12 — — 12
Derivative liabilities(2) 2,515 26,011 3,095 31,621
$109,113 $37,409 $3,095 $149,617 (1) Includes loans transferred to securitization vehicles where such transfers were accounted for as secured financings rather than sales of
approximately $11.9 billion. The securitization vehicles issued securities that were distributed to investors. The Company does not have economic exposure to the underlying assets in those securitization vehicles beyond the Company’s retained interests. The loans are reflected as an asset within Mortgages and asset-backed positions and the proceeds received from the transfer are reflected as a liability within Other secured borrowings. These loans are classified as Level 2 assets.
(2) Derivative assets and liabilities are presented on a net basis by level. Inter- and intra-level cash collateral, cross-product and counterparty netting at November 30, 2007 was approximately $38.8 billion and $36.6 billion, respectively.

LEHMAN BROTHERS HOLDINGS INC. Notes to Consolidated Financial Statements
(Unaudited)
- 31 -
Level 3 Gains and Losses
The tables presented below summarize the change in balance sheet carrying values associated with Level 3 Financial instruments for six months ended May 31, 2008 and May 31, 2007. Caution should be utilized when evaluating reported net revenues for Level 3 Financial instruments because the values presented exclude economic hedging activities that may be transacted in instruments categorized within other fair value hierarchy levels. Actual net revenues associated with Level 3 Financial instruments inclusive of hedging activities could differ materially.
Mortgage and asset- Corporate Corporate
In millions backed securities debt and other equities Net derivatives Total
Balance at December 1, 2007 $ 24,952 $ 3,082 $ 8,373 $ 2,477 $ 38,884
Net Payments, Purchases and Sales (2,159) 545 1,293 (8) (329)
Net Transfers In/(Out) 31 2,094 164 (1,122) 1,167
Gains/(Losses)(1)
Realized (107) 13 32 (137) (199)
Unrealized (2,120) (144) 296 356 (1,612)
Balance at May 31, 2008 $ 20,597 $ 5,590 $ 10,158 $ 1,566 $ 37,911
Mortgage and asset- Corporate Corporate
In millions backed securities debt and other equities Net derivatives Total
Balance at December 1, 2006 $ 8,575 $ 1,924 $ 2,427 $ 686 $ 13,612
Net Payments, Purchases and Sales 4,020 478 1,187 277 5,962
Net Transfers In/(Out) 14 95 375 39 523
Gains/(Losses)(1)
Realized 450 50 26 55 581
Unrealized (211) 2 148 223 162
Balance at May 31, 2007 $ 12,848 $ 2,549 $ 4,163 $ 1,280 $ 20,840
(1) Realized or unrealized gains/(losses) from changes in values of Level 3 Financial instruments represent gains/(losses) from changes in values of those Financial instruments only for the period(s) in which the instruments were classified as Level 3.
The tables presented below summarize the change in balance sheet carrying values associated with Level 3 Financial instruments for the two quarterly periods completed to date for fiscal year 2008 and the four quarterly periods of fiscal year 2007. Caution should be utilized when evaluating reported net revenues for Level 3 Financial instruments because the values presented exclude economic hedging activities that may be transacted in instruments categorized within other fair value hierarchy levels. Actual net revenues associated with Level 3 Financial instruments inclusive of hedging activities could differ materially.

LEHMAN BROTHERS HOLDINGS INC. Notes to Consolidated Financial Statements
(Unaudited)
- 32 -
Mortgage and asset- Corporate Corporate
In millions backed securities debt and other equities Net derivatives Total
Balance at December 1, 2007 $ 24,952 $ 3,082 $ 8,373 $ 2,477 $ 38,884
Net Payments, Purchases and Sales 46 524 360 73 1,003
Net Transfers In/(Out) (519) 655 (80) 34 90
Gains/(Losses)(1)
Realized 83 24 27 (20) 114
Unrealized (750) (35) 695 204 114
Balance at February 29, 2008 23,812 4,250 9,375 2,768 40,205
Net Payments, Purchases and Sales (2,205) 21 933 (81) (1,332)
Net Transfers In/(Out) 550 1,439 244 (1,156) 1,077
Gains/(Losses)(1)
Realized (190) (11) 5 (117) (313)
Unrealized (1,370) (109) (399) 152 (1,726)
Balance at May 31, 2008 $ 20,597 $ 5,590 $10,158 $ 1,566 $ 37,911
(1) Realized or unrealized gains/(losses) from changes in values of Level 3 Financial instruments represent gains/(losses) from changes in values of those Financial instruments only for the period(s) in which the instruments were classified as Level 3.
Mortgage and asset- Corporate Corporate
In millions backed securities debt and other equities Net derivatives Total
Balance at December 1, 2006 $ 8,575 $ 1,924 $ 2,427 $ 686 $ 13,612
Net Payments, Purchases and Sales 2,349 428 210 283 3,270
Net Transfers In/(Out) 137 — — — 137
Gains/(Losses)(1)
Realized 176 19 21 7 223
Unrealized (80) 13 13 158 104
Balance at February 28, 2007 11,157 2,384 2,671 1,134 17,346
Net Payments, Purchases and Sales 1,671 50 977 (6) 2,692
Net Transfers In/(Out) (123) 95 375 39 386
Gains/(Losses) (1)
Realized 274 31 5 48 358
Unrealized (131) (11) 135 65 58
Balance at May 31, 2007 12,848 2,549 4,163 1,280 20,840
Net Payments, Purchases and Sales 1,575 (299) 545 (59) 1,762
Net Transfers In/(Out) 9,856 (144) 232 (160) 9,784
Gains/(Losses) (1)
Realized 210 7 37 (4) 250
Unrealized (825) 19 62 543 (201)
Balance at August 31, 2007 23,664 2,132 5,039 1,600 32,435
Net Payments, Purchases and Sales 1,213 292 2,939 157 4,601
Net Transfers In/(Out) 1,480 615 103 31 2,229
Gains/(Losses) (1)
Realized 255 47 227 (166) 363
Unrealized (1,660) (4) 65 855 (744)
Balance at November 30, 2007 $ 24,952 $ 3,082 $ 8,373 $ 2,477 $ 38,884
(1) Realized or unrealized gains/(losses) from changes in values of Level 3 Financial instruments represent gains/(losses) from changes in values of those Financial instruments only for the period(s) in which the instruments were classified as Level 3.
Net revenues (both realized and unrealized) for Level 3 Financial instruments are a component of Principal transactions in the Consolidated Statement of Income. Net realized losses associated with Level 3 Financial instruments were approximately $0.3 billion and $0.2 billion for the 2008 three and six months ended, respectively, compared to net realized

LEHMAN BROTHERS HOLDINGS INC. Notes to Consolidated Financial Statements
(Unaudited)
- 33 -
gains of $0.4 billion and $0.6 billion in the corresponding 2007 periods. The net unrealized loss on Level 3 non-derivative Financial instruments was approximately $1.9 billion and $2.0 billion for the 2008 three and six months ended, respectively, compared to approximately $7 million and $61 million in the corresponding 2007 periods, primarily consisting of unrealized losses from mortgage and asset-backed securities. The net unrealized gain on Level 3 derivative Financial instruments was approximately $0.2 billion and $0.4 billion for the three and six months ended May 31, 2008, respectively, primarily consisting of unrealized gains from volatility and interest rate products. The net unrealized gain on Level 3 derivative Financial instruments was approximately $0.07 billion and $0.2 billion three and six months ended May 31, 2007, respectively, primarily consisting of unrealized gains from credit and interest rate-related derivative positions. Level 3 Financial instruments may be economically hedged with financial instruments not classified as Level 3; therefore, gains or losses associated with Level 3 Financial instruments may be offset by gains or losses associated with financial instruments classified in other levels of the fair value hierarchy.
Fair Value Option
SFAS 159 permits certain financial assets and liabilities to be measured at fair value, using an instrument-by-instrument election. Changes in the fair value of the financial assets and liabilities for which the fair value option was made are reflected in Principal transactions in the Consolidated Statement of Income. As indicated above in the fair value hierarchy tables and further discussed in Note 1, “Summary of Significant Accounting Policies, Accounting and Regulatory Developments—SFAS 159,” the Company elected to account for the following financial assets and liabilities at fair value:
Certain hybrid financial instruments. These instruments are primarily structured notes that are risk managed on a fair value basis and within the Company’s Capital Market activities and for which hedge accounting under SFAS 133, had been complex to maintain. Changes in the fair value of these liabilities, excluding any Interest income or Interest expense, are reflected in Principal transactions in the Consolidated Statement of Income. The Company calculates the impact of its own credit spread on hybrid financial instruments carried at fair value by discounting future cash flows at a rate which incorporates observable changes in its credit spread. At May 31, 2008, the estimated changes in the fair value attributable to the observable impact from instrument-specific credit risk was a gain of approximately $0.4 billion and $1.0 billion for the 2008 three and six months ended, respectively, attributable to the widening of the Company’s credit spreads during these periods. The change in fair value attributable to the observable impact from instrument-specific credit risk was not material to the results of operations for the three and six months ended May 31, 2007. As of May 31, 2008 and November 30, 2007, the aggregate principal amount of hybrid financial instruments classified as short-term borrowings and measured at fair value exceeded the fair value by approximately $0.6 billion and $0.2 billion, respectively. Additionally, and as of May 31, 2008 and November 30, 2007, the aggregate principal amount of hybrid financial instruments classified as long-term borrowings and measured at fair value exceeded the fair value by approximately $4.8 billion and $2.1 billion, respectively.
Other secured borrowings. Certain liabilities recorded as Other secured borrowings include the proceeds received from transferring loans to securitization vehicles where such transfers were accounted for as secured financings rather than sales under SFAS 140. The transferred loans are reflected as assets within Mortgages and asset-backed securities and are accounted for at fair value and categorized as Level 2 in the fair value hierarchy. The liabilities are also accounted for at fair value. The change in fair value of the liabilities attributable to the observable impact from instrument-specific credit risk was not material to the results of operations. The Company considers itself to have economic exposure only to the securities retained from those securitization vehicles; the Company does not have economic exposure to the underlying assets in those securitization vehicles.
Deposit liabilities at banks. The Company elects to account for certain deposits at the Company’s U.S. banking subsidiaries at fair value. The change in fair value attributable to the observable impact from instrument-specific credit risk was not material to the results of operations. As of May 31, 2008 and November 30, 2007, the difference between the fair value and the aggregate principal amount of deposit liabilities at banks carried at fair value was not material.

LEHMAN BROTHERS HOLDINGS INC. Notes to Consolidated Financial Statements
(Unaudited)
- 34 -
Liabilities for which the fair value option was elected are categorized in the table below based upon the lowest level of significant input to the valuations.
At Fair Value as of May 31, 2008
In millions Level 1 Level 2 Level 3 Total
Certain hybrid financial instruments:
Short-term borrowings — $ 9,354 — $ 9,354
Long-term borrowings — $ 27,278 — $ 27,278
Other secured borrowings — $ 13,617 — $ 13,617
Deposit liabilities at banks — $ 10,252 — $ 10,252
At Fair Value as of November 30, 2007
In millions Level 1 Level 2 Level 3 Total
Certain hybrid financial instruments:
Short-term borrowings — $ 9,035 — $ 9,035
Long-term borrowings — $ 27,204 — $ 27,204
Other secured borrowings — $ 9,149 — $ 9,149
Deposit liabilities at banks — $ 15,986 — $ 15,986
Fair Value on a Nonrecurring Basis
The Company uses fair value measurements on a nonrecurring basis in its assessment of assets classified as Goodwill and other identifiable intangible assets. These assets are recorded at fair value initially and assessed for impairment periodically thereafter. SFAS No. 142, Goodwill and Other Intangible Assets, requires impairment testing, comparison of carrying amount of the assets to their current, fair value, on an annual basis and between annual tests if circumstances change that would more likely than not reduce the fair value of goodwill below its carrying amount. The Company completed its last annual impairment test on goodwill and other intangible assets as of August 31, 2007, and no impairment was identified. In addition, as a result of market conditions during the second quarter of 2008, the Company conducted an impairment test on goodwill and other intangible assets as of May 31, 2008 and no impairment was identified. The lowest level of inputs for fair value measurements for Goodwill and other intangible assets are Level 3.
Note 5 Securities Received and Pledged as Collateral
The Company enters into secured borrowing and lending transactions to finance inventory positions, obtain securities for settlement and meet clients’ needs. The Company receives collateral in connection with resale agreements, securities borrowed transactions, borrow/pledge transactions, client margin loans and derivative transactions. The Company generally is permitted to sell or repledge these securities held as collateral and use them to secure repurchase agreements, enter into securities lending transactions or deliver to counterparties to cover short positions.
At May 31, 2008 and November 30, 2007, the fair value of securities received as collateral that the Company was permitted to sell or repledge was approximately $518 billion and $798 billion, respectively. The fair value of securities received as collateral that the Company sold or repledged was approximately $427 billion and $725 billion at May 31, 2008 and November 30, 2007, respectively.
The Company also pledges its own assets, primarily to collateralize certain financing arrangements. These pledged securities, where the counterparty has the right by contract or custom to sell or repledge the financial instruments, were approximately $43 billion and $63 billion at May 31, 2008 and November 30, 2007, respectively. The carrying value of Financial instruments and other inventory positions owned that have been pledged or otherwise encumbered to counterparties where those counterparties do not have the right to sell or repledge, was approximately $80 billion and $87 billion at May 31, 2008 and November 30, 2007, respectively.
Note 6 Securitizations and Special Purpose Entities
Generally, residential and commercial mortgages, home equity loans, municipal and corporate bonds, and lease and trade receivables are financial assets that the Company securitizes through SPEs. The Company may continue to hold an interest in the financial assets securitized in the form of the securities created in the transaction, including residual interests

LEHMAN BROTHERS HOLDINGS INC. Notes to Consolidated Financial Statements
(Unaudited)
- 35 -
(“interests in securitizations”) established to facilitate the securitization transaction. Interests in securitizations are presented within Financial instruments and other inventory positions owned (primarily in mortgages and asset-backed securities and government and agencies) in the Consolidated Statement of Financial Condition. For additional information regarding the accounting for securitization transactions, see Note 1, “Summary of Significant Accounting Policies—Consolidation Policies,” to the Consolidated Financial Statements.
For the periods ended May 31, 2008 and 2007, the following financial assets were securitized:
Three Months Ended
May 31, Six Months Ended
May 31, In millions 2008 2007 2008 2007
Residential mortgages $ 5,227 $ 37,683 $12,095 $60,264 Commercial mortgages 1,500 5,083 1,500 7,912 Municipal and other asset-backed financial instruments 1,449 909 4,572 1,917
Total $ 8,176 $ 43,675 $18,167 $70,093
At May 31, 2008 and November 30, 2007, the Company had approximately $1.3 billion and $1.6 billion, respectively, of non-investment grade interests from securitization activities.
The tables below present: the fair value of interests in securitizations at May 31, 2008 and November 30, 2007; and model assumptions of market factors, sensitivity of valuation models to adverse changes in the assumptions; and cash flows received on such interests in the securitizations. The sensitivity analyses presented below are hypothetical and should be used with caution since the stresses are performed without considering the effect of hedges, which serve to reduce the Company’s actual risk. The Company mitigates the risks associated with the below interests in securitizations through various risk management dynamic hedging strategies. These results are calculated by stressing a particular economic assumption independent of changes in any other assumption (as required by U.S. generally accepted accounting principles). In reality, changes in one factor often result in changes in another factor which may counteract or magnify the effect of the changes outlined in the table below. Changes in the fair value based on a 10% or 20% variation in an assumption should not be extrapolated because the relationship of the change in the assumption to the change in fair value may not be linear.
Securitization Activity
May 31, 2008 November 30, 2007 Residential Mortgages Residential Mortgages
Non- Non- Investment Investment Investment Investment Dollars in millions Grade(1) Grade Other(2) Grade(1) Grade Other(2)
Interests in securitizations (in billions) $ 5.3 $ 1.2 $ 1.8 $ 7.1 $ 1.6 $ 2.6 Weighted-average life (years) 8 9 5 9 4 6 Average constant prepayment rate 11.5% 14.9% — 12.4% 17.0% — Effect of 10% adverse change $ 56 $ 20 $ — $ 55 $ 8 $ — Effect of 20% adverse change $ 119 $ 34 $ — $ 111 $ 10 $ — Weighted-average credit loss assumption 0.6% 4.3% 1.2% 0.5% 2.4% 0.7% Effect of 10% adverse change $ 21 $ 36 $ 31 $ 107 $ 104 $ 6 Effect of 20% adverse change $ 50 $ 66 $ 63 $ 197 $ 201 $ 12 Weighted-average discount rate 12.0% 20.3% 7.3% 7.7% 19.4% 7.3% Effect of 10% adverse change $ 216 $ 40 $ 147 $ 245 $ 53 $ 84 Effect of 20% adverse change $ 412 $ 76 $ 291 $ 489 $ 102 $ 166
(1) The amount of investment-grade interests in securitizations related to agency collateralized mortgage obligations was approximately $2.1 billion and $2.5 billion at May 31, 2008 and November 30, 2007, respectively.
(2) At May 31, 2008, other interests in securitizations included approximately $1.6 billion of investment grade commercial mortgages, approximately $0.1 billion of non-investment grade commercial mortgages and the remainder relates to municipal products. At November 30, 2007, other interests in securitizations included approximately $2.4 billion of investment grade commercial mortgages, approximately $0.03 billion of non-investment grade commercial mortgages and the remainder relates to municipal products.

LEHMAN BROTHERS HOLDINGS INC. Notes to Consolidated Financial Statements
(Unaudited)
- 36 -
Cash flows received on interests in securitizations
Six Months Ended May 31, 2008 Year Ended November 30, 2007 Residential Mortgages Residential Mortgages Non- Non- Investment Investment Investment Investment In millions Grade Grade Other Grade Grade Other
$ 442 $ 546 $ 105 $898 $633 $130
Mortgage servicing rights. Mortgage servicing rights (“MSRs”) represent the right to future cash flows based upon contractual servicing fees for mortgage loans and mortgage-backed securities. MSRs generally arise from the securitization of residential mortgage loans that the Company originates. MSRs are presented within Financial instruments and other inventory positions owned on the Consolidated Statement of Financial Condition. At May 31, 2008 and November 30, 2007, the Company had MSRs of approximately $1.6 billion and $1.2 billion, respectively. MSRs activities for the six months ended May 31, 2008 and the year ended November 30, 2007 are as follows:
In millions May 31, 2008 November 30, 2007
Balance, beginning of period $1,183 $ 829 Additions, net 61 368 Changes in fair value: Paydowns/servicing fees (90) (209) Resulting from changes in valuation assumptions 453 195 Balance, end of period $1,607 $ 1,183
The determination of MSRs fair value is based upon a discounted cash flow valuation model. Cash flow and prepayment assumptions used in the discounted cash flow model are: based on empirical data drawn from the historical performance of MSRs; consistent with assumptions used by market participants valuing similar MSRs; and from data obtained on the performance of similar MSRs. These variables can, and generally will, vary from quarter to quarter as market conditions and projected interest rates change. For that reason, risk related to MSRs directly correlates to changes in prepayment speeds and discount rates. The Company mitigates this risk by entering into hedging transactions.
The following table shows the main assumptions used to determine the fair value of MSRs at May 31, 2008 and November 30, 2007, the sensitivity of MSRs’ fair value measurements to changes in these assumptions, and cash flows received on contractual servicing:
Dollars in millions May 31, 2008 November 30, 2007
Weighted-average prepayment speed (CPR) 15.5% 24.5% Effect of 10% adverse change $ 91 $ 102 Effect of 20% adverse change $ 174 $ 190 Discount rate 12.0% 6.5% Effect of 10% adverse change $ 59 $ 20 Effect of 20% adverse change $ 112 $ 39 Cash flows received on contractual servicing $ 175 $ 276
The above sensitivity analysis is hypothetical and should be used with caution since the stresses are performed without considering the effect of hedges, which serve to reduce the Company’s actual risk. These results are calculated by stressing a particular economic assumption independent of changes in any other assumption (as required by U.S. generally accepted accounting principles). In reality, changes in one factor often result in changes in another factor which may counteract or magnify the effect of the changes outlined in the above table. Changes in the fair value based on a 10% or 20% variation in an assumption should not be extrapolated because the relationship of the change in the assumption to the change in fair value may not be linear.
Non-QSPE activities. The Company has transactional activity with SPEs that do not meet the QSPE criteria because their permitted activities are not limited sufficiently or the assets are non-qualifying financial instruments (e.g., real estate). These SPEs issue credit-linked notes, invest in real estate or are established for other structured financing transactions designed to meet clients’ investing or financing needs.
A collateralized debt obligation (“CDO”) transaction involves the purchase by an SPE of a diversified portfolio of securities and/or loans that are then managed by an independent asset manager. Interests in the SPE (debt and equity) are sold to

LEHMAN BROTHERS HOLDINGS INC. Notes to Consolidated Financial Statements
(Unaudited)
- 37 -
third-party investors. The Company’s primary role in a CDO is to act as structuring and placement agent, warehouse provider, underwriter and market maker in the related CDO securities. In a typical CDO, at the direction of a third party asset manager, the Company will temporarily warehouse securities or loans on the Company’s balance sheet pending the sale to the SPE once the permanent financing is completed. At May 31, 2008 and November 30, 2007, the Company owned approximately $614.6 million and $581.2 million of equity securities in CDOs, respectively. Because the Company’s investments do not represent a majority of the CDOs’ equity, the Company is not exposed to the majority of the CDOs’ expected losses. Accordingly, the Company is not the primary beneficiary of the CDOs and therefore the Company does not consolidate them.
As a dealer in credit default swaps, the Company makes a market in buying and selling credit protection on single issuers as well as on portfolios of credit exposures. The Company mitigates credit risk, in part, by purchasing default protection through credit default swaps with SPEs. The Company pays a premium to the SPEs for assuming credit risk under the credit default swap. In these transactions, SPEs issue credit-linked notes to investors and use the proceeds to invest in high quality collateral. The Company’s maximum potential loss associated with involvement with such credit-linked note transactions is measured by the fair value of credit default swaps with such SPEs. At May 31, 2008 and November 30, 2007, respectively, the fair values of these credit default swaps were $3.7 billion and $3.9 billion. The underlying investment grade collateral held by SPEs where the Company is the first-lien holder was $16.5 billion and $15.7 billion at May 31, 2008 and November 30, 2007, respectively.
Because the investors assume default risk associated with both the reference portfolio and the SPEs’ assets, the Company’s expected loss calculations generally demonstrate the investors in the SPEs bear a majority of the entity’s expected losses. Accordingly, the Company generally is not the primary beneficiary and therefore do not consolidate these SPEs. In instances where the Company is the primary beneficiary of the SPEs, the Company consolidates the SPEs. At May 31, 2008 and November 30, 2007, the Company consolidated approximately $223 million and $180 million of these SPEs, respectively. The assets associated with these consolidated SPEs are presented as a component of Financial instruments and other inventory positions owned, and the liabilities are presented as a component of Other secured borrowings.
The Company also invests in real estate directly through consolidated subsidiaries and through VIEs. The Company consolidates investments in real estate VIEs when the Company is the primary beneficiary. The Company records the assets of these consolidated real estate VIEs as a component of Financial instruments and other inventory positions owned, and the liabilities are presented as a component of Other secured borrowings. At May 31, 2008 and November 30, 2007, the Company consolidated approximately $7.9 billion and $9.8 billion, respectively, of real estate-related investments. After giving effect to non-recourse financing, the Company’s net investment position in these consolidated real estate VIEs was $3.9 billion and $6.0 billion at May 31, 2008 and November 30, 2007, respectively.
The following table summarizes non-QSPE activities at May 31, 2008 and November 30, 2007:
In millions May 31, 2008 November 30, 2007
Credit default swaps with SPEs $ 3,672 $ 3,859 Value of underlying investment-grade collateral 16,526 15,744 Value of assets consolidated 223 180 Consolidated real estate VIEs 7,913 9,786 Net investment 3,936 6,012
In addition to the above, the Company enters into other transactions with SPEs designed to meet clients’ investment and/or funding needs. For further discussion of SPE-related and other commitments, see Note 8, “Commitments, Contingencies and Guarantees,” to the Consolidated Financial Statements.

LEHMAN BROTHERS HOLDINGS INC. Notes to Consolidated Financial Statements
(Unaudited)
- 38 -
Note 7 Borrowings and Deposit Liabilities
Borrowings and deposit liabilities at banks at May 31, 2008 and November 30, 2007 consisted of the following:
In millions May 31, 2008 November 30, 2007
Short-term borrowings Unsecured Current portion of long-term borrowings $ 20,991 $ 16,801 Commercial paper 7,948 3,101 Other(1) 5,703 7,645 Secured 660 519 Total $ 35,302 $ 28,066 Amount carried at fair value(2) $ 9,354 $ 9,035 Deposit liabilities at banks Time deposits At U.S. banks $ 10,530 $ 16,189 At non-U.S. banks 16,854 10,974 Savings deposits At U.S. banks 1,427 1,556 At non-U.S. banks 544 644 Total $ 29,355 $ 29,363 Amount carried at fair value(2) $ 10,252 $ 15,986 Long-term borrowings Senior notes $110,553 $108,914 Subordinated notes 12,625 9,259 Junior subordinated notes 5,004 4,977 Total $128,182 $123,150 Amount carried at fair value(2) $ 27,278 $ 27,204
(1) Principally certain hybrid financial instruments with maturities of less than one year and zero-strike warrants.
(2) Certain borrowings and deposit liabilities at banks are carried at fair value in accordance with SFAS 159. For additional information, see Note 1, “Summary of Significant Accounting Polices,” and Note 4, “Fair Value of Financial Instruments,” to the Consolidated Financial Statements.
Junior subordinated notes are notes issued to trusts or limited partnerships (collectively, the “Trusts”). The Trusts were formed for the purposes of (i) issuing securities representing ownership interests in the assets of the Trusts; (ii) investing the proceeds of the Trusts in junior subordinated notes of Holdings; and (iii) engaging in activities necessary and incidental thereto. Junior subordinated notes qualify as Tier 1 regulatory capital for purposes of regulatory reporting as a CSE and are considered capital by leading rating agencies.
Credit Facilities
The Company uses both committed and uncommitted bilateral and syndicated long-term bank facilities to complement long-term debt issuances. In particular, the Company maintains a $2.0 billion unsecured, committed revolving credit agreement with a syndicate of banks. In March 2008, the Company amended and restated this credit facility for three years to February 2011. In addition, the Company maintains a $2.5 billion multi-currency unsecured, committed revolving credit facility (“European Facility”) with a syndicate of banks for Lehman Brothers Bankhaus AG (“Bankhaus”) and Lehman Brothers Treasury Co. B.V. which expires in April 2010. The ability to borrow under such facilities is conditioned on complying with customary lending conditions and covenants. These conditions and covenants do not contain provisions that could, upon an adverse change in the Company’s credit ratings, trigger a requirement for an early repayment or prevent future borrowings under the facilities. The Company has maintained compliance with the material covenants under these credit agreements at all times. The Company draws on both of these facilities from time to time in the normal course of conducting business. As of May 31, 2008, there were no outstanding borrowings against either Holdings’ credit facility or the European Facility.

LEHMAN BROTHERS HOLDINGS INC. Notes to Consolidated Financial Statements
(Unaudited)
- 39 -
Note 8 Commitments, Contingencies and Guarantees
In the normal course of business, the Company enters into various commitments and guarantees, including lending commitments to high grade and high yield borrowers, private equity investment commitments, liquidity commitments and other guarantees.
Lending-Related Commitments
The following table summarizes the contractual amounts of lending-related commitments at May 31, 2008 and November 30, 2007:
Total Expiration per Period at May 31, 2008 Contractual Amount In millions
2008
2009
2010-2011
2012-2013
Later
May 31, 2008
Nov 30, 2007
Lending commitments High grade $ 4,569 $ 4,757 $ 5,589 $ 11,202 $ 479 $ 26,596 $ 23,986 High yield 2,858 286 1,110 3,245 912 8,411 14,420 Contingent acquisition facilities High grade 905 767 — — — 1,672 10,230 High yield 425 — — — — 425 9,749 Mortgage commitments 713 326 959 277 21 2,296 7,449 Secured lending transactions 75,299 4,135 1,292 329 398 81,453 124,565
The Company uses various hedging and funding strategies to actively manage market, credit and liquidity exposures on these commitments. The Company does not believe total commitments necessarily are indicative of actual risk or funding requirements because the commitments may not be drawn or fully used and such amounts are reported before consideration of hedges.
Lending commitments. Through the Company’s high grade (investment grade) and high yield (non-investment grade) sales, trading and underwriting activities, commitments are made to extend credit in loan syndication transactions. These commitments and any related draw downs of these facilities typically have fixed maturity dates and are contingent on certain representations, warranties and contractual conditions applicable to the borrower. High yield exposures are defined as securities of or loans to companies rated BB+ or lower or equivalent ratings by recognized credit rating agencies, as well as non-rated securities or loans that, in management’s opinion, are non-investment grade.
The Company had commitments to high grade borrowers at May 31, 2008 and November 30, 2007 of $26.6 billion (net credit exposure of $19.8 billion, after consideration of hedges) and $24.0 billion (net credit exposure of $12.2 billion, after consideration of hedges), respectively. The Company had commitments to high yield borrowers of $8.4 billion (net credit exposure of $7.6 billion, after consideration of hedges) and $14.4 billion (net credit exposure of $13.1 billion, after consideration of hedges) at May 31, 2008 and November 30, 2007, respectively.
Contingent acquisition facilities. The Company provides contingent commitments to investment and non-investment grade counterparties related to acquisition financing. The Company does not believe contingent acquisition commitments are necessarily indicative of actual risk or funding requirements as funding is dependent upon both a proposed transaction being completed and the acquiror fully utilizing the commitment. Typically, these commitments are made to a potential acquiror in a proposed acquisition, which may or may not be completed depending on whether the potential acquiror to whom the commitment was made is successful. A contingent borrower’s ability to draw on the commitment is typically subject to there being no material adverse change in the borrower’s financial condition, among other factors, and the commitments also generally contain certain flexible pricing features to adjust for changing market conditions prior to closing. In addition, acquirors generally utilize multiple financing sources, including other investment and commercial banks, as well as accessing the general capital markets for completing transactions. Therefore, contingent acquisition commitments are generally greater than the amounts the Company ultimately expects to fund. Further, past practice, consistent with the Company’s credit facilitation framework, has been to syndicate acquisition financings to investors. The ultimate timing, amount and pricing of syndication, however, is influenced by market conditions that may not necessarily be consistent with those at the time the commitment was entered. The Company provided contingent commitments to high grade counterparties related to acquisition financing of approximately $1.7 billion and $10.2 billion at May 31, 2008 and November 30, 2007, respectively, and to high yield counterparties related to acquisition financing of approximately $0.4 billion and $9.8 billion at May 31, 2008 and November 30, 2007, respectively.

LEHMAN BROTHERS HOLDINGS INC. Notes to Consolidated Financial Statements
(Unaudited)
- 40 -
Mortgage commitments. Through the Company’s mortgage origination platforms, commitments are made to extend mortgage loans. At May 31, 2008 and November 30, 2007, outstanding mortgage commitments were approximately $2.3 billion and $7.4 billion, respectively. These commitments included $0.5 billion and $3.0 billion of residential mortgages and $1.8 billion and $4.4 billion of commercial mortgages at May 31, 2008 and November 30, 2007, respectively. Typically, residential mortgage loan commitments require us to originate mortgage loans at the option of a borrower, generally within 90 days at fixed interest rates. Consistent with past practice, the Company’s intention is to sell residential mortgage loans, once originated, primarily through securitizations. The ability to sell or securitize mortgage loans, however, is dependent on market conditions.
Secured lending transactions. In connection with financing activities, the Company had outstanding commitments under certain collateralized lending arrangements of approximately $5.1 billion and $8.5 billion at May 31, 2008 and November 30, 2007, respectively. These commitments require borrowers to provide acceptable collateral, as defined in the agreements, when amounts are drawn under the lending facilities. Advances made under these lending arrangements typically are at variable interest rates and generally provide for over-collateralization. In addition, at May 31, 2008, the Company had commitments to enter into forward starting secured resale and repurchase agreements, primarily secured by government and government agency collateral, of $48.4 billion and $28.0 billion, respectively, compared to $70.8 billion and $45.3 billion, respectively, at November 30, 2007.
Other Commitments and Guarantees
The following table summarizes other commitments and guarantees at May 31, 2008 and November 30, 2007:
Total Expiration per Period at May 31, 2008 Contractual Amount In millions
2008
2009
2010-2011
2012-2013
Later
May 31, 2008
Nov 30, 2007
Derivative contracts(1) $114,188 $ 77,117 $119,404 $195,271 $223,363 $729,343 $737,937 Municipal-securities-related commitments 333 1,002 221 220 4,196 5,972 6,902 Other commitments with variable interest entities 25 1,343 170 997 7,000 9,535 10,405 Standby letters of credit 1,538 371 2 — — 1,911 1,690 Private equity and other
principal investments 2,181 814 1,107 171 — 4,273 2,583 (1) The Company believes the fair value of these derivative contracts is a more relevant measure of these obligations because the Company believes the
notional amount overstates the expected payout. At May 31, 2008 and November 30, 2007, the fair value of these derivatives contracts approximated $16.6 billion and $36.8 billion, respectively.
Derivative contracts. Under FASB Interpretation No. 45, Guarantor’s Accounting and Disclosure Requirements for Guarantees, Including Indirect Guarantees of Indebtedness of Others (“FIN 45”), derivative contracts are considered to be guarantees if such contracts require the Company to make payments to counterparties based on changes in an underlying instrument or index (e.g., security prices, interest rates, and currency rates) and include written credit default swaps, written put options, written foreign exchange and interest rate options. Derivative contracts are not considered guarantees if these contracts are cash settled and the Company cannot determine if the derivative counterparty held the contracts’ underlying instruments at inception. The Company has determined these conditions have been met for certain large financial institutions. Accordingly, when these conditions are met, the Company has not included these derivatives in the Company’s guarantee disclosures.
At May 31, 2008 and November 30, 2007, the maximum payout value of derivative contracts deemed to meet the FIN 45 definition of a guarantee was approximately $729.3 billion and $737.9 billion, respectively. For purposes of determining maximum payout, notional values are used; however, the Company believes the fair value of these contracts is a more relevant measure of these obligations because the notional amounts greatly overstate the expected payout. At May 31, 2008 and November 30, 2007, the fair value of such derivative contracts approximated $16.6 billion and $36.8 billion, respectively. In addition, all amounts included above are before consideration of hedging transactions. The Company substantially mitigates its risk on these contracts through hedges, using other derivative contracts and/or cash instruments. The Company manages the risk associated with derivative guarantees consistent with its global risk management policies.
Municipal-securities-related commitments. At May 31, 2008 and November 30, 2007, the Company had municipal-securities-related commitments of approximately $6.0 billion and $6.9 billion, respectively, which are principally comprised of liquidity commitments related to trust certificates backed by high grade municipal securities. The Company believes its

LEHMAN BROTHERS HOLDINGS INC. Notes to Consolidated Financial Statements
(Unaudited)
- 41 -
liquidity commitments to these trusts involve a low level of risk because the obligations are supported by high grade securities and generally cease if the underlying assets are downgraded below investment grade or upon an issuer’s default.
Other commitments with VIEs. The Company makes certain liquidity commitments and guarantees to VIEs. The Company provides liquidity commitments of approximately $1.2 billion and $1.4 billion at May 31, 2008 and November 30, 2007, respectively, which represented its maximum exposure to loss, to commercial paper conduits in support of certain clients’ secured financing transactions. However, actual risk to the Company is less because these liquidity commitments are over-collateralized with investment grade collateral.
The Company provides limited downside protection guarantees to investors in certain VIEs by guaranteeing return of the VIEs’ investors’ initial principal investment. The Company’s maximum exposure to loss under such commitments was approximately $6.6 billion and $6.1 billion at May 31, 2008 and November 30, 2007, respectively; however, actual risk is less because the Company’s obligations are collateralized by the VIEs’ assets and contain significant constraints under which downside protection will be available (e.g., the VIE is required to liquidate assets in the event certain loss levels are triggered).
Additionally, the Company has entered into agreements that obligate it to purchase commercial paper from VIEs. The commercial paper is purchased by the Company and delivered to clients for purposes of funding a debt service reserve. The Company obtains guaranteed investment contracts underwritten by insurance companies on these agreements. The guaranteed investment contracts allow the Company to stop the agreements in the event of a default by the client upon delivery of the commercial paper. At May 31, 2008 and November 30, 2007, the Company was committed to purchase $1.7 billion and $1.3 billion, respectively.
At November 30, 2007, the Company was contingently committed to provide $1.6 billion of liquidity to an A-1/P-1 multi-seller conduit in the event the conduit was unable to remarket secured liquidity notes. The obligation to provide liquidity would generally occur one year after a failed remarketing attempt by the conduit. At May 31, 2008, this conduit is consolidated into the Company’s results of operations.
Standby letters of credit. At May 31, 2008 and November 30, 2007, respectively, the Company had commitments under letters of credit issued by banks to counterparties for $1.9 billion and $1.7 billion. The Company is contingently liable for these letters of credit which are primarily used to provide collateral for securities and commodities borrowed and to satisfy margin deposits at option and commodity exchanges.
Private equity and other principal investments. At May 31, 2008 and November 30, 2007, the Company had private equity and other principal investment commitments of approximately $4.3 billion and $2.6 billion, respectively, representing commitments to private equity partnerships and other principal investment opportunities. It has been the Company’s past practice to distribute and syndicate certain of these commitments to its investing clients.
Other. In the normal course of business, the Company provides guarantees to securities clearinghouses and exchanges. These guarantees generally are required under the standard membership agreements, such that members are required to guarantee the performance of other members. To mitigate these performance risks, the exchanges and clearinghouses often require members to post collateral.
In connection with certain asset sales and securitization transactions, the Company often makes customary representations and warranties about the assets. Violations of these representations and warranties, such as early payment defaults by borrowers, may require us to repurchase loans previously sold, or indemnify the purchaser against any losses. To mitigate these risks, to the extent the assets being securitized may have been originated by third parties, the Company generally obtains equivalent representations and warranties from these third parties when the Company acquires the assets. The Company has established reserves which it believes to be adequate in connection with such representations and warranties.
In the normal course of business, the Company is exposed to credit and market risk as a result of executing, financing and settling various client security and commodity transactions. These risks arise from the potential that clients or counterparties may fail to satisfy their obligations and the collateral obtained is insufficient. In such instances, the Company may be required to purchase or sell financial instruments at unfavorable market prices. The Company seeks to control these risks by obtaining margin balances and other collateral in accordance with regulatory and internal guidelines.
Certain of the Company’s subsidiaries, as general partners, are contingently liable for the obligations of certain public and private limited partnerships. In the Company’s opinion, contingent liabilities, if any, for the obligations of such partnerships will not, in the aggregate, have a material adverse effect on the Consolidated Statement of Financial Condition or Consolidated Statement of Income.

LEHMAN BROTHERS HOLDINGS INC. Notes to Consolidated Financial Statements
(Unaudited)
- 42 -
In connection with certain acquisitions and strategic investments, the Company agreed to pay additional consideration contingent on the acquired entity meeting or exceeding specified income, revenue or other performance thresholds. These payments will be recorded as amounts become determinable. Had the determination dates been May 31, 2008 and November 30, 2007, the Company’s estimated obligations related to these contingent consideration arrangements would have been $0.4 billion for both periods.
Income Taxes
The Company is under continuous examination by the Internal Revenue Service (the “IRS”), and other tax authorities in major operating jurisdictions such as the U.K. and Japan, and in various states in which the Company has significant operations, such as New York. The Company regularly assesses the likelihood of additional assessments in each tax jurisdiction and the impact on the Consolidated Financial Statements. Tax reserves have been established, which the Company believes to be adequate with regards to the potential for additional exposure. Once established, reserves are adjusted only when additional information is obtained or an event requiring a change to the reserve occurs. Management believes the resolution of these uncertain tax positions will not have a material impact on the financial condition of the Company; however resolution could have an impact on the Company’s effective tax rate in any reporting period. For a further discussion of the Company’s income tax liability, see Note 10, “Income Taxes,” to the Consolidated Financial Statements.
Litigation
In the normal course of business the Company has been named as a defendant in a number of lawsuits and other legal and regulatory proceedings. Such proceedings include actions brought against the Company and others with respect to transactions in which the Company acted as an underwriter or financial advisor, actions arising out of the Company’s activities as a broker or dealer in securities and commodities and actions brought on behalf of various classes of claimants against many securities firms, including the Company. The Company provides for potential losses that may arise out of legal and regulatory proceedings to the extent such losses are probable and can be estimated. Although there can be no assurance as to the ultimate outcome, the Company generally has denied, or believes it has a meritorious defense and will deny, liability in all significant cases pending against it, and the Company intends to defend vigorously each such case. Based on information currently available, the Company believes the amount, or range, of reasonably possible losses in excess of established reserves not to be material to the Company’s Consolidated Financial Condition or Cash Flows. However, losses may be material to operating results for any particular future period, depending on the level of income for such period.

LEHMAN BROTHERS HOLDINGS INC. Notes to Consolidated Financial Statements
(Unaudited)
- 43 -
Note 9 Earnings per Common Share
Three Months Ended May 31, Six Months Ended May 31,
In millions, except per share data 2008 2007 2008 2007
Numerator: Net income $(2,774) $1,273 $(2,285) $2,419 Less: Preferred stock dividends (99) (17) (123) (34)
Numerator for basic earnings per share— net income applicable to common stock $(2,873) $1,256 $(2,408) $2,385
Denominator: Denominator for basic earnings per share— weighted-average common shares 559.3 538.2 555.5 539.7 Effect of dilutive securities: Employee stock options 12.4 25.1 15.4 25.9 Restricted stock units 0.1 4.8 1.5 6.2
Dilutive potential common shares 12.5 29.9 16.9 32.1
Denominator for diluted earnings per share— weighted-average common and dilutive potential common shares (1) 571.8 568.1 572.4 571.8
Basic earnings per common share $ (5.14) $ 2.33 $ (4.33) $ 4.42 Diluted earnings per common share $ (5.14) $ 2.21 $ (4.33) $ 4.17
(1) Anti-dilutive options and restricted stock units excluded
from the calculations of diluted earnings per share 60.6 4.0 48.0 2.4
In March 2008, the Company issued $4.0 billion aggregate liquidation preference of 7.25% Non-Cumulative Perpetual Convertible Preferred Stock, Series P (the “Series P Convertible Preferred”). Each share of the Series P Convertible Preferred is convertible into 20.0509 shares of Holdings’ common stock, subject to adjustment. Each share of the Series P Convertible Preferred may be converted at any time at the option of the holder. On or after April 1, 2013, the Series P Convertible Preferred may be converted at the option of the Company into shares of Holdings’ common stock at the then applicable conversion rate if, for 20 trading days during any period of 30 consecutive trading days, the closing price of its common stock exceeds 130% of the then applicable conversion price of the Series P Convertible Preferred.
The EPS calculations above do not reflect the impact of the issuance of $4.0 billion of common stock on June 12, 2008. On a pro forma basis including this equity issuance, earnings per common share (diluted) for the three and six months ended May 31, 2008 would have been a loss of $4.09 per share and a loss of $3.45 per share, respectively.
For additional discussion of the Company’s common stock and non-cumulative mandatory convertible preferred stock issuances on June 12, 2008, see Note 14, “Subsequent Events” to the Consolidated Financial Statements.

LEHMAN BROTHERS HOLDINGS INC. Notes to Consolidated Financial Statements
(Unaudited)
- 44 -
Note 10 Income Taxes
The Company adopted FIN 48 on December 1, 2007 and recognized a decrease to opening retained earnings of approximately $178 million. Of this amount approximately $137 million was reflected as an increase to the liability for unrecognized tax benefits and $41 million was reflected as an increase to the associated interest and penalty accrual.
As of December 1, 2007, the total amount of liability for unrecognized tax benefits was approximately $1.3 billion. Of this amount, approximately $1.0 billion (net of federal benefit of state issues, creditability of foreign tax credits and competent authority relief) would favorably impact the effective tax rate if recognition of the uncertain tax positions occurred in the future. In addition to the unrecognized tax benefits, the Company has accrued interest and penalties in the Consolidated Financial Statements of approximately $0.3 billion. The Company classifies interest on unrecognized tax benefits as a component of interest expense, and accounts for penalties as a component of Provision for income taxes.
The Company operates in multiple taxing jurisdictions, both inside and outside the U.S., and faces audits from various tax authorities regarding many issues including but not limited to: transfer pricing, deductibility of certain expenses, creditability of foreign taxes, and other matters. The table below summarizes the major jurisdictions in which the Company operates and the earliest tax year in which the Company remains subject to examination:
Jurisdiction Tax Year
U.S. (IRS) 2001 U.K. 2003 Japan 2003 Korea 2002 New York State and New York City 1996
As indicated above, the Company is currently under audit by the IRS in the U.S. and other tax authorities in major operating jurisdictions such as the U.K. and Japan, and in various states in which the Company has significant operations, such as New York. While it is reasonably possible that a significant change in the balance of unrecognized tax benefits may occur within twelve months of this Form 10-Q, quantification of an estimated range of the change cannot be made at this time due to the uncertainty of the potential outcome of outstanding issues.
The IRS is currently undertaking an examination of the Company that covers tax years 2001 through 2005. While the examination is ongoing, the Company believes it is adequately reserved for any issues that may arise from this examination. The IRS previously completed an examination of the Company’s tax years 1997 through 2000. Although most issues were settled on a basis acceptable to the Company, two issues remain unresolved and will carry into litigation with the IRS. Based on the strength of its positions, the Company has not reserved any part of these issues. The aggregate tax benefits previously recorded with regard to these two issues is approximately $185 million. The two issues from the 1997 through 2000 cycle which the Company plans to litigate also have an impact on the 2001 through 2005 tax years. The aggregate tax benefit previously recorded with regard to these two issues for the 2001 through 2005 tax years is approximately $500 million.

LEHMAN BROTHERS HOLDINGS INC. Notes to Consolidated Financial Statements
(Unaudited)
- 45 -
Note 11 Employee Benefit Plans
The Company maintains various pension and postretirement benefit plans. The components of the Company’s net periodic benefit expense for its pension and postretirement plans were as follows:
Pension Benefits Other Postretirement U.S. Non–U.S. Benefits In millions 2008 2007 2008 2007 2008 2007
Three Months Ended May 31, Service cost $ 12 $ 14 $ 3 $ 2 $― $― Interest cost 18 16 7 6 1 1 Expected return on plan assets (22) (21) (11) (9) ― ― Amortization of net actuarial loss 3 7 1 2 ― ―
Amortization of prior service cost 1 1 ― ― ― ―
Net periodic cost $ 12 $ 17 $ ― $ 1 $ 1 $ 1
Six Months Ended May 31, Service cost $ 24 $ 28 $ 5 $ 3 $ 1 $― Interest cost 35 33 13 13 2 2 Expected return on plan assets (45) (43) (22) (19) ― ― Amortization of net actuarial loss 5 14 2 6 ― ―
Amortization of prior service cost 2 2 ― ― ― ―
Net periodic cost $ 21 $ 34 $ (2) $ 3 $ 3 $ 2
Note 12 Regulatory Requirements
For regulatory purposes, Holdings and its subsidiaries are referred to collectively as a CSE. CSEs are supervised and examined by the SEC, which requires minimum capital standards on a consolidated basis. At May 31, 2008, Holdings was in compliance with the CSE capital requirements and had allowable capital in excess of the minimum capital requirements on a consolidated basis.
In the United States, Lehman Brothers Inc. (“LBI”) and Neuberger Berman, LLC (“NB LLC”) are registered broker-dealers in the U.S. that are subject to SEC Rule 15c3-1 and Rule 1.17 of the Commodity Futures Trading Commission, which specify minimum net capital requirements for the registrants. LBI and NB LLC have consistently operated with net capital in excess of their respective regulatory capital requirements. LBI has elected to calculate its minimum net capital in accordance with Appendix E of the Net Capital Rule which establishes alternative net capital requirements for broker-dealers that are part of CSEs. In addition to meeting the alternative net capital requirements, LBI is required to maintain tentative net capital in excess of $1 billion and net capital in excess of $500 million. LBI is also required to notify the SEC in the event that its tentative net capital is less than $5 billion. As of May 31, 2008, LBI had net capital of approximately $3.8 billion, which exceeded the minimum alternative net capital requirement by approximately $3.1 billion. As of May 31, 2008, NB LLC had net capital of approximately $261 million, which exceeded the minimum net capital requirement by approximately $256 million.
Lehman Brothers International (Europe) (“LB Europe”), a United Kingdom registered broker-dealer and subsidiary of Holdings, is subject to the capital requirements of the Financial Services Authority (“FSA”) in the United Kingdom. Financial resources, as defined, must exceed the total financial resources requirement of the FSA. At May 31, 2008, LB Europe’s financial resources of approximately $16.5 billion exceeded the minimum requirement by approximately $9.6 billion. In January 2008, LB Europe became subject to Basel II, which includes mandated minimum regulatory capital requirements. At May 31, 2008, LB Europe exceeded this capital resources requirement by $4.2 billion. Lehman Brothers Japan (“LB Japan”), a regulated broker-dealer, is subject to the capital requirements of the FSA in Japan and the Bank of Japan. At May 31, 2008, LB Japan had net capital of approximately $1.2 billion, which was approximately $571 million in excess of Financial Services Agency in Japan’s required level and approximately $311 million in excess of Bank of Japan’s required level.

LEHMAN BROTHERS HOLDINGS INC. Notes to Consolidated Financial Statements
(Unaudited)
- 46 -
Lehman Brothers Bank, FSB (“LB Bank”), the Company’s thrift subsidiary, is regulated by the Office of Thrift Supervision. Lehman Brothers Commercial Bank (“LB Commercial Bank”), the Company’s Utah industrial bank subsidiary is regulated by the Utah Department of Financial Institutions and the Federal Deposit Insurance Corporation. LB Bank and LB Commercial Bank exceeded all regulatory capital requirements and are considered to be well capitalized as of May 31, 2008. Bankhaus is subject to the capital requirements of the Federal Financial Supervisory Authority of the German Federal Republic. At May 31, 2008, Bankhaus’ financial resources exceeded its minimum financial resources requirement.
Certain other subsidiaries are subject to various securities, commodities and banking regulations and capital adequacy requirements promulgated by the regulatory and exchange authorities of the countries in which they operate. At May 31, 2008, these other subsidiaries were in compliance with their applicable local capital adequacy requirements.
In addition, the Company’s “AAA” rated derivatives subsidiaries, Lehman Brothers Financial Products Inc. (“LBFP”) and Lehman Brothers Derivative Products Inc. (“LBDP”), have established certain capital and operating restrictions that are reviewed by various rating agencies. At May 31, 2008, LBFP and LBDP each had capital that exceeded the requirements of the rating agencies.
The regulatory rules referred to above, and certain covenants contained in various debt agreements, may restrict Holdings’ ability to withdraw capital from its regulated subsidiaries, which in turn could limit its ability to pay dividends to shareholders. Holdings fully guarantees the payment of all liabilities, obligations and commitments of certain of its subsidiaries.
Note 13 Condensed Consolidating Financial Statement Schedules
LBI, a wholly-owned subsidiary of Holdings, had approximately $0.2 billion of debt securities outstanding at May 31, 2008 that were issued in registered public offerings and were therefore subject to the reporting requirements of Sections 13(a) and 15(d) of the Securities Exchange Act of 1934, as amended (the “Exchange Act”). Holdings has fully and unconditionally guaranteed these outstanding debt securities of LBI (and any debt securities of LBI that may be issued in the future under these registration statements), which, together with the information presented in this Note 13, allows LBI to avail itself of an exemption provided by SEC rules from the requirement to file separate LBI reports under the Exchange Act. See Note 15 to the 2007 Consolidated Financial Statements included in Holdings’ Annual Report on Form 10-K for the fiscal year ended November 30, 2007 for a discussion of restrictions on the ability of Holdings to obtain funds from its subsidiaries by dividend or loan.
The following schedules set forth the Company’s condensed consolidating statements of income for the three and six months ended May 31, 2008 and 2007, the Company’s condensed consolidating balance sheets at May 31, 2008 and November 30, 2007, and the Company’s condensed consolidating statements of cash flows for the six months ended May 31, 2008 and 2007. In the following schedules, “Holdings” refers to the unconsolidated balances of Holdings, “LBI” refers to the unconsolidated balances of Lehman Brothers Inc. and “Other Subsidiaries” refers to the combined balances of all other subsidiaries of Holdings. “Eliminations” represents the adjustments necessary to (i) eliminate intercompany transactions and (ii) eliminate investments in subsidiaries.

LEHMAN BROTHERS HOLDINGS INC. Notes to Consolidated Financial Statements
(Unaudited)
- 47 -
Condensed Consolidating Statement of Income
Other In millions Holdings LBI Subsidiaries Eliminations Total
Three Months Ended May 31, 2008 Net revenues $(1,674) $ 848 $ 158 $ — $ (668) Equity in net income of subsidiaries (1,478) (802) — 2,280 — Total non-interest expenses 415 589 2,415 — 3,419
Income before taxes (3,567) (543) (2,257) 2,280 (4,087) Provision (benefit) for income taxes (793) 106 (626) — (1,313)
Net income $(2,774) $ (649) $(1,631) $ 2,280 $(2,774)
Three Months Ended May 31, 2007 Net revenues $ (604) $1,350 $ 4,766 $ — $ 5,512 Equity in net income of subsidiaries 1,856 379 — (2,235) — Total non-interest expenses 213 951 2,469 — 3,633
Income before taxes 1,039 778 2,297 (2,235) 1,879 Provision (benefit) for income taxes (234) 152 688 — 606
Net income $ 1,273 $ 626 $ 1,609 $(2,235) $ 1,273
Six Months Ended May 31, 2008 Net revenues $(2,575) $ 466 $ 4,948 $ — $ 2,839 Equity in net income of subsidiaries (688) 168 — 520 — Total non-interest expenses 138 1,081 5,044 — 6,263
Income before taxes (3,401) (447) (96) 520 (3,424) Provision (benefit) for income taxes (1,116) (298) 275 — (1,139)
Net income $(2,285) $(149) $ (371) $ 520 $(2,285)
Six Months Ended May 31, 2007 Net revenues $(1,061) $2,633 $ 8,987 $ — $10,559 Equity in net income of subsidiaries 3,211 759 — (3,970) — Total non-interest expenses 172 1,875 4,934 — 6,981
Income before taxes 1,978 1,517 4,053 (3,970) 3,578 Provision (benefit) for income taxes (441) 262 1,338 — 1,159
Net income $ 2,419 $1,255 $ 2,715 $ (3,970) $ 2,419

LEHMAN BROTHERS HOLDINGS INC. Notes to Consolidated Financial Statements
(Unaudited)
- 48 -
Condensed Consolidating Balance Sheet at May 31, 2008 Other In millions Holdings LBI Subsidiaries Eliminations Total
Assets
Cash and cash equivalents $ 736 $ 232 $ 5,825 $ (280) $ 6,513
Cash and securities segregated and on
deposit for regulatory and other purposes — 8,538 4,493 — 13,031
Financial instruments and other inventory
positions owned 29,777 63,606 264,449 (88,423) 269,409
Collateralized agreements 158 156,244 138,124 — 294,526
Receivables and other assets 5,203 14,066 49,467 (12,783) 55,953
Due from subsidiaries 171,787 76,810 534,716 (783,313) —
Equity in net assets of subsidiaries 24,096 1,406 80,344 (105,846) —
Total assets $231,757 $320,902 $1,077,418 $(990,645) $639,432
Liabilities and stockholders’ equity
Short-term borrowings and current portion of
long-term borrowings $ 25,766 $ 234 $ 9,685 $ (383) $ 35,302
Financial instruments and other inventory
positions sold but not yet purchased 954 41,319 177,088 (77,854) 141,507
Collateralized financing 9,896 85,750 123,538 (11,262) 207,922
Accrued liabilities and other payables 749 21,211 60,491 (11,563) 70,888
Due to subsidiaries 79,261 160,727 465,163 (705,151) —
Deposit liabilities at banks — — 29,542 (187) 29,355
Long-term borrowings 88,855 7,034 110,692 (78,399) 128,182
Total liabilities 205,481 316,275 976,199 (884,799) 613,156
Total stockholders’ equity 26,276 4,627 101,219 (105,846) 26,276
Total liabilities and stockholders’ equity $231,757 $320,902 $1,077,418 $(990,645) $639,432

LEHMAN BROTHERS HOLDINGS INC. Notes to Consolidated Financial Statements
(Unaudited)
- 49 -
Condensed Consolidating Balance Sheet at November 30, 2007 Other In millions Holdings LBI Subsidiaries Eliminations Total
Assets
Cash and cash equivalents $ 2,218 $ 356 $ 6,205 $ (1,493) $ 7,286
Cash and securities segregated and on
deposit for regulatory and other purposes 12 7,986 4,745 — 12,743
Financial instruments and other inventory
positions owned 34,221 85,617 262,753 (69,462) 313,129
Collateralized agreements — 177,499 123,735 — 301,234
Receivables and other assets 7,691 18,325 48,363 (17,708) 56,671
Due from subsidiaries 144,176 81,078 658,244 (883,498) —
Equity in net assets of subsidiaries 25,058 1,491 78,655 (105,204) —
Total assets $ 213,376 $ 372,352 $ 1,182,700 $ (1,077,365) $691,063
Liabilities and stockholders’ equity
Short-term borrowings and current portion of
long-term borrowings $ 16,574 $ 936 $ 13,020 $ (2,464) $ 28,066
Financial instruments and other inventory
positions sold but not yet purchased 3,020 52,422 155,352 (61,177) 149,617
Collateralized financing 9,451 118,912 134,733 (5,065) 258,031
Accrued liabilities and other payables 3,641 24,801 70,262 (18,358) 80,346
Due to subsidiaries 70,861 165,607 567,840 (804,308) —
Deposit liabilities at banks — — 29,584 (221) 29,363
Long-term borrowings 87,339 5,228 111,151 (80,568) 123,150
Total liabilities 190,886 367,906 1,081,942 (972,161) 668,573
Total stockholders’ equity 22,490 4,446 100,758 (105,204) 22,490
Total liabilities and stockholders’ equity $ 213,376 $ 372,352 $ 1,182,700 $ (1,077,365) $691,063

LEHMAN BROTHERS HOLDINGS INC. Notes to Consolidated Financial Statements
(Unaudited)
- 50 -
Condensed Consolidating Statement of Cash Flows for the Six Months Ended May 31, 2008 Other In millions Holdings LBI Subsidiaries Eliminations Total
Cash Flows from Operating Activities Net income $ (2,285) $ (149) $ (371) $ 520 $ (2,285) Adjustments to reconcile net income to net cash provided by (used in) operating activities: Equity in income of subsidiaries 688 (168) — (520) — Depreciation and amortization 128 20 177 — 325 Non-cash compensation 868 — — — 868 Other adjustments 8 13 (78) (2) (59) Net change in: Cash and securities segregated and on deposit for regulatory and other purposes 12 (552) 252 — (288) Financial instruments and other inventory positions owned 5,000 22,007 (2,916) 18,961 43,052 Financial instruments and other inventory positions sold but not yet purchased (2,066) (11,103) 22,103 (16,677) (7,743) Collateralized agreements and collateralized financing, net 287 (11,907) (25,584) (6,197) (43,401) Other assets and payables, net 239 668 (11,147) 1,872 (8,368) Due to/from affiliates, net (19,211) (612) 20,851 (1,028) —
Net cash provided by (used in) operating activities (16,332) (1,783) 3,287 (3,071) (17,899)
Cash Flows from Investing Activities Dividends received/(paid) 780 1,100 (1,880) — — Purchase of property, equipment and leasehold improvements, net (288) (10) (189) — (487) Business acquisitions, net of cash acquired — — (91) — (91) Capital contributions from LBI — (978) 978 — — Capital contributions from Holdings (791) 453 338 — —
Net cash provided by (used in) investing activities (299) 565 (844) — (578)
Cash Flows from Financing Activities Net (payments for ) proceeds from: Issuance of short-term borrowings, net 4,985 (101) (3,919) 2,081 3,046 Derivative contracts with a financing element — — (367) — (367) Deposit liabilities at banks — — (42) 34 (8) Tax benefit from the issuance of stock-based awards 37 — — — 37 Net proceeds from: Issuance of common stock 2 — — — 2 Issuance of long-term borrowings 16,108 1,800 20,349 (5,459) 32,798 Issuance of preferred stock, net of issuance costs 5,856 — — — 5,856 Issuance of treasury stock 203 — — — 203 Payments for: Principal payments of long-term borrowings, including the current portion of long-term borrowings (10,948) (605) (18,844) 7,628 (22,769) Purchase of treasury stock (760) — — — (760) Dividends paid (334) — — — (334)
Net cash provided by (used in) financing activities 15,149 1,094 (2,823) 4,284 17,704
Net change in cash and cash equivalents (1,482) (124) (380) 1,213 (773) Cash and cash equivalents, beginning of period 2,218 356 6,205 (1,493) 7,286
Cash and cash equivalents, end of period $ 736 $ 232 $ 5,825 $ (280) $ 6,513

LEHMAN BROTHERS HOLDINGS INC. Notes to Consolidated Financial Statements
(Unaudited)
- 51 -
Condensed Consolidating Statement of Cash Flows for the Six Months Ended May 31, 2007
Other In millions Holdings LBI Subsidiaries Eliminations Total
Cash Flows from Operating Activities Net income $ 2,419 $ 1,255 $ 2,715 $ (3,970) $ 2,419 Adjustments to reconcile net income to net cash provided by (used in) operating activities: Equity in income of subsidiaries (3,211) (759) — 3,970 — Depreciation and amortization 96 18 170 — 284 Non-cash compensation 631 — — — 631 Other adjustments 2 13 (44) (3) (32) Net change in: Cash and securities segregated and on deposit for regulatory and other purposes 39 (83) (1,019) — (1,063) Financial instruments and other inventory positions owned (15,115) (7,797) (44,703) 10,692 (56,923) Financial instruments and other inventory positions sold but not yet purchased 449 8,105 48,318 (14,943) 41,929 Collateralized agreements and collateralized financing, net 6,996 (15,286) (2,796) 3,142 (7,944) Other assets and payables, net (1,512) 2,754 (4,818) 460 (3,116) Due to/from affiliates, net (10,960) 12,399 (14,816) 13,377 —
Net cash provided by (used in) operating activities (20,166) 619 (16,993) 12,725 (23,815)
Cash Flows from Investing Activities Dividends received/(paid) 1,685 (201) (1,484) — — Purchase of property, equipment and leasehold improvements, net (228) (25) (194) — (447) Business acquisitions, net of cash acquired — — (461) — (461) Proceeds from sale of business — — 65 — 65 Capital contributions from LBI — — — — — Capital contributions from Holdings (1,120) — 1,120 — —
Net cash provided by (used in) investing activities 337 (226) (954) — (843)
Cash Flows from Financing Activities Net (payments for) proceeds from: Issuance of short-term borrowings, net 1,950 (136) 1,040 (170) 2,684 Derivative contracts with a financing element — — 126 — 126 Deposit liabilities at banks — — (2,329) 1,731 (598) Tax benefit from the issuance of stock-based awards 225 — — — 225 Net proceeds from: Issuance of common stock 28 — — — 28 Issuance of long-term borrowings 22,690 — 48,518 (31,384) 39,824 Issuance of treasury stock 240 — — — 240 Payments for: Principal payments of long-term borrowings, including the current portion of long-term borrowings (5,437) (306) (28,047) 17,475 (16,315) Purchase of treasury stock (2,039) — — — (2,039) Dividends paid (211) — — — (211)
Net cash provided by (used in) financing activities 17,446 (442) 19,308 (12,348) 23,964
Net change in cash and cash equivalents (2,383) (49) 1,361 377 (694) Cash and cash equivalents, beginning of period 3,435 534 4,369 (2,351) 5,987
Cash and cash equivalents, end of period $ 1,052 $ 485 $ 5,730 $ (1,974) $ 5,293

LEHMAN BROTHERS HOLDINGS INC. Notes to Consolidated Financial Statements
(Unaudited)
- 52 -
Note 14 Subsequent Events
On June 12, 2008, the Company completed the issuance and sale of 143 million shares of its common stock, par value $0.10 (“Common Stock”). The sale of the Common Stock closed at a price of $28.00 per share, resulting in approximately $4.0 billion of proceeds for the Company.
On June 12, 2008, the Company issued 2 million shares ($2.0 billion aggregate liquidation preference) of 8.75% Non-Cumulative Mandatory Convertible Preferred Stock, Series Q (the “Series Q Convertible Preferred”). Each share of the Series Q Convertible Preferred is convertible at any time at the option of the holder into 30.2663 shares of Common Stock, subject to adjustment. Each share of the Series Q Convertible Preferred will be mandatorily converted on July 1, 2011 into between 30.2663 shares and 35.7142 shares of Common Stock, unless earlier converted at the option of the holder. The conversion rate is subject to adjustment in certain circumstances.

LEHMAN BROTHERS HOLDINGS INC.
- 53 -
Report of Independent Registered Public Accounting Firm
The Board of Directors and Stockholders of Lehman Brothers Holdings Inc.
We have reviewed the consolidated statement of financial condition of Lehman Brothers Holdings Inc. and subsidiaries (the “Company”) as of May 31, 2008, and the related consolidated statement of income for the three and six month periods ended May 31, 2008 and 2007, and the consolidated statement of cash flows for the six month periods ended May 31, 2008 and 2007. These financial statements are the responsibility of the Company's management.
We conducted our review in accordance with the standards of the Public Company Accounting Oversight Board (United States). A review of interim financial information consists principally of applying analytical procedures and making inquiries of persons responsible for financial and accounting matters. It is substantially less in scope than an audit conducted in accordance with the standards of the Public Company Accounting Oversight Board (United States), the objective of which is the expression of an opinion regarding the financial statements taken as a whole. Accordingly, we do not express such an opinion.
Based on our review, we are not aware of any material modifications that should be made to the consolidated financial statements referred to above for them to be in conformity with U.S. generally accepted accounting principles.
We have previously audited, in accordance with the standards of the Public Company Accounting Oversight Board (United States), the consolidated statement of financial condition of the Company as of November 30, 2007, and the related consolidated statements of income, stockholders’ equity, and cash flows for the year then ended and in our report dated January 28, 2008, we expressed an unqualified opinion on those consolidated financial statements.
New York, New York July 10, 2008

LEHMAN BROTHERS HOLDINGS INC. PART I — FINANCIAL INFORMATION
- 54 -
ITEM 2. MANAGEMENT’S DISCUSSION AND ANALYSIS OF FINANCIAL CONDITION AND RESULTS OF OPERATIONS
Page Contents Number
Introduction .................................................................................................................................. 55
Forward-Looking Statements ................................................................................................... 55
Executive Overview .................................................................................................................... 55
Critical Accounting Policies and Estimates ........................................................................... 58
Consolidated Results of Operations........................................................................................ 64
Impact from Market Events...................................................................................................... 67
Business Segments....................................................................................................................... 73
Geographic Segments ................................................................................................................. 79
Liquidity, Funding and Capital Resources ............................................................................. 80
Lending-Related Commitments ............................................................................................... 90
Off-Balance-Sheet Arrangements ............................................................................................ 91
Risk Management......................................................................................................................... 93
CSE Regulatory Capital .............................................................................................................. 101
Accounting and Regulatory Developments........................................................................... 103
Effects of Inflation ...................................................................................................................... 108

LEHMAN BROTHERS HOLDINGS INC. Management’s Discussion and Analysis of Financial Condition and Results of Operations
- 55 -
Introduction
Lehman Brothers Holdings Inc. (“Holdings”) and subsidiaries (collectively, the “Company,” the “Firm,” “Lehman Brothers,” “we,” “us” or “our”) serves the financial needs of corporations, governments and municipalities, institutional clients and high net worth individuals worldwide with business activities organized in three segments: Capital Markets, Investment Banking and Investment Management. Founded in 1850, Lehman Brothers maintains market presence in equity and fixed income sales, trading and research, investment banking, asset management, private investment management and private equity. The Company is headquartered in New York, with regional headquarters in London and Tokyo, and operates in a network of offices in North America, Europe, the Middle East, Latin America and the Asia Pacific region. The Company is a member of all principal securities and commodities exchanges in the U.S., and holds memberships or associate memberships on several principal international securities and commodities exchanges, including the London, Tokyo, Hong Kong, Frankfurt, Paris, Milan and Australian stock exchanges.
This Management’s Discussion and Analysis of Financial Condition and Results of Operations (“MD&A”) should be read together with the Consolidated Financial Statements and the accompanying notes contained in this Report and Management’s Discussion and Analysis of Financial Condition and Results of Operations and the Consolidated Financial Statements and notes thereto included in Holdings’ Annual Report on Form 10-K for the fiscal year ended November 30, 2007 (the “Form 10-K”). Unless specifically stated otherwise, all references in this MD&A to the 2008 and 2007 quarters and the three and six month reporting periods refer to the quarters or six month periods ended May 31, 2008 and 2007, or the last date of such fiscal periods, as the context requires, and all references to quarters are to the Company’s fiscal quarters. Certain prior-period amounts reflect reclassifications to conform to the current year’s presentation.
Forward-Looking Statements
Some of the statements contained in this MD&A, including those relating to the Company’s strategy and other statements that are predictive in nature, that depend on or refer to future events or conditions or that include words such as “expects,” “anticipates,” “intends,” “plans,” “believes,” “estimates” and similar expressions, are forward-looking statements within the meaning of Section 21E of the Exchange Act. These statements are not historical facts but instead represent only management’s expectations, estimates and projections regarding future events. Similarly, these statements are not guarantees of future performance and involve certain risks and uncertainties that are difficult to predict, which may include, but are not limited to, market risk, investor sentiment, liquidity risk, credit ratings changes, credit exposure and operational, legal, regulatory and reputational risks. For further discussion of these risks, see “Risk Factors” and “Management’s Discussion and Analysis of Financial Condition and Results of Operations – Certain Factors Affecting Results of Operations” in the Form 10-K.
As a global investment bank, the nature of the Company’s business makes predicting future performance difficult. Revenues and earnings may vary from quarter to quarter and from year to year. Caution should be used when extrapolating historical results to future periods. The Company’s actual results and financial condition may differ, perhaps materially, from the anticipated results and financial condition in any such forward-looking statements and, accordingly, readers are cautioned not to place undue reliance on such statements, which speak only as of the date on which they are made. The Company undertakes no obligation to update any forward-looking statements, whether as a result of new information, future events or otherwise.
Executive Overview1
Summary of Results
The Company reported a net loss for the second quarter of 2008 of $2.8 billion, or a $5.14 loss per common share (diluted), compared with net earnings for the second quarter of 2007 of $1.3 billion, or $2.21 per common share (diluted). Revenues, net of interest expense (“net revenues”) for the second quarter of 2008 were negative $0.7 billion, compared to $5.5 billion in the prior-year period. The pre-tax loss for the second quarter of 2008 was $4.1 billion, compared with pre-tax earnings of $1.9 billion for the prior-year period.
For the six months ended May 31, 2008, the Company incurred a net loss of $2.3 billion, or a $4.33 loss per common share (diluted), compared with net earnings for the six months ended May 31, 2007 of $2.4 billion, or a $4.17 per common share (diluted). Net revenues for the six months ended May 31, 2008 were $2.8 billion, compared to $10.6 billion in the prior-year
1 Market share, volume and ranking statistics in this MD&A were obtained from Thomson Financial, an operating unit of The Thomson Reuters
Corporation.

LEHMAN BROTHERS HOLDINGS INC. Management’s Discussion and Analysis of Financial Condition and Results of Operations
- 56 -
six month period. The pre-tax loss for the six months ended May 31, 2008 was $3.4 billion, compared with pre-tax earnings of $3.6 billion in the prior-year six month period.
The losses in the Company’s net revenues and earnings during the second quarter of 2008 were driven by losses within the Capital Markets business segment which more than offset net revenues from the Investment Banking and Investment Management segments. Net revenues were significantly impacted by challenging market conditions that continued to impact the Company’s valuation of certain financial instruments, primarily residential and commercial mortgage-related assets and related economic hedges to those asset classes. The Company also incurred losses on principal investing activities, economic hedging activities and defensive rates and credit trading positions. These losses were partially offset by gains on certain of the Company’s debt liabilities. The impact of these events is reflected within the Company’s Capital Markets business segment and principally within the Fixed Income component.
The Company’s Capital Markets business segment reported negative net revenues for the three and six months ended May 31, 2008 of negative $2.4 billion and negative $0.7 billion, respectively, compared to net revenue of $3.6 billion and $7.1 billion for the three and six months ended May 31, 2007, respectively. Capital Markets—Fixed Income net revenues for the three and six months ended May 31, 2008 were negative $3.0 billion and negative $2.7 billion, respectively, compared to $1.9 billion and $4.1 billion in the corresponding 2007 periods. For the three and six months ended May 31, 2008, Capital Markets—Equities reported net revenues of $0.6 billion and $2.0 billion respectively, a decrease of 64% and 33% from $1.7 billion and $3.0 billion for the three and six months ended May 31, 2007, respectively. Investment Banking segment net revenues were $0.9 billion and $1.7 billion in the 2008 three and six months, respectively, down 25% and 14% from the corresponding 2007 periods. Investment Management segment net revenues increased 10% and 24% to $0.8 billion and $1.8 billion in the 2008 three and six months, respectively, compared to the corresponding 2007 periods, reflecting increasing net revenues in both Asset Management and Private Investment Management. Assets under management (“AUM”) at May 31, 2008 were $277 billion, an increase of 5% from levels at May 31, 2007 and a 2% decrease from levels at November 30, 2007.
During the second quarter of 2008, the Company reduced assets, including inventory positions related to residential mortgages, commercial mortgage and real estate-related investments, and acquisition finance facilities. At May 31, 2008, the Company’s total assets were approximately $639.4 billion, representing a 19% decrease, or a reduction of $146.6 billion, from total asset levels of $786.0 billion at February 29, 2008. May 31, 2008 total asset balances were 7% lower, or $51.6 billion less than total asset levels reported at November 30, 2007. The combined effect of an equity raise as well as the reduction of assets in the second quarter of 2008 resulted in a decrease in the Company’s gross and net leverage ratios to 24.34x and 12.06x at May 31, 2008, respectively, from 30.73x and 16.14x at November 30, 2007.1
The Company’s business, by its nature, does not produce predictable earnings. Results in any given period can be materially affected by conditions in global financial markets and economic conditions generally. For a further discussion of factors that may affect future operating results, see “Management’s Discussion and Analysis of Financial Condition and Results of Operations—Certain Factors Affecting Results of Operations” in the Form 10-K. For a detailed discussion of results of operations by business segments and geographic regions, see “Business Segments” and “Geographic Segments” in this MD&A.
Business Environment
As an investment banking, securities and investment management firm, the Company’s businesses are materially affected by conditions in the global financial markets and worldwide economic conditions. A favorable business environment is generally characterized by, among other factors, high global gross domestic product growth, stable geopolitical conditions, transparent and efficient capital markets, liquid markets with active investors, low inflation, high business and consumer confidence and strong business earnings. These factors provide a positive climate for investment banking activities, for many of the Company’s capital markets trading businesses and for wealth creation, which contributes to growth in the Company’s asset management business. For further discussion of how market conditions can affect business, see “Risk Factors” and “Management’s Discussion and Analysis of Financial Condition and Results of Operations—Certain Factors Affecting Results of Operations” in the Form 10-K.
1 Gross leverage ratio is computed by dividing assets by stockholders’ equity. The Company’s net leverage ratio is calculated as net assets divided by
tangible equity capital. The Company calculates net assets by excluding from total assets: (i) cash and securities segregated and on deposit for regulatory and other purposes; (ii) collateralized lending agreements; and (iii) identifiable intangible assets and goodwill. The Company believes net leverage based on net assets to be a more useful measure of leverage, because it excludes certain low-risk, non-inventory assets and utilizes tangible equity capital as a measure of equity base. The Company calculates tangible equity capital by including stockholders’ equity and junior subordinated notes and excluding identifiable intangible assets and goodwill. The Company believes tangible equity capital to be a more meaningful measure of equity base for purposes of calculating net leverage because it includes instruments the Company considers to be equity-like and excludes identifiable intangible assets and goodwill because the Company does not view equity used to support those intangible assets and goodwill as available to support remaining net assets. For a further discussion of leverage ratios, see “Liquidity—Capital Ratios” in this MD&A.

LEHMAN BROTHERS HOLDINGS INC. Management’s Discussion and Analysis of Financial Condition and Results of Operations
- 57 -
During the second quarter of 2008, the Company operated in an unfavorable global business environment. Conditions were characterized by a continued lack of liquidity in the credit markets, significantly depressed volumes in most equity markets, a widening in certain fixed income credit spreads compared to the end of the 2007 fiscal year and declining asset values. Growth in major economies slowed as a result of declining business and consumer confidence. Global inflation rose, amid slowing economic growth. Commodity prices rose significantly during the quarter, with oil and gold reaching record levels, raising costs of industrial production. Consumer spending was challenged by a combination of lower wealth from declining housing values, higher commodity prices impacting levels of disposable income, and falling private sector employment growth. Central banks’ concerns regarding exacerbating inflationary conditions limited their ability to effect monetary policies intended to provide liquidity within the markets. The combination of low levels of liquidity and financial companies de-leveraging their balance sheets resulted in downward pressure on financial asset prices. These global economic conditions, in aggregate, depressed both the valuations of the Company’s inventory positions as well as transactional volumes and market activity levels in which the Company’s Capital Markets and Investment Banking business segments operated during the fiscal quarter.
Based upon estimates by the Company’s economists, global economic growth was approximately 2.5% at the end of the second quarter of 2008 compared to 3.5% in fiscal year 2007. The decrease was driven by a slowdown in the Americas and Eurozone. The Company anticipates global economic growth in subsequent fiscal quarters to be less than levels in the second fiscal quarter of 2008. The magnitude of the growth deceleration is largely dependent on how extended and severe the credit dislocation continues to be, results from fiscal and monetary policy actions, accessibility of new sources of liquidity and oil prices leveling or continuing to increase.
At the end of the Company’s 2008 second quarter, the global fixed income environment was characterized by tighter spreads compared to the first quarter of 2008. However, spreads were still at wider levels than at the end of the 2007 fiscal year. Global high yield and high grade spread indices tightened 78 basis points and 9 basis points, respectively, at the end of the second quarter compared to the end of the first quarter of 2008 and widened 81 and 43 basis points, respectively, compared to the end of the 2007 fiscal year. At the end of the second quarter of 2008, global equity markets modestly increased from levels at the end of the first quarter of 2008 but were down 6.6% at the end of the second quarter compared to the end of fiscal year 2007. Global corporate activity levels in completed M&A transactions for the 2008 second quarter were lower, compared to levels at the end of the first quarter of 2008 and those at the end of the 2007 fiscal year. Equity underwriting levels for the 2008 second quarter were down 25% from the 2007 fourth quarter and fixed income underwriting levels for the 2008 second quarter increased 7% between the benchmark periods.
Investment banking activity for the remaining 2008 calendar year is expected to be modest. Global public issuance markets have contracted from 2007 levels. The Company believes full-year 2008 M&A volumes will decline compared to full-year 2007 levels. The anticipated decrease in 2008 investment banking activities is the result of both comparatively lower financial sponsor activity as well as slower economic growth. This is expected to be offset in part by: (i) the weak U.S. dollar attracting cross-border transactions; (ii) companies focusing on core businesses and divesting non-core functions; (iii) selective financing of strategic deals; and (iv) equity or hybrid equity offerings.
Real gross domestic product growth (“GDP”) in the U.S. economy, as forecasted by the Company’s economists, expanded by an estimated 1.0% for the 2008 second quarter, compared to GDP growth of 1.0% in the first quarter. This forecast is predicated upon declining consumer spending resulting from increasing unemployment levels and declining wealth measures. Expected relief on consumer spending as a result of fiscal stimulus packages may be annulled from rising commodity prices, particularly oil and grains. Continued slowdowns in home sales and commercial real estate investments suggest inventories may continue to rise and increase levels of construction and price cuts. Growth in industrial production slowed from 2007 levels, reflecting reduced growth in domestic consumer demand, partially offset by demand for U.S. exports. Market indications suggesting declines in business and consumer confidences continue to be present as they were in the prior quarter. In March 2008, the Federal Reserve Bank of New York created the Primary Dealer Credit Facility which was designed to address elevated pressures in short-term funding markets. The U.S. Federal Reserve Board reduced rates twice in the fiscal quarter and is anticipated to hold rates steady over the next several meetings. The Company’s economists expect the terminal funds rate will be within the range of 1.50% and 2.00% by the end of the fourth quarter due to rising energy costs, tightening credit conditions, a continued drop in home prices and weak job markets. Long-term bond yields increased, with the 10-year Treasury note yield ending the fiscal quarter at 4.10%, up approximately 70 basis points from the first quarter of 2008. At the end of the second fiscal quarter, the S&P 500 Index, Dow Jones Industrial Average and NASDAQ composites decreased 8.5%, 7.3%, and 3.1%, respectively, from 2007 second quarter levels.
In Eurozone countries and the U.K., economic growth slowed during the second quarter of the 2008 fiscal year as the disruption in the global financial markets and higher oil prices affected spending and consumer confidence. Business activity reflected a decline from the benchmark period as a result of tighter credit conditions and an overall decrease in

LEHMAN BROTHERS HOLDINGS INC. Management’s Discussion and Analysis of Financial Condition and Results of Operations
- 58 -
consumption across all sectors. Labor markets appeared unaffected as unemployment levels modestly declined over the quarter. Measures of core inflation increased during the 2008 second quarter mainly due to elevated pressure in the energy and food markets. The European Central Bank held rates level during the fiscal quarter and the Company’s economists expect a rate increase to occur in the third quarter of the 2008 fiscal year. In April 2008, the Bank of England eased rates and a further rate reduction is anticipated during the remaining quarters of the fiscal year. The Bund and Gilts’ 10-year yields were 4.4% and 4.8%, respectively, at the 2008 second quarter-end compared to 3.9% and 4.3%, respectively, at the 2008 first quarter-end. Equity volatility for continental Europe and the U.K. was up compared to levels at the end of the 2008 first quarter. The Company believes that the generally tighter bank and credit conditions, lower forecasted global growth and a stronger Euro will combine to slow 2008 Eurozone and U.K. growth.
In Japan, real gross domestic product growth decelerated, unemployment levels modestly decreased and measures of inflation spiked slightly during the 2008 quarter due to increased energy prices. While increasing food prices are causing slight inflation, the rise is expected to taper by the end of the 2008 fiscal year. The Company expects energy prices to have a significant impact on Japan’s economic performance from the second half of the 2008 fiscal year and beyond. The Bank of Japan held its rates steady during the 2008 quarter and is anticipated to continue to do so into the 2008 fiscal year. The yield on the 10-year Japanese government bond increased 25 basis points from the first quarter of calendar year 2008 to 1.6% at the end of the second quarter of calendar year 2008. The Nikkei 225 equity index gained 10.6% over the course of April to mark the largest percentage increase since July 1995. Residential and non-residential construction spending decreased, and the recovery in the corporate sector during the period has yet to have an effect on wages and consumption, thus increasing the risk of a possible recession. The Company expects three trends to emerge in China’s economy in 2008: (i) GDP growth to fall on an annual basis; (ii) inflation to increase over the long-term; and (iii) the central bank to focus more on slowing growth than rising inflation. The Company expects certain larger emerging markets, Brazil, Russia and Mexico, for example, to achieve solid growth during the 2008 calendar year. While Latin America is expected to feel the effects from a decelerating U.S. economy, the Company believes the impact should be less severe than historically as a result of the region’s establishment of new trading relationships with other parts of the world. During 2008, the Company expects India to continue GDP growth absent a significant contraction in the U.S. economy. Any effect from weaker world economic growth should be offset by continued investment and spending within India.
Critical Accounting Policies and Estimates
The following is a summary of the Company’s critical accounting policies that may involve a higher degree of management judgment and in some instances complexity in application. For a further discussion of these and other accounting policies, see Note 1 “Summary of Significant Accounting Policies,” to the Consolidated Financial Statements.
Use of Estimates
In preparing the Consolidated Financial Statements and accompanying notes, management makes various estimates in accordance with U.S. generally accepted accounting principles that affect reported amounts and disclosures. Broadly, those estimates are used in:
• measuring fair value of certain financial instruments;
• accounting for identifiable intangible assets and goodwill;
• establishing provisions for potential losses that may arise from litigation, regulatory proceedings and tax examinations;
• assessing the Company’s ability to realize deferred taxes; and
• valuing equity-based compensation awards.
Estimates are based on available information and judgment. Therefore, actual results could differ from estimates and that difference could have a material effect on the Consolidated Financial Statements and notes thereto.
Consolidation Policies
The assessment of whether accounting criteria for consolidation of an entity is met requires management to exercise judgment. The Company consolidates the entities in which the Company has a controlling financial interest. The Company determines whether it has a controlling financial interest in an entity by first determining whether the entity is a voting

LEHMAN BROTHERS HOLDINGS INC. Management’s Discussion and Analysis of Financial Condition and Results of Operations
- 59 -
interest entity (sometimes referred to as a non-VIE), a variable interest entity (“VIE”) or a qualified special purpose entity (“QSPE”).
Voting Interest Entity. Voting interest entities are entities that have (i) total equity investment at risk sufficient to fund expected future operations independently and (ii) equity holders who have the obligation to absorb losses or receive residual returns and the right to make decisions about the entity’s activities. In accordance with Accounting Research Bulletin (“ARB”) No. 51, Consolidated Financial Statements, and Statement of Financial Accounting Standards (“SFAS”) No. 94, Consolidation of All Majority-Owned Subsidiaries (“SFAS 94”), voting interest entities are consolidated when the Company has a controlling financial interest, typically more than 50 % of an entity’s voting interests.
Variable Interest Entity. VIEs are entities that lack one or more voting interest entity characteristics. The Company consolidates VIEs in which it is the primary beneficiary. In accordance with Financial Accounting Standards Board (“FASB”) Interpretation (“FIN”) No. 46, Consolidation of Variable Interest Entities (revised December 2003)—an interpretation of ARB No. 51 (“FIN 46(R)”), the Company is the primary beneficiary if it has a variable interest, or a combination of variable interests, that will either (i) absorb a majority of the VIE’s expected losses, (ii) receive a majority of the VIE’s expected residual returns, or (iii) both. To determine if the Company is the primary beneficiary of a VIE, the Company reviews, among other factors, the VIE’s design, capital structure, contractual terms, which interests create or absorb variability and related party relationships, if any. Additionally, the Company may calculate its share of the VIE’s expected losses and expected residual returns based upon the VIE’s contractual arrangements and/or the Company’s position in the VIE’s capital structure. This type of analysis is typically performed using expected cash flows allocated to the expected losses and expected residual returns under various probability-weighted scenarios.
Qualified Special Purpose Entity. QSPEs are passive entities with limited permitted activities. SFAS No. 140, Accounting for Transfers and Servicing of Financial Assets and Extinguishments of Liabilities-a replacement of FASB Statement No. 125 (“SFAS 140”), establishes the criteria an entity must satisfy to be a QSPE, including types of assets held, limits on asset sales, use of derivatives and financial guarantees, and discretion exercised in servicing activities. In accordance with SFAS 140 and FIN 46(R), the Company does not consolidate QSPEs.
For a further discussion of the Company’s involvement with VIEs, QSPEs and other entities see Note 6, “Securitizations and Special Purpose Entities,” to the Consolidated Financial Statements.
Equity-Method Investments. Entities in which the Company does not have a controlling financial interest (i.e., non-consolidated entities) but in which the Company exerts significant influence (generally defined as owning a voting interest of 20% to 50%, or a partnership interest greater than 3%) are accounted for either under Accounting Principles Board (“APB”) Opinion No. 18, The Equity Method of Accounting for Investments in Common Stock or SFAS No. 159, The Fair Value Option for Financial Assets and Financial Liabilities (“SFAS 159”). For further discussion of the Company’s adoption of SFAS 159, see “Accounting and Regulatory Developments—SFAS 159” below.
Other. The Company has formed various non-consolidated private equity or other alternative investment funds with third-party investors that are typically organized as limited partnerships. The Company typically acts as general partner for these funds, and when third-party investors have (i) rights to either remove the general partner without cause or to liquidate the partnership; or (ii) substantive participation rights, the Company does not consolidate these partnerships in accordance with Emerging Issue Task Force (“EITF”) No. 04-5, Determining Whether a General Partner, or the General Partners as a Group, Controls a Limited Partnership or Similar Entity When the Limited Partners Have Certain Rights.
A determination of whether the Company has a controlling financial interest in an entity and therefore a consolidation assessment of that entity is initially made at the time the Company becomes involved with the entity. Certain events may occur which cause the Company to re-assess its initial determination of an entity. These re-assessments focus on whether an entity is a VIE or non-VIE, whether the Company is the primary beneficiary (if the entity is a VIE) and ultimately the consolidation assessment of that entity. Those events generally are:
• The entity’s governance structure is changed such that either (i) the characteristics or adequacy of equity at risk are changed, or (ii) expected returns or losses are reallocated among the participating parties within the entity.
• The equity investment (or some part thereof) is returned to the equity investors and other interests become exposed to expected returns or losses.
• Additional activities are undertaken or assets acquired by the entity that were beyond those anticipated previously.
• Participants in the entity acquire or sell interests in the entity.
LEHMAN BROTHERS HOLDINGS INC. Management’s Discussion and Analysis of Financial Condition and Results of Operations
- 60 -
• The entity receives additional equity at risk or curtails its activities in a way that changes the expected returns or losses.
When the Company does not consolidate an entity or apply the equity method of accounting, the Company presents its investment in the entity at fair value. For a further discussion regarding potential changes to consolidation-related accounting standards, see “Accounting and Regulatory Developments—Elimination of QSPEs and Changes in the FIN 46(R) Consolidation Model” below.
Valuation of Financial Instruments
Substantially all of the Company’s Financial instruments and other inventory positions owned and Financial instruments and other inventory positions sold but not yet purchased are reported at fair value. The Company accounts for these assets and liabilities at fair value under various accounting literature and applicable industry guidance, namely broker-dealer and investment company accounting guidance. The Company categorizes Real estate held for sale positions as a component of Financial instruments and other inventory positions owned. Real estate held for sale positions are reported by the Company at the lower of carrying amount or fair value less cost to sell.
The Company early adopted the provisions of SFAS No. 157, Fair Value Measurements (“SFAS 157”), in the first quarter of 2007. SFAS 157 defines fair value, establishes a framework for measuring fair value, establishes a fair value hierarchy based on the quality of inputs used to measure fair value and enhances disclosure requirements for fair value measurements. Prior to December 1, 2006, the Company followed the American Institute of Certified Public Accountants (“AICPA”) Audit and Accounting Guide, Brokers and Dealers in Securities, when determining fair value for financial instruments. The AICPA Audit and Accounting Guide permitted the recognition of a discount to the quoted price when determining the fair value for a substantial block of a particular security as long as the quoted price was not considered to be readily realizable (i.e., a block discount).
SFAS 157 defines fair value as the price that would be received to sell an asset or paid to transfer a liability in an orderly transaction between market participants at the measurement date, or an exit price. The degree of judgment utilized in measuring the fair value of financial instruments generally correlates to the level of pricing observability. Financial instruments with readily available active quoted prices or for which fair value can be measured from actively quoted prices in active markets generally have more pricing observability and less judgment utilized in measuring fair value. Conversely, financial instruments rarely traded or not quoted have less observability and are measured at fair value using valuation models that require more judgment. Pricing observability is impacted by a number of factors, including the type of financial instrument, whether the financial instrument is new to the market and not yet established, the characteristics specific to the transaction and overall market conditions generally.
The overall valuation process for financial instruments may include adjustments to valuations derived from pricing models. These adjustments may be made when, in management’s judgment, either the size of the position in the financial instrument or other features of the financial instrument such as its complexity, or the market in which the financial instrument is traded (such as counterparty, credit, concentration or liquidity) require that an adjustment be made to the value derived from the pricing models. An adjustment may be made if the sale of a financial instrument is subject to sales restrictions that would result in a price less than the computed fair value measurement from a quoted market price. Additionally, an adjustment from the price derived from a model typically reflects management’s judgment that other participants in the market for the financial instrument being measured at fair value would also consider such an adjustment in pricing that same financial instrument.
The Company has categorized its financial instruments measured at fair value into a three-level classification in accordance with SFAS 157. Fair value measurements of financial instruments that use quoted prices in active markets for identical assets or liabilities are generally categorized as Level 1, and fair value measurements of financial instruments that have no direct observable levels are generally categorized as Level 3. The lowest level input that is significant to the fair value measurement of a financial instrument is used to categorize the instrument and reflects the judgment of management.
While SFAS 157 does not prescribe which valuation technique the Company should use to measure the fair value of an asset or a liability, SFAS 157 does require the Company to select an appropriate valuation technique for the market conditions and for which sufficient, reliable data inputs are available. SFAS 157 distinguishes between inputs that are based on market data obtained from independent sources and inputs that reflect assumptions from one market participant as to actions of other market participants and emphasizes that valuation methodologies maximize inputs based on market data. A determination of what constitutes “observable market data” requires significant judgment. The Company considers observable or market-based data to be data that can be characterized as not proprietary, readily available or based on consensus within reasonably narrow ranges, regularly distributed or updated, reliable and verifiable

LEHMAN BROTHERS HOLDINGS INC. Management’s Discussion and Analysis of Financial Condition and Results of Operations
- 61 -
and provided by multiple, independent sources that are involved in the relevant market.
Inputs to valuation techniques used by the Company to determine the fair value of an asset or a liability are prioritized based upon the SFAS 157 hierarchy. The SFAS 157 hierarchy gives priority to observable inputs in the marketplace that are more objective, rather than inputs that are more subjective because they have been derived through extrapolation or interpolation from market data. The basis of a financial instrument level within the fair value hierarchy is the lowest level of any input that is significant to the fair value measurement. The categorization of an asset or liability within the SFAS 157 hierarchy is based upon the pricing transparency of the financial instrument and does not necessarily correspond to the perceived risk of the asset or liability. The following describes the three levels of the fair value hierarchy under SFAS 157, provides general characteristics and examples of measurement inputs associated with each hierarchical level as well as valuation techniques used by the Company for components of its financial instrument inventory.
Level 1 — Level 1 inputs are quoted prices (unadjusted) for identical assets or liabilities in active markets. A quoted price for an identical asset or liability in an active market (e.g., an equity security traded on the New York Stock Exchange) provides the most reliable fair value measurement because it is directly observable to the market. The types of assets and liabilities valued based on quoted market prices in active markets and categorized by the Company as Level 1 within the fair value hierarchy generally include equities listed in active markets, G-7 government and agency securities, investments in publicly traded mutual funds with quoted market prices and listed derivatives.
Level 2 — Level 2 inputs are inputs that are observable, either directly or indirectly, but do not qualify as Level 1 inputs. Level 2 inputs may include:
• Quoted prices for similar assets or liabilities in active markets.
• Quoted prices for identical or similar assets or liabilities in markets that are not active, that is, markets in which there are few transactions for the asset or liability, the prices are not current, or price quotations vary substantially either over time or among market makers (e.g., some brokered markets), or in which little information is released publicly (e.g., a principal-to-principal market).
• Inputs other than quoted prices that are observable for the asset or liability (e.g., interest rates and yield curves observable at commonly quoted intervals, volatilities, prepayment speeds, loss severities, credit risks, and default rates).
• Inputs that are derived principally from or corroborated by observable market data through correlation or by other means (market-corroborated inputs).
The types of assets and liabilities that trade in markets that are not considered to be active, but are valued based on quoted market prices, broker or dealer quotations, or alternative pricing sources with reasonable levels of price transparency include non-G-7 government securities, municipal bonds, certain hybrid financial instruments, certain mortgage and asset backed securities, certain corporate debt, certain commitments and guarantees, certain private equity investments and certain derivatives. Level 2 derivatives are valued using pricing models based on the net present value of estimated future cash flows and directly observed prices from exchange-traded derivatives, other over-the-counter (“OTC”) derivative contracts, or external pricing services, while taking into account either the Company’s or counterparty’s creditworthiness, as appropriate. Determining the fair value for Level 2 derivative contracts can require a significant level of estimation and management judgment.
Financial instruments categorized as Level 2 within the SFAS 157 hierarchy are generally presented, at inception, using the transacted price. Thereafter, the Company generally values Level 2 assets and liabilities based upon comparable market prices or other relevant information from market transactions involving identical or comparable assets and liabilities.
Level 3 — Level 3 inputs reflect the Company’s assumptions that it believes market participants would use in pricing the asset or liability. The Company develops Level 3 inputs based on the best information available in the circumstances, which may include indirect correlation to a market value, combinations of market values or the Company’s proprietary data. Level 3 inputs generally include information derived through extrapolation or interpolation of observable market data.
Financial assets and liabilities presented at fair value and categorized as Level 3 are generally those where the measurements of fair value are significantly dependent on relevant empirical data to extrapolate fair value measurements. The models’ inputs reflect assumptions that market participants would use in pricing the

LEHMAN BROTHERS HOLDINGS INC. Management’s Discussion and Analysis of Financial Condition and Results of Operations
- 62 -
instrument in a current period transaction and outcomes from the models represent an exit price and expected future cash flows. Valuation models are calibrated to the market on a frequent basis. The parameters and inputs are adjusted for assumptions about risk and current market conditions. Changes to inputs in valuation models are not changes to valuation methodologies; rather, the inputs are modified to reflect direct or indirect impacts on asset classes from changes in market conditions. Accordingly, results from valuation models in one period may not be indicative of future period measurements. Valuations are independently reviewed by employees outside the business unit and, where applicable, valuations are back tested comparing instruments sold to where they were marked.
At the end of the second quarter of 2008, Level 3 assets, including derivatives on a net basis, were approximately $37.9 billion, a 6% decrease from approximately $40.2 billion at the end of the 2008 first quarter and a 3% decline from approximately $38.9 billion at the end of the 2007 fiscal year. During the 2008 second quarter, the Company sold approximately $3.6 billion of Level 3 assets. Additionally, the Company’s valuation adjustments (realized and unrealized) related to Level 3 assets reduced Level 3 assets by approximately $2.0 billion. These reductions were offset in the aggregate by net transfers in and other activity of approximately $3.4 billion; specifically, a result of approximately $1.1 billion of net transfers into the Level 3 category and approximately $2.3 billion of other transactional activity, primarily purchases and payments.
Asset transfers into Level 3 exceeded asset transfers out of Level 3 by approximately $1.1 billion. As a secondary result of the Company’s deleveraging activities and sales of assets during the period, the ability to observe prices in markets increased and therefore required the Company to transfer certain assets from Level 3 to Level 2. These reductional activities were more than offset by transfers of assets into Level 3 during the 2008 second quarter. Notably, transactional levels for residential mortgage-related assets in the U.K. and Eurozone slowed to no longer support categorization of these positions outside of Level 3. Additionally and during the 2008 second quarter, the Company sold approximately $3.6 billion of Level 3 assets, approximately $2.7 billion of which were mortgage-related. These sales were offset by purchases and payment activities related to Level 3 assets of approximately $2.3 billion, having a net effect of decreasing Level 3 assets between periods by approximately $1.3 billion. Level 3 net derivatives decreased at May 31, 2008 by approximately $1.2 billion from balances at February 29, 2008, reflecting a comparatively lower level of derivative assets at May 31, 2008 than at February 29, 2008.
At May 31, 2008, Level 3 assets included approximately $10.2 billion of private equity and principal investing-related positions (generally, private equity and principal investment positions in addition to equity interests in corporations or investment vehicles and investment managers that are presented as a component of Corporate equities) and $1.6 billion of net derivatives (generally interest rate option contracts, credit default swaptions, structured volatility derivatives and other forward starting contracts that are generally long-tenured). The remaining approximate $26.2 billion consist of approximately $20.6 billion of mortgage and asset-backed positions and approximately $5.6 billion of corporate debt-related positions. These amounts have generally been categorized into Level 3 as a result of a lack of liquidity or transactional activity in the markets.
The following table presents comparative metrics of the Company’s Level 3 assets at May 31, 2008, February 29, 2008 and November 30, 2007:
At In millions May 31, 2008 Feb 29, 2008 Nov 30, 2007
Level 3 assets $ 41,344 $ 42,508 $ 41,979 Less: Level 3 derivative liabilities (3,433) (2,303) (3,095) Level 3 assets (net derivatives) $ 37,911 $ 40,205 $ 38,884 Total assets $639,432 $786,035 $691,063 Total assets measured at fair value $248,745 $304,096 $291,212 Less: derivative liabilities measured at fair value (25,885) (37,807) (31,621) Assets measured at fair value (net derivatives) $222,860 $266,289 $259,591 Level 3 assets as a percent of total assets 6% 5% 6% Level 3 assets as a percent of total assets measured at fair value 17% 14% 14% Level 3 assets (net derivatives) as a percent of assets measured at fair value (net derivatives) 17% 15% 15%
For a further discussion regarding the measurement of Financial instruments and other inventory positions owned,

LEHMAN BROTHERS HOLDINGS INC. Management’s Discussion and Analysis of Financial Condition and Results of Operations
- 63 -
excluding Real estate held for sale, and Financial instruments and other inventory positions sold but not yet purchased at fair value, see Note 4, “Fair Value of Financial Instruments,” to the Consolidated Financial Statements.
Identifiable Intangible Assets and Goodwill
Determining the carrying values and useful lives of certain assets acquired and liabilities assumed associated with business acquisitions—intangible assets in particular—requires significant judgment. At least annually, the Company is required to assess whether goodwill and other intangible assets have been impaired by comparing the estimated fair value, calculated based on price-earnings multiples, of each business segment with its estimated net book value, by estimating the amount of stockholders’ equity required to support each business segment. Periodically estimating the fair value of a reporting unit and carrying values of intangible assets with indefinite lives involves significant judgment and often involves the use of significant estimates and assumptions. These estimates and assumptions could have a significant effect on whether or not an impairment charge is recognized and the magnitude of such a charge.
SFAS No. 142, Goodwill and Other Intangible Assets, requires impairment testing on an annual basis and between annual tests if circumstances change that would more likely than not reduce the fair value of goodwill below its carrying amount. The Company completed its last annual impairment test on goodwill and other intangible assets as of August 31, 2007, and no impairment was identified. In addition, as a result of market conditions during the second quarter of 2008, the Company also conducted an impairment test on goodwill and other intangible assets as of May 31, 2008, and no impairment was identified.
Legal, Regulatory and Tax Proceedings
In the normal course of business, the Company has been named as a defendant in a number of lawsuits and other legal and regulatory proceedings. Such proceedings include actions brought against the Company and others with respect to transactions in which the Company acted as an underwriter or financial advisor, actions arising out of the Company’s activities as a broker or dealer in securities and commodities and actions brought on behalf of various classes of claimants against many securities firms, including the Company. In addition, business activities are reviewed by various taxing authorities around the world with regard to corporate income tax rules and regulations. The Company provides for potential losses that may arise out of legal, regulatory and tax proceedings to the extent such losses are probable and can be estimated. Those determinations require significant judgment. For a further discussion, see Note 8, “Commitments, Contingencies and Guarantees,” to the Consolidated Financial Statements.

LEHMAN BROTHERS HOLDINGS INC. Management’s Discussion and Analysis of Financial Condition and Results of Operations
- 64 -
Consolidated Results of Operations
Overview
The following table sets forth an overview of results of operations for the three and six months ended May 31, 2008 and 2007:
Three Months Ended Six Months Ended May 31, Percent May 31, Percent
In millions 2008 2007 Change 2008 2007 Change
Net revenues $ (668) $ 5,512 NM1 $ 2,839 $ 10,559 (73)% Income before taxes $ (4,087) $ 1,879 NM $(3,424) $ 3,578 NM Net income $ (2,774) $ 1,273 NM $(2,285) $ 2,419 NM Earnings per diluted common share $ (5.14) $ 2.21 NM $ (4.33) $ 4.17 NM
Annualized return on average common stockholders’ equity2 NM 25.8% NM 25.1%
Annualized return on average tangible common stockholders’ equity NM 31.6% NM 30.7%
Net Revenues
The following table sets forth an overview of net revenues for the three and six months ended May 31, 2008 and 2007:
Three Months Ended Six Months Ended May 31, Percent May 31, Percent
In millions 2008 2007 Change 2008 2007 Change
Principal transactions $ (3,442) $ 2,889 NM $ (2,670) $ 5,810 NM Investment banking 858 1,150 (25)% 1,725 2,000 (14)% Commissions 639 568 13 1,297 1,108 17 Interest and dividends 7,771 10,558 (26) 17,405 19,647 (11) Asset management and other 414 414 — 853 809 5 Gross revenues $ 6,240 $ 15,579 (60)% $18,610 $ 29,374 (37)% Interest expense 6,908 10,067 (31) 15,771 18,815 (16) Net revenues $ (668) $ 5,512 NM $ 2,839 $ 10,559 (73)% Net interest revenues $ 863 $ 491 76% $ 1,634 $ 832 96% Principal transactions, commissions and net interest revenues $ (1,940) $ 3,948 NM $ 261 $ 7,750 (97)%
Principal Transactions, Commissions and Net Interest Revenue. In both the Capital Markets segment and the Private Investment Management business within the Investment Management segment, the Company evaluates net revenue performance based on the aggregate of Principal transactions, Commissions and Net interest revenues (Interest and dividends revenue net of Interest expense). The revenue category of Principal transactions includes realized and
1 Not meaningful. 2 Return on average common stockholders’ equity and return on average tangible common stockholders’ equity are computed by dividing annualized net income applicable to common stock for the period by average common stockholders’ equity and average tangible common stockholders’ equity, respectively. The Company believes average tangible common stockholders’ equity is a meaningful measure because it reflects the common stockholders’ equity deployed in the Company’s businesses. Average tangible common stockholders’ equity equals average common stockholders’ equity less average identifiable intangible assets and goodwill and is computed as follows:
Three Months Ended May 31, Six Months Ended May 31, In millions 2008 2007 2008 2007
Annualized net income applicable to common stock $(11,491) $ 5,025 $ (4,815) $ 4,770 Average stockholders’ equity $25,554 $20,567 $24,533 $20,131 Less: average preferred stock (4,993) (1,095) (3,694) (1,095) Average common stockholders’ equity $20,561 $19,472 $20,839 $19,036 Less: average identifiable intangible assets and goodwill (4,107) (3,592) (4,114) (3,515) Average tangible common stockholders’ equity $16,454 $15,880 $16,725 $15,521 Return on average common stockholders’ equity NM 25.8% NM 25.1% Return on average tangible common stockholders’ equity NM 31.6% NM 30.7%
LEHMAN BROTHERS HOLDINGS INC. Management’s Discussion and Analysis of Financial Condition and Results of Operations
- 65 -
unrealized gains and losses; the revenue category Commissions reflects earned commissions associated with client transactions; and Interest and dividend revenue and Interest expense reflects revenues and expenses associated with financing or hedging positions. Interest and dividends revenue and Interest expense are a function of the level and mix of total assets and liabilities (primarily financial instruments owned and sold but not yet purchased, and collateralized borrowing and lending activities), prevailing interest rates and the term structure of financings. Caution should be used when analyzing these revenue categories individually because they may not be indicative of the overall performance of the Capital Markets and Investment Management business segments. Principal transactions, Commissions and Net interest revenues in the aggregate were negative $2.0 billion and $0.3 billion in the 2008 three and six months, compared to $3.9 billion and $7.8 billion in the corresponding 2007 periods, respectively.
Principal transactions revenue for the 2008 three and six months were negative $3.4 billion and negative $2.7 billion, respectively, compared to $2.9 billion and $5.8 billion in the corresponding 2007 periods, primarily as a result of negative valuation adjustments made on certain components of Capital Markets inventory described in “Impact from Market Events” below. Commission revenues rose 13% and 17% in the 2008 three and six months compared to the corresponding 2007 periods, respectively, reflecting growth in institutional commissions. Interest and dividends revenue declined 26% and 11% in the 2008 three and six months, respectively, from the corresponding 2007 three and six months and Interest expense similarly declined between the benchmark periods. Net interest revenues increased 76% and 96% in the 2008 three and six months from the corresponding 2007 three and six months, respectively, reflecting lower financing costs on certain inventory positions.
Investment Banking. Investment banking revenues represent fees and commissions received for underwriting public and private offerings of fixed income and equity securities, fees and other revenues associated with advising clients on M&A activities, as well as other corporate financing activities. Investment banking net revenues for the 2008 three and six months were $0.9 billion and $1.7 billion, respectively, a decrease of 25% and 14% from the comparable 2007 periods, primarily driven by a decrease within Global Finance—Debt businesses. Between the benchmark periods, Global Finance—Debt net revenues decreased 47% and 37%, respectively, as the number of financial sponsor transactions was minimal during the periods. Comparing the second quarter of 2008 to the second quarter of 2007, Advisory services net revenues decreased 13% but comparing the six months ended May 31, 2008 to May 31, 2007, Advisory services net revenues increased 9%. The sequential decrease in Advisory services net revenues reflects a decrease in announced M&A activity since the latter part of 2007. Global Finance—Equity net revenues were $0.3 billion for the three months ended May 31, 2008, essentially flat compared to the same period in 2007, while for six months ended 2008 net revenues were $0.5 billion, a 7% increase from the corresponding period in 2007.
Included in Investment banking revenue are client-driven derivative and other capital market-related transactions with Investment Banking clients, which totaled approximately $0.1 billion and $0.2 billion for the 2008 three and six months, respectively, compared to approximately $0.2 billion and $0.3 billion in the comparable 2007 periods.
Asset Management and Other. Asset management and other revenues primarily result from asset management activities in the Investment Management business segment. Asset management and other revenues were $0.4 billion and $0.9 billion in the 2008 three and six month periods, respectively, consistent with the three months ended May 31, 2007 and an increase of 5% from the six months ended May 31, 2007, primarily reflecting higher management fees earned.

LEHMAN BROTHERS HOLDINGS INC. Management’s Discussion and Analysis of Financial Condition and Results of Operations
- 66 -
Non-Interest Expenses
Three Months Six Months
Ended Ended
May 31, Percent May 31, Percent
In millions 2008 2007 Change 2008 2007 Change
Compensation and benefits $2,325 $2,718 (14)% $4,166 $5,206 (20)%
Non-personnel expenses:
Technology and communications 309 287 8 612 553 11
Brokerage, clearance and distribution fees 252 201 25 504 395 28
Occupancy 188 152 24 373 298 25
Professional fees 100 120 (17) 198 218 (9)
Business development 87 100 (13) 175 184 (5)
Other 158 55 NM 235 127 85
Total non-personnel expenses $1,094 $ 915 20% $2,097 $1,775 18%
Total non-interest expenses $3,419 $3,633 (6)% $6,263 $6,981 (10)%
Compensation and benefits/Net revenues NM 49.3% NM 49.3%
Non-personnel expenses/Net revenues NM 16.6% 73.9% 16.8%
Non-interest expenses for the 2008 three and six month periods were $3.4 billion and $6.3 billion, respectively, decreasing 6% and 10%, from $3.6 billion and $7.0 billion in the comparable 2007 periods. A substantial portion of non-interest expenses is compensation-related, which includes both fixed (consisting primarily of salaries, benefits and amortization of previous years’ deferred equity awards) and variable (consisting primarily of incentive compensation and commissions) components. Compensation expense, particularly the variable component reflecting discretionary bonuses, is impacted by levels of business activity, the structure of the Company’s share-based compensation programs and management’s judgment. Remaining non-interest expense categories are largely variable, and are expected to change over time with revenue levels, business activity mix and employee headcount levels.
Compensation and benefits. Compensation and benefits expense includes both fixed and variable components. Compensation and benefits totaled $2.3 billion and $4.2 billion for the 2008 three and six months ended May 31, 2008, respectively, compared to $2.7 billion and $5.2 billion in the comparable 2007 periods. The variable component of Compensation and benefits for the 2008 six months ended May 31, 2008, declined 34% compared to the six months ended May 31, 2007. Employees totaled approximately 26,200 and 28,300 at May 31, 2008 and 2007, respectively, reflecting a net 7% decrease due to a rescaling of operations and business activities, based upon underlying business and economic conditions, including the announced resizing of the residential mortgage business. Attributable to the reduction of the Company’s workforce, compensation and benefits expense includes approximately $0.1 billion and $0.2 billion of severance expense for the three and six months ended May 31, 2008, respectively.
Non-personnel expenses. Non-personnel expenses totaled $1.1 billion and $2.1 billion in the 2008 three and six months, respectively, up 20% and 18% compared to the corresponding 2007 periods. Technology and communications expenses rose 8% and 11% in the 2008 three and six months, respectively, compared to the corresponding 2007 periods, due to comparatively higher communication costs as well as the opening of a new datacenter. Brokerage, clearance and distribution fees rose 25% and 28% in the 2008 three and six months, respectively, compared to the corresponding 2007 periods, reflecting the higher levels of equity market volatility and corresponding higher transaction volumes. Occupancy expenses increased 24% and 25% in the 2008 three and six months, respectively, compared to the corresponding 2007 periods due to the expansion of the businesses globally and new office locations, partially offset by the closure of certain business platforms. Professional fees decreased 17% and 9% in the 2008 three and six months, respectively, compared to the corresponding 2007 periods generally attributable to lower levels of external recruitment. Business development expenses decreased 13% and 5% in the 2008 three and six months, respectively, compared to the corresponding 2007 periods due to lower marketing and advertising costs associated with the Company’s suspended mortgage origination platforms. For the three and six months ended May 31, 2008, approximately $20 million and $54 million, respectively, of costs associated with the restructuring of the Firm’s global residential mortgage origination business have been included in Other expenses. Additionally and at May 31, 2008, the Company held approximately $2.6 billion of real estate-related positions that did not qualify as held for sale pursuant to SFAS No. 144, Accounting for the Impairment or Disposal of Long-Lived Assets. Accordingly, the Company recorded accumulated depreciation expense of approximately $80 million in the second quarter of 2008 for these assets. This amount is a component of Other expense in the Consolidated Statement of Income.

LEHMAN BROTHERS HOLDINGS INC. Management’s Discussion and Analysis of Financial Condition and Results of Operations
- 67 -
Income Taxes
The provision for income taxes was a net credit of $1.3 billion and a net credit of $1.1 billion in the 2008 three and six months, respectively, reflecting tax benefits associated with the Company’s pre-tax losses. In the 2007 three and six months, the Company had tax provisions of $0.6 billion and $1.2 billion, respectively. The second quarter of 2008 effective tax rate was 32.1% generally consistent with 32.3% for the second quarter of 2007. The effective tax rate for the six months ended May 31, 2008 was 33.3% also generally consistent with 32.4% for the six months ended May 31, 2007.
Business Acquisitions, Business Dispositions and Strategic Investments
Business Dispositions. During the second quarter of 2008:
• In April 2008, the Company announced the suspension of its U.K home loans division, Southern Pacific Mortgage Limited. Previously, the Company announced the suspension of its wholesale and correspondent mortgage lending activities at the Aurora Loan Services subsidiary. As a result of these suspension activities, the Company incurred one-time, non-compensation expenses of approximately $20 million and $54 million for the three and six months ended May 31, 2008, respectively.
Strategic Investments. During the second quarter of 2008, the Company entered into the strategic investments listed below:
• The Company acquired non-voting, minority ownership stakes in the general partner, the limited partner and the management company of One William Street Capital Management LP (collectively, “One William Street”). At May 31, 2008, the aggregate amount of the Company’s investment in One William Street was approximately $160 million, which was a minority investment in relation to the total, third-party investments in One William Street.
• The Company acquired non-voting, minority ownership stakes in the master fund, general partner, special limited partner and management company of R3 Capital Partners (collectively, “R3”), an asset manager of funds investing primarily in corporate bonds and loans. At May 31, 2008, the aggregate amount of the Company’s investment in R3 was approximately $1.1 billion, which was a minority investment in relation to the total, third-party investments in R3. The Company sold assets and transferred derivative risk of approximately $4.5 billion at fair value to R3 during the second quarter of 2008; the assets sold were primarily corporate bonds and loans.
Impact from Market Events
When market conditions change or if markets for specific financial instruments dislocate, the fair values of the Company’s financial inventory increase or decrease. Fair value is a market-based measure considered from the perspective of market participants who hold an asset or owe a liability and is based upon the perspective of market participants at a given point in time.
Challenging market conditions present in the preceding three quarters continued during the second quarter of 2008. These adverse conditions in the credit markets have impacted numerous products, including residential mortgage-related assets in various geographies and across the capital structure, commercial mortgage and real estate-related assets, and leveraged lending, or acquisition finance facilities. As a result of these market events, the Company recorded negative valuation adjustments of approximately $4.0 billion on certain components of its financial inventory. These valuation adjustments were partially offset by a net benefit of approximately $0.4 billion due to the impact of the widening of the Company’s credit spreads on the carrying value of certain of its debt liabilities. The total amount of valuation adjustments in the second quarter of 2008, before consideration of economic hedges, was an approximate $3.6 billion reduction to the Company’s net revenues. The negative valuation adjustments resulting from the impact of adverse market conditions were amplified by counter productive results from economic risk management strategies employed by the Company which had served to mitigate asset price deterioration in prior quarters. The total amount of valuation adjustments in the second quarter of 2008, after consideration of economic hedges, was an approximate $3.7 billion reduction to the Company’s net revenues, substantially all of which are reflected within the results of operations for the Company’s Fixed Income component of Capital Markets.

LEHMAN BROTHERS HOLDINGS INC. Management’s Discussion and Analysis of Financial Condition and Results of Operations
- 68 -
The table below presents certain components of valuation adjustments recorded during the 2008 three and six months as well as the accumulated valuation adjustments recorded from fiscal year 2007 through May 31, 2008. These components are presented on both a gross and net basis. The net impact represents the revenue impact from the components after adjusting for certain economic risk mitigation strategies. Caution should be utilized when evaluating the amounts in the following table as they represent only certain components of revenue associated with the business activities described.
Three Months Ended Six Months Ended May 31, 2008 May 31, 2008 Fiscal Year 2007 In billions Gross Net(1) Gross Net(1) Gross Net(1)
Residential mortgage-related positions $(2.4) $(2.0) $(5.4) $(2.8) $(4.7) $(1.3) Other asset-backed-related position (0.4) (0.4) (0.6) (0.5) (0.6) (0.2) Commercial mortgage and real estate-related investments(2) (0.9) (1.3) (2.3) (2.3) (1.4) (0.9) Acquisition finance facilities (funded and unfunded) (0.3) (0.4) (1.0) (0.9) (1.0) (0.4) (4.0) (4.1) (9.3) (6.5) (7.7) (2.8) Valuation of debt liabilities(3) 0.4 0.4 1.0 1.0 0.9 0.9 $(3.6) $(3.7) $(8.3) $(5.5) $(6.8) $(1.9)
(1) The net impact represents the remaining impact from the components after including the impact of certain economic risk mitigation strategies. The gross impact excludes any effect of economic risk mitigation strategies.
(2) Certain real estate-related investments are reflected as a component of Real estate held for sale. The Company makes equity and debt investments in entities (including voting-interest entities and VIEs) whose underlying assets are real estate. The Company consolidates those entities in which it either controls the entity under SFAS 94 or is the primary beneficiary in accordance with FIN 46(R). The Company does not have economic exposure to the total underlying assets in those entities. The amounts presented are the Company’s net investment and therefore exclude the amounts that have been consolidated but for which the Company does not have economic exposure. Other asset categories, not included in this table, also contain interests in entities that engage in real estate-related activities.
(3) Represents the gain on debt liabilities the Company elected to measure at fair value under SFAS 159. These gains represent the effect of changes in the Company’s credit spread and exclude any interest income or expense as well as any gain or loss from the embedded derivative components of these instruments. Changes in valuations are allocated to the businesses in relation to the cash generated by, or funding requirements of, the underlying positions.
For a further discussion of how the market events and resulting negative valuation adjustments impacted the results of operations of the Company’s business and geographic segments, see “Business Segments” and “Geographic Segments” in this MD&A.
The Company continues to have exposures to these financial instruments and the markets to which the instruments relate, and as market conditions continue to evolve, the value of these and other financial instruments, including any economic hedging strategies employed by the Company, could appreciate or deteriorate. The following sections provide a summary of the Company’s exposures to these financial instruments at May 31, 2008. For a further discussion regarding the Company’s financial inventory, see Note 3, “Financial Instruments and Other Inventory Positions,” to the Consolidated Financial Statements. For a further discussion regarding the Company’s fair value determination of financial assets and liabilities, see Note 4, “Fair Value of Financial Instruments,” to the Consolidated Financial Statements.
Mortgage-related Assets and Real Estate-related Investments
Mortgage loans are loans secured by real property made to a borrower (or borrowers). Mortgage loans enter the market in a variety of forms: they may enter directly as whole loans originated; or, they may enter indirectly through the form of securitizations resulting in mortgage-backed securities, collateralized obligations or other structured finance products. The Company’s mortgage-related trading positions consist of whole loans, retained interests in securitizations, loans purchased as non-performing loans, equity interests in commercial properties, asset-backed securities that are backed by mortgage loans or other assets, and derivatives referencing mortgages or mortgage-backed securities. The Company typically disposes of whole loans by securitizing or selling them and may retain certain securities of such securitizations, often referred to as retained interests. The Company may also purchase interests in or enter into derivatives referencing collateral obligations where the collateral may be an asset-backed security. Mortgage-related positions are reflected in the Company’s financial inventory as Mortgage and asset-backed securities.
The valuation methodologies used for mortgage-related assets incorporate a variety of inputs including prices observed from execution of a number of trades in the marketplace; ABX, CMBX and similar indices that track the performance of

LEHMAN BROTHERS HOLDINGS INC. Management’s Discussion and Analysis of Financial Condition and Results of Operations
- 69 -
a series of credit default swaps based upon specific types of mortgages, and other market information, such as data on remittances received and updated cumulative loss data on underlying obligations. For a further discussion on the Company’s accounting policies related to fair value, see “Critical Accounting Policies—Valuation of Financial Instruments.” For a further discussion regarding the measure of Financial instruments and other inventory positions owned, excluding Real estate held for sale, and Financial instruments and other inventory positions sold but not yet purchased at fair value, see Note 4, “Fair Value of Financial Instruments,” to the Consolidated Financial Statements.
Certain real estate investment positions are debt or equity investments that the Company makes in entities (including voting-interest entities and VIEs) whose underlying assets are real estate. These investments are a component of the Company’s financial inventory and presented as Real estate held for sale. The Company consolidates those entities in which it either controls the entity under SFAS 94, or is the primary beneficiary in accordance with FIN 46(R). In instances where the Company consolidates entities in which it holds a debt or equity investment, the Company does not have economic exposure to the underlying assets in those entities beyond the Company’s investment shown below. The Company accounts for these positions at the lower of their carrying amount or fair value less cost to sell. The Company uses a variety of valuation methods to determine the carrying amount of its real estate held for sale such as summing the land value and the depreciated value, replacement costs, sales of similar properties, discounted cash flow analyses adjusted to account for differences in internal rates of return or presumed capitalization rates. Other asset categories, not included in the table below, also contains interests in entities that engage in real estate-related activities.
At May 31, 2008, February 29, 2008 and November 30, 2007, the Company’s exposure to residential and commercial mortgage-related assets, other asset-backed-related positions and real estate-related investments was generally:
At Percent Change In billions May 31, 2008 Feb 29, 2008 Nov 30, 2007 May v. Feb May v. Nov
Residential mortgages: Securities $ 15.0 $ 18.2 $ 16.7 Whole loans 8.3 11.9 14.2 Servicing and other 1.6 1.7 1.2
$ 24.9 $ 31.8 $ 32.1 (22)% (22)%
Commercial mortgages:
Whole loans $ 19.9 $ 24.9 $ 26.2
Securities and other 9.5 11.2 12.7
$ 29.4 $ 36.1 $ 38.9 (19)% (24)%
Other asset-backed (1) $ 6.5 $ 6.5 $ 6.2
Mortgage and asset-
backed securities(2) $ 60.8 $ 74.4 $ 77.2 (18)% (21)%
Real estate investments, net(3) $ 10.4 $ 12.9 $ 12.8 (19)% (19)%
(1) Included within this line are securities as well as whole loans. Specifically, these positions include franchise-related whole business financings, small business loans, and various asset-backed positions related to student loans, credit cards and auto loans. Approximately $805 million of the securities included within this line at May 31, 2008 were rated BB+ or lower (or equivalent ratings) by recognized credit rating agencies.
(2) Balances shown exclude loans to which the Company does not have economic exposure because the Company transferred mortgage-related loans to securitization vehicles where such transfers were accounted for as secured financings rather than sales under SFAS 140. The securitization vehicles issued securities that were distributed to investors. The Company does not have economic exposure to the underlying assets in those securitization vehicles beyond the Company’s retained interests, which are included above.
(3) Certain real estate-related investments are reflected as a component of Real estate held for sale. The Company makes equity and debt investments in entities (including voting-interest entities and VIEs) whose underlying assets are real estate. The Company consolidates those entities in which it either controls the entity under SFAS 94 or is the primary beneficiary in accordance with FIN 46(R). The Company does not have economic exposure to the total underlying assets in those entities. The amounts presented are the Company’s net investment and therefore exclude the amounts that have been consolidated but for which the Company does not have economic exposure. Other asset categories, not included in this table, also contains interests in entities that engage in real estate-related activities.

LEHMAN BROTHERS HOLDINGS INC. Management’s Discussion and Analysis of Financial Condition and Results of Operations
- 70 -
Residential mortgages. The product and geographic diversifications of the Company’s residential mortgage portfolio at May 31, 2008, February 29, 2008 and November 30, 2007 can be generally described as below. These characterizations are largely based upon the credit assessment of the borrowers to which the mortgage loans have been extended.
At Percent Change In billions May 31, 2008 Feb 29, 2008 Nov 30, 2007 May v. Feb May v. Nov
U.S. Alt-A/Prime(1) Whole loans $ 2.1 $ 3.7 $ 3.7 Securities 6.5 9.2 7.8 Servicing and other 1.6 1.7 1.2 $ 10.2 $ 14.6 $ 12.7 (30)% (20)% Subprime/Second Lien(2) Whole loans $ 1.1 $ 1.3 $ 3.3 Securities 1.7 2.7 2.0 $ 2.8 $ 4.0 $ 5.3 (30)% (47)% Other U.S. Whole loans $ 1.0 $ 1.6 $ 2.1 Securities 0.3 0.5 0.2 $ 1.3 $ 2.1 $ 2.3 (38)% (43)% Europe Whole loans $ 3.6 $ 5.0 $ 5.0 Securities 5.7 4.5 5.2 $ 9.3 $ 9.5 $ 10.2 (2)% (9)% Asia-Pacific Whole loans $ 0.5 $ 0.3 $ 0.1 Securities 0.2 0.4 0.4 $ 0.7 $ 0.7 $ 0.5 —% 40% Other asset-backed $ 0.6 $ 0.9 $ 1.1 (33)% (45)% Total residential mortgages $ 24.9 $ 31.8 $ 32.1 (22)% (22)%
(1) The Company generally defines U.S. Alt-A residential mortgage loans as those associated with borrowers who may have creditworthiness of “prime” quality but may have traits that prevent the loans from qualifying as “prime.” Those traits could include documentation deficiencies related to the borrowers’ income disclosure, referred to as partial or no documentation; or the underlying property may not be owner occupied despite full or lower documentation of the borrowers’ income levels.
(2) The Company generally defines U.S. subprime residential mortgage loans as those associated with borrowers having a credit score in the range of 620 or lower using the Fair Isaac Corporation’s statistical model, or having other negative factors within their credit profiles. The Company also includes residential mortgage loans that were originated through BNC Mortgage LLC (“BNC”) prior to its closure in the third quarter of the Company’s 2007 fiscal year. BNC served borrowers with subprime qualifying credit profiles but also served borrowers with stronger credit history as a result of broker relationships or product offerings and such loans are also included in subprime business activity.
The ratings diversification (where high yield are securities rated BB+ or lower or equivalent ratings by recognized credit rating agencies) of the Company’s residential mortgage-related securities at May 31, 2008, February 29, 2008 and November 30, 2007 was:
May 31, 2008 February 29, 2008 November 30, 2007
Residential mortgage securities: High grade 91% 89% 85% High yield 9 11 15
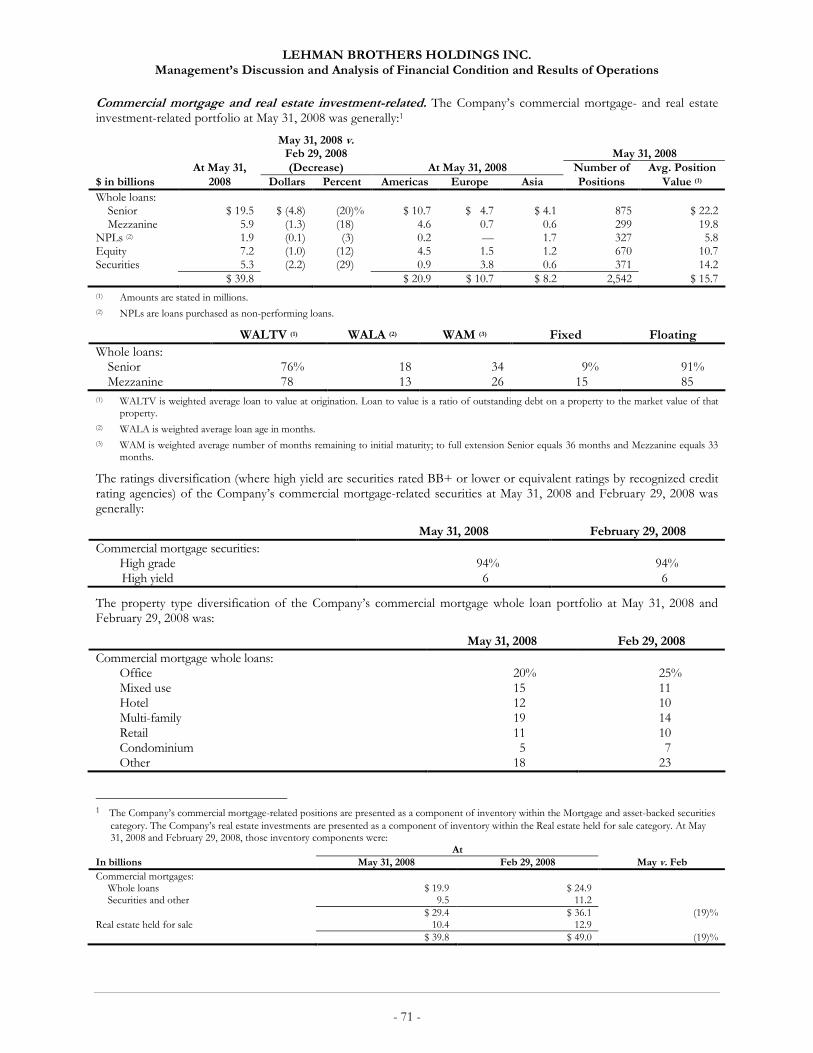
LEHMAN BROTHERS HOLDINGS INC. Management’s Discussion and Analysis of Financial Condition and Results of Operations
- 71 -
Commercial mortgage and real estate investment-related. The Company’s commercial mortgage- and real estate investment-related portfolio at May 31, 2008 was generally:1
May 31, 2008 v. Feb 29, 2008 May 31, 2008 At May 31, (Decrease) At May 31, 2008 Number of Avg. Position
$ in billions 2008 Dollars Percent Americas Europe Asia Positions Value (1)
Whole loans: Senior $ 19.5 $ (4.8) (20)% $ 10.7 $ 4.7 $ 4.1 875 $ 22.2 Mezzanine 5.9 (1.3) (18) 4.6 0.7 0.6 299 19.8 NPLs (2) 1.9 (0.1) (3) 0.2 — 1.7 327 5.8 Equity 7.2 (1.0) (12) 4.5 1.5 1.2 670 10.7 Securities 5.3 (2.2) (29) 0.9 3.8 0.6 371 14.2 $ 39.8 $ 20.9 $ 10.7 $ 8.2 2,542 $ 15.7
(1) Amounts are stated in millions.
(2) NPLs are loans purchased as non-performing loans.
WALTV (1) WALA (2) WAM (3) Fixed Floating
Whole loans: Senior 76% 18 34 9% 91% Mezzanine 78 13 26 15 85
(1) WALTV is weighted average loan to value at origination. Loan to value is a ratio of outstanding debt on a property to the market value of that property.
(2) WALA is weighted average loan age in months.
(3) WAM is weighted average number of months remaining to initial maturity; to full extension Senior equals 36 months and Mezzanine equals 33 months.
The ratings diversification (where high yield are securities rated BB+ or lower or equivalent ratings by recognized credit rating agencies) of the Company’s commercial mortgage-related securities at May 31, 2008 and February 29, 2008 was generally:
May 31, 2008 February 29, 2008
Commercial mortgage securities: High grade 94% 94% High yield 6 6
The property type diversification of the Company’s commercial mortgage whole loan portfolio at May 31, 2008 and February 29, 2008 was:
May 31, 2008 Feb 29, 2008
Commercial mortgage whole loans: Office 20% 25% Mixed use 15 11 Hotel 12 10 Multi-family 19 14 Retail 11 10 Condominium 5 7 Other 18 23
1 The Company’s commercial mortgage-related positions are presented as a component of inventory within the Mortgage and asset-backed securities
category. The Company’s real estate investments are presented as a component of inventory within the Real estate held for sale category. At May 31, 2008 and February 29, 2008, those inventory components were:
At In billions May 31, 2008 Feb 29, 2008 May v. Feb
Commercial mortgages: Whole loans $ 19.9 $ 24.9 Securities and other 9.5 11.2 $ 29.4 $ 36.1 (19)% Real estate held for sale 10.4 12.9 $ 39.8 $ 49.0 (19)%

LEHMAN BROTHERS HOLDINGS INC. Management’s Discussion and Analysis of Financial Condition and Results of Operations
- 72 -
Acquisition Finance Facilities
The Company enters into contingent commitments with counterparties to provide acquisition financing. The Company’s past experience generally has been that the full contingently committed amount is not drawn upon because transactions are not executed, initial deal sizes are revised or multiple financing sources are used by counterparties. Contingent commitments are recorded as a component of Derivatives and other contractual agreements in the Company’s financial instrument inventory. The fair value of these contingent acquisition facilities is estimated by using executed transactions on comparable loans and anticipated market prices based upon pricing indications from syndicate banks and customers. The valuation of these commitments also takes into account certain fee income and third-party credit ratings of counterparties. For a further discussion regarding all of the Company’s commitments and guarantees, see “Lending-Related Commitments,” in this MD&A.
While it is the Company’s intent to distribute through syndication when those facilities are drawn, or “funded,” the Company may not be able to syndicate the full lending facility because of market conditions or otherwise. Additionally, the Company may extend lending facilities to counterparties for business relationship purposes. In both instances, the loan is reflected as a component of Corporate debt and other in the Company’s financial instrument inventory. The fair value of these loans is estimated using executed transactions on comparable loans, market price quotations and market observable credit default swaps. For a further discussion regarding the Company’s high yield lending inventory, see “Liquidity, Funding and Capital Resources—Net Assets,” in this MD&A.
The following table summarizes the Company’s exposure to these commitments (where high yield are commitments made to counter-parties rated BB+ or lower or equivalent ratings by recognized credit rating agencies) at May 31, 2008, February 29, 2008 and November 30, 2007:
At Percent Change In billions May 31, 2008 Feb 29, 2008 Nov 30, 2007 May v. Feb May v. Nov
High grade:(1) Contingent $ 1.7 $ 7.2 $ 10.2 Unfunded 1.1 0.8 — Funded 3.7 2.9 1.7 $ 6.5 $ 10.9 $ 11.9 (40)% (45)% High yield: (1) Contingent $ 0.4 $ 3.7 $ 9.7 Unfunded 2.1 2.2 2.7 Funded 9.0 11.9 11.5 $ 11.5 $ 17.8 $ 23.9 (35)% (52)% $ 18.0 $ 28.7 $ 35.8 (37)% (50)%
(1) At May 31, 2008, February 29, 2008 and November 30, 2007, the Company has categorized amounts contingently committed as “Contingent”; amounts that were contingently committed in the prior period but unfunded in the current period as “Unfunded;” and amounts that were contingently committed in the prior period but funded in the current period as “Funded.”
Economic Hedges
To manage price risk or the change in fair value of an asset or liability, the Company may employ a risk management strategy referred to as an economic hedge. An economic hedge may be either a cash hedge or a derivative hedge. A derivative hedge is a derivative contract whose value is based on an underlying asset, index or reference rate. The Company’s position in that contract is typically designed with the intent to partially or fully offset changes in the price risk or fair value of the corresponding asset or liability. An economic hedge may be employed for specific inventory positions or trading books, or for the overall risks present in the businesses in which the Company operates. The Company may enter into an economic hedge whose value is based upon a specific financial instrument class, an index that references a financial instrument class or a rate that impacts a financial instrument’s value.
For example, the Company may employ an economic hedge against specific assets it owns by entering into a derivative contract that references an index that tracks the performance of a series of credit default swaps based upon a specific type of asset. The index the derivative contract references increases and decreases as the market’s view for the underlying financial instrument class changes. The Company’s position in that economic hedge typically is designed to offset movements in the price of the financial instrument.
By their nature, certain economic hedges expose the Company to basis risk. That is, changes in the values of the financial instruments whose prices were to be hedged are not offset by movements in the values of the financial instrument class, index or rate underlying the economic hedges. During the second quarter of 2008, the valuation

LEHMAN BROTHERS HOLDINGS INC. Management’s Discussion and Analysis of Financial Condition and Results of Operations
- 73 -
adjustments on certain of the Company’s financial instruments were not mitigated by the economic hedge strategies. This is in contrast to prior periods when the Company’s cash and economic hedges were able to offset, in part, the Company’s valuation adjustments on the items being hedged. As a result, in the second quarter of 2008, the Company incurred approximately $0.1 billion of additional losses as gains from some economic hedges were more than offset by losses from other economic hedging activity.
Because the Company is a broker-dealer that applies fair value accounting to all of its cash and derivative inventory positions, at May 31, 2008, the Company did not designate the hedges discussed above as accounting hedges under the provisions of SFAS No. 133, Accounting for Derivative Instruments and Hedging Activities (“SFAS 133”). For a further discussion regarding the Company’s derivative portfolio, see Note 3, “Financial Instruments and Other Inventory Positions,” to the Consolidated Financial Statements. For a further discussion regarding the Company’s fair value determination of derivative contracts, see Note 1, “Summary of Significant Accounting Policies,” and Note 4, “Fair Value of Financial Instruments,” to the Consolidated Financial Statements.
Fund-Related Assets
The Company has formed various private equity or other alternative investment funds with third-party investors that are typically organized as limited partnerships. The Company typically acts as general partner for these funds and does not consolidate the funds into its results of operations when the third-party investors to the funds have (i) rights to either remove the general partner without cause or to liquidate the partnership; or (ii) substantive participation rights.
The Company may provide support to the funds, although the Company has no obligation to do so. The support may take the form of guarantees, additional capital commitments to the funds and/or the purchase of assets from the funds. If support is provided to the funds, the Company performs a re-assessment of the non-consolidation of the fund as required by FIN 46(R).
During the 2008 second quarter, the Company entered into asset exchanges with certain funds. The Company incurred a net loss on the asset exchange transactions of approximately $28 million and included the assets exchanged from these funds within the Company's consolidated statement of financial condition at May 31, 2008. Substantially all of the assets consolidated are managed within the Company’s Capital Markets—Fixed Income businesses.
Business Segments
The Company’s operations are organized into three business segments:
• Capital Markets;
• Investment Banking; and
• Investment Management.
These business segments generate revenues from institutional, corporate, government and high net worth individual clients across each of the revenue categories in the Consolidated Statement of Income. Segment operating results contain certain internal allocations, such as funding costs that are centrally managed. Allocations made are based upon management’s estimates and judgments. Additionally, because certain components of revenues reflect the overall performance of the Company as well as the performance of individual business units, performance in one segment may be affected by the performance of other segments.

LEHMAN BROTHERS HOLDINGS INC. Management’s Discussion and Analysis of Financial Condition and Results of Operations
- 74 -
Segment Net Revenues
Three Months Ended Six Months Ended May 31, Percent May 31, Percent
In millions 2008 2007 Change 2008 2007 Change
Net revenues: Capital Markets $(2,374) $3,594 NM $ (703) $7,096 NM Investment Banking 858 1,150 (25)% 1,725 2,000 (14)% Investment Management 848 768 10 1,817 1,463 24 Total net revenues (668) 5,512 NM 2,839 10,559 (73)% Compensation and benefits 2,325 2,718 (14)% 4,166 5,206 (20) Non-personnel expenses 1,094 915 20 2,097 1,775 18 Income before taxes $(4,087) $1,879 NM $(3,424) $3,578 NM
Capital Markets
The Capital Markets segment is divided into two components:
Fixed Income — The Company makes markets in and trades municipal and public sector instruments, interest rate and credit products, mortgage-related securities and loan products, currencies and commodities. The Company also originates mortgages and structures and enters into a variety of derivative transactions. The Company provides research covering economic, quantitative, strategic, credit, relative value, index and portfolio analyses. Additionally, the Company provides financing, advice and servicing activities to the hedge fund community, known as prime brokerage services. The Company engages in certain proprietary trading activities and in principal investing in real estate that are managed within this component.
Equities — The Company makes markets in and trades equities and equity-related products and enters into a variety of derivative transactions. The Company also provides equity-related research coverage as well as execution and clearing services for clients. Through capital markets prime services, the Company provides prime brokerage services to the hedge fund community. The Company also engages in proprietary trading activities and private equity and other principal related investments.
The following table sets forth the operating results of the Capital Markets business segment.
Capital Markets Results of Operations
Three Months Ended Six Months Ended May 31, Percent May 31, Percent In millions 2008 2007 Change 2008 2007 Change
Principal transactions $(3,701) $ 2,646 NM $(3,281) $ 5,403 NM Commissions 453 393 15% 915 774 18% Interest and dividends 7,769 10,547 (26) 17,391 19,624 (11) Other 1 30 (97) 8 37 (78) Total revenues 4,522 13,616 (67) 15,033 25,838 (42) Interest expense 6,896 10,022 (31) 15,736 18,742 (16) Net revenues (2,374) 3,594 NM (703) 7,096 NM Non-interest expenses 2,135 2,241 (5)% 3,569 4,374 (18)% Income before taxes $(4,509) $ 1,353 NM $(4,272) $ 2,722 NM
The following table sets forth net revenues for the two components of the Capital Markets business segment.
Capital Markets Net Revenues
Three Months Ended Six Months Ended May 31, Percent May 31, Percent In millions 2008 2007 Change 2008 2007 Change
Fixed Income $(2,975) $1,902 NM $(2,714) $4,075 NM Equities 601 1,692 (64)% 2,011 3,021 (33)% $(2,374) $3,594 NM $ (703) $7,096 NM

LEHMAN BROTHERS HOLDINGS INC. Management’s Discussion and Analysis of Financial Condition and Results of Operations
- 75 -
Net revenues for the 2008 three and six months were negative $2.4 billion and negative $0.7 billion, respectively, compared to $3.6 billion and $7.1 billion in the corresponding 2007 periods. The variance between the benchmark periods reflects the impact from negative valuations incurred across inventory positions. Capital Markets net revenues in the 2008 three and six month periods include approximately $0.4 billion and $1.0 billion, respectively, of gains on debt liabilities which the Company elected to fair value under SFAS 159. Interest and dividends revenue for the Capital Markets segment declined 26% and 11% in the 2008 three and six months, respectively, compared to the corresponding 2007 periods, and Capital Markets’ Interest expense declined 31% and 16% between the comparative periods, primarily attributable to comparative changes in global yield curves and lower financing costs for certain inventory positions. The greater decline in financing costs compared to financing revenues resulted in net interest revenues for the Capital Markets segment increasing 66% and 88% to approximately $0.9 billion and $1.7 billion in the 2008 three and six month periods, respectively, from $0.5 billion and $0.9 billion in the corresponding 2007 periods. Non-interest expenses for the 2008 three and six months decreased 5% and 18%, respectively, compared to the corresponding 2007 periods, reflecting the resizing of various business platforms, particularly associated with certain fixed income products. For a further discussion, see “Consolidated Results of Operations—Business Acquisitions, Business Dispositions and Strategic Investments—Business Dispositions” above. Capital Markets’ Income before taxes for the 2008 three and six months was negative $4.5 billion and negative $4.3 billion, respectively, compared to $1.4 billion and $2.7 billion in the corresponding 2007 periods.
Net revenues in Capital Markets—Fixed Income were negative $3.0 billion and negative $2.7 billion for the 2008 three and six months, respectively, compared to $1.9 billion and $4.1 billion in the corresponding 2007 periods. The businesses within the Fixed Income component of Capital Markets were the most affected by the market dislocations and asset repricings across various products that have continued from the second half of the 2007 fiscal year through the 2008 second quarter. These market factors resulted in negative valuation adjustments recorded against mortgage and asset-backed-related positions as well as real estate-related investments and leveraged finance positions. For a further discussion of the components of the negative valuation adjustment recorded in the 2008 three and six months and the Company’s related exposures at May 31, 2008, see “Impact from Market Events” above. Additionally, the Company maintained defensive trading positions in its credit and rates businesses that lost approximately $0.7 billion in the second quarter of 2008 as a result of large market movements that occurred during the three month period.
Despite negative net revenue results for the three months and six months ended May 31, 2008, Capital Markets—Fixed Income’s client revenues for the periods were approximately 27% and 40% higher than in the corresponding 2007 periods.1 The comparative increase in client revenues reflects strong client demand for liquid market products, including interest rate and foreign exchange offerings, high grade debt products, including primary and secondary trading, and the fixed income financing component of prime brokerage services. Additionally, the Company’s developing commodities trading business experienced record performance within the three month period ended May 31, 2008.
Capital Markets—Fixed Income results for the 2008 three and six month periods include approximately $0.3 billion and $0.8 billion, respectively, in allocated gains from valuation changes in certain debt liabilities carried at fair value under SFAS 159. Losses on principal portfolios recorded in the Fixed Income component of Capital Markets were approximately $0.3 and $0.6 billion for both the 2008 three and six month periods, respectively.
Capital Markets—Equities net revenues decreased 64% and 33% to $0.6 billion and $2.0 billion for the 2008 three and six months, respectively, from $1.7 billion and $3.0 billion for the corresponding 2007 periods. Capital Markets—Equities client revenues were unchanged between the second quarter of 2008 and the second quarter of 2007; but increased 16% between the six month ended May 31 comparative periods, reflecting increases in execution services and prime services activities. Global market trading volumes were lower in 2008 three and six months compared to corresponding 2007 periods. Capital Markets—Equities prime services’ net revenues in the 2008 three and six months increased 5% and 16%, respectively, compared to the corresponding 2007 periods. Overall client balances were 17% lower at the end of the 2008 quarter as compared to balances at the end of the 2007 second quarter. The decline in equity prime brokerage balances is attributable to clients’ deleveraging, clients’ diversifying their balances across multiple prime brokers, as well as the Company’s intent to reduce those balances that are viewed as inefficient use of the prime broker balance sheet.
Capital Markets—Equities net revenues for the 2008 three and six months include losses of approximately $0.3 billion and $0.1 billion, respectively, from principal investment activity, driven, in part, by depreciation in the Company’s investment in an asset manager. In addition, allocated gains from valuation changes in certain debt liabilities carried at fair value under SFAS 159 were approximately $0.1 billion and $0.2 billion for the 2008 three and six months, respectively.
1 Client revenues are an internal operating metric that is used to quantify the sales activity of Capital Market’s client activities by management. It
consists of commissions, which are earned from clients, and sales credits, which are a measurement calculated via models or determined on a transactional basis value. Client revenues do not reflect any impact of valuation adjustments or related hedging activities nor do client revenues reflect the results of proprietary trading or principal investing activities.

LEHMAN BROTHERS HOLDINGS INC. Management’s Discussion and Analysis of Financial Condition and Results of Operations
- 76 -
Investment Banking
The Company takes an integrated approach to client coverage, organizing bankers into industry, product and geographic groups within the Investment Banking segment. Business services provided to corporations and governments worldwide can be separated into:
Global Finance — The Company serves clients’ capital raising needs through underwriting, private placements, leveraged finance and other activities associated with debt and equity products.
Advisory Services — The Company provides business advisory services with respect to mergers and acquisitions, divestitures, restructurings and other corporate activities.
The following table sets forth the operating results of the Investment Banking segment.
Investment Banking Results of Operations 1
Three Months Ended Six Months Ended, May 31, Percent May 31, Percent
In millions 2008 2007 Change 2008 2007 Change
Global Finance—Debt $ 288 $ 540 (47)% $ 610 $ 968 (37)% Global Finance—Equity 330 333 (1) 545 508 7 Advisory Services 240 277 (13) 570 524 9 Total revenues $ 858 $1,150 (25)% $1,725 $2,000 (14) Non-interest expenses 665 812 (18) 1,351 1,472 (8) Income before taxes $ 193 $ 338 (43)% $ 374 $ 528 (29)%
The following table sets forth the Company’s Investment Banking transaction volumes.2 These volumes do not always directly correlate to Investment Banking revenues because they do not necessarily correspond to the amount of securities actually underwritten and only include certain reported underwriting activity and because revenue rates vary among transactions.
Three Months Ended Six Months Ended May 31, Percent May 31, Percent In millions 2008 2007 Change 2008 2007 Change
Global Finance—Debt $ 45,419 $ 139,035 (67)% $ 101,748 $ 237,733 (57)% Global Finance—Equity 11,807 9,639 22 17,700 16,273 9 Advisory Services—Completed 181,833 180,418 1 275,131 350,292 (21) Advisory Services—Announced 170,513 325,505 (48) 245,569 575,786 (57)
Investment Banking net revenues totaled $0.9 billion and $1.7 billion in the 2008 three and six months, respectively, a decrease of 25% and 14% compared to the corresponding 2007 periods, reflecting consistent revenues in Global Finance—Equity and lower revenues in Global Finance—Debt between the benchmark periods. Non-interest expenses in the 2008 three and six months declined 18% and 8% to $0.7 billion and $1.4 billion from $0.8 billion and $1.5 billion in the corresponding 2007 periods. Income before taxes decreased 43% and 29%, respectively in the 2008 three and six month periods, respectively, and, correspondingly, pre-tax margins in the 2008 three and six months were 22.5% and 21.7%, respectively, as compared to 29.4% and 26.4% in the corresponding 2007 periods.
Global Finance—Debt origination net revenues were $0.3 billion and $0.6 billion in the 2008 three and six months, respectively, decreasing 47% and 37% compared to the corresponding 2007 periods. These second quarter results are consistent with publicly reported global debt origination market volumes which decreased on an annualized basis at May 31, 2008 by 18% compared to publicly reported volumes for the 2007 calendar year and the Company’s annualized debt origination market volumes, which decreased 47% during the same comparative periods. Declines in both net revenues and
1 Investment banking revenues are net of related underwriting expenses. 2 Debt and equity underwriting volumes as reported by Thomson Financial, an operating unit of The Thomson Reuters Corporation., are based on
full credit for single-book managers and equal credit for joint-book managers. Debt underwriting volumes include both publicly registered and Rule 144A issues of high grade and high yield bonds, sovereign, agency and taxable municipal debt, non-convertible preferred stock and mortgage- and asset-backed securities. Equity underwriting volumes include both publicly registered and Rule 144A issues of common stock and convertibles. Because publicly reported debt and equity underwriting volumes do not necessarily correspond to the amount of securities actually underwritten and do not include certain private placements and other transactions, and because revenue rates vary among transactions, publicly reported debt and equity underwriting volumes may not be indicative of revenues in a given period. Additionally, because Advisory Services volumes are based on full credit to each of the advisors in a transaction, and because revenue rates vary among transactions, Advisory Services volumes may not be indicative of revenues in a given period.

LEHMAN BROTHERS HOLDINGS INC. Management’s Discussion and Analysis of Financial Condition and Results of Operations
- 77 -
volumes between the same comparable periods were driven, in part, by weaknesses in the high yield and structured debt markets, an outcome of continued turbulence in the credit markets. Debt origination fee backlog was approximately $0.1 billion at May 31, 2008, an 88% decrease from backlog levels at May 31, 2007. Debt origination backlog may not be indicative of the level of future business due to the frequent use of the shelf registration process and changes in overall market conditions. On a calendar year-to-date basis, the Company’s market ranking in 2008 for publicly reported global debt origination was thirteen with a 3.8% market share, down from a rank of six with a 5.7% market share for the calendar year 2007.
Global Finance—Equity net revenues for the 2008 three and six months were $0.3 billion and $0.5 billion, respectively, consistent with the second quarter of 2007 and an increase of 7% compared to the six months ended May 31, 2007. Publicly reported global equity origination market volumes decreased on an annualized basis at May 31, 2008 by 27% compared to publicly reported volumes for the 2007 calendar year; however, the Company’s annualized equity origination market volumes increased 11% between the same comparable periods. The increase in the Company’s second quarter 2008 net revenues was primarily attributable to strong financial sector issuances (secondary and convertibles-related activities). Equity-related fee backlog (for both filed and unfiled transactions) at May 31, 2008 was approximately $0.2 billion, half of the value at May 31, 2007; however, that measure may not be indicative of the level of future business depending on changes in overall market conditions. On a calendar year-to-date basis, the Company’s market ranking for publicly reported 2008 global equity origination was seven with a 5.2% market share, up from a rank of nine with a 3.4% market share for the calendar year 2007.
Advisory Services net revenues were $0.2 billion and $0.6 billion for the 2008 three and six months, respectively, compared to $0.3 billion and $0.5 billion, in the corresponding 2007 periods. On an annualized basis at May 31, 2008, industry-wide completed and announced transaction volumes decreased 35% and 34%, respectively, as compared to publicly reported volumes for the 2007 calendar year while the Company’s annualized completed and announced volumes decreased 18% and 34%, respectively. M&A fee backlog at May 31, 2008 was $0.2 billion, down 52% from May 31, 2007; however, that measure may not be indicative of the level of future business depending on changes in overall market conditions. On a calendar year-to-date basis, the Company’s market ranking for completed transactions was five with a 24.4% share, up from a rank of seven with a 19.4% share for the 2007 calendar year. In addition and on a calendar year-to-date basis, the Company’s market ranking for announced transactions in the comparable periods was six with a 17.7% share, up from a rank of nine with a 17.5% share for the 2007 calendar year.
Investment Management
The Investment Management business segment consists of:
Asset Management — The Company provides customized investment management services for high net worth clients, mutual funds and other institutional investors. Asset Management also serves as general partner for private equity and other alternative investment partnerships and has minority stake investments in certain alternative investment managers.
Private Investment Management — The Company provides investment, wealth advisory and capital markets execution services to high net worth and middle market institutional clients.
The following table sets forth the operating results of the Investment Management segment.
Investment Management Results of Operations
Three Months Ended Six Months Ended May 31, Percent May 31, Percent In millions 2008 2007 Change 2008 2007 Change
Principal transactions $259 $243 7% $ 612 $ 407 50% Commissions 186 175 6 382 334 14 Interest and dividends 2 11 (82) 15 23 (35) Asset management and other 413 384 8 843 772 9 Total revenues 860 813 6 1,852 1,536 21 Interest expense 12 45 (73) 35 73 (52) Net revenues 848 768 10 1,817 1,463 24 Non-interest expenses 619 580 7 1,343 1,135 18 Income before taxes $229 $188 22% $ 474 $ 328 45%

LEHMAN BROTHERS HOLDINGS INC. Management’s Discussion and Analysis of Financial Condition and Results of Operations
- 78 -
The following table sets forth Asset Management and Private Investment Management net revenues.
Investment Management Net Revenues
Three Months Ended, Six Months Ended
May 31, Percent May 31, Percent
In millions 2008 2007 Change 2008 2007 Change
Asset Management $496 $460 8% $1,114 $ 876 27% Private Investment Management 352 308 14 703 587 20 $848 $768 10% $1,817 $1,463 24%
The following table sets forth AUM by asset class.
Composition of Assets Under Management
Percent Change to May 31, 2008 May 31, Nov 30, May 31, Nov 30, May 31, In billions 2008 2007 2007 2007 2007
Equity $109 $107 $108 2% 1% Fixed income 75 75 65 – 15 Money markets 54 66 64 (18) (16) Alternative investments 39 34 26 15 50 $277 $282 $263 (2)% 5%
The following table sets forth a summary of the changes in AUM.
Changes in Assets Under Management
Three Months Ended Six Months Ended May 31, Percent May 31, Percent In billions 2008 2007 Change 2008 2007 Change
Opening balance $277 $236 17% $282 $225 25% Net additions/(subtractions) (9) 16 NM (9) 24 NM Net market appreciation/(depreciation) 9 11 (18) 4 14 (71) Total increase/(decrease) – 27 NM (5) 38 NM Assets Under Management $277 $263 5% $277 $263 5%
Investment Management net revenues for the 2008 three and six months increased 10% and 24%, respectively, compared to the corresponding 2007 periods with higher net revenues in Asset Management and Private Investment Management. Non-Interest expense for the 2008 three and six months increased 7% and 18%, respectively, compared to the corresponding 2007 periods due to higher levels of compensation, correlated to higher revenues. Income before taxes increased 22% and 45% for the 2008 three and six months, respectively, compared to the corresponding 2007 periods. Pre-tax margin was 27.0% and 26.1% for the 2008 three and six months, respectively, which increased from 24.4% and 22.4% for the corresponding 2007 periods.
The 10% and 24% increase in Investment Management net revenues for the 2008 three and six months as compared to the corresponding 2007 periods are the result of gains from minority interests in asset managers and an increase in high net worth revenues due to higher assets under management levels. Asset Management net revenues increased 8% and 27% for the 2008 three and six months, respectively, in comparison to the corresponding 2007 periods as a result of comparably higher levels of traditional and alternative asset management business activity. Private Investment Management net revenues for the 2008 three and six months were $0.4 billion and $0.7 billion, respectively, compared to $0.3 billion and $0.6 billion for the corresponding 2007 periods.
At May 31, 2008, AUM was $277 billion, an increase of 5% compared to the corresponding 2007 period. Balances for fixed income and alternative investment asset classes increased and money markets decreased compared to the second quarter of 2007. At May 31, 2008, assets under management decreased 2% from November 30, 2007, due to net outflows, primarily in money markets, partially offset by increased market performance.

LEHMAN BROTHERS HOLDINGS INC. Management’s Discussion and Analysis of Financial Condition and Results of Operations
- 79 -
Geographic Segments
The Company organizes its operations into three geographic regions:
• Europe and the Middle East, inclusive of operations in Russia and Turkey;
• Asia-Pacific, inclusive of operations in Australia and India; and
• the Americas.
Net revenues presented by geographic region are based upon the location of the senior coverage banker or investment advisor in the case of Investment Banking or Asset Management, respectively, or where the position was risk managed within Capital Markets and Private Investment Management. Certain revenues associated with U.S. products and services that result from relationships with international clients have been classified as international revenues using an allocation process. The methodology for allocating the Firm’s revenues to geographic regions is dependent on the judgment of management. Additionally, because certain components of revenues reflect the overall performance of the Company as well as the performance of individual regions, performance in one segment may be affected by the performance of other segments.
The following presents, in management’s judgment, a reasonable representation of each region’s contribution to net revenues.
Geographic Net Revenues
Three Months Ended Six Months Ended May 31, Percent May 31, Percent In millions 2008 2007 Change 2008 2007 Change
Europe and the Middle East $(499) $1,829 NM $ 261 $ 3,197 (92)% Asia-Pacific 57 762 (93)% 1,405 1,356 4 Total Non-Americas (442) 2,591 NM 1,666 4,553 (63) U.S. (290) 2,888 NM 1,052 5,916 (82) Other Americas 64 33 94% 121 90 34 Total Americas (226) 2,921 NM 1,173 6,006 (80) Net revenues $(668) $5,512 NM $2,839 $10,559 (73)%
Non-Americas net revenues for the 2008 three and six months were negative $0.4 billion and $1.7 billion, respectively, compared to the corresponding 2007 periods of $2.6 billion and $4.6 billion, respectively. The change in geographic concentrations of net revenues was due to the concentration in the Americas and Europe and the Middle East of negative valuation adjustments as well as incurred losses on principal investing activities and defensive rates and credit trading positions. For a further discussion of negative valuation adjustments recorded in the 2008 three and six months, see “Impact from Market Events” above.
Second quarter 2008 results within Europe and the Middle East reflect positive results within Investment Banking and Investment Management. However, these did not offset negative results within Capital Markets. Net revenues in Europe and the Middle East were negative $0.5 billion and $0.3 billion for the 2008 three and six months, respectively, compared to $1.8 billion and $3.2 billion in the corresponding 2007 periods, respectively. Comparatively lower Capital Markets net revenues were the result of the continuation of unfavorable credit and interest rate markets within the U.K. and Eurozone as well as a decline in principal investment activity, driven, in part, by depreciation in the Company’s investment in an asset manager. Client revenues for the 2008 second quarter increased 4% from the 2007 second quarter. Investment Banking net revenues for the Europe and the Middle East segment for the 2008 three and six months decreased 31% and 13%, respectively, from the 2007 three and six months, reflecting lower market volumes in the region. Offsetting these results, Investment Management net revenues were higher than benchmark periods, as a result of strong client activity within Private Investment Management.
Second quarter 2008 results within Asia-Pacific were impacted by valuation adjustments that were offset in part by positive results within Investment Management. Net revenues in Asia-Pacific were $0.06 billion and $1.4 billion for the 2008 three and six months, respectively, compared to $0.8 billion and $1.4 billion in the corresponding 2007 periods, respectively. Capital Markets results were impacted by negative valuation adjustments on asset repricings as well as an approximate $0.2 billion loss from proprietary investment activity. Client revenue levels for the region were consistent between the 2008 second quarter and the 2007 second quarter. Investment Banking results were consistent with those in the comparative

LEHMAN BROTHERS HOLDINGS INC. Management’s Discussion and Analysis of Financial Condition and Results of Operations
- 80 -
2007 quarter. Investment Management within the region doubled from the 2007 second quarter reflecting continued development of this business segment within the geographic segment.
Liquidity, Funding and Capital Resources
The Company establishes and monitors compliance with guidelines for the level and composition of its liquidity pool and asset funding, the makeup and size of the Company’s balance sheet and the utilization of equity.
Liquidity
The funding market environment became very challenging during the second quarter of 2008 as a series of credit and liquidity events in the Company’s industry resulted in a sharp decrease in the supply of liquidity in March, which was partially reversed in April and May. Despite this difficult environment, the Company strengthened its liquidity position, finishing the quarter with record levels of liquidity.
• The Company’s liquidity pool at May 31, 2008 was approximately $45 billion, up from approximately $34 billion at February 29, 2008 and $35 billion at November 30, 2007.
• Long-term capital (long-term borrowings, excluding borrowings with remaining contractual maturities within twelve months of the financial statement date, and total stockholders’ equity) was approximately $154 billion at May 31, 2008, up from approximately $153 billion at February 29, 2008 and $146 billion at November 30, 2007. The May 31, 2008 long-term capital balance does not reflect the impact of the issuance of $4.0 billion of common stock and of $2.0 billion of 8.75% Non-Cumulative Mandatory Convertible Preferred Stock, Series Q, on June 12, 2008. On a pro forma basis including these two issuances, long-term capital would have been $160 billion at May 31, 2008.
Liquidity pool. The Company maintains a liquidity pool available to Holdings that is primarily intended to cover expected cash outflows for twelve months in a stressed liquidity environment. In assessing the required size of the liquidity pool, the Company assumes that assets outside the liquidity pool cannot be sold to generate cash, unsecured debt cannot be issued, and any cash and unencumbered liquid assets outside of the liquidity pool cannot be used to support the liquidity of Holdings. The Company’s liquidity pool is sized to cover expected cash outflows associated with the following items:
• The repayment of approximately $30.8 billion of unsecured debt issued by Holdings and unregulated entities. This includes approximately:
o $20.7 billion of current portion of long-term borrowings. The remaining $0.4 billion of current portion of long-term borrowings is related to regulated entities which maintain their own liquidity pool sized to cover the repayment of the approximately $1.0 billion in aggregate of unsecured debt maturing in the next twelve months issued by those regulated entities.
o $7.9 billion of commercial paper.
o $2.2 billion of bank loans and hybrid financial instruments with maturities of less than one year. This excludes approximately $2.8 billion of structured note self-funding trades that are measured at fair value and managed by business units through matched, unencumbered asset portfolios outside of Holdings’ liquidity pool. The remaining $0.7 are bank loans in regulated entities.
• The repayment of approximately $1.6 billion of certain hybrid financial instruments with contingent early redemption features linked to market prices or other triggering events (e.g., the downgrade of a reference obligation underlying a credit-linked note), which are reasonably expected to mature within twelve months (approximately $1.6 billion). These instruments are classified as long-term debt based on their contractual maturity.
• The funding of commitments to extend credit made by the Company and certain of its unregulated subsidiaries is based on a probabilistic model. The funding of commitments to extend credit made by regulated subsidiaries (including the Company’s banks) is covered by the liquidity pools maintained by these regulated subsidiaries. For additional information, see “Lending-Related Commitments” below and Note 8, “Commitments, Contingencies and Guarantees,” to the Consolidated Financial Statements.
• The anticipated impact of adverse changes on secured funding, either in the form of a greater difference between the market and pledge value of assets (also known as “haircuts”) or in the form of reduced borrowing availability.

LEHMAN BROTHERS HOLDINGS INC. Management’s Discussion and Analysis of Financial Condition and Results of Operations
- 81 -
In addition, the liquidity pool is sized to cover the impact of a one notch downgrade of Holdings’ long-term debt ratings, including the additional collateral that would be required to be posted against derivative contracts and other secured funding arrangements. See “—Credit Ratings” below.
The liquidity pool is primarily invested in cash instruments, government and agency securities and overnight repurchase agreements collateralized by government and agency securities. The Company calculates its liquidity pool on a daily basis.
Estimated values of the liquidity pool and other unencumbered (i.e., unpledged) asset portfolios available are:
In billions May 31, 2008 November 30, 2007
Unregulated Holdings liquidity pool at pledge value $ 44.6 $ 34.9 Other unencumbered assets at market value 60.6 63.2 105.2 98.1 Regulated(1) Unencumbered assets held at market value 87.3 95.5 Total $192.5 $193.6
(1) Regulated subsidiaries, such as the Company’s U.S. and non-U.S. broker-dealers and bank entities, maintain their own liquidity pools to cover their stand-alone expected annualized cash funding needs in a stressed liquidity environment. Unencumbered assets in regulated entities are generally restricted from transfer and therefore considered not available to support the liquidity needs of Holdings or other unregulated entities.
Funding of assets. The Company funds assets based on their liquidity characteristics, and utilizes cash capital1 to provide financing for long-term funding needs. The Company’s funding strategy incorporates the following factors:
• Liquid assets (i.e., assets for which the Company believes a reliable secured funding market exists across all market environments including government bonds, U.S. agency securities, corporate bonds, asset-backed securities and equity securities) are primarily funded on a secured basis.
• Secured funding “haircuts” are funded with cash capital.
• Illiquid assets (e.g., fixed assets, intangible assets and margin postings) and less liquid inventory positions (e.g., derivatives, private equity investments, certain corporate loans, certain commercial mortgages and real estate positions) are funded with cash capital.
• Certain unencumbered assets that are not part of the liquidity pool irrespective of asset quality are also funded with cash capital. These assets are typically unencumbered because of operational and asset-specific factors. The Company does not assume a change in these factors during a stressed liquidity event.
As part of its funding strategy, the Company also takes steps to mitigate the main sources of contingent liquidity risk as follows:
• Commitments to extend credit — Cash capital is utilized to cover a probabilistic estimate of expected funding of commitments to extend credit. For a further discussion of commitments, see “Lending-Related Commitments” in this MD&A and Note 8, “Commitments, Contingencies and Guarantees,” to the Consolidated Financial Statements.
• Ratings downgrade — Cash capital is utilized to cover the liquidity impact of a one-notch downgrade of Holdings’ long-term debt ratings. A ratings downgrade would increase the amount of collateral to be posted against derivative contracts and other secured funding arrangements. For a further discussion of credit ratings and the potential impacts of ratings downgrades, see “Credit Ratings” below.
• Client financing — The Company provides secured financing to clients typically through repurchase and prime broker agreements. These financing activities create liquidity risk when:
o Clients withdraw their free credit balances. The Company mitigates this risk by not relying on free credit balances to fund its own or its clients’ positions.
o The availability and terms of the Company’s own secured borrowing agreements adversely change during a stressed liquidity event and the Company is unable to reflect these changes in client financing
1 Cash capital consists of stockholders’ equity, the estimated sustainable portion of core deposit liabilities at the Company’s bank subsidiaries, and
liabilities with remaining term of one year or more.

LEHMAN BROTHERS HOLDINGS INC. Management’s Discussion and Analysis of Financial Condition and Results of Operations
- 82 -
agreements. The Company mitigates this risk by entering into term secured borrowing agreements, in which the Company can fund different types of collateral at pre-determined collateralization levels, and by maintaining liquidity pools at regulated broker-dealers.
The Company’s policy is to operate with an excess of long-term funding sources over long-term funding requirements (“cash capital surplus”). The Company seeks to maintain a cash capital surplus at Holdings of at least $2.0 billion. Cash capital surplus at Holdings was $15.0 billion at May 31, 2008 compared with $7.0 billion at February 29, 2008 and $8.0 billion November 30, 2007. Additionally, at May 31, 2008, the cash capital surplus in regulated entities was approximately $12.3 billion compared with $8.8 billion at February 29, 2008 and $12.6 billion November 30, 2007.
The Company hedges the majority of foreign exchange risk associated with investments in subsidiaries in non-U.S. dollar currencies using foreign currency-denominated long-term debt and forwards.
Diversification of funding sources. The Company seeks to diversify its funding sources. The Company issues long-term debt in multiple currencies and across a wide range of maturities to tap many investor bases, thereby reducing reliance on any one source.
• During the six months ended May 31, 2008, the Company issued $32.8 billion of long-term borrowings. Long-term borrowings (less current portion) increased to $128.2 billion at May 31, 2008, up from $123.2 billion at November 30, 2007. The weighted-average maturities of long-term borrowings were 7.7 years and 7.1 years at May 31, 2008 and November 30, 2007, respectively.
• The Company diversifies its issuances geographically to minimize refinancing risk and broaden the debt-holder base. As of May 31, 2008, February 29, 2008 and November 30, 2007, 54%, 53% and 54%, respectively, of long-term debt was issued outside the U.S.
• In order to minimize refinancing risk, the Company establishes threshold amounts (stated as percentages of outstanding long-term borrowings) on long-term borrowings anticipated to mature within any quarterly (7.5%), half-year (12.0%) and full-year (20.0%) interval. At May 31, 2008, those limits were $9.6 billion, $15.4 billion and $25.6 billion, respectively. If the Company were to operate with debt above these levels, the Company would not include the additional amount as a source of cash capital.
• The Company typically issues in sufficient size to create a liquid benchmark issuance (i.e., sufficient size to be included in the Lehman Bond Index, a widely used index for fixed income asset managers).
Long-term debt is accounted for in long-term-borrowings maturity profile at its contractual maturity date if the debt is redeemable at the Company’s option. Long-term debt that is repayable at par at the holder’s option is included in these limits at its earliest redemption date. Extendible issuances (which mature on an initial specified maturity date, unless the debt holders elect to extend the term of the note for a period specified in the note) are included in these limits at their earliest maturity date.

LEHMAN BROTHERS HOLDINGS INC. Management’s Discussion and Analysis of Financial Condition and Results of Operations
- 83 -
The quarterly long-term borrowings maturity schedule over the next five years at May 31, 2008 is as follows:
Long-Term Borrowings Maturity Profile Chart(1)
$500
$1,000
$1,500
$2,000
$2,500
$3,000
$3,500
$4,000
$4,500
$5,000
$5,500
$6,000
$6,500
$7,000
$7,500
$8,000
2009 Q3 2009 Q4 2010 Q1 2010 Q2 2010 Q3 2010 Q4 2011 Q1 2011 Q2 2011 Q3 2011 Q4 2012 Q1 2012 Q2 2012 Q3 2012 Q4 2013 Q1 2013 Q2 2013 Q3 2013 Q4 2014 Q1 2014 Q2
In m
illio
ns
LTD Extendibles
(1) Included in long-term debt is $6.3 billion of certain hybrid financial instruments with contingent early redemption features linked to market prices
or other triggering events (e.g., the downgrade of a reference obligation underlying a credit-linked note). In the above maturity table, these notes are shown at their contractual maturity. In determining the cash capital value of these notes, however, the Company excluded the portion reasonably expected to mature within twelve months ($1.6 billion) from its cash capital sources at May 31, 2008.
• The Company uses both committed and uncommitted bilateral and syndicated long-term bank facilities to complement long-term debt issuances. In particular, the Company maintains a $2.0 billion unsecured, committed revolving credit agreement with a syndicate of banks. In March 2008, the Company amended and restated this credit facility for three years to February 2011. In addition, the Company maintains a $2.5 billion multi-currency unsecured, committed revolving credit facility (“European Facility”) with a syndicate of banks for Lehman Brothers Bankhaus AG (“Bankhaus”) and Lehman Brothers Treasury Co. B.V. which expires in April 2010. The ability to borrow under such facilities is conditioned on complying with customary lending conditions and covenants. These conditions and covenants do not contain provisions that could, upon an adverse change in the Company’s credit ratings, trigger a requirement for an early repayment or prevent future borrowings under the facilities. The Company has maintained compliance with the material covenants under these credit agreements at all times. The Company draws on both of these facilities from time to time in the normal course of conducting business. As of May 31, 2008, there were no outstanding borrowings against either Holdings’ credit facility or the European Facility.

LEHMAN BROTHERS HOLDINGS INC. Management’s Discussion and Analysis of Financial Condition and Results of Operations
- 84 -
• The Company owns three bank entities: Lehman Brothers Bank, a U.S.-based thrift institution, Lehman Brothers Commercial Bank, a U.S.-based industrial bank, and Bankhaus, a German bank institution. These regulated bank entities operate in a deposit-protected environment and are able to source low-cost unsecured funds that are primarily term deposits. These bank entities are generally insulated from a company-specific or market liquidity event, thereby providing a reliable funding source for their mortgage products and selected loan assets and increasing consolidated funding diversification. At May 31, 2008, these bank entities had total assets of $46 billion compared with $44 billion at February 29, 2008 and November 30, 2007.
• Bank facilities provide the Company with further diversification and flexibility. For example, the Company draws on committed syndicated credit facilities described above on a regular basis (typically 25% to 50% of the time on a weighted-average basis) to provide the Company with additional sources of long-term funding on an as-needed basis. The Company has the ability to prepay and redraw any number of times and to retain the proceeds for any term up to the maturity date of the facility. As a result, the Company views these facilities as having the same liquidity value as long-term borrowings with the same maturity dates, and the Company includes these borrowings in reported long-term borrowings at the facility’s stated final maturity date to the extent that they are outstanding as of a reporting date.
• In March 2008, the Federal Reserve announced that the Federal Reserve Bank of New York has been granted the authority to establish a Primary Dealer Credit Facility (“PDCF”). The PDCF is an overnight loan facility that provides funding to primary dealers in exchange for a broad range of investment-grade debt securities and is intended to foster the functioning of financial markets more generally. The facility was originally established for at least six months and may be extended by the Federal Reserve beyond September 2008 as conditions warrant. The Company’s registered broker-dealer subsidiary, Lehman Brothers Inc. (“LBI”), may at times use the PDCF as an additional source of secured funding. During the second quarter of 2008, LBI accessed the PDCF on seven occasions for operational testing purposes, the last of which was on April 16, 2008.
Secured Funding. Liquid securities are typically funded on a secured basis – generally through tri-party repurchase agreements, in which a custodian bank or clearing organization acts as an intermediary between the Company and its funding counterparties. The Company’s tri-party repurchase agreements stood at $188 billion at May 31, 2008, compared with $230 billion at February 29, 2008 and $230 billion at November 30, 2007. Excluding government and agency securities, for which there exists a very liquid secured funding market, the Company’s tri-party repurchase agreements stood at $105 billion at May 31, 2008, compared with $115 billion at February 29, 2008 and $111 billion at November 30, 2007.
The main liquidity risk associated with the secured funding of non-government, non-agency securities is a reduction in borrowing availability. To mitigate this risk, the Company has put in place a four-pronged strategy:
• Selecting reliable funding counterparties (i.e., counterparties with which the Company has broad and long-established relationships and which are very familiar with the asset classes that they fund).
• Seeking term funding whenever possible. The average remaining maturity of the Company’s tri-party repurchase agreements, excluding government and agency securities, was 35 days at May 31, 2008, compared with 22 days at February 29, 2008 and 27 days at November 30, 2007. Excluding securities that can be pledged to central banks, the average remaining maturity of the Company’s tri-party repurchase agreements was over 40 days at May 31, 2008.
• Overfunding (i.e., the Company has secured funding capacity in excess of firm and client positions, filling the gap by substituting treasury and agency securities in the U.S. and borrowing in securities in Europe). This gives the Company the ability to absorb adverse changes in secured funding capacity in times of stress by reducing total collateral borrowed in or reallocating the higher quality, easy to fund treasury or agency securities, outside these facilities as necessary. Overfunding was approximately $27 billion at May 31, 2008. This is not included as part of the Company’s liquidity pool.
• As a last resort, using the liquidity pool available to the Company to mitigate the loss of secured funding capacity. Of the Company’s tri-party repurchase agreements of $105 billion, excluding government and agency securities:
o Approximately $40 billion consists of central bank eligible securities that are of a high quality and have the potential to be placed within the market.
o Of the remaining $65 billion, $25 billion is funding other, high quality, investment grade fixed income

LEHMAN BROTHERS HOLDINGS INC. Management’s Discussion and Analysis of Financial Condition and Results of Operations
- 85 -
securities and major index equities, for which there exists a very active, reliable and liquid secured funding market and a further $8 billion of assets are funded within our own bank entities.
o A loss of repo capacity on the remaining $32 billion may be mitigated by the liquidity pool available to the Company.
Scenario Analysis and Stress Testing. The Company performs regular stress testing and scenario analysis to assess the impact of various stressed liquidity events on the Company’s liquidity. The Company’s scenarios cover periods of between one month and one year. The Company assumes in all of its scenarios that a normal trading environment continues to exist but takes the immediate impact of a disruption in secured funding markets into account when determining the amount of assets to be funded.
Most of the Company’s scenarios assume complete disruption of unsecured funding markets (i.e., the inability to issue new unsecured debt, and a significant disruption of the secured funding markets, which is several orders of magnitude greater than what the Company experienced in March 2008. The Company also assumes multi-notch rating downgrades, draws on unfunded commitments and withdrawal of excess cash by its clients. The Company mitigates these cash outflows through its liquidity pools and draws on its committed facilities and optimizes funding across legal entities to the extent possible.
Funding action plan. The Company has developed and regularly updates a funding action plan, which represents a detailed action plan to manage a stress liquidity event, including a communication plan for regulators, creditors, investors and clients.
Legal entity structure. The Company’s legal entity structure can constrain liquidity available to Holdings. Some of the legal entities, particularly the Company’s regulated broker-dealers and bank entities are restricted in the amount of funds that they can distribute or lend to Holdings. For a further discussion, see Note 12, “Regulatory Requirements,” to the Consolidated Financial Statements.
Certain regulated subsidiaries are funded with subordinated debt issuances and/or subordinated loans from Holdings, which are counted as regulatory capital for those subsidiaries. The Company’s policy is to fund subordinated debt advances by Holdings to subsidiaries for use as regulatory capital with long-term debt issued by Holdings having a maturity at least one year greater than the maturity of the subordinated debt advance.
Credit Ratings
Like other companies in the securities industry, the Company relies on external sources to finance a significant portion of the Company’s day-to-day operations. The cost and availability of unsecured financing are affected by the Company’s short-term and long-term credit ratings. Factors that may be significant to the determination of credit ratings or otherwise affect the Company’s ability to raise short-term and long-term financing include the Company’s profit margin, earnings trend and volatility, cash liquidity and liquidity management, capital structure, risk level and risk management, geographic and business diversification, and relative positions in the markets in which the Company operates. Deterioration in any of these factors or combination of these factors may lead rating agencies to downgrade the Company’s credit ratings. This may increase the cost of, or possibly limit access to, certain types of unsecured financings and trigger additional collateral requirements in derivative contracts and other secured funding arrangements. In addition, debt ratings can affect certain capital markets revenues, particularly in those businesses where longer-term counterparty performance is critical, such as OTC derivative transactions, including credit derivatives and interest rate swaps.
At May 31, 2008, the ratings of Holdings’ and LBI’s, a wholly owned subsidiary of the Company and a registered broker-dealer, short- and long-term senior borrowings were as follows:
Credit Ratings Holdings LBI
Short-term Long-term Short-term Long-term
Standard & Poor’s Ratings Services A-1 A+ A-1+ AA-
Moody’s Investors Service P-1 A1 P-1 Aa3
Fitch Ratings F1+ AA- F1+ AA-
Dominion Bond Rating Service Limited R-1 (middle) AA (low) R-1 (middle) AA
At May 31, 2008, counterparties had the right to require the Company to post additional collateral pursuant to derivative contracts and other secured funding arrangements of approximately $3.1 billion.
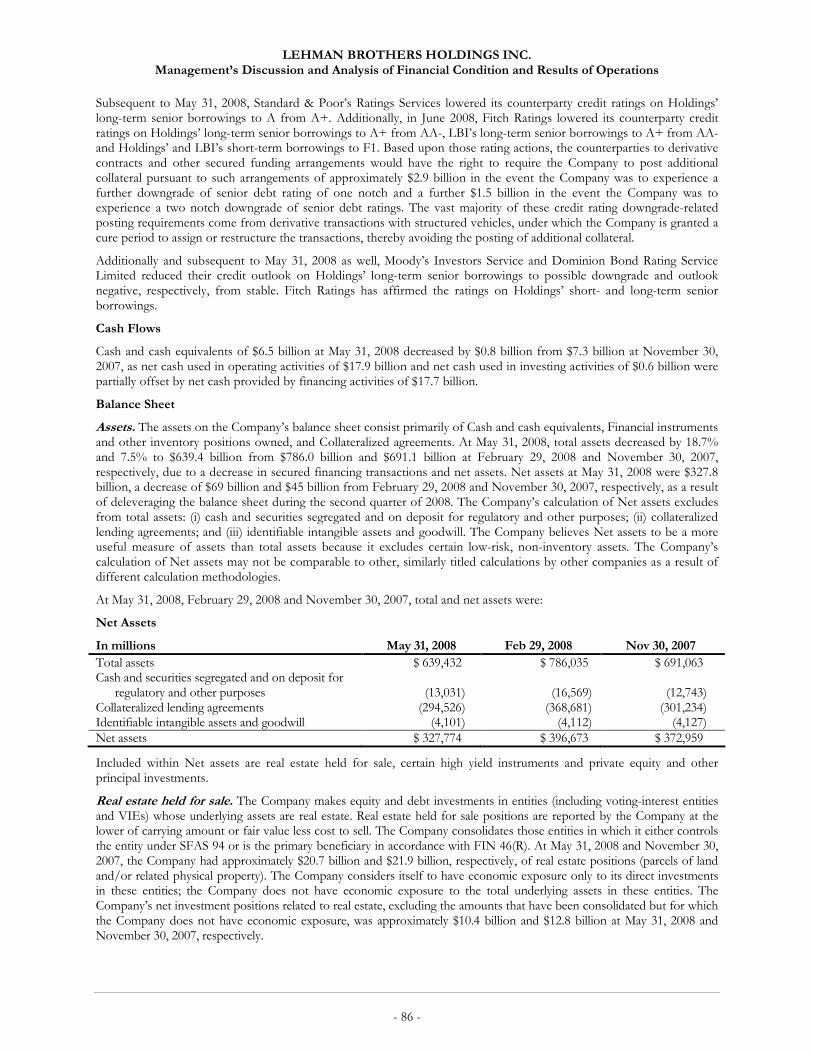
LEHMAN BROTHERS HOLDINGS INC. Management’s Discussion and Analysis of Financial Condition and Results of Operations
- 86 -
Subsequent to May 31, 2008, Standard & Poor’s Ratings Services lowered its counterparty credit ratings on Holdings’ long-term senior borrowings to A from A+. Additionally, in June 2008, Fitch Ratings lowered its counterparty credit ratings on Holdings’ long-term senior borrowings to A+ from AA-, LBI’s long-term senior borrowings to A+ from AA- and Holdings’ and LBI’s short-term borrowings to F1. Based upon those rating actions, the counterparties to derivative contracts and other secured funding arrangements would have the right to require the Company to post additional collateral pursuant to such arrangements of approximately $2.9 billion in the event the Company was to experience a further downgrade of senior debt rating of one notch and a further $1.5 billion in the event the Company was to experience a two notch downgrade of senior debt ratings. The vast majority of these credit rating downgrade-related posting requirements come from derivative transactions with structured vehicles, under which the Company is granted a cure period to assign or restructure the transactions, thereby avoiding the posting of additional collateral.
Additionally and subsequent to May 31, 2008 as well, Moody’s Investors Service and Dominion Bond Rating Service Limited reduced their credit outlook on Holdings’ long-term senior borrowings to possible downgrade and outlook negative, respectively, from stable. Fitch Ratings has affirmed the ratings on Holdings’ short- and long-term senior borrowings.
Cash Flows
Cash and cash equivalents of $6.5 billion at May 31, 2008 decreased by $0.8 billion from $7.3 billion at November 30, 2007, as net cash used in operating activities of $17.9 billion and net cash used in investing activities of $0.6 billion were partially offset by net cash provided by financing activities of $17.7 billion.
Balance Sheet
Assets. The assets on the Company’s balance sheet consist primarily of Cash and cash equivalents, Financial instruments and other inventory positions owned, and Collateralized agreements. At May 31, 2008, total assets decreased by 18.7% and 7.5% to $639.4 billion from $786.0 billion and $691.1 billion at February 29, 2008 and November 30, 2007, respectively, due to a decrease in secured financing transactions and net assets. Net assets at May 31, 2008 were $327.8 billion, a decrease of $69 billion and $45 billion from February 29, 2008 and November 30, 2007, respectively, as a result of deleveraging the balance sheet during the second quarter of 2008. The Company’s calculation of Net assets excludes from total assets: (i) cash and securities segregated and on deposit for regulatory and other purposes; (ii) collateralized lending agreements; and (iii) identifiable intangible assets and goodwill. The Company believes Net assets to be a more useful measure of assets than total assets because it excludes certain low-risk, non-inventory assets. The Company’s calculation of Net assets may not be comparable to other, similarly titled calculations by other companies as a result of different calculation methodologies.
At May 31, 2008, February 29, 2008 and November 30, 2007, total and net assets were:
Net Assets
In millions May 31, 2008 Feb 29, 2008 Nov 30, 2007
Total assets $ 639,432 $ 786,035 $ 691,063 Cash and securities segregated and on deposit for regulatory and other purposes (13,031) (16,569) (12,743) Collateralized lending agreements (294,526) (368,681) (301,234) Identifiable intangible assets and goodwill (4,101) (4,112) (4,127) Net assets $ 327,774 $ 396,673 $ 372,959
Included within Net assets are real estate held for sale, certain high yield instruments and private equity and other principal investments.
Real estate held for sale. The Company makes equity and debt investments in entities (including voting-interest entities and VIEs) whose underlying assets are real estate. Real estate held for sale positions are reported by the Company at the lower of carrying amount or fair value less cost to sell. The Company consolidates those entities in which it either controls the entity under SFAS 94 or is the primary beneficiary in accordance with FIN 46(R). At May 31, 2008 and November 30, 2007, the Company had approximately $20.7 billion and $21.9 billion, respectively, of real estate positions (parcels of land and/or related physical property). The Company considers itself to have economic exposure only to its direct investments in these entities; the Company does not have economic exposure to the total underlying assets in these entities. The Company’s net investment positions related to real estate, excluding the amounts that have been consolidated but for which the Company does not have economic exposure, was approximately $10.4 billion and $12.8 billion at May 31, 2008 and November 30, 2007, respectively.

LEHMAN BROTHERS HOLDINGS INC. Management’s Discussion and Analysis of Financial Condition and Results of Operations
- 87 -
At May 31, 2008, the Company held approximately $2.6 billion of real estate-related positions that did not qualify as held for sale pursuant to SFAS No. 144, Accounting for the Impairment or Disposal of Long-Lived Assets. Accordingly, the Company recorded accumulated depreciation expense of approximately $80 million in the second quarter of 2008 for these assets. This expense represents the cumulative depreciation for those positions since their inception through May 31, 2008. This amount is a component of Other non-interest expenses in the Consolidated Statement of Income. These positions are reported by the Company at the lower of carrying amount or fair value less cost to sell. Of the approximately $2.6 billion, the amount that has been consolidated but for which the Company does not have economic exposure, was approximately $0.9 billion at May 31, 2008. Of the approximately $80 million of accumulated depreciation expense, approximately $32 million related to the $0.9 billion for which the Company does not have economic exposure.
High yield instruments. The Company underwrites, syndicates, invests in and makes markets in high yield corporate debt securities and loans. The Company defines high yield instruments as securities of or loans to companies rated BB+ or lower or equivalent ratings by recognized rating agencies, as well as non-rated securities or loans that, in management’s opinion, are non-investment grade. High yield debt instruments generally involve greater risks than investment grade instruments and loans due to the issuer’s creditworthiness and the lower liquidity of the market for such instruments. In addition, these issuers generally have relatively higher levels of indebtedness resulting in an increased sensitivity to adverse economic conditions. The Company seeks to reduce these risks through active hedging strategies and through the diversification of products and counterparties.
High yield instruments are carried at fair value, with unrealized gains and losses reflected in Principal transactions in the Consolidated Statement of Income. The Company mitigates aggregate and single-issuer net exposure through the use of derivatives, non-recourse financing and other financial instruments. High yield instruments at May 31, 2008, February 29, 2008 and November 30, 2007 were as follows:
In millions May 31, 2008 Feb 29, 2008 Nov 30, 2007
Bonds and loans in established trading markets $22,641 $29,893 $32,490 Bonds and loans held awaiting securitization and/or syndication — 47 157 Bonds and loans with little or no pricing transparency 1,215 958 1,118 High yield instruments 23,856 30,898 33,765 Credit risk hedges(1) (1,201) (1,629) (2,337) High yield position, net $22,655 $29,269 $31,428
(1) Credit risk hedges represent financial instruments with offsetting risk to the same underlying counterparty, but exclude other credit and market risk mitigants which are highly correlated, such as index, basket and/or sector hedges.
Private equity and other principal investments. The Company’s Private Equity business operates in six major asset classes: Merchant Banking, Real Estate, Venture Capital, Credit-Related Investments, Private Funds Investments and Infrastructure. The Company has raised privately-placed funds in these asset classes, for which the Company acts as a general partner and in which the Company has general and in many cases limited partner interests. In addition, the Company generally co-invests in the investments made by the funds or may make other non-fund-related direct investments. At May 31, 2008, February 29, 2008 and November 30, 2007, private equity related investments totaled $4.4 billion, $5.0 billion and $4.2 billion, respectively. The real estate industry represented the highest concentrations at 41%, 47% and 41% at May 31, 2008, February 29, 2008 and November 30, 2007, respectively, and the largest single investment was approximately $0.3 billion at all three periods.
Private equity investments are measured at fair value based on an assessment of each underlying investment, incorporating valuations that consider expected cash flows, earnings multiples and/or comparisons to similar market transactions, among other factors. Valuation adjustments, which usually involve the use of significant management estimates, are an integral part of pricing these instruments, reflecting consideration of credit quality, concentration risk, sale restrictions and other liquidity factors. For additional information about private equity and other principal investment activities, including related commitments, see Note 8, “Commitments, Contingencies and Guarantees,” to the Consolidated Financial Statements.
Equity Management
The management of equity is a critical aspect of capital management. Determining the appropriate amount of the Company’s equity capital base is dependent on a number of variables, including the amount of equity needed given the Company’s estimation of risk in business activities, the capital required by laws or regulations, and credit rating agencies’ perspectives of capital sufficiency.
The Company continuously evaluates the use of equity with the objective of maximizing shareholder value. In periods where the Company determines levels of equity to be beyond those necessary to support the Company’s business

LEHMAN BROTHERS HOLDINGS INC. Management’s Discussion and Analysis of Financial Condition and Results of Operations
- 88 -
activities, the Company may return capital to shareholders through dividend payments or stock repurchases.
The Company maintains a common stock repurchase program to manage equity capital. In January 2008, the Company’s Board of Directors authorized the repurchase, subject to market conditions, of up to 100 million shares of Holdings’ common stock for the management of equity capital, including consideration of dilution due to employee stock awards. This resolution supersedes the stock repurchase program authorized in 2007. The stock repurchase program is effected principally through open-market purchases, as well as through employee transactions where employees tender shares of common stock to pay for the exercise price of stock options and the required tax withholding obligations upon option exercises and conversion of restricted stock units (“RSUs”) to freely-tradable common stock.
Over the course of the past six months, the Company repurchased through open-market purchases, structured derivative trades or withheld from employees for the purposes described above approximately 15.6 million shares of common stock at an aggregate cost of approximately $0.9 billion, or $55.82 per share. During the past six months, the Company issued 7.4 million shares resulting from employee stock option exercises and another 28.8 million shares were issued out of treasury stock to an irrevocable grantor trust that holds shares for issuance to employees in satisfaction of RSUs granted under the Firm’s equity compensation plans.
The Company entered into a structured derivative share-buyback trade in December 2007 that was completed in February 2008. The Company delivered cash consideration to the counterparty upon entering the transaction. The counterparty’s obligation under each tranche of the transaction was dependent on Holdings’ stock price at the end of the transaction. If, in respect of any tranche, Holdings’ stock price was greater than a benchmark price, the counterparty was obligated to remit payment for the benchmark price. If Holdings’ stock price was less than the benchmark price, the counterparty was obligated to deliver shares of Holdings’ common stock to the Company. The net effect of the transaction to the Company was a purchase of 1,000,000 shares of Holdings’ common stock and receipt of payment from the counterparty.
For a further discussion of the Company’s equity issuances in June 2008, specifically, the $4.0 billion public offering of 143 million shares of common stock and 2.0 million shares of 8.75% Non-Cumulative Mandatory Convertible Preferred Stock, Series Q, see Note 14, “Subsequent Events” to the Consolidated Financial Statements.
Capital Ratios
Leverage Ratios. The relationship of assets to equity is one measure of a company’s capital adequacy. Generally, this leverage ratio is computed by dividing assets by stockholders’ equity. The Company believes that a more meaningful, comparative ratio for companies in the securities industry is net leverage, which is the result of net assets divided by tangible equity capital.
The Company’s net leverage ratio is calculated as net assets divided by tangible equity capital. The Company calculates net assets by excluding from total assets: (i) cash and securities segregated and on deposit for regulatory and other purposes; (ii) collateralized lending agreements; and (iii) identifiable intangible assets and goodwill. The Company believes net leverage based on net assets to be a more useful measure of leverage, because it excludes certain low-risk, non-inventory assets and utilizes tangible equity capital as a measure of equity base. The Company calculates tangible equity capital by including stockholders’ equity and junior subordinated notes and excluding identifiable intangible assets and goodwill. The Company believes tangible equity capital to be a more meaningful measure of equity base for purposes of calculating net leverage because it includes instruments the Company considers to be equity-like and excludes identifiable intangible assets and goodwill because the Company does not view equity used to support those intangible assets and goodwill as available to support remaining net assets. The Company considers junior subordinated notes, generally debt instruments issued to trusts, to be a component of its tangible equity capital base due to certain characteristics of the debt, including its long-term nature, the Company’s ability to defer payments due on the debt and the subordinated nature of the debt in the Company’s equity structure. Junior subordinated notes qualify as regulatory capital for purposes of regulatory reporting as a consolidated supervised entity (“CSE”). Measures of net assets and tangible equity capital may not be comparable to other similarly titled calculations by other companies as a result of different calculation methodologies.

LEHMAN BROTHERS HOLDINGS INC. Management’s Discussion and Analysis of Financial Condition and Results of Operations
- 89 -
Tangible Equity Capital and Capital Ratios
In millions May 31, 2008 Feb 29, 2008 Nov 30, 2007
Total stockholders’ equity $ 26,276 $ 24,832 $ 22,490 Junior subordinated notes (1), (2) 5,004 4,976 4,740 Identifiable intangible assets and goodwill (4,101) (4,112) (4,127) Tangible equity capital $ 27,179 $25,696 $ 23,103 Total assets $ 639,432 $ 786,035 $ 691,063 Leverage ratio 24.34x 31.65x 30.73x Net assets $ 327,774 $ 396,673 $ 372,959 Net leverage ratio 12.06x 15.44x 16.14x
(1) See Note 7, “Borrowings and Deposit Liabilities,” to the Consolidated Financial Statements.
(2) At November 30, 2007, the Company excluded approximately $237 million of junior subordinated notes issued to trusts or limited partnerships.
The table above does not reflect the impact of the issuance of $4.0 billion of common stock and of $2.0 billion of 8.75% Non-Cumulative Mandatory Convertible Preferred Stock, Series Q, on June 12, 2008. On a pro forma basis including those equity issuances, the Company’s leverage ratio and net leverage ratio would have been 20.00x and 10.06x, respectively.
Included below are the changes in tangible equity capital at May 31, 2008, February 29, 2008 and November 30, 2007:
Tangible Equity Capital
Three Months Ended Year Ended In millions May 31, 2008 Feb 29, 2008 Nov 30, 2007
Beginning tangible equity capital $25,696 $23,103 $18,567 Net income (2,774) 489 4,192 Dividends on common stock (105) (106) (351) Dividends on preferred stock (99) (24) (67) Common stock open-market repurchases (68) (697) (2,605) Common stock withheld from employees (1) (40) (69) (573) Equity-based award plans (2) 534 1,086 2,829 Issuance of preferred stock, net of issuance cost 4,000 1,856 — Net change in junior subordinated notes included in tangible equity (3) 28 236 2,002 Change in identifiable intangible assets and goodwill 11 15 (765) Other, net (4) (4) (193) (126) Ending tangible equity capital $27,179 $25,696 $23,103
(1) Represents shares of common stock withheld in satisfaction of the exercise price of stock options and tax withholding obligations upon option exercises and conversion of RSUs.
(2) This represents the sum of (i) proceeds received from employees upon the exercise of stock options, (ii) the incremental tax benefits from the issuance of stock-based awards, and (iii) the value of employee services received, as represented by the amortization of deferred stock compensation.
(3) Junior subordinated notes are deeply subordinated and have a long-term maturity and interest deferral features and are utilized in calculating equity capital by leading rating agencies. Junior subordinated notes qualify as regulatory capital for CSE purposes.
(4) Other, net for the quarter ended February 29, 2008 includes a $178 million decrease to retained earnings from the adoption of FIN No. 48, Accounting for Uncertainty in Income Taxes, an Interpretation of FASB Statement No. 109 (“FIN 48”). Other, net for the year ended November 30, 2007 includes a $67 million net increase to Retained earnings from the adoption of SFAS 157 and SFAS 159 and a $210 million decrease to Accumulated other comprehensive income/(loss) from the adoption of SFAS No. 158, Employers’ Accounting for Defined Benefit Pension and Other Retirement Plans (“SFAS 158”). See “Accounting and Regulatory Developments” below for additional information.
Primary Equity Double Leverage. Primary equity double leverage ratio is the comparison of Holdings’ equity investments in subsidiaries to total equity capital (the sum of total stockholders’ equity and junior subordinated notes). As of May 31, 2008, equity investment in subsidiaries was $24.1 billion and total equity capital was $31.3 billion. The Company aims to maintain a primary equity double leverage ratio of 1.0x or below. The Company’s primary equity double leverage ratio was 0.77x and 0.91x as of May 31, 2008 and November 30, 2007, respectively. The Company believes total equity capital to be a more meaningful measure of equity than stockholders’ equity because the Company considers junior subordinated notes to be equity-like due to their subordinated nature, long-term maturity and interest deferral features. The Company believes primary equity double leverage based on total equity capital to be a useful measure of equity investments in subsidiaries. The Company’s calculation of primary equity double leverage may not be comparable to other similarly titled calculations by other companies as a result of different calculation methodologies.

LEHMAN BROTHERS HOLDINGS INC. Management’s Discussion and Analysis of Financial Condition and Results of Operations
- 90 -
For a further discussion of the Company’s regulatory capital ratios, see “CSE Regulatory Capital” in this MD&A.
Lending-Related Commitments
The following table summarizes the contractual amounts of lending-related commitments at May 31, 2008 and November 30, 2007:
Total Contractual Expiration per Period at May 31, 2008 Amount 2010- 2012-
In millions 2008 2009 2011 2013 Later
May 31, 2008
Nov 30, 2007
Lending commitments High grade (1) $ 4,569 $ 4,757 $ 5,589 $ 11,202 $ 479 $ 26,596 $ 23,986 High yield (2) 2,858 286 1,110 3,245 912 8,411 14,420 Contingent acquisition facilities High grade 905 767 — — — 1,672 10,230 High yield 425 — — — — 425 9,749 Mortgage commitments 713 326 959 277 21 2,296 7,449 Secured lending transactions 75,299 4,135 1,292 329 398 81,453 124,565
(1) The Company views its net credit exposure for high grade commitments, after consideration of hedges, to be $19.8 billion and $12.2 billion at May 31, 2008 and November 30, 2007, respectively.
(2) The Company views its net credit exposure for high yield commitments, after consideration of hedges, to be $7.6 billion and $13.1 billion at May 31, 2008 and November 30, 2007, respectively.
The Company uses various hedging and funding strategies to actively manage market, credit and liquidity exposures on these commitments. The Company does not believe total commitments necessarily are indicative of actual risk or funding requirements because the commitments may not be drawn or fully used and such amounts are reported before consideration of hedges.
Lending commitments. Through the Company’s high grade (investment grade) and high yield (non-investment grade) sales, trading and underwriting activities, commitments are made to extend credit in loan syndication transactions. These commitments and any related draw downs of these facilities typically have fixed maturity dates and are contingent on certain representations, warranties and contractual conditions applicable to the borrower. High yield exposures are defined as securities of or loans to companies rated BB+ or lower or equivalent ratings by recognized credit rating agencies, as well as non-rated securities or loans that, in management’s opinion, are non-investment grade.
The Company had commitments to high grade borrowers at May 31, 2008 and November 30, 2007 of $26.6 billion (net credit exposure of $19.8 billion, after consideration of hedges) and $24.0 billion (net credit exposure of $12.2 billion, after consideration of hedges), respectively. The Company had commitments to high yield borrowers of $8.4 billion (net credit exposure of $7.6 billion, after consideration of hedges) and $14.4 billion (net credit exposure of $13.1 billion, after consideration of hedges) at May 31, 2008 and November 30, 2007, respectively.
Contingent acquisition facilities. The Company provides contingent commitments to investment and non-investment grade counterparties related to acquisition financing. The Company does not believe contingent acquisition commitments are necessarily indicative of actual risk or funding requirements as funding is dependent upon both a proposed transaction being completed and the acquiror fully utilizing the commitment. Typically, these commitments are made to a potential acquiror in a proposed acquisition, which may or may not be completed depending on whether the potential acquiror to whom the commitment was made is successful. A contingent borrower’s ability to draw on the commitment is typically subject to there being no material adverse change in the borrower’s financial condition, among other factors, and the commitments also generally contain certain flexible pricing features to adjust for changing market conditions prior to closing. In addition, acquirors generally utilize multiple financing sources, including other investment and commercial banks, as well as accessing the general capital markets for completing transactions. Therefore, contingent acquisition commitments are generally greater than the amounts the Company ultimately expects to fund. Further, past practice, consistent with the Company’s credit facilitation framework, has been to syndicate acquisition financings to investors. The ultimate timing, amount and pricing of syndication, however, is influenced by market conditions that may not necessarily be consistent with those at the time the commitment was entered. The Company provided contingent commitments to high grade counterparties related to acquisition financing of approximately $1.7 billion and $10.2 billion at May 31, 2008 and November 30, 2007, respectively, and to high yield counterparties related to acquisition financing of approximately $0.4 billion and $9.7 billion at May 31, 2008 and November 30, 2007, respectively.

LEHMAN BROTHERS HOLDINGS INC. Management’s Discussion and Analysis of Financial Condition and Results of Operations
- 91 -
Mortgage commitments. Through the Company’s mortgage origination platforms, commitments are made to extend mortgage loans. At May 31, 2008 and November 30, 2007, outstanding mortgage commitments were approximately $2.3 billion and $7.4 billion, respectively. These commitments included $0.5 billion and $3.0 billion of residential mortgages and $1.8 billion and $4.4 billion of commercial mortgages at May 31, 2008 and November 30, 2007, respectively. Typically, residential mortgage loan commitments require us to originate mortgage loans at the option of a borrower, generally within 90 days at fixed interest rates. Consistent with past practice, the Company’s intention is to sell residential mortgage loans, once originated, primarily through securitizations. The ability to sell or securitize mortgage loans, however, is dependent on market conditions.
Secured lending transactions. In connection with financing activities, the Company had outstanding commitments under certain collateralized lending arrangements of approximately $5.1 billion and $8.5 billion at May 31, 2008 and November 30, 2007, respectively. These commitments require borrowers to provide acceptable collateral, as defined in the agreements, when amounts are drawn under the lending facilities. Advances made under these lending arrangements typically are at variable interest rates and generally provide for over-collateralization. In addition, at May 31, 2008, the Company had commitments to enter into forward starting secured resale and repurchase agreements, primarily secured by government and government agency collateral, of $48.4 billion and $28.0 billion, respectively, compared to $70.8 billion and $45.3 billion, respectively, at November 30, 2007.
For additional information about lending-related commitments, see Note 8, “Commitments, Contingencies and Guarantees,” to the Consolidated Financial Statements.
Off-Balance-Sheet Arrangements
In the normal course of business the Company engages in a variety of off-balance-sheet arrangements, including certain derivative contracts meeting the FIN No. 45, Guarantor’s Accounting and Disclosure Requirements for Guarantees, Including Indirect Guarantees of Indebtedness of Others (“FIN 45”), definition of a guarantee that may require future payments. Other than lending-related commitments already discussed above in “Lending-Related Commitments,” the following table summarizes off-balance-sheet arrangements at May 31, 2008 and November 30, 2007:
Total Contractual Expiration per Period at May 31, 2008 Amount 2010- 2012-
In millions 2008 2009 2011 2013 Later
May 31, 2008
Nov 30, 2007
Derivative contracts (1) $114,188 $77,117 $119,404 $195,271 $223,363 $729,343 $737,937 Municipal-securities-related commitments 333 1,002 221 220 4,196 5,972 6,902 Other commitments with variable interest entities 25 1,343 170 997 7,000 9,535 10,405 Standby letters of credit 1,538 371 2 — — 1,911 1,690 Private equity and other principal investments 2,181 814 1,107 171 — 4,273 2,583
(1) The Company believes the fair value of these derivative contracts is a more relevant measure of these obligations because the Company believes the notional amount overstates the expected payout. At May 31, 2008 and November 30, 2007, the fair value of these derivative contracts approximated $16.6 billion and $36.8 billion, respectively.
In accordance with FIN 45, the table above includes only certain derivative contracts meeting the FIN 45 definition of a guarantee. For additional information on these guarantees and other off-balance-sheet arrangements, see Note 8 “Commitments, Contingencies and Guarantees,” to the Consolidated Financial Statements.
Derivatives
Neither derivatives’ notional amounts nor underlying instrument values are reflected as assets or liabilities in the Consolidated Statement of Financial Condition. Rather, the market, or fair values, related to derivative transactions are reported in the Consolidated Statement of Financial Condition as assets or liabilities in Derivatives and other contractual agreements, as applicable. Derivatives are presented on a net-by-counterparty basis when a legal right of offset exists, on a net-by-cross product basis when applicable provisions are stated in a master netting agreement; and/or on a net of cash collateral received or paid on a counterparty basis, provided a legal right of offset exists.
The Company enters into derivative transactions both in a trading capacity and as an end-user. Acting in a trading capacity, the Company enters into derivative transactions to satisfy the needs of its clients and to manage the Company’s exposure to market and credit risks resulting from its trading activities.

LEHMAN BROTHERS HOLDINGS INC. Management’s Discussion and Analysis of Financial Condition and Results of Operations
- 92 -
As an end-user, the Company primarily uses derivatives to hedge exposure to market risk (including foreign currency exchange and interest rate risks) and credit risks. When these end-user derivatives are interest rate swaps they are measured at fair value through earnings and the carrying value of the related hedged item is adjusted through earnings for the effect of changes in the fair value of the risk being hedged. The hedge ineffectiveness in these relationships is recorded in Interest expense in the Consolidated Statement of Income. When end-user derivatives are used in hedges of net investments in non-U.S. dollar functional currency subsidiaries, the gains or losses are reported within Accumulated other comprehensive income/(loss), net of tax, in Stockholders’ equity.
The Company conducts derivative activities through a number of wholly-owned subsidiaries. The Company’s fixed income derivative products business is principally conducted through Lehman Brothers Special Financing Inc., and separately capitalized “AAA” rated subsidiaries, Lehman Brothers Financial Products Inc. and Lehman Brothers Derivative Products Inc. The Company’s equity derivative products business is conducted through Lehman Brothers Finance S.A. and Lehman Brothers OTC Derivatives Inc. The Company’s commodity and energy derivatives product business is conducted through Lehman Brothers Commodity Services Inc. In addition, as a global investment bank, the Company also is a market maker in a number of foreign currencies. Counterparties to the Company’s derivative product transactions primarily are U.S. and foreign banks, securities firms, corporations, governments and their agencies, finance companies, insurance companies, investment companies and pension funds. The Company manages risks associated with derivatives on an aggregate basis, along with the risks associated with non-derivative trading and market-making activities in cash instruments, as part of the Company’s risk management policies. The Company uses industry standard derivative contracts whenever appropriate.
For additional information about accounting policies and trading-related and end-user derivative activities, see Note 1, “Summary of Significant Accounting Policies,” and Note 3, “Financial Instruments and Other Inventory Positions,” to the Consolidated Financial Statements.
Special Purpose Entities
The Company enters into various transactions with special purpose entities (“SPEs”). SPEs may be corporations, trusts or partnerships that are established for a limited purpose. There are two types of SPEs: QSPEs and VIEs.
A QSPE generally can be described as an entity whose permitted activities are limited to passively holding financial assets and distributing cash flows to investors based on pre-set terms. The Company’s primary involvement with QSPEs relates to securitization transactions in which transferred assets, including mortgages, loans, receivables and other financial assets, are sold to an SPE that qualifies as a QSPE under SFAS 140. In accordance with SFAS 140 and FIN46(R), the Company does not consolidate QSPEs. The Company recognizes at fair value the interests the Company holds in the QSPEs. The Company derecognizes financial assets transferred to QSPEs, provided the Company has surrendered control over the assets.
Certain SPEs do not meet the QSPE criteria because their permitted activities are not limited sufficiently or the assets are non-qualifying financial instruments (e.g., real estate). These SPEs are referred to as VIEs, and the Company typically uses them to create securities with a unique risk profile desired by investors to intermediate financial risk or to invest in real estate. Examples of the Company’s involvement with VIEs include collateralized debt obligations, synthetic credit transactions, real estate investments through VIEs, and other structured financing transactions. Under FIN 46(R), the Company consolidates a VIE if the Company is the primary beneficiary of the entity. The primary beneficiary is the party that either (i) absorbs a majority of the VIEs expected losses; (ii) receives a majority of the VIEs expected residual returns; or (iii) both.
For a further discussion of consolidation policies, see “Critical Accounting Policies and Estimates—Consolidation Policies” in this MD&A. For a further discussion of securitization activities and involvement with VIEs, see Note 6, “Securitizations and Special Purpose Entities,” to the Consolidated Financial Statements.
Conduits
Conduits are entities established to convey financing. They are thinly capitalized SPE structures established on behalf of a sponsor or sponsors that purchase assets usually from multiple parties, funding those purchases by issuing commercial paper. Assets held in a conduit serve as collateral for the commercial paper issued by the conduit. The Company is a sponsor, guarantor, and/or liquidity and credit facility provider to certain conduits. Specifically:
• The Company makes certain liquidity commitments and guarantees to commercial paper conduits in support of certain clients’ secured financing transactions. These commitments and guarantees obligate the Company to provide liquidity to these conduits in the event the conduits cannot obtain funding in the market. However, the Company’s obligation is limited to the total amount required to fund clients’ assets in the conduit. At May 31, 2008 and November 30, 2007, the amount of these commitments was approximately $1.2 billion and $1.4

LEHMAN BROTHERS HOLDINGS INC. Management’s Discussion and Analysis of Financial Condition and Results of Operations
- 93 -
billion, respectively; however, actual risk to the Company is believed to be limited because these liquidity commitments are over-collateralized with investment grade collateral. For a further discussion, see Note 8, “Commitments, Contingencies and Guarantees—Other Commitments and Guarantees,” to the Consolidated Financial Statements.
• The Company provides limited downside protection guarantees to investors in certain VIEs. These guarantees may include a guaranteed return of the investors’ initial investment or of the investors’ initial investment plus an agreed upon return depending on the terms. At May 31, 2008 and November 30, 2007, these commitments were approximately $6.6 billion and $6.1 billion, respectively. The Company believes actual risk to be limited because the Company’s obligations are collateralized by the VIEs’ assets and contain significant constraints under which downside protection will be available (e.g., the VIE is required to liquidate assets in the event certain loss levels are triggered). For a further discussion, see Note 8, “Commitments, Contingencies and Guarantees—Other Commitments and Guarantees,” to the Consolidated Financial Statements.
• The Company participates in an A-1/P-1-rated multi-seller conduit. This multi-seller issues secured liquidity notes to provide financing. The Company uses this conduit for purposes of funding a portion of contingent acquisition commitments. At May 31, 2008, the Company had no contingent commitment to provide liquidity to this multi-seller conduit. At November 30, 2007, the Company was contingently committed to provide approximately $1.6 billion of liquidity if the conduit is unable to remarket the secured liquidity notes upon their maturity, generally, one year after a failed remarketing event. This conduit is consolidated in the Company’s results of operations. For a further discussion, see Note 8, “Commitments, Contingencies and Guarantees—Other Commitments and Guarantees,” to the Consolidated Financial Statements.
• Additionally, the Company has entered into agreements that obligate it to purchase commercial paper from VIEs. The commercial paper is purchased by the Company and delivered to clients for purposes of funding a debt service reserve. The Company obtains guaranteed investment contracts underwritten by insurance companies on these agreements. The guaranteed investment contracts allow the Company to stop the agreements in the event of a default by the client upon delivery of the commercial paper. At May 31, 2008 and November 30, 2007, the Company was committed to purchase $1.7 billion and $1.3 billion of commercial paper, respectively.
• The Company has established a $2.4 billion conduit that issues secured liquidity notes to pre-fund high grade loan commitments. The conduit’s obligations are fully backed by a triple-A rated, third-party, one-year revolving liquidity back stop, which the Company has, in turn, fully backed. This conduit is consolidated in the Company’s results of operations.
Risk Management
The Company’s goal is to realize returns from business commensurate with the risks assumed. The Company’s business activities have inherent risks that the Company monitors, evaluates and manages through a comprehensive risk management structure. These risks include market, credit, liquidity, operational and reputational exposures, among others.
The bases of risk control processes are:
• The Company establishes policies to document risk principles, risk capacity and tolerance levels.
• The Company monitors and enforces adherence to risk policies.
• The Company measures quantifiable risks using methodologies and models based on tested assumptions.
• The Company identifies emerging risks through monitoring portfolios, new business development, unusual or complex transactions and external events and market influences.
• The Company reports risks to stakeholders.
Risk Management Structure
While risk cannot be completely eliminated, the Company has designed an internal control environment to put appropriate risk mitigants in place. Control processes separate the duties of risk management from revenue generation and effect management oversight of the risk management function.

LEHMAN BROTHERS HOLDINGS INC. Management’s Discussion and Analysis of Financial Condition and Results of Operations
- 94 -
Overall risk limits and risk management policies, including establishment of risk tolerance levels, are determined by the Risk Committee. The Risk Committee, which includes management’s Executive Committee, the Global Head of Risk Management and certain other members of senior management, reviews risk exposures, position concentrations and risk-taking activities on a weekly basis, or more frequently as needed. The Company’s Risk Committee allocates the usage of capital to the businesses and establishes trading and credit limits for counterparties with a goal to maintain diversification of businesses, counterparties and geographic presence.
The Global Risk Management Division (the “Division”) is independent of revenue-generation but maintains a presence in regional trading centers as well as in key sales offices. The Division’s role is to assist in explaining risks and making them clear to management and others. The organization of the Division reflects the Company’s integrated approach to risk management, bringing together the skill sets of credit, market, quantitative, sovereign and operational risk management groups.
Market Risk
Market risk is the potential change to the market value of trading and investing positions. The Company assumes market risk in market-making, specialist, proprietary trading, investing and underwriting activities.
Market risk can result from changes in market variables, including:
• Changes in the level, slope or shape of yield curves (interest rates), widening or tightening of general spread levels (credit or credit-related spreads) and volatility of interest rates.
• Directional movements in prices and volatilities of individual equities, equity baskets and equity indices.
• Movement of domestic and foreign currency rates.
• Price movements of commodities such as electricity, natural gas and oil.
• Changes in asset valuations.
Responsibility for defining and monitoring market risk tolerance levels is that of the Company’s Market Risk Management Department (the “MRM Department”). Based upon the MRM Department’s established thresholds, management applies business judgment to mitigate these risks, managing risk exposures by diversifying portfolios, limiting position sizes and establishing economic hedges. Both the MRM Department and management also rely upon the Quantitative Risk Management Department (the “QRM Department”) to ensure that both quantifiable and unquantifiable risk is identified, assessed and managed.
Management and the MRM and QRM Departments use qualitative and quantitative risk measures and analyses such as sensitivity to changes in interest rates, prices, and implied volatilities. Stress testing, which measures the impact on the value of existing portfolios of specific changes in market factors for certain products, is performed with regularity. Scenario analyses, which estimate sensitivity to a set of predefined market and/or external events, are also conducted periodically. A statistical measure of the potential loss in the fair value of a portfolio due to adverse movements in underlying risk factors known as value-at-risk (“VaR”) is also used to monitor and manage market risk.
VaR. The Company estimates VaR using a model that simulates revenue and loss distributions on substantially all financial instruments in its portfolio by applying historical market changes to the current portfolio.
In a historical simulation VaR, portfolio positions have offsetting risk characteristics, referred to as diversification benefit. The Company measures the diversification benefit within its portfolio by historically simulating how the positions in its current portfolio would have behaved in relation to each other, as opposed to using a static estimate of a diversification benefit, which remains relatively constant from period to period. From time to time there will be changes in its historical simulation VaR due to changes in the diversification benefit across the Company’s portfolio of financial instruments.
VaR measures have inherent limitations including: historical market conditions and historical changes in market risk factors may not be accurate predictors of future market conditions or future market risk factors; VaR measurements are based on current positions, while future risk depends on future positions; and VaR based on a one-day measurement period does not fully capture the market risk of positions that cannot be liquidated or hedged within one day. VaR is not intended to capture worst case scenario losses and the Company could incur losses greater than the VaR amounts reported.
There is no uniform industry methodology for estimating VaR. Different assumptions concerning the number of risk factors; the duration of the time series; the weighting, if any, of risk factors against the time series and daily changes in

LEHMAN BROTHERS HOLDINGS INC. Management’s Discussion and Analysis of Financial Condition and Results of Operations
- 95 -
these risk factors, as well as different methodologies, could produce materially different results and therefore caution should be used when comparing VaR measures among comparable institutions.
To compute historical simulation VaR, the Company uses four years of historical data, weighted to give greater impact to more recent time periods, in simulating potential changes in market risk factors, and estimates the amount that its current portfolio could lose with a specified degree of confidence, over a given time interval. For the table below, a one-day time interval and a 95% confidence level were used. This means that there is a 1-in-20 chance that daily trading net revenue losses on a particular day would exceed the reported VaR.
VaR — Historical Simulation
Using the same four years of historical data, the following tables present historical simulation VaR on a weighted and un-weighted basis. In simulating potential changes in market risk factors and estimating the amount that the Company’s current portfolio could lose with a specified degree of confidence, the weighted VaR calculation gives greater impact to more recent time periods and the un-weighted VaR calculation gives equal impact to the four year time period.
On a weighted basis:
Average VaR Three Months Ended At Three Months Ended May 31, 2008
May 31, Feb 29, Nov 30, May 31, Feb 29, Nov 30, In millions 2008 2008 2007 2008 2008 2007 High Low
Interest rate risk $ 88 $ 90 $ 96 $109 $103 $ 89 $127 $ 87 Equity price risk 41 43 50 46 49 51 61 32 Foreign exchange risk 10 14 11 13 13 10 16 9 Commodity risk 12 11 13 12 13 11 16 9 Diversification benefit (47) (52) (46) (57) (48) (37) $104 $106 $ 124 $123 $130 $ 124 $140 $103
On an un-weighted basis:
Average VaR Three Months Ended At Three Months Ended May 31, 2008 May 31, Feb 29, Nov 30, May 31, Feb 29, Nov 30, In millions 2008 2008 2007 2008 2008 2007 High Low
Interest rate risk $ 63 $ 72 $ 69 $71 $78 $ 77 $81 $ 63 Equity price risk 33 34 41 36 38 42 54 28 Foreign exchange risk 10 17 12 14 16 11 17 10 Commodity risk 12 11 13 12 13 11 16 9 Diversification benefit (43) (45) (50) (49) (48) (41) $75 $89 $ 85 $84 $97 $ 100 $100 $75
For its own internal management purposes, the Company uses both weighted and un-weighted VaR calculated at a 95% confidence interval over a one-day time horizon, among other measures. In line with the requirements of the CSE regulatory capital framework, for the purposes of calculation of the general market risk allowance for risk-weighted assets, the Company calculates weighted VaR at a 99% confidence level and over a ten-day time horizon.
During the quarter ending May 31, 2008, the reported average VaR decreased due to significant position reductions across many product areas, which were partially offset by increased market volatilities. As part of the Company’s risk management control processes, daily trading net revenues are monitored and compared with the reported weighted historical simulation VaR as of the end of the prior business day. In the quarter ended May 31, 2008, there were nine days when daily net trading loss exceeded historical simulation VaR as measured at the close of the previous business day.
The Company uses stress testing to evaluate risks associated with its Real estate held for sale positions. As of May 31, 2008, the Company had approximately $20.7 billion of real estate investments; however, the Company’s net investment at risk was limited to $10.4 billion, as a portion of these assets have been financed on a non-recourse basis. As of May 31, 2008, the Company estimates that a hypothetical 10% decline in the underlying property values associated with these positions would have resulted in a net revenue loss of approximately $1.3 billion.
Credit Risk
Credit risk represents the loss incurred as a result of failure by a client, counterparty or issuer to meet its contractual obligations. Credit risk is inherent in traditional banking products (loans, commitments to lend and contingent liabilities)

LEHMAN BROTHERS HOLDINGS INC. Management’s Discussion and Analysis of Financial Condition and Results of Operations
- 96 -
and in “traded” products (derivative contracts such as forwards, swaps and options, repurchase agreements, including repos and reverse repos), debt securities and securities borrowing and lending transactions.
Management and in particular the Company’s Credit Risk Management Department (the “CRM Department”) define and monitor credit risk and exposure. The CRM Department approves counterparties, assigns internal risk ratings, and establishes credit limits, among other risk mitigation procedures. The CRM Department monitors and reviews counterparty risk ratings, current credit exposures and potential credit exposures across products and recommends valuation adjustments, when appropriate. Given market events or counterparties’ changes in financial conditions, additional review and adjustment procedures may be undertaken. The Company also seeks to reduce current and potential credit exposures by entering into agreements that: offset receivables from and payables to a counterparty; obtain upfront or contingent collateral from counterparties; provide a third-party guarantee for a counterparty’s obligations; and transfer credit risk to third parties using structures or techniques such as credit derivatives. Working with the MRM Department, the CRM Department also participates in transaction approval, where the risks of the transaction on a stand-alone basis as well as aggregate risk exposure to the obligor are considered.
Credit risk on derivatives. Derivatives are exchange traded or privately negotiated contracts that derive their value from an underlying asset. Derivatives are useful for risk management because the fair values or cash flows of derivatives can be used to offset the changes in fair values or cash flows of other financial instruments. In addition to risk management, the Company enters into derivative transactions for purposes of client transactions or establishing trading positions. The presentation of derivatives in the Consolidated Statement of Financial Position is net of payments and receipts and, in instances where management determines a legal right of offset exists as a result of a netting agreement, net-by-counterparty. Risk for an OTC derivative includes credit risk associated with the counterparty in the negotiated contract and continues for the duration of that contract.
The fair value of OTC derivative assets at May 31, 2008 and November 30, 2007, was $44.4 billion and $41.3 billion, respectively; however, the Company views its net credit exposure to have been $37.4 billion and $34.6 billion at May 31, 2008 and November 30, 2007, respectively, representing the fair value of OTC derivative contracts in a net receivable position after consideration of collateral.
The following tables set forth the fair value of OTC derivative assets and liabilities by contract type and related net credit exposure, as of May 31, 2008 and November 30, 2007.

LEHMAN BROTHERS HOLDINGS INC. Management’s Discussion and Analysis of Financial Condition and Results of Operations
- 97 -
Fair Value of OTC Derivative Contracts by Maturity
May 31, 2008 Cross Maturity, Cross Product Less Greater and Cash Net
than 1 to 5 5 to 10 than 10 Collateral OTC Credit In millions 1 Year Years Years Years Netting(1) Derivatives Exposure
Assets Interest rate, currency and credit default swaps and options $ 4,048 $23,249 $17,753 $17,885 $(37,287) $25,648 $25,757 Foreign exchange forward contracts and options 3,022 639 547 177 (2,002) 2,383 2,078 Other fixed income securities contracts(2) 9,740 2,796 356 3 (2,554) 10,341 6,161 Equity contracts 3,467 3,376 1,132 1,833 (3,786) 6,022 3,432 $20,277 $30,060 $19,788 $19,898 $(45,629) $44,394 $37,428
Liabilities Interest rate, currency and credit default swaps and options $ 4,482 $14,787 $13,468 $11,611 $(34,615) $ 9,733 Foreign exchange forward contracts and options 2,707 877 408 203 (1,925) 2,270 Other fixed income securities contracts(3) 4,922 1,983 875 — (2,088) 5,692 Equity contracts 2,073 6,143 1,138 1,828 (4,791) 6,391 $14,184 $23,790 $15,889 $13,642 $(43,419) $24,086
(1) Cross-maturity netting represents the netting of receivable balances with payable balances for the same counterparty across maturity and product categories. Receivable and payable balances with the same counterparty in the same maturity category are netted within the maturity category when appropriate. Cash collateral received or paid is netted on a counterparty basis, provided legal right of offset exists. Assets and liabilities at May 31, 2008 were netted down for cash collateral of approximately $23.8 billion and $21.6 billion, respectively.
(2) Includes commodity derivative assets of $4.1 billion.
(3) Includes commodity derivative liabilities of $3.4 billion.

LEHMAN BROTHERS HOLDINGS INC. Management’s Discussion and Analysis of Financial Condition and Results of Operations
- 98 -
November 30, 2007 Cross Maturity, Cross Product Less Greater and Cash Net
than 1 to 5 5 to 10 than 10 Collateral OTC Credit In millions 1 Year Years Years Years Netting(1) Derivatives Exposure
Assets Interest rate, currency and credit default swaps and options $ 4,814 $22,407 $13,915 $15,901 $(35,009) $22,028 $21,718 Foreign exchange forward contracts and options 2,940 432 390 166 (1,449) 2,479 1,954 Other fixed income securities contracts(2) 8,015 866 89 15 (535) 8,450 6,890 Equity contracts 4,615 2,469 629 2,470 (1,826) 8,357 4,043 $20,384 $26,174 $15,023 $18,552 $(38,819) $41,314 $34,605
Liabilities Interest rate, currency and credit default swaps and options $ 4,499 $12,355 $11,483 $11,873 $(29,295) $10,915 Foreign exchange forward contracts and options 3,578 540 530 126 (1,886) 2,888 Other fixed income securities contracts(3) 5,474 608 322 2 (382) 6,024 Equity contracts 5,007 5,584 795 2,928 (5,035) 9,279 $18,558 $19,087 $13,130 $14,929 $(36,598) $29,106
(1) Cross-maturity netting represents the netting of receivable balances with payable balances for the same counterparty across maturity and product categories. Receivable and payable balances with the same counterparty in the same maturity category are netted within the maturity category when appropriate. Cash collateral received or paid is netted on a counterparty basis, provided legal right of offset exists. Assets and liabilities at November 30, 2007 were netted down for cash collateral of approximately $19.7 billion and $17.5 billion, respectively.
(2) Includes commodity derivative assets of $1.5 billion.
(3) Includes commodity derivative liabilities of $1.5 billion.
Presented below is an analysis of net credit exposure at May 31, 2008 and November 30, 2007 for OTC contracts based on actual ratings made by external rating agencies or by equivalent ratings established and used by the Company’s CRM Department.
Net Credit Exposure
Less Greater Total Counterparty S&P/Moody’s than 1 to 5 5 to 10 than May 31, November 30, Risk Rating Equivalent 1 Year Years Years 10 Years 2008 2007
iAAA AAA/Aaa 4% 6% 6% 9% 25% 24% iAA AA/Aa 12 6 2 4 24 26 iA A/A 9 6 6 13 34 37 iBBB BBB/Baa 4 1 1 2 8 7 iBB BB/Ba 1 2 1 1 5 3 iB or lower B/B1or lower 1 2 1 — 4 3 31% 23% 17% 29% 100% 100%
Revenue Volatility
The overall effectiveness of risk management practices can be evaluated on a broader perspective when analyzing the distribution of daily net trading revenues over time. The following table shows a measure of daily trading net revenue volatility, utilizing actual daily trading net revenues over the previous rolling 250 trading days at a 95% confidence level. This measure represents the loss relative to the median actual daily trading net revenues over the previous rolling 250 trading days, measured at a 95% confidence level. This means there is a 1-in-20 chance that actual daily trading net revenues would be expected to decline by an amount in excess of the reported revenue volatility measure.

LEHMAN BROTHERS HOLDINGS INC. Management’s Discussion and Analysis of Financial Condition and Results of Operations
- 99 -
Average Revenue Volatility Three Months Ended Revenue Volatility At Three Months Ended May 31, 2008
May 31, Feb 29, Nov 30, May 31, Feb 29, Nov 30, In millions 2008 2008 2007 2008 2008 2007 High Low
Interest rate risk $169 $ 83 $ 75 $129 $ 77 $ 58 $169 $ 83 Equity price risk 49 48 44 49 47 41 51 48 Foreign exchange risk 10 7 6 8 6 6 10 7 Commodity risk 8 5 4 6 5 4 8 5 Diversification benefit (75) (39) (34) (50) (32) (34) $161 $104 $ 95 $142 $103 $ 75 $162 $104
Average trading net revenue volatility measured in this manner was $142 million for the quarter ended May 31, 2008, an 89% increase from the comparable measure for the quarter ended November 30, 2007. The increase of this measurement was primarily driven by increased volatilities in overall markets.
The following chart sets forth the frequency distribution for daily trading net revenues for Capital Markets and Investment Management business segments (including trading activity in the fixed income and equity markets undertaken on behalf of client investors and excluding any trading activity undertaken on behalf of those investors in private equity offerings) for the quarters ended May 31, 2008 and 2007:
10
7
11
5 56
8
5
2
4
2
12
24
18
43
1
-
5
10
15
20
25
30
< $(90) $(90) - $(60) $(60) - $(30) $(30) - $0 $0 - $30 $30 - $60 $60 - $90 $90 - $120 $120 - $150 > $150
Daily Trading Net Revenues ($ Millions)
Number of Days
2Q08 2Q07
For the quarters ended May 31, 2008 and 2007, the largest loss in daily trading net revenues, including valuation adjustments, on any single day was $312 million and $25 million, respectively.
Liquidity Risk
Liquidity risk is the potential that the Company is unable to:
• Meet payment obligations when due;
• Borrow funds in the market on an on-going basis and at an acceptable price to fund actual or proposed commitments; or
• Liquidate assets in a timely manner at a reasonable price.
Management’s Finance Committee is responsible for developing, implementing and enforcing liquidity, funding and capital policies. These policies include recommendations for capital and balance sheet size as well as the allocation of

LEHMAN BROTHERS HOLDINGS INC. Management’s Discussion and Analysis of Financial Condition and Results of Operations
- 100 -
capital to the business units. Management’s Finance Committee oversees compliance with policies and limits with the goal of ensuring the Company is not exposed to undue liquidity, funding or capital risk.
The Company’s liquidity strategy seeks to ensure that the Company maintains sufficient liquidity to meet funding obligations in all market environments. That strategy is centered on five principles:
• Maintaining a liquidity pool that is of sufficient size to cover expected cash outflows for one year in a stressed liquidity environment.
• Relying on secured funding only to the extent that the Company believes it would be available in all market environments.
• Diversifying funding sources to minimize reliance on any given provider.
• Assessing liquidity at the legal entity level. For example, because legal entity structure can constrain liquidity available to Holdings, the Company’s liquidity pool excludes liquidity that is restricted from availability to Holdings.
• Maintaining a comprehensive funding action plan to manage a stress liquidity event, including a communication plan for regulators, creditors, investors and clients.
For further discussion of the Company’s liquidity positions, see “Liquidity, Funding and Capital Resources” in this MD&A.
Operational Risk
Operational risk is the risk of loss resulting from inadequate or failed internal processes, people and systems, or from external causes, whether deliberate, accidental or natural. Operational risk may arise from mistakes, intentional or otherwise, in the execution, confirmation or settlement of transactions or from transactions not being properly recorded, evaluated or accounted. The Company’s businesses are highly dependent on the ability to daily process a large number of transactions across numerous and diverse markets in many currencies, and these transactions have become increasingly complex. Consequently, the Company relies heavily on financial, accounting and other data processing systems. In recent years, the Company has substantially upgraded and expanded the capabilities of data processing systems and other operating technology, and the Company expects that it will need to continue to upgrade and expand in the future to avoid disruption of, or constraints on, the Company’s operations.
The Operational Risk Management Department is responsible for implementing and maintaining overall global operational risk management framework, which seeks to minimize these risks through assessing, reporting, monitoring and mitigating operational risks.
The Company has a company-wide business continuity plan (the “BCP”). The BCP objective is to ensure that the Company can continue critical operations with limited processing interruption in the event of a business disruption. The business continuity group manages internal incident response process and develops and maintains continuity plans for critical business functions and infrastructure. This includes determining how vital business activities will be performed until normal processing capabilities can be restored. The business continuity group is also responsible for facilitating disaster recovery and business continuity training and preparedness for employees.
Reputational and Other Risk
The Company recognizes that maintaining its reputation among clients, investors, regulators and the general public is critical. Maintaining the Company’s reputation depends on a large number of factors, including the selection of clients and the conduct of business activities. The Company seeks to maintain its reputation by screening potential clients and by conducting business activities in accordance with high ethical standards.
Potential clients are screened through a multi-step process that begins with the individual business units and product groups. In screening clients, these groups undertake a comprehensive review of the client and its background and the potential transaction to determine, among other things, whether they pose any risks to reputation. Potential transactions are screened by independent committees in the Firm, which are composed of senior members from various corporate divisions of the Company including members of the Division. These committees review the nature of the client and its business, the due diligence conducted by the business units and product groups and the proposed terms of the transaction to determine overall acceptability of the proposed transaction. In so doing, the committees evaluate the appropriateness of the transaction, including a consideration of ethical and social responsibility issues and the potential effect of the transaction on the Company’s reputation.

LEHMAN BROTHERS HOLDINGS INC. Management’s Discussion and Analysis of Financial Condition and Results of Operations
- 101 -
The Company is exposed to other risks having an ability to adversely impact business. Such risks include legal, geopolitical, tax and regulatory risks that may come to bear due to changes in local laws, regulations, accounting standards or tax statutes. To assist in the mitigation of such risks, the Company monitors and reviews regulatory, statutory or legal proposals that could impact the Company’s businesses. See “Risk Factors” and “Management’s Discussion and Analysis of Financial Condition and Results of Operations—Certain Factors Affecting Results of Operations” in the Form 10-K.
CSE Regulatory Capital
In managing its capital, the Company considers a variety of requirements and expectations. Sufficient capital must be in place to support current and projected business activities, according to both the Company’s internal assessments and the Company’s regulators, in particular its principal regulator, the SEC. The Company became a CSE in December 2005, subjecting it to group-wide supervision and examination by the SEC as well as minimum capital requirements on a consolidated basis.
Tier 1 Capital and Total Risk-Based Capital Ratios
As a CSE, the Company is required to notify the SEC if the Company’s Total Risk-Based Capital Ratio falls below 10%. The Company’s Total Risk-Based Capital Ratio has exceeded this minimum notification threshold since the Company became a CSE. The Company’s Total Risk-Based Capital Ratio is calculated as total allowable capital divided by total risk-weighted assets. The Company’s Total Risk-Based Capital Ratio is a result of methodologies developed by the Company and approved by the SEC.
In calculating both Tier 1 Capital and Total Risk-Based Capital ratios, the Company considers allowable capital and risk-weighted assets, the components of which are generally described below.
Allowable Capital. The elements of allowable capital used in the Company’s capital ratios are categorized as Tier 1 and Tier 2 capital components. Those components of Tier 1 and Tier 2 capital are calculated as follows:
Tier 1 Capital Components
• The Company’s common stockholders’ equity;
• Less the sum of the Company’s (i) identifiable intangible assets and goodwill, (ii) deferred tax assets that are dependent on future taxable income, (iii) cumulative gains or losses, net of taxes, that arise from the application of fair value accounting on the Company’s financial debt liabilities and which are attributable to changes in the Company’s credit spread, and (iv) other deductions, including the Company’s investments in insurance subsidiaries;
• Plus, certain qualifying capital elements:
Unrestricted securities issued by the Company — include perpetual, non-cumulative preferred securities. These capital elements are deeply subordinated within the capital structure, rank senior only to common stockholders’ equity, cannot be redeemed at the option of the holder, and have dividends that can be deferred indefinitely.
Restricted securities issued by the Company — generally include qualifying cumulative preferred securities, trust preferred securities and certain hybrid securities. These capital elements are deeply subordinated within the capital structure, rank senior only to common stockholders’ equity and qualifying unrestricted securities, and have dividends that can be deferred for up to 20 fiscal quarters or longer.
The Company’s Tier 1 capital includes threshold limitations for the amount of restricted securities included in the calculation. At May 31, 2008, the Company’s amount of restricted securities did not exceed the calculation threshold amount.
Tier 2 Capital Components
Includes all Tier 1 Capital Components plus:
• Senior and subordinated notes — generally include qualifying senior and subordinated notes that are unsecured and have maturities greater than five years from the date of the financial statements.
The Company’s total allowable capital includes threshold limitations for the amount of senior and subordinated

LEHMAN BROTHERS HOLDINGS INC. Management’s Discussion and Analysis of Financial Condition and Results of Operations
- 102 -
notes included in the calculation. The amount of senior and subordinated notes may not exceed half of the sum of common shareholders’ equity less deductions, and qualifying unrestricted and restricted securities. At May, 31, 2008, the Company withheld approximately $0.3 billion of qualifying subordinated notes, and $86.3 billion of qualifying senior notes (which represented all available qualifying senior notes), from recognition in Tier 2 capital.
The SEC has approved the Company’s inclusion of senior notes, which are senior to subordinated notes, as allowable capital over a period of up to three years from December 2005. As a result, the recognition of senior notes in the allowable capital computations expires in December 2008. Qualifying senior notes are not a component of the Company’s allowable capital computation at May 31, 2008. The Company does not intend to seek an extension to continue including senior notes in its allowable capital computation, and any remaining excess capacity for recognition of senior notes in the Company’s allowable capital computation is expected to be replaced by other qualifying securities, as applicable.
For a further discussion of certain of the Company’s capital components, see Note 7, “Borrowings and Deposit Liabilities,” to the Consolidated Financial Statements.
Risk-Weighted Assets. Total risk-weighted assets are principally driven by market risk, credit risk and operational risk allowances computed using methodologies developed by the Company and approved by the SEC. These methodologies are in compliance with the SEC’s CSE regulatory capital framework, which is generally consistent with the Basel Committee on Banking Supervision’s June 2006 updated framework for calculating risk-based capital requirements (“Basel II”).
Market risk allowances are calculated for trading and investing positions, including certain debt and equity instruments, commodity instruments, foreign exchange contracts and derivative contracts (including unfunded portions of commitments). The Company utilizes internal models, including VaR models, to compute general market risk allowances and specific risks such as incremental default risk, principal investment risk and other event risks.
Credit risk allowances are computed for certain assets on the consolidated balance sheet (including certain credit, debt and equity-like instruments, and exposures under derivatives contracts and securities financing transactions) and certain other off-balance sheet exposures. The Company applies the Basel II advanced internal ratings-based approach (“A-IRB”) to its credit risk exposures to determine its minimum regulatory capital requirements. The A-IRB approach primarily relies on internally derived risk factors such as probability of default which is correlated to internal ratings, exposure at default, loss given default, and the residual maturities. For certain exposures where the primary source of repayment by the obligor is based on the cash flows generated by the assets that are being financed, additional risk factors are considered, including the asset characteristics, current market conditions and quality of the security.
Operational risk allowances reflect the underlying risk of loss resulting from inadequate or failed internal processes, people and systems, or from external causes, whether deliberate, accidental or natural. The Company applies a methodology that is consistent with the Basel II basic indicator approach. The risk allowance is determined as a certain percentage of the average annual positive net revenues over the previous three years.
The Company continues to proactively refine its risk methodologies and models in anticipation of or in response to regulatory and business developments, as well as market events and influences. For a further discussion of the Company’s risk management framework and the Company’s calculation of VaR, see “Risk Management” in this MD&A.

LEHMAN BROTHERS HOLDINGS INC. Management’s Discussion and Analysis of Financial Condition and Results of Operations
- 103 -
Capital Ratio Calculations. At May 31, 2008, the Company’s Tier 1 and Total Risk-Based Capital Ratios were:
(In billions) At May 31, 2008
Common stockholders’ equity $ 19.3 Less: Identifiable intangible assets and goodwill (4.1) Certain deferred tax assets (2.3) Cumulative (gains)/losses on fair valuation of own debt (1.5) Other deductions (0.1) Plus: Qualifying unrestricted securities 7.9 Qualifying restricted securities 4.0 Tier 1 Allowable Capital 23.2 Qualifying subordinated notes 11.6 Tier 2 Allowable Capital 11.6 Total allowable capital $ 34.8 Risk-Weighted Assets Credit risk $ 93.3 Market risk 91.1 Operational risk 32.2 Total risk-weighted assets $216.6 Tier 1 Capital Ratio 10.7% Total Risk-Based Capital Ratio 16.1%
The number above does not reflect the impact of the issuance of $4.0 billion of Common Stock and of $2.0 billion of 8.75% Non-Cumulative Mandatory Convertible Preferred Stock Series Q on June 12, 2008.
Accounting and Regulatory Developments
The following summarizes accounting standards that have been issued during the periods covered by the Consolidated Financial Statements and the effect of adoption on results of operations, if any, actual or estimated.
SFAS 157. In September 2006, the FASB issued SFAS 157. SFAS 157 defines fair value, establishes a framework for measuring fair value, outlines a fair value hierarchy based on inputs used to measure fair value and enhances disclosure requirements for fair value measurements. SFAS 157 does not change existing guidance as to whether or not an instrument is carried at fair value.
SFAS 157 also (i) nullifies the guidance in EITF 02-3, Issues Involved in Accounting for Derivative Contracts Held for Trading Purposes and Contracts Involved in Energy Trading and Risk Management Activities (“EITF 02-3”), that precluded the recognition of a trading profit at the inception of a derivative contract, unless the fair value of such derivative was obtained from a quoted market price or other valuation technique incorporating observable inputs; (ii) clarifies that an issuer’s credit standing should be considered when measuring liabilities at fair value; (iii) precludes the use of a liquidity or block discount when measuring instruments traded in an active market at fair value; and (iv) requires costs related to acquiring financial instruments carried at fair value to be included in earnings as incurred.
The Company elected to early adopt SFAS 157 at the beginning of the 2007 fiscal year and recorded the difference between the carrying amounts and fair values of (i) stand-alone derivatives and/or certain hybrid financial instruments measured using the guidance in EITF 02-3 on recognition of a trading profit at the inception of a derivative, and (ii) financial instruments that are traded in active markets that were measured at fair value using block discounts, as a cumulative-effect adjustment to opening retained earnings. As a result of adopting SFAS 157, the Company recognized a $45 million after-tax ($78 million pre-tax) increase to opening retained earnings. For additional information regarding the Company’s adoption of SFAS 157, see Note 4, “Fair Value of Financial Instruments,” to the Consolidated Financial Statements.
SFAS 158. In September 2006, the FASB issued SFAS 158, which requires an employer to recognize the over- or under-

LEHMAN BROTHERS HOLDINGS INC. Management’s Discussion and Analysis of Financial Condition and Results of Operations
- 104 -
funded status of its defined benefit postretirement plans as an asset or liability in its Consolidated Statement of Financial Condition, measured as the difference between the fair value of the plan assets and the benefit obligation. For pension plans, the benefit obligation is the projected benefit obligation; while for other postretirement plans the benefit obligation is the accumulated postretirement obligation. Upon adoption, SFAS 158 requires an employer to recognize previously unrecognized actuarial gains and losses and prior service costs within Accumulated other comprehensive income/(loss), net of tax, a component of Stockholders’ equity. In accordance with the guidance in SFAS 158, the Company adopted this provision of the standard for the year ended November 30, 2007. The adoption of SFAS 158 reduced Accumulated other comprehensive loss, by $210 million after-tax ($344 million pre-tax) at November 30, 2007.
SFAS 159. In February 2007, the FASB issued SFAS 159 which permits certain financial assets and financial liabilities to be measured at fair value, using an instrument-by-instrument election. The initial effect of adopting SFAS 159 must be accounted for as a cumulative-effect adjustment to opening retained earnings for the fiscal year in which the Company applies SFAS 159. Retrospective application of SFAS 159 to fiscal years preceding the effective date is not permitted.
The Company elected to early adopt SFAS 159 beginning in the 2007 fiscal year and to measure at fair value substantially all hybrid financial instruments not previously accounted for at fair value under SFAS No. 155, as well as certain deposit liabilities at the Company’s U.S. banking subsidiaries. The Company elected to adopt SFAS 159 for these instruments to reduce the complexity of accounting for these instruments under SFAS 133. As a result of adopting SFAS 159, the Company recognized a $22 million after-tax increase ($35 million pre-tax) to opening retained earnings as of December 1, 2006, representing the effect of changing the measurement basis of these financial instruments from an adjusted amortized cost basis at November 30, 2006 to fair value. For additional information regarding the adoption of SFAS 159, see Note 4, “Fair Value of Financial Instruments,” to the Consolidated Financial Statements.
SFAS 141(R). In December 2007, the FASB issued SFAS No. 141(R), Business Combinations (“SFAS 141(R)”). SFAS 141(R) expands the definition of transactions and events that qualify as business combinations; requires that the acquired assets and liabilities, including contingencies, be recorded at the fair value determined on the acquisition date and changes thereafter reflected in revenue, not goodwill; changes the recognition timing for restructuring costs; and requires acquisition costs to be expensed as incurred. Adoption of SFAS 141(R) is required for combinations after December 15, 2008. Early adoption and retroactive application of SFAS 141(R) to fiscal years preceding the effective date are not permitted. The Company is evaluating the impact of adoption on its Consolidated Financial Statements.
SFAS 160. In December 2007, the FASB issued SFAS No. 160, Noncontrolling Interest in Consolidated Financial Statements (“SFAS 160”). SFAS 160 re-characterizes minority interests in consolidated subsidiaries as non-controlling interests and requires the classification of minority interests as a component of equity. Under SFAS 160, a change in control will be measured at fair value, with any gain or loss recognized in earnings. The effective date for SFAS 160 is for annual periods beginning on or after December 15, 2008. Early adoption and retroactive application of SFAS 160 to fiscal years preceding the effective date are not permitted. The Company is evaluating the impact of adoption on its Consolidated Financial Statements.
SFAS 161. In March 2008, the FASB issued SFAS No. 161, Disclosures about Derivative Instruments and Hedging Activities (“SFAS 161”). SFAS 161 requires specific disclosures regarding the location and amounts of derivative instruments in the Company’s financial statements; how derivative instruments and related hedged items are accounted for; and how derivative instruments and related hedged items affect the Company’s financial position, financial performance, and cash flows. SFAS 161 is effective for financial statements issued and for fiscal years and interim periods after November 15, 2008. Early application is permitted. Because SFAS 161 impacts the Company’s disclosure and not its accounting treatment for derivative instruments and related hedged items, the Company’s adoption of SFAS 161 will not impact the Consolidated Financial Statements.
SFAS 162. In May 2008, the FASB issued SFAS No. 162, The Hierarchy of Generally Accepted Accounting Principles (“SFAS 162”). SFAS 162 identifies a consistent framework, or hierarchy, for selecting accounting principles to be used in preparing financial statements that are presented in conformity with U.S. generally accepted accounting principles for nongovernmental entities (the “Hierarchy”). The Hierarchy within SFAS 162 is consistent with that previously defined in the American Institute of Certified Public Accountants Statement on Auditing Standards No. 69, The Meaning of Present Fairly in Conformity With Generally Accepted Accounting Principles (“SAS 69”). SFAS 162 is effective 60 days following the SEC’s approval of the Public Company Accounting Oversight Board amendments to AU Section 411, The Meaning of Present Fairly in Conformity With Generally Accepted Accounting Principles. The adoption of SFAS 162 will not have a material effect on the Consolidated Financial Statements because the Company has utilized the guidance within SAS 69.
SFAS 163. In May 2008, the FASB issued SFAS No. 163, Accounting for Financial Guarantee Insurance Contracts—an interpretation of FASB Statement No. 60 (“SFAS 163”). SFAS 163 requires recognition of an insurance claim liability prior
LEHMAN BROTHERS HOLDINGS INC. Management’s Discussion and Analysis of Financial Condition and Results of Operations
- 105 -
to an event of default when there is evidence that credit deterioration has occurred in an insured financial obligation. SFAS 163 is also the recognition and measurement used to account for premium revenue and claim liabilities. SFAS 163 is effective for financial statements issued for fiscal years beginning after December 15, 2008, and all interim periods within those fiscal years. Early application is not permitted. The Company’s adoption of SFAS 163 will not have a material effect on the Consolidated Financial Statements.
FIN 48. In June 2006, the FASB issued FIN 48. FIN 48 sets out a framework for management to use to determine the appropriate level of tax reserves to maintain for uncertain tax positions. FIN 48 uses a two-step approach wherein a tax benefit is recognized if a position is more likely than not to be sustained, and the amount of benefit is then measured on a probabilistic approach, as defined in FIN 48. FIN 48 also sets out disclosure requirements to enhance transparency of an entity’s tax reserves. The Company adopted FIN 48 at the beginning of the 2008 fiscal year and recognized a decrease to opening retained earnings of approximately $178 million. For additional information regarding the adoption of FIN 48, see Note 10, “Income Taxes,” to the Consolidated Financial Statements.
SOP 07-1. In June 2007, the AICPA issued Statement of Position (“SOP”) No. 07-1, Clarification of the Scope of the Audit and Accounting Guide Investment Companies and Accounting by Parent Companies and Equity Method Investors for Investments in Investment Companies ("SOP 07-1"). SOP 07-1 addresses when the accounting principles of the AICPA Audit and Accounting Guide Investment Companies must be applied by an entity and whether those accounting principles must be retained by a parent company in consolidation or by an investor in the application of the equity method of accounting. The effective date for SOP 07-1 was initially for fiscal years beginning on or after December 15, 2007; however, in February 2008, the FASB directed the FASB Staff to issue SOP 07-1-1 Effective Date of AICPA Statement of Position 07-1 (“SOP 07-1-1”), which indefinitely delays the effective dates for SOP 07-1 and FASB Staff Position (“FSP”) FIN 46(R)-7, Application of FASB Interpretation No. 46(R) to Investment Companies which was effective upon adoption of SOP 07-1.
EITF Issue 07-4. In March 2008, the FASB ratified the consensus reached in EITF 07-4, Application of the Two-Class Method under FASB Statement No. 128 to Master Limited Partnerships (“EITF 07-4”). This issue relates to the application of the two-class method under SFAS No. 128, Earnings Per Share, to master limited partnerships (“MLPs”). EITF 07-4 applies to MLPs that are required to make incentive distributions when certain thresholds have been met and that are accounted for as equity distributions. EITF 07-4 is effective for financial statements issued for fiscal years beginning after December 15, 2008, and interim periods within those fiscal years. Earlier application is not permitted. Adoption of EITF Issue 07-4 will not have a material effect on the Consolidated Financial Statements.
EITF Issue 07-6. In December, 2007, the FASB ratified the consensus reached in EITF 07-6, Accounting for the Sale of Real Estate Subject to the Requirements of FASB Statement No. 66, When the Agreement Includes a Buy-Sell Clause (“EITF 07-6”). This issue relates to accounting for the sale of real estate subject to the requirements of SFAS No. 66, Accounting for Sales of Real Estate. The Task Force reached a conclusion that the selling investor of real estate should determine whether a buy-sell clause constitutes an option or other form of prohibited continuing involvement by considering facts and circumstances such as those that might effectively compel the buyer to sell its interest and those that might effectively compel the selling investor to reacquire the real estate, such as negative tax implications, favorable arrangements with the venture, or strategic needs to own the property. EITF 07-6 is effective prospectively and for new arrangements entered into, and assessments performed, in fiscal years beginning after December 5, 2007, and interim periods within those fiscal years. Early application is not permitted. Adoption of EITF 07-6 will not have a material effect on the Consolidated Financial Statements.
FSP FAS 140-3. In February 2008, the FASB directed the FASB Staff to issue FSP No. FAS 140-3, Accounting for Transfers of Financial Assets and Repurchase Financing Transactions (“FSP FAS 140-3”). Under FSP FAS 140-3, it is presumed that an initial transfer of a financial asset and a repurchase entered into contemporaneously or in contemplation of each other are considered part of the same arrangement, known as a linked transaction. However, if certain criteria are met, the initial transfer and repurchase financing are not evaluated as a linked transaction and must be evaluated separately under FAS 140. FSP FAS 140-3 will be effective for financial statements issued for fiscal years beginning after November 15, 2008, and interim periods within those fiscal years. Earlier application is not permitted. The Company is evaluating the impact of adopting FSP FAS 140-3 on the Consolidated Financial Statements.
FSP FAS 142-3. In April 2008, the FASB directed the FASB Staff to issue FSP No. FAS 142-3, Determination of the Useful Life of Intangible Assets (“FSP FAS 142-3”). FSP FAS 142-3 amends the factors that should be considered in developing a renewal or extension assumptions used for purposes of determining the useful life of a recognized intangible asset under FASB Statement No. 142, Goodwill and Other Intangible Assets (“SFAS 142”). FSP FAS 142-3 is intended to improve the consistency between the useful life of a recognized intangible asset under SFAS 142 and the period of expected cash flows used to measure the fair value of the asset under SFAS 141(R), Business Combinations, and other U.S. generally accepted accounting principles. FSP FAS 142-3 is effective for fiscal years beginning after December 15, 2008. Earlier

LEHMAN BROTHERS HOLDINGS INC. Management’s Discussion and Analysis of Financial Condition and Results of Operations
- 106 -
application is not permitted. The Company believes the impact of adopting FSP FAS 142-3 will not have a material effect on the Consolidated Financial Statements.
FSP FIN 39-1. In April 2007, the FASB directed the FASB Staff to issue FSP No. FIN 39-1, Amendment of FASB Interpretation No. 39 (“FSP FIN 39-1”). FSP FIN 39-1 modifies FIN No. 39, Offsetting of Amounts Related to Certain Contracts, and permits companies to offset cash collateral receivables or payables with net derivative positions under certain circumstances. FSP FIN 39-1 is effective for fiscal years beginning after November 15, 2007, with early adoption permitted. FSP FIN 39-1 does not affect the Consolidated Financial Statements because it clarified the acceptability of existing market practice, which the Company uses, of netting cash collateral against net derivative assets and liabilities.
FSP FIN 48-1. In May 2007, the FASB directed the FASB Staff to issue FSP No. FIN 48-1, Definition of “Settlement” In FASB Interpretation No. 48 (“FSP FIN 48-1”). Under FSP FIN 48-1, a previously unrecognized tax benefit may be subsequently recognized if the tax position is effectively settled and other specified criteria are met. The Company adopted FSP FIN 48-1 upon adoption of FIN 48.
FSP APB 14-1. In May 2008, the FASB directed the FASB Staff to issue FSP APB 14-1, Accounting for Convertible Debt Instruments That May Be Settled in Cash upon Conversion (Including Partial Cash Settlement) (“FSP APB 14-1”). FSP APB 14-1 applies to convertible debt instruments that, by their stated terms, may be settled in cash (or other assets) upon conversion, including partial cash settlement of the conversion option. FSP APB 14-1 requires bifurcation of the instrument into a debt component which is initially recorded at fair value and an equity component. The difference between the fair value of the debt component and the initial proceeds from issuance of the instrument is recorded as a component of equity. The liability component of the debt instrument is accreted to par using the effective yield method; accretion is reported as a component of interest expense. The equity component is not subsequently re-valued as long as it continues to qualify for equity treatment. FSP APB 14-1 is effective for financial statements issued and for fiscal years and interim periods after December 15, 2008. Early adoption is not permitted. The Company is evaluating the impact of adopting FSP APB 14-1 on the Consolidated Financial Statements.
SAB 109. In November 2007, the SEC issued Staff Accounting Bulletin (“SAB”) No. 109, Written Loan Commitments Recorded at Fair Value Through Earnings (“SAB 109”). SAB 109 supersedes SAB No. 105, Loan Commitments Accounted for as Derivative Instruments (“SAB 105”), and expresses the view, consistent with the guidance in SFAS 156 and SFAS 159, that the expected net future cash flows related to the associated servicing of the loan should be included in the measurement of all written loan commitments that are accounted for at fair value through earnings. SAB 105 also expressed the view that internally-developed intangible assets (such as customer relationship intangible assets) should not be recorded as part of the fair value of a derivative loan commitment. SAB 109 retains that view and broadens its application to all written loan commitments that are accounted for at fair value through earnings. Adoption of SAB 109 did not have a material effect on the Consolidated Financial Statements.
Effect of Adoption. The table presented below summarizes the impact of adoption from the accounting developments summarized above on the results of operations:
Accumulated Other
Comprehensive Retained Earnings
In millions Date of Adoption Income/(Loss) Increase/(Decrease)
Year Ended November 30, 2007
SFAS 157 December 1, 2006 $ 45
SFAS 158 November 30, 2007 $(210)
SFAS 159 December 1, 2006 22
Six Months Ended May 31, 2008
FIN 48 December 1, 2007 (178)
Elimination of QSPEs and Changes in the FIN 46(R) Consolidation Model. In April of 2008, the FASB voted to eliminate QSPEs from the guidance in SFAS 140 and to remove the scope exception for QSPEs from FIN 46(R). This will require that VIEs previously accounted for as QSPEs will need to be analyzed for consolidation according to FIN 46 (R). While the revised standards have not been finalized and the Board's proposals will be subject to a public comment period, this change may affect the Company’s Consolidated Financial Statements as the Company may lose sales treatment for assets previously sold to a QSPE (i.e., no longer be able to de-recognize the assets from its Statement of Financial Condition), as well as for future sales. The proposed revisions could be effective as early as January 2009. The Company will continue to evaluate the impact of these changes on its financial statements once the changes to U.S. generally accepted accounting principles are completed.

LEHMAN BROTHERS HOLDINGS INC. Management’s Discussion and Analysis of Financial Condition and Results of Operations
- 107 -
The ASF Framework. On December 6, 2007, the American Securitization Forum (“ASF”), working with various constituency groups as well as representatives of U.S. federal government agencies, issued the Streamlined Foreclosure and Loss Avoidance Framework for Securitized Subprime Adjustable Rate Mortgage Loans (the “ASF Framework”). The ASF Framework provides guidance for servicers to streamline borrower evaluation procedures and to facilitate the use of foreclosure and loss prevention efforts in an attempt to reduce the number of U.S. subprime residential mortgage borrowers who might default in the coming year because the borrowers cannot afford to pay the increased loan interest rate after their U.S. subprime residential mortgage variable loan rate resets. The ASF Framework requires a borrower and its U.S. subprime residential mortgage variable loan to meet specific conditions to qualify for a modification under which the qualifying borrower’s loan’s interest rate would be kept at the existing rate, generally for five years following an upcoming reset period. The ASF Framework is focused on U.S. subprime first-lien adjustable-rate residential mortgages that have an initial fixed interest rate period of 36 months or less, are included in securitized pools, were originated between January 1, 2005 and July 31, 2007, and have an initial interest rate reset date between January 1, 2008 and July 31, 2010 (defined as “Segment 2 Subprime ARM Loans” within the ASF Framework). On June 11, 2008, ASF revised the ASF Framework to permit application, in appropriate circumstances, to any rate reset on Segment 2 Subprime ARM Loans rather than only the initial rate reset.
On January 8, 2008, the SEC’s Office of Chief Accountant (the “OCA”) issued a letter (the “OCA Letter”) addressing accounting issues that may be raised by the ASF Framework. Specifically, the OCA Letter expressed the view that if a Segment 2 Subprime ARM Loan is modified pursuant to the ASF Framework and that loan could legally be modified, the OCA will not object to continued status of the transferee as a QSPE under SFAS 140. Concurrent with the issuance of the OCA Letter, the OCA requested the FASB to immediately address the issues that have arisen in the application of the QSPE guidance in SFAS 140. Any loan modifications the Company makes in accordance with the ASF Framework will not have a material impact on its accounting for U.S. subprime residential mortgage loans nor securitizations or retained interests in securitizations of U.S. subprime residential mortgage loans.
At May 31, 2008, the Company has not yet modified a significant volume of loans using the ASF Framework. Additionally and at May 31, 2008, the Company does not believe its application of the ASF Framework will impact the off-balance sheet status of the Company sponsored QSPEs that hold Segment 2 Subprime ARM Loans.
Basel II. As of December 1, 2005, the Company became regulated by the SEC as a CSE. This supervision subjects the Company to group-wide supervision and examination by the SEC, minimum capital requirements on a consolidated basis and reporting (including reporting of capital adequacy measurement consistent with the standards adopted by the Basel Committee on Banking Supervision) and notification requirements. CSE capital requirements for the Company are principally driven by market, credit and operational risk amounts computed using methodologies developed by the Company and approved by the SEC.
The Basel Committee on Banking Supervision published an updated framework to calculate risk-based capital requirements in June 2006 (“Basel II”). In September 2006, U.S. federal bank regulators announced their intent to implement Basel II in the U.S. On December 10, 2007, the U.S. federal bank regulators published final rules to implement new risk-based capital requirements in the U.S. for large, internationally active (core) banking organizations.
The CSE regulations are intended to provide consolidated supervision of investment bank holding companies that is broadly consistent with U.S. federal bank regulatory oversight of bank holding companies. Basel II is meant to be applied on a consolidated basis for banking institutions or bank holding companies that have consolidated total assets of $250 billion or more and/or consolidated total on-balance-sheet foreign exposure of $10 billion or more. Basel II provides two broad methods for calculating minimum capital requirements related to credit risk: (i) a standardized approach that relies heavily upon external credit assessments by major independent credit rating agencies; and (ii) an internal ratings-based approach, at foundation or advanced levels that permits the use of internal rating assessments in determining required capital.
Beginning January 2008, certain of the Company’s subsidiaries in Europe, became subject to the Basel II requirements. The time frame in which Basel II requirements would become effective for U.S. banking institutions or bank holding companies is contemplated to be on or after (i) completion of four consecutive quarterly parallel calculations, in which an entity would remain subject to existing risk-based capital rules but also calculate its risk-based capital requirements under the new Basel II framework; and (ii) a series of transitional periods during which an entity would report under the new framework, subject to supervisory mandated minimum regulatory capital requirements.
Additionally and as an increasing number of global banking organizations become subject to Basel II, new interpretations may arise, and harmonization among regulators could impact the regulatory capital standards under which the Company

LEHMAN BROTHERS HOLDINGS INC. Management’s Discussion and Analysis of Financial Condition and Results of Operations
- 108 -
operates as a CSE, as well as the requirements for some of the Company’s regulated subsidiaries. For further discussion of the Company’s CSE capital ratios, see “CSE Regulatory Capital” in this MD&A.
Effects of Inflation
Because the Company’s assets are, to a large extent, liquid in nature, they are not significantly affected by inflation. However, the rate of inflation affects such expenses as employee compensation, office space leasing costs and communications charges, which may not be readily recoverable in the prices of services the Company offers. To the extent inflation results in rising interest rates and has other adverse effects on the securities markets, it may adversely affect the consolidated financial condition and results of operations in certain businesses.

LEHMAN BROTHERS HOLDINGS INC. PART I- FINANCIAL INFORMATION
- 109 -
ITEM 3. QUANTITATIVE AND QUALITATIVE DISCLOSURES ABOUT MARKET RISK
The information under the caption “Management’s Discussion and Analysis of Financial Condition and Results of Operations—Risk Management” in Part I, Item 2, in this Report is incorporated herein by reference.
ITEM 4. CONTROLS AND PROCEDURES
Our management, with the participation of the Chairman and Chief Executive Officer and the Chief Financial Officer of Holdings (its principal executive officer and principal financial officer, respectively), evaluated our disclosure controls and procedures as of the end of the fiscal quarter covered by this Report.
Based on that evaluation, the Chairman and Chief Executive Officer and the Chief Financial Officer have concluded that, as of the end of the fiscal quarter covered by this Report, our disclosure controls and procedures are effective to ensure that information required to be disclosed by Holdings in the reports filed or submitted by it under the Exchange Act is recorded, processed, summarized and reported within the time periods specified in the SEC’s rules and forms, and include controls and procedures designed to ensure that information required to be disclosed by Holdings in such reports is accumulated and communicated to our management, including the Chairman and Chief Executive Officer and the Chief Financial Officer of Holdings, as appropriate to allow timely decisions regarding required disclosure.
There was no change in our internal control over financial reporting that occurred during the fiscal quarter covered by this Report that has materially affected, or is reasonably likely to materially affect, our internal control over financial reporting.

LEHMAN BROTHERS HOLDINGS INC. PART II — OTHER INFORMATION
- 110 -
ITEM 1. LEGAL PROCEEDINGS
See Part I, Item 3, “Legal Proceedings,” in the Form 10-K and Part II, Item 1, “Legal Proceedings,” in Holdings’ Quarterly Report on Form 10-Q for the quarter ended February 29, 2008 for a complete description of certain proceedings previously reported by the Company, including those listed below; only significant subsequent developments in such proceedings and new matters, if any, since the filing of the latest Form 10-Q are described below. Capitalized terms used in this Item that are defined in the Form 10-K have the meanings ascribed to them in the Form 10-K.
The Company is involved in a number of judicial, regulatory and arbitration proceedings concerning matters arising in connection with the conduct of the Company’s business. Such proceedings include actions brought against the Company and others with respect to transactions in which the Company acted as an underwriter or financial advisor, actions arising out of activities as a broker or dealer in securities and commodities and actions brought on behalf of various classes of claimants against many securities and commodities firms, including the Company.
Although there can be no assurance as to the ultimate outcome, the Company generally have denied, or believes it has a meritorious defense and will deny, liability in all significant cases pending against the Company, including the matters described below and in the Form 10-K and subsequent Form 10-Q, and the Company intends to defend vigorously each such case. Based on information currently available, the Company believes the amount, or range, of reasonably possible losses in connection with the actions against the Company, including the matters described below and in the Form 10-K and subsequent Form 10-Q, in excess of established reserves, in the aggregate, not to be material to the Company’s consolidated financial condition or cash flows. However, losses may be material to the Company’s operating results for any particular future period, depending on the level of income for such period.
Alaska Electrical Pension Fund v. Lehman Brothers Holdings Inc., et al.
On June 19, 2008, a purported class action complaint was received in the Supreme Court of the State of New York, County of Nassau, captioned Alaska Electrical Pension Fund v. Lehman Brothers Holdings Inc., et al. The complaint is brought as a purported class action on behalf of all persons or entities who acquired mortgage pass-through certificates and asset-backed notes of Structured Asset Securities Corporation (“SASCO”) issued during 2006 and 2007 pursuant or traceable to an allegedly false and misleading registration statement and through which approximately 60 mortgage trusts issued notes. The complaint names certain employees of LBI who signed the registration statement and the mortgage trusts along with Holdings, LBI and SASCO. It purports to allege a claim under Sections 11 and 15 of the Securities Act of 1933, as amended (the “1933 Act”). It seeks compensatory damages to the class members.
Archstone-Related Litigation
Steven A. Stender, et al. v. James A. Cardwell, et al.; Jack P. Katz v. Ernest A. Gerardi, Jr., et al. On November 30, 2007, a purported class action lawsuit related to the acquisition of Archstone-Smith Trust (“ASN”) and Archstone-Smith Operating Trust (“ASOT”) by affiliates of Tishman Speyer Real Estate Venture VII, L.P. and Holdings (the “Acquisition”), captioned Steven A. Stender, et al. v. James A. Cardwell, et al. (Case no. 2007cv2503), was filed in the United States District Court for the District of Colorado (the “Stender Action”). The lawsuit names, among others, ASN, ASOT, ASN’s former trustees, Holdings and Tishman Speyer Development Corporation as defendants. This action was brought by certain former unitholders of ASOT, individually and purportedly on behalf of all holders of ASOT’s Class A-1 common units as of the date of the Acquisition, and alleges, among other things, (i) that ASOT and ASN entered into enforceable property contribution agreements and partnership agreements with such unitholders; (ii) that ASN and ASOT agreed not to enter into any transactions or dispose of any interest in the property contributed by such unitholders that would result in such unitholders realizing a taxable gain, and agreed to provide such unitholders with the ability to receive dividends and to liquidate their units by receiving cash or converting them to common shares in the publicly-traded ASN; (iii) that ASN and ASOT failed to perform their duties under the contribution and partnership agreements and statutory and common law partnership principles in connection with the Acquisition; and (iv) that ASN and its former trustees and officers, aided and abetted by Holdings and Tishman Speyer Development Corporation, violated their fiduciary duties owed to such unitholders in connection with the Acquisition. The class action seeks an unspecified amount of damages.
On February 27, 2008, on motion of all defendants, the magistrate judge presiding over the Stender Action granted defendants’ request for a stay of discovery and further pretrial proceedings pending the court’s decision on the defendants motion to stay or dismiss the complaint in favor of arbitration, or in the alternative, to dismiss for failure to state a claim.
On May 9, 2008, a second purported class action lawsuit relating to the Acquisition, captioned Jack P. Katz v. Ernest A. Gerardi, Jr., et al., was filed in the Circuit Court of Cook County, Illinois by the same law firm that represents plaintiffs in

LEHMAN BROTHERS HOLDINGS INC. PART II — OTHER INFORMATION
- 111 -
the Stender Action. The lawsuit names, among others, ASN, ASOT, ASN’s former trustees, Holdings and Tishman Speyer Development Corporation as defendants. The complaint alleges, among other things, that the prospectus/information statement and registration statement on Form S-4 filed with the SEC by ASOT with respect to the Series O Preferred Units to be issued to unitholders who did not elect to receive the cash consideration in connection with the Acquisition violated Sections 11, 12 and 15 of the 1933 Act in that the prospectus and registration statement allegedly contained materially false and misleading statements. The complaint seeks (i) with respect to unitholders who elected to receive the Series O Preferred Units, rescission of their exchange and/or damages in the amount of the full value of the Class A-1 Common Units at the time of the Acquisition plus the value of the tax protection and other purported benefits applicable to the Class A-1 Common Units; and (ii) with respect to unitholders who elected to receive the cash consideration, rescissory damages and/or damages in the amount of the tax liability they were required to pay as a result of the receipt of the cash consideration.
First Alliance Mortgage Company Matters
On June 6, 2008, the California District Court preliminarily approved a settlement of the parties and set a final hearing to approve the settlement for October 27, 2008.
IPO Fee Litigation
On May 27 and 28, 2008, the New York District Court ordered the dismissal of both the In re Issuer Plaintiff Initial Public Offering Fee Antitrust Litigation and the purchaser litigation (Harold Gillet, et al. v. Goldman Sachs & Co., et al.; Yakov Prager, et al. v. Goldman Sachs & Co, et al., and David Holzman, et al. v. Goldman Sachs & Co., et al.), pursuant to the stipulations of dismissal filed by the parties.
Marubeni Litigation
On June 18, 2008 four individuals, including two former Marubeni Corporation employees, were taken into custody by the Tokyo Police Department on charges relating to their involvement in the fraud.
Municipal Derivatives Litigation
LBI has been named as a defendant in six putative class action cases concerning the sale of municipal derivatives: (1) Fairfax County, Virginia, et al. v. Wachovia Bank N.A., et al., 08-cv-432 (United States District Court for the District of Columbia (“D.C. District Court”)), filed on March 12, 2008; (2) Hinds County, Mississippi v. Wachovia Bank, et al., 08-cv-2516 (United Sates District Court for the Southern District of New York (“New York District Court”)), filed on March 13, 2008; (3) The City of Oakland, California v. AIG Financial Products Corp., et al., 08-cv-2116 (United States District Court for the Northern District of California(“California District Court”)), filed on April 23, 2008; (4) Central Bucks School District v. Wachovia Bank N.A., et al., 08-cv-956 (D.C. District Court), filed on June 4, 2008; (5) Mayor and City Counsel of Baltimore v. Wachovia Bank, N.A., et al. (New York District Court), filed on July 3, 2008; and (6) County of Alameda, California v. AIG Financial Products Corp., et al. (California District Court), filed on July 8, 2008. In each case, plaintiffs allege a conspiracy among issuers and brokers of municipal derivatives to fix prices, rig bids, and allocate customers in violation of Section 1 of the Sherman Act, 15 U.S.C. § 1. The City of Oakland also alleges that this conduct violated California’s Cartwright Act, Cal. Bus. & Prof. Code §§ 16720, et seq., and Unfair Competition Law, Cal. Bus. & Prof. Code §§ 17200, et seq.
On June 16, 2008, the United States Judicial Panel on Multidistrict Litigation (“MDL Panel”) issued an order transferring the cases brought by Fairfax County and Hinds County (as well as another case in which LBI is not named) to the New York District Court for coordinated or consolidated pretrial proceedings. In that order, the MDL Panel identified the cases brought by the City of Oakland and Central Bucks School District, as well as two cases in which LBI is not named, as additional actions that may be consolidated in the multi-district litigation proceeding. On June 23, 2008, the New York District Court issued an order consolidating four cases, including those brought by Fairfax County and Hinds County, for all pretrial purposes. The Baltimore and the second California case had not yet been filed at that time.
Subprime Disclosure-Related Matters
Southeastern Pennsylvania Transportation Authority, et al. v. Lehman Brothers Holdings, Inc., et al. and Operative Plasterers and Cement Masons International Association Local 262 Annuity Fund et al. v. Lehman Brothers Holdings, Inc., et al. On April 29, 2008 and June 18, 2008, two purported securities class actions were filed against Holdings and certain of its officers relating to Holdings’ allegedly false or misleading statements in connection with its subprime mortgage backed securities trading. The April 29th class action complaint, captioned Southeastern Pennsylvania Transportation Authority, et al. v. Lehman Brothers Holdings, Inc., et al. (“SEPTA”) was filed in the United States District Court for the Northern District of Illinois. The June 18th class action complaint, captioned Operative Plasterers and Cement Masons International Association Local 262 Annuity Fund et al. v. Lehman Brothers Holdings, Inc., et al. (“Operative Plasterers”) was filed in the United States District Court for the

LEHMAN BROTHERS HOLDINGS INC. PART II — OTHER INFORMATION
- 112 -
Southern District of New York. The purported class period for the SEPTA complaint is September 13, 2006 through July 30, 2007, while the purported class period for the Operative Plasterers complaint is September 13, 2006 through June 6, 2008.
Both complaints allege that Holdings made materially false or misleading statements by purportedly failing to fully disclose the nature and extent of its exposure to losses incurred from trading in subprime mortgage backed derivatives and collateralized debt obligations. Plaintiffs further allege that Holdings materially overvalued its position, maintained inadequate reserves, and did not prepare its financial statements in accordance with U.S. generally accepted accounting principles. Both complaints allege violations of Section 10(b) of the Exchange Act and Rule 10b-5 promulgated thereunder against Holdings and the individual defendants. The complaints also allege that the individual defendants violated Section 20(a) of the Exchange Act. The complaints seek class certification and compensatory damages in an amount to be determined.
Alex E. Rinehart et al. v. Lehman Brothers Holdings, Inc. et al. Also on June 18, 2008, a third purported class action complaint, captioned Alex E. Rinehart et al. v. Lehman Brothers Holdings, Inc. et al. (“Rinehart”), was filed in the United States District Court for the Southern District of New York against Holdings, certain of its current officers and directors and members of the Employee Benefit Plans Committee. The Rinehart complaint is brought pursuant to the Employee Retirement Income Security Act (“ERISA”) on behalf of a purported class of all participants in or beneficiaries of the Holdings’ employee pension benefit plan, the Lehman Brothers Savings Plan (the “Plan”) between September 13, 2006 and the present whose accounts included investments in Holdings’ common stock.
The Rinehart complaint alleges that Holdings and its officers and directors, as fiduciaries of the Plan, failed to exercise the required skill, care, prudence, and diligence required to administer the Plan allegedly because Holdings was “heavily invested in collateralized debt obligations (“CDOs”) and subprime mortgage backed derivatives and was a participant in the mortgage backed security origination sector.” Plaintiffs allege that defendants failed to fully disclose the nature and extent of losses incurred from trading in subprime mortgage backed derivatives and CDOs, and that Holdings failed to timely write down its positions in these securities. Plaintiffs further allege that Holdings materially overvalued its position, maintained inadequate reserves, and did not prepare its financial statements in accordance with U.S. generally accepted accounting principles. Plaintiffs allege that, as fiduciaries of the Plan, defendants had an obligation to conduct an independent and thorough investigation into the merits of all investment alternatives, and by allegedly disseminating false or misleading information, they failed to prudently manage the Plan’s assets with respect to the Plan’s investments. The complaint seeks relief in the form of unspecified monetary payment to the Plan and Plan participants, along with injunctive and other equitable relief.
ITEM 1A. RISK FACTORS
There are no material changes from the risk factors set forth in Part I, Item 1A, in the Form 10-K.

LEHMAN BROTHERS HOLDINGS INC. PART II — OTHER INFORMATION
- 113 -
ITEM 2. UNREGISTERED SALES OF EQUITY SECURITIES AND USE OF PROCEEDS
The table below sets forth information with respect to purchases made by or on behalf of Holdings or any “affiliated purchaser” (as defined in Rule 10b-18(a)(3) under the Exchange Act) of common stock during the quarter ended May 31, 2008.
Total Number of Shares Purchased
Average Price Paid per Share
Total Number of Shares Purchased
as Part of Publicly
Announced Plans or Programs
Maximum Number of
Shares that May Yet Be
Purchased Under the Plans or Programs
Month #1 (March 1-March 31, 2008): Common stock repurchases(1) 250,000 250,000 Employee transactions(2) 126,615 126,615 Total 376,615 $44.25 376,615 86,663,338 Month #2 (April 1-April 30, 2008): Common stock repurchases(1) 1,221,500 1,221,500 Employee transactions(2) 60,458 60,458 Total 1,281,958 $40.30 1,281,958 85,381,380 Month #3 (May 1-May 31, 2008): Common stock repurchases(1) 175,000 175,000 Employee transactions(2) 837,393 837,393 Total 1,012,393 $38.45 1,012,393 84,368,987 Total (March 1, 2008-May 31, 2008): Common stock repurchases(1) 1,646,500 1,646,500 Employee transactions(2) 1,024,466 1,024,466 Total 2,670,966 $40.15 2,670,966 84,368,987
(1) The Company has an ongoing common stock repurchase program, pursuant to which the Company repurchases shares in the open market or through structured derivative trades. As previously announced, in January 2008 the Company’s Board of Directors authorized the repurchase, subject to market conditions, of up to 100 million shares of Holdings’ common stock for the management of the Firm’s equity capital, taking dilution due to employee stock awards into consideration. This authorization superseded the stock repurchase program authorized in January 2007. The number of shares authorized to be repurchased in the open market is reduced by the actual number of Employee Offset Shares (as defined below) received and by shares repurchased through structured derivative trades.
(2) Represents shares of common stock withheld in satisfaction of the exercise price of stock options and tax withholding obligations upon option exercises and conversion of restricted stock units (collectively, “Employee Offset Shares”).
For more information about the repurchase program and employee stock plans, see “Management’s Discussion and Analysis of Financial Condition and Results of Operations—Liquidity, Funding and Capital Resources—Equity Management” in Part I, Item 2, and Notes 10 and 12 to the Consolidated Financial Statements in Part II, Item 8, and “Security Ownership of Certain Beneficial Owners and Management and Related Stockholder Matters” in Part III, Item 12, of the Form 10-K.

LEHMAN BROTHERS HOLDINGS INC. PART II — OTHER INFORMATION
- 114 -
ITEM 4. SUBMISSION OF MATTERS TO A VOTE OF SECURITY HOLDERS
The Annual Meeting of Stockholders of Holdings was held on April 15, 2008.
The stockholders voted on proposals to:
1. Elect eleven Directors for one-year terms;
2. Ratify the selection by the Audit Committee of the Board of Directors of Ernst & Young LLP as the Company’s independent registered public accounting firm for the 2008 fiscal year;
3. Approve an amendment to the Company’s 2005 Stock Incentive Plan increasing the number of shares of common stock available for awards;
4. Approve the Executive Incentive Compensation Plan (formerly named the Short-Term Executive Compensation Plan), as amended;
5. Consider a stockholder proposal related to political contributions made by the Company (“Stockholder Proposal I”); and
6. Consider a stockholder proposal related to the preparation of an environmental sustainability report by the Company (“Stockholder Proposal II”).
All nominees for election to the board were elected to serve until the Annual Meeting in 2009, and until their respective successors are elected and qualified.
The stockholders also ratified the selection of the independent auditors by the Audit Committee of the Board of Directors, adopted the amendment to the Company’s 2005 Stock Incentive Plan and approved the Executive Incentive Compensation Plan, as amended.
Stockholder Proposal I and Stockholder Proposal II were not adopted.
The number of votes cast for and against, and the number of abstentions and broker non-votes with respect to each proposal is set forth below:
Broker Proposal For Against Abstain Non-Votes
Election of Directors Michael L. Ainslie 514,554,291 4,980,266 5,848,079 * John F. Akers 496,903,479 23,220,657 5,258,500 * Roger S. Berlind 513,018,546 6,478,855 5,885,235 * Thomas H. Cruikshank 514,295,855 5,810,812 5,275,969 * Marsha Johnson Evans 499,290,527 20,268,627 5,823,482 * Richard S. Fuld, Jr. 516,115,279 4,571,785 4,695,572 * Sir Christopher Gent 500,477,658 19,664,475 5,240,503 * Jerry A. Grundhofer 517,885,066 1,668,958 5,828,612 * Roland A. Hernandez 517,739,255 2,372,536 5,270,845 * Henry Kaufman 512,229,381 5,285,384 7,867,871 * John D. Macomber 495,933,574 24,070,205 5,378,857 * Ratification of the selection by the Audit Committee of the Board of Directors of the independent registered public accounting firm for the 2008 fiscal year 516,407,283 4,167,454 4,807,899 * Adoption of the amendment to the Company’s 2005 Stock Incentive Plan 275,986,055 174,882,676 5,486,848 69,027,057 Approval of the Executive Incentive Compensation Plan, as amended 503,353,572 15,665,701 6,363,363 * Adoption of Stockholder Proposal I 15,732,044 359,953,920 80,669,615 69,027,057 Adoption of Stockholder Proposal II 16,484,890 376,298,191 63,572,498 69,027,057
* Not applicable

LEHMAN BROTHERS HOLDINGS INC. PART II — OTHER INFORMATION
- 115 -
ITEM 6. Exhibits
The following exhibits are filed as part of (or are furnished with, as indicated below) this Quarterly Report or, where indicated, were heretofore filed and are hereby incorporated by reference:
3.01 Restated Certificate of Incorporation of the Registrant dated October 10, 2006 (incorporated by reference to Exhibit 3.04 to the Registrant’s Quarterly Report on Form 10-Q for the quarter ended August 31, 2006)
3.02 Certificate of Designations with respect to the Registrant’s Non-Cumulative Perpetual Preferred Stock, Series H (incorporated by reference to Exhibit 3.01 to the Registrant’s Current Report on Form 8-K filed with the SEC on May 23, 2007)
3.03 Certificate of Designations with respect to the Registrant’s Non-Cumulative Perpetual Preferred Stock, Series I (incorporated by reference to Exhibit 3.02 to the Registrant’s Current Report on Form 8-K filed with the SEC on May 23, 2007)
3.04 Certificate of Designations with respect to the Registrant’s Non-Cumulative Perpetual Preferred Stock, Series J (incorporated by reference to Exhibit 3.1 to the Registrant’s Current Report on Form 8-K filed with the SEC on February 12, 2008)
3.05 Certificate of Designations with respect to the Registrant’s Non-Cumulative Perpetual Convertible Preferred Stock, Series P (incorporated by reference to Exhibit 3.1 to the Registrant’s Current Report on Form 8-K filed with the SEC on April 4, 2008)
3.06 Certificate of Designations with respect to the Registrant’s 8.75% Non-Cumulative Mandatory Convertible Preferred Stock, Series Q (incorporated by reference to Exhibit 3.1 to the Registrant’s Current Report on Form 8-K filed with the SEC on June 12, 2008)
3.07 By-Laws of the Registrant, amended as of November 8, 2007 (incorporated by reference to Exhibit 3.01 to the Registrant’s Current Report on Form 8-K filed with the SEC on November 15, 2007)
10.01 Form of Agreement evidencing a grant of Restricted Stock Units to Directors under the Lehman Brothers Holdings Inc. 2005 Stock Incentive Plan, as amended (incorporated by reference to Exhibit 10.1 to the Registrant’s Current Report on Form 8-K filed with the SEC on April 11, 2008)
10.02 Form of Agreement evidencing a grant of Nonqualified Stock Options to Directors under the Lehman Brothers Holdings Inc. 2005 Stock Incentive Plan, as amended (incorporated by reference to Exhibit 10.2 to the Registrant’s Current Report on Form 8-K filed with the SEC on April 11, 2008)
10.03 Lehman Brothers Holdings Inc. 2005 Stock Incentive Plan (incorporated by reference to Appendix B to the Registrant’s Definitive Proxy Statement for its 2008 Annual Meeting of Stockholders)
10.04 Lehman Brothers Holdings Inc. Executive Incentive Compensation Plan (incorporated by reference to Appendix C to the Registrant’s Definitive Proxy Statement for its 2008 Annual Meeting of Stockholders)
11.01 Computation of Per Share Earnings (omitted in accordance with section (b)(11) of Item 601 of Regulation S-K; the computation of per share earnings is set forth in Part I, Item 1, in Note 9 to the Consolidated Financial Statements (Earnings per Common Share))
12.01* Computation of Ratios of Earnings to Fixed Charges and to Combined Fixed Charges and Preferred Stock Dividends
15.01* Letter of Ernst & Young LLP regarding Unaudited Interim Financial Information
31.01* Certification of Chief Executive Officer Pursuant to Rule 13a-14(a) and 15d-14(a)
31.02* Certification of Chief Financial Officer Pursuant to Rule 13a-14(a) and 15d-14(a)
32.01* Certification of Chief Executive Officer Pursuant to 18 U.S.C. Section 1350, as Enacted by Section 906 of the Sarbanes-Oxley Act of 2002 (This certification is being furnished and shall not be deemed “filed” with the SEC for purposes of Section 18 of the Exchange Act, or otherwise subject to the liability of that section, and shall not be deemed to be incorporated by reference into any filing under the Securities Act or the Exchange Act, except to the extent that the Registrant specifically incorporates it by reference.)

LEHMAN BROTHERS HOLDINGS INC. PART II — OTHER INFORMATION
- 116 -
32.02* Certification of Chief Financial Officer Pursuant to 18 U.S.C. Section 1350, as Enacted by Section 906 of the Sarbanes-Oxley Act of 2002 (This certification is being furnished and shall not be deemed “filed” with the SEC for purposes of Section 18 of the Exchange Act, or otherwise subject to the liability of that section, and shall not be deemed to be incorporated by reference into any filing under the Securities Act or the Exchange Act, except to the extent that the Registrant specifically incorporates it by reference.)
* Filed/furnished herewith

LEHMAN BROTHERS HOLDINGS INC.
- 117 -
SIGNATURES
Pursuant to the requirements of the Securities Exchange Act of 1934, the Registrant has duly caused this Report to be signed on its behalf by the undersigned thereunto duly authorized. LEHMAN BROTHERS HOLDINGS INC.
(Registrant)
Date: July 10, 2008 By: /s/ Ian T. Lowitt Chief Financial Officer, Controller
and Executive Vice President (principal financial and accounting officer)

LEHMAN BROTHERS HOLDINGS INC.
- 118 -
EXHIBIT INDEX
EXHIBIT NO. EXHIBIT 12.01* Computation Of Ratios of Earnings to Fixed Charges and to Combined Fixed Charges and Preferred
Stock Dividends 15.01* Letter of Ernst & Young LLP regarding Unaudited Interim Financial Information 31.01* Certification of Chief Executive Officer Pursuant to Rule 13a-14(a) and 15d-14(a) 31.02* Certification of Chief Financial Officer Pursuant to Rule 13a-14(a) and 15d-14(a) 32.01* Certification of Chief Executive Officer Pursuant to 18 U.S.C. Section 1350, as Enacted by Section
906 of the Sarbanes-Oxley Act of 2002 32.02* Certification of Chief Financial Officer Pursuant to 18 U.S.C. Section 1350, as Enacted by Section
906 of the Sarbanes-Oxley Act of 2002 *Included in this booklet.

LEHMAN BROTHERS HOLDINGS INC.
EXHIBIT 12.01
Computation of Ratios of Earnings to Fixed Charges and to Combined Fixed Charges and Preferred Stock Dividends
(Unaudited)
Six Months Ended
Year Ended November 30, Dollars in millions May 31, 2008 2007 2006 2005 2004
Pre-tax earnings from continuing operations $ (3,424) $ 6,013 $ 5,905 $ 4,829 $ 3,518
Add: Fixed charges (excluding capitalized interest) 15,595 39,799 29,323 18,040 9,773
Pre-tax earnings before fixed charges $12,171 $45,812 $35,228 $22,869 $13,291
Fixed charges:
Interest $15,771 $39,746 $29,126 $17,790 $ 9,674
Other (1) 77 132 108 125 114
Total fixed charges 15,848 39,878 29,234 17,915 9,788
Preferred stock dividend requirements 178 97 98 101 129
Total combined fixed charges and preferred stock dividends $16,026 $39,975 $29,332 $18,016 $ 9,917
Ratio of earnings to fixed charges 0.77 1.15 1.21 1.28 1.36
Ratio of earnings to combined fixed charges and preferred stock dividends 0.76 1.15 1.20 1.27 1.34
(1) Other fixed charges consist of the interest factor in rentals and capitalized interest.

EXHIBIT 15.01
Letter of Ernst & Young LLP regarding Unaudited Interim Financial Information
July 10, 2008
To the Board of Directors and Stockholders of Lehman Brothers Holdings Inc.
We are aware of the incorporation by reference in the following Registration Statements and Post Effective Amendments:
(1) Registration Statement (Form S-3 No. 333-134553) of Lehman Brothers Holdings Inc., (2) Registration Statement (Form S-3 No. 033-53651) of Lehman Brothers Holdings Inc., (3) Registration Statement (Form S-3 No. 033-56615) of Lehman Brothers Holdings Inc., (4) Registration Statement (Form S-3 No. 033-58548) of Lehman Brothers Holdings Inc., (5) Registration Statement (Form S-3 No. 033-62085) of Lehman Brothers Holdings Inc., (6) Registration Statement (Form S-3 No. 033-65674) of Lehman Brothers Holdings Inc., (7) Registration Statement (Form S-3 No. 333-14791) of Lehman Brothers Holdings Inc., (8) Registration Statement (Form S-3 No. 333-38227) of Lehman Brothers Holdings Inc., (9) Registration Statement (Form S-3 No. 333-44771) of Lehman Brothers Holdings Inc., (10) Registration Statement (Form S-3 No. 333-50197) of Lehman Brothers Holdings Inc., (11) Registration Statement (Form S-3 No. 333-60474) of Lehman Brothers Holdings Inc., (12) Registration Statement (Form S-3 No. 333-61878) of Lehman Brothers Holdings Inc., (13) Registration Statement (Form S-3 No. 333-75723) of Lehman Brothers Holdings Inc., (14) Registration Statement (Form S-3 No. 333-76339) of Lehman Brothers Holdings Inc., (15) Registration Statement (Form S-3 No. 333-108711-01) of Lehman Brothers Holdings Inc., (16) Registration Statement (Form S-3 No. 333-121067) of Lehman Brothers Holdings Inc., (17) Registration Statement (Form S-3 No. 333-51913) of Lehman Brothers Inc., (18) Registration Statement (Form S-3 No. 333-08319) of Lehman Brothers Inc., (19) Registration Statement (Form S-3 No. 033-63613) of Lehman Brothers Inc., (20) Registration Statement (Form S-4 No. 333-129195) of Lehman Brothers Holdings Inc., (21) Registration Statement (Form S-8 No. 033-53923) of Lehman Brothers Holdings Inc., (22) Registration Statement (Form S-8 No. 333-07875) of Lehman Brothers Holdings Inc., (23) Registration Statement (Form S-8 No. 333-57239) of Lehman Brothers Holdings Inc., (24) Registration Statement (Form S-8 No. 333-59184) of Lehman Brothers Holdings Inc., (25) Registration Statement (Form S-8 No. 333-68247) of Lehman Brothers Holdings Inc., (26) Registration Statement (Form S-8 No. 333-110179) of Lehman Brothers Holdings Inc., (27) Registration Statement (Form S-8 No. 333-110180) of Lehman Brothers Holdings Inc., (28) Registration Statement (Form S-8 No. 333-121193) of Lehman Brothers Holdings Inc., (29) Registration Statement (Form S-8 No. 333-130161) of Lehman Brothers Holdings Inc., (30) Registration Statement (Form S-8 No. 333-147545) of Lehman Brothers Holdings Inc.;
of our report dated July 10, 2008 relating to the unaudited consolidated interim financial statements of Lehman Brothers Holdings Inc. that is included in its Form 10-Q for the quarter ended May 31, 2008.
We are aware that the aforementioned report, pursuant to Rule 436(c) under the Securities Act of 1933 (the “Act”), is not a part of a registration statement prepared or certified by an accountant or a report prepared or certified by an accountant within the meaning of Sections 7 and 11 of the Act.
New York, NY

LEHMAN BROTHERS HOLDINGS INC.
EXHIBIT 31.01
CERTIFICATION
I, Richard S. Fuld, Jr., certify that:
1. I have reviewed this quarterly report on Form 10-Q of Lehman Brothers Holdings Inc.;
2. Based on my knowledge, this report does not contain any untrue statement of a material fact or omit to state a material fact necessary to make the statements made, in light of the circumstances under which such statements were made, not misleading with respect to the period covered by this report;
3. Based on my knowledge, the financial statements, and other financial information included in this report, fairly present in all material respects the financial condition, results of operations and cash flows of the registrant as of, and for, the periods presented in this report;
4. The registrant’s other certifying officer(s) and I are responsible for establishing and maintaining disclosure controls and procedures (as defined in Exchange Act Rules 13a-15(e) and 15d-15(e)) and internal control over financial reporting (as defined in Exchange Act Rules 13a-15(f) and 15d-15(f)) for the registrant and have:
(a) Designed such disclosure controls and procedures, or caused such disclosure controls and procedures to be designed under our supervision, to ensure that material information relating to the registrant, including its consolidated subsidiaries, is made known to us by others within those entities, particularly during the period in which this report is being prepared;
(b) Designed such internal control over financial reporting, or caused such internal control over financial reporting to be designed under our supervision, to provide reasonable assurance regarding the reliability of financial reporting and the preparation of financial statements for external purposes in accordance with generally accepted accounting principles;
(c) Evaluated the effectiveness of the registrant’s disclosure controls and procedures and presented in this report our conclusions about the effectiveness of the disclosure controls and procedures, as of the end of the period covered by this report based on such evaluation; and
(d) Disclosed in this report any change in the registrant’s internal control over financial reporting that occurred during the registrant’s most recent fiscal quarter (the registrant’s fourth fiscal quarter in the case of an annual report) that has materially affected, or is reasonably likely to materially affect, the registrant’s internal control over financial reporting;
5. The registrant’s other certifying officer(s) and I have disclosed, based on our most recent evaluation of internal control over financial reporting, to the registrant’s auditors and the audit committee of the registrant’s board of directors (or persons performing the equivalent functions):
(a) All significant deficiencies and material weaknesses in the design or operation of internal control over financial reporting which are reasonably likely to adversely affect the registrant’s ability to record, process, summarize and report financial information; and
(b) Any fraud, whether or not material, that involves management or other employees who have a significant role in the registrant’s internal control over financial reporting.
Date: July 10, 2008
/s/ Richard S. Fuld, Jr. Richard S. Fuld, Jr.
Chairman and Chief Executive Officer

LEHMAN BROTHERS HOLDINGS INC.
EXHIBIT 31.02 CERTIFICATION
I, Ian T. Lowitt, certify that:
1. I have reviewed this quarterly report on Form 10-Q of Lehman Brothers Holdings Inc.;
2. Based on my knowledge, this report does not contain any untrue statement of a material fact or omit to state a material fact necessary to make the statements made, in light of the circumstances under which such statements were made, not misleading with respect to the period covered by this report;
3. Based on my knowledge, the financial statements, and other financial information included in this report, fairly present in all material respects the financial condition, results of operations and cash flows of the registrant as of, and for, the periods presented in this report;
4. The registrant’s other certifying officer(s) and I are responsible for establishing and maintaining disclosure controls and procedures (as defined in Exchange Act Rules 13a-15(e) and 15d-15(e)) and internal control over financial reporting (as defined in Exchange Act Rules 13a-15(f) and 15d-15(f)) for the registrant and have:
(a) Designed such disclosure controls and procedures, or caused such disclosure controls and procedures to be designed under our supervision, to ensure that material information relating to the registrant, including its consolidated subsidiaries, is made known to us by others within those entities, particularly during the period in which this report is being prepared;
(b) Designed such internal control over financial reporting, or caused such internal control over financial reporting to be designed under our supervision, to provide reasonable assurance regarding the reliability of financial reporting and the preparation of financial statements for external purposes in accordance with generally accepted accounting principles;
(c) Evaluated the effectiveness of the registrant’s disclosure controls and procedures and presented in this report our conclusions about the effectiveness of the disclosure controls and procedures, as of the end of the period covered by this report based on such evaluation; and
(d) Disclosed in this report any change in the registrant’s internal control over financial reporting that occurred during the registrant’s most recent fiscal quarter (the registrant’s fourth fiscal quarter in the case of an annual report) that has materially affected, or is reasonably likely to materially affect, the registrant’s internal control over financial reporting;
5. The registrant’s other certifying officer(s) and I have disclosed, based on our most recent evaluation of internal control over financial reporting, to the registrant’s auditors and the audit committee of the registrant’s board of directors (or persons performing the equivalent functions):
(a) All significant deficiencies and material weaknesses in the design or operation of internal control over financial reporting which are reasonably likely to adversely affect the registrant’s ability to record, process, summarize and report financial information; and
(b) Any fraud, whether or not material, that involves management or other employees who have a significant role in the registrant’s internal control over financial reporting.
Date: July 10, 2008
/s/ Ian T. Lowitt Ian T. Lowitt
Chief Financial Officer, Controller and Executive Vice President

LEHMAN BROTHERS HOLDINGS INC.
EXHIBIT 32.01
CERTIFICATION PURSUANT TO 18 U.S.C. SECTION 1350,
AS ENACTED BY SECTION 906 OF THE SARBANES-OXLEY ACT OF 2002
Pursuant to Section 906 of the Sarbanes-Oxley Act of 2002 (18 U.S.C. Section 1350), I, Richard S. Fuld, Jr., certify that:
1. The Quarterly Report on Form 10-Q for the quarter ended May 31, 2008 (the “Report”) of Lehman Brothers
Holdings Inc. (the “Company”) as filed with the Securities and Exchange Commission as of the date hereof, fully complies with the requirements of Section 13(a) or 15(d) of the Securities Exchange Act of 1934; and
2. The information contained in the Report fairly presents, in all material respects, the financial condition and
results of operations of the Company. Date: July 10, 2008
/s/ Richard S. Fuld, Jr. Richard S. Fuld, Jr.
Chairman and Chief Executive Officer
A signed original of this written statement required by Section 906, or other document authenticating, acknowledging, or otherwise adopting the signature that appears in typed form within the electronic version of this written statement required by Section 906, has been provided to Lehman Brothers Holdings Inc. and will be retained by Lehman Brothers Holdings Inc. and furnished to the Securities and Exchange Commission or its staff upon request.

LEHMAN BROTHERS HOLDINGS INC.
EXHIBIT 32.02
CERTIFICATION PURSUANT TO 18 U.S.C. SECTION 1350,
AS ENACTED BY SECTION 906 OF THE SARBANES-OXLEY ACT OF 2002
Pursuant to Section 906 of the Sarbanes-Oxley Act of 2002 (18 U.S.C. Section 1350), I, Ian T. Lowitt, certify that:
1. The Quarterly Report on Form 10-Q for the quarter ended May 31, 2008 (the “Report”) of Lehman Brothers
Holdings Inc. (the “Company”) as filed with the Securities and Exchange Commission as of the date hereof, fully complies with the requirements of Section 13(a) or 15(d) of the Securities Exchange Act of 1934; and
2. The information contained in the Report fairly presents, in all material respects, the financial condition and
results of operations of the Company.
Date: July 10, 2008
/s/ Ian T. Lowitt Ian T. Lowitt
Chief Financial Officer, Controller and Executive Vice President
A signed original of this written statement required by Section 906, or other document authenticating, acknowledging, or otherwise adopting the signature that appears in typed form within the electronic version of this written statement required by Section 906, has been provided to Lehman Brothers Holdings Inc. and will be retained by Lehman Brothers Holdings Inc. and furnished to the Securities and Exchange Commission or its staff upon request

Printed with soy ink on recycled paper.