washington, d.c. 20549d18rn0p25nwr6d.cloudfront.net/cik-0001393612/380...loans, private student...
TRANSCRIPT
UNITED STATES SECURITIES AND EXCHANGE COMMISSIONWashington, D.C. 20549
FORM 10-K(Mark One)
x ANNUAL REPORT PURSUANT TO SECTION 13 OR 15(d) OF THE SECURITIES EXCHANGE ACT OF 1934
For the year ended December 31, 2018
o TRANSITION REPORT PURSUANT TO SECTION 13 OR 15(d) OF THE SECURITIES EXCHANGE ACT OF 1934
For the transition period from to Commission File Number 001-33378
DISCOVER FINANCIAL SERVICES(Exact name of registrant as specified in its charter)
Delaware 36-2517428(State or other jurisdiction of incorporation or organization) (I.R.S. Employer Identification No.)
2500 Lake Cook Road, Riverwoods, Illinois 60015 (224) 405-0900
(Address of principal executive offices, including zip code) (Registrant’s telephone number, including area code)
Securities registered pursuant to Section 12(b) of the Act:Title of each class Name of each exchange on which registered
Common Stock, par value $0.01 per share New York Stock Exchange Securities registered pursuant to Section 12(g) of the Act: None
Indicate by check mark if the registrant is a well-known seasoned issuer, as defined in Rule 405 of the Securities Act. Yes x No o
Indicate by check mark if the registrant is not required to file reports pursuant to Section 13 or Section 15(d) of the Exchange Act. Yes o No x
Indicate by check mark whether the registrant (1) has filed all reports required to be filed by Section 13 or 15(d) of the Securities Exchange Act of 1934 during the preceding 12months (or for such shorter period that the registrant was required to file such reports), and (2) has been subject to such filing requirements for the past 90 days. Yes x No o
Indicate by check mark whether the registrant has submitted electronically every Interactive Data File required to be submitted pursuant to Rule 405 of Regulation S-T(§232.405 of this chapter) during the preceding 12 months (or for such shorter period that the registrant was required to submit such files). Yes x No o
Indicate by check mark if disclosure of delinquent filers pursuant to Item 405 of Regulation S-K (§229.405 of this chapter) is not contained herein, and will not be contained, tothe best of registrant’s knowledge, in definitive proxy or information statements incorporated by reference in Part III of this Form 10-K or any amendment to this Form 10-K. x
Indicate by check mark whether the registrant is a large accelerated filer, an accelerated filer, a non-accelerated filer, or a smaller reporting company. See the definitions of“large accelerated filer,” “accelerated filer” and “smaller reporting company” in Rule 12b-2 of the Exchange Act.
Large accelerated filer xAccelerated filer o
Non-accelerated filer o Smaller reporting company o
If an emerging growth company, indicate by check mark if the registrant has elected not to use the extended transition period for complying with any new or revised financialaccounting standards provided pursuant to Section 13(a) of the Exchange Act. o
Indicate by check mark whether the registrant is a shell company (as defined in Rule 12b-2 of the Exchange Act). Yes o No x
The aggregate market value of the common equity held by non-affiliates of the registrant on the last business day of the registrant’s most recently completed second fiscalquarter was approximately $24,123,706,276 .
As of February 15, 2019 , there were 328,386,672 shares of the registrant’s Common Stock, par value $0.01 per share, outstanding.
DOCUMENTS INCORPORATED BY REFERENCEPortions of the registrant’s definitive proxy statement for its annual stockholders’ meeting to be held on May 16, 2019 are incorporated by reference in Part III of this Form 10-K.
DISCOVER FINANCIAL SERVICESAnnual Report on Form 10-K for the year ended December 31, 2018
TABLE OF CONTENTS
Part I Item 1. Business 1Item 1A. Risk Factors 24Item 1B. Unresolved Staff Comments 41Item 2. Properties 41Item 3. Legal Proceedings 41Item 4. Mine Safety Disclosures 41 Part II Item 5. Market for Registrant's Common Equity, Related Stockholder Matters and Issuer Purchases of Equity Securities 42Item 6. Selected Financial Data 43Item 7. Management's Discussion and Analysis of Financial Condition and Results of Operations 46Item 7A. Quantitative and Qualitative Disclosures about Market Risk 72Item 8. Financial Statements and Supplementary Data 74Item 9. Changes in and Disagreements with Accountants on Accounting and Financial Disclosure 145Item 9A. Controls and Procedures 145Item 9B. Other Information 145 Part III Item 10. Directors, Executive Officers and Corporate Governance 146Item 11. Executive Compensation 146Item 12. Security Ownership of Certain Beneficial Owners and Management and Related Stockholder Matters 146Item 13. Certain Relationships and Related Transactions, and Director Independence 147Item 14. Principal Accounting Fees and Services 147
Part IV Item 15. Exhibits, Financial Statement Schedules 148Item 16. Form 10-K Summary 155
Except as otherwise indicated or unless the context otherwise requires, “Discover Financial Services,” “Discover,” “DFS,” “we,” “us,” “our,” and “the Company” refer toDiscover Financial Services and its subsidiaries. See Item 8 — Financial Statements and Supplementary Data — Glossary of Acronyms for terms and abbreviations usedthroughout the annual report.
We own or have rights to use the trademarks, trade names and service marks that we use in conjunction with the operation of our business, including, but not limited to:Discover ® , PULSE ® , Cashback Bonus ® , Discover Cashback Checking ® , Discover it ® , Freeze it ® College Covered ® , and Diners Club International ® . All othertrademarks, trade names and service marks included in this annual report on Form 10-K are the property of their respective owners.

Table of Contents
Part I.
Part I | Item 1. Business
IntroductionDiscover Financial Services (the “Company”) is a direct banking and payment services company. We were incorporated in Delaware in 1960.
We are a bank holding company under the Bank Holding Company Act of 1956 as well as a financial holding company under the Gramm-Leach-Bliley Act and therefore are subject to oversight, regulation and examination by the Board of Governors of the Federal Reserve System (the “FederalReserve”). We provide direct banking products and services and payment services through our subsidiaries. We offer our customers credit cardloans, private student loans, personal loans, home equity loans and deposit products. We had $90.5 billion in loan receivables and $44.7 billion indeposits issued through direct-to-consumer channels and affinity relationships at December 31, 2018 . We also operate the Discover Network, thePULSE network (“PULSE”) and Diners Club International (“Diners Club”). The Discover Network processes transactions for Discover-branded creditand debit cards and provides payment transaction processing and settlement services. PULSE operates an electronic funds transfer network,providing financial institutions issuing debit cards on the PULSE network with access to ATMs domestically and internationally, as well as point-of-sale (“POS”) terminals at retail locations throughout the U.S. for debit card transactions. Diners Club is a global payments network of licensees,which are generally financial institutions, that issue Diners Club branded charge cards and/or provide card acceptance services.
Available InformationWe make available, free of charge through the investor relations page of our internet site www.discover.com, our annual reports on Form 10-
K, quarterly reports on Form 10-Q, current reports on Form 8-K, proxy statements, Forms 3, 4 and 5 filed by or on behalf of our directors andexecutive officers, and any amendments to those documents filed with or furnished to the Securities and Exchange Commission (the “SEC”)pursuant to the Securities Exchange Act of 1934. These filings are available as soon as reasonably practicable after they are filed with or furnishedto the SEC.
In addition, the following information is available on the investor relations page of our internet site: (i) our Corporate Governance Policies;(ii) our Code of Ethics and Business Conduct; and (iii) the charters of the Audit, Compensation and Leadership Development, Nominating andGovernance, and Risk Oversight Committees of our Board of Directors. These documents are also available in print without charge to any personwho requests them by writing or telephoning our principal executive offices: Discover Financial Services, Office of the Corporate Secretary, 2500Lake Cook Road, Riverwoods, Illinois 60015, U.S.A., telephone number (224) 405-0900.
Operating ModelWe manage our business activities in two segments: Direct Banking and Payment Services. Our Direct Banking segment includes consumer
banking and lending products, specifically Discover-branded credit cards issued to individuals on the Discover Network and other consumer bankingproducts and services, including student loans, personal loans, home equity loans and deposit products. Our Payment Services segment includesPULSE, Diners Club and our Network Partners business, which provides payment transaction processing and settlement services on the DiscoverNetwork.
We are principally engaged in providing products and services to customers in the United States, although the royalty and licensee revenuewe receive from Diners Club licensees is mainly derived from sources outside of the United States. For quantitative information concerning ourgeographic distribution, see Note 4: Loan Receivables to our consolidated financial statements.
Below are descriptions of the principal products and services of each of our reportable segments. For additional financial information relatingto our business and our operating segments, see Note 22: Segment Disclosures to our consolidated financial statements.
- 1 -
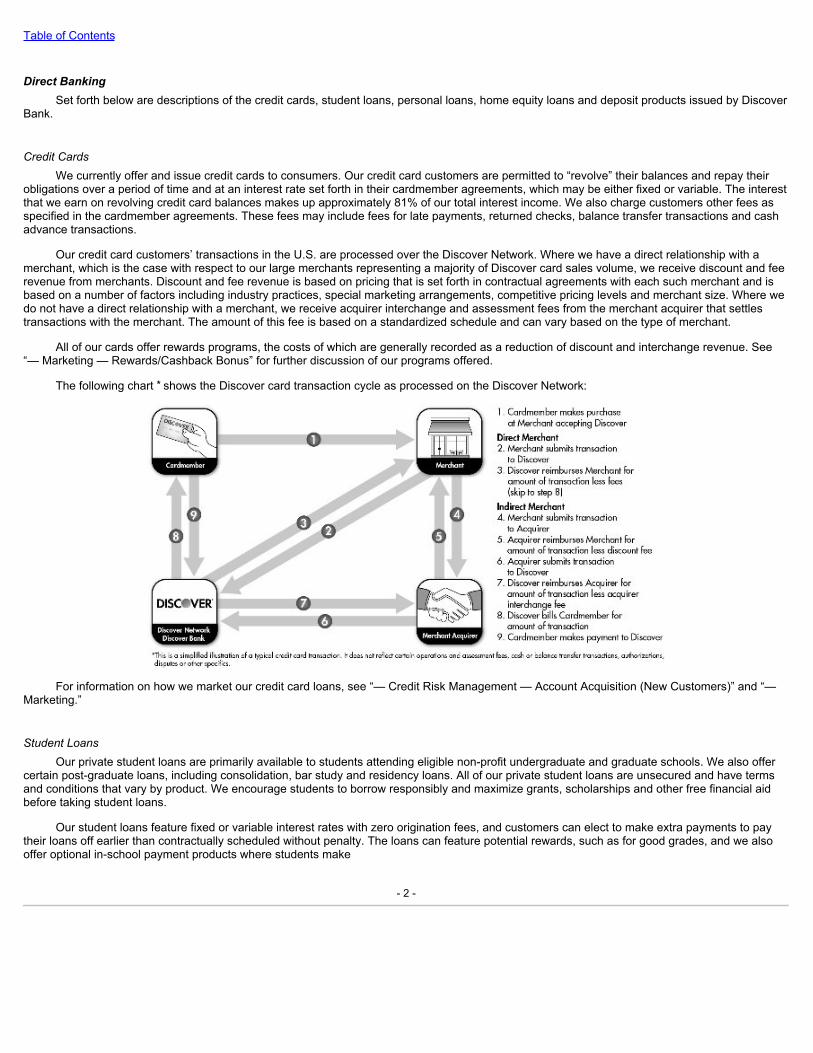
Table of Contents
DirectBankingSet forth below are descriptions of the credit cards, student loans, personal loans, home equity loans and deposit products issued by Discover
Bank.
CreditCardsWe currently offer and issue credit cards to consumers. Our credit card customers are permitted to “revolve” their balances and repay their
obligations over a period of time and at an interest rate set forth in their cardmember agreements, which may be either fixed or variable. The interestthat we earn on revolving credit card balances makes up approximately 81% of our total interest income. We also charge customers other fees asspecified in the cardmember agreements. These fees may include fees for late payments, returned checks, balance transfer transactions and cashadvance transactions.
Our credit card customers’ transactions in the U.S. are processed over the Discover Network. Where we have a direct relationship with amerchant, which is the case with respect to our large merchants representing a majority of Discover card sales volume, we receive discount and feerevenue from merchants. Discount and fee revenue is based on pricing that is set forth in contractual agreements with each such merchant and isbased on a number of factors including industry practices, special marketing arrangements, competitive pricing levels and merchant size. Where wedo not have a direct relationship with a merchant, we receive acquirer interchange and assessment fees from the merchant acquirer that settlestransactions with the merchant. The amount of this fee is based on a standardized schedule and can vary based on the type of merchant.
All of our cards offer rewards programs, the costs of which are generally recorded as a reduction of discount and interchange revenue. See“— Marketing — Rewards/Cashback Bonus” for further discussion of our programs offered.
The following chart * shows the Discover card transaction cycle as processed on the Discover Network:
For information on how we market our credit card loans, see “— Credit Risk Management — Account Acquisition (New Customers)” and “—Marketing.”
StudentLoansOur private student loans are primarily available to students attending eligible non-profit undergraduate and graduate schools. We also offer
certain post-graduate loans, including consolidation, bar study and residency loans. All of our private student loans are unsecured and have termsand conditions that vary by product. We encourage students to borrow responsibly and maximize grants, scholarships and other free financial aidbefore taking student loans.
Our student loans feature fixed or variable interest rates with zero origination fees, and customers can elect to make extra payments to paytheir loans off earlier than contractually scheduled without penalty. The loans can feature potential rewards, such as for good grades, and we alsooffer optional in-school payment products where students make
- 2 -

Table of Contents
monthly payments while in school. The standard repayment period is 15 to 20 years, depending on the type of student loan. Student loans mayinclude a deferment period, during which customers are not required to make payments while enrolled in school at least half time as determined bythe school. This period begins on the date the loan is first disbursed and ends six to nine months (depending on loan type) after the customerceases to be enrolled in school at least half time. As part of the loan approval process, all of our student loans, except for bar study, residency andprivate consolidation loans, are certified by and disbursed through the school to ensure students do not borrow more than the cost of attendanceless other financial aid.
We market our student loans through digital channels, direct mail, email, radio and television. We also work with schools to create awarenessof our products with students and their families. Students can apply for our student loans online, by telephone or by mail, and we have dedicatedstaff within our call centers to service student loans. We invite applicants who qualify to apply with a creditworthy cosigner, which may improve thelikelihood of loan approval and a lower interest rate.
PersonalLoansOur personal loans are primarily intended to help customers consolidate existing debt, although they can be used for other reasons. These
loans are unsecured with fixed interest rates, terms and payments, and have zero origination fees. The repayment period for personal loans is threeto seven years and there is no prepayment penalty for repaying any portion of a personal loan balance prior to the scheduled maturity date.Customers may be subject to other charges, including late fees when a customer has not made a minimum payment by the contractual due date.
We generally market personal loans through direct mail, digital channels and email. Prospective applicants can obtain information regardingDiscover Personal Loans online or by telephone and have the ability to apply online, by telephone or through the mail.
HomeEquityLoansOur home equity loans are intended for multiple purposes, including mortgage refinance, debt consolidation, home improvement and other
major expenses. These loans are closed-end, secured loans with fixed interest rates, terms and payments. These loans are secured by a first orsecond lien on a customer’s home and require monthly payment over a 10 to 30 year term. Customers may elect to make larger than minimumpayments without being subject to a prepayment penalty, although certain third-party costs may be required to be reimbursed by the customer if theloan is repaid in full within three years. Customers may also be subject to additional charges, including late fees and returned payment charges.
We market home equity loans through a mix of direct mail, digital channels and email. Prospective applicants can obtain information and applyonline or by telephone.
DepositsWe obtain deposits from consumers directly or through affinity relationships (“direct-to-consumer deposits”). Additionally, we obtain deposits
through third-party securities brokerage firms that offer our deposits to their customers (“brokered deposits”). Our direct-to-consumer depositproducts include online savings accounts, certificates of deposit, money market accounts, Individual Retirement Arrangement certificates of depositand checking accounts, while our brokered deposit products include certificates of deposit and sweep accounts. All of our deposits are insured bythe Federal Deposit Insurance Corporation (the “FDIC”) to the maximum permitted by law. We do not pay interest on checking account balancesand instead offer cashback rewards for certain debit card purchases. Certificates of deposit are offered on a range of tenors from three monthsthrough ten years with interest rates that are fixed for the full period. There are minimum balance requirements to open certificates of deposit andpenalties for early withdrawals. Money market accounts are transactional accounts with minimum balance requirements. Money market accountsand savings accounts have limitations on withdrawal frequency, as required by law, and interest rates on these accounts are subject to change atany time. Fees apply to some transactions and availability of funds varies based on product and method of funding.
We market our direct-to-consumer deposit products through the use of radio, print materials, direct mail, affinity arrangements with thirdparties and digital channels. Customers can generally apply for deposit accounts online or by telephone. Checking account applications can only beinitiated online. For more information regarding our deposit products, see “Management’s Discussion and Analysis of Financial Condition andResults of Operations — Liquidity and Capital Resources — Funding Sources — Deposits.”
- 3 -

Table of Contents
PaymentServicesSet forth below are descriptions of PULSE, Diners Club and our Network Partners business, which provides, among other services, payment
transaction processing and settlement services.
PULSEOur PULSE network is one of the nation’s leading debit/ATM networks. PULSE links cardholders served by approximately 4,100 financial
institutions to ATMs and POS terminals located throughout the United States, including cardholders at financial institutions with which PULSE hasdirect relationships and through agreements PULSE has with other debit networks. PULSE also provides cash access at approximately 2.1 millionATMs in 134 countries.
PULSE’s primary source of revenue is transaction fees charged for switching and settling ATM and debit transactions initiated through the useof debit cards issued by participating financial institutions. In addition, PULSE offers a variety of optional products and services that produce incomefor the network, including signature debit transaction processing, debit card fraud detection and risk mitigation services, and connections to otherregional and national electronic funds transfer networks.
When a financial institution joins the PULSE network, debit cards issued by that institution are eligible to be used at all of the ATMs and POSdebit terminals that participate in the PULSE network, and the PULSE mark can be used on that institution’s debit cards and ATMs. In addition,financial institution participants may sponsor merchants, direct processors and independent sales organizations to participate in the PULSE POSand ATM debit service. A participating financial institution assumes liability for transactions initiated through the use of debit cards issued by thatinstitution, as well as for ensuring compliance with PULSE’s operating rules and policies applicable to that institution’s debit cards, ATMs and, ifapplicable, sponsored merchants, direct processors and independent sales organizations.
When PULSE enters into a network-to-network agreement with another debit network, the other network’s participating financial institutions’debit cards can be used at terminals in the PULSE network. PULSE does not have a direct relationship with these financial institutions and the othernetwork bears the financial responsibility for transactions of those financial institutions’ cardholders and for ensuring compliance with PULSE’soperating rules.
DinersClubOur Diners Club business maintains an acceptance network in more than 190 countries and territories through its relationships with over 120
licensees, which are generally financial institutions. We do not directly issue Diners Club cards to consumers, but grant our licensees the right toissue Diners Club branded cards and/or provide card acceptance services. Our licensees pay us royalties for the right to use the Diners Club brand,which is our primary source of Diners Club revenues. We also earn revenue from providing various support services to our Diners Club licensees,including processing and settlement of cross-border transactions. We also provide a centralized service center and internet services to ourlicensees.
When Diners Club cardholders use their cards outside the host country or territory of the issuing licensee, transactions are routed and settledover the Diners Club network through its centralized service center. In order to increase merchant acceptance in certain targeted countries andterritories, we work with merchant acquirers to offer Diners Club and Discover acceptance to their merchants. These acquirers are granted licensesto market the Diners Club brands to existing and new merchants. As we continue to work toward achieving full card acceptance across ournetworks, Discover customers are using their cards at an increasing number of merchant and ATM locations that accept Diners Club cards aroundthe world. Diners Club cardholders with cards issued by licensees outside of North America continue to use their cards on the Discover Network inNorth America and on the PULSE and Diners Club networks domestically and internationally, respectively.
NetworkPartnersBusinessWe have agreements with a number of financial institutions, networks and commercial service providers for issuance of products or
processing of payments on Discover networks. We refer to these financial institutions, networks and commercial service providers as “NetworkPartners.” We may earn merchant discount and acquirer assessments net of issuer fees paid, in addition to other fees, for processing transactionsfor Network Partners. We also leverage our payments infrastructure in other ways, such as business-to-business payment processing.
- 4 -
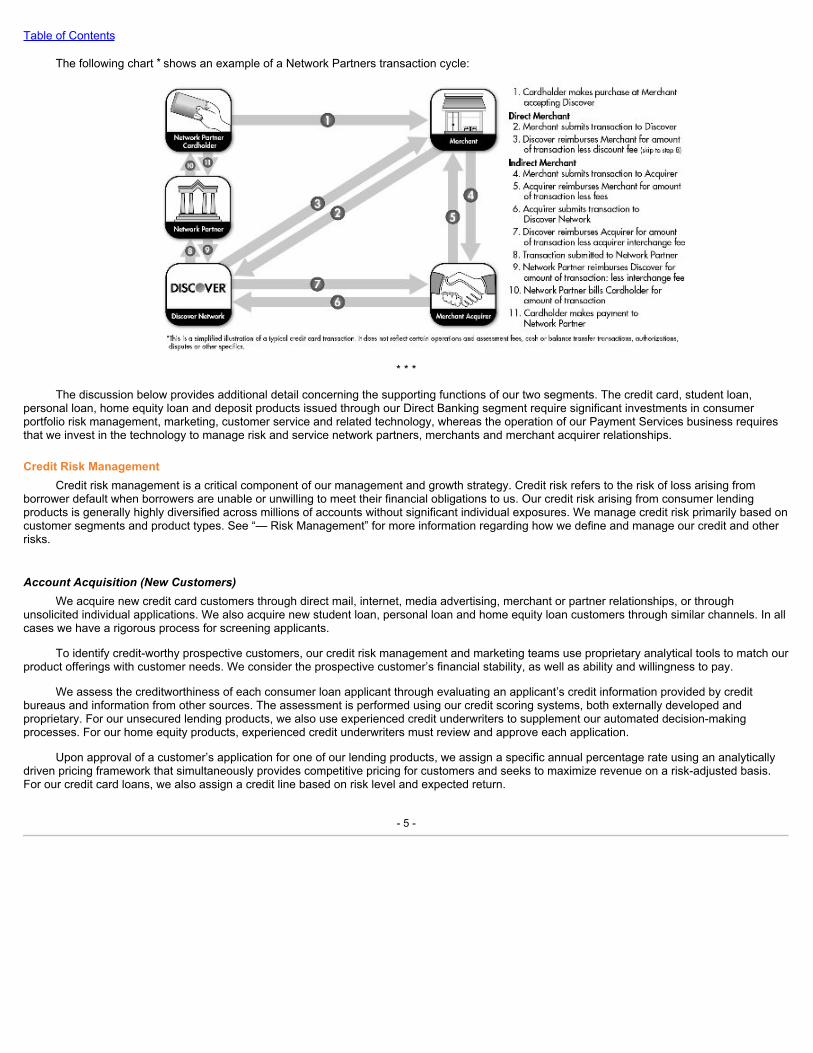
Table of Contents
The following chart * shows an example of a Network Partners transaction cycle:
* * *
The discussion below provides additional detail concerning the supporting functions of our two segments. The credit card, student loan,personal loan, home equity loan and deposit products issued through our Direct Banking segment require significant investments in consumerportfolio risk management, marketing, customer service and related technology, whereas the operation of our Payment Services business requiresthat we invest in the technology to manage risk and service network partners, merchants and merchant acquirer relationships.
Credit Risk ManagementCredit risk management is a critical component of our management and growth strategy. Credit risk refers to the risk of loss arising from
borrower default when borrowers are unable or unwilling to meet their financial obligations to us. Our credit risk arising from consumer lendingproducts is generally highly diversified across millions of accounts without significant individual exposures. We manage credit risk primarily based oncustomer segments and product types. See “— Risk Management” for more information regarding how we define and manage our credit and otherrisks.
AccountAcquisition(NewCustomers)We acquire new credit card customers through direct mail, internet, media advertising, merchant or partner relationships, or through
unsolicited individual applications. We also acquire new student loan, personal loan and home equity loan customers through similar channels. In allcases we have a rigorous process for screening applicants.
To identify credit-worthy prospective customers, our credit risk management and marketing teams use proprietary analytical tools to match ourproduct offerings with customer needs. We consider the prospective customer’s financial stability, as well as ability and willingness to pay.
We assess the creditworthiness of each consumer loan applicant through evaluating an applicant’s credit information provided by creditbureaus and information from other sources. The assessment is performed using our credit scoring systems, both externally developed andproprietary. For our unsecured lending products, we also use experienced credit underwriters to supplement our automated decision-makingprocesses. For our home equity products, experienced credit underwriters must review and approve each application.
Upon approval of a customer’s application for one of our lending products, we assign a specific annual percentage rate using an analyticallydriven pricing framework that simultaneously provides competitive pricing for customers and seeks to maximize revenue on a risk-adjusted basis.For our credit card loans, we also assign a credit line based on risk level and expected return.
- 5 -

Table of Contents
PortfolioManagement(ExistingCustomers)The revolving nature of our credit card loans requires that we regularly assess the credit risk exposure of such accounts. This assessment
uses the individual’s Discover account performance information as well as information from credit bureaus. We utilize statistical evaluation models tosupport the measurement and management of credit risk. At the individual customer level, we use custom risk models together with generic industrymodels as an integral part of the credit decision-making process. Depending on the duration of the customer’s account, risk profile and otherperformance metrics, the account may be subject to a range of account management treatments, including transaction authorization limits andincreases or decreases on credit limits.
CustomerAssistanceWe provide our customers with a variety of tools to proactively manage their accounts, including email, text message and push reminders and
a website dedicated to customer education, as further discussed under the heading “— Customer Service.” These tools are designed to limit acustomer’s risk of becoming delinquent. When a customer’s account becomes delinquent or is at risk of becoming delinquent, we employ a varietyof strategies to assist customers in returning to current status on their accounts.
All monthly billing statements of accounts with past due amounts include a request for payment of such amounts. Customer assistancepersonnel generally initiate contact with customers within 30 days after any portion of their balance becomes past due. The nature and the timing ofthe initial contact are determined by a review of the customer’s prior account activity and payment habits.
We reevaluate our collection efforts, and consider the implementation of other techniques, as a customer becomes increasingly delinquent.We limit our exposure to delinquencies through controls within our process for authorizing transactions and credit limits and criteria-based accountsuspension and revocation. In situations involving customers with financial difficulties, we may enter into arrangements to extend or otherwisechange payment schedules, lower interest rates and/or waive fees to aid customers in returning to current status on their obligations to us. For moreinformation see Note 4: Loan Receivables to our consolidated financial statements.
MarketingIn addition to working with our credit risk management personnel on account acquisition and portfolio management, our marketing group
provides other key functions, including product development, management of our Cashback Bonus and other rewards programs, protection productmanagement, and brand and advertising management.
ProductDevelopmentIn order to attract and retain customers and merchants, we continue to develop new programs, features and benefits and market them
through a variety of channels, including television, radio, mail, telephone and digital. Marketing efforts may promote no annual fee, Cashback Bonus,FICO Credit Score for free, Freeze it, Social Security Number Alerts, New Account Alerts, balance transfer offers and other rewards programs.Through the development of a large prospect database, use of credit bureau data and use of a customer contact strategy and management system,we continuously develop our modeling and customer engagement capabilities, which helps optimize product, pricing and channel selection.
Rewards/CashbackBonusOur cardmembers use several card products, all with no annual fee, that allow them to earn their rewards based on how they want to use
credit, which can be redeemed in any amount at any time, in general as set forth below.
• Discoveritcard offers 5% Cashback Bonus in categories that change each quarter up to a quarterly maximum (signing up is required) and1% Cashback Bonus on all other purchases.
• DiscoveritChromecard offers 2% Cashback Bonus at gas stations and restaurants on up to $1,000 in combined purchases each quarterand 1% Cashback Bonus on all other purchases.
• DiscoveritMilescard offers 1.5 miles for every dollar spent on purchases.
• Disco veritSecuredcard offers the same reward features as the Discover it Chrome card. Customers provide a security deposit ascollateral for the credit card account. Starting at eight months after the account opening,
- 6 -

Table of Contents
Discover reviews the account to determine if the security deposit can be refunded to the customer and they graduate to an unsecured line ofcredit.
• DiscoverMorecard offers 5% Cashback Bonus in categories that change each quarter up to a quarterly maximum (signing up is required).Customers earn .25% Cashback Bonus on their first $3,000 on all other annual purchases and on all warehouse purchases, and 1%Cashback Bonus on purchases over $3,000.
• DiscoveritBusinesscard offers 1.5% Cashback Bonus on all purchases.
ProtectionProductsWe currently sell an identity theft protection product, and we service and maintain existing enrollments of the payment and wallet protection
products detailed below for our credit card customers.
• IdentityTheftProtection.The most comprehensive identity theft monitoring product includes an initial credit report, credit bureau reportmonitoring at the three major credit bureaus, prompt alerts to key changes to credit bureau files that help customers spot possible identitytheft quickly, internet surveillance to monitor multiple credit and debit card numbers and social security numbers on suspicious websites,identity theft insurance of $1,000,000 to cover certain out-of-pocket expenses due to identity theft, and access to knowledgeableprofessionals who can help resolve issues.
• PaymentProtection.This product allows customers to suspend their minimum payments due for up to two years, depending on thequalifying event and product level, when certain qualifying life events occur. While on benefit, customers have no minimum monthlypayment, and are not charged interest, late fees or the fees for the product. This product covers a variety of different events, such asunemployment, disability, natural disasters or other life events, such as marriage or birth of a child. Depending on the product level andavailability under state laws, outstanding balances up to $10,000 or $25,000, are cancelled in the event of death.
• WalletProtection.This product offers one-call convenience if a customer’s wallet is lost or stolen, including requesting cancellation andreplacement of the customer’s credit and debit cards, monitoring the customer’s credit bureau reports at the three major credit bureaus for180 days and alerting them to key changes to their credit files, and providing up to $100 to replace the customer’s wallet or purse.
BrandandAdvertisingManagementWe maintain a full-service marketing department charged with delivering integrated mass and direct communications to foster customer
engagement with our products and services. We also leverage strategic partnerships with sponsorship properties such as the NHL and the Big TenConference to help drive loan growth. Our brand team utilizes consumer insights and market intelligence to define our mass communicationstrategy, create multi-channel advertising messages and develop marketing partnerships with sponsorship properties. This work is performed inhouse as well as with a variety of external agencies and vendors.
Customer ServiceOur credit card customers have the option to manage their accounts online via Discover.com, through Discover Mobile applications and by
calling our U.S.-based customer service personnel. Our digital solutions offer a range of benefits, which may include:
• Access to overall credit health tools such as Credit Scorecard, Freeze it, Social Security Number Alerts and New Account Alerts;
• Customer service via multiple communication channels, including messaging, chat and 24/7 customer service by telephone; and
• Proactive notifications via email, text messaging and in-app messaging for monitoring transaction activity and account security.
Our student loan, personal loan, home equity loan and deposit product customers can utilize our online account services to manage theiraccounts and to use interactive tools and calculators.
- 7 -
Table of Contents
ProcessingServicesOur processing services cover four functional areas: card personalization, print/mail, remittance processing and document processing. Card
personalization is responsible for the mailing of credit and debit cards for new accounts, replacements and reissues. Print/mail specializes instatement and letter printing and mailing. Remittance processing handles account payments and check processing. Document processing handleshard-copy forms, including new account applications.
Fraud PreventionWe monitor our customers’ accounts to help prevent, detect, investigate and resolve fraud. Our fraud prevention processes are designed to
protect the security of cards, applications and accounts in a manner consistent with our customers’ needs to easily acquire and use our products.Prevention systems monitor the authorization of application information, verification of customer identity, sales, processing of convenience andbalance transfer checks, and electronic transactions.
Each credit and debit card transaction is subject to screening, authorization and approval through externally developed and proprietary POSdecision systems and each transaction for a deposit account is subject to screening and approval through a dynamic transaction evaluation andscoring methodology. We use a variety of techniques that help identify and halt fraudulent transactions, including adaptive models, rules-baseddecision-making logic, report analysis, data integrity checks and manual account reviews. We manage accounts identified by the fraud detectionsystem through technology that integrates fraud prevention and customer service. Strategies are subject to regular review and enhancement toenable us to respond quickly to changing conditions as well as to protect our customers and our business from emerging fraud activity.
Discover Network OperationsWe support our merchants through a merchant acquiring model that includes direct relationships with large merchants in the United States
and arrangements with merchant acquirers generally for small- and mid-size merchants. In addition to our U.S.-based merchant acceptancelocations, Discover Network cards also are accepted at many locations in Canada, Mexico, the Caribbean, China, Japan and a growing number ofcountries around the world on the Diners Club network, or through reciprocal acceptance arrangements made with international payment networks(i.e., network-to-network).
We maintain direct relationships with most of our large merchant accounts, which enables us to benefit from joint marketing programs andopportunities and to retain the entire discount revenue from the merchants. The terms of our direct merchant relationships are governed bymerchant services agreements. These agreements are also accompanied by additional program documents that further define our networkfunctionality and requirements, including operating regulations, technical specifications and dispute rules. To enable ongoing improvements in ournetwork’s functionality and in accordance with industry convention, we publish updates to our program documents on a semi-annual basis.
Discover Network services the majority of its small- and mid-size merchant portfolios through third-party merchant acquirers to allow suchacquirers to offer a comprehensive payments processing package to such merchants. Merchants also can apply to our merchant acquirer partnersdirectly to accept Discover Network cards through the acquirers’ integrated payments solutions. Merchant acquirers provide merchants withconsolidated servicing for Discover, Visa and MasterCard transactions, resulting in streamlined statements and customer service for merchants, andreduced costs for us. These acquirer partners also perform credit evaluations and screen applications against unacceptable business types and theOffice of Foreign Asset Control Specifically Designated Nationals list.
Discover Network operates systems and processes that seek to ensure data integrity, prevent fraud and ensure compliance with our operatingregulations. Our systems evaluate incoming transaction activity to identify abnormalities that require investigation and fraud mitigation. DesignatedDiscover Network personnel are responsible for validating compliance with our operating regulations and law, including enforcing our data securitystandards and prohibitions against illegal or otherwise unacceptable activities. Discover Network is a founding and current member of the PaymentCard Industry Security Standards Council, LLC (the “Council”) and is working to expand the adoption of the Council’s security standards globally formerchants and service providers that store, transmit or process cardholder data.
- 8 -

Table of Contents
TechnologyWe provide technology systems processing through a combination of owned and hosted data centers and the use of third-party vendors.
These data centers support our payment networks, provide customers with access to their accounts and manage transaction authorizations, amongother functions. Discover Network works with a number of vendors to maintain our connectivity in support of POS authorizations. This connectivityalso enables merchants to receive timely payment for their Discover Network card transactions.
Our approach to technology development and management involves both third-party and in-house resources. We use third-party vendors forbasic technology services (e.g., telecommunications, hardware and operating systems) as well as for processing and other services for our directbanking and payment services businesses. We subject each vendor to a formal approval process, which includes among other things a securityassessment, to ensure that the vendor can assist us in maintaining a cost-effective and reliable technology platform. We use our in-house resourcesto build, maintain and oversee some of our technology systems. We believe this approach enhances our operations and improves cost efficiencies.
SeasonalityIn our credit card business, we experience fluctuations in transaction volumes and the level of loan receivables as a result of higher seasonal
consumer spending and payment patterns around the winter holidays, summer vacations and back-to-school periods. In our student loan business,our loan disbursements peak at the beginning of a school’s academic semester or quarter. Although there is a seasonal impact to transactionvolumes and the levels of credit card and student loan receivables, seasonal trends have not caused significant fluctuations in our results ofoperations or credit quality metrics between quarterly and annual periods.
Revenues in our Diners Club business are generally higher in the first half of the year as a result of Diners Club’s tiered pricing system wherelicensees qualify for lower royalty rate tiers as cumulative volume grows during the course of the year.
CompetitionWe compete with other consumer financial services providers, including non-traditional providers such as financial technology firms and
payment networks on the basis of a number of factors, including brand, reputation, customer service, product and service offerings, incentives,pricing and other terms. Our credit card business also competes on the basis of reward programs and merchant acceptance. We compete foraccounts and utilization with cards issued by other financial institutions (including American Express, Bank of America, JPMorgan Chase, CapitalOne and Citi) and, to a lesser extent, businesses that issue their own private label cards or otherwise extend credit to their customers. Incomparison to our largest credit card competitors, our strengths include cash rewards, conservative portfolio management and strong customerservice. Competition based on rewards and other card features and benefits continues to be strong. Our student loan product competes forcustomers with Sallie Mae and Wells Fargo, as well as other lenders that offer private student loans. Our personal loan product competes forcustomers primarily with Wells Fargo, Citi and non-traditional lenders, including financial technology firms and peer to peer lenders. Our home equityloan product faces competition primarily from traditional branch lending institutions, credit unions and other home equity installment lenders, as wellas providers of cash-out refinance loans and home equity lines of credit.
Although our student and personal loan receivables have increased, our credit card receivables continue to represent a majority of ourreceivables. The credit card business is highly competitive. Some of our competitors offer a wider variety of financial products than we do, whichmay currently position them better among customers who prefer to use a single financial institution to meet all of their financial needs. Some of ourcompetitors enjoy greater financial resources, diversification and scale than we do, and are therefore able to invest more in initiatives andtechnology to attract and retain customers, such as advertising, targeted marketing, account acquisitions and pricing offerings in interest rates,annual fees, reward programs and low-priced balance transfer programs. In addition, some of our competitors have assets such as branch locationsand co-brand relationships that may help them compete more effectively. Another competitive factor in the credit card business is the increasing useof debit cards as an alternative to credit cards for purchases.
Because most domestically-issued credit cards, other than those issued on the American Express network, are issued on the Visa andMasterCard networks, most other card issuers benefit from the dominant market share of Visa and MasterCard. The former exclusionary rules ofVisa and MasterCard limited our ability to attract merchants and credit and debit card issuers, contributing to Discover not being as widely acceptedin the U.S. as Visa and
- 9 -
Table of Contents
MasterCard. Merchant acceptance of the Discover card has increased in the past several years, both in the number of merchants enabled foracceptance and the number of merchants actively accepting Discover. We continue to make investments in expanding Discover and Diners Clubacceptance in key international markets where an acceptance gap exists.
In our payment services business, we compete with other networks for volume and to attract network partners to issue credit, debit andprepaid cards on the Discover, PULSE and Diners Club networks. We generally compete on the basis of customization of services and variouspricing strategies, including incentives and rebates. We also compete on the basis of issuer fees, fees paid to networks (including switch fees),merchant acceptance, network functionality, customer perception of service quality, brand image, reputation and market share. The Diners Club andDiscover networks’ primary competitors are Visa, MasterCard and American Express, and PULSE’s network competitors include Visa’s Interlink,MasterCard’s Maestro and First Data’s STAR. American Express is a particularly strong competitor to Diners Club as both cards target internationalbusiness travelers. As the payments industry continues to evolve, we are also facing increasing competition from financial technology firms andalternative payment solutions, which leverage new technologies and a customer’s existing deposit and credit card accounts and bank relationshipsto create payment or other fee-based solutions.
In our direct-to-consumer deposits business, we have acquisition and servicing capabilities similar to other large direct banks, including Ally,American Express, Barclays, Capital One (360), Goldman Sachs, Synchrony and USAA. We compete with traditional banks and credit unions thatsource deposits through branch locations and direct channels. We seek to differentiate our deposit product offerings on the basis of brandreputation, digital experience, customer service and value.
For more information regarding the nature of and the risks we face in connection with the competitive environment for our products andservices, see “Risk Factors — Strategic Business Risk.”
Intellectual PropertyWe use a variety of methods, such as trademarks, patents, copyrights and trade secrets, to protect our intellectual property. We also place
appropriate restrictions on our proprietary information to control access and prevent unauthorized disclosures. Our Discover, PULSE and DinersClub brands are important assets, and we take steps to protect the value of these assets and our reputation.
EmployeesAs of December 31, 2018 , we employed approximately 16,600 individuals.
Risk ManagementOur business exposes us to strategic (including reputational), credit, market, liquidity, operational, compliance and legal risks. We use an
enterprise-wide risk management framework to identify, measure, monitor, manage and report risks that affect or could affect the achievement ofour strategic, financial and other objectives.
EnterpriseRiskManagementPrinciplesOur enterprise risk management philosophy is expressed through five key principles that guide our approach to risk management:
Comprehensiveness, Accountability, Independence, Defined Risk Appetite and Transparency.
ComprehensivenessWe seek to maintain a comprehensive risk management framework for managing risk enterprise-wide, including policies, risk management
processes, monitoring and testing, and reporting. Our framework is designed to be comprehensive with respect to our business units and theircontrol and support functions, and across all risk types.
AccountabilityWe structure accountability across three lines of defense along the principles of risk management execution, oversight and independent
validation. As the first line of defense, our business units seek to manage the risks to which they are exposed as a result of their activities, includingthose risks arising from activities that have been outsourced to third parties. The principles apply across all businesses and risk types and guide thedefinition of specific roles and responsibilities.
- 10 -

Table of Contents
IndependenceOur second and third lines of defense, which are comprised of risk and control functions, operate independent of the business units. The
second line of defense includes our corporate risk management (“CRM”) department, which is led by our Chief Risk Officer (“CRO”), who isappointed by our Board of Directors. The CRM department sets risk management standards and policies that are consistent with the size andcomplexity of our business, industry practices and applicable legal and regulatory requirements. The CRO is accountable for providing our Board ofDirectors and executive management with an independent perspective on: the risks to which we are exposed; how well management is identifying,assessing and managing risk; and the capabilities we have in place to manage risks across the enterprise. Our internal audit department, as thethird line of defense, performs periodic, independent reviews and tests compliance with risk management policies, procedures and standards acrossthe Company. It also periodically reviews the design and operating effectiveness of our risk management program and processes, including theindependence and effectiveness of our CRM function, and reports the results to our Audit Committee of the Board of the Directors (“AuditCommittee”) and, where appropriate, the Risk Oversight Committee of the Board of Directors (“Risk Oversight Committee”).
DefinedRiskAppetiteWe operate within a risk appetite framework approved by our Board of Directors, which guides an acceptable level of risk-taking, considering
desired financial returns and other objectives. To that end, limits and escalation thresholds are set consistent with the risk appetite approved by ourBoard of Directors.
TransparencyWe seek to provide transparency of exposures and outcomes, which is core to our risk culture. We provide this risk transparency through our
risk committee structure and standardized processes for escalating issues and reporting. This is accomplished at several levels within theorganization, including quarterly meetings held by our Risk Committee and quarterly reports to the Risk Oversight Committee and Audit Committee,as well as regular reporting to our Risk subcommittees commensurate with the needs of our businesses. Further, our CRO is a member of theCompany’s Executive Committee.
EnterpriseRiskManagementGovernanceStructureOur governance structure is based on the principle that each line of business is responsible for managing risks inherent in its business with
appropriate oversight from our senior management and Board of Directors. Various committees are in place to oversee the management of risksacross our Company. We seek to apply operating principles consistently to each committee. These operating principles are detailed in committeecharters, which are approved by the Risk Committee. Our banking subsidiaries have their own risk governance, compliance, auditing and otherrequirements. Our risk governance framework is implemented such that bank-level risk governance requirements are satisfied as well.
BoardofDirectorsOur Board of Directors (i) approves certain risk management policies, (ii) approves our capital targets and goals, (iii) approves our risk
appetite framework, (iv) monitors our strategic plan, (v) appoints our CRO and other risk governance function leaders, as appropriate, (vi) receivesreports on any exceptions to the Enterprise Risk Management policy and (vii) receives and reviews regulatory examination reports. The Board ofDirectors receives reports from the Audit Committee and Risk Oversight Committee on risk management matters and from the Compensation andLeadership Development Committee on risks associated with compensation and leadership development.
RiskOversightCommitteeofourBoardofDirectorsOur Risk Oversight Committee is responsible for overseeing our risk management policies and the operations of our enterprise-wide risk
management framework and our capital planning, liquidity risk management and resolution planning activities. The Committee is responsible for (i)approving and periodically reviewing our risk management policies, (ii) overseeing the operation of our policies and procedures for establishing ourrisk management governance, risk management procedures and risk-control infrastructure, (iii) overseeing the operation of processes and systemsfor implementing and monitoring compliance with such policies and procedures, (iv) reviewing and making recommendations to the Board ofDirectors, as appropriate, regarding the Company’s risk management framework, key risk management policies and the Company’s risk appetiteand tolerance, (v) receiving and reviewing regular reports
- 11 -
Table of Contents
from our CRO on risk management deficiencies and emerging risks, the status of and changes to risk exposures, policies, procedures and practices,and the steps management has taken to monitor and control risk exposures, (vi) receiving reports on compliance with our risk appetite and limitstructure and risk management policies, procedures and controls, (vii) overseeing capital planning, liquidity risk management and resolutionplanning related activities, and (viii) sharing information, liaising and meeting in joint session with the Audit Committee (which it may do through theChairs of the Committees) as necessary or desirable to help ensure that the committees have received the information necessary to permit them tofulfill their duties and responsibilities with respect to oversight of risk management matters.
AuditCommitteeofourBoardofDirectorsWith respect to the enterprise risk management framework, our Audit Committee is responsible for the following: (i) discussing policies with
respect to risk assessment and management, (ii) receiving and reviewing reports from our CRO and other members of management as theCommittee deems appropriate on the guidelines and policies for assessing and managing our exposure to risks, the corporation’s major financialrisk exposures and the steps management has taken to monitor and control such exposures, and (iii) sharing information and liaising with the RiskOversight Committee as necessary or desirable to help ensure that the committees have received the information necessary to permit them to fulfilltheir duties and responsibilities with respect to oversight of risk management matters.
CompensationandLeadershipDevelopmentCommitteeofourBoardofDirectorsOur Compensation and Leadership Development Committee is responsible for overseeing risk management associated with the Company’s
compensation and leadership development practices. The Committee receives reporting regarding the Company’s compensation practices andevaluates whether these practices encourage excessive risk-taking. As a part of its reviews, the Committee considers input from our CRO and takesinto account risk outcomes. The Compensation and Leadership Development Committee receives reporting regarding talent management practicesand evaluates risks associated with leadership development and succession planning.
RiskCommitteeOur Risk Committee is an executive management-level committee that establishes a comprehensive enterprise risk management program,
which includes (i) providing a regular forum for representatives of our different functional groups to identify and discuss key risk issues and torecommend to senior management actions that should be taken to manage the level of risk taken by the business lines, (ii) establishing andoverseeing an enterprise-wide approach to risk management through the development of our Enterprise Risk Management Policy and theassociated oversight framework for the identification, measurement, monitoring, management and reporting of enterprise risk, (iii) communicatingour risk appetite and philosophy, including establishing limits and thresholds for managing enterprise-wide risks, and (iv) reviewing, on a periodicbasis, our aggregate enterprise-wide risk exposures and the effectiveness of risk identification, measurement, monitoring, management andreporting policies and procedures, and related controls within the lines of business.
Our Risk Committee has formed and designated a number of committees to assist it in carrying out its responsibilities. These committees,made up of representatives from senior levels of management, escalate issues to our Risk Committee as guided by escalation thresholds. Theserisk management committees include the Discover Bank Credit Committee, Asset/Liability Management Committees (Discover Financial Servicesand Discover Bank), the Counterparty Credit Committee, the New Initiatives Committee, the Operational Risk Committee, the Capital PlanningCommittee, the Compliance Committee, the Information Security Executive Committee and the Human Resources Committee.
ChiefExecutiveOfficerThe Chief Executive Officer (“CEO”) is ultimately responsible for risk management within our Company. In that capacity, the CEO establishes
a risk management culture throughout the Company and ensures that businesses operate in accordance with this risk culture.
BusinessUnitHeadsOur business unit heads are responsible for managing risk associated with pursuit of their strategic, financial and other business objectives.
Business unit heads are responsible for (i) complying with all risk limits and risk policies, (ii) identifying risks and implementing appropriate controls,(iii) explicitly considering risk when developing strategic plans, budgets and new products, (iv) implementing appropriate controls when pursuingbusiness strategies and objectives, (v) ensuring business units implement business unit processes, controls and monitoring to support corporatemodel risk
- 12 -
Table of Contents
management standards such as documentation standards and reporting standards, (vi) coordinating with CRM to produce relevant, sufficient,accurate and timely risk reporting that is consistent with the processes and methodology established by CRM, (vii) ensuring sufficient financialresources and qualified personnel are deployed to control the risks inherent in the business activities, and (viii) designating, in consultation with theCRO, a Business Risk Officer to assist with the above and to perform the specific duties described below.
Business Risk Officers work in conjunction with the business unit head to implement a business risk management program that satisfiesbusiness unit needs and adheres to corporate policy, standards and risk architecture.
ChiefRiskOfficerAs a member of the Company’s senior management team, the CRO chairs our Risk Committee. In addition, the CRO has oversight
responsibility to establish the CRM function with capabilities to exercise its mandate across all risk categories. Our CRO reports directly to our RiskOversight Committee and administratively to the CEO. Our CRO provides an independent view on the key risks to which our Company is exposed toour Risk Committee, our Audit Committee, our Risk Oversight Committee and our Board of Directors.
CorporateRiskManagementThe CRM department is led by the CRO and supports business units by providing objective oversight of our risk profile to help ensure that
risks are managed, aggregated and reported to our Risk Committee, our Risk Oversight Committee and our Audit Committee. The CRM departmentparticipates in our Risk Committee and sub-committee meetings to provide an enterprise-wide perspective on risk, governance matters, policies andrisk thresholds. The CRM department is comprised of operational, consumer credit, counterparty credit, and market and liquidity risk oversightfunctions. In addition, the CRM department has enterprise risk management, corporate compliance, third-party risk management, model riskmanagement, information security and risk and insurance management frameworks to manage potential risk that might arise within these respectiveareas.
CreditRiskManagementCredit Risk Management is responsible for (i) developing, validating and implementing credit policy criteria and predictive loan origination and
servicing models in order to optimize the profitability of Company lending activities, (ii) ensuring adherence to our credit risk policies and approvallimits, and that departmental policies, procedures, and internal controls are consistent with the standards defined by the Company, (iii) ensuring thatwe manage credit risk within approved limits, and (iv) monitoring performance for both new and existing consumer loan products and portfolios.
LawDepartmentThe CRM department collaborates and coordinates closely with other risk and control functions in exercising its oversight responsibilities, in
particular with the law department. This department plays a significant role in managing our legal risk by, among other things, identifying, interpretingand advising on legal and regulatory risks. Our law department participates in meetings of the Risk Committee and the sub-committees of the RiskCommittee in order to advise on legal risks and to inform the committees of any relevant legislative and regulatory developments.
InternalAuditDepartmentOur internal audit department performs periodic, independent reviews and testing of compliance with risk management policies and standards
across the Company, as well as assessments of the design and operating effectiveness of these policies and standards. The internal auditdepartment also validates that risk management controls are functioning as intended by reviewing and evaluating the design and operatingeffectiveness of the CRM program and processes, including the independence and effectiveness of the CRM function. The results of such reviewsare reported to our Audit Committee.
RiskCategoriesWe are exposed to a broad set of risks in the course of our business activities due to both internal and external factors, which we segment
into six major risk categories. The first five are defined to be broadly consistent with guidance published by the Federal Reserve and the BaselCommittee on Banking Supervision (“BCBS”): credit, market, liquidity, operational, compliance and legal risk. We recognize the sixth, strategic risk,as a separate risk category. We
- 13 -

Table of Contents
evaluate the potential impact of a risk event on the Company by assessing the financial impact, the impact to our reputation, the legal and regulatoryimpact, and the client/customer impact. In addition, we have established various policies to help govern these risks.
CreditRiskOur credit risk arises from the potential that a borrower or counterparty will fail to perform on an obligation. Our credit risk includes consumer
credit risk and counterparty credit risk. Consumer credit risk is primarily incurred by Discover Bank through the issuance of (i) unsecured creditincluding credit cards, student loans and personal loans and (ii) secured credit including secured credit cards, deposit secured loans and homeequity loans. Counterparty credit risk is incurred through a number of activities including settlement, certain marketing programs, treasury andasset/liability management, network incentive programs, guarantors, vendor relationships and insurers.
MarketRiskMarket risk is the risk to our financial condition resulting from adverse movements in market rates or prices, such as interest rates, foreign
exchange rates, credit spreads or equity prices. Given the nature of our business activities, we are exposed to various types of market risk; inparticular interest rate risk, foreign exchange risk and other risks that arise through the management of our investment portfolio. Interest rate risk ismore significant relative to other market risk exposures and results from potential mismatches in the repricing term of assets and liabilities (yieldcurve risk) and volatility in reference rates used to reprice floating-rate structures (basis risk). Foreign exchange risk is primarily incurred throughexposure to currency movements across a variety of business activities and is derived, specifically, from the timing differences between transactionauthorizations and settlement.
LiquidityRiskLiquidity risk is the risk that we will be unable to meet our obligations as they become due because of an inability to liquidate assets or obtain
adequate funding, or an inability to easily unwind or offset specific exposures without significantly lowering market prices because of inadequatemarket depth or market disruptions.
OperationalRiskOperational risk is defined as the risk of loss resulting from inadequate or failed internal processes, people and systems or from external
events. Operational risk is inherent in all our businesses. Operational risk categories incorporate all of the operational loss event-type categories setforth by the BCBS, which include the following: (i) internal fraud, (ii) external fraud, (iii) employment practices and workplace safety, (iv) clients,products and business practices, (v) damage to physical assets, (vi) business disruption and system failures, and (vii) execution, delivery andprocess management.
ComplianceRiskCompliance risk is the operational risk of legal or regulatory sanctions, financial loss or damage to reputation resulting from failure to comply
with laws, regulations, rules, other regulatory requirements, or codes of conduct and other standards of self-regulatory organizations applicable tous. Compliance risk exposures are actively and primarily managed by our business units in conjunction with our compliance department. Ourcompliance program governs the management of compliance risk. Our Risk Committee and Compliance Committee oversee our complianceprogram.
LegalRiskLegal risk arises from the potential that unenforceable contracts, lawsuits or adverse judgments can disrupt or otherwise negatively affect our
operations or condition. These risks are inherent in all of our businesses. Legal risk exposures are actively and primarily managed by our businessunits in conjunction with our law department. Our Risk Committee and Compliance Committee oversee our legal risk management. Specifically, thelaw department is responsible for providing advice, interpreting and identifying developments regarding laws, regulations, regulatory guidance andlitigation, and setting standards for communicating relevant changes to corporate compliance, the business and internal audit. The law departmentalso identifies and communicates legal risk associated with new products and business practices.
- 14 -
Table of Contents
StrategicRiskStrategic risk is the risk that our strategies and the execution of those strategies do not produce the desired outcome, resulting in a negative
impact on our enterprise value. This risk can be driven by internal and external factors, including (i) our business model, market position, selection ofstrategies and execution of those strategies and (ii) competitor strategies, emergence of new competitors, emergence of new technologies,changing consumer preferences or other market factors.
Our Risk Committee actively manages strategic risk through the development, implementation and oversight of our business strategies,including the development of budgets and business plans. Our business units take on and are accountable for managing strategic risk in pursuit oftheir objectives.
EnterpriseRiskManagementFrameworkOur enterprise risk management principles are executed through a risk management framework that is based upon industry standards for
managing risk and controls. While the detailed activities vary by risk type, there are common process elements that apply across risk types. Weseek to apply these elements consistently in the interest of effective and efficient risk management. This framework seeks to link risk processes andinfrastructure with the appropriate risk oversight to create a risk management structure that raises risk awareness, reduces impact of potential riskevents, improves business decision-making and increases operational efficiency.
RiskIdentificationWe seek to identify potential exposures that could adversely affect our ability to successfully implement strategies and achieve objectives. To
ensure that the full scale and scope of risk exposures from firm-wide activities are identified, we seek to identify risk exposures based on (i)significant enterprise-level risks that are strategic, systemic, or emerging in nature, (ii) granular risk exposures from on-balance sheet and off-balance sheet positions, including concentrations, and (iii) risk exposures from initiatives focused on new, expanded, customized, or modifiedproducts, services, and processes.
Risk exposures identified through these three approaches are consolidated to create a comprehensive risk inventory. This inventory isleveraged by a number of processes within the Company including stress scenario design and stress testing, capital planning, risk appetite settingand risk modeling. The risk inventory is reviewed and approved at least annually by the Risk Committee while the sub-committees review the risksmapped to the relevant risk categories for transparency and comprehensive coverage of risk exposures.
RiskMeasurement
Our risk measurement process seeks to ensure that the identified risk exposures are appropriately assessed. Risk measurement techniquesappropriate to the risk category, including econometric modeling, statistical analysis, peer benchmarking and qualitative assessments, are employedto measure our material risk exposures.
RiskMonitoring
Our risks are monitored through an integrated monitoring framework consisting of risk appetite metrics and key risk indicators (“KRIs”). Thesemetrics are established to monitor changes in our risk exposures and external environment. Risk appetite metrics are used to monitor the overall riskprofile of the Company by setting risk boundaries and expectations through quantitative limits and qualitative expressions. We use KRIs to monitorour risk profile through direct or indirect alignment with the risk appetite limits.
These metrics enable monitoring of risk by business management and by measuring risk and performance data against risk appetite and KRIescalation thresholds that are updated periodically. Escalation procedures are in place to notify the appropriate governance committees in the eventof any actual risk limit breaches or potential upcoming breaches.
RiskManagement
We have policies and a defined governance structure in place to manage risks. In the event of a risk exposure exceeding establishedthresholds, management determines appropriate response actions. Responses, which may be taken by the Board of Directors, the Risk OversightCommittee, the Audit Committee, the Risk Committee, sub-committees or the CRO, or business units, may include (i) actions to directly mitigate orresolve risk, (ii) actions to
- 15 -
Table of Contents
terminate any activities resulting in an undesired or unintended risk position, or (iii) actions to prevent, avoid, modify, share or accept a risk position(or activity prior to its occurrence).
RiskReportingAs the constituents primarily responsible for proactively managing the risks to which they are exposed, our business units and risk and control
functions periodically report to the governance committees. The CRM function is responsible for independent reporting on risk matters to variousconstituencies across the Company on a periodic basis. The CRM department periodically provides risk management reporting to the RiskCommittee, the Audit Committee, the Risk Oversight Committee and the Board of Directors.
StressTestingWe use stress testing to better understand the range of potential risks and their impacts to which the Company is exposed. A stress testing
framework is employed to provide a comprehensive, integrated and forward-looking assessment of material risks and vulnerabilities. Stress testresults inform on business strategy, risk appetite setting, and decisions related to capital actions, contingency capital plans, liquidity buffer,contingency funding plans and balance sheet positioning. Our stress testing framework utilizes a risk inventory, which covers our risk exposuresacross our defined risk categories. The risk inventory provides a comprehensive view of our vulnerabilities capturing current and emerging risks frommanagement’s view, granular risks relevant to business units and emerging risks associated with new initiatives.
RiskManagementReviewofCompensationWe believe in a pay for performance philosophy, which considers performance across the Company, business segments and individual
performance, as appropriate, as well as the long-term interests of our shareholders and the safety and soundness of the Company. We designcompensation to be competitive relative to our peers to attract, retain and motivate our employees. In addition to being competitive in the markets inwhich we compete for talent and encouraging employees to achieve objectives set out by our management, our compensation programs aredesigned to balance an appropriate mix of compensation components to align the interests of employees with the long-term interests ofshareholders and the safety and soundness of the Company.
The design and administration of our compensation programs provide incentives that seek to appropriately balance risk and financial results ina manner that does not incentivize employees to take imprudent risks, is compatible with effective controls and enterprise-wide risk management,and is supported by strong corporate governance, including oversight by our Board of Directors and the Compensation and LeadershipDevelopment Committee of our Board of Directors.
RiskAppetiteandStrategicLimitStructureRisk appetite is defined as the aggregate level and the type of risks we are willing to accept or avoid in order to achieve our strategic
objectives. Risk appetite expressions are consistent with the Company’s aspirations, mission statement and core values, and also serve as tools topreclude business activities that could have a negative impact on our reputation.
Our risk appetite statement consists of both quantitative limits and qualitative expressions to recognize a range of possible outcomes and setboundaries for proactive management of risks. Limits focus on achieving business performance and earnings objectives, and on maintaining capitaland franchise resiliency under stress conditions featuring combined impacts of macroeconomic and idiosyncratic shocks. These limits andexpressions are revised at least annually or as warranted by changes in business strategy, risk profile and external environment.
Management and our CRM department monitor approved limits and escalation triggers to ensure that the business is operating within theapproved risk appetite. Risk limits are monitored and reported on to various risk sub-committees, the Risk Committee and our Board of Directors, asappropriate. Through ongoing monitoring of risk exposures, management seeks to be able to identify appropriate risk response and mitigationstrategies in order to react dynamically to changing conditions.
- 16 -

Table of Contents
CapitalPlanningRisk exposures identified through the risk identification process across risk categories and risk types are consolidated to create a
comprehensive risk inventory. This inventory is leveraged by a number of processes within the Company including stress scenario design, capitalplanning, risk appetite setting and risk modeling. The risk inventory is reviewed and approved at least annually by the Capital Planning Committeealong with the Risk Committee and sub-committees to ensure transparency and comprehensive coverage of risk exposures. Our capital planningand management framework encompasses forecasting capital levels, establishing capital targets, monitoring capital adequacy against targets,maintaining appropriate contingency capital plans and identifying strategic options to deploy excess capital.
Supervision and Regulation
GeneralOur operations are subject to extensive regulation, supervision and examination under U.S. federal, state and foreign laws and regulations. As
a bank holding company under the Bank Holding Company Act of 1956 and a financial holding company under the Gramm-Leach-Bliley Act, we aresubject to the supervision, examination and regulation of the Federal Reserve. As a large provider of consumer financial services, we are subject tothe supervision, examination and regulation of the Consumer Financial Protection Bureau (the “CFPB”).
We operate two banking subsidiaries, each of which is in the United States. Discover Bank, our main banking subsidiary, offers credit cardloans, student loans, personal loans and home equity loans as well as certificates of deposit, savings and checking accounts and other types ofdeposit accounts. Discover Bank is chartered and regulated by the Office of the Delaware State Bank Commissioner (the “DelawareCommissioner”), and is also regulated by the FDIC, which insures its deposits up to applicable limits and serves as the bank’s primary federalbanking regulator. Our other bank, Bank of New Castle, is also chartered and regulated by the Delaware Commissioner and insured and regulatedby the FDIC.
BankHoldingCompanyRegulationPermissible activities for a bank holding company include owning a bank as well as those activities that are so closely related to banking as to
be a proper incident thereto, such as consumer lending and other activities that have been approved by the Federal Reserve by regulation or order.Certain servicing activities are also permissible for a bank holding company if conducted for or on behalf of the bank holding company or any of itsaffiliates. Impermissible activities for bank holding companies include activities that are related to commerce such as retail sales of nonfinancialproducts.
A financial holding company and the non-bank companies under its control are permitted to engage in activities considered financial in nature,incidental to financial activities, or complementary to financial activities, if the Federal Reserve determines that such activities pose no risk to thesafety or soundness of depository institutions or the financial system in general. Being a financial holding company under the Gramm-Leach-BlileyAct requires that the depository institutions that we control meet certain criteria, including capital, management and Community Reinvestment Actrequirements. In addition, under the Dodd-Frank Wall Street Reform and Consumer Protection Act (the “Dodd-Frank Act”) we are required to meetcertain capital and management criteria to maintain our status as a financial holding company. Failure to meet the criteria for financial holdingcompany status results in restrictions on new financial activities or acquisitions and could require discontinuance of existing activities that are notgenerally permissible for bank holding companies.
Federal Reserve regulations and the Federal Deposit Insurance Act (the “FDIA”), as amended by the Dodd-Frank Act, require that bankholding companies serve as a source of strength to each subsidiary bank and commit resources to support each subsidiary bank. This support maybe required at times when a bank holding company may not be able to provide such support without adversely affecting its ability to meet otherobligations.
The Dodd-Frank Act addresses risks to the economy and the payments system, especially those posed by large systemically significantfinancial firms. The Economic Growth, Regulatory Relief, and Consumer Protection Act (“EGRRCPA”) amended the Dodd-Frank Act by raising theasset size thresholds for certain enhanced prudential standards. Under the amended statute, the Federal Reserve is authorized to impose certainenhanced prudential standards on bank holding companies with total assets of at least $100 billion, including Discover, only after issuing a newregulation or order based on a risk-based determination. The Federal Reserve and other federal banking agencies issued proposals on October 31,2018, to tailor existing regulations in accordance with the EGRRCPA. The proposals
- 17 -

Table of Contents
were open for public comment until January 22, 2019. The timing and substance of any final rules is currently unknown.
On February 5, 2019, the Federal Reserve announced that certain less complex firms subject to Comprehensive Capital Analysis and Review(“CCAR”), generally those with total consolidated assets between $100 billion and $250 billion, have been provided relief from certain components ofthe Federal Reserve’s capital planning and stress testing framework for the 2019 stress test cycle. The Federal Reserve issued a temporary ordergranting Discover relief from the regulatory requirements related to supervisory stress testing and company-run stress testing for the 2019 stresstest cycle and provided Discover a one-year extension of the requirement to submit a capital plan to the Federal Reserve until April 5, 2020.Additionally, Discover is not required to participate in the 2019 CCAR process. Notwithstanding this relief, Discover is still required to prepare acapital plan to be approved by its Board of Directors, containing planned capital distributions for the period from July 1, 2019 to June 30, 2020.Under the terms of the Federal Reserve’s order, Discover’s capital distributions during this period will be limited based on a formula that is largelybased on results from the Federal Reserve’s 2018 supervisory stress test. The Federal Reserve will continue to review Discover’s capital planningand risk management practices through the regular supervisory process and has stated that it will propose a final rule to address these matters forthe 2020 stress test cycle and beyond. It is currently anticipated based on the Federal Reserve’s public statements and its proposed rule issued onOctober 31, 2018, as discussed above, that Discover will be required to submit a capital plan to the Federal Reserve and participate in supervisorystress tests as part of the 2020 stress test cycle.
Regulatory developments, findings and ratings could negatively impact our business strategies or require us to: limit or change our businesspractices, restructure our products in ways that we may not currently anticipate, limit our product offerings, invest more management time andresources in compliance efforts, limit the fees we can charge for services or limit our ability to pursue certain business opportunities and obtainrelated required regulatory approvals. For additional information regarding bank regulatory limitations on acquisitions and investments, see “—Acquisitions and Investments.” See Note 19: Litigation and Regulatory Matters to our consolidated financial statements for more information onrecent matters affecting Discover. Regulatory developments could also influence our strategies, impact the value of our assets, or otherwiseadversely affect our businesses. For more information regarding the regulatory environment and developments under the Dodd-Frank Act, see“Management’s Discussion and Analysis of Financial Condition and Results of Operations — Regulatory Environment and Developments” and “RiskFactors.”
Capital,DividendsandShareRepurchasesWe, Discover Bank and Bank of New Castle are subject to capital adequacy guidelines adopted by federal banking regulators, which include
maintaining minimum capital and leverage ratios for capital adequacy and higher ratios to be deemed “well-capitalized” for other regulatorypurposes. We and our subsidiary banks are each required to maintain Tier 1 and total capital equal to at least 6% and 8% of our total risk-weightedassets, respectively. We and our subsidiary banks are also required to maintain a minimum “leverage ratio” (Tier 1 capital to adjusted total assets) of4% and a common equity Tier 1 capital ratio (common equity Tier 1 capital to total risk-weighted assets) of 4.5% . Further, under the FederalReserve’s annual capital plan requirements, Discover Financial Services is required to demonstrate that under stress scenarios we will maintaineach of the minimum capital ratios on a pro-forma basis throughout the nine-quarter planning horizon.
In addition to the supervisory minimum levels of capital described above, Federal Reserve rules applicable to Discover Financial Servicesrequire maintenance of the following minimum capital ratios to be considered “well-capitalized” for certain purposes under Regulation Y (12 CFR225): (i) a Tier 1 risk-based capital ratio of 6% and (ii) a total risk-based capital ratio of 10%. Our banking subsidiaries are required by the FDIC’sPrompt Corrective Action rules to maintain the following minimum capital ratios to be considered “well-capitalized”: (i) a common equity Tier 1 capitalratio of 6.5%; (ii) a Tier 1 risk-based capital ratio of 8%; (iii) a total risk-based capital ratio of 10%; and (iv) a Tier 1 leverage ratio of 5%. AtDecember 31, 2018 , Discover Financial Services met all requirements to be deemed “well-capitalized” pursuant to the applicable regulations. Forrelated information regarding our bank subsidiaries see “— FDIA” below.
There are various federal and state law limitations on the extent to which our banking subsidiaries can provide funds to us through dividends,loans or otherwise. These limitations include minimum regulatory capital requirements, federal and state banking law requirements concerning thepayment of dividends out of net profits or surplus, affiliate transaction limits and general federal and state regulatory oversight to prevent unsafe orunsound practices. In general, federal and applicable state banking laws prohibit, without first obtaining regulatory approval, insured depositoryinstitutions, such as our banking subsidiaries, from making dividend distributions if such distributions are not paid out of
- 18 -
Table of Contents
available earnings or would cause the institution to fail to meet applicable capital adequacy standards. For more information, see “— FDIA” below.
Additionally, we are subject to regulatory requirements imposed by the Federal Reserve as part of its stress testing framework and its CCARprogram. In 2018, Discover was required to submit a capital plan to the Federal Reserve that included an assessment of our expected uses andsources of capital over a nine-quarter planning horizon. We submitted our capital plan to the Federal Reserve in April 2018 for the 2018 CCAR cycleand received notice in June 2018 that the Federal Reserve does not object to our proposed capital plan, including share repurchases and plannedquarterly capital distributions through June 30, 2019. As described above, Discover has been notified that it is not required to participate in CCAR orsubmit to supervisory stress tests for the 2019 stress test cycle. However, Discover’s capital distributions for the period between July 1, 2019 andJune 30, 2020 will be limited based on a formula that is largely based on results from the Federal Reserve’s 2018 supervisory stress test. TheFederal Reserve has issued a proposed rule, and indicated that it will propose additional rule changes, that will substantially change the stresstesting and capital planning requirements applicable to Discover for 2020 and beyond.
For more information, including additional conditions and limits on our ability to pay dividends and repurchase our stock, see “— Bank HoldingCompany Regulation,” “Risk Factors — Credit, Market and Liquidity Risk — Wemaybelimitedinourabilitytopaydividendsonandrepurchaseourstock” and “— Weareaholdingcompanyanddependonpaymentsfromoursubsidiaries,” “Management’s Discussion and Analysis of FinancialCondition and Results of Operations — Liquidity and Capital Resources — Capital” and Note 17: Capital Adequacy to our consolidated financialstatements.
FDIAThe FDIA imposes various requirements on insured depository institutions. For example, the FDIA requires, among other things, the federal
banking agencies to take “prompt corrective action” in respect of depository institutions that do not meet minimum capital requirements. The FDIAsets forth the following five capital tiers: “well-capitalized,” “adequately capitalized,” “undercapitalized,” “significantly undercapitalized” and “criticallyundercapitalized.” A depository institution’s capital tier will depend upon how its capital levels compare with various relevant capital measures andcertain other factors that are established by regulation. At December 31, 2018 , Discover Bank and Bank of New Castle met all applicablerequirements to be deemed “well-capitalized.”
The FDIA also prohibits any depository institution from making any capital distributions (including payment of a dividend) or paying anymanagement fee to its parent holding company if the depository institution would thereafter be “undercapitalized.” “Undercapitalized” institutions aresubject to growth limitations and are required to submit a capital restoration plan. For a capital restoration plan to be acceptable, among otherthings, the depository institution’s parent holding company must guarantee that the institution will comply with the capital restoration plan.
If a depository institution fails to submit an acceptable capital restoration plan, it is treated as if it is “significantly undercapitalized.”“Significantly undercapitalized” depository institutions may be subject to a number of requirements and restrictions, including orders to sell sufficientvoting stock to become “adequately capitalized,” requirements to reduce total assets, and cessation of receipt of deposits from correspondentbanks. “Critically undercapitalized” institutions are subject to the appointment of a receiver or conservator.
Each of our banking subsidiaries may also be held liable by the FDIC for any loss incurred, or reasonably expected to be incurred, due to thedefault of the other U.S. banking subsidiary and for any assistance provided by the FDIC to the other U.S. banking subsidiary that is in danger ofdefault.
The FDIA prohibits insured banks from accepting brokered deposits or offering interest rates on any deposits significantly higher than theprevailing rate in the bank’s normal market area or nationally (depending upon where the deposits are solicited), unless it is “well-capitalized,” or it is“adequately capitalized” and receives a waiver from the FDIC. A bank that is less than “well-capitalized” is generally prohibited from paying aninterest rate on deposits in excess of 75 basis points over the national market average. There are no such restrictions under the FDIA on a bank thatis “well-capitalized.” As of December 31, 2018 , Discover Bank and Bank of New Castle each met the FDIC’s definition of a “well-capitalized”institution for purposes of accepting brokered deposits. An inability to accept brokered deposits in the future could materially adversely impact ourfunding costs and liquidity. For more information, see “Risk Factors — Credit, Market and Liquidity Risk — Aninabilitytoacceptormaintaindepositsinthefuturecouldmateriallyadverselyaffectourliquiditypositionandourabilitytofundourbusiness.”
- 19 -

Table of Contents
The FDIA also affords FDIC insured depository institutions, such as Discover Bank and Bank of New Castle, the ability to “export” interestrates permitted under the laws of the state where the bank is located. Discover Bank and Bank of New Castle are both located in Delaware and,therefore, charge interest on loans to out-of-state borrowers at rates permitted under Delaware law, regardless of the usury limitations imposed bythe state laws of the borrower’s residence. Delaware law does not limit the amount of interest that may be charged on loans of the type offered byDiscover Bank or Bank of New Castle. This flexibility facilitates the current nationwide lending activities of Discover Bank and Bank of New Castle.
The FDIA subjects Discover Bank to deposit insurance assessments. Under the Dodd-Frank Act, in order to bolster the reserves of theDeposit Insurance Fund, the minimum reserve ratio set by the FDIC was increased to 1.35% and subsequently the FDIC set a reserve ratio of 2%.The Dodd-Frank Act removed the statutory cap for the reserve ratio, leaving the FDIC free to set a cap in the future. The FDIC also previouslyamended its deposit insurance regulations in ways that have raised Discover Bank’s cost of deposit insurance. Further increases may occur in thefuture.
AcquisitionsandInvestmentsSince we are a bank holding company, and Discover Bank and Bank of New Castle are insured depository institutions, we are subject to
banking laws and regulations that limit the types of acquisitions and investments that we can make. In addition, certain permitted acquisitions andinvestments that we seek to make are subject to the prior review and approval of our banking regulators, including the Federal Reserve and FDIC.Our banking regulators have broad discretion on whether to approve proposed acquisitions and investments. In deciding whether to approve aproposed acquisition, federal bank regulators will consider, among other factors, the effect of the acquisition on competition, our financial condition,and our future prospects, including current and projected capital ratios and levels; the competence, experience, and integrity of our managementand our record of compliance with laws and regulations; the convenience and needs of the communities to be served, including our record ofcompliance under the Community Reinvestment Act; and our effectiveness in combating money laundering. Therefore, results of supervisoryactivities of the banking regulators, including examination results and ratings, can impact whether regulators approve proposed acquisitions andinvestments. Supervisory action related to anti-money laundering and related laws and regulations will limit for a period of time our ability to enterinto certain types of acquisitions and make certain types of investments. For more information on recent matters affecting Discover, see Note 19:Litigation and Regulatory Matters to our consolidated financial statements. For information on the challenging regulatory environment, see “RiskFactors.”
In addition, certain acquisitions of our voting stock may be subject to regulatory approval or notice under U.S. federal or Delaware state law.Investors are responsible for ensuring that they do not, directly or indirectly, acquire shares of our stock in excess of the amount that can beacquired without regulatory approval under the Change in Bank Control Act, the Bank Holding Company Act and the Delaware Change in BankControl provisions, which prohibit any person or company from acquiring control of us without, in most cases, the prior written approval of each ofthe FDIC, the Federal Reserve and the Delaware Commissioner.
ConsumerFinancialServicesThe relationship between us and our U.S. customers is regulated extensively under federal and state consumer protection laws. Federal laws
include the Truth in Lending Act, the Equal Credit Opportunity Act, the Fair Credit Reporting Act, the Gramm-Leach-Bliley Act, the CARD Act, theServicemembers Civil Relief Act, the Military Lending Act and the Dodd-Frank Act. These and other federal laws, among other things, prohibit unfair,deceptive and abusive trade practices, require disclosures of the cost of credit, provide substantive consumer rights, prohibit discrimination in credittransactions, regulate the use of credit report information, provide privacy protections, require safe and sound banking operations, restrict our abilityto raise interest rates, protect customers serving in the military and their dependents and subject us to substantial regulatory oversight. The CFPBhas rulemaking and interpretive authority under the Dodd-Frank Act and other federal consumer financial services laws, as well as broadsupervisory, examination and enforcement authority over large providers of consumer financial products and services, such as Discover. For moreinformation, see “Management’s Discussion and Analysis of Financial Condition and Results of Operations — Regulatory Environment andDevelopments — Consumer Financial Services.” State and, in some cases, local laws also may regulate in these areas, as well as in the areas ofcollection practices, and may provide other additional consumer protections.
Violations of applicable consumer protection laws can result in significant potential liability in litigation by customers, including civil monetarypenalties, actual damages, restitution and attorneys’ fees. Federal banking regulators, as well as state attorneys general and other state and localconsumer protection agencies, also may seek to
- 20 -

Table of Contents
enforce consumer protection requirements and obtain these and other remedies. Further violations may cause federal banking regulators to deny, ordelay approval of, potential acquisitions and investments. See “— Acquisitions and Investments.”
We are subject to additional laws and regulations affecting mortgage lenders. Federal, state and, in some instances, local laws apply tomortgage lending activities. These laws generally regulate the manner in which mortgage lending and lending-related activities are conducted,including advertising and other consumer disclosures, payments for services and recordkeeping requirements. These laws include the Real EstateSettlement Procedures Act, the Fair Credit Reporting Act, the Truth in Lending Act, the Equal Credit Opportunity Act, the Fair Housing Act, theHome Mortgage Disclosure Act and various state laws. For more information, see “Management’s Discussion and Analysis of Financial Conditionand Results of Operations — Regulatory Environment and Developments — Consumer Financial Services.”
PaymentNetworksWe operate the Discover and PULSE networks, which deliver switching and settlement services to financial institutions and other program
participants for a variety of ATM, POS and other electronic banking transactions. These operations are regulated by certain federal and statebanking, privacy and data security laws. Moreover, the Discover and PULSE networks are subject to examination under the oversight of the FederalFinancial Institutions Examination Council, an interagency body composed of the federal bank regulators and the National Credit UnionAdministration. In addition, as our payments business has expanded globally through Diners Club, we are subject to government regulation incountries in which our networks operate or our cards are used, either directly or indirectly through regulation affecting Diners Club networklicensees. Changes in existing federal, state or international regulation could increase the cost or risk of providing network services, change thecompetitive environment, or otherwise materially adversely affect our operations. The legal environment regarding privacy and data security isparticularly dynamic, and any unpermitted disclosure of confidential customer information could have a material adverse impact on our business,including loss of consumer confidence.
The Dodd-Frank Act contains several provisions that are relevant to the business practices, network transaction volume, revenue andprospects for future growth of PULSE, our debit card network business. The Dodd-Frank Act requires that merchants control the routing of debittransactions, and that interchange fees received by certain payment card issuers on debit card transactions be “reasonable and proportional” to theissuer’s cost in connection with such transactions, as determined by the Federal Reserve. The Dodd-Frank Act also requires the Federal Reserve torestrict debit card networks and issuers from requiring debit card transactions to be processed solely on a single payment network or two or moreaffiliated networks, or from requiring that transactions be routed over certain networks. For information regarding related impacts on our debit cardbusiness, see “Management’s Discussion and Analysis of Financial Condition and Results of Operations — Regulatory Environment andDevelopments — Payment Networks.”
MoneyLaundering&TerroristFinancingPreventionProgramWe maintain an enterprise-wide program designed to comply with all applicable anti-money laundering and anti-terrorism laws and
regulations, including the Bank Secrecy Act and the USA PATRIOT Act of 2001. This program includes policies, procedures, training and otherinternal controls designed to mitigate the risk of money laundering or terrorist financing posed by our products, services, customers and geographiclocale. These controls include procedures and processes to detect and report suspicious transactions, perform customer due diligence, and meet allrecordkeeping and reporting requirements related to particular transactions involving currency or monetary instruments. The program is coordinatedby our anti-money laundering compliance and sanctions officer and undergoes an annual independent audit to assess its effectiveness. Ourprogram is typically reviewed on an annual basis by federal banking regulators. In May 2015, Discover Financial Services entered into a writtenagreement with the Federal Reserve Bank of Chicago to resolve matters related to the Federal Reserve’s examination of Discover FinancialServices’ anti-money laundering and related compliance programs. Discover Financial Services agreed to, among other things, enhance its anti-money laundering and related compliance programs. See Note 19: Litigation and Regulatory Matters to our consolidated financial statements formore information. For additional information regarding bank regulatory limitations on acquisitions and investments, see “— Acquisitions andInvestments.”
SanctionsProgramsWe have a program designed to comply with applicable economic and trade sanctions programs, including those administered and enforced
by the U.S. Department of the Treasury’s Office of Foreign Assets Control. These
- 21 -
Table of Contents
sanctions are usually targeted against foreign countries, terrorists, international narcotics traffickers and those believed to be involved in theproliferation of weapons of mass destruction. These regulations generally require either the blocking of accounts or other property of specifiedentities or individuals, but they may also require the rejection of certain transactions involving specified entities or individuals. We maintain policies,procedures and other internal controls designed to comply with these sanctions programs.
Executive Officers of the RegistrantSet forth below is information concerning our executive officers, each of whom is a member of our Executive Committee.
Name Age Position Roger C. Hochschild 54 Chief Executive Officer and President R. Mark Graf 54 Executive Vice President, Chief Financial Officer Brian D. Hughes 51 Executive Vice President, Chief Risk Officer Daniel P. Capozzi 47 Executive Vice President, President - Credit Operations and Decision Management R. Andrew Eichfeld 49 Executive Vice President, Chief Human Resources and Administrative Officer Julie A. Loeger 55 Executive Vice President, President - U.S. Cards Carlos M. Minetti 56 Executive Vice President, President - Consumer Banking Diane E. Offereins 61 Executive Vice President, President - Payment Services Glenn P. Schneider 57 Executive Vice President, Chief Information Officer David W. Nelms 58 Executive Officer Kathryn McNamara Corley 59 Executive Vice President
Roger C. Hochschild is our Chief Executive Officer and President, a position he has held since October 2018. Mr. Hochschild was alsoelected to the Discover Board of Directors in August 2018. From 2004 to 2018, Mr. Hochschild served as President and Chief Operating Officer.Prior to that, he was Executive Vice President, Chief Administrative and Strategic Officer (2001 to 2004) and Executive Vice President, ChiefMarketing Officer - Discover (1998 to 2001) of our former parent company Morgan Stanley. Mr. Hochschild holds a Bachelor’s degree in Economicsfrom Georgetown University and an M.B.A. from the Amos Tuck School at Dartmouth College.
R. Mark Graf is our Executive Vice President, Chief Financial Officer. He has held this role since April 2011. In his role, he is also responsiblefor the Comprehensive Capital Analysis and Review and Resolution Planning program offices. He was also Chief Accounting Officer until December2012. Prior to joining us, Mr. Graf was an investment advisor with Aquiline Capital Partners, a private equity firm specializing in investments in thefinancial services industry. From 2006 to 2008, Mr. Graf was a partner at Barrett Ellman Stoddard Capital. Mr. Graf was Executive Vice Presidentand Chief Financial Officer for Fifth Third Bank from 2004 to 2006, after having served as its Treasurer from 2001 to 2004. He holds a Bachelor’sdegree in Economics from the Wharton School of the University of Pennsylvania.
Brian D. Hughes is our Executive Vice President, Chief Risk Officer. He has held this role since December 2016 and been Chief Risk Officersince May 2016. Mr. Hughes is responsible for Corporate Risk Management, Model Risk Management, Information Security and Compliance,including the AML/BSA compliance program. Mr. Hughes joined Discover in 2012 as Senior Vice President and held leadership positions in CreditRisk Management, Deposit Products and Cardmember Marketing. Prior to joining us, Mr. Hughes held leadership roles at HSBC North America(2004-2012) and Booz & Co. (1993-2004). He holds a Bachelor’s degree in Electrical Engineering from the University of Illinois and an M.B.A. fromthe Booth School of Business at The University of Chicago.
Daniel P. Capozzi is our Executive Vice President, President - Credit Operations and Decision Management. He has held this role sinceOctober 2018 and previously served as Senior Vice President, Credit and Decision Management beginning in June 2017. Mr. Capozzi is responsiblefor Credit Risk Management, Loss Forecasting, Analytics, Decision Science and related functions. Since joining Discover in 2007, Mr. Capozzi hasheld leadership positions in the Deposits business and Corporate Finance. Prior to joining Discover, he held various leadership positions
- 22 -

Table of Contents
in Finance at Citi and Bank of America. Mr. Capozzi holds a Bachelor’s degree in Business Administration from Northeastern University.
R. Andrew Eichfeld is our Executive Vice President, Chief Human Resources and Administrative Officer. He has held this role sinceSeptember 2018. Prior to joining Discover, Mr. Eichfeld was an independent advisor from 2017 to 2018 and held various positions at McKinsey &Company from 1995 to 2017, where he was elected a senior partner in 2009. Mr. Eichfeld holds a Bachelor’s degree in Government from OberlinCollege, as well as a Master’s degree in Middle Eastern studies and an M.B.A. in Marketing, both from the University of Chicago.
Julie A. Loeger is our Executive Vice President, President - U.S. Cards. She has held this role since October 2018. She served as ExecutiveVice President, Chief Marketing Officer from December 2015 to October 2018 and was Senior Vice President, Chief Marketing Officer from April toDecember 2015. Ms. Loeger joined Discover in 1991 and has held leadership positions in many areas, including Rewards, Portfolio Marketing,Acquisition, Brand Management and Product Development. Prior to joining Discover, she held various marketing positions at Anheuser Busch, Inc.She holds a Bachelor’s of Business Administration degree in Finance from The University of Texas at San Antonio, an M.B.A. from Loyola UniversityChicago and attended the executive program at The Amos Tuck School at Dartmouth College.
Carlos M. Minetti is our Executive Vice President, President - Consumer Banking. He has held this role since February 2014. Previously, heserved as Executive Vice President, President - Consumer Banking and Operations (2010 to 2014), Executive Vice President, CardmemberServices and Consumer Banking (2007 to 2010), and Executive Vice President for Cardmember Services, and Chief Risk Officer (2001 to 2007).Prior to joining us, Mr. Minetti worked in card operations and risk management for American Express from 1987 to 2000, most recently as SeniorVice President. Mr. Minetti holds a Bachelor’s degree in Industrial Engineering from Texas A & M University and an M.B.A. from the Booth School ofBusiness at The University of Chicago.
Diane E. Offereins is our Executive Vice President, President - Payment Services. She has held this role since April 2010. Previously, sheserved as Executive Vice President, Payment Services (2008 to 2010) and Executive Vice President and Chief Technology Officer (1998 to 2008).In 2006, she assumed leadership of the PULSE network. Prior to joining us, Ms. Offereins worked at MBNA America Bank from 1993 to 1998, mostrecently as Senior Executive Vice President. Ms. Offereins holds a Bachelor’s degree in Accounting from Loyola University New Orleans.
Glenn P. Schneider is our Executive Vice President, Chief Information Officer. He has held this role since January 2015. Previously, heserved as Senior Vice President and Chief Information Officer (2008 to 2015), Senior Vice President, Application Development (2003 to 2008), andVice President, Marketing Applications (1998 to 2003). Prior to joining us in 1993, Mr. Schneider worked for Kemper Financial Services as aProgrammer. He holds a Bachelor’s degree in Economics/Computer Science with a minor in Statistics from Northern Illinois University.
David W. Nelms is an Executive Officer of the Company (formerly Chief Executive Officer from February 2004 to October 2018). Mr. Nelmsalso assumed the role of Chairman in January 2009, a position that he held until stepping down as Executive Chairman in December 2018. Heserved as President and Chief Operating Officer from 1998 to 2004. Prior to joining us, Mr. Nelms worked at MBNA America Bank from 1991 to1998, most recently as Vice Chairman. Mr. Nelms holds a Bachelor’s degree in Mechanical Engineering from the University of Florida and an M.B.A.from Harvard Business School. Mr. Nelms is expected to retire from the Company in March 2019.
Kathryn McNamara Corley is an Executive Vice President of the Company (formerly Executive Vice President, General Counsel andSecretary from February 2008 to January 2019). Previously, she served as Senior Vice President, General Counsel and Secretary (1999 to 2008).Prior to becoming General Counsel, Ms. Corley was Managing Director for our former parent company Morgan Stanley’s global government andregulatory relations. Ms. Corley holds a Bachelor’s degree in Political Science from the University of Southern California and a J.D. and HonoraryDoctors of Law degree from George Mason University. Ms. Corley is expected to retire from the Company in March 2019.
- 23 -

Table of Contents
Item 1A. Risk FactorsYoushouldcarefullyconsidereachofthefollowingrisksdescribedbelowandalloftheotherinformationinthisannualreportonForm10-Kin
evaluatingus.Ourbusiness,financialcondition,cashflowsand/orresultsofoperationscouldbemateriallyadverselyaffectedbyanyoftheserisks.Thetradingpriceofourcommonstockcoulddeclineduetoanyoftheserisks.ThisannualreportonForm10-Kalsocontainsforward-lookingstatementsthatinvolverisksanduncertainties.Ouractualresultscoulddiffermateriallyfromthoseanticipatedintheseforward-lookingstatementsasaresultofcertainfactors,includingtherisksfacedbyusdescribedbelowandelsewhereinthisannualreportonForm10-K.See“SpecialNoteRegardingForward-LookingStatements,”whichimmediatelyfollowstherisksbelow.
Current Economic and Regulatory Environment
Economicconditionscouldhaveamaterialadverseeffectonourbusiness,resultsofoperationsandfinancialcondition.
As a provider of consumer financial services, our business, results of operations and financial condition are subject to the United States andglobal economic environment. While the economy appears to be stable, we are experiencing the normalization of delinquency and charge-off ratesand entering a period during which these rates increase to long-run levels as the supply of consumer credit grows. A customer’s ability andwillingness to repay us can be negatively impacted by not only economic conditions but also a customer’s other payment obligations.
Economic conditions also can reduce the usage of credit cards in general and the average purchase amount of transactions industry-wide,including our cards, which reduces interest income and transaction fees. We rely heavily on interest income from our credit card business togenerate earnings. Our interest income from credit card loans was $8.8 billion for the year ended December 31, 2018 , which was 83% of netrevenues (defined as net interest income plus other income), compared to $7.9 billion for the year ended December 31, 2017 , which was 80% ofnet revenues. Economic conditions combined with a competitive marketplace could result in slow loan growth, resulting in reduced revenue growthfrom our core direct banking business.
Financialregulatorydevelopmentshaveandwillcontinuetosignificantlyimpacttheenvironmentforthefinancialservicesindustry,whichcouldadverselyimpactourbusiness,resultsofoperationsandfinancialcondition.
The EGRRCPA was signed into law on May 24, 2018. The act generally redefined a Systemically Important Financial Institution (“SIFI”) asone with assets above $250 billion. As a result, Discover anticipates being released from the SIFI designation as the act is implemented, since ourassets are below the statutory threshold. However, the applicability of various prudential standards, such as those related to capital, on Discover willbe determined by how our prudential banking regulators implement the act.
Meanwhile, the portions of the Dodd-Frank Act unchanged by the EGRRCPA remain law, including provisions governing the practices andoversight of financial institutions and other firms that participate in financial markets. The Senate and regulatory agency leadership are expected tocontinue to support tailoring of the regulatory burden on large financial institutions, including Discover. Success in making further legislative changesto the Dodd-Frank Act remains uncertain due to the potentially divergent agendas of the House and Senate. Further, the outcome of supervisoryand regulatory reform efforts at the federal banking agencies remains uncertain. Also, it is possible that regulatory reform measures maydisproportionately benefit our competitors or not benefit Discover at all due to our size, structure or product offerings, among other things.
The impact of the evolving regulatory environment on our business and operations depends upon a number of factors including thesupervisory priorities and actions of the Federal Reserve, the FDIC and the CFPB, the actions of our competitors and other marketplaceparticipants, as well as the behavior of consumers. Regulatory developments, findings and actions have, and could continue to, negatively impactour business strategies or require us to: limit, exit or change our business practices, restructure our products in ways that we may not currentlyanticipate, limit our product offerings, invest more management time and resources in compliance efforts, limit the fees we can charge for services,or limit our ability to pursue certain business opportunities and obtain related required regulatory approvals. For example, the Federal Reserve andthe FDIC enforcement actions related to our anti-money laundering program have caused us to change our processes and incur significantexpenses. For additional information regarding bank regulatory limitations on acquisitions and investments, see “Business — Supervision andRegulation — Acquisitions and Investments.” See also Note 19: Litigation and Regulatory Matters to our consolidated financial statements for moreinformation on recent matters affecting Discover. Regulatory developments could also influence our strategies, impact the value of our assets, orotherwise adversely affect our businesses.
- 24 -

Table of Contents
Compliance expectations and expenditures have increased significantly for Discover and other financial services firms, and could continue toincrease as regulators remain focused on controls and operational processes and we introduce new products or features or enter into new businessarrangements. We may face additional compliance and regulatory risk to the extent that we enter into new business arrangements with third-partyservice providers, alternative payment providers, or other industry participants. The additional expense, time and resources needed to comply withongoing or additional regulatory requirements may adversely impact our business and results of operations.
For more information regarding the regulatory environment and developments potentially impacting Discover, see “Management’s Discussionand Analysis of Financial Condition and Results of Operations — Regulatory Environment and Developments.”
Strategic Business RiskWefacecompetitioninthecreditcardmarketfromotherconsumerfinancialservicesproviders,andwemaynotbeabletocompeteeffectively,whichcouldresultinfewercustomersandloweraccountbalancesandcouldmateriallyadverselyaffectourfinancialcondition,cashflowsandresultsofoperations.
The consumer financial services business is highly competitive. We compete with other consumer financial services providers, including non-traditional providers such as financial technology firms, on the basis of a number of factors, including brand, reputation, customer service, productofferings, incentives, pricing, e-wallet participation and other terms. Competition in credit cards is also based on merchant acceptance and the valueprovided to the customer by rewards programs. Many credit card issuers have instituted rewards programs that are similar to ours, and, in somecases, could be viewed as more attractive to customers than our programs. These competitive factors affect our ability to attract and retaincustomers, increase usage of our products and maximize the revenue generated by our products. In addition, because most domestically-issuedcredit cards, other than those issued by American Express, are issued on the Visa and MasterCard networks, most other card issuers benefit fromthe dominant position and marketing and pricing power of Visa and MasterCard. The competitive marketplace could result in slower loan growth,resulting in reduced revenue growth from our core direct banking business. If we are unable to compete successfully, or if competing successfullyrequires us to take aggressive actions in response to competitors’ actions, our financial condition, cash flows and results of operations could bematerially adversely affected.
Weincurconsiderablecostincompetingwithotherconsumerfinancialservicesproviders,andmanyofourcompetitorshavegreaterfinancialresourcesthanwedo,whichmayplaceusatacompetitivedisadvantageandnegativelyaffectourfinancialresults.
We incur considerable cost in competing with other consumer financial services providers to attract and retain customers and increase usageof our products. A substantial portion of this cost relates to marketing expenditures and rewards programs. Since 2013 our rewards rate, whichrepresents rewards cost divided by Discover Card sales volume, has increased from less than 1% to 1.30% in 2018. We expect the competitiveintensity in the rewards space to continue, which could result in a continued increase in the rewards rate. Our consumer financial services productscompete primarily on the basis of pricing, terms and service. Because of the highly competitive nature of the credit card-issuing business, a primarymethod of competition among credit card issuers, including us, has been to offer rewards programs, low introductory interest rates, attractivestandard purchase rates and balance transfer programs that offer a favorable annual percentage rate or other financial incentives for a specifiedlength of time on account balances transferred from another credit card.
Competition is intense in the credit card industry, and customers may frequently switch credit cards or transfer their balances to another card.We expect to continue to invest in initiatives to remain competitive in the consumer financial services industry, including the launch of new cards andfeatures, brand awareness initiatives, targeted marketing, online and mobile enhancements, e-wallet participation, customer service improvements,credit risk management and operations enhancements, and infrastructure efficiencies. There can be no assurance that any of the cost we incur orincentives we offer to attempt to acquire and maintain accounts and increase usage of our products will be effective. In addition, to the extent thatwe offer new products, features or services to remain competitive, we may be subject to increased operational or other risks.
Furthermore, many of our competitors are larger than we are, have greater financial resources than we do, have more breadth in consumerbanking products, have lower funding costs than we have and expect to have, and have assets, such as branch locations and co-brandrelationships, that may be appealing to certain customers. For example, larger credit card issuers, which have greater resources than we do, may bebetter positioned to fund appealing
- 25 -

Table of Contents
rewards, marketing and advertising programs. We may be at a competitive disadvantage as a result of the greater financial resources, diversificationand scale of many of our competitors.
Our costs directly affect our earnings results. Many factors can influence the amount of our costs, as well as how quickly it may increase. Ourongoing investments in infrastructure, which may be necessary to maintain a competitive business, integrate newly-acquired businesses andestablish scalable operations, increase our cost. In addition, as our business develops, changes or expands, additional cost can arise as a result ofa reevaluation of business strategies, management of outsourced services, asset purchases, structural reorganization, compliance with new laws orregulations or the acquisition of new businesses. If we are unable to successfully manage our cost, our financial results will be negatively affected.
Wefacecompetitionfromotheroperatorsofpaymentnetworksandalternativepaymentproviders,andwemaynotbeabletocompeteeffectively,whichcouldresultinreducedtransactionvolume,limitedmerchantacceptanceofourcards,limitedissuanceofcardsonournetworksbythirdpartiesandmateriallyreducedearningsfromourpaymentservicesbusiness.
We face substantial and increasingly intense competition in the payments industry, both from traditional players and new, emerging alternativepayment providers. For example, we compete with other payment networks to attract network partners to issue credit and debit cards and other cardproducts on the Discover, PULSE and Diners Club networks. Competition with other operators of payment networks is generally based on issuerfees, fees paid to networks (including switch fees), merchant acceptance, network functionality and other economic terms. Competition is also basedon customer perception of service quality, brand image, reputation and market share. Further, we are facing increased competition from alternativepayment providers, who may create innovative network or other arrangements with our primary competitors or other industry participants, whichcould adversely impact our costs, transaction volume and ability to grow our business.
Many of our competitors are well established, larger than we are and/or have greater financial resources or scale than we do. Thesecompetitors have provided financial incentives to card issuers, such as large cash signing bonuses for new programs, funding for and sponsorshipof marketing programs and other bonuses. Visa and MasterCard each enjoy greater merchant acceptance and broader global brand recognitionthan we do. Although we have made progress in merchant acceptance, we have not achieved global market parity with Visa and MasterCard. Inaddition, Visa and MasterCard have entered into long-term arrangements with many financial institutions that may have the effect of discouragingthose institutions from issuing cards on the Discover Network or issuing debit cards on the PULSE network. Some of these arrangements areexclusive, or nearly exclusive, which further limits our ability to conduct material amounts of business with these institutions. If we are unable toremain competitive on issuer fees and other incentives, we may be unable to offer adequate pricing to network partners while maintaining sufficientnet revenues.
We also face competition as merchants put pressure on transaction fees. Increasing merchant fees or acquirer fees could adversely affect oureffort to increase merchant acceptance of credit cards issued on the Discover Network and may cause merchant acceptance to decrease. This, inturn, could adversely affect our ability to attract network partners and our ability to maintain or grow revenues from our proprietary network. Inaddition, competitors’ settlements with merchants and related actions, including pricing pressures and/or surcharging, could negatively impact ourbusiness practices. Competitor actions related to the structure of merchant and acquirer fees and merchant and acquirer transaction routingstrategies have adversely affected and are expected to continue to adversely affect our PULSE network’s business practices, network transactionvolume, revenue and prospects for future growth, and entry into new product markets. Visa has entered into arrangements with some merchantsand acquirers that have, and are expected to continue to have, the effect of discouraging those merchants and acquirers from routing debittransactions to PULSE. In addition, the Dodd-Frank Act’s network participation requirements and competitor actions negatively impact PULSE’sability to enter into exclusivity arrangements, which affects PULSE’s business practices and may materially adversely affect its network transactionvolume and revenue. PULSE has a pending lawsuit against Visa with respect to these competitive concerns. PULSE’s transaction processingrevenue was $ 178 million and $167 million for the years ended December 31, 2018 and 2017 , respectively.
American Express is also a strong competitor, with international acceptance, high transaction fees and an upscale brand image.Internationally, American Express competes in the same market segments as Diners Club. We may face challenges in increasing internationalacceptance on our networks, particularly if third parties that we rely on to issue Diners Club cards, increase card acceptance and market our brandsdo not perform to our expectations.
- 26 -

Table of Contents
In addition, if we are unable to maintain sufficient network functionality to be competitive with other networks, or if our competitors developbetter data security solutions or more innovative products and services than we do, our ability to retain and attract network partners and maintain orincrease the revenues generated by our proprietary card-issuing business or our PULSE business may be materially adversely affected.Additionally, competitors may develop data security solutions, which as a consequence of the competitors’ market power, we may be forced to use.In which case, our business may be adversely affected as they may be better positioned to absorb the costs over higher volumes or a largercustomer base.
Our business depends upon relationships with issuers, merchant acquirers and licensees, which are generally financial institutions. Theeconomic and regulatory environment and increased consolidation in the financial services industry decrease our opportunities for new business andmay result in the termination of existing business relationships if a business partner is acquired or goes out of business. In addition, as a result ofthis environment, financial institutions may have decreased interest in engaging in new card issuance opportunities or expanding existing cardissuance relationships, which would inhibit our ability to grow our payment services business. We continue to face substantial and intensecompetition in the payments industry, which impacts our revenue margins, transaction volume and business strategies.
Ifweareunsuccessfulinmaintainingourinternationalnetworkbusinessandachievingmeaningfulglobalcardacceptance,wemaybeunabletogrowourinternationalnetworkbusiness.
We continue to make progress toward, but have not completed, achieving global card acceptance across the Diners Club network, theDiscover Network and PULSE since we acquired the Diners Club network and related assets in 2008. This would allow Discover customers to usetheir cards at merchant and ATM locations that accept Diners Club cards around the world and would allow Diners Club customers to use theircards on the Discover Network in North America and on the PULSE network both domestically and internationally.
Our international network business depends upon the cooperation, support and continuous operation of the network licensees that issueDiners Club cards and that maintain a merchant acceptance network. As is the case for other card payment networks, our Diners Club network doesnot issue cards or determine the terms and conditions of cards issued by the network licensees. If we are unable to continue our relationships withnetwork licensees or if the network licensees are unable to continue their relationships with merchants, our ability to maintain or increase revenuesand to remain competitive would be adversely affected due to the potential deterioration in customer relationships and related demand that couldresult. If one or more licensees were to experience a significant impairment of their business or were to cease doing business for economic,regulatory or other reasons, we would face the adverse effects of business interruption in a particular market, including loss of volume, acceptanceand revenue, and exposure to potential reputational risk. If such conditions arise in the future, we may deploy resources and incur expenses in orderto sustain network acceptance. Additionally, interruption of network licensee relationships could have an adverse effect on the acceptance ofDiscover cards when they are used on the Diners Club network outside of North America.
Also, as we have non-amortizable intangible assets that resulted from the purchase of Diners Club, if we are unable to maintain or increaserevenues due to the reasons described above, we may be exposed to an impairment loss on the Diners Club acquisition that, when recognized,could have a material adverse impact on our consolidated financial condition and results of operations. The long-term success of our internationalnetwork business depends upon achieving meaningful global card acceptance, which has included and may continue to include higher overall costsor longer timeframes than anticipated.
Thesuccessofourstudentloanstrategydependsuponourabilitytomanagetherisksofourstudentloanportfolioandthestudentlendingenvironment.Ifwefailtodoso,wemaybeunabletosustainandgrowourstudentloanportfolio.
The long-term success of our student loan strategy depends upon our ability to manage the credit risk, pricing, funding, operations andexpenses of our student loan portfolio, as well as grow student loan originations. Our student loan strategy is also impacted by external factors suchas the overall economic environment, a competitive marketplace and a challenging regulatory environment for private student loans and studentloans generally. For more information on the regulatory environment, see “Management’s Discussion and Analysis of Financial Condition andResults of Operations — Regulatory Environment and Developments — Consumer Financial Services” and Note 19: Litigation and RegulatoryMatters to our consolidated financial statements. Economic weakness, government and regulatory focus on higher education costs, student lendingand student loan servicing, as well as competitive factors, such as competition from non-traditional lenders such as financial technology firms, maypresent challenges to managing and growing our
- 27 -
Table of Contents
private student loan business in the future, and could cause us to restructure our private student loan products in ways that we may not currentlyanticipate. In addition, changes that adversely affect the private student loan market generally may negatively impact the profitability and growth ofour student loan portfolio.
Acquisitionsorstrategicinvestmentsthatwepursuemaynotbesuccessfulandcoulddisruptourbusiness,harmourfinancialconditionorreduceourearnings.
We may consider or undertake strategic acquisitions of, or material investments in, businesses, products, portfolios of loans or technologies inthe future. We may not be able to identify suitable acquisition or investment candidates, or even if we do identify suitable candidates, they may bedifficult to finance, expensive to fund and there is no guarantee that we can obtain any necessary regulatory approvals or complete the transactionson terms that are favorable to us. We generally must receive federal regulatory approvals before we can acquire a bank, bank holding company,deposits or certain assets or businesses. For additional information regarding bank regulatory limitations on acquisitions and investments, see“Business — Supervision and Regulation — Acquisitions and Investments.”
To the extent we pay the purchase price of any strategic acquisition or investment in cash, it may have an adverse effect on our financialcondition; similarly, if the purchase price is paid with our stock, it may be dilutive to our stockholders. In addition, we may assume liabilitiesassociated with a business acquisition or investment, including unrecorded liabilities that are not discovered at the time of the transaction, and therepayment or settlement of those liabilities may have an adverse effect on our financial condition.
We may not be able to successfully integrate the personnel, operations, businesses, products, or technologies of an acquisition or investment.Integration may be particularly challenging if we enter into a line of business in which we have limited experience and the business operates in adifficult legal, regulatory or competitive environment. We may find that we do not have adequate operations or expertise to manage the newbusiness. The integration of any acquisition or investment may divert management’s time and resources from our core business, which could impairour relationships with our current employees, customers and strategic partners and disrupt our operations. Acquisitions and investments also maynot perform to our expectations for various reasons, including the loss of key personnel, customers or vendors. If we fail to integrate acquisitions orinvestments or realize the expected benefits, we may lose the return on these acquisitions or investments or incur additional transaction costs, andour business, reputation and financial condition may be harmed as a result.
Credit, Market and Liquidity RiskOurbusinessdependsonourabilitytomanageourcreditrisk,andfailingtomanagethisrisksuccessfullymayresultinhighcharge-offrates,whichwouldmateriallyadverselyaffectourbusiness,profitabilityandfinancialcondition.
We seek to grow our loan receivables while maintaining quality credit performance. Our success depends on our ability to manage our creditrisk while attracting new customers with profitable usage patterns. We select our customers, manage their accounts and establish terms and creditlimits using externally developed and proprietary scoring models and other analytical techniques that are designed to set terms and credit limits toappropriately compensate us for the credit risk we accept, while encouraging customers to use their available credit. The models and approacheswe use may not accurately predict future charge-offs due to, among other things, inaccurate assumptions. While we continually seek to improve ourassumptions and models, we may make modifications that unintentionally cause them to be less predictive or we may incorrectly interpret the dataproduced by these models in setting our credit policies.
Our ability to manage credit risk and avoid high charge-off rates may be adversely affected by economic conditions that may be difficult topredict. At December 31, 2018 and 2017 , $1.2 billion , or 1.27% , and $987 million , or 1.17% , of our loan receivables were non-performing(defined as loans over 90 days delinquent and accruing interest plus loans not accruing interest). While the U.S. economy appears to be stable, weare experiencing the normalization of delinquency and charge-off rates and entering a period during which these rates increase to long-run levels asthe supply of consumer credit grows. There can be no assurance that our underwriting and portfolio management strategies will permit us to avoidhigh charge-off levels, or that our allowance for loan losses will be sufficient to cover actual losses.
A customer’s ability and willingness to repay us can be negatively impacted by increases in their payment obligations to other lenders and byrestricted availability of credit to consumers generally. Our collection operations may not compete effectively to secure more of customers’diminished cash flow than our competitors. In addition, we
- 28 -

Table of Contents
may fail to quickly identify customers who are likely to default on their payment obligations and reduce our exposure by closing credit lines andrestricting authorizations, which could adversely impact our financial condition and results of operations. Our ability to manage credit risk also maybe adversely affected by legal or regulatory changes (such as restrictions on collections, bankruptcy laws, minimum payment regulations and re-ageguidance), competitors’ actions and consumer behavior, as well as inadequate collections staffing, resources, techniques and models.
We continue to expand our marketing of our non-credit card consumer lending products. A customer’s ability and willingness to repaypersonal loans, private student loans and home equity loans may be more significantly impacted than other consumer loans by other debts orincreases in their payment obligations to other lenders. Additionally, a customer’s ability to repay personal loans, private student loans and homeequity loans may be significantly impaired by the unavailability of consumer credit generally. There can be no assurance that we will be able to growthese products in accordance with our strategies, manage our credit and other risks associated with these products, or generate sufficient revenueto cover our expenses in these markets. Our failure to manage our credit and other risks may materially adversely affect our profitability and ourability to grow these products, limiting our ability to further diversify our business.
Adversemarketconditionsoraninabilitytoeffectivelymanageourliquidityriskcouldnegativelyimpactourabilitytomeetourliquidityandfundingneeds,whichcouldmateriallyadverselyimpactourbusinessoperationsandoverallfinancialcondition.
We must effectively manage the liquidity risk to which we are exposed. We require liquidity in order to meet cash requirements such as day-to-day operating expenses, extensions of credit on our consumer loans and required payments of principal and interest on our borrowings. Ourprimary sources of liquidity and funding are payments on our loan receivables, deposits, and proceeds from securitization transactions andsecurities offerings. We may maintain too much liquidity, which can be costly and limit financial flexibility, or we may be too illiquid, which could resultin financial distress during a liquidity stress event. Our liquidity portfolio had a balance of approximately $15.9 billion as of December 31, 2018 ,compared to $13.6 billion as of December 31, 2017 . Our total contingent liquidity sources amounted to $52.9 billion as of December 31, 2018 ,compared to $48.7 billion as of December 31, 2017 . As of December 31, 2018 , our total contingent liquidity sources consisted of $15.9 billion in ourliquidity portfolio, $31.5 billion in incremental Federal Reserve discount window capacity, and $5.5 billion of undrawn capacity in privatesecuritizations.
In the event that our current sources of liquidity do not satisfy our needs, we would be required to seek additional financing. The availability ofadditional financing will depend on a variety of factors such as market conditions, the general availability of credit to the financial services industry,new regulatory restrictions and requirements, and our credit ratings. Disruptions, uncertainty or volatility in the capital, credit or deposit markets,such as the volatility experienced in the capital and credit markets during the financial crisis of 2007, may limit our ability to repay or replacematuring liabilities in a timely manner. As such, we may be forced to delay the acquisition of additional funding or be forced to issue or raise fundingat undesirable terms and/or costs, which could decrease profitability and significantly reduce financial flexibility. Regulations such as the liquiditycoverage ratio, which requires firms to hold a minimum level of high-quality assets, may increase the cost of funding and impact funding availabilityand are described more fully in “Management’s Discussion and Analysis of Financial Condition and Results of Operations — RegulatoryEnvironment and Developments.” Further, in disorderly financial markets or for other reasons, it may be difficult or impossible to liquidate some ofour investments to meet our liquidity needs.
There can be no assurance that significant disruption and volatility in the financial markets will not occur in the future. Likewise, adversedevelopments with respect to financial institutions and other third parties with whom we maintain important financial relationships could negativelyimpact our funding and liquidity. If we are unable to continue to fund our assets through deposits or access capital markets on favorable terms, or ifwe experience an increase in our borrowing costs or otherwise fail to manage our liquidity effectively, our liquidity, operating results, financial resultsand condition may be materially adversely affected.
Aninabilitytoacceptormaintaindepositsinthefuturecouldmateriallyadverselyaffectourliquiditypositionandourabilitytofundourbusiness.
We obtain deposits from consumers either directly or through affinity relationships and through third-party securities brokerage firms that offerour deposits to their customers. We had $44.7 billion in deposits acquired directly or through affinity relationships and $23.1 billion in depositsoriginated through securities brokerage firms as of December 31, 2018 , compared to $39.4 billion and $19.4 billion , respectively, as of December31, 2017 . Competition
- 29 -
Table of Contents
from other financial services firms that use deposit funding, the rates and services we offer on our deposit products, and our ability to maintain ahigh level of customer experience may affect deposit renewal rates, costs or availability. Changes we make to the rates offered on our depositproducts may affect our profitability (through funding costs) and our liquidity (through volumes raised). In addition, our ability to maintain existing orobtain additional deposits may be impacted by factors, including factors beyond our control, such as: perceptions about our financial strength orquality of deposit servicing or online banking generally, which could reduce the number of consumers choosing to place deposits with us; thirdparties continuing or entering into affinity relationships with us; disruptions in technology services or the internet, generally; or third-party securitiesbrokerage firms continuing to offer our deposit products.
Our ability to obtain deposit funding and offer competitive interest rates on deposits is also dependent on capital levels of our banksubsidiaries. The FDIA in certain circumstances prohibits insured banks, such as our subsidiary Discover Bank, from accepting brokered deposits(as defined in the FDIA) and applies other restrictions, such as a cap on interest rates we may pay. See “Business — Supervision and Regulation”and Note 17: Capital Adequacy to our consolidated financial statements for more information. While Discover Bank met the FDIC’s definition of“well-capitalized” as of December 31, 2018 , and has no restrictions regarding acceptance of brokered deposits or setting of interest rates, there canbe no assurance that it will continue to meet this definition. Additionally, our regulators can adjust the requirements to be “well-capitalized” at anytime and have authority to place limitations on our deposit businesses, including the interest rate we pay on deposits.
Ifweareunabletosecuritizeourreceivables,itmayhaveamaterialadverseeffectonourliquidity,costoffundsandoverallfinancialcondition.
We use the securitization of credit card receivables, which involves the transfer of receivables to a trust and the issuance by the trust ofbeneficial interests to third-party investors, as a significant source of funding as well as for contingent liquidity. Our average level of credit cardsecuritized borrowings from third parties was $16.0 billion and $16.1 billion for the years ended December 31, 2018 and 2017 , respectively. Therecan be no assurance that there will not be future disruptions in the credit card securitization market similar to those experienced during the financialcrisis. Our ability to raise funding through the securitization market also depends, in part, on the credit ratings of the securities we issue from oursecuritization trusts. If we are not able to satisfy rating agency requirements to confirm the ratings of asset-backed securities issued by our trusts atthe time of a new issuance of securities, it could limit our ability to access the securitization markets. Additional factors affecting the extent to whichwe may securitize our credit card receivables in the future include the overall credit quality of our receivables, the costs of securitizing ourreceivables, the demand for credit card asset-backed securities, and the legal, regulatory, accounting and tax requirements governing securitizationtransactions and asset-backed securities, generally. For example, the implementation of the Basel Committee on Banking Supervision’s revisedsecuritization framework for banks by the member countries by the beginning of 2019 could negatively impact the pricing and/or volume of ourasset-backed securities issuances. A prolonged inability to securitize our credit card receivables, or an increase in the costs of such issuances, mayhave a material adverse effect on our liquidity, cost of funds and overall financial condition.
Theoccurrenceofeventsthatresultintheearlyamortizationofourexistingcreditcardsecuritizationtransactionsoraninabilitytodelaytheaccumulationofprincipalcollectionsinourcreditcardsecuritizationtrustswouldmateriallyadverselyaffectourliquidity.
Our liquidity would be materially adversely affected by the occurrence of events that could result in the early amortization of our existing creditcard securitization transactions. Our credit card securitizations are structured as “revolving transactions” that do not distribute to securitizationinvestors their share of monthly principal payments received on the underlying receivables during the revolving period, and instead use thoseprincipal payments to fund the purchase of new receivables. The occurrence of an “early amortization event” may result in termination of therevolving periods of our securitization transactions, which would require us to repay the affected outstanding securitized borrowings out of principalcollections without regard to the original payment schedule. Early amortization events include, for example, insufficient cash flows in the securitizedpool of receivables to meet contractual requirements (i.e. excess spread less than zero) and certain breaches of representations, warranties orcovenants in the agreements relating to the securitization. For more information on excess spread, see Note 5: Credit Card and Student LoanSecuritization Activities to our consolidated financial statements. An early amortization event would negatively impact our liquidity, and require us torely on alternative funding sources, which may or may not be available at the time. An early amortization event also could impact our ability toaccess the undrawn conduit facilities that we maintain for contingent liquidity purposes.
- 30 -

Table of Contents
Our credit card securitization structure includes a requirement that we accumulate principal collections into a restricted account in the amountof scheduled maturities on a pro rata basis over the 12 months prior to a security’s maturity date. We have the option under our credit cardsecuritization documents to shorten this accumulation period, subject to the satisfaction of certain conditions. Historically, we have exercised thisoption to shorten the accumulation period to one month prior to maturity. If we were to determine that the payment rate on the underlyingreceivables would not support a one-month accumulation period, we would need to begin accumulating principal cash flows earlier than we havehistorically. A lengthening of the accumulation period would negatively impact our liquidity, requiring management to implement mitigating measures.During periods of significant maturity levels, absent management actions, the lengthening of the accumulation period could materially adverselyaffect our financial condition.
Adowngradeinthecreditratingsofoursecuritiescouldmateriallyadverselyaffectourbusinessandfinancialcondition.
We, along with Discover Bank, are regularly evaluated by the ratings agencies, and their ratings for our long-term debt and other securities,including asset-backed securities issued by our securitization trusts, are based on a number of factors that may change from time to time, includingour financial strength as well as factors that may not be within our control. Factors that affect our unsecured credit ratings include, but are not limitedto, the macroeconomic environment in which we operate and the credit ratings of the U.S. government, the credit quality and performance of ourassets, the amount and quality of our capital, the level and stability of our earnings, and the structure and amount of our liquidity. In addition to thesefactors, the ratings of our asset-backed securities are also based on the quality of the underlying receivables and the credit enhancement structureof the trusts. Downgrades in our ratings or those of Discover Bank or our trusts could materially adversely affect our cost of funds, access to capitaland funding, and overall financial condition. There can be no assurance that we will be able to maintain our current credit ratings or that our creditratings will not be lowered or withdrawn.
Wemaynotbesuccessfulinmanagingtheinvestmentsinourliquidityinvestmentportfolioandinvestmentperformancemaydeteriorateduetomarketfluctuations,whichwouldadverselyaffectourbusinessandfinancialcondition.
We must effectively manage the risks of the investments in our liquidity investment portfolio, which is comprised of cash and cash equivalentsand high-quality liquid investments. The value of our investments may be adversely affected by market fluctuations including changes in interestrates, prices, prepayment rates, credit risk premiums and overall market liquidity. Also, investments backed by collateral could be adverselyimpacted by changes in the value of the underlying collateral. In addition, economic conditions may cause certain of the obligors, counterparties andunderlying collateral on our investments to incur losses of their own or default on their obligations to us due to bankruptcy, lack of liquidity,operational failure or other reasons, thereby increasing our credit risk exposure to these investments. These risks could result in a decrease in thevalue of our investments, which could negatively impact our financial condition. These risks could also restrict our access to funding. While thesecurities in our investment portfolio are currently limited to obligations of high-quality sovereign and government-sponsored issuers, we maychoose to expand the range of our investments over time, which may result in greater fluctuations in market value. While we expect theseinvestments to be readily convertible into cash and do not believe they present a material increase to our risk profile or will have a material impacton our risk-based capital ratios, they are subject to certain market fluctuations that may reduce the ability to fully convert them into cash.
Changesinthelevelofinterestratescouldmateriallyadverselyaffectourearnings.
Changes in interest rates cause our net interest income to increase or decrease, as some of our assets and liabilities carry interest rates thatfluctuate with market benchmarks. External factors may cause interest rates to increase. Tighter Federal Reserve monetary policy and rising interestrates would increase the cost of borrowing for consumers, businesses and governments. Higher interest rates could negatively impact Discover’scustomers as total debt service payments would increase, impede Discover’s ability to grow its consumer lending businesses, and increase the costof our funding, which would put Discover at a disadvantage as compared to competitors that have less expensive funding sources.
Some of our consumer loan receivables bear interest at a fixed rate or do not earn interest, and we are not able to increase the rate on thoseloans to offset any higher cost of funds, which could materially reduce earnings. At the same time, our variable rate loan receivables, most of whichare based on the prime rate, may not change at the same rate as our floating-rate borrowings or may be subject to a cap, subjecting us to basis risk.The majority of our floating-rate borrowings and interest rate derivatives are generally based on the one-month London Interbank Offered Rate
- 31 -

Table of Contents
(“LIBOR”). If the one-month LIBOR rate were to increase without a corresponding increase in the prime rate, our earnings would be negativelyimpacted. While the majority of our existing certificates of deposit bear interest at fixed rates that do not fluctuate with market benchmarks, we mayuse derivative instruments to hedge the fixed rates associated with some of these certificates of deposit. However, the costs of new depositsfluctuate with interest rates. Moreover, although certificates of deposit we issue directly to consumers are subject to early withdrawal penalties,these penalties may not fully mitigate early withdrawal behavior in a rising interest rate environment. Additionally, on July 27, 2017, the UK FinancialConduct Authority announced that it would no longer encourage or compel banks to continue to contribute quotes and maintain LIBOR after 2021.Potential replacements for LIBOR are emerging; however, the transition process is still ongoing and the outcome is still uncertain.
Interest rates may also adversely impact our delinquency and charge-off rates. Many consumer lending products bear interest rates thatfluctuate with certain base lending rates published in the market, such as the prime rate and LIBOR. As a result, higher interest rates often lead tohigher payment requirements by consumers under obligations to us and other lenders, most of which may reduce their ability to remain current ontheir obligations to us and thereby lead to loan delinquencies and additions to our loan loss provision, which could materially adversely affect ourearnings.
We continually monitor interest rates and have a number of tools, including the composition of our investments, liability terms and interest ratederivatives, to manage our interest rate risk exposure. Changes in market assumptions regarding future interest rates could significantly impact ourinterest rate risk strategy, our financial position and results of operations. If our interest rate risk management strategies are not appropriatelymonitored or executed, these activities may not effectively mitigate our interest rate sensitivity or have the desired impact on our results ofoperations or financial condition. For information related to interest rate risk sensitivities, see “Quantitative and Qualitative Disclosures About MarketRisk.”
Wemaybelimitedinourabilitytopaydividendsonandrepurchaseourstock.
In the year ended December 31, 2018 , we increased our quarterly common stock dividend to $0.40 per share and repurchasedapproximately 8% of our outstanding common stock under our share repurchase program. The declaration and payment of future dividends, as wellas the amount thereof, are subject to the discretion of our Board of Directors. The amount and size of any future dividends and share repurchaseswill depend upon regulatory limitations imposed by the Federal Reserve, and our results of operations, financial condition, capital levels, cashrequirements, future prospects, regulatory review and other factors as further described in “Business — Supervision and Regulation — Capital,Dividends and Share Repurchases.” Holders of our shares of common stock are subject to the prior dividend rights of holders of our preferred stockor the depositary shares representing such preferred stock outstanding, and if full dividends have not been declared and paid on all outstandingshares of our preferred stock in any dividend period, no dividend may be declared or paid on or set aside for payment on our common stock.Banking laws and regulations and our banking regulators may limit or prohibit our payment of dividends on or our repurchase of our stock at anytime. There can be no assurance that we will declare and pay any dividends on or repurchase our stock in the future.
Weareaholdingcompanyanddependonpaymentsfromoursubsidiaries.
Discover Financial Services, our parent holding company, depends on dividends, distributions and other payments from its subsidiaries,particularly Discover Bank, to fund dividend payments, share repurchases, payments on its obligations, including debt obligations, and to providefunding and capital as needed to its operating subsidiaries. Banking laws and regulations and our banking regulators may limit or prohibit ourtransfer of funds freely, either to or from our subsidiaries, at any time. These laws, regulations and rules may hinder our ability to access funds thatwe may need to make payments on our obligations or otherwise achieve strategic objectives. For more information, see “Business — Supervisionand Regulation — Capital, Dividends and Share Repurchases.”
Operational and Other RiskOurriskmanagementframeworkandmodelsformanagingrisksmaynotbeeffectiveinmitigatingourriskofloss.
Our risk management framework seeks to identify and mitigate risk and appropriately balance risk and return. We have established processesand procedures intended to identify, measure, manage, monitor and report the types of risk to which we are subject, including credit risk, marketrisk, liquidity risk, operational risk, compliance and legal risk, and strategic risk. We seek to monitor and control our risk exposure through aframework of policies, procedures, limits and reporting requirements.
- 32 -
Table of Contents
Management of our risks in some cases depends upon the use of analytical and/or forecasting models. We use a variety of models to manageand inform decision-making with respect to customers, and for the measurement of risk including credit, market and operational risks and for ourfinance and treasury functions. Models used by Discover can vary in their complexity and are designed to identify, measure and mitigate risks atvarious levels such as loan-level, portfolio segments, entire portfolios and products. These models use a set of computational rules to generatenumerical estimates of uncertain values to be used for assessment of price, financial forecasts, and estimates of credit, interest rate, market andoperational risk. All models carry some level of uncertainty that introduces risks in the estimates.
If the models that we use to mitigate risks are inadequate, we may incur increased losses. In addition, there may be risks that exist, or thatdevelop in the future, that we have not appropriately anticipated, identified or mitigated. If our risk management framework and models do noteffectively identify or mitigate our risks, we could suffer unexpected losses and our financial condition and results of operations could be materiallyadversely affected.
Ifoursecuritysystems,orthoseofthirdparties,containinginformationaboutus,ourcustomersorthirdpartieswithwhichwedobusiness,arecompromised,ourbusinesscouldbedisruptedandwemaybesubjecttosignificantfinancialexposure,liabilityanddamagetoourreputation.
Our direct banking and network operations rely heavily on the secure processing, storage and transmission of confidential or sensitiveinformation about us, our customers and third parties with which we do business. Information security risks for financial institutions have increasedand continue to increase in part because of the proliferation of new technologies, the use of the internet, mobile and telecommunicationstechnologies to conduct financial transactions, and the increased sophistication and activities of organized crime, activists, hackers, terroristorganizations, nation state actors and other external parties. Those parties may also attempt to fraudulently induce employees, customers or otherusers of our systems (including third parties) to disclose confidential or sensitive information in order to gain access to our data or that of ourcustomers.
Our technologies, systems, networks and software, those of other financial institutions and other firms that handle or maintain confidential orsensitive information (including customer information), have been, and are likely to continue to be, the target of increasingly frequent cyber-attacks,malicious code, computer viruses, denial of service attacks, phishing and social engineering, other remote access attacks, and physical attacks thatcould result in unauthorized access, misuse, loss, unavailability or destruction of data (including confidential customer information), accounttakeovers, identity theft and fraud, unavailability of service or other events. These types of threats may derive from human error, fraud or malice onthe part of external or internal parties, or may result from technological failure or otherwise.
Despite our efforts to ensure the integrity of our systems through our information security and business continuity programs, we may not beable to anticipate or to implement effective preventive measures against all known and unknown security threats, attacks or breaches or events ofthese types, especially because the techniques used change frequently and are becoming increasingly more sophisticated or are not recognizeduntil launched or vulnerabilities in software or hardware are unknown or are unable to be entirely addressed even after becoming known, andbecause:
• Security attacks can originate from a wide variety of sources and geographic locations and may be undetected for a period of time.
• We rely on many third-party service providers and network participants, including merchants, and, as such, a security breach or cyber-attack affecting one of these third parties could impact us. For example, the financial services industry continues to see attacks againstthe environments where personal and identifiable information is handled. For additional information see the risk factor “— Werelyonthirdpartiestodeliverservices.Ifwefacedifficultiesmanagingourrelationshipswiththird-partyserviceproviders,ourrevenueorresultsofoperationscouldbemateriallyadverselyaffected.”
• To access our products and services, our customers may use computers and mobile devices that are beyond our security controlsystems.
We are subject to increasing risk related to information and data security as we increase acceptance of the Discover card internationally,expand our suite of online direct banking products, enhance our mobile payment technologies, acquire new or outsource some of our businessoperations, expand our internal usage of web-based products and applications, and otherwise attempt to keep pace with rapid technologicalchanges in the financial services industry. Our efforts to mitigate this risk increase our expenses. While we continue to invest in our informationsecurity defenses (including cybersecurity defenses), if our security systems or those of third parties are penetrated or
- 33 -
Table of Contents
circumvented such that the confidentiality, integrity or availability of information about us, our customers, transactions processed on our networks oron third-party networks on our behalf or third parties with which we do business is compromised, we could be subject to significant liability that maynot be covered by insurance, including significant legal and financial exposure, actions by our regulators, damage to our reputation, or a loss ofconfidence in the security of our systems, products and services that could materially adversely affect our business. For additional information onrisks in this area, see the risk factors below regarding fraudulent activity, the introduction of new products and services, the use of third parties foroutsourcing, technology generally, and laws and regulations addressing consumer privacy and data use and security.
Ifwecannotremainorganizationallyeffective,wewillbeunabletoaddresstheopportunitiesandchallengespresentedbyourstrategyandtheincreasinglydynamicandcompetitiveeconomicandregulatoryenvironment.
To remain organizationally effective, we must effectively empower, integrate and deploy our management and operational resources andincorporate global and local business, regulatory and consumer perspectives into our decisions and processes. In order to execute on our objectiveto be the leading consumer bank and payments partner, we must develop and implement innovative and efficient technology solutions andmarketing initiatives while effectively managing legal, regulatory, compliance, security, operational and other risks as well as expenses. Examplesinclude the implementation of a broader rollout of our checking product and a structure for a more competitive global network business. If we fail todevelop and implement these solutions, we may be unable to expand quickly and the results of our expansion may be unsatisfactory. In addition, ifwe are unable to make decisions quickly, assess our opportunities and risks, execute our strategy, and implement new governance, managerial andorganizational processes as needed in this increasingly dynamic and competitive economic and regulatory environment, our financial condition,results of operations, relationships with our business partners, banking regulators, customers and shareholders, and ultimately our prospects forachieving our long-term strategies, may be negatively impacted.
WemaybeunabletoincreaseorsustainDiscovercardusage,whichcouldimpairgrowthin,orleadtodiminishing,averagebalancesandtotalrevenue.
A key element of our business strategy is to increase the usage of the Discover card by our customers, including making it their primary card,and thereby increase our revenue from transaction and service fees and interest income. However, our customers’ use and payment patterns maychange because of social, legal and economic factors, and customers may decide to use debit cards or other payment products instead of creditcards, not increase card usage, or pay their balances within the grace period to avoid finance charges. We face challenges from competing cardproducts in our attempts to increase credit card usage by our existing customers. Our ability to increase card usage also is dependent on customersatisfaction, which may be adversely affected by factors outside of our control, including competitors’ actions and legislative/regulatory changes.Existing legal and regulatory restrictions limit pricing changes that may impact an account throughout its lifecycle, which may reduce our capability tooffer lower price promotions to drive account usage and customer engagement. As part of our strategy to increase usage, we have been increasingthe number of merchants who accept cards issued on the Discover Network. If we are unable to continue increasing merchant acceptance or fail toimprove awareness of existing merchant acceptance of our cards, our ability to grow usage of Discover cards may be hampered. As a result ofthese factors, we may be unable to increase or sustain credit card usage, which could impair growth in or lead to diminishing average balances andtotal revenue.
Ourtransactionvolumeisconcentratedamonglargemerchants,andareductioninthenumberoflargemerchantsthatacceptcardsontheDiscoverNetworkorPULSEnetworkortheratestheypaycouldmateriallyadverselyaffectourbusiness,financialcondition,resultsofoperationsandcashflows.
Discover card transaction dollar volume was concentrated among our top 100 merchants in 2018 , with our largest merchant accounting forapproximately 5% of that transaction volume. Transaction volume on the PULSE network was also concentrated among the top 100 merchants in2018 , with our largest merchant accounting for approximately 20% of PULSE transaction volume. These merchants could seek to negotiate betterpricing or other financial incentives by conditioning their continued participation in the Discover Network and/or PULSE network on a change in theterms of their economic participation. Loss of acceptance at our largest merchants would decrease transaction volume, negatively impact our brand,and could cause customer attrition. In addition, some of our merchants, primarily our remaining small- and mid-size merchants, are not contractuallycommitted to us for any period of time and may cease to participate in the Discover Network at any time on short notice.
Actual or perceived limitations on acceptance of credit cards issued on the Discover Network or debit cards issued on the PULSE networkcould adversely affect the use of Discover cards by existing customers and the
- 34 -
Table of Contents
attractiveness of the Discover card to prospective customers. Also, we may have difficulty attracting and retaining network partners if we are unableto add or retain acquirers or merchants who accept cards issued on the Discover or PULSE networks. As a result of these factors, a reduction in thenumber of our merchants or the rates they pay could materially adversely affect our business, financial condition, results of operations and cashflows.
Ourbusiness,financialconditionandresultsofoperationsmaybeadverselyaffectedbymerchants’increasingfocusonthefeeschargedbycreditcardanddebitcardnetworks.
Merchant acceptance and fees are critical to the success of both our card-issuing and payment processing businesses. Merchants areconcerned with the fees charged by credit card and debit card networks. They seek to negotiate better pricing or other financial incentives as acondition of continued participation in the Discover Network and PULSE network. During the past few years, merchants and their trade groups havefiled numerous lawsuits against Visa, MasterCard, American Express and their card-issuing banks, claiming that their practices toward merchants,including issuer fees, violate federal antitrust laws. There can be no assurance that they will not in the future bring legal proceedings against othercredit card and debit card issuers and networks, including us. Merchants also may promote forms of payment with lower fees, such as ACH-basedpayments, or seek to impose surcharges at the point of sale for use of credit or debit cards. Merchant groups have also promoted federal and statelegislation that would restrict issuer practices or enhance the ability of merchants, individually or collectively, to negotiate more favorable fees. Theheightened focus by merchants on the fees charged by credit card and debit card networks, together with the Dodd-Frank Act and recent industrylitigation, which would allow merchants to encourage customers to use other payment methods or cards and may increase merchant surcharging,could lead to reduced transactions on, or merchant acceptance of, Discover Network or PULSE network cards or reduced fees, any of which couldadversely affect our business, financial condition and results of operations.
Political,economicorotherinstabilityinacountryorgeographicregion,orotherunforeseenorcatastrophicevents,couldadverselyaffectourinternationalbusinessactivitiesandreduceourrevenue.
Natural disasters or other catastrophic events, including terrorist attacks, may have a negative effect on our business and infrastructure,including our information technology systems. Our Diners Club network, concentrated primarily on serving the global travel industry, could beadversely affected by international conditions that may result in a decline in consumer or business travel activity. Armed conflict, public healthemergencies, natural disasters, political instability or terrorism may have a significant negative effect on travel activity and related revenue. Althougha regionalized event or condition may primarily affect one of our network participants, it may also affect our overall network and card activity and ourresulting revenue. Overall network and card transaction activity may decline as a result of concerns about safety or disease or may be limitedbecause of economic conditions that result in spending on travel to decline. The impact of such events and other catastrophes on the overalleconomy may also adversely affect our financial condition or results of operations.
Fraudulentactivityassociatedwithourproductsorournetworkscouldcauseourbrandstosufferreputationaldamage,theuseofourproductstodecreaseandourfraudlossestobemateriallyadverselyaffected.
We are subject to the risk of fraudulent activity associated with merchants, customers and other third parties handling customer information.The risk of fraud continues to increase for the financial services industry in general. We incurred fraud losses and other charges of $83 million and$89 million for the years ended December 31, 2018 and 2017 , respectively. Credit and debit card fraud, identity theft and related crimes areprevalent and perpetrators are growing ever more sophisticated. Our resources, customer authentication methods and fraud prevention tools maybe insufficient to accurately predict or prevent fraud. Additionally, our risk of fraud continues to increase as third parties that handle confidentialconsumer information suffer security breaches, acceptance of the Discover card grows internationally and we expand our direct banking businessand introduce new products and features. Our financial condition, the level of our fraud charge-offs and other results of operations could bematerially adversely affected if fraudulent activity were to significantly increase. High-profile fraudulent activity could negatively impact our brand andreputation. In addition, significant increases in fraudulent activity could lead to regulatory intervention (such as mandatory card reissuance) andreputational and financial damage to our brands, which could negatively impact the use of our deposit accounts, cards and networks and therebyhave a material adverse effect on our business. Further, fraudulent activity may result in lower license fee revenue from our Diners Club licensees.
- 35 -
Table of Contents
Thefinancialservicesandpaymentservicesindustriesarerapidlyevolving,andwemaybeunsuccessfulinintroducingnewproductsorservicesonalargescaleinresponsetothesechanges.
Technological changes continue to significantly impact the financial services and payment services industries, such as continuingdevelopment of technologies in the areas of smart cards, radio frequency and proximity payment devices, electronic wallets, mobile commerce, dataanalytics, machine learning and artificial intelligence, among others. For example, we may be unsuccessful in deploying new technologies tostrengthen our credit underwriting capabilities, marketing efforts, enhance customer service, drive efficiencies in back-office functions or reducefraud. The increasingly competitive mobile, e-wallet and tokenization spaces are expected to continue to bring risks and opportunities to both ourcard-issuing and payments businesses.
The effect of technological changes on our business is unpredictable. We depend, in part, on third parties for the development of and accessto new technologies. We expect that new services and technologies relating to the payments business will continue to appear in the market, andthese new services and technologies may be superior to, or render obsolete, the technologies that we currently use in our products and services.Rapidly evolving technologies and new entrants in mobile and emerging payments pose a risk to Discover both as a card issuer and to thepayments business. As a result, our future success may be dependent on our ability to identify and adapt to technological changes and evolvingindustry standards and to provide payment solutions for our customers, merchants and financial institution customers.
Difficulties or delays in the development, production, testing and marketing of new products or services may be caused by a number of factorsincluding, among other things, operational, capital and regulatory constraints. The occurrence of such difficulties may affect the success of ourproducts or services, and developing unsuccessful products and services could result in financial losses as well as decreased capital availability. Inaddition, the new products and services offered may not be attractive to consumers, merchants or financial institution customers. Also, success of anew product or service may depend upon our ability to deliver it on a large scale, which may require a significant capital investment that we may notbe in a position to make. If we are unable to successfully introduce and maintain new income-generating products and services while also managingour expenses, it may impact our ability to compete effectively and materially adversely affect our business and earnings.
Werelyonthirdpartiestodeliverservices.Ifwefacedifficultiesmanagingourrelationshipswiththird-partyserviceproviders,ourrevenueorresultsofoperationscouldbemateriallyadverselyaffected.
We depend on third-party service providers for many aspects of the operation of our business. For example, we depend on third parties forsoftware and systems development, the timely transmission of information across our data transportation network, and for othertelecommunications, processing, remittance, technology-related and other services in connection with our direct banking and payment servicesbusinesses. If a service provider fails to provide the services that we require or expect, or fails to meet contractual requirements, such as servicelevels, security requirements or compliance with applicable laws, the failure could negatively impact our business by adversely affecting our ability toprocess customers’ transactions in a timely and accurate manner, otherwise hampering our ability to serve our customers, or subjecting us tolitigation and regulatory risk for poor vendor oversight. Such a failure could adversely affect the perception of the reliability of our networks andservices, and the quality of our brands, and could have a materially adverse effect on our reputation, revenues and/or our results of operations.
Werelyontechnologytodeliverservices.Ifkeytechnologyplatformsbecomeobsolete,orifweexperiencedisruptions,includingdifficultiesinourabilitytoprocesstransactions,ourrevenueorresultsofoperationscouldbemateriallyadverselyaffected.
Our ability to deliver services to our customers and run our business in compliance with applicable laws and regulations may be affected bythe functionality of our technology systems. The implementation of technology changes as well as patches and upgrades to maintain current andintegrated systems may result in compliance issues and may, at least temporarily, cause disruptions to our business, including, but not limited to,systems interruptions, transaction processing errors and system conversion delays, all of which could have a negative impact on us. In addition, ourtransaction processing systems and other operational systems may encounter service interruptions at any time due to system or software failure,natural disaster or other reasons. Such services could be disrupted at any of our primary or back-up facilities or our other owned or leased facilities.Third parties to whom we outsource the maintenance and development of certain technological functionality may experience errors or disruptionsthat could adversely impact us and over which we may have limited control. In addition, there is no assurance that we will be able to sustain ourinvestment in new technology to avoid obsolescence of critical systems and applications. A failure to maintain current
- 36 -

Table of Contents
technology, systems and facilities or to control third-party risk, could cause disruptions in the operation of our business, which could materiallyadversely affect our transaction volumes, revenues, reputation and/or our results of operations.
Oursuccessisdependent,inpart,uponourexecutiveofficersandotherkeyemployees.Ifweareunabletorecruit,retainandmotivatekeyofficersandemployeestodriveourbusiness,ourbusinesscouldbemateriallyadverselyaffected.
Our success depends, in large part, on our ability to recruit, retain and motivate key officers and employees to manage and grow ourbusiness. Our senior management team has significant industry experience and would be difficult to replace. We believe we are in a critical period ofcompetition in the financial services and payments industry. The market for qualified individuals is highly competitive, and we may not be able toattract and retain qualified personnel or candidates to replace or succeed members of our senior management team or other key personnel or it maybe expensive to do so. We may be subject to restrictions under future legislation or regulation limiting executive compensation. For example, thefederal banking agencies have previously issued proposed rulemaking on incentive compensation practices for certain employees at bankingorganizations, including executives, and may issue additional rules relating to such activities in the future. These requirements could negativelyimpact our ability to compete with other companies in attracting, hiring and retaining key personnel and offer incentives that motivate our keypersonnel to perform and may require us to extensively restructure certain of our existing incentive compensation practices. Additionally, the marketfor individuals with skills in fields such as technology, analytics and payments is increasingly competitive and we may not be able to attract andretain persons with the desired skill set or experience. If we are unable to recruit, retain and motivate key personnel to manage and grow ourbusiness well, our business could be materially adversely affected.
Merchantdefaultsmayadverselyaffectourbusiness,financialcondition,cashflowsandresultsofoperations.
As an issuer and merchant acquirer in the United States on the Discover Network, and as a holder of certain merchant agreementsinternationally for the Diners Club network, we may be contingently liable for certain disputed credit card sales transactions that arise betweencustomers and merchants. If a dispute is resolved in the customer’s favor, we will cause a credit or refund of the amount to be issued to thecustomer and charge back the transaction to the merchant or merchant acquirer. If we are unable to collect this amount from the merchant ormerchant acquirer, we will bear the loss for the amount credited or refunded to the customer. Where the purchased product or service is notprovided until some later date following the purchase, such as an airline ticket, the likelihood of potential liability increases. For the years endedDecember 31, 2018 and 2017 losses related to merchant chargebacks were not material.
Damagetoourreputationcoulddamageourbusiness.
In recent years, financial services companies have experienced increased reputational risk as consumers protest and regulators scrutinizebusiness and compliance practices of such companies. Maintaining a positive reputation is critical to attracting and retaining customers, investorsand employees. Damage to our reputation can therefore cause significant harm to our business and prospects. Harm to our reputation can arisefrom numerous sources, including, among others, employee misconduct, a breach of our or our service providers’ cybersecurity defenses, litigationor regulatory outcomes, failing to deliver minimum standards of service and quality, compliance failures, and the activities of customers, businesspartners and counterparties. Social media also can cause harm to our reputation. By its very nature, social media can reach a wide audience in avery short amount of time, which presents unique corporate communications challenges. Negative or ‘wrong’ type of publicity generated throughunexpected social media coverage can damage Discover’s reputation and brand. Negative publicity regarding us, whether or not true, may result incustomer attrition and other harm to our business prospects.
Wemaybeunsuccessfulinpromotingandprotectingourbrandsorprotectingourotherintellectualproperty,orthirdpartiesmayallegethatweareinfringingtheirintellectualpropertyrights.
The Discover, PULSE and Diners Club brands have substantial economic and goodwill value. Our success is dependent on our ability topromote and protect these brands and our other intellectual property. Our ability to attract and retain customers is highly dependent upon theexternal perception of our company and brands. Our brands are licensed for use to business partners and network participants, some of whom havecontractual obligations to promote and develop our brands. For example, the Discover card brand is now being issued by certain Diners Clublicensees in their local markets. If our business partners do not adhere to contractual standards, engage in improper business practices, orotherwise misappropriate, use or diminish the value of our brands or our other intellectual property, we
- 37 -
Table of Contents
may suffer reputational and financial damage. If we will not be able to adequately protect our brands, our proprietary information and otherintellectual property, our business success may be adversely affected. In addition, third parties may allege that our marketing, processes or systemsmay infringe their intellectual property rights. Given the potential risks and uncertainties of such claims, our business could be adversely affected byhaving to pay significant monetary damages, technology development expenses or licensing fees, and we may have to alter our business practicesor be prevented from competing effectively.
Laws,regulations,andsupervisoryguidanceandpractices,ortheapplicationthereof,mayadverselyaffectourbusiness,financialconditionandresultsofoperations.
We must comply with an array of banking, consumer lending, and payment services laws and regulations in all of the jurisdictions in which weoperate as described more fully in “Business — Supervision and Regulation” and “Management’s Discussion and Analysis of Financial Conditionand Results of Operations — Regulatory Environment and Developments.” Regulatory developments, findings and ratings could negatively impactour business strategies or require us to: limit or change our business practices, restructure our products in ways that we may not currentlyanticipate, limit our product offerings, invest more management time and resources in compliance efforts, limit the fees we can charge for services,or limit our ability to pursue certain business opportunities and obtain related required regulatory approvals. For additional information regardingbank regulatory limitations on acquisitions and investments, see “Business — Supervision and Regulation — Acquisitions and Investments.” SeeNote 19: Litigation and Regulatory Matters to our consolidated financial statements for more information on recent matters affecting Discover andthe second risk factor in this section regarding the regulatory environment for the businesses in which we engage.
In addition, we are subject to inquiries and enforcement actions from states’ attorney general offices and regulation by the Federal TradeCommission, state banking regulators and the U.S. Department of Justice, as well as the SEC and New York Stock Exchange in our capacity as apublic company. We also are subject to the requirements of entities that set and interpret the accounting standards (such as the FASB, the SEC,banking regulators and our independent registered public accounting firm), which may add new requirements or change their interpretations on howstandards should be applied. In June 2016, the FASB issued new guidance that will require lenders to adopt the current expected credit loss(“CECL”) approach to evaluate impairment of loans and financial instruments. The CECL approach requires evaluation of credit impairment basedon an estimate of life of loan losses whereas rules currently in effect require utilization of incurred losses. We are required to put the CECL standardin place for the 2020 fiscal year. See Note 1: Background and Basis of Presentation — Recently Issued Accounting Pronouncements to ourconsolidated financial statements for more information on the new standard and its potential impact on our financial condition and results ofoperations. This and other guidance not yet issued could potentially have a material impact on business lines, as well as how we record and reportour financial condition and results of operations, and could have an impact on regulatory capital.
Failure to comply with laws, regulations and standards could lead to adverse consequences such as financial, structural, reputational andoperational penalties, including receivership, litigation exposure and fines, (as described further below). Failure to comply with anti-corruption andother laws can expose us and/or individual employees to potentially severe criminal and civil penalties. Specifically, we are subject to anti-corruptionlaws and regulations, including the U.S. Foreign Corrupt Practices Act and other laws, that prohibit the making or offering of improper payments.
Legislative, regulatory and tax code changes could impact the profitability of our business activities, alter consumer behavior in ways we didnot anticipate, require us to limit or change our business practices or our product offerings, or expose us to additional costs (including increasedcompliance costs). Significant changes in laws and regulations may have a more adverse effect on our results of operations than on the results ofour competitors or may disproportionately benefit our competitors.
Currentandproposedlawsandregulationsaddressingconsumerprivacyanddatauseandsecuritycouldaffectthecompetitivenessofourproductsandincreaseourcosts.
Legal or regulatory pronouncements relating to consumer privacy, data use and security affect our business. We are subject to a number oflaws concerning consumer privacy and data use and security such as the European Union’s General Data Privacy Regulation and the CaliforniaConsumer Privacy Act. Due to recent consumer data compromise events in the United States, which resulted in unauthorized access to millions ofcustomers’ data, these areas continue to be a focus of the executive administration, Congress, state legislators and attorneys general and otherregulators. Developments in this area, such as new laws, regulations, regulatory guidance, litigation or enforcement actions, could
- 38 -

Table of Contents
result in new or different requirements on Discover and other card issuers or networks that could increase costs or adversely affect thecompetitiveness of our credit card or debit card products. See the discussion on recent security developments in “Management’s Discussion andAnalysis of Financial Condition and Results of Operations — Regulatory Environment and Developments” for more information. In addition, failure tocomply with the privacy and data use and security laws and regulations to which we are subject, including by reason of inadvertent disclosure ofconfidential information or the failure to provide timely notification of a disclosure, could result in litigation, fines, sanctions, penalties or otheradverse consequences and loss of consumer confidence, which could materially adversely affect our results of operations, overall business andreputation.
Litigationandregulatoryactionscouldsubjectustosignificantfines,penaltiesand/orrequirementsresultinginincreasedexpenses.
Businesses in the consumer banking and payment services industries have historically been subject to significant legal actions, includingclass action lawsuits and commercial, shareholder and patent litigation. Many of these actions have included claims for substantial compensatory,statutory or punitive damages. We have historically offered customers an arbitration clause in agreements to quickly and economically resolvedisputes. The arbitration clause has, in some cases, also limited our exposure to consumer class action litigation, however, there can be noassurance that we will be able to continue to offer arbitration clauses in the future or that we will be successful in enforcing the arbitration clause.Legal challenges to the enforceability of these clauses have led most card issuers, and may cause us, to discontinue their use. There havepreviously been bills pending in Congress to directly or indirectly prohibit the use of pre-dispute arbitration clauses in some or all consumer bankingproducts. Further, from time to time, we are involved in legal actions challenging the use of our arbitration clause. In addition, we have been andmay again be involved in various actions or proceedings brought by governmental regulatory and enforcement agencies, which could harm ourreputation, require us to change our business activities and product offerings, or subject us to significant fines, penalties, customer restitution orother requirements, resulting in increased expenses. For example, complying with our agreements with the Federal Reserve and the FDIC consentorder related to our anti-money laundering program have caused us to incur significant expenses. See Note 19: Litigation and Regulatory Matters toour consolidated financial statements for more information on current matters affecting Discover.
Special Note Regarding Forward-Looking StatementsThis annual report on Form 10-K and materials we have filed or will file with the SEC (as well as information included in our other written or
oral statements) contain or will contain certain statements that are forward-looking within the meaning of the Private Securities Litigation Reform Actof 1995. These statements are not guarantees of future performance and involve certain risks, uncertainties and assumptions that are difficult topredict. Actual outcomes and results may differ materially from those expressed in, or implied by, our forward-looking statements. Words such as“expects,” “anticipates,” “believes,” “estimates” and other similar expressions or future or conditional verbs such as “will,” “should,” “would” and“could” are intended to identify such forward-looking statements. You should not rely solely on the forward-looking statements and should considerall uncertainties and risks throughout this annual report on Form 10-K, including those described under “Risk Factors.” The statements are only as ofthe date they are made, and we undertake no obligation to update any forward-looking statement.
Possible events or factors that could cause results or performance to differ materially from those expressed in our forward-looking statementsinclude the following:
• changes in economic variables, such as the availability of consumer credit, the housing market, energy costs, the number and size ofpersonal bankruptcy filings, the rate of unemployment, the levels of consumer confidence and consumer debt, and investor sentiment;
• the impact of current, pending and future legislation, regulation, supervisory guidance, and regulatory and legal actions, including, but notlimited to, those related to tax reform, financial regulatory reform, consumer financial services practices, anti-corruption and funding,capital and liquidity;
• the actions and initiatives of current and potential competitors;
• our ability to manage our expenses;
• our ability to successfully achieve card acceptance across our networks and maintain relationships with network participants andmerchants;
• our ability to sustain and grow our card, private student loan and personal loan products;
- 39 -

Table of Contents
• our ability to increase or sustain Discover card usage or attract new customers;
• difficulty obtaining regulatory approval for, financing, closing, transitioning, integrating or managing the expenses of acquisitions of orinvestments in new businesses, products or technologies;
• our ability to manage our credit risk, market risk, liquidity risk, operational risk, compliance and legal risk, and strategic risk;
• the availability and cost of funding and capital;
• access to deposit, securitization, equity, debt and credit markets;
• the impact of rating agency actions;
• the level and volatility of equity prices, commodity prices and interest rates, currency values, investments, other market fluctuations andother market indices;
• losses in our investment portfolio;
• limits on our ability to pay dividends and repurchase our common stock;
• limits on our ability to receive payments from our subsidiaries;
• fraudulent activities or material security breaches of our or others’ key systems;
• our ability to remain organizationally effective;
• the effect of political, economic and market conditions, geopolitical events and unforeseen or catastrophic events;
• our ability to introduce new products or services;
• our ability to manage our relationships with third-party vendors;
• our ability to maintain current technology and integrate new and acquired systems and technology;
• our ability to collect amounts for disputed transactions from merchants and merchant acquirers;
• our ability to attract and retain employees;
• our ability to protect our reputation and our intellectual property; and
• new lawsuits, investigations or similar matters or unanticipated developments related to current matters.
We routinely evaluate and may pursue acquisitions of or investments in businesses, products, technologies, loan portfolios or deposits, whichmay involve payment in cash or our debt or equity securities.
The foregoing review of important factors should not be construed as exclusive and should be read in conjunction with the other cautionarystatements that are included in this annual report on Form 10-K. These factors expressly qualify all subsequent oral and written forward-lookingstatements attributable to us or persons acting on our behalf. Except for any ongoing obligations to disclose material information as required underU.S. federal securities laws, we do not have any intention or obligation to update forward-looking statements after we distribute this annual report onForm 10-K, whether as a result of new information, future developments or otherwise.
- 40 -

Table of Contents
Item 1B. Unresolved Staff CommentsNone.
Item 2. PropertiesWe have eight principal properties located in seven states in the United States. We own four principal properties, which include our corporate
headquarters, two call centers and a processing center, and we lease four principal properties, which include two call centers, our PULSEheadquarters and an office supporting our student loan business. The call centers, processing center and student loan office largely support ourDirect Banking segment; the PULSE headquarters is used by our Payment Services segment; and our corporate headquarters is used by both ourDirect Banking and Payment Services segments. Each of our call centers and our processing center are operating at and being utilized to areasonable capacity. We believe our principal facilities are both suitable and adequate to meet our current and projected needs. We also haveeleven leased offices located outside the United States, which include eight offices that support our Payment Services segment, two offices thatsupport our Direct Banking segment and one office that supports business activities in both segments.
Item 3. Legal ProceedingsFor a description of legal proceedings, see Note 19: Litigation and Regulatory Matters to our consolidated financial statements.
Item 4. Mine Safety DisclosuresNone.
- 41 -
Table of Contents
Part II.
Part II | Item 5. Market for Registrant’s Common Equity, Related Stockholder Matters and Issuer Purchases ofEquity Securities
Our common stock is traded on the New York Stock Exchange (ticker symbol DFS). The approximate number of record holders of ourcommon stock as of February 15, 2019 was 46,343 .
Issuer Purchases of Equity Securities
The following table sets forth information regarding purchases of our common stock related to our share repurchase program and employeetransactions that were made by us or on our behalf during the most recent quarter:
PeriodTotal Number of
Shares Purchased Average Price PaidPer Share
Total Number of SharesPurchased as Part of
Publicly Announced Planor Program (1)
Maximum Dollar Value ofShares that may yet bepurchased under thePlans or Programs (1)
October 1-31, 2018
Repurchase program (1) 2,272,952 $ 75.07 2,272,952 $ 2,429,638,265
Employee transactions (2) 752 $ 76.53 N/A N/ANovember 1-30, 2018
Repurchase program (1) 2,152,488 $ 69.89 2,152,488 $ 2,279,209,552
Employee transactions (2) 2,443 $ 69.93 N/A N/ADecember 1-31, 2018
Repurchase program (1) 2,192,483 $ 63.37 2,192,483 $ 2,140,279,796
Employee transactions (2) 90,738 $ 59.08 N/A N/A
Total
Repurchase program (1) 6,617,923 $ 69.51 6,617,923 $ 2,140,279,796
Employee transactions (2) 93,933 $ 59.50 N/A N/A (1) On July 19, 2018 , our Board of Directors approved a share repurchase program authorizing the purchase of up to $3.0 billion of our outstanding shares of common stock. This share repurchase program
expires on January 31, 2020 and may be terminated at any time.(2) Reflects shares withheld (under the terms of grants under employee stock compensation plans) to offset tax withholding obligations that occur upon the delivery of outstanding shares underlying restricted
stock units or upon the exercise of stock options.
- 42 -
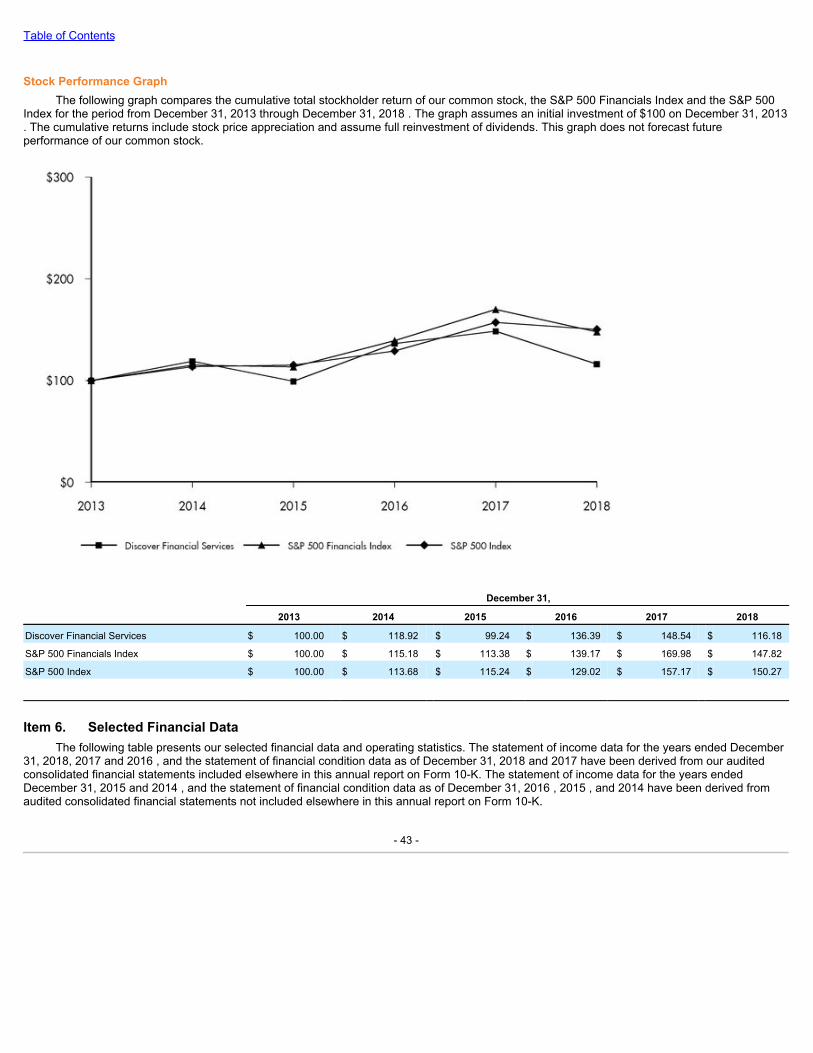
Table of Contents
Stock Performance GraphThe following graph compares the cumulative total stockholder return of our common stock, the S&P 500 Financials Index and the S&P 500
Index for the period from December 31, 2013 through December 31, 2018 . The graph assumes an initial investment of $100 on December 31, 2013. The cumulative returns include stock price appreciation and assume full reinvestment of dividends. This graph does not forecast futureperformance of our common stock.
December 31, 2013 2014 2015 2016 2017 2018
Discover Financial Services $ 100.00 $ 118.92 $ 99.24 $ 136.39 $ 148.54 $ 116.18
S&P 500 Financials Index $ 100.00 $ 115.18 $ 113.38 $ 139.17 $ 169.98 $ 147.82
S&P 500 Index $ 100.00 $ 113.68 $ 115.24 $ 129.02 $ 157.17 $ 150.27
Item 6. Selected Financial DataThe following table presents our selected financial data and operating statistics. The statement of income data for the years ended December
31, 2018, 2017 and 2016 , and the statement of financial condition data as of December 31, 2018 and 2017 have been derived from our auditedconsolidated financial statements included elsewhere in this annual report on Form 10-K. The statement of income data for the years endedDecember 31, 2015 and 2014 , and the statement of financial condition data as of December 31, 2016 , 2015 , and 2014 have been derived fromaudited consolidated financial statements not included elsewhere in this annual report on Form 10-K.
- 43 -
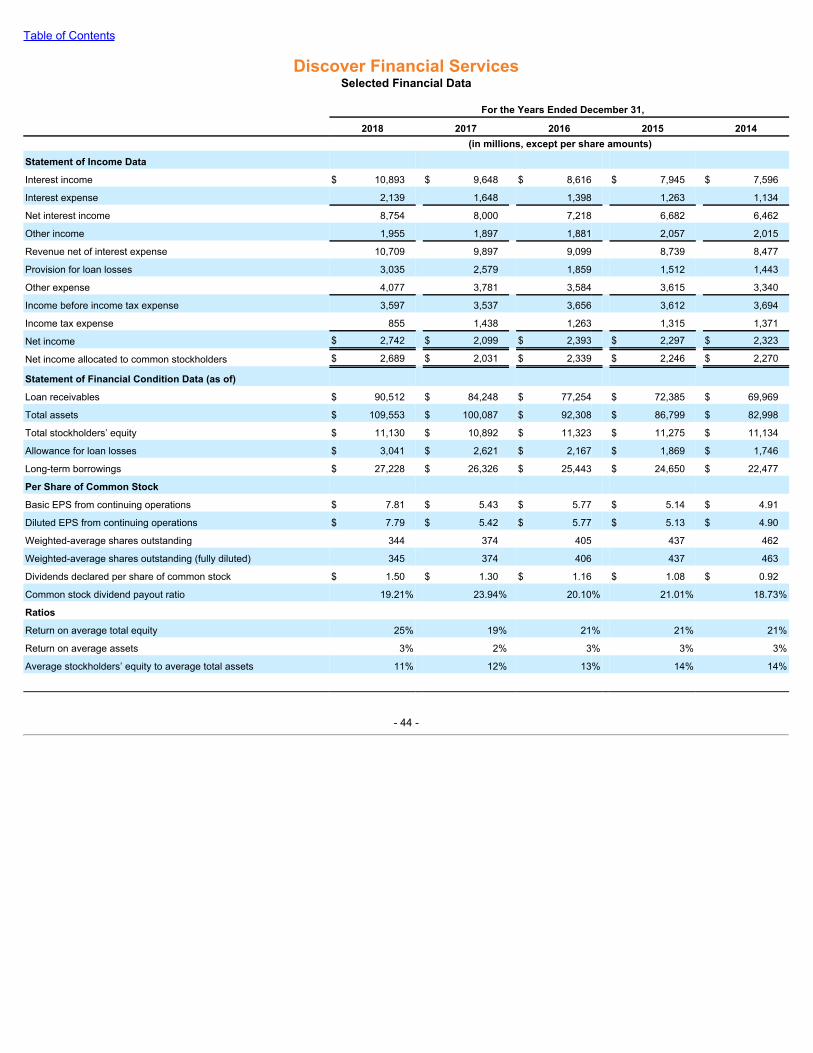
Table of Contents
Discover Financial ServicesSelected Financial Data
For the Years Ended December 31, 2018 2017 2016 2015 2014 (in millions, except per share amounts)
Statement of Income Data
Interest income $ 10,893 $ 9,648 $ 8,616 $ 7,945 $ 7,596
Interest expense 2,139 1,648 1,398 1,263 1,134
Net interest income 8,754 8,000 7,218 6,682 6,462
Other income 1,955 1,897 1,881 2,057 2,015
Revenue net of interest expense 10,709 9,897 9,099 8,739 8,477
Provision for loan losses 3,035 2,579 1,859 1,512 1,443
Other expense 4,077 3,781 3,584 3,615 3,340
Income before income tax expense 3,597 3,537 3,656 3,612 3,694
Income tax expense 855 1,438 1,263 1,315 1,371
Net income $ 2,742 $ 2,099 $ 2,393 $ 2,297 $ 2,323
Net income allocated to common stockholders $ 2,689 $ 2,031 $ 2,339 $ 2,246 $ 2,270
Statement of Financial Condition Data (as of)
Loan receivables $ 90,512 $ 84,248 $ 77,254 $ 72,385 $ 69,969
Total assets $ 109,553 $ 100,087 $ 92,308 $ 86,799 $ 82,998
Total stockholders’ equity $ 11,130 $ 10,892 $ 11,323 $ 11,275 $ 11,134
Allowance for loan losses $ 3,041 $ 2,621 $ 2,167 $ 1,869 $ 1,746
Long-term borrowings $ 27,228 $ 26,326 $ 25,443 $ 24,650 $ 22,477
Per Share of Common Stock
Basic EPS from continuing operations $ 7.81 $ 5.43 $ 5.77 $ 5.14 $ 4.91
Diluted EPS from continuing operations $ 7.79 $ 5.42 $ 5.77 $ 5.13 $ 4.90
Weighted-average shares outstanding 344 374 405 437 462
Weighted-average shares outstanding (fully diluted) 345 374 406 437 463
Dividends declared per share of common stock $ 1.50 $ 1.30 $ 1.16 $ 1.08 $ 0.92
Common stock dividend payout ratio 19.21% 23.94% 20.10% 21.01% 18.73%
Ratios
Return on average total equity 25% 19% 21% 21% 21%
Return on average assets 3% 2% 3% 3% 3%
Average stockholders’ equity to average total assets 11% 12% 13% 14% 14%
- 44 -
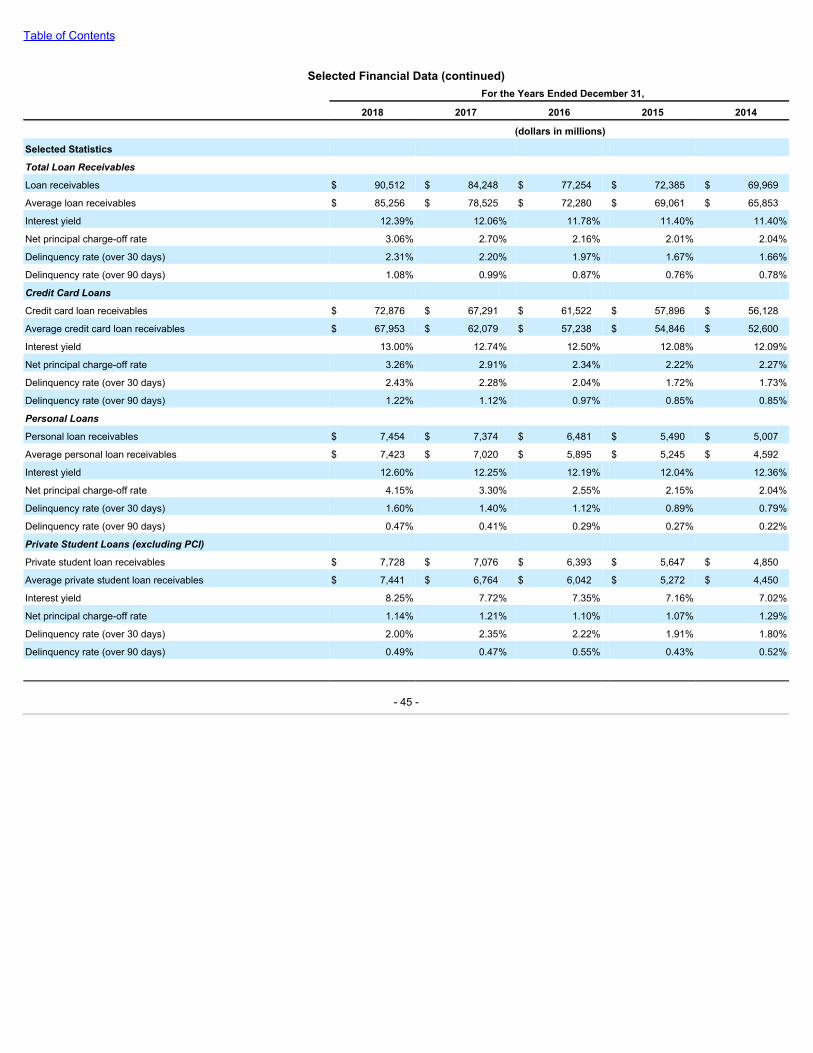
Table of Contents
Selected Financial Data (continued) For the Years Ended December 31,
2018 2017 2016 2015 2014 (dollars in millions)
Selected Statistics
TotalLoanReceivables
Loan receivables $ 90,512 $ 84,248 $ 77,254 $ 72,385 $ 69,969
Average loan receivables $ 85,256 $ 78,525 $ 72,280 $ 69,061 $ 65,853
Interest yield 12.39% 12.06% 11.78% 11.40% 11.40%
Net principal charge-off rate 3.06% 2.70% 2.16% 2.01% 2.04%
Delinquency rate (over 30 days) 2.31% 2.20% 1.97% 1.67% 1.66%
Delinquency rate (over 90 days) 1.08% 0.99% 0.87% 0.76% 0.78%
CreditCardLoans
Credit card loan receivables $ 72,876 $ 67,291 $ 61,522 $ 57,896 $ 56,128
Average credit card loan receivables $ 67,953 $ 62,079 $ 57,238 $ 54,846 $ 52,600
Interest yield 13.00% 12.74% 12.50% 12.08% 12.09%
Net principal charge-off rate 3.26% 2.91% 2.34% 2.22% 2.27%
Delinquency rate (over 30 days) 2.43% 2.28% 2.04% 1.72% 1.73%
Delinquency rate (over 90 days) 1.22% 1.12% 0.97% 0.85% 0.85%
PersonalLoans
Personal loan receivables $ 7,454 $ 7,374 $ 6,481 $ 5,490 $ 5,007
Average personal loan receivables $ 7,423 $ 7,020 $ 5,895 $ 5,245 $ 4,592
Interest yield 12.60% 12.25% 12.19% 12.04% 12.36%
Net principal charge-off rate 4.15% 3.30% 2.55% 2.15% 2.04%
Delinquency rate (over 30 days) 1.60% 1.40% 1.12% 0.89% 0.79%
Delinquency rate (over 90 days) 0.47% 0.41% 0.29% 0.27% 0.22%
PrivateStudentLoans(excludingPCI)
Private student loan receivables $ 7,728 $ 7,076 $ 6,393 $ 5,647 $ 4,850
Average private student loan receivables $ 7,441 $ 6,764 $ 6,042 $ 5,272 $ 4,450
Interest yield 8.25% 7.72% 7.35% 7.16% 7.02%
Net principal charge-off rate 1.14% 1.21% 1.10% 1.07% 1.29%
Delinquency rate (over 30 days) 2.00% 2.35% 2.22% 1.91% 1.80%
Delinquency rate (over 90 days) 0.49% 0.47% 0.55% 0.43% 0.52%
- 45 -

Table of Contents
Item 7. Management’s Discussion and Analysis of Financial Condition and Results of OperationsThefollowingdiscussionandanalysisofourfinancialconditionandresultsofoperationsshouldbereadinconjunctionwithouraudited
consolidatedfinancialstatementsandrelatednotesincludedelsewhereinthisannualreportonForm10-K.Someoftheinformationcontainedinthisdiscussionandanalysisconstitutesforward-lookingstatementsthatinvolverisksanduncertainties.Actualresultscoulddiffermateriallyfromthosediscussedintheseforward-lookingstatements.Factorsthatcouldcauseorcontributetothesedifferencesinclude,butarenotlimitedto,thosediscussedbelowandelsewhereinthisannualreportonForm10-Kparticularlyunder“RiskFactors”and“SpecialNoteRegardingForward-LookingStatements,”whichimmediatelyfollows“RiskFactors.”Unlessotherwisespecified,referencestoNotestoourconsolidatedfinancialstatementsaretotheNotestoourauditedconsolidatedfinancialstatementsasofDecember31,2018and2017andforyearsendedDecember31,2018,2017and2016.
Introduction and OverviewDiscover Financial Services (“DFS”) is a direct banking and payment services company. We provide direct banking products and services and
payment services through our subsidiaries. We offer our customers credit card loans, private student loans, personal loans, home equity loans anddeposit products. We also operate the Discover Network, the PULSE network (“PULSE”) and Diners Club International (“Diners Club”). TheDiscover Network processes transactions for Discover-branded credit and debit cards and provides payment transaction processing and settlementservices. PULSE operates an electronic funds transfer network, providing financial institutions issuing debit cards on the PULSE network withaccess to ATMs domestically and internationally, as well as point-of-sale (“POS”) terminals at retail locations throughout the U.S. for debit cardtransactions. Diners Club is a global payments network of licensees, which are generally financial institutions, that issue Diners Club branded chargecards and/or provide card acceptance services.
Our primary revenues consist of interest income earned on loan receivables and fees earned from customers, financial institutions, merchantsand issuers. The primary expenses required to operate our business include funding costs (interest expense), loan loss provisions, customerrewards and expenses incurred to grow, manage and service our loan receivables and networks. Our business activities are funded primarilythrough consumer deposits, securitization of loan receivables and the issuance of unsecured debt.
2018 Highlights
• Net income was $2.7 billion , or $7.79 per diluted share, compared to $2.1 billion , or $5.42 per diluted share, in the prior year.
• Total loans grew $6.3 billion , or 7% , from the prior year to $90.5 billion .
• Credit card loans grew $5.6 billion , or 8% , from the prior year to $72.9 billion .
• The total net charge-off rate increased 36 basis points from the prior year to 3.06% .
• The net charge-off rate for credit card loans increased 35 basis points from the prior year to 3.26% and the delinquency rate for credit cardloans over 30 days past due increased 15 basis points to 2.43% .
• Direct-to-consumer deposits grew $5.3 billion , or 13% , from the prior year to $44.7 billion .
• Payment Services transaction volume for the segment was $232.6 billion , up 15% from the prior year.
Prior Year Highlights
• Net income was $2.1 billion and $2.4 billion, or $5.42 and $5.77 per diluted share in 2017 and 2016, respectively.
• Total loans grew $7.0 billion in 2017, or 9%, from 2016 to $84.2 billion.
• Credit card loans grew $5.8 billion in 2017, or 9%, from 2016 to $67.3 billion.
• The total net charge-off rate increased 54 basis points in 2017 from 2016 to 2.70%.
• The net charge-off rate for credit card loans increased 57 basis points in 2017 from 2016 to 2.91% and the delinquency rate for credit cardloans over 30 days past due increased 24 basis points to 2.28%.
• Direct-to-consumer deposits grew $3.4 billion in 2017, or 9%, from 2016 to $39.4 billion.
• Payment Services transaction volume for the segment was $202.9 billion in 2017, up 12% from 2016.
- 46 -
Table of Contents
• During 2017, the effective tax rate increased 6.2 percentage points, primarily driven by a one-time adjustment of $179 million as a resultof the Tax Cuts and Jobs Act of 2017 (“TCJA”).
OutlookWe continue to focus on disciplined capital deployment through profitable organic loan growth and execution of our capital plan. Our
marketing strategy remains focused on expanding wallet share with existing customers and adding new accounts to achieve continued loan growthin 2019.
Total expenses are expected to increase in 2019 as we continue to invest in business growth and technology, including the deployment ofadvanced analytics and automation. We expect the rewards rate to modestly increase in 2019 largely resulting from the ongoing shift in product mixto the Discover it platform.
The total net charge-off rate in 2019 is expected to increase in comparison to the prior year and we expect to add to the loan loss reserve dueto the seasoning of continued loan growth and supply-driven credit normalization. We expect net interest margin in 2019 to remain relatively flat.
In our payments segment, we will continue to pursue new ways to drive volume growth in a competitive environment. We continue to leverageour network to support our card-issuing business.
Regulatory Environment and DevelopmentsFederal banking regulators continue to propose and implement new regulations and supervisory guidance, including under the Dodd-Frank
Wall Street Reform and Consumer Protection Act (the "Dodd-Frank Act"), and modify their examination and enforcement priorities. The Dodd-FrankAct created a framework for regulation of large systemically significant financial firms, including Discover, through a variety of measures, includingincreased capital and liquidity requirements and limits on leverage and enhanced supervisory authority. The impact of the evolving regulatoryenvironment on our business and operations depends upon a number of factors, including supervisory priorities and actions, our actions, those ofour competitors and other marketplace participants, and the behavior of consumers.
On May 24, 2018, the President signed into law a package of legislative reforms titled the Economic Growth, Regulatory Relief, andConsumer Protection Act (“EGRRCPA”), which are intended to promote economic growth, provide tailored regulatory relief for smaller and lesscomplex financial institutions, and enhance consumer protections. Among other provisions, the new law raises the asset threshold for automaticallydesignating a bank holding company as “systemically important” from $50 billion to $250 billion. The new law became effective immediately for bankholding companies with assets less than $100 billion and will become effective 18 months from its enactment for banks with assets of $100 billion ormore. Upon effectiveness of the new law, bank holding companies with assets less than $250 billion will no longer automatically be subject toregulatory requirements that establish enhanced prudential standards pursuant to the Dodd-Frank Act. However, the extent of relief afforded toDiscover under the law will depend on how it is implemented. On October 31, 2018, the Federal Reserve and other federal banking regulatorsissued proposals to tailor the existing regulatory requirements related to capital, liquidity and enhanced prudential standards to an institution’s riskand complexity profile for banking institutions with total assets of $100 billion or more. The timing and substance of any final rules are currentlyunknown. On February 5, 2019, the Federal Reserve announced that certain less complex firms subject to Comprehensive Capital Analysis andReview (“CCAR”), generally those with total consolidated assets between $100 billion and $250 billion, have been provided relief from certaincomponents of the Federal Reserve’s capital planning and stress testing framework for the 2019 stress test cycle. The Federal Reserve issued atemporary order granting Discover relief from the regulatory requirements related to supervisory stress testing and company-run stress testing forthe 2019 stress test cycle and provided Discover a one-year extension of the requirement to submit a capital plan to the Federal Reserve until April5, 2020. Additionally, Discover is not required to participate in the 2019 CCAR process. For more information, see “Business — Supervision andRegulation — Bank Holding Company Regulation.”
Another provision contained in the EGRRCPA authorizes the Social Security Administration to modernize the process in which it verifiesinformation to help financial institutions detect and prevent the unauthorized use of Social Security numbers to open fraudulent accounts. Whileimprovements to processes and procedures are underway, the timing and impact is uncertain.
Policymakers at the federal and state levels are increasingly focused on measures to enhance data security and data breach incidentresponse requirements as a result of growing cybersecurity threats and the number of incidents
- 47 -
Table of Contents
involving unauthorized access to consumer information. Furthermore, regulations and legislation at various levels of government have beenproposed to create data privacy standards. For example, the California Consumer Privacy Act (“CCPA”) creates a broad set of privacy rights andremedies modeled in part on the European Union's General Data Protection Regulation. The CCPA goes into effect on January 1, 2020. While it istoo early to know their full impact, these developments could ultimately result in the imposition of requirements on Discover and other providers ofconsumer financial services or networks that could increase costs or otherwise adversely affect our businesses.
The impact of the evolving regulatory environment on our business and operations depends upon a number of factors, including supervisorypriorities and actions, our actions, actions of our competitors and other marketplace participants, and the behavior of consumers. For moreinformation on how the regulatory environment, enforcement actions, findings and ratings could also have an impact on our strategies, the value ofour assets, or otherwise adversely affect our business see “Risk Factors — Current Economic and Regulatory Environment”. For more informationon recent matters affecting us, see Note 19: Litigation and Regulatory Matters to our consolidated financial statements.
ConsumerFinancialServicesThe Consumer Financial Protection Bureau (the “CFPB”) regulates consumer financial products and services, as well as certain financial
services providers, including Discover. The CFPB has rulemaking and interpretive authority under the Dodd-Frank Act and other federal consumerfinancial services laws, as well as broad supervisory, examination and enforcement authority over designated financial services providers, includingDiscover. The CFPB’s regulatory authority includes the exercise of rulemaking, supervision and enforcement powers with respect to “unfair,deceptive or abusive acts or practices” and consumer access to fair, transparent and competitive financial products and services. Historically, theCFPB’s policy priorities focused on several financial products of the type we offer (e.g. credit cards and student loans).
On December 6, 2018, a new director of the CFPB was confirmed. The new director has indicated that her initial priorities include ensuringthat the CFPB is fair and transparent in taking actions to empower consumers and provides certainty for market participants, including through theuse of cost-benefit analysis and rulemaking processes. Previously, the CFPB issued formal requests for information on various topics, which areexpected to continue. Despite the changes in the CFPB’s leadership, the CFPB is required by statute to undertake certain actions such as its bi-annual review of the consumer credit card market.
There continues to be legislative and regulatory focus on the private student loan market, including by some state legislatures and stateattorneys general. Recent areas of focus have included servicing, payments and collection practices, which have resulted in an increase insupervisory examinations of Discover related to private student loans. Legislative focus on student loans has resulted in the enactment of studentloan servicing laws in several states, and consideration of new licensing, servicing, reporting and regulatory oversight requirements for student loanservicers. Such legislation, regulation or guidance may increase the complexity and expense of servicing student loans and impact the entirestudent loan market, which could cause us to change our private student loan products or servicing practices in ways that we may not currentlyanticipate.
PaymentNetworksThe Dodd-Frank Act contains several provisions impacting the debit card market, including network participation requirements and
interchange fee limitations. The changing debit card environment, including competitor actions related to merchant and acquirer pricing andtransaction routing strategies, has adversely affected, and is expected to continue to adversely affect, our PULSE network's business practices,network transaction volume, revenue and prospects for future growth. We continue to closely monitor competitor pricing and technologydevelopment strategies in order to assess their impact on our business and on competition in the marketplace. Following an inquiry by the U.S.Department of Justice into some of these competitor pricing strategies, PULSE filed a lawsuit against Visa in late 2014 with respect to thesecompetitive concerns. The Court granted summary judgment in favor of Visa on August 31, 2018. PULSE filed an appeal on January 17, 2019. Visaalso faces ongoing merchant litigation as it relates to the underlying anticompetitive behavior that is the subject of PULSE’s case against Visa. Inaddition, the Dodd-Frank Act's network participation requirements impact PULSE's ability to enter into exclusivity arrangements, which affectsPULSE's current business practices and may materially adversely affect its network transaction volume and revenue.
- 48 -
Table of Contents
Banking
CapitalDiscover Financial Services and Discover Bank are subject to regulatory capital requirements that became effective January 1, 2015 under
final rules issued by the Federal Reserve and the Federal Deposit Insurance Corporation (“FDIC”) to implement the provisions under the BaselCommittee’s December 2010 framework (referred to as “Basel III”). The final capital rules ("Basel III rules") require minimum risk-based capital andleverage ratios and define what constitutes capital for purposes of calculating those ratios. In addition, the Basel III rules establish a capitalconservation buffer (“CCB”) above the regulatory minimum capital requirements, which must consist entirely of Common Equity Tier 1 ("CET1")capital and result in higher required minimum ratios by at least 2.5%. The new CCB requirement became effective January 2016; however, thebuffer threshold amounts have been subject to a gradual phase-in period. The full 2.5% buffer requirement is fully phased-in as of January 2019. Abanking organization is subject to limitations on paying dividends, engaging in share repurchases and paying discretionary bonuses if its capital levelfalls below any of the minimum capital requirements, taking into account the applicable CCB thresholds. Based on our current capital compositionand levels and business plans, we are and expect to continue to be in compliance with the requirements for the foreseeable future. For additionalinformation, see "— Liquidity and Capital Resources — Capital."
On April 10, 2018, the Federal Reserve issued a notice of proposed rulemaking that would significantly revise the regulatory capital and stresstesting frameworks for mid-sized bank holding companies such as Discover Financial Services by, among other things, imposing new “stress buffer”requirements and revising certain assumptions used in supervisory stress tests. The proposal is intended to make regulatory capital requirementsmore forward-looking, risk-sensitive and firm-specific by linking them to the annual CCAR stress testing and capital plan review process. The timingand substance of any final rulemaking is uncertain at this time.
On December 21, 2018, federal banking agencies adopted a joint final rule that will, among other things, give bank holding companies andbanks, including Discover and its bank subsidiaries, the option to phase in the regulatory capital impacts of implementing the current expected creditloss ("CECL") approach over a three-year transition period. Recognition would be on a straight-line basis (i.e., 25% in year one, 50% in year two,75% in year three and 100% thereafter). The final rule will become effective on April 1, 2019, although public companies such as Discover are notrequired to implement CECL until 2020. Separately on December 21, 2018, the Federal Reserve announced that it will not incorporate CECL into itssupervisory stress tests until at least 2022 to reduce uncertainty, allow for better capital planning at affected firms and allow the Federal Reserve togather additional information on the impact of CECL. The Federal Reserve will still require banking institutions subject to Dodd-Frank Act company-run stress test requirements to incorporate CECL into their internal stress testing processes beginning in 2020. For more information on CECL andhow it may affect Discover, see Note 1: Background and Basis of Presentation to our consolidated financial statements.
LiquidityWe are currently subject to the U.S. liquidity coverage ratio rule issued by federal banking regulators. This quantitative requirement is
designed to promote the short-term resilience of the liquidity risk profile of large and internationally active banking organizations in the United States.The rule requires covered banks to maintain an amount of high-quality liquid assets sufficient to cover projected net cash outflows during aprospective 30-day calendar period under an acute, hypothetical liquidity stress scenario. Given our current asset size, we are subject to a modifiedliquidity coverage ratio requirement, which requires a lower level of high-quality liquid assets to meet the minimum ratio requirement due toadjustments to the net cash outflow amount. T he Federal Reserve issued a proposal on October 31, 2018 that would exempt bank holdingcompanies with less than $250 billion in assets and less than $75 billion in certain other exposures from the liquidity coverage ratio rule. The timingand substance of any final rulemaking is unknown.
- 49 -
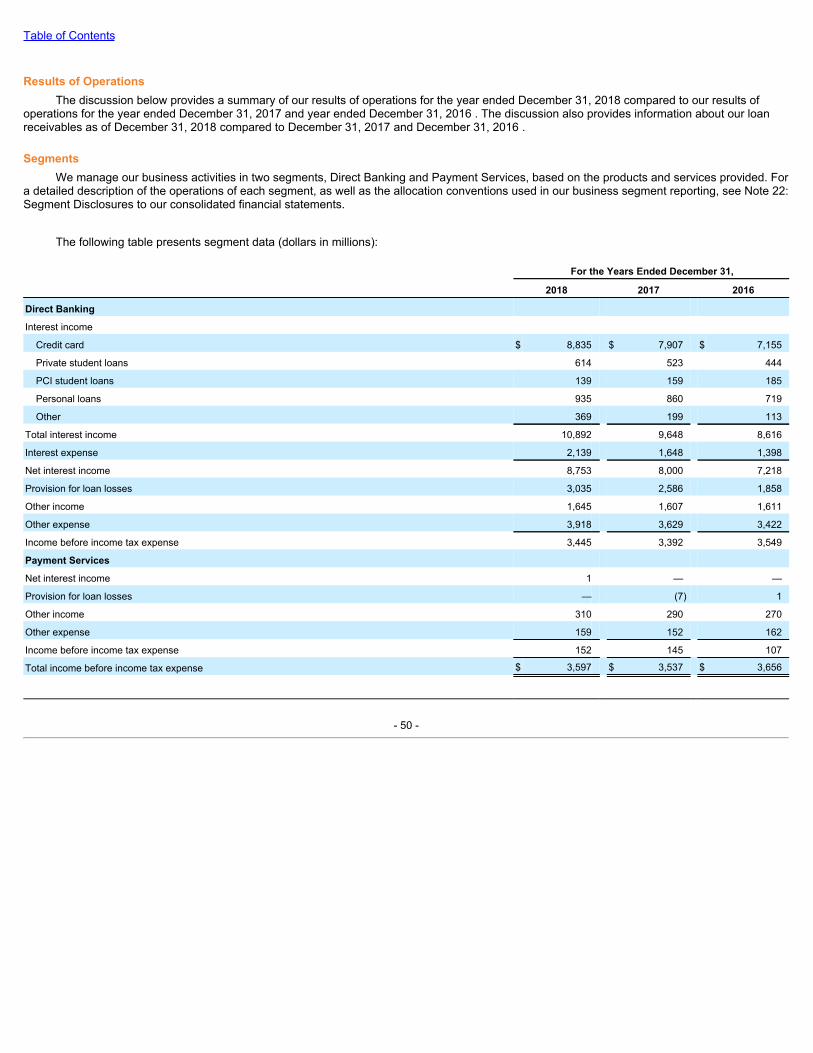
Table of Contents
Results of OperationsThe discussion below provides a summary of our results of operations for the year ended December 31, 2018 compared to our results of
operations for the year ended December 31, 2017 and year ended December 31, 2016 . The discussion also provides information about our loanreceivables as of December 31, 2018 compared to December 31, 2017 and December 31, 2016 .
SegmentsWe manage our business activities in two segments, Direct Banking and Payment Services, based on the products and services provided. For
a detailed description of the operations of each segment, as well as the allocation conventions used in our business segment reporting, see Note 22:Segment Disclosures to our consolidated financial statements.
The following table presents segment data (dollars in millions):
For the Years Ended December 31, 2018 2017 2016
Direct Banking
Interest income
Credit card $ 8,835 $ 7,907 $ 7,155
Private student loans 614 523 444
PCI student loans 139 159 185
Personal loans 935 860 719
Other 369 199 113
Total interest income 10,892 9,648 8,616
Interest expense 2,139 1,648 1,398
Net interest income 8,753 8,000 7,218
Provision for loan losses 3,035 2,586 1,858
Other income 1,645 1,607 1,611
Other expense 3,918 3,629 3,422
Income before income tax expense 3,445 3,392 3,549
Payment Services
Net interest income 1 — —
Provision for loan losses — (7) 1
Other income 310 290 270
Other expense 159 152 162
Income before income tax expense 152 145 107
Total income before income tax expense $ 3,597 $ 3,537 $ 3,656
- 50 -
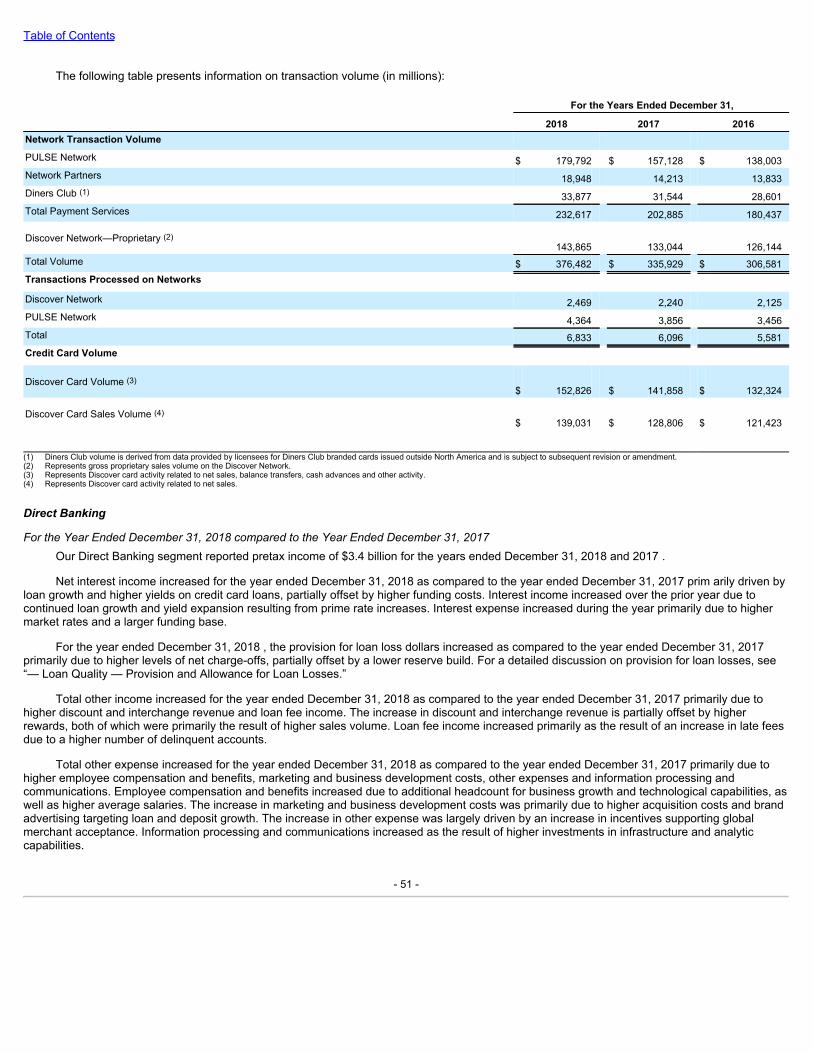
Table of Contents
The following table presents information on transaction volume (in millions):
For the Years Ended December 31,
2018 2017 2016Network Transaction Volume PULSE Network $ 179,792 $ 157,128 $ 138,003Network Partners 18,948 14,213 13,833Diners Club (1) 33,877 31,544 28,601Total Payment Services 232,617 202,885 180,437
Discover Network—Proprietary (2)143,865 133,044 126,144
Total Volume $ 376,482 $ 335,929 $ 306,581Transactions Processed on Networks Discover Network 2,469 2,240 2,125PULSE Network 4,364 3,856 3,456Total 6,833 6,096 5,581Credit Card Volume
Discover Card Volume (3)$ 152,826 $ 141,858 $ 132,324
Discover Card Sales Volume (4)$ 139,031 $ 128,806 $ 121,423
(1) Diners Club volume is derived from data provided by licensees for Diners Club branded cards issued outside North America and is subject to subsequent revision or amendment.(2) Represents gross proprietary sales volume on the Discover Network.(3) Represents Discover card activity related to net sales, balance transfers, cash advances and other activity.(4) Represents Discover card activity related to net sales.
DirectBanking
FortheYearEndedDecember31,2018comparedtotheYearEndedDecember31,2017Our Direct Banking segment reported pretax income of $3.4 billion for the years ended December 31, 2018 and 2017 .
Net interest income increased for the year ended December 31, 2018 as compared to the year ended December 31, 2017 prim arily driven byloan growth and higher yields on credit card loans, partially offset by higher funding costs. Interest income increased over the prior year due tocontinued loan growth and yield expansion resulting from prime rate increases. Interest expense increased during the year primarily due to highermarket rates and a larger funding base.
For the year ended December 31, 2018 , the provision for loan loss dollars increased as compared to the year ended December 31, 2017primarily due to higher levels of net charge-offs, partially offset by a lower reserve build. For a detailed discussion on provision for loan losses, see“— Loan Quality — Provision and Allowance for Loan Losses.”
Total other income increased for the year ended December 31, 2018 as compared to the year ended December 31, 2017 primarily due tohigher discount and interchange revenue and loan fee income. The increase in discount and interchange revenue is partially offset by higherrewards, both of which were primarily the result of higher sales volume. Loan fee income increased primarily as the result of an increase in late feesdue to a higher number of delinquent accounts.
Total other expense increased for the year ended December 31, 2018 as compared to the year ended December 31, 2017 primarily due tohigher employee compensation and benefits, marketing and business development costs, other expenses and information processing andcommunications. Employee compensation and benefits increased due to additional headcount for business growth and technological capabilities, aswell as higher average salaries. The increase in marketing and business development costs was primarily due to higher acquisition costs and brandadvertising targeting loan and deposit growth. The increase in other expense was largely driven by an increase in incentives supporting globalmerchant acceptance. Information processing and communications increased as the result of higher investments in infrastructure and analyticcapabilities.
- 51 -
Table of Contents
Discover card sales volume was $139.0 billion for the year ended December 31, 2018 , which was an increase of 7.9% as compared to theyear ended December 31, 2017 . This volume growth was driven primarily by growth in active cardmembers.
FortheYearEndedDecember31,2017comparedtotheYearEndedDecember31,2016Our Direct Banking segment reported pretax income of $3.4 billion for the year ended December 31, 2017 as compared to $3.5 billion for the
year ended December 31, 2016 .
Net interest income increased for the year ended December 31, 2017 as compared to the year ended December 31, 2016 primarily driven byloan growth and higher yields on credit card loans, partially offset by higher funding costs. The increase in credit card yields was primarily due toprime rate increases and a higher portion of revolving card receivables, partially offset by the portfolio mix and higher interest charge-offs. Interestincome increased during the year ended December 31, 2017 as compared to the year ended December 31, 2016 due to loan growth and higheryields. Interest expense increased during the year ended December 31, 2017 as compared to the year ended December 31, 2016 primarily due toincreased borrowings to fund asset growth, higher market rates and a change in funding mix.
For the year ended December 31, 2017 , the provision for loan loss dollars increased as compared to the year ended December 31, 2016 dueto higher levels of net charge-offs combined with a larger build of the allowance for loan losses as compared to 2016 . For a detailed discussion onprovision for loan losses, see “— Loan Quality — Provision and Allowance for Loan Losses.”
Total other income remained relatively flat for the year ended December 31, 2017 as compared to the year ended December 31, 2016 .Discount and interchange revenue remained flat for the year ended December 31, 2017 in comparison to the year ended December 31, 2016 withoffsetting increases in gross discount and interchange revenue and rewards, both of which were primarily the result of higher sales volume. Loan feeincome increased for the year ended December 31, 2017 as compared to the previous year primarily due to an increase in late fees.
Total other expense increased for the year ended December 31, 2017 as compared to the year ended December 31, 2016 primarily due to anincrease in employee compensation and benefits, professional fees, marketing and business development costs, offset by a decrease in informationprocessing and communications. The increase in employee compensation and benefits was driven by the impact of additional headcount forregulatory and compliance needs and business growth, higher average salaries and a one-time special bonus for eligible employees in response tothe TCJA in 2017. The increase in professional fees was driven primarily by investments in technology and infrastructure, offset by the completion ofa look back project related to anti-money laundering remediation in 2016. The increase in marketing and business development was primarily theresult of higher brand advertising and loan acquisition costs that contributed to loan growth. The decrease in information processing andcommunications was primarily the result of infrastructure efficiencies.
Discover card sales volume was $128.8 billion for the year ended December 31, 2017 , which was an increase of 6.1% as compared to theyear ended December 31, 2016 . This volume growth was driven primarily by an increase in active cardmembers.
PaymentServices
FortheYearEndedDecember31,2018comparedtotheYearEndedDecember31,2017Our Payment Services segment reported pretax income of $152 million for the year ended December 31, 2018 as compared to pretax income
of $145 million for the year ended December 31, 2017 . The increase in segment pretax income was primarily due to higher other income driven byhigher transaction volume across multiple channels.
Downturns in the global economy or negative impacts in foreign currency may adversely affect our financial condition or results of operationsin our Payment Services segment. We continue to work with our Diners Club licensees with regard to their ability to maintain financing sufficient tosupport business operations. We may continue to provide additional support in the future, including loans, facilitating transfer of ownership, oracquiring assets or licensees, which may cause us to incur losses. The licensees that we currently consider to be of concern accounted forapproximately 4% of Diners Club revenue for the years ended December 31, 2018 and 2017 .
- 52 -

Table of Contents
FortheYearEndedDecember31,2017comparedtotheYearEndedDecember31,2016Our Payment Services segment reported pretax income of $145 million for the year ended December 31, 2017 as compared to pretax income
of $107 million the year ended December 31, 2016 . The increase in segment pretax income was primarily driven by an increase in transactionprocessing revenue due to higher POS transactions and lower expense.
Critical Accounting EstimatesIn preparing our consolidated financial statements in conformity with accounting principles generally accepted in the United States (“GAAP”),
management must make judgments and use estimates and assumptions about the effects of matters that are uncertain. For estimates that involve ahigh degree of judgment and subjectivity, it is possible that different estimates could reasonably be derived for the same period. For estimates thatare particularly sensitive to changes in economic or market conditions, significant changes to the estimated amount from period to period are alsopossible. Management believes the current assumptions and other considerations used to estimate amounts reflected in our consolidated financialstatements are appropriate. However, if actual experience differs from the assumptions and other considerations used in estimating amounts in ourconsolidated financial statements, the resulting changes could have a material effect on our consolidated results of operations and, in certain cases,could have a material effect on our consolidated financial condition. Management has identified the estimates related to our allowance for loanlosses, the evaluation of goodwill for potential impairment and the accrual of income taxes as critical accounting estimates.
AllowanceforLoanLossesWe base our allowance for loan losses on several analyses that help us estimate incurred losses as of the balance sheet date. In deriving this
estimate, we consider the collectibility of principal, interest and fees associated with our loan receivables. While our estimation process includeshistorical data and analysis, there is a significant amount of judgment applied in selecting inputs and analyzing the results produced to determine theallowance. We use a migration analysis to estimate the likelihood that a loan will progress through the various stages of delinquency. Managementalso estimates loss emergence by using other analyses to estimate losses incurred from non-delinquent accounts. The considerations in theseanalyses include past and current loan performance, loan seasoning and growth, current risk management practices, account collection strategies,economic conditions, bankruptcy filings, policy changes and forecasting uncertainties. Given the same information, others may reach differentreasonable estimates.
If management used different assumptions in estimating incurred net loan losses, the impact to the allowance for loan losses could have amaterial effect on our consolidated financial condition and results of operations. For example, a 10% change in management’s estimate of incurrednet loan losses could have resulted in a change of approximately $304 million in the allowance for loan losses at December 31, 2018 , with acorresponding change in the provision for loan losses. See “— Loan Quality” and Note 2: Summary of Significant Accounting Policies to ourconsolidated financial statements for further details about our allowance for loan losses.
GoodwillWe recognize goodwill when the purchase price of an acquired business exceeds the total of the fair values of the acquired net assets. As
required by GAAP, we test goodwill for impairment annually, or more often if indicators of impairment exist. In evaluating goodwill for impairment,management must estimate the fair value of the reporting unit(s) to which the goodwill relates. Because market data concerning acquisitions ofcomparable businesses typically are not readily obtainable, other valuation techniques such as earnings multiples and cash flow models are used inestimating the fair values of these reporting units. In applying these techniques, management considers historical results, business forecasts, marketand industry conditions and other factors. We may also consult independent valuation experts where needed in applying these valuation techniques.The valuation methodologies we use involve assumptions about business performance, revenue and expense growth, capital expenditures, discountrates and other assumptions that are judgmental in nature.
- 53 -
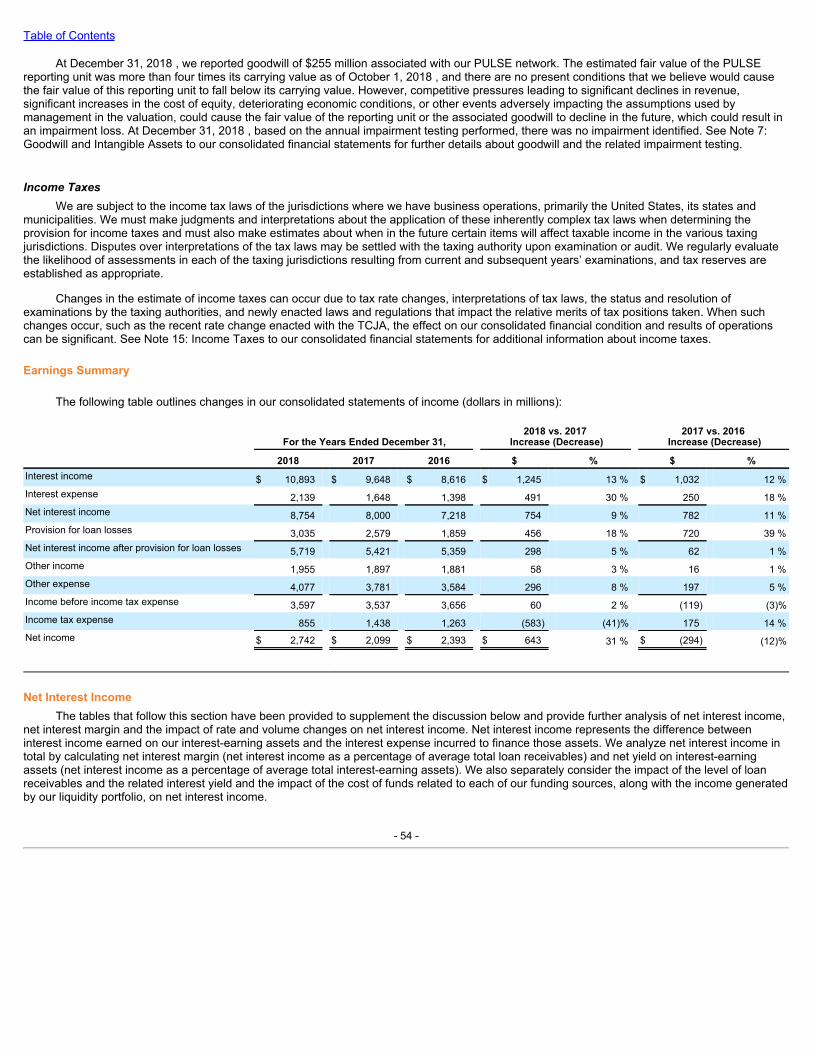
Table of Contents
At December 31, 2018 , we reported goodwill of $255 million associated with our PULSE network. The estimated fair value of the PULSEreporting unit was more than four times its carrying value as of October 1, 2018 , and there are no present conditions that we believe would causethe fair value of this reporting unit to fall below its carrying value. However, competitive pressures leading to significant declines in revenue,significant increases in the cost of equity, deteriorating economic conditions, or other events adversely impacting the assumptions used bymanagement in the valuation, could cause the fair value of the reporting unit or the associated goodwill to decline in the future, which could result inan impairment loss. At December 31, 2018 , based on the annual impairment testing performed, there was no impairment identified. See Note 7:Goodwill and Intangible Assets to our consolidated financial statements for further details about goodwill and the related impairment testing.
IncomeTaxesWe are subject to the income tax laws of the jurisdictions where we have business operations, primarily the United States, its states and
municipalities. We must make judgments and interpretations about the application of these inherently complex tax laws when determining theprovision for income taxes and must also make estimates about when in the future certain items will affect taxable income in the various taxingjurisdictions. Disputes over interpretations of the tax laws may be settled with the taxing authority upon examination or audit. We regularly evaluatethe likelihood of assessments in each of the taxing jurisdictions resulting from current and subsequent years’ examinations, and tax reserves areestablished as appropriate.
Changes in the estimate of income taxes can occur due to tax rate changes, interpretations of tax laws, the status and resolution ofexaminations by the taxing authorities, and newly enacted laws and regulations that impact the relative merits of tax positions taken. When suchchanges occur, such as the recent rate change enacted with the TCJA, the effect on our consolidated financial condition and results of operationscan be significant. See Note 15: Income Taxes to our consolidated financial statements for additional information about income taxes.
Earnings Summary
The following table outlines changes in our consolidated statements of income (dollars in millions):
For the Years Ended December 31, 2018 vs. 2017
Increase (Decrease) 2017 vs. 2016
Increase (Decrease)
2018 2017 2016 $ % $ %Interest income $ 10,893 $ 9,648 $ 8,616 $ 1,245 13 % $ 1,032 12 %Interest expense 2,139 1,648 1,398 491 30 % 250 18 %Net interest income 8,754 8,000 7,218 754 9 % 782 11 %Provision for loan losses 3,035 2,579 1,859 456 18 % 720 39 %Net interest income after provision for loan losses 5,719 5,421 5,359 298 5 % 62 1 %Other income 1,955 1,897 1,881 58 3 % 16 1 %Other expense 4,077 3,781 3,584 296 8 % 197 5 %Income before income tax expense 3,597 3,537 3,656 60 2 % (119) (3)%Income tax expense 855 1,438 1,263 (583) (41)% 175 14 %Net income $ 2,742 $ 2,099 $ 2,393 $ 643 31 % $ (294) (12)%
Net Interest IncomeThe tables that follow this section have been provided to supplement the discussion below and provide further analysis of net interest income,
net interest margin and the impact of rate and volume changes on net interest income. Net interest income represents the difference betweeninterest income earned on our interest-earning assets and the interest expense incurred to finance those assets. We analyze net interest income intotal by calculating net interest margin (net interest income as a percentage of average total loan receivables) and net yield on interest-earningassets (net interest income as a percentage of average total interest-earning assets). We also separately consider the impact of the level of loanreceivables and the related interest yield and the impact of the cost of funds related to each of our funding sources, along with the income generatedby our liquidity portfolio, on net interest income.
- 54 -

Table of Contents
Our interest-earning assets consist of: (i) cash and cash equivalents primarily related to amounts on deposit with the Federal Reserve Bank ofPhiladelphia, (ii) restricted cash, (iii) other short-term investments, (iv) investment securities and (v) loan receivables. Our interest-bearing liabilitiesconsist primarily of deposits, both direct-to-consumer and brokered, and long-term borrowings, including amounts owed to securitization investors.Net interest income is influenced by the following:
• The level and composition of loan receivables, including the proportion of credit card loans to other loans, as well as the proportion of loanreceivables bearing interest at promotional rates as compared to standard rates;
• The credit performance of our loans, particularly with regard to charge-offs of finance charges, which reduce interest income;
• The terms of long-term borrowings and certificates of deposit upon initial offering, including maturity and interest rate;
• The interest rates necessary to attract and maintain direct-to-consumer deposits;
• The level and composition of other interest-earning assets, including our liquidity portfolio and interest-bearing liabilities;
• Changes in the interest rate environment, including the levels of interest rates and the relationships among interest rate indices, such asthe prime rate, the Federal Funds rate, interest rate on excess reserves and London Interbank Offered Rate;
• The effectiveness of interest rate swaps in our interest rate risk management program; and
• The difference between the carrying amount and future cash flows expected to be collected on purchased credit-impaired (“PCI”) loans.
FortheYearEndedDecember31,2018comparedtotheYearEndedDecember31,2017Net interest income increased for the year ended December 31, 2018 as compared to the year ended December 31, 2017 prim arily driven by
loan growth and higher yields on credit card loans, partially offset by higher funding costs. Interest income increased over the prior year due tocontinued loan growth and yield expansion resulting from prime rate increases. Interest expense increased during the year primarily due to highermarket rates and a larger funding base.
FortheYearEndedDecember31,2017comparedtotheYearEndedDecember31,2016Net interest income increased for the year ended December 31, 2017 as compared to the year ended December 31, 2016 primarily driven by
loan growth and higher yields on credit card loans, partially offset by higher funding costs. The increase in credit card yields was primarily due toprime rate increases and a higher portion of revolving card receivables, partially offset by the portfolio mix and higher interest charge-offs. Interestincome increased during the year ended December 31, 2017 as compared to the year ended December 31, 2016 due to loan growth and higheryields. Interest expense increased during the year ended December 31, 2017 as compared to the year ended December 31, 2016 primarily due toincreased borrowings to fund asset growth, higher market rates and a change in funding mix.
- 55 -
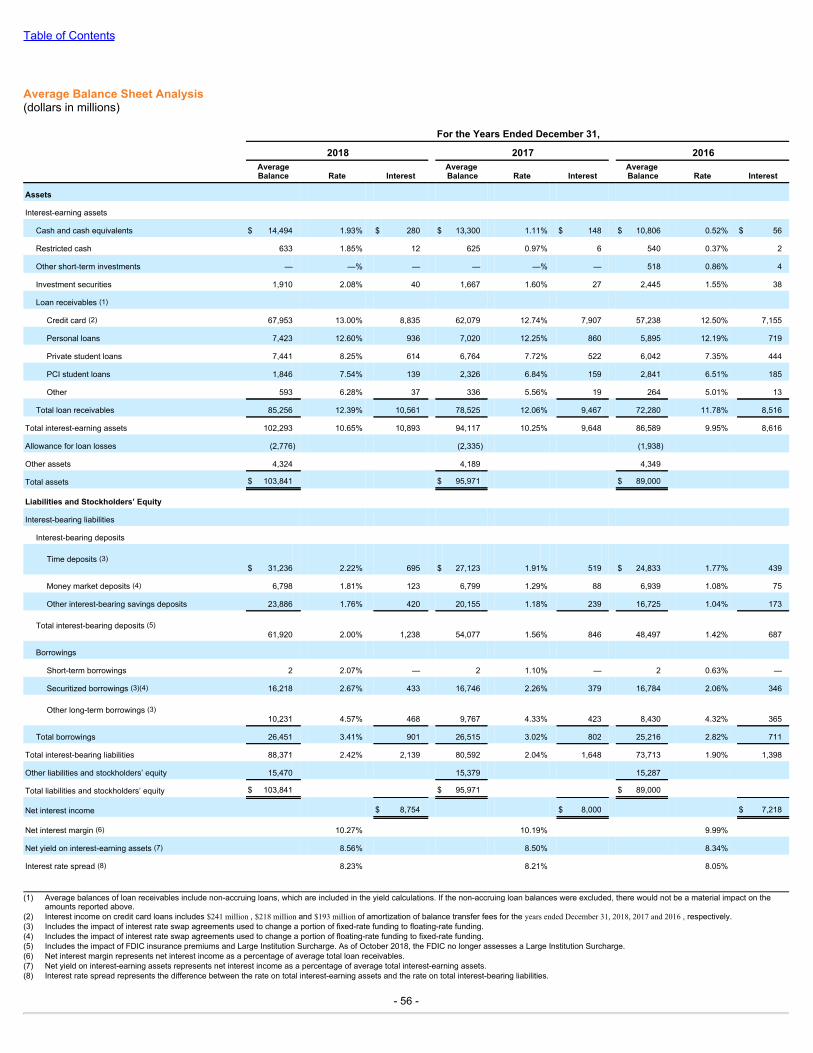
Table of Contents
Average Balance Sheet Analysis(dollars in millions)
For the Years Ended December 31,
2018 2017 2016
AverageBalance Rate Interest Average
Balance Rate Interest Average Balance Rate Interest
Assets
Interest-earning assets
Cash and cash equivalents $ 14,494 1.93% $ 280 $ 13,300 1.11% $ 148 $ 10,806 0.52% $ 56
Restricted cash 633 1.85% 12 625 0.97% 6 540 0.37% 2
Other short-term investments — —% — — —% — 518 0.86% 4
Investment securities 1,910 2.08% 40 1,667 1.60% 27 2,445 1.55% 38
Loan receivables (1)
Credit card (2) 67,953 13.00% 8,835 62,079 12.74% 7,907 57,238 12.50% 7,155
Personal loans 7,423 12.60% 936 7,020 12.25% 860 5,895 12.19% 719
Private student loans 7,441 8.25% 614 6,764 7.72% 522 6,042 7.35% 444
PCI student loans 1,846 7.54% 139 2,326 6.84% 159 2,841 6.51% 185
Other 593 6.28% 37 336 5.56% 19 264 5.01% 13
Total loan receivables 85,256 12.39% 10,561 78,525 12.06% 9,467 72,280 11.78% 8,516
Total interest-earning assets 102,293 10.65% 10,893 94,117 10.25% 9,648 86,589 9.95% 8,616
Allowance for loan losses (2,776) (2,335) (1,938)
Other assets 4,324 4,189 4,349
Total assets $ 103,841 $ 95,971 $ 89,000
Liabilities and Stockholders’ Equity
Interest-bearing liabilities
Interest-bearing deposits
Time deposits (3)$ 31,236 2.22% 695 $ 27,123 1.91% 519 $ 24,833 1.77% 439
Money market deposits (4) 6,798 1.81% 123 6,799 1.29% 88 6,939 1.08% 75
Other interest-bearing savings deposits 23,886 1.76% 420 20,155 1.18% 239 16,725 1.04% 173
Total interest-bearing deposits (5)61,920 2.00% 1,238 54,077 1.56% 846 48,497 1.42% 687
Borrowings
Short-term borrowings 2 2.07% — 2 1.10% — 2 0.63% —
Securitized borrowings (3)(4) 16,218 2.67% 433 16,746 2.26% 379 16,784 2.06% 346
Other long-term borrowings (3)10,231 4.57% 468 9,767 4.33% 423 8,430 4.32% 365
Total borrowings 26,451 3.41% 901 26,515 3.02% 802 25,216 2.82% 711
Total interest-bearing liabilities 88,371 2.42% 2,139 80,592 2.04% 1,648 73,713 1.90% 1,398
Other liabilities and stockholders’ equity 15,470 15,379 15,287
Total liabilities and stockholders’ equity $ 103,841 $ 95,971 $ 89,000
Net interest income $ 8,754 $ 8,000 $ 7,218
Net interest margin (6) 10.27% 10.19% 9.99%
Net yield on interest-earning assets (7) 8.56% 8.50% 8.34%
Interest rate spread (8) 8.23% 8.21% 8.05% (1) Average balances of loan receivables include non-accruing loans, which are included in the yield calculations. If the non-accruing loan balances were excluded, there would not be a material impact on the
amounts reported above.(2) Interest income on credit card loans includes $241 million , $218 million and $193 million of amortization of balance transfer fees for the years ended December 31, 2018, 2017 and 2016 , respectively.(3) Includes the impact of interest rate swap agreements used to change a portion of fixed-rate funding to floating-rate funding.(4) Includes the impact of interest rate swap agreements used to change a portion of floating-rate funding to fixed-rate funding.(5) Includes the impact of FDIC insurance premiums and Large Institution Surcharge. As of October 2018, the FDIC no longer assesses a Large Institution Surcharge.(6) Net interest margin represents net interest income as a percentage of average total loan receivables.(7) Net yield on interest-earning assets represents net interest income as a percentage of average total interest-earning assets.(8) Interest rate spread represents the difference between the rate on total interest-earning assets and the rate on total interest-bearing liabilities.
- 56 -
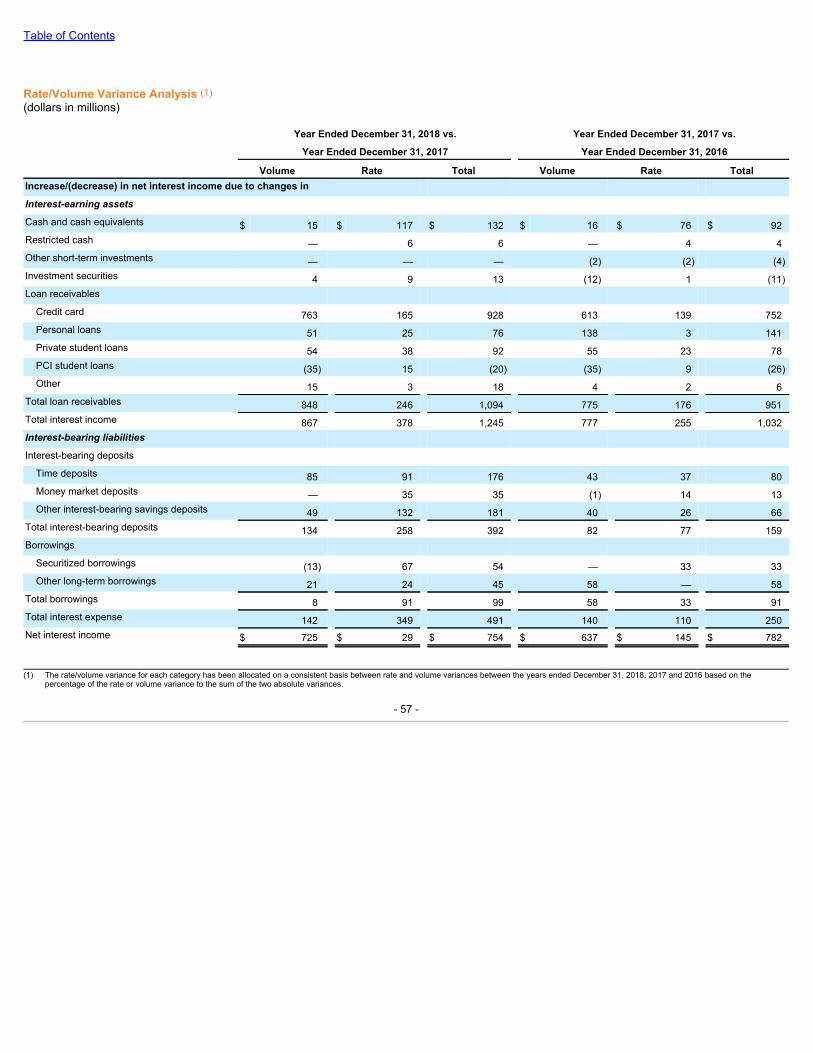
Table of Contents
Rate/Volume Variance Analysis (1) (dollars in millions)
Year Ended December 31, 2018 vs. Year Ended December 31, 2017 vs. Year Ended December 31, 2017 Year Ended December 31, 2016
Volume Rate Total Volume Rate Total Increase/(decrease) in net interest income due to changes in Interest-earningassets Cash and cash equivalents $ 15 $ 117 $ 132 $ 16 $ 76 $ 92Restricted cash — 6 6 — 4 4Other short-term investments — — — (2) (2) (4)Investment securities 4 9 13 (12) 1 (11)Loan receivables
Credit card 763 165 928 613 139 752Personal loans 51 25 76 138 3 141Private student loans 54 38 92 55 23 78PCI student loans (35) 15 (20) (35) 9 (26)Other 15 3 18 4 2 6
Total loan receivables 848 246 1,094 775 176 951Total interest income 867 378 1,245 777 255 1,032Interest-bearingliabilities Interest-bearing deposits
Time deposits 85 91 176 43 37 80Money market deposits — 35 35 (1) 14 13Other interest-bearing savings deposits 49 132 181 40 26 66
Total interest-bearing deposits 134 258 392 82 77 159Borrowings
Securitized borrowings (13) 67 54 — 33 33Other long-term borrowings 21 24 45 58 — 58
Total borrowings 8 91 99 58 33 91Total interest expense 142 349 491 140 110 250Net interest income $ 725 $ 29 $ 754 $ 637 $ 145 $ 782
(1) The rate/volume variance for each category has been allocated on a consistent basis between rate and volume variances between the years ended December 31, 2018, 2017 and 2016 based on the
percentage of the rate or volume variance to the sum of the two absolute variances.
- 57 -
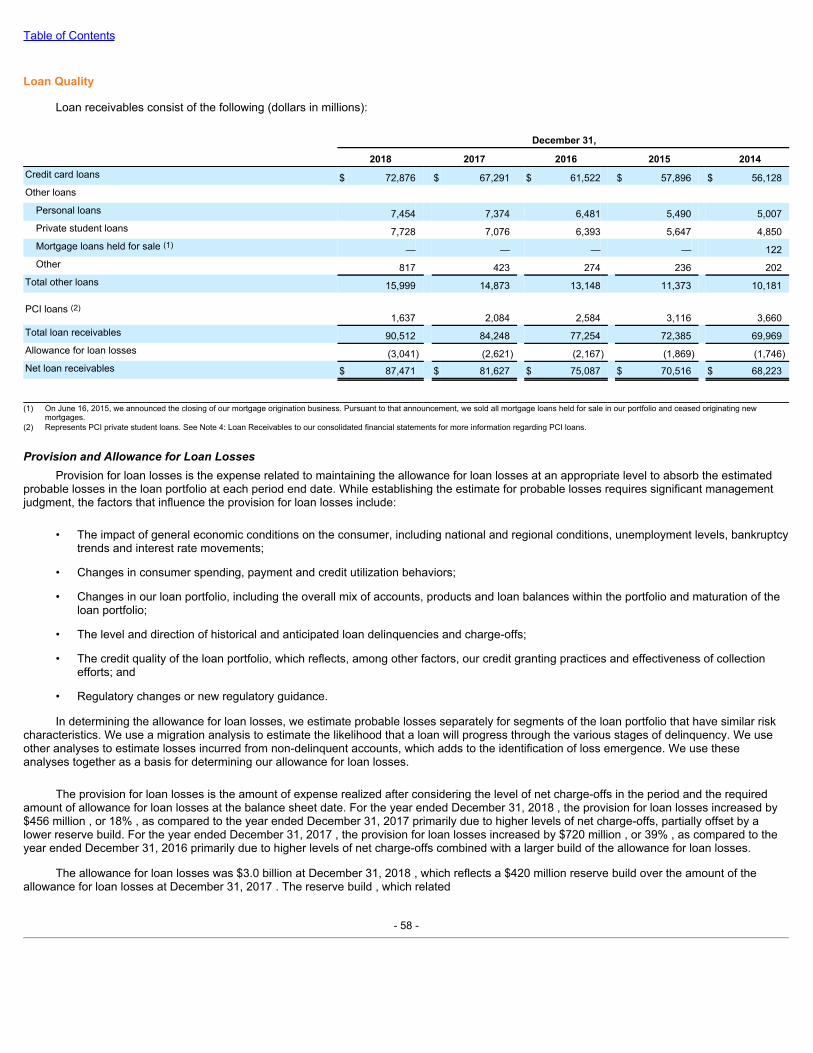
Table of Contents
Loan Quality
Loan receivables consist of the following (dollars in millions):
December 31, 2018 2017 2016 2015 2014Credit card loans $ 72,876 $ 67,291 $ 61,522 $ 57,896 $ 56,128Other loans
Personal loans 7,454 7,374 6,481 5,490 5,007Private student loans 7,728 7,076 6,393 5,647 4,850Mortgage loans held for sale (1) — — — — 122Other 817 423 274 236 202
Total other loans 15,999 14,873 13,148 11,373 10,181
PCI loans (2)1,637 2,084 2,584 3,116 3,660
Total loan receivables 90,512 84,248 77,254 72,385 69,969Allowance for loan losses (3,041) (2,621) (2,167) (1,869) (1,746)Net loan receivables $ 87,471 $ 81,627 $ 75,087 $ 70,516 $ 68,223
(1) On June 16, 2015, we announced the closing of our mortgage origination business. Pursuant to that announcement, we sold all mortgage loans held for sale in our portfolio and ceased originating new
mortgages.(2) Represents PCI private student loans. See Note 4: Loan Receivables to our consolidated financial statements for more information regarding PCI loans.
ProvisionandAllowanceforLoanLossesProvision for loan losses is the expense related to maintaining the allowance for loan losses at an appropriate level to absorb the estimated
probable losses in the loan portfolio at each period end date. While establishing the estimate for probable losses requires significant managementjudgment, the factors that influence the provision for loan losses include:
• The impact of general economic conditions on the consumer, including national and regional conditions, unemployment levels, bankruptcytrends and interest rate movements;
• Changes in consumer spending, payment and credit utilization behaviors;
• Changes in our loan portfolio, including the overall mix of accounts, products and loan balances within the portfolio and maturation of theloan portfolio;
• The level and direction of historical and anticipated loan delinquencies and charge-offs;
• The credit quality of the loan portfolio, which reflects, among other factors, our credit granting practices and effectiveness of collectionefforts; and
• Regulatory changes or new regulatory guidance.
In determining the allowance for loan losses, we estimate probable losses separately for segments of the loan portfolio that have similar riskcharacteristics. We use a migration analysis to estimate the likelihood that a loan will progress through the various stages of delinquency. We useother analyses to estimate losses incurred from non-delinquent accounts, which adds to the identification of loss emergence. We use theseanalyses together as a basis for determining our allowance for loan losses.
The provision for loan losses is the amount of expense realized after considering the level of net charge-offs in the period and the requiredamount of allowance for loan losses at the balance sheet date. For the year ended December 31, 2018 , the provision for loan losses increased by$456 million , or 18% , as compared to the year ended December 31, 2017 primarily due to higher levels of net charge-offs, partially offset by alower reserve build. For the year ended December 31, 2017 , the provision for loan losses increased by $720 million , or 39% , as compared to theyear ended December 31, 2016 primarily due to higher levels of net charge-offs combined with a larger build of the allowance for loan losses.
The allowance for loan losses was $3.0 billion at December 31, 2018 , which reflects a $420 million reserve build over the amount of theallowance for loan losses at December 31, 2017 . The reserve build , which related
- 58 -
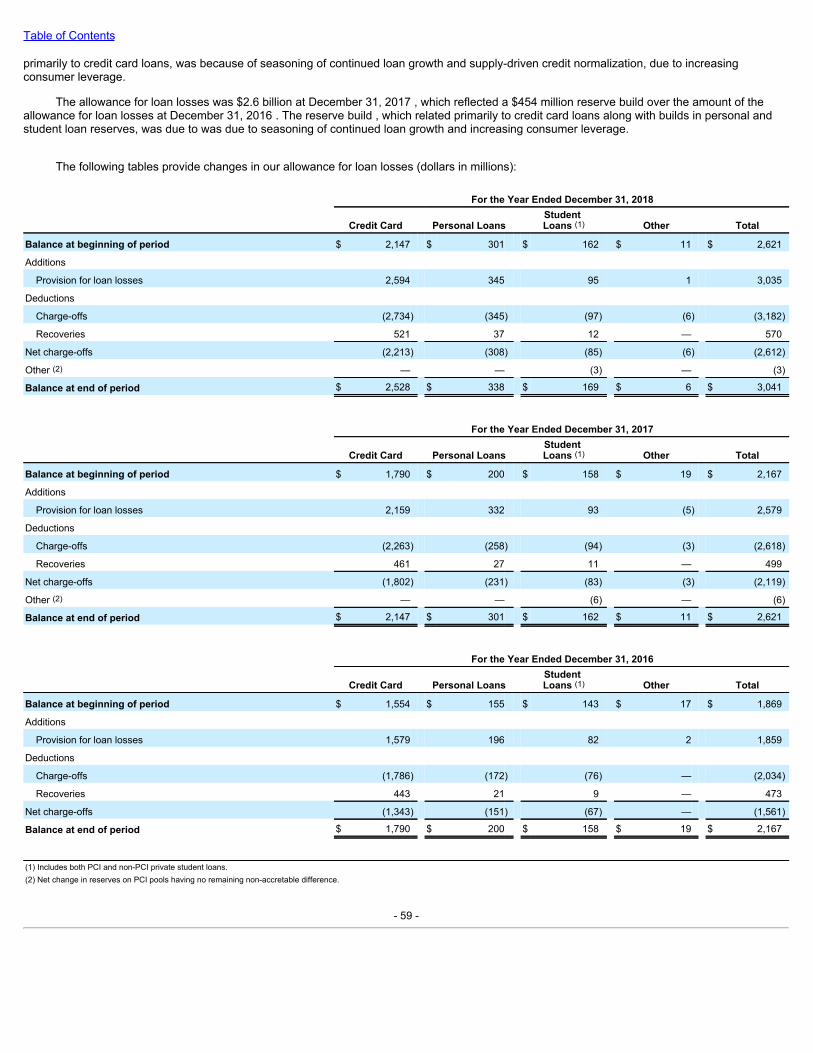
Table of Contents
primarily to credit card loans, was because of seasoning of continued loan growth and supply-driven credit normalization, due to increasingconsumer leverage.
The allowance for loan losses was $2.6 billion at December 31, 2017 , which reflected a $454 million reserve build over the amount of theallowance for loan losses at December 31, 2016 . The reserve build , which related primarily to credit card loans along with builds in personal andstudent loan reserves, was due to was due to seasoning of continued loan growth and increasing consumer leverage.
The following tables provide changes in our allowance for loan losses (dollars in millions):
For the Year Ended December 31, 2018
Credit Card Personal Loans Student Loans (1) Other Total
Balance at beginning of period $ 2,147 $ 301 $ 162 $ 11 $ 2,621
Additions
Provision for loan losses 2,594 345 95 1 3,035
Deductions
Charge-offs (2,734) (345) (97) (6) (3,182)
Recoveries 521 37 12 — 570
Net charge-offs (2,213) (308) (85) (6) (2,612)
Other (2) — — (3) — (3)
Balance at end of period $ 2,528 $ 338 $ 169 $ 6 $ 3,041
For the Year Ended December 31, 2017
Credit Card Personal Loans Student Loans (1) Other Total
Balance at beginning of period $ 1,790 $ 200 $ 158 $ 19 $ 2,167
Additions
Provision for loan losses 2,159 332 93 (5) 2,579
Deductions
Charge-offs (2,263) (258) (94) (3) (2,618)
Recoveries 461 27 11 — 499
Net charge-offs (1,802) (231) (83) (3) (2,119)
Other (2) — — (6) — (6)
Balance at end of period $ 2,147 $ 301 $ 162 $ 11 $ 2,621
For the Year Ended December 31, 2016
Credit Card Personal Loans Student Loans (1) Other Total
Balance at beginning of period $ 1,554 $ 155 $ 143 $ 17 $ 1,869
Additions
Provision for loan losses 1,579 196 82 2 1,859
Deductions
Charge-offs (1,786) (172) (76) — (2,034)
Recoveries 443 21 9 — 473
Net charge-offs (1,343) (151) (67) — (1,561)
Balance at end of period $ 1,790 $ 200 $ 158 $ 19 $ 2,167
(1) Includes both PCI and non-PCI private student loans.(2) Net change in reserves on PCI pools having no remaining non-accretable difference.
- 59 -
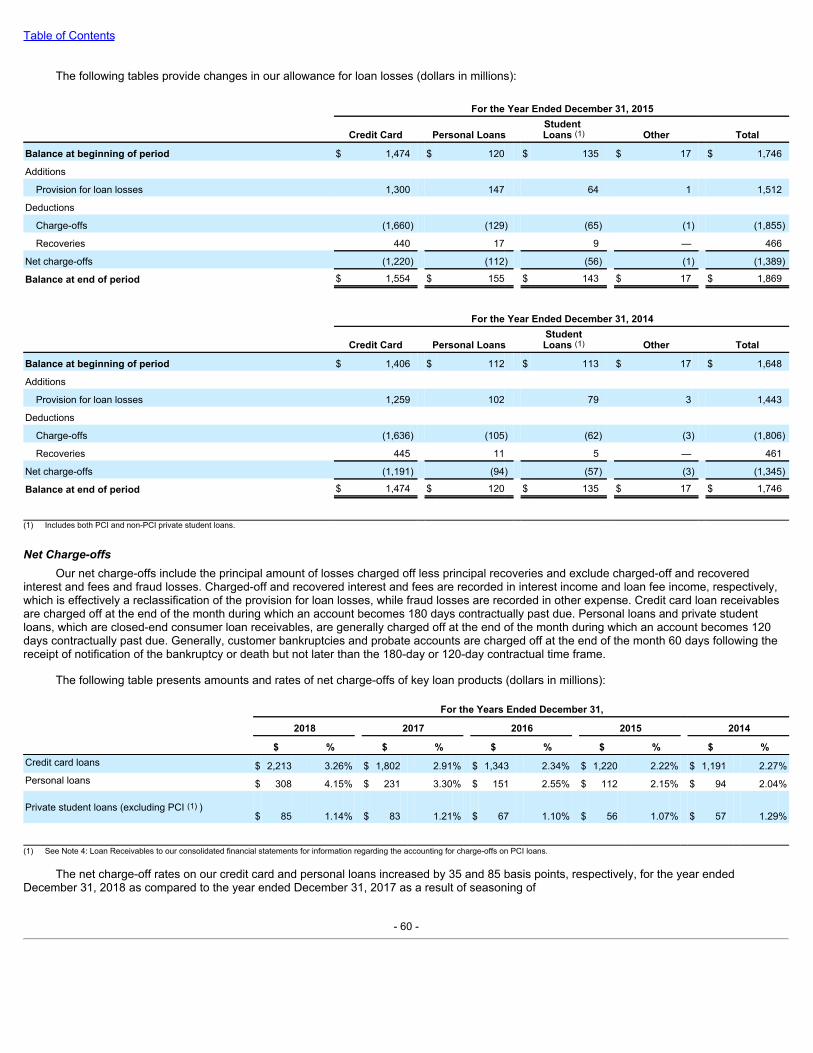
Table of Contents
The following tables provide changes in our allowance for loan losses (dollars in millions):
For the Year Ended December 31, 2015
Credit Card Personal Loans Student Loans (1) Other Total
Balance at beginning of period $ 1,474 $ 120 $ 135 $ 17 $ 1,746
Additions
Provision for loan losses 1,300 147 64 1 1,512
Deductions
Charge-offs (1,660) (129) (65) (1) (1,855)
Recoveries 440 17 9 — 466
Net charge-offs (1,220) (112) (56) (1) (1,389)
Balance at end of period $ 1,554 $ 155 $ 143 $ 17 $ 1,869
For the Year Ended December 31, 2014
Credit Card Personal Loans StudentLoans (1) Other Total
Balance at beginning of period $ 1,406 $ 112 $ 113 $ 17 $ 1,648
Additions
Provision for loan losses 1,259 102 79 3 1,443
Deductions
Charge-offs (1,636) (105) (62) (3) (1,806)
Recoveries 445 11 5 — 461
Net charge-offs (1,191) (94) (57) (3) (1,345)
Balance at end of period $ 1,474 $ 120 $ 135 $ 17 $ 1,746
(1) Includes both PCI and non-PCI private student loans.
NetCharge-offsOur net charge-offs include the principal amount of losses charged off less principal recoveries and exclude charged-off and recovered
interest and fees and fraud losses. Charged-off and recovered interest and fees are recorded in interest income and loan fee income, respectively,which is effectively a reclassification of the provision for loan losses, while fraud losses are recorded in other expense. Credit card loan receivablesare charged off at the end of the month during which an account becomes 180 days contractually past due. Personal loans and private studentloans, which are closed-end consumer loan receivables, are generally charged off at the end of the month during which an account becomes 120days contractually past due. Generally, customer bankruptcies and probate accounts are charged off at the end of the month 60 days following thereceipt of notification of the bankruptcy or death but not later than the 180-day or 120-day contractual time frame.
The following table presents amounts and rates of net charge-offs of key loan products (dollars in millions):
For the Years Ended December 31,
2018 2017 2016 2015 2014
$ % $ % $ % $ % $ %Credit card loans $ 2,213 3.26% $ 1,802 2.91% $ 1,343 2.34% $ 1,220 2.22% $ 1,191 2.27%Personal loans $ 308 4.15% $ 231 3.30% $ 151 2.55% $ 112 2.15% $ 94 2.04%
Private student loans (excluding PCI (1) )$ 85 1.14% $ 83 1.21% $ 67 1.10% $ 56 1.07% $ 57 1.29%
(1) See Note 4: Loan Receivables to our consolidated financial statements for information regarding the accounting for charge-offs on PCI loans.
The net charge-off rates on our credit card and personal loans increased by 35 and 85 basis points, respectively, for the year endedDecember 31, 2018 as compared to the year ended December 31, 2017 as a result of seasoning of
- 60 -
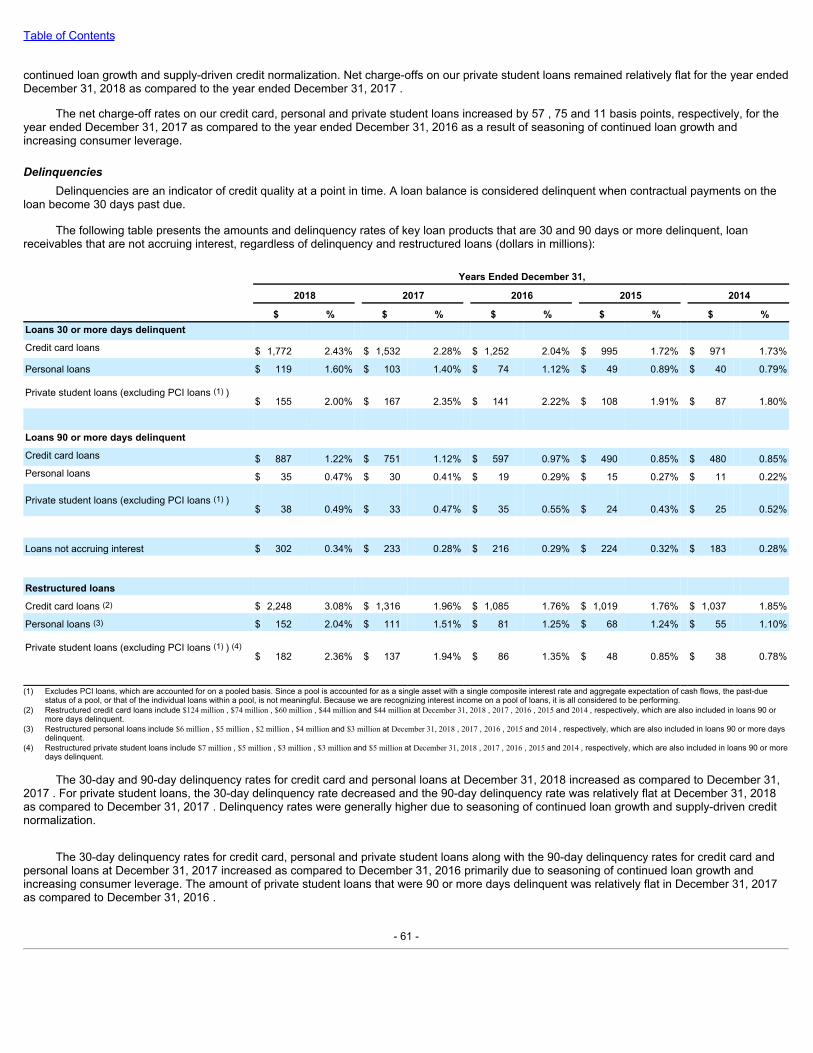
Table of Contents
continued loan growth and supply-driven credit normalization. Net charge-offs on our private student loans remained relatively flat for the year endedDecember 31, 2018 as compared to the year ended December 31, 2017 .
The net charge-off rates on our credit card, personal and private student loans increased by 57 , 75 and 11 basis points, respectively, for theyear ended December 31, 2017 as compared to the year ended December 31, 2016 as a result of seasoning of continued loan growth andincreasing consumer leverage.
DelinquenciesDelinquencies are an indicator of credit quality at a point in time. A loan balance is considered delinquent when contractual payments on the
loan become 30 days past due.
The following table presents the amounts and delinquency rates of key loan products that are 30 and 90 days or more delinquent, loanreceivables that are not accruing interest, regardless of delinquency and restructured loans (dollars in millions):
Years Ended December 31,
2018 2017 2016 2015 2014
$ % $ % $ % $ % $ %Loans 30 or more days delinquent Credit card loans $ 1,772 2.43% $ 1,532 2.28% $ 1,252 2.04% $ 995 1.72% $ 971 1.73%
Personal loans $ 119 1.60% $ 103 1.40% $ 74 1.12% $ 49 0.89% $ 40 0.79%
Private student loans (excluding PCI loans (1) )$ 155 2.00% $ 167 2.35% $ 141 2.22% $ 108 1.91% $ 87 1.80%
Loans 90 or more days delinquent Credit card loans $ 887 1.22% $ 751 1.12% $ 597 0.97% $ 490 0.85% $ 480 0.85%Personal loans $ 35 0.47% $ 30 0.41% $ 19 0.29% $ 15 0.27% $ 11 0.22%
Private student loans (excluding PCI loans (1) )$ 38 0.49% $ 33 0.47% $ 35 0.55% $ 24 0.43% $ 25 0.52%
Loans not accruing interest $ 302 0.34% $ 233 0.28% $ 216 0.29% $ 224 0.32% $ 183 0.28%
Restructured loans
Credit card loans (2) $ 2,248 3.08% $ 1,316 1.96% $ 1,085 1.76% $ 1,019 1.76% $ 1,037 1.85%
Personal loans (3) $ 152 2.04% $ 111 1.51% $ 81 1.25% $ 68 1.24% $ 55 1.10%
Private student loans (excluding PCI loans (1) ) (4)$ 182 2.36% $ 137 1.94% $ 86 1.35% $ 48 0.85% $ 38 0.78%
(1) Excludes PCI loans, which are accounted for on a pooled basis. Since a pool is accounted for as a single asset with a single composite interest rate and aggregate expectation of cash flows, the past-due
status of a pool, or that of the individual loans within a pool, is not meaningful. Because we are recognizing interest income on a pool of loans, it is all considered to be performing.(2) Restructured credit card loans include $124 million , $74 million , $60 million , $44 million and $44 million at December 31, 2018 , 2017 , 2016 , 2015 and 2014 , respectively, which are also included in loans 90 or
more days delinquent.(3) Restructured personal loans include $6 million , $5 million , $2 million , $4 million and $3 million at December 31, 2018 , 2017 , 2016 , 2015 and 2014 , respectively, which are also included in loans 90 or more days
delinquent.(4) Restructured private student loans include $7 million , $5 million , $3 million , $3 million and $5 million at December 31, 2018 , 2017 , 2016 , 2015 and 2014 , respectively, which are also included in loans 90 or more
days delinquent.
The 30-day and 90-day delinquency rates for credit card and personal loans at December 31, 2018 increased as compared to December 31,2017 . For private student loans, the 30-day delinquency rate decreased and the 90-day delinquency rate was relatively flat at December 31, 2018as compared to December 31, 2017 . Delinquency rates were generally higher due to seasoning of continued loan growth and supply-driven creditnormalization.
The 30-day delinquency rates for credit card, personal and private student loans along with the 90-day delinquency rates for credit card andpersonal loans at December 31, 2017 increased as compared to December 31, 2016 primarily due to seasoning of continued loan growth andincreasing consumer leverage. The amount of private student loans that were 90 or more days delinquent was relatively flat in December 31, 2017as compared to December 31, 2016 .
- 61 -
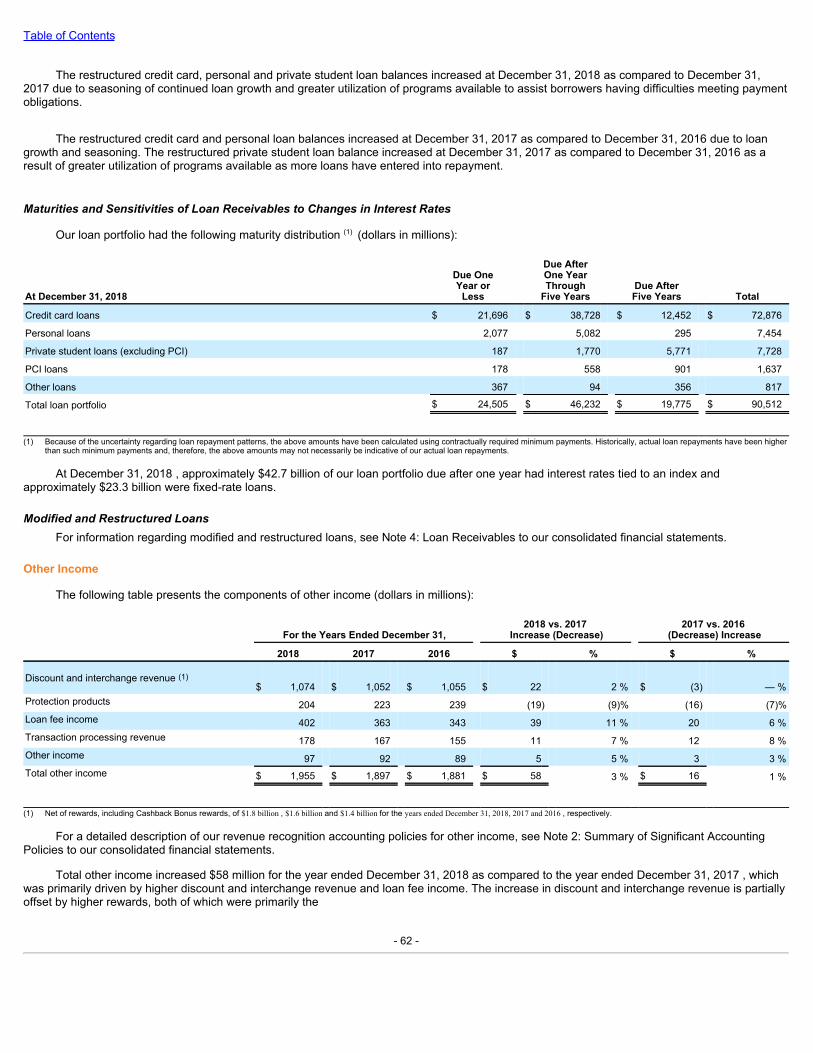
Table of Contents
The restructured credit card, personal and private student loan balances increased at December 31, 2018 as compared to December 31,2017 due to seasoning of continued loan growth and greater utilization of programs available to assist borrowers having difficulties meeting paymentobligations.
The restructured credit card and personal loan balances increased at December 31, 2017 as compared to December 31, 2016 due to loangrowth and seasoning. The restructured private student loan balance increased at December 31, 2017 as compared to December 31, 2016 as aresult of greater utilization of programs available as more loans have entered into repayment.
MaturitiesandSensitivitiesofLoanReceivablestoChangesinInterestRates
Our loan portfolio had the following maturity distribution (1) (dollars in millions):
At December 31, 2018
Due OneYear or
Less
Due AfterOne YearThrough
Five Years Due AfterFive Years Total
Credit card loans $ 21,696 $ 38,728 $ 12,452 $ 72,876
Personal loans 2,077 5,082 295 7,454
Private student loans (excluding PCI) 187 1,770 5,771 7,728
PCI loans 178 558 901 1,637
Other loans 367 94 356 817
Total loan portfolio $ 24,505 $ 46,232 $ 19,775 $ 90,512
(1) Because of the uncertainty regarding loan repayment patterns, the above amounts have been calculated using contractually required minimum payments. Historically, actual loan repayments have been higher
than such minimum payments and, therefore, the above amounts may not necessarily be indicative of our actual loan repayments.
At December 31, 2018 , approximately $42.7 billion of our loan portfolio due after one year had interest rates tied to an index andapproximately $23.3 billion were fixed-rate loans.
ModifiedandRestructuredLoansFor information regarding modified and restructured loans, see Note 4: Loan Receivables to our consolidated financial statements.
Other Income
The following table presents the components of other income (dollars in millions):
For the Years Ended December 31, 2018 vs. 2017
Increase (Decrease) 2017 vs. 2016
(Decrease) Increase
2018 2017 2016 $ % $ %
Discount and interchange revenue (1)$ 1,074 $ 1,052 $ 1,055 $ 22 2 % $ (3) — %
Protection products 204 223 239 (19) (9)% (16) (7)%Loan fee income 402 363 343 39 11 % 20 6 %Transaction processing revenue 178 167 155 11 7 % 12 8 %Other income 97 92 89 5 5 % 3 3 %Total other income $ 1,955 $ 1,897 $ 1,881 $ 58 3 % $ 16 1 %
(1) Net of rewards, including Cashback Bonus rewards, of $1.8 billion , $1.6 billion and $1.4 billion for the years ended December 31, 2018, 2017 and 2016 , respectively.
For a detailed description of our revenue recognition accounting policies for other income, see Note 2: Summary of Significant AccountingPolicies to our consolidated financial statements.
Total other income increased $58 million for the year ended December 31, 2018 as compared to the year ended December 31, 2017 , whichwas primarily driven by higher discount and interchange revenue and loan fee income. The increase in discount and interchange revenue is partiallyoffset by higher rewards, both of which were primarily the
- 62 -
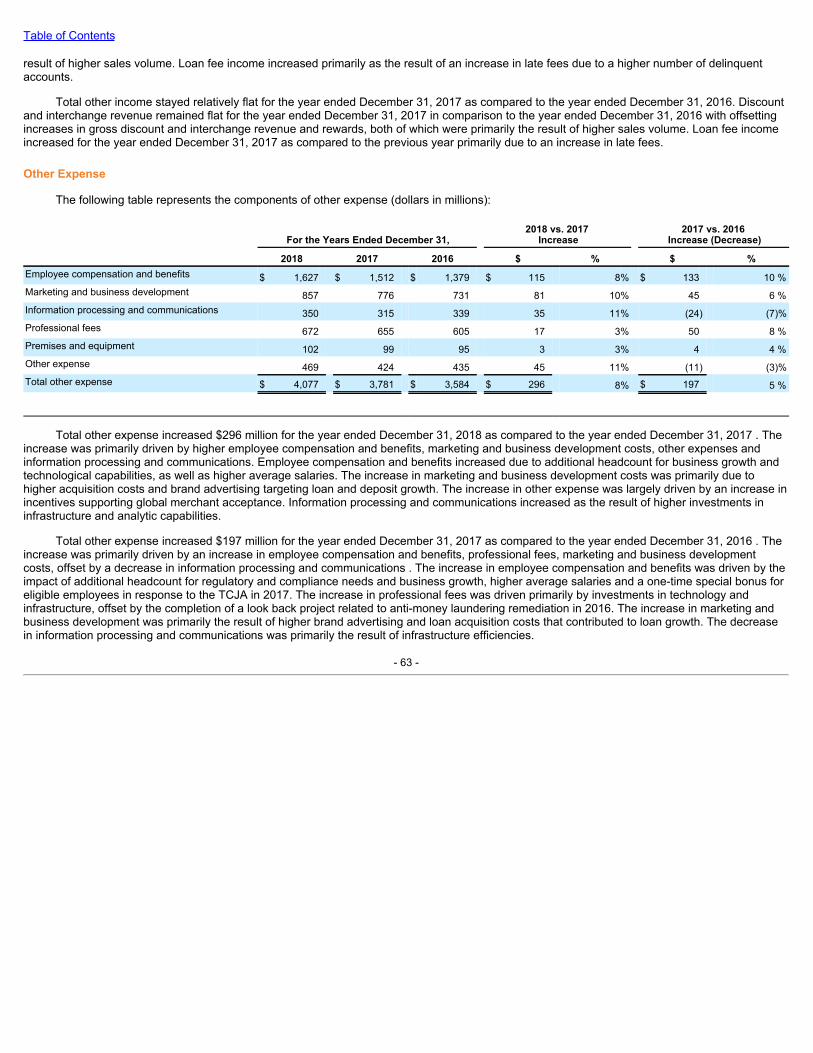
Table of Contents
result of higher sales volume. Loan fee income increased primarily as the result of an increase in late fees due to a higher number of delinquentaccounts.
Total other income stayed relatively flat for the year ended December 31, 2017 as compared to the year ended December 31, 2016. Discountand interchange revenue remained flat for the year ended December 31, 2017 in comparison to the year ended December 31, 2016 with offsettingincreases in gross discount and interchange revenue and rewards, both of which were primarily the result of higher sales volume. Loan fee incomeincreased for the year ended December 31, 2017 as compared to the previous year primarily due to an increase in late fees.
Other Expense
The following table represents the components of other expense (dollars in millions):
For the Years Ended December 31, 2018 vs. 2017
Increase 2017 vs. 2016
Increase (Decrease)
2018 2017 2016 $ % $ %Employee compensation and benefits $ 1,627 $ 1,512 $ 1,379 $ 115 8% $ 133 10 %Marketing and business development 857 776 731 81 10% 45 6 %Information processing and communications 350 315 339 35 11% (24) (7)%Professional fees 672 655 605 17 3% 50 8 %Premises and equipment 102 99 95 3 3% 4 4 %Other expense 469 424 435 45 11% (11) (3)%Total other expense $ 4,077 $ 3,781 $ 3,584 $ 296 8% $ 197 5 %
Total other expense increased $296 million for the year ended December 31, 2018 as compared to the year ended December 31, 2017 . Theincrease was primarily driven by higher employee compensation and benefits, marketing and business development costs, other expenses andinformation processing and communications. Employee compensation and benefits increased due to additional headcount for business growth andtechnological capabilities, as well as higher average salaries. The increase in marketing and business development costs was primarily due tohigher acquisition costs and brand advertising targeting loan and deposit growth. The increase in other expense was largely driven by an increase inincentives supporting global merchant acceptance. Information processing and communications increased as the result of higher investments ininfrastructure and analytic capabilities.
Total other expense increased $197 million for the year ended December 31, 2017 as compared to the year ended December 31, 2016 . Theincrease was primarily driven by an increase in employee compensation and benefits, professional fees, marketing and business developmentcosts, offset by a decrease in information processing and communications . The increase in employee compensation and benefits was driven by theimpact of additional headcount for regulatory and compliance needs and business growth, higher average salaries and a one-time special bonus foreligible employees in response to the TCJA in 2017. The increase in professional fees was driven primarily by investments in technology andinfrastructure, offset by the completion of a look back project related to anti-money laundering remediation in 2016. The increase in marketing andbusiness development was primarily the result of higher brand advertising and loan acquisition costs that contributed to loan growth. The decreasein information processing and communications was primarily the result of infrastructure efficiencies.
- 63 -
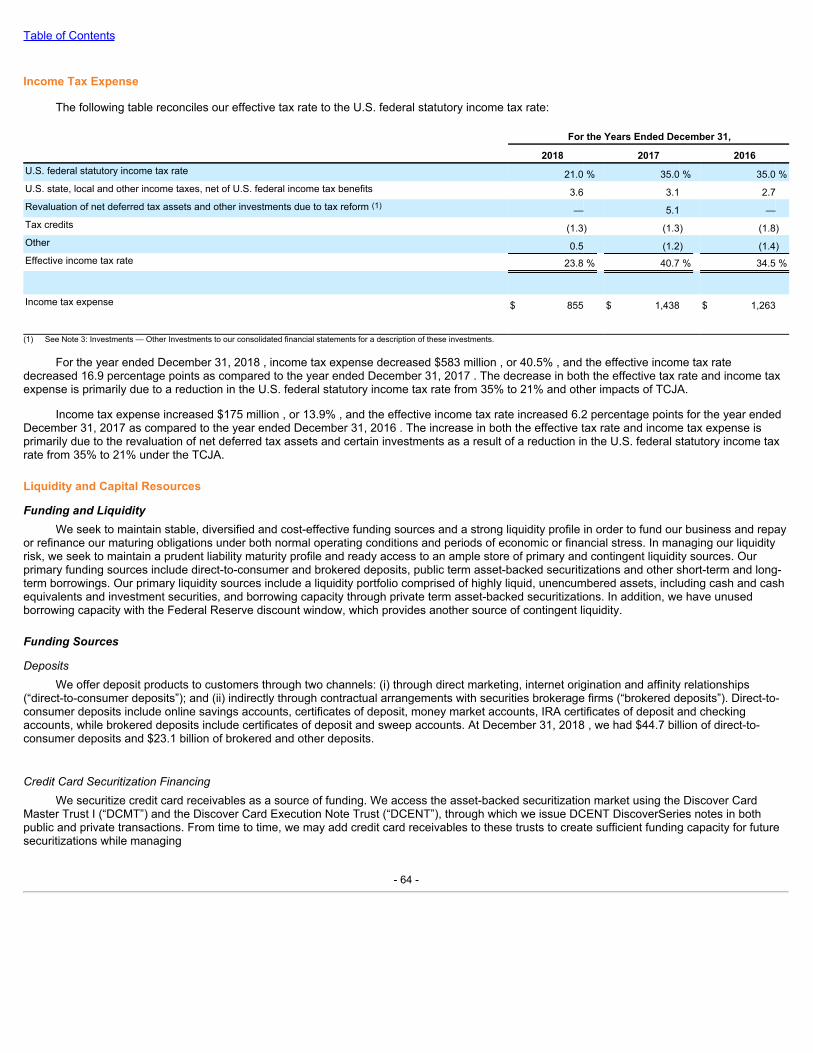
Table of Contents
Income Tax Expense
The following table reconciles our effective tax rate to the U.S. federal statutory income tax rate:
For the Years Ended December 31,
2018 2017 2016U.S. federal statutory income tax rate 21.0 % 35.0 % 35.0 %U.S. state, local and other income taxes, net of U.S. federal income tax benefits 3.6 3.1 2.7Revaluation of net deferred tax assets and other investments due to tax reform (1) — 5.1 —Tax credits (1.3) (1.3) (1.8)Other 0.5 (1.2) (1.4)Effective income tax rate 23.8 % 40.7 % 34.5 %
Income tax expense $ 855 $ 1,438 $ 1,263 (1) See Note 3: Investments — Other Investments to our consolidated financial statements for a description of these investments.
For the year ended December 31, 2018 , income tax expense decreased $583 million , or 40.5% , and the effective income tax ratedecreased 16.9 percentage points as compared to the year ended December 31, 2017 . The decrease in both the effective tax rate and income taxexpense is primarily due to a reduction in the U.S. federal statutory income tax rate from 35% to 21% and other impacts of TCJA.
Income tax expense increased $175 million , or 13.9% , and the effective income tax rate increased 6.2 percentage points for the year endedDecember 31, 2017 as compared to the year ended December 31, 2016 . The increase in both the effective tax rate and income tax expense isprimarily due to the revaluation of net deferred tax assets and certain investments as a result of a reduction in the U.S. federal statutory income taxrate from 35% to 21% under the TCJA.
Liquidity and Capital Resources
FundingandLiquidityWe seek to maintain stable, diversified and cost-effective funding sources and a strong liquidity profile in order to fund our business and repay
or refinance our maturing obligations under both normal operating conditions and periods of economic or financial stress. In managing our liquidityrisk, we seek to maintain a prudent liability maturity profile and ready access to an ample store of primary and contingent liquidity sources. Ourprimary funding sources include direct-to-consumer and brokered deposits, public term asset-backed securitizations and other short-term and long-term borrowings. Our primary liquidity sources include a liquidity portfolio comprised of highly liquid, unencumbered assets, including cash and cashequivalents and investment securities, and borrowing capacity through private term asset-backed securitizations. In addition, we have unusedborrowing capacity with the Federal Reserve discount window, which provides another source of contingent liquidity.
FundingSources
DepositsWe offer deposit products to customers through two channels: (i) through direct marketing, internet origination and affinity relationships
(“direct-to-consumer deposits”); and (ii) indirectly through contractual arrangements with securities brokerage firms (“brokered deposits”). Direct-to-consumer deposits include online savings accounts, certificates of deposit, money market accounts, IRA certificates of deposit and checkingaccounts, while brokered deposits include certificates of deposit and sweep accounts. At December 31, 2018 , we had $44.7 billion of direct-to-consumer deposits and $23.1 billion of brokered and other deposits.
CreditCardSecuritizationFinancingWe securitize credit card receivables as a source of funding. We access the asset-backed securitization market using the Discover Card
Master Trust I (“DCMT”) and the Discover Card Execution Note Trust (“DCENT”), through which we issue DCENT DiscoverSeries notes in bothpublic and private transactions. From time to time, we may add credit card receivables to these trusts to create sufficient funding capacity for futuresecuritizations while managing
- 64 -
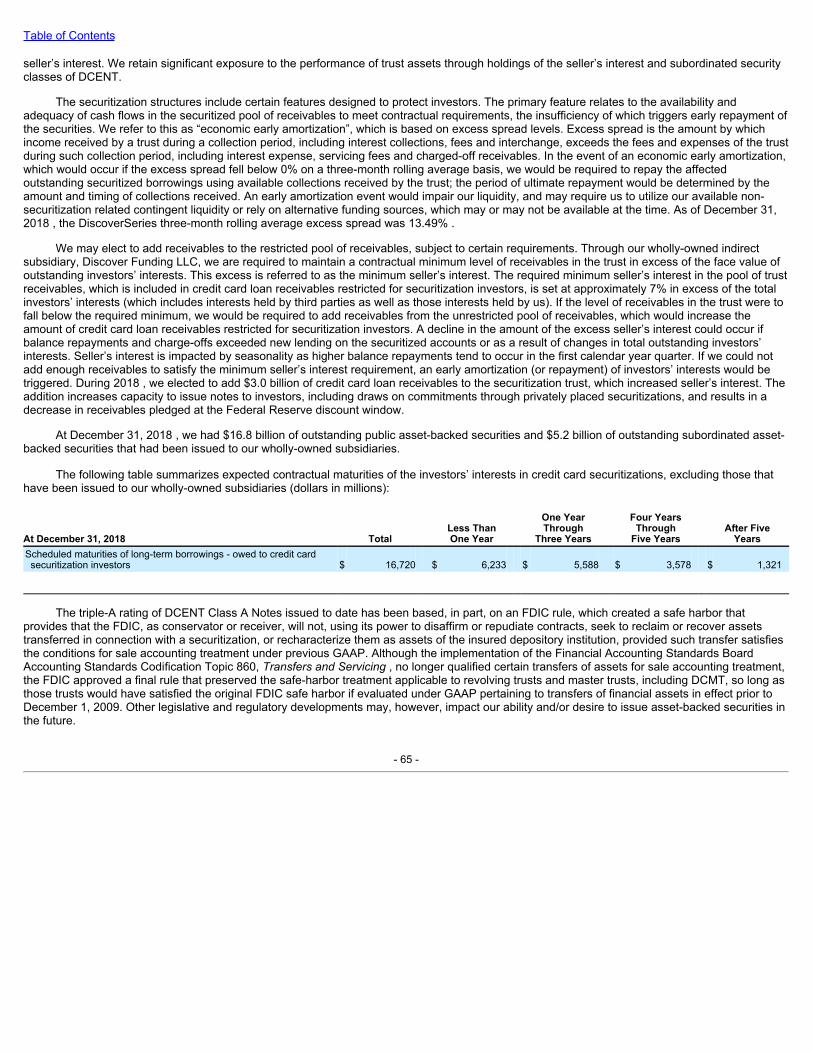
Table of Contents
seller’s interest. We retain significant exposure to the performance of trust assets through holdings of the seller’s interest and subordinated securityclasses of DCENT.
The securitization structures include certain features designed to protect investors. The primary feature relates to the availability andadequacy of cash flows in the securitized pool of receivables to meet contractual requirements, the insufficiency of which triggers early repayment ofthe securities. We refer to this as “economic early amortization”, which is based on excess spread levels. Excess spread is the amount by whichincome received by a trust during a collection period, including interest collections, fees and interchange, exceeds the fees and expenses of the trustduring such collection period, including interest expense, servicing fees and charged-off receivables. In the event of an economic early amortization,which would occur if the excess spread fell below 0% on a three-month rolling average basis, we would be required to repay the affectedoutstanding securitized borrowings using available collections received by the trust; the period of ultimate repayment would be determined by theamount and timing of collections received. An early amortization event would impair our liquidity, and may require us to utilize our available non-securitization related contingent liquidity or rely on alternative funding sources, which may or may not be available at the time. As of December 31,2018 , the DiscoverSeries three-month rolling average excess spread was 13.49% .
We may elect to add receivables to the restricted pool of receivables, subject to certain requirements. Through our wholly-owned indirectsubsidiary, Discover Funding LLC, we are required to maintain a contractual minimum level of receivables in the trust in excess of the face value ofoutstanding investors’ interests. This excess is referred to as the minimum seller’s interest. The required minimum seller’s interest in the pool of trustreceivables, which is included in credit card loan receivables restricted for securitization investors, is set at approximately 7% in excess of the totalinvestors’ interests (which includes interests held by third parties as well as those interests held by us). If the level of receivables in the trust were tofall below the required minimum, we would be required to add receivables from the unrestricted pool of receivables, which would increase theamount of credit card loan receivables restricted for securitization investors. A decline in the amount of the excess seller’s interest could occur ifbalance repayments and charge-offs exceeded new lending on the securitized accounts or as a result of changes in total outstanding investors’interests. Seller’s interest is impacted by seasonality as higher balance repayments tend to occur in the first calendar year quarter. If we could notadd enough receivables to satisfy the minimum seller’s interest requirement, an early amortization (or repayment) of investors’ interests would betriggered. During 2018 , we elected to add $3.0 billion of credit card loan receivables to the securitization trust, which increased seller’s interest. Theaddition increases capacity to issue notes to investors, including draws on commitments through privately placed securitizations, and results in adecrease in receivables pledged at the Federal Reserve discount window.
At December 31, 2018 , we had $16.8 billion of outstanding public asset-backed securities and $5.2 billion of outstanding subordinated asset-backed securities that had been issued to our wholly-owned subsidiaries.
The following table summarizes expected contractual maturities of the investors’ interests in credit card securitizations, excluding those thathave been issued to our wholly-owned subsidiaries (dollars in millions):
At December 31, 2018 Total Less ThanOne Year
One YearThrough
Three Years
Four YearsThrough
Five Years After Five
YearsScheduled maturities of long-term borrowings - owed to credit cardsecuritization investors $ 16,720 $ 6,233 $ 5,588 $ 3,578 $ 1,321
The triple-A rating of DCENT Class A Notes issued to date has been based, in part, on an FDIC rule, which created a safe harbor thatprovides that the FDIC, as conservator or receiver, will not, using its power to disaffirm or repudiate contracts, seek to reclaim or recover assetstransferred in connection with a securitization, or recharacterize them as assets of the insured depository institution, provided such transfer satisfiesthe conditions for sale accounting treatment under previous GAAP. Although the implementation of the Financial Accounting Standards BoardAccounting Standards Codification Topic 860, TransfersandServicing, no longer qualified certain transfers of assets for sale accounting treatment,the FDIC approved a final rule that preserved the safe-harbor treatment applicable to revolving trusts and master trusts, including DCMT, so long asthose trusts would have satisfied the original FDIC safe harbor if evaluated under GAAP pertaining to transfers of financial assets in effect prior toDecember 1, 2009. Other legislative and regulatory developments may, however, impact our ability and/or desire to issue asset-backed securities inthe future.
- 65 -

Table of Contents
OtherLong-TermBorrowings—StudentLoansAt December 31, 2018 , $198 million of remaining principal balance was outstanding on securitized debt assumed as part of our acquisition of
The Student Loan Corporation. Principal and interest payments on the underlying student loans will reduce the balance of these secured borrowingsover time.
OtherLong-TermBorrowings—CorporateandBankDebt
The following table provides a summary of Discover Financial Services (Parent Company) and Discover Bank outstanding fixed-rate debt(dollars in millions):
At December 31, 2018Principal Amount
OutstandingDiscover Financial Services (Parent Company) fixed-rate senior notes, maturing 2019-2027 $ 2,900Discover Financial Services (Parent Company) fixed-rate retail notes, maturing 2019-2031 $ 351Discover Bank fixed-rate senior bank notes, maturing 2020-2028 $ 6,100Discover Bank fixed-rate subordinated bank notes, maturing 2019-2028 $ 1,200
Certain Discover Financial Services senior notes require us to offer to repurchase the notes at a price equal to 101% of their aggregateprincipal amount plus accrued and unpaid interest in the event of a change of control involving us and a corresponding ratings downgrade to belowinvestment grade.
Short-TermBorrowingsAs part of our regular funding strategy, we may from time to time borrow short-term funds in the federal funds market or the repurchase
(“repo”) market through repurchase agreements. Federal funds are short-term, unsecured loans between banks or other financial entities with aFederal Reserve account. Funds borrowed in the repo market are short-term, collateralized loans, usually secured with highly-rated investmentsecurities such as U.S. Treasury bills or notes, or federal agency mortgage bonds or debentures. At December 31, 2018 , there were no outstandingbalances in the federal funds market or repurchase agreements.
AdditionalFundingSources
PrivateAsset-BackedSecuritizationsWe have access to committed borrowing capacity through privately placed asset-backed securitizations. At December 31, 2018 , we had total
committed capacity of $6.0 billion , $500 million of which was drawn. While we may utilize funding from these private securitizations from time totime for normal business operations, their committed nature also makes them a reliable contingency funding source. Therefore, we reserve someundrawn capacity, informed by our liquidity stress testing results, for potential contingency funding needs. We also seek to ensure the stability andreliability of these securitizations by staggering their maturity dates, renewing them approximately one year prior to their scheduled maturity datesand periodically drawing them for operational testing purposes and seasonal funding needs.
FederalReserveDiscover Bank has access to the Federal Reserve Bank of Philadelphia’s discount window. As of December 31, 2018 , Discover Bank had
$31.5 billion of available borrowing capacity through the discount window based on the amount and type of assets pledged, primarily consumerloans. We have no borrowings outstanding under the discount window and reserve this capacity as a source of contingent liquidity.
FundingUsesOur primary uses of funds include the extensions of loans and credit, primarily through Discover Bank, the purchase of investment securities
for our liquidity portfolio, working capital, and debt and capital service. We assess funding uses and liquidity needs under stressed and normaloperating conditions, considering primary uses of funding, such as on-balance sheet loans, and contingent uses of funding, such as the need to postadditional collateral for derivatives positions. In order to anticipate funding needs under stress, we conduct liquidity stress testing to assess the
- 66 -
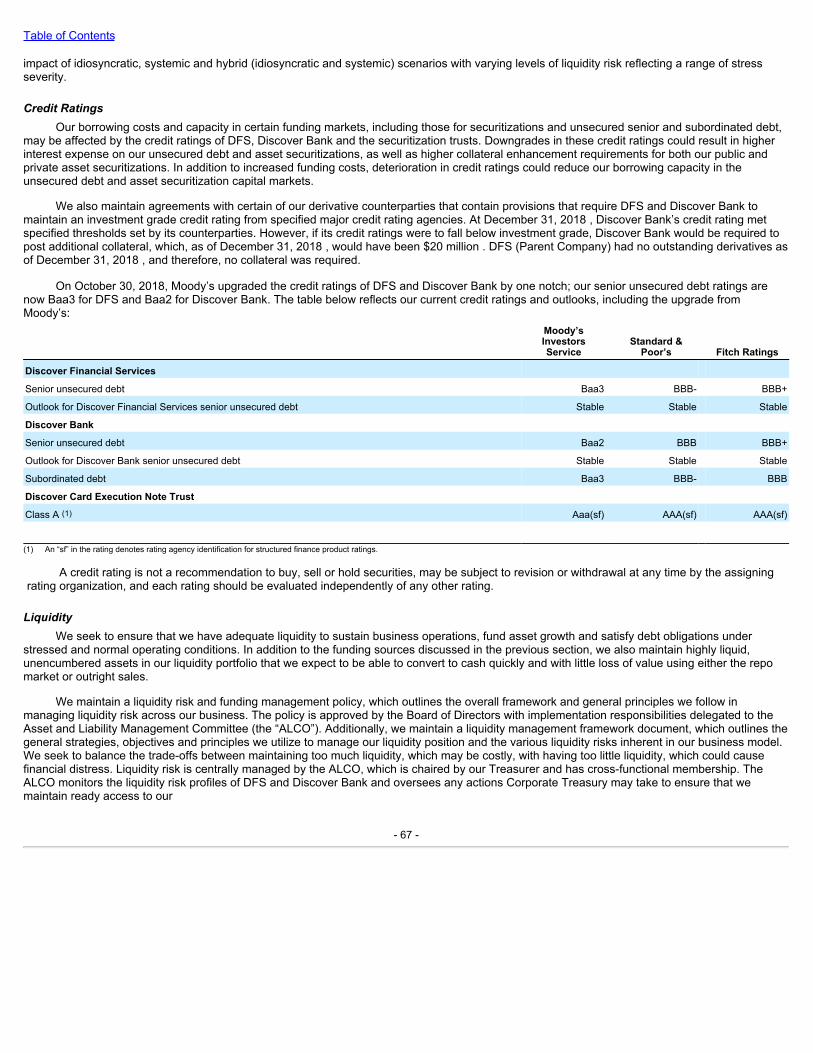
Table of Contents
impact of idiosyncratic, systemic and hybrid (idiosyncratic and systemic) scenarios with varying levels of liquidity risk reflecting a range of stressseverity.
CreditRatingsOur borrowing costs and capacity in certain funding markets, including those for securitizations and unsecured senior and subordinated debt,
may be affected by the credit ratings of DFS, Discover Bank and the securitization trusts. Downgrades in these credit ratings could result in higherinterest expense on our unsecured debt and asset securitizations, as well as higher collateral enhancement requirements for both our public andprivate asset securitizations. In addition to increased funding costs, deterioration in credit ratings could reduce our borrowing capacity in theunsecured debt and asset securitization capital markets.
We also maintain agreements with certain of our derivative counterparties that contain provisions that require DFS and Discover Bank tomaintain an investment grade credit rating from specified major credit rating agencies. At December 31, 2018 , Discover Bank’s credit rating metspecified thresholds set by its counterparties. However, if its credit ratings were to fall below investment grade, Discover Bank would be required topost additional collateral, which, as of December 31, 2018 , would have been $20 million . DFS (Parent Company) had no outstanding derivatives asof December 31, 2018 , and therefore, no collateral was required.
On October 30, 2018, Moody’s upgraded the credit ratings of DFS and Discover Bank by one notch; our senior unsecured debt ratings arenow Baa3 for DFS and Baa2 for Discover Bank. The table below reflects our current credit ratings and outlooks, including the upgrade fromMoody’s:
Moody’sInvestorsService
Standard &Poor’s Fitch Ratings
Discover Financial Services
Senior unsecured debt Baa3 BBB- BBB+
Outlook for Discover Financial Services senior unsecured debt Stable Stable Stable
Discover Bank
Senior unsecured debt Baa2 BBB BBB+
Outlook for Discover Bank senior unsecured debt Stable Stable Stable
Subordinated debt Baa3 BBB- BBB
Discover Card Execution Note Trust
Class A (1) Aaa(sf) AAA(sf) AAA(sf) (1) An “sf” in the rating denotes rating agency identification for structured finance product ratings.
A credit rating is not a recommendation to buy, sell or hold securities, may be subject to revision or withdrawal at any time by the assigningrating organization, and each rating should be evaluated independently of any other rating.
LiquidityWe seek to ensure that we have adequate liquidity to sustain business operations, fund asset growth and satisfy debt obligations under
stressed and normal operating conditions. In addition to the funding sources discussed in the previous section, we also maintain highly liquid,unencumbered assets in our liquidity portfolio that we expect to be able to convert to cash quickly and with little loss of value using either the repomarket or outright sales.
We maintain a liquidity risk and funding management policy, which outlines the overall framework and general principles we follow inmanaging liquidity risk across our business. The policy is approved by the Board of Directors with implementation responsibilities delegated to theAsset and Liability Management Committee (the “ALCO”). Additionally, we maintain a liquidity management framework document, which outlines thegeneral strategies, objectives and principles we utilize to manage our liquidity position and the various liquidity risks inherent in our business model.We seek to balance the trade-offs between maintaining too much liquidity, which may be costly, with having too little liquidity, which could causefinancial distress. Liquidity risk is centrally managed by the ALCO, which is chaired by our Treasurer and has cross-functional membership. TheALCO monitors the liquidity risk profiles of DFS and Discover Bank and oversees any actions Corporate Treasury may take to ensure that wemaintain ready access to our
- 67 -
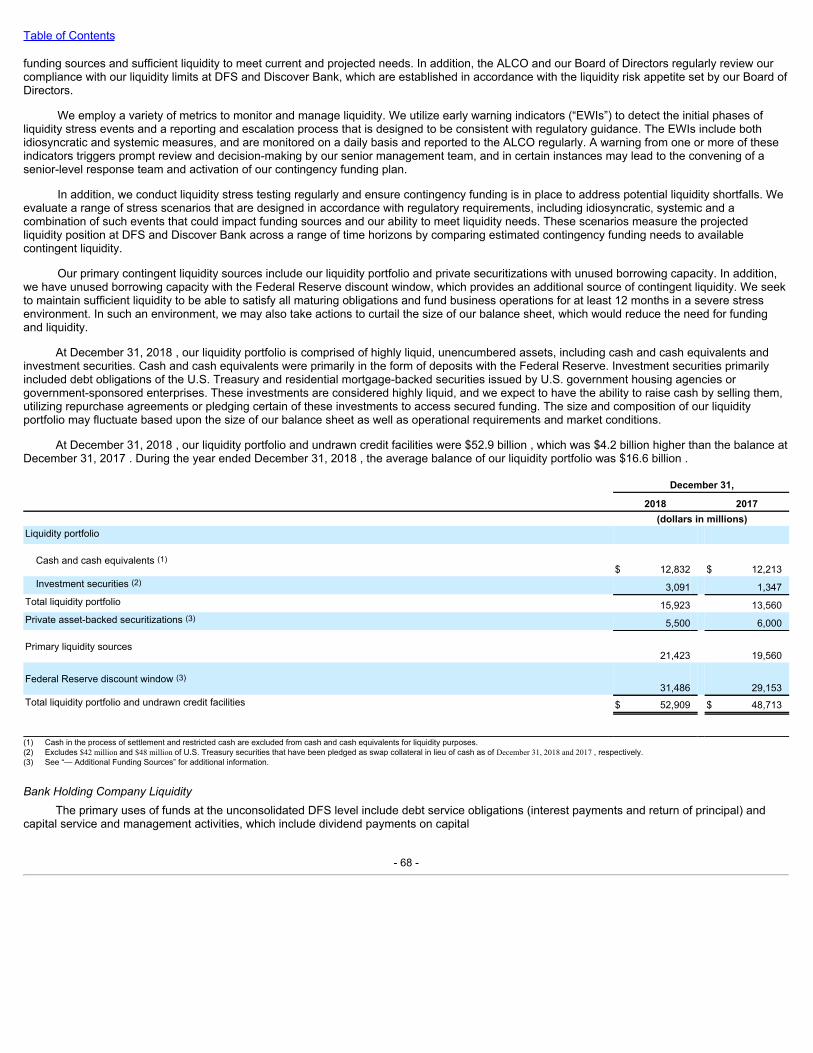
Table of Contents
funding sources and sufficient liquidity to meet current and projected needs. In addition, the ALCO and our Board of Directors regularly review ourcompliance with our liquidity limits at DFS and Discover Bank, which are established in accordance with the liquidity risk appetite set by our Board ofDirectors.
We employ a variety of metrics to monitor and manage liquidity. We utilize early warning indicators (“EWIs”) to detect the initial phases ofliquidity stress events and a reporting and escalation process that is designed to be consistent with regulatory guidance. The EWIs include bothidiosyncratic and systemic measures, and are monitored on a daily basis and reported to the ALCO regularly. A warning from one or more of theseindicators triggers prompt review and decision-making by our senior management team, and in certain instances may lead to the convening of asenior-level response team and activation of our contingency funding plan.
In addition, we conduct liquidity stress testing regularly and ensure contingency funding is in place to address potential liquidity shortfalls. Weevaluate a range of stress scenarios that are designed in accordance with regulatory requirements, including idiosyncratic, systemic and acombination of such events that could impact funding sources and our ability to meet liquidity needs. These scenarios measure the projectedliquidity position at DFS and Discover Bank across a range of time horizons by comparing estimated contingency funding needs to availablecontingent liquidity.
Our primary contingent liquidity sources include our liquidity portfolio and private securitizations with unused borrowing capacity. In addition,we have unused borrowing capacity with the Federal Reserve discount window, which provides an additional source of contingent liquidity. We seekto maintain sufficient liquidity to be able to satisfy all maturing obligations and fund business operations for at least 12 months in a severe stressenvironment. In such an environment, we may also take actions to curtail the size of our balance sheet, which would reduce the need for fundingand liquidity.
At December 31, 2018 , our liquidity portfolio is comprised of highly liquid, unencumbered assets, including cash and cash equivalents andinvestment securities. Cash and cash equivalents were primarily in the form of deposits with the Federal Reserve. Investment securities primarilyincluded debt obligations of the U.S. Treasury and residential mortgage-backed securities issued by U.S. government housing agencies orgovernment-sponsored enterprises. These investments are considered highly liquid, and we expect to have the ability to raise cash by selling them,utilizing repurchase agreements or pledging certain of these investments to access secured funding. The size and composition of our liquidityportfolio may fluctuate based upon the size of our balance sheet as well as operational requirements and market conditions.
At December 31, 2018 , our liquidity portfolio and undrawn credit facilities were $52.9 billion , which was $4.2 billion higher than the balance atDecember 31, 2017 . During the year ended December 31, 2018 , the average balance of our liquidity portfolio was $16.6 billion .
December 31, 2018 2017 (dollars in millions)Liquidity portfolio
Cash and cash equivalents (1)$ 12,832 $ 12,213
Investment securities (2) 3,091 1,347Total liquidity portfolio 15,923 13,560Private asset-backed securitizations (3) 5,500 6,000
Primary liquidity sources21,423 19,560
Federal Reserve discount window (3)31,486 29,153
Total liquidity portfolio and undrawn credit facilities $ 52,909 $ 48,713
(1) Cash in the process of settlement and restricted cash are excluded from cash and cash equivalents for liquidity purposes.(2) Excludes $42 million and $48 million of U.S. Treasury securities that have been pledged as swap collateral in lieu of cash as of December 31, 2018 and 2017 , respectively.(3) See “— Additional Funding Sources” for additional information.
BankHoldingCompanyLiquidityThe primary uses of funds at the unconsolidated DFS level include debt service obligations (interest payments and return of principal) and
capital service and management activities, which include dividend payments on capital
- 68 -
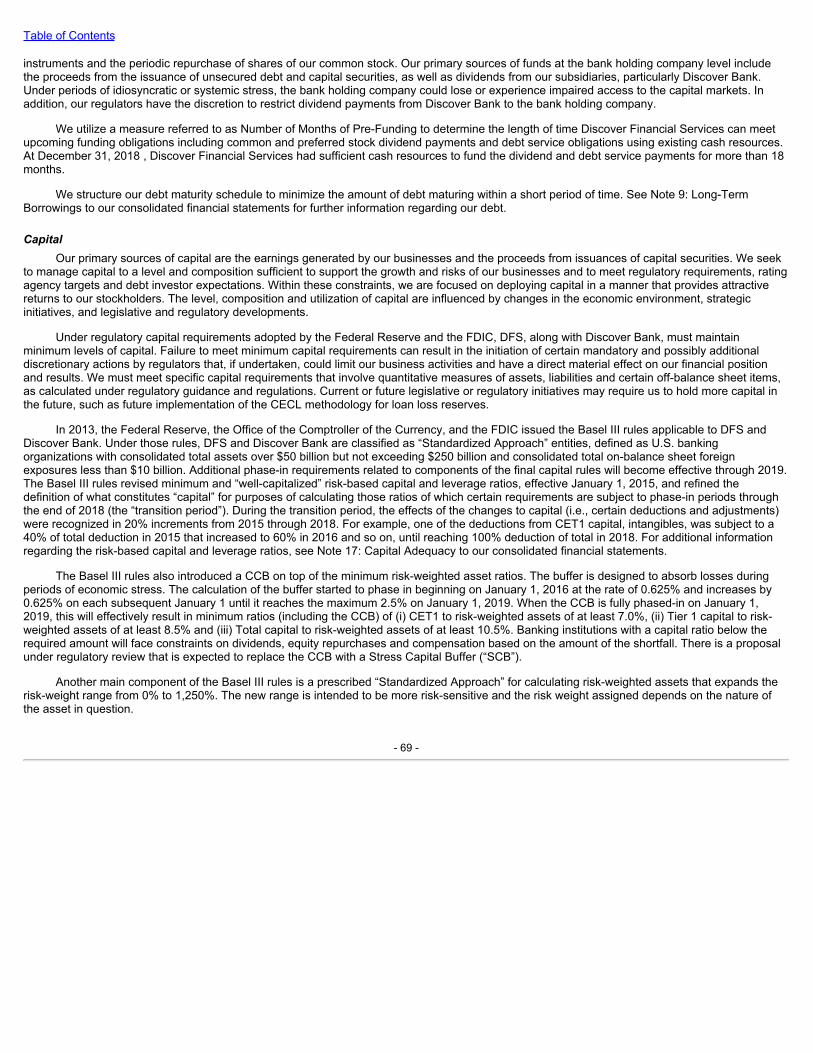
Table of Contents
instruments and the periodic repurchase of shares of our common stock. Our primary sources of funds at the bank holding company level includethe proceeds from the issuance of unsecured debt and capital securities, as well as dividends from our subsidiaries, particularly Discover Bank.Under periods of idiosyncratic or systemic stress, the bank holding company could lose or experience impaired access to the capital markets. Inaddition, our regulators have the discretion to restrict dividend payments from Discover Bank to the bank holding company.
We utilize a measure referred to as Number of Months of Pre-Funding to determine the length of time Discover Financial Services can meetupcoming funding obligations including common and preferred stock dividend payments and debt service obligations using existing cash resources.At December 31, 2018 , Discover Financial Services had sufficient cash resources to fund the dividend and debt service payments for more than 18months.
We structure our debt maturity schedule to minimize the amount of debt maturing within a short period of time. See Note 9: Long-TermBorrowings to our consolidated financial statements for further information regarding our debt.
CapitalOur primary sources of capital are the earnings generated by our businesses and the proceeds from issuances of capital securities. We seek
to manage capital to a level and composition sufficient to support the growth and risks of our businesses and to meet regulatory requirements, ratingagency targets and debt investor expectations. Within these constraints, we are focused on deploying capital in a manner that provides attractivereturns to our stockholders. The level, composition and utilization of capital are influenced by changes in the economic environment, strategicinitiatives, and legislative and regulatory developments.
Under regulatory capital requirements adopted by the Federal Reserve and the FDIC, DFS, along with Discover Bank, must maintainminimum levels of capital. Failure to meet minimum capital requirements can result in the initiation of certain mandatory and possibly additionaldiscretionary actions by regulators that, if undertaken, could limit our business activities and have a direct material effect on our financial positionand results. We must meet specific capital requirements that involve quantitative measures of assets, liabilities and certain off-balance sheet items,as calculated under regulatory guidance and regulations. Current or future legislative or regulatory initiatives may require us to hold more capital inthe future, such as future implementation of the CECL methodology for loan loss reserves.
In 2013, the Federal Reserve, the Office of the Comptroller of the Currency, and the FDIC issued the Basel III rules applicable to DFS andDiscover Bank. Under those rules, DFS and Discover Bank are classified as “Standardized Approach” entities, defined as U.S. bankingorganizations with consolidated total assets over $50 billion but not exceeding $250 billion and consolidated total on-balance sheet foreignexposures less than $10 billion. Additional phase-in requirements related to components of the final capital rules will become effective through 2019.The Basel III rules revised minimum and “well-capitalized” risk-based capital and leverage ratios, effective January 1, 2015, and refined thedefinition of what constitutes “capital” for purposes of calculating those ratios of which certain requirements are subject to phase-in periods throughthe end of 2018 (the “transition period”). During the transition period, the effects of the changes to capital (i.e., certain deductions and adjustments)were recognized in 20% increments from 2015 through 2018. For example, one of the deductions from CET1 capital, intangibles, was subject to a40% of total deduction in 2015 that increased to 60% in 2016 and so on, until reaching 100% deduction of total in 2018. For additional informationregarding the risk-based capital and leverage ratios, see Note 17: Capital Adequacy to our consolidated financial statements.
The Basel III rules also introduced a CCB on top of the minimum risk-weighted asset ratios. The buffer is designed to absorb losses duringperiods of economic stress. The calculation of the buffer started to phase in beginning on January 1, 2016 at the rate of 0.625% and increases by0.625% on each subsequent January 1 until it reaches the maximum 2.5% on January 1, 2019. When the CCB is fully phased-in on January 1,2019, this will effectively result in minimum ratios (including the CCB) of (i) CET1 to risk-weighted assets of at least 7.0%, (ii) Tier 1 capital to risk-weighted assets of at least 8.5% and (iii) Total capital to risk-weighted assets of at least 10.5%. Banking institutions with a capital ratio below therequired amount will face constraints on dividends, equity repurchases and compensation based on the amount of the shortfall. There is a proposalunder regulatory review that is expected to replace the CCB with a Stress Capital Buffer (“SCB”).
Another main component of the Basel III rules is a prescribed “Standardized Approach” for calculating risk-weighted assets that expands therisk-weight range from 0% to 1,250%. The new range is intended to be more risk-sensitive and the risk weight assigned depends on the nature ofthe asset in question.
- 69 -
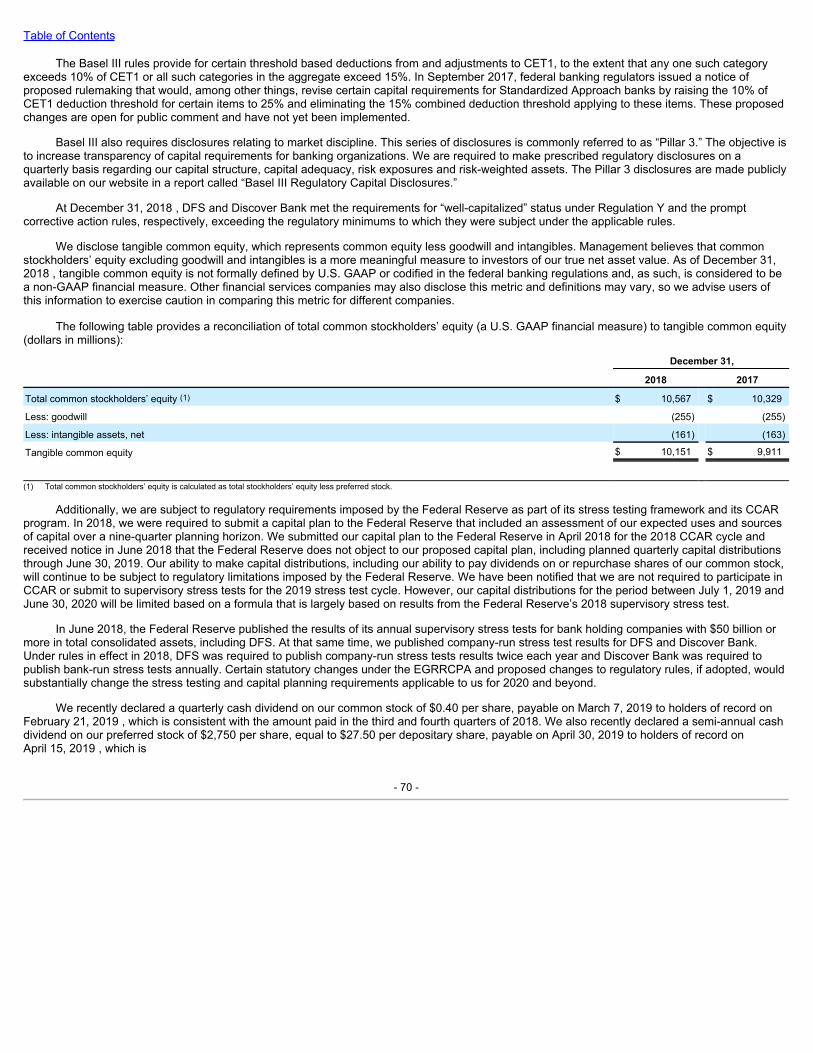
Table of Contents
The Basel III rules provide for certain threshold based deductions from and adjustments to CET1, to the extent that any one such categoryexceeds 10% of CET1 or all such categories in the aggregate exceed 15%. In September 2017, federal banking regulators issued a notice ofproposed rulemaking that would, among other things, revise certain capital requirements for Standardized Approach banks by raising the 10% ofCET1 deduction threshold for certain items to 25% and eliminating the 15% combined deduction threshold applying to these items. These proposedchanges are open for public comment and have not yet been implemented.
Basel III also requires disclosures relating to market discipline. This series of disclosures is commonly referred to as “Pillar 3.” The objective isto increase transparency of capital requirements for banking organizations. We are required to make prescribed regulatory disclosures on aquarterly basis regarding our capital structure, capital adequacy, risk exposures and risk-weighted assets. The Pillar 3 disclosures are made publiclyavailable on our website in a report called “Basel III Regulatory Capital Disclosures.”
At December 31, 2018 , DFS and Discover Bank met the requirements for “well-capitalized” status under Regulation Y and the promptcorrective action rules, respectively, exceeding the regulatory minimums to which they were subject under the applicable rules.
We disclose tangible common equity, which represents common equity less goodwill and intangibles. Management believes that commonstockholders’ equity excluding goodwill and intangibles is a more meaningful measure to investors of our true net asset value. As of December 31,2018 , tangible common equity is not formally defined by U.S. GAAP or codified in the federal banking regulations and, as such, is considered to bea non-GAAP financial measure. Other financial services companies may also disclose this metric and definitions may vary, so we advise users ofthis information to exercise caution in comparing this metric for different companies.
The following table provides a reconciliation of total common stockholders’ equity (a U.S. GAAP financial measure) to tangible common equity(dollars in millions): December 31, 2018 2017
Total common stockholders’ equity (1) $ 10,567 $ 10,329
Less: goodwill (255) (255)
Less: intangible assets, net (161) (163)
Tangible common equity $ 10,151 $ 9,911
(1) Total common stockholders’ equity is calculated as total stockholders’ equity less preferred stock.
Additionally, we are subject to regulatory requirements imposed by the Federal Reserve as part of its stress testing framework and its CCARprogram. In 2018, we were required to submit a capital plan to the Federal Reserve that included an assessment of our expected uses and sourcesof capital over a nine-quarter planning horizon. We submitted our capital plan to the Federal Reserve in April 2018 for the 2018 CCAR cycle andreceived notice in June 2018 that the Federal Reserve does not object to our proposed capital plan, including planned quarterly capital distributionsthrough June 30, 2019. Our ability to make capital distributions, including our ability to pay dividends on or repurchase shares of our common stock,will continue to be subject to regulatory limitations imposed by the Federal Reserve. We have been notified that we are not required to participate inCCAR or submit to supervisory stress tests for the 2019 stress test cycle. However, our capital distributions for the period between July 1, 2019 andJune 30, 2020 will be limited based on a formula that is largely based on results from the Federal Reserve’s 2018 supervisory stress test.
In June 2018, the Federal Reserve published the results of its annual supervisory stress tests for bank holding companies with $50 billion ormore in total consolidated assets, including DFS. At that same time, we published company-run stress test results for DFS and Discover Bank.Under rules in effect in 2018, DFS was required to publish company-run stress tests results twice each year and Discover Bank was required topublish bank-run stress tests annually. Certain statutory changes under the EGRRCPA and proposed changes to regulatory rules, if adopted, wouldsubstantially change the stress testing and capital planning requirements applicable to us for 2020 and beyond.
We recently declared a quarterly cash dividend on our common stock of $0.40 per share, payable on March 7, 2019 to holders of record onFebruary 21, 2019 , which is consistent with the amount paid in the third and fourth quarters of 2018. We also recently declared a semi-annual cashdividend on our preferred stock of $2,750 per share, equal to $27.50 per depositary share, payable on April 30, 2019 to holders of record onApril 15, 2019 , which is
- 70 -
Table of Contents
consistent with the amount paid in the second and fourth quarters of 2018.
On July 19, 2018 , our Board of Directors approved a share repurchase program authorizing the repurchase of up to $3.0 billion of ouroutstanding shares of common stock. The program expires on January 31, 2020 and may be terminated at any time. This program replaced theprior $2.8 billion share repurchase program, which had $611 million of remaining authorization. During the year ended December 31, 2018 , werepurchased approximately 27 million shares, or 8% , of our outstanding common stock for $2.0 billion . We expect to continue to repurchase sharesunder our program from time to time based on market conditions and other factors, subject to legal and regulatory requirements and restrictions,including non-objection from the Federal Reserve as described above. Share repurchases under the program may be made through a variety ofmethods, including open market purchases, privately negotiated transactions or other purchases, including block trades, accelerated sharerepurchase transactions, or any combination of such methods.
The amount and size of any future dividends and share repurchases will depend upon our results of operations, financial condition, capitallevels, cash requirements, future prospects and other factors. The declaration and payment of future dividends, as well as the amount thereof, aresubject to the discretion of our Board of Directors. Holders of our shares of common stock are subject to the prior dividend rights of holders of ourpreferred stock or the depositary shares representing such preferred stock outstanding, and if full dividends have not been declared and paid on alloutstanding shares of preferred stock in any dividend period, no dividend may be declared or paid or set aside for payment on our common stock. Inaddition, as noted above, banking laws and regulations and our banking regulators may limit our ability to pay dividends and make sharerepurchases, including limitations on the extent to which our banking subsidiaries can provide funds to us through dividends, loans or otherwise.Further, current or future regulatory initiatives may require us to hold more capital in the future. There can be no assurance that we will declare andpay any dividends or repurchase any shares of our common stock in the future. For more information, including conditions and limits on our ability topay dividends and repurchase our stock, see “Business — Supervision and Regulation — Capital, Dividends and Share Repurchases,” “RiskFactors — Credit, Market and Liquidity Risk — Wemaybelimitedinourabilitytopaydividendsonandrepurchaseourstock” and “— Weareaholdingcompanyanddependonpaymentsfromoursubsidiaries” and Note 17: Capital Adequacy to our consolidated financial statements.
Certain Off-Balance Sheet Arrangements
GuaranteesGuarantees are contracts or indemnification agreements that contingently require us to make payments to a guaranteed party based on
changes in an underlying asset, liability, or equity security of a guaranteed party, rate or index. Also included in guarantees are contracts thatcontingently require the guarantor to make payments to a guaranteed party based on another entity’s failure to perform under an agreement. Ourguarantees relate to transactions processed on the Discover Network and certain transactions processed by PULSE and Diners Club. See Note 18:Commitments, Contingencies and Guarantees to our consolidated financial statements for further discussion regarding our guarantees.
- 71 -
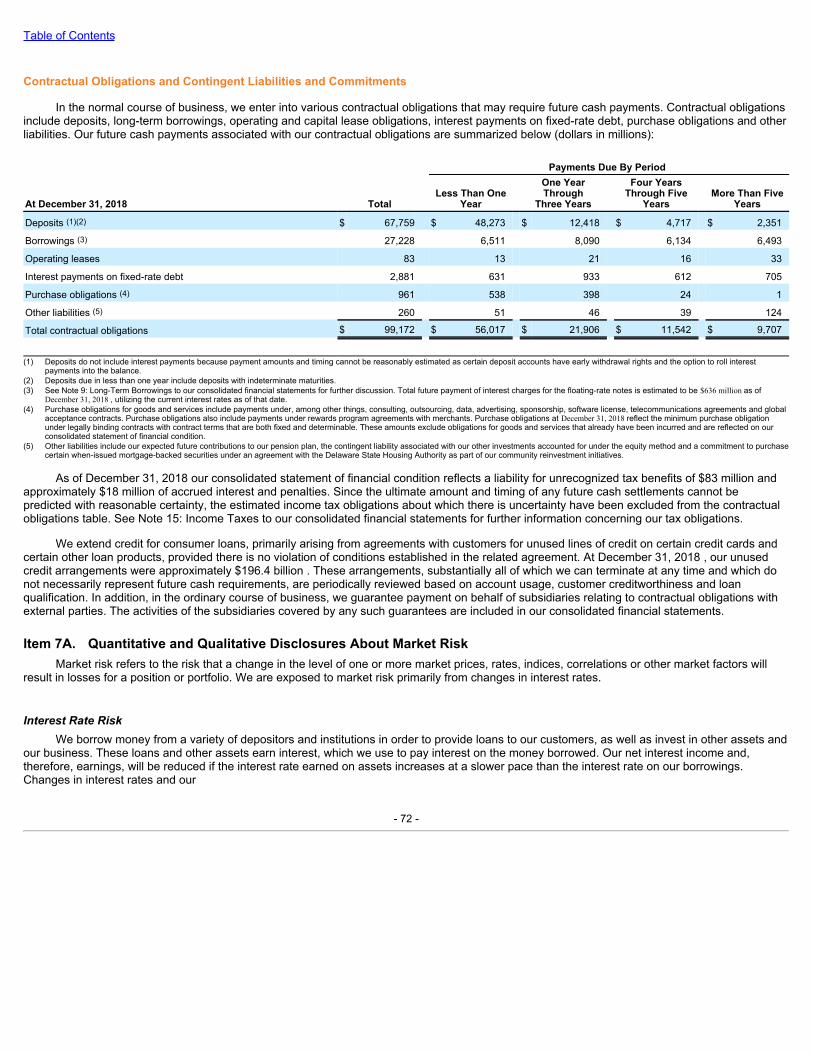
Table of Contents
Contractual Obligations and Contingent Liabilities and Commitments
In the normal course of business, we enter into various contractual obligations that may require future cash payments. Contractual obligationsinclude deposits, long-term borrowings, operating and capital lease obligations, interest payments on fixed-rate debt, purchase obligations and otherliabilities. Our future cash payments associated with our contractual obligations are summarized below (dollars in millions):
Payments Due By Period
At December 31, 2018 Total Less Than One
Year
One YearThrough
Three Years
Four YearsThrough Five
Years More Than Five
Years
Deposits (1)(2) $ 67,759 $ 48,273 $ 12,418 $ 4,717 $ 2,351
Borrowings (3) 27,228 6,511 8,090 6,134 6,493
Operating leases 83 13 21 16 33
Interest payments on fixed-rate debt 2,881 631 933 612 705
Purchase obligations (4) 961 538 398 24 1
Other liabilities (5) 260 51 46 39 124
Total contractual obligations $ 99,172 $ 56,017 $ 21,906 $ 11,542 $ 9,707
(1) Deposits do not include interest payments because payment amounts and timing cannot be reasonably estimated as certain deposit accounts have early withdrawal rights and the option to roll interest
payments into the balance.(2) Deposits due in less than one year include deposits with indeterminate maturities.(3) See Note 9: Long-Term Borrowings to our consolidated financial statements for further discussion. Total future payment of interest charges for the floating-rate notes is estimated to be $636 million as of
December 31, 2018 , utilizing the current interest rates as of that date.(4) Purchase obligations for goods and services include payments under, among other things, consulting, outsourcing, data, advertising, sponsorship, software license, telecommunications agreements and global
acceptance contracts. Purchase obligations also include payments under rewards program agreements with merchants. Purchase obligations at December 31, 2018 reflect the minimum purchase obligationunder legally binding contracts with contract terms that are both fixed and determinable. These amounts exclude obligations for goods and services that already have been incurred and are reflected on ourconsolidated statement of financial condition.
(5) Other liabilities include our expected future contributions to our pension plan, the contingent liability associated with our other investments accounted for under the equity method and a commitment to purchasecertain when-issued mortgage-backed securities under an agreement with the Delaware State Housing Authority as part of our community reinvestment initiatives.
As of December 31, 2018 our consolidated statement of financial condition reflects a liability for unrecognized tax benefits of $83 million andapproximately $18 million of accrued interest and penalties. Since the ultimate amount and timing of any future cash settlements cannot bepredicted with reasonable certainty, the estimated income tax obligations about which there is uncertainty have been excluded from the contractualobligations table. See Note 15: Income Taxes to our consolidated financial statements for further information concerning our tax obligations.
We extend credit for consumer loans, primarily arising from agreements with customers for unused lines of credit on certain credit cards andcertain other loan products, provided there is no violation of conditions established in the related agreement. At December 31, 2018 , our unusedcredit arrangements were approximately $196.4 billion . These arrangements, substantially all of which we can terminate at any time and which donot necessarily represent future cash requirements, are periodically reviewed based on account usage, customer creditworthiness and loanqualification. In addition, in the ordinary course of business, we guarantee payment on behalf of subsidiaries relating to contractual obligations withexternal parties. The activities of the subsidiaries covered by any such guarantees are included in our consolidated financial statements.
Item 7A. Quantitative and Qualitative Disclosures About Market RiskMarket risk refers to the risk that a change in the level of one or more market prices, rates, indices, correlations or other market factors will
result in losses for a position or portfolio. We are exposed to market risk primarily from changes in interest rates.
InterestRateRiskWe borrow money from a variety of depositors and institutions in order to provide loans to our customers, as well as invest in other assets and
our business. These loans and other assets earn interest, which we use to pay interest on the money borrowed. Our net interest income and,therefore, earnings, will be reduced if the interest rate earned on assets increases at a slower pace than the interest rate on our borrowings.Changes in interest rates and our
- 72 -
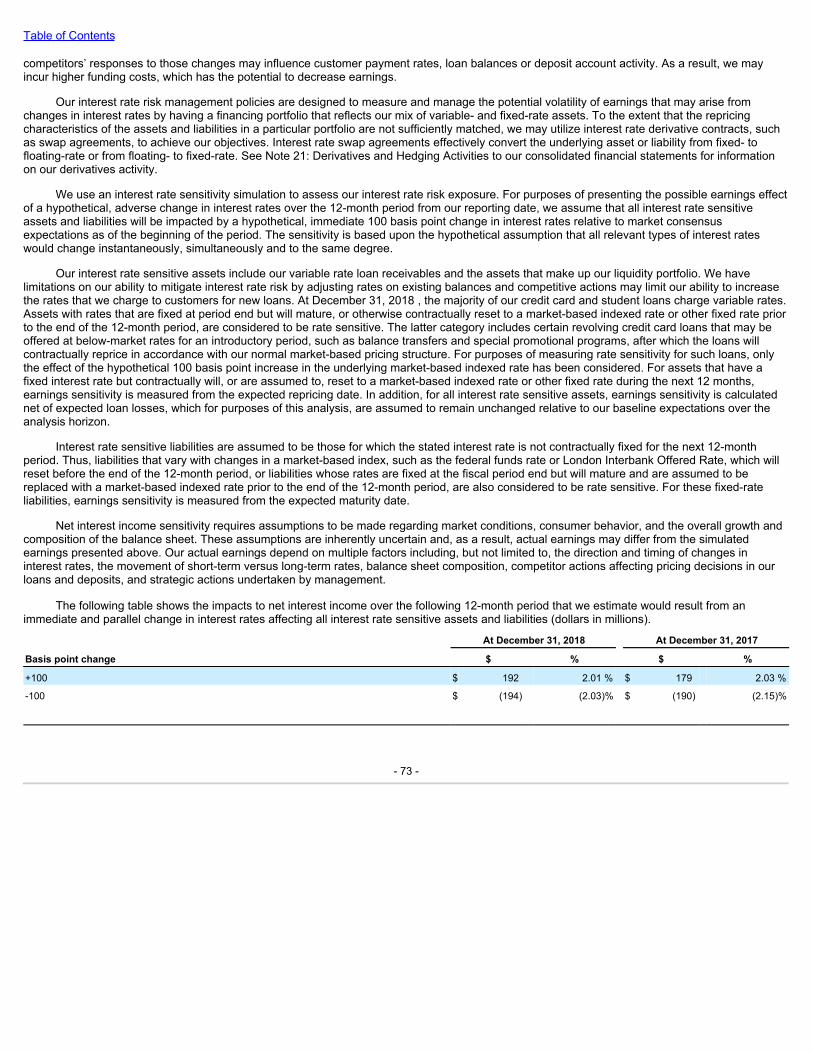
Table of Contents
competitors’ responses to those changes may influence customer payment rates, loan balances or deposit account activity. As a result, we mayincur higher funding costs, which has the potential to decrease earnings.
Our interest rate risk management policies are designed to measure and manage the potential volatility of earnings that may arise fromchanges in interest rates by having a financing portfolio that reflects our mix of variable- and fixed-rate assets. To the extent that the repricingcharacteristics of the assets and liabilities in a particular portfolio are not sufficiently matched, we may utilize interest rate derivative contracts, suchas swap agreements, to achieve our objectives. Interest rate swap agreements effectively convert the underlying asset or liability from fixed- tofloating-rate or from floating- to fixed-rate. See Note 21: Derivatives and Hedging Activities to our consolidated financial statements for informationon our derivatives activity.
We use an interest rate sensitivity simulation to assess our interest rate risk exposure. For purposes of presenting the possible earnings effectof a hypothetical, adverse change in interest rates over the 12-month period from our reporting date, we assume that all interest rate sensitiveassets and liabilities will be impacted by a hypothetical, immediate 100 basis point change in interest rates relative to market consensusexpectations as of the beginning of the period. The sensitivity is based upon the hypothetical assumption that all relevant types of interest rateswould change instantaneously, simultaneously and to the same degree.
Our interest rate sensitive assets include our variable rate loan receivables and the assets that make up our liquidity portfolio. We havelimitations on our ability to mitigate interest rate risk by adjusting rates on existing balances and competitive actions may limit our ability to increasethe rates that we charge to customers for new loans. At December 31, 2018 , the majority of our credit card and student loans charge variable rates.Assets with rates that are fixed at period end but will mature, or otherwise contractually reset to a market-based indexed rate or other fixed rate priorto the end of the 12-month period, are considered to be rate sensitive. The latter category includes certain revolving credit card loans that may beoffered at below-market rates for an introductory period, such as balance transfers and special promotional programs, after which the loans willcontractually reprice in accordance with our normal market-based pricing structure. For purposes of measuring rate sensitivity for such loans, onlythe effect of the hypothetical 100 basis point increase in the underlying market-based indexed rate has been considered. For assets that have afixed interest rate but contractually will, or are assumed to, reset to a market-based indexed rate or other fixed rate during the next 12 months,earnings sensitivity is measured from the expected repricing date. In addition, for all interest rate sensitive assets, earnings sensitivity is calculatednet of expected loan losses, which for purposes of this analysis, are assumed to remain unchanged relative to our baseline expectations over theanalysis horizon.
Interest rate sensitive liabilities are assumed to be those for which the stated interest rate is not contractually fixed for the next 12-monthperiod. Thus, liabilities that vary with changes in a market-based index, such as the federal funds rate or London Interbank Offered Rate, which willreset before the end of the 12-month period, or liabilities whose rates are fixed at the fiscal period end but will mature and are assumed to bereplaced with a market-based indexed rate prior to the end of the 12-month period, are also considered to be rate sensitive. For these fixed-rateliabilities, earnings sensitivity is measured from the expected maturity date.
Net interest income sensitivity requires assumptions to be made regarding market conditions, consumer behavior, and the overall growth andcomposition of the balance sheet. These assumptions are inherently uncertain and, as a result, actual earnings may differ from the simulatedearnings presented above. Our actual earnings depend on multiple factors including, but not limited to, the direction and timing of changes ininterest rates, the movement of short-term versus long-term rates, balance sheet composition, competitor actions affecting pricing decisions in ourloans and deposits, and strategic actions undertaken by management.
The following table shows the impacts to net interest income over the following 12-month period that we estimate would result from animmediate and parallel change in interest rates affecting all interest rate sensitive assets and liabilities (dollars in millions). At December 31, 2018 At December 31, 2017
Basis point change $ % $ %
+100 $ 192 2.01 % $ 179 2.03 %
-100 $ (194) (2.03)% $ (190) (2.15)%
- 73 -
Table of Contents
Item 8. Financial Statements and Supplementary Data
REPORT OF INDEPENDENT REGISTERED PUBLIC ACCOUNTING FIRM
To the Board of Directors and Stockholders ofDiscover Financial ServicesRiverwoods, IL
Opinion on Internal Control over Financial Reporting
We have audited the internal control over financial reporting of Discover Financial Services (the “Company”) as of December 31, 2018 , based onthe criteria established in InternalControl—IntegratedFramework(2013)issued by the Committee of Sponsoring Organizations of the TreadwayCommission (“COSO”). In our opinion, the Company maintained, in all material respects, effective internal control over financial reporting as ofDecember 31, 2018 , based on criteria established in InternalControl-IntegratedFramework(2013)issued by COSO.We have also audited, in accordance with the standards of the Public Company Accounting Oversight Board (United States) (“PCAOB”), theconsolidated statement of financial condition, and the related consolidated statements of income, comprehensive income, changes in stockholders’equity, and cash flows as of and for the year ended December 31, 2018 of the Company and our report dated February 20, 2019 expressed anunqualified opinion on those financial statements.
Basis for Opinion
The Company’s management is responsible for maintaining effective internal control over financial reporting and for its assessment of theeffectiveness of internal control over financial reporting, included in the accompanying Management’s Annual Report on Internal Control overFinancial Reporting. Our responsibility is to express an opinion on the Company’s internal control over financial reporting based on our audit. We area public accounting firm registered with the PCAOB and are required to be independent with respect to the Company in accordance with the U.S.federal securities laws and the applicable rules and regulations of the Securities and Exchange Commission and the PCAOB.We conducted our audit in accordance with the standards of the PCAOB. Those standards require that we plan and perform the audit to obtainreasonable assurance about whether effective internal control over financial reporting was maintained in all material respects. Our audit includedobtaining an understanding of internal control over financial reporting, assessing the risk that a material weakness exists, testing and evaluating thedesign and operating effectiveness of internal control based on the assessed risk, and performing such other procedures as we considerednecessary in the circumstances. We believe that our audit provides a reasonable basis for our opinion.
Definition and Limitations of Internal Control over Financial Reporting
A company’s internal control over financial reporting is a process designed to provide reasonable assurance regarding the reliability of financialreporting and the preparation of financial statements for external purposes in accordance with generally accepted accounting principles. Acompany’s internal control over financial reporting includes those policies and procedures that (1) pertain to the maintenance of records that, inreasonable detail, accurately and fairly reflect the transactions and dispositions of the assets of the company; (2) provide reasonable assurance thattransactions are recorded as necessary to permit preparation of financial statements in accordance with generally accepted accounting principles,and that receipts and expenditures of the company are being made only in accordance with authorizations of management and directors of thecompany; and (3) provide reasonable assurance regarding prevention or timely detection of unauthorized acquisition, use, or disposition of thecompany’s assets that could have a material effect on the financial statements.Because of its inherent limitations, internal control over financial reporting may not prevent or detect misstatements. Also, projections of anyevaluation of effectiveness to future periods are subject to the risk that controls may become inadequate because of changes in conditions, or thatthe degree of compliance with the policies or procedures may deteriorate.
/s/ D ELOITTE & T OUCHE LLP
Chicago, Illinois February 20, 2019
- 74 -

Table of Contents
REPORT OF INDEPENDENT REGISTERED PUBLIC ACCOUNTING FIRM
To the Board of Directors and Stockholders ofDiscover Financial ServicesRiverwoods, IL
Opinion on the Financial Statements
We have audited the accompanying consolidated statements of financial condition of Discover Financial Services (the “Company”) as of December31, 2018 and 2017 , the related consolidated statements of income, comprehensive income, stockholders’ equity, and cash flows, for each of thethree years in the period ended December 31, 2018 , and the related notes (collectively referred to as the “financial statements”). In our opinion, thefinancial statements present fairly, in all material respects, the financial position of the Company as of December 31, 2018 and 2017 , and theresults of its operations and its cash flows for each of the three years in the period ended December 31, 2018 , in conformity with accountingprinciples generally accepted in the United States of America.
We have also audited, in accordance with the standards of the Public Company Accounting Oversight Board (United States) (“PCAOB”), theCompany’s internal control over financial reporting as of December 31, 2018 , based on the criteria established in InternalControl—IntegratedFramework(2013)issued by the Committee of Sponsoring Organizations of the Treadway Commission and our report dated February 20, 2019expressed an unqualified opinion on the Company’s internal control over financial reporting.
Basis for Opinion
These financial statements are the responsibility of the Company’s management. Our responsibility is to express an opinion on the Company’sfinancial statements based on our audits. We are a public accounting firm registered with the PCAOB and are required to be independent withrespect to the Company in accordance with the U.S. federal securities laws and the applicable rules and regulations of the Securities and ExchangeCommission and the PCAOB.
We conducted our audits in accordance with the standards of the PCAOB. Those standards require that we plan and perform the audit to obtainreasonable assurance about whether the financial statements are free of material misstatement, whether due to error or fraud. Our audits includedperforming procedures to assess the risks of material misstatement of the financial statements, whether due to error or fraud, and performingprocedures that respond to those risks. Such procedures included examining, on a test basis, evidence regarding the amounts and disclosures inthe financial statements. Our audits also included evaluating the accounting principles used and significant estimates made by management, as wellas evaluating the overall presentation of the financial statements. We believe that our audits provide a reasonable basis for our opinion.
/s/ D ELOITTE & T OUCHE LLP
Chicago, Illinois February 20, 2019
We have served as the Company’s auditor since the spin-off from its former parent company in 2007 and as Discover Bank’s (a wholly-ownedsubsidiary of the Company) auditor since 1985.
- 75 -
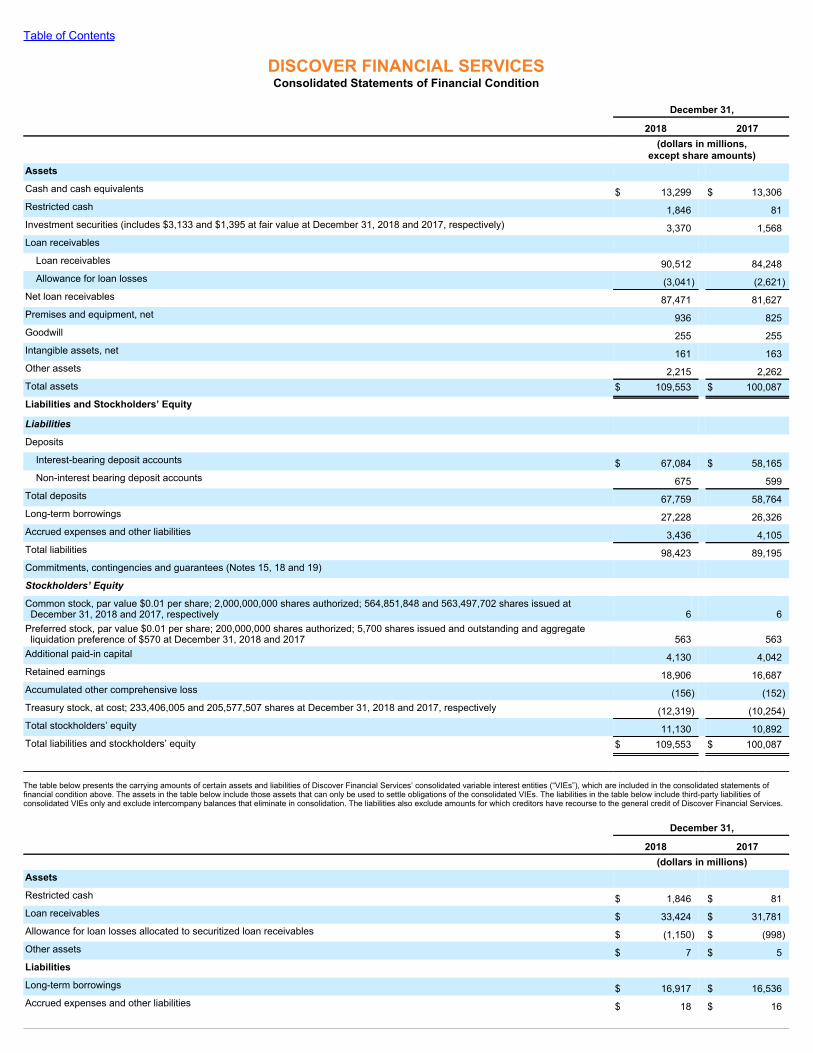
Table of Contents
DISCOVER FINANCIAL SERVICESConsolidated Statements of Financial Condition
December 31, 2018 2017
(dollars in millions,
except share amounts)Assets Cash and cash equivalents $ 13,299 $ 13,306Restricted cash 1,846 81Investment securities (includes $3,133 and $1,395 at fair value at December 31, 2018 and 2017, respectively) 3,370 1,568Loan receivables
Loan receivables 90,512 84,248Allowance for loan losses (3,041) (2,621)
Net loan receivables 87,471 81,627Premises and equipment, net 936 825Goodwill 255 255Intangible assets, net 161 163Other assets 2,215 2,262Total assets $ 109,553 $ 100,087
Liabilities and Stockholders’ Equity Liabilities Deposits
Interest-bearing deposit accounts $ 67,084 $ 58,165Non-interest bearing deposit accounts 675 599
Total deposits 67,759 58,764Long-term borrowings 27,228 26,326Accrued expenses and other liabilities 3,436 4,105Total liabilities 98,423 89,195Commitments, contingencies and guarantees (Notes 15, 18 and 19) Stockholders’Equity Common stock, par value $0.01 per share; 2,000,000,000 shares authorized; 564,851,848 and 563,497,702 shares issued atDecember 31, 2018 and 2017, respectively 6 6
Preferred stock, par value $0.01 per share; 200,000,000 shares authorized; 5,700 shares issued and outstanding and aggregateliquidation preference of $570 at December 31, 2018 and 2017 563 563
Additional paid-in capital 4,130 4,042Retained earnings 18,906 16,687Accumulated other comprehensive loss (156) (152)Treasury stock, at cost; 233,406,005 and 205,577,507 shares at December 31, 2018 and 2017, respectively (12,319) (10,254)Total stockholders’ equity 11,130 10,892Total liabilities and stockholders’ equity $ 109,553 $ 100,087
The table below presents the carrying amounts of certain assets and liabilities of Discover Financial Services’ consolidated variable interest entities (“VIEs”), which are included in the consolidated statements offinancial condition above. The assets in the table below include those assets that can only be used to settle obligations of the consolidated VIEs. The liabilities in the table below include third-party liabilities ofconsolidated VIEs only and exclude intercompany balances that eliminate in consolidation. The liabilities also exclude amounts for which creditors have recourse to the general credit of Discover Financial Services.
December 31, 2018 2017 (dollars in millions)Assets Restricted cash $ 1,846 $ 81Loan receivables $ 33,424 $ 31,781Allowance for loan losses allocated to securitized loan receivables $ (1,150) $ (998)Other assets $ 7 $ 5Liabilities Long-term borrowings $ 16,917 $ 16,536Accrued expenses and other liabilities $ 18 $ 16

See Notes to the Consolidated Financial Statements.
- 76 -
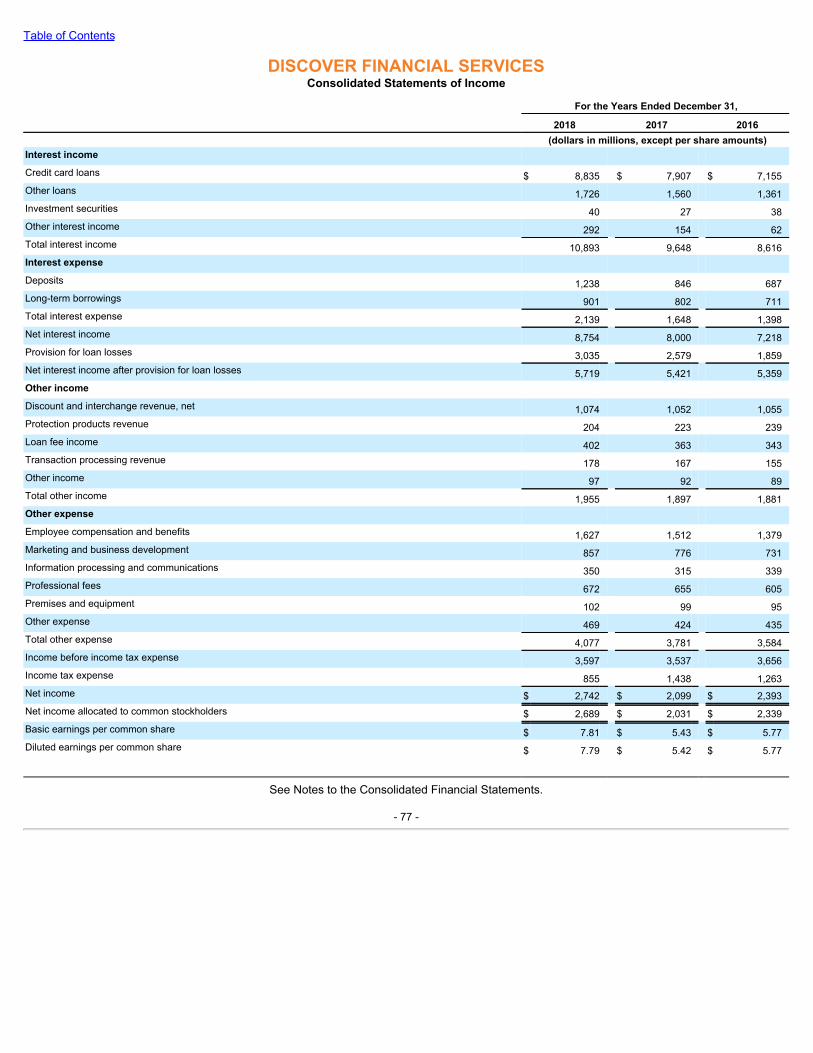
Table of Contents
DISCOVER FINANCIAL SERVICESConsolidated Statements of Income
For the Years Ended December 31,
2018 2017 2016 (dollars in millions, except per share amounts)Interest income Credit card loans $ 8,835 $ 7,907 $ 7,155Other loans 1,726 1,560 1,361Investment securities 40 27 38Other interest income 292 154 62Total interest income 10,893 9,648 8,616Interest expense Deposits 1,238 846 687Long-term borrowings 901 802 711Total interest expense 2,139 1,648 1,398Net interest income 8,754 8,000 7,218Provision for loan losses 3,035 2,579 1,859Net interest income after provision for loan losses 5,719 5,421 5,359Other income Discount and interchange revenue, net 1,074 1,052 1,055Protection products revenue 204 223 239Loan fee income 402 363 343Transaction processing revenue 178 167 155Other income 97 92 89Total other income 1,955 1,897 1,881Other expense Employee compensation and benefits 1,627 1,512 1,379Marketing and business development 857 776 731Information processing and communications 350 315 339Professional fees 672 655 605Premises and equipment 102 99 95Other expense 469 424 435Total other expense 4,077 3,781 3,584Income before income tax expense 3,597 3,537 3,656Income tax expense 855 1,438 1,263Net income $ 2,742 $ 2,099 $ 2,393Net income allocated to common stockholders $ 2,689 $ 2,031 $ 2,339Basic earnings per common share $ 7.81 $ 5.43 $ 5.77Diluted earnings per common share $ 7.79 $ 5.42 $ 5.77
See Notes to the Consolidated Financial Statements.
- 77 -
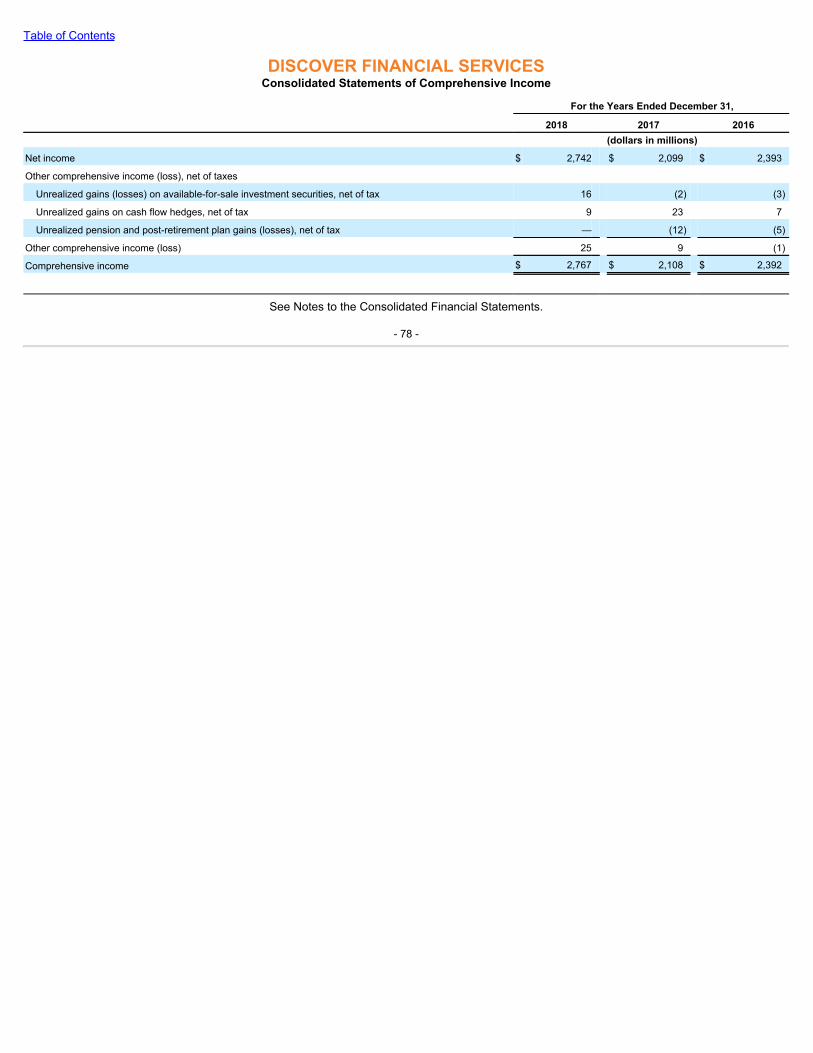
Table of Contents
DISCOVER FINANCIAL SERVICESConsolidated Statements of Comprehensive Income
For the Years Ended December 31,
2018 2017 2016 (dollars in millions)
Net income $ 2,742 $ 2,099 $ 2,393
Other comprehensive income (loss), net of taxes
Unrealized gains (losses) on available-for-sale investment securities, net of tax 16 (2) (3)
Unrealized gains on cash flow hedges, net of tax 9 23 7
Unrealized pension and post-retirement plan gains (losses), net of tax — (12) (5)
Other comprehensive income (loss) 25 9 (1)
Comprehensive income $ 2,767 $ 2,108 $ 2,392
See Notes to the Consolidated Financial Statements.
- 78 -
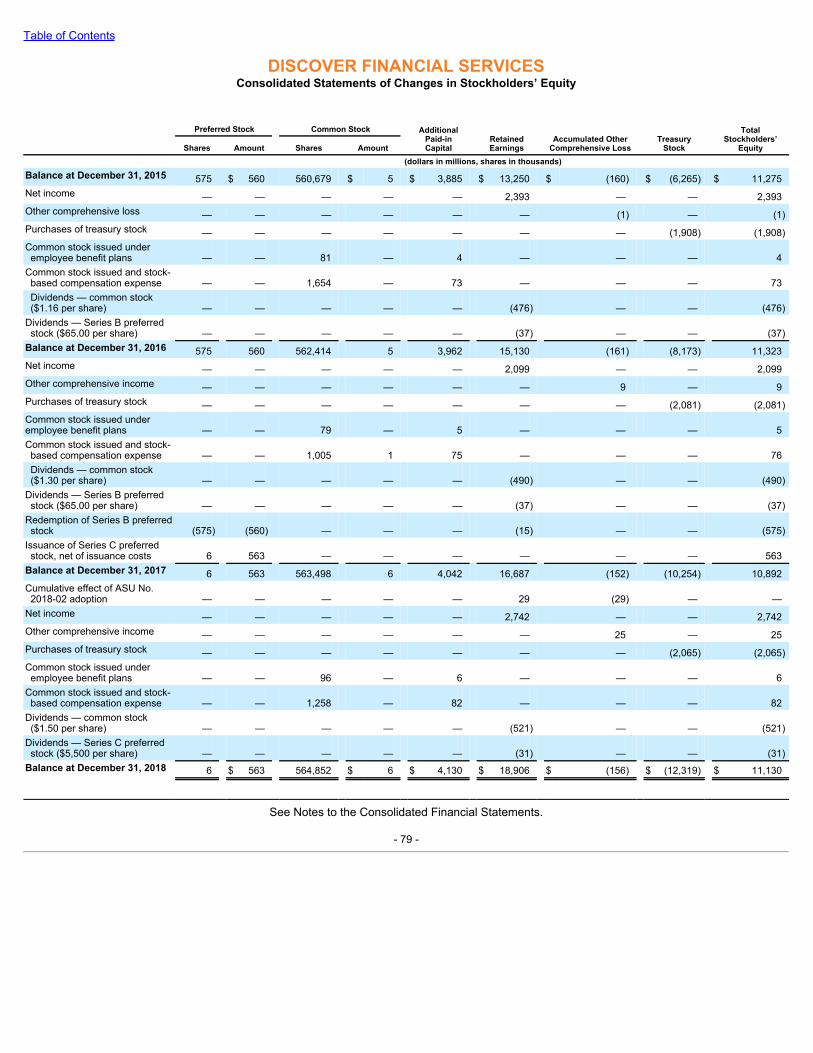
Table of Contents
DISCOVER FINANCIAL SERVICESConsolidated Statements of Changes in Stockholders’ Equity
Preferred Stock
Common Stock
AdditionalPaid-inCapital
RetainedEarnings
Accumulated OtherComprehensive Loss
TreasuryStock
TotalStockholders’
Equity
Shares Amount Shares Amount (dollars in millions, shares in thousands)Balance at December 31, 2015 575 $ 560 560,679 $ 5 $ 3,885 $ 13,250 $ (160) $ (6,265) $ 11,275Net income — — — — — 2,393 — — 2,393Other comprehensive loss — — — — — — (1) — (1)Purchases of treasury stock — — — — — — — (1,908) (1,908)Common stock issued underemployee benefit plans — — 81 — 4 — — — 4
Common stock issued and stock-based compensation expense — — 1,654 — 73 — — — 73Dividends — common stock($1.16 per share) — — — — — (476) — — (476)
Dividends — Series B preferredstock ($65.00 per share) — — — — — (37) — — (37)
Balance at December 31, 2016 575 560 562,414 5 3,962 15,130 (161) (8,173) 11,323Net income — — — — — 2,099 — — 2,099Other comprehensive income — — — — — — 9 — 9Purchases of treasury stock — — — — — — — (2,081) (2,081)Common stock issued underemployee benefit plans — — 79 — 5 — — — 5Common stock issued and stock-based compensation expense — — 1,005 1 75 — — — 76Dividends — common stock($1.30 per share) — — — — — (490) — — (490)
Dividends — Series B preferredstock ($65.00 per share) — — — — — (37) — — (37)
Redemption of Series B preferredstock (575) (560) — — — (15) — — (575)
Issuance of Series C preferredstock, net of issuance costs 6 563 — — — — — — 563
Balance at December 31, 2017 6 563 563,498 6 4,042 16,687 (152) (10,254) 10,892Cumulative effect of ASU No.2018-02 adoption — — — — — 29 (29) — —
Net income — — — — — 2,742 — — 2,742Other comprehensive income — — — — — — 25 — 25Purchases of treasury stock — — — — — — — (2,065) (2,065)Common stock issued underemployee benefit plans — — 96 — 6 — — — 6
Common stock issued and stock-based compensation expense — — 1,258 — 82 — — — 82
Dividends — common stock($1.50 per share) — — — — — (521) — — (521)
Dividends — Series C preferredstock ($5,500 per share) — — — — — (31) — — (31)
Balance at December 31, 2018 6 $ 563 564,852 $ 6 $ 4,130 $ 18,906 $ (156) $ (12,319) $ 11,130
See Notes to the Consolidated Financial Statements.
- 79 -
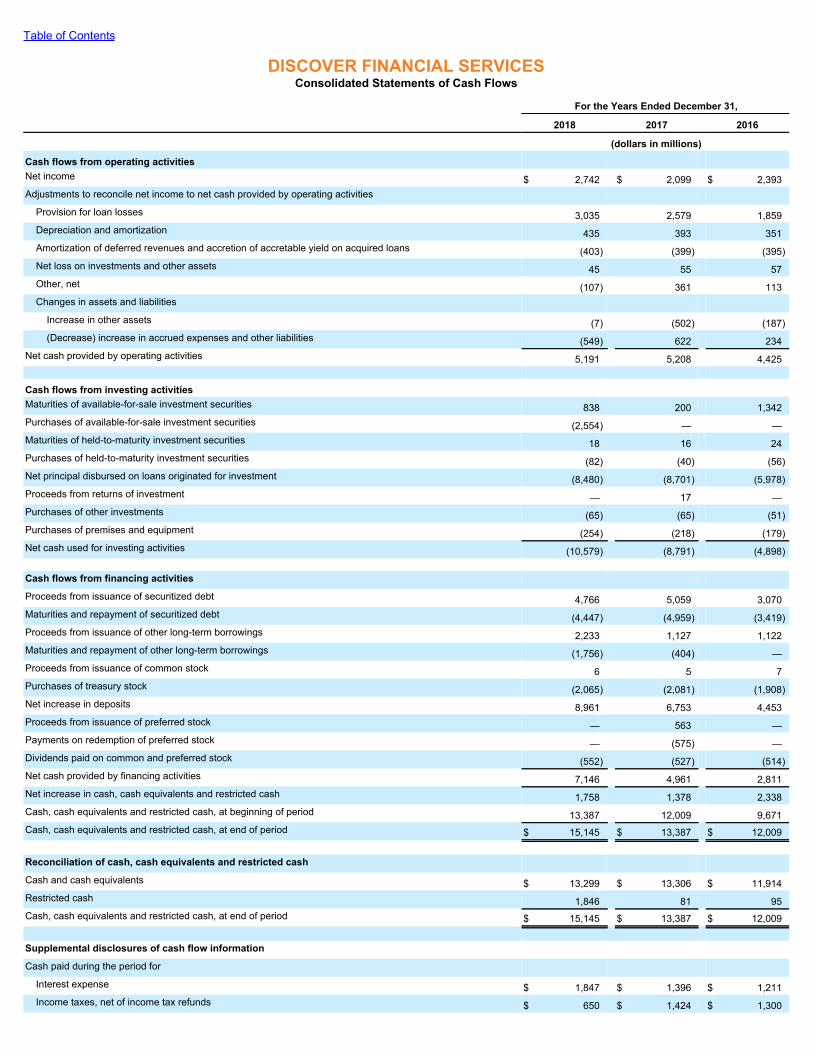
Table of Contents
DISCOVER FINANCIAL SERVICESConsolidated Statements of Cash Flows
For the Years Ended December 31,
2018 2017 2016 (dollars in millions)
Cash flows from operating activities Net income $ 2,742 $ 2,099 $ 2,393Adjustments to reconcile net income to net cash provided by operating activities
Provision for loan losses 3,035 2,579 1,859Depreciation and amortization 435 393 351Amortization of deferred revenues and accretion of accretable yield on acquired loans (403) (399) (395)Net loss on investments and other assets 45 55 57Other, net (107) 361 113Changes in assets and liabilities
Increase in other assets (7) (502) (187)(Decrease) increase in accrued expenses and other liabilities (549) 622 234
Net cash provided by operating activities 5,191 5,208 4,425 Cash flows from investing activities Maturities of available-for-sale investment securities 838 200 1,342Purchases of available-for-sale investment securities (2,554) — —Maturities of held-to-maturity investment securities 18 16 24Purchases of held-to-maturity investment securities (82) (40) (56)Net principal disbursed on loans originated for investment (8,480) (8,701) (5,978)Proceeds from returns of investment — 17 —Purchases of other investments (65) (65) (51)Purchases of premises and equipment (254) (218) (179)Net cash used for investing activities (10,579) (8,791) (4,898) Cash flows from financing activities Proceeds from issuance of securitized debt 4,766 5,059 3,070Maturities and repayment of securitized debt (4,447) (4,959) (3,419)Proceeds from issuance of other long-term borrowings 2,233 1,127 1,122Maturities and repayment of other long-term borrowings (1,756) (404) —Proceeds from issuance of common stock 6 5 7Purchases of treasury stock (2,065) (2,081) (1,908)Net increase in deposits 8,961 6,753 4,453Proceeds from issuance of preferred stock — 563 —Payments on redemption of preferred stock — (575) —Dividends paid on common and preferred stock (552) (527) (514)Net cash provided by financing activities 7,146 4,961 2,811Net increase in cash, cash equivalents and restricted cash 1,758 1,378 2,338Cash, cash equivalents and restricted cash, at beginning of period 13,387 12,009 9,671Cash, cash equivalents and restricted cash, at end of period $ 15,145 $ 13,387 $ 12,009
Reconciliation of cash, cash equivalents and restricted cash Cash and cash equivalents $ 13,299 $ 13,306 $ 11,914Restricted cash 1,846 81 95Cash, cash equivalents and restricted cash, at end of period $ 15,145 $ 13,387 $ 12,009
Supplemental disclosures of cash flow information Cash paid during the period for
Interest expense $ 1,847 $ 1,396 $ 1,211Income taxes, net of income tax refunds $ 650 $ 1,424 $ 1,300

See Notes to the Consolidated Financial Statements.
- 80 -

Table of Contents
Notes to the Consolidated Financial Statements
1. Background and Basis of Presentation
DescriptionofBusinessDiscover Financial Services (“DFS” or the “Company”) is a direct banking and payment services company. The Company is a bank holding
company under the Bank Holding Company Act of 1956 as well as a financial holding company under the Gramm-Leach-Bliley Act and therefore issubject to oversight, regulation and examination by the Board of Governors of the Federal Reserve System (the “Federal Reserve”). The Companyprovides direct banking products and services and payment services through its subsidiaries. The Company offers its customers credit card loans,private student loans, personal loans, home equity loans and deposit products. The Company also operates the Discover Network, the PULSEnetwork (“PULSE”) and Diners Club International (“Diners Club”). The Discover Network processes transactions for Discover-branded credit anddebit cards and provides payment transaction processing and settlement services. PULSE operates an electronic funds transfer network, providingfinancial institutions issuing debit cards on the PULSE network with access to ATMs domestically and internationally, as well as point-of-sale(“POS”) terminals at retail locations throughout the U.S. for debit card transactions. Diners Club is a global payments network of licensees, whichare generally financial institutions, that issue Diners Club branded charge cards and/or provide card acceptance services.
The Company’s business activities are managed in two segments, Direct Banking and Payment Services, based on the products and servicesprovided. For a detailed description of the operations of each segment, as well as the allocation conventions used in business segment reporting,see Note 22: Segment Disclosures.
BasisofPresentationThe accompanying consolidated financial statements have been prepared in accordance with accounting principles generally accepted in the
United States (“GAAP”). The preparation of financial statements in conformity with GAAP requires the Company to make estimates andassumptions that affect the amounts reported in the consolidated financial statements and related disclosures. These estimates are based oninformation available as of the date of the consolidated financial statements. The Company believes that the estimates used in the preparation of theconsolidated financial statements are reasonable. Actual results could differ from these estimates.
PrinciplesofConsolidationThe consolidated financial statements include the accounts of the Company and its wholly-owned subsidiaries. The Company’s policy is to
consolidate all entities in which it owns more than 50% of the outstanding voting stock unless it does not control the entity. However, the Companydid not have a controlling voting interest in any entity other than its wholly-owned subsidiaries in the periods presented in the accompanyingconsolidated financial statements.
It is also the Company’s policy to consolidate any VIE for which the Company is the primary beneficiary, as defined by GAAP. On this basis,the Company consolidates the Discover Card Master Trust I (“DCMT”) and the Discover Card Execution Note Trust (“DCENT”) as well as twostudent loan securitization trusts. The Company is deemed to be the primary beneficiary of each of these trusts since it is, for each, the trust servicerand the holder of both the residual interest and the majority of the most subordinated interests. Because of those involvements, the Company has,for each trust, (i) the power to direct the activities that most significantly impact the economic performance of the trust, and (ii) the obligation (orright) to absorb losses (or receive benefits) of the trust that could potentially be significant. The Company has determined that it was not the primarybeneficiary of any other VIE during the years ended December 31, 2018, 2017 and 2016 .
For investments in any entities in which the Company owns 50% or less of the outstanding voting stock but in which the Company hassignificant influence over operating and financial decisions, the Company applies the equity method of accounting. The Company also applies theequity method to its investments in qualified affordable housing projects and similar tax credit partnerships. In cases where the Company’s equityinvestment is less than 20% and significant influence does not exist, such investments are carried at cost, adjusted for any impairment in value.
RecentlyIssuedAccountingPronouncementsIn February 2018, the Financial Accounting Standards Board (“FASB”) issued Accounting Standards Update (“ASU”) No. 2018-02,
Reclassification of Certain Tax Effects from Accumulated Other Comprehensive Income. The ASU permits, but does not require, issuers toreclassify into retained earnings any tax effects that are stranded in
- 81 -
Table of Contents
accumulated other comprehensive income (“AOCI”) as a result of the change in the statutory federal tax rate enacted by the Tax Cuts and Jobs Actof 2017 (“TCJA”). Tax effects that are stranded in AOCI for other reasons, such as prior changes in tax law or changes in a valuation allowance,may not be reclassified directly through retained earnings. The guidance is effective for fiscal years beginning after December 15, 2018, with earlyadoption permitted. The Company early adopted the ASU as of April 1, 2018, resulting in a reclassification from AOCI to retained earnings that didnot have a material impact to the Company's consolidated financial statements. See Note 13: Accumulated Other Comprehensive Income foradditional details on adoption of this standard. The Company's policy is to adjust the tax effects of a component of AOCI in the same period in whichthe item is sold or otherwise derecognized, or when the carrying value of the item is remeasured.
In January 2017, the FASB issued ASU No. 2017-04, Intangibles—Goodwill and Other (Topic 350): Simplifying the Test for GoodwillImpairment. The purpose of this ASU is to simplify the test for goodwill impairment by eliminating Step 2 of the current impairment test. Under thecurrent rules, if the reporting unit’s carrying value exceeds its fair value (Step 1), goodwill impairment is measured as the difference between thecarrying value of goodwill and its implied fair value. To compute the implied fair value of goodwill under Step 2, an entity has to perform proceduresto determine the fair value at the impairment testing date of its assets and liabilities (including unrecognized assets and liabilities) following theprocedure that would be required in determining the fair value of assets acquired and liabilities assumed in a business combination. Under the newstandard, the Company will perform its annual goodwill impairment test by comparing the fair value of a reporting unit with its carrying amount. TheCompany should recognize an impairment charge, if any, for the amount by which the carrying amount exceeds the reporting unit’s fair value;however, the loss recognized should not exceed the total amount of goodwill allocated to that reporting unit. The amendments in this ASU apply tothe Company’s annual or any interim goodwill impairment tests in fiscal years beginning after December 15, 2019. Early adoption is permitted forinterim or annual goodwill impairment tests performed on testing dates after January 1, 2017. The amendments in this ASU apply on a prospectivebasis. All of the Company’s recorded goodwill is associated with its PULSE debit business. The Company elected to early adopt this ASU effectivewith its goodwill impairment test as of October 1, 2018. This ASU has no impact on cash flows and its adoption did not have any impact on theCompany’s consolidated financial condition or results of operations because the estimated fair value of the PULSE reporting unit is well in excess ofits carrying value.
In June 2016, the FASB issued ASU No. 2016-13, Financial Instruments-Credit Losses (Topic 326): Measurement of Credit Losses onFinancial Instruments. This ASU replaces the incurred loss model with the current expected credit loss (“CECL”) approach. For loans carried atamortized cost, the allowance for loan losses will be based on management’s current estimate of all expected credit losses over the remainingcontractual term of the loans. Upon the origination of a loan, the Company will have to record its estimate of all expected credit losses on that loanthrough an immediate charge to earnings. Updates to that estimate each period will be recorded through provision expense. The CECL estimate isto be based on historical experience, current conditions and reasonable and supportable forecasts.
The CECL approach is expected to increase the Company’s allowance for loan losses as a result of: (1) encompassing expected losses, notsimply those deemed to be already incurred, (2) extending the loss estimate period over the entire life of the loan and (3) reclassification of the creditloss component of the purchased credit-impaired (“PCI”) loan portfolio out of loan carrying value and into the allowance for loan losses. Theallowance for loan losses on all loans carried at amortized cost, including PCI loans and loans modified in a troubled debt restructuring (“TDR”) willbe measured under the CECL approach. Existing specialized measurement guidance for PCI loans, which the ASU refers to as purchased credit-deteriorated (“PCD”), and TDRs will be eliminated, although certain separate disclosure guidance will be retained. Measurement of credit impairmentof available-for-sale debt securities will generally remain unchanged under the new rules, but any such impairment will be recorded through anallowance, rather than a direct write-down of the security.
The ASU is effective for the Company on January 1, 2020. A cross-functional governance structure is in place to oversee the implementationof the standard. The Company is finalizing the development of loss forecasting models, technological solutions and processes to satisfy therequirements of the new standard. Management is evaluating key accounting interpretations and the time period over which losses can bereasonably estimated. Upon adoption, the allowance for loan losses is expected to increase with an offsetting adjustment to retained earnings.Additionally, the carrying value of PCD loans will be increased through an offsetting addition to the allowance for loan losses. Adoption of thestandard has the potential to materially impact stockholders’ equity and regulatory capital as well as the Company’s consolidated financial conditionand results of operations. The extent of the impact upon adoption will likely depend on the characteristics of the Company's loan portfolio andeconomic conditions at that date, as well as forecasted conditions thereafter.
- 82 -

Table of Contents
In March 2016, the FASB issued ASU No. 2016-08, Principal versus Agent Considerations (Reporting Revenue Gross versus Net). Thisguidance became effective for the Company on January 1, 2018, along with ASU 2014-09, Revenue from Contracts with Customers (Topic 606),discussed below. This ASU did not result in a change to the accounting or reporting of the Company's revenue arrangements that involve aprincipal-agent relationship. Therefore, its adoption has had no impact on the Company's consolidated financial condition, results of operations orcash flows. The guidance in this ASU provides clarification on the principal versus agent concept in relation to revenue recognition guidance issuedas part of ASU 2014-09. Topic 606 requires a company to determine whether it is a principal or an agent in a transaction in which another party isinvolved in providing goods or services to a customer by evaluating the nature of its promise to the customer. ASU 2016-08 provides clarification foridentifying the good, service or right being transferred in a revenue transaction and identifies the principal as the party that controls the good, serviceor right prior to its transfer to the customer. The ASU provides further clarity on how to evaluate control in this context.
In February 2016, the FASB issued ASU No. 2016-02, Leases (Topic 842). The guidance will require lessees to capitalize most leases ontheir balance sheet whereas under current GAAP only capital leases are recognized on the lessee’s balance sheet. Leases which today areidentified as capital leases will generally be identified as financing leases under the new guidance but otherwise their accounting treatment willremain relatively unchanged. Leases identified today as operating leases will generally remain in that category under the new standard, but both aright-of-use asset and a liability for remaining lease payments will now be required to be recognized on the balance sheet for this type of lease. Themanner in which expenses associated with all leases are reported on the income statement will remain mostly unchanged. Lessor accounting alsoremains substantially unchanged by the new standard. The new guidance is effective on January 1, 2019 and the Company is prepared toimplement the standard. The Company will recognize a cumulative-effect adjustment to the opening balance of retained earnings as of the effectivedate without adjusting comparative periods. Management has determined that the standard will not have a material impact on the Company’sconsolidated financial statements.
In May 2014, the FASB issued ASU No. 2014-09, Revenue from Contracts with Customers (Topic 606). The guidance in this ASU supersedesexisting revenue recognition requirements in Topic 605, Revenue Recognition, including an assortment of transaction-specific and industry-specificrules. The new revenue recognition model became effective for the Company on January 1, 2018. The model generally results in the same revenuerecognition patterns as have historically been applied to the Company’s revenues that are subject to this guidance. The timing and measurement offee revenues associated with the Company’s credit card arrangements and costs associated with the Company’s credit card reward programs havenot been affected as a result of the adoption of Accounting Standards Codification ("ASC") Topic 606. Accounting and reporting for the Company’stransaction processing services, including discount and interchange revenue and other transaction processing fees, remains substantiallyunchanged from treatments under GAAP in effect prior to 2018. As permitted by the ASU, management elected to adopt this standard using amodified retrospective approach, which means that the cumulative effect of initially applying the standard was recognized at the date of initialapplication through an adjustment to beginning retained earnings, but no restatement of prior periods was made. Based on its evaluations,management concluded that no adjustment to beginning retained earnings was required as of January 1, 2018, the date of adoption. See Note 23:Revenue from Contracts with Customers for additional information resulting from this standard.
2.Summary of Significant Accounting Policies
CashandCashEquivalentsCash and cash equivalents is defined by the Company as cash on deposit with banks, including time deposits and other highly liquid
investments, with maturities of 90 days or less when purchased. Cash and cash equivalents included $728 million and $1.3 billion of cash and duefrom banks and $12.6 billion and $12.0 billion of interest-earning deposits at other banks at December 31, 2018 and 2017 , respectively.
RestrictedCashRestricted cash includes cash for which the Company’s ability to withdraw funds at any time is contractually limited. Restricted cash is
generally designated for specific purposes arising out of certain contractual or other obligations.
InvestmentSecuritiesAt December 31, 2018 , investment securities consisted of U.S. Treasury obligations and mortgage-backed securities issued by government
agencies. Investment securities that the Company has the positive intent and ability to
- 83 -

Table of Contents
hold to maturity are classified as held-to-maturity and are reported at amortized cost. All other investment securities are classified as available-for-sale, as the Company does not hold investment securities for trading purposes. Available-for-sale investment securities are reported at fair valuewith unrealized gains and losses, net of tax, reported as a component of AOCI included in stockholders’ equity. The Company estimates the fairvalue of available-for-sale investment securities as more fully discussed in Note 20: Fair Value Measurements. The amortized cost for each held-to-maturity and available-for-sale investment security is adjusted for amortization of premiums or accretion of discounts, as appropriate. Suchamortization or accretion is included in interest income. The Company evaluates its unrealized loss positions for other-than-temporary impairment inaccordance with GAAP applicable for investments in debt securities. Realized gains and losses and the credit loss portion of other-than-temporaryimpairments related to investment securities are determined at the individual security level and are reported in other income.
LoanReceivablesLoan receivables consist of credit card receivables, other loans and PCI loans. Loan receivables also include unamortized net deferred loan
origination fees and costs (also see “— Significant Revenue Recognition Accounting Policies — Loan Interest and Fee Income”). Credit card loanreceivables are reported at their principal amounts outstanding and include uncollected billed interest and fees and are reduced for unearnedrevenue related to balance transfer fees (also see “— Significant Revenue Recognition Accounting Policies — Loan Interest and Fee Income”).Other loans consist of student loans, personal loans and other loans and are reported at their principal amounts outstanding. For student loans,principal amounts outstanding also include accrued interest that has been capitalized. The Company’s loan receivables are deemed to be held forinvestment at origination or acquisition because management has the intent and ability to hold them for the foreseeable future. Cash flowsassociated with loans originated or acquired for investment are classified as cash flows from investing activities, regardless of a subsequent changein intent.
PurchasedCredit-ImpairedLoansPCI loans are loans acquired at prices that reflected a discount related to deterioration in individual loan credit quality since origination. The
Company’s PCI loans are comprised entirely of acquired private student loans.
The PCI student loans were aggregated into pools based on common risk characteristics at the time of their acquisition. Loans were groupedprimarily on the basis of origination date as loans originated in a particular year generally reflect the application of common origination strategiesand/or underwriting criteria. Each pool is accounted for as a single asset and each has a single composite interest rate, total contractual cash flowsand total expected cash flows.
Interest income on PCI loans is recognized on the basis of expected cash flows rather than contractual cash flows. The total amount ofinterest income recognizable on a pool of PCI loans (i.e., its accretable yield) is the difference between the carrying amount of the loan pool and thefuture cash flows expected to be collected without regard to whether the expected cash flows represent principal or interest collections. Interest isrecognized on an effective yield basis over the life of the loan pool.
The initial estimates of the fair value of the PCI student loans included the impact of expected credit losses, and therefore, no allowance forloan losses was recorded as of the purchase dates. The difference between contractually required cash flows and cash flows expected to becollected, as measured at the acquisition dates, is not permitted to be accreted. Charge-offs are absorbed by this non-accretable difference and donot result in a charge to earnings. However, as noted below, a charge to provision expense may be necessary to the extent that expected creditlosses increase after the acquisition date.
The estimate of cash flows expected to be collected is evaluated each reporting period to ensure it reflects management’s latest expectationsof future credit losses and borrower prepayments, and interest rates in effect in the current period. To the extent expected credit losses increaseafter the acquisition dates, the Company will record an allowance for loan losses through the provision for loan losses, which will reduce net income.Changes in expected cash flows related to changes in prepayments or interest rate indices for variable rate loans generally are recordedprospectively as adjustments to interest income.
To the extent that a significant increase in cash flows due to lower expected losses is deemed probable, the Company will first reverse anypreviously established allowance for loan losses and then increase the amount of remaining accretable yield. The increase to yield would berecognized prospectively over the remaining life of the loan pool. An increase in the accretable yield would reduce the remaining non-accretabledifference available to absorb
- 84 -
Table of Contents
subsequent charge-offs. Disposals of loans, which may include sales of loans or receipt of payments in full from the borrower or charge-offs, resultin removal of the loans from their respective pools.
DelinquentLoansandCharge-OffsThe entire balance of an account is contractually past due if the minimum payment is not received by the specified date on the customer’s
billing statement. Delinquency is reported on loans that are 30 days or more past due.
Credit card loans are charged off at the end of the month during which an account becomes 180 days past due. Closed-end consumer loanreceivables are charged off at the end of the month during which an account becomes 120 days contractually past due. Customer bankruptcies andprobate accounts are charged off at the end of the month 60 days following the receipt of notification of the bankruptcy or death, but not later thanthe 180-day or 120-day time frame described above. Receivables associated with alleged or potential fraudulent transactions are adjusted to theirnet realizable value upon receipt of notification of such fraud through a charge to other expense and are subsequently written off at the end of themonth 90 days following notification, but not later than the contractual 180-day or 120-day time frame described above. The Company’s charge-offpolicies are designed to comply with guidelines established by the Federal Financial Institutions Examination Council (“FFIEC”).
The Company’s net charge-offs include the principal amount of loans charged off less principal recoveries and exclude charged-off interestand fees, recoveries of interest and fees and fraud losses.
The practice of re-aging an account also may affect loan delinquencies and charge-offs. A re-age is intended to assist delinquent customerswho have experienced financial difficulties but who demonstrate both an ability and willingness to repay. Accounts meeting specific criteria are re-aged when the Company and the customer agree on a temporary repayment schedule that may include concessionary terms. With re-aging, theoutstanding balance of a delinquent account is returned to a current status. Customers may also qualify for a workout re-age when either a longerterm or permanent hardship exists. The Company’s re-age practices are designed to comply with FFIEC guidelines.
AllowanceforLoanLossesThe Company maintains an allowance for loan losses at a level that is appropriate to absorb probable losses inherent in the loan portfolio. The
estimate of probable incurred losses considers uncollectible principal, interest and fees associated with the Company’s loan receivables. Theallowance is evaluated quarterly for appropriateness and is maintained through an adjustment to the provision for loan losses. Charge-offs ofprincipal amounts of loans outstanding are deducted from the allowance and subsequent recoveries of such amounts increase the allowance.Charge-offs of loan balances representing unpaid interest and fees result in a reversal of interest and fee income, respectively, which is effectively areclassification of provision of loan losses (also see “— Significant Revenue Recognition Accounting Policies — Loan Interest and Fee Income”).
The Company calculates its allowance for loan losses by estimating probable losses separately for classes of the loan portfolio with similarloan characteristics, which generally results in segmenting the portfolio by loan product type.
The Company bases its allowance for loan losses on several analyses that help estimate incurred losses as of the balance sheet date. Whilethe Company’s estimation process includes historical data and analysis, there is a significant amount of judgment applied in selecting inputs andanalyzing the results produced by the models to determine the allowance. For substantially all of its loan receivables, the Company uses a migrationanalysis to estimate the likelihood that a loan will progress through the various stages of delinquency. The Company uses other analyses toestimate losses incurred on non-delinquent and bankrupt accounts. The considerations in these analyses include past and current loanperformance, loan growth and seasoning, current risk management practices, account collection strategies, economic conditions, bankruptcy filings,policy changes and forecasting uncertain ties. Consideration of past and current loan performance includes the post-modification performance ofloans modified in a troubled debt restructuring. F or the majority of its portfolio, the Company estimates its allowance for loan losses on a pooledbasis, which includes loans that are delinquent and/or no longer accruing interest and/or certain loans that have defaulted from a loan modificationprogram.
As part of certain collection strategies, the Company may modify the terms of loans to customers experiencing financial hardship. Temporaryand permanent modifications on credit card and personal loans, as well as temporary modifications on student loans and certain grants of studentloan forbearance are accounted for as troubled debt
- 85 -

Table of Contents
restructurings. The Company considers a modified loan in which a concession has been granted to the borrower to be a troubled debt restructuringbased on the cumulative length of the concession period and credit quality of the borrower.
Loan receivables, other than PCI loans, that have been modified under a troubled debt restructuring are evaluated separately from the poolsof receivables that are subject to the collective analyses described above. Loan receivables modified in a troubled debt restructuring are recorded attheir present values with impairment measured as the difference between the recorded investment in the loan and the discounted present value ofcash flows expected to be collected. Consistent with the Company’s measurement of impairment of modified loans on a pooled basis, the discountrate used for credit card loans in internal programs is the average current annual percentage rate applied to non-impaired credit card loans, whichapproximates what would have applied to the pool of modified loans prior to modification. The discount rate used for credit card loans in externalprograms reflects a rate that is consistent with rates offered to cardmembers not in a program that have similar risk characteristics. For student andpersonal loans, the discount rate used is the average contractual rate prior to modification. Changes in the present value are recorded in theprovision for loan losses. All of the Company’s troubled debt restructurings, which are evaluated collectively on an aggregated (by loan type) basis,have a related allowance for loan losses.
PremisesandEquipment,netPremises and equipment, net, are stated at cost less accumulated depreciation and amortization, which is computed using the straight-line
method over the estimated useful lives of the assets. Buildings are depreciated over a period of 39 years . The costs of improvements arecapitalized and depreciated either over the asset’s estimated useful life, typically ten to fifteen years , or over the remaining term of the lease, whenapplicable. Furniture and fixtures are depreciated over a period of five to ten years . Equipment is depreciated over three to ten years . Maintenanceand repairs are immediately expensed, while the costs of improvements are capitalized.
Purchased software and capitalized costs related to internally developed software are amortized over their useful lives of three to ten years .Costs incurred during the application development stage related to internally developed software are capitalized. Costs are expensed as incurredduring the preliminary project stage and post implementation stage. Once the capitalization criteria as defined in GAAP have been met, externaldirect costs incurred for materials and services used in developing or obtaining internal-use computer software and payroll and payroll-related costsfor employees who are directly associated with the internal-use computer software project (to the extent those employees devoted time directly tothe project) are capitalized. Amortization of capitalized costs begins when the software is ready for its intended use. Capitalized software is includedin premises and equipment, net in the Company’s consolidated statements of financial condition. See Note 6: Premises and Equipment for furtherinformation about the Company’s premises and equipment.
Cloud computing arrangements involving the licensing of software that meet certain criteria are recognized as the acquisition ofsoftware. Such assets are measured at the present value of the license obligation, if the license is to be paid over time, in addition to any capitalizedupfront costs and amortized over the life of the arrangement. Cloud computing arrangements that do not meet the criteria to be recognized asacquired software are accounted for as service contracts. To date, none of the Company’s cloud computing arrangements have met the criteria tobe recognized as acquired software.
Premises and equipment are subject to impairment testing when events or conditions indicate that the carrying value of the asset may not befully recoverable from future cash flows. See “— Intangible Assets” for additional details on impairment testing.
GoodwillGoodwill is recorded as part of the Company’s acquisitions of businesses when the purchase price exceeds the fair value of the net tangible
and separately identifiable intangible assets acquired. The Company’s goodwill is not amortized, but rather is subject to an impairment test at thereporting unit level annually as of October 1, or between annual tests if an event occurs or circumstances change that would more likely than notreduce the fair value of a reporting unit below its carrying amount. The Company’s reported goodwill relates to PULSE, which it acquired in 2005.The Company’s goodwill is tested for impairment by comparing the fair value of the reporting unit to its carrying value. If the fair value of thereporting unit exceeds its carrying value, goodwill is not impaired. If the carrying value exceeds its fair value, an impairment loss must be recognizedin an amount equal to that excess, limited to the total amount of goodwill allocated to that reporting unit. No impairment was identified during theimpairment test conducted as of October 1, 2018 .
- 86 -

Table of Contents
IntangibleAssetsThe Company’s identifiable intangible assets consist of both amortizable and non-amortizable intangible assets. The Company’s amortizable
intangible assets consist primarily of acquired customer relationships and certain trade name intangibles. All of the Company’s amortizableintangible assets are carried at net book value and are amortized over their estimated useful lives. The amortization periods approximate the periodsover which the Company expects to generate future net cash inflows from the use of these assets. The Company’s policy is to amortize intangiblesin a manner that reflects the pattern in which the projected net cash inflows to the Company are expected to occur, where such pattern can bereasonably determined, as opposed to the straight-line basis. This method of amortization typically results in a greater portion of the intangible assetbeing amortized in the earlier years of its useful life.
All of the Company’s amortizable intangible assets, as well as other amortizable or depreciable long-lived assets such as premises andequipment, are subject to impairment testing when events or conditions indicate that the carrying value of the asset may not be fully recoverablefrom future cash flows. A test for recoverability is done by comparing the asset’s carrying value to the sum of the undiscounted future net cashinflows expected to be generated from the use of the asset over its remaining useful life. Impairment exists if the sum of the undiscounted expectedfuture net cash inflows is less than the carrying amount of the asset. Impairment would result in a write-down of the asset to its estimated fair value.The estimated fair values of these assets are based on the discounted present value of the stream of future net cash inflows expected to be derivedover the remaining useful lives of the assets. If an impairment write-down is recorded, the remaining useful life of the asset will be evaluated todetermine whether revision of the remaining amortization or depreciation period is appropriate.
The Company’s non-amortizable intangible assets consist primarily of the brand-related intangibles and international transaction processingrights included in the acquisition of Diners Club. These assets are deemed to have indefinite useful lives and are therefore not subject toamortization. All of the Company’s non-amortizable intangible assets are subject to a test for impairment annually as of October 1, or morefrequently if events or changes in circumstances indicate that the asset might be impaired. As required by GAAP, if the carrying value of a non-amortizable intangible asset is in excess of its fair value, the asset must be written down to its fair value through the recognition of an impairmentcharge to earnings. In contrast to amortizable intangibles, there is no test for recoverability associated with the impairment test for non-amortizableintangible assets. No impairment was identified during the impairment test conducted as of October 1, 2018 .
Stock-basedCompensationThe Company measures the cost of employee services received in exchange for an award of stock-based compensation based on the grant-
date fair value of the award. The cost, net of estimated forfeitures, is recognized over the requisite service period. Awards to employees who areretirement-eligible at any point during the year are amortized over 12 months in accordance with the vesting terms that apply under thosecircumstances. No compensation cost is recognized for awards that are subsequently forfeited.
AdvertisingCostsThe Company expenses television and radio advertising costs in the period in which the advertising is first aired and all other advertising costs
as incurred. Advertising costs are recorded in marketing and business development and were $258 million , $219 million and $196 million for theyears ended December 31, 2018, 2017 and 2016 , respectively.
IncomeTaxesIncome tax expense is provided for using the asset and liability method, under which deferred tax assets and liabilities are determined based
on the temporary differences between the financial statement and income tax bases of assets and liabilities using currently enacted tax rates.Deferred tax assets are recognized when their realization is determined to be more likely than not. Uncertain tax positions are measured at thehighest amount of tax benefit for which realization is judged to be more likely than not. Tax benefits that do not meet these criteria are unrecognizedtax benefits. See Note 15: Income Taxes for more information about the Company’s income taxes.
FinancialInstrumentsUsedforAssetandLiabilityManagementThe Company utilizes derivative financial instruments to manage its various exposures to changes in fair value of certain assets and liabilities,
variability in future cash flows arising from changes in interest rates or other types of
- 87 -

Table of Contents
forecasted transactions, and changes in foreign exchange rates. All derivatives are carried at their estimated fair values on the Company’sconsolidated statements of financial condition. Derivatives having gross positive fair values, inclusive of net accrued interest receipts or payments,are recorded in other assets. Derivatives with gross negative fair values, inclusive of net accrued interest payments or receipts, are recorded inaccrued expenses and other liabilities. The methodologies used to estimate the fair values of these derivative financial instruments are described inNote 20: Fair Value Measurements. Collateral receivable or payable amounts associated with derivatives are not offset against the fair value ofthese derivatives, but are recorded separately in other assets or deposits, respectively. Variation margin payments associated with derivativepositions that are cleared through an exchange are legally characterized as settlements of the derivative positions. Such settlement payments arereflected as offsets to the associated derivatives balances recorded in other assets or in accrued expenses and other liabilities, instead of ascollateral in other assets or deposits. The impact of settlement payments on the consolidated statements of financial condition is discussed in moredetail in Note 21: Derivatives and Hedging Activities.
Certain of these instruments are designated and qualify for hedge accounting. A hedge is deemed effective to the extent that the change infair value, cash flow, or net investment of the hedged item is offset by changes in the hedging instrument. Under cash flow hedge accounting,changes in the fair values of the derivative instruments are recognized in other comprehensive income (“OCI”) and subsequently reclassified toearnings in the period the hedged forecasted cash flows affect earnings. In a net investment hedge, amounts accumulated in OCI are reclassifiedinto earnings when a hedged net investment is either sold or substantially liquidated. Under fair value hedge accounting, changes in both (i) the fairvalues of the derivative instruments and (ii) the fair values of the hedged items relating to the risks being hedged, including net differences, if any,are recorded in interest expense. Certain other derivatives are not designated as hedges or do not qualify for hedge accounting; changes in the fairvalue of these derivatives are recorded in other income. These transactions are discussed in more detail in Note 21: Derivatives and HedgingActivities.
AccumulatedOtherComprehensiveIncomeThe Company records unrealized gains and losses on available-for-sale securities, changes in the fair value of cash flow hedges, and certain
pension and foreign currency translation adjustments in OCI on an after-tax basis where applicable. The Company’s policy is to adjust the taxeffects of a component of AOCI in the same period in which the item is sold or otherwise derecognized, or when the carrying value of the item isremeasured. Details of OCI, net of tax, are presented in the statement of comprehensive income, and a rollforward of AOCI is presented in thestatement of changes in stockholders’ equity and Note 13: Accumulated Other Comprehensive Income.
SignificantRevenueRecognitionAccountingPolicies
LoanInterestandFeeIncomeInterest on loans is comprised largely of interest on credit card loans and is recognized based on the amount of loans outstanding and their
contractual interest rate. Interest on credit card loans is included in loan receivables when billed to the customer. The Company accrues unbilledinterest revenue each month from a customer’s billing cycle date to the end of the month. The Company applies an estimate of the percentage ofloans that will revolve in the next cycle in the estimation of the accrued unbilled portion of interest revenue that is included in accrued interestreceivable on the consolidated statements of financial condition. Interest on other loan receivables is accrued monthly in accordance with theircontractual terms and recorded in accrued interest receivable, which is included in other assets, in the consolidated statements of financialcondition. Interest related to PCI loans is discussed in Note 4: Loan Receivables.
The Company recognizes fees (except balance transfer fees and certain product fees) on loan receivables in interest income or loan feeincome as the fees are assessed. Balance transfer fees and certain product fees are recognized in interest income or loan fee income ratably overthe periods to which they relate. Balance transfer fees are accreted to interest income over the life of the related balance. As of December 31, 2018and 2017 , deferred revenues related to balance transfer fees, recorded as a reduction of loan receivables, were $52 million and $47 million ,respectively. Loan fee income consists of fees on credit card loans and includes late, cash advance, returned check and other miscellaneous feesand is reflected net of waivers and charge-offs.
Direct loan origination costs on credit card loans are deferred and amortized on a straight-line basis over a one year period and recorded ininterest income from credit card loans. Direct loan origination costs on other loan receivables are deferred and amortized over the life of the loanusing the interest method and are recorded in interest income from other loans. As of December 31, 2018 and 2017 , the remaining unamortizeddeferred costs related to loan origination were $138 million and $125 million , respectively, and were recorded in loan receivables.
- 88 -

Table of Contents
The Company accrues interest and fees on loan receivables until the loans are paid or charged off, except in instances of customerbankruptcy, death or fraud, where no further interest and fee accruals occur following notification. Credit card and closed-end consumer loanreceivables are placed on non-accrual status upon receipt of notification of the bankruptcy or death of a customer or suspected fraudulent activity onan account. Upon completion of the fraud investigation, non-fraudulent credit card and closed-end consumer loan receivables may resume accruinginterest. Payments received on non-accrual loans are allocated according to the same payment hierarchy methodology applied to loans that areaccruing interest. When loan receivables are charged off, unpaid accrued interest and fees are reversed against the income line items in which theywere originally recorded in the consolidated statements of income. Charge-offs and recoveries of amounts that relate to capitalized interest onstudent loans are treated as principal charge-offs and recoveries, affecting the provision for loan losses rather than interest income. The Companyconsiders uncollectible interest and fee revenues in assessing the adequacy of the allowance for loan losses.
Interest income from loans individually evaluated for impairment, including loans accounted for as troubled debt restructurings, is accountedfor in the same manner as other accruing loans. Cash collections on these loans are allocated according to the same payment hierarchymethodology applied to loans that are not in such programs.
DiscountandInterchangeRevenueThe Company earns discount revenue from fees charged to merchants with whom it has entered into card acceptance agreements for
processing credit card purchase transactions. The Company earns acquirer interchange revenue primarily from merchant acquirers on all DiscoverNetwork, Diners Club and PULSE transactions made by credit and debit card customers at merchants with whom merchant acquirers have enteredinto card acceptance agreements for processing payment card transactions. These card acceptance arrangements generally renew automaticallyand do not have fixed durations. Under these agreements, the Company stands ready to process payment transactions as and when each ispresented. The Company earns discount, interchange and similar fees only when transactions are processed. Contractually defined per-transactionfee amounts typically apply to each type of transaction processed and are recognized as revenue at the time each transaction is captured forsettlement. These fees are typically collected by the Company as part of the process of settling transactions daily with merchants and acquirers andare fully earned at the time settlement is made.
The Company pays issuer interchange to card-issuing entities that have entered into contractual arrangements to issue cards on the DiscoverNetwork and on certain transactions on the Diners Club and PULSE networks. This cost is contractually established and is based on the card-issuing organization’s transaction volume. The Company classifies this cost as a reduction of discount and interchange revenue. Costs of cardholderreward arrangements, including the Cashback Bonus reward program, are classified as reductions of discount and interchange revenue pursuant toguidance under ASC Topic 606 governing consideration payable to a customer. For both issuer interchange and cardholder rewards, the Companyaccrues the cost at the time each underlying card transaction is captured for settlement.
CustomerRewardsThe Company offers its customers various reward programs, including the CashbackBonusreward program, pursuant to which the Company
pays certain customers a reward equal to a percentage of their credit card purchase amounts based on the type and volume of the customer’spurchases. The liability for customer rewards, which is included in accrued expenses and other liabilities on the consolidated statements of financialcondition, is recorded on an individual customer basis and is accumulated as qualified customers earn rewards through their ongoing credit cardpurchase activity or other defined actions. The Company recognizes customer rewards costs as a reduction of the related revenue, if any. Ininstances where a reward is not associated with a revenue-generating transaction, such as when a reward is given for opening an account, thereward cost is recorded as an operating expense. For the years ended December 31, 2018, 2017 and 2016 , rewards costs amounted to $1.8 billion, $1.6 billion and $1.4 billion , respectively. The liability for customer rewards was $1.6 billion and $1.5 billion at December 31, 2018 and 2017 ,respectively, and is included in accrued expenses and other liabilities on the consolidated statements of financial condition.
ProtectionProductsRevenueThe Company earns revenue related to fees received for ancillary products and services, including payment protection and identity theft
protection services, to its credit card customers. A portion of this revenue comprises amounts earned for arranging for the delivery of productsoffered by third-party service providers. The amount of
- 89 -

Table of Contents
revenue recorded is generally based on either a percentage of a customer’s outstanding balance or a flat fee, in either case assessed monthly, andis recognized as earned. These contracts are month-to-month arrangements that are cancellable at any time. The Company recognizes eachmonthly fee in the period to which the service or coverage relates.
TransactionProcessingRevenueTransaction processing revenue represents switch fees charged to financial institutions and merchants under network participation
agreements for processing ATM, debit and point-of-sale transactions over the PULSE network, as well as various participation and membershipfees. Network participation agreements generally renew automatically and do not have fixed durations, although the Company does enter into fixed-term pricing or incentive arrangements with certain network participants. The impact of such incentives is not material to the Company’sconsolidated statements of income. Similar to discount and interchange fees, switch fees are contractually defined per-transaction fee amounts andare assessed and recognized as revenue at the time each transaction is captured for settlement. These fees are typically collected by the Companyas part of the process of settling transactions with network participants. Membership and other participation fees are recognized over the periods towhich each fee relates.
OtherIncomeOther income includes sales-based royalty revenues earned by Diners Club, merchant fees, certain payments from merchants related to
reward programs, revenues from network partners and other miscellaneous revenue items. Sales-based royalty revenues are recognized as therelated sales are reported by Diners franchisees. All remaining items of other income are recognized as the related performance obligations aresatisfied.
FutureRevenueAssociatedwithCustomerContractsFor contracts under which the Company processes payment card transactions, the Company has the right to assess fees for services
performed and to collect those fees through the settlement process. The Company generates essentially all of its discount and interchange revenueand transaction processing revenue, as well as some revenue reported as other income, through such contracts. There is no specified quantity ofservice promised in these contracts as the number of payment transactions is dependent upon cardholder behavior, which is outside the control ofthe Company and its network customers (i.e., merchants, acquirers, issuers and other network participants). As noted above, these contracts aretypically without fixed durations and renew automatically. For these reasons, the Company does not make or disclose an estimate of revenueassociated with performance obligations attributable to the remaining terms of these contracts. Future revenue associated with the Company’ssales-based royalty revenues earned from Diners Club licensees is similarly variable and open-ended, and therefore the Company does not make ordisclose an estimate of royalties associated with performance obligations attributable to the remaining terms of the licensing and royaltyarrangements. Because of the nature of the services and the manner of collection associated with the majority of the Company's revenue fromcontracts with customers, material receivables or deferred revenues are not generated.
IncentivePaymentsThe Company makes certain incentive payments under contractual arrangements with financial institutions, Diners Club licensees, merchants,
acquirers and certain other customers. These payments are generally classified as contra-revenue unless a specifically identifiable benefit isreceived by the Company in consideration for the payment and the fair value of such benefit can be reasonably estimated. If no such benefit isidentified, then the entire payment is classified as contra-revenue and included in the consolidated statements of income in the line item where therelated revenues are recorded. If the payment gives rise to an asset because it is expected to directly or indirectly contribute to future net cashinflows, it is deferred and recognized over the expected benefit period. The unamortized portion of the deferred incentive payments included in otherassets on the consolidated statements of financial condition was $23 million and $32 million at December 31, 2018 and 2017 , respectively.
- 90 -
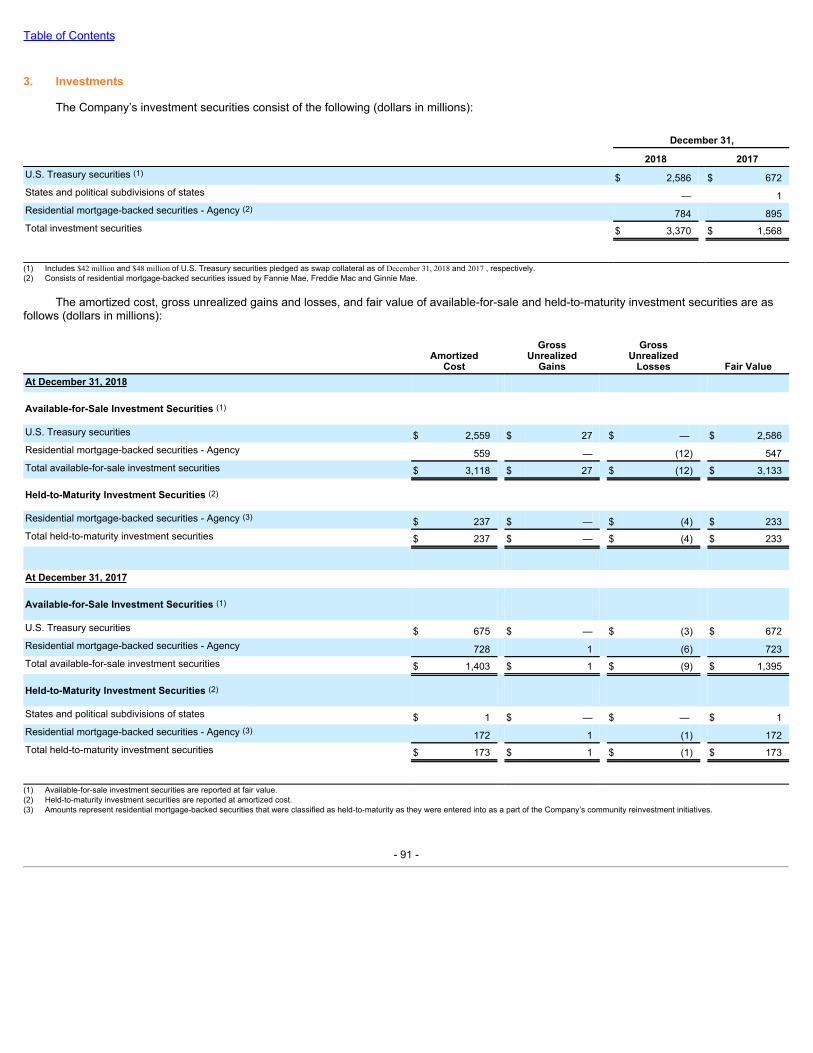
Table of Contents
3. Investments
The Company’s investment securities consist of the following (dollars in millions):
December 31, 2018 2017U.S. Treasury securities (1) $ 2,586 $ 672States and political subdivisions of states — 1Residential mortgage-backed securities - Agency (2) 784 895Total investment securities $ 3,370 $ 1,568
(1) Includes $42 million and $48 million of U.S. Treasury securities pledged as swap collateral as of December 31, 2018 and 2017 , respectively.(2) Consists of residential mortgage-backed securities issued by Fannie Mae, Freddie Mac and Ginnie Mae.
The amortized cost, gross unrealized gains and losses, and fair value of available-for-sale and held-to-maturity investment securities are asfollows (dollars in millions):
Amortized
Cost
GrossUnrealized
Gains
GrossUnrealized
Losses Fair ValueAt December 31, 2018
Available-for-Sale Investment Securities (1)
U.S. Treasury securities $ 2,559 $ 27 $ — $ 2,586Residential mortgage-backed securities - Agency 559 — (12) 547Total available-for-sale investment securities $ 3,118 $ 27 $ (12) $ 3,133
Held-to-Maturity Investment Securities (2)
Residential mortgage-backed securities - Agency (3) $ 237 $ — $ (4) $ 233Total held-to-maturity investment securities $ 237 $ — $ (4) $ 233
At December 31, 2017
Available-for-Sale Investment Securities (1)
U.S. Treasury securities $ 675 $ — $ (3) $ 672Residential mortgage-backed securities - Agency 728 1 (6) 723Total available-for-sale investment securities $ 1,403 $ 1 $ (9) $ 1,395
Held-to-Maturity Investment Securities (2)
States and political subdivisions of states $ 1 $ — $ — $ 1Residential mortgage-backed securities - Agency (3) 172 1 (1) 172Total held-to-maturity investment securities $ 173 $ 1 $ (1) $ 173
(1) Available-for-sale investment securities are reported at fair value.(2) Held-to-maturity investment securities are reported at amortized cost.(3) Amounts represent residential mortgage-backed securities that were classified as held-to-maturity as they were entered into as a part of the Company’s community reinvestment initiatives.
- 91 -
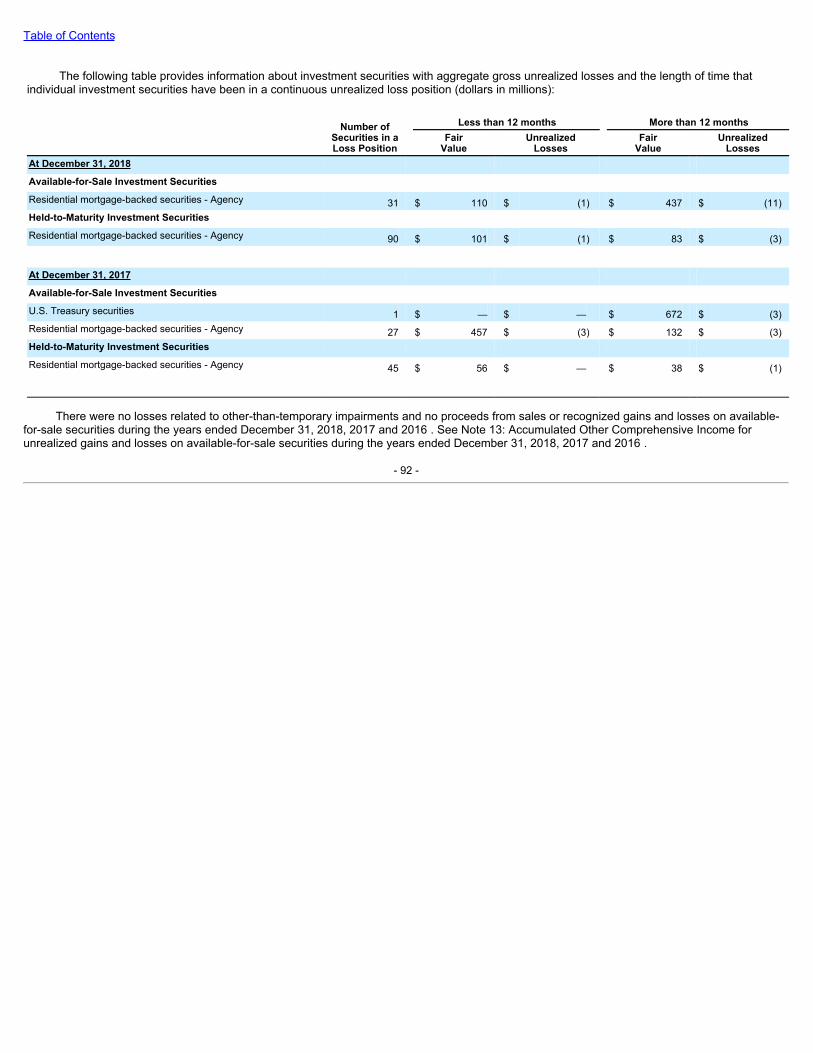
Table of Contents
The following table provides information about investment securities with aggregate gross unrealized losses and the length of time thatindividual investment securities have been in a continuous unrealized loss position (dollars in millions):
Number ofSecurities in aLoss Position
Less than 12 months More than 12 months
Fair
Value Unrealized
Losses Fair
Value Unrealized
LossesAt December 31, 2018 Available-for-Sale Investment Securities Residential mortgage-backed securities - Agency 31 $ 110 $ (1) $ 437 $ (11)Held-to-Maturity Investment Securities Residential mortgage-backed securities - Agency 90 $ 101 $ (1) $ 83 $ (3)
At December 31, 2017 Available-for-Sale Investment Securities U.S. Treasury securities 1 $ — $ — $ 672 $ (3)Residential mortgage-backed securities - Agency 27 $ 457 $ (3) $ 132 $ (3)Held-to-Maturity Investment Securities Residential mortgage-backed securities - Agency 45 $ 56 $ — $ 38 $ (1)
There were no losses related to other-than-temporary impairments and no proceeds from sales or recognized gains and losses on available-for-sale securities during the years ended December 31, 2018, 2017 and 2016 . See Note 13: Accumulated Other Comprehensive Income forunrealized gains and losses on available-for-sale securities during the years ended December 31, 2018, 2017 and 2016 .
- 92 -
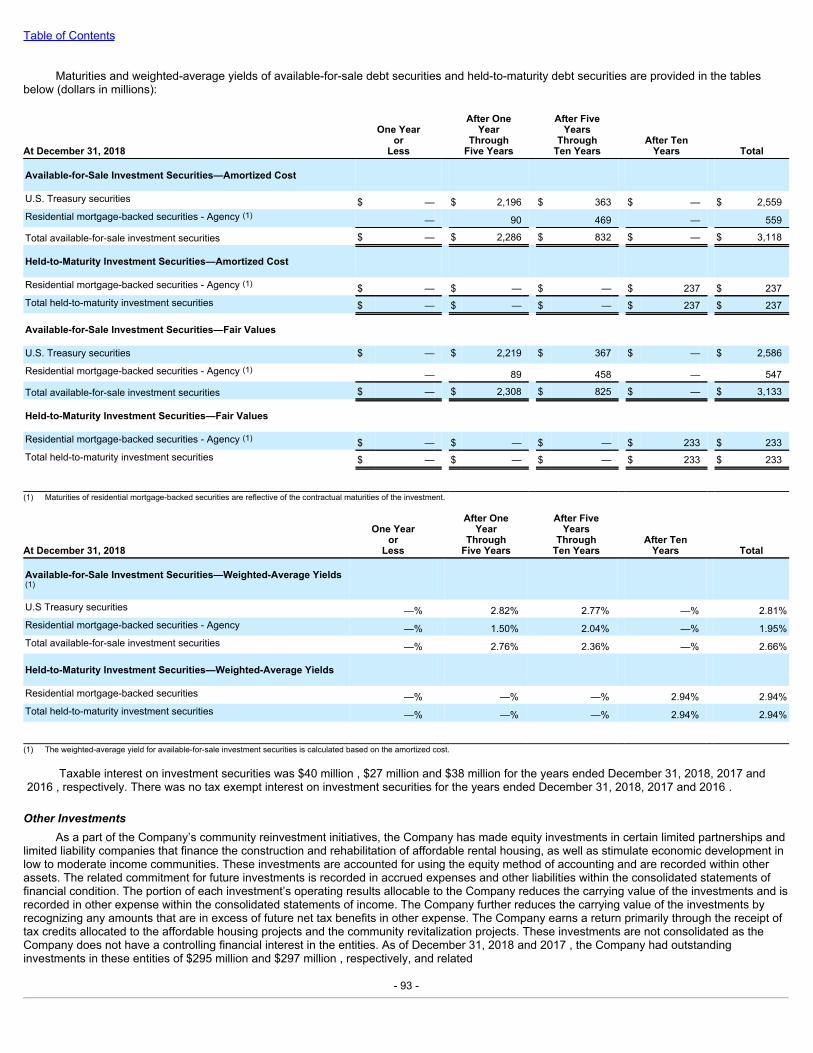
Table of Contents
Maturities and weighted-average yields of available-for-sale debt securities and held-to-maturity debt securities are provided in the tablesbelow (dollars in millions):
At December 31, 2018
One Yearor
Less
After OneYear
ThroughFive Years
After FiveYears
ThroughTen Years
After TenYears Total
Available-for-Sale Investment Securities—Amortized Cost U.S. Treasury securities $ — $ 2,196 $ 363 $ — $ 2,559Residential mortgage-backed securities - Agency (1) — 90 469 — 559
Total available-for-sale investment securities $ — $ 2,286 $ 832 $ — $ 3,118
Held-to-Maturity Investment Securities—Amortized Cost Residential mortgage-backed securities - Agency (1) $ — $ — $ — $ 237 $ 237Total held-to-maturity investment securities $ — $ — $ — $ 237 $ 237
Available-for-Sale Investment Securities—Fair Values U.S. Treasury securities $ — $ 2,219 $ 367 $ — $ 2,586
Residential mortgage-backed securities - Agency (1) — 89 458 — 547
Total available-for-sale investment securities $ — $ 2,308 $ 825 $ — $ 3,133
Held-to-Maturity Investment Securities—Fair Values Residential mortgage-backed securities - Agency (1) $ — $ — $ — $ 233 $ 233Total held-to-maturity investment securities $ — $ — $ — $ 233 $ 233
(1) Maturities of residential mortgage-backed securities are reflective of the contractual maturities of the investment.
At December 31, 2018
One Yearor
Less
After OneYear
ThroughFive Years
After FiveYears
ThroughTen Years
After TenYears Total
Available-for-Sale Investment Securities—Weighted-Average Yields(1) U.S Treasury securities —% 2.82% 2.77% —% 2.81%Residential mortgage-backed securities - Agency —% 1.50% 2.04% —% 1.95%Total available-for-sale investment securities —% 2.76% 2.36% —% 2.66%
Held-to-Maturity Investment Securities—Weighted-Average Yields Residential mortgage-backed securities —% —% —% 2.94% 2.94%Total held-to-maturity investment securities —% —% —% 2.94% 2.94% (1) The weighted-average yield for available-for-sale investment securities is calculated based on the amortized cost.
Taxable interest on investment securities was $40 million , $27 million and $38 million for the years ended December 31, 2018, 2017 and2016 , respectively. There was no tax exempt interest on investment securities for the years ended December 31, 2018, 2017 and 2016 .
OtherInvestmentsAs a part of the Company’s community reinvestment initiatives, the Company has made equity investments in certain limited partnerships and
limited liability companies that finance the construction and rehabilitation of affordable rental housing, as well as stimulate economic development inlow to moderate income communities. These investments are accounted for using the equity method of accounting and are recorded within otherassets. The related commitment for future investments is recorded in accrued expenses and other liabilities within the consolidated statements offinancial condition. The portion of each investment’s operating results allocable to the Company reduces the carrying value of the investments and isrecorded in other expense within the consolidated statements of income. The Company further reduces the carrying value of the investments byrecognizing any amounts that are in excess of future net tax benefits in other expense. The Company earns a return primarily through the receipt oftax credits allocated to the affordable housing projects and the community revitalization projects. These investments are not consolidated as theCompany does not have a controlling financial interest in the entities. As of December 31, 2018 and 2017 , the Company had outstandinginvestments in these entities of $295 million and $297 million , respectively, and related
- 93 -
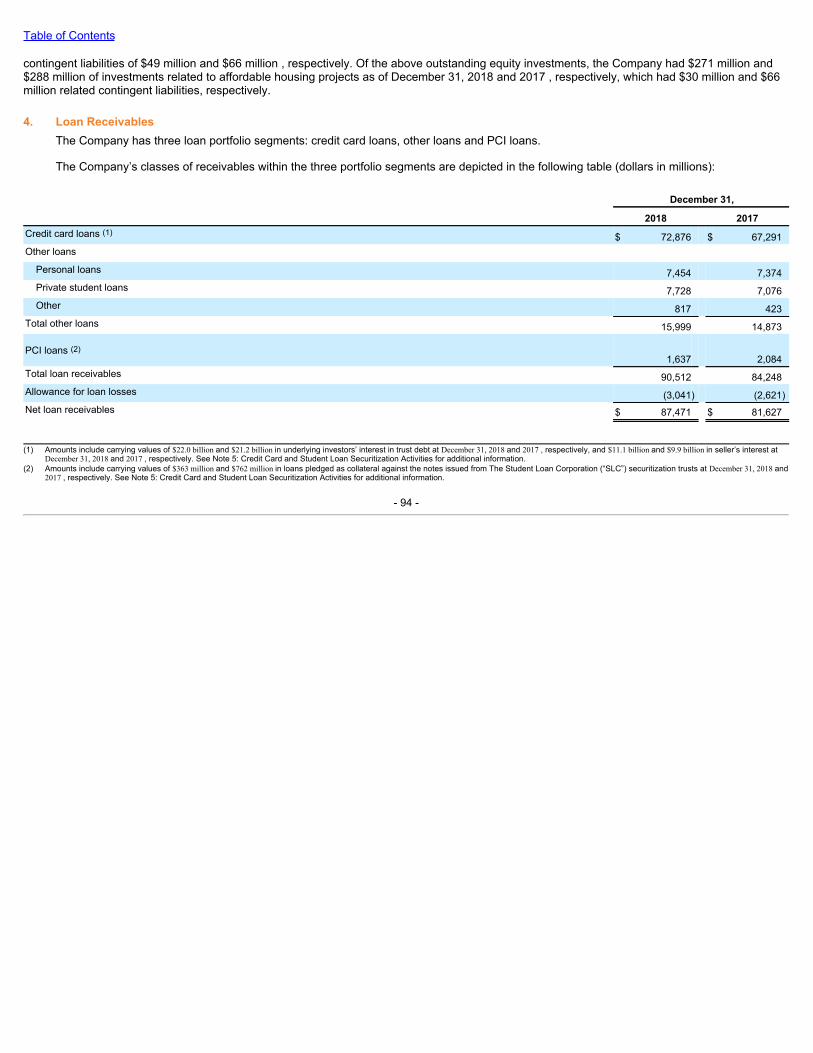
Table of Contents
contingent liabilities of $49 million and $66 million , respectively. Of the above outstanding equity investments, the Company had $271 million and$288 million of investments related to affordable housing projects as of December 31, 2018 and 2017 , respectively, which had $30 million and $66million related contingent liabilities, respectively.
4. Loan ReceivablesThe Company has three loan portfolio segments: credit card loans, other loans and PCI loans.
The Company’s classes of receivables within the three portfolio segments are depicted in the following table (dollars in millions):
December 31, 2018 2017Credit card loans (1) $ 72,876 $ 67,291Other loans
Personal loans 7,454 7,374Private student loans 7,728 7,076Other 817 423
Total other loans 15,999 14,873
PCI loans (2)1,637 2,084
Total loan receivables 90,512 84,248Allowance for loan losses (3,041) (2,621)Net loan receivables $ 87,471 $ 81,627
(1) Amounts include carrying values of $22.0 billion and $21.2 billion in underlying investors’ interest in trust debt at December 31, 2018 and 2017 , respectively, and $11.1 billion and $9.9 billion in seller’s interest at
December 31, 2018 and 2017 , respectively. See Note 5: Credit Card and Student Loan Securitization Activities for additional information.(2) Amounts include carrying values of $363 million and $762 million in loans pledged as collateral against the notes issued from The Student Loan Corporation (“SLC”) securitization trusts at December 31, 2018 and
2017 , respectively. See Note 5: Credit Card and Student Loan Securitization Activities for additional information.
- 94 -
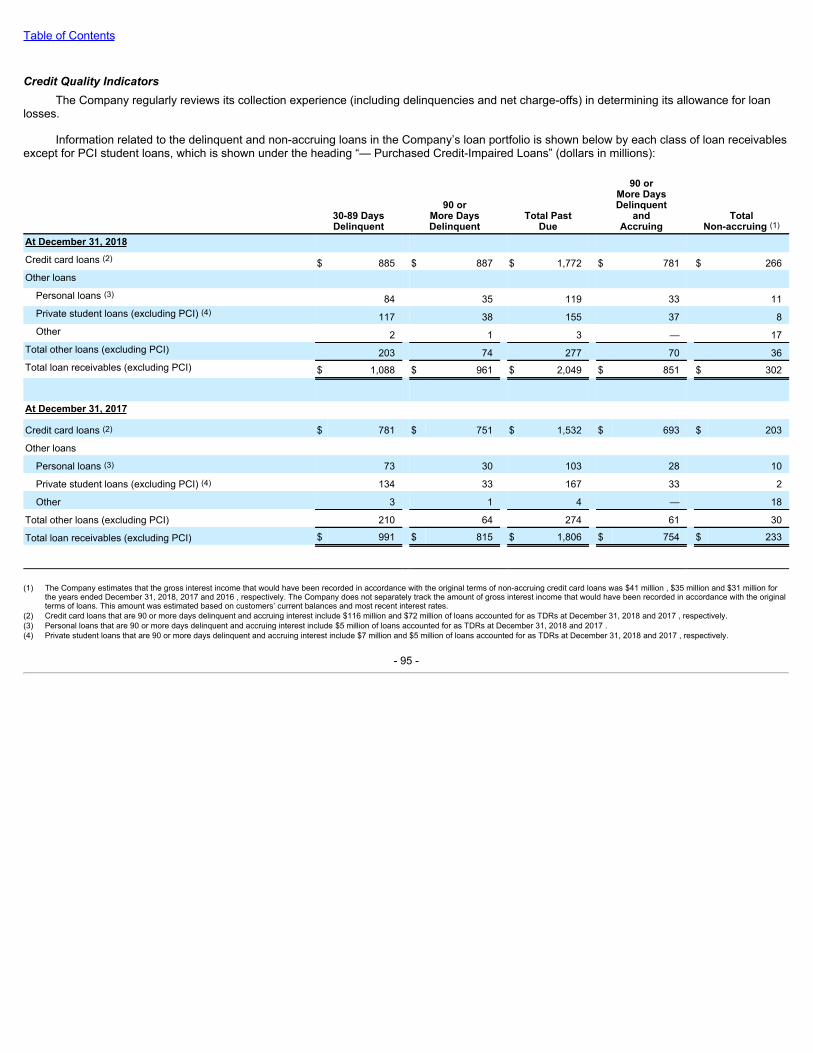
Table of Contents
CreditQualityIndicatorsThe Company regularly reviews its collection experience (including delinquencies and net charge-offs) in determining its allowance for loan
losses.
Information related to the delinquent and non-accruing loans in the Company’s loan portfolio is shown below by each class of loan receivablesexcept for PCI student loans, which is shown under the heading “— Purchased Credit-Impaired Loans” (dollars in millions):
30-89 DaysDelinquent
90 orMore DaysDelinquent
Total PastDue
90 orMore DaysDelinquent
andAccruing
TotalNon-accruing (1)
At December 31, 2018 Credit card loans (2) $ 885 $ 887 $ 1,772 $ 781 $ 266Other loans
Personal loans (3) 84 35 119 33 11Private student loans (excluding PCI) (4) 117 38 155 37 8Other 2 1 3 — 17
Total other loans (excluding PCI) 203 74 277 70 36Total loan receivables (excluding PCI) $ 1,088 $ 961 $ 2,049 $ 851 $ 302
At December 31, 2017
Credit card loans (2) $ 781 $ 751 $ 1,532 $ 693 $ 203
Other loans
Personal loans (3) 73 30 103 28 10
Private student loans (excluding PCI) (4) 134 33 167 33 2
Other 3 1 4 — 18
Total other loans (excluding PCI) 210 64 274 61 30
Total loan receivables (excluding PCI) $ 991 $ 815 $ 1,806 $ 754 $ 233
(1) The Company estimates that the gross interest income that would have been recorded in accordance with the original terms of non-accruing credit card loans was $41 million , $35 million and $31 million for
the years ended December 31, 2018, 2017 and 2016 , respectively. The Company does not separately track the amount of gross interest income that would have been recorded in accordance with the originalterms of loans. This amount was estimated based on customers’ current balances and most recent interest rates.
(2) Credit card loans that are 90 or more days delinquent and accruing interest include $116 million and $72 million of loans accounted for as TDRs at December 31, 2018 and 2017 , respectively.(3) Personal loans that are 90 or more days delinquent and accruing interest include $5 million of loans accounted for as TDRs at December 31, 2018 and 2017 .(4) Private student loans that are 90 or more days delinquent and accruing interest include $7 million and $5 million of loans accounted for as TDRs at December 31, 2018 and 2017 , respectively.
- 95 -
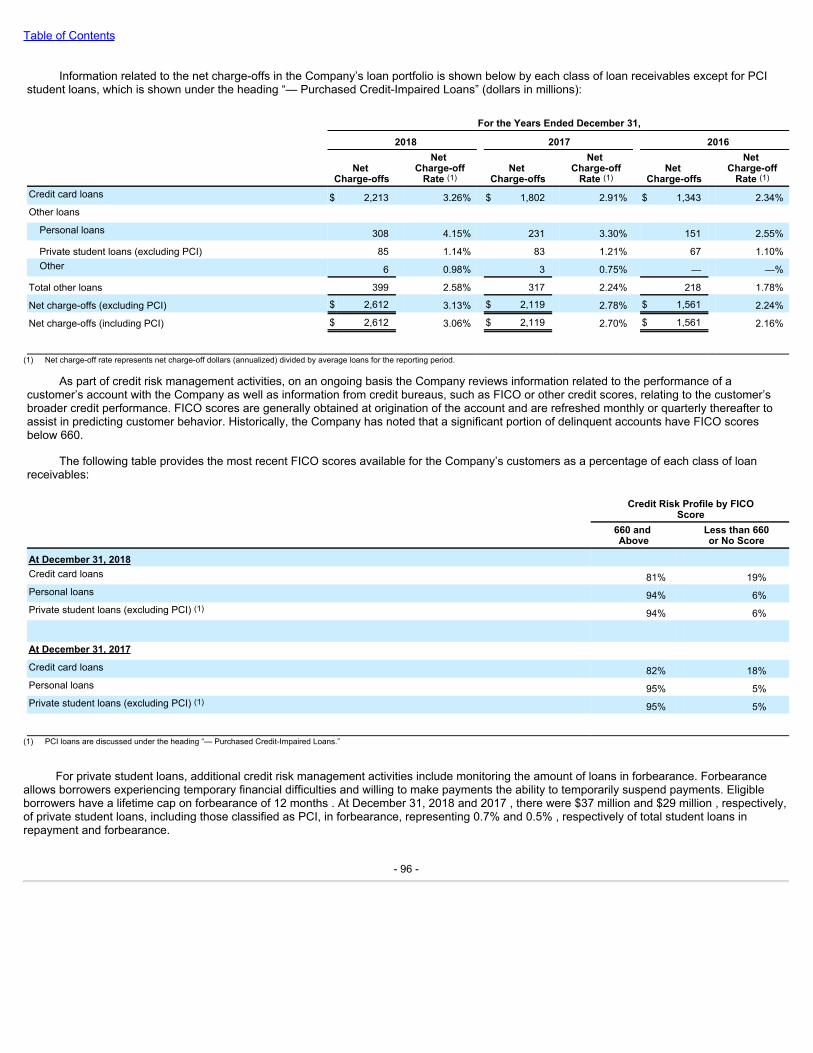
Table of Contents
Information related to the net charge-offs in the Company’s loan portfolio is shown below by each class of loan receivables except for PCIstudent loans, which is shown under the heading “— Purchased Credit-Impaired Loans” (dollars in millions):
For the Years Ended December 31, 2018 2017 2016
Net
Charge-offs
Net Charge-off
Rate (1) Net
Charge-offs
Net Charge-off
Rate (1) Net
Charge-offs
Net Charge-off
Rate (1)
Credit card loans $ 2,213 3.26% $ 1,802 2.91% $ 1,343 2.34%Other loans
Personal loans 308 4.15% 231 3.30% 151 2.55%
Private student loans (excluding PCI) 85 1.14% 83 1.21% 67 1.10%Other 6 0.98% 3 0.75% — —%
Total other loans 399 2.58% 317 2.24% 218 1.78%
Net charge-offs (excluding PCI) $ 2,612 3.13% $ 2,119 2.78% $ 1,561 2.24%
Net charge-offs (including PCI) $ 2,612 3.06% $ 2,119 2.70% $ 1,561 2.16%
(1) Net charge-off rate represents net charge-off dollars (annualized) divided by average loans for the reporting period.
As part of credit risk management activities, on an ongoing basis the Company reviews information related to the performance of acustomer’s account with the Company as well as information from credit bureaus, such as FICO or other credit scores, relating to the customer’sbroader credit performance. FICO scores are generally obtained at origination of the account and are refreshed monthly or quarterly thereafter toassist in predicting customer behavior. Historically, the Company has noted that a significant portion of delinquent accounts have FICO scoresbelow 660.
The following table provides the most recent FICO scores available for the Company’s customers as a percentage of each class of loanreceivables:
Credit Risk Profile by FICO
Score
660 and Above
Less than 660or No Score
At December 31, 2018 Credit card loans 81% 19%Personal loans 94% 6%Private student loans (excluding PCI) (1) 94% 6%
At December 31, 2017 Credit card loans 82% 18%Personal loans 95% 5%Private student loans (excluding PCI) (1) 95% 5%
(1) PCI loans are discussed under the heading “— Purchased Credit-Impaired Loans.”
For private student loans, additional credit risk management activities include monitoring the amount of loans in forbearance. Forbearanceallows borrowers experiencing temporary financial difficulties and willing to make payments the ability to temporarily suspend payments. Eligibleborrowers have a lifetime cap on forbearance of 12 months . At December 31, 2018 and 2017 , there were $37 million and $29 million , respectively,of private student loans, including those classified as PCI, in forbearance, representing 0.7% and 0.5% , respectively of total student loans inrepayment and forbearance.
- 96 -
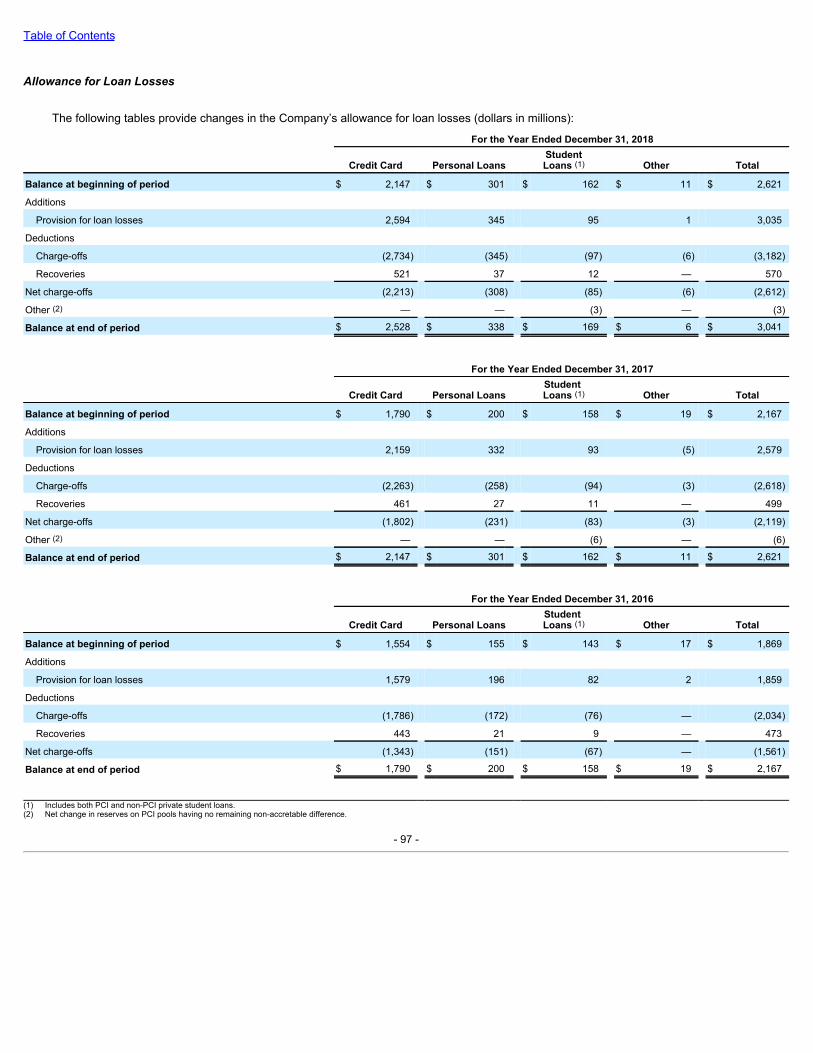
Table of Contents
AllowanceforLoanLosses
The following tables provide changes in the Company’s allowance for loan losses (dollars in millions): For the Year Ended December 31, 2018
Credit Card Personal Loans StudentLoans (1) Other Total
Balance at beginning of period $ 2,147 $ 301 $ 162 $ 11 $ 2,621
Additions
Provision for loan losses 2,594 345 95 1 3,035
Deductions
Charge-offs (2,734) (345) (97) (6) (3,182)
Recoveries 521 37 12 — 570
Net charge-offs (2,213) (308) (85) (6) (2,612)
Other (2) — — (3) — (3)
Balance at end of period $ 2,528 $ 338 $ 169 $ 6 $ 3,041
For the Year Ended December 31, 2017
Credit Card Personal Loans Student Loans (1) Other Total
Balance at beginning of period $ 1,790 $ 200 $ 158 $ 19 $ 2,167
Additions
Provision for loan losses 2,159 332 93 (5) 2,579
Deductions
Charge-offs (2,263) (258) (94) (3) (2,618)
Recoveries 461 27 11 — 499
Net charge-offs (1,802) (231) (83) (3) (2,119)
Other (2) — — (6) — (6)
Balance at end of period $ 2,147 $ 301 $ 162 $ 11 $ 2,621
For the Year Ended December 31, 2016
Credit Card Personal Loans Student Loans (1) Other Total
Balance at beginning of period $ 1,554 $ 155 $ 143 $ 17 $ 1,869
Additions
Provision for loan losses 1,579 196 82 2 1,859
Deductions
Charge-offs (1,786) (172) (76) — (2,034)
Recoveries 443 21 9 — 473
Net charge-offs (1,343) (151) (67) — (1,561)
Balance at end of period $ 1,790 $ 200 $ 158 $ 19 $ 2,167
(1) Includes both PCI and non-PCI private student loans.(2) Net change in reserves on PCI pools having no remaining non-accretable difference.
- 97 -
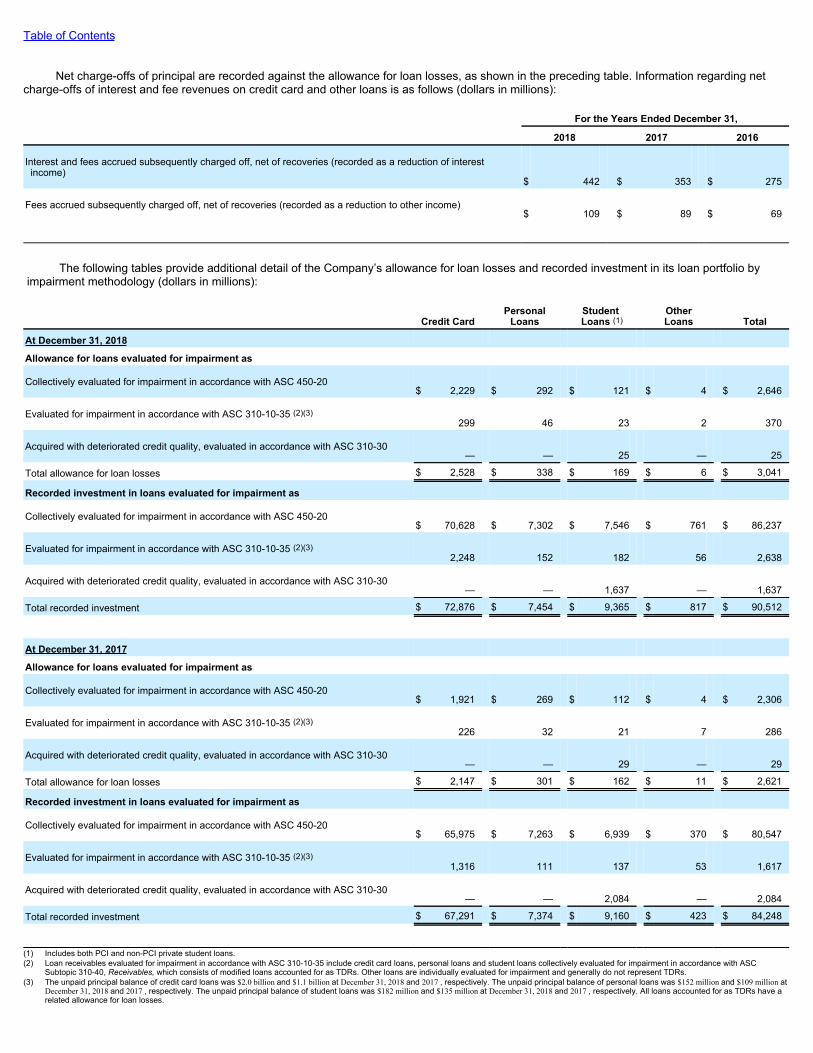
Table of Contents
Net charge-offs of principal are recorded against the allowance for loan losses, as shown in the preceding table. Information regarding netcharge-offs of interest and fee revenues on credit card and other loans is as follows (dollars in millions):
For the Years Ended December 31,
2018 2017 2016
Interest and fees accrued subsequently charged off, net of recoveries (recorded as a reduction of interestincome)
$ 442 $ 353 $ 275
Fees accrued subsequently charged off, net of recoveries (recorded as a reduction to other income)$ 109 $ 89 $ 69
The following tables provide additional detail of the Company’s allowance for loan losses and recorded investment in its loan portfolio byimpairment methodology (dollars in millions):
Credit Card Personal
Loans Student Loans (1)
OtherLoans Total
At December 31, 2018
Allowance for loans evaluated for impairment as
Collectively evaluated for impairment in accordance with ASC 450-20$ 2,229 $ 292 $ 121 $ 4 $ 2,646
Evaluated for impairment in accordance with ASC 310-10-35 (2)(3)299 46 23 2 370
Acquired with deteriorated credit quality, evaluated in accordance with ASC 310-30— — 25 — 25
Total allowance for loan losses $ 2,528 $ 338 $ 169 $ 6 $ 3,041
Recorded investment in loans evaluated for impairment as
Collectively evaluated for impairment in accordance with ASC 450-20$ 70,628 $ 7,302 $ 7,546 $ 761 $ 86,237
Evaluated for impairment in accordance with ASC 310-10-35 (2)(3)2,248 152 182 56 2,638
Acquired with deteriorated credit quality, evaluated in accordance with ASC 310-30— — 1,637 — 1,637
Total recorded investment $ 72,876 $ 7,454 $ 9,365 $ 817 $ 90,512
At December 31, 2017
Allowance for loans evaluated for impairment as
Collectively evaluated for impairment in accordance with ASC 450-20$ 1,921 $ 269 $ 112 $ 4 $ 2,306
Evaluated for impairment in accordance with ASC 310-10-35 (2)(3)226 32 21 7 286
Acquired with deteriorated credit quality, evaluated in accordance with ASC 310-30— — 29 — 29
Total allowance for loan losses $ 2,147 $ 301 $ 162 $ 11 $ 2,621
Recorded investment in loans evaluated for impairment as
Collectively evaluated for impairment in accordance with ASC 450-20$ 65,975 $ 7,263 $ 6,939 $ 370 $ 80,547
Evaluated for impairment in accordance with ASC 310-10-35 (2)(3)1,316 111 137 53 1,617
Acquired with deteriorated credit quality, evaluated in accordance with ASC 310-30— — 2,084 — 2,084
Total recorded investment $ 67,291 $ 7,374 $ 9,160 $ 423 $ 84,248
(1) Includes both PCI and non-PCI private student loans.(2) Loan receivables evaluated for impairment in accordance with ASC 310-10-35 include credit card loans, personal loans and student loans collectively evaluated for impairment in accordance with ASC
Subtopic 310-40, Receivables,which consists of modified loans accounted for as TDRs. Other loans are individually evaluated for impairment and generally do not represent TDRs.(3) The unpaid principal balance of credit card loans was $2.0 billion and $1.1 billion at December 31, 2018 and 2017 , respectively. The unpaid principal balance of personal loans was $152 million and $109 million at
December 31, 2018 and 2017 , respectively. The unpaid principal balance of student loans was $182 million and $135 million at December 31, 2018 and 2017 , respectively. All loans accounted for as TDRs have arelated allowance for loan losses.

- 98 -
Table of Contents
TroubledDebtRestructuringsThe Company has internal loan modification programs that provide relief to credit card, personal loan and student loan borrowers who may be
experiencing financial hardship. The Company continually evaluates new programs to determine which of them meet the definition of a TDR. Theinternal loan modification programs include both temporary and permanent programs, which vary by product. External loan modification programsare also available for credit card and personal loans. Temporary and permanent modifications on credit card and personal loans, as well astemporary modifications on student loans and certain grants of student loan forbearance, result in the loans being considered individually impaired.In addition, loans that defaulted or graduated from modification programs or forbearance are considered to be individually impaired.
For credit card customers, the Company offers temporary hardship programs consisting of an interest rate reduction and in some cases areduced minimum payment, both lasting for a period no longer than 12 months . The permanent modification program involves changing thestructure of the loan to a fixed payment loan with a maturity no longer than 60 months and reducing the interest rate on the loan. The permanentmodification program does not normally provide for the forgiveness of unpaid principal, but may allow for the reversal of certain unpaid interest orfee assessments. The Company also makes permanent loan modifications for customers who request financial assistance through external sources,such as a consumer credit counseling agency program. These loans typically receive a reduced interest rate but continue to be subject to theoriginal minimum payment terms and do not normally include waiver of unpaid principal, interest or fees. Modified credit card loans that are deemedto meet the definition of TDRs include loans in both temporary and permanent programs.
For personal loan customers, in certain situations the Company offers various payment programs, including temporary and permanentprograms. The temporary programs normally consist of a reduction of the minimum payment for a period of no longer than 12 months with the optionof a final balloon payment required at the end of the loan term or an extension of the maturity date with the total term not exceeding nine years .Further, in certain circumstances, the interest rate on the loan is reduced. The permanent programs involve changing the terms of the loan in orderto pay off the outstanding balance over a longer term and also in certain circumstances reducing the interest rate on the loan. Similar to thetemporary programs, the total term may not exceed nine years . The Company also allows permanent loan modifications for customers who requestfinancial assistance through external sources, similar to the credit card customers discussed above. Payments are modified based on the new termsagreed upon with the credit counseling agency. Personal loans included in temporary and permanent programs are accounted for as TDRs.
At December 31, 2018 , there was $5.6 billion of private student loans in repayment, which includes both PCI and non-PCI loans. To assiststudent loan borrowers who are experiencing temporary financial difficulties but are willing to resume making payments, the Company may offerhardship forbearance or programs that include payment deferral, temporary payment reduction, temporary interest rate reduction or extended terms.A non-PCI modified loan typically meets the definition of a TDR based on the cumulative length of the concession period and an evaluation of thecredit quality of the borrower based on FICO scores.
Borrower performance after using payment programs or forbearance is monitored and the Company believes the programs help to preventdefaults and are useful in assisting customers experiencing financial difficulties. The Company plans to continue to use payment programs andforbearance and, as a result, expects to have additional loans classified as TDRs in the future.
- 99 -
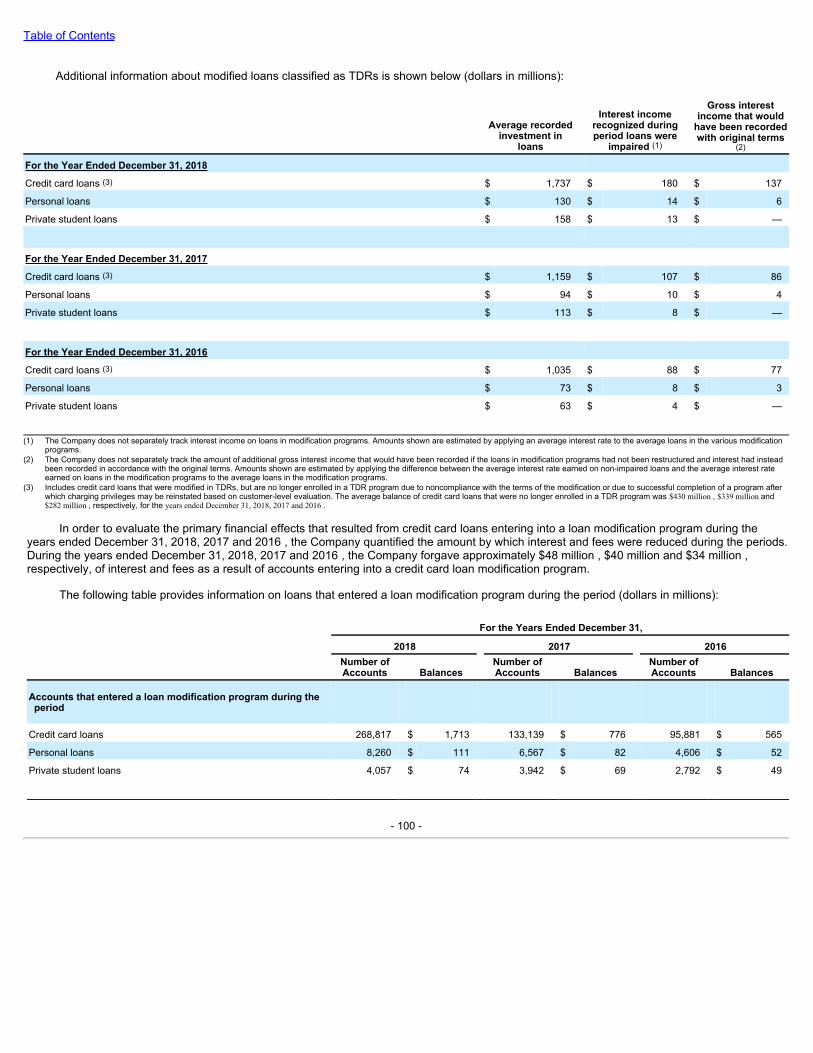
Table of Contents
Additional information about modified loans classified as TDRs is shown below (dollars in millions):
Average recordedinvestment in
loans
Interest incomerecognized duringperiod loans were
impaired (1)
Gross interestincome that would
have been recordedwith original terms
(2)
For the Year Ended December 31, 2018
Credit card loans (3) $ 1,737 $ 180 $ 137
Personal loans $ 130 $ 14 $ 6
Private student loans $ 158 $ 13 $ —
For the Year Ended December 31, 2017
Credit card loans (3) $ 1,159 $ 107 $ 86
Personal loans $ 94 $ 10 $ 4
Private student loans $ 113 $ 8 $ —
For the Year Ended December 31, 2016
Credit card loans (3) $ 1,035 $ 88 $ 77
Personal loans $ 73 $ 8 $ 3
Private student loans $ 63 $ 4 $ — (1) The Company does not separately track interest income on loans in modification programs. Amounts shown are estimated by applying an average interest rate to the average loans in the various modification
programs.(2) The Company does not separately track the amount of additional gross interest income that would have been recorded if the loans in modification programs had not been restructured and interest had instead
been recorded in accordance with the original terms. Amounts shown are estimated by applying the difference between the average interest rate earned on non-impaired loans and the average interest rateearned on loans in the modification programs to the average loans in the modification programs.
(3) Includes credit card loans that were modified in TDRs, but are no longer enrolled in a TDR program due to noncompliance with the terms of the modification or due to successful completion of a program afterwhich charging privileges may be reinstated based on customer-level evaluation. The average balance of credit card loans that were no longer enrolled in a TDR program was $430 million , $339 million and$282 million , respectively, for the years ended December 31, 2018, 2017 and 2016 .
In order to evaluate the primary financial effects that resulted from credit card loans entering into a loan modification program during theyears ended December 31, 2018, 2017 and 2016 , the Company quantified the amount by which interest and fees were reduced during the periods.During the years ended December 31, 2018, 2017 and 2016 , the Company forgave approximately $48 million , $40 million and $34 million ,respectively, of interest and fees as a result of accounts entering into a credit card loan modification program.
The following table provides information on loans that entered a loan modification program during the period (dollars in millions):
For the Years Ended December 31, 2018 2017 2016
Number ofAccounts Balances
Number ofAccounts Balances
Number ofAccounts Balances
Accounts that entered a loan modification program during theperiod
Credit card loans 268,817 $ 1,713 133,139 $ 776 95,881 $ 565
Personal loans 8,260 $ 111 6,567 $ 82 4,606 $ 52
Private student loans 4,057 $ 74 3,942 $ 69 2,792 $ 49
- 100 -
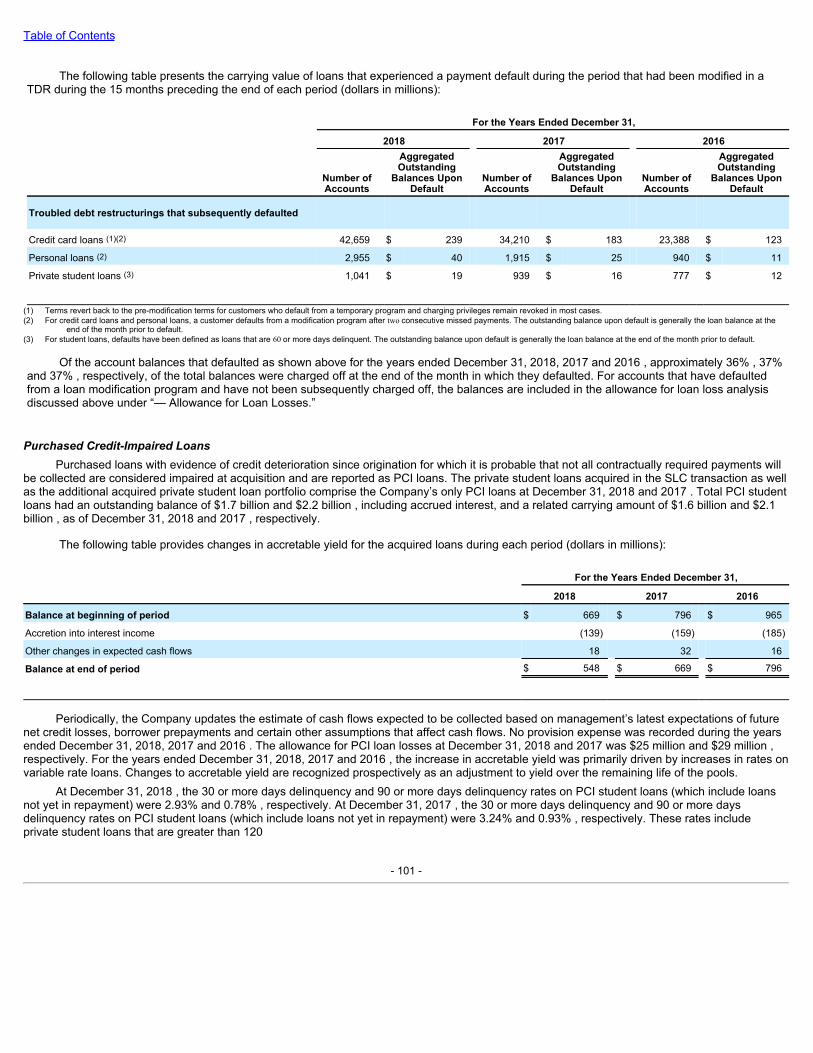
Table of Contents
The following table presents the carrying value of loans that experienced a payment default during the period that had been modified in aTDR during the 15 months preceding the end of each period (dollars in millions):
For the Years Ended December 31, 2018 2017 2016
Number ofAccounts
AggregatedOutstanding
Balances UponDefault
Number ofAccounts
AggregatedOutstanding
Balances UponDefault
Number ofAccounts
AggregatedOutstanding
Balances UponDefault
Troubled debt restructurings that subsequently defaulted
Credit card loans (1)(2) 42,659 $ 239 34,210 $ 183 23,388 $ 123
Personal loans (2) 2,955 $ 40 1,915 $ 25 940 $ 11
Private student loans (3) 1,041 $ 19 939 $ 16 777 $ 12
(1) Terms revert back to the pre-modification terms for customers who default from a temporary program and charging privileges remain revoked in most cases.(2) For credit card loans and personal loans, a customer defaults from a modification program after two consecutive missed payments. The outstanding balance upon default is generally the loan balance at the
end of the month prior to default.(3) For student loans, defaults have been defined as loans that are 60 or more days delinquent. The outstanding balance upon default is generally the loan balance at the end of the month prior to default.
Of the account balances that defaulted as shown above for the years ended December 31, 2018, 2017 and 2016 , approximately 36% , 37%and 37% , respectively, of the total balances were charged off at the end of the month in which they defaulted. For accounts that have defaultedfrom a loan modification program and have not been subsequently charged off, the balances are included in the allowance for loan loss analysisdiscussed above under “— Allowance for Loan Losses.”
PurchasedCredit-ImpairedLoansPurchased loans with evidence of credit deterioration since origination for which it is probable that not all contractually required payments will
be collected are considered impaired at acquisition and are reported as PCI loans. The private student loans acquired in the SLC transaction as wellas the additional acquired private student loan portfolio comprise the Company’s only PCI loans at December 31, 2018 and 2017 . Total PCI studentloans had an outstanding balance of $1.7 billion and $2.2 billion , including accrued interest, and a related carrying amount of $1.6 billion and $2.1billion , as of December 31, 2018 and 2017 , respectively.
The following table provides changes in accretable yield for the acquired loans during each period (dollars in millions):
For the Years Ended December 31,
2018 2017 2016
Balance at beginning of period $ 669 $ 796 $ 965
Accretion into interest income (139) (159) (185)
Other changes in expected cash flows 18 32 16
Balance at end of period $ 548 $ 669 $ 796
Periodically, the Company updates the estimate of cash flows expected to be collected based on management’s latest expectations of futurenet credit losses, borrower prepayments and certain other assumptions that affect cash flows. No provision expense was recorded during the yearsended December 31, 2018, 2017 and 2016 . The allowance for PCI loan losses at December 31, 2018 and 2017 was $25 million and $29 million ,respectively. For the years ended December 31, 2018, 2017 and 2016 , the increase in accretable yield was primarily driven by increases in rates onvariable rate loans. Changes to accretable yield are recognized prospectively as an adjustment to yield over the remaining life of the pools.
At December 31, 2018 , the 30 or more days delinquency and 90 or more days delinquency rates on PCI student loans (which include loansnot yet in repayment) were 2.93% and 0.78% , respectively. At December 31, 2017 , the 30 or more days delinquency and 90 or more daysdelinquency rates on PCI student loans (which include loans not yet in repayment) were 3.24% and 0.93% , respectively. These rates includeprivate student loans that are greater than 120
- 101 -
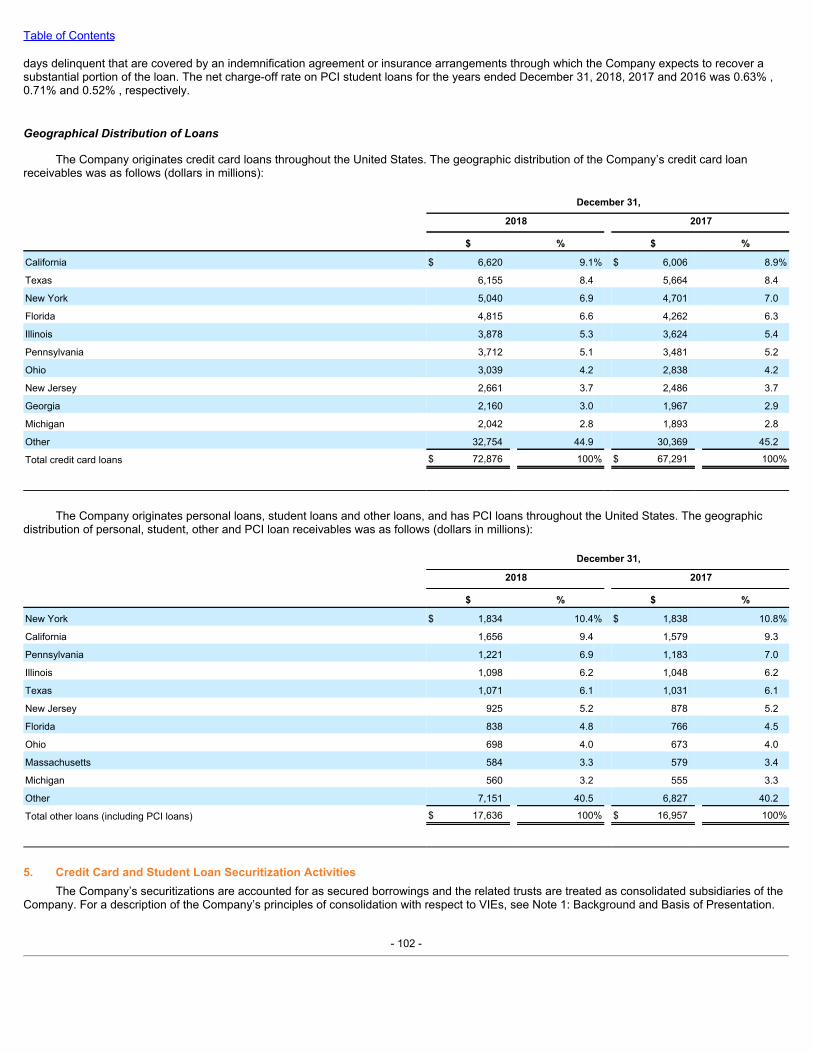
Table of Contents
days delinquent that are covered by an indemnification agreement or insurance arrangements through which the Company expects to recover asubstantial portion of the loan. The net charge-off rate on PCI student loans for the years ended December 31, 2018, 2017 and 2016 was 0.63% ,0.71% and 0.52% , respectively.
GeographicalDistributionofLoans
The Company originates credit card loans throughout the United States. The geographic distribution of the Company’s credit card loanreceivables was as follows (dollars in millions):
December 31,
2018 2017
$ % $ %
California $ 6,620 9.1% $ 6,006 8.9%
Texas 6,155 8.4 5,664 8.4
New York 5,040 6.9 4,701 7.0
Florida 4,815 6.6 4,262 6.3
Illinois 3,878 5.3 3,624 5.4
Pennsylvania 3,712 5.1 3,481 5.2
Ohio 3,039 4.2 2,838 4.2
New Jersey 2,661 3.7 2,486 3.7
Georgia 2,160 3.0 1,967 2.9
Michigan 2,042 2.8 1,893 2.8
Other 32,754 44.9 30,369 45.2
Total credit card loans $ 72,876 100% $ 67,291 100%
The Company originates personal loans, student loans and other loans, and has PCI loans throughout the United States. The geographicdistribution of personal, student, other and PCI loan receivables was as follows (dollars in millions):
December 31,
2018 2017
$ % $ %
New York $ 1,834 10.4% $ 1,838 10.8%
California 1,656 9.4 1,579 9.3
Pennsylvania 1,221 6.9 1,183 7.0
Illinois 1,098 6.2 1,048 6.2
Texas 1,071 6.1 1,031 6.1
New Jersey 925 5.2 878 5.2
Florida 838 4.8 766 4.5
Ohio 698 4.0 673 4.0
Massachusetts 584 3.3 579 3.4
Michigan 560 3.2 555 3.3
Other 7,151 40.5 6,827 40.2
Total other loans (including PCI loans) $ 17,636 100% $ 16,957 100%
5. Credit Card and Student Loan Securitization ActivitiesThe Company’s securitizations are accounted for as secured borrowings and the related trusts are treated as consolidated subsidiaries of the
Company. For a description of the Company’s principles of consolidation with respect to VIEs, see Note 1: Background and Basis of Presentation.
- 102 -
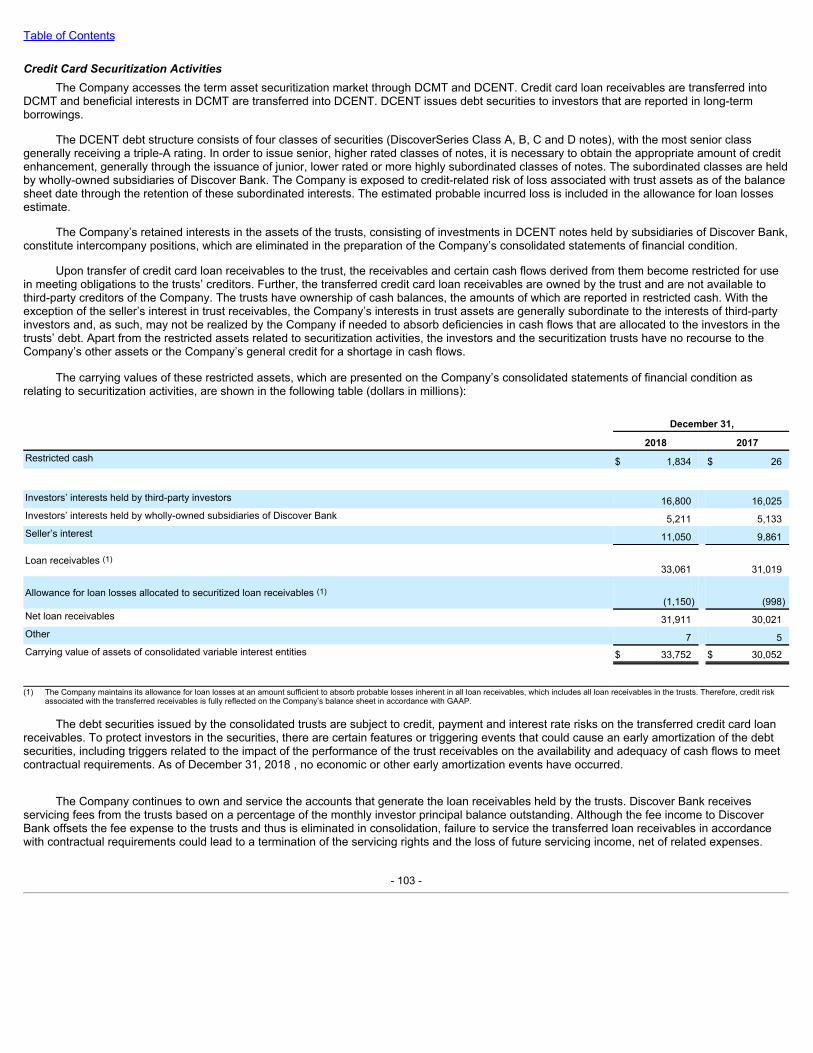
Table of Contents
CreditCardSecuritizationActivitiesThe Company accesses the term asset securitization market through DCMT and DCENT. Credit card loan receivables are transferred into
DCMT and beneficial interests in DCMT are transferred into DCENT. DCENT issues debt securities to investors that are reported in long-termborrowings.
The DCENT debt structure consists of four classes of securities (DiscoverSeries Class A, B, C and D notes), with the most senior classgenerally receiving a triple-A rating. In order to issue senior, higher rated classes of notes, it is necessary to obtain the appropriate amount of creditenhancement, generally through the issuance of junior, lower rated or more highly subordinated classes of notes. The subordinated classes are heldby wholly-owned subsidiaries of Discover Bank. The Company is exposed to credit-related risk of loss associated with trust assets as of the balancesheet date through the retention of these subordinated interests. The estimated probable incurred loss is included in the allowance for loan lossesestimate.
The Company’s retained interests in the assets of the trusts, consisting of investments in DCENT notes held by subsidiaries of Discover Bank,constitute intercompany positions, which are eliminated in the preparation of the Company’s consolidated statements of financial condition.
Upon transfer of credit card loan receivables to the trust, the receivables and certain cash flows derived from them become restricted for usein meeting obligations to the trusts’ creditors. Further, the transferred credit card loan receivables are owned by the trust and are not available tothird-party creditors of the Company. The trusts have ownership of cash balances, the amounts of which are reported in restricted cash. With theexception of the seller’s interest in trust receivables, the Company’s interests in trust assets are generally subordinate to the interests of third-partyinvestors and, as such, may not be realized by the Company if needed to absorb deficiencies in cash flows that are allocated to the investors in thetrusts’ debt. Apart from the restricted assets related to securitization activities, the investors and the securitization trusts have no recourse to theCompany’s other assets or the Company’s general credit for a shortage in cash flows.
The carrying values of these restricted assets, which are presented on the Company’s consolidated statements of financial condition asrelating to securitization activities, are shown in the following table (dollars in millions):
December 31, 2018 2017Restricted cash $ 1,834 $ 26
Investors’ interests held by third-party investors 16,800 16,025Investors’ interests held by wholly-owned subsidiaries of Discover Bank 5,211 5,133Seller’s interest 11,050 9,861
Loan receivables (1)33,061 31,019
Allowance for loan losses allocated to securitized loan receivables (1)(1,150) (998)
Net loan receivables 31,911 30,021Other 7 5Carrying value of assets of consolidated variable interest entities $ 33,752 $ 30,052
(1) The Company maintains its allowance for loan losses at an amount sufficient to absorb probable losses inherent in all loan receivables, which includes all loan receivables in the trusts. Therefore, credit risk
associated with the transferred receivables is fully reflected on the Company’s balance sheet in accordance with GAAP.
The debt securities issued by the consolidated trusts are subject to credit, payment and interest rate risks on the transferred credit card loanreceivables. To protect investors in the securities, there are certain features or triggering events that could cause an early amortization of the debtsecurities, including triggers related to the impact of the performance of the trust receivables on the availability and adequacy of cash flows to meetcontractual requirements. As of December 31, 2018 , no economic or other early amortization events have occurred.
The Company continues to own and service the accounts that generate the loan receivables held by the trusts. Discover Bank receivesservicing fees from the trusts based on a percentage of the monthly investor principal balance outstanding. Although the fee income to DiscoverBank offsets the fee expense to the trusts and thus is eliminated in consolidation, failure to service the transferred loan receivables in accordancewith contractual requirements could lead to a termination of the servicing rights and the loss of future servicing income, net of related expenses.
- 103 -
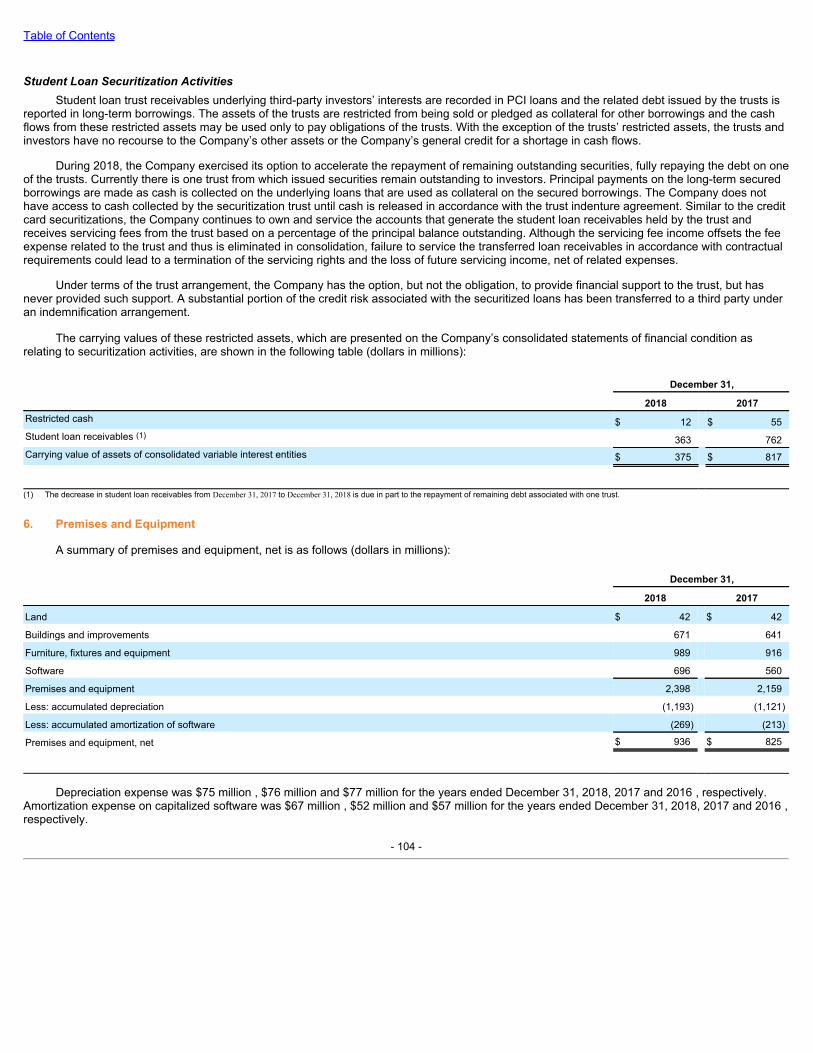
Table of Contents
StudentLoanSecuritizationActivitiesStudent loan trust receivables underlying third-party investors’ interests are recorded in PCI loans and the related debt issued by the trusts is
reported in long-term borrowings. The assets of the trusts are restricted from being sold or pledged as collateral for other borrowings and the cashflows from these restricted assets may be used only to pay obligations of the trusts. With the exception of the trusts’ restricted assets, the trusts andinvestors have no recourse to the Company’s other assets or the Company’s general credit for a shortage in cash flows.
During 2018, the Company exercised its option to accelerate the repayment of remaining outstanding securities, fully repaying the debt on oneof the trusts. Currently there is one trust from which issued securities remain outstanding to investors. Principal payments on the long-term securedborrowings are made as cash is collected on the underlying loans that are used as collateral on the secured borrowings. The Company does nothave access to cash collected by the securitization trust until cash is released in accordance with the trust indenture agreement. Similar to the creditcard securitizations, the Company continues to own and service the accounts that generate the student loan receivables held by the trust andreceives servicing fees from the trust based on a percentage of the principal balance outstanding. Although the servicing fee income offsets the feeexpense related to the trust and thus is eliminated in consolidation, failure to service the transferred loan receivables in accordance with contractualrequirements could lead to a termination of the servicing rights and the loss of future servicing income, net of related expenses.
Under terms of the trust arrangement, the Company has the option, but not the obligation, to provide financial support to the trust, but hasnever provided such support. A substantial portion of the credit risk associated with the securitized loans has been transferred to a third party underan indemnification arrangement.
The carrying values of these restricted assets, which are presented on the Company’s consolidated statements of financial condition asrelating to securitization activities, are shown in the following table (dollars in millions):
December 31,
2018 2017Restricted cash $ 12 $ 55Student loan receivables (1) 363 762Carrying value of assets of consolidated variable interest entities $ 375 $ 817
(1) The decrease in student loan receivables from December 31, 2017 to December 31, 2018 is due in part to the repayment of remaining debt associated with one trust.
6. Premises and Equipment
A summary of premises and equipment, net is as follows (dollars in millions):
December 31, 2018 2017
Land $ 42 $ 42
Buildings and improvements 671 641
Furniture, fixtures and equipment 989 916
Software 696 560
Premises and equipment 2,398 2,159
Less: accumulated depreciation (1,193) (1,121)
Less: accumulated amortization of software (269) (213)
Premises and equipment, net $ 936 $ 825
Depreciation expense was $75 million , $76 million and $77 million for the years ended December 31, 2018, 2017 and 2016 , respectively.Amortization expense on capitalized software was $67 million , $52 million and $57 million for the years ended December 31, 2018, 2017 and 2016 ,respectively.
- 104 -
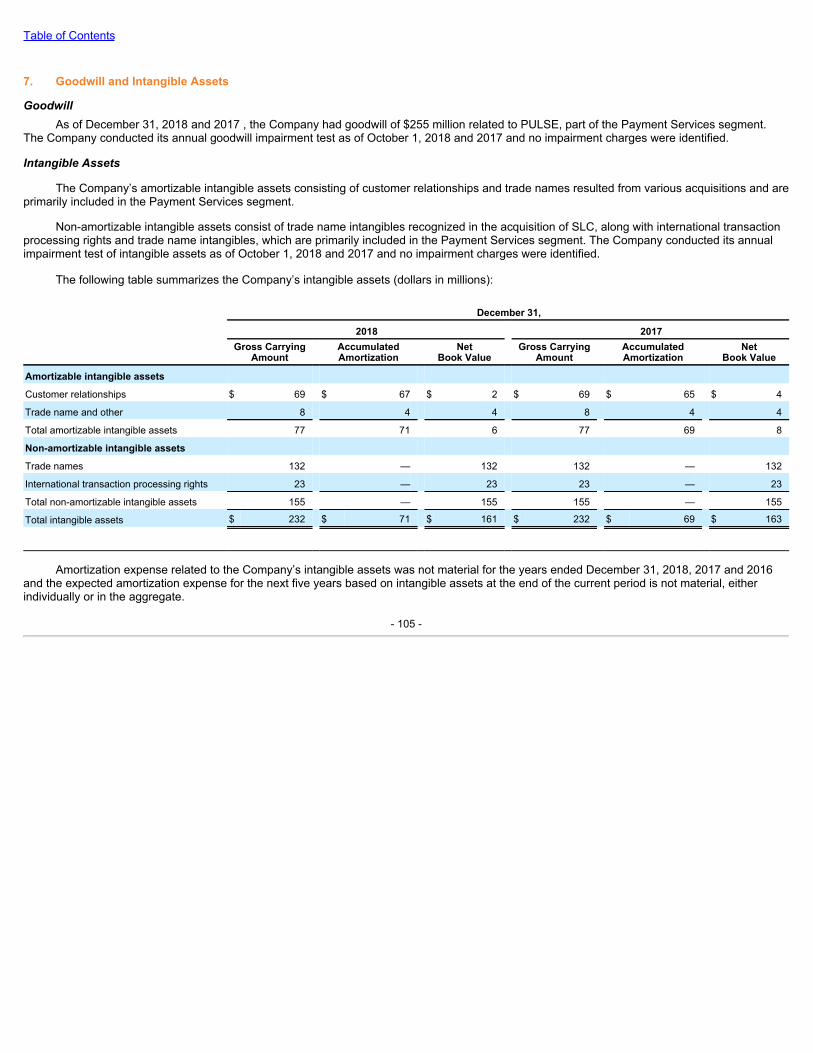
Table of Contents
7. Goodwill and Intangible Assets
GoodwillAs of December 31, 2018 and 2017 , the Company had goodwill of $255 million related to PULSE, part of the Payment Services segment.
The Company conducted its annual goodwill impairment test as of October 1, 2018 and 2017 and no impairment charges were identified.
IntangibleAssets
The Company’s amortizable intangible assets consisting of customer relationships and trade names resulted from various acquisitions and areprimarily included in the Payment Services segment.
Non-amortizable intangible assets consist of trade name intangibles recognized in the acquisition of SLC, along with international transactionprocessing rights and trade name intangibles, which are primarily included in the Payment Services segment. The Company conducted its annualimpairment test of intangible assets as of October 1, 2018 and 2017 and no impairment charges were identified.
The following table summarizes the Company’s intangible assets (dollars in millions):
December 31, 2018 2017
Gross Carrying
Amount AccumulatedAmortization
NetBook Value
Gross CarryingAmount
AccumulatedAmortization
NetBook Value
Amortizable intangible assets
Customer relationships $ 69 $ 67 $ 2 $ 69 $ 65 $ 4
Trade name and other 8 4 4 8 4 4
Total amortizable intangible assets 77 71 6 77 69 8
Non-amortizable intangible assets
Trade names 132 — 132 132 — 132
International transaction processing rights 23 — 23 23 — 23
Total non-amortizable intangible assets 155 — 155 155 — 155
Total intangible assets $ 232 $ 71 $ 161 $ 232 $ 69 $ 163
Amortization expense related to the Company’s intangible assets was not material for the years ended December 31, 2018, 2017 and 2016and the expected amortization expense for the next five years based on intangible assets at the end of the current period is not material, eitherindividually or in the aggregate.
- 105 -
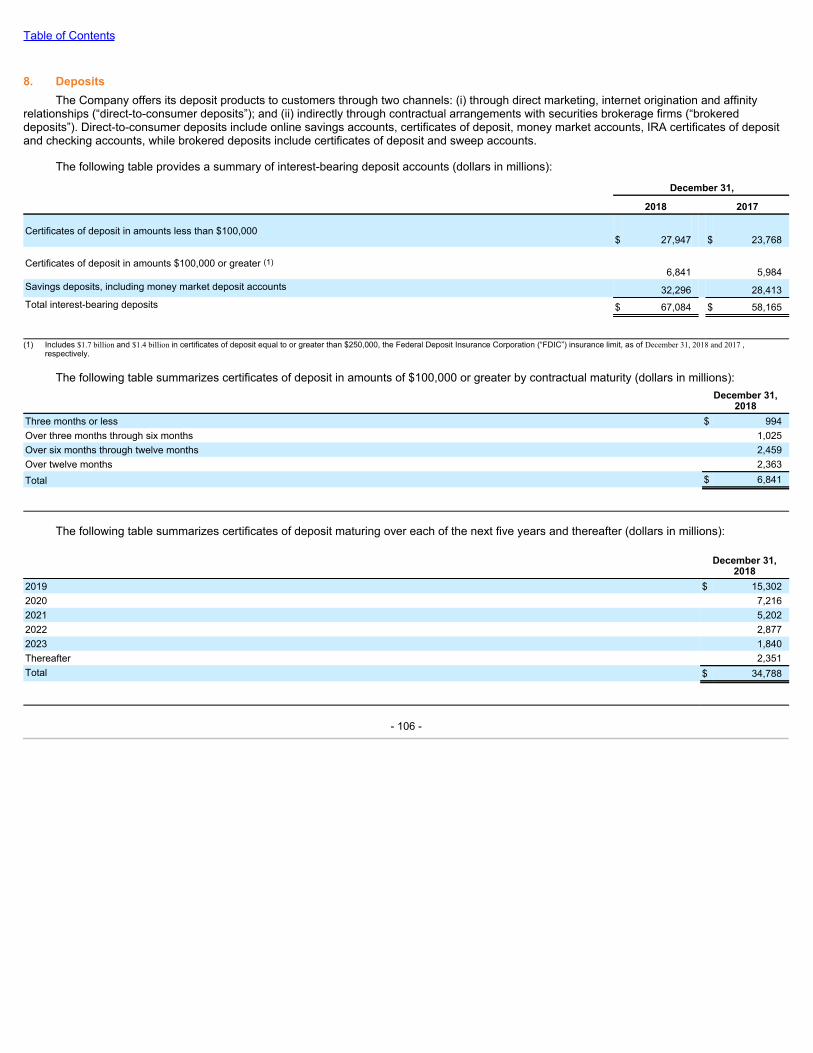
Table of Contents
8. DepositsThe Company offers its deposit products to customers through two channels: (i) through direct marketing, internet origination and affinity
relationships (“direct-to-consumer deposits”); and (ii) indirectly through contractual arrangements with securities brokerage firms (“brokereddeposits”). Direct-to-consumer deposits include online savings accounts, certificates of deposit, money market accounts, IRA certificates of depositand checking accounts, while brokered deposits include certificates of deposit and sweep accounts.
The following table provides a summary of interest-bearing deposit accounts (dollars in millions): December 31, 2018 2017
Certificates of deposit in amounts less than $100,000$ 27,947 $ 23,768
Certificates of deposit in amounts $100,000 or greater (1)6,841 5,984
Savings deposits, including money market deposit accounts 32,296 28,413Total interest-bearing deposits $ 67,084 $ 58,165
(1) Includes $1.7 billion and $1.4 billion in certificates of deposit equal to or greater than $250,000, the Federal Deposit Insurance Corporation (“FDIC”) insurance limit, as of December 31, 2018 and 2017 ,
respectively.
The following table summarizes certificates of deposit in amounts of $100,000 or greater by contractual maturity (dollars in millions):
December 31,
2018Three months or less $ 994Over three months through six months 1,025Over six months through twelve months 2,459Over twelve months 2,363Total $ 6,841
The following table summarizes certificates of deposit maturing over each of the next five years and thereafter (dollars in millions):
December 31,
20182019 $ 15,3022020 7,2162021 5,2022022 2,8772023 1,840Thereafter 2,351Total $ 34,788
- 106 -
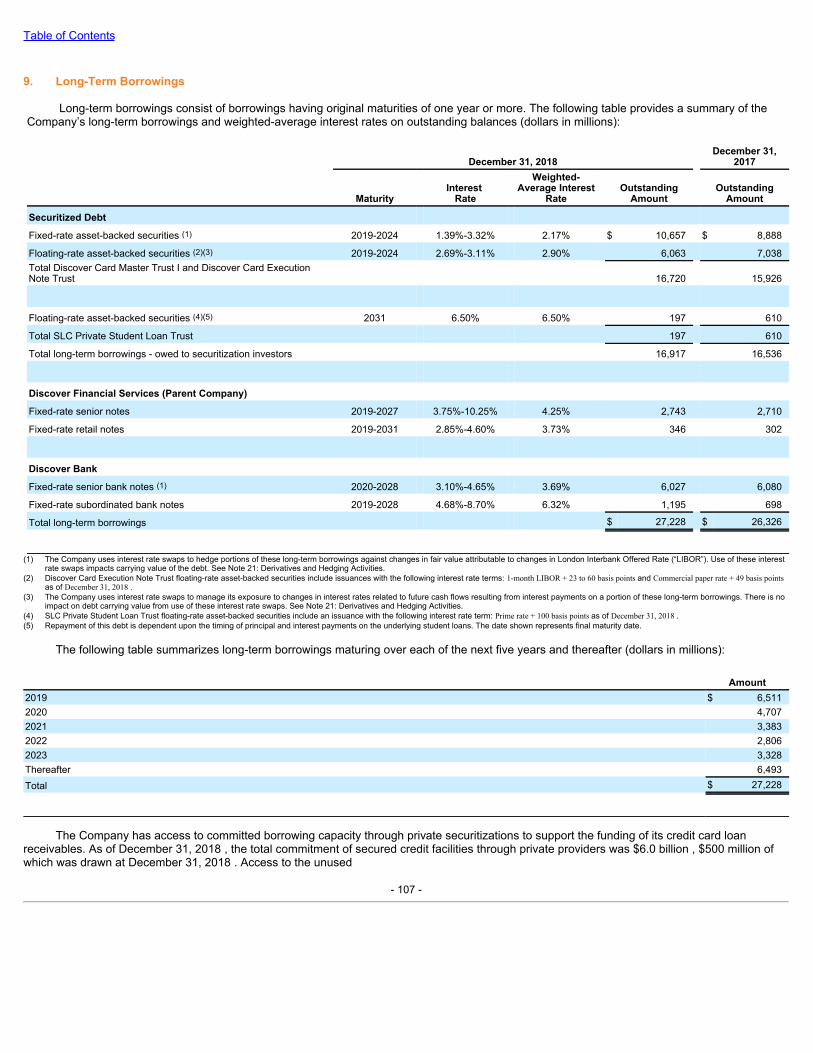
Table of Contents
9. Long-Term Borrowings
Long-term borrowings consist of borrowings having original maturities of one year or more. The following table provides a summary of theCompany’s long-term borrowings and weighted-average interest rates on outstanding balances (dollars in millions):
December 31, 2018 December 31,
2017
Maturity Interest
Rate
Weighted-Average Interest
Rate Outstanding
Amount Outstanding
Amount
Securitized Debt
Fixed-rate asset-backed securities (1) 2019-2024 1.39%-3.32% 2.17% $ 10,657 $ 8,888
Floating-rate asset-backed securities (2)(3) 2019-2024 2.69%-3.11% 2.90% 6,063 7,038Total Discover Card Master Trust I and Discover Card ExecutionNote Trust 16,720 15,926
Floating-rate asset-backed securities (4)(5) 2031 6.50% 6.50% 197 610
Total SLC Private Student Loan Trust 197 610
Total long-term borrowings - owed to securitization investors 16,917 16,536
Discover Financial Services (Parent Company)
Fixed-rate senior notes 2019-2027 3.75%-10.25% 4.25% 2,743 2,710
Fixed-rate retail notes 2019-2031 2.85%-4.60% 3.73% 346 302
Discover Bank
Fixed-rate senior bank notes (1) 2020-2028 3.10%-4.65% 3.69% 6,027 6,080
Fixed-rate subordinated bank notes 2019-2028 4.68%-8.70% 6.32% 1,195 698
Total long-term borrowings $ 27,228 $ 26,326
(1) The Company uses interest rate swaps to hedge portions of these long-term borrowings against changes in fair value attributable to changes in London Interbank Offered Rate (“LIBOR”). Use of these interest
rate swaps impacts carrying value of the debt. See Note 21: Derivatives and Hedging Activities.(2) Discover Card Execution Note Trust floating-rate asset-backed securities include issuances with the following interest rate terms: 1-month LIBOR + 23 to 60 basis points and Commercial paper rate + 49 basis points
as of December 31, 2018 .(3) The Company uses interest rate swaps to manage its exposure to changes in interest rates related to future cash flows resulting from interest payments on a portion of these long-term borrowings. There is no
impact on debt carrying value from use of these interest rate swaps. See Note 21: Derivatives and Hedging Activities.(4) SLC Private Student Loan Trust floating-rate asset-backed securities include an issuance with the following interest rate term: Prime rate + 100 basis points as of December 31, 2018 .(5) Repayment of this debt is dependent upon the timing of principal and interest payments on the underlying student loans. The date shown represents final maturity date.
The following table summarizes long-term borrowings maturing over each of the next five years and thereafter (dollars in millions):
Amount2019 $ 6,5112020 4,7072021 3,3832022 2,8062023 3,328Thereafter 6,493Total $ 27,228
The Company has access to committed borrowing capacity through private securitizations to support the funding of its credit card loanreceivables. As of December 31, 2018 , the total commitment of secured credit facilities through private providers was $6.0 billion , $500 million ofwhich was drawn at December 31, 2018 . Access to the unused
- 107 -
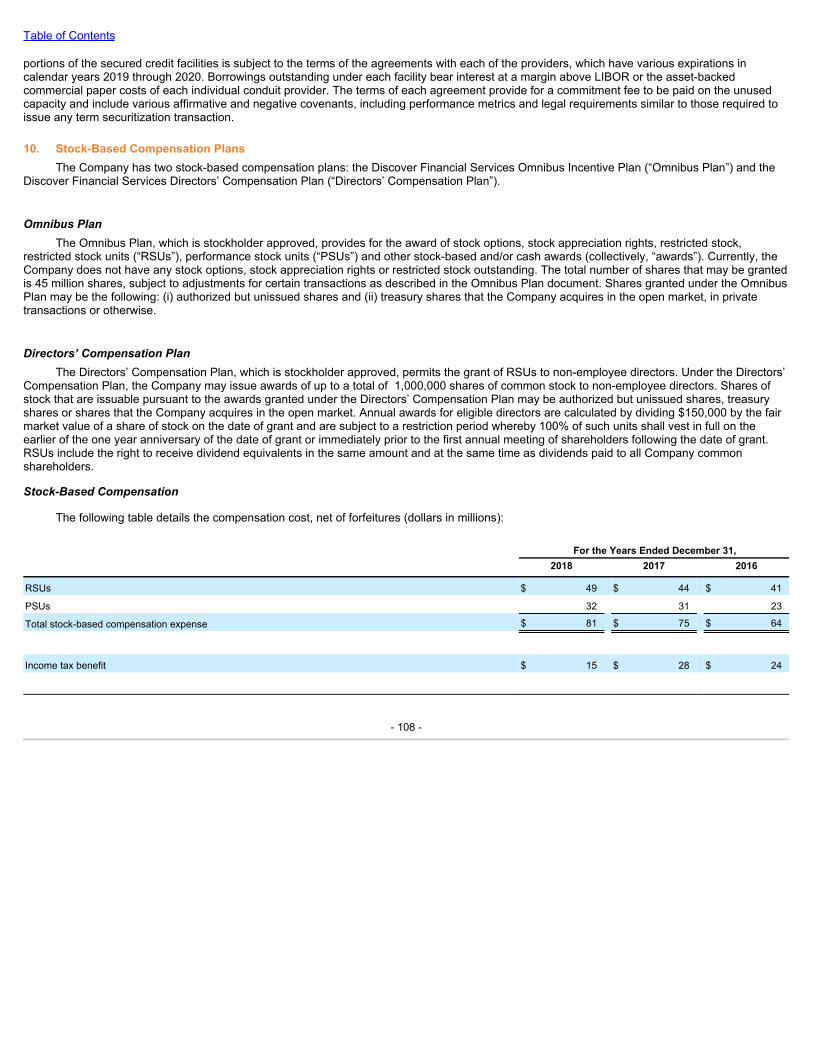
Table of Contents
portions of the secured credit facilities is subject to the terms of the agreements with each of the providers, which have various expirations incalendar years 2019 through 2020. Borrowings outstanding under each facility bear interest at a margin above LIBOR or the asset-backedcommercial paper costs of each individual conduit provider. The terms of each agreement provide for a commitment fee to be paid on the unusedcapacity and include various affirmative and negative covenants, including performance metrics and legal requirements similar to those required toissue any term securitization transaction.
10. Stock-Based Compensation PlansThe Company has two stock-based compensation plans: the Discover Financial Services Omnibus Incentive Plan (“Omnibus Plan”) and the
Discover Financial Services Directors’ Compensation Plan (“Directors’ Compensation Plan”).
OmnibusPlanThe Omnibus Plan, which is stockholder approved, provides for the award of stock options, stock appreciation rights, restricted stock,
restricted stock units (“RSUs”), performance stock units (“PSUs”) and other stock-based and/or cash awards (collectively, “awards”). Currently, theCompany does not have any stock options, stock appreciation rights or restricted stock outstanding. The total number of shares that may be grantedis 45 million shares, subject to adjustments for certain transactions as described in the Omnibus Plan document. Shares granted under the OmnibusPlan may be the following: (i) authorized but unissued shares and (ii) treasury shares that the Company acquires in the open market, in privatetransactions or otherwise.
Directors’CompensationPlanThe Directors’ Compensation Plan, which is stockholder approved, permits the grant of RSUs to non-employee directors. Under the Directors’
Compensation Plan, the Company may issue awards of up to a total of 1,000,000 shares of common stock to non-employee directors. Shares ofstock that are issuable pursuant to the awards granted under the Directors’ Compensation Plan may be authorized but unissued shares, treasuryshares or shares that the Company acquires in the open market. Annual awards for eligible directors are calculated by dividing $150,000 by the fairmarket value of a share of stock on the date of grant and are subject to a restriction period whereby 100% of such units shall vest in full on theearlier of the one year anniversary of the date of grant or immediately prior to the first annual meeting of shareholders following the date of grant.RSUs include the right to receive dividend equivalents in the same amount and at the same time as dividends paid to all Company commonshareholders.
Stock-BasedCompensation
The following table details the compensation cost, net of forfeitures (dollars in millions):
For the Years Ended December 31, 2018 2017 2016
RSUs $ 49 $ 44 $ 41
PSUs 32 31 23
Total stock-based compensation expense $ 81 $ 75 $ 64
Income tax benefit $ 15 $ 28 $ 24
- 108 -
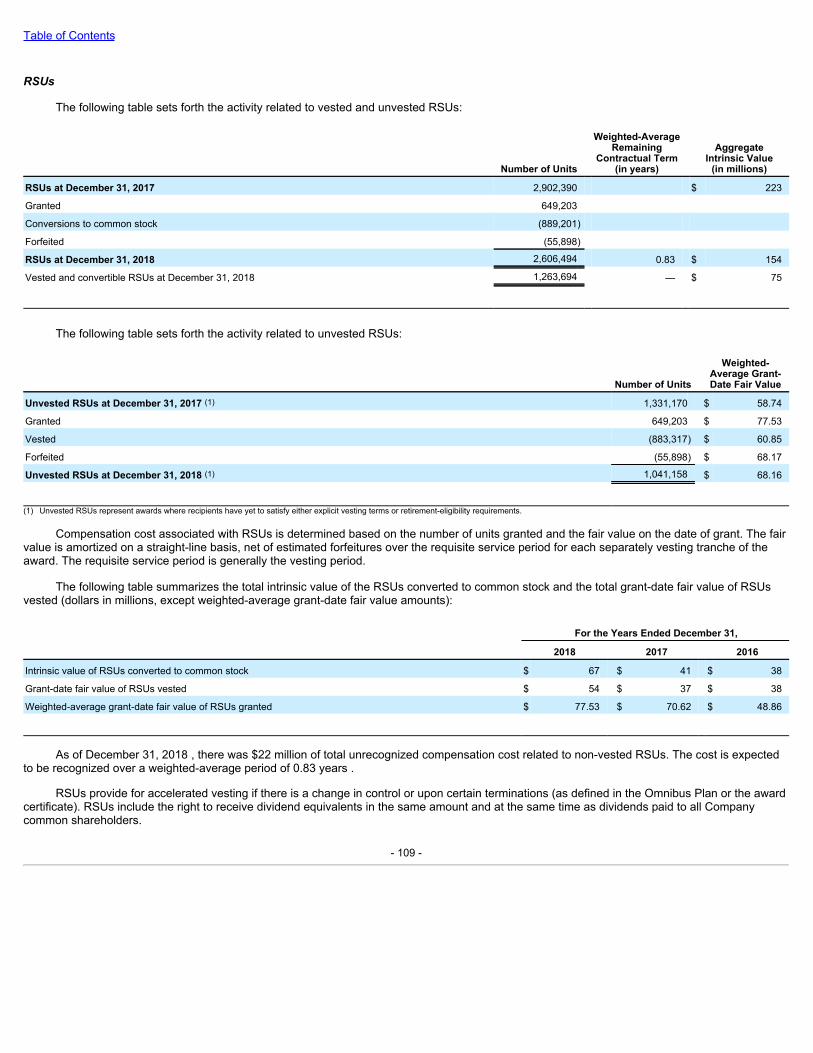
Table of Contents
RSUs
The following table sets forth the activity related to vested and unvested RSUs:
Number of Units
Weighted-AverageRemaining
Contractual Term(in years)
AggregateIntrinsic Value
(in millions)
RSUs at December 31, 2017 2,902,390 $ 223
Granted 649,203
Conversions to common stock (889,201)
Forfeited (55,898)
RSUs at December 31, 2018 2,606,494 0.83 $ 154
Vested and convertible RSUs at December 31, 2018 1,263,694 — $ 75
The following table sets forth the activity related to unvested RSUs:
Number of Units
Weighted-Average Grant-Date Fair Value
Unvested RSUs at December 31, 2017 (1) 1,331,170 $ 58.74
Granted 649,203 $ 77.53
Vested (883,317) $ 60.85
Forfeited (55,898) $ 68.17
Unvested RSUs at December 31, 2018 (1) 1,041,158 $ 68.16
(1) Unvested RSUs represent awards where recipients have yet to satisfy either explicit vesting terms or retirement-eligibility requirements.
Compensation cost associated with RSUs is determined based on the number of units granted and the fair value on the date of grant. The fairvalue is amortized on a straight-line basis, net of estimated forfeitures over the requisite service period for each separately vesting tranche of theaward. The requisite service period is generally the vesting period.
The following table summarizes the total intrinsic value of the RSUs converted to common stock and the total grant-date fair value of RSUsvested (dollars in millions, except weighted-average grant-date fair value amounts):
For the Years Ended December 31, 2018 2017 2016
Intrinsic value of RSUs converted to common stock $ 67 $ 41 $ 38
Grant-date fair value of RSUs vested $ 54 $ 37 $ 38
Weighted-average grant-date fair value of RSUs granted $ 77.53 $ 70.62 $ 48.86
As of December 31, 2018 , there was $22 million of total unrecognized compensation cost related to non-vested RSUs. The cost is expectedto be recognized over a weighted-average period of 0.83 years .
RSUs provide for accelerated vesting if there is a change in control or upon certain terminations (as defined in the Omnibus Plan or the awardcertificate). RSUs include the right to receive dividend equivalents in the same amount and at the same time as dividends paid to all Companycommon shareholders.
- 109 -
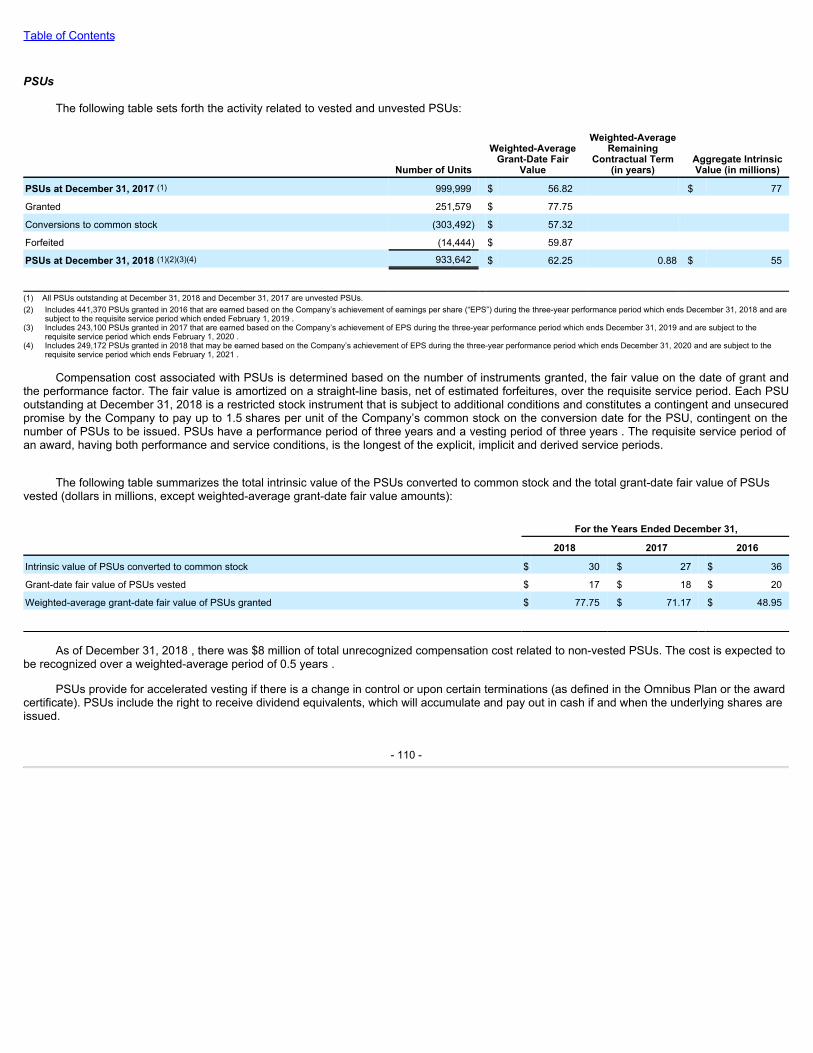
Table of Contents
PSUs
The following table sets forth the activity related to vested and unvested PSUs:
Number of Units
Weighted-AverageGrant-Date Fair
Value
Weighted-AverageRemaining
Contractual Term(in years)
Aggregate IntrinsicValue (in millions)
PSUs at December 31, 2017 (1) 999,999 $ 56.82 $ 77
Granted 251,579 $ 77.75
Conversions to common stock (303,492) $ 57.32
Forfeited (14,444) $ 59.87
PSUs at December 31, 2018 (1)(2)(3)(4) 933,642 $ 62.25 0.88 $ 55
(1) All PSUs outstanding at December 31, 2018 and December 31, 2017 are unvested PSUs.(2) Includes 441,370 PSUs granted in 2016 that are earned based on the Company’s achievement of earnings per share (“EPS”) during the three-year performance period which ends December 31, 2018 and are
subject to the requisite service period which ended February 1, 2019 .(3) Includes 243,100 PSUs granted in 2017 that are earned based on the Company’s achievement of EPS during the three-year performance period which ends December 31, 2019 and are subject to the
requisite service period which ends February 1, 2020 .(4) Includes 249,172 PSUs granted in 2018 that may be earned based on the Company’s achievement of EPS during the three-year performance period which ends December 31, 2020 and are subject to the
requisite service period which ends February 1, 2021 .
Compensation cost associated with PSUs is determined based on the number of instruments granted, the fair value on the date of grant andthe performance factor. The fair value is amortized on a straight-line basis, net of estimated forfeitures, over the requisite service period. Each PSUoutstanding at December 31, 2018 is a restricted stock instrument that is subject to additional conditions and constitutes a contingent and unsecuredpromise by the Company to pay up to 1.5 shares per unit of the Company’s common stock on the conversion date for the PSU, contingent on thenumber of PSUs to be issued. PSUs have a performance period of three years and a vesting period of three years . The requisite service period ofan award, having both performance and service conditions, is the longest of the explicit, implicit and derived service periods.
The following table summarizes the total intrinsic value of the PSUs converted to common stock and the total grant-date fair value of PSUsvested (dollars in millions, except weighted-average grant-date fair value amounts):
For the Years Ended December 31, 2018 2017 2016
Intrinsic value of PSUs converted to common stock $ 30 $ 27 $ 36
Grant-date fair value of PSUs vested $ 17 $ 18 $ 20
Weighted-average grant-date fair value of PSUs granted $ 77.75 $ 71.17 $ 48.95
As of December 31, 2018 , there was $8 million of total unrecognized compensation cost related to non-vested PSUs. The cost is expected tobe recognized over a weighted-average period of 0.5 years .
PSUs provide for accelerated vesting if there is a change in control or upon certain terminations (as defined in the Omnibus Plan or the awardcertificate). PSUs include the right to receive dividend equivalents, which will accumulate and pay out in cash if and when the underlying shares areissued.
- 110 -
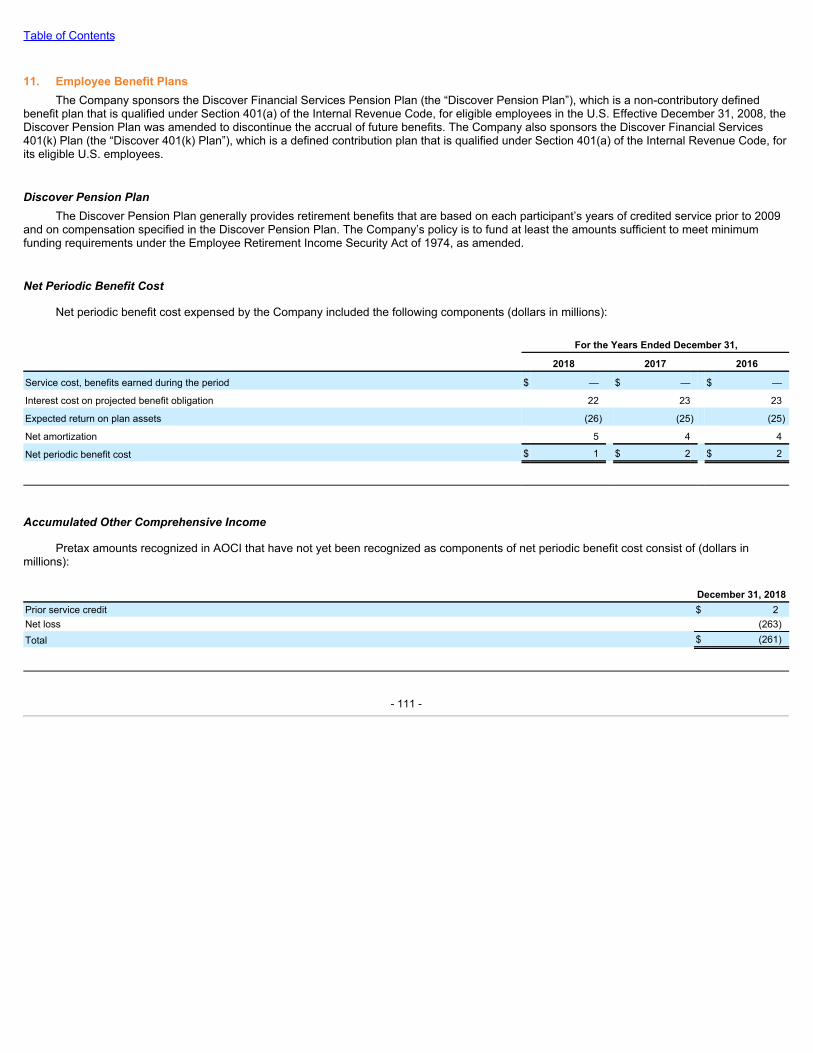
Table of Contents
11. Employee Benefit PlansThe Company sponsors the Discover Financial Services Pension Plan (the “Discover Pension Plan”), which is a non-contributory defined
benefit plan that is qualified under Section 401(a) of the Internal Revenue Code, for eligible employees in the U.S. Effective December 31, 2008, theDiscover Pension Plan was amended to discontinue the accrual of future benefits. The Company also sponsors the Discover Financial Services401(k) Plan (the “Discover 401(k) Plan”), which is a defined contribution plan that is qualified under Section 401(a) of the Internal Revenue Code, forits eligible U.S. employees.
DiscoverPensionPlanThe Discover Pension Plan generally provides retirement benefits that are based on each participant’s years of credited service prior to 2009
and on compensation specified in the Discover Pension Plan. The Company’s policy is to fund at least the amounts sufficient to meet minimumfunding requirements under the Employee Retirement Income Security Act of 1974, as amended.
NetPeriodicBenefitCost
Net periodic benefit cost expensed by the Company included the following components (dollars in millions):
For the Years Ended December 31, 2018 2017 2016
Service cost, benefits earned during the period $ — $ — $ —
Interest cost on projected benefit obligation 22 23 23
Expected return on plan assets (26) (25) (25)
Net amortization 5 4 4
Net periodic benefit cost $ 1 $ 2 $ 2
AccumulatedOtherComprehensiveIncome
Pretax amounts recognized in AOCI that have not yet been recognized as components of net periodic benefit cost consist of (dollars inmillions):
December 31, 2018Prior service credit $ 2Net loss (263)Total $ (261)
- 111 -
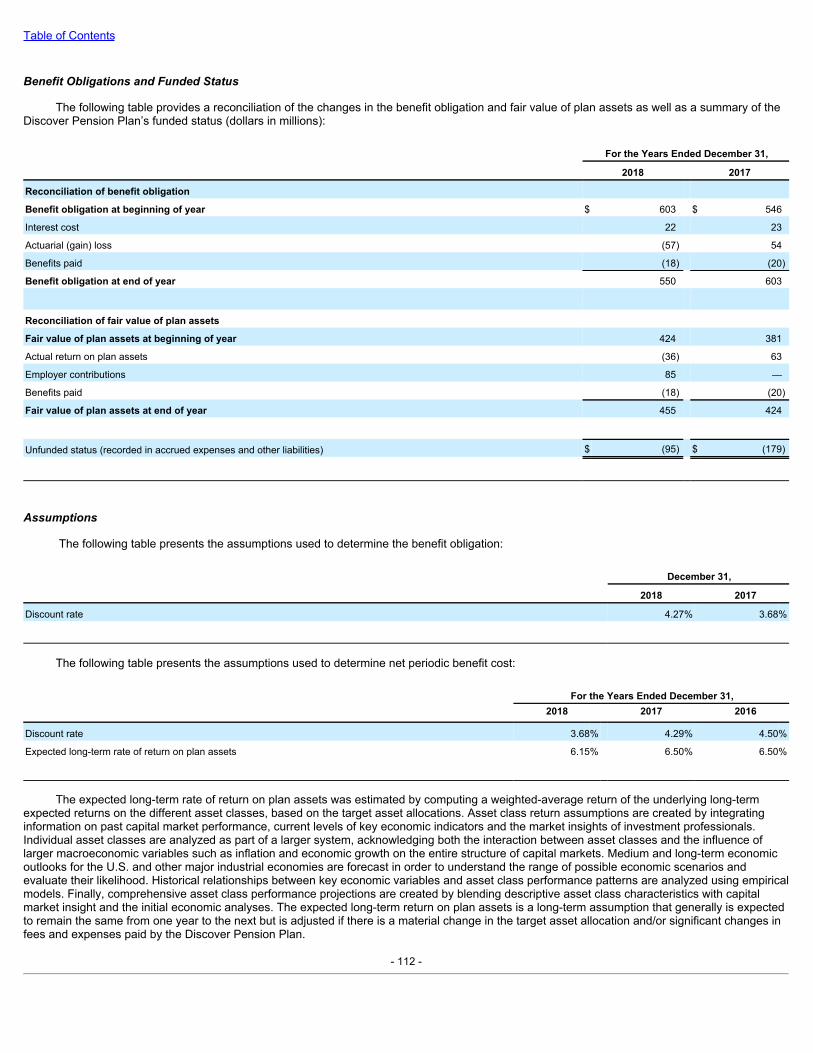
Table of Contents
BenefitObligationsandFundedStatus
The following table provides a reconciliation of the changes in the benefit obligation and fair value of plan assets as well as a summary of theDiscover Pension Plan’s funded status (dollars in millions):
For the Years Ended December 31, 2018 2017
Reconciliation of benefit obligation
Benefit obligation at beginning of year $ 603 $ 546
Interest cost 22 23
Actuarial (gain) loss (57) 54
Benefits paid (18) (20)
Benefit obligation at end of year 550 603
Reconciliation of fair value of plan assets
Fair value of plan assets at beginning of year 424 381
Actual return on plan assets (36) 63
Employer contributions 85 —
Benefits paid (18) (20)
Fair value of plan assets at end of year 455 424
Unfunded status (recorded in accrued expenses and other liabilities) $ (95) $ (179)
Assumptions
The following table presents the assumptions used to determine the benefit obligation:
December 31, 2018 2017
Discount rate 4.27% 3.68%
The following table presents the assumptions used to determine net periodic benefit cost:
For the Years Ended December 31, 2018 2017 2016
Discount rate 3.68% 4.29% 4.50%
Expected long-term rate of return on plan assets 6.15% 6.50% 6.50%
The expected long-term rate of return on plan assets was estimated by computing a weighted-average return of the underlying long-termexpected returns on the different asset classes, based on the target asset allocations. Asset class return assumptions are created by integratinginformation on past capital market performance, current levels of key economic indicators and the market insights of investment professionals.Individual asset classes are analyzed as part of a larger system, acknowledging both the interaction between asset classes and the influence oflarger macroeconomic variables such as inflation and economic growth on the entire structure of capital markets. Medium and long-term economicoutlooks for the U.S. and other major industrial economies are forecast in order to understand the range of possible economic scenarios andevaluate their likelihood. Historical relationships between key economic variables and asset class performance patterns are analyzed using empiricalmodels. Finally, comprehensive asset class performance projections are created by blending descriptive asset class characteristics with capitalmarket insight and the initial economic analyses. The expected long-term return on plan assets is a long-term assumption that generally is expectedto remain the same from one year to the next but is adjusted if there is a material change in the target asset allocation and/or significant changes infees and expenses paid by the Discover Pension Plan.
- 112 -

Table of Contents
DiscoverPensionPlanAssetsThe targeted asset allocation for 2019 by asset class is 66% and 34% for fixed income securities and equity securities, respectively. The
Discover Financial Services Retirement Plan Investment Committee (the “Investment Committee”) determined the asset allocation targets for theDiscover Pension Plan based on its assessment of business and financial conditions, demographic and actuarial data, funding characteristics andrelated risk factors. Other relevant factors, including industry practices and long-term historical and prospective capital market returns wereconsidered as well.
The Discover Pension Plan return objectives provide long-term measures for monitoring the investment performance against growth in thepension obligations. The overall allocation is expected to help protect the Discover Pension Plan’s funded status while generating sufficiently stablereal returns (net of inflation) to help cover current and future benefit payments and to improve the Discover Pension Plan’s funded status. TotalDiscover Pension Plan portfolio performance is assessed by comparing actual returns with relevant benchmarks, such as the S&P 500 Index, theS&P 500 Total Return Index, the Russell 2000 Index and the MSCI All Country World Index.
Both the equity and fixed income portions of the asset allocation use a combination of active and passive investment strategies and differentinvestment styles. The fixed income asset allocation consists of longer duration fixed income securities in order to help reduce plan exposure tointerest rate variation and to better correlate assets with obligations. The longer duration fixed income allocation is expected to help stabilize thefunding status ratio over the long term.
The asset mix of the Discover Pension Plan is reviewed by the Investment Committee on a regular basis. The asset allocation strategy willchange over time in response to changes in the Discover Pension Plan’s funded status.
- 113 -
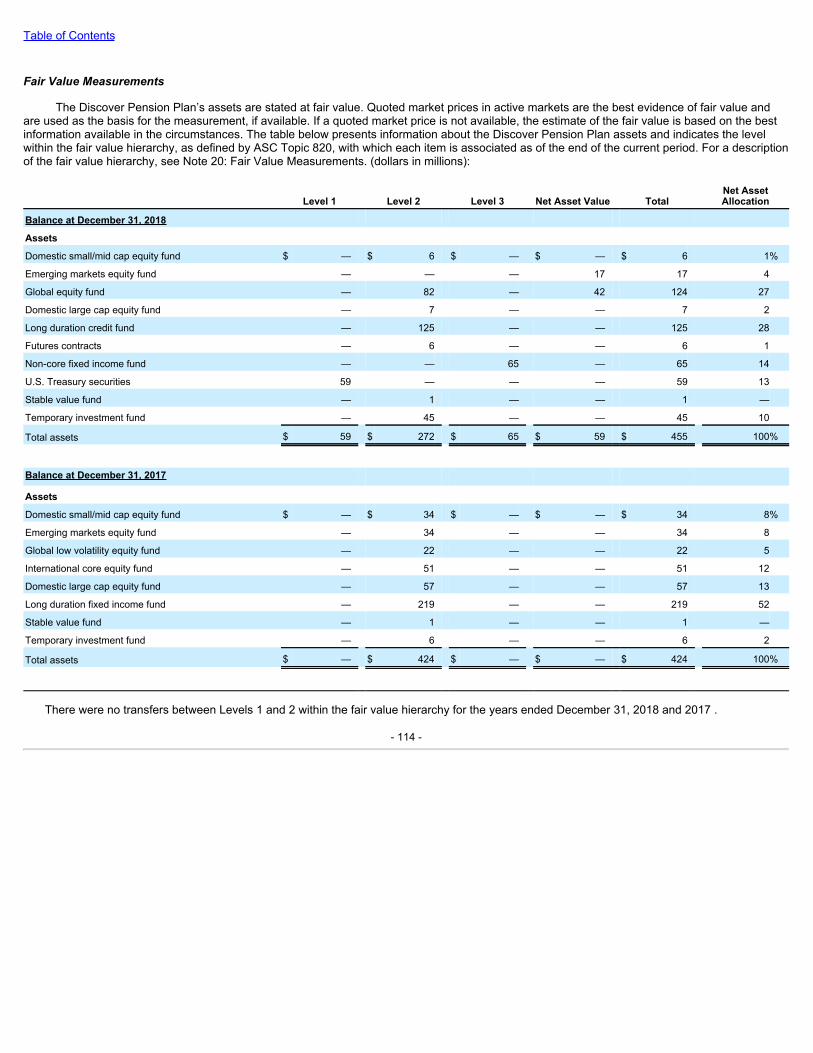
Table of Contents
FairValueMeasurements
The Discover Pension Plan’s assets are stated at fair value. Quoted market prices in active markets are the best evidence of fair value andare used as the basis for the measurement, if available. If a quoted market price is not available, the estimate of the fair value is based on the bestinformation available in the circumstances. The table below presents information about the Discover Pension Plan assets and indicates the levelwithin the fair value hierarchy, as defined by ASC Topic 820, with which each item is associated as of the end of the current period. For a descriptionof the fair value hierarchy, see Note 20: Fair Value Measurements. (dollars in millions):
Level 1 Level 2 Level 3 Net Asset Value Total Net AssetAllocation
Balance at December 31, 2018
Assets
Domestic small/mid cap equity fund $ — $ 6 $ — $ — $ 6 1%
Emerging markets equity fund — — — 17 17 4
Global equity fund — 82 — 42 124 27
Domestic large cap equity fund — 7 — — 7 2
Long duration credit fund — 125 — — 125 28
Futures contracts — 6 — — 6 1
Non-core fixed income fund — — 65 — 65 14
U.S. Treasury securities 59 — — — 59 13
Stable value fund — 1 — — 1 —
Temporary investment fund — 45 — — 45 10
Total assets $ 59 $ 272 $ 65 $ 59 $ 455 100%
Balance at December 31, 2017
Assets
Domestic small/mid cap equity fund $ — $ 34 $ — $ — $ 34 8%
Emerging markets equity fund — 34 — — 34 8
Global low volatility equity fund — 22 — — 22 5
International core equity fund — 51 — — 51 12
Domestic large cap equity fund — 57 — — 57 13
Long duration fixed income fund — 219 — — 219 52
Stable value fund — 1 — — 1 —
Temporary investment fund — 6 — — 6 2
Total assets $ — $ 424 $ — $ — $ 424 100%
There were no transfers between Levels 1 and 2 within the fair value hierarchy for the years ended December 31, 2018 and 2017 .
- 114 -
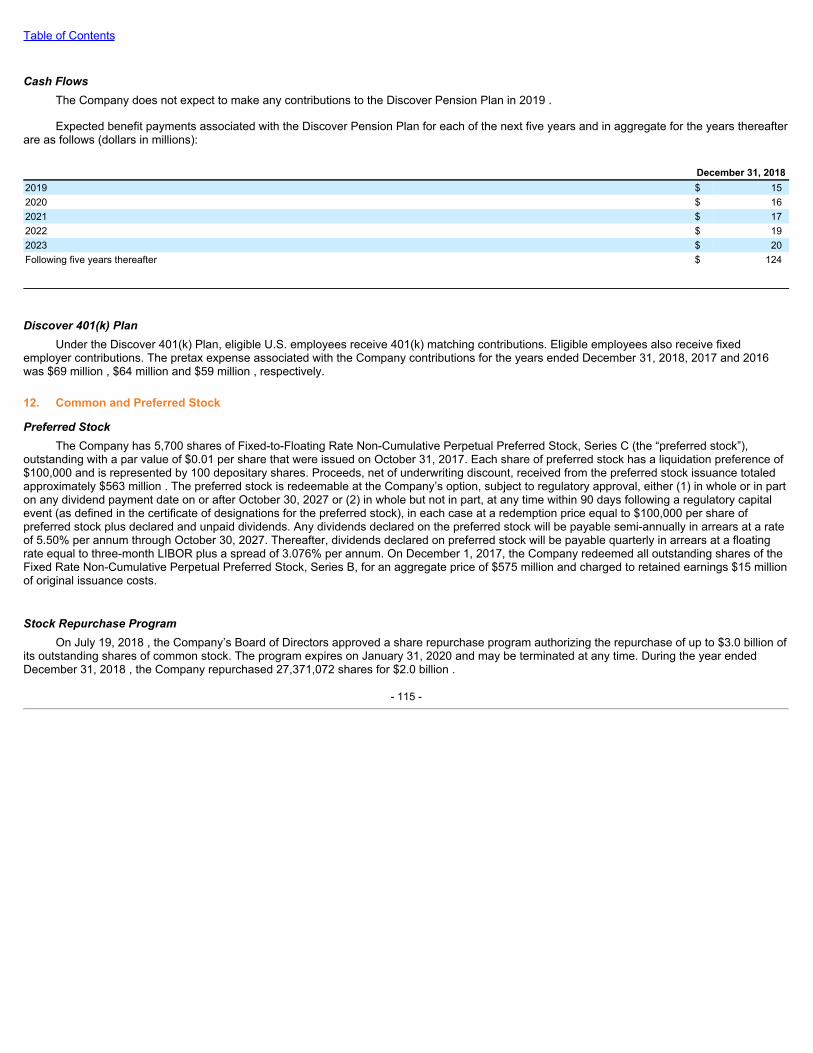
Table of Contents
CashFlowsThe Company does not expect to make any contributions to the Discover Pension Plan in 2019 .
Expected benefit payments associated with the Discover Pension Plan for each of the next five years and in aggregate for the years thereafterare as follows (dollars in millions):
December 31, 20182019 $ 152020 $ 162021 $ 172022 $ 192023 $ 20Following five years thereafter $ 124
Discover401(k)PlanUnder the Discover 401(k) Plan, eligible U.S. employees receive 401(k) matching contributions. Eligible employees also receive fixed
employer contributions. The pretax expense associated with the Company contributions for the years ended December 31, 2018, 2017 and 2016was $69 million , $64 million and $59 million , respectively.
12. Common and Preferred Stock
PreferredStockThe Company has 5,700 shares of Fixed-to-Floating Rate Non-Cumulative Perpetual Preferred Stock, Series C (the “preferred stock”),
outstanding with a par value of $0.01 per share that were issued on October 31, 2017. Each share of preferred stock has a liquidation preference of$100,000 and is represented by 100 depositary shares. Proceeds, net of underwriting discount, received from the preferred stock issuance totaledapproximately $563 million . The preferred stock is redeemable at the Company’s option, subject to regulatory approval, either (1) in whole or in parton any dividend payment date on or after October 30, 2027 or (2) in whole but not in part, at any time within 90 days following a regulatory capitalevent (as defined in the certificate of designations for the preferred stock), in each case at a redemption price equal to $100,000 per share ofpreferred stock plus declared and unpaid dividends. Any dividends declared on the preferred stock will be payable semi-annually in arrears at a rateof 5.50% per annum through October 30, 2027. Thereafter, dividends declared on preferred stock will be payable quarterly in arrears at a floatingrate equal to three-month LIBOR plus a spread of 3.076% per annum. On December 1, 2017, the Company redeemed all outstanding shares of theFixed Rate Non-Cumulative Perpetual Preferred Stock, Series B, for an aggregate price of $575 million and charged to retained earnings $15 millionof original issuance costs.
StockRepurchaseProgramOn July 19, 2018 , the Company’s Board of Directors approved a share repurchase program authorizing the repurchase of up to $3.0 billion of
its outstanding shares of common stock. The program expires on January 31, 2020 and may be terminated at any time. During the year endedDecember 31, 2018 , the Company repurchased 27,371,072 shares for $2.0 billion .
- 115 -
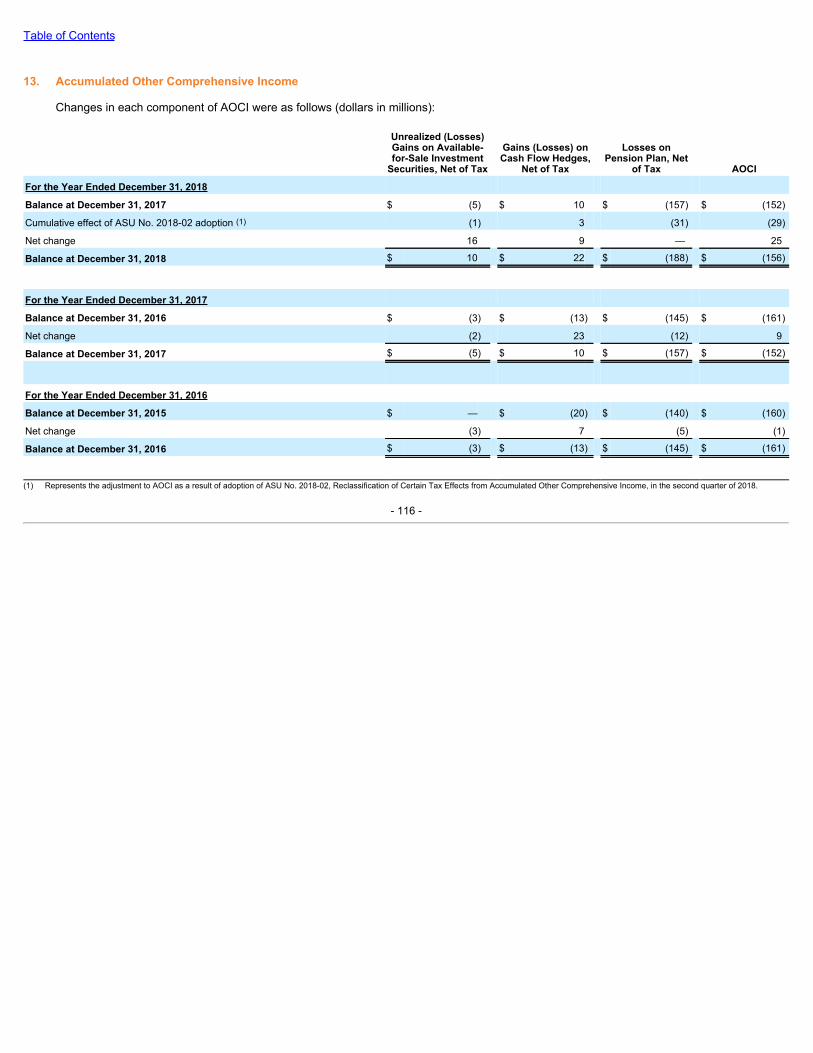
Table of Contents
13. Accumulated Other Comprehensive Income
Changes in each component of AOCI were as follows (dollars in millions):
Unrealized (Losses)Gains on Available-for-Sale Investment
Securities, Net of Tax
Gains (Losses) onCash Flow Hedges,
Net of Tax
Losses onPension Plan, Net
of Tax AOCI
For the Year Ended December 31, 2018
Balance at December 31, 2017 $ (5) $ 10 $ (157) $ (152)
Cumulative effect of ASU No. 2018-02 adoption (1) (1) 3 (31) (29)
Net change 16 9 — 25
Balance at December 31, 2018 $ 10 $ 22 $ (188) $ (156)
For the Year Ended December 31, 2017
Balance at December 31, 2016 $ (3) $ (13) $ (145) $ (161)
Net change (2) 23 (12) 9
Balance at December 31, 2017 $ (5) $ 10 $ (157) $ (152)
For the Year Ended December 31, 2016
Balance at December 31, 2015 $ — $ (20) $ (140) $ (160)
Net change (3) 7 (5) (1)
Balance at December 31, 2016 $ (3) $ (13) $ (145) $ (161)
(1) Represents the adjustment to AOCI as a result of adoption of ASU No. 2018-02, Reclassification of Certain Tax Effects from Accumulated Other Comprehensive Income, in the second quarter of 2018.
- 116 -
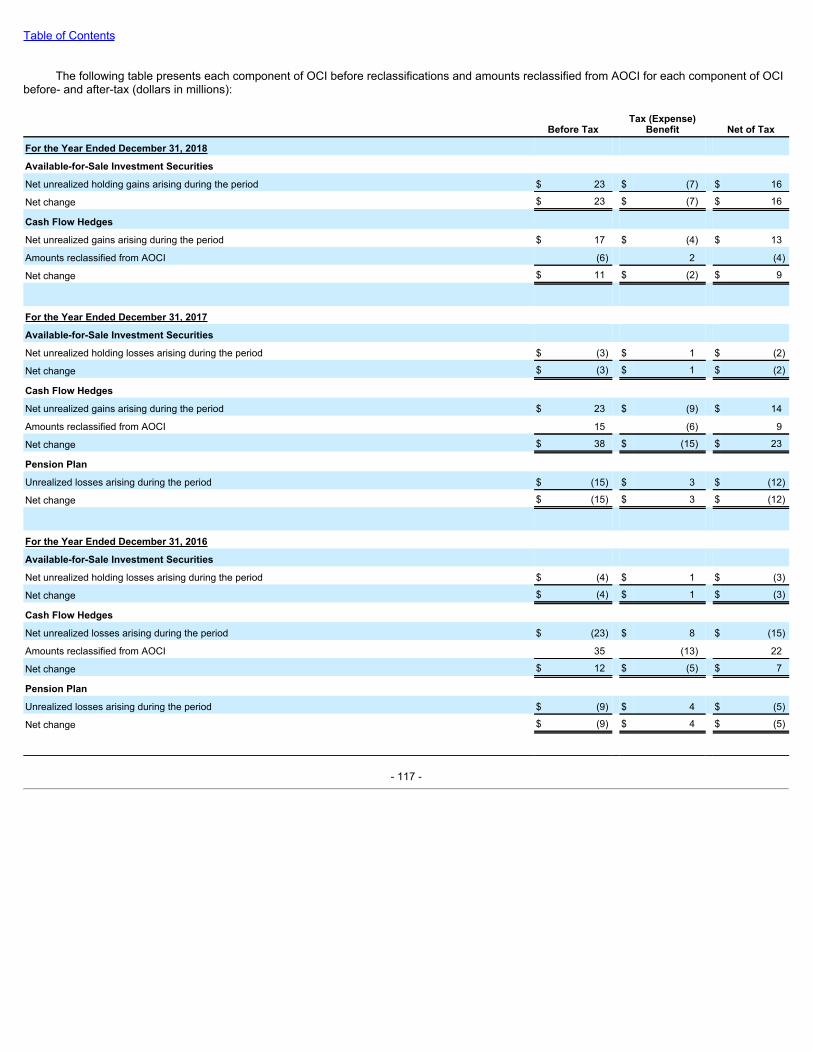
Table of Contents
The following table presents each component of OCI before reclassifications and amounts reclassified from AOCI for each component of OCIbefore- and after-tax (dollars in millions):
Before Tax Tax (Expense)
Benefit Net of Tax
For the Year Ended December 31, 2018
Available-for-Sale Investment Securities
Net unrealized holding gains arising during the period $ 23 $ (7) $ 16
Net change $ 23 $ (7) $ 16
Cash Flow Hedges
Net unrealized gains arising during the period $ 17 $ (4) $ 13
Amounts reclassified from AOCI (6) 2 (4)
Net change $ 11 $ (2) $ 9
For the Year Ended December 31, 2017
Available-for-Sale Investment Securities
Net unrealized holding losses arising during the period $ (3) $ 1 $ (2)
Net change $ (3) $ 1 $ (2)
Cash Flow Hedges
Net unrealized gains arising during the period $ 23 $ (9) $ 14
Amounts reclassified from AOCI 15 (6) 9
Net change $ 38 $ (15) $ 23
Pension Plan
Unrealized losses arising during the period $ (15) $ 3 $ (12)
Net change $ (15) $ 3 $ (12)
For the Year Ended December 31, 2016
Available-for-Sale Investment Securities
Net unrealized holding losses arising during the period $ (4) $ 1 $ (3)
Net change $ (4) $ 1 $ (3)
Cash Flow Hedges
Net unrealized losses arising during the period $ (23) $ 8 $ (15)
Amounts reclassified from AOCI 35 (13) 22
Net change $ 12 $ (5) $ 7
Pension Plan
Unrealized losses arising during the period $ (9) $ 4 $ (5)
Net change $ (9) $ 4 $ (5)
- 117 -
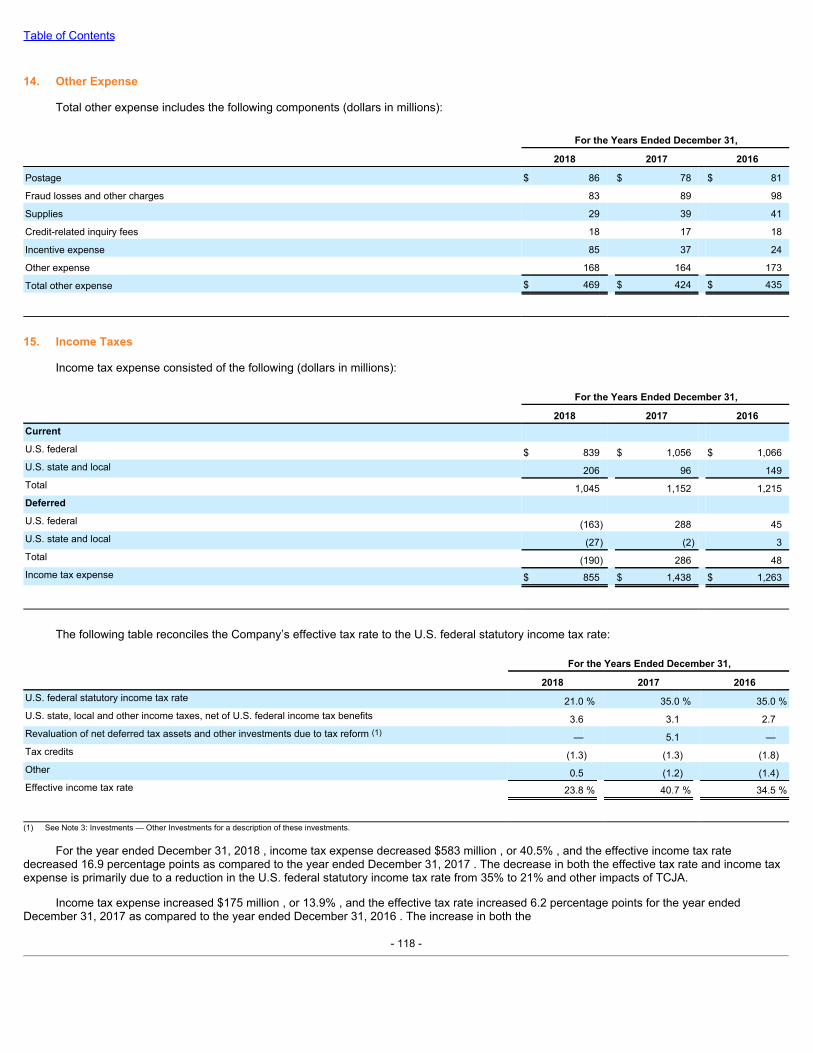
Table of Contents
14. Other Expense
Total other expense includes the following components (dollars in millions):
For the Years Ended December 31, 2018 2017 2016
Postage $ 86 $ 78 $ 81
Fraud losses and other charges 83 89 98
Supplies 29 39 41
Credit-related inquiry fees 18 17 18
Incentive expense 85 37 24
Other expense 168 164 173
Total other expense $ 469 $ 424 $ 435
15. Income Taxes
Income tax expense consisted of the following (dollars in millions):
For the Years Ended December 31,
2018 2017 2016Current U.S. federal $ 839 $ 1,056 $ 1,066U.S. state and local 206 96 149Total 1,045 1,152 1,215Deferred U.S. federal (163) 288 45U.S. state and local (27) (2) 3Total (190) 286 48Income tax expense $ 855 $ 1,438 $ 1,263
The following table reconciles the Company’s effective tax rate to the U.S. federal statutory income tax rate:
For the Years Ended December 31,
2018 2017 2016U.S. federal statutory income tax rate 21.0 % 35.0 % 35.0 %U.S. state, local and other income taxes, net of U.S. federal income tax benefits 3.6 3.1 2.7Revaluation of net deferred tax assets and other investments due to tax reform (1) — 5.1 —Tax credits (1.3) (1.3) (1.8)Other 0.5 (1.2) (1.4)Effective income tax rate 23.8 % 40.7 % 34.5 %
(1) See Note 3: Investments — Other Investments for a description of these investments.
For the year ended December 31, 2018 , income tax expense decreased $583 million , or 40.5% , and the effective income tax ratedecreased 16.9 percentage points as compared to the year ended December 31, 2017 . The decrease in both the effective tax rate and income taxexpense is primarily due to a reduction in the U.S. federal statutory income tax rate from 35% to 21% and other impacts of TCJA.
Income tax expense increased $175 million , or 13.9% , and the effective tax rate increased 6.2 percentage points for the year endedDecember 31, 2017 as compared to the year ended December 31, 2016 . The increase in both the
- 118 -
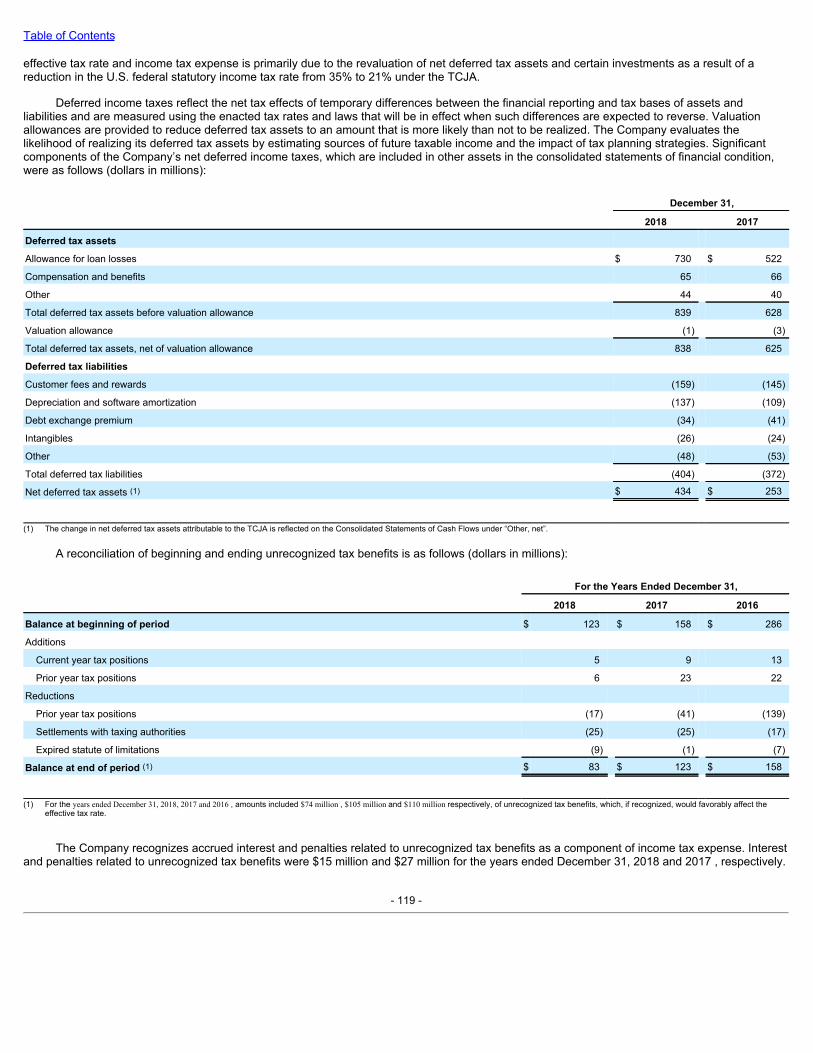
Table of Contents
effective tax rate and income tax expense is primarily due to the revaluation of net deferred tax assets and certain investments as a result of areduction in the U.S. federal statutory income tax rate from 35% to 21% under the TCJA.
Deferred income taxes reflect the net tax effects of temporary differences between the financial reporting and tax bases of assets andliabilities and are measured using the enacted tax rates and laws that will be in effect when such differences are expected to reverse. Valuationallowances are provided to reduce deferred tax assets to an amount that is more likely than not to be realized. The Company evaluates thelikelihood of realizing its deferred tax assets by estimating sources of future taxable income and the impact of tax planning strategies. Significantcomponents of the Company’s net deferred income taxes, which are included in other assets in the consolidated statements of financial condition,were as follows (dollars in millions):
December 31, 2018 2017
Deferred tax assets
Allowance for loan losses $ 730 $ 522
Compensation and benefits 65 66
Other 44 40
Total deferred tax assets before valuation allowance 839 628
Valuation allowance (1) (3)
Total deferred tax assets, net of valuation allowance 838 625
Deferred tax liabilities
Customer fees and rewards (159) (145)
Depreciation and software amortization (137) (109)
Debt exchange premium (34) (41)
Intangibles (26) (24)
Other (48) (53)
Total deferred tax liabilities (404) (372)
Net deferred tax assets (1) $ 434 $ 253
(1) The change in net deferred tax assets attributable to the TCJA is reflected on the Consolidated Statements of Cash Flows under “Other, net”.
A reconciliation of beginning and ending unrecognized tax benefits is as follows (dollars in millions):
For the Years Ended December 31, 2018 2017 2016
Balance at beginning of period $ 123 $ 158 $ 286
Additions
Current year tax positions 5 9 13
Prior year tax positions 6 23 22
Reductions
Prior year tax positions (17) (41) (139)
Settlements with taxing authorities (25) (25) (17)
Expired statute of limitations (9) (1) (7)
Balance at end of period (1) $ 83 $ 123 $ 158
(1) For the years ended December 31, 2018, 2017 and 2016 , amounts included $74 million , $105 million and $110 million respectively, of unrecognized tax benefits, which, if recognized, would favorably affect the
effective tax rate.
The Company recognizes accrued interest and penalties related to unrecognized tax benefits as a component of income tax expense. Interestand penalties related to unrecognized tax benefits were $15 million and $27 million for the years ended December 31, 2018 and 2017 , respectively.
- 119 -
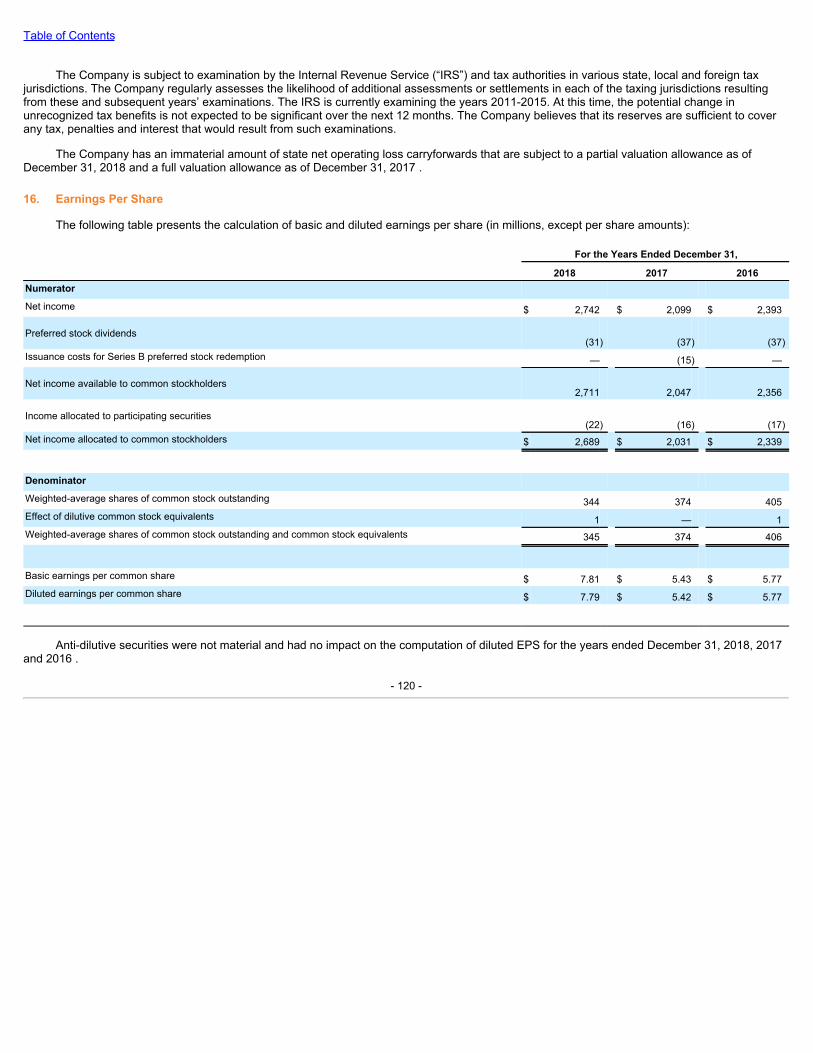
Table of Contents
The Company is subject to examination by the Internal Revenue Service (“IRS”) and tax authorities in various state, local and foreign taxjurisdictions. The Company regularly assesses the likelihood of additional assessments or settlements in each of the taxing jurisdictions resultingfrom these and subsequent years’ examinations. The IRS is currently examining the years 2011-2015. At this time, the potential change inunrecognized tax benefits is not expected to be significant over the next 12 months. The Company believes that its reserves are sufficient to coverany tax, penalties and interest that would result from such examinations.
The Company has an immaterial amount of state net operating loss carryforwards that are subject to a partial valuation allowance as ofDecember 31, 2018 and a full valuation allowance as of December 31, 2017 .
16. Earnings Per Share
The following table presents the calculation of basic and diluted earnings per share (in millions, except per share amounts):
For the Years Ended December 31,
2018 2017 2016Numerator Net income $ 2,742 $ 2,099 $ 2,393
Preferred stock dividends(31) (37) (37)
Issuance costs for Series B preferred stock redemption — (15) —
Net income available to common stockholders2,711 2,047 2,356
Income allocated to participating securities(22) (16) (17)
Net income allocated to common stockholders $ 2,689 $ 2,031 $ 2,339
Denominator Weighted-average shares of common stock outstanding 344 374 405Effect of dilutive common stock equivalents 1 — 1Weighted-average shares of common stock outstanding and common stock equivalents 345 374 406
Basic earnings per common share $ 7.81 $ 5.43 $ 5.77Diluted earnings per common share $ 7.79 $ 5.42 $ 5.77
Anti-dilutive securities were not material and had no impact on the computation of diluted EPS for the years ended December 31, 2018, 2017and 2016 .
- 120 -
Table of Contents
17. Capital AdequacyThe Company is subject to the capital adequacy guidelines of the Federal Reserve, and Discover Bank, the Company’s main banking
subsidiary, is subject to various regulatory capital requirements as administered by the FDIC. Failure to meet minimum capital requirements canresult in the initiation of certain mandatory and possibly additional discretionary actions by regulators that, if undertaken, could have a direct materialeffect on the financial position and results of the Company and Discover Bank. Under capital adequacy guidelines and the regulatory framework forprompt corrective action, the Company and Discover Bank must meet specific capital guidelines that involve quantitative measures of assets,liabilities and certain off-balance sheet items, as calculated under regulatory guidelines. Capital amounts and classification are also subject toqualitative judgments by the regulators about components, risk weightings and other factors.
In 2013, the Federal Reserve, the Office of the Comptroller of the Currency, and the FDIC issued final capital rules under the BaselCommittee’s December 2010 framework (referred to as “Basel III”) establishing a new comprehensive capital framework for U.S. bankingorganizations. The final capital rules (“Basel III rules”) substantially revise Basel I rules regarding the risk-based capital requirements applicable tobank holding companies and depository institutions, including the Company. The Basel III rules, which became effective for the Company onJanuary 1, 2015, are subject to phase-in periods through the end of 2018. This timing is based on the Company being classified as a “StandardizedApproach” entity.
Among other things, the Basel III rules (i) introduced a new capital measure called Common Equity Tier 1 (“CET1”), (ii) specify that Tier 1capital consists of CET1 and additional Tier 1 capital instruments meeting specified requirements, (iii) apply most deductions/adjustments toregulatory capital measures to CET1 and not to the other components of capital, thus potentially requiring higher levels of CET1 in order to meetminimum ratios and (iv) expand the scope of the deductions/adjustments from capital as compared to existing regulations.
The Basel III minimum capital ratios are as follows:
• 8.0% Total capital (i.e., Tier 1 plus Tier 2) to risk-weighted assets;• 6.0% Tier 1 capital (i.e., CET1 plus Additional Tier 1) to risk-weighted assets;• 4.0% Tier 1 capital to average consolidated assets as reported on consolidated financial statements (known as the “leverage ratio”); and• 4.5% CET1 to risk-weighted assets.
As of December 31, 2018 , the Company and Discover Bank met all Basel III minimum capital ratio requirements to which they were subject.The Company and Discover Bank also met the requirements to be considered “well-capitalized” under Regulation Y and prompt corrective actionregulations, respectively, and there have been no conditions or events that management believes have changed the Company’s or Discover Bank’scategory. To be categorized as “well-capitalized,” the Company and Discover Bank must maintain minimum capital ratios as set forth in the tablebelow.
- 121 -
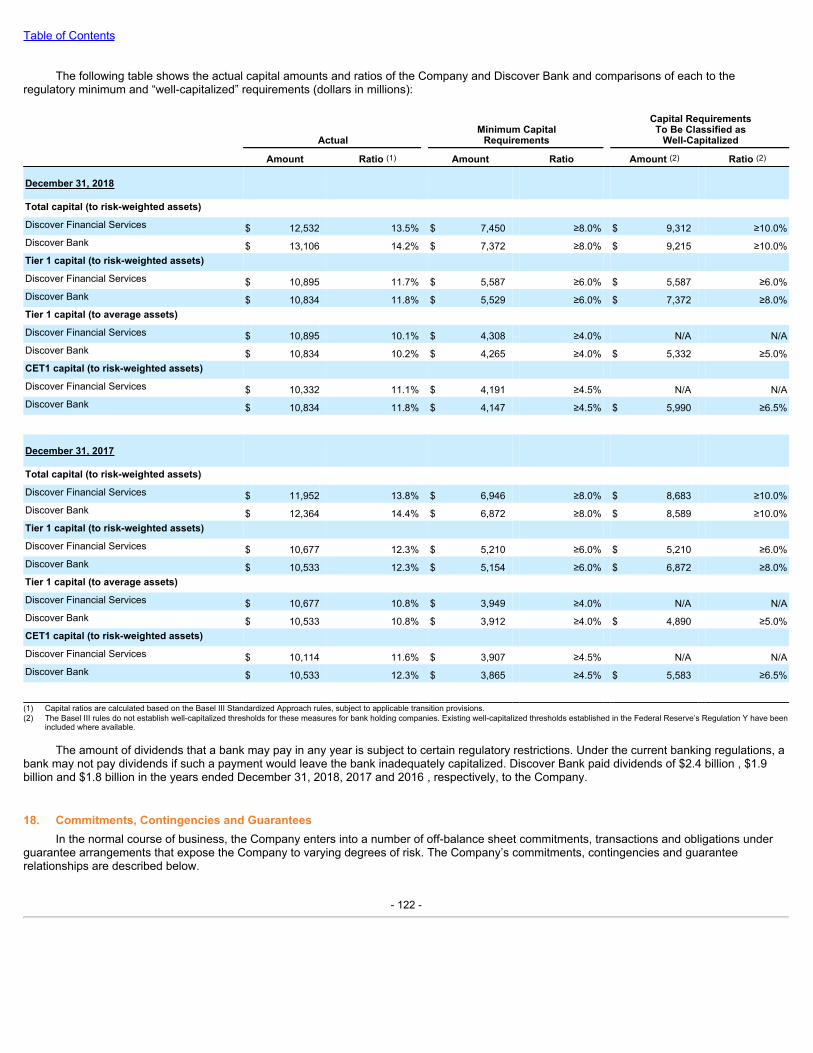
Table of Contents
The following table shows the actual capital amounts and ratios of the Company and Discover Bank and comparisons of each to theregulatory minimum and “well-capitalized” requirements (dollars in millions):
Actual Minimum Capital
Requirements
Capital RequirementsTo Be Classified as
Well-Capitalized
Amount Ratio (1) Amount Ratio Amount (2) Ratio (2)
December 31, 2018 Total capital (to risk-weighted assets) Discover Financial Services $ 12,532 13.5% $ 7,450 ≥8.0% $ 9,312 ≥10.0%Discover Bank $ 13,106 14.2% $ 7,372 ≥8.0% $ 9,215 ≥10.0%Tier 1 capital (to risk-weighted assets) Discover Financial Services $ 10,895 11.7% $ 5,587 ≥6.0% $ 5,587 ≥6.0%Discover Bank $ 10,834 11.8% $ 5,529 ≥6.0% $ 7,372 ≥8.0%Tier 1 capital (to average assets) Discover Financial Services $ 10,895 10.1% $ 4,308 ≥4.0% N/A N/ADiscover Bank $ 10,834 10.2% $ 4,265 ≥4.0% $ 5,332 ≥5.0%CET1 capital (to risk-weighted assets) Discover Financial Services $ 10,332 11.1% $ 4,191 ≥4.5% N/A N/ADiscover Bank $ 10,834 11.8% $ 4,147 ≥4.5% $ 5,990 ≥6.5%
December 31, 2017 Total capital (to risk-weighted assets) Discover Financial Services $ 11,952 13.8% $ 6,946 ≥8.0% $ 8,683 ≥10.0%Discover Bank $ 12,364 14.4% $ 6,872 ≥8.0% $ 8,589 ≥10.0%Tier 1 capital (to risk-weighted assets) Discover Financial Services $ 10,677 12.3% $ 5,210 ≥6.0% $ 5,210 ≥6.0%Discover Bank $ 10,533 12.3% $ 5,154 ≥6.0% $ 6,872 ≥8.0%Tier 1 capital (to average assets) Discover Financial Services $ 10,677 10.8% $ 3,949 ≥4.0% N/A N/ADiscover Bank $ 10,533 10.8% $ 3,912 ≥4.0% $ 4,890 ≥5.0%CET1 capital (to risk-weighted assets) Discover Financial Services $ 10,114 11.6% $ 3,907 ≥4.5% N/A N/ADiscover Bank $ 10,533 12.3% $ 3,865 ≥4.5% $ 5,583 ≥6.5% (1) Capital ratios are calculated based on the Basel III Standardized Approach rules, subject to applicable transition provisions.(2) The Basel III rules do not establish well-capitalized thresholds for these measures for bank holding companies. Existing well-capitalized thresholds established in the Federal Reserve’s Regulation Y have been
included where available.
The amount of dividends that a bank may pay in any year is subject to certain regulatory restrictions. Under the current banking regulations, abank may not pay dividends if such a payment would leave the bank inadequately capitalized. Discover Bank paid dividends of $2.4 billion , $1.9billion and $1.8 billion in the years ended December 31, 2018, 2017 and 2016 , respectively, to the Company.
18. Commitments, Contingencies and GuaranteesIn the normal course of business, the Company enters into a number of off-balance sheet commitments, transactions and obligations under
guarantee arrangements that expose the Company to varying degrees of risk. The Company’s commitments, contingencies and guaranteerelationships are described below.
- 122 -
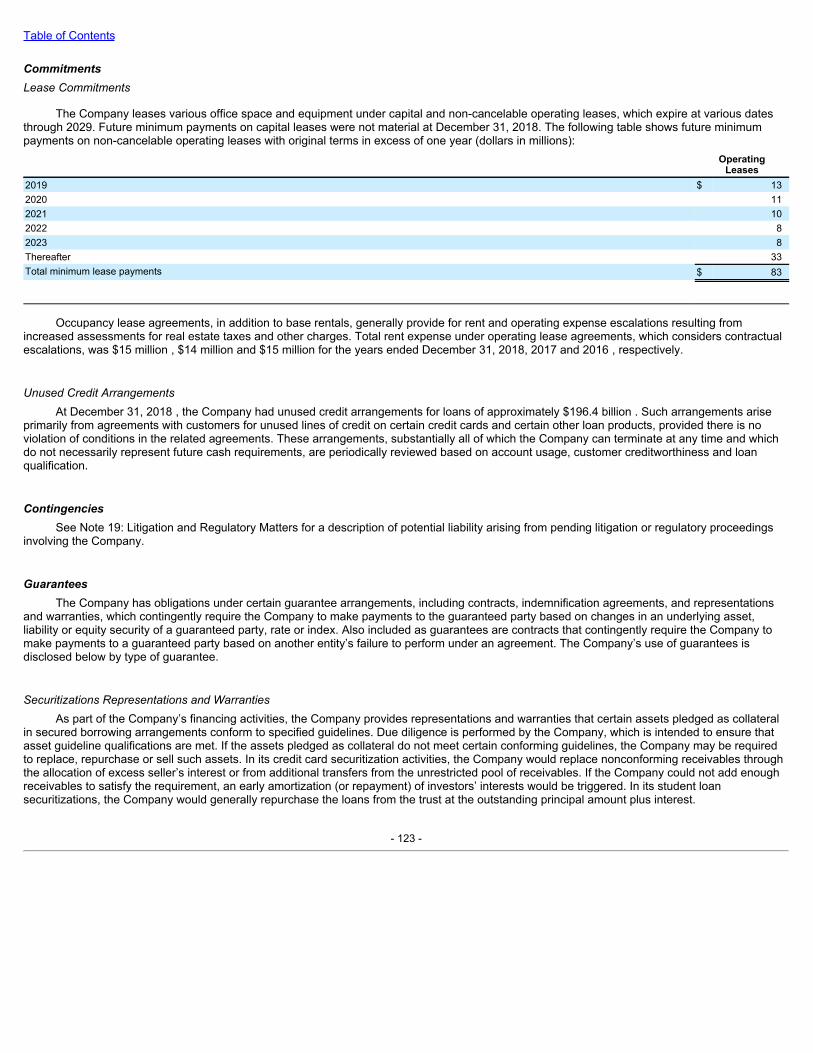
Table of Contents
CommitmentsLeaseCommitments
The Company leases various office space and equipment under capital and non-cancelable operating leases, which expire at various datesthrough 2029. Future minimum payments on capital leases were not material at December 31, 2018. The following table shows future minimumpayments on non-cancelable operating leases with original terms in excess of one year (dollars in millions):
Operating
Leases2019 $ 132020 112021 102022 82023 8Thereafter 33Total minimum lease payments $ 83
Occupancy lease agreements, in addition to base rentals, generally provide for rent and operating expense escalations resulting fromincreased assessments for real estate taxes and other charges. Total rent expense under operating lease agreements, which considers contractualescalations, was $15 million , $14 million and $15 million for the years ended December 31, 2018, 2017 and 2016 , respectively.
UnusedCreditArrangementsAt December 31, 2018 , the Company had unused credit arrangements for loans of approximately $196.4 billion . Such arrangements arise
primarily from agreements with customers for unused lines of credit on certain credit cards and certain other loan products, provided there is noviolation of conditions in the related agreements. These arrangements, substantially all of which the Company can terminate at any time and whichdo not necessarily represent future cash requirements, are periodically reviewed based on account usage, customer creditworthiness and loanqualification.
ContingenciesSee Note 19: Litigation and Regulatory Matters for a description of potential liability arising from pending litigation or regulatory proceedings
involving the Company.
GuaranteesThe Company has obligations under certain guarantee arrangements, including contracts, indemnification agreements, and representations
and warranties, which contingently require the Company to make payments to the guaranteed party based on changes in an underlying asset,liability or equity security of a guaranteed party, rate or index. Also included as guarantees are contracts that contingently require the Company tomake payments to a guaranteed party based on another entity’s failure to perform under an agreement. The Company’s use of guarantees isdisclosed below by type of guarantee.
SecuritizationsRepresentationsandWarrantiesAs part of the Company’s financing activities, the Company provides representations and warranties that certain assets pledged as collateral
in secured borrowing arrangements conform to specified guidelines. Due diligence is performed by the Company, which is intended to ensure thatasset guideline qualifications are met. If the assets pledged as collateral do not meet certain conforming guidelines, the Company may be requiredto replace, repurchase or sell such assets. In its credit card securitization activities, the Company would replace nonconforming receivables throughthe allocation of excess seller’s interest or from additional transfers from the unrestricted pool of receivables. If the Company could not add enoughreceivables to satisfy the requirement, an early amortization (or repayment) of investors’ interests would be triggered. In its student loansecuritizations, the Company would generally repurchase the loans from the trust at the outstanding principal amount plus interest.
- 123 -
Table of Contents
The maximum potential amount of future payments the Company could be required to make would be equal to the current outstandingbalances of third-party investor interests in credit card asset-backed securities, and the principal amount of any student loan secured borrowings,plus any unpaid interest for the corresponding secured borrowings. The Company has recorded substantially all of the maximum potential amount offuture payments in long-term borrowings on the Company’s consolidated statements of financial condition. The Company has not recorded anyincremental contingent liability associated with its secured borrowing representations and warranties. Management believes that the probability ofhaving to replace, repurchase or sell assets pledged as collateral under secured borrowing arrangements, including an early amortization event, islow.
CounterpartySettlementGuaranteesDiners Club and DFS Services LLC (on behalf of PULSE) have various counterparty exposures, which are listed below.
• MerchantGuarantee. Diners Club has entered into contractual relationships with certain international merchants, which generally includetravel-related businesses, for the benefit of all Diners Club licensees. The licensees hold the primary liability to settle the transactions oftheir customers with these merchants. However, Diners Club retains a counterparty exposure if a licensee fails to meet its financialpayment obligation to one of these merchants.
• ATMGuarantee.PULSE entered into contractual relationships with certain international ATM acquirers in which DFS Services LLCretains counterparty exposure if an issuer fails to fulfill its settlement obligation.
• NetworkAllianceGuarantee.Discover Network, Diners Club and PULSE have entered into contractual relationships with certaininternational payment networks in which DFS Services LLC retains the counterparty exposure if a network fails to fulfill its settlementobligation.
The maximum potential amount of future payments related to such contingent obligations is dependent upon the transaction volumeprocessed between the time a potential counterparty defaults on its settlement and the time at which the Company disables the settlement of anyfurther transactions for the defaulting party. However, there is no limitation on the maximum amount the Company may be liable to pay. The actualamount of the potential exposure cannot be quantified as the Company cannot determine whether particular counterparties will fail to meet theirsettlement obligations.
While the Company has some contractual remedies to offset these counterparty settlement exposures (such as letters of credit or pledgeddeposits), in the event that all licensees and/or issuers were to become unable to settle their transactions, the Company estimates its maximumpotential counterparty exposures to these settlement guarantees, based on historical transaction volume, would be $115 million for merchantguarantees as of December 31, 2018 . The maximum potential counterparty exposures to these settlement guarantees for ATM guarantees wouldbe immaterial as of December 31, 2018 . The maximum potential counterparty exposures for network alliance guarantees would be $34 million as ofDecember 31, 2018 .
The Company believes that the estimated amounts of maximum potential future payments are not representative of the Company’s actualpotential loss exposure given Diners Club’s and PULSE’s insignificant historical losses from these counterparty exposures. As of December 31,2018 , the Company had not recorded any contingent liability in the consolidated financial statements for these counterparty exposures, andmanagement believes that the probability of any payments under these arrangements is low.
DiscoverNetworkMerchantChargebackGuaranteesThe Company operates the Discover Network, issues payment cards and permits third parties to issue payment cards. The Company is
contingently liable for certain transactions processed on the Discover Network in the event of a dispute between the payment card customer and amerchant. The contingent liability arises if the disputed transaction involves a merchant or merchant acquirer with whom the Discover Network has adirect relationship. If a dispute is resolved in the customer’s favor, the Discover Network will credit or refund the disputed amount to the DiscoverNetwork card issuer, who in turn credits its customer’s account. The Discover Network will then charge back the disputed amount of the paymentcard transaction to the merchant or merchant acquirer, where permitted by the applicable agreement, to seek recovery of amounts already paid tothe merchant for payment card transactions. If the Discover Network is unable to collect the amount subject to dispute from the merchant ormerchant acquirer (e.g., in the event of merchant default or dissolution or after expiration of the time period for chargebacks in the applicable
- 124 -
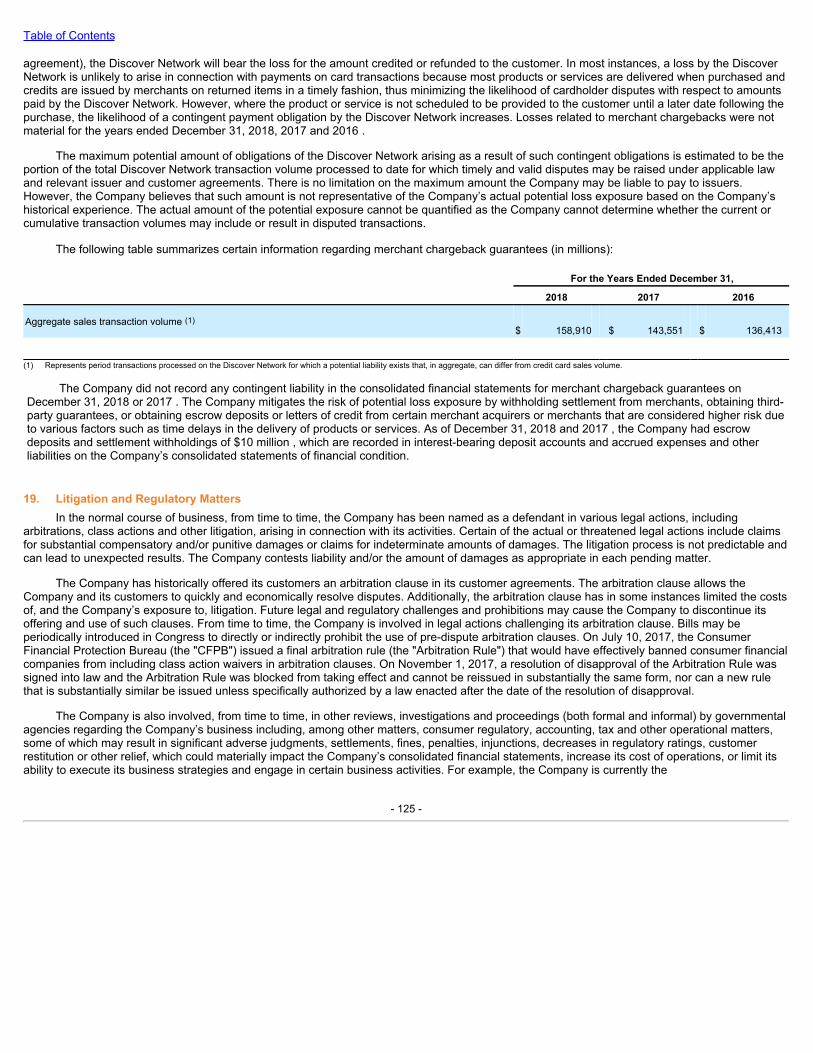
Table of Contents
agreement), the Discover Network will bear the loss for the amount credited or refunded to the customer. In most instances, a loss by the DiscoverNetwork is unlikely to arise in connection with payments on card transactions because most products or services are delivered when purchased andcredits are issued by merchants on returned items in a timely fashion, thus minimizing the likelihood of cardholder disputes with respect to amountspaid by the Discover Network. However, where the product or service is not scheduled to be provided to the customer until a later date following thepurchase, the likelihood of a contingent payment obligation by the Discover Network increases. Losses related to merchant chargebacks were notmaterial for the years ended December 31, 2018, 2017 and 2016 .
The maximum potential amount of obligations of the Discover Network arising as a result of such contingent obligations is estimated to be theportion of the total Discover Network transaction volume processed to date for which timely and valid disputes may be raised under applicable lawand relevant issuer and customer agreements. There is no limitation on the maximum amount the Company may be liable to pay to issuers.However, the Company believes that such amount is not representative of the Company’s actual potential loss exposure based on the Company’shistorical experience. The actual amount of the potential exposure cannot be quantified as the Company cannot determine whether the current orcumulative transaction volumes may include or result in disputed transactions.
The following table summarizes certain information regarding merchant chargeback guarantees (in millions):
For the Years Ended December 31,
2018 2017 2016
Aggregate sales transaction volume (1)$ 158,910 $ 143,551 $ 136,413
(1) Represents period transactions processed on the Discover Network for which a potential liability exists that, in aggregate, can differ from credit card sales volume.
The Company did not record any contingent liability in the consolidated financial statements for merchant chargeback guarantees onDecember 31, 2018 or 2017 . The Company mitigates the risk of potential loss exposure by withholding settlement from merchants, obtaining third-party guarantees, or obtaining escrow deposits or letters of credit from certain merchant acquirers or merchants that are considered higher risk dueto various factors such as time delays in the delivery of products or services. As of December 31, 2018 and 2017 , the Company had escrowdeposits and settlement withholdings of $10 million , which are recorded in interest-bearing deposit accounts and accrued expenses and otherliabilities on the Company’s consolidated statements of financial condition.
19. Litigation and Regulatory MattersIn the normal course of business, from time to time, the Company has been named as a defendant in various legal actions, including
arbitrations, class actions and other litigation, arising in connection with its activities. Certain of the actual or threatened legal actions include claimsfor substantial compensatory and/or punitive damages or claims for indeterminate amounts of damages. The litigation process is not predictable andcan lead to unexpected results. The Company contests liability and/or the amount of damages as appropriate in each pending matter.
The Company has historically offered its customers an arbitration clause in its customer agreements. The arbitration clause allows theCompany and its customers to quickly and economically resolve disputes. Additionally, the arbitration clause has in some instances limited the costsof, and the Company’s exposure to, litigation. Future legal and regulatory challenges and prohibitions may cause the Company to discontinue itsoffering and use of such clauses. From time to time, the Company is involved in legal actions challenging its arbitration clause. Bills may beperiodically introduced in Congress to directly or indirectly prohibit the use of pre-dispute arbitration clauses. On July 10, 2017, the ConsumerFinancial Protection Bureau (the "CFPB") issued a final arbitration rule (the "Arbitration Rule") that would have effectively banned consumer financialcompanies from including class action waivers in arbitration clauses. On November 1, 2017, a resolution of disapproval of the Arbitration Rule wassigned into law and the Arbitration Rule was blocked from taking effect and cannot be reissued in substantially the same form, nor can a new rulethat is substantially similar be issued unless specifically authorized by a law enacted after the date of the resolution of disapproval.
The Company is also involved, from time to time, in other reviews, investigations and proceedings (both formal and informal) by governmentalagencies regarding the Company’s business including, among other matters, consumer regulatory, accounting, tax and other operational matters,some of which may result in significant adverse judgments, settlements, fines, penalties, injunctions, decreases in regulatory ratings, customerrestitution or other relief, which could materially impact the Company’s consolidated financial statements, increase its cost of operations, or limit itsability to execute its business strategies and engage in certain business activities. For example, the Company is currently the
- 125 -

Table of Contents
subject of an action by the Federal Reserve with respect to anti-money laundering and related compliance programs as referred to below. Inaddition, certain subsidiaries of the Company are subject to a consent order with the CFPB regarding certain student loan servicing practices, asdescribed below. Pursuant to powers granted under federal banking laws, regulatory agencies have broad and sweeping discretion, and may assesscivil money penalties, require changes to certain business practices or require customer restitution at any time. The existing supervisory actionrelated to anti-money laundering and related laws and regulations will limit for a period of time the Company’s ability to enter into certain types ofacquisitions and make certain types of investments.
In accordance with applicable accounting guidance, the Company establishes an accrued liability for legal and regulatory matters when thosematters present loss contingencies that are both probable and estimable. Litigation and regulatory settlement related expense was not material forthe years ended December 31, 2018, 2017 and 2016 .
There may be an exposure to loss in excess of any amounts accrued. The Company believes the estimate of the aggregate range ofreasonably possible losses (meaning those losses the likelihood of which is more than remote but less than likely) in excess of the amounts that theCompany has accrued for legal and regulatory proceedings is up to $100 million . This estimated range of reasonably possible losses is based uponcurrently available information for those proceedings in which the Company is involved, takes into account the Company’s best estimate of suchlosses for those matters for which an estimate can be made, and does not represent the Company’s maximum potential loss exposure. Variousaspects of the legal proceedings underlying the estimated range will change from time to time and actual results may vary significantly from theestimate.
The Company’s estimated range above involves significant judgment, given the varying stages of the proceedings, the existence of numerousyet to be resolved issues, the breadth of the claims (often spanning multiple years and, in some cases, a wide range of business activities),unspecified damages and/or the novelty of the legal issues presented. The outcome of pending matters could be material to the Company’sconsolidated financial condition, operating results and cash flows for a particular future period, depending on, among other things, the level of theCompany’s income for such period, and could adversely affect the Company’s reputation.
On May 26, 2015, the Company entered into a written agreement with the Federal Reserve Bank of Chicago where the Company agreed toenhance the Company’s enterprise-wide anti-money laundering and related compliance programs. The agreement does not include civil moneypenalties.
On July 22, 2015, the Company announced that its subsidiaries, Discover Bank, SLC and Discover Products Inc. (the “DiscoverSubsidiaries”), agreed to a consent order with the CFPB resolving the agency’s investigation with respect to certain student loan servicing practices.The CFPB’s investigation into these practices has been previously disclosed by the Company, initially in February 2014. The order required theDiscover Subsidiaries to provide redress of approximately $16 million to consumers who may have been affected by the activities described in theorder related to certain collection calls, overstatements of minimum payment due amounts in billing statements, and provision of interest paidinformation to consumers, and provide regulatory disclosures with respect to loans acquired in default. In addition, the Discover Subsidiaries wererequired to pay a $2.5 million civil money penalty to the CFPB. As required by the consent order, on October 19, 2015, the Discover Subsidiariessubmitted to the CFPB a redress plan and a compliance plan designed to ensure that the Discover Subsidiaries provide redress and otherwisecomply with the terms of the order.
On March 8, 2016, a class action lawsuit was filed against the Company, other credit card networks, other issuing banks, and EMVCo in theU.S. District Court for the Northern District of California (B&R Supermarket, Inc., d/b/a Milam’s Market, et al. v. Visa, Inc. et al.) alleging violations ofthe Sherman Antitrust Act, California’s Cartwright Act, and unjust enrichment. Plaintiffs allege a conspiracy by defendants to shift fraud liability tomerchants with the migration to the EMV security standard and chip technology. Plaintiffs assert joint and several liability among the defendants andseek unspecified damages, including treble damages, attorneys’ fees, costs and injunctive relief. On July 15, 2016, plaintiffs filed an amendedcomplaint that includes additional named plaintiffs, reasserts the original claims, and includes additional state law causes of action. On September30, 2016, the court granted the motions to dismiss for certain issuing banks and EMVCo but denied the motions to dismiss filed by the networks,including the Company. In May 2017, the Court entered an order transferring the entire action to a federal court in New York that is presiding overcertain related claims that are pending in the actions consolidated as MDL 1720. On March 11, 2018, the Court entered an order denying theplaintiffs' motion for class certification without prejudice to filing a renewed motion. Plaintiffs filed a renewed motion for class certification on July 16,2018. Plaintiffs filed their opening merits expert reports on October 5, 2018, and the parties anticipate that class briefing will be complete by springof 2019. The
- 126 -

Table of Contents
Company is not in a position at this time to assess the likely outcome or its exposure, if any, with respect to this matter, but will seek to vigorouslydefend against all claims asserted by the plaintiffs .
20. Fair Value MeasurementsFair value is defined as the price that would be received to sell an asset or paid to transfer a liability in an orderly transaction between market
participants at the measurement date. ASC Topic 820, FairValueMeasurement, provides a three-level hierarchy for classifying financialinstruments, which is based on whether the inputs to the valuation techniques used to measure the fair value of each financial instrument areobservable or unobservable. It also requires certain disclosures about those measurements. The three-level valuation hierarchy is as follows:
• Level1: Fair values determined by Level 1 inputs are defined as those that utilize quoted prices (unadjusted) in active markets for identicalassets or liabilities that the Company has the ability to access.
• Level2: Fair values determined by Level 2 inputs are those that utilize inputs other than quoted prices included in Level 1 that are observablefor the asset or liability, either directly or indirectly. Level 2 inputs include quoted prices for similar assets and liabilities in active or inactivemarkets, quoted prices for the identical assets in an inactive market, and inputs other than quoted prices that are observable for the asset orliability, such as interest rates and yield curves that are observable at commonly quoted intervals. The Company evaluates factors such as thefrequency of transactions, the size of the bid-ask spread and the significance of adjustments made when considering transactions involvingsimilar assets or liabilities to assess the relevance of those observed prices. If relevant and observable prices are available, the fair values ofthe related assets or liabilities would be classified as Level 2.
• Level3: Fair values determined by Level 3 inputs are those based on unobservable inputs and include situations where there is little, if any,market activity for the asset or liability being valued. In instances in which the inputs used to measure fair value may fall into different levels ofthe fair value hierarchy, the level in the fair value hierarchy within which the fair value measurement in its entirety is classified is based on thelowest level input that is significant to the fair value measurement in its entirety. The Company may utilize both observable and unobservableinputs in determining the fair values of financial instruments classified within the Level 3 category.
The determination of classification of its financial instruments within the fair value hierarchy is performed at least quarterly by the Company.For transfers in and out of the levels of the fair value hierarchy, the Company discloses the fair value measurement based on the value immediatelypreceding the transfer.
The Company’s assessment of the significance of a particular input to the fair value measurement in its entirety requires judgment andinvolves consideration of factors specific to the asset or liability. Furthermore, certain techniques used to measure fair value involve some degree ofjudgment and, as a result, are not necessarily indicative of the amounts the Company would realize in a current market exchange.
- 127 -
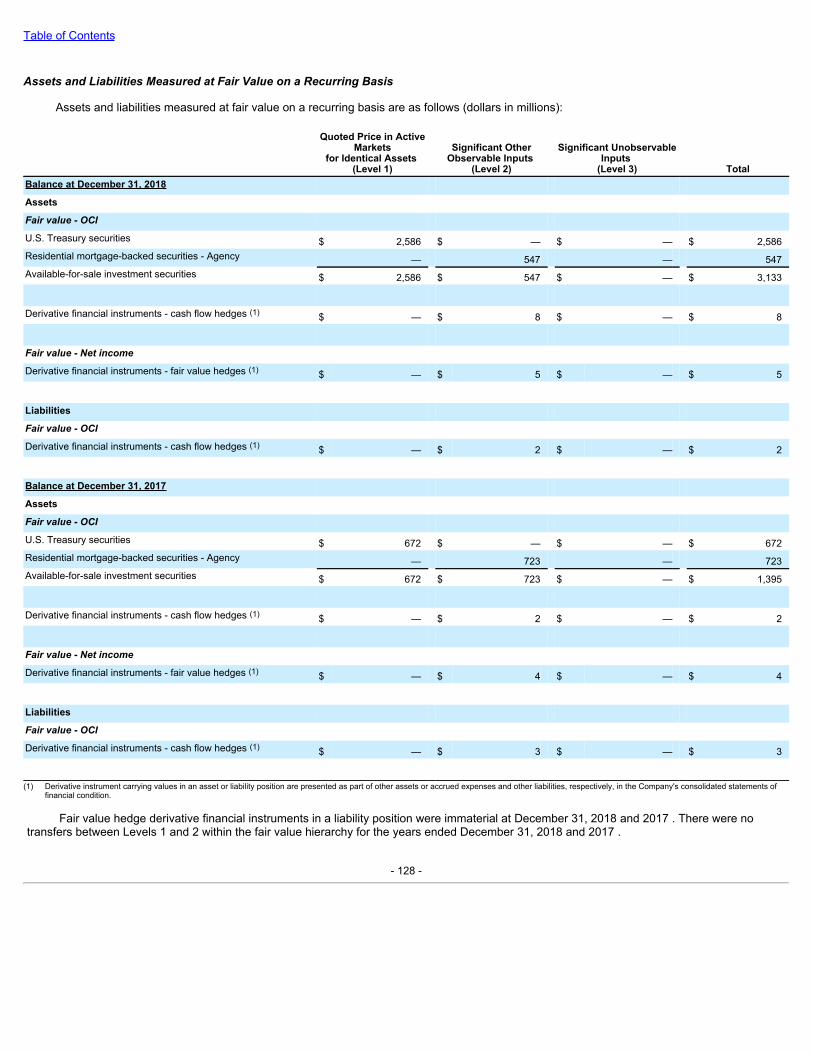
Table of Contents
AssetsandLiabilitiesMeasuredatFairValueonaRecurringBasis
Assets and liabilities measured at fair value on a recurring basis are as follows (dollars in millions):
Quoted Price in ActiveMarkets
for Identical Assets (Level 1)
Significant OtherObservable Inputs
(Level 2)
Significant UnobservableInputs
(Level 3) TotalBalance at December 31, 2018 Assets Fairvalue-OCI U.S. Treasury securities $ 2,586 $ — $ — $ 2,586Residential mortgage-backed securities - Agency — 547 — 547Available-for-sale investment securities $ 2,586 $ 547 $ — $ 3,133
Derivative financial instruments - cash flow hedges (1) $ — $ 8 $ — $ 8
Fairvalue-Netincome Derivative financial instruments - fair value hedges (1) $ — $ 5 $ — $ 5
Liabilities Fairvalue-OCI Derivative financial instruments - cash flow hedges (1) $ — $ 2 $ — $ 2
Balance at December 31, 2017 Assets Fairvalue-OCI U.S. Treasury securities $ 672 $ — $ — $ 672Residential mortgage-backed securities - Agency — 723 — 723Available-for-sale investment securities $ 672 $ 723 $ — $ 1,395
Derivative financial instruments - cash flow hedges (1) $ — $ 2 $ — $ 2
Fairvalue-Netincome Derivative financial instruments - fair value hedges (1) $ — $ 4 $ — $ 4
Liabilities Fairvalue-OCI Derivative financial instruments - cash flow hedges (1) $ — $ 3 $ — $ 3 (1) Derivative instrument carrying values in an asset or liability position are presented as part of other assets or accrued expenses and other liabilities, respectively, in the Company's consolidated statements of
financial condition.
Fair value hedge derivative financial instruments in a liability position were immaterial at December 31, 2018 and 2017 . There were notransfers between Levels 1 and 2 within the fair value hierarchy for the years ended December 31, 2018 and 2017 .
- 128 -

Table of Contents
Available-for-SaleInvestmentSecuritiesInvestment securities classified as available-for-sale consist of U.S. Treasury securities and residential mortgage-backed securities. The fair
value estimates of investment securities classified as Level 1, consisting of U.S. Treasury securities, are determined based on quoted market pricesfor the same securities. The Company classifies residential mortgage-backed securities as Level 2, the fair value estimates of which are based onthe best information available. This data may consist of observed market prices, broker quotes or discounted cash flow models that incorporateassumptions such as benchmark yields, issuer spreads, prepayment speeds, credit ratings and losses, the priority of which may vary based onavailability of information.
The Company validates the fair value estimates provided by the pricing services primarily by comparison to valuations obtained through otherpricing sources. The Company evaluates pricing variances amongst different pricing sources to ensure that the valuations utilized are reasonable.The Company also corroborates the reasonableness of the fair value estimates with analysis of trends of significant inputs, such as market interestrate curves. The Company further performs due diligence in understanding the procedures and techniques performed by the pricing services toderive fair value estimates.
At December 31, 2018 , amounts reported in residential mortgage-backed securities reflect government-rated obligations issued by FannieMae, Freddie Mac and Ginnie Mae with a par value of $549 million , a weighted-average coupon of 2.81% and a weighted-average remainingmaturity of three years .
DerivativeFinancialInstrumentsThe Company’s derivative financial instruments consist of interest rate swaps and foreign exchange forward contracts. These instruments are
classified as Level 2 as their fair values are estimated using proprietary pricing models, containing certain assumptions based on readily observablemarket-based inputs, including interest rate curves, option volatility and foreign currency forward and spot rates. In determining fair values, thepricing models use widely accepted valuation techniques including discounted cash flow analysis on the expected cash flows of each derivative.This analysis reflects the contractual terms of the derivatives, including the period to maturity and the observable market-based inputs. The fairvalues of the interest rate swaps are determined using the market standard methodology of netting the discounted future fixed cash receipts (orpayments) and the discounted expected variable cash payments (or receipts). The variable cash payments are based on an expectation of futureinterest rates derived from the observable market interest rate curves. The Company considers collateral and master netting agreements thatmitigate credit exposure to counterparties in determining the counterparty credit risk valuation adjustment. The fair values of the currencyinstruments are valued comparing the contracted forward exchange rate pertaining to the specific contract maturities to the current market exchangerate.
The Company validates the fair value estimates of interest rate swaps primarily through comparison to the fair value estimates computed bythe counterparties to each of the derivative transactions. The Company evaluates pricing variances amongst different pricing sources to ensure thatthe valuations utilized are reasonable. The Company also corroborates the reasonableness of the fair value estimates with analysis of trends ofsignificant inputs, such as market interest rate curves. The Company performs due diligence in understanding the impact to any changes to thevaluation techniques performed by proprietary pricing models prior to implementation, working closely with the third-party valuation service, andreviews the control objectives of the service at least annually. The Company corroborates the fair value of foreign exchange forward contractsthrough independent calculation of the fair value estimates.
AssetsandLiabilitiesMeasuredatFairValueonaNon-RecurringBasisThe Company also has assets that under certain conditions are subject to measurement at fair value on a non-recurring basis. These assets
include those associated with acquired businesses, including goodwill and other intangible assets. For these assets, measurement at fair value inperiods subsequent to the initial recognition of the assets is applicable if one or more of the assets is determined to be impaired. During the yearsended December 31, 2018 and 2017 , the Company had no material impairments related to these assets.
- 129 -
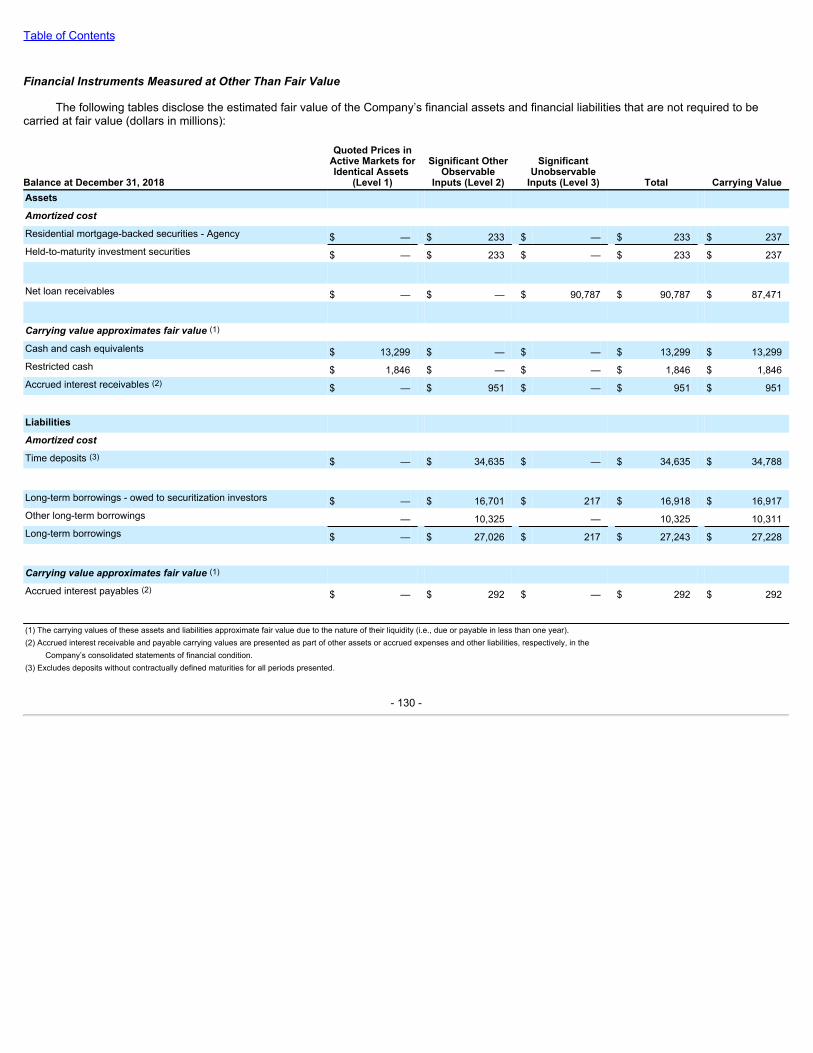
Table of Contents
FinancialInstrumentsMeasuredatOtherThanFairValue
The following tables disclose the estimated fair value of the Company’s financial assets and financial liabilities that are not required to becarried at fair value (dollars in millions):
Balance at December 31, 2018
Quoted Prices inActive Markets forIdentical Assets
(Level 1)
Significant OtherObservable
Inputs (Level 2)
SignificantUnobservable
Inputs (Level 3) Total Carrying ValueAssets Amortizedcost Residential mortgage-backed securities - Agency $ — $ 233 $ — $ 233 $ 237Held-to-maturity investment securities $ — $ 233 $ — $ 233 $ 237
Net loan receivables $ — $ — $ 90,787 $ 90,787 $ 87,471
Carryingvalueapproximatesfairvalue(1) Cash and cash equivalents $ 13,299 $ — $ — $ 13,299 $ 13,299Restricted cash $ 1,846 $ — $ — $ 1,846 $ 1,846Accrued interest receivables (2) $ — $ 951 $ — $ 951 $ 951 Liabilities Amortizedcost Time deposits (3) $ — $ 34,635 $ — $ 34,635 $ 34,788
Long-term borrowings - owed to securitization investors $ — $ 16,701 $ 217 $ 16,918 $ 16,917Other long-term borrowings — 10,325 — 10,325 10,311Long-term borrowings $ — $ 27,026 $ 217 $ 27,243 $ 27,228
Carryingvalueapproximatesfairvalue(1) Accrued interest payables (2) $ — $ 292 $ — $ 292 $ 292 (1) The carrying values of these assets and liabilities approximate fair value due to the nature of their liquidity (i.e., due or payable in less than one year).(2) Accrued interest receivable and payable carrying values are presented as part of other assets or accrued expenses and other liabilities, respectively, in the Company’s consolidated statements of financial condition.(3) Excludes deposits without contractually defined maturities for all periods presented.
- 130 -
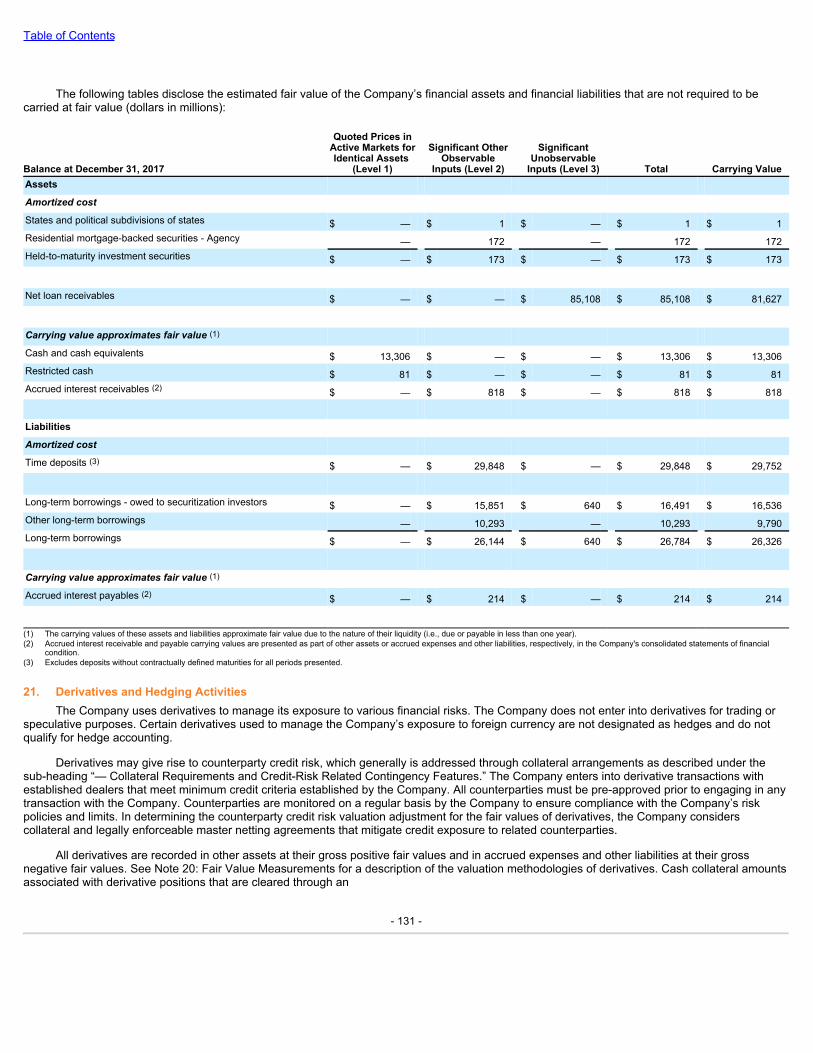
Table of Contents
The following tables disclose the estimated fair value of the Company’s financial assets and financial liabilities that are not required to becarried at fair value (dollars in millions):
Balance at December 31, 2017
Quoted Prices inActive Markets forIdentical Assets
(Level 1)
Significant OtherObservable
Inputs (Level 2)
SignificantUnobservable
Inputs (Level 3) Total Carrying ValueAssets Amortizedcost States and political subdivisions of states $ — $ 1 $ — $ 1 $ 1Residential mortgage-backed securities - Agency — 172 — 172 172Held-to-maturity investment securities $ — $ 173 $ — $ 173 $ 173
Net loan receivables $ — $ — $ 85,108 $ 85,108 $ 81,627
Carryingvalueapproximatesfairvalue(1) Cash and cash equivalents $ 13,306 $ — $ — $ 13,306 $ 13,306Restricted cash $ 81 $ — $ — $ 81 $ 81Accrued interest receivables (2) $ — $ 818 $ — $ 818 $ 818 Liabilities Amortizedcost Time deposits (3) $ — $ 29,848 $ — $ 29,848 $ 29,752
Long-term borrowings - owed to securitization investors $ — $ 15,851 $ 640 $ 16,491 $ 16,536Other long-term borrowings — 10,293 — 10,293 9,790Long-term borrowings $ — $ 26,144 $ 640 $ 26,784 $ 26,326
Carryingvalueapproximatesfairvalue(1) Accrued interest payables (2) $ — $ 214 $ — $ 214 $ 214 (1) The carrying values of these assets and liabilities approximate fair value due to the nature of their liquidity (i.e., due or payable in less than one year).(2) Accrued interest receivable and payable carrying values are presented as part of other assets or accrued expenses and other liabilities, respectively, in the Company's consolidated statements of financial
condition.(3) Excludes deposits without contractually defined maturities for all periods presented.
21. Derivatives and Hedging ActivitiesThe Company uses derivatives to manage its exposure to various financial risks. The Company does not enter into derivatives for trading or
speculative purposes. Certain derivatives used to manage the Company’s exposure to foreign currency are not designated as hedges and do notqualify for hedge accounting.
Derivatives may give rise to counterparty credit risk, which generally is addressed through collateral arrangements as described under thesub-heading “— Collateral Requirements and Credit-Risk Related Contingency Features.” The Company enters into derivative transactions withestablished dealers that meet minimum credit criteria established by the Company. All counterparties must be pre-approved prior to engaging in anytransaction with the Company. Counterparties are monitored on a regular basis by the Company to ensure compliance with the Company’s riskpolicies and limits. In determining the counterparty credit risk valuation adjustment for the fair values of derivatives, the Company considerscollateral and legally enforceable master netting agreements that mitigate credit exposure to related counterparties.
All derivatives are recorded in other assets at their gross positive fair values and in accrued expenses and other liabilities at their grossnegative fair values. See Note 20: Fair Value Measurements for a description of the valuation methodologies of derivatives. Cash collateral amountsassociated with derivative positions that are cleared through an
- 131 -

Table of Contents
exchange are legally characterized as settlement of the derivative positions. Such collateral amounts are reflected as offsets to the associatedderivatives balances recorded in other assets or in accrued expenses and other liabilities. Other cash collateral posted and held balances arerecorded in other assets and deposits, respectively, in the consolidated statements of financial condition. Collateral amounts recorded in theconsolidated statements of financial condition are based on the net collateral posted or held position for each applicable legal entity’s master nettingarrangement with each counterparty.
DerivativesDesignatedasHedgesDerivatives designated and qualifying as a hedge of the exposure to variability in expected future cash flows arising from changes in interest
rates, or other types of forecasted transactions, are considered cash flow hedges. Derivatives designated and qualifying as a hedge of the exposureto changes in the fair value of an asset, liability, or firm commitment attributable to a particular risk, such as interest rate risk, are considered fairvalue hedges.
CashFlowHedgesThe Company uses interest rate swaps to manage its exposure to changes in interest rates related to future cash flows resulting from interest
payments on credit card securitized debt and deposits. The Company’s outstanding cash flow hedges are for an initial maximum period of sevenyears for securitized debt and deposits. The derivatives are designated as hedges of the risk of changes in cash flows on the Company’s LIBOR orFederal Funds rate-based interest payments, and qualify for hedge accounting in accordance with ASC Topic 815, DerivativesandHedging(“ASC815”).
The change in the fair value of derivatives designated as cash flow hedges is recorded in OCI and is subsequently reclassified into earnings inthe period that the hedged forecasted cash flows affect earnings. Amounts reported in AOCI related to derivatives at December 31, 2018 will bereclassified to interest expense as interest payments are accrued on certain of the Company’s floating-rate securitized debt and deposits. During thenext 12 months, the Company estimates it will reclassify $10 million of pretax benefit to interest expense related to its derivatives designated ascash flow hedges.
FairValueHedgesThe Company is exposed to changes in fair value of certain of its fixed-rate debt obligations due to changes in interest rates. The Company
uses interest rate swaps to manage its exposure to changes in fair value of certain fixed-rate long-term borrowings, including securitized debt andbank or other senior notes, and deposits attributable to changes in LIBOR, a benchmark interest rate as defined by ASC 815. These interest rateswaps qualify as fair value hedges in accordance with ASC 815. Changes in both (i) the fair values of the derivatives and (ii) the hedged long-termborrowings and deposits relating to the risk being hedged are recorded in interest expense. The changes generally provide substantial offset to oneanother, with any difference in interest expense.
DerivativesNotDesignatedasHedges
ForeignExchangeForwardContractsThe Company has foreign exchange forward contracts that are economic hedges and are not designated as accounting hedges. The
Company enters into foreign exchange forward contracts to manage foreign currency risk. Changes in the fair value of these contracts are recordedin other income.
DerivativesClearedThroughanExchangeThe legal characterization of cash variation margin payments on derivatives cleared through an exchange are legally considered settlement
payments and are accounted for with corresponding derivative positions as one unit of account and not separately as collateral. With settlementpayments on derivative positions cleared through this exchange reflected as offsets to the associated derivative asset and liability balances, the fairvalues of derivative instruments and collateral balances shown are generally reduced.
- 132 -
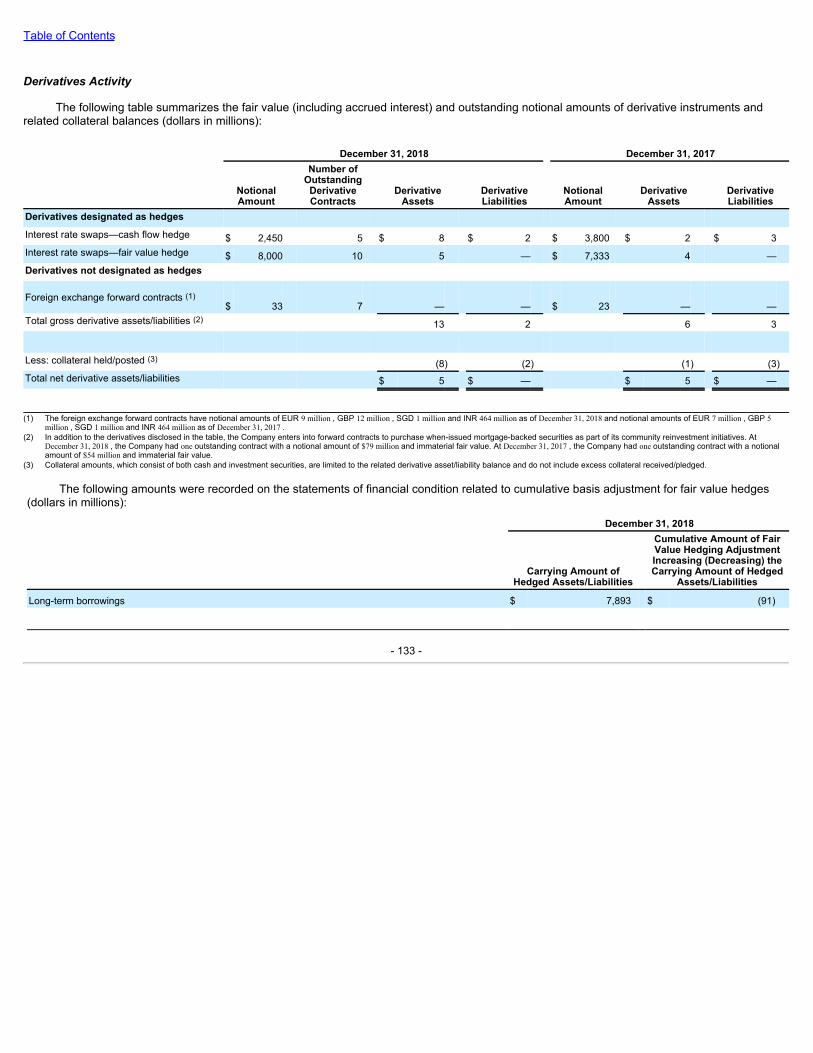
Table of Contents
DerivativesActivity
The following table summarizes the fair value (including accrued interest) and outstanding notional amounts of derivative instruments andrelated collateral balances (dollars in millions):
December 31, 2018 December 31, 2017
NotionalAmount
Number ofOutstandingDerivativeContracts
DerivativeAssets
DerivativeLiabilities
NotionalAmount
DerivativeAssets
DerivativeLiabilities
Derivatives designated as hedges Interest rate swaps—cash flow hedge $ 2,450 5 $ 8 $ 2 $ 3,800 $ 2 $ 3Interest rate swaps—fair value hedge $ 8,000 10 5 — $ 7,333 4 —Derivatives not designated as hedges
Foreign exchange forward contracts (1)$ 33 7 — — $ 23 — —
Total gross derivative assets/liabilities (2) 13 2 6 3
Less: collateral held/posted (3) (8) (2) (1) (3)Total net derivative assets/liabilities $ 5 $ — $ 5 $ —
(1) The foreign exchange forward contracts have notional amounts of EUR 9 million , GBP 12 million , SGD 1 million and INR 464 million as of December 31, 2018 and notional amounts of EUR 7 million , GBP 5
million , SGD 1 million and INR 464 million as of December 31, 2017 .(2) In addition to the derivatives disclosed in the table, the Company enters into forward contracts to purchase when-issued mortgage-backed securities as part of its community reinvestment initiatives. At
December 31, 2018 , the Company had one outstanding contract with a notional amount of $79 million and immaterial fair value. At December 31, 2017 , the Company had one outstanding contract with a notionalamount of $54 million and immaterial fair value.
(3) Collateral amounts, which consist of both cash and investment securities, are limited to the related derivative asset/liability balance and do not include excess collateral received/pledged.
The following amounts were recorded on the statements of financial condition related to cumulative basis adjustment for fair value hedges(dollars in millions): December 31, 2018
Carrying Amount of
Hedged Assets/Liabilities
Cumulative Amount of FairValue Hedging AdjustmentIncreasing (Decreasing) theCarrying Amount of Hedged
Assets/Liabilities
Long-term borrowings $ 7,893 $ (91)
- 133 -
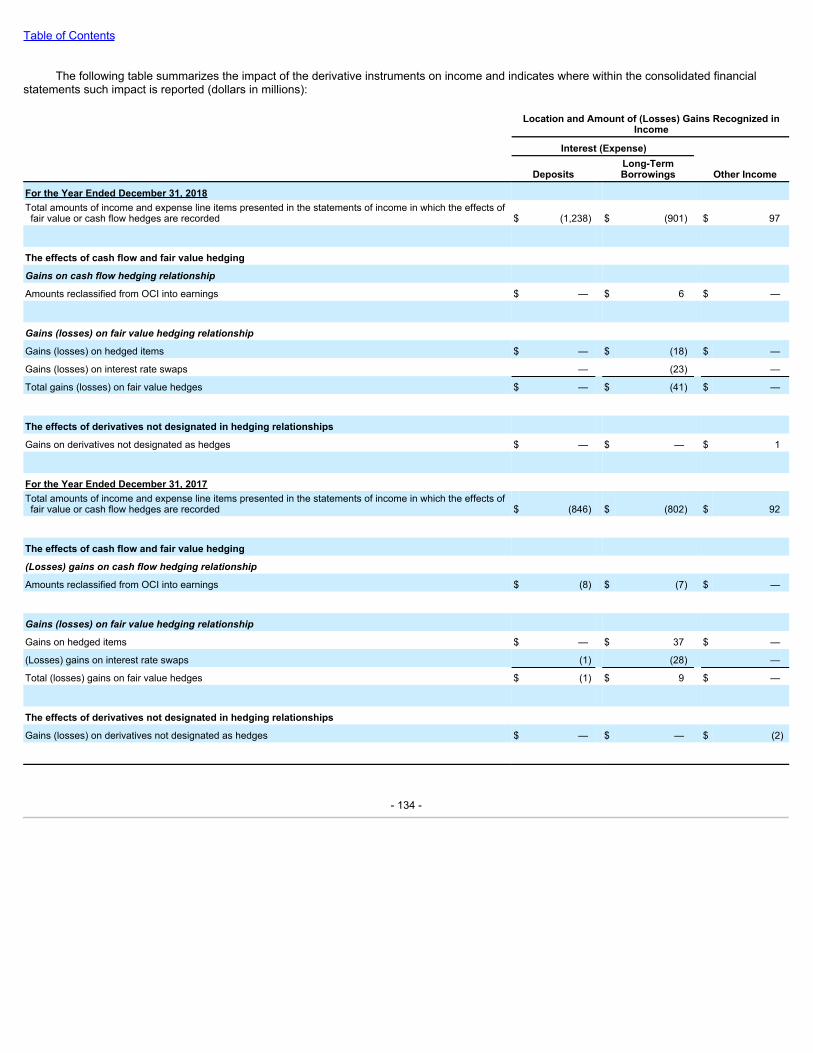
Table of Contents
The following table summarizes the impact of the derivative instruments on income and indicates where within the consolidated financialstatements such impact is reported (dollars in millions):
Location and Amount of (Losses) Gains Recognized in
Income Interest (Expense)
Deposits Long-TermBorrowings Other Income
For the Year Ended December 31, 2018 Total amounts of income and expense line items presented in the statements of income in which the effects offair value or cash flow hedges are recorded $ (1,238) $ (901) $ 97
The effects of cash flow and fair value hedging
Gainsoncashflowhedgingrelationship
Amounts reclassified from OCI into earnings $ — $ 6 $ —
Gains(losses)onfairvaluehedgingrelationship
Gains (losses) on hedged items $ — $ (18) $ —
Gains (losses) on interest rate swaps — (23) —
Total gains (losses) on fair value hedges $ — $ (41) $ —
The effects of derivatives not designated in hedging relationships
Gains on derivatives not designated as hedges $ — $ — $ 1
For the Year Ended December 31, 2017 Total amounts of income and expense line items presented in the statements of income in which the effects offair value or cash flow hedges are recorded $ (846) $ (802) $ 92
The effects of cash flow and fair value hedging
(Losses)gainsoncashflowhedgingrelationship
Amounts reclassified from OCI into earnings $ (8) $ (7) $ —
Gains(losses)onfairvaluehedgingrelationship
Gains on hedged items $ — $ 37 $ —
(Losses) gains on interest rate swaps (1) (28) —
Total (losses) gains on fair value hedges $ (1) $ 9 $ —
The effects of derivatives not designated in hedging relationships
Gains (losses) on derivatives not designated as hedges $ — $ — $ (2)
- 134 -
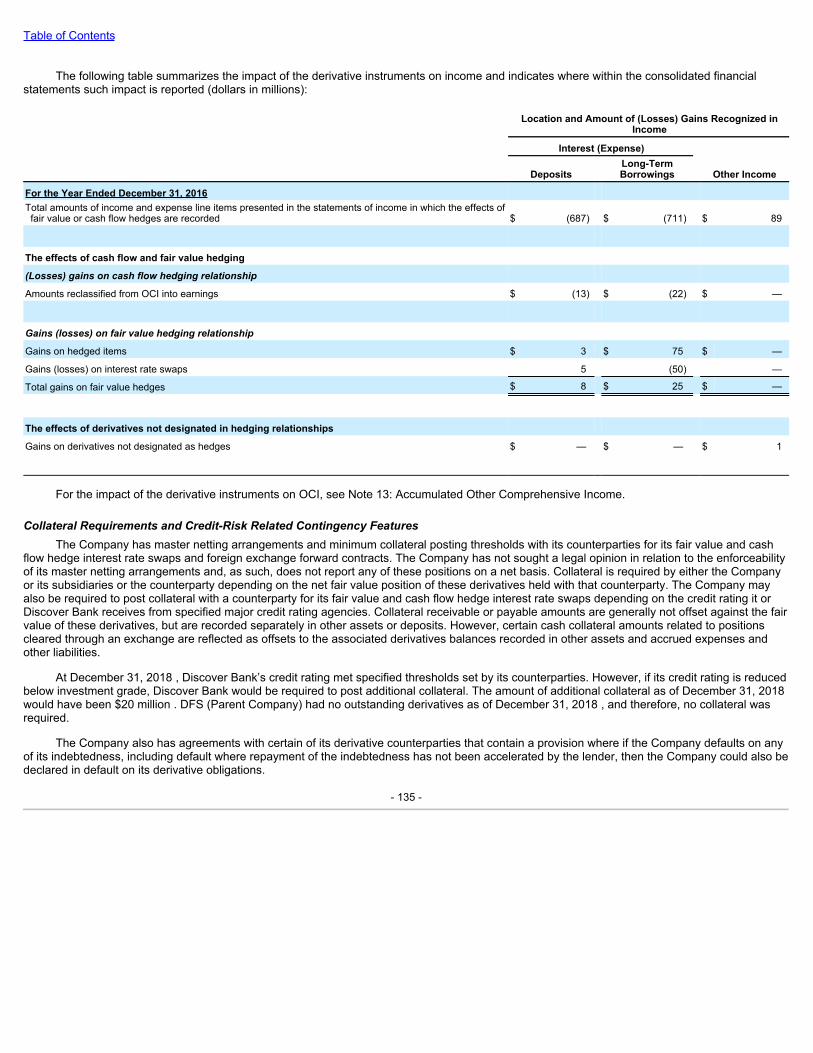
Table of Contents
The following table summarizes the impact of the derivative instruments on income and indicates where within the consolidated financialstatements such impact is reported (dollars in millions):
Location and Amount of (Losses) Gains Recognized in
Income Interest (Expense)
Deposits Long-TermBorrowings Other Income
For the Year Ended December 31, 2016 Total amounts of income and expense line items presented in the statements of income in which the effects offair value or cash flow hedges are recorded $ (687) $ (711) $ 89
The effects of cash flow and fair value hedging
(Losses)gainsoncashflowhedgingrelationship
Amounts reclassified from OCI into earnings $ (13) $ (22) $ —
Gains(losses)onfairvaluehedgingrelationship
Gains on hedged items $ 3 $ 75 $ —
Gains (losses) on interest rate swaps 5 (50) —
Total gains on fair value hedges $ 8 $ 25 $ —
The effects of derivatives not designated in hedging relationships
Gains on derivatives not designated as hedges $ — $ — $ 1
For the impact of the derivative instruments on OCI, see Note 13: Accumulated Other Comprehensive Income.
CollateralRequirementsandCredit-RiskRelatedContingencyFeaturesThe Company has master netting arrangements and minimum collateral posting thresholds with its counterparties for its fair value and cash
flow hedge interest rate swaps and foreign exchange forward contracts. The Company has not sought a legal opinion in relation to the enforceabilityof its master netting arrangements and, as such, does not report any of these positions on a net basis. Collateral is required by either the Companyor its subsidiaries or the counterparty depending on the net fair value position of these derivatives held with that counterparty. The Company mayalso be required to post collateral with a counterparty for its fair value and cash flow hedge interest rate swaps depending on the credit rating it orDiscover Bank receives from specified major credit rating agencies. Collateral receivable or payable amounts are generally not offset against the fairvalue of these derivatives, but are recorded separately in other assets or deposits. However, certain cash collateral amounts related to positionscleared through an exchange are reflected as offsets to the associated derivatives balances recorded in other assets and accrued expenses andother liabilities.
At December 31, 2018 , Discover Bank’s credit rating met specified thresholds set by its counterparties. However, if its credit rating is reducedbelow investment grade, Discover Bank would be required to post additional collateral. The amount of additional collateral as of December 31, 2018would have been $20 million . DFS (Parent Company) had no outstanding derivatives as of December 31, 2018 , and therefore, no collateral wasrequired.
The Company also has agreements with certain of its derivative counterparties that contain a provision where if the Company defaults on anyof its indebtedness, including default where repayment of the indebtedness has not been accelerated by the lender, then the Company could also bedeclared in default on its derivative obligations.
- 135 -
Table of Contents
22. Segment DisclosuresThe Company’s business activities are managed in two segments: Direct Banking and Payment Services.
• DirectBanking:The Direct Banking segment includes Discover-branded credit cards issued to individuals on the Discover Network andother consumer products and services, including private student loans, personal loans, home equity loans, and other consumer lendingand deposit products. The majority of Direct Banking revenues relate to interest income earned on the segment’s loan products.Additionally, the Company’s credit card products generate substantially all revenues related to discount and interchange, protectionproducts and loan fee income.
• PaymentServices:The Payment Services segment includes PULSE, an automated teller machine, debit and electronic funds transfernetwork; Diners Club, a global payments network; and the Company’s Network Partners business, which provides payment transactionprocessing and settlement services on the Discover Network. The majority of Payment Services revenues relate to transaction processingrevenue from PULSE and royalty and licensee revenue from Diners Club.
The business segment reporting provided to and used by the Company’s chief operating decision maker is prepared using the followingprinciples and allocation conventions:
• The Company aggregates operating segments when determining reportable segments.
• Corporate overhead is not allocated between segments; all corporate overhead is included in the Direct Banking segment.
• Through its operation of the Discover Network, the Direct Banking segment incurs fixed marketing, servicing and infrastructure costs thatare not specifically allocated among the segments, with the exception of an allocation of direct and incremental costs driven by theCompany’s Payment Services segment.
• The assets of the Company are not allocated among the operating segments in the information reviewed by the Company’s chiefoperating decision maker.
• The revenues of each segment are derived from external sources. The segments do not earn revenue from intercompany sources.
• Income taxes are not specifically allocated between the operating segments in the information reviewed by the Company’s chief operatingdecision maker.
- 136 -
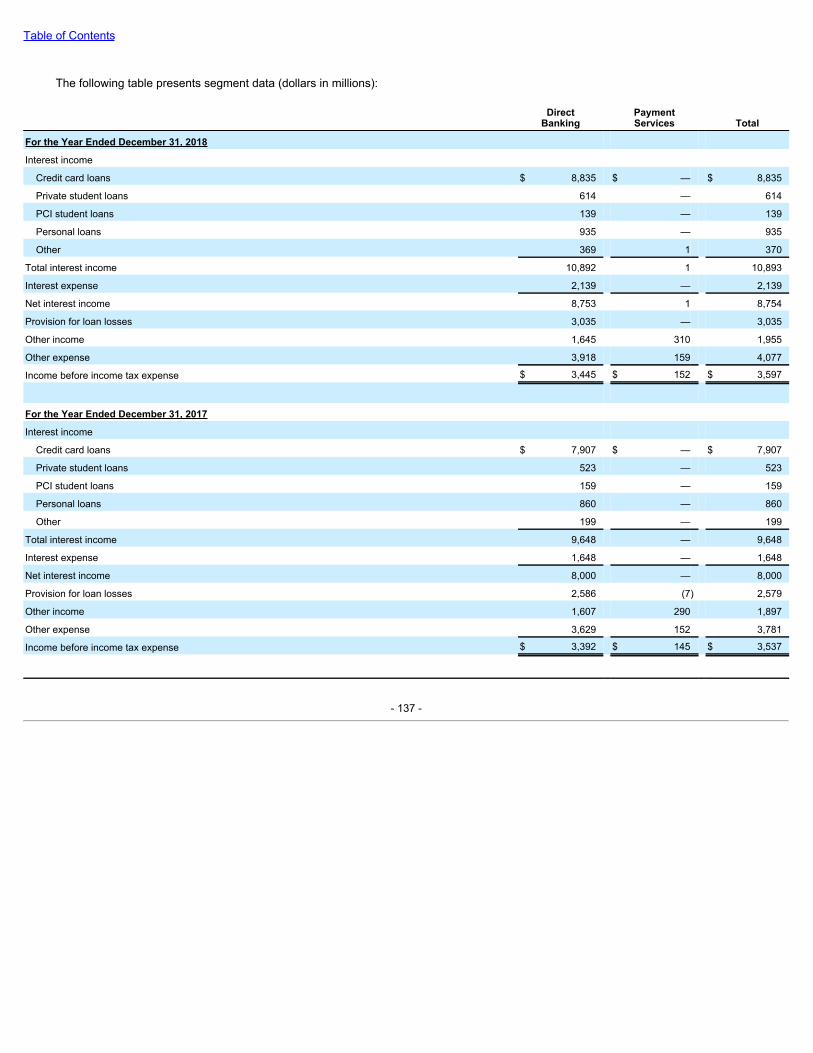
Table of Contents
The following table presents segment data (dollars in millions):
Direct
Banking PaymentServices Total
For the Year Ended December 31, 2018
Interest income
Credit card loans $ 8,835 $ — $ 8,835
Private student loans 614 — 614
PCI student loans 139 — 139
Personal loans 935 — 935
Other 369 1 370
Total interest income 10,892 1 10,893
Interest expense 2,139 — 2,139
Net interest income 8,753 1 8,754
Provision for loan losses 3,035 — 3,035
Other income 1,645 310 1,955
Other expense 3,918 159 4,077
Income before income tax expense $ 3,445 $ 152 $ 3,597
For the Year Ended December 31, 2017
Interest income
Credit card loans $ 7,907 $ — $ 7,907
Private student loans 523 — 523
PCI student loans 159 — 159
Personal loans 860 — 860
Other 199 — 199
Total interest income 9,648 — 9,648
Interest expense 1,648 — 1,648
Net interest income 8,000 — 8,000
Provision for loan losses 2,586 (7) 2,579
Other income 1,607 290 1,897
Other expense 3,629 152 3,781
Income before income tax expense $ 3,392 $ 145 $ 3,537
- 137 -
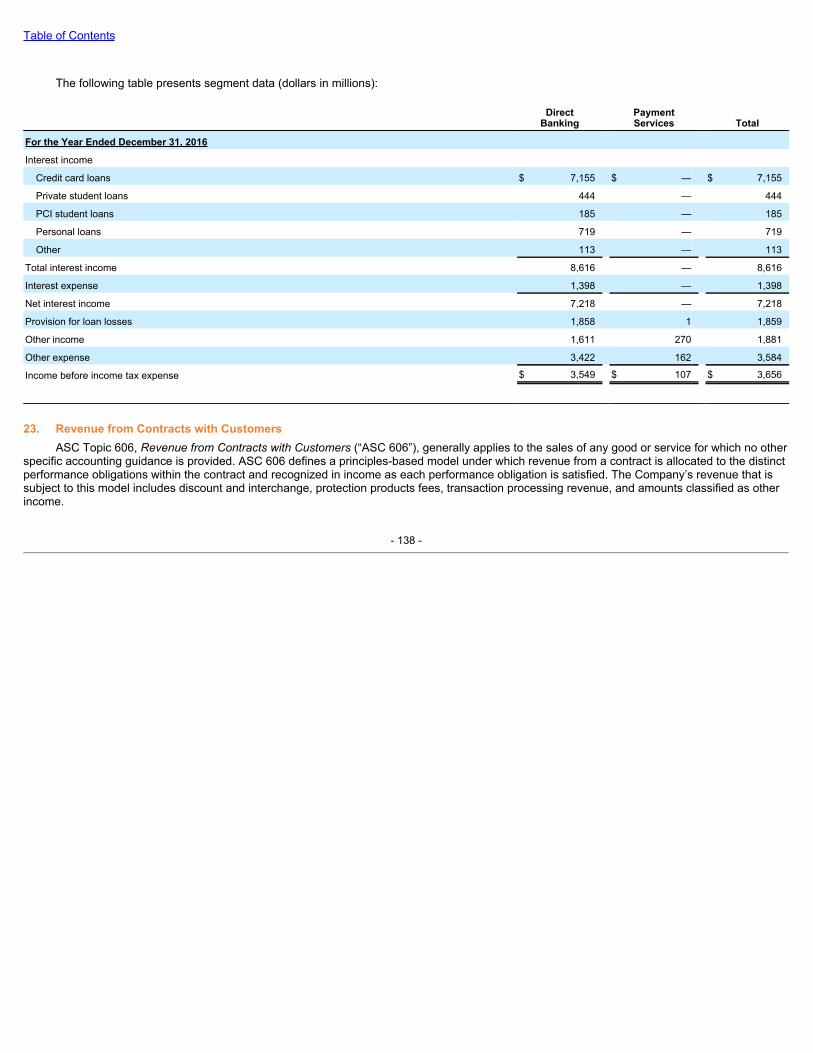
Table of Contents
The following table presents segment data (dollars in millions):
Direct
Banking PaymentServices Total
For the Year Ended December 31, 2016
Interest income
Credit card loans $ 7,155 $ — $ 7,155
Private student loans 444 — 444
PCI student loans 185 — 185
Personal loans 719 — 719
Other 113 — 113
Total interest income 8,616 — 8,616
Interest expense 1,398 — 1,398
Net interest income 7,218 — 7,218
Provision for loan losses 1,858 1 1,859
Other income 1,611 270 1,881
Other expense 3,422 162 3,584
Income before income tax expense $ 3,549 $ 107 $ 3,656
23. Revenue from Contracts with CustomersASC Topic 606, RevenuefromContractswithCustomers(“ASC 606”), generally applies to the sales of any good or service for which no other
specific accounting guidance is provided. ASC 606 defines a principles-based model under which revenue from a contract is allocated to the distinctperformance obligations within the contract and recognized in income as each performance obligation is satisfied. The Company’s revenue that issubject to this model includes discount and interchange, protection products fees, transaction processing revenue, and amounts classified as otherincome.
- 138 -
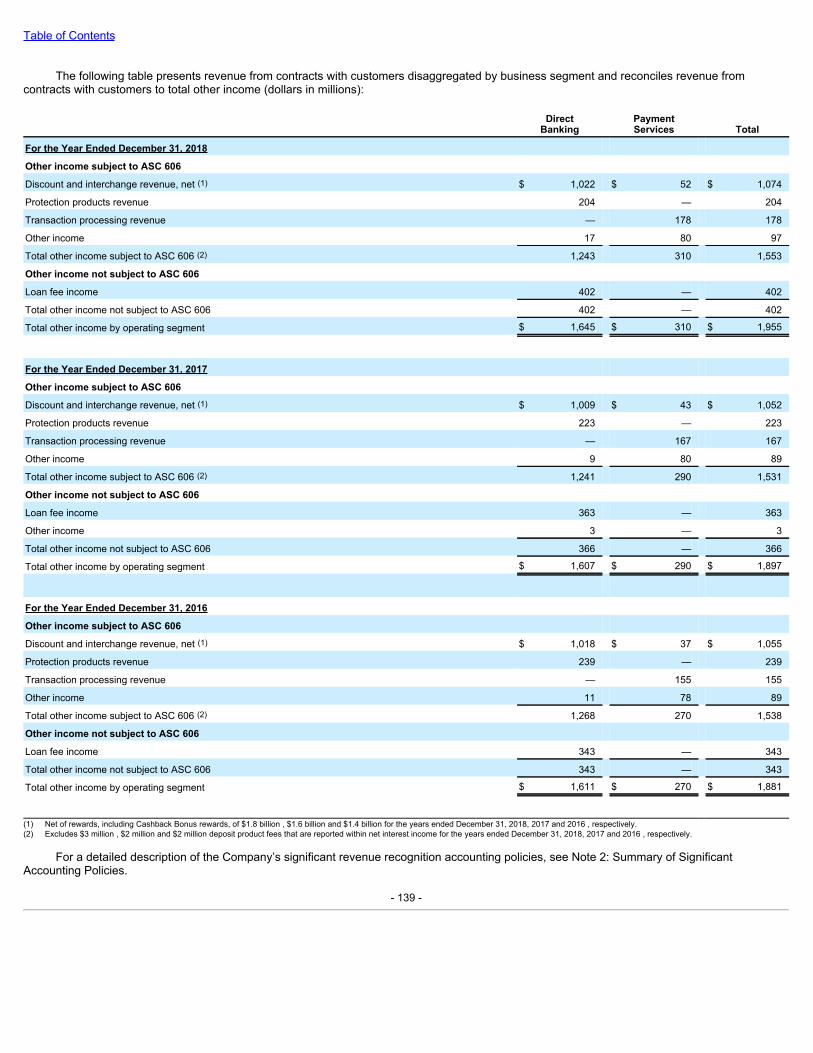
Table of Contents
The following table presents revenue from contracts with customers disaggregated by business segment and reconciles revenue fromcontracts with customers to total other income (dollars in millions):
Direct
Banking PaymentServices Total
For the Year Ended December 31, 2018
Other income subject to ASC 606
Discount and interchange revenue, net (1) $ 1,022 $ 52 $ 1,074
Protection products revenue 204 — 204
Transaction processing revenue — 178 178
Other income 17 80 97
Total other income subject to ASC 606 (2) 1,243 310 1,553
Other income not subject to ASC 606
Loan fee income 402 — 402
Total other income not subject to ASC 606 402 — 402
Total other income by operating segment $ 1,645 $ 310 $ 1,955
For the Year Ended December 31, 2017
Other income subject to ASC 606
Discount and interchange revenue, net (1) $ 1,009 $ 43 $ 1,052
Protection products revenue 223 — 223
Transaction processing revenue — 167 167
Other income 9 80 89
Total other income subject to ASC 606 (2) 1,241 290 1,531
Other income not subject to ASC 606
Loan fee income 363 — 363
Other income 3 — 3
Total other income not subject to ASC 606 366 — 366
Total other income by operating segment $ 1,607 $ 290 $ 1,897
For the Year Ended December 31, 2016
Other income subject to ASC 606
Discount and interchange revenue, net (1) $ 1,018 $ 37 $ 1,055
Protection products revenue 239 — 239
Transaction processing revenue — 155 155
Other income 11 78 89
Total other income subject to ASC 606 (2) 1,268 270 1,538
Other income not subject to ASC 606
Loan fee income 343 — 343
Total other income not subject to ASC 606 343 — 343
Total other income by operating segment $ 1,611 $ 270 $ 1,881
(1) Net of rewards, including Cashback Bonus rewards, of $1.8 billion , $1.6 billion and $1.4 billion for the years ended December 31, 2018, 2017 and 2016 , respectively.(2) Excludes $3 million , $2 million and $2 million deposit product fees that are reported within net interest income for the years ended December 31, 2018, 2017 and 2016 , respectively.
For a detailed description of the Company’s significant revenue recognition accounting policies, see Note 2: Summary of SignificantAccounting Policies.
- 139 -
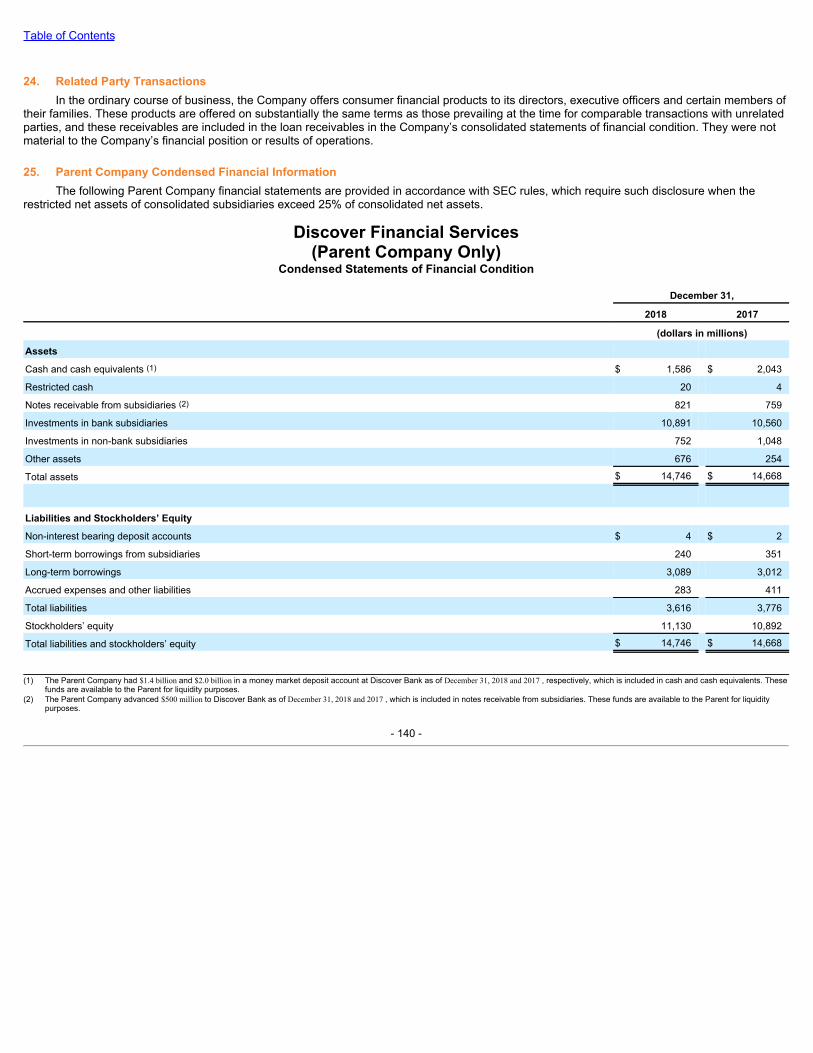
Table of Contents
24. Related Party TransactionsIn the ordinary course of business, the Company offers consumer financial products to its directors, executive officers and certain members of
their families. These products are offered on substantially the same terms as those prevailing at the time for comparable transactions with unrelatedparties, and these receivables are included in the loan receivables in the Company’s consolidated statements of financial condition. They were notmaterial to the Company’s financial position or results of operations.
25. Parent Company Condensed Financial InformationThe following Parent Company financial statements are provided in accordance with SEC rules, which require such disclosure when the
restricted net assets of consolidated subsidiaries exceed 25% of consolidated net assets.
Discover Financial Services(Parent Company Only)
Condensed Statements of Financial Condition
December 31, 2018 2017 (dollars in millions)
Assets
Cash and cash equivalents (1) $ 1,586 $ 2,043
Restricted cash 20 4
Notes receivable from subsidiaries (2) 821 759
Investments in bank subsidiaries 10,891 10,560
Investments in non-bank subsidiaries 752 1,048
Other assets 676 254
Total assets $ 14,746 $ 14,668
Liabilities and Stockholders’ Equity
Non-interest bearing deposit accounts $ 4 $ 2
Short-term borrowings from subsidiaries 240 351
Long-term borrowings 3,089 3,012
Accrued expenses and other liabilities 283 411
Total liabilities 3,616 3,776
Stockholders’ equity 11,130 10,892
Total liabilities and stockholders’ equity $ 14,746 $ 14,668
(1) The Parent Company had $1.4 billion and $2.0 billion in a money market deposit account at Discover Bank as of December 31, 2018 and 2017 , respectively, which is included in cash and cash equivalents. These
funds are available to the Parent for liquidity purposes.(2) The Parent Company advanced $500 million to Discover Bank as of December 31, 2018 and 2017 , which is included in notes receivable from subsidiaries. These funds are available to the Parent for liquidity
purposes.
- 140 -
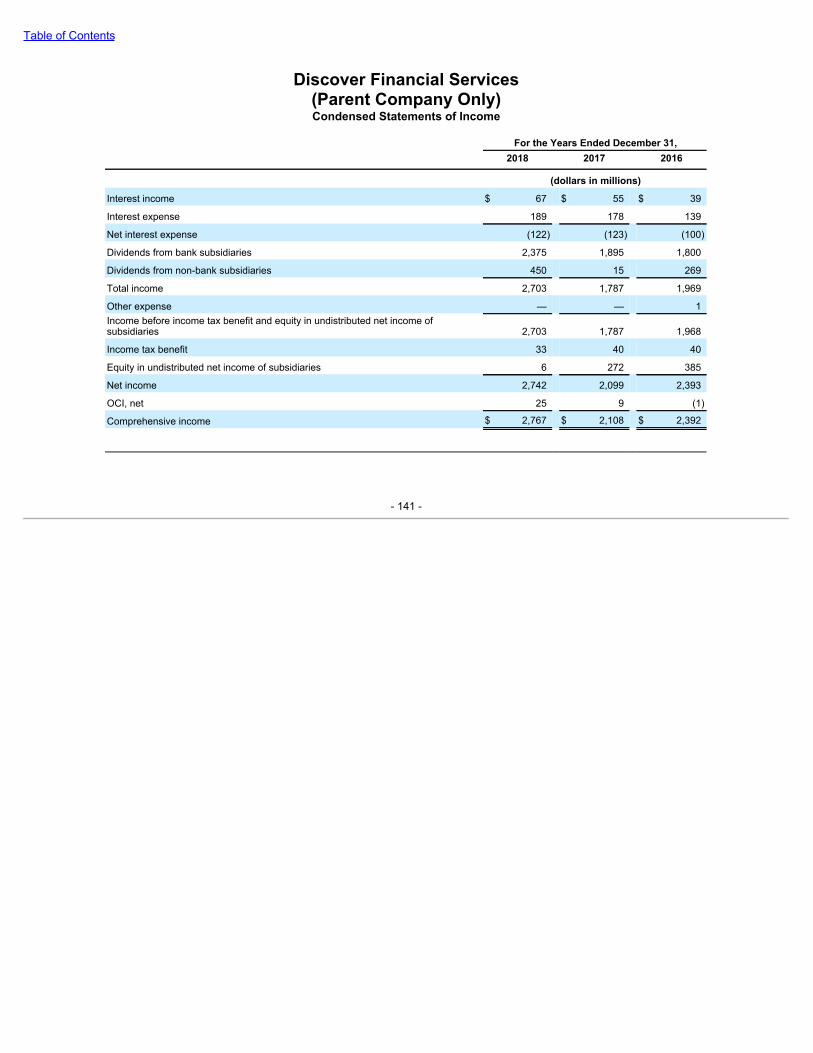
Table of Contents
Discover Financial Services(Parent Company Only)Condensed Statements of Income
For the Years Ended December 31, 2018 2017 2016
(dollars in millions)
Interest income $ 67 $ 55 $ 39
Interest expense 189 178 139
Net interest expense (122) (123) (100)
Dividends from bank subsidiaries 2,375 1,895 1,800
Dividends from non-bank subsidiaries 450 15 269
Total income 2,703 1,787 1,969
Other expense — — 1Income before income tax benefit and equity in undistributed net income ofsubsidiaries 2,703 1,787 1,968
Income tax benefit 33 40 40
Equity in undistributed net income of subsidiaries 6 272 385
Net income 2,742 2,099 2,393
OCI, net 25 9 (1)
Comprehensive income $ 2,767 $ 2,108 $ 2,392
- 141 -
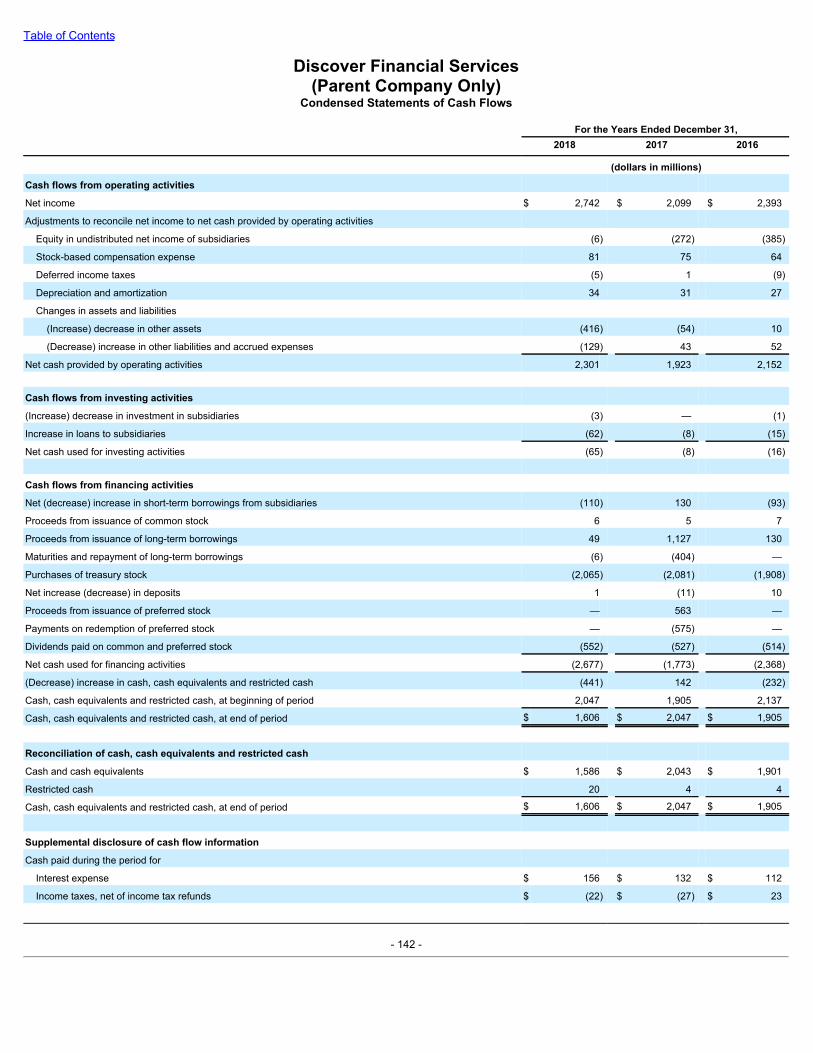
Table of Contents
Discover Financial Services(Parent Company Only)
Condensed Statements of Cash Flows
For the Years Ended December 31, 2018 2017 2016
(dollars in millions)
Cash flows from operating activities
Net income $ 2,742 $ 2,099 $ 2,393
Adjustments to reconcile net income to net cash provided by operating activities
Equity in undistributed net income of subsidiaries (6) (272) (385)
Stock-based compensation expense 81 75 64
Deferred income taxes (5) 1 (9)
Depreciation and amortization 34 31 27
Changes in assets and liabilities
(Increase) decrease in other assets (416) (54) 10
(Decrease) increase in other liabilities and accrued expenses (129) 43 52
Net cash provided by operating activities 2,301 1,923 2,152 Cash flows from investing activities
(Increase) decrease in investment in subsidiaries (3) — (1)
Increase in loans to subsidiaries (62) (8) (15)
Net cash used for investing activities (65) (8) (16) Cash flows from financing activities
Net (decrease) increase in short-term borrowings from subsidiaries (110) 130 (93)
Proceeds from issuance of common stock 6 5 7
Proceeds from issuance of long-term borrowings 49 1,127 130
Maturities and repayment of long-term borrowings (6) (404) —
Purchases of treasury stock (2,065) (2,081) (1,908)
Net increase (decrease) in deposits 1 (11) 10
Proceeds from issuance of preferred stock — 563 —
Payments on redemption of preferred stock — (575) —
Dividends paid on common and preferred stock (552) (527) (514)
Net cash used for financing activities (2,677) (1,773) (2,368)
(Decrease) increase in cash, cash equivalents and restricted cash (441) 142 (232)
Cash, cash equivalents and restricted cash, at beginning of period 2,047 1,905 2,137
Cash, cash equivalents and restricted cash, at end of period $ 1,606 $ 2,047 $ 1,905
Reconciliation of cash, cash equivalents and restricted cash
Cash and cash equivalents $ 1,586 $ 2,043 $ 1,901
Restricted cash 20 4 4
Cash, cash equivalents and restricted cash, at end of period $ 1,606 $ 2,047 $ 1,905
Supplemental disclosure of cash flow information
Cash paid during the period for
Interest expense $ 156 $ 132 $ 112
Income taxes, net of income tax refunds $ (22) $ (27) $ 23
- 142 -
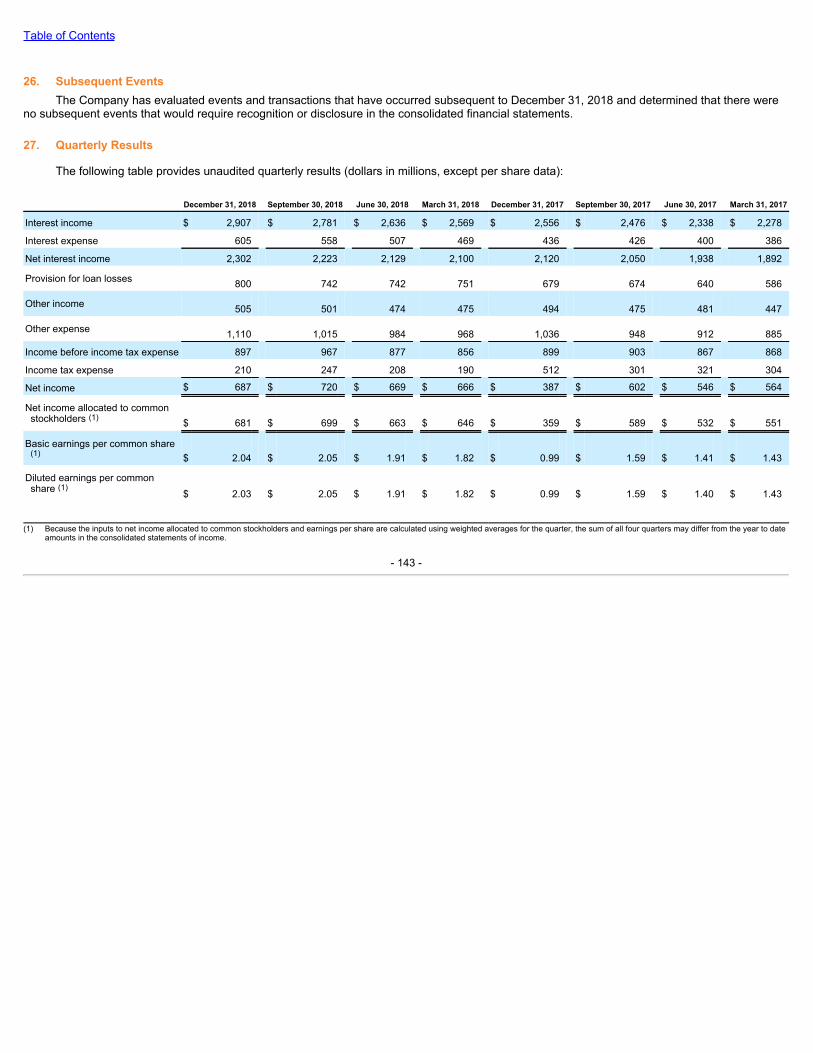
Table of Contents
26. Subsequent EventsThe Company has evaluated events and transactions that have occurred subsequent to December 31, 2018 and determined that there were
no subsequent events that would require recognition or disclosure in the consolidated financial statements.
27. Quarterly Results
The following table provides unaudited quarterly results (dollars in millions, except per share data):
December 31, 2018 September 30, 2018 June 30, 2018 March 31, 2018 December 31, 2017 September 30, 2017 June 30, 2017 March 31, 2017
Interest income $ 2,907 $ 2,781 $ 2,636 $ 2,569 $ 2,556 $ 2,476 $ 2,338 $ 2,278
Interest expense 605 558 507 469 436 426 400 386
Net interest income 2,302 2,223 2,129 2,100 2,120 2,050 1,938 1,892
Provision for loan losses 800 742 742 751 679 674 640 586
Other income 505 501 474 475 494 475 481 447
Other expense 1,110 1,015 984 968 1,036 948 912 885
Income before income tax expense 897 967 877 856 899 903 867 868
Income tax expense 210 247 208 190 512 301 321 304
Net income $ 687 $ 720 $ 669 $ 666 $ 387 $ 602 $ 546 $ 564
Net income allocated to commonstockholders (1) $ 681 $ 699 $ 663 $ 646 $ 359 $ 589 $ 532 $ 551
Basic earnings per common share(1) $ 2.04 $ 2.05 $ 1.91 $ 1.82 $ 0.99 $ 1.59 $ 1.41 $ 1.43
Diluted earnings per commonshare (1)
$ 2.03 $ 2.05 $ 1.91 $ 1.82 $ 0.99 $ 1.59 $ 1.40 $ 1.43 (1) Because the inputs to net income allocated to common stockholders and earnings per share are calculated using weighted averages for the quarter, the sum of all four quarters may differ from the year to date
amounts in the consolidated statements of income.
- 143 -
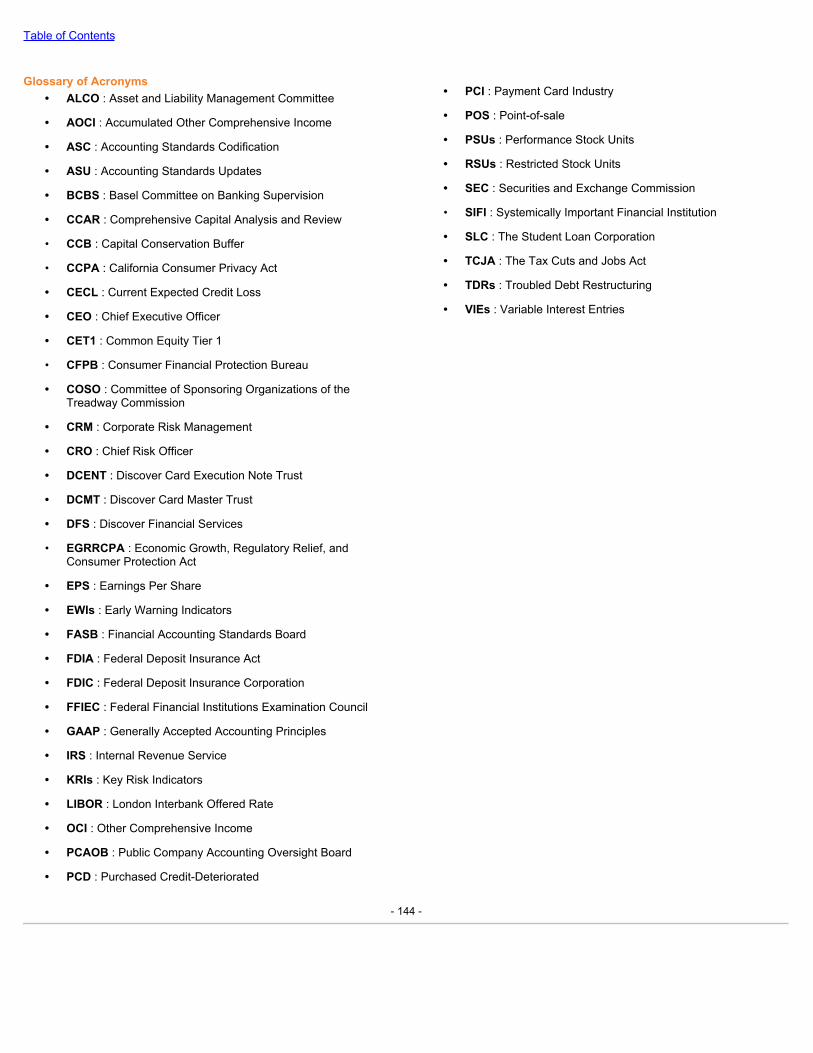
Table of Contents
Glossary of Acronyms• ALCO : Asset and Liability Management Committee
• AOCI : Accumulated Other Comprehensive Income
• ASC : Accounting Standards Codification
• ASU : Accounting Standards Updates
• BCBS : Basel Committee on Banking Supervision
• CCAR : Comprehensive Capital Analysis and Review
• CCB : Capital Conservation Buffer
• CCPA : California Consumer Privacy Act
• CECL : Current Expected Credit Loss
• CEO : Chief Executive Officer
• CET1 : Common Equity Tier 1
• CFPB : Consumer Financial Protection Bureau
• COSO : Committee of Sponsoring Organizations of theTreadway Commission
• CRM : Corporate Risk Management
• CRO : Chief Risk Officer
• DCENT : Discover Card Execution Note Trust
• DCMT : Discover Card Master Trust
• DFS : Discover Financial Services
• EGRRCPA : Economic Growth, Regulatory Relief, andConsumer Protection Act
• EPS : Earnings Per Share
• EWIs : Early Warning Indicators
• FASB : Financial Accounting Standards Board
• FDIA : Federal Deposit Insurance Act
• FDIC : Federal Deposit Insurance Corporation
• FFIEC : Federal Financial Institutions Examination Council
• GAAP : Generally Accepted Accounting Principles
• IRS : Internal Revenue Service
• KRIs : Key Risk Indicators
• LIBOR : London Interbank Offered Rate
• OCI : Other Comprehensive Income
• PCAOB : Public Company Accounting Oversight Board
• PCD : Purchased Credit-Deteriorated
• PCI : Payment Card Industry
• POS : Point-of-sale
• PSUs : Performance Stock Units
• RSUs : Restricted Stock Units
• SEC : Securities and Exchange Commission
• SIFI : Systemically Important Financial Institution
• SLC : The Student Loan Corporation
• TCJA : The Tax Cuts and Jobs Act
• TDRs : Troubled Debt Restructuring
• VIEs : Variable Interest Entries
- 144 -

Table of Contents
Item 9. Changes in and Disagreements with Accountants on Accounting and Financial DisclosureNone.
Item 9A. Controls and Procedures
Evaluation of Disclosure Controls and ProceduresUnder the supervision and with the participation of our management, including our Chief Executive Officer and Chief Financial Officer, we
conducted an evaluation of the effectiveness of our disclosure controls and procedures (as defined in Rule 13a-15(e) and 15d-15(e) of the SecuritiesExchange Act of 1934, as amended (the “Exchange Act”)), which are designed to ensure that information required to be disclosed by us in thereports that we file or submit under the Exchange Act is recorded, processed, summarized and reported within the time periods specified by theSEC’s rules and forms. Disclosure controls and procedures include, without limitation, controls and procedures designed to ensure that informationrequired to be disclosed by us in the reports that we file or submit under the Exchange Act is accumulated and communicated to our management,including our Chief Executive Officer and Chief Financial Officer, as appropriate to allow timely decisions regarding required disclosure. Based onthis evaluation, our Chief Executive Officer and Chief Financial Officer concluded that our disclosure controls and procedures were effective as ofthe end of the period covered by this report.
Management’s Report on Internal Control over Financial ReportingOur management is responsible for establishing and maintaining adequate internal control over financial reporting (as such term is defined in
Exchange Act Rule 13a-15(f) and 15d-15(f)) for the Company. Our internal control over financial reporting is designed to provide reasonableassurance regarding the reliability of financial reporting and the preparation of financial statements in accordance with generally acceptedaccounting principles. There are inherent limitations to the effectiveness of any system of internal control over financial reporting. These limitationsinclude the possibility of human error, the circumvention or overriding of the system and reasonable resource constraints. Because of its inherentlimitations, our internal control over financial reporting may not prevent or detect misstatements. Projections of any evaluation of effectiveness tofuture periods are subject to the risk that controls may become inadequate because of changes in conditions or that the degree of compliance withpolicies or procedures may deteriorate.
Management assessed the effectiveness of our internal control over financial reporting as of December 31, 2018 . In making this assessment,management used the criteria set forth in InternalControl-IntegratedFramework(2013)issued by the Committee of Sponsoring Organizations ofthe Treadway Commission. Based on management’s assessments and those criteria, management has concluded that our internal control overfinancial reporting was effective as of December 31, 2018 .
The effectiveness of our internal control over financial reporting as of December 31, 2018 has been audited by Deloitte & Touche LLP, anindependent registered public accounting firm, and the firm’s report on this matter is included in Item 8 of this annual report on Form 10-K.
Changes in Internal Control over Financial ReportingThere have been no changes in our internal control over financial reporting (as such term is defined in Exchange Act Rule 13a-15(f) and 15d-
15(f)) that occurred during the period covered by this report that have materially affected, or are reasonably likely to materially affect, our internalcontrol over financial reporting.
Item 9B. Other InformationNone.
- 145 -
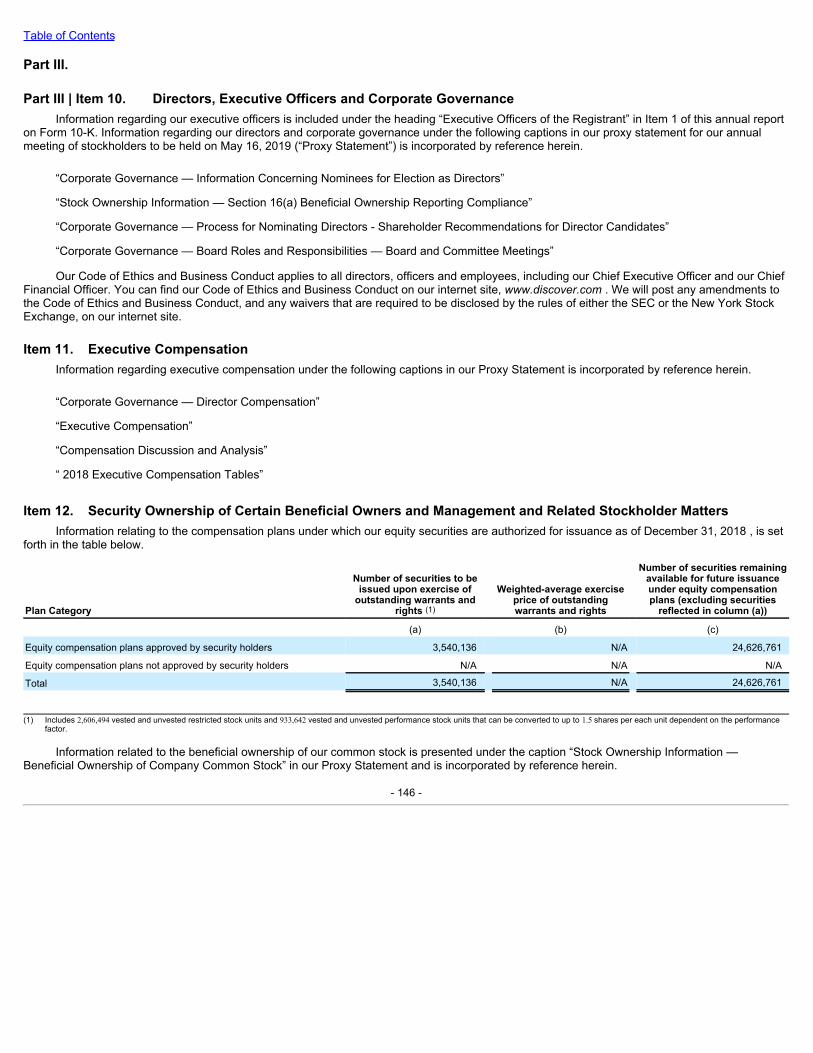
Table of Contents
Part III.
Part III | Item 10. Directors, Executive Officers and Corporate GovernanceInformation regarding our executive officers is included under the heading “Executive Officers of the Registrant” in Item 1 of this annual report
on Form 10-K. Information regarding our directors and corporate governance under the following captions in our proxy statement for our annualmeeting of stockholders to be held on May 16, 2019 (“Proxy Statement”) is incorporated by reference herein.
“Corporate Governance — Information Concerning Nominees for Election as Directors”
“Stock Ownership Information — Section 16(a) Beneficial Ownership Reporting Compliance”
“Corporate Governance — Process for Nominating Directors - Shareholder Recommendations for Director Candidates”
“Corporate Governance — Board Roles and Responsibilities — Board and Committee Meetings”
Our Code of Ethics and Business Conduct applies to all directors, officers and employees, including our Chief Executive Officer and our ChiefFinancial Officer. You can find our Code of Ethics and Business Conduct on our internet site, www.discover.com. We will post any amendments tothe Code of Ethics and Business Conduct, and any waivers that are required to be disclosed by the rules of either the SEC or the New York StockExchange, on our internet site.
Item 11. Executive CompensationInformation regarding executive compensation under the following captions in our Proxy Statement is incorporated by reference herein.
“Corporate Governance — Director Compensation”
“Executive Compensation”
“Compensation Discussion and Analysis”
“ 2018 Executive Compensation Tables”
Item 12. Security Ownership of Certain Beneficial Owners and Management and Related Stockholder MattersInformation relating to the compensation plans under which our equity securities are authorized for issuance as of December 31, 2018 , is set
forth in the table below.
Plan Category
Number of securities to beissued upon exercise of
outstanding warrants andrights (1)
Weighted-average exerciseprice of outstandingwarrants and rights
Number of securities remainingavailable for future issuanceunder equity compensationplans (excluding securities
reflected in column (a)) (a) (b) (c)
Equity compensation plans approved by security holders 3,540,136 N/A 24,626,761
Equity compensation plans not approved by security holders N/A N/A N/A
Total 3,540,136 N/A 24,626,761
(1) Includes 2,606,494 vested and unvested restricted stock units and 933,642 vested and unvested performance stock units that can be converted to up to 1.5 shares per each unit dependent on the performance
factor.
Information related to the beneficial ownership of our common stock is presented under the caption “Stock Ownership Information —Beneficial Ownership of Company Common Stock” in our Proxy Statement and is incorporated by reference herein.
- 146 -

Table of Contents
Item 13. Certain Relationships and Related Transactions, and Director IndependenceInformation regarding certain relationships and related transactions, and director independence under the following captions in our Proxy
Statement is incorporated by reference herein.
“Other Matters — Certain Transactions”
“Corporate Governance — Information Concerning Nominees for Election as Directors — Director Independence”
Item 14. Principal Accounting Fees and ServicesInformation regarding principal accounting fees and services in our Proxy Statement is incorporated by reference herein.
- 147 -
Table of Contents
Part IV.
Part IV | Item 15. Exhibits, Financial Statement Schedules
(a) Documents filed as part of this Form 10-K:
1. Consolidated Financial StatementsThe consolidated financial statements required to be filed in this annual report on Form 10-K are listed below and appear on pages 74 through
143 herein.
INDEX TO CONSOLIDATED FINANCIAL STATEMENTS
Reports of Independent Registered Public Accounting Firm 74Consolidated Statements of Financial Condition as of December 31, 2018 and 2017 76Consolidated Statements of Income for the years ended December 31, 2018, 2017 and 2016 77Consolidated Statements of Comprehensive Income for the years ended December 31, 2018, 2017 and 2016 78Consolidated Statements of Changes in Stockholders’ Equity for the years ended December 31, 2018, 2017 and 2016 79Consolidated Statements of Cash Flows for the years ended December 31, 2018, 2017 and 2016 80Notes to the Consolidated Financial Statements 81
2. Financial Statement SchedulesSeparate financial statement schedules have been omitted either because they are not applicable or because the required information is
included in the consolidated financial statements.
3. ExhibitsSee the Exhibit Index below for a list of the exhibits being filed or furnished with or incorporated by reference into this annual report on Form
10-K.
Exhibit Index
ExhibitNumber
Description
2.1*
Separation and Distribution Agreement, dated as of June 29, 2007, between Morgan Stanley and Discover Financial Services (filedas Exhibit 2.1 to Discover Financial Services’ Current Report on Form 8-K filed on July 5, 2007 and incorporated herein byreference thereto), as amended by the First Amendment to the Separation and Distribution Agreement dated as of June 29, 2007between Discover Financial Services and Morgan Stanley, dated February 11, 2010 (filed as Exhibit 10.2 to Discover FinancialServices’ Current Report on Form 8-K filed on February 12, 2010 and incorporated herein by reference thereto).
2.2*
Agreement for the Sale and Purchase of the Goldfish Credit Card Business, dated February 7, 2008, among Discover FinancialServices, Goldfish Bank Limited, Discover Bank, SCFC Receivables Corporation, and Barclays Bank Plc (filed as Exhibit 2.1 toDiscover Financial Services’ Current Report on Form 8-K filed on February 7, 2008 and incorporated herein by reference thereto),as amended and restated by Amended and Restated Agreement for the Sale and Purchase of the Goldfish Credit Card Business,dated March 31, 2008, among Discover Financial Services, Goldfish Bank Limited, Discover Bank, SCFC Receivables Corporation,Barclays Bank PLC, and Barclays Group US Inc. (filed as Exhibit 2.1 to Discover Financial Services’ Quarterly Report on Form 10-Q filed on April 14, 2008 and incorporated herein by reference thereto).
- 148 -
Table of Contents
ExhibitNumber
Description
2.3
Agreement and Plan of Merger by and among Discover Bank, Academy Acquisition Corp. and The Student Loan Corporation datedas of September 17, 2010 (filed as Exhibit 2.3 to Discover Financial Services’ Annual Report on Form 10-K for the fiscal yearended November 30, 2010 filed on January 26, 2011 and incorporated herein by reference thereto).
3.1
Amended and Restated Certificate of Incorporation of Discover Financial Services (filed as Exhibit 3.1 to Discover FinancialServices’ Quarterly Report on Form 10-Q filed on July 1, 2009 and incorporated herein by reference thereto).
3.2
Amended and Restated By-Laws of Discover Financial Services (filed as Exhibit 3.1 to Discover Financial Services’ Current Reporton Form 8-K filed on December 19, 2016 and incorporated herein by reference thereto).
3.3
Certificate of Elimination of the Fixed Rate Cumulative Perpetual Preferred Stock, Series A, of Discover Financial Services (filed asExhibit 3.2 to Discover Financial Services’ Quarterly Report on Form 10-Q filed on June 26, 2012 and incorporated herein byreference thereto).
3.4
Certificate of Designations of Fixed Rate Non-Cumulative Perpetual Preferred Stock, Series B (filed as Exhibit 3.1 to DiscoverFinancial Services’ Current Report on Form 8-K filed on October 16, 2012 and incorporated herein by reference thereto).
3.5
Certificate of Designations of Fixed-to-Floating Rate Non-Cumulative Perpetual Preferred Stock, Series C (filed as Exhibit 3.1 toDiscover Financial Services' Current Report on Form 8-K filed on October 31, 2017 and incorporated herein by reference thereto).
3.6
Certificate of Elimination of Fixed-to-Floating Rate Non-Cumulative Perpetual Preferred Stock, Series B (filed as Exhibit 3.1 toDiscover Financial Services' Current Report on Form 8-K filed on December 4, 2017 and incorporated herein by reference thereto).
4.1
Senior Indenture, dated as of June 12, 2007, by and between Discover Financial Services and U.S. Bank National Association, astrustee (filed as Exhibit 4.1 to Discover Financial Services’ Current Report on Form 8-K filed on June 12, 2007 and incorporatedherein by reference thereto).
4.2
Subordinated Indenture, dated as of September 8, 2015, by and between Discover Financial Services and U.S. Bank NationalAssociation (filed as Exhibit 4.1 to Discover Financial Services’ Current Report on Form 8-K filed on September 8, 2015 andincorporated herein by reference thereto).
4.3
Fiscal and Paying Agency Agreement, dated November 16, 2009, between Discover Bank, as issuer, and U.S. Bank NationalAssociation, as fiscal and paying agent (filed as Exhibit 4.1 to Discover Financial Services’ Current Report on Form 8-K filed onNovember 16, 2009 and incorporated herein by reference thereto).
4.4
Fiscal and Paying Agency Agreement, dated April 15, 2010, between Discover Bank, as issuer, and U.S. Bank NationalAssociation, as fiscal and paying agent (filed as Exhibit 4.1 to Discover Financial Services’ Current Report on Form 8-K filed onApril 16, 2010 and incorporated herein by reference thereto).
4.5
Deposit Agreement, dated October 31, 2017 (filed as Exhibit 4.1 to Discover Financial Services' Current Report on Form 8-K filedon October 31, 2017 and incorporated herein by reference thereto).
4.6
Form of Certificate Representing the Fixed-to-Floating Rate Non-Cumulative Perpetual Preferred Stock, Series C (filed as Exhibit4.2 to Discover Financial Services' Current Report on Form 8-K filed on October 31, 2017 and incorporated herein by referencethereto).
4.7
Fiscal and Paying Agency Agreement between Discover Bank and U.S. Bank National Association dated as of February 21, 2013(filed as Exhibit 4.1 to Discover Financial Services’ Current Report on Form 8-K filed on February 21, 2013 and incorporated hereinby reference thereto).
4.8
Fiscal and Paying Agency Agreement, dated as of August 8, 2013, between Discover Bank, as issuer, and U.S. Bank NationalAssociation, as fiscal and paying agent (filed as Exhibit 4.1 to Discover Financial Services’ Current Report on Form 8-K filed onAugust 8, 2013 and incorporated herein by reference thereto).
- 149 -
Table of Contents
ExhibitNumber
Description
4.9
Fiscal and Paying Agency Agreement, dated as of March 13, 2014, between Discover Bank, as issuer, and U.S. Bank NationalAssociation, as fiscal and paying agent (filed as Exhibit 4.1 to Discover Financial Services’ Current Report on Form 8-K filed onMarch 13, 2014 and incorporated herein by reference thereto).
4.10
Fiscal and Paying Agency Agreement, dated as of August 7, 2014, between Discover Bank, as issuer, and U.S. Bank NationalAssociation, as fiscal and paying agent (filed as Exhibit 4.1 to Discover Financial Services’ Current Report on Form 8-K filed onAugust 7, 2014 and incorporated herein by reference thereto).
4.11
Fiscal and Paying Agency Agreement, dated June 4, 2015, between Discover Bank, as issuer, and U.S. Bank National Association,as fiscal and paying agent (filed as Exhibit 4.1 to Discover Financial Services’ current report on Form 8-K filed on June 4, 2015 andincorporated herein by reference thereto).
4.12
Fiscal and Paying Agency Agreement, dated August 13, 2015, between Discover Bank, as issuer, and U.S. Bank NationalAssociation, as fiscal and paying agent (filed as Exhibit 4.1 to Discover Financial Services’ current report on Form 8-K filed onAugust 13, 2015 and incorporated herein by reference thereto).
4.13
Fiscal and Paying Agency Agreement, dated July 27, 2016, between Discover Bank, as issuer, and U.S. Bank NationalAssociation, as fiscal and paying agent (filed as Exhibit 4.1 to Discover Financial Services’ current report on Form 8-K filed on July28, 2016 and incorporated herein by reference thereto).
Otherinstrumentsdefiningtherightsofholdersoflong-termdebtsecuritiesofDiscoverFinancialServicesanditssubsidiariesareomittedpursuanttoSection(b)(4)(iii)(A)ofItem601ofRegulationS-K.DiscoverFinancialServicesagreestofurnishcopiesoftheseinstrumentstotheSECuponrequest.
10.1
Tax Sharing Agreement, dated as of June 30, 2007, between Morgan Stanley and Discover Financial Services (filed as Exhibit 10.1to Discover Financial Services’ Current Report on Form 8-K filed on July 5, 2007 and incorporated herein by reference thereto).
10.2
U.S. Employee Matters Agreement, dated as of June 30, 2007, between Morgan Stanley and Discover Financial Services (filed asExhibit 10.2 to Discover Financial Services’ Current Report on Form 8-K filed on July 5, 2007 and incorporated herein by referencethereto).
10.3
Transition Services Agreement, dated as of June 30, 2007, between Morgan Stanley and Discover Financial Services (filed asExhibit 10.3 to Discover Financial Services’ Current Report on Form 8-K filed on July 5, 2007 and incorporated herein by referencethereto).
10.4
Transitional Trade Mark License Agreement, dated as of June 30, 2007, between Morgan Stanley & Co. PLC and Goldfish BankLimited (filed as Exhibit 10.4 to Discover Financial Services’ Current Report on Form 8-K filed on July 5, 2007 and incorporatedherein by reference thereto).
10.5
Amended and Restated Trust Agreement, dated as of December 22, 2015, between Discover Funding LLC, as Beneficiary, andWilmington Trust Company, as Owner Trustee (filed as Exhibit 4.6 to Discover Bank’s Current Report on Form 8-K filed onDecember 23, 2015 and incorporated herein by reference thereto).
10.6
Third Amended and Restated Pooling and Servicing Agreement, dated as of December 22, 2015, between Discover Bank, asMaster Servicer and Servicer, Discover Funding LLC, as Transferor, and U.S. Bank National Association, as Trustee (filed asExhibit 4.2 to Discover Bank’s Current Report on Form 8-K filed on December 23, 2015 and incorporated herein by referencethereto).
10.7
Amended and Restated Series Supplement for Series 2007-CC, dated as of December 22, 2015, among Discover Bank, as MasterServicer and Servicer, Discover Funding LLC, as Transferor, and U.S. Bank National Association, as Trustee (filed as Exhibit 4.3 toDiscover Bank’s Current Report on Form 8-K filed on December 23, 2015 and incorporated herein by reference thereto).
10.8 †
Discover Financial Services Omnibus Incentive Plan (filed as an attachment to Discover Financial Services’ Proxy Statement onSchedule 14A filed on February 27, 2009 and incorporated herein by reference thereto).
10.9 †
Amended Form of Restricted Stock Unit Award Under Discover Financial Services Omnibus Incentive Plan (filed as Exhibit 10.6 toDiscover Financial Services’ Quarterly Report on Form 10-Q filed on July 12, 2007 and incorporated herein by reference thereto).
- 150 -
Table of Contents
ExhibitNumber
Description
10.10†
Directors’ Compensation Plan of Discover Financial Services (filed as Exhibit 10.3 to Discover Financial Services’ Current Reporton Form 8-K filed on June 19, 2007 and incorporated herein by reference thereto), as amended and restated as of January 20,2011 (filed as Exhibit A to the Discover Financial Services’ definitive proxy statement filed on February 18, 2011 and incorporatedherein by reference thereto), as further amended by Amendment No. 2, effective as of December 1, 2011 (filed as Exhibit 10.10 tothe Discover Financial Services’ Annual Report on Form 10-K filed on January 26, 2012 and incorporated herein by referencethereto).
10.11 †
Amended Form of Restricted Stock Unit Award Under Discover Financial Services Directors’ Compensation Plan (filed as Exhibit10.7 to Discover Financial Services’ Quarterly Report on Form 10-Q filed on July 12, 2007 and incorporated herein by referencethereto).
10.12†
Discover Financial Services Employee Stock Purchase Plan (filed as Exhibit 10.2 to Discover Financial Services’ Current Reporton Form 8-K filed on June 19, 2007 and incorporated herein by reference thereto) as amended by Amendment No. 1 to DiscoverFinancial Services Employee Stock Purchase Plan effective as of May 1, 2008 (filed as Exhibit 10.12 to Discover FinancialServices’ Annual Report on Form 10-K filed on January 28, 2009 and incorporated herein by reference thereto); Amendment No. 2to Discover Financial Services Employee Stock Purchase Plan, effective as of December 1, 2009 (filed as Exhibit 10.2 to DiscoverFinancial Services’ Quarterly Report on Form 10-Q filed on April 9, 2010 and incorporated herein by reference thereto); andAmendment No. 3 to Discover Financial Services Employee Stock Purchase Plan (filed as Exhibit 10.3 to Discover FinancialServices’ Quarterly Report on Form 10-Q filed on September 28, 2011 and incorporated herein by reference thereto).
10.13 †
Offer of Employment, dated as of January 8, 1999 (filed as Exhibit 10.2 to Discover Financial Services’ Current Report on Form 8-Kfiled on June 12, 2007 and incorporated herein by reference thereto).
10.14 †
Waiver of Change of Control Benefits, dated September 24, 2007 (filed as Exhibit 10.15 to Discover Financial Services’Registration Statement on Form S-4 filed on November 27, 2007 and incorporated herein by reference thereto).
10.15
Collateral Certificate Transfer Agreement, dated as of July 26, 2007 between Discover Bank, as Depositor and Discover CardExecution Note Trust (filed as Exhibit 4.4 to Discover Bank’s Current Report on Form 8-K filed on July 27, 2007 and incorporatedherein by reference thereto).
10.16
Amended and Restated Indenture, dated as of December 22, 2015, between Discover Card Execution Note Trust, as Issuer, andU.S. Bank National Association, as Indenture Trustee (filed as Exhibit 4.4 to Discover Bank’s Current Report on Form 8-K filed onDecember 23, 2015 and incorporated herein by reference thereto).
10.17
Second Amended and Restated Indenture Supplement for the DiscoverSeries Notes, dated as of December 22, 2015, betweenDiscover Card Execution Note Trust, as Issuer, and U.S. Bank National Association, as Indenture Trustee (filed as Exhibit 4.5 toDiscover Bank’s Current Report on Form 8-K filed on December 23, 2015 and incorporated herein by reference thereto).
10.18
Omnibus Amendment to Indenture Supplement and Terms Documents, dated as of July 2, 2009, between Discover Card ExecutionNote Trust, as Issuer, and U.S. Bank National Association, as Indenture Trustee (filed as Exhibit 4.1 to Discover Bank’s CurrentReport on Form 8-K filed on July 6, 2009 and incorporated herein by reference thereto).
10.19 †
Discover Financial Services Change-in-Control Severance Policy Amended and Restated October 15, 2014 (filed as Exhibit 10.1 toDiscover Financial Services’ Current Report on Form 8-K filed on October 16, 2014 and incorporated herein by reference thereto).
10.20
Release and Settlement Agreement, executed as of October 27, 2008, by and among Discover Financial Services, DFS Services,LLC, Discover Bank, and their Subsidiaries and Affiliates; MasterCard Incorporated and MasterCard International Incorporated andtheir Affiliates; and Visa Inc. and its Affiliates and Predecessors including Visa U.S.A. Inc. and Visa International ServiceAssociation (filed as Exhibit 99.1 to Discover Financial Services’ Current Report on Form 8-K filed on October 28, 2008 andincorporated herein by reference thereto).
10.21 †
2008 Year End Form of Restricted Stock Unit Award Under Discover Financial Services Omnibus Incentive Plan (filed as Exhibit10.21 to Discover Financial Services’ Annual Report on Form 10-K filed on January 28, 2009 and incorporated herein by referencethereto).
- 151 -
Table of Contents
ExhibitNumber
Description
10.22 †
2008 Special Grant Form of Restricted Stock Unit Award Under Discover Financial Services Omnibus Incentive Plan (filed asExhibit 10.22 to Discover Financial Services’ Annual Report on Form 10-K filed on January 28, 2009 and incorporated herein byreference thereto).
10.23
Form of Waiver, executed by each of Discover Financial Services’ senior executive officers and certain other employees (filed asExhibit 10.3 to Discover Financial Services’ Current Report on Form 8-K filed on March 13, 2009 and incorporated herein byreference thereto).
10.24
Form of Executive Compensation Agreement, dated March 13, 2009, executed by each of Discover Financial Services’ seniorexecutive officers and certain other employees (filed as Exhibit 10.4 to Discover Financial Services’ Quarterly Report on Form 10-Qfiled on April 8, 2009 and incorporated herein by reference thereto).
10.25 †
Form of Share Award Agreement Under Discover Financial Services Amended and Restated 2007 Omnibus Incentive Plan (filedas Exhibit 10(a) to Discover Financial Services’ Current Report on Form 8-K filed on December 11, 2009 and incorporated hereinby reference thereto).
10.26 †
Amendment to 2009 Year End Award Certificate for Restricted Stock Units Under Discover Financial Services Amended andRestated 2007 Omnibus Incentive Plan, effective December 1, 2009 (filed as Exhibit 10.1 to Discover Financial Services’ QuarterlyReport on Form 10-Q filed on April 9, 2010 and incorporated herein by reference thereto).
10.27
Settlement Agreement and Mutual Release between Discover Financial Services and Morgan Stanley, dated February 11, 2010(filed as Exhibit 10.1 to Discover Financial Services’ Current Report on Form 8-K filed on February 12, 2010 and incorporatedherein by reference thereto).
10.28
Purchase Price Adjustment Agreement by and among Citibank, N.A., The Student Loan Corporation and Discover Bank, datedSeptember 17, 2010 (filed as Exhibit 10.32 to Discover Financial Services’ Annual Report on Form 10-K filed on January 26, 2011and incorporated herein by reference thereto).
10.29
Amendment to Purchase Price Adjustment Agreement by and among Citibank, N.A., The Student Loan Corporation and DiscoverBank, dated December 30, 2010 (filed as Exhibit 10.33 to Discover Financial Services’ Annual Report on Form 10-K filed onJanuary 26, 2011 and incorporated herein by reference thereto).
10.30
Indemnification Agreement by and between Citibank, N.A. and Discover Bank, dated September 17, 2010 (filed as Exhibit 10.34 toDiscover Financial Services’ Annual Report on Form 10-K filed on January 26, 2011 and incorporated herein by reference thereto).
10.31
First Amendment to Indemnification Agreement by and between Citibank, N.A. and Discover Bank, dated December 30, 2010 (filedas Exhibit 10.35 to Discover Financial Services’ Annual Report on Form 10-K filed on January 26, 2011 and incorporated herein byreference thereto).
10.32 †
Form Award Certificate for Restricted Stock Units Under Discover Financial Services Amended and Restated 2007 OmnibusIncentive Plan (filed as Exhibit 10.4 to Discover Financial Services’ Quarterly Report on Form 10-Q filed on April 8, 2011 andincorporated herein by reference thereto).
10.33 †
Form Award Certificate for Performance Stock Units Under Discover Financial Services Amended and Restated 2007 OmnibusIncentive Plan (filed as Exhibit 10.5 to Discover Financial Services’ Quarterly Report on Form 10-Q filed on April 8, 2011 andincorporated herein by reference thereto).
10.34
Asset Purchase Agreement between Discover Bank and Citibank, N.A. dated August 31, 2011 (filed as Exhibit 10.2 to DiscoverFinancial Services’ Quarterly Report on Form 10-Q filed on September 28, 2011 and incorporated herein by reference thereto).
10.35 †
Form 2012 Award Certificate for Restricted Stock Units Under Discover Financial Services Amended and Restated 2007 OmnibusIncentive Plan (filed as Exhibit 10.1 to Discover Financial Services’ Quarterly Report on Form 10-Q filed on April 4, 2012 andincorporated herein by reference thereto).
10.36 †
Form 2012 Award Certificate for Performance Stock Units Under Discover Financial Services Amended and Restated 2007Omnibus Incentive Plan (filed as Exhibit 10.2 to Discover Financial Services’ Quarterly Report on Form 10-Q filed on April 4, 2012and incorporated herein by reference thereto).
- 152 -
Table of Contents
ExhibitNumber
Description
10.37 †
Form 2013 Award Certificate for Restricted Stock Units Under Discover Financial Services Amended and Restated 2007 OmnibusIncentive Plan (filed as Exhibit 10.1 to Discover Financial Services’ Quarterly Report on Form 10-Q filed on April 30, 2013 andincorporated herein by reference thereto).
10.38 †
Form 2013 Award Certificate for Performance Stock Units Under Discover Financial Services Amended and Restated 2007Omnibus Incentive Plan (filed as Exhibit 10.2 to Discover Financial Services’ Quarterly Report on Form 10-Q filed on April 30, 2013and incorporated herein by reference thereto).
10.39 †
Amendment No. 3 to the Directors’ Compensation Plan of Discover Financial Services, effective as of July 1, 2013 (filed as Exhibit10.1 to Discover Financial Services’ Quarterly Report on Form 10-Q filed on July 30, 2013 and incorporated herein by referencethereto).
10.40 †
Form of 2013 Special Award Certificate for Restricted Stock Units Under Discover Financial Services Amended and Restated 2007Omnibus Incentive Plan (filed as Exhibit 10.1 to Discover Financial Services’ Current Report on Form 8-K filed on December 26,2013 and incorporated herein by reference thereto).
10.41 †
Discover Financial Services Amended and Restated 2014 Omnibus Incentive Plan (filed as an attachment to Discover FinancialServices’ Proxy Statement on Schedule 14A filed on March 19, 2014 and incorporated herein by reference thereto).
10.42 †
Form 2014 Award Certificate for Restricted Stock Units Under Discover Financial Services Amended andRestated 2007 Omnibus Incentive Plan (filed as Exhibit 10.1 to Discover Financial Services’ QuarterlyReport on Form 10-Q filed on April 29, 2014 and incorporated herein by reference thereto).
10.43 †
Form 2014 Award Certificate for Performance Stock Units Under Discover Financial Services Amendedand Restated 2007 Omnibus Incentive Plan (filed as Exhibit 10.2 to Discover Financial Services’Quarterly Report on Form 10-Q filed on April 29, 2014 and incorporated herein by reference thereto).
10.44 †
Amendment No. 4 to the Directors’ Compensation Plan of Discover Financial Services, effective as of May 7, 2014 (filed as Exhibit10.2 to Discover Financial Services’ Quarterly Report on Form 10-Q filed onAugust 1, 2014 and incorporated herein by reference thereto).
10.45 †
Form 2015 Award Certificate for Cash-Converted Restricted Stock Units Under Discover Financial Services Amended andRestated 2014 Omnibus Incentive Plan (filed as Exhibit 10.1 to Discover Financial Services’ Quarterly Report on Form 10-Q filedon April 30, 2015 and incorporated herein by reference thereto).
10.46 †
Form 2015 Award Certificate for Restricted Stock Units Under Discover Financial Services Amended and Restated 2014 OmnibusIncentive Plan (filed as Exhibit 10.2 to Discover Financial Services’ Quarterly Report on Form 10-Q filed on April 30, 2015 andincorporated herein by reference thereto).
10.47 †
Form 2015 Award Certificate for Performance Stock Units Under Discover Financial Services Amended and Restated 2014Omnibus Incentive Plan (filed as Exhibit 10.3 to Discover Financial Services’ Quarterly Report on Form 10-Q filed on April 30, 2015and incorporated herein by reference thereto).
10.48 †
Form of 2015 Special Award Certificate for Restricted Stock Units Under Discover Financial Services Amended and Restated 2014Omnibus Incentive Plan (filed as Exhibit 10.1 to Discover Financial Services’ Current Report on Form 8-K filed on April 30, 2015and incorporated herein by reference thereto).
10.49 †
Amendment No. 4 to Discover Financial Services Employee Stock Purchase Plan (filed as Exhibit 10.1 to Discover FinancialServices’ Quarterly Report on Form 10-Q filed on October 29, 2015 and incorporated herein by reference thereto).
10.50 †
Form of 2015 Special Award Certificate for Restricted Stock Units Under Discover Financial Services Amended and Restated 2014Omnibus Incentive Plan (filed as Exhibit 10.1 to Discover Financial Services’ Current Report on Form 8-K filed on December 21,2015 and incorporated herein by reference thereto).
10.51
Receivables Sale and Contribution Agreement, dated as of December 22, 2015 between Discover Bank and Discover Funding LLC(filed as Exhibit 4.1 to Discover Bank’s Current Report on Form 8-K filed on December 23, 2015 and incorporated herein byreference thereto).
- 153 -
Table of Contents
ExhibitNumber
Description
10.52 †
Form 2016 Award Certificate for Restricted Stock Units under Discover Financial Services Amended and Restated 2014 OmnibusIncentive Plan (filed as Exhibit 10.52 to Discover Financial Services’ Annual Report on Form 10-K filed on February 24, 2016 andincorporated herein by reference thereto).
10.53 †
Form 2016 Award Certificate for Performance Stock Units under Discover Financial Services Amended and Restated 2014Omnibus Incentive Plan (filed as Exhibit 10.53 to Discover Financial Services’ Annual Report on Form 10-K filed on February 24,2016 and incorporated herein by reference thereto).
10.54 †
Amendment No. 5 to Directors’ Compensation Plan of Discover Financial Services, effective as of January 1, 2017 (filed as Exhibit10.54 to Discover Financial Services’ Annual Report on Form 10-K filed on February 23, 2017 and incorporated herein by referencethereto).
10.55 †
Form 2017 Award Certificate for Restricted Stock Units under Discover Financial Services Amended andRestated Omnibus Incentive Plan (filed as Exhibit 10.1 to Discover Financial Services’ Quarterly Report on Form 10-Q filed on May2, 2017 and incorporated herein by reference thereto).
10.56 †
Form 2017 Award Certificate for Performance Stock Units under Discover Financial Services Amended and Restated OmnibusIncentive Plan (filed as Exhibit 10.2 to Discover Financial Services’ Quarterly Report on Form 10-Q filed on May 2, 2017 andincorporated herein by reference thereto).
10.57 †
Form 2018 Award Certificate for Restricted Stock Units under Discover Financial Services Director’s Compensation Plan (filed asExhibit 10.1 to Discover Financial Services’ Quarterly Report on Form 10-Q filed on May 1, 2018 and incorporated herein byreference thereto).
10.58 †
Form 2018 Award Certificate for Restricted Stock Units under Discover Financial Services Amended and Restated OmnibusIncentive Plan (filed as Exhibit 10.2 to Discover Financial Services’ Quarterly Report on Form 10-Q filed on May 1, 2018 andincorporated herein by reference thereto).
10.59 †
Form 2018 Award Certificate for Performance Stock Units under Discover Financial Services Amended and Restated OmnibusIncentive Plan (filed as Exhibit 10.3 to Discover Financial Services’ Quarterly Report on Form 10-Q filed on May 1, 2018 andincorporated herein by reference thereto).
10.60 †
Amendment to 2017 Directors' Annual Equity Award Certificate for Restricted Stock Units of Discover Financial Services, effectiveas of February 22, 2018 (filed as Exhibit 10.4 to Discover Financial Services’ Quarterly Report on Form 10-Q filed on May 1, 2018and incorporated herein by reference thereto).
10.61 †
Amendment No. 6 to the Directors’ Compensation Plan of Discover Financial Services, effective as of February 22, 2018 (filed asExhibit 10.5 to Discover Financial Services’ Quarterly Report on Form 10-Q filed on May 1, 2018 and incorporated herein byreference thereto).
10.62 † Amendment No. 7 to the Directors’ Compensation Plan of Discover Financial Services, effective as of January 1, 2019.
10.63 † Amendment No. 8 to the Directors’ Compensation Plan of Discover Financial Services, effective as of January 1, 2019.
21 Subsidiaries of the Registrant.
23 Consent of Independent Registered Public Accounting Firm.
24 Powers of Attorney (included on signature page).
31.1 Certification of Chief Executive Officer pursuant to Rule 13a-14(a) under the Securities Exchange Act of 1934.
31.2 Certification of Chief Financial Officer pursuant to Rule 13a-14(a) under the Securities Exchange Act of 1934.
32.1
Certification of Chief Executive Officer and Chief Financial Officer pursuant to Section 1350 of Chapter 63 of Title 18 of the UnitedStates Code.
101.INS XBRL Instance Document.
101.SCH XBRL Taxonomy Extension Schema Document.
- 154 -

Table of Contents
ExhibitNumber
Description
101.CAL XBRL Taxonomy Extension Calculation Linkbase Document.
101.DEF XBRL Taxonomy Extension Definition Linkbase Document.
101.LAB XBRL Taxonomy Extension Label Linkbase Document.
101.PRE XBRL Taxonomy Extension Presentation Linkbase Document. * We agree to furnish supplementally to the Commission a copy of any omitted schedule or exhibit to such agreement upon the request of the Commission in accordance with Item 601(b)(2) of Regulation S-K.† Management contract or compensatory plan or arrangement required to be filed as an exhibit to Form 10-K pursuant to Item 15(b) of this report.
Item 16. Form 10-K SummaryNone.
- 155 -

Table of Contents
Signature
Pursuant to the requirements of Section 13 or 15(d) of the Securities Exchange Act of 1934, the registrant has duly caused this report to besigned on its behalf by the undersigned, thereunto duly authorized.
Discover Financial Services(Registrant)
By: /s/ R. M ARK G RAF
R. Mark Graf
Executive Vice President, Chief Financial Officer
Date: February 20, 2019
- 156 -

Table of Contents
Power of AttorneyWe, the undersigned, hereby severally constitute D. Christopher Greene, our true and lawful attorney with full power to him to sign for us, and
in our names in the capacities indicated below, any and all amendments to the annual report on Form 10-K filed with the Securities and ExchangeCommission, hereby ratifying and confirming our signatures as they may be signed by our said attorneys to any and all amendments to said AnnualReport on Form 10-K.
Pursuant to the requirements of the Securities Exchange Act of 1934, this report has been signed below by the following persons on behalf ofthe Registrant and in the capacities indicated on February 20, 2019 .
Signature Title
/s/ R OGER C. H OCHSCHILD Chief Executive Officer and President, DirectorRoger C. Hochschild
/s/ R . M ARK G RAF Executive Vice President, Chief Financial Officer (Principal Financial Officer)
R. Mark Graf
/s/ E DWARD W. M C G ROGAN Senior Vice President and Chief Accounting Officer (Principal Accounting Officer)Edward W. McGrogan
/s/ L AWRENCE A. W EINBACH Chairman of the BoardLawrence A. Weinbach
/s/ J EFFREY S. A RONIN Director
Jeffrey S. Aronin
/s/ M ARY K. B USH DirectorMary K. Bush
/s/ G REGORY C. C ASE Director
Gregory C. Case
/s/ C ANDACE H. D UNCAN DirectorCandace H. Duncan
/s/ J OSEPH F. E AZOR Director
Joseph F. Eazor
/s/ C YNTHIA A. G LASSMAN DirectorCynthia A. Glassman
/s/ T HOMAS G. M AHERAS DirectorThomas G. Maheras
/s/ M ICHAEL H. M OSKOW Director
Michael H. Moskow
/s/ M ARK A . T HIERER DirectorMark A. Thierer
- 157 -

Exhibit 10.62
Amendment No. 7 to the Discover Financial Services
Directors’ Compensation Plan
Effective January 1, 2019, the Discover Financial Services Directors’ Compensation Plan (the “Plan”), is hereby amended in the followingrespects:
• The Plan is amended by replacing the text of Subsection 5(a)(ii) Subsequent Awards in Section 5 Initial and Annual Awards in its entiretywith the following:
(ii) Subsequent Awards . As of the date of each Annual Meeting, each Eligible Director, including, without limitation, any Eligible Directorwho becomes a member of the Board by reason of being elected to the Board at such Annual Meeting, shall be entitled to receive a number ofRestricted Stock Units equal to the number obtained by dividing $150,000 by the Fair Market Value of a share of Stock on such day; provided,however,that such Eligible Director continues to serve as a director of the Company after such Annual Meeting. Notwithstanding the foregoing, if aperson becomes an Eligible Director on a date other than the date of an Annual Meeting, the equity award provided for in this Section 5(a)(ii) shallbe granted on the date that such person becomes an Eligible Director, using the Fair Market Value of a share of Stock on such date; provided,however, that such award shall be adjusted on a pro-rata basis by multiplying such award by a fraction where the numerator is the number ofmonths between the date that such person becomes an Eligible Director and the date of the next Annual Meeting and the denominator is twelve(12).
• The Plan is amended by replacing the text of Subsection 7(a) Board Members in Section 7 Retainer and Other Fees in its entirety with thefollowing:
(a) Board Members . Each Eligible Director shall be entitled to an Annual Retainer of $105,000.

Exhibit 10.63
Amendment No. 8 to the Discover Financial Services
Directors’ Compensation Plan
Effective January 1, 2019, the Discover Financial Services Directors’ Compensation Plan (the “Plan”), is hereby amended in the followingrespects:
• The Plan is amended by replacing the text of Subsection 7(b) Lead Director and Chairpersons . in Section 7 Retainer and Other Fees in itsentirety with the following:
(b) Independent Chair and Committee Chairpersons . In addition to the Annual Retainer provided for in Section 7(a), each EligibleDirector who is the (i) Independent Chair shall be entitled to an annual retainer of $210,000; (ii) the Audit Committee Chair shall be entitledto an annual Committee Chair fee of $30,000; (iii) the Compensation and Leadership Development Committee Chair shall be entitled to anannual Committee Chair fee of $25,000; (iv) the Nominating and Governance Committee Chair shall be entitled to an annual CommitteeChair fee of $20,000; and (v) the Risk Oversight Committee Chair shall be entitled to an annual Committee Chair fee of $30,000.

Exhibit 21
DISCOVER FINANCIAL SERVICESSUBSIDIARIES
Subsidiary
Jurisdiction of Incorporation or Formation
Bank of New Castle DelawareDFS Corporate Services LLC DelawareDFS GSD Corp (d/b/a Discover Payment Solutions) ArizonaDFS International Inc. DelawareDFS Services LLC DelawareDiners Club International Ltd. New YorkDiners Club Services Private Limited IndiaDiscover Bank DelawareDiscover Financial Services (Canada), Inc. CanadaDiscover Financial Services (Hong Kong) Limited Hong KongDiscover Financial Services (UK) Limited England/WalesDiscover Funding LLC DelawareDiscover Global Employment Company Private Limited SingaporeDiscover Home Loans, Inc. DelawareDiscover Information Technology (Shanghai) Limited ShanghaiDiscover Products Inc. UtahDiscover Properties LLC DelawareDiscover Services Corporation DelawareGTC Insurance Agency, Inc. DelawarePULSE Network LLC DelawareThe Student Loan Corporation Delaware

Exhibit 23
CONSENT OF INDEPENDENT REGISTERED PUBLIC ACCOUNTING FIRMWe consent to the incorporation by reference in Registration Statement Nos. 333-173360, 333-150228, 333-144184, 333-144188, and 333-144189on Form S-8 and No. 333-225830 on Form S-3 of our reports dated February 20, 2019 , relating to the consolidated financial statements of DiscoverFinancial Services, and the effectiveness of Discover Financial Services’ internal control over financial reporting, appearing in this Annual Report onForm 10-K of Discover Financial Services for the year ended December 31, 2018 , and to the reference to us under the heading "Experts" in theProspectus, which is part of the Registration Statement.
/s/ D ELOITTE & T OUCHE LLP
Chicago, Illinois February 20, 2019

Exhibit 31.1
CERTIFICATIONI, Roger C. Hochschild, certify that:
1. I have reviewed this Annual Report on Form 10-K of Discover Financial Services (the “registrant”);
2. Based on my knowledge, this report does not contain any untrue statement of a material fact or omit to state a material fact necessary tomake the statements made, in light of the circumstances under which such statements were made, not misleading with respect to the periodcovered by this report;
3. Based on my knowledge, the financial statements, and other financial information included in this report, fairly present in all materialrespects the financial condition, results of operations and cash flows of the registrant as of, and for, the periods presented in this report;
4. The registrant's other certifying officer and I are responsible for establishing and maintaining disclosure controls and procedures (as definedin Exchange Act Rules 13a-15(e) and 15d-15(e)) and internal control over financial reporting (as defined in Exchange Act Rules 13a-15(f)and 15d-15(f)) for the registrant and have:a) Designed such disclosure controls and procedures, or caused such disclosure controls and procedures to be designed under our
supervision, to ensure that material information relating to the registrant, including its consolidated subsidiaries, is made known tous by others within those entities, particularly during the period in which this report is being prepared;
b) Designed such internal control over financial reporting, or caused such internal control over financial reporting to be designed underour supervision, to provide reasonable assurance regarding the reliability of financial reporting and the preparation of financialstatements for external purposes in accordance with generally accepted accounting principles;
c) Evaluated the effectiveness of the registrant's disclosure controls and procedures and presented in this report our conclusionsabout the effectiveness of the disclosure controls and procedures, as of the end of the period covered by this report based on suchevaluation; and
d) Disclosed in this report any change in the registrant's internal control over financial reporting that occurred during the registrant'smost recent fiscal quarter (the registrant's fourth fiscal quarter in the case of an annual report) that has materially affected, or isreasonably likely to materially affect, the registrant's internal control over financial reporting; and
5. The registrant's other certifying officer and I have disclosed, based on our most recent evaluation of internal control over financial reporting,to the registrant's auditors and the audit committee of the registrant's board of directors (or persons performing the equivalent functions):a) All significant deficiencies and material weaknesses in the design or operation of internal control over financial reporting which are
reasonably likely to adversely affect the registrant's ability to record, process, summarize and report financial information; andb) Any fraud, whether or not material, that involves management or other employees who have a significant role in the registrant's
internal control over financial reporting.
Date: February 20, 2019
/s/ R OGER C. H OCHSCHILD Roger C. Hochschild Chief Executive Officer and President
Exhibit 31.2
CERTIFICATIONI, R. Mark Graf, certify that:
1. I have reviewed this Annual Report on Form 10-K of Discover Financial Services (the “registrant”);
2. Based on my knowledge, this report does not contain any untrue statement of a material fact or omit to state a material fact necessary tomake the statements made, in light of the circumstances under which such statements were made, not misleading with respect to the periodcovered by this report;
3. Based on my knowledge, the financial statements, and other financial information included in this report, fairly present in all materialrespects the financial condition, results of operations and cash flows of the registrant as of, and for, the periods presented in this report;
4. The registrant's other certifying officer and I are responsible for establishing and maintaining disclosure controls and procedures (as definedin Exchange Act Rules 13a-15(e) and 15d-15(e)) and internal control over financial reporting (as defined in Exchange Act Rules 13a-15(f)and 15d-15(f)) for the registrant and have:a) Designed such disclosure controls and procedures, or caused such disclosure controls and procedures to be designed under our
supervision, to ensure that material information relating to the registrant, including its consolidated subsidiaries, is made known tous by others within those entities, particularly during the period in which this report is being prepared;
b) Designed such internal control over financial reporting, or caused such internal control over financial reporting to be designed underour supervision, to provide reasonable assurance regarding the reliability of financial reporting and the preparation of financialstatements for external purposes in accordance with generally accepted accounting principles;
c) Evaluated the effectiveness of the registrant's disclosure controls and procedures and presented in this report our conclusionsabout the effectiveness of the disclosure controls and procedures, as of the end of the period covered by this report based on suchevaluation; and
d) Disclosed in this report any change in the registrant's internal control over financial reporting that occurred during the registrant'smost recent fiscal quarter (the registrant's fourth fiscal quarter in the case of an annual report) that has materially affected, or isreasonably likely to materially affect, the registrant's internal control over financial reporting; and
5. The registrant's other certifying officer and I have disclosed, based on our most recent evaluation of internal control over financial reporting,to the registrant's auditors and the audit committee of the registrant's board of directors (or persons performing the equivalent functions):a) All significant deficiencies and material weaknesses in the design or operation of internal control over financial reporting which are
reasonably likely to adversely affect the registrant's ability to record, process, summarize and report financial information; andb) Any fraud, whether or not material, that involves management or other employees who have a significant role in the registrant's
internal control over financial reporting.
Date: February 20, 2019
/s/ R. M ARK G RAF R. Mark Graf Executive Vice President, Chief FinancialOfficer

Exhibit 32.1
CERTIFICATION PURSUANT TO18 U.S.C. SECTION 1350,
AS ADOPTED PURSUANT TOSECTION 906 OF THE SARBANES-OXLEY ACT OF 2002
In connection with the Annual Report of Discover Financial Services (the “Company”) on Form 10-K for the period ended December 31, 2018 , asfiled with the Securities and Exchange Commission (the “Report”), each of Roger C. Hochschild, Chief Executive Officer and President of theCompany, and R. Mark Graf, Executive Vice President and Chief Financial Officer of the Company, certifies, pursuant to 18 U.S.C. Section 1350, asadopted pursuant to Section 906 of the Sarbanes-Oxley Act of 2002, that:
1. The Report fully complies with the requirements of Section 13(a) or 15(d) of the Securities Exchange Act of 1934; and2. The information contained in the Report fairly presents, in all material respects, the financial condition and results of operations of
the Company.
Date: February 20, 2019
/s/ R OGER C. H OCHSCHILD Roger C. Hochschild Chief Executive Officer and President
Date: February 20, 2019
/s/ R. M ARK G RAF R. Mark Graf Executive Vice President, Chief FinancialOfficer