washington state ^^ department of commerce energy
TRANSCRIPT
^^ Department of Commerceinnovation is in oiu nature.
commerce. wa. gov/eia
Washington StateEnergy Independence Act
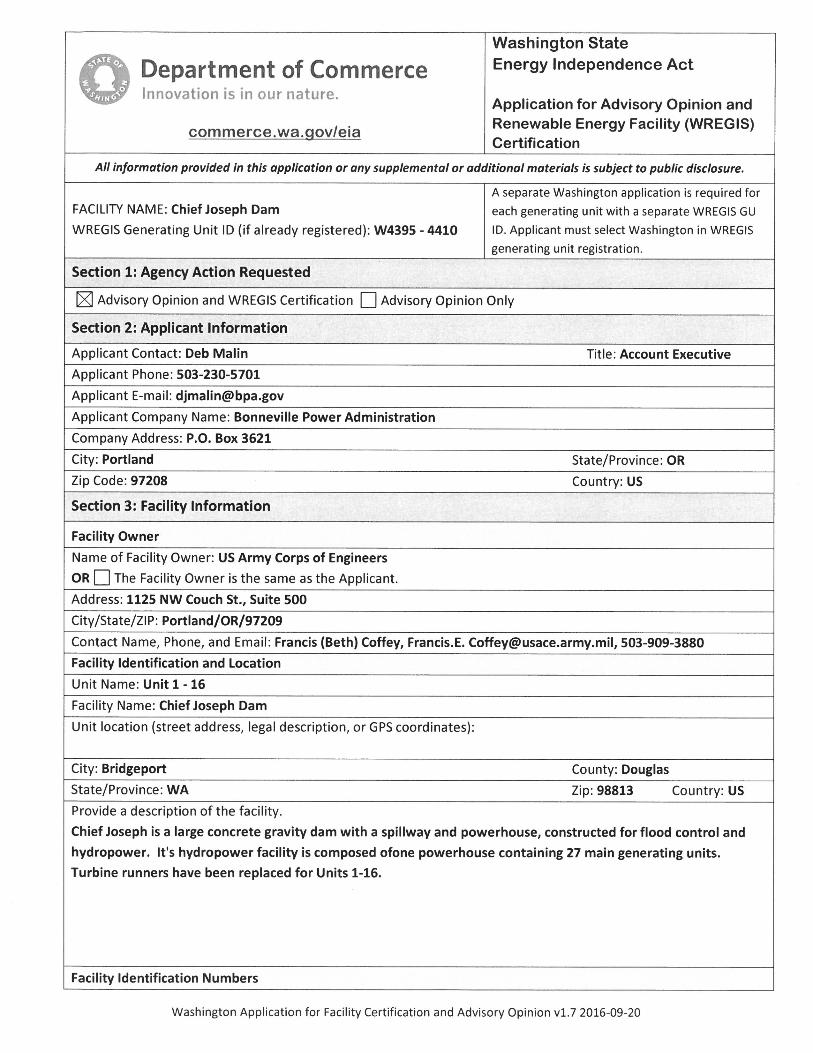
Application for Advisory Opinion andRenewable Energy Facility (WREGIS)Certification
All information provided in this application or any supplemental or additional materials is subject to public disclosure.
FACILIT/ NAME: Chief Joseph Dam
WREGIS Generating Unit ID (if already registered): W4395 - 4410
A separate Washington application is required for
each generating unit with a separate WREGIS GU
ID. Applicant must select Washington in WREGIS
generating unit registration.
Section 1: Agency Action Requested
Advisory Opinion and WREGIS Certification || Advisory Opinion Only
Section 2: Applicant Information
Applicant Contact: Deb Malin Title: Account Executive
Applicant Phone: 503-230-5701
Applicant E-mail: djmalin@bpa. gov
Applicant Company Name: Bonneville Power Administration
Company Address: P.O. Box 3621
City: Portland State/Province: OR
Zip Code:97208 Country: US
Section 3: Facility Information
Facility Owner
Name of Facility Owner: US Army Corps of Engineers
OR |_| The Facility Owner is the same as the Applicant.
Address: 1125 NW Couch St., Suite 500
City/State/ZIP: Portland/OR/97209
Contact Name, Phone, and Email: Francis (Beth) Coffey, Francis.E. [email protected], 503-909-3880Facility Identification and Location
Unit Name: Unit 1-16
Facility Name: Chief Joseph Dam
Unit location (street address, legal description, or GPS coordinates):
City: Bridgeport County: Douglas
State/Province: WA Zip: 98813 Country: US
Provide a description of the facility.
Chief Joseph is a large concrete gravity dam with a spillway and powerhouse, constructed for flood control and
hydropower. It's hydropower facility is composed ofone powerhouse containing 27 main generating units.Turbine runners have been replaced for Units 1-16.
Facility Identification Numbers
Washington Application for Facility Certification and Advisory Opinion vl. 7 2016-09-20
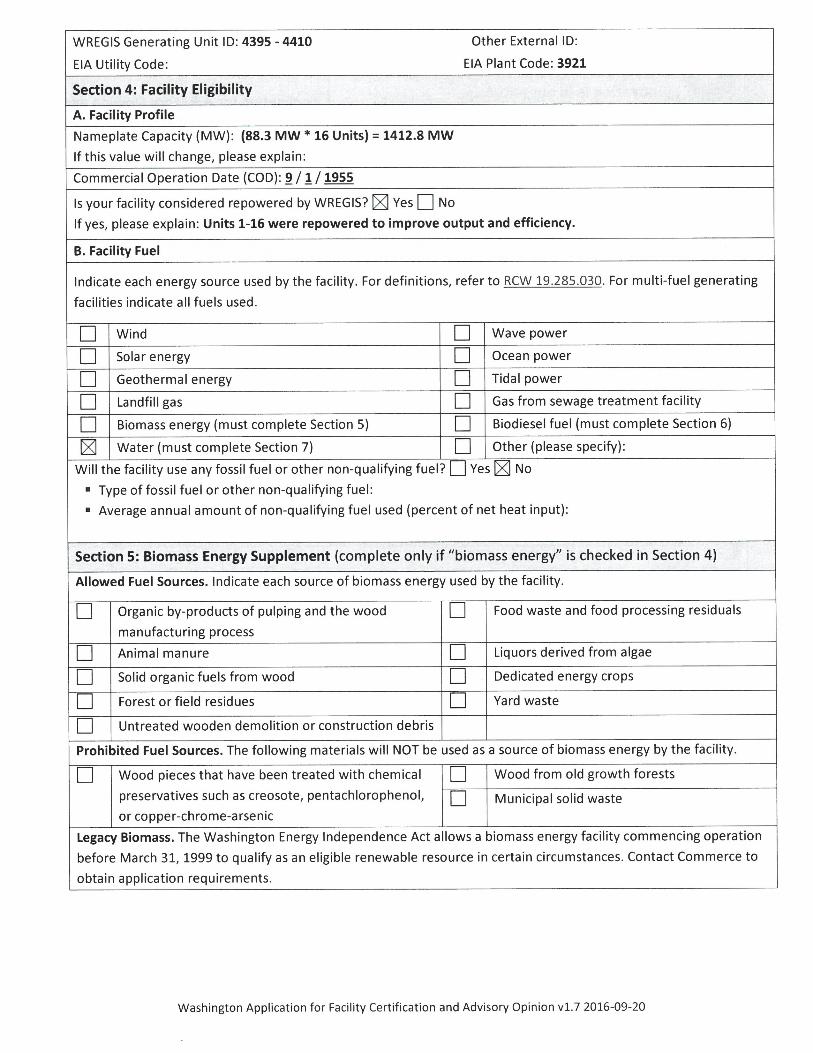
WREGIS Generating Unit ID: 4395 - 4410
EIA Utility Code:
Other External ID:
EIA Plant Code: 3921
Section 4: Facility Eligibility
A. Facility Profile
Nameplate Capacity (MW): (88.3 MW * 16 Units) = 1412.8 MWIf this value will change, please explain:
Commercial Operation Date (COD): 9 /1 / 1955
Is your facility considered repowered by WREGIS? 1X1 Yes |_| NoIf yes, please explain: Units 1-16 were repowered to improve output and efficiency.
B. Facility Fuel
Indicate each energy source used by the facility. For definitions, refer to RCW 19.285.030. For multi-fuel generatingfacilities indicate all fuels used.
a Wind Wave power
n Solar energy n Ocean power
Geothermal energy a Tidal power
Landfill gas "D Gas from sewage treatment facility
Biomass energy (must complete Section 5) a Biodiesel fuel (must complete Section 6)
Water (must complete Section 7) D Other (please specify):
Will the facility use any fossil fuel or other non-qualifying fuel? I I Yes 1X1 No. Type of fossil fuel or other non-qualifying fuel:. Average annual amount of non-qualifying fuel used (percent of net heat input):
Section 5: Biomass Energy Supplement (complete only if "biomass energy" is checked in Section 4)
Allowed Fuel Sources. Indicate each source of biomass energy used by the facility.
u Organic by-products of pulping and the wood
manufacturing process
u Food waste and food processing residuals
u Animal manure u Liquors derived from algae
u Solid organic fuels from wood u Dedicated energy crops
n Forest or field residues u Yard waste
u Untreated wooden demolition or construction debris
Prohibited Fuel Sources. The following materials will NOT be used as a source of biomass energy by the facility.
u Wood pieces that have been treated with chemical
preservatives such as creosote, pentachlorophenol,or copper-chrome-arsenic
uu
Wood from old growth forests
Municipal solid waste
Legacy Biomass. The Washington Energy Independence Act allows a biomass energy facility commencing operationbefore March 31, 1999 to qualify as an eligible renewable resource in certain circumstances. Contact Commerce to
obtain application requirements.
Washington Application for Facility Certification and Advisory Opinion vl. 7 2016-09-20
Section 6: Biodiesel Fuel Supplement (complete only if "biodiesel fuel" is checked in Section 4)
The biodiesel fuel used by the facility meets each of the identified conditions:
The fuel (a) is a mono alkyl ester of long chain fatty acids derived from vegetable oils or animal fats for usein compression-ignition engines and (b) meets the requirements of the American society of testing andmaterials specification D 6751 in effect as of January 1, 2003.
The fuel is NOT from crops raised on land cleared from old growth or first-growth forests where the clearing
occurred after December 7, 2006.
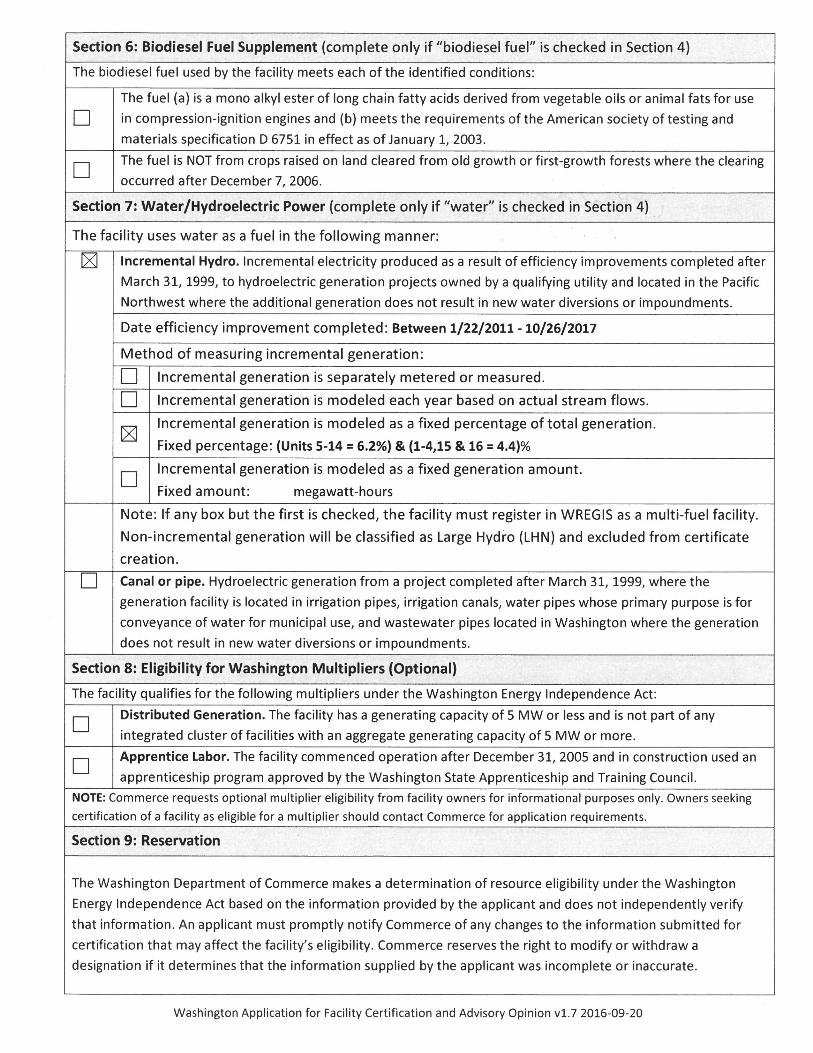
Section 7: Water/Hydroelectric Power (complete only if "water" is checked in Section 4)
The facility uses water as a fuel in the following manner:
M Incremental Hydro. Incremental electricity produced as a result of efficiency improvements completed after
March 31, 1999, to hydroelectric generation projects owned by a qualifying utility and located in the Pacific
Northwest where the additional generation does not result in new water diversions or impoundments.
Date efficiency improvement completed: Between 1/22/2011 -10/26/2017
Method of measuring incremental generation:
D Incremental generation is separately metered or measured.
Incremental generation is modeled each year based on actual stream flows.
Incremental generation is modeled as a fixed percentage of total generation.
Fixed percentage: (Units 5-14 = 6.2%) & (1-4,15 & 16 = 4.4)%
DIncremental generation is modeled as a fixed generation amount
Fixed amount: megawatt-hours
Note: If any box but the first is checked, the facility must register in WREGIS as a multi-fuel facility.
Non-incremental generation will be classified as Large Hydro (LHN) and excluded from certificate
creation.
u Canal or pipe. Hydroelectric generation from a project completed after March 31, 1999, where the
generation facility is located in irrigation pipes, irrigation canals, water pipes whose primary purpose is forconveyance of water for municipal use, and wastewater pipes located in Washington where the generationdoes not result in new water diversions or impoundments.
Section 8: Eligibility for Washington Multipliers (Optional)
The facility qualifies for the following multipliers under the Washington Energy Independence Act:
Distributed Generation. The facility has a generating capacity of 5 MW or less and is not part of anyintegrated cluster of facilities with an aggregate generating capacity of 5 MW or more.Apprentice Labor. The facility commenced operation after December 31, 2005 and in construction used an
apprenticeship program approved by the Washington State Apprenticeship and Training Council.
NOTE: Commerce requests optional multiplier eligibility from facility owners for informational purposes only. Owners seeking
certification of a facility as eligible for a multiplier should contact Commerce for application requirements.
Section 9: Reservation
The Washington Department of Commerce makes a determination of resource eligibility under the Washington
Energy Independence Act based on the information provided by the applicant and does not independently verifythat information. An applicant must promptly notify Commerce of any changes to the information submitted forcertification that may affect the facility's eligibility. Commerce reserves the right to modify or withdraw a
designation if it determines that the information supplied by the applicant was incomplete or inaccurate.
Washington Application for Facility Certification and Advisory Opinion vl. 7 2016-09-20
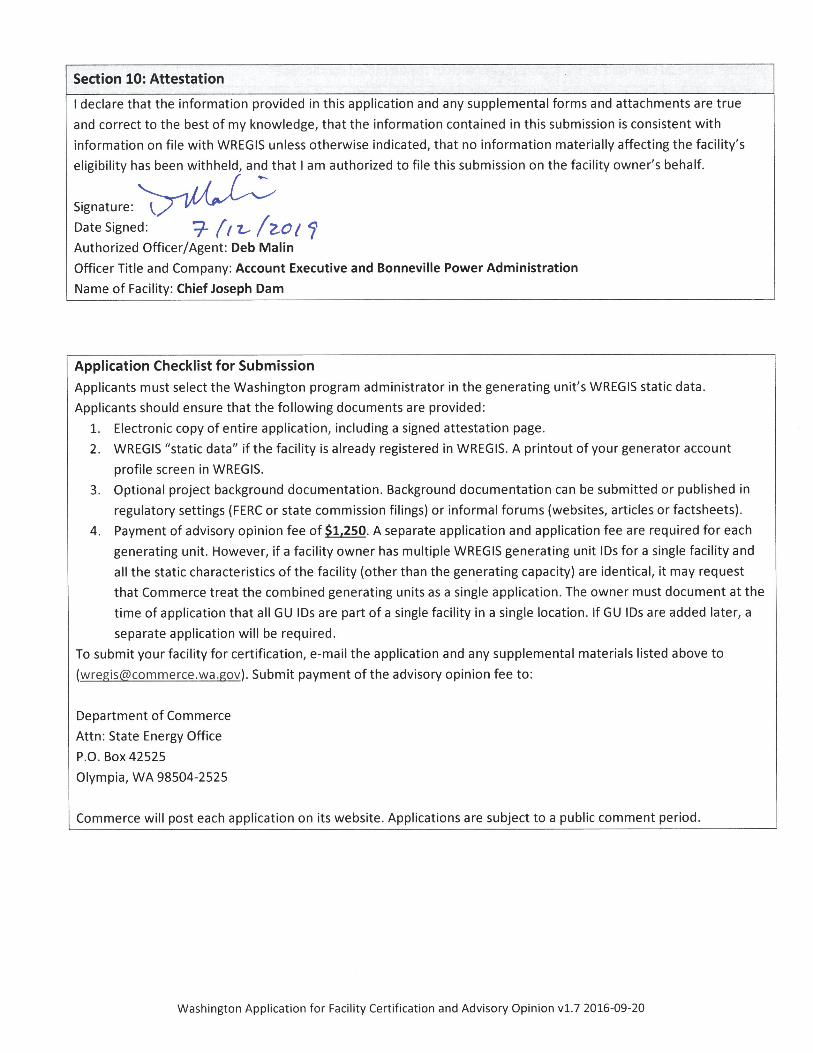
Section 10: Attestation
I declare that the information provided in this application and any supplemental forms and attachments are true
and correct to the best of my knowledge, that the information contained in this submission is consistent with
information on file with WREGIS unless otherwise indicated, that no information materially affecting the facility's
eligibility has been withheld, and that I am authorized to file this submission on the facility owner's behalf.
Signature: ^
Date Signed: ^ f(T^ f 2.01 <fAuthorized Officer/Agent: Deb Malin
Officer Title and Company: Account Executive and Bonneville Power Administration
Name of Facility: Chief Joseph Dam
Application Checklist for Submission
Applicants must select the Washington program administrator in the generating unit's WREGIS static data.Applicants should ensure that the following documents are provided:
1. Electronic copy of entire application, including a signed attestation page.
2. WREGIS "static data" if the facility is already registered in WREGIS. A printout of your generator account
profile screen in WREGIS.
3. Optional project background documentation. Background documentation can be submitted or published in
regulatory settings (FERC or state commission filings) or informal forums (websites, articles or factsheets).4. Paymentof advisory opinion fee of $1,250. A separate application and application fee are required for each
generating unit. However, if a facility owner has multiple WREGIS generating unit IDs for a single facility andall the static characteristics of the facility (other than the generating capacity) are identical, it may request
that Commerce treat the combined generating units as a single application. The owner must document at thetime of application that all GU IDs are part of a single facility in a single location. If GU IDs are added later, a
separate application will be required.
To submit your facility for certification, e-mail the application and any supplemental materials listed above to(wregis@commerce. wa. gov). Submit payment of the advisory opinion fee to:
Department of Commerce
Attn: State Energy Office
P. O. Box 42525
01ympia, WA 98504-2525
Commerce will post each application on its website. Applications are subject to a public comment period.
Washington Application for Facility Certification and Advisory Opinion vl. 7 2016-09-20
PRE-DECISIONAL AND FIUO – For Internal Use Only August 2018
1
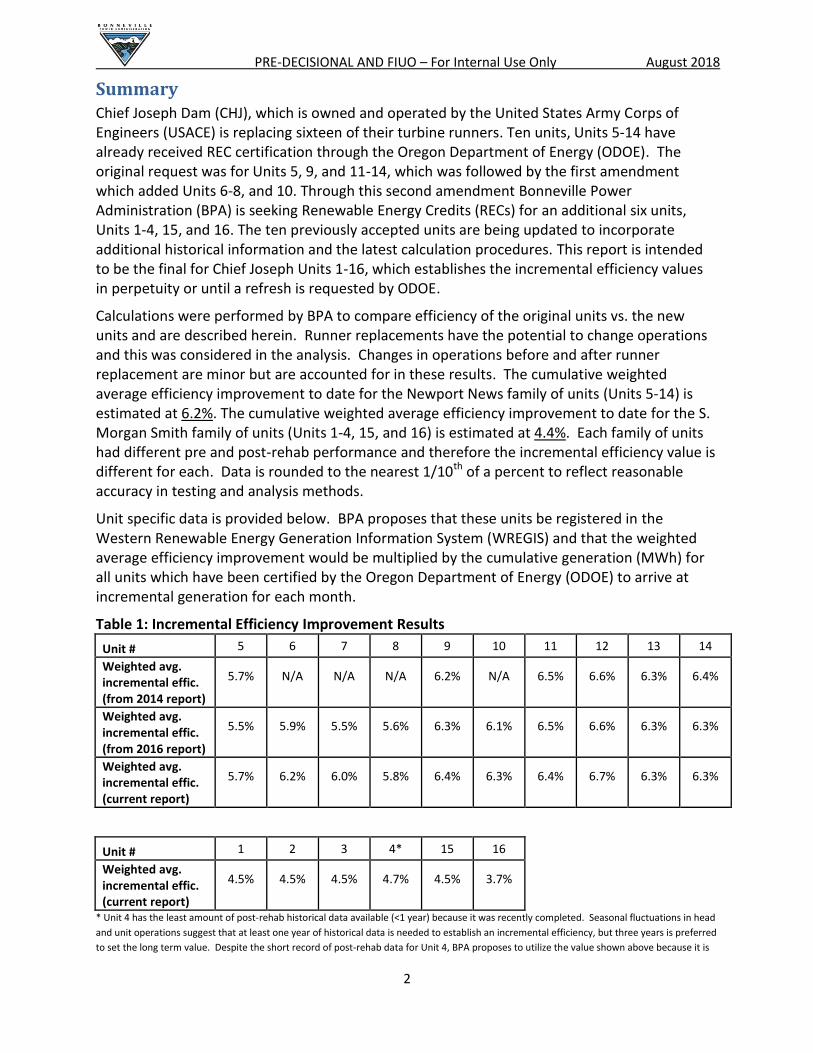
Chief Joseph Dam
Turbine Efficiency Improvements – Units 1-16, Add Units 1-4, 15, 16
Calculation of Incremental Efficiency Improvements for Renewable Energy Credits
Table of Contents Summary ....................................................................................................................................................... 2
Background ................................................................................................................................................... 3
Project Description.................................................................................................................................... 3
Unit Online Dates ...................................................................................................................................... 3
Unit Ratings ............................................................................................................................................... 4
Performance ................................................................................................................................................. 4
REC Calculation Method ............................................................................................................................... 9
Method Description .................................................................................................................................. 9
Summary of Governing Equations ............................................................................................................ 9
Metering Discussion ................................................................................................................................ 10
Summary of Results ................................................................................................................................ 12
Conclusion ................................................................................................................................................... 17
PRE-DECISIONAL AND FIUO – For Internal Use Only August 2018
2
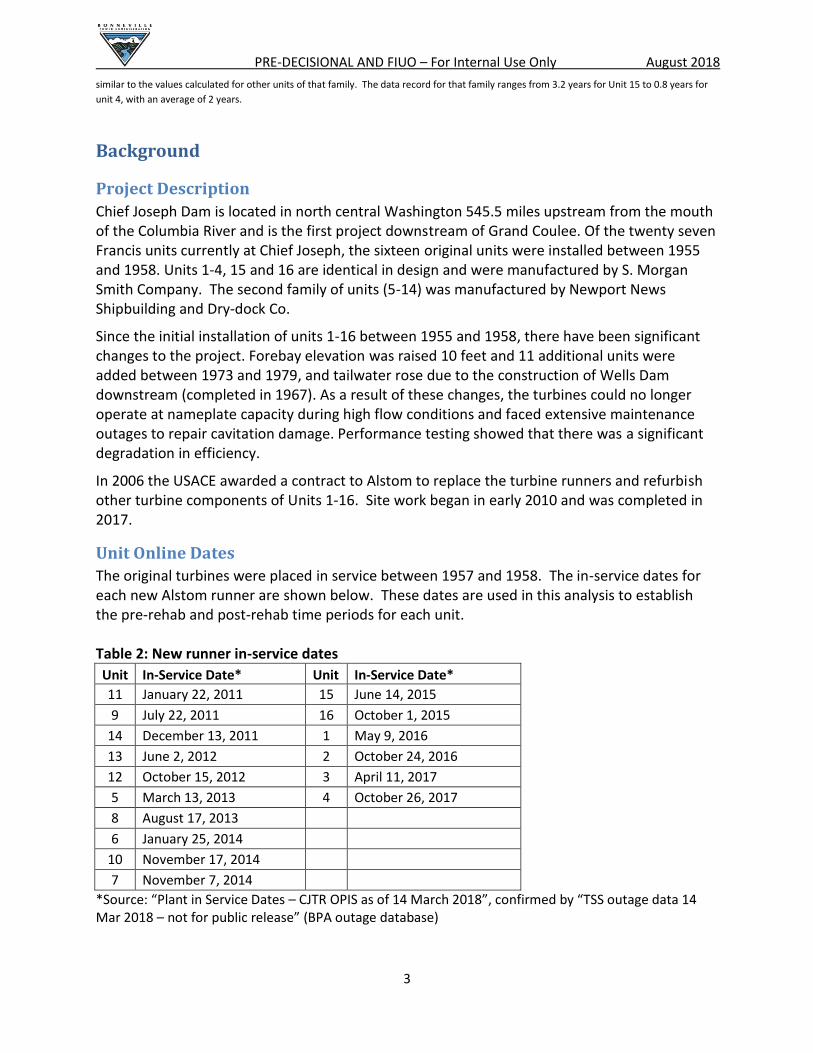
Summary Chief Joseph Dam (CHJ), which is owned and operated by the United States Army Corps of Engineers (USACE) is replacing sixteen of their turbine runners. Ten units, Units 5-14 have already received REC certification through the Oregon Department of Energy (ODOE). The original request was for Units 5, 9, and 11-14, which was followed by the first amendment which added Units 6-8, and 10. Through this second amendment Bonneville Power Administration (BPA) is seeking Renewable Energy Credits (RECs) for an additional six units, Units 1-4, 15, and 16. The ten previously accepted units are being updated to incorporate additional historical information and the latest calculation procedures. This report is intended to be the final for Chief Joseph Units 1-16, which establishes the incremental efficiency values in perpetuity or until a refresh is requested by ODOE.
Calculations were performed by BPA to compare efficiency of the original units vs. the new units and are described herein. Runner replacements have the potential to change operations and this was considered in the analysis. Changes in operations before and after runner replacement are minor but are accounted for in these results. The cumulative weighted average efficiency improvement to date for the Newport News family of units (Units 5-14) is estimated at 6.2%. The cumulative weighted average efficiency improvement to date for the S. Morgan Smith family of units (Units 1-4, 15, and 16) is estimated at 4.4%. Each family of units had different pre and post-rehab performance and therefore the incremental efficiency value is different for each. Data is rounded to the nearest 1/10th of a percent to reflect reasonable accuracy in testing and analysis methods.
Unit specific data is provided below. BPA proposes that these units be registered in the Western Renewable Energy Generation Information System (WREGIS) and that the weighted average efficiency improvement would be multiplied by the cumulative generation (MWh) for all units which have been certified by the Oregon Department of Energy (ODOE) to arrive at incremental generation for each month.
Table 1: Incremental Efficiency Improvement Results
Unit # 5 6 7 8 9 10 11 12 13 14
Weighted avg. incremental effic. (from 2014 report)
5.7% N/A N/A N/A 6.2% N/A 6.5% 6.6% 6.3% 6.4%
Weighted avg. incremental effic. (from 2016 report)
5.5% 5.9% 5.5% 5.6% 6.3% 6.1% 6.5% 6.6% 6.3% 6.3%
Weighted avg. incremental effic. (current report)
5.7% 6.2% 6.0% 5.8% 6.4% 6.3% 6.4% 6.7% 6.3% 6.3%
Unit # 1 2 3 4* 15 16
Weighted avg. incremental effic. (current report)
4.5% 4.5% 4.5% 4.7% 4.5% 3.7%
* Unit 4 has the least amount of post-rehab historical data available (<1 year) because it was recently completed. Seasonal fluctuations in head
and unit operations suggest that at least one year of historical data is needed to establish an incremental efficiency, but three years is preferred
to set the long term value. Despite the short record of post-rehab data for Unit 4, BPA proposes to utilize the value shown above because it is
PRE-DECISIONAL AND FIUO – For Internal Use Only August 2018
3
similar to the values calculated for other units of that family. The data record for that family ranges from 3.2 years for Unit 15 to 0.8 years for
unit 4, with an average of 2 years.
Background
Project Description
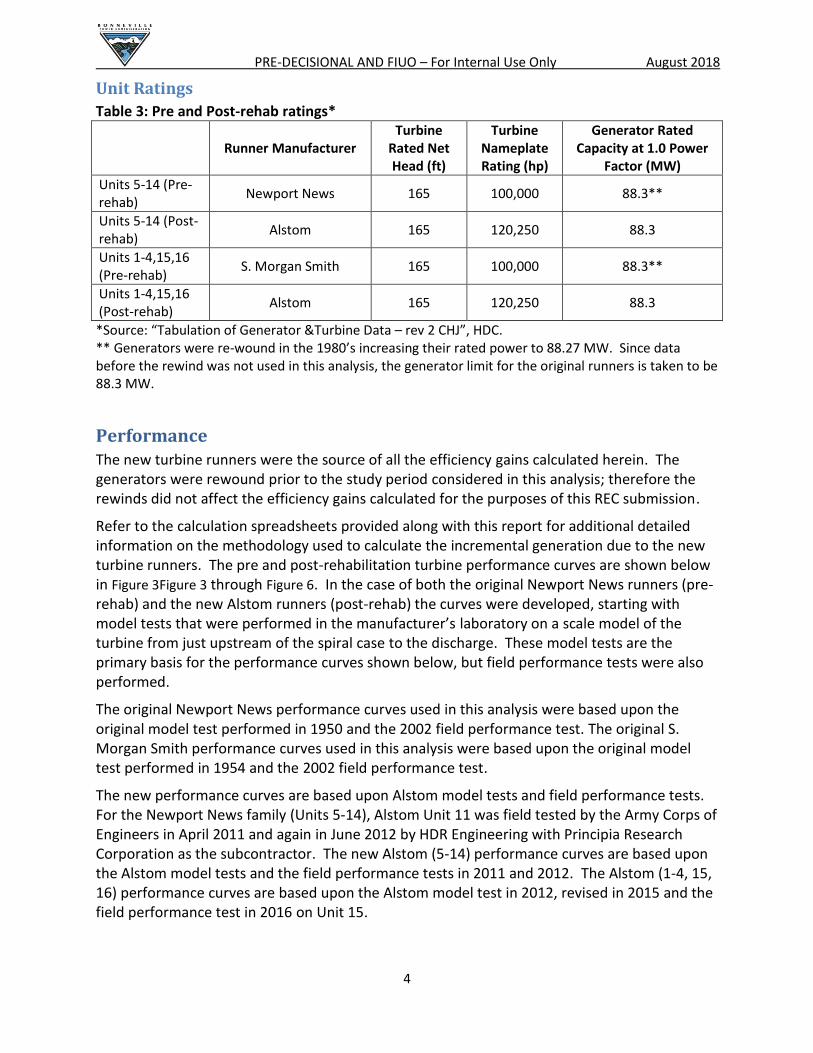
Chief Joseph Dam is located in north central Washington 545.5 miles upstream from the mouth of the Columbia River and is the first project downstream of Grand Coulee. Of the twenty seven Francis units currently at Chief Joseph, the sixteen original units were installed between 1955 and 1958. Units 1-4, 15 and 16 are identical in design and were manufactured by S. Morgan Smith Company. The second family of units (5-14) was manufactured by Newport News Shipbuilding and Dry-dock Co.
Since the initial installation of units 1-16 between 1955 and 1958, there have been significant changes to the project. Forebay elevation was raised 10 feet and 11 additional units were added between 1973 and 1979, and tailwater rose due to the construction of Wells Dam downstream (completed in 1967). As a result of these changes, the turbines could no longer operate at nameplate capacity during high flow conditions and faced extensive maintenance outages to repair cavitation damage. Performance testing showed that there was a significant degradation in efficiency.
In 2006 the USACE awarded a contract to Alstom to replace the turbine runners and refurbish other turbine components of Units 1-16. Site work began in early 2010 and was completed in 2017.
Unit Online Dates
The original turbines were placed in service between 1957 and 1958. The in-service dates for each new Alstom runner are shown below. These dates are used in this analysis to establish the pre-rehab and post-rehab time periods for each unit. Table 2: New runner in-service dates
Unit In-Service Date* Unit In-Service Date*
11 January 22, 2011 15 June 14, 2015
9 July 22, 2011 16 October 1, 2015
14 December 13, 2011 1 May 9, 2016
13 June 2, 2012 2 October 24, 2016
12 October 15, 2012 3 April 11, 2017
5 March 13, 2013 4 October 26, 2017
8 August 17, 2013
6 January 25, 2014
10 November 17, 2014
7 November 7, 2014
*Source: “Plant in Service Dates – CJTR OPIS as of 14 March 2018”, confirmed by “TSS outage data 14 Mar 2018 – not for public release” (BPA outage database)
PRE-DECISIONAL AND FIUO – For Internal Use Only August 2018
4
Unit Ratings
Table 3: Pre and Post-rehab ratings*
Runner Manufacturer
Turbine Rated Net Head (ft)
Turbine Nameplate Rating (hp)
Generator Rated Capacity at 1.0 Power
Factor (MW)
Units 5-14 (Pre-rehab)
Newport News 165 100,000 88.3**
Units 5-14 (Post-rehab)
Alstom 165 120,250 88.3
Units 1-4,15,16 (Pre-rehab)
S. Morgan Smith 165 100,000 88.3**
Units 1-4,15,16 (Post-rehab)
Alstom 165 120,250 88.3
*Source: “Tabulation of Generator &Turbine Data – rev 2 CHJ”, HDC. ** Generators were re-wound in the 1980’s increasing their rated power to 88.27 MW. Since data before the rewind was not used in this analysis, the generator limit for the original runners is taken to be 88.3 MW.
Performance The new turbine runners were the source of all the efficiency gains calculated herein. The generators were rewound prior to the study period considered in this analysis; therefore the rewinds did not affect the efficiency gains calculated for the purposes of this REC submission.
Refer to the calculation spreadsheets provided along with this report for additional detailed information on the methodology used to calculate the incremental generation due to the new turbine runners. The pre and post-rehabilitation turbine performance curves are shown below in Figure 3Figure 3 through Figure 6. In the case of both the original Newport News runners (pre-rehab) and the new Alstom runners (post-rehab) the curves were developed, starting with model tests that were performed in the manufacturer’s laboratory on a scale model of the turbine from just upstream of the spiral case to the discharge. These model tests are the primary basis for the performance curves shown below, but field performance tests were also performed.
The original Newport News performance curves used in this analysis were based upon the original model test performed in 1950 and the 2002 field performance test. The original S. Morgan Smith performance curves used in this analysis were based upon the original model test performed in 1954 and the 2002 field performance test.
The new performance curves are based upon Alstom model tests and field performance tests. For the Newport News family (Units 5-14), Alstom Unit 11 was field tested by the Army Corps of Engineers in April 2011 and again in June 2012 by HDR Engineering with Principia Research Corporation as the subcontractor. The new Alstom (5-14) performance curves are based upon the Alstom model tests and the field performance tests in 2011 and 2012. The Alstom (1-4, 15, 16) performance curves are based upon the Alstom model test in 2012, revised in 2015 and the field performance test in 2016 on Unit 15.
PRE-DECISIONAL AND FIUO – For Internal Use Only August 2018
5
The performance curves (i.e. flow tables) used in this analysis were provided by the Hydroelectric Design Center of the U.S. Army Corps of Engineers (HDC) for both the old and new units. These performance curves reconcile the model and field test results for both the original and new turbine runners. The tabulated values for the entire range of gross heads can be found in the calculation spreadsheet. The field test efficiency results are incorporated in the curves used in this analysis, however efficiency degradation due to age is not fully captured.
The field performance test results for the new Alstom (5-14) units are shown below for the June 2012 test conducted by HDR Engineering (principal contractor) and Principia Research Corporation (subcontractor). The best turbine efficiency point at 170 feet net head was approximately 95.6% (see Figure 1).
Figure 1: Field test results (Source: USACE Hydroelectric Design Center, HDR Engineering and Principia Research, June 2012)
The field performance test for the new Alstom (1-4, 15, 16) was conducted in 2016 on Unit 15 and flow tables were prepared in 2017, both by HDC. The field performance test validated the performance that Alstom predicted from their model test after adjusting to prototype scale and accounting for losses. Therefore no adjustments were made to the model test predicted flow tables after the field test. See Figure 2 below for a summary of the test results.
PRE-DECISIONAL AND FIUO – For Internal Use Only August 2018
6
Figure 2: Field test results (Source: USACE Hydroelectric Design Center, May 2016)
The generator efficiency assumed by HDC for the flow table development was 98.34% for the original Newport News units and 98.5% for the new Alstom (5-14) units. The generator efficiency assumed for the flow table development was 98% for the S. Morgan Smith units and 98% or the new Alstom (1-4, 15, 16) units. This REC analysis focused on turbine efficiency improvements so the generator efficiency was backed out of the flow tables to arrive at turbine efficiency which is shown in the figures below.
PRE-DECISIONAL AND FIUO – For Internal Use Only August 2018
7
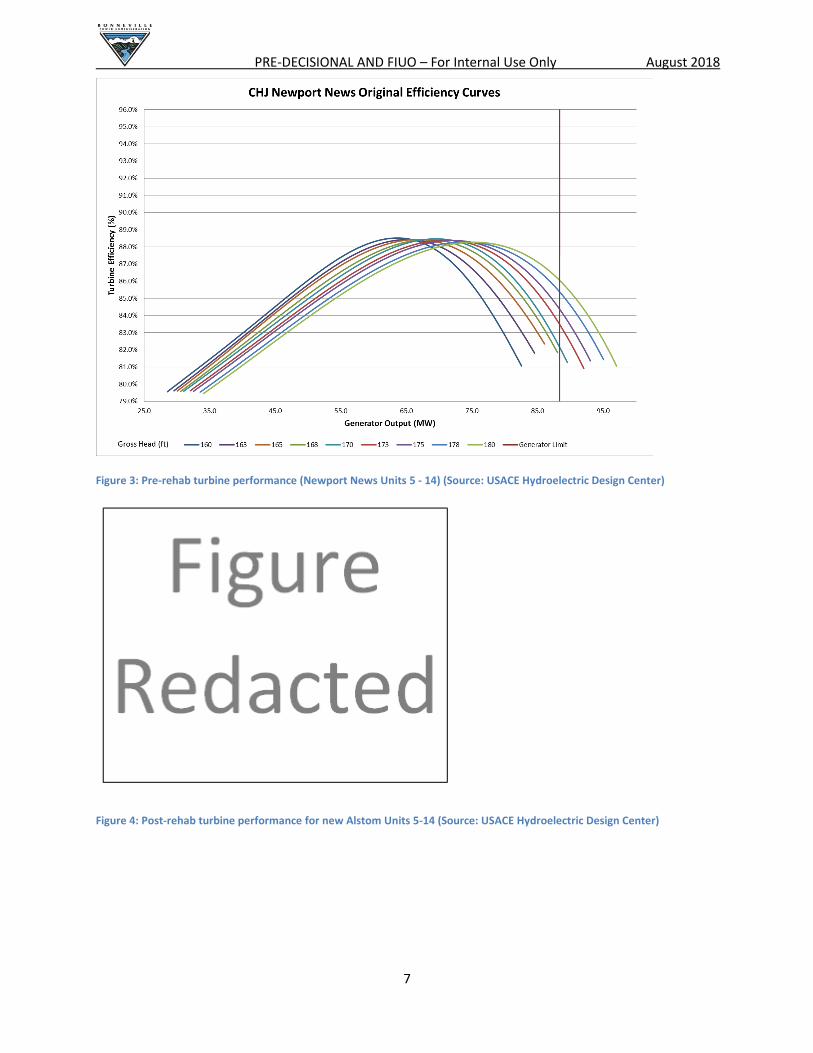
Figure 3: Pre-rehab turbine performance (Newport News Units 5 - 14) (Source: USACE Hydroelectric Design Center)
Figure 4: Post-rehab turbine performance for new Alstom Units 5-14 (Source: USACE Hydroelectric Design Center)

PRE-DECISIONAL AND FIUO – For Internal Use Only August 2018
8
Figure 5: Pre-rehab turbine performance (S. Morgan Smith Units 1-4,15,16) (Source: USACE Hydroelectric Design Center)
Figure 6: Post-rehab turbine performance for new Alstom units 1-4, 15, 16 (Source: USACE Hydroelectric Design Center)
Although unit capacity (i.e. generator limit) has not changed, the refurbished units have a
higher peak efficiency which occurs at a higher relative generator output.

PRE-DECISIONAL AND FIUO – For Internal Use Only August 2018
9
REC Calculation Method
Method Description
Calculations for this REC application were completed in a macro-enabled excel spreadsheet. The calculation spreadsheet will be made available to Oregon DOE reviewers and contains additional detailed information. Hourly operations data was collected for all sixteen units for the years 2008 - 2018. This data was available in the BPA PI Data System and is believed to be representative of expected operations. Since a ten year time span was considered, it can be assumed that we are covering a broad range of water years which represent a sufficient range of operating conditions to accurately model the overall efficiency change with the new runners. Captured in this data are the most current unit operation requirements, under a wide variety of flow conditions.
Calculations were performed to estimate the average annual change in efficiency under post-rehabilitation conditions. The unit-specific operating condition is established by gross head (forebay elevation – tailwater elevation) and generator output for each hour. Pre and post-rehab performance tables are used to look up turbine efficiency of the original turbines and new turbines at the same operating condition for each hour of operation. The performance tables are defined by generator output or power (MW) in the left most column, gross head (ft) in the top row, and turbine efficiency in the body. Interpolation was utilized to calculate the efficiency if the operating condition fell between rows and columns in the table. A bi-linear interpolation macro was utilized to perform the look up function. The macro logic can be found in the reference spreadsheet.
Graphs of the data and detailed annual results can be found in the calculation spreadsheet.
Summary of Governing Equations Generator Output (MW) = hourly unit generation data from BPA PI Data Link information database Gross head (ft) = forebay elevation (ft) – tailwater elevation (ft) Original turbine efficiency (%) = value interpolated from the original turbine efficiency table(s) New turbine efficiency (%) = value interpolated from the new turbine efficiency table(s)
Total efficiency (%) = turbine efficiency (%) X generator efficiency (%)
-The generator efficiency is assumed to equal 98.5% in this equation because the generator was rewound prior to the study period.
Delta total efficiency (%) = new total efficiency (%) – old total efficiency (%) Delta generation (MW or MWh) = delta total efficiency (%) X generation (MW or MWh) Delta Efficiency (weighted avg) = 100% X Sum of annual hourly delta generation / Sum of annual hourly generation Weighted Avg. Incremental Efficiency (avg. for all years of study) = sum of: (delta efficiency (weighted avg) X annual delta generation) / (sum of annual delta generation)

PRE-DECISIONAL AND FIUO – For Internal Use Only August 2018
10
The Weighted Avg. Incremental Efficiency is then corrected for bias as described in the Summary of Results and Table 5.
Metering Discussion
Units 1-16 at Chief Joseph Dam are separately metered for gross generation at each unit. The meters measure the gross generation from each unit with no unmonitored paths around the meters. The meter data is collected by the plant SCADA system, also known as GDACS (Generic Data Acquisition and Control System). The Watt-hour data is uploaded to the Corps of Engineers Operations and Maintenance Business Information Line (OMBIL) database and monthly gross generation reports are extracted from OMBIL by BPA.
The unit gross generation meters measure total generation from each unit and do not account for station service loads. However, in the case of renewable energy generation for incremental hydro projects, the station service loads are irrelevant to the calculation of incremental energy. The station service loads will not change as a result of the unit efficiency improvement, while the unit gross generation will increase due to the efficiency improvement.
WREGIS agrees that in this case the station service load should not be included in the calculation of incremental generation. The station service load did not change as a result of the efficiency upgrade, so all of the incremental generation reaches the grid. The following example explains why station service load is irrelevant to the calculation of incremental generation.
Gross Generation Before runner replacement:
-Let’s say that the gross generation is 500 MWh -Let’s say the station service and pumping load is 50 MWh.
After runner replacement:
-With an incremental efficiency gain of 4.8%, -The gross generation would be 500 MWh X 104.8% = 524 MWh.
So the incremental generation measured against the gross would be: (524 – 500 MWh) X 99.77% (transformer efficiency)* = 23.9 MWh. Net Generation Before runner replacement:
-The net generation is (500 MWh – 50 MWh) X 99.77% transformer efficiency* = 449 MWh.
After runner replacement:
-Assuming the same station service load of 50 MWh, the net generation would be (524 MWh – 50 MWh) X 99.77% (transformer efficiency)* = 472.9 MWh.
So the incremental generation measured against the net would be the same as if it were measured against the gross: 472.9 MWh – 449 MWh = 23.9 MWh.

PRE-DECISIONAL AND FIUO – For Internal Use Only August 2018
11
*The incremental generation that reaches the grid for each unit will be equal to the incremental gross generation measured on the low side of the transformer multiplied by transformer efficiency or loss factor. BPA Transmission will calculate the transformer efficiency or loss factor and update it whenever it experiences a significant change. 99.77% is the average transformer efficiency or loss factor for Units 1-16. Meter Information: The watt/watt-hour power meters for Chief Joseph Units 1-16 are JEMSTAR type with an
accuracy of approximately +/- 0.1%. Individual information about each meter is listed below in
Table 4.

PRE-DECISIONAL AND FIUO – For Internal Use Only August 2018
12
Table 4: Detailed Generation Meter Information
CHIEF JOSEPH UNITS 1-16 WATT HOUR METERS
UNIT MODEL MODEL NUMBER SERIAL NUMBER
1 JEMSTAR JS-09R6120-23 01 13 00163
2 JEMSTAR JS-09R6120-23 01 13 00169
3 JEMSTAR JS-09R6120-23 01 13 00172
4 JEMSTAR JS-09R6120-23 01 13 00155
5 JEMSTAR JS-09R6120-23 01 13 00168
6 JEMSTAR JS-09R6120-23 01 13 00173
7 JEMSTAR JS-09R6120-23 01 13 00178
8 JEMSTAR JS-09R6120-23 01 13 00164
9 JEMSTAR JS-09R6120-23 01 13 00150
10 JEMSTAR JS-09R6120-23 01 13 00170
11 JEMSTAR JS-09R6120-23 01 13 00162
12 JEMSTAR JS-09R6120-23 01 13 00166
13 JEMSTAR JS-09R6120-23 01 13 00165
14 JEMSTAR JS-09R6120-23 01 13 00177
15 JEMSTAR JS-09R6120-23 01 13 00156
16 JEMSTAR JS-09R6120-23 01 13 00175
Summary of Results
The data revealed that the new units are operated somewhat differently than the original units
because the peak efficiency occurs at a different flow. It can be observed from the results
below that the calculated weighted efficiency of the original units were slightly higher when
considering pre-rehab operations than when considering post-rehab operations. So if the REC
calculations are performed using post-rehab data then the original unit efficiency would be
slightly lower when compared to using pre-rehab data.
PRE-DECISIONAL AND FIUO – For Internal Use Only August 2018
13
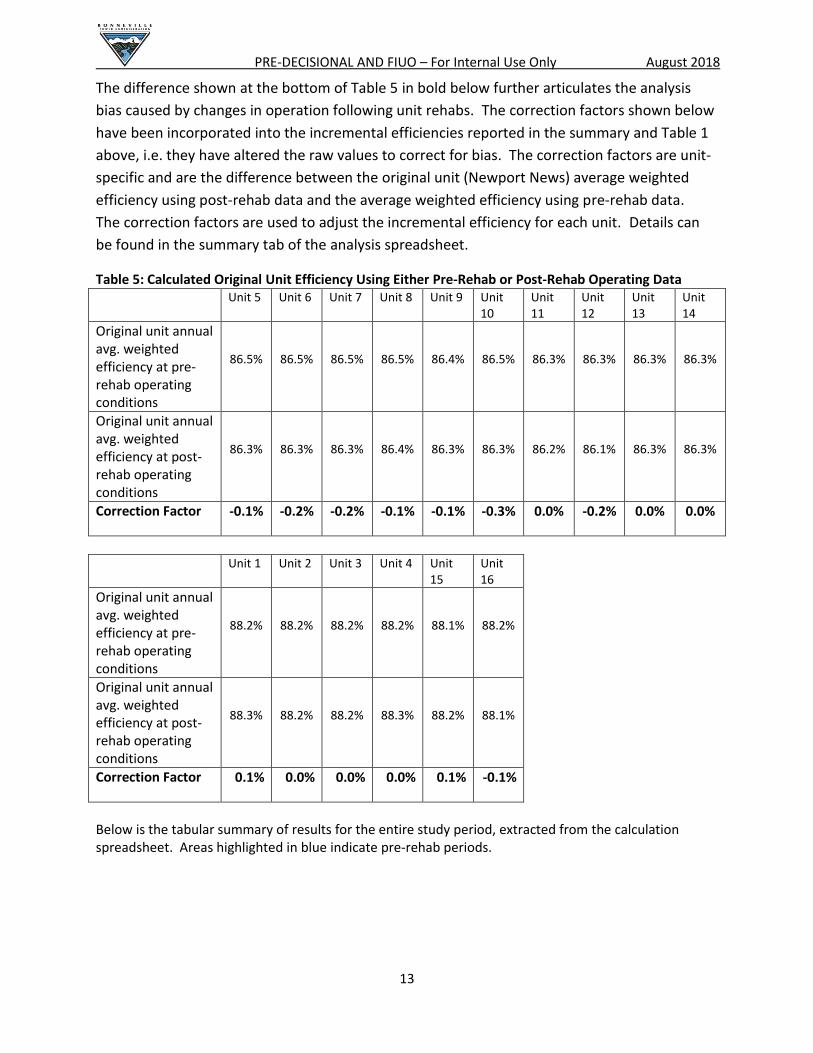
The difference shown at the bottom of Table 5 in bold below further articulates the analysis
bias caused by changes in operation following unit rehabs. The correction factors shown below
have been incorporated into the incremental efficiencies reported in the summary and Table 1
above, i.e. they have altered the raw values to correct for bias. The correction factors are unit-
specific and are the difference between the original unit (Newport News) average weighted
efficiency using post-rehab data and the average weighted efficiency using pre-rehab data.
The correction factors are used to adjust the incremental efficiency for each unit. Details can
be found in the summary tab of the analysis spreadsheet.
Table 5: Calculated Original Unit Efficiency Using Either Pre-Rehab or Post-Rehab Operating Data
Unit 5 Unit 6 Unit 7 Unit 8 Unit 9 Unit 10
Unit 11
Unit 12
Unit 13
Unit 14
Original unit annual avg. weighted efficiency at pre-rehab operating conditions
86.5% 86.5% 86.5% 86.5% 86.4% 86.5% 86.3% 86.3% 86.3% 86.3%
Original unit annual avg. weighted efficiency at post-rehab operating conditions
86.3% 86.3% 86.3% 86.4% 86.3% 86.3% 86.2% 86.1% 86.3% 86.3%
Correction Factor -0.1% -0.2% -0.2% -0.1% -0.1% -0.3% 0.0% -0.2% 0.0% 0.0%
Unit 1 Unit 2 Unit 3 Unit 4 Unit 15
Unit 16
Original unit annual avg. weighted efficiency at pre-rehab operating conditions
88.2% 88.2% 88.2% 88.2% 88.1% 88.2%
Original unit annual avg. weighted efficiency at post-rehab operating conditions
88.3% 88.2% 88.2% 88.3% 88.2% 88.1%
Correction Factor 0.1% 0.0% 0.0% 0.0% 0.1% -0.1%
Below is the tabular summary of results for the entire study period, extracted from the calculation spreadsheet. Areas highlighted in blue indicate pre-rehab periods.

PRE-DECISIONAL AND FIUO – For Internal Use Only August 2018
14
Figure 7: Screenshot of results, extracted from calculation spreadsheet
CHJ Efficiency Improvements Post Rehab - Units 1-16
Using Oregon DOE guidance, method similar to that used by Chelan PUD
Pre-Rehab Pre-Rehab
Unit # Unit #
1 2 3 4 5 6 7 8 9 10 11 12 13 14 15 16
2008 4.97% 4.26% 4.99% 4.96% 6.1% 6.0% 6.2% 6.1% 6.1% 6.1% 6.7% 7.3% 7.6% 6.6% 5.06% 4.89%
2009 4.33% 4.78% 4.37% 4.44% 5.4% 5.1% 5.4% 5.4% 5.2% 5.3% 5.4% 6.0% 5.9% 5.6% 4.27% 4.27%
2010 4.17% 4.30% 4.19% 4.26% 5.3% 5.0% 5.3% 5.1% 5.1% 5.1% 4.6% 5.9% 5.3% 4.9% 3.85% 3.76%
2011 4.30% 4.34% 4.33% 4.35% 5.1% 5.1% 5.2% 5.1% 6.7% 5.0% 8.0% 5.3% 5.4% 6.0% 4.38% 4.27%
2012 4.86% 4.84% 4.81% 4.86% 6.2% 5.7% 5.8% 5.8% 6.2% 5.5% 6.3% 6.1% 7.1% 6.8% 4.73% 4.60%
2013 4.58% 5.11% 4.60% 4.58% 6.0% 6.0% 5.6% 5.4% 6.2% 5.7% 6.3% 6.7% 6.3% 6.2% 4.63% 4.39%
2014 4.52% 4.82% 4.59% 4.68% 5.4% 5.6% 5.8% 5.9% 6.2% 5.6% 6.3% 6.5% 6.4% 6.1% 4.70% 4.47%
2015 5.12% 4.72% 4.97% 4.87% 5.2% 6.4% 5.4% 5.4% 6.6% 6.4% 5.9% 7.4% 5.9% 6.1% 5.13% 4.76%
2016 4.08% 4.08% 4.24% 3.99% 5.0% 6.3% 5.2% 5.2% 6.2% 6.2% 4.8% 6.5% 5.6% 5.6% 4.21% 3.85%
2017 4.31% 4.31% 4.39% 3.87% 6.7% 6.8% 6.8% 6.1% 7.1% 6.6% 5.8% 7.0% 6.5% 5.6% 4.28% 3.52%
2018 4.76% 4.63% 4.67% 4.65% 7.5% 7.3% 7.3% 7.3% 7.1% 7.2% 6.1% 7.1% 6.8% 7.1% 4.60% 4.17%
Unit # Unit #
1 2 3 4 5 6 7 8 9 10 11 12 13 14 15 16
2008 24800 5418 23640 25360 21432 23114 20113 18939 21136 22812 17406 13762 12757 18695 24243 25834
2009 22415 10178 20353 19802 15374 19267 15058 15380 19227 15918 17116 9968 10220 12813 16533 23665
2010 19067 15767 20266 17578 13935 22139 14468 14908 16678 15066 3757 9978 2059 5444 12578 15292
2011 24639 19179 23460 24178 20987 19175 16280 21281 10149 22946 34995 14451 9855 11930 24520 24872
2012 23244 14191 22187 20827 13515 20674 18368 18427 31156 24239 28887 6493 11185 32601 25821 25288
2013 26181 13865 24142 24383 15769 13628 21345 9656 26273 17991 27083 18664 23853 28561 22307 25677
2014 24833 10022 25372 20880 11540 22915 9048 18171 33447 4034 33456 29300 25922 26682 15810 23230
2015 17120 19442 24571 24539 17089 30173 18609 17525 32390 33583 24942 29991 24855 27041 15680 11556
2016 15632 6251 12263 22667 17989 26303 16326 19781 19766 33081 8475 25861 17780 11415 21204 15113
2017 19161 22943 16719 3341 18591 33360 34371 8433 23823 33810 6652 31582 12656 6216 23942 15995
2018 15364 17063 15277 16976 16428 15947 20301 20832 17991 24008 4793 24504 11428 5277 15925 13479
Old Unit Original Unit
1 2 3 4 5 6 7 8 9 10 11 12 13 14 15 16
2008 87.70% 88.22% 87.71% 87.72% 86.1% 86.2% 86.1% 86.2% 86.1% 86.1% 85.9% 85.6% 85.6% 85.9% 87.60% 87.70%
2009 88.21% 87.93% 88.19% 88.19% 86.6% 86.5% 86.5% 86.6% 86.5% 86.5% 86.5% 86.4% 86.4% 86.4% 88.20% 88.19%
2010 88.25% 88.20% 88.20% 88.19% 86.4% 86.5% 86.4% 86.5% 86.5% 86.5% 86.5% 86.3% 86.6% 86.6% 88.34% 88.34%
2011 88.38% 88.35% 88.35% 88.38% 86.7% 86.7% 86.7% 86.7% 86.3% 86.7% 85.6% 86.7% 86.7% 86.5% 88.33% 88.36%
2012 88.11% 88.10% 88.11% 88.12% 86.4% 86.6% 86.6% 86.5% 86.3% 86.6% 86.3% 86.4% 85.9% 86.1% 88.09% 88.16%
2013 88.25% 87.98% 88.23% 88.27% 86.2% 86.6% 86.7% 86.5% 86.4% 86.7% 86.4% 86.2% 86.4% 86.4% 88.25% 88.33%
2014 88.32% 88.21% 88.35% 88.32% 86.5% 86.6% 86.5% 86.4% 86.4% 86.5% 86.4% 86.3% 86.4% 86.5% 88.28% 88.39%
2015 88.15% 88.22% 88.15% 88.15% 86.6% 86.3% 86.6% 86.6% 86.1% 86.3% 86.3% 85.7% 86.3% 86.2% 87.89% 88.27%
2016 88.38% 88.44% 88.43% 88.44% 86.5% 86.4% 86.5% 86.5% 86.5% 86.5% 86.6% 86.4% 86.4% 86.5% 88.37% 88.15%
2017 88.23% 88.21% 88.07% 88.50% 86.1% 86.1% 86.1% 86.4% 86.0% 86.2% 86.4% 86.0% 86.2% 86.4% 88.23% 88.09%
2018 88.23% 88.26% 88.25% 88.25% 85.9% 86.0% 86.0% 86.0% 86.1% 86.1% 86.4% 86.1% 86.2% 86.0% 88.23% 88.17%
New Unit New Unit
1 2 3 4 5 6 7 8 9 10 11 12 13 14 15 16
2008 92.68% 92.48% 92.70% 92.68% 92.2% 92.2% 92.3% 92.3% 92.2% 92.2% 92.6% 92.9% 93.2% 92.5% 92.66% 92.59%
2009 92.54% 92.71% 92.56% 92.63% 92.0% 91.7% 91.9% 91.9% 91.7% 91.9% 91.9% 92.4% 92.4% 92.1% 92.47% 92.46%
2010 92.42% 92.50% 92.40% 92.44% 91.8% 91.4% 91.7% 91.6% 91.6% 91.6% 91.0% 92.2% 91.9% 91.5% 92.19% 92.10%
2011 92.68% 92.69% 92.68% 92.73% 91.8% 91.8% 91.9% 91.8% 93.0% 91.7% 93.5% 92.0% 92.1% 92.5% 92.71% 92.63%
2012 92.97% 92.94% 92.92% 92.98% 92.6% 92.3% 92.3% 92.4% 92.5% 92.1% 92.6% 92.4% 93.0% 92.9% 92.82% 92.75%
2013 92.83% 93.08% 92.83% 92.85% 92.2% 92.6% 92.3% 91.9% 92.7% 92.4% 92.7% 92.9% 92.7% 92.7% 92.88% 92.72%
2014 92.84% 93.03% 92.94% 93.00% 91.9% 92.2% 92.4% 92.3% 92.7% 92.1% 92.7% 92.8% 92.8% 92.6% 92.98% 92.86%
2015 93.27% 92.94% 93.11% 93.03% 91.8% 92.6% 92.0% 92.0% 92.7% 92.6% 92.2% 93.1% 92.3% 92.3% 93.02% 93.03%
2016 92.46% 92.52% 92.67% 92.43% 91.5% 92.7% 91.7% 91.7% 92.6% 92.7% 91.5% 92.9% 92.1% 92.1% 92.58% 92.00%
2017 92.54% 92.52% 92.46% 92.37% 92.8% 93.0% 93.0% 92.5% 93.1% 92.8% 92.2% 93.1% 92.7% 92.0% 92.51% 91.61%
2018 92.99% 92.89% 92.92% 92.90% 93.3% 93.3% 93.3% 93.3% 93.1% 93.3% 92.5% 93.2% 93.0% 93.1% 92.83% 92.35%
1 2 3 4 5 6 7 8 9 10 11 12 13 14 15 16
2008 498720 127060 473624 511500 349470 386917 322691 309072 344269 371616 259886 188685 168858 283058 478877 527910
2009 517893 212941 465813 446107 285107 375099 279192 287179 371738 298731 316241 166511 171856 226915 387066 553846
2010 457518 366658 483590 412831 261017 445969 272220 290654 325466 295058 82560 169646 38681 111074 326852 406941
2011 572562 441461 541597 555209 415298 377313 314390 420254 151192 460678 438006 272167 182231 199492 560300 582249
2012 478286 293036 461476 428154 217059 362392 318461 316059 499784 443983 456529 107240 156890 478689 545620 550167
2013 571688 271570 524768 531843 262846 228231 378002 178153 421677 316348 432032 277796 380364 457630 482143 584985
2014 549158 207928 553242 445953 214994 409848 155227 308898 537219 71543 534122 451611 407568 438828 336550 519509
2015 334149 411827 494667 503451 327263 474613 345016 324873 491867 528853 420825 405562 419398 444256 305775 242838
2016 382764 153178 289238 567892 356938 415702 312543 380408 320935 531260 175760 399920 314874 202554 503485 392169
2017 444527 531722 380423 86271 276457 488747 503540 137243 336305 510301 114099 448720 193653 111443 559724 453970
2018 322799 368328 327139 365020 220402 217997 277460 287167 254682 334208 79041 344306 168983 74037 346040 322942
Total gen for post rehab period (MWh) 1,150,090 900,050 707,562 365,020 1,658,901 2,006,907 1,438,559 1,438,590 2,862,469 1,904,622 2,650,415 2,327,915 2,041,730 2,207,438 1,715,024 1,169,081
Incremental gen for post rehab period (MWh) 50157 40006 31996 16976 97,406 128,699 89,606 84,743 184,847 124,482 169,283 159,902 127,679 137,793 76751 44587
Avg. annual delta generation for post-rehab period (MWh) 18952 20003 18567 16976 16,786 26,097 22,402 16,949 26,407 31,121 21,321 26,650 19,402 19,685 21633 14862
Avg. delta generation (aMW) 2.16 2.28 2.12 1.94 1.92 2.98 2.56 1.93 3.01 3.55 2.43 3.04 2.21 2.25 2.47 1.70
Avg. annual total gen. for post-rehab period (MWh) 434557.784 450025.244 410588.518 365020 285,882 406,956 359,640 287,718 408,924 476,156 333,817 387,986 310,255 315,348 483385.014 389693.667
Weighted avg. incremental effic. (total delta gen for post rehab
period/total gen for post rehab period) 4.4% 4.4% 4.5% 4.7% 5.9% 6.4% 6.2% 5.9% 6.5% 6.5% 6.4% 6.9% 6.3% 6.2% 4.5% 3.8%
Total weighted avg. incremental efficiency (all units 5-14
combined) 6.3%
Total weighted avg. incremental efficiency (all units 1-4, 15, 16
combined) 4.4%
Bias Correction
Original Unit Weighted Average Efficiency with pre-rehab data 88.2% 88.2% 88.2% 88.2% 86.5% 86.5% 86.5% 86.5% 86.4% 86.5% 86.3% 86.3% 86.3% 86.3% 88.1% 88.2%
Original Unit Weighted Average Efficiency with post-rehab data 88.3% 0.8822801 0.88154036 0.882525479 86.3% 86.3% 86.3% 86.4% 86.3% 86.3% 86.2% 86.1% 86.3% 86.3% 0.88210319 0.88130059
Difference 0.1% 0.0% 0.0% 0.0% -0.1% -0.2% -0.2% -0.1% -0.1% -0.3% 0.0% -0.2% 0.0% 0.0% 0.1% -0.1%
Per Unit Weighted avg. incremental effic. (avg annual incremental
gen/avg annual total gen) 4.5% 4.5% 4.5% 4.7% 5.7% 6.2% 6.0% 5.8% 6.4% 6.3% 6.4% 6.7% 6.3% 6.3% 4.5% 3.7%
Total weighted avg. incremental efficiency (all units 5-14
combined) - Corrected for bias 6.2%
Total weighted avg. incremental efficiency (all units 1-4, 15, 16
combined) - Corrected for bias 4.4%
Unit #
Weighted Avg Efficiency
Delta Generation (MWh)
Delta Efficiency (weighted avg)
Weighted Avg Efficiency
Total Generation (MWh)
PRE-DECISIONAL AND FIUO – For Internal Use Only August 2018
15
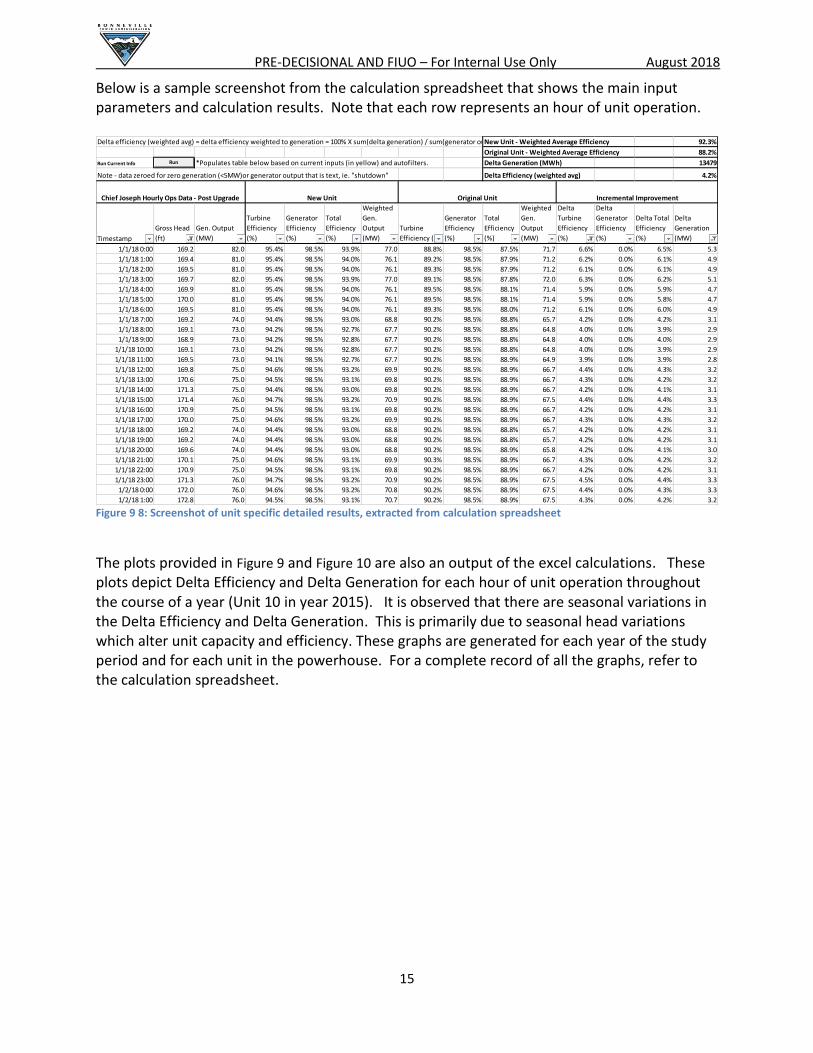
Below is a sample screenshot from the calculation spreadsheet that shows the main input parameters and calculation results. Note that each row represents an hour of unit operation.
Figure 9 8: Screenshot of unit specific detailed results, extracted from calculation spreadsheet
The plots provided in Figure 9 and Figure 10 are also an output of the excel calculations. These plots depict Delta Efficiency and Delta Generation for each hour of unit operation throughout the course of a year (Unit 10 in year 2015). It is observed that there are seasonal variations in the Delta Efficiency and Delta Generation. This is primarily due to seasonal head variations which alter unit capacity and efficiency. These graphs are generated for each year of the study period and for each unit in the powerhouse. For a complete record of all the graphs, refer to the calculation spreadsheet.
Delta efficiency (weighted avg) = delta efficiency weighted to generation = 100% X sum(delta generation) / sum(generator output) New Unit - Weighted Average Efficiency 92.3%
Original Unit - Weighted Average Efficiency 88.2%
Run Current Info *Populates table below based on current inputs (in yellow) and autofilters. Delta Generation (MWh) 13479
Note - data zeroed for zero generation (<5MW)or generator output that is text, ie. "shutdown" Delta Efficiency (weighted avg) 4.2%
Timestamp
Gross Head
(ft)
Gen. Output
(MW)
Turbine
Efficiency
(%)
Generator
Efficiency
(%)
Total
Efficiency
(%)
Weighted
Gen.
Output
(MW)
Turbine
Efficiency (%)
Generator
Efficiency
(%)
Total
Efficiency
(%)
Weighted
Gen.
Output
(MW)
Delta
Turbine
Efficiency
(%)
Delta
Generator
Efficiency
(%)
Delta Total
Efficiency
(%)
Delta
Generation
(MW)
1/1/18 0:00 169.2 82.0 95.4% 98.5% 93.9% 77.0 88.8% 98.5% 87.5% 71.7 6.6% 0.0% 6.5% 5.3
1/1/18 1:00 169.4 81.0 95.4% 98.5% 94.0% 76.1 89.2% 98.5% 87.9% 71.2 6.2% 0.0% 6.1% 4.9
1/1/18 2:00 169.5 81.0 95.4% 98.5% 94.0% 76.1 89.3% 98.5% 87.9% 71.2 6.1% 0.0% 6.1% 4.9
1/1/18 3:00 169.7 82.0 95.4% 98.5% 93.9% 77.0 89.1% 98.5% 87.8% 72.0 6.3% 0.0% 6.2% 5.1
1/1/18 4:00 169.9 81.0 95.4% 98.5% 94.0% 76.1 89.5% 98.5% 88.1% 71.4 5.9% 0.0% 5.9% 4.7
1/1/18 5:00 170.0 81.0 95.4% 98.5% 94.0% 76.1 89.5% 98.5% 88.1% 71.4 5.9% 0.0% 5.8% 4.7
1/1/18 6:00 169.5 81.0 95.4% 98.5% 94.0% 76.1 89.3% 98.5% 88.0% 71.2 6.1% 0.0% 6.0% 4.9
1/1/18 7:00 169.2 74.0 94.4% 98.5% 93.0% 68.8 90.2% 98.5% 88.8% 65.7 4.2% 0.0% 4.2% 3.1
1/1/18 8:00 169.1 73.0 94.2% 98.5% 92.7% 67.7 90.2% 98.5% 88.8% 64.8 4.0% 0.0% 3.9% 2.9
1/1/18 9:00 168.9 73.0 94.2% 98.5% 92.8% 67.7 90.2% 98.5% 88.8% 64.8 4.0% 0.0% 4.0% 2.9
1/1/18 10:00 169.1 73.0 94.2% 98.5% 92.8% 67.7 90.2% 98.5% 88.8% 64.8 4.0% 0.0% 3.9% 2.9
1/1/18 11:00 169.5 73.0 94.1% 98.5% 92.7% 67.7 90.2% 98.5% 88.9% 64.9 3.9% 0.0% 3.9% 2.8
1/1/18 12:00 169.8 75.0 94.6% 98.5% 93.2% 69.9 90.2% 98.5% 88.9% 66.7 4.4% 0.0% 4.3% 3.2
1/1/18 13:00 170.6 75.0 94.5% 98.5% 93.1% 69.8 90.2% 98.5% 88.9% 66.7 4.3% 0.0% 4.2% 3.2
1/1/18 14:00 171.3 75.0 94.4% 98.5% 93.0% 69.8 90.2% 98.5% 88.9% 66.7 4.2% 0.0% 4.1% 3.1
1/1/18 15:00 171.4 76.0 94.7% 98.5% 93.2% 70.9 90.2% 98.5% 88.9% 67.5 4.4% 0.0% 4.4% 3.3
1/1/18 16:00 170.9 75.0 94.5% 98.5% 93.1% 69.8 90.2% 98.5% 88.9% 66.7 4.2% 0.0% 4.2% 3.1
1/1/18 17:00 170.0 75.0 94.6% 98.5% 93.2% 69.9 90.2% 98.5% 88.9% 66.7 4.3% 0.0% 4.3% 3.2
1/1/18 18:00 169.2 74.0 94.4% 98.5% 93.0% 68.8 90.2% 98.5% 88.8% 65.7 4.2% 0.0% 4.2% 3.1
1/1/18 19:00 169.2 74.0 94.4% 98.5% 93.0% 68.8 90.2% 98.5% 88.8% 65.7 4.2% 0.0% 4.2% 3.1
1/1/18 20:00 169.6 74.0 94.4% 98.5% 93.0% 68.8 90.2% 98.5% 88.9% 65.8 4.2% 0.0% 4.1% 3.0
1/1/18 21:00 170.1 75.0 94.6% 98.5% 93.1% 69.9 90.3% 98.5% 88.9% 66.7 4.3% 0.0% 4.2% 3.2
1/1/18 22:00 170.9 75.0 94.5% 98.5% 93.1% 69.8 90.2% 98.5% 88.9% 66.7 4.2% 0.0% 4.2% 3.1
1/1/18 23:00 171.3 76.0 94.7% 98.5% 93.2% 70.9 90.2% 98.5% 88.9% 67.5 4.5% 0.0% 4.4% 3.3
1/2/18 0:00 172.0 76.0 94.6% 98.5% 93.2% 70.8 90.2% 98.5% 88.9% 67.5 4.4% 0.0% 4.3% 3.3
1/2/18 1:00 172.8 76.0 94.5% 98.5% 93.1% 70.7 90.2% 98.5% 88.9% 67.5 4.3% 0.0% 4.2% 3.2
Chief Joseph Hourly Ops Data - Post Upgrade Incremental ImprovementOriginal UnitNew Unit
Run

PRE-DECISIONAL AND FIUO – For Internal Use Only August 2018
16
Figure 9: Example of incremental generation (new units - original units) for each hour of a single year (Unit 10, 2015), extracted from the calculation spreadsheet
Figure 10: Example of incremental efficiency (new units - original units) for each hour of a single year (Unit 10, 2015), extracted from the calculation spreadsheet
PRE-DECISIONAL AND FIUO – For Internal Use Only August 2018
17
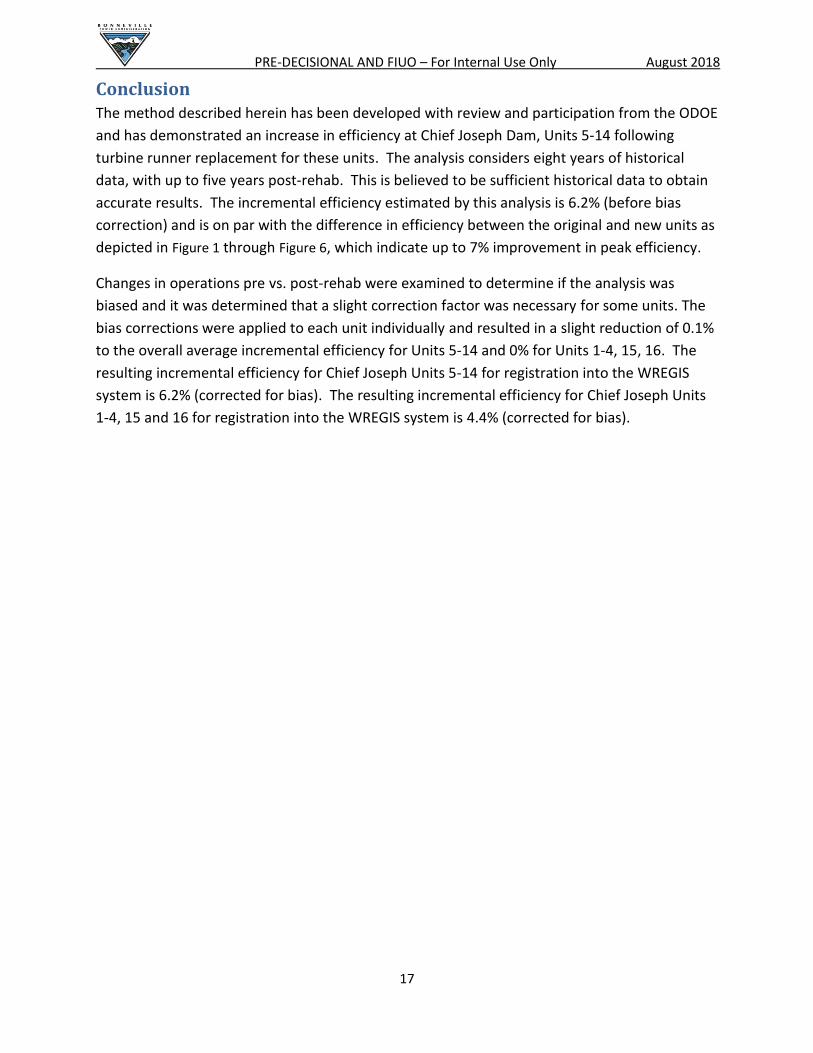
Conclusion The method described herein has been developed with review and participation from the ODOE
and has demonstrated an increase in efficiency at Chief Joseph Dam, Units 5-14 following
turbine runner replacement for these units. The analysis considers eight years of historical
data, with up to five years post-rehab. This is believed to be sufficient historical data to obtain
accurate results. The incremental efficiency estimated by this analysis is 6.2% (before bias
correction) and is on par with the difference in efficiency between the original and new units as
depicted in Figure 1 through Figure 6, which indicate up to 7% improvement in peak efficiency.
Changes in operations pre vs. post-rehab were examined to determine if the analysis was
biased and it was determined that a slight correction factor was necessary for some units. The
bias corrections were applied to each unit individually and resulted in a slight reduction of 0.1%
to the overall average incremental efficiency for Units 5-14 and 0% for Units 1-4, 15, 16. The
resulting incremental efficiency for Chief Joseph Units 5-14 for registration into the WREGIS
system is 6.2% (corrected for bias). The resulting incremental efficiency for Chief Joseph Units
1-4, 15 and 16 for registration into the WREGIS system is 4.4% (corrected for bias).

OregonKulc B;'O\I, 'I]. (jovei'iH)]'
April 15. 2019
Debra MatinBonneville Power AdministrationP.O. Box 3621Portland, OR 97208
OREGONDEPARTMENT OFENERGY
550 Capitol St. NESalem, OR 97301
Phone: 503-378-4040Toll Free: 1-800-221-8035
FAX: 503-373-7806
www.oregon.gov/energy
RE: Certificate of Oregon Eligibility and Vintage Date for Chief Joseph (W4395-W4398:W4409, W4410) ~ ~ ~ ° - " "-^- -.. -"<
Dear Ms. Malin;
The^Oregon Department of Energy has approved your request for Oregon Renewable Portfolio Standard(RPS) eligibility for Chief Joseph Units 1-4 and 15-16. The Department has notified WREGISofthisapproval and the first eligible vintage date. Any Renewable Energy Cenificates (RECs) sourced fromgeneration from your facility from the vintage date described below will be eligible for RPS compliance inOregon.
Generating Unit WREGIS IDOregon
CertificationNumber
First EligibleVintage Date
Renewal Date
^hiefJoseph 1 W4395 19alt001wa May 2016 April 2024Chief Joseph 2 W4396 19alt001\va October 2016 April 2024Chief Joseph 3 W4397 19alt001wa April 2016 April 2024^hief Joseph^ W4398 19alt001wa October 2017 April 2024
^ChieHoseghJ^Chief JosephJ^
W4409 19alt001wa June 2015W4410 19alt001wa October 2015
_Agn^2024_April 2024
PJeasenote that the Department routinely requires an evaluation of incremental efficiency evaluation fiveyears. Based on your facility's approval date. Chief Joseph Units 1-4 and 15-16 will need to attest to thesame incremental efficiency by April 2024 in order to maintain eligibility for the Oregon RPS. If anychanges are made to your facility that could affect its eligibility for the Oregon RPS prior to the renewaldate listed above, the Depanment must be notified.
Chief Joseph Units 1-4 and 15-16 have received approval under ORS 469A. 025(4)(b), which allowshydroelectric facilities that have installed efficiency upgrades on or after January 1, 1995, to receive RPSeligible credit for the electricity attributable to the efficiency upgrade. The Department's approval is onlyfor the incremental electricity attributed to efficiency upgrades calculated using the methodology proposedby Bonneville Power Administration and on file with the Department and WREGIS. Any future'changes tothe methodology in practice or with WREGIS must receive Department approval.
Please contact me with any questions about this letter or approval.
Best,
lebA^a SmithWREGIS Program Administrator-Oregon550 Capitol Street NESalem, OR 97301(503)[email protected]
Page 2 of 2

OregonJohn A. Kitzhaber, MD, Governor
December 22, 2014
of625 St NE
OR
Toll Free:FAX:
www.oregon. gov/energy
Debra MalinBonneville Power Administration
P.O. Box 3621Portland, OR
RE: Certificate of Oregon Eligibility and Vintage Date for Chief Joseph (W4399, W4403,W4405-W4408)
Dear Ms. Malin:
The Oregon Department of Energy has approved your June 2014 request for Oregon Renewable Portfolio(RPS) eligibility for Chief Joe Unit 5, 9, 11-14. The Department has notified of this
approval and the first eligible vintage date. Any Renewable Energy Certificates (RECs) fromgeneration from your facility from the vintage date described below will be eligible for RPS compliance inOregon.
Generating Unit
_ChiefJoseph^_ChiefJosephJJ_Chief Joseph 12
_ChiefJ(weghn_Chief Joseph 14
ID
W4399
W4403W4405
W4406W4407
W4408
OregonCertification
Number
14alt003wa
14alt003wa
14alt003wa
14alt003wa
14alt003wa
14alt003wa
First EUgibleVintage Date
March 2013
Jull2011January 2011October 2012
June 2012
December 2011
Renewal Date
December 2019
December 2019
December 2019
December 2019
December 2019
December 2019
Please note that the routinely an evaluation of incremental efficiency evaluation fiveyears, on your facility's approval Chief Joe Unit 5, 9, 11-14 will need to to theincremental efficiency by December 2019 in order to maintain eligibility for the Oregon RPS. If anychanges are to your facility that could affect its eligibility for the Oregon RPS prior to thedate listed above, the Department must be notified.
Chief Joe Unit 5, 9, 1 1-14 has received approval under ORS 469A.025(4)(b), which allows hydroelectricfacilities have efficiency on or after January 1, 1995, to receive RPS eligible creditfor the electricity attributable to the efficiency upgrade. The Department's approval is only for theincremental electricity attributed to efficiency calculated the methodolo0' byBonneville Power Administration and on file with the Department and WTtEGIS. Any tothe methodology in or with WREGIS must receive approval.
Please contact me with any questions about this letter or approval.
Julie, 'PeacockWRBGIS Program Administrator-Oregon625 Marion St. NE
Salem, OR 97300503. 373. 2125julie. [email protected]. us

OregonKate Brown, Governor
Jufy2 6, 2017
of550 St NE
OR
Toll Free:FAX:
www.oregon. gov/energyDebra MalinBonneville Power AdministrationP.O. Box 3621Portland, OR
RE: Certificate of Oregon and Vintage Date for CW4400, W4401, andW4404)
Dear Ms. Malin:
The Oregon Depanment of Energy has approved your request for Oregon Renewable Portfolio Standard (RPS)eligibility for Chief J« Unit 6, 7, 8, and 10. The Department has WR.EGIS of this approval and the firsteligible vintage date. Any Renewable Energy Certificates (RECs) sourced from generation from your facility fromthe vintage date described below will be eligible for RPS compliance in Oregon.
Generating Unit
CtuefJoseghfi^hiefJosefih_7_
Chief Joseph 10
ID
W4400W440IW4402W4404
OregonCertification
Number
17alt001wa
17alt001wa
17alt001wa
17alt001wa
Renewal Date
^Febrya^2022_
Please note that the Department routinely requires an evaluation of incremental efficiency evaluation five years.on your facility's approval Chief Joe Unit 6, 7, 8, and 10 will to to the incremental
efficiency by February 2022 in order to maintain eligibility for the Oregon RPS. If any changes are to yourfacility that could affect its eligibility for the Oregon RPS prior to the renewal date listed above, the Departmentmust be notified.
Chief Joe Unit 6, 7, 8, and 10 has received approval under ORS 469A. 025(4Xb), which allows hydroelectricfacilities that have efficiency on or after Januai^' 1, 1995, to receive RPS eligible credit for theelectricity aHributable to the efficiency upgrade. The Department's approval is only for the incremental electricityattributed to efficiency upgrades calculated using the methodology proposed by Bonneville Power Administrationand on file with the Department and WREGIS. Any future changes to the methodology in practice or with WREGIS
receive Department approval.
Please contact me with any questions about this letter or approval.
Sincerely,
U/tA-
Jessica D. Reichers
Technology and Policy ManagerDepartment of Energy
550 St NESalem, OR 97301
