washoe county regional travel characteristics study · 4.1 survey objectives and overall approach...
TRANSCRIPT
Regional Transportation Commission
Washoe County Regional Travel Characteristics Study
04/12/2018
NuStats, LLC Contact: Vivian Daigler, Project Manager PO Box 19304 Austin, TX 78760 Phone: 512-279-4153 Fax: 512-485-2835 E-mail: [email protected]
In Association with: PlanTrans, LLC Coulter & Associates Kimley-Horn and Associates

Household Travel Survey
Final Report

Table of Contents
1.0 Acknowledgements ................................................................................................................................ 1
2.0 Executive Summary ................................................................................................................................ 2
3.0 Key Statistics .......................................................................................................................................... 3
4.0 Introduction ........................................................................................................................................... 5
4.1 Survey Objectives and Overall Approach ....................................................................................... 5
4.2 Description of the Survey Components .......................................................................................... 7
4.3 Survey Schedule .............................................................................................................................. 7
5.0 Survey Design ......................................................................................................................................... 9
5.1 Survey Instrument and Materials Design ....................................................................................... 9
5.1.1 Notification Postcards ....................................................................................................... 9
5.1.2 Travel Day Assignment .................................................................................................... 10
5.1.3 Recruitment Survey Instrument ...................................................................................... 10
5.1.4 Retrieval Survey Instrument ............................................................................................ 11
5.1.5 Reminders ........................................................................................................................ 12
5.2 Sample Design............................................................................................................................... 12
5.2.1 Survey Universe ............................................................................................................... 12
5.2.2 Sampling Design and Selection Methodology ................................................................. 14
6.0 Survey Methods ................................................................................................................................... 21
6.1 Survey Pilot ................................................................................................................................... 21
6.2 Final Survey Design ....................................................................................................................... 23
6.2.1 Main Survey Data Collection Overview ........................................................................... 23
6.2.2 Survey Processes ............................................................................................................. 24
6.2.3 Proxy Reporting ............................................................................................................... 27
6.2.4 Call Backs ......................................................................................................................... 27
6.2.5 Refusals ............................................................................................................................ 28
6.2.6 Hotline ............................................................................................................................. 28
6.2.7 Non-English Speaking Households .................................................................................. 29
6.2.8 Interviewer Training ........................................................................................................ 29
6.2.9 Incentives ......................................................................................................................... 30
6.2.10 Definition of a Completed Household ............................................................................. 31
6.2.11 Respondent Burden ......................................................................................................... 32
6.2.12 Sample Management ....................................................................................................... 33
6.3 Public Awareness .......................................................................................................................... 35
6.4 Quality Control .............................................................................................................................. 35
7.0 Global Positioning System (GPS) Subsample ......................................................................................... 37
7.1 Overview ....................................................................................................................................... 37
7.2 Deployment Methods and Results ............................................................................................... 38
7.2.1 Deployment Methods ...................................................................................................... 38
7.2.2 Deployment Results ......................................................................................................... 38

7.2.3 GPS Participation Results ................................................................................................. 39
7.3 GPS/Diary Processing Methods and Results ................................................................................. 40
7.3.1 Processing of Data from RouteScout and GPS Loggers ................................................... 40
7.4 GPS and Diary Trip Matching Results ........................................................................................... 42
7.4.1 Matching Results ............................................................................................................. 43
7.4.2 Matching Results – Summary Tables ............................................................................... 46
7.5 GPS Data Deliverables................................................................................................................... 46
8.0 Assessment of Survey Quality .............................................................................................................. 48
8.1 Item Non-Response Analysis ........................................................................................................ 48
8.2 Expected Value Ranges and Logical Relationships between Items .............................................. 49
8.3 Data Review – Kimley-Horn .......................................................................................................... 51
8.3.1 File Review ....................................................................................................................... 51
8.4 Geographic Coverage .................................................................................................................... 53
8.5 Response Rate Summary .............................................................................................................. 54
8.5.1 Total Sample Size ............................................................................................................. 55
8.5.2 CASRO Response Rate ..................................................................................................... 57
8.5.3 Simple Response Rate...................................................................................................... 57
9.0 Survey Data Weighting and Expansion ................................................................................................. 60
9.1 Household Weight ........................................................................................................................ 60
9.1.1 Raking Adjustment ........................................................................................................... 61
9.2 Person Weight .............................................................................................................................. 63
9.2.1 Final Expanded Person Weight ........................................................................................ 65
9.3 Factoring Diary Trips from GPS Results ........................................................................................ 65
10.0 Overall Survey Results .................................................................................................................... 67
10.1 Respondent/Household Summary (Weighted) DK/RF excluded .................................................. 69
10.2 Travel Behavior ............................................................................................................................. 77
10.3 Trip Characteristics ....................................................................................................................... 80
10.3.1 Mode Choice .................................................................................................................... 81
10.3.2 Travel Times ..................................................................................................................... 83
10.4 Activity-Based Survey Results ....................................................................................................... 85
11.0 Limitations of the Survey ............................................................................................................... 87
12.0 Recommendations for Future Survey Improvement ....................................................................... 88
Appendix A – Examples of the Notification Postcards ................................................................................. 89
Appendix B - CATI and Web Recruitment Script .......................................................................................... 90
Appendix C – List of Assigned Travel Days................................................................................................. 108
Appendix D – CATI and Web Retrieval Script ............................................................................................ 110
Appendix E – Non-GPS Survey Materials ................................................................................................... 114
Appendix F – GPS Survey Materials .......................................................................................................... 127
Appendix G – RouteScout Survey Materials .............................................................................................. 132
Appendix H – Reminder Script .................................................................................................................. 137
Appendix I – Pre-Paid Incentive Letter and Follow up Letter ..................................................................... 138
Figures
Figure 1: RTC MPO Map of the Household Travel Survey Study Area* .................................................................. 6
Figure 2: Survey Schedule ........................................................................................................................................ 8
Figure 3: Reno-Sparks MPO 20 Planning Districts ................................................................................................. 13
Figure 4: Transit Oversampling area ...................................................................................................................... 19
Figure 5: RTC HHTS Survey Process ....................................................................................................................... 24
Figure 6: Example NuTripX™ Screen - Interactive Real-Time Geocoding with Trip Sequencing ........................... 27
Figure 7: Schematic of the GPS Data Processing Software ................................................................................... 40
Figure 8: RTC Place Locations ................................................................................................................................ 52
Figure 9: RTC Home Locations ............................................................................................................................... 53
Figure 10: Distribution of Households by Day of Week ........................................................................................ 69
Figure 11: Household Size (Weighted) .................................................................................................................. 70
Figure 12: Number of Household Vehicles (Weighted) ......................................................................................... 70
Figure 13: Ethnicity distribution (Weighted) ......................................................................................................... 71
Figure 14: Proportion of Hispanic Household (Weighted) .................................................................................... 72
Figure 15: Ownership of Household Residence (Weighted) ................................................................................. 72
Figure 16: Illustrated Household Income* (Weighted) ......................................................................................... 73
Figure 17: Number of Household Workers (Weighted) ........................................................................................ 74
Figure 18: Gender Participation (Weighted) ......................................................................................................... 75
Figure 19: Respondent Disability Status (Weighted) ............................................................................................. 76
Figure 20: Respondent Employment Status (Weighted) ....................................................................................... 76
Figure 21: Average Travel Duration by Mode ....................................................................................................... 82
Figure 22: Average Travel Distance by Mode ........................................................................................................ 83
Figure 23: Trip Distribution by Time of Day Based on Departure Hour ................................................................ 84
Figure 24: Hourly Trip Distribution by Departure Hours ....................................................................................... 84
Figure 25: Notification GPS and Non-GPS Postcards ............................................................................................. 89
Tables
Table 1: List of Abbreviations and Acronyms .......................................................................................................... 8
Table 2: Average Trip Rates by Demographic Characteristic (weighted and GPS factored) ................................... 3
Table 3: Key Household Travel Survey Trip Statistics (weighted and expanded) .................................................... 4
Table 4: Travel Mode Distribution (weighted) ........................................................................................................ 4

Table 5: RTC HHTS Survey Design Schematic .......................................................................................................... 7
Table 6: Study Area and Survey Universe .............................................................................................................. 14
Table 7: Non-GPS Sample Size by District .............................................................................................................. 16
Table 8: GPS Goal by Area Type ............................................................................................................................. 17
Table 9: Regionwide Household Distribution by Household Vehicle & Number of Household Workers ............. 17
Table 10: Socioeconomic Sample Goals by Household Vehicle & Number of Household Workers ..................... 18
Table 11: Regionwide Household Distribution by Household Size & Household Income ..................................... 18
Table 12: Socioeconomic Sample Goals by Household Size & Household Income ............................................... 18
Table 13: Sociodemographic Distribution for the Study Area ............................................................................... 20
Table 14: Pilot and Main Survey Recruitment and Retrieval Summary by Survey Mode ..................................... 24
Table 15: Main Survey Recruitment Start and End Dates ..................................................................................... 25
Table 16: Main Survey Retrieval Start and End Dates ........................................................................................... 26
Table 17: Hotline Call Summary ............................................................................................................................ 29
Table 18: Main Survey Incentive Structure for GPS and Non-GPS Households .................................................... 30
Table 19: Incentives Summary ............................................................................................................................... 31
Table 20: Average Time in Minutes to Complete the Main Survey ....................................................................... 33
Table 21: Trip Rates for the GPS and RouteScout Samples ................................................................................... 37
Table 22: GPS Trips by Day of Week ...................................................................................................................... 38
Table 23: Deployment Statistics by GPS Household Sample Type ........................................................................ 39
Table 24: Recruitment, Completion and Results by GPS Household Type ............................................................ 39
Table 25: Method of Interpolating HDOP and Satellites in View from the RouteScout Accuracy Measure ......... 40
Table 26: Frequencies of Number of Days for the GPS Sample ............................................................................ 42
Table 27: Trip Frequencies for the Matched GPS Sample (Diary and GPS) ........................................................... 43
Table 28: Status of Matches between Diary and GPS ........................................................................................... 44
Table 29: Trip Frequencies for the GPS Sample for the Main Survey ................................................................... 44
Table 30: Summary Statistics – Comparison of GPS and Diary Records ................................................................ 46
Table 31: Perfect Match Summary ........................................................................................................................ 46
Table 32: Missing Trip Matching Summary ........................................................................................................... 46
Table 33: Household Item Non-Response ............................................................................................................. 48
Table 34: Person Item Non-Response ................................................................................................................... 48
Table 35: Vehicle Item Non-Response ................................................................................................................... 49
Table 36: Travel Behavior Item Non-Response ..................................................................................................... 49
Table 37: Summary of Quality Assurance Checks ................................................................................................. 49
Table 38: Geographic Distribution by Strata ......................................................................................................... 54
Table 39: Summary of Used Sample Count by Sample Type for Main Study ........................................................ 55
Table 40: Sample Disposition for Recruitment by Sampling Type for Main Study ................................................ 56
Table 41: Recruitment and Retrieval Rates and Response Rates by Sample Type for the Main Study ................ 58

Table 42: Recruitment Rates and Response Rates by Sampling Strata for the Main Study .................................. 59
Table 43: Raking Adjustment at Household Level ................................................................................................. 62
Table 44: Survey and Population Distribution by Raking Variables ...................................................................... 64
Table 45: Distribution of Trips of Different Match Types ...................................................................................... 66
Table 46: Household Income by Retrieval Mode .................................................................................................. 67
Table 47: Hispanic Status by Retrieval Mode (Person) .......................................................................................... 67
Table 48: Household Size by Retrieval Mode ........................................................................................................ 68
Table 49: Retrieval Modes by Sample type ........................................................................................................... 68
Table 50: Retrieval Mode by Race (Person) .......................................................................................................... 69
Table 51: Vehicle Fuel Type ................................................................................................................................... 71
Table 52: Landlines in Household (Weighted) ....................................................................................................... 73
Table 53: Number of Household Students (Weighted) ......................................................................................... 74
Table 54: Respondent Age Distribution (Weighted) ............................................................................................. 75
Table 55: Respondent Number of Jobs (Weighted) .............................................................................................. 77
Table 56: Average Household Trips by Household Size and Employment Status [Weighted] .............................. 77
Table 57: Average Household Trips by Household Size and Number of Household Vehicles [Weighted] ........... 78
Table 58: Average Household Trips by Household Size and Household Income [Weighted] ............................... 78
Table 59: Average Trips per Person by Age Group [Weighted] ............................................................................. 78
Table 60: Average Trips per Person by Gender [Weighted] .................................................................................. 79
Table 61: Average Trips per Person by Age and Gender [Weighted] .................................................................... 79
Table 62: Trip Distribution by Activity [weighted] ................................................................................................. 80
Table 63: Trip Distribution by Travel Mode ........................................................................................................... 81
Table 64: Mode Choice Comparison ...................................................................................................................... 82
Table 65: Number of Activities by Place Type (Home, Work, School, and Other) ................................................ 85
Table 66: Average Travel Duration by Activity [Weighted] ................................................................................... 85
Table 67: List of Assigned Travel Days ................................................................................................................. 108

Table 1: List of Abbreviations and Acronyms
RTC Regional Transportation Commission of Washoe County ACS American Community Survey CASRO Council of American Survey Research Organizations CATI Computer Assisted Telephone Interviewing CM Complete CPH Completes Per Hour GPS Global Positioning System HH Household HHTS Household Travel Survey/Study MPO Metropolitan Planning Organization MSG Marketing Systems Group NTX NuTripX™ – NuStats’ proprietary real-time geocoding tool RS RouteScout – Smartphone application developed by
NuStats for GPS data collection LAT Latitude LONG Longitude

1 RTC Washoe County Travel Characteristics Study Final Report
1.0 Acknowledgements
NuStats and the Regional Transportation Commission of Washoe County (RTC) would like to acknowledge the
many individuals who assisted with the planning, development, implementation, and execution of this
project. Each party played an integral role in allowing this project to be a success.
The RTC team was led by Xuan Wang, who provided guidance and oversight throughout the project. Debra
Goodwin, Amy Cummings and Judy Altoff were key members of the advisory team. Additional members of the
advisory team were: Michael Dulude, Hao Xu, Jeremy Smith, Tina Wu, and Joseph Harrington. We are grateful
for their contribution to this project.
Oversight to the Public Awareness campaign was provided by Joseph Harrington. Bobbi Coulter of Coulter and
Associates, lead the Public Awareness effort for NuStats. We are grateful for their efforts to ensure the
population of Washoe County was made aware of this project.
Leading the Global Positioning System (GPS) portion of this study was Peter Stopher. Dr. Stopher is considered
one of the top experts in the world when it comes to collecting and analyzing GPS data, and we are grateful to
him and his team at PlanTrans for the hard work they’ve put into this project.
Kimley-Horn and Associates provided modeling expertise and local quality assurance. The individuals that
performed these tasks were Tim Padgett and Molly O’Brien, and NuStats is thankful to them for their
contributions to this project.
NuStats’ data collection team worked tirelessly to recruit, retrieve, troubleshoot, and provide quality
assurance, quality control, and sample management. Several of the NuStats team also performed the tasks of
trip-purpose editing of the GPS and RouteScout data, fulfillment (postcards, survey packets, GPS devices, and
mailing incentives) and downloading travel data from the GPS devices. These team members were
instrumental in the successful completion of this project, and we are grateful to all of them for their
contributions to this project.
Finally, without the survey participants, this project could not have been successful. It takes considerable
effort to provide recruitment and travel data of all household members; for this, we are extremely grateful to
these households that participated.
Additional individuals to be acknowledged for their contributions to this project:
Kris Castillo, Ceci Natal, and Christina Gomez Data Collection Specialists
Brett Davis Senior Software Developer
Sarah Griffith CDF Administrator
Mike Hinojosa Fulfillment Supervisor
Sujin Hong Senior Data Analyst
Martin Kunzmann President, NuStats
Cory Masterman Post Trip Purpose Editing Lead
George Uribe Data Collection Manager
2 RTC Washoe County Travel Characteristics Study Final Report
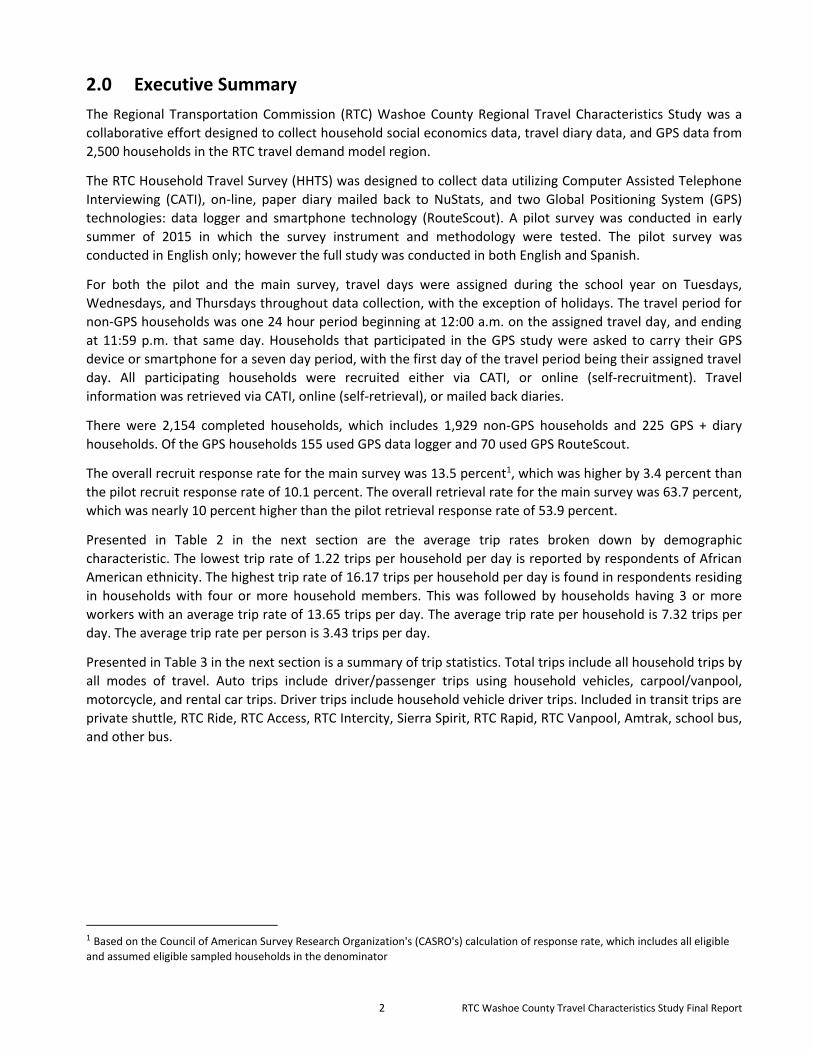
2.0 Executive Summary
The Regional Transportation Commission (RTC) Washoe County Regional Travel Characteristics Study was a
collaborative effort designed to collect household social economics data, travel diary data, and GPS data from
2,500 households in the RTC travel demand model region.
The RTC Household Travel Survey (HHTS) was designed to collect data utilizing Computer Assisted Telephone
Interviewing (CATI), on-line, paper diary mailed back to NuStats, and two Global Positioning System (GPS)
technologies: data logger and smartphone technology (RouteScout). A pilot survey was conducted in early
summer of 2015 in which the survey instrument and methodology were tested. The pilot survey was
conducted in English only; however the full study was conducted in both English and Spanish.
For both the pilot and the main survey, travel days were assigned during the school year on Tuesdays,
Wednesdays, and Thursdays throughout data collection, with the exception of holidays. The travel period for
non-GPS households was one 24 hour period beginning at 12:00 a.m. on the assigned travel day, and ending
at 11:59 p.m. that same day. Households that participated in the GPS study were asked to carry their GPS
device or smartphone for a seven day period, with the first day of the travel period being their assigned travel
day. All participating households were recruited either via CATI, or online (self-recruitment). Travel
information was retrieved via CATI, online (self-retrieval), or mailed back diaries.
There were 2,154 completed households, which includes 1,929 non-GPS households and 225 GPS + diary
households. Of the GPS households 155 used GPS data logger and 70 used GPS RouteScout.
The overall recruit response rate for the main survey was 13.5 percent1, which was higher by 3.4 percent than
the pilot recruit response rate of 10.1 percent. The overall retrieval rate for the main survey was 63.7 percent,
which was nearly 10 percent higher than the pilot retrieval response rate of 53.9 percent.
Presented in Table 2 in the next section are the average trip rates broken down by demographic
characteristic. The lowest trip rate of 1.22 trips per household per day is reported by respondents of African
American ethnicity. The highest trip rate of 16.17 trips per household per day is found in respondents residing
in households with four or more household members. This was followed by households having 3 or more
workers with an average trip rate of 13.65 trips per day. The average trip rate per household is 7.32 trips per
day. The average trip rate per person is 3.43 trips per day.
Presented in Table 3 in the next section is a summary of trip statistics. Total trips include all household trips by
all modes of travel. Auto trips include driver/passenger trips using household vehicles, carpool/vanpool,
motorcycle, and rental car trips. Driver trips include household vehicle driver trips. Included in transit trips are
private shuttle, RTC Ride, RTC Access, RTC Intercity, Sierra Spirit, RTC Rapid, RTC Vanpool, Amtrak, school bus,
and other bus.
1 Based on the Council of American Survey Research Organization's (CASRO's) calculation of response rate, which includes all eligible
and assumed eligible sampled households in the denominator

3 RTC Washoe County Travel Characteristics Study Final Report
3.0 Key Statistics
Presented in Table 2 are the average trip rates broken down by demographic characteristic.
Table 2: Average Trip Rates by Demographic Characteristic (weighted and GPS factored)
Item Trips per household/person
per day
Household 7.32
Person 3.43
Household size
1 3.05
2 5.64
3 9.14
4+ 16.17
Household vehicles
0 3.77
1 4.99
2 8.89
3+ 9.56
Household workers
0 3.40
1 7.00
2 11.02
3+ 13.65
Household income
Less than $25,000 4.87
$25,000 to less than $50,000 6.50
$50,000 to less than $75,000 8.93
$75,000 or less than $100,000 7.65
$100,000 or more 10.44
Refused to report income 4.65
Age
<25 years old 3.11
25 – 34 3.31
35 – 44 4.58
45 – 54 3.87
55 – 64 3.62
65+ 2.73
Hispanic Status
Yes 3.45
No 3.43
Ethnicity
White 3.53
African American 1.22
American Indian/Alaska Native 2.53
Asian 3.46
Native Hawaiian/Pacific Islander 2.12
Other 3.27
Refused to report ethnicity 3.20
4 RTC Washoe County Travel Characteristics Study Final Report
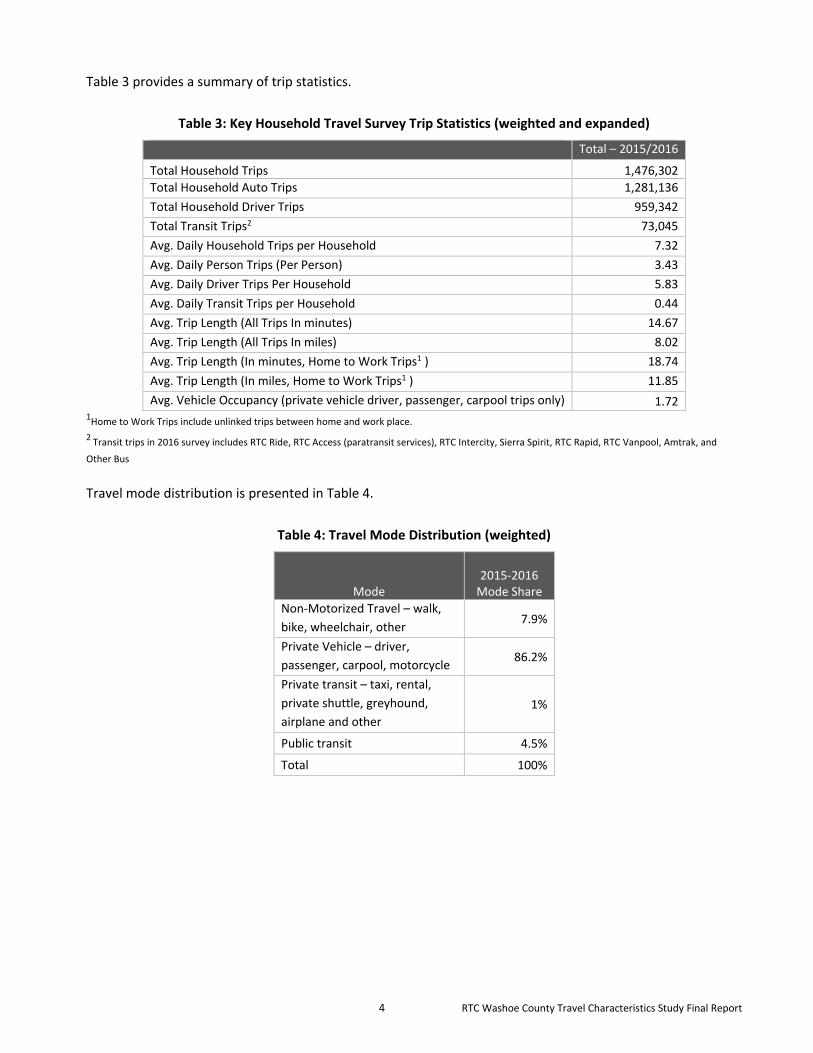
Table 3 provides a summary of trip statistics.
Table 3: Key Household Travel Survey Trip Statistics (weighted and expanded)
Total – 2015/2016
Total Household Trips 1,476,302
Total Household Auto Trips 1,281,136
Total Household Driver Trips 959,342
Total Transit Trips2 73,045
Avg. Daily Household Trips per Household 7.32
Avg. Daily Person Trips (Per Person) 3.43
Avg. Daily Driver Trips Per Household 5.83
Avg. Daily Transit Trips per Household 0.44
Avg. Trip Length (All Trips In minutes) 14.67
Avg. Trip Length (All Trips In miles) 8.02
Avg. Trip Length (In minutes, Home to Work Trips1 ) 18.74
Avg. Trip Length (In miles, Home to Work Trips1 ) 11.85
Avg. Vehicle Occupancy (private vehicle driver, passenger, carpool trips only) 1.72 1Home to Work Trips include unlinked trips between home and work place.
2 Transit trips in 2016 survey includes RTC Ride, RTC Access (paratransit services), RTC Intercity, Sierra Spirit, RTC Rapid, RTC Vanpool, Amtrak, and
Other Bus
Travel mode distribution is presented in Table 4.
Table 4: Travel Mode Distribution (weighted)
Mode 2015-2016
Mode Share
Non-Motorized Travel – walk,
bike, wheelchair, other 7.9%
Private Vehicle – driver,
passenger, carpool, motorcycle 86.2%
Private transit – taxi, rental,
private shuttle, greyhound,
airplane and other
1%
Public transit 4.5%
Total 100%

5 RTC Washoe County Travel Characteristics Study Final Report
4.0 Introduction
The 2015-2016 RTC Travel Characteristics Survey was a multi-modal study of the demographic and travel
behavior characteristics of residents throughout Washoe County, Nevada. Detailed travel behavior
information was obtained from 2,154 households, using multiple data collection methods, including
Computer Assisted Telephone Interviewing (CATI), online, mail surveys, wearable GPS devices, and a
smartphone application. The survey sampling plan was designed to ensure an accurate representation of the
entire RTC region.
4.1 Survey Objectives and Overall Approach
The main objective of the household travel study was to collect completed travel surveys from 2,500
households in the RTC region. The completed households are representative of the population of the 20
planning districts in Reno-Sparks. These 20 districts were disaggregated based on geographic and
socioeconomic characteristics. Of particular interest to the RTC is the stratification of the resulting data into 2
two-dimensional categories: vehicles per household and number of workers per household and; household
size and household income level. Ten percent of the responding households were selected to participate with
GPS technology, either by wearing a GPS Data Logger (DL) or by utilizing RouteScout (NuStats’ smartphone
GPS tracking application). Participating households were required to complete a traditional travel diary. The
GPS data serves to adjust unreported trips.
Assigned travel days were Tuesday through Thursday, except for holidays that fell on one of those days.
During school breaks, data collection was suspended until school was back in session. With the approval of
the RTC project manager, several travel days were added to the assigned travel day schedule in late fall 2015,
and in early spring 2016.
A pilot study was conducted in early summer 2015 in order to assess respondent reaction to the survey and to
confirm that the survey questions would yield the desired data. A summary of the pilot study is presented in
Section 6.1. The pilot report provided recommendations for modifications that were implemented for the full
study.
Figure 1 shows a map of the survey study area.

6 RTC Washoe County Travel Characteristics Study Final Report
Figure 1: RTC MPO Map of the Household Travel Survey Study Area*
*Source: http://www.rtcwashoe.com/mapwarehouse/RTC_MPO_Area.pdf

7 RTC Washoe County Travel Characteristics Study Final Report
4.2 Description of the Survey Components
An overview of the key aspects of the RTC HHTS survey design is presented in Table 5. These three aspects,
Sample Type, Household Type, and Survey Mode, are described as follows:
Sample Type: The sampling frame for the RTC HHTS was an address-based sample. Households whose addresses were sampled fell into two types—those for which there was a telephone number matched to the address (Matched Sample) and those without a matching telephone number (Unmatched Sample). In general, Matched Sample households have landline telephones, and Unmatched Sample households are those with no telephone, or cell phone numbers only.
Household Type: Households were recruited as: 1) those using Global Positioning System (GPS) technology (GPS Households) to augment their travel reporting and; 2) those not using GPS technology (Non-GPS). In the RTC HHTS design, GPS households were further recruited to use one of two different types of GPS technology:
Wearable GPS
RouteScout (Smartphone GPS tracking technology)
Survey Mode: To provide potential respondents with multiple ways to respond, there were different survey modes offered in the Recruitment and Retrieval phase of the survey. Recruitment was available to all Household Types through computer-assisted telephone interviewing (CATI) as well as on the Internet through the RTC Survey website. Retrieval of travel information was offered through CATI and Online, as well as by Mail for Non-GPS Households.
Table 5: RTC HHTS Survey Design Schematic
Sample Type Household
Type
Survey Mode
Recruitment Retrieval
CATI Online CATI Online Mail
Matched or Unmatched
Sample supplemented with
targeted listed samples and
targeted consumer cell sample
GP
S H
ou
seh
old
s
GPS
RouteScout
Non-GPS Households
Traditionally, household travel surveys have two phases—recruitment, in which households are screened for
participation; and retrieval, in which the detailed travel and activity information is collected. The recruitment
phase contained a robust list of questions to collect person, household, vehicle, demographic, and habitual
location information. The retrieval phase included the collection of detailed household travel information
from all survey respondents. Additionally, any information that was refused during the recruitment interview
was attempted to be collected during the retrieval interview.
4.3 Survey Schedule
NuStats was contracted on April 15th, 2015 to conduct the Regional Transportation Commission of Washoe
County Travel Characteristics Study. Upon execution of the contract, NuStats began work on the tasks noted.
Figure 2 provides the summary of the tasks performed, with the timeframe dedicated to each. As noted in
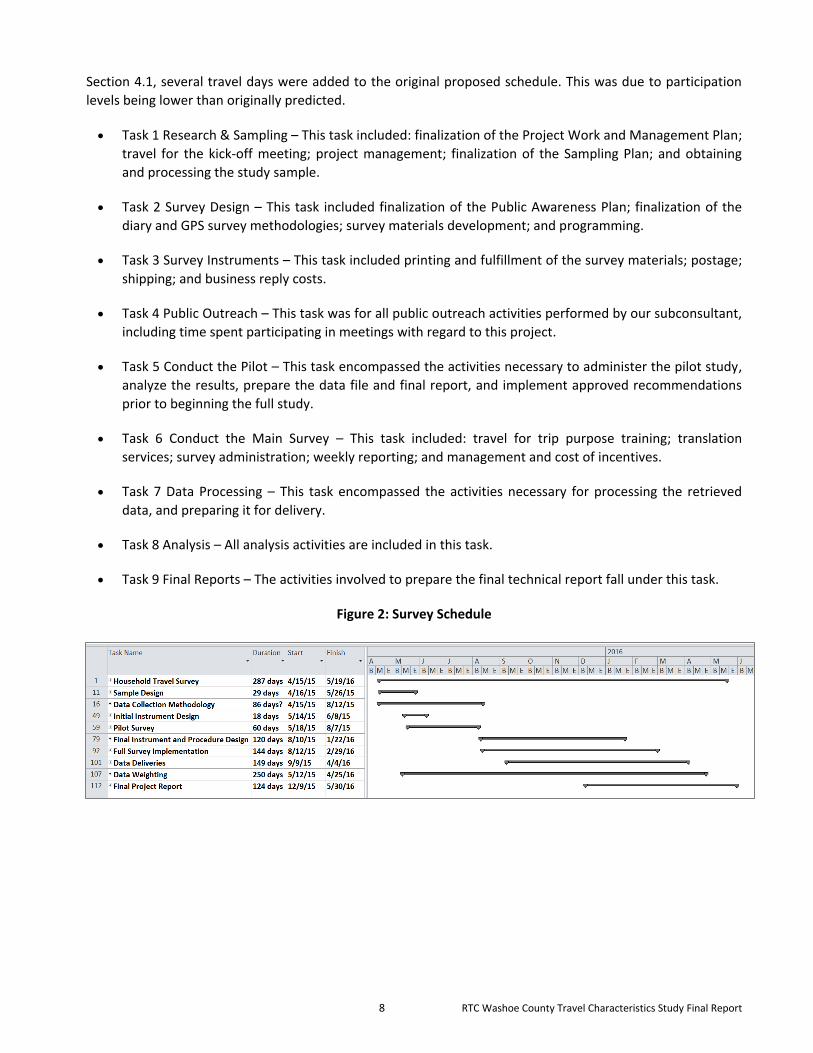
8 RTC Washoe County Travel Characteristics Study Final Report
Section 4.1, several travel days were added to the original proposed schedule. This was due to participation
levels being lower than originally predicted.
Task 1 Research & Sampling – This task included: finalization of the Project Work and Management Plan;
travel for the kick-off meeting; project management; finalization of the Sampling Plan; and obtaining
and processing the study sample.
Task 2 Survey Design – This task included finalization of the Public Awareness Plan; finalization of the
diary and GPS survey methodologies; survey materials development; and programming.
Task 3 Survey Instruments – This task included printing and fulfillment of the survey materials; postage;
shipping; and business reply costs.
Task 4 Public Outreach – This task was for all public outreach activities performed by our subconsultant,
including time spent participating in meetings with regard to this project.
Task 5 Conduct the Pilot – This task encompassed the activities necessary to administer the pilot study,
analyze the results, prepare the data file and final report, and implement approved recommendations
prior to beginning the full study.
Task 6 Conduct the Main Survey – This task included: travel for trip purpose training; translation
services; survey administration; weekly reporting; and management and cost of incentives.
Task 7 Data Processing – This task encompassed the activities necessary for processing the retrieved
data, and preparing it for delivery.
Task 8 Analysis – All analysis activities are included in this task.
Task 9 Final Reports – The activities involved to prepare the final technical report fall under this task.
Figure 2: Survey Schedule
9 RTC Washoe County Travel Characteristics Study Final Report
5.0 Survey Design
The RTC team and NuStats worked closely to finalize the design of the HHTS. A multimodal data collection
menu was offered to participating households in order to maximize individual preference for survey
administration. Households had the option of providing their completed travel information via mail, landline
phone, cell phone, QR code, web, and other electronic means. The web-based recruitment and retrieval
instruments were implemented using Voxco software and were accessible from the public website. With the
postcard notification, each household received a unique Personal Identification Number (PIN) for login. The
PIN allows for controlled and secured access to our survey instruments and was deactivated after a household
completed their travel data. The web surveys followed the same format and flow as the CATI surveys that the
interviewers used. Passive, high-resolution GPS data was collected via GPS DataLoggers (DL) and RouteScout
(smartphone application) technology.
A public outreach plan was collaboratively designed between RTC, Coulter & Associates, and NuStats. The
public outreach plan was implemented for the pilot survey, and was evaluated following the pilot for possible
improvements that could be implemented for the full study.
Travel diary and GPS materials were processed for shipping to recruited households so that they would be
received no later than the day before the assigned travel day.
Retrieval was completed in one of three modes: CATI, Online, or Mail. If responding households had not
logged onto the survey website to complete their retrieval interview the day following their assigned travel
day, retrieval calls were placed to collect the travel data.
5.1 Survey Instrument and Materials Design
5.1.1 Notification Postcards
Notification of the survey in the form or postcards was mailed to all unmatched sample. The postcards
included an introduction to the survey, the purpose of the survey, a date to respond by, incentives being
offered (to select households), a toll-free number to call with questions or to be recruited into the survey by a
Computer Assisted Telephone Interviewing (CATI) interviewer, the URL for the survey website to self-recruit,
and the respondent’s PIN. For Spanish speaking participants, a line was placed on the front of the postcard
saying: “Si desea esta información en español por favor llame a NuStats usando el número gratuito 1-877-221-
7828.” or “If you would like this information in Spanish please call NuStats using the toll free number 1-877-
221-7828.”
The postcards were modified a few times throughout the main study. The initial change was to enhance the
call out window from saying “Your input is needed!” to “You can make a difference!” and adding a bubble
showing “$25”. Also for the second version, the respond by date was changed from 10 days to 14 days, the
statement “Choose how you want to participate” was removed, and the paragraph stating “OR Call NuStats
survey research firm, toll-free at 1-877-221-7828” was moved to the bottom of the postcard and reworded to
say “Questions? Call NuStats survey research firm, toll-free at 1-877-221-7828.” The reasons for these
changes were to place focus on the incentive, and encourage web participation. Lastly, NuStats discontinued
printing RouteScout specific postcards, and only mentioned GPS in the text of the postcard.
In its third iteration, the postcard evolved even further. NuStats created a QR code that took the respondent
directly to the KOLO video interview, and a QR code that took the respondent directly to the survey website.
With each mailing, approximately one-half of the households received the video link, and one half received
10 RTC Washoe County Travel Characteristics Study Final Report
the survey link. It turned out more households that received the QR code with the survey link chose to recruit
into the survey than did those that received the KOLO video interview QR code. Therefore, with the fourth
iteration, we discontinued mailing postcards with the KOLO video QR code. Examples of the notification
postcards may be found in Appendix A – Examples of the Notification Postcards.
5.1.2 Travel Day Assignment
Travel diary days were randomly assigned to households at the beginning of the recruitment interview for one
24-hour period on one weekday (Tuesday through Thursday) excluding any statutory holidays and school
breaks and ensuring an even distribution of travel days. GPS data for GPS participants was collected for a
continuous seven day (168 hour) time period. Distribution of travel days at the household level was
monitored daily to ensure proper day-of-week distribution. The list of assigned travel days may be found in
Appendix C – List of Assigned Travel Days.
5.1.3 Recruitment Survey Instrument
The recruitment survey for the RTC HHTS was developed collaboratively with RTC, NuStats, a modeling expert
chosen by the RTC project manager, and with input from the technical advisory team. The recruitment survey
was based on the RTC’s travel modeling and analytical needs. The full CATI and online recruitment script may
be found in Appendix B - CATI and Web Recruitment Script.
The key data elements identified and collected were as follows:
Household Characteristics – main household characteristics collected were:
a) Physical address, county of residence must be Washoe
b) Household size
c) Number of workers
d) Use of public transportation
e) Vehicle ownership, operational, and number of vehicles available to the household for regular
use
f) Bicycle ownership and number of bicycles available to the household for use
g) Type of residence
h) Home ownership status
i) Number of years at current address
j) Number of cell and landline phone numbers in household
k) Household income
Person Characteristics - Demographic information was collected for all household members to help
explain the impact of household dynamics on personal travel in the region. The person-level data
elements were:
a) Name, Gender, Age
b) Relationship among household members
c) If any household members are of Hispanic, Latino or Spanish origin
d) Ethnicity
e) Vehicles driven by household members
f) Number in household who possess a valid driver’s license

11 RTC Washoe County Travel Characteristics Study Final Report
g) Employment status, if more than one employer, location of employment, type of industry and
occupation
h) Typical work days, number of hours worked per week, availability of working flexible hours,
and mode of transportation to and from work location
i) If disabled, type of disability
j) Student status, grade level, home or on-line schooled, name and location of school, Mode of
transportation to and from school location, level of education completed
k) Number of one-way transit trips in the past week, employer or school assistance with transit
fare
l) Number of bicycle trips in the past week
Vehicle Characteristics - The recruitment instrument included questions about the vehicles available
to the household:
a) Year, make, model, and body type
b) Vehicle fuel type (hybrid, gasoline, diesel, etc.)
GPS Characteristics – The recruitment instrument included questions specific to GPS households,
both DL and RS households:
a) Confirm all household members age 12 and over agree to participate
b) Smartphone operating system, type of phone, phone number, and carrier
5.1.4 Retrieval Survey Instrument
The CATI and Online programs were set up to encourage respondents to answer every required question, and
to terminate (with prior warning) the retrieval interview if respondents refused. The telephone
representatives were trained on refusal rebuttals to minimize terminations. The CATI program also prompted
interviewers to reference the same trips made by other household members. The retrieval questionnaire
utilized in the CATI and online interviews is found in Appendix D – CATI and Web Retrieval Script. The non-GPS
travel diary packet materials may be found in Appendix E – Non-GPS Survey Materials. Appendix F – GPS
Survey Materials contains the GPS travel diary packet materials.
The travel diary for the RTC HHTS was developed collaboratively with RTC, NuStats, a modeling expert chosen
by the RTC project manager, and with input from the technical advisory team. The travel diary was based on
the RTC’s travel modeling and analytical needs.
The retrieval interview confirmed information, and collected missing information not completed in
the recruitment interview:
a) Physical address, location of employment, location of school
b) Household size
c) Name, age, and relationship
d) Vehicle information
e) DL or RS usage
Activities – The retrieval interview collected information about each person’s activities throughout
their assigned travel period. These data elements included:
a) Identify activity
b) Activity start time/end time
12 RTC Washoe County Travel Characteristics Study Final Report
Trip Data – During the retrieval interview, trip data was collected for each household member, and
included the following:
a) Arrival and departure time
b) Trip place name and address
c) Trip mode
d) Number of household members who traveled
e) Vehicle(s) driven by each household member
f) Parking type, cost, and how parking was paid for
g) Use of transit, if so, which transit system and route or line number or name
5.1.5 Reminders
During the recruitment interview, respondents were given the opportunity to select their desired method of
being reminded of their assigned travel day. One day prior to the assigned travel day, the respondent received
a reminder via the method they chose, either via text message, email, or telephone call. At the time of
reminder, the respondents are asked to verify they have received their travel materials and are provided any
additional information necessary. The reminder script may be found in Appendix H – Reminder Script.
5.2 Sample Design
The purpose of the regional household travel survey was to gather statistically sound data that is detailed,
reliable, and of high quality so as to be incorporated into the RTC’s traffic demand model that better reflects
the rapid population growth and travel demand increase in the area. Collected data would reflect the diversity
of residents and their travel behavior throughout the region. The sampling plan was developed in close
coordination between RTC and the NuStats team. The sampling plan outlined the procedures for yielding a
statistically viable and reliable sampling strategy comprised of a geographically and socio-demographically
representative draw of households in the region. Critical considerations for the strategic sample design were:
identification of the survey universe, selection of the sampling frame, and a sampling method that included
stratification scheme and determination of sample size. The following sections discuss each of these key
issues.
5.2.1 Survey Universe
An address-based sampling frame approach was used. An address-based sample is a random sample of all
residential addresses that receive U.S. Mail delivery. Its main advantage is its reach into population groups
that typically participate at lower-than-average levels, largely due to coverage bias (such as households with
no phones or cell-phone only households). For efficiency of data collection, NuStats matched addresses to
telephone numbers that had a listed name of the household appended to the sampled mailing addresses. This
sampling frame ensured coverage of all types of households irrespective of their telephone ownership status,
including households with no telephones (estimated at between 3% and 4% of households in the United
States.2).
In order to better target hard-to-reach groups, the address-based sample were supplemented with samples
drawn from the listed residential frame that included listed telephone numbers from working blocks of
numbers in the United States for which the name and address associated with the telephone number were
known. The “targeted” listed residential sample, as available from the sampling vendor, included low-income
2 https://nces.ed.gov/statprog/handbook/nhes_dataquality.asp, accessed 3/9/2016.
13 RTC Washoe County Travel Characteristics Study Final Report
listed sample, large-household listed sample, young population sample, and Spanish-surname sample. As
expected, this sample was used to further strengthen the coverage of hard-to-reach households. The
advantage of drawing sample from this frame is its efficiency in conducting the survey effort—being able to
directly reach the hard-to-reach households and secure their participation in the survey in a direct and active
approach. Both address and listed residential samples were procured from the sample provider – Marketing
Systems Group (MSG) based in Fort Washington, PA.
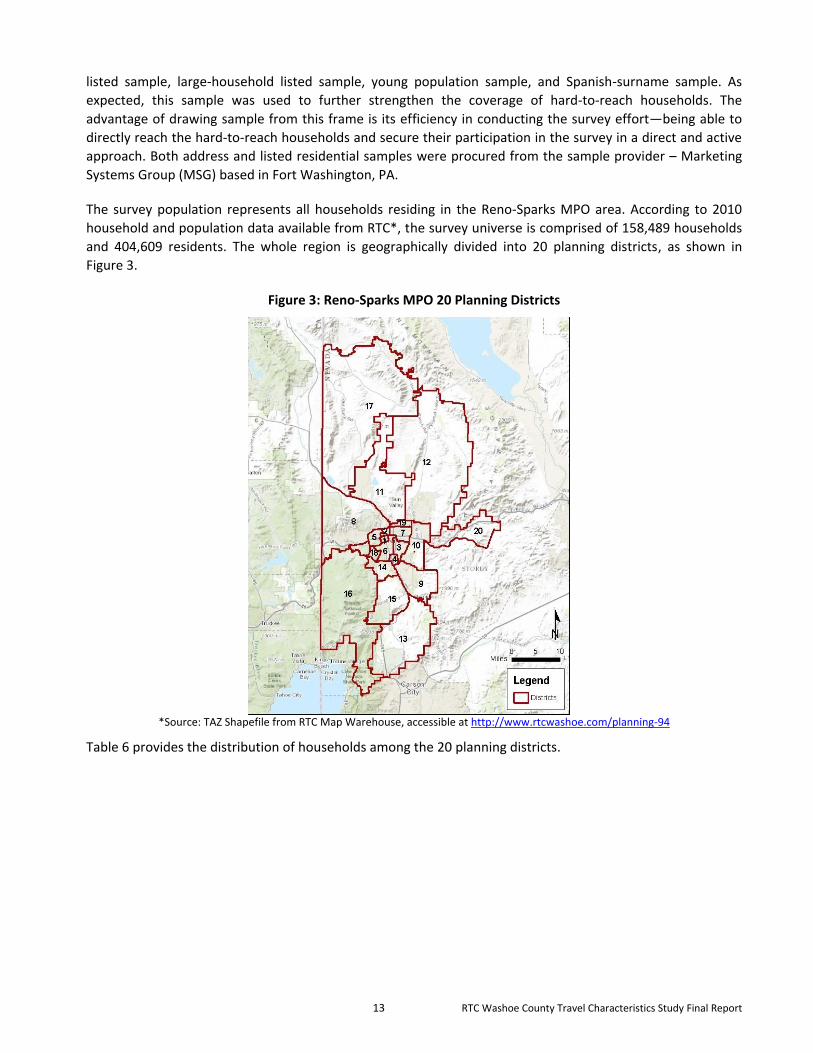
The survey population represents all households residing in the Reno-Sparks MPO area. According to 2010
household and population data available from RTC*, the survey universe is comprised of 158,489 households
and 404,609 residents. The whole region is geographically divided into 20 planning districts, as shown in
Figure 3.
Figure 3: Reno-Sparks MPO 20 Planning Districts
*Source: TAZ Shapefile from RTC Map Warehouse, accessible at http://www.rtcwashoe.com/planning-94
Table 6 provides the distribution of households among the 20 planning districts.

14 RTC Washoe County Travel Characteristics Study Final Report
Table 6: Study Area and Survey Universe
District District Name Household % of Total
1 Downtown 4,579 3%
2 University 3,385 2%
3 Airport 1,683 1%
4 Convention Center 3,724 2%
5 Reno Northwest 10,749 7%
6 Reno South 17,173 11%
7 Central Sparks 15,248 10%
8 Verdi-Mogul 16,332 10%
9 Huffaker Hills 10,522 7%
10 East Sparks 15,270 10%
11 North Valleys 17,494 11%
12 Pyramid Lake/Spanish Springs 17,184 11%
13 Washoe Southeast 3,264 2%
14 Anderson 5,529 3%
15 Rolling Hills 6,428 4%
16 Galena Creek Par 106 0%
17 Cold Springs 4,025 3%
18 Pyramid Lake 3,222 2%
19 North Sparks 2,563 2%
20 Washoe East 9 <1%
Total 158,489 100%
5.2.2 Sampling Design and Selection Methodology
NuStats employed a stratified probability sample of households for the RTC HHTS Full Study. Stratified
sampling is a type of random or probability sampling, the methods of which are well grounded in statistical
theory and the theory of probability. Specifically, stratified sampling is a probability sampling method where
the survey universe is divided into smaller groups and a random sample is chosen within each group (i.e.,
every sampling unit has some non-zero probability of being selected into the sample). This method resulted in
over-sampling for some strata ensuring NuStats captured the diversity of the population according to specific
factors affecting travel behavior in the study area. Thus, within strata, households were selected with equal
probabilities but the combined sample (across strata) comprised an unequal probability sample of
households.
To ensure geographic representation, NuStats utilized a geographic stratification scheme, which ensured
adequate representation of households throughout the study area. A stratified random sample that was
disproportionate to the distribution of households by county of residence was drawn.
Sampling Frame
The sampling frame establishes population coverage as well as the efficiency of the sample (i.e., the extent to
which screening is needed to weed out unusable or ineligible entries). Therefore, NuStats utilized an address–
based frame to pull random samples of households in the region. One of the address-based frame’s
recognized strengths is its ability to reach into population groups, regardless of phone ownership, and provide
comprehensive coverage. In addition, address-based sampling enabled NuStats to target Districts 1, 2, 3 and 7,
which were lagging in participation.

15 RTC Washoe County Travel Characteristics Study Final Report
For efficiency of data collection, addresses were matched to telephone numbers and had listed household
names appended to the sampled mailing addresses. Samples without matched phone numbers were invited
to the survey via mail with a notification postcard. As found in previous studies, the response rate for
unmatched households is generally lower than matched households and this held true for the RTC HHTS.
According to the National Health Statistics Reports (Issue No. 70), nearly 35 percent of adults aged 18 and
over in the State of Nevada are estimated to live in cell-only households.
In the late fall, NuStats identified certain demographics that were lagging behind the average: young
households (all members age 25 years or less); large households (more than 4 household members); and
Hispanic households. In an attempt to increase participation from these groups, a sample of 500 households
was drawn from this pool of available sample of Hispanic surname, large, and young households, which
included matched, unmatched, GPS, and non-GPS sample; then the selected households were mailed a letter
that contained a five dollar bill and a message asking them to participate in the study. An example of the
letter is found in Appendix I – Pre-Paid Incentive Letter. Households in this sample that had not recruited into
the study by January 7th, 2016, were sent a follow up letter that is included as Appendix I – Pre-Paid Incentive
Letter and Follow up Letter.
Of the 500 households sent the pre-paid incentive letter:
Thirty households enrolled online to participate in the study;
One enrolled via CATI to participate in the study;
Twenty-nine of the letters were returned as undeliverable;
Overall, seven percent of this sample recruited into the study;
A total of 19 households (four percent) completed both recruitment and retrieval
This was one percent higher than the average for all other types of sample
Sampling Method and Proposed Sample Size
The selection of an appropriate sampling method is critical for an effective sample design that guards against
unplanned selectiveness and produces a robust data set that is representative of the population in the region
and captures diverse travel patterns and travel behaviors. NuStats targeted a total of 2,500 completed surveys
for the main study that would result in a +/- 1.2 percent margin of sampling error at a 95 percent confidence
interval. Of these, 500 completed surveys were targeted for the additional GPS component of the survey to
track household travel patterns through GPS technologies. Due to overall participation rates being less than
anticipated, the actual number of retrieved households reached to 2051, 82 percent of the original target with
1,683 non-GPS households, and 368 GPS/RS households retrieved.
Using a stratified probability sampling method, the survey universe was divided into smaller groups with a
random sample chosen within each group. This method resulted in oversampling for some strata to ensure
that the diversity of the population, according to specific factors affecting travel behavior, was captured in the
study area. Thus, within strata, households were selected randomly (i.e., with equal probability of selection),
but the combined sample (across strata) comprised an unequal probability sample of households.
Geographic Stratification
Stratifying the sample goal by district ensured a sound sample size per district. Table 7 presents the targeted
and realized survey goals by district for non-GPS sample. As shown in the table, a minimum goal of 30 Non-

16 RTC Washoe County Travel Characteristics Study Final Report
GPS households is allocated to every district except Galena Creek Park and Washoe East, where less than one
percent of the total households are located. The geographic stratification for the targeted and realized survey
goals for GPS households is found in Table 8.
Table 7: Non-GPS Sample Size by District
District District Name Total
Households % of Total*
Target Non-
GPS Goal
% Sample
Total*
1 Downtown 4,579 3% 56 3%
2 University 3,385 2% 41 2%
3 Airport 1,683 1% 30 2%
4 Convention Center 3,724 2% 44 2%
5 Reno Northwest 10,749 7% 135 7%
6 Reno South 17,173 11% 217 11%
7 Central Sparks 15,248 10% 192 10%
8 Verdi-Mogul 16,332 10% 206 10%
9 Huffaker Hills 10,522 7% 132 7%
10 East Sparks 15,270 10% 192 10%
11 North Valleys 17,494 11% 220 11%
12 Pyramid Lake/Spanish Springs 17,184 11% 216 11%
13 Washoe Southeast 3,264 2% 40 2%
14 Anderson 5,529 3% 70 4%
15 Rolling Hills 6,428 4% 81 4%
16 Galena Creek Park 106 <1% 8 0%
17 Cold Springs 4,025 3% 50 3%
18 Pyramid Lake 3,222 2% 40 2%
19 North Sparks 2,563 2% 30 2%
20 Washoe East 9 <1% 0 0%
Total 158,489 100% 2,000 100%
*Totals may not add to 100% due to rounding
17 RTC Washoe County Travel Characteristics Study Final Report
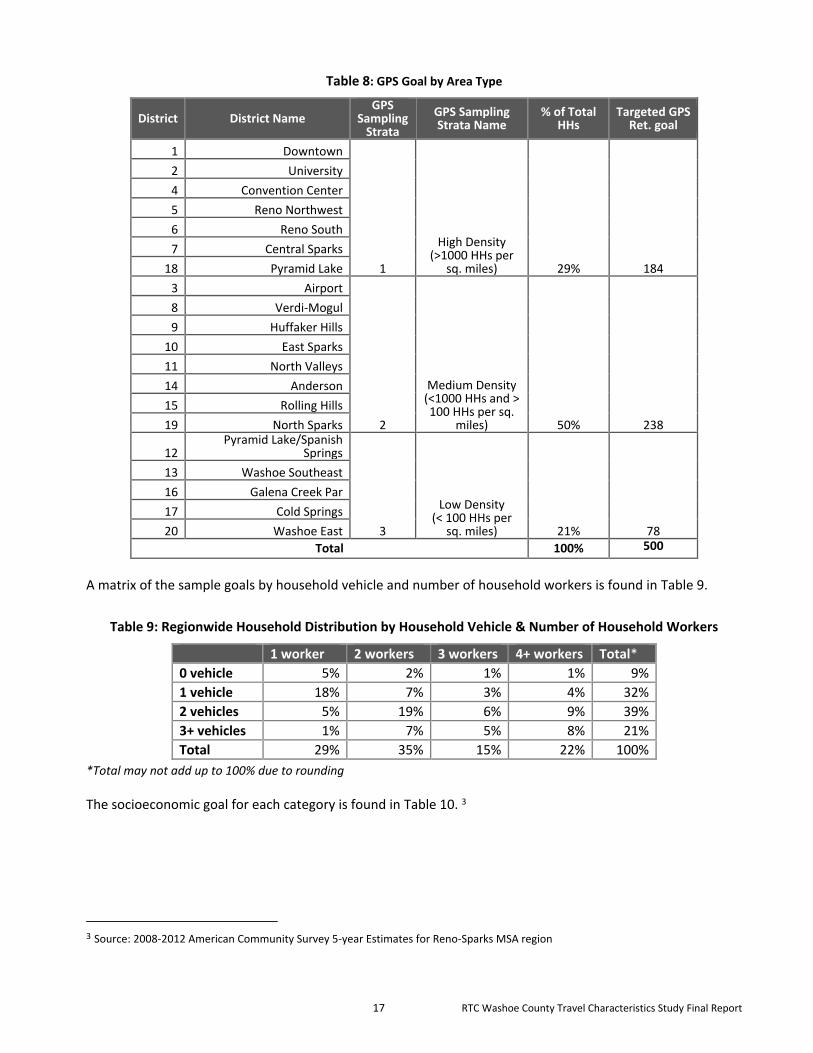
Table 8: GPS Goal by Area Type
District District Name GPS
Sampling Strata
GPS Sampling Strata Name
% of Total HHs
Targeted GPS Ret. goal
1 Downtown
1
High Density (>1000 HHs per
sq. miles) 29% 184
2 University
4 Convention Center
5 Reno Northwest
6 Reno South
7 Central Sparks
18 Pyramid Lake
3 Airport
2
Medium Density (<1000 HHs and > 100 HHs per sq.
miles) 50% 238
8 Verdi-Mogul
9 Huffaker Hills
10 East Sparks
11 North Valleys
14 Anderson
15 Rolling Hills
19 North Sparks
12 Pyramid Lake/Spanish
Springs
3
Low Density (< 100 HHs per
sq. miles) 21% 78
13 Washoe Southeast
16 Galena Creek Par
17 Cold Springs
20 Washoe East
Total 100% 500
A matrix of the sample goals by household vehicle and number of household workers is found in Table 9.
Table 9: Regionwide Household Distribution by Household Vehicle & Number of Household Workers
1 worker 2 workers 3 workers 4+ workers Total*
0 vehicle 5% 2% 1% 1% 9%
1 vehicle 18% 7% 3% 4% 32%
2 vehicles 5% 19% 6% 9% 39%
3+ vehicles 1% 7% 5% 8% 21%
Total 29% 35% 15% 22% 100%
*Total may not add up to 100% due to rounding
The socioeconomic goal for each category is found in Table 10. 3
3 Source: 2008-2012 American Community Survey 5-year Estimates for Reno-Sparks MSA region
18 RTC Washoe County Travel Characteristics Study Final Report
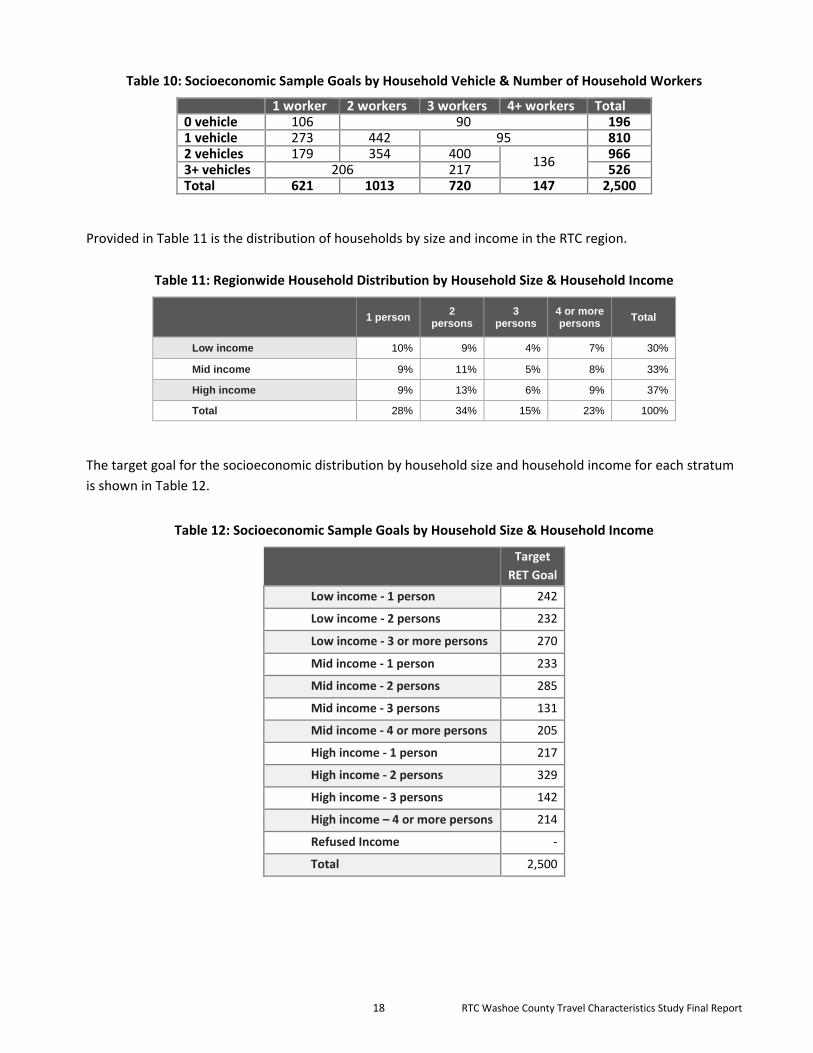
Table 10: Socioeconomic Sample Goals by Household Vehicle & Number of Household Workers
1 worker 2 workers 3 workers 4+ workers Total 0 vehicle 106 90 196 1 vehicle 273 442 95 810 2 vehicles 179 354 400
136 966
3+ vehicles 206 217 526 Total 621 1013 720 147 2,500
Provided in Table 11 is the distribution of households by size and income in the RTC region.
Table 11: Regionwide Household Distribution by Household Size & Household Income
1 person 2
persons 3
persons 4 or more persons
Total
Low income 10% 9% 4% 7% 30%
Mid income 9% 11% 5% 8% 33%
High income 9% 13% 6% 9% 37%
Total 28% 34% 15% 23% 100%
The target goal for the socioeconomic distribution by household size and household income for each stratum
is shown in Table 12.
Table 12: Socioeconomic Sample Goals by Household Size & Household Income
Target
RET Goal
Low income - 1 person 242
Low income - 2 persons 232
Low income - 3 or more persons 270
Mid income - 1 person 233
Mid income - 2 persons 285
Mid income - 3 persons 131
Mid income - 4 or more persons 205
High income - 1 person 217
High income - 2 persons 329
High income - 3 persons 142
High income – 4 or more persons 214
Refused Income -
Total 2,500

19 RTC Washoe County Travel Characteristics Study Final Report
Listed households within one-quarter mile of a transit station (potential transit households) were drawn from
the targeted census tracts. Figure 4 presents the transit oversampling area for the RTC HHTS.
Figure 4: Transit Oversampling area
The targeted sociodemographic distribution for the study area may be found in Table 13.

20 RTC Washoe County Travel Characteristics Study Final Report
Table 13: Sociodemographic Distribution for the Study Area
Total Counts % Counts
Household Size
(ACS 2010-2014)
1 48,726 29.6%
2 57,075 34.7%
3 23,739 14.4%
4 or more 34,921 21.2%
Total 164,461 100.0%
Household Vehicle
Ownership
(ACS 2010-2014)
0 13,349 8.1%
1 54,557 33.2%
2 62,112 37.8%
3 or more 34,443 20.9%
Total 48,726 29.6%
Household Workers
(ACS 2010-2014)
0 43,846 26.7%
1 66,195 40.2%
2 45,476 27.7%
3 or more 8,944 5.4%
Total 164,461 100.0%
Household Income
(ACS 2010-2014)
<$25K 38,560 23.4%
$25K-$50K 32,284 19.6%
$50k-$75K 37,383 22.7%
$75K-$100K 20,704 12.6%
$100K+ 35,530 21.6%
Total 164,461 100.0%
Hispanic Status of Residents
(ACS 2010-2014)
Hispanic 98671 22.9%
Non-Hispanic 331314 77.1%
Total 429,985 100.0%
Age of Residents
(ACS 2010-2014)
<20 yrs 109,790 25.5%
20 – 34 yrs 92,176 21.4%
35 – 44 yrs 54,288 12.6%
45 – 54 yrs 60,141 14.0%
55 – 64 yrs 56,111 13.0%
65+ yrs 57,479 13.4%
Total 429,985 100.0%
21 RTC Washoe County Travel Characteristics Study Final Report
6.0 Survey Methods
This section describes the main survey methods. Following a brief discussion of the changes made to the main
survey as a result of the RTC HHTS pilot study, the final survey design is presented in detail. Discussions of the
following specific aspects of the survey methods are then presented: proxy reporting, call backs, refusals, hotline,
handling non-English speaking households, interviewer training, incentives, definition of a completed household,
respondent burden, and sample management. Survey outreach to hard-to-reach populations and ongoing quality
control complete the survey methods.
6.1 Survey Pilot
The pilot study was conducted from June 3rd to July 31st, prior to the full study, in order to assess respondent
reaction to the survey and to confirm that the survey questions yielded the desired data. All households were
mailed a postcard notifying them of the upcoming survey and offering some basic information about the survey,
as well as information to complete the survey online. Respondents were offered two modes to complete the
recruitment interview: CATI and web. Retrieval options were: mail back of diaries; web; or CATI. A toll-free
hotline was available for respondents to call with questions about the survey. A technical support telephone
number was provided for GPS and RouteScout participants to call if they required technical assistance. The pilot
study was conducted in English only to effectively test the survey instruments prior to any translations.
The original pilot sampling plan targeted a total of 138 completes be collected. Of these, 100 were to be non-
GPS, proportionately distributed among 20 geographic sampling strata. For the pilot study, there were no set
goals by district or by socioeconomic characteristics of household. In addition, 28 percent of the sample, or 38
households throughout the whole study area, were selected to complete the pilot using either the smartphone
GPS data collection app (19 households) or GPS data loggers (19 households). A total of 106 households
completed both the recruitment and retrieval interviews: 76 non-GPS households; 17 GPS households; and 13
RouteScout households.
Participating households were required to complete a traditional travel diary, and had the opportunity to enter
their travel information via the RTC Survey website, in lieu of completing a paper diary. The data collected for the
2015 RTC Washoe County Regional Travel Characteristics Pilot Study provided travel characteristics data for a
typical weekday (Tuesday through Thursday) in the Washoe County Metropolitan Planning Area. The first
assigned travel day was June 16th, and the last assigned travel day was July 2nd. This data collected also included
information on household travel characteristics, demographics, and socioeconomic situations. NuStats’
geocoding tool, NuTripXTM (NTX), was utilized for geocoding all trips. For households that reported their travel
information to one of our interviewers via CATI, those interviewers entered the household’s information into
NTX real-time. Households that self-reported their travel information online used NTX as well. Households
requiring assistance with NTX were able to call NuStats’ toll-free hotline and one of our interviewers would
provide assistance.
The processed pilot sample was divided into individual replicates by sample type (matched non-GPS, matched
GPS, unmatched non-GPS, and unmatched GPS). Each replicate is designed to contain a random representation
of the sample universe of the same sample type. For this purpose, sample replicates were designed to represent
the various household types (matched vs. unmatched or GPS vs. Non-GPS households) and were loaded into the
VOXCO system and released for dialing following the mailing of advance postcards. Given the short time-frame
for the pilot survey (three weeks) and the low match rate (32 percent), NuStats opted to send advance postcards
to all sample, not just the unmatched households.

22 RTC Washoe County Travel Characteristics Study Final Report
Retrieval calls were placed to households the day following their assigned travel day. Retrieval calls were placed
and reminder emails were sent every few days in an effort to reach households at various times of the day, and
days of the week. Average retrieval rate for the pilot study was 54 percent.
Overall, the processes in place for the pilot study performed as expected. The flow of the questions worked well.
Habitual location addresses were attempted in both recruitment and retrieval. The primary work address or
nearest cross-streets was the highest ranked item of non-response.
Initially, a total of 2,760 records of address-based sample were randomly drawn throughout the study area and
were expected to have a proportionate distribution to the number of households by district. Of the initial sample
purchase, 23 percent of the matched records ended up being ineligible for the survey. As a result of the sample
having a high percentage of ineligible records, a very low match rate (32 percent) and poor sample performance
(with only a three percent recruitment rate) NuStats made the decision to purchase additional sample that was
targeted for cell-phone only households. The additional 3,500 sample records helped NuStats reach 92 percent
of the recruitment goal.
The non-GPS households retrieved at a rate of 58 percent, which was the highest of all three modes. Both GPS
and RouteScout households were over-recruited showing an excess of 6 households recruited for GPS and 4
households above the goal for RouteScout and GPS. The retrieval rate for GPS households was 50 percent and for
RouteScout households it was 42 percent. All retrieval rates were considerably lower than the anticipated 65
percent retrieval rate.
Recommendations:
For the main study, we will add a cross-check to match employers with addresses in an effort to bring
that item of non-response down to an acceptable range.
A robust public awareness campaign will provide additional modes to ensure the public is provided
multiple opportunities to be informed of the full study.
Transit using households will be oversampled in order to ensure that the travel patterns of transit users
are adequately represented.
The capability of tracking the amount of time each household required to complete NuTripX™ was
requested to be included for the main study; however this was not able to be implemented.
Adding an over/under series of questions to ascertain a closer range of income for households refusing
to provide this information.
Two issues were identified within the retrieval database: household vehicle number was not stored
correctly for some places; and, parking data was inadvertently not collected. Both of which were
resolved for the main study.
For the main study, monitoring of zero trip percentages by interviewer is to be performed to ensure the
interviewers are appropriately gathering reported trip data, and probing when the respondent reports
no travel.
Items to be implemented in the main study that were not in place for the pilot study are:
Sample will be monitored as to appropriate district distribution
Sample will be monitored to obtain adequate data in hard-to-reach population groups (Hispanic, large,
head of household <25, low income household)

23 RTC Washoe County Travel Characteristics Study Final Report
Spanish language component will be implemented
Incentives will be offered
Notification postcards will be mailed in waves throughout the main study
Unmatched sample will be required to provide contact information (either email or phone number)
Definition of a completed household will be developed and followed
An active public awareness campaign will be implemented
6.2 Final Survey Design
The RTC HHTS pilot yielded a few recommended revisions to the recruitment instrument and one minor revision
to the retrieval instrument. Some changes did not yield the anticipated benefits, therefore, during the main
survey data collection, there were changes made to increase recruitment and retrieval rates for particular
populations, to encourage online responses, and to generally raise the overall level of response. This section
presents the final survey design and documents the changes made.
6.2.1 Main Survey Data Collection Overview
The RTC HHTS collected travel data for one full day, or 24 hour time period, from 12:00 a.m. until 11:59 p.m. on
their assigned travel day. Households that participated in the study utilizing GPS technology were tasked with
continuing to use the GPS technology for an additional six days. Assigned travel days for both non-GPS and GPS
households were Tuesday, Wednesday, or Thursday, except on government or school holidays.
The schedule for recruitment and retrieval CATI interviewing was mainly from 1:30 p.m. through 8:00 p.m. on
weekdays, 1:30 p.m. through 7:00 p.m. on Fridays, and from 11:00 a.m. through 6:00 p.m. on Saturdays. In an
effort to reach more respondents, CATI interviewing until 9:00 p.m. was implemented two evenings per week,
and for the final few weeks of data collection, CATI interviewing occurred four evenings per week (Monday,
Tuesday, Wednesday, and Thursday). On several occasions, call attempts were made beginning at 11:00 a.m. on
weekdays.
Survey respondents were provided the option of completing the recruitment and retrieval surveys via a secure
website. The online surveys followed the same general format and flow as the CATI programs used by the
interviewers. The online portion was implemented using the same VOXCO software as was used for the CATI.
Respondents accessed the online surveys from the public website, and gained access to the recruit and retrieval
applications using a unique PIN provided in the notification postcard or to recruited households during the CATI
interview.
The majority of households in the main survey were recruited through CATI, but more households were retrieved
by mail, as may be seen in Table 14. The percentage of CATI recruitment and the percentage of mail retrievals
were both significantly higher than anticipated, or budgeted. This resulted in a significant impact on the data
collection resources.
Out of 2,083 preliminary completes, 2,049 passed the quality control procedure and met the definition of
complete. The 2,049 completed surveys for the main study were combined with 105 from the pilot study,
resulting in a total of 2,154 households. Of the original 397 GPS households that returned their devices and
completed their diaries, only 225 of these had fully completed trip data and diary data. Those with fully
completed diary data, but not GPS data, were included with the non-GPS household data.
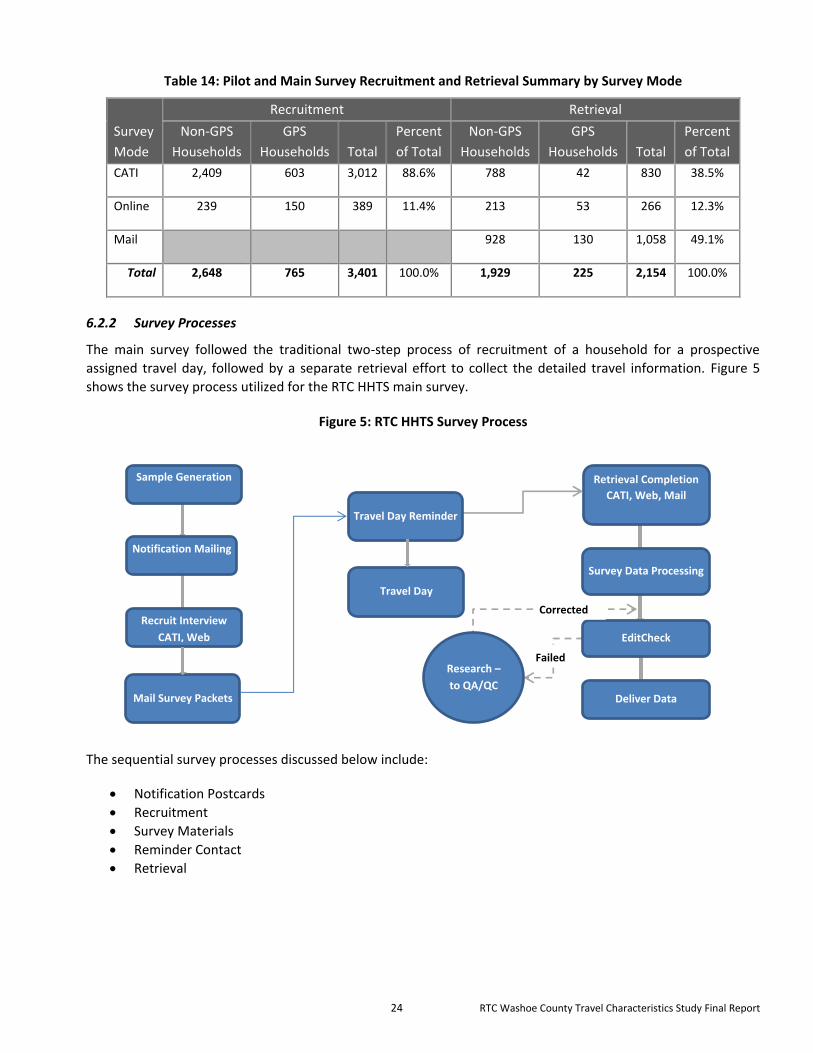
24 RTC Washoe County Travel Characteristics Study Final Report
Table 14: Pilot and Main Survey Recruitment and Retrieval Summary by Survey Mode
Survey
Mode
Recruitment Retrieval
Non-GPS
Households
GPS
Households Total
Percent
of Total
Non-GPS
Households
GPS
Households Total
Percent
of Total
CATI 2,409 603 3,012 88.6% 788 42 830 38.5%
Online 239 150 389 11.4% 213 53 266 12.3%
Mail 928 130 1,058 49.1%
Total 2,648 765 3,401 100.0% 1,929 225 2,154 100.0%
6.2.2 Survey Processes
The main survey followed the traditional two-step process of recruitment of a household for a prospective
assigned travel day, followed by a separate retrieval effort to collect the detailed travel information. Figure 5
shows the survey process utilized for the RTC HHTS main survey.
Figure 5: RTC HHTS Survey Process
The sequential survey processes discussed below include:
Notification Postcards
Recruitment
Survey Materials
Reminder Contact
Retrieval
Sample Generation
Notification Mailing
Recruit Interview
CATI, Web
Mail Survey Packets
Retrieval Completion
CATI, Web, Mail
Survey Data Processing
EditCheck
Deliver Data
Failed
Corrected
Research –
to QA/QC
Travel Day
Travel Day Reminder

25 RTC Washoe County Travel Characteristics Study Final Report
Notification Postcards
Waves of notification postcards were mailed to unmatched sample on a weekly basis throughout the fall, with
each wave consisting of approximately 5,000 postcards. The final wave of postcards was mailed December 29th,
2015. A total of 28,555 postcards were mailed. Of those, 3,263 (11 percent) were returned as undeliverable.
After the first few waves of postcards were mailed, with approximately 1,000 of them returned as undeliverable,
NuStats changed the approach to address all of the postcards to “Current Resident” rather than individual
addressees. This improved the return rate slightly, but did not completely resolve the issue. The postcard itself
went through several revisions in an effort to encourage more households to participate. Examples of these
postcards may be found in Appendix A – Examples of the Notification Postcards.
All unmatched households in the first sample order were mailed postcards. There was a high rate of returned
postcards, and a low rate of participation by households that were sent postcards. For the second sample order,
NuStats drew sample from the lagging districts of 1, 2, 3, and 7 and mailed postcards to these groups in an effort
to improve recruitment rates from those districts. The sample drawn from was unmatched sample, and resulted
in a slight improvement in recruitment rates for all four of these lagging districts.
Recruitment
There were two modes for recruitment: CATI and online. Table 15 shows the start and end dates of recruitment,
by mode and for each language used in the main survey. The Spanish language implementation lagged slightly
behind the English as it was decided to wait until the English scripts were stable before undertaking translation in
Spanish.
Table 15: Main Survey Recruitment Start and End Dates
Response Mode
START DATES END DATE
English Spanish
CATI 8/26/2015 9/23/2015 1/19/2016
Online 8/26/2015 9/23/2015 1/19/2016
Training for CATI interviewers took place in the afternoon of August 26th, 2015, immediately followed by
conducting actual interviews that evening. To maximize response and reduce confusion among family members,
during the recruitment interview, a household “reference” person was identified. This person was given the
responsibility of ensuring that all members of the household completed a travel diary and, if applicable, used the
GPS devices sent to them. At the end of the recruitment interview, this same person provided their contact
information including a mailing address to have all the survey materials sent to them to distribute to other
household members. This reference person was critical in ensuring all family members participated in the survey.
In order to ensure that the final demographic distribution was in line with the ACS data for the Reno/Sparks area,
"termination" algorithms were included in the CATI recruitment to randomly disqualify the elderly as these
households are disproportionately at home and reachable by telephone. Termination algorithms in the CATI and
online program to randomly disqualify 80% (one of every five) of elderly (where the age was defined as all
household members were 65 or above) for both GPS and non-GPS recruitment, were implemented in October,
2015.
The average length of the CATI recruitment interview was just over 19 minutes.

26 RTC Washoe County Travel Characteristics Study Final Report
Survey Materials
Following recruitment, a packet of survey materials was custom assembled for each recruited household. For non-GPS households, the material contained either the English or Spanish versions of the following:
A personalized survey cover letter, signed by the RTC project manager;
Separate travel diaries for each member of the household, with the name and PIN on each diary;
A postage-paid return envelope.
Examples of the non-GPS survey materials may be found in Appendix E – Non-GPS Survey Materials.
Recruited RouteScout households received the above materials, along with instructions on how to download and
use RouteScout, and a daily record card to check off if they took their Smartphone with them everywhere they
went each day for the seven days of the travel period. Examples of the RS survey materials may be found in
Appendix G – RouteScout Survey Materials.
Recruited GPS households received a box containing all of the above, plus the relevant GPS equipment and
instructions for use. The boxes were pre-labeled with a postage-paid label making it easy for respondents to
return the equipment to NuStats. Households recruited for GPS also received a daily record card to check off if
they took their GPS technology with them everywhere they went each day for the seven days of the travel
period. Examples of the GPS survey materials may be found in Appendix F – GPS Survey Materials.
Only 28 households requested at the end of the recruitment interview to receive the Spanish version of the
survey package. This is less than one percent of the recruited households, and indicates that the majority of
Hispanic households in the RTC HHTS preferred the English versions.
Retrieval
There were three modes for a household to provide travel information: by CATI, online or by mailing back the
completed diary and, for GPS households, the completed daily record card. Table 16 presents the start and end
dates of retrieval for CATI and online, by language. The last day for receipt of mailed back diaries was February
27, 2016.
Table 16: Main Survey Retrieval Start and End Dates
Response Mode
START DATES END DATE
English Spanish
CATI 9/9/2015 11/4/2015 2/27/2016
Online 9/9/2015 11/4/2015 2/27/2016
Mail 2/27/2016
CATI retrieval of travel diary information began on the day following the assigned travel day. Households that
had chosen to complete retrieval by web were not called the day following the travel day, but were allowed 2-3
days to complete by web. According to callback rules, this sample remained closed and was only released 2-3
days later if the household had not completed by web. These data were collected using a Voxco CATI program
that is linked to NuTripX™—an interactive mapping program for online geocoding. All geocoding is performed in
real-time via NuTripX™ (NTX) which is web-based and can be used by the respondent on the web or by a
telephone interviewer (CATI). The screenshot shown in Figure 6 provides an example of interactive real-time
geocoding with logical trip sequencing. All address data was geocoded to the current X-Y coordinates. Once the
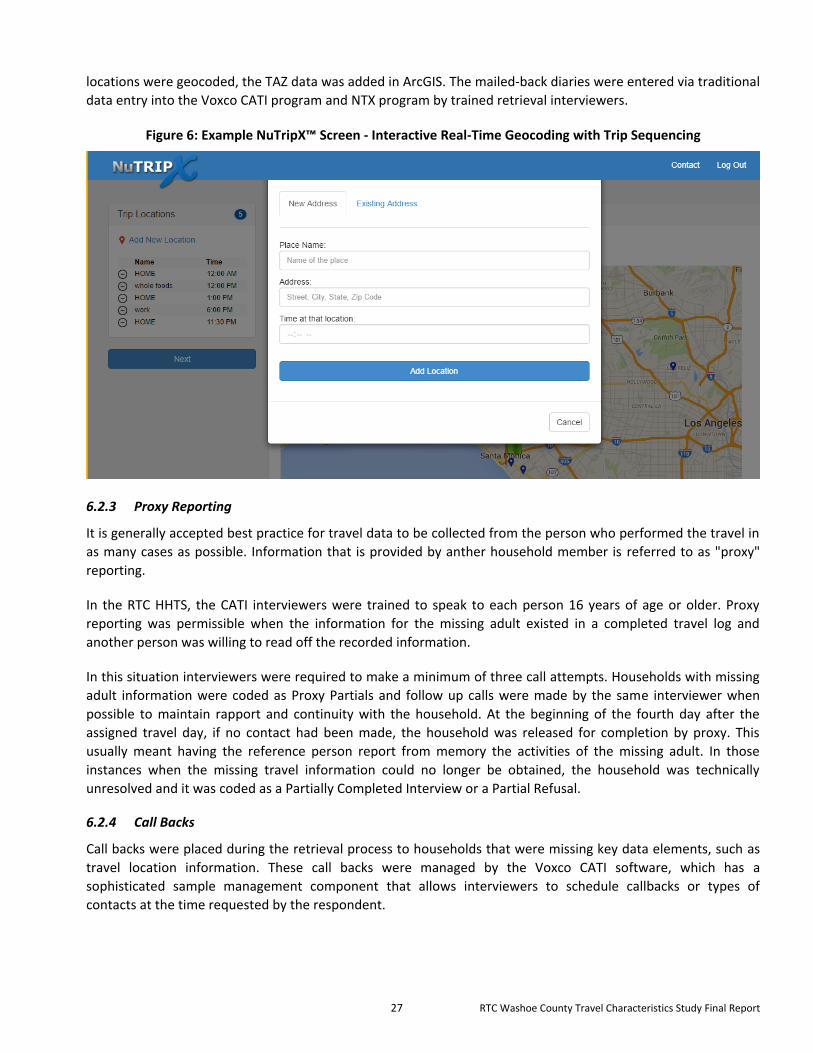
27 RTC Washoe County Travel Characteristics Study Final Report
locations were geocoded, the TAZ data was added in ArcGIS. The mailed-back diaries were entered via traditional
data entry into the Voxco CATI program and NTX program by trained retrieval interviewers.
Figure 6: Example NuTripX™ Screen - Interactive Real-Time Geocoding with Trip Sequencing
6.2.3 Proxy Reporting
It is generally accepted best practice for travel data to be collected from the person who performed the travel in
as many cases as possible. Information that is provided by anther household member is referred to as "proxy"
reporting.
In the RTC HHTS, the CATI interviewers were trained to speak to each person 16 years of age or older. Proxy
reporting was permissible when the information for the missing adult existed in a completed travel log and
another person was willing to read off the recorded information.
In this situation interviewers were required to make a minimum of three call attempts. Households with missing
adult information were coded as Proxy Partials and follow up calls were made by the same interviewer when
possible to maintain rapport and continuity with the household. At the beginning of the fourth day after the
assigned travel day, if no contact had been made, the household was released for completion by proxy. This
usually meant having the reference person report from memory the activities of the missing adult. In those
instances when the missing travel information could no longer be obtained, the household was technically
unresolved and it was coded as a Partially Completed Interview or a Partial Refusal.
6.2.4 Call Backs
Call backs were placed during the retrieval process to households that were missing key data elements, such as
travel location information. These call backs were managed by the Voxco CATI software, which has a
sophisticated sample management component that allows interviewers to schedule callbacks or types of
contacts at the time requested by the respondent.
28 RTC Washoe County Travel Characteristics Study Final Report
The next step in the survey process was an automated EditCheck system (described in Section 6.4). Households
that did not pass the edit checks and needed additional corrections or follow-up were handled by the Quality
Assurance research team. The research team conducted a thorough review of each record and initiated a follow-
up or call back with the main respondent of the household to clarify any missing data or data discrepancy. If the
research team was unable to reach the household, they left a message to call the hotline to confirm information
about their reported travel. If an email address was provided, an email message was sent requesting the
respondent call the research team to confirm information about their reported travel.
6.2.5 Refusals
Each respondent has a unique set of factors to consider when making the decision to participate in a survey.
Some respondents are concerned with the legitimacy of the research, others want to make sure their privacy is
protected, some want to make certain there is a clear benefit to participation (to themselves, their community,
or society in general), and still others are concerned about the time and burden of the study. Regardless of their
primary concern, all respondents are more likely to participate when contacted by a professional, persuasive,
and engaging interviewer.
In addition to teaching interviewers to use the characteristics of their voices for sounding upbeat and engaging,
the interviewer training focused on teaching interviewers to “read” respondents and tailor their replies to
respondent questions and objections based on the undermining concerns. Remaining professional at all times as
well as friendly and courteous are considered crucial elements at gaining and maintaining cooperation from
respondents. Interviewers were always taught to be tactful, pleasant, sincere, and well prepared.
Interviewers were also trained to provide additional information about the study to handle a call where the
respondent sounded insecure and showed a lack of understanding about the study even after an explanation
was given. In addition to learning best practices, interviewers were trained to leave detailed interviewer notes in
the records. It was critical that interviewers document the "facts" for full understanding of the situation in case
the respondent was very difficult or threatening during the call and later wanted to complain about the study or
the phone call.
Refusal avoidance and refusal turn around skills are more critical during the retrieval stage. At the retrieval stage,
much time and effort had been spent in recruiting the household and in mailing them materials for their
participation. This is why not just one but a series of refusal conversion attempts was made, each followed by a
resting period. These attempts were often successful, especially when the calls were made by seasoned
interviewers that had experience working with difficult cases.
6.2.6 Hotline
A toll-free hotline was maintained for the RTC HHTS. The hotline was available 24 hours a day, 7 days a week.
This hotline was covered by one of NuStats interviewers that was specifically trained on all aspects of the RTC
Travel Characteristics Survey and was dedicated to answer this line real-time from 4pm–8pm PST weekdays and
12pm–6pm PST Saturdays. Due to a few issues, the hotline was not always answered real-time during these time
frames, and instead callers that left messages were called back as quickly as possible. A total of 454 calls were
managed by our hotline team. The reasons for the calls may be found in Table 17.

29 RTC Washoe County Travel Characteristics Study Final Report
Table 17: Hotline Call Summary
Reason for Call Count % of Total
Opting out 94 21%
Hung up 112 25%
Called to participate in survey 24 5%
Returned our call 64 14%
Needed on line help 18 4%
Had not received materials 8 2%
Wanted to be re-scheduled 18 4%
Called to report travel 4 1%
Help completing diary 31 7%
Has mailed completed diaries in 7 2%
Household will mail in diaries 1 0%
Called to provide missing information 1 0%
Incentive Questions 15 3%
Other 57 13%
Total Calls 454 100.0%
6.2.7 Non-English Speaking Households
The main survey was conducted in Spanish as well as in English. NuStats provided a team of experienced bilingual
interviewers who were trained to conduct interviews in Spanish as requested by respondents. Households that
requested the interviews be conducted in Spanish were either routed to one of the bilingual interviewers or, if
one was not available, the household was coded as requiring a Spanish call back. Interviews in Spanish tended to
be longer than those in English as interviewers had to explain concepts that sometimes were harder to relate to
for some of these respondents. A team of bilingual supervisors was tasked with daily monitoring duties to ensure
interviewing protocols were met in Spanish just as well as they were in the main English survey.
Households that were monolingual in languages other than English or Spanish were coded with a "Language
Barrier" call disposition, thanked and not included in the survey. There were 108 such households in the main
survey, as may be calculated from the recruitment sample disposition table (Table 40). This equates to less than
one-half of one percent of all sampled households. This represents all languages other than English and Spanish,
which in the Reno/Sparks area may include Chinese, Tagalog, Other Pacific Island languages, German, Korean,
and many more.
6.2.8 Interviewer Training
All telephone interviewers and hotline staff were rigorously trained to ensure delivery of the highest quality data.
The production and quality teams worked closely with the interviewers, the project manager and programming
team to evaluate sample and interviewer performance, and implement changes where it was deemed necessary.
These efforts resulted not only in high quality data, but also ensured all sample was adequately worked.
All RTC interviewers were trained according to Marketing Research Association (MRA) standards. The rigorous
training program at NuStats included not only the technical aspects such as using the CATI interviewing programs
and phone system, but also how to convey the importance and legitimacy of the survey, techniques for
overcoming respondent’s refusals, and maintaining professionalism at all times. In addition, RTC project-specific
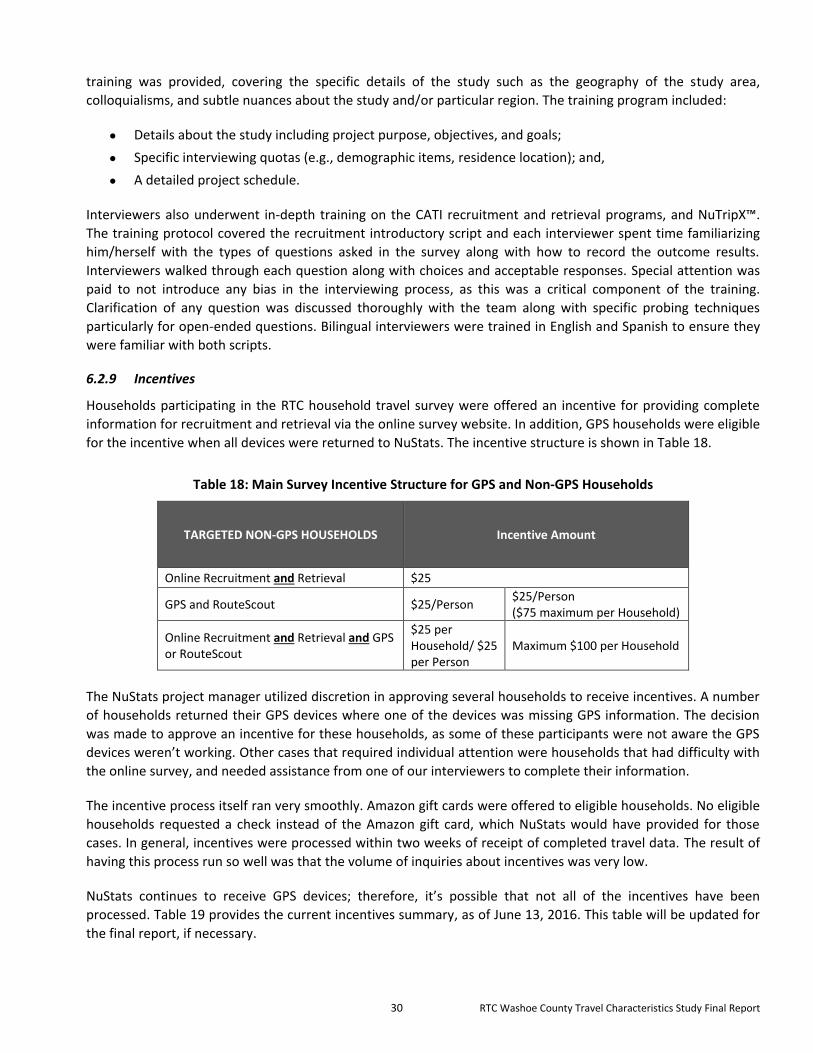
30 RTC Washoe County Travel Characteristics Study Final Report
training was provided, covering the specific details of the study such as the geography of the study area,
colloquialisms, and subtle nuances about the study and/or particular region. The training program included:
Details about the study including project purpose, objectives, and goals;
Specific interviewing quotas (e.g., demographic items, residence location); and,
A detailed project schedule.
Interviewers also underwent in-depth training on the CATI recruitment and retrieval programs, and NuTripX™.
The training protocol covered the recruitment introductory script and each interviewer spent time familiarizing
him/herself with the types of questions asked in the survey along with how to record the outcome results.
Interviewers walked through each question along with choices and acceptable responses. Special attention was
paid to not introduce any bias in the interviewing process, as this was a critical component of the training.
Clarification of any question was discussed thoroughly with the team along with specific probing techniques
particularly for open-ended questions. Bilingual interviewers were trained in English and Spanish to ensure they
were familiar with both scripts.
6.2.9 Incentives
Households participating in the RTC household travel survey were offered an incentive for providing complete
information for recruitment and retrieval via the online survey website. In addition, GPS households were eligible
for the incentive when all devices were returned to NuStats. The incentive structure is shown in Table 18.
Table 18: Main Survey Incentive Structure for GPS and Non-GPS Households
TARGETED NON-GPS HOUSEHOLDS Incentive Amount
Online Recruitment and Retrieval $25
GPS and RouteScout $25/Person $25/Person ($75 maximum per Household)
Online Recruitment and Retrieval and GPS or RouteScout
$25 per Household/ $25 per Person
Maximum $100 per Household
The NuStats project manager utilized discretion in approving several households to receive incentives. A number
of households returned their GPS devices where one of the devices was missing GPS information. The decision
was made to approve an incentive for these households, as some of these participants were not aware the GPS
devices weren’t working. Other cases that required individual attention were households that had difficulty with
the online survey, and needed assistance from one of our interviewers to complete their information.
The incentive process itself ran very smoothly. Amazon gift cards were offered to eligible households. No eligible
households requested a check instead of the Amazon gift card, which NuStats would have provided for those
cases. In general, incentives were processed within two weeks of receipt of completed travel data. The result of
having this process run so well was that the volume of inquiries about incentives was very low.
NuStats continues to receive GPS devices; therefore, it’s possible that not all of the incentives have been
processed. Table 19 provides the current incentives summary, as of June 13, 2016. This table will be updated for
the final report, if necessary.
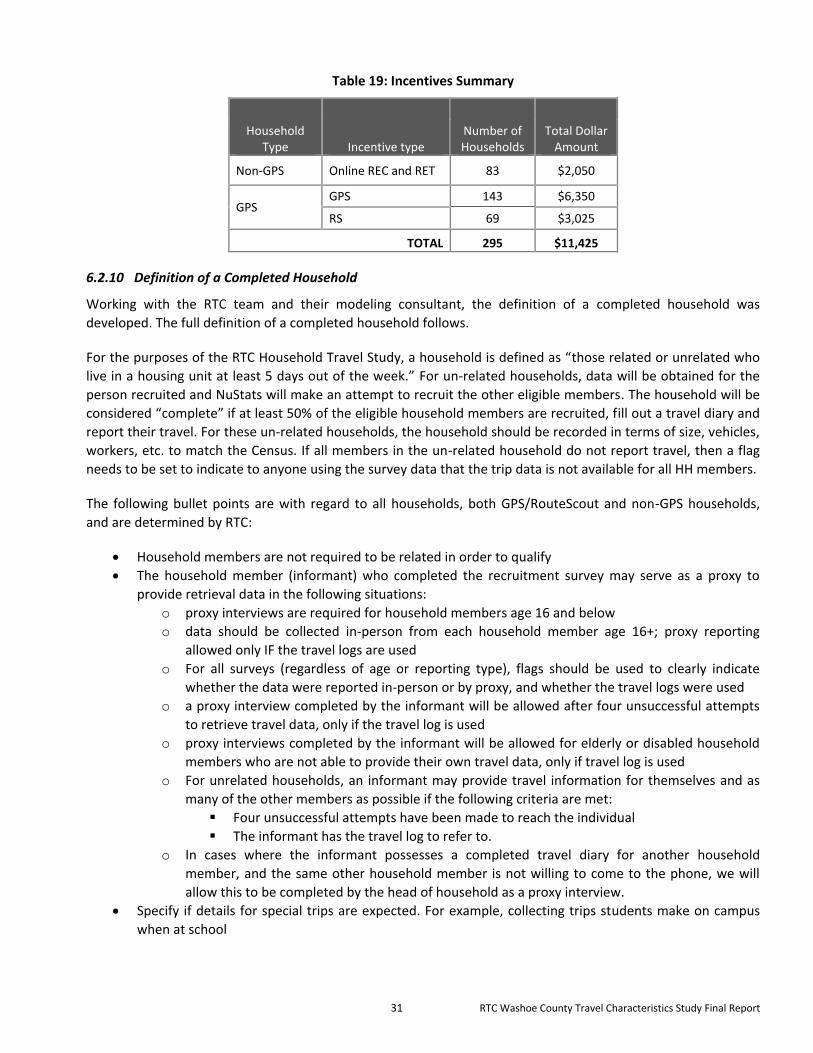
31 RTC Washoe County Travel Characteristics Study Final Report
Table 19: Incentives Summary
Household Type Incentive type
Number of Households
Total Dollar Amount
Non-GPS Online REC and RET 83 $2,050
GPS GPS 143 $6,350
RS 69 $3,025
TOTAL 295 $11,425
6.2.10 Definition of a Completed Household
Working with the RTC team and their modeling consultant, the definition of a completed household was
developed. The full definition of a completed household follows.
For the purposes of the RTC Household Travel Study, a household is defined as “those related or unrelated who
live in a housing unit at least 5 days out of the week.” For un-related households, data will be obtained for the
person recruited and NuStats will make an attempt to recruit the other eligible members. The household will be
considered “complete” if at least 50% of the eligible household members are recruited, fill out a travel diary and
report their travel. For these un-related households, the household should be recorded in terms of size, vehicles,
workers, etc. to match the Census. If all members in the un-related household do not report travel, then a flag
needs to be set to indicate to anyone using the survey data that the trip data is not available for all HH members.
The following bullet points are with regard to all households, both GPS/RouteScout and non-GPS households,
and are determined by RTC:
Household members are not required to be related in order to qualify
The household member (informant) who completed the recruitment survey may serve as a proxy to
provide retrieval data in the following situations:
o proxy interviews are required for household members age 16 and below
o data should be collected in-person from each household member age 16+; proxy reporting
allowed only IF the travel logs are used
o For all surveys (regardless of age or reporting type), flags should be used to clearly indicate
whether the data were reported in-person or by proxy, and whether the travel logs were used
o a proxy interview completed by the informant will be allowed after four unsuccessful attempts
to retrieve travel data, only if the travel log is used
o proxy interviews completed by the informant will be allowed for elderly or disabled household
members who are not able to provide their own travel data, only if travel log is used
o For unrelated households, an informant may provide travel information for themselves and as
many of the other members as possible if the following criteria are met:
Four unsuccessful attempts have been made to reach the individual
The informant has the travel log to refer to.
o In cases where the informant possesses a completed travel diary for another household
member, and the same other household member is not willing to come to the phone, we will
allow this to be completed by the head of household as a proxy interview.
Specify if details for special trips are expected. For example, collecting trips students make on campus
when at school

32 RTC Washoe County Travel Characteristics Study Final Report
All locations visited must be 100% geocoded to either: full address, cross-streets, or place (single street
or place centroid)
No more than 5% missing and/or coded non-response data from a trip record, except for the data listed
below for which every record needs to display valid information in order for the survey record to be
considered complete:
o origin zone
o destination zone
o trip purpose from
o trip purpose to
o arrival time
o departure time
o time spent at activity
o origin and destination locations and place type
o mode
No more than 15% missing income
o no more than 5% with no data at all (modeler requests an over/under option be included i.e. ,
“can you tell me if your income is above or below 75k”, if below 75k, “can you tell me if it is
above or below 35k”)
Exceptions for large households:
o Households with 4+ persons -- no more than 10% will have travel missing for one person.
o Households with 5+ persons -- no more than 10% will have travel missing for two persons.
The following points are specific to GPS and RouteScout (RS) households.
GPS devices and diaries are provided for all household members aged 12 and above. Household
members below the age of 12 are provided diaries only. Diaries are provided to all members of RS
households. Household members aged 12 and above participate in the study using RS and will also
complete a diary. Household members below the age of 12 will complete a diary only. The travel period
for GPS/RS households is a full seven day period, with the first day of the travel period being the assigned
travel day. A household is considered to be a GPS/RS/diary complete if:
o Travel is reported for all household members by mail, web, or phone with complete information
as specified above
o GPS devices are used on the assigned travel day for at least two persons provided with GPS
devices, and for only one person if only one GPS device provided
If travel was reported for a GPS person, then at least one GPS trip should have been
captured by that person
If no travel was reported for a GPS person, then it is okay if there are no GPS trips
captured on that day by that person
o All devices are returned
6.2.11 Respondent Burden
Table 20 below presents the average length of time, in minutes, for a respondent to complete the recruitment
and retrieval portions of the survey, by response mode. The mail response mode was estimated based on the
amount of time our staff needed to enter the diaries for each household. Since our data entry staff is well versed
in completing household travel diaries, it is likely the respondents themselves needed a few minutes more than
15, but we do not have a way to report that amount of time.

33 RTC Washoe County Travel Characteristics Study Final Report
Table 20: Average Time in Minutes to Complete the Main Survey
RESPONSE MODE
RECRUITMENT RETRIEVAL
CATI 19.2 25
Online 30 35
Mail 15
6.2.12 Sample Management
Sample management concerns those aspects of data collection management involving the availability and
release of households (samples) in the project database to the appropriate next step in the survey process for
that household. Much of the sample involves the management efforts of the data collection team. This included
looking at the characteristics of the sample and making adjustments to maximize productivity and response,
including review of live/non-final sample to determine how much new sample, relatively fresh sample (only a
few call attempts), and older sample was available. It also included ensuring that all callbacks, including
recruitment and retrieval programs and all specialized or target sample including GPS households, were properly
loaded in Voxco and allocated to staff, including calls that may have been scheduled from online recruitment
mode.
NuStats staff oversaw and facilitated quota management for all modes of data collection on an on-going, real-
time basis through the Voxco Command Center program. Quotas and strata were constantly checked to ensure
that they were filling proportionately. This aspect of the Voxco interviewing software is critical in launching
complex, large household studies such as the RTC HHTS because it provides an efficient, low-risk method for
centralized, timely tracking and adjustments of sample. When necessary, sample was assigned with priority to
generate completes in lagging quota cells.
In addition to sample and quota management, the team closely tracked and managed productivity, production
levels, and schedules on an hourly basis. If productivity was lagging, staff troubleshot project performance and
worked quickly to identify the cause(s) and rectify the issue(s). Proper quota and production management for
large studies such as the RTC HHTS are heavily reliant on real-time, constant sample management so production
task leads were tracking, coordinating, and reporting on sample performance indicators with other key project
team members on a regular basis.
Recruitment Sample Protocols
For the RTC household travel study, sample was divided into individual replicates of 500 samples each. Each
replicate contained a random representation of the sample universe. The value of using replicates to manage
sample was in having the ability to fully work through sample within each replicate before moving on to the next
one. This allowed the data collection team to maximize sample performance before releasing new sample to the
mix.
The RTC recruitment program contained standard call outcomes and some project specific codes as well.
Interviewers were trained to follow specific protocols in coding call outcomes correctly. Each interviewer was
assigned an interviewer identity number to access the program. This allowed for each call record to be tracked to
the interviewer for review, feedback and coaching opportunities as needed. This was a valuable tool used to
identify interviewers that needed help with refusal avoidance techniques or other areas that could be identified
by running interviewer performance statistics.
34 RTC Washoe County Travel Characteristics Study Final Report
A minimum of eight attempts to valid numbers resulting in a no contact were made before finalizing a sample
record. This protocol was adjusted throughout the duration of the project, for example, to increase the level of
effort in lagging areas. In some of the hard to reach areas sample was rested for a long period of time and re-
attempted later in the project.
One other aspect of sample management was the "rest-and-recycle" technique for non-responsive households.
After eight attempts without being able to contact a household, those samples were "rested" for a period of a
few weeks and then were recycled back into the active sample pool for re-calling and re-contacting.
Retrieval Sample Protocol
A key element to consider when discussing sample management and the retrieval stage is the Production
Schedule. The Production Schedule contained the list of all valid travel dates for the duration of the project. This
schedule dictated when sample needed to be available for reminder calls and when it needed to be available for
retrieval calls.
Sample management for retrieval was an on-going and hands on task that often times required supervisory and
management staff to discuss sample segments or even specific households on the best approach to finalize the
household. Some of the considerations taken into account included whether the household had been called
during the day of the week and time of the day when the recruitment interview took place, whether calls had
been spread out across times of the day and days of the week, whether any or too many messages had been left,
or whether the household needed to be finalized as non-completed and needed to be replaced.
When email addresses were available, the NuStats team sent reminder email messages asking the participants to
log onto the survey website to complete their travel information. These email messages were sent on a weekly
basis to non-responsive households to whom several call attempts had been placed without contact, and that
had not completed their travel information online, or had not refused to participate. An example of one of these
reminder emails is shown in the text box below. The final two email reminders included a note that the deadline
for receipt of travel information was February 27th, 2016.
On the same schedule as the reminder emails, text messages were sent to non-responsive households to whom
several call attempts had been placed without making contact, and that had not completed their travel
information online, or had not refused to participate. Due to the desire to limit the text message to be received
in one message window, the text was kept under 110 characters. An example of one of these text messages is
found in the following text box.
SUBJECT LINE: RTC Household Travel Survey Reminder (DO NOT DELETE)
PIN: «PINNO»
Dear «RFNAM»,
Thank you for participating in the Regional Transportation Commission – Washoe County Household Travel Characteristics Survey! Our records indicate you have not yet submitted your travel information from your travel date of «TDAY». If you would like assistance with completing your diary/diaries, please contact NuStats toll-free at 877-221-7828 and one of our telephone representatives will be happy to assist you. If you would like to complete the survey online, please visit www.RTCSurvey.com and enter your PIN («PINNO») to report your travel.
Best Regards,
The RTC Travel Survey Team
35 RTC Washoe County Travel Characteristics Study Final Report
The Strata and Quotas definition module in Voxco allowed NuStats to manage subsets of the sample and to open
or close access to any stratum or subset as needed. It also allowed NuStats to apply goals or ceilings to monitor
the number of completed interviews by stratum, and the rate at which they were attained.
This module was used for tracking goals and sample management by assisting in the release or withholding of
specific sample segments. Many of the sample management activities already described were made possible by a
specific strata definition that existed in the Quota Management module. The starting point of making this sample
control tool work was to specify a set of criteria or strata, upon which sample controls were to be applied.
6.3 Public Awareness
The following strategies and activities were planned and implemented on behalf of the RTC Washoe County
Travel Study:
Household Travel Survey
Informational community outreach interviews were planned and aired on local ABC affiliate, KOLO-TV News (air times coincided with prime time news, in both the morning and evening, and also during the mid-day news).
News releases and media advisories were researched, written and distributed in partnership with the RTC Public Information Team.
NuStats team followed-up with all media contacts regarding the news release.
Continuous media relations were conducted throughout the ongoing surveys and overall study.
Mentions of the overall study appeared on all three main news networks (including ABC KOLO-TV, NBC KRVN-TV, and CBS KTVN-TV).
Social media outreach was planned and implemented in conjunction with the RTC Public Information Team; including posting of the informational interviews that originally aired on ABC affiliated, KOLO-TV.
Distribution of e-mail blasts to local Chambers of Commerce and selected community organizations.
6.4 Quality Control
The following quality control protocols were implemented for the RTC household travel study data collection
team:
A comprehensive Interviewer-training (specifically focused on understanding and proper delivery of the CATI
questionnaire)
Adherence to CASRO guidelines
Expert program design input and detailed and redundant program testing
Dedicated, tenured team of Managers, Trainers, Supervisors and Interviewers.
On-site and off-site monitoring of interviewers’ efforts by project-specific QC leaders. Monitoring capability
used with options of providing instant messaging feedback during live calls.
On-going, constant dual data reviews being conducted by data collection leaders and by NuStats data
cleaning team throughout the entire data collection period.
Please visit www.RTCSurvey.com and enter your PIN
«PINNO» to report your travel. NuStats - 877-221-7828.

36 RTC Washoe County Travel Characteristics Study Final Report
Electronic tracking of interviewers’ performance – dialing statistics, completed interviews, refusals, non-
contacts, average interview lengths.
Live, full monitoring of CATI interviews led by project-dedicated Quality Control Managers and Supervisors were
conducted as the cornerstone of the QC process for this study. Full monitoring sessions, where a conversation
between an interviewer and a respondent is not only heard but also viewed through remote visual monitoring,
were the most efficient and reliable method for ensuring that Interviewers were reading scripts verbatim as well
as accurately recording all data provided by respondents. Following industry guidelines, a minimum of 10% of all
CATI completes were monitored or validated. Monitoring sessions were also used to provide on-going
supplementary training to interviewers as well as to validate the accuracy of the real-time entry. For each
monitoring session, interviewers were evaluated on the following criteria: dialing rate, effective use of time,
professionalism, gaining cooperation, disposition coding, contact procedures, reading verbatim, neutral delivery,
effective probing, pacing and focus, and accurate data entry. In addition, for retrieval the primary QC focus was
on trip collection, probing for missed trips, and the accuracy of the collection of address details.
In addition, dual project data reviews were also a key part of the overall QC process. On a shift-by-shift basis, the
NuStats QC team actively checked data within the dialing program for completeness on key criteria. This was
followed by full-scale automated data checks by NuStats data staff to confirm that data met the required
specifications. This dual system helped ensure that the NuStats QC team was able to quickly correct any potential
data issues and to also administer immediate remedial training for specific Interviewers.

37 RTC Washoe County Travel Characteristics Study Final Report
7.0 Global Positioning System (GPS) Subsample
7.1 Overview
The purpose of the GPS component of the RTC Travel Characteristics Study (RTCS) was to collect detailed
information about all trips made by the GPS subsample and to estimate levels of trip underreporting in this
subsample that can be applied to the larger, non-GPS sample. The following section summarizes the GPS data
collection results for the GPS/Diary Complete households (as defined by the updated GPS and diary completion
rules). All households that reported travel by January 26, 2016 are included. With a target goal of obtaining 500
GPS complete households, it was estimated that at least 800 households would need to be recruited.
Recruitment for the study concluded on January 19, 2016. There were 602 households recruited into the GPS
component of the study, which was below the target goal. A split design was implemented, with some
households receiving dedicated wearable GPS devices (loggers) and other households receiving the RouteScout
App to load on their own Smartphone. The GPS devices or RouteScout software were to be used for seven days,
with the first day coinciding with the assigned diary travel day.
This split technology design allowed for the collection of seven days of highly accurate trip data with minimal
respondent burden. Households selected for the GPS component were deployed for seven days, with all
household members age 12 and above receiving GPS equipment. Local deployment personnel shipped and
received returned equipment from/to their home. As GPS devices were returned by GPS households and data
were received from the server for RouteScout households, the data were downloaded and posted to a secure
portal for processing by PlanTrans.
PlanTrans, as a subcontractor to NuStats, was responsible for managing and processing the GPS component of
this survey.
There are some interesting results from the GPS component that may be useful for the RTC for future planning of
surveys and related issues. First, the average trip rates for households that were recruited for the GPS survey and
eventually used in the matching are 5.31 trips per person on the diary day from the GPS devices/software and
4.86 trips per person on the diary day recorded in the diaries. However, there are differences between those
who used the RouteScout software and those who used the GPS devices as shown in Table 21. Because both the
diary and GPS for RouteScout participants show a higher trip rate, it appears that those who accepted the
RouteScout software are more mobile than those who used the GPS loggers. Interestingly, the underreporting
percentage is about half by RouteScout of that by GPS logger (5.2 percent compared to 11.6 percent).
Table 21: Trip Rates for the GPS and RouteScout Samples
Trip Rate Source GPS Logger RouteScout Total
GPS 4.97 6.06 5.31
Diary 4.45 5.76 4.86
Table 22 shows the number of trips recorded by GPS by day of week, the number of days recorded, and the
average trip rates by day of week. The table shows that the number of days recorded by day of week was least
for Sundays and greatest for Thursdays. The trip rate is highest on Saturdays and lowest on Tuesdays, and among
the weekdays, there is a rise from Tuesday through Friday, with Monday showing a marginally higher trip rate
than Tuesday. The weekend days show the highest trip rates, with Saturday at 6.76 trips per person per day and
Sunday at 5.37 trips per person per day.
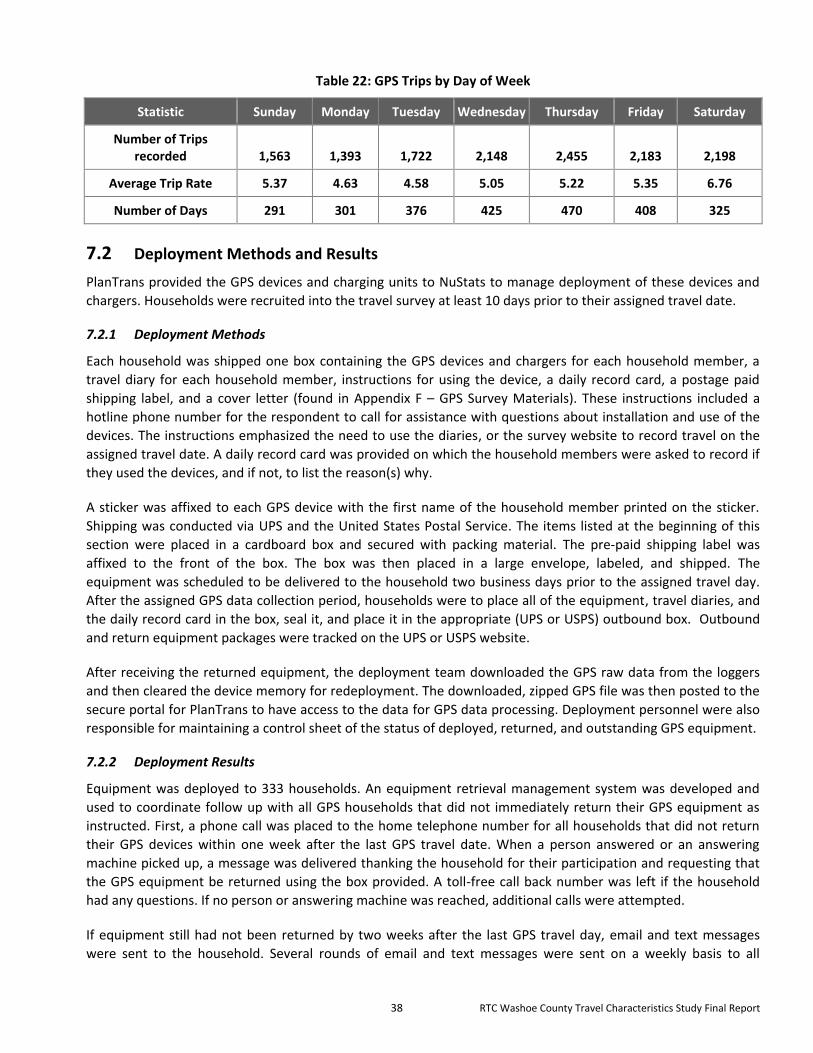
38 RTC Washoe County Travel Characteristics Study Final Report
Table 22: GPS Trips by Day of Week
Statistic Sunday Monday Tuesday Wednesday Thursday Friday Saturday
Number of Trips recorded 1,563 1,393 1,722 2,148 2,455 2,183 2,198
Average Trip Rate 5.37 4.63 4.58 5.05 5.22 5.35 6.76
Number of Days 291 301 376 425 470 408 325
7.2 Deployment Methods and Results
PlanTrans provided the GPS devices and charging units to NuStats to manage deployment of these devices and
chargers. Households were recruited into the travel survey at least 10 days prior to their assigned travel date.
7.2.1 Deployment Methods
Each household was shipped one box containing the GPS devices and chargers for each household member, a
travel diary for each household member, instructions for using the device, a daily record card, a postage paid
shipping label, and a cover letter (found in Appendix F – GPS Survey Materials). These instructions included a
hotline phone number for the respondent to call for assistance with questions about installation and use of the
devices. The instructions emphasized the need to use the diaries, or the survey website to record travel on the
assigned travel date. A daily record card was provided on which the household members were asked to record if
they used the devices, and if not, to list the reason(s) why.
A sticker was affixed to each GPS device with the first name of the household member printed on the sticker.
Shipping was conducted via UPS and the United States Postal Service. The items listed at the beginning of this
section were placed in a cardboard box and secured with packing material. The pre-paid shipping label was
affixed to the front of the box. The box was then placed in a large envelope, labeled, and shipped. The
equipment was scheduled to be delivered to the household two business days prior to the assigned travel day.
After the assigned GPS data collection period, households were to place all of the equipment, travel diaries, and
the daily record card in the box, seal it, and place it in the appropriate (UPS or USPS) outbound box. Outbound
and return equipment packages were tracked on the UPS or USPS website.
After receiving the returned equipment, the deployment team downloaded the GPS raw data from the loggers
and then cleared the device memory for redeployment. The downloaded, zipped GPS file was then posted to the
secure portal for PlanTrans to have access to the data for GPS data processing. Deployment personnel were also
responsible for maintaining a control sheet of the status of deployed, returned, and outstanding GPS equipment.
7.2.2 Deployment Results
Equipment was deployed to 333 households. An equipment retrieval management system was developed and
used to coordinate follow up with all GPS households that did not immediately return their GPS equipment as
instructed. First, a phone call was placed to the home telephone number for all households that did not return
their GPS devices within one week after the last GPS travel date. When a person answered or an answering
machine picked up, a message was delivered thanking the household for their participation and requesting that
the GPS equipment be returned using the box provided. A toll-free call back number was left if the household
had any questions. If no person or answering machine was reached, additional calls were attempted.
If equipment still had not been returned by two weeks after the last GPS travel day, email and text messages
were sent to the household. Several rounds of email and text messages were sent on a weekly basis to all

39 RTC Washoe County Travel Characteristics Study Final Report
outstanding households. Calls were also placed on a weekly basis. As of July 19th, 53 households had not
returned the GPS equipment sent to them. This is a total of 105 unreturned devices.
The deployment outcomes are presented in Table 23.
Table 23: Deployment Statistics by GPS Household Sample Type
Sample Type Recruited Households
Returned Deployed
(HH) Refused
Not Returned
Devices Not Deployed
GPS Devices and chargers 333 200 80 53 8
7.2.3 GPS Participation Results
The recruitment goal was to have an equal number of households recruited for each of the GPS loggers and the
use of RouteScout software on their personal Smartphones. As shown in Table 24, at the outset, including the
pilot sample, the goal was to recruit 782 households, split equally. However, in actuality, only 77 percent of this
goal was achieved, and the numbers were unequal, with 269 households recruited for RouteScout and 333 for
GPS loggers. As was found in the pilot survey, recruiting households to use the loggers was more successful than
recruiting them to use their own Smartphones, a point that should be kept in mind for future surveys.
Of the recruited households, 200 (60%) that were recruited to use the GPS loggers actually complied with the
request and returned loggers with useable data. For the RouteScout software on personal Smartphones, the
actual compliance was by 112 (42%) of the recruited households. Again, the GPS loggers show superiority over
Smartphones for compliance, as well as for recruitment. To be useful for the factoring exercise, households and
the individuals within those households needed to complete their travel diaries on the start day of their GPS
logger or RouteScout use. However, 44 households, plus 6 individuals in households that included some full
respondents, did not complete diaries. Of these 44 households, 23 were provided with GPS loggers and 21 with
the RouteScout software. In addition, 43 households, plus 19 individuals in households that included some full
respondents, did not use their GPS logger or the RouteScout software on the diary day. Of these 43 households,
24 were supplied with the RouteScout software and 19 with GPS devices. Similarly, 5 individuals did not use their
Smartphone on the diary day, and 14 did not use their GPS loggers. (It should be noted that we have included
among the counts of complying households those households that reported no travel on the diary day.) Again, it
is noteworthy for future surveys that the non-compliance rate for Smartphone households was higher than for
GPS logger households, so that the final percentages of useable households for the factoring are 40 percent for
the GPS logger and 18 percent for the Smartphone.
Table 24: Recruitment, Completion and Results by GPS Household Type
Sample Type Recruit Total
Recruit Goal
Recruit % Complete
GPS/RS Complete
GPS/RS + Diary
Complete Goal
%Complete Goal
GPS 333 391 85 200 155 40
RS 269 391 69 112 70 18
Total 602 782 77 312 225 29
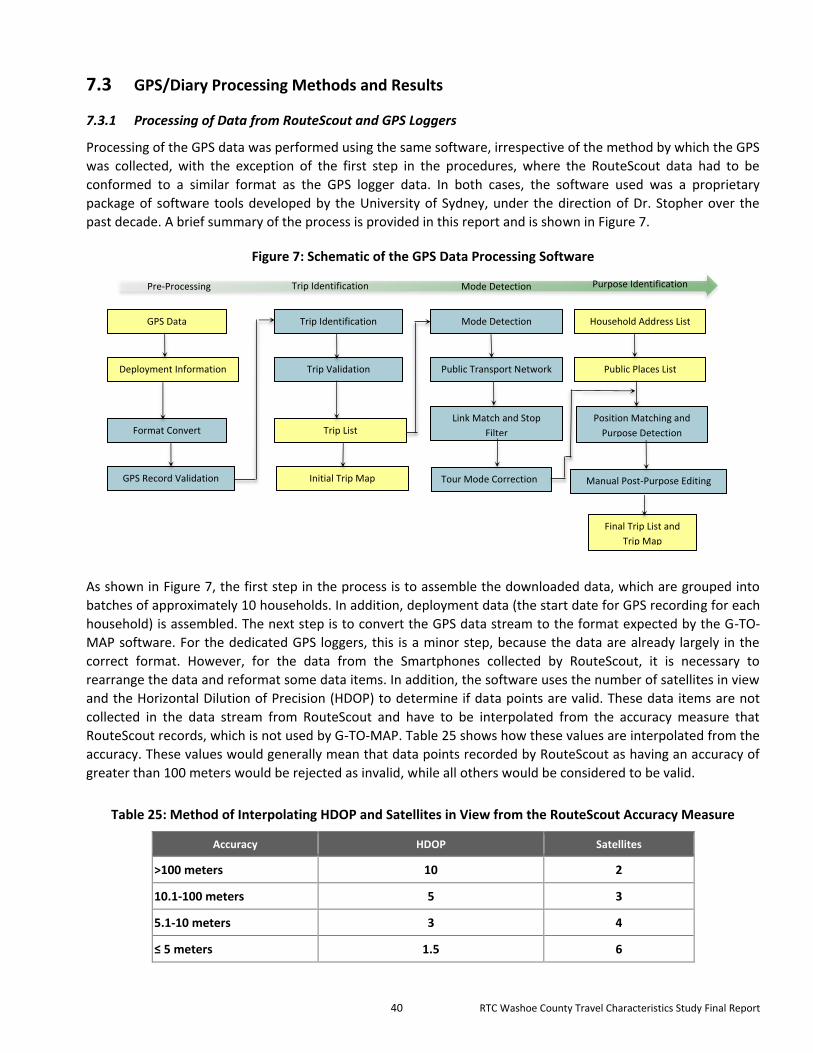
40 RTC Washoe County Travel Characteristics Study Final Report
7.3 GPS/Diary Processing Methods and Results
7.3.1 Processing of Data from RouteScout and GPS Loggers
Processing of the GPS data was performed using the same software, irrespective of the method by which the GPS
was collected, with the exception of the first step in the procedures, where the RouteScout data had to be
conformed to a similar format as the GPS logger data. In both cases, the software used was a proprietary
package of software tools developed by the University of Sydney, under the direction of Dr. Stopher over the
past decade. A brief summary of the process is provided in this report and is shown in Figure 7.
Figure 7: Schematic of the GPS Data Processing Software
As shown in Figure 7, the first step in the process is to assemble the downloaded data, which are grouped into
batches of approximately 10 households. In addition, deployment data (the start date for GPS recording for each
household) is assembled. The next step is to convert the GPS data stream to the format expected by the G-TO-
MAP software. For the dedicated GPS loggers, this is a minor step, because the data are already largely in the
correct format. However, for the data from the Smartphones collected by RouteScout, it is necessary to
rearrange the data and reformat some data items. In addition, the software uses the number of satellites in view
and the Horizontal Dilution of Precision (HDOP) to determine if data points are valid. These data items are not
collected in the data stream from RouteScout and have to be interpolated from the accuracy measure that
RouteScout records, which is not used by G-TO-MAP. Table 25 shows how these values are interpolated from the
accuracy. These values would generally mean that data points recorded by RouteScout as having an accuracy of
greater than 100 meters would be rejected as invalid, while all others would be considered to be valid.
Table 25: Method of Interpolating HDOP and Satellites in View from the RouteScout Accuracy Measure
Accuracy HDOP Satellites
>100 meters 10 2
10.1-100 meters 5 3
5.1-10 meters 3 4
≤ 5 meters 1.5 6
GPS Data
Deployment Information
Format Convert
GPS Record Validation
Trip Identification
Trip Validation
Link Match and Stop
Filter
Initial Trip Map
Mode Detection
Public Transport Network
Trip List
Household Address List
Public Places List
Position Matching and
Purpose Detection
Tour Mode Correction Manual Post-Purpose Editing
Final Trip List and
Trip Map
Pre-Processing
Trip Identification
Mode Detection
Purpose Identification

41 RTC Washoe County Travel Characteristics Study Final Report
G-TO-MAP then checks the data for validity. A common problem with all GPS devices (Smartphone or dedicated
GPS device) is that there are occasional roll-backs in time of a few seconds in duration. These cause serious
problems in the processing and so must be detected and corrected before the processing continues. Typically,
roll-backs in time are on the order of 3 – 14 seconds, although occasionally a larger value may be encountered.
GPS experts are unable to explain why this happens, but it is commonly found in any GPS data stream.
After the data have been checked for validity and any necessary corrections made, the data are then processed
through a step called trip identification. This step uses a user-provided number of seconds to define the stop
duration that is to define the end of a trip. In this project, a duration of 45 seconds was used to define the end of
a trip, because it has been found that this provides close to optimal results in terms of a trade-off between the
need to link through stops that are not real destinations, and the need to split trips where a short stop (such as a
pick up or drop off) occurs. This step provides a preliminary trip table which is subjected to some validation tests,
to ensure that such things as bus stops and train stations are correctly picked up, and then the initial trip list is
output, together with first draft Google Earth maps. The trip list is now processed through a link matching
process that uses information on the road network, public transport networks, bus stop and train station
locations, and other relevant network information. This processing step provides a preliminary identification of
mode, based on proximity of the path to the various networks, household ownership of bicycles, speed,
acceleration, and other information to identify the probable mode of travel. The first mode to be identified is
walk, because it is slowest, may not adhere to the networks, and has the lowest rates of acceleration and
deceleration. Following this, public transport is identified, based on speed, acceleration, deceleration, and
proximity to the public transportation networks. The remaining trips are then allocated to car and bicycle,
although a check is made on bicycle ownership to determine if bicycle is likely. The home location is also used in
this step to identify tours, which are defined as any sequence of trips that begins at home and eventually ends at
home.
The output from this step is a trip list with mode identified, and this is then processed by a step called “tour
mode correction”. In this step, the sequence of mode use on a tour is determined and checked against a set of
rules as to what sequences of mode use are considered possible. For example, a sequence such as car-car-bus-
bicycle would be considered improbable, because one normally must return home with the car with which one
left at the beginning of the tour. Therefore, the bus and bicycle legs would be changed to car. After these checks
are made and corrections made to the mode identification, the data are fed to the final step of purpose
identification. In this step, additional information is input on school, shop, and work locations, and purpose is
imputed from the geographic information on shops, schools, work, and home, and from the duration of time
spent at the destination location.
At this point, a manual step is introduced, called “post-purpose editing”. At this step, a trained editor examines
each trip and the information on mode and purpose, using both the trip list and the Google Earth maps. An
examination may be made of the street view at the destination of the trip to determine if it is consistent with the
imputed purpose. Also, each destination is checked to make sure it is a real destination, and not a traffic stop.
The editing typically involves joining some trips together through traffic stops, splitting some trips to pick up very
short stops, changing mode and changing purpose, where appropriate. A set of rules is used to guide the editing
process, so that it is done objectively and is not subject to the whims of individual editors. The output at the end
of this step is a final trip table from the GPS data, providing day, date, time start, time end, origin (with latitude
and longitude), destination (also with latitude and longitude), duration of travel in time and distance, imputed
mode, imputed purpose, and number of people travelling together. Subsequently, data from the Daily Record
cards is added to each trip, indicating whether or not the respondent used the GOS device on each day. Any
missed days in the middle or ends of the record are added, when possible, based on the Daily Record data, which
may indicate certain days on which the person did not travel.

42 RTC Washoe County Travel Characteristics Study Final Report
7.4 GPS and Diary Trip Matching Results
GPS data were requested from each respondent for seven days, with the first day of GPS data collection also
being the designated diary day. As noted in section 6.2.3, in some cases, GPS respondents did not complete a
diary. In other cases, respondents did not use their GPS device on the diary day, or completed their dairies but
provided no GPS data at all. For the matching process, it is necessary that a respondent has both valid diary data
and valid GPS data for the same day, and the numbers of households and individuals that provided such data
were 225 households and 345 individuals, which includes both individuals who claimed not to have traveled on
the diary day, and those who provided GPS data on a day that they claimed in the diary not to have traveled, or
completed the diary with travel information on a day that their Daily Record showed was a day on which they did
not leave home.
Table 30 shows the frequencies of numbers of days for which data were provided from the GPS participants
(both Smartphone and GPS logger and Main and Pilot data combined). It can be seen that the largest percentage
of people provided 7 days of data and, in fact, 38.1 percent provided 7 or more days of data. A total of 61.9
percent of people provided data for 5 or more days. This represents a high rate of compliance with the GPS task
and indicates a substantial amount of data available.
Table 26: Frequencies of Number of Days for the GPS Sample
Number of Days Frequency Percentage
1 73 14.7% 2 43 8.7% 3 35 7.1% 4 38 7.7% 5 58 11.7% 6 60 12.1% 7 95 19.2% 8 50 10.1% 9 16 3.2%
10 15 3.0% 11 3 0.6% 12 2 0.4% 13 4 0.8% 14 1 0.2% 15 2 0.4% 18 1 0.2%
TOTAL 496 100.0%
The matching process involved matching the data from the diary day with data from the GPS record for the same
day and then checking each trip to see if it really matched. An automated process was used initially to check for a
match. This process indicated a match on start time or end time, if those times were within 10 minutes of each
other. Similarly, a match was indicated if the latitude and longitude of the origin were within 0.002 degrees of
each other, which represents approximately one tenth of a mile in each of longitude and latitude and allows for a
combined difference of almost 0.2 miles if both latitude and longitude differ by up to 0.002 degrees. A check was
also made on mode and purpose. However, because the diary data are much richer in both of these attributes
than the imputed GPS data, these matches were not considered critical, but rather indicative. Even where the
number of trips is the same in both the diary and the GPS (103 cases, apart from those where both show 0 trips),
17 of these cases show significant differences in some of the trips, with some trips recorded in the GPS and not

43 RTC Washoe County Travel Characteristics Study Final Report
the diary, and vice versa. Thus, a careful matching was then undertaken on a trip-by-trip basis to determine
which trips matched and which did not. If trips matched on origin and destination, then the trip was assumed to
be the same trip, even if the times were not a match within 10 minutes. However, if the origin and/or destination
did not match, the trip was considered not to be a match, even if the times did match within 10 minutes.
7.4.1 Matching Results
There are 14 respondents who reported both in the diary and the Daily Record that they did not travel on the
diary day. This reduces the number of individuals available for matching on actual travel to 331. These outcomes
affect 11 households. A further 30 individuals recorded trips either in the diary with no GPS trips (14) or on the
GPS with no diary trips (16). These are more troublesome and indicate a problem, possibly that they completed
the diary for a different day from the one requested, or that the GPS was not carried on the diary day. In 12 of
these cases, the respondent had filled in their Daily Record Card to show that they carried their GPS with them all
day on that day: in 5 cases, the respondent had no GPS trips, but reported diary trips; in the other 7 cases, the
respondent had GPS trips recorded but indicated no travel in the diary. The numbers of trips recorded by GPS for
the 16 persons whose diaries claimed no travel totaled 98, and varied from 2 to 17 trips. For the 14 persons who
claimed on the GPS daily record not to have traveled on the diary day, there were 57 trips recorded in the
diaries, ranging from 1 to 8 trips.
Table 27 shows the comparison of the trip frequency for those respondents who had matching data (including no
travel days) between the Diary and the GPS. The table shows that the GPS captured a total of 1,840 trips
compared to the 1,679 in the diaries. This, without further analysis, suggests that the diaries under-reported trips
by almost 10 percent (161 trips difference against the 1,679 recorded in the diaries). However, this is not a
correct assessment. Table 28 shows the results in terms of matching of trips and shows a far poorer picture of
diary reporting than Table 27. In the GPS record, some start and end times are missing, where editing has
interpolated a trip. Therefore, the correct count of trips that are only in the diary is that of the origins and
destinations that are only in the diary, i.e., 425 trips. On the other hand, there are 586 trips that are in the GPS
records only and not in the diaries. This latter suggests an under-reporting rate of 35 percent, based on the
number of diary trips actually recorded (including the 425 that were not recorded by the GPS).
Table 27: Trip Frequencies for the Matched GPS Sample (Diary and GPS)
Trips (#)
GPS Record Diary Record
Frequency Percentage Frequency Percentage
0 28 1.50% 29 1.70%
1 319 17.30% 319 19.10%
2 316 17.20% 316 18.90%
3 261 14.20% 250 15.00%
4 222 12.10% 211 12.60%
5 174 9.50% 162 9.70%
6 135 7.30% 123 7.40%
7 101 5.50% 85 5.10%
8 79 4.30% 64 3.80%
9 61 3.30% 46 2.80%
10 48 2.60% 33 2.00%
11 33 1.80% 21 1.30%

44 RTC Washoe County Travel Characteristics Study Final Report
Trips (#)
GPS Record Diary Record
Frequency Percentage Frequency Percentage
12 25 1.40% 12 0.70%
13 18 1.00% 8 0.50%
14 14 0.80% 7 0.40%
15 12 0.70% 5 0.30%
16 8 0.40% 4 0.20%
17 7 0.40% 3 0.20%
18 5 0.30% 2 0.10%
19 2 0.10% 1 0.10%
20 1 0.10% 0 0.00%
Totals 1841 100% 1672 100%
As indicated in Table 28, some trips show a complete match, at least within the tolerance limits permitted in this
project. However, Table 28 also indicates that there are 419 trips that are recorded in the diary only and 588 that
are recorded by the GPS only. The former will occur most probably if the GPS is left at home, or if the trip is very
short, so that the GPS is unable to get a fix on position. The latter will occur when people forget to enter trips
they have made into the diary, or intentionally omit them because of fatigue in answering, or forget that they
have made the trips at all. Table 29 shows the frequencies of missed trips.
Table 28: Status of Matches between Diary and GPS
Match Status Origin Destination Start Time End Time
Matched within .1 mile or
10 minutes 1031 923 985 847
No Match 222 330 230 368
Diary Only 419 419 457 457
GPS Only 588 588 573 573
Both No Travel 14 14 29 29
TOTAL 2274 2274 2274 2274
Table 29: Trip Frequencies for the GPS Sample for the Main Survey
Missing Trips (#)
Missing GPS Frequency
Missing Diary Frequency
1 125 135
2 46 51
3 20 21
4 14 16
5 5 8
6 4 10

45 RTC Washoe County Travel Characteristics Study Final Report
Missing Trips (#)
Missing GPS Frequency
Missing Diary Frequency
7 3 3
8 2 1
9 0 1
10 0 3
11 0 1
12 0 0
13 0 1
14 0 0
15 0 1
16 0 0
17 0 1
Totals 219 253
About 57 percent (125) of respondents with missing GPS trips have only a single trip missing, which is often a
result of failure of the GPS to acquire position. A total of 171 respondents (78 percent) have 2 or fewer missing
GPS trips. The maximum number of GPS missed trips is 8 and applies to just two respondents. A further 3
respondents have 7 missed trips and another 4 have 6 missed trips. For missed diary trips, 135 respondents (53
percent) missed 1 trip in their diary; while a further 51 (20 percent) missed 2 trips. One respondent missed 17
trips and 7 respondents missed 10 or more trips.
There are 23 respondents where nothing matches at all between the diary record and the GPS record. That is to
say, for these respondents, no origins or destinations match, no times match, and generally mode and purpose
do not match either. These are the most puzzling cases. There are a further three cases, where the origins and
destinations do not match, but some or all of the times match. These 26 respondents recorded 129 trips on their
GPS devices and 97 trips in their diaries. Two explanations for this situation are possible. On the one hand, the
respondents could have handed their GPS devices to another person on the diary day and that is the travel that
was recorded, while the respondent filled out the diary for what he or she actually did on the day. The other
possibility is that the person filled out the diary for a different day from that for which he or she was instructed
to use the diary. Unfortunately, time and resources for this project do not allow searching for a match to other
days of the GPS record. It is noteworthy, however, that 15 households (whose data are not included in these
statistics) completed their diaries apparently for a date that was 6 or more days before the beginning of the GPS
period, or after the end of the GPS period and this was known to the survey team. It is, therefore, quite plausible
that some respondents may have completed their diaries for a quite different date from the one on which they
were expected to complete them, without this information being available to the survey team.
Starting from 345 individuals for whom both diary and GPS records (presumably for the same day) were
available, including those who did not leave home on the diary day, 30 are lost from the analysis because either
their GPS devices had no trips recorded on the diary day while trips were recorded in the diary, or the diary had
no trips recorded while there were trips recorded by the GPS device. A further 26 are also lost, because nothing
between their diary and the GPS record matches, so that it has to be assumed that these respondents have not
recorded the same day of travel in their diaries as was measured by the GPS. This leaves 289 respondents whose
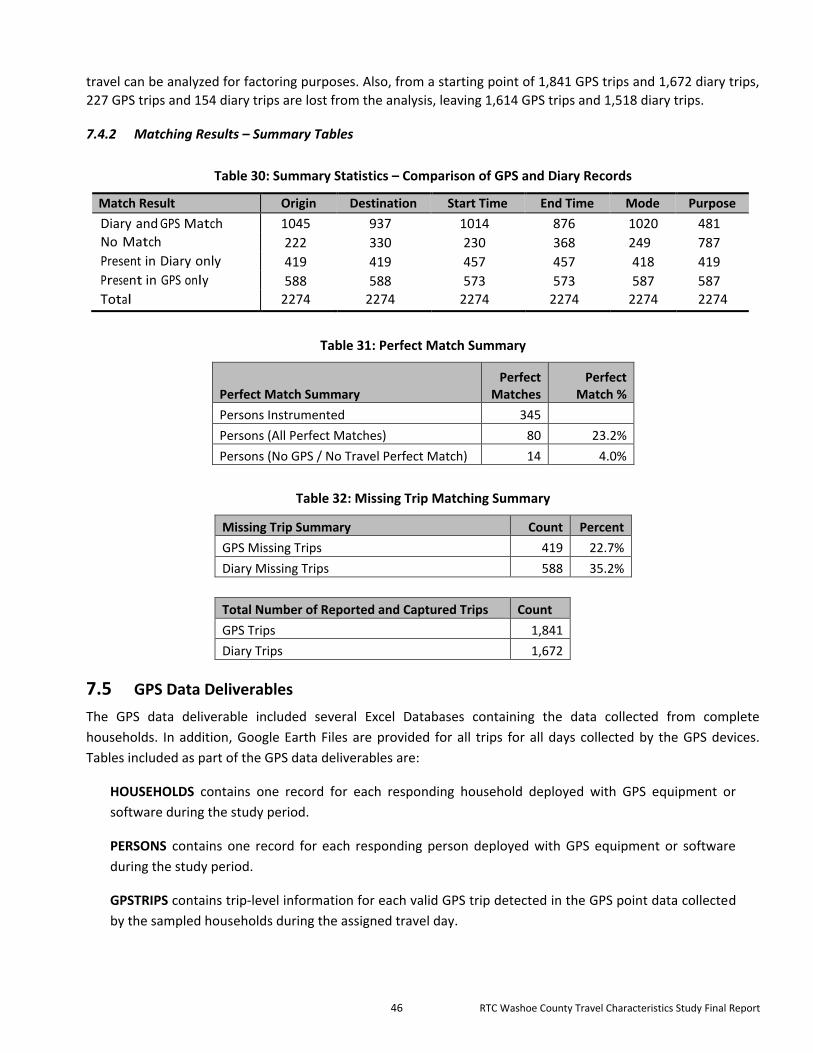
46 RTC Washoe County Travel Characteristics Study Final Report
travel can be analyzed for factoring purposes. Also, from a starting point of 1,841 GPS trips and 1,672 diary trips,
227 GPS trips and 154 diary trips are lost from the analysis, leaving 1,614 GPS trips and 1,518 diary trips.
7.4.2 Matching Results – Summary Tables
Table 30: Summary Statistics – Comparison of GPS and Diary Records
Match Result Origin Destination Start Time End Time Mode Purpose
Diary and GPS Match 1045 937 1014 876 1020 481
No Match 222 330 230 368 249 787
Present in Diary only 419 419 457 457 418 419
Present in GPS only 588 588 573 573 587 587
Total 2274 2274 2274 2274 2274 2274
Table 31: Perfect Match Summary
Perfect Match Summary Perfect
Matches Perfect
Match %
Persons Instrumented 345
Persons (All Perfect Matches) 80 23.2%
Persons (No GPS / No Travel Perfect Match) 14 4.0%
Table 32: Missing Trip Matching Summary
Missing Trip Summary Count Percent
GPS Missing Trips 419 22.7%
Diary Missing Trips 588 35.2%
Total Number of Reported and Captured Trips Count GPS Trips 1,841 Diary Trips 1,672
7.5 GPS Data Deliverables
The GPS data deliverable included several Excel Databases containing the data collected from complete
households. In addition, Google Earth Files are provided for all trips for all days collected by the GPS devices.
Tables included as part of the GPS data deliverables are:
HOUSEHOLDS contains one record for each responding household deployed with GPS equipment or
software during the study period.
PERSONS contains one record for each responding person deployed with GPS equipment or software
during the study period.
GPSTRIPS contains trip-level information for each valid GPS trip detected in the GPS point data collected
by the sampled households during the assigned travel day.

47 RTC Washoe County Travel Characteristics Study Final Report
MISSEDTRIPANALYSIS contains a comparison of diary reported trips and GPS captured trips by persons
for complete households. This table contains only persons whose diary data could be matched to GPS
data, or whose diary data confirmed no travel on the travel day.
DIARYGPSTM contains all diary reported trips by persons for all households. This table contains only
persons whose diary data could be matched to GPS data, or whose diary data confirmed no travel on the
travel day.
TRIPS_SORTED contains an integrated record of all trips, both diary reported and GPS captured trips, by persons for all complete households. This table contains only persons or vehicles whose diary data could be matched to GPS data, or whose diary data confirmed no travel on the travel day.
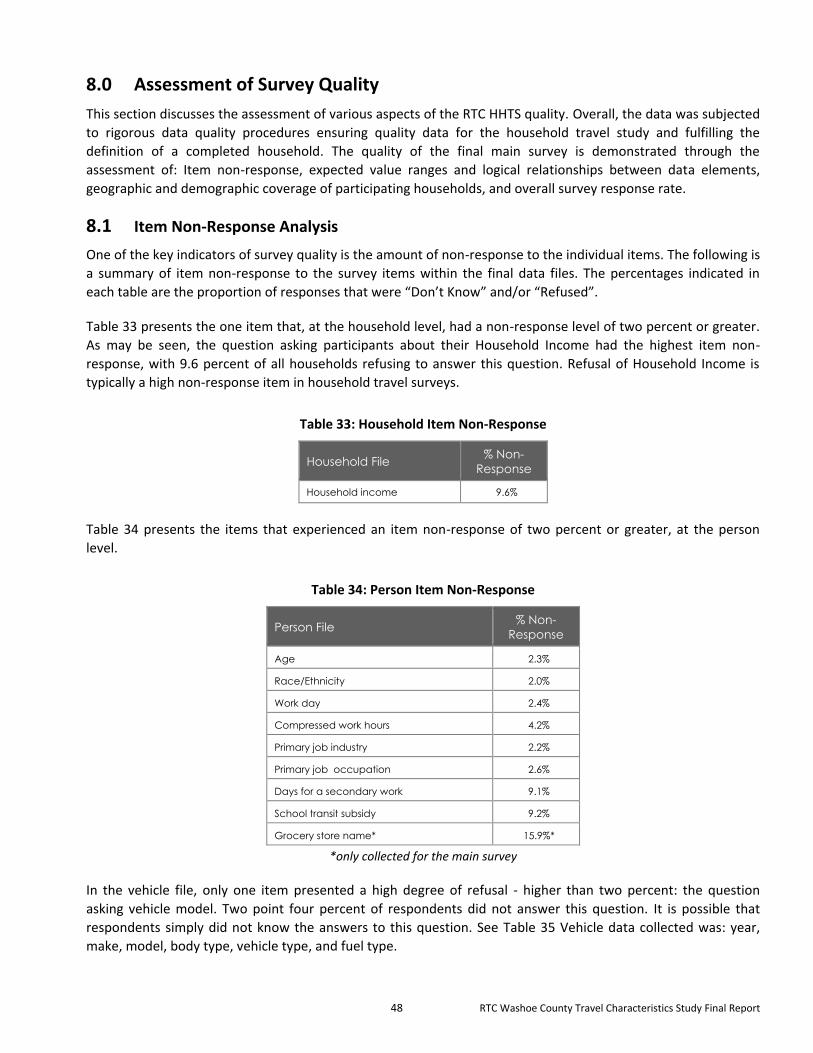
48 RTC Washoe County Travel Characteristics Study Final Report
8.0 Assessment of Survey Quality
This section discusses the assessment of various aspects of the RTC HHTS quality. Overall, the data was subjected
to rigorous data quality procedures ensuring quality data for the household travel study and fulfilling the
definition of a completed household. The quality of the final main survey is demonstrated through the
assessment of: Item non-response, expected value ranges and logical relationships between data elements,
geographic and demographic coverage of participating households, and overall survey response rate.
8.1 Item Non-Response Analysis
One of the key indicators of survey quality is the amount of non-response to the individual items. The following is
a summary of item non-response to the survey items within the final data files. The percentages indicated in
each table are the proportion of responses that were “Don’t Know” and/or “Refused”.
Table 33 presents the one item that, at the household level, had a non-response level of two percent or greater.
As may be seen, the question asking participants about their Household Income had the highest item non-
response, with 9.6 percent of all households refusing to answer this question. Refusal of Household Income is
typically a high non-response item in household travel surveys.
Table 33: Household Item Non-Response
Household File % Non-
Response
Household income 9.6%
Table 34 presents the items that experienced an item non-response of two percent or greater, at the person
level.
Table 34: Person Item Non-Response
Person File % Non-
Response
Age 2.3%
Race/Ethnicity 2.0%
Work day 2.4%
Compressed work hours 4.2%
Primary job industry 2.2%
Primary job occupation 2.6%
Days for a secondary work 9.1%
School transit subsidy 9.2%
Grocery store name* 15.9%*
*only collected for the main survey
In the vehicle file, only one item presented a high degree of refusal - higher than two percent: the question
asking vehicle model. Two point four percent of respondents did not answer this question. It is possible that
respondents simply did not know the answers to this question. See Table 35 Vehicle data collected was: year,
make, model, body type, vehicle type, and fuel type.
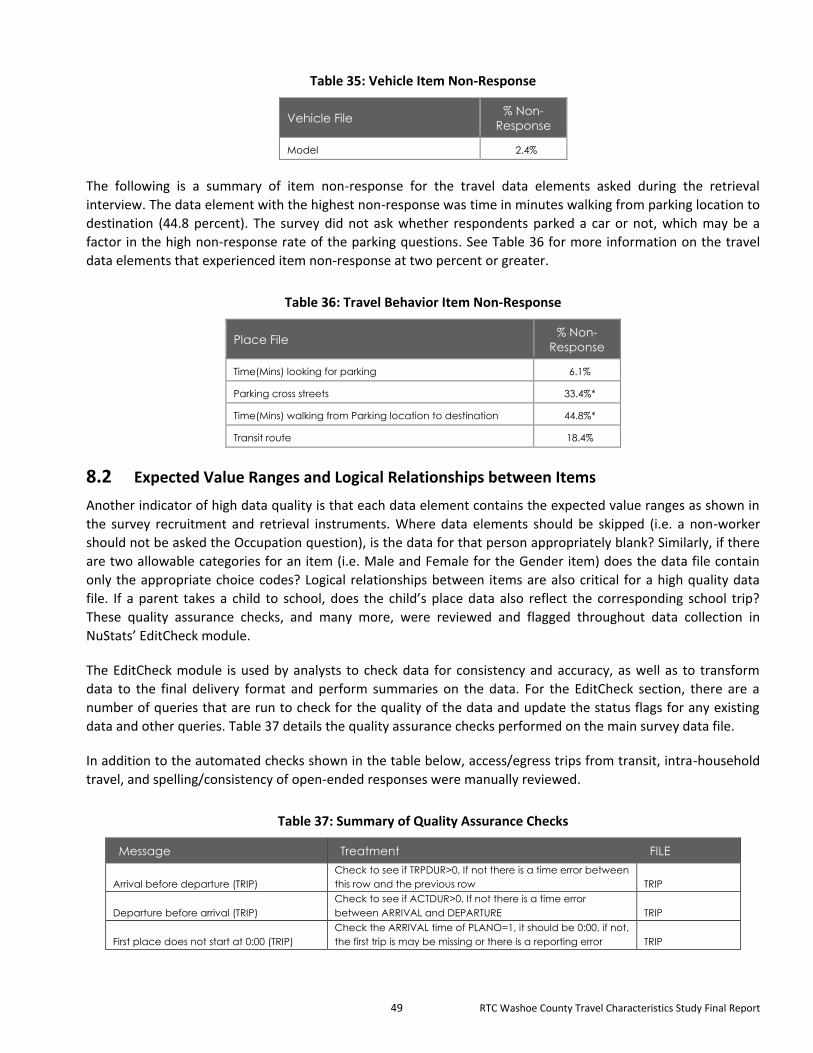
49 RTC Washoe County Travel Characteristics Study Final Report
Table 35: Vehicle Item Non-Response
Vehicle File % Non-
Response
Model 2.4%
The following is a summary of item non-response for the travel data elements asked during the retrieval
interview. The data element with the highest non-response was time in minutes walking from parking location to
destination (44.8 percent). The survey did not ask whether respondents parked a car or not, which may be a
factor in the high non-response rate of the parking questions. See Table 36 for more information on the travel
data elements that experienced item non-response at two percent or greater.
Table 36: Travel Behavior Item Non-Response
Place File % Non-
Response
Time(Mins) looking for parking 6.1%
Parking cross streets 33.4%*
Time(Mins) walking from Parking location to destination 44.8%*
Transit route 18.4%
8.2 Expected Value Ranges and Logical Relationships between Items
Another indicator of high data quality is that each data element contains the expected value ranges as shown in
the survey recruitment and retrieval instruments. Where data elements should be skipped (i.e. a non-worker
should not be asked the Occupation question), is the data for that person appropriately blank? Similarly, if there
are two allowable categories for an item (i.e. Male and Female for the Gender item) does the data file contain
only the appropriate choice codes? Logical relationships between items are also critical for a high quality data
file. If a parent takes a child to school, does the child’s place data also reflect the corresponding school trip?
These quality assurance checks, and many more, were reviewed and flagged throughout data collection in
NuStats’ EditCheck module.
The EditCheck module is used by analysts to check data for consistency and accuracy, as well as to transform
data to the final delivery format and perform summaries on the data. For the EditCheck section, there are a
number of queries that are run to check for the quality of the data and update the status flags for any existing
data and other queries. Table 37 details the quality assurance checks performed on the main survey data file.
In addition to the automated checks shown in the table below, access/egress trips from transit, intra-household
travel, and spelling/consistency of open-ended responses were manually reviewed.
Table 37: Summary of Quality Assurance Checks
Message Treatment FILE
Arrival before departure (TRIP)
Check to see if TRPDUR>0, If not there is a time error between
this row and the previous row TRIP
Departure before arrival (TRIP)
Check to see if ACTDUR>0, If not there is a time error
between ARRIVAL and DEPARTURE TRIP
First place does not start at 0:00 (TRIP)
Check the ARRIVAL time of PLANO=1, it should be 0:00, if not,
the first trip is may be missing or there is a reporting error TRIP

50 RTC Washoe County Travel Characteristics Study Final Report
Message Treatment FILE
Last place does not end at 23:59 (TRIP)
Check the DEPART time of the last trip, it should be 23:59, if
not there is a numbering error between trips or the last trip
has a reporting error TRIP
Day Time Totals <> 1439 (TRIP) One of the TRPDUR/ACTDUR's is false TRIP
Need reason for no travel/filled in and
should not be (PER) Check NOGO/O_NOGO PER
HHSIZ (HH) not equal to person count (PER)
Check PER data to see if everyone is a valid person then
modify HHSIZ HH/PER
HHVEH (HH) not equal to vehicle count
(VEH)
Check VEH data to see if vehicle is a valid vehicle , then
modify HHVEH HH
VEHOP (HH) not equal to vehicle count
(VEH)
Check VEH data to see if vehicle is a valid vehicle , then
modify HHVEH HH
HHWRK (HH) not equal to workers count
(PER)
Check PER data to see if everyone AGE>15 has a valid
EMPLY code, then modify HHWRK HH/PER
HTRIPS (HH) does not match number of
household trips (TRIP)
Validate total number of trips from NTX and update HTRIPS in
HH table HH/TRIP
INCOM is missing or is out of range (HH) Check INCOM, look in REC data HH
RESTY missing or is out of range (Including
RESTO) Check RESTY and O_RESTY, look in REC data HH
HHSTU does not match number of
Household students Verity student status of each household member HH
TRIP - Person Making Trips not in PER file
(PER/TRIP) Check Trip file or Person Roster for inconsistency TRIP
TRIP-person traveling together (TRIP) Manually review intra-household travel TRIP
AGE and/or GENDER is missing or out of
range (PER)
Check AGE and GENDER, one could be missing, RET (add
per) and REC data PER
PERSON not in HH file
There is no HH in the HH table corresponding to this PERSON,
check REC and RET or send to RESEARCH and verify if
PERSON is moved out of house or non-household member HH/PER
Work trip address does not match WADDR
(PER/TRIP) Check WLOC, maybe 2 works. Also check ACTTYP PER/TRIP
SCHOL is missing
Check PER school data, update from RET (add per) or send
to research PER
SCHOL is not null
Check PER school data, update from RET (add per) or send
to research PER
SNAME, SADDR is missing when SLOC is not
home or vice versa
Check PER school data, update from RET (add per) or send
to research RES
School trip address does not match SADDR
(PER/TRIP) Check ACTTYP PER/TRIP
Trip duration (TRPDU) is out of range or
does not agree with PLANO (TRIP)
Check Arrival time of current place and departure time of
previous place, PLANO=1 should have a null TRPDUR TRIP
PTRIPS (PER) does not match number of
person trips (TRIP) Review TRIP and recompute PTRIPS PER/TRIP
Home trip does not match HHADDR
(HH/TRIP) CHECK ACTTYP HH/TRIP
Invalid mode
PLANO 1 should not have a mode, there should be a MODE
for all other PLANO's TRIP
Number of household members traveling
together is larger than household size Check HHMEM in TRIP if it is too large TRIP
Wrong geocoding for work location-
geocoded to the city Need to collect addr or cross street PER
Wrong geocoding school loc - geocoded
to the city
Need to collect addr or cross street or SNAME with at least
one street PER
VEH YEAR is missing or is out of range (VEH) Check rec data VEH
PER - Employment Verification (EMPLY) -
Part 1 Check REC and RET PER tables PER
PER - WORKER (WLOC, OCCUP, INDUS) - Check REC and RET PER tables PER

51 RTC Washoe County Travel Characteristics Study Final Report
Message Treatment FILE
Part 3
PER - AGEB is NOT NULL Update AGEB to NULL PER
PER - DISAB is null or DTYPE,DSLIC,TWEXT is
null Check REC and RET PER tables PER
PER - WKSTAT is null Check Work Status PER
PER - WKSTAT is not null Check Work Status PER
TRIP - PER1 is null and HHMEM > 0 Review TRIP TRIP
PER - School-aged person not a student Obtain school information, or reason not in school PER
Look for home xy-coordinates in trip table
or geocode haddr
Invalid home address. Locate and geocode home addr,
else, send to research HH/TRIP
Out of area household - Need Out of Area
Addr and needs to be geocoded Flagged for Research RES
Speed is too fast(Place is wrongly
geocoded or mode is wrong or travel time
is wrong)
Review locations, times, and travel mode, else, send for
research. TRIP
NOGO is missing Flagged for Research TRIP
ACTIVITY STARTS BEFORE ARRIVAL TIME Review Trip table and times, else, send for research. ACTIVITY
ACTIVITY ENDS AFTER DEPARTURE TIME Review Trip table and times, else, send for research. ACTIVITY
8.3 Data Review – Kimley-Horn
The purpose of this section is to present information on the review of the draft data sets from the RTC Household
Survey performed by Kimley-Horn. The following data submission files (Excel) from NuStats were reviewed:
RTCHHTS_DataMatrix_Deliv_03252016_;
HH_deliv_wgt;
PER_deliv_wgt;
PLACE_deliv_wgt;
VEH_deliv_wgt.
A combined Excel file was created with a tab for each of the original survey submission files (HH, PER, PLACE, and
VEH). These tabs, along with the DataMatrix file were reviewed as noted in the following sections.
8.3.1 File Review
Kimley-Horn and Associates reviewed the HH, PER, PLACE, and VEH files along with the DataMatrix file for
accuracy and consistency and to make sure that these files were as “clean” as possible. Examples of data checks
consisted of the following:
Data fields where checked against those listed in Data Dictionary tab.
Spelling was checked for consistency in all fields.
Numbers stored as text.
Multiple listings or duplicates.
Consistency with possible answers from Data Dictionary tab.
Consistency between related fields.
Consistency between names in same field and across tabs
Travel Date and Travel Day were checked for consistency.

52 RTC Washoe County Travel Characteristics Study Final Report
Consistency between addresses for same employer.
Consistency between LAT/LONG for same employer/same address.
Consistency between Employer City, Employer State and Employer Zip.
Consistency between addresses for same person.
Consistency between address, city, state, zip and LAT/LONG for each location.
Logic check between fields.
A spreadsheet of issues found in the review was shared with RTC, NuStats, and the RTC’s modeler. In addition
to file review, all tabs were also edited where appropriate to correct errors.
Finally, in addition to the review items noted above, a GIS analysis of the data was also performed. First, all place
locations were plotted and checked for consistency as well as errors. Second, all HH locations were also plotted.
Four HH locations fell outside Washoe County. Two locations were located in Storey County which seems
reasonable, but one household was located in Lyon County and another was located in Marin County, CA. These
two HH locations were checked. Upon receipt of the data review from Kimley-Horn, NuStats made the necessary
corrections and finalized the data file. Plots showing the place locations and home locations are provided in
Figure 8 and Figure 9.
Figure 8: RTC Place Locations
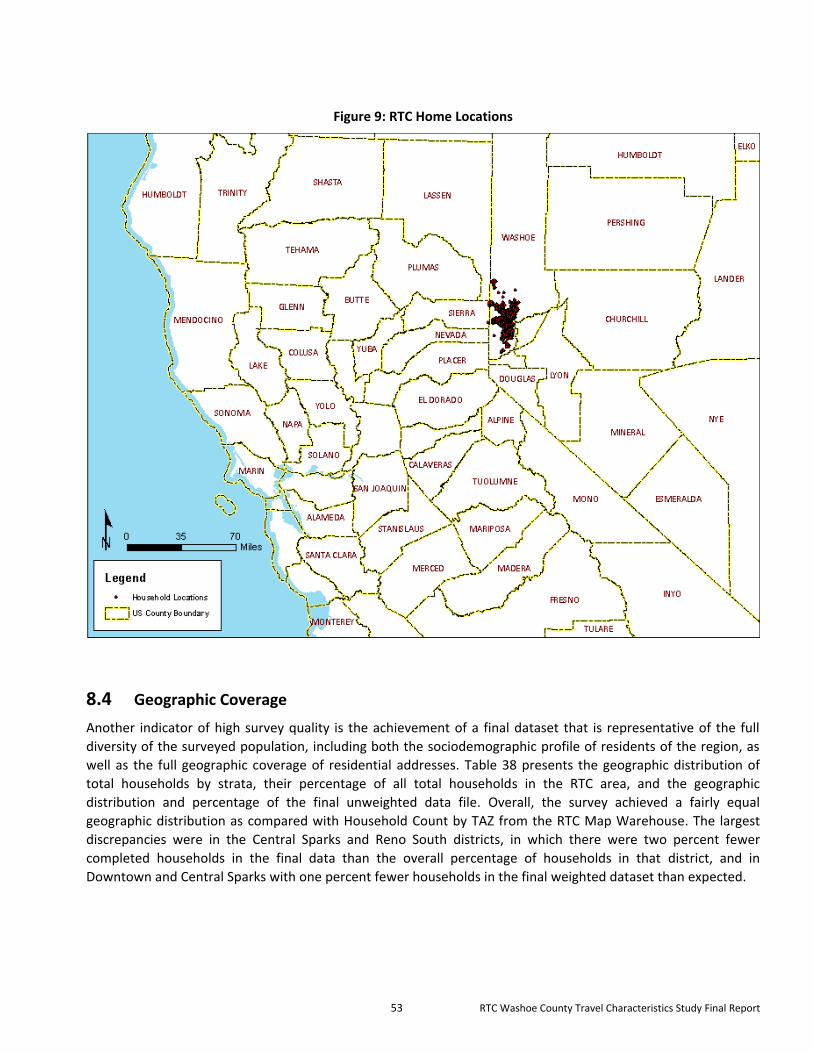
53 RTC Washoe County Travel Characteristics Study Final Report
Figure 9: RTC Home Locations
8.4 Geographic Coverage
Another indicator of high survey quality is the achievement of a final dataset that is representative of the full
diversity of the surveyed population, including both the sociodemographic profile of residents of the region, as
well as the full geographic coverage of residential addresses. Table 38 presents the geographic distribution of
total households by strata, their percentage of all total households in the RTC area, and the geographic
distribution and percentage of the final unweighted data file. Overall, the survey achieved a fairly equal
geographic distribution as compared with Household Count by TAZ from the RTC Map Warehouse. The largest
discrepancies were in the Central Sparks and Reno South districts, in which there were two percent fewer
completed households in the final data than the overall percentage of households in that district, and in
Downtown and Central Sparks with one percent fewer households in the final weighted dataset than expected.

54 RTC Washoe County Travel Characteristics Study Final Report
Table 38: Geographic Distribution by Strata
District District Name Total
Households
% of Total
Households
Final Data File
(Unweighted)
Percent of
Final Data File
(Weighted)
1 Downtown 4579 3% 2% 2%
2 University 3385 2% 2% 2%
3 Airport 1683 1% 1% 1%
4 Convention
Center 3724 2% 2% 2%
5 Reno Northwest 10749 7% 6% 7%
6 Reno South 17173 11% 9% 11%
7 Central Sparks 15248 10% 8% 9%
8 Verdi-Mogul 16332 10% 9% 10%
9 Huffaker Hills 10522 7% 6% 7%
10 East Sparks 15270 10% 10% 10%
11 North Valleys 17494 11% 11% 11%
12 Pyramid Lake/
Spanish Springs 17184 11% 13% 11%
13 Washoe
Southeast 3264 2% 3% 2%
14 Anderson 5529 3% 4% 4%
15 Rolling Hills 6428 4% 5% 4%
16 Galena Creek
Park 106 <1% 1% 0%
17 Cold Springs 4025 3% 3% 3%
18 Pyramid Lake 3222 2% 3% 2%
19 North Sparks 2563 2% 2% 2%
20 Washoe East 9 <1% 0% 0%
Total 158,489 100% 100% 100%
8.5 Response Rate Summary
The final measure of survey quality is the response rate, which can be measured simply as the number of
households sampled divided by the number of completes or by using one of the statistically accepted formulas.
This report presents the simple and the Council of American Survey Research Organization's (CASRO's)
calculation of response rate. The CASRO calculation includes all eligible and assumed eligible sampled
households in the denominator. The CASRO method of response rate calculation formed the basis for the
development of a standard for the calculation of response rates by the American Association for Public Opinion
Research (AAPOR), which was then further refined by the Institute for Social and Economic Research (ISER). This
calculation yields a more precise view of the overall percent of households from the original sample that end up
completing the survey.4
4 For detailed information on response rate calculation visit http://www.quantitativeskills.com/sisa/calculations/resprhlp.htm

55 RTC Washoe County Travel Characteristics Study Final Report
8.5.1 Total Sample Size
Presented in Table 39 is the summary of the sample count and type used for the full study. It should be noted
that in the proposal stage for this project, we had initially estimated approximately 30,000 sample records would
be necessary to collect completed surveys from 2,500 households. Due to a much lower than estimated response
rate in the pilot study, and a low matched rate (<40 percent) of the purchased sample, the sampling plan was
revised to estimate 84,150 sample records would be needed. Due to limited availability of sample in some of the
specific districts, the total count of sample used for the full study was 73,802.
The voter registration list for the region was obtained from the Office of Nevada Secretary of State. This list
contained 12,539 records that we were able to match phone numbers to the unmatched sample list. In addition,
682 records from the pilot address-based sampling frame were able to be recycled for the full study, as were
2,814 records from the pilot cell sample list.
Table 39: Summary of Used Sample Count by Sample Type for Main Study
Sampling Frame Specific Sample Type Total Counts Used
for Full Study
Address–based Sampling Frame
Matched 17,738
Unmatched 22,479
Recycled pilot matched sample 682
Unmatched sample matched to the phone number from the voter list
12,539
Cell Matched 4,300
Recycled pilot cell sample 2,814
Listed RDD Sampling Frame
Large household 3,814
Low income household 1,500
Young head of household 2,930
Spanish surname household 2,506
General listed household from near-transit-area
2,500
Total 73,802
The RTC HHTS full study was conducted utilizing a two-stage approach. The first stage was the recruitment
interview in which households provided information about their household, household members, vehicles,
transit use, habitual locations, and demographic information. The second stage was the retrieval interview in
which travel information from all household members of the recruited households was collected. During the
retrieval interview, additional attempts were made to collect information missing or refused in the recruitment
interview. The sample disposition for recruitment by sampling type for the full study is presented in Table 40.
Based on eligible households in each sample type, the recruitment rate for listed sample outperformed the cell
sample and the address-based sample, with six percent of all eligible listed households completing a recruitment
interview. The cell sample showed five percent of eligible sample completed a recruitment interview. Address-
based sample showed a four percent completion rate of eligible sample.

56 RTC Washoe County Travel Characteristics Study Final Report
Table 40: Sample Disposition for Recruitment by Sampling Type for Main Study
Sample Type Category Dispositions Count % of Total
Sample Type**
Address-based Sample
Eligible
Complete 2,063 4%
Partial complete 520 1%
Final refusal 1,629 3%
Incomplete after starting the survey 30 0%
Subtotal 4,242 8%
Ineligible
Language barrier* 108 0%
Disconnect 7,505 14%
Business/government 601 1%
Invalid phone number –fax/modem 347 1%
Not qualified/terminated from qualification question/over quota
1,129 2%
Subtotal 9,690 18%
Unknown
Answering machine 8,604 16%
Busy line 267 0%
Call back 344 1%
No answer/left message 2,186 4%
Soft refusal to participate 2,498 5%
Hang up 3,358 6%
Unmatched sample contacted via mail and no response
22,028 41%
Other 221 0%
Subtotal 39,506 74%
Total 53,438 100%
Listed
Eligible
Complete 768 6%
Partial complete 218 2%
Final refusal 550 4%
Incomplete after starting the survey 7 0%
Sub total 1,543 12%
Ineligible
Language barrier* 63 0%
Disconnect 2,275 17%
Business/government 172 1%
Invalid phone number –fax/modem 161 1%
Not qualified/terminated from qualification question/over quota
307 2%
Subtotal 2,978 22%
Unknown
Answering machine 3,968 30%
Busy line 143 1%
Call back 333 3%
No answer/left message 1,494 11%
Soft refusal to participate 869 7%
Hang up 1,797 14%
Other 125 1%
Subtotal 8,729 66%
Total 13,250 100%
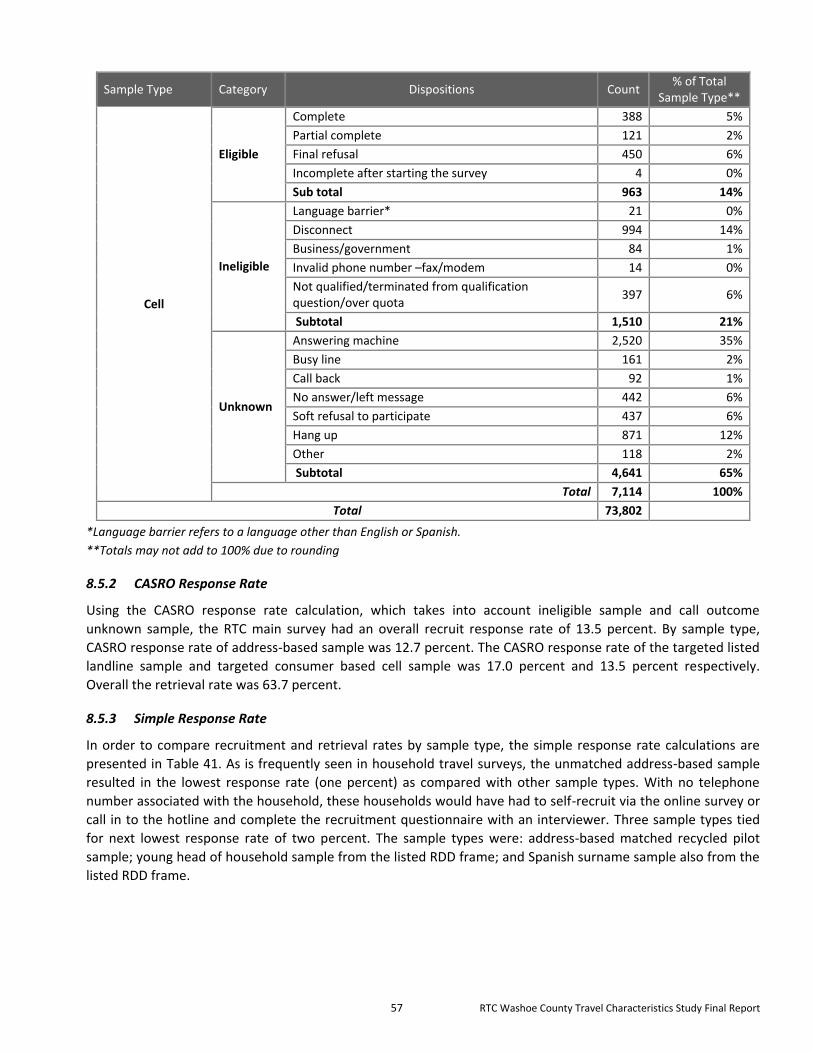
57 RTC Washoe County Travel Characteristics Study Final Report
Sample Type Category Dispositions Count % of Total
Sample Type**
Cell
Eligible
Complete 388 5%
Partial complete 121 2%
Final refusal 450 6%
Incomplete after starting the survey 4 0%
Sub total 963 14%
Ineligible
Language barrier* 21 0%
Disconnect 994 14%
Business/government 84 1%
Invalid phone number –fax/modem 14 0%
Not qualified/terminated from qualification question/over quota
397 6%
Subtotal 1,510 21%
Unknown
Answering machine 2,520 35%
Busy line 161 2%
Call back 92 1%
No answer/left message 442 6%
Soft refusal to participate 437 6%
Hang up 871 12%
Other 118 2%
Subtotal 4,641 65%
Total 7,114 100%
Total 73,802
*Language barrier refers to a language other than English or Spanish.
**Totals may not add to 100% due to rounding
8.5.2 CASRO Response Rate
Using the CASRO response rate calculation, which takes into account ineligible sample and call outcome
unknown sample, the RTC main survey had an overall recruit response rate of 13.5 percent. By sample type,
CASRO response rate of address-based sample was 12.7 percent. The CASRO response rate of the targeted listed
landline sample and targeted consumer based cell sample was 17.0 percent and 13.5 percent respectively.
Overall the retrieval rate was 63.7 percent.
8.5.3 Simple Response Rate
In order to compare recruitment and retrieval rates by sample type, the simple response rate calculations are
presented in Table 41. As is frequently seen in household travel surveys, the unmatched address-based sample
resulted in the lowest response rate (one percent) as compared with other sample types. With no telephone
number associated with the household, these households would have had to self-recruit via the online survey or
call in to the hotline and complete the recruitment questionnaire with an interviewer. Three sample types tied
for next lowest response rate of two percent. The sample types were: address-based matched recycled pilot
sample; young head of household sample from the listed RDD frame; and Spanish surname sample also from the
listed RDD frame.
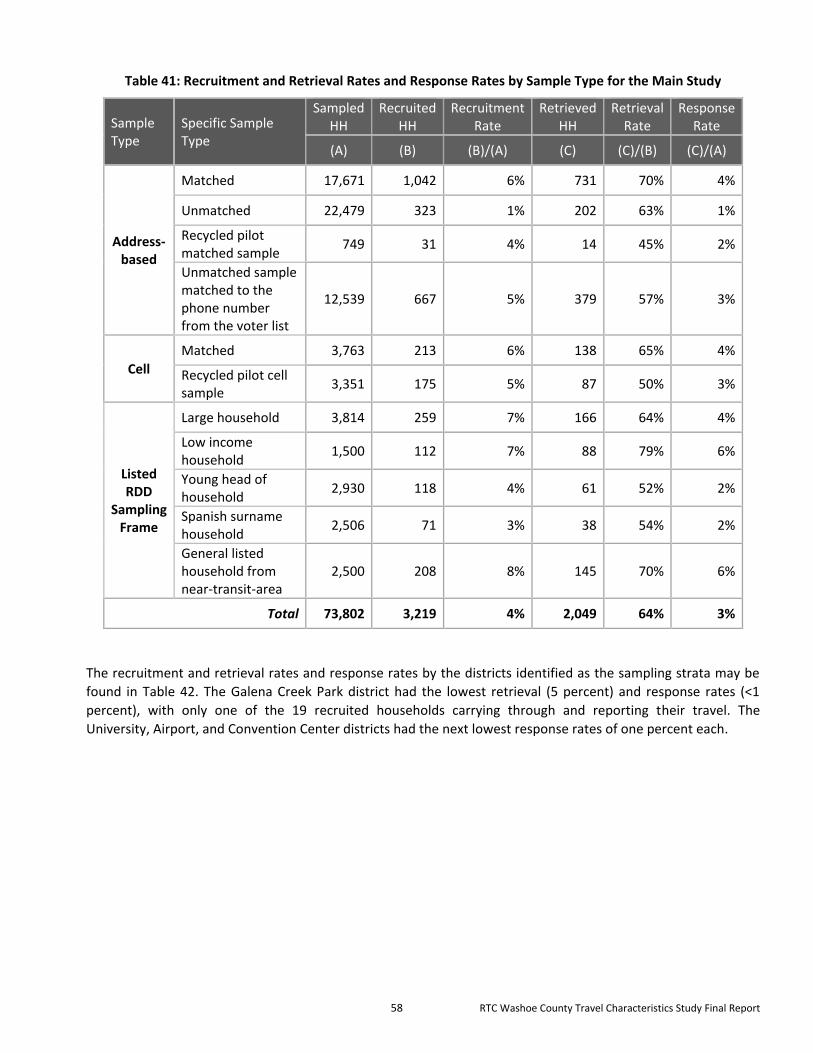
58 RTC Washoe County Travel Characteristics Study Final Report
Table 41: Recruitment and Retrieval Rates and Response Rates by Sample Type for the Main Study
Sample Type
Specific Sample Type
Sampled HH
Recruited HH
Recruitment Rate
Retrieved HH
Retrieval Rate
Response Rate
(A) (B) (B)/(A) (C) (C)/(B) (C)/(A)
Address-based
Matched 17,671 1,042 6% 731 70% 4%
Unmatched 22,479 323 1% 202 63% 1%
Recycled pilot matched sample
749 31 4% 14 45% 2%
Unmatched sample matched to the phone number from the voter list
12,539 667 5% 379 57% 3%
Cell
Matched 3,763 213 6% 138 65% 4%
Recycled pilot cell sample
3,351 175 5% 87 50% 3%
Listed RDD
Sampling Frame
Large household 3,814 259 7% 166 64% 4%
Low income household
1,500 112 7% 88 79% 6%
Young head of household
2,930 118 4% 61 52% 2%
Spanish surname household
2,506 71 3% 38 54% 2%
General listed household from near-transit-area
2,500 208 8% 145 70% 6%
Total 73,802 3,219 4% 2,049 64% 3%
The recruitment and retrieval rates and response rates by the districts identified as the sampling strata may be
found in Table 42. The Galena Creek Park district had the lowest retrieval (5 percent) and response rates (<1
percent), with only one of the 19 recruited households carrying through and reporting their travel. The
University, Airport, and Convention Center districts had the next lowest response rates of one percent each.
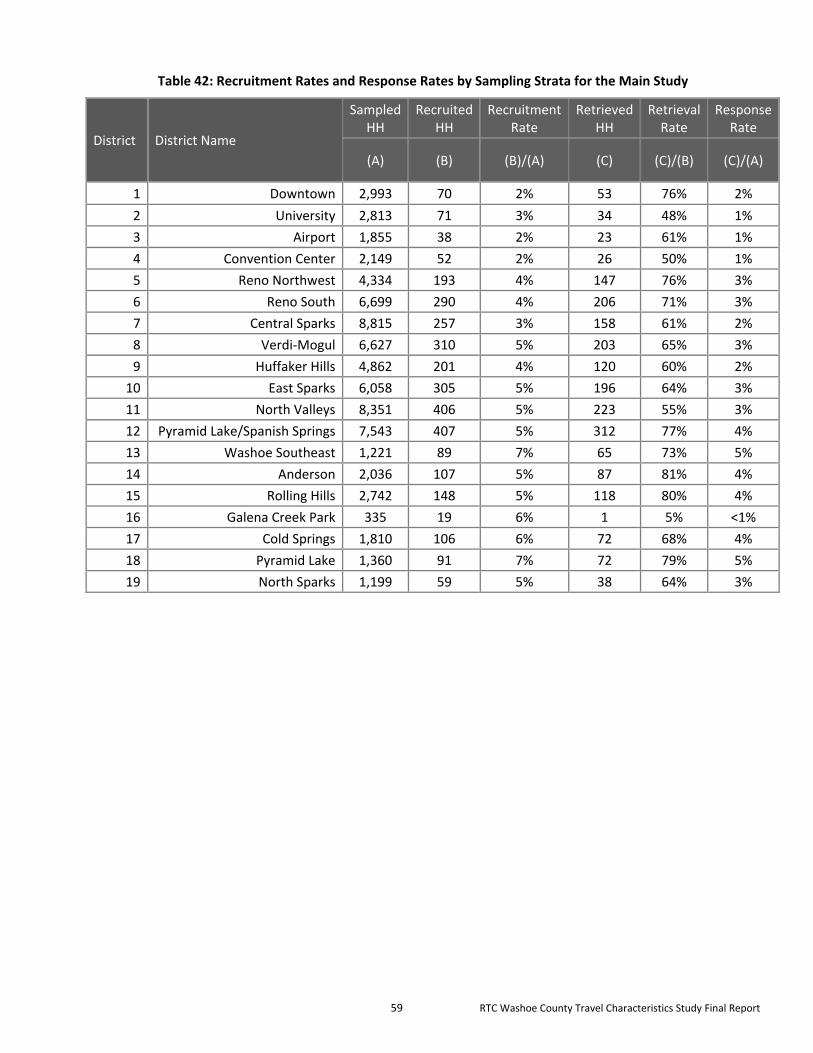
59 RTC Washoe County Travel Characteristics Study Final Report
Table 42: Recruitment Rates and Response Rates by Sampling Strata for the Main Study
District District Name
Sampled HH
Recruited HH
Recruitment Rate
Retrieved HH
Retrieval Rate
Response Rate
(A) (B) (B)/(A) (C) (C)/(B) (C)/(A)
1 Downtown 2,993 70 2% 53 76% 2%
2 University 2,813 71 3% 34 48% 1%
3 Airport 1,855 38 2% 23 61% 1%
4 Convention Center 2,149 52 2% 26 50% 1%
5 Reno Northwest 4,334 193 4% 147 76% 3%
6 Reno South 6,699 290 4% 206 71% 3%
7 Central Sparks 8,815 257 3% 158 61% 2%
8 Verdi-Mogul 6,627 310 5% 203 65% 3%
9 Huffaker Hills 4,862 201 4% 120 60% 2%
10 East Sparks 6,058 305 5% 196 64% 3%
11 North Valleys 8,351 406 5% 223 55% 3%
12 Pyramid Lake/Spanish Springs 7,543 407 5% 312 77% 4%
13 Washoe Southeast 1,221 89 7% 65 73% 5%
14 Anderson 2,036 107 5% 87 81% 4%
15 Rolling Hills 2,742 148 5% 118 80% 4%
16 Galena Creek Park 335 19 6% 1 5% <1%
17 Cold Springs 1,810 106 6% 72 68% 4%
18 Pyramid Lake 1,360 91 7% 72 79% 5%
19 North Sparks 1,199 59 5% 38 64% 3%

60 RTC Washoe County Travel Characteristics Study Final Report
9.0 Survey Data Weighting and Expansion
From a finite population sampling theory perspective, analytic weights are needed to develop estimates of
population parameters and, more generally, to draw inferences about the sampled population. Without the use
of analytic weights, population estimates are subject to biases of unknown (and possibly large) magnitude.
Consequently, analytic weights are crucial to obtain survey estimates with minimal bias.
The weighting approach utilized in this study accounts for the biases associated with sampling and robustness of
the data collected. Specifically, the components of the analytic weights generated from method are as follows:
Sampling weights
Raking adjustment
Analytic weights are computed at the household and person levels. These weights adjust the relative importance
of responses to reflect the different probabilities of selection by respondents, and align the sample distributions
to population distributions. This section discusses the components of the household weight and person weight in
detail.
9.1 Household Weight
The sampling weight reflects the probability of selection of an address or a telephone number from the sampling
frame. Considering the multiple-sampling frame employed in this study, separate sampling weights are
calculated for samples from each sample frame employed – address-based sampling frame, several targeted
listed landline sampling frame and targeted consumer-based cellphone sample frame. Specifically, the sampling
weight for a sampling unit j in the sampling frame (denoted as ,j SampFrW ) from each sample draw, is simply the
reciprocal of the selection probability of the sampling unit.
,
,
1
Probj SampFr
j SampFr
W (1)
Where:
The sampling unit j is an address in the address-based sampling frame, a landline residential phone number in
the targeted listed residential frames or a cell phone number in the targeted cell phone sample frame. Sampling frame SampFr is address-based sampling frame, targeted listed residential sampling frames or targeted cell phone
sample frame.
The sampling weights help adjust for oversampling of specific geographies (e.g. potential transit user households
live in ¼ mile radius from transit stations) or demographic groups of interest (e.g. hard to reach population such
as large household, low income household etc.) for which we had implemented controls to ensure adequate
observations in these groups. To illustrate, the sampling weight associated with an address-based sample is
simply computed as the number of addresses (universe) in the address-based frame divided by number of
sample pieces ordered from the frame for the study area for each sample order. For this study, samples (i.e.
addresses) were drawn by district defined by RTC from address-based sampling frame, sampling weights was
computed by district for the samples drawn from the address-based sampling frame. On the other hand,
targeted listed samples (large households with 4 or more persons, low income households with annual income
less than $25,000, young households with all members aged 25 or younger, Hispanic surnames) and cell samples
were drawn randomly across the RTC study area from the respective sampling frames. In addition, general listed
households within ¼ mile from the transit station (potential transit households) were drawn from the targeted

61 RTC Washoe County Travel Characteristics Study Final Report
census tracts within one-quarter mile from the transit stations. Sampling weights were computed separately for
samples drawn from each of the five targeted sampling groups and for the cell samples.
9.1.1 Raking Adjustment
Raking adjustments are used to improve the reliability of survey estimates. Raking adjustments are applied to the
collected data when the distribution of key demographic variables do not match to those of the general
population; hence, a raking adjustment was used to align the weighted sample with population statistics from
the latest available census data - 2010-2014 5-year estimates, depending on selected raking control variables and
base-geography. In particular, the aforementioned weights were adjusted so that the sums of the adjusted
weights are equal to known population totals for certain subgroups of the population, defined by demographic
characteristics and geographic variables. Variables and variable categories used for raking at the household level
are as follows:
Household size (1, 2, 3, 4 or more) distribution
Household income (Less than $35,000, $35,000 - $100,000, over $100,000)
Household vehicle & number of household workers in the household (0 vehicle & 0 worker, 0 vehicle & 1 or more worker, 1 vehicle & 0 worker, 1 vehicle & 1 or more worker, 2 vehicle & 0 worker, 2 vehicle & 1 worker, 2 vehicle & 2 or more worker, 3 + vehicle & 0 or 1 worker, 3+ vehicle & 2 or more worker)
District of home location
These variables were chosen as raking variables as these are key variables that impact travel behaviors and it is
important that the collected data are representative of general population geographically and socioeconomically.
It is reasonable to expect that maximum bias reduction would be achieved using these variables on travel
demand data calibration. It is important to note that the missing values in the raking variables were imputed to
calculate the raking adjustments using the well-known hot deck method, in which a missing value is imputed
using the data from other observations in the same dataset. Missing income was imputed before the household
level raking procedure using a mean of household income for combination of four variables - OWN (home
ownership), HHSIZ (household size), HHWRK (number of household workers) and HHVEH (number of household
vehicles) variables. A mean of each combination was calculated and applied to the refused income values for the
relevant category.
The raking procedure was based on an iterative proportional fitting procedure, and involves simultaneous ratio
adjustments to two or more marginal distributions of population counts. The raking procedure was performed in
a sequence of adjustments. First, base weights (sampling weights) were adjusted to one marginal distribution
and then to the second marginal distribution, and so on. One sequence of adjustments to the marginal
distributions was known as a cycle or iteration. The procedure was repeated until convergence was achieved.
Following the raking procedure, inordinately large weights or too small weights, a by-product of raking, ought to
be capped in order to prevent samples with extremely large or small weight from skewing other variables that
are not controlled by the weighting process and travel pattern. Weights that are over 3 or less than 0.25 were
capped to be 3 and 0.25 respectively so that balanced raking results remain effective while removing outlying
weights.
Table 43 shows the survey and population distributions by demographic and geographic raking variables for the
study area. A comparison of the unweighted distribution and the weighted distribution of these raking variables
indicates that the raking procedure has aligned the sample statistics to the population statistics.

62 RTC Washoe County Travel Characteristics Study Final Report
Table 43: Raking Adjustment at Household Level
Key variables Unweighted Weighted 2010-2014
Difference
(% points) Weighted-ACS
Household Size
1 648 30.1% 664 30.8% 48,726 29.6% 1.2%
2 961 44.6% 772 35.9% 57,075 34.7% 1.2%
3 275 12.8% 314 14.6% 23,739 14.4% 0.2%
4 or more 270 12.5% 404 18.7% 34,921 21.2% -2.5%
Total 2154 100.0% 2,154 100.0% 164,461 100.00% 0.0%
Income*
Less than 35K 537 27.6% 645 33.3% 55,759 33.9% -0.6%
35K-100K 939 48.2% 858 44.3% 73,172 44.5% -0.2%
100K+ 471 24.2% 432 22.3% 35,530 21.6% 0.7%
Total 1947 100.0% 1,935 100.0% 164,461 100.00% 0.0%
Number of Household Vehicles
0 vehicle - 0 worker 91 4.2% 102 4.7% 7,737 4.7% 0.0%
0 vehicle - 1 or more worker
33 1.5% 60 2.8% 5,612 3.4% -0.7%
1 vehicle - 0 worker 414 19.2% 292 13.6% 19,892 12.2% 1.4%
1 vehicle - 1 or more worker
331 15.4% 434 20.2% 34,665 21.2% -1.1%
2 vehicle - 0 worker 263 12.2% 172 8.0% 11,737 7.2% 0.8%
2 vehicle - 1 worker 292 13.6% 304 14.1% 23,000 14.1% 0.0%
2 vehicle - 2 or more worker
403 18.7% 367 17.0% 27,375 16.8% 0.3%
3 + vehicle - 0 or 1 worker
138 6.4% 173 8.0% 13,965 8.6% -0.5%
3+ vehicle - 2 or more worker
189 8.8% 250 11.6% 20,478 12.5% -0.9%
Total 2154 100.0% 2,154 100.0% 164,461 100.00% 0.0%
District
1 53 2.5% 58 2.7% 4,579 2.89% -0.7%
2 34 1.6% 44 2.1% 3,385 2.14% -0.1%
3 23 1.1% 24 1.1% 1,683 1.06% -0.2%
4 26 1.2% 46 2.1% 3,724 2.35% -0.4%
5 147 6.8% 148 6.9% 10,749 6.78% 0.1%
6 206 9.6% 238 11.0% 17,173 10.84% 0.2%
7 158 7.3% 196 9.1% 15,248 9.62% -0.4%
8 203 9.4% 219 10.2% 16,332 10.31% 0.0%
9 120 5.6% 141 6.6% 10,522 6.64% -0.1%
10 196 9.1% 210 9.7% 15,270 9.64% 0.2%
11 223 10.4% 223 10.4% 17,494 11.04% 0.1%
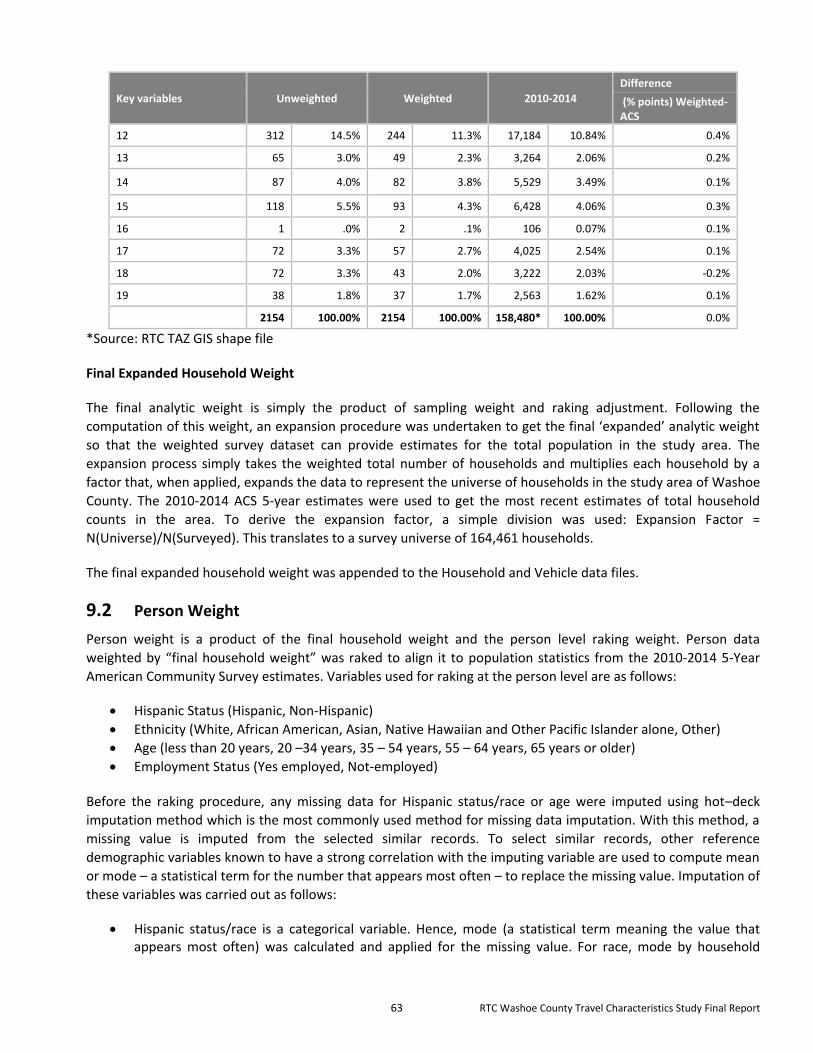
63 RTC Washoe County Travel Characteristics Study Final Report
Key variables Unweighted Weighted 2010-2014
Difference
(% points) Weighted-ACS
12 312 14.5% 244 11.3% 17,184 10.84% 0.4%
13 65 3.0% 49 2.3% 3,264 2.06% 0.2%
14 87 4.0% 82 3.8% 5,529 3.49% 0.1%
15 118 5.5% 93 4.3% 6,428 4.06% 0.3%
16 1 .0% 2 .1% 106 0.07% 0.1%
17 72 3.3% 57 2.7% 4,025 2.54% 0.1%
18 72 3.3% 43 2.0% 3,222 2.03% -0.2%
19 38 1.8% 37 1.7% 2,563 1.62% 0.1%
2154 100.00% 2154 100.00% 158,480* 100.00% 0.0%
*Source: RTC TAZ GIS shape file
Final Expanded Household Weight
The final analytic weight is simply the product of sampling weight and raking adjustment. Following the
computation of this weight, an expansion procedure was undertaken to get the final ‘expanded’ analytic weight
so that the weighted survey dataset can provide estimates for the total population in the study area. The
expansion process simply takes the weighted total number of households and multiplies each household by a
factor that, when applied, expands the data to represent the universe of households in the study area of Washoe
County. The 2010-2014 ACS 5-year estimates were used to get the most recent estimates of total household
counts in the area. To derive the expansion factor, a simple division was used: Expansion Factor =
N(Universe)/N(Surveyed). This translates to a survey universe of 164,461 households.
The final expanded household weight was appended to the Household and Vehicle data files.
9.2 Person Weight
Person weight is a product of the final household weight and the person level raking weight. Person data
weighted by “final household weight” was raked to align it to population statistics from the 2010-2014 5-Year
American Community Survey estimates. Variables used for raking at the person level are as follows:
Hispanic Status (Hispanic, Non-Hispanic)
Ethnicity (White, African American, Asian, Native Hawaiian and Other Pacific Islander alone, Other)
Age (less than 20 years, 20 –34 years, 35 – 54 years, 55 – 64 years, 65 years or older)
Employment Status (Yes employed, Not-employed)
Before the raking procedure, any missing data for Hispanic status/race or age were imputed using hot–deck
imputation method which is the most commonly used method for missing data imputation. With this method, a
missing value is imputed from the selected similar records. To select similar records, other reference
demographic variables known to have a strong correlation with the imputing variable are used to compute mean
or mode – a statistical term for the number that appears most often – to replace the missing value. Imputation of
these variables was carried out as follows:
Hispanic status/race is a categorical variable. Hence, mode (a statistical term meaning the value that appears most often) was calculated and applied for the missing value. For race, mode by household

64 RTC Washoe County Travel Characteristics Study Final Report
income category was computed and applied to race refusal records in the same household income category. For Hispanic status, mode of Hispanic status by combination of household income and race was computed and applied to missing or refusal values of the same household income and age group.
Age is a scale variable. Hence, mean age for combination of education level, employment status, and student status was computed and applied to age refusals. If education level was refused or missing, a mean age of relevant work status and student status category was applied. If all the variables used for imputation are refusals, and the overall average age was applied.
Following the raking procedure, any very large weights were capped to equal a maximum of three times the
mean weight to avoid side effect of very large weights, a by-product of raking procedure. Table 44 shows the
survey and population distribution by the aforementioned raking variables.
Table 44: Survey and Population Distribution by Raking Variables
Key variables Unweighted Weighted 2010-2014 ACS
Difference
(% points) Weighted-ACS
Hispanic Status
Hispanic 368 8.1% 758 16.7% 98,671 22.9% -6.2%
Non-Hispanic 4201 91.9% 3771 83.3% 331,314 77.1% 6.2%
Total 4569 100.0% 4529 100.0% 429,985 100.0% 0.0%
Age
<20 years old 759 16.8% 1105 24.5% 109,790 25.5% -1.0%
20-34 522 11.6% 866 19.2% 92,176 21.4% -2.2%
35-54 1104 24.5% 1191 26.4% 114,429 26.6% -0.2%
55 – 64 949 21.1% 662 14.7% 56,111 13.0% 1.6%
65+ 1174 26.0% 687 15.2% 57,479 13.4% 1.9%
Total 4508 100.0% 4510 100.0% 429,985 100.0% 0.0%
Race
White 4067 89.6% 3799 84.3% 350,364 81.5% 2.8%
Black or African American 57 1.3% 97 2.1% 10,202 2.4% -0.2%
American Indian or Alaska Native
42 .9% 58 1.3% 6,771 1.6% -0.3%
Asian 101 2.2% 195 4.3% 22,461 5.2% -0.9%
Native Hawaiian and Other Pacific Islander alone
19 .4% 29 .6% 2,518 0.6% 0.0%
OTHER 253 5.6% 328 7.3% 37,669 8.8% -1.5%
Total 4539 100.0% 4505 100.0% 429,985 100.0% 0.0%
Employment Status
Yes 2041 44.4% 2150 46.8% 202,147 47.0% -0.2%
No (Including 16 or under) 2554 55.6% 2445 53.2% 227,838 53.0% 0.2%
Total 4595 100.0% 4595 100% 429,985 100.0% 0.0%

65 RTC Washoe County Travel Characteristics Study Final Report
9.2.1 Final Expanded Person Weight
Following computation of “final person weight”, weights were then expanded to reflect the total 429,985
persons residing in the Washoe County. The final expanded person weight was appended to Person and Place
data files.
9.3 Factoring Diary Trips from GPS Results
In a household travel survey, there are at least two critical issues in the accuracy of the resulting trip data:
sample coverage and trip reporting accuracy. Sample coverage is dealt with elsewhere in this report, and has to
do with such things as nonresponse and sample adherence. Trip reporting accuracy is the issue that is of concern
in this section of the report. Unfortunately, in all household travel surveys that ask people to report their travel,
the reported travel, whether provided in written diaries or through interviews, are subject to errors: omission
due to memory issues, privacy concerns, fatigue in answering the questions, and other issues. Use of global
positioning system (GPS) devices, either through Smartphones or dedicated GPS loggers, provides a method to
increase the accuracy of trip reporting. However, GPS is by no means foolproof, but does provide a significantly
higher accuracy of reporting.
In the RTC Washoe County Travel Characteristics Study, 225 households (11 percent) completed both GPS
measurement for at least one household member and also provided diaries for the appointed diary day. Where
both GPS data and diary data exist for the same day, it is possible to determine the level of correction that may
be needed to diary data to bring it closer to true trip-making levels. While the percentage of households
completing both GPS and diaries seems fairly reasonable, the actual number is too low to undertake detailed
factoring. Statistical analysis of small samples is fraught with error, so caution must be used in determining how
to correct diary trips.
Four types of trips can be identified in the sample:
Matched trips (M) – trips that are found in both the diary trip table and the GPS trip table, as determined
by examining the match of origin and destination coordinates (latitude and longitude);
Underestimated trips (U) – trips that are found in the GPS trip table but are not in the diary trip table;
Overestimated trips (O) – trips that are found in the diary trip table that are not present in the GPS trip
table, except for instances where it can be determined that the diary trips were missed by the GPS
device; and
Additional trips (A) – trips that are found in the diary trip table that are not present in the GPS trip table
and for which it can be determined that the GPS record is in error. These trips are of little further interest
in this study.
Matched trips are defined more leniently than in the earlier comparison. If a trip is found in the diary that
matches any part of a trip reported by the GPS device or Smartphone, it is counted as a match. For
underestimated and overestimated trips, an example would be the case where the diary records a trip from
home to work, while the GPS shows that the person dropped of someone at school on the way to work and then
continued on to work. The GPS would show two trips in this case, which would be considered to be
underestimated trips. The Diary would have reported a single home to work trip, which is considered to be an
overestimated (not real) trip, because it should not have appeared in the diary. An additional trip might arise
where a round trip to drop a child at school was not recorded by the GPS either because the GPS was left at
home, or because the trip was too short for the GPS to gain position. Table 45 shows the numbers of these types
of trips for the 289 respondents that remained after excluding those with trips on their GPS devices and no trips
in the diary, no trips in the GPS device and trips in the diary, and those whose diary and GPS trips do not match.

66 RTC Washoe County Travel Characteristics Study Final Report
Table 45: Distribution of Trips of Different Match Types
Match Type Frequency Percent Cumulative Frequency Cumulative Percent
Overestimated Trips (O) 9 0.5% 9 0.5%
Additional Trips (A) 267 14.0% 276 14.5%
Matched Trips (M) 1,253 65.5% 1,529 80.0%
Underestimated Trips (U) 383 20.0% 1,912 100.0%
The Additional Trips should not be subject to factoring, because these are trips that have been correctly entered
in the diaries, but for which there is no parallel GPS validation, because they arise from errors that respondents
make in carrying their GPS devices, and sometimes from technical difficulties experienced by the GPS devices.
Overestimated trips should not have been recorded in the diaries but were recorded through respondent error.
The diary recorded trips (1,253 + 9 = 1,262), exclusive of the additional trips, are the base on which correction
should be made, because 81.6 percent of respondents filled out their diaries without being equipped with a GPS
device or Smartphone App. However, when looking at diary trips from those who did not carry a GPS, the total
diary trip base for correction is the number of diary trips less the probable additional trips that the GPS would
not have caught. Thus the base trips must be reduced by 14 percent from the total of all diary trips. These trips
must be factored down by 0.5 percent for unreal trips that were recorded in their diaries, and factored up by 20
percent, representing the underestimation of diary trips, compared to the GPS.
The correct number of trips is (M+A+U) = 1903. The number of trips measured by the diaries is (M+O+A) = 1529.
Therefore, the simple factor to apply is (M+A+U)/(M+A+O) = 1903/1529 = 1.245. In fact, the reporting of diary
trips is quite variable in the population, with some respondents reporting exactly the same trips as were
measured by the GPS, while others report very few of the trips measured by the GPS. Unfortunately, with only
225 households to work with in the Reno project, it is not possible to examine significant differences by
household and trip-making characteristics. While probably not as accurate as one would like, application of a
single factor is all that can be achieved in this project.
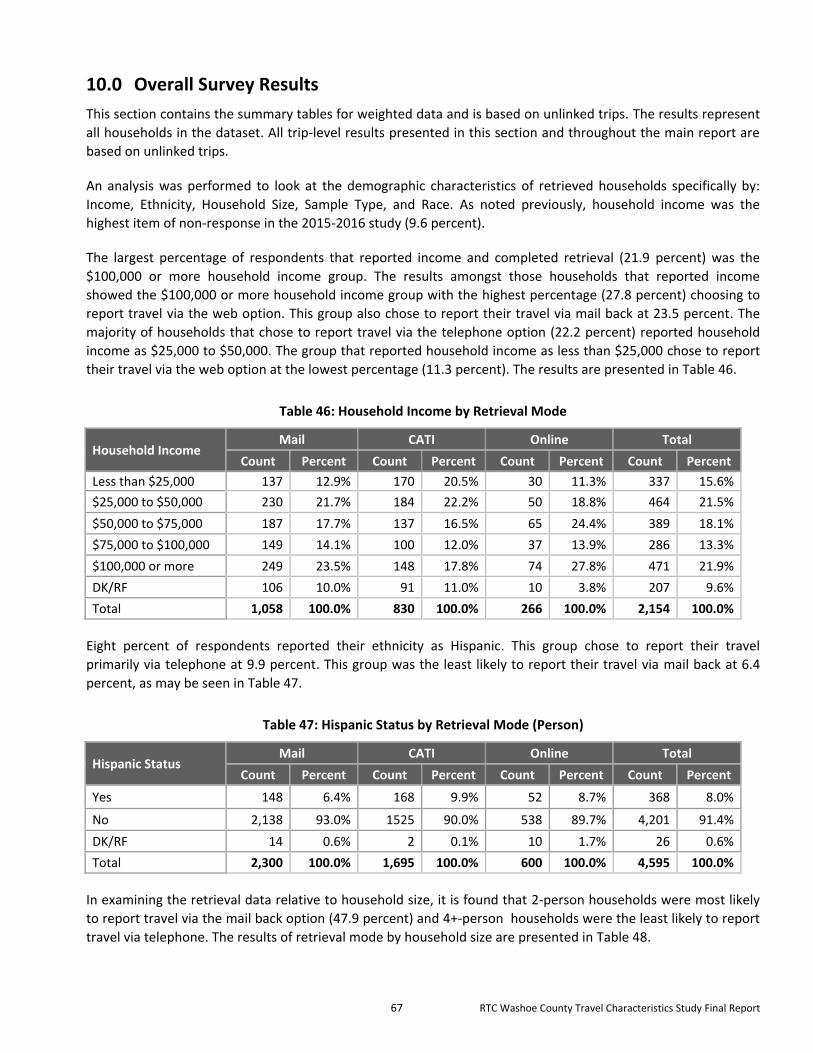
67 RTC Washoe County Travel Characteristics Study Final Report
10.0 Overall Survey Results
This section contains the summary tables for weighted data and is based on unlinked trips. The results represent
all households in the dataset. All trip-level results presented in this section and throughout the main report are
based on unlinked trips.
An analysis was performed to look at the demographic characteristics of retrieved households specifically by:
Income, Ethnicity, Household Size, Sample Type, and Race. As noted previously, household income was the
highest item of non-response in the 2015-2016 study (9.6 percent).
The largest percentage of respondents that reported income and completed retrieval (21.9 percent) was the
$100,000 or more household income group. The results amongst those households that reported income
showed the $100,000 or more household income group with the highest percentage (27.8 percent) choosing to
report travel via the web option. This group also chose to report their travel via mail back at 23.5 percent. The
majority of households that chose to report travel via the telephone option (22.2 percent) reported household
income as $25,000 to $50,000. The group that reported household income as less than $25,000 chose to report
their travel via the web option at the lowest percentage (11.3 percent). The results are presented in Table 46.
Table 46: Household Income by Retrieval Mode
Household Income Mail CATI Online Total
Count Percent Count Percent Count Percent Count Percent
Less than $25,000 137 12.9% 170 20.5% 30 11.3% 337 15.6%
$25,000 to $50,000 230 21.7% 184 22.2% 50 18.8% 464 21.5%
$50,000 to $75,000 187 17.7% 137 16.5% 65 24.4% 389 18.1%
$75,000 to $100,000 149 14.1% 100 12.0% 37 13.9% 286 13.3%
$100,000 or more 249 23.5% 148 17.8% 74 27.8% 471 21.9%
DK/RF 106 10.0% 91 11.0% 10 3.8% 207 9.6%
Total 1,058 100.0% 830 100.0% 266 100.0% 2,154 100.0%
Eight percent of respondents reported their ethnicity as Hispanic. This group chose to report their travel
primarily via telephone at 9.9 percent. This group was the least likely to report their travel via mail back at 6.4
percent, as may be seen in Table 47.
Table 47: Hispanic Status by Retrieval Mode (Person)
Hispanic Status Mail CATI Online Total
Count Percent Count Percent Count Percent Count Percent
Yes 148 6.4% 168 9.9% 52 8.7% 368 8.0%
No 2,138 93.0% 1525 90.0% 538 89.7% 4,201 91.4%
DK/RF 14 0.6% 2 0.1% 10 1.7% 26 0.6%
Total 2,300 100.0% 1,695 100.0% 600 100.0% 4,595 100.0%
In examining the retrieval data relative to household size, it is found that 2-person households were most likely
to report travel via the mail back option (47.9 percent) and 4+-person households were the least likely to report
travel via telephone. The results of retrieval mode by household size are presented in Table 48.

68 RTC Washoe County Travel Characteristics Study Final Report
Table 48: Household Size by Retrieval Mode
Household Size Mail CATI Online Total
Count Percent Count Percent Count Percent Count Percent
1 person 282 26.7% 293 35.3% 73 27.4% 648 30.1%
2 persons 507 47.9% 338 40.7% 116 43.6% 961 44.6%
3 persons 129 12.2% 114 13.7% 32 12.0% 275 12.8%
4+ persons 140 13.2% 85 10.2% 45 16.9% 270 12.5%
Total 1,058 100.0% 830 100.0% 266 100.0% 2,154 100.0%
An analysis of retrieval mode by sample type may be found in Table 49. Of note, the sample type that showed
the highest level of retrieval was the address-based matched sample type, and the sample type that showed the
lowest level of retrieval was the Spanish surname targeted listed sample type. These results are consistent with
other recent household travel studies performed by NuStats.
Table 49: Retrieval Modes by Sample type
Sample Type Mail CATI Online Total
Count Percent Count Percent Count Percent Count Percent
Address-based matched 615 58.1% 473 57.0% 108 40.6% 1,196 55.5%
Address-based unmatched 81 7.7% 13 1.6% 88 33.1% 182 8.4%
Cell 120 11.3% 127 15.3% 31 11.7% 278 12.9%
Large household targeted listed
88 8.3% 59 7.1% 19 7.1% 166 7.7%
Low income targeted listed 34 3.2% 49 5.9% 5 1.9% 88 4.1%
Young household targeted listed
24 2.3% 29 3.5% 8 3.0% 61 2.8%
Spanish surname targeted listed
16 1.5% 19 2.3% 3 1.1% 38 1.8%
General listed household from near-transit-area
80 7.6% 61 7.3% 4 1.5% 145 6.7%
Total 1,058 100.0% 830 100.0% 266 100.0% 2,154 100.0%
Of the respondents who reported their ethnicity, the largest group who also provided travel was households
where ethnicity was reported as White at 88.5 percent. This group also showed the largest percentage that
reported travel via all three options with 89.8 percent of the mail respondents, 87.1 percent of the telephone
respondents, and 87.3 percent of the web respondents identifying ethnicity in this category. The complete
breakdown of retrieval mode by race may be seen in Table 50.
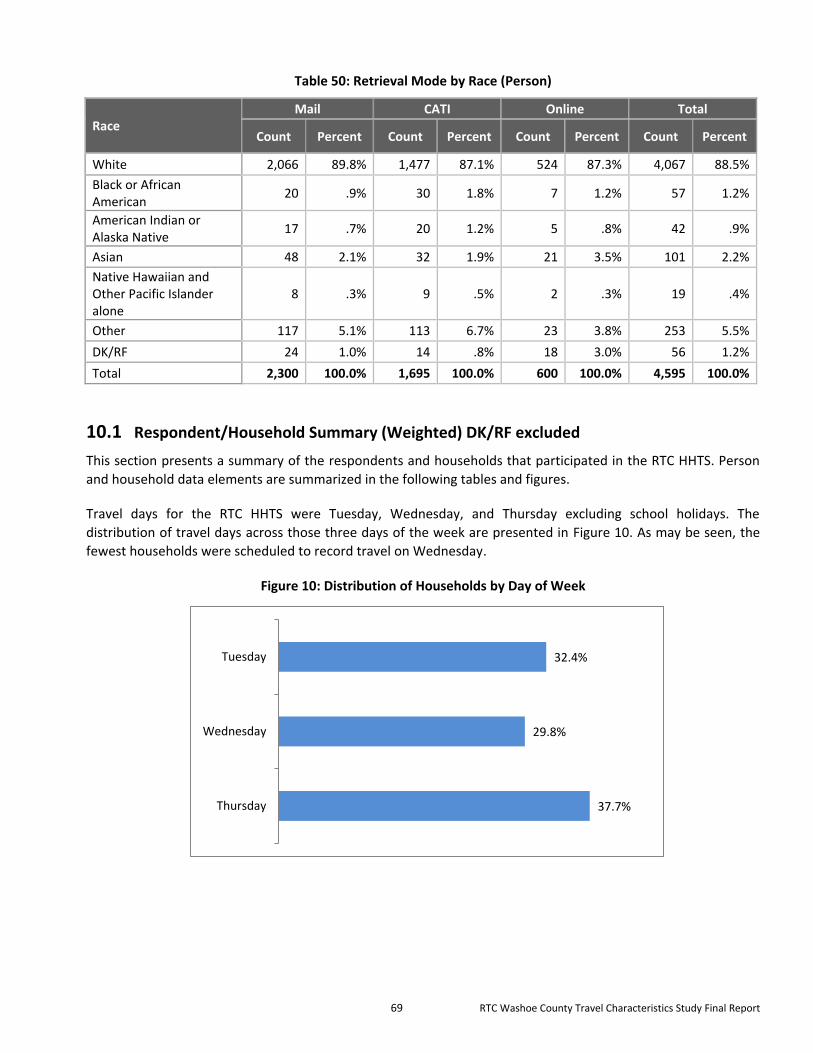
69 RTC Washoe County Travel Characteristics Study Final Report
Table 50: Retrieval Mode by Race (Person)
Race Mail CATI Online Total
Count Percent Count Percent Count Percent Count Percent
White 2,066 89.8% 1,477 87.1% 524 87.3% 4,067 88.5%
Black or African American
20 .9% 30 1.8% 7 1.2% 57 1.2%
American Indian or Alaska Native
17 .7% 20 1.2% 5 .8% 42 .9%
Asian 48 2.1% 32 1.9% 21 3.5% 101 2.2%
Native Hawaiian and Other Pacific Islander alone
8 .3% 9 .5% 2 .3% 19 .4%
Other 117 5.1% 113 6.7% 23 3.8% 253 5.5%
DK/RF 24 1.0% 14 .8% 18 3.0% 56 1.2%
Total 2,300 100.0% 1,695 100.0% 600 100.0% 4,595 100.0%
10.1 Respondent/Household Summary (Weighted) DK/RF excluded
This section presents a summary of the respondents and households that participated in the RTC HHTS. Person
and household data elements are summarized in the following tables and figures.
Travel days for the RTC HHTS were Tuesday, Wednesday, and Thursday excluding school holidays. The
distribution of travel days across those three days of the week are presented in Figure 10. As may be seen, the
fewest households were scheduled to record travel on Wednesday.
Figure 10: Distribution of Households by Day of Week
32.4%
29.8%
37.7%
Tuesday
Wednesday
Thursday
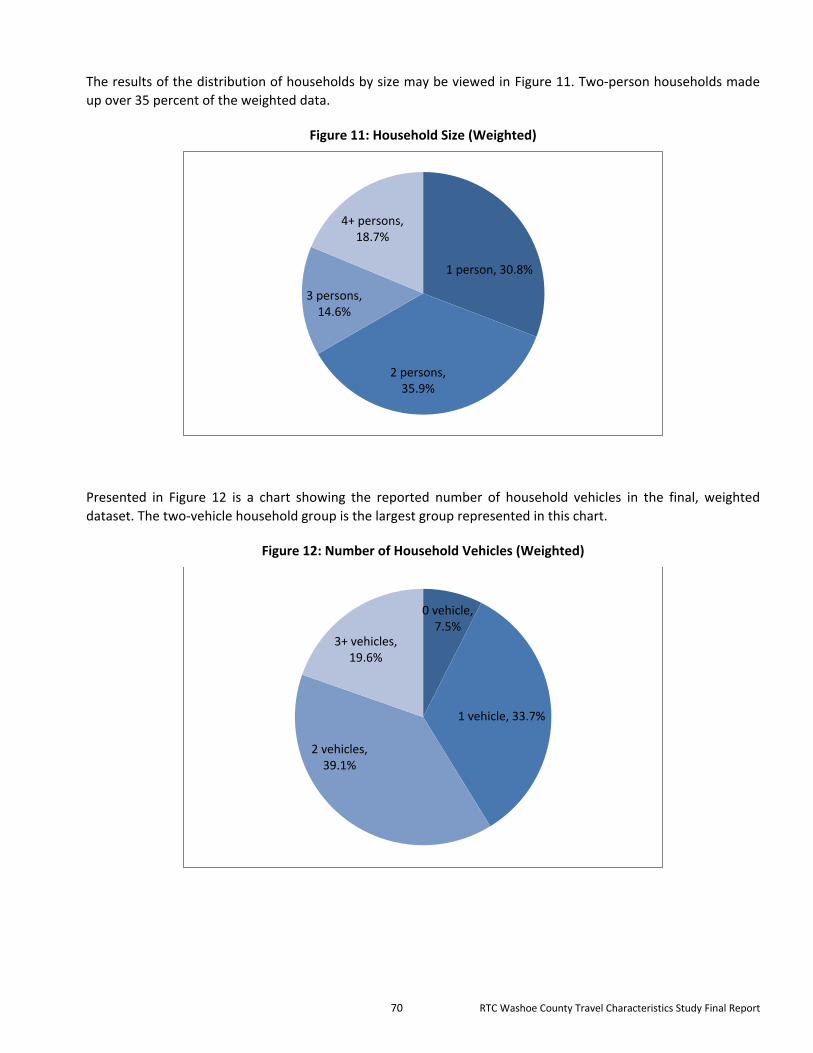
70 RTC Washoe County Travel Characteristics Study Final Report
The results of the distribution of households by size may be viewed in Figure 11. Two-person households made
up over 35 percent of the weighted data.
Figure 11: Household Size (Weighted)
Presented in Figure 12 is a chart showing the reported number of household vehicles in the final, weighted
dataset. The two-vehicle household group is the largest group represented in this chart.
Figure 12: Number of Household Vehicles (Weighted)
1 person, 30.8%
2 persons, 35.9%
3 persons, 14.6%
4+ persons, 18.7%
0 vehicle, 7.5%
1 vehicle, 33.7%
2 vehicles, 39.1%
3+ vehicles, 19.6%
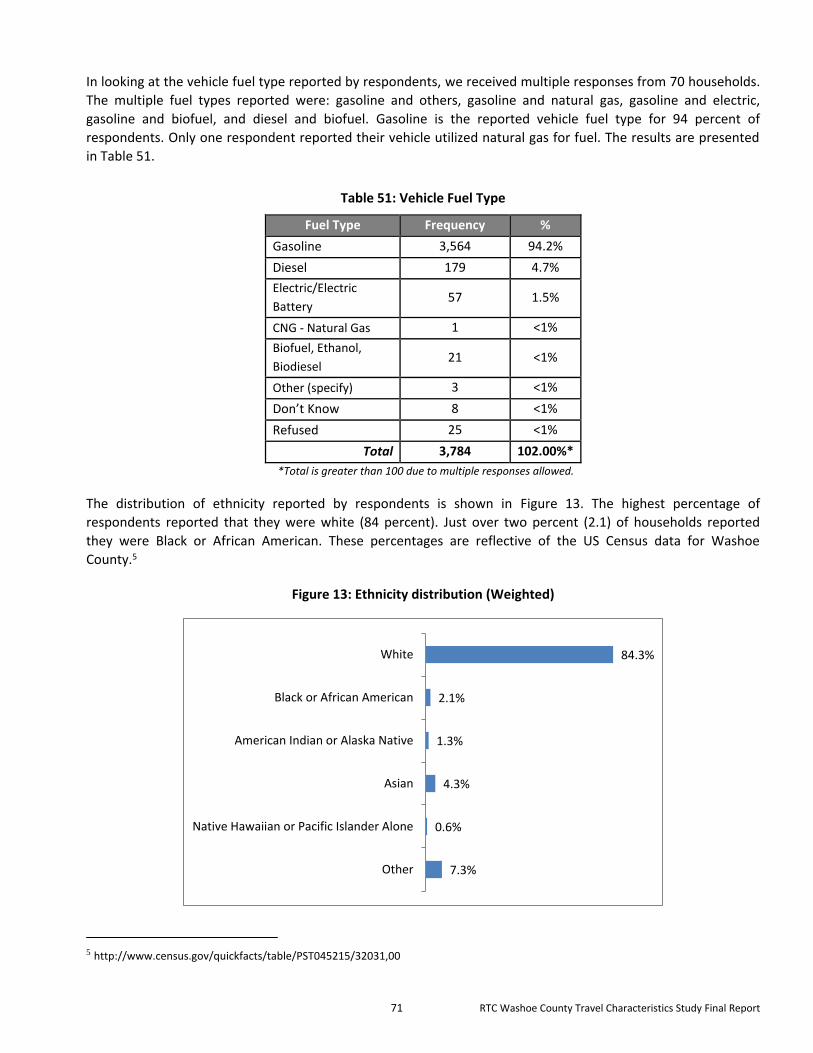
71 RTC Washoe County Travel Characteristics Study Final Report
In looking at the vehicle fuel type reported by respondents, we received multiple responses from 70 households.
The multiple fuel types reported were: gasoline and others, gasoline and natural gas, gasoline and electric,
gasoline and biofuel, and diesel and biofuel. Gasoline is the reported vehicle fuel type for 94 percent of
respondents. Only one respondent reported their vehicle utilized natural gas for fuel. The results are presented
in Table 51.
Table 51: Vehicle Fuel Type
Fuel Type Frequency %
Gasoline 3,564 94.2%
Diesel 179 4.7%
Electric/Electric
Battery 57 1.5%
CNG - Natural Gas 1 <1%
Biofuel, Ethanol,
Biodiesel 21 <1%
Other (specify) 3 <1%
Don’t Know 8 <1%
Refused 25 <1%
Total 3,784 102.00%*
*Total is greater than 100 due to multiple responses allowed.
The distribution of ethnicity reported by respondents is shown in Figure 13. The highest percentage of
respondents reported that they were white (84 percent). Just over two percent (2.1) of households reported
they were Black or African American. These percentages are reflective of the US Census data for Washoe
County.5
Figure 13: Ethnicity distribution (Weighted)
5 http://www.census.gov/quickfacts/table/PST045215/32031,00
84.3%
2.1%
1.3%
4.3%
0.6%
7.3%
White
Black or African American
American Indian or Alaska Native
Asian
Native Hawaiian or Pacific Islander Alone
Other

72 RTC Washoe County Travel Characteristics Study Final Report
Participation by households reporting their ethnicity as Hispanic was 16.7 percent. This percentage is six
percentage points lower than the information found on the US Census website (22.9 percent) for Washoe
County.6 The distribution is shown in Figure 14.
Figure 14: Proportion of Hispanic Household (Weighted)
The homeownership rate in Nevada is 54.8 percent.7 Respondents in the RTC HHTS report a home ownership
rate of 76.8 percent, and a rental rate of 22.9 percent.
Figure 15: Ownership of Household Residence (Weighted)
6 http://www.census.gov/quickfacts/table/PST045215/32031,00 7 https://research.stlouisfed.org/fred2/series/NVHOWN accessed 6/10/2016
Hispanic, 16.7%
Non-Hispanic, 83.3%
Own/Buying (Paying off Mortgage),
76.8%
Rent, 22.9%
Other, specify, 0.3%

73 RTC Washoe County Travel Characteristics Study Final Report
The most recent report available with regard to state level wireless only phone ownership is the National Health
Statistic Report, Number 70, issued December 18, 2013. As of December 2012, wireless only phone ownership in
the state of Nevada for adults age 18 and up was 38.9 percent.8 Approximately two percent of the population
has no phone at all. Wireless only phone ownership in western United States is estimated to be 46.9 percent as
of December 2014.9 The data collected with regard to landline phone ownership for the RTC HHTS shows that
nearly 80 percent of households in the RTC region own landline telephones. The results are presented in Table
52.
Table 52: Landlines in Household (Weighted)
Landlines in Household Frequency Percent
Yes 1,697 78.9%
No 453 21.1%
Total 2,150 100.00%
In looking at household annual income distribution, a total of five percent of households reported income in the
range of less than $10,000. The income range of $50,000 to $74,999 is the largest with 17.5 percent of
respondents reporting annual income in this range. The smallest percentage of households (1.2 percent)
responded their annual income range was $200,000 to $249,000. Household income distribution is illustrated in
Figure 16.
Figure 16: Illustrated Household Income* (Weighted)
*Income distribution excludes DK/RF
Nearly three-quarters (69.8 percent) of the RTC HHTS households reported having no students. A small
percentage (1.4 percent) reported having four or more students in their household. The distribution of the
reported number of students by household is shown in Table 53.
8 http://www.cdc.gov/nchs/data/nhsr/nhsr070.pdf accessed 6/10/2016 9 http://www.cdc.gov/nchs/data/nhis/earlyrelease/wireless201506.pdf accessed 6/10/2016
5.0%
16.2%
12.1%
12.0%
17.5%
14.8%
13.7%
4.7%
1.2%
2.7%
Less than $10,000
$10,000 to $24,999
$25,000 to $34,999
$35,000 to $49,999
$50,000 to $74,999
$75,000 to $99,999
$100,000 to $149,999
$150,000 to $199,999
$200,000 to $249,999
$250,000 or more
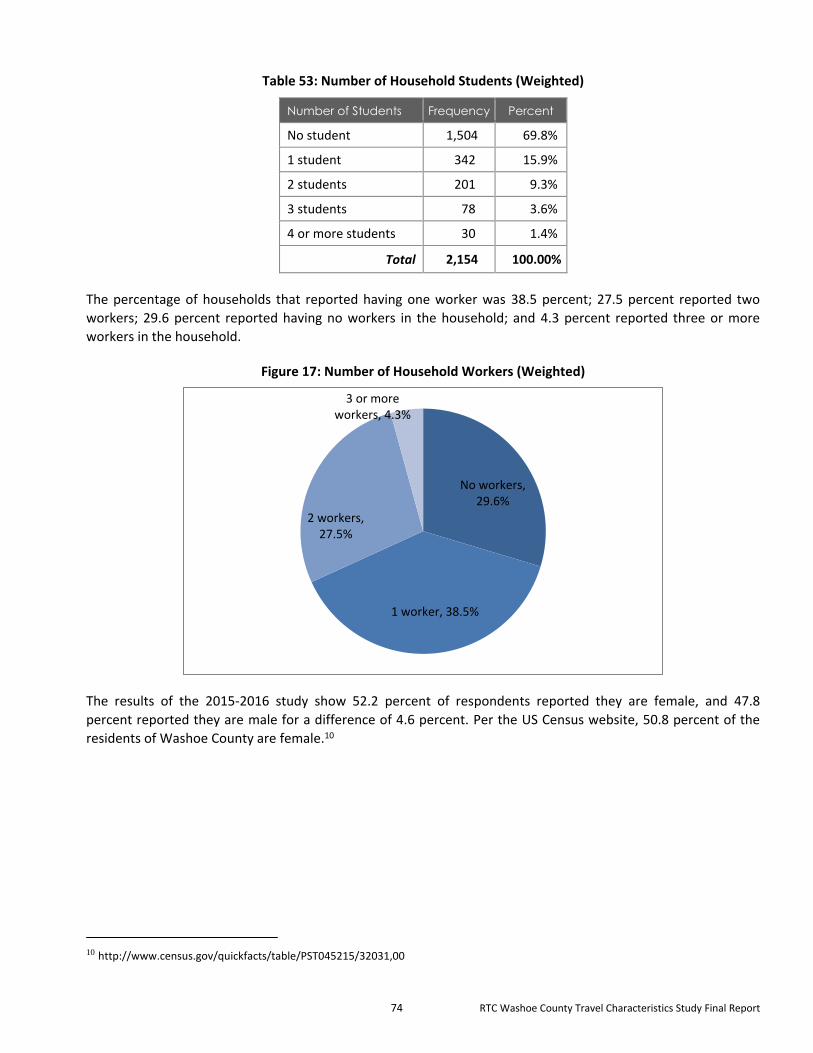
74 RTC Washoe County Travel Characteristics Study Final Report
Table 53: Number of Household Students (Weighted)
Number of Students Frequency Percent
No student 1,504 69.8%
1 student 342 15.9%
2 students 201 9.3%
3 students 78 3.6%
4 or more students 30 1.4%
Total 2,154 100.00%
The percentage of households that reported having one worker was 38.5 percent; 27.5 percent reported two
workers; 29.6 percent reported having no workers in the household; and 4.3 percent reported three or more
workers in the household.
Figure 17: Number of Household Workers (Weighted)
The results of the 2015-2016 study show 52.2 percent of respondents reported they are female, and 47.8
percent reported they are male for a difference of 4.6 percent. Per the US Census website, 50.8 percent of the
residents of Washoe County are female.10
10 http://www.census.gov/quickfacts/table/PST045215/32031,00
No workers, 29.6%
1 worker, 38.5%
2 workers, 27.5%
3 or more workers, 4.3%

75 RTC Washoe County Travel Characteristics Study Final Report
Figure 18: Gender Participation (Weighted)
Respondent age was reported by the age distribution shown in Table 54.
Table 54: Respondent Age Distribution (Weighted)
Age Distribution Frequency Percent
<20 years old 1,105 24.49%
20-34 866 19.19%
35-54 1,191 26.41%
55 – 64 662 14.68%
65+ 687 15.23%
Total 4,510 100.00%
The disability rate for the 2015-2016 study at eight percent was one percent higher than reported in the 2005
study.
Male, 47.8%
Female, 52.2%

76 RTC Washoe County Travel Characteristics Study Final Report
Figure 19: Respondent Disability Status (Weighted)
The 2015-2016 RTC HHTS asked respondents to provide their employment status in the capacity of full-time,
and/or part-time paid employment. The questionnaire allowed for respondents to enter information about
primary and secondary jobs. The results of the employment status question are presented in Figure 20.
Table 55 provides the information on the number of jobs, as reported by respondents. Most of the respondents
(94 percent) reported having only one job.
Figure 20: Respondent Employment Status (Weighted)
Yes, 8.3%
No, 91.7%
YES - Full Time, 44.4%
YES - Part Time, 13.7%
NO, 41.9%
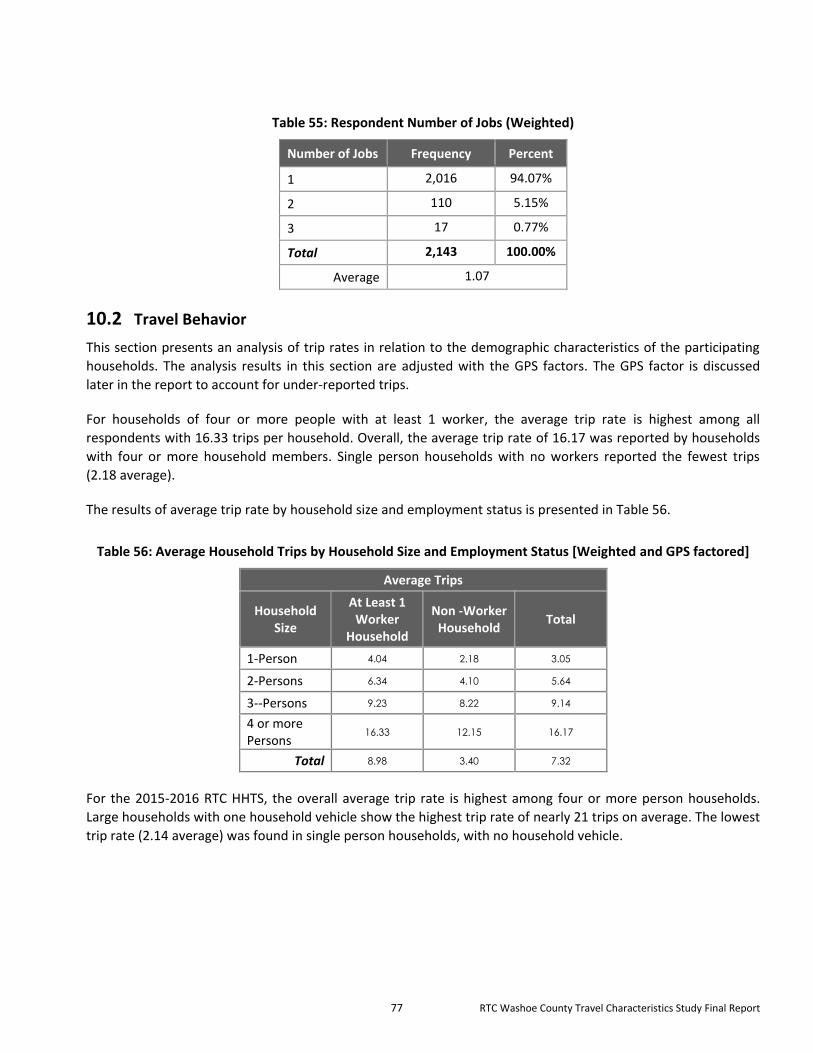
77 RTC Washoe County Travel Characteristics Study Final Report
Table 55: Respondent Number of Jobs (Weighted)
Number of Jobs Frequency Percent
1 2,016 94.07%
2 110 5.15%
3 17 0.77%
Total 2,143 100.00%
Average 1.07
10.2 Travel Behavior
This section presents an analysis of trip rates in relation to the demographic characteristics of the participating
households. The analysis results in this section are adjusted with the GPS factors. The GPS factor is discussed
later in the report to account for under-reported trips.
For households of four or more people with at least 1 worker, the average trip rate is highest among all
respondents with 16.33 trips per household. Overall, the average trip rate of 16.17 was reported by households
with four or more household members. Single person households with no workers reported the fewest trips
(2.18 average).
The results of average trip rate by household size and employment status is presented in Table 56.
Table 56: Average Household Trips by Household Size and Employment Status [Weighted and GPS factored]
Average Trips
Household Size
At Least 1 Worker
Household
Non -Worker Household
Total
1-Person 4.04 2.18 3.05
2-Persons 6.34 4.10 5.64
3--Persons 9.23 8.22 9.14
4 or more Persons
16.33 12.15 16.17
Total 8.98 3.40 7.32
For the 2015-2016 RTC HHTS, the overall average trip rate is highest among four or more person households.
Large households with one household vehicle show the highest trip rate of nearly 21 trips on average. The lowest
trip rate (2.14 average) was found in single person households, with no household vehicle.

78 RTC Washoe County Travel Characteristics Study Final Report
Table 57: Average Household Trips by Household Size and Number of Household Vehicles [Weighted and GPS factored]
Average Trips
Household Vehicles
1 – Person Household
2 - Persons Household
3- Persons Household
4 or More Persons
Household Total
No Vehicle 2.14 5.64 13.48 8.95 3.77
1 – Vehicle 3.11 5.68 9.62 20.92 4.99
2 – Vehicles 3.93 5.61 9.36 17.84 8.89
3 or more Vehicles
3.07 5.69 8.55 14.02 9.56
Total 3.05 5.64 9.14 16.17 7.32
As has been the trend for the RTC HHTS, four or more person households report the highest average trip rate
among all household size and household income strata. The highest average trip rate (18.2) was reported by
households of four or more persons with a household income of $50,000 to $74,999. The next highest average
trip rate (17.9) was found in households of four or more persons reporting an income of $100,000 or more.
Table 58: Average Household Trips by Household Size and Household Income [Weighted and GPS factored]
Average Trips
Household Income 1 – Person Household
2 - Persons Household
3- Persons Household
4 or more Persons
Household Total
Less than $25,000 2.59 5.13 12.41 14.05 4.87
$25,000 to $49,999 3.45 5.36 9.95 14.58 6.50
$50,000 to $74,999 4.19 6.49 9.28 18.20 8.93
$75,000 to $99,999 3.59 5.63 7.23 14.03 7.65
$100,000 or more 3.30 6.20 9.45 17.93 10.44
Don't know/refused 1.94 4.41 5.83 13.16 4.65
Total 3.05 5.64 9.14 16.17 7.32
Average trip rates by age group, gender, and age and gender, are presented in Table 59, Table 60, and Table 61.
Table 59: Average Trips per Person by Age Group [Weighted]
Age Person Trip Count Trip Rate
<25 years old 1,336 4,151 3.11
25-34 634 2,097 3.31
35-54 1,191 5,000 4.20
55-64 662 2,398 3.62

79 RTC Washoe County Travel Characteristics Study Final Report
Age Person Trip Count Trip Rate
65 or older 687 1,872 2.73
Don't know/refused 85 258 3.04
Total 4,595 15,776 3.43
Table 60: Average Trips per Person by Gender [Weighted]
Age Person Trip Count Trip Rate
Male 2,180 7,384 3.39
Female 2,378 8,214 3.45
DK/RF 37 178 4.82
Total 4,595 15,776 3.43
Table 61: Average Trips per Person by Age and Gender [Weighted]
Gender Age Person Trip Count Trip Rate
Male
<25 years old 657 2,028 3.09
25-34 294 898 3.05
35-54 580 2,376 4.10
55-64 306 1,133 3.70
65 or older 316 869 2.75
Don't know/refused
27 80 2.94
Total 2,180 7,384 3.39
Female
<25 years old 661 2,038 3.08
25-34 340 1,200 3.53
35-54 607 2,575 4.24
55-64 356 1,265 3.56
65 or older 371 1,003 2.71
Don't know/refused
43 134 3.13
Total 2,378 8,214 3.45
Gender Refused
<25 years old 18 85 4.65
25-34 0 0 -
35-54 4 49 12.94
55-64 0 0 -
65 or older 0 0 -
Don't know/refused
15 44 2.98
Total 37 178 4.82

80 RTC Washoe County Travel Characteristics Study Final Report
10.3 Trip Characteristics
This section presents the characteristics of the trips themselves. Specific data elements collected were: main
purpose of travel (activity); mode of travel; and travel times.
Respondents were asked to record the activity they participated in at each trip destination. Aside from activities
at home/work/school that initiated the trips, routine shopping (8.6 percent), pick up/drop off passengers (8.1
percent), social/visit friends/relatives (4 percent), and eat meal restaurant/diner (3.8 percent) were the main
other activities performed. Trip distribution by activity is shown in Table 62.
Table 62: Trip Distribution by Activity [weighted]
Activity Trip
Counts Percent
At Home
Personal activities (sleeping, personal care, leisure, chores, etc.) 4,401 27.9%
Preparing meals / eating 405 2.6%
Hosting visitors / entertaining guests 17 .1%
Exercise (with or without equipment) / playing sports 25 .2%
Study / schoolwork 105 .7%
Work for pay at home using telecommunications equipment 63 .4%
Using computer / telephone / cell or smartphone or other communications device for personal activities 116
.7%
All other activities at home 381 2.4%
At Work
Work / job duties 1,927 12.2%
Training 24 .2%
Meals at work 15 .1%
Work sponsored social activities (holiday or birthday celebrations, etc.) 4 .0%
Non-work related activities (social clubs, etc.) 16 .1%
Exercise / sports 11 .1%
Volunteer work / activities 78 .5%
All other work-related activities 85 .5%
At School
In School / classroom / laboratory 973 6.2%
Meals at school / college 3 .0%
After school or non-class-related sports / physical activity 50 .3%
All other after-school or non-class-related activities (library, band rehearsal, clubs, etc.) 77 .5%
Quick Stops / Trips
Change of transportation / transfer 385 2.4%
Pickup / drop off passenger(s) 1,271 8.1%
Drive-through meals (snacks, coffee, etc.) 228 1.4%
Drive-through other (ATM, bank, etc.) 153 1.0%
At Other Places
Work related (meeting, sales call, delivery) 197 1.2%
Service private vehicle (gas, oil, lube, repairs) 226 1.4%
Routine shopping (groceries, clothing, convenience store, household maintenance) 1,363 8.6%
Shopping for major purchases or specialty items (appliances, electronics, new vehicle, major 278 1.8%

81 RTC Washoe County Travel Characteristics Study Final Report
Activity Trip
Counts Percent
household repairs)
Household errands (bank, dry cleaning, etc.) 129 .8%
Personal business (visit government office, attorney, accountant) 224 1.4%
Eat meal at restaurant / diner 596 3.8%
Health care (doctor, dentist, eye care, chiropractor, veterinarian) 437 2.8%
Civic/religious activities 169 1.1%
Outdoor exercise (sports, jogging, bicycling, walking, walking dog, etc.) 238 1.5%
Indoor exercise (gym, yoga, etc.) 246 1.6%
Entertainment (movies, watch sports, etc.) 231 1.5%
Social / visit friends / relatives 630 4.0%
Total 15,776 100.0%
10.3.1 Mode Choice
For each trip, respondents were asked to provide the mode of travel they used. The distribution of trips by mode
collected from the survey is shown in Table 63. The most popular travel mode choice was Auto / Van / Truck
Driver with 66.8 percent of trips made using this mode. The next most popular mode was Auto / Van / Truck
Passenger with 19.5 percent of trips being made using this mode.
Table 63: Trip Distribution by Travel Mode [weighted and GPS factored]
Mode Frequency Percent
Walk 1,049 6.5%
Bike 178 1.1%
Wheelchair / Mobility Scooter 4 .0%
Other Non-Motorized (skateboard, etc.) 19 .1%
Auto / Van / Truck Driver 10,252 66.8%
Auto / Van / Truck Passenger 3,268 19.5%
Carpool / Vanpool (RTC Trip Match) 52 .4%
Motorcycle / Scooter / Moped 31 .2%
Taxi / Hired Car / Limo 11 .1%
Rental Car / Vehicle 88 .5%
Private Shuttle (Employer, Hotel, etc.) 22 .1%
Airplane 19 .1%
Other Private Transit 24 .1%
RTC Transit 363 2.14%
RTC Access (paratransit services) 21 .1%
RTC Vanpool 0 0.00%
Amtrak 0 0.00%
School Bus 363 2.1%
Other Bus 11 .1%
Total 15,776 100.0%
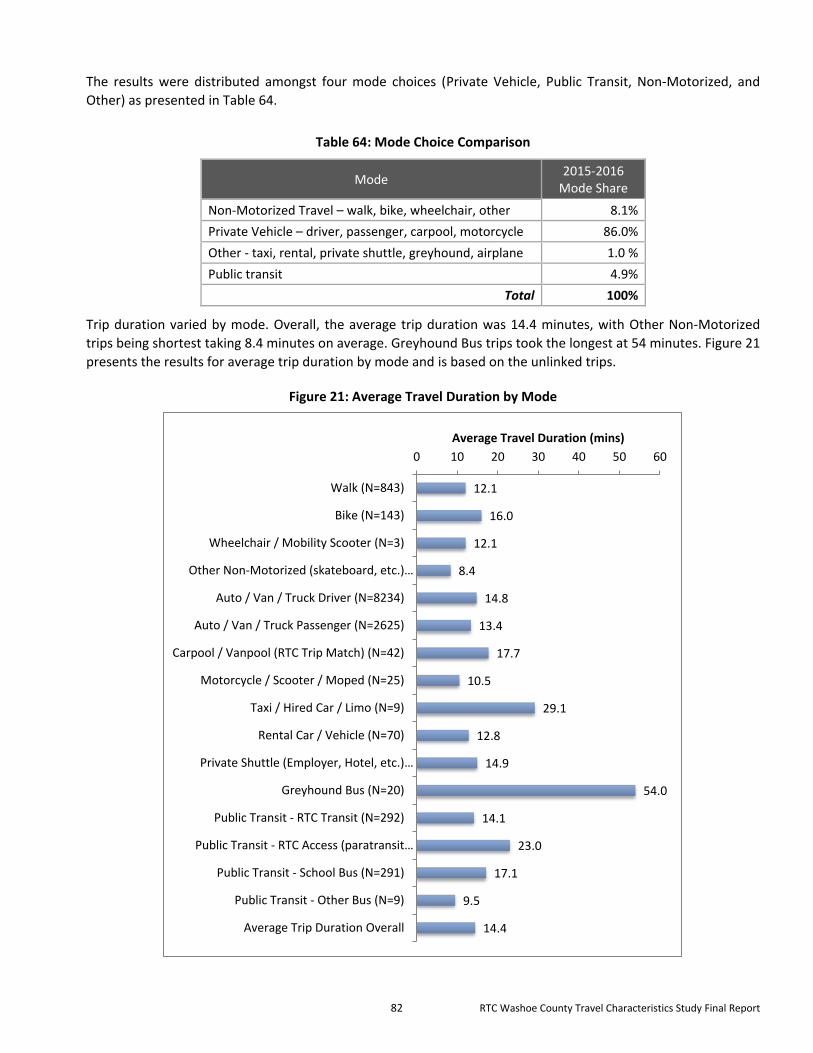
82 RTC Washoe County Travel Characteristics Study Final Report
The results were distributed amongst four mode choices (Private Vehicle, Public Transit, Non-Motorized, and
Other) as presented in Table 64.
Table 64: Mode Choice Comparison
Mode 2015-2016
Mode Share
Non-Motorized Travel – walk, bike, wheelchair, other 8.1%
Private Vehicle – driver, passenger, carpool, motorcycle 86.0%
Other - taxi, rental, private shuttle, greyhound, airplane 1.0 %
Public transit 4.9%
Total 100%
Trip duration varied by mode. Overall, the average trip duration was 14.4 minutes, with Other Non-Motorized
trips being shortest taking 8.4 minutes on average. Greyhound Bus trips took the longest at 54 minutes. Figure 21
presents the results for average trip duration by mode and is based on the unlinked trips.
Figure 21: Average Travel Duration by Mode
12.1
16.0
12.1
8.4
14.8
13.4
17.7
10.5
29.1
12.8
14.9
54.0
14.1
23.0
17.1
9.5
14.4
0 10 20 30 40 50 60
Walk (N=843)
Bike (N=143)
Wheelchair / Mobility Scooter (N=3)
Other Non-Motorized (skateboard, etc.)…
Auto / Van / Truck Driver (N=8234)
Auto / Van / Truck Passenger (N=2625)
Carpool / Vanpool (RTC Trip Match) (N=42)
Motorcycle / Scooter / Moped (N=25)
Taxi / Hired Car / Limo (N=9)
Rental Car / Vehicle (N=70)
Private Shuttle (Employer, Hotel, etc.)…
Greyhound Bus (N=20)
Public Transit - RTC Transit (N=292)
Public Transit - RTC Access (paratransit…
Public Transit - School Bus (N=291)
Public Transit - Other Bus (N=9)
Average Trip Duration Overall
Average Travel Duration (mins)
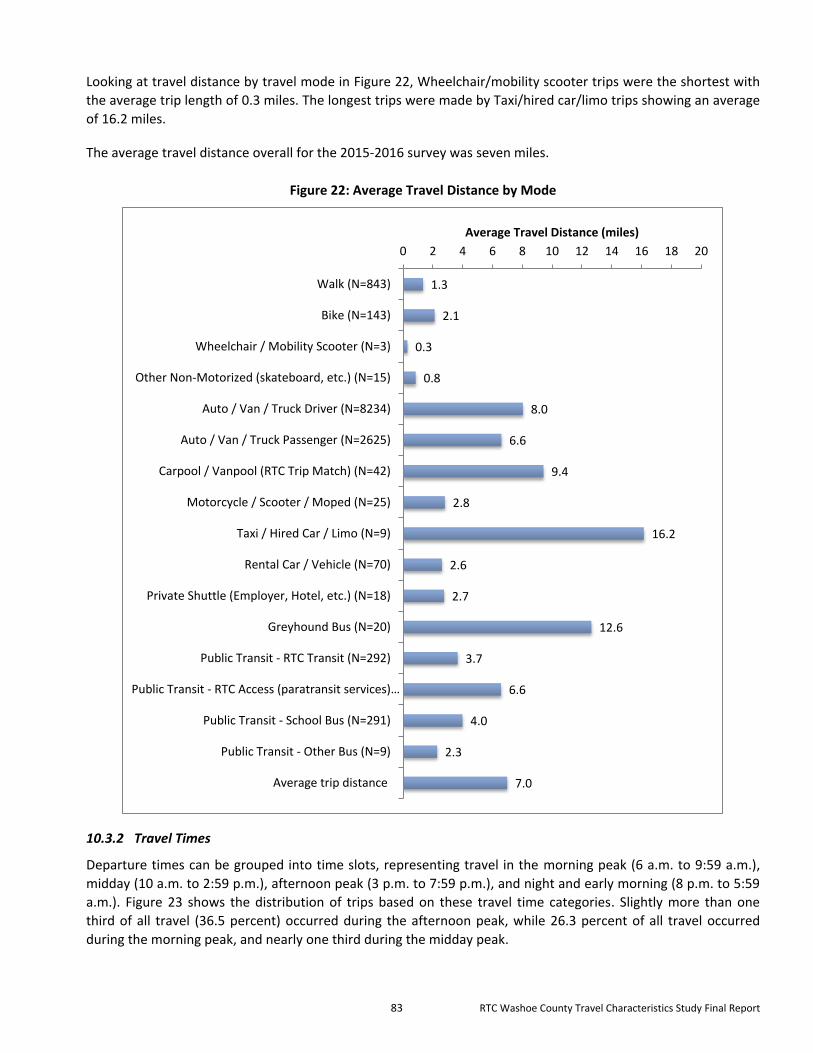
83 RTC Washoe County Travel Characteristics Study Final Report
Looking at travel distance by travel mode in Figure 22, Wheelchair/mobility scooter trips were the shortest with
the average trip length of 0.3 miles. The longest trips were made by Taxi/hired car/limo trips showing an average
of 16.2 miles.
The average travel distance overall for the 2015-2016 survey was seven miles.
Figure 22: Average Travel Distance by Mode
10.3.2 Travel Times
Departure times can be grouped into time slots, representing travel in the morning peak (6 a.m. to 9:59 a.m.),
midday (10 a.m. to 2:59 p.m.), afternoon peak (3 p.m. to 7:59 p.m.), and night and early morning (8 p.m. to 5:59
a.m.). Figure 23 shows the distribution of trips based on these travel time categories. Slightly more than one
third of all travel (36.5 percent) occurred during the afternoon peak, while 26.3 percent of all travel occurred
during the morning peak, and nearly one third during the midday peak.
1.3
2.1
0.3
0.8
8.0
6.6
9.4
2.8
16.2
2.6
2.7
12.6
3.7
6.6
4.0
2.3
7.0
0 2 4 6 8 10 12 14 16 18 20
Walk (N=843)
Bike (N=143)
Wheelchair / Mobility Scooter (N=3)
Other Non-Motorized (skateboard, etc.) (N=15)
Auto / Van / Truck Driver (N=8234)
Auto / Van / Truck Passenger (N=2625)
Carpool / Vanpool (RTC Trip Match) (N=42)
Motorcycle / Scooter / Moped (N=25)
Taxi / Hired Car / Limo (N=9)
Rental Car / Vehicle (N=70)
Private Shuttle (Employer, Hotel, etc.) (N=18)
Greyhound Bus (N=20)
Public Transit - RTC Transit (N=292)
Public Transit - RTC Access (paratransit services)…
Public Transit - School Bus (N=291)
Public Transit - Other Bus (N=9)
Average trip distance
Average Travel Distance (miles)

84 RTC Washoe County Travel Characteristics Study Final Report
Figure 23: Trip Distribution by Time of Day Based on Departure Hour
In examining hourly trip distribution, the highest peak hours of travel were 2 p.m. to 6 p.m. The hour between 3
p.m. and 4 p.m. shows the highest percentage of all trips with 9.2 percent of trips reported as falling in that time
frame. These results are shown in Figure 24 utilizing a 24 hour time scale.
Figure 24: Hourly Trip Distribution by Departure Hours
26.3%
29.6%
36.5%
7.6%
0.0%
5.0%
10.0%
15.0%
20.0%
25.0%
30.0%
35.0%
40.0%
Morning Peak Midday Afternoon Peak Night
.1% .1% .1% .1%.6%
1.3%
4.6%
8.6%8.2%
4.9%4.8%5.1%
6.1%5.7%
7.9%
9.2%9.0%8.8%
5.4%
4.0%
2.5%
1.4%.8% .6%
-1%
1%
3%
5%
7%
9%
11%
13%
15%
0 1 2 3 4 5 6 7 8 9 10 11 12 13 14 15 16 17 18 19 20 21 22 23
Time of Day (Hour)

85 RTC Washoe County Travel Characteristics Study Final Report
10.4 Activity-Based Survey Results
One activity was collected for each place visited. The number of activities by home, school, work and other are presented in Table 65.
Table 65: Number of Activities by Place Type (Home, Work, School, and Other)
Place Type Counts Percentages
Home 5,513 34.9%
Work 2,160 13.7%
School 1,104 7.0%
Other 7,000 44.4%
Total 15,776 100.0%
The average travel duration reported for the Training category was 56.62 minutes, which was the longest travel
duration. Respondents reported 24.29 minutes average travel duration for the “Meals at work” category, which
was the second longest travel duration. Overall, the average travel duration was 14.44 minutes. Table 66
presents the average travel duration by activity excluding airplane mode travel.
Table 66: Average Travel Duration by Activity [Weighted]
Activity at Visited Place Mean N
Personal activities (sleeping, personal care, leisure, chores) 14.20 4,400
Preparing meals/eating 13.38 405
Hosting visitors/entertaining guests 21.56 17
Exercise (with or without equipment)/playing sports 9.15 25
Study / schoolwork 13.59 105
Work for pay at home using telecommunications equipment 12.48 63
Using computer/telephone/cell or smart phone or other
communications device for personal activities 12.94 116
All other activities at my home 13.65 381
Work/job duties 16.42 1,927
Training 56.62 24
Meals at work 24.29 15
Work-sponsored social activities (holiday or birthday celebrations,
etc.) 16.65 4
Non-work related activities (social clubs, etc.) 11.69 16
Exercise/sports 12.40 11
Volunteer work/activities 9.56 78
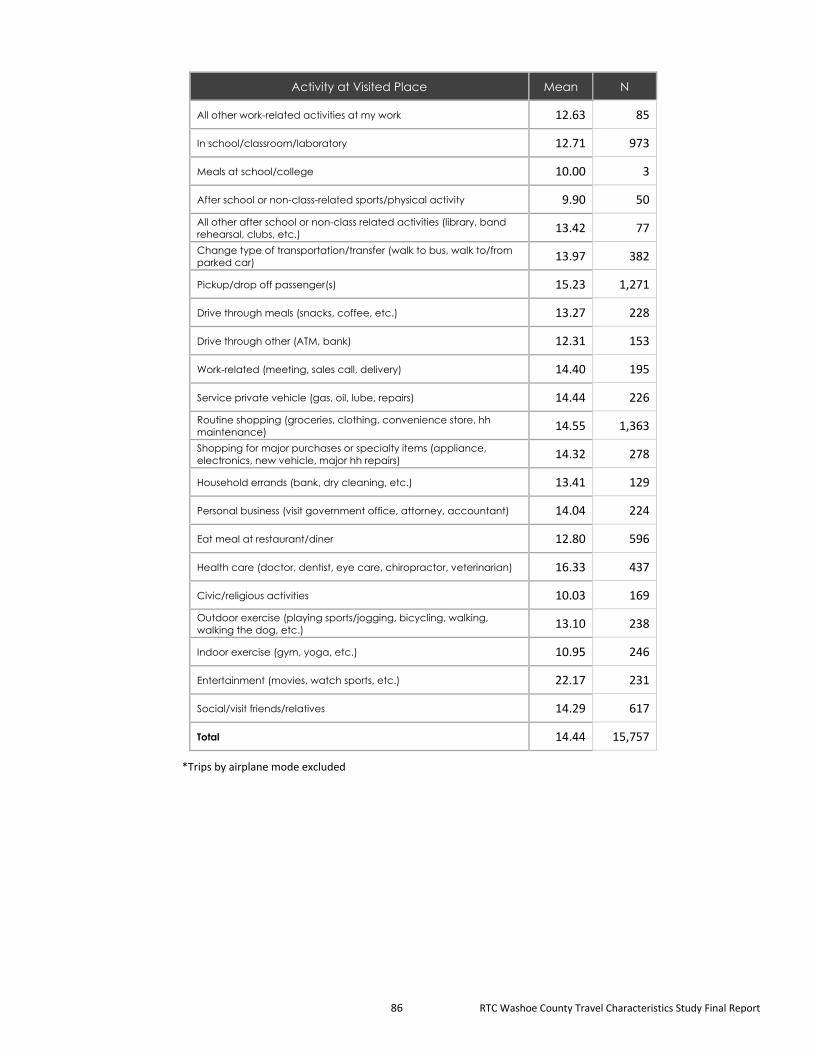
86 RTC Washoe County Travel Characteristics Study Final Report
Activity at Visited Place Mean N
All other work-related activities at my work 12.63 85
In school/classroom/laboratory 12.71 973
Meals at school/college 10.00 3
After school or non-class-related sports/physical activity 9.90 50
All other after school or non-class related activities (library, band
rehearsal, clubs, etc.) 13.42 77
Change type of transportation/transfer (walk to bus, walk to/from
parked car) 13.97 382
Pickup/drop off passenger(s) 15.23 1,271
Drive through meals (snacks, coffee, etc.) 13.27 228
Drive through other (ATM, bank) 12.31 153
Work-related (meeting, sales call, delivery) 14.40 195
Service private vehicle (gas, oil, lube, repairs) 14.44 226
Routine shopping (groceries, clothing, convenience store, hh
maintenance) 14.55 1,363
Shopping for major purchases or specialty items (appliance,
electronics, new vehicle, major hh repairs) 14.32 278
Household errands (bank, dry cleaning, etc.) 13.41 129
Personal business (visit government office, attorney, accountant) 14.04 224
Eat meal at restaurant/diner 12.80 596
Health care (doctor, dentist, eye care, chiropractor, veterinarian) 16.33 437
Civic/religious activities 10.03 169
Outdoor exercise (playing sports/jogging, bicycling, walking,
walking the dog, etc.) 13.10 238
Indoor exercise (gym, yoga, etc.) 10.95 246
Entertainment (movies, watch sports, etc.) 22.17 231
Social/visit friends/relatives 14.29 617
Total 14.44 15,757
*Trips by airplane mode excluded

87 RTC Washoe County Travel Characteristics Study Final Report
11.0 Limitations of the Survey
As with every survey and the resulting dataset and findings, the RTC HHTS experienced a few limitations. Each
limitation is described in the following sections, and is presented in no particular order.
Sample Performance
When preparing a sampling plan, certain assumptions are made based on prior experience. For the RTC HHTS,
the estimated overall recruitment response rate was six percent. The actual overall recruitment response rate for
the RTC HHTS overall was four percent (see Table 41). When looking at the type of sample and its performance,
matched address-based sample, matched cell sample, and the listed RDD sampling frame performed at or near
the expected six percent response rate, while all others fell below the six percent expected response rate.
For retrieval, typically 65 to 67 percent of the recruited households will complete the retrieval questionnaire and
report their travel. Overall, only 64 percent of recruited households for the RTC HHTS completed retrieval. This is
significant because a large amount of effort is invested in recruiting households, shipping retrieval materials, and
making repeated attempts to collect travel data. In addition to telephone calls, reminders were sent via email
and text message on a weekly basis to households prompting them to report travel information.
The fact that both recruitment and retrieval failed to meet the expected goals impacted negatively on the budget
and schedule, ultimately creating a shortfall in completed households.
Underrepresentation of Smartphone GPS Households
The sampling plan for the RTC HHTS had targeted an even split of GPS technologies with 50 percent of the GPS
households utilizing GPS data loggers and the remaining 50 percent utilizing RouteScout (RS) to collect GPS data
points over a seven day assigned travel period. The inequity of the split was monitored throughout data
collection, with attempts to balance it made on several occasions. When the inequality was first identified, a
portion of the sample flagged for GPS data logger was reflagged as RS in attempt to balance the two groups more
equally. This method of reflagging a portion of the GPS data logger sample was repeated on a few occasions
during data collection. The refusal rate of RS selected households was particularly high, and an evaluation was
performed of the reasons for refusal. The primary explanation given by selected households for refusing to
participate using the smartphone technology was they were concerned that downloading the smartphone app
would provide a two-way portal to the personal data stored on their smartphones. The technology is too new for
participants to research to find out that this is not possible with the app used for this particular study. The
secondary explanation provided was that household members age 12 and up did not all own smartphones,
therefore the entire household was not able to participate utilizing the smartphone technology. At the end of
data collection, recruitment of households utilizing GPS data loggers was 16 percent greater than that of RS
households; and retrieval showed an even greater gap with 36 percent more GPS data logger households
completing retrieval.
Improving the communication about how the smartphone technology works is warranted for future studies in
which this GPS technology will be used. Smartphone GPS technology is considered one of the most promising
innovations for use in HHTS. The expectation is that more information about the limits of the research firm’s
ability to access participants’ smartphones will be more accessible to the general public and will alleviate this
fear.

88 RTC Washoe County Travel Characteristics Study Final Report
12.0 Recommendations for Future Survey Improvement
Several recommendations are made with regard specifically to the retrieval module. For this survey, we utilized
NuTripX, a proprietary real-time geocoding program built by NuStats. The suggestions included in the bullet-
points below also include the reason for the modification when further clarification is needed.
Embed NTX as a seamless transition from Voxco, and back again to reduce partial completes.
o Respondents that self-reported had difficulty returning to Voxco after completing the travel
information entry in NTX. NuStats assumes the respondents didn’t understand they needed to
return to Voxco to finish the survey. Our team is working on embedding the NTX survey
questions in the Voxco survey in a way that will make it seamless for the respondents to
transition from Voxco to NTX and back to Voxco.
Modify instructions to make them more user friendly for less tech-savvy people.
o A small percentage of respondents required assistance with completing the NTX portion of their
surveys. Our team is working to develop more clearly defined instructions that should help those
having difficulty navigating NTX to be able to do so without assistance.
Enable respondents to plot Home/School/Work as available per household member prior to beginning the mapping portion, which would make the information available to reference during the travel data collection.
Add the ability to move waypoints after they are plotted. o This is helpful when utilizing cross streets and verifying locations with respondents.
Display trip lines from location to location. o This provides a visual for respondents to see their route.
Add ability to correct the time without deleting the location. o Currently NTX does not allow a change in the time entered after location is entered and requires
the location be removed and re-entered to modify the time.
Allow one person to enter travel data for household members that traveled together, rather than on an individual basis.
o Currently, the NTX program only allows completion of travel information on an individual basis. Our programming team is working to change this to allow travel to be entered for multiple household members for the occasions they travel together. This will reduce respondent burden.
Allow entry of up to 3 activities at each stop; this matches the diary.
Include an automatic QC check for trip duration and length so that it does not need to be done in post-processing and can be fixed by the respondent when an unrealistic speed is found.
Modify screenflow to enter locations and answer location questions place by place to improve user experience and reduce error.
Add question “Did you park a car?” o The questionnaire did not include this question, but asked several parking questions. By adding
“Did you park a car?” to the retrieval questionnaire, respondents that answered “no” to this question would automatically skip all related parking questions.
The main survey was conducted in Spanish which involved translating all of the survey printed materials (diary
and GPS) as well as the cover letters and CATI and online scripts into Spanish. Only 28 households requested at
the end of the recruitment interview to receive the Spanish version of the survey package. This is less than one
percent of the recruited households, and indicates that the majority of Hispanic households in the RTC HHTS
preferred the English versions. For future surveys, it is recommended that bi-lingual interviewers be available to
assist participants requiring the Spanish version of the survey. This will save the cost of printing materials, and
programming the surveys in Spanish, but will still serve to collect data from Spanish speaking households.

89 RTC Washoe County Travel Characteristics Study Final Report
Appendix A – Examples of the Notification Postcards
The images in Figure 25 are of the notification postcards that were sent to Non-GPS, RouteScout, and GPS
households.
Figure 25: Notification GPS and Non-GPS Postcards
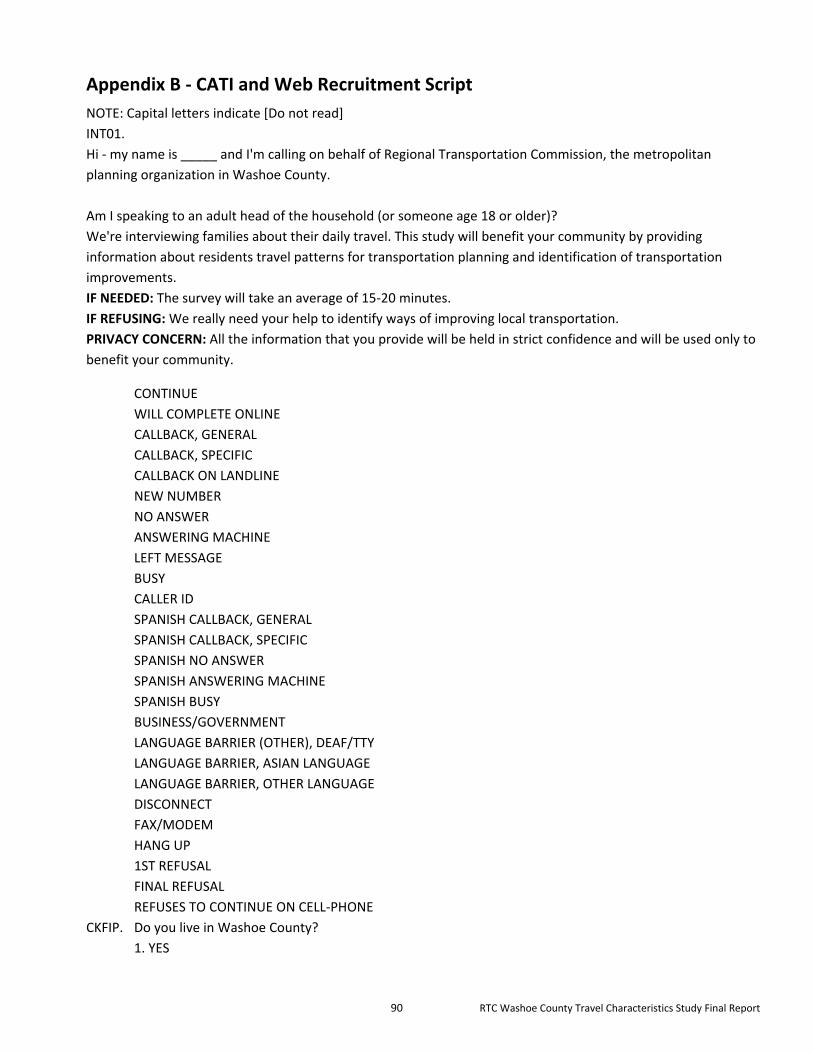
90 RTC Washoe County Travel Characteristics Study Final Report
Appendix B - CATI and Web Recruitment Script
NOTE: Capital letters indicate [Do not read]
INT01.
Hi - my name is _____ and I'm calling on behalf of Regional Transportation Commission, the metropolitan
planning organization in Washoe County.
Am I speaking to an adult head of the household (or someone age 18 or older)?
We're interviewing families about their daily travel. This study will benefit your community by providing
information about residents travel patterns for transportation planning and identification of transportation
improvements.
IF NEEDED: The survey will take an average of 15-20 minutes.
IF REFUSING: We really need your help to identify ways of improving local transportation.
PRIVACY CONCERN: All the information that you provide will be held in strict confidence and will be used only to
benefit your community.
CONTINUE
WILL COMPLETE ONLINE
CALLBACK, GENERAL
CALLBACK, SPECIFIC
CALLBACK ON LANDLINE
NEW NUMBER
NO ANSWER
ANSWERING MACHINE
LEFT MESSAGE
BUSY
CALLER ID
SPANISH CALLBACK, GENERAL
SPANISH CALLBACK, SPECIFIC
SPANISH NO ANSWER
SPANISH ANSWERING MACHINE
SPANISH BUSY
BUSINESS/GOVERNMENT
LANGUAGE BARRIER (OTHER), DEAF/TTY
LANGUAGE BARRIER, ASIAN LANGUAGE
LANGUAGE BARRIER, OTHER LANGUAGE
DISCONNECT
FAX/MODEM
HANG UP
1ST REFUSAL
FINAL REFUSAL
REFUSES TO CONTINUE ON CELL-PHONE
CKFIP. Do you live in Washoe County?
1. YES
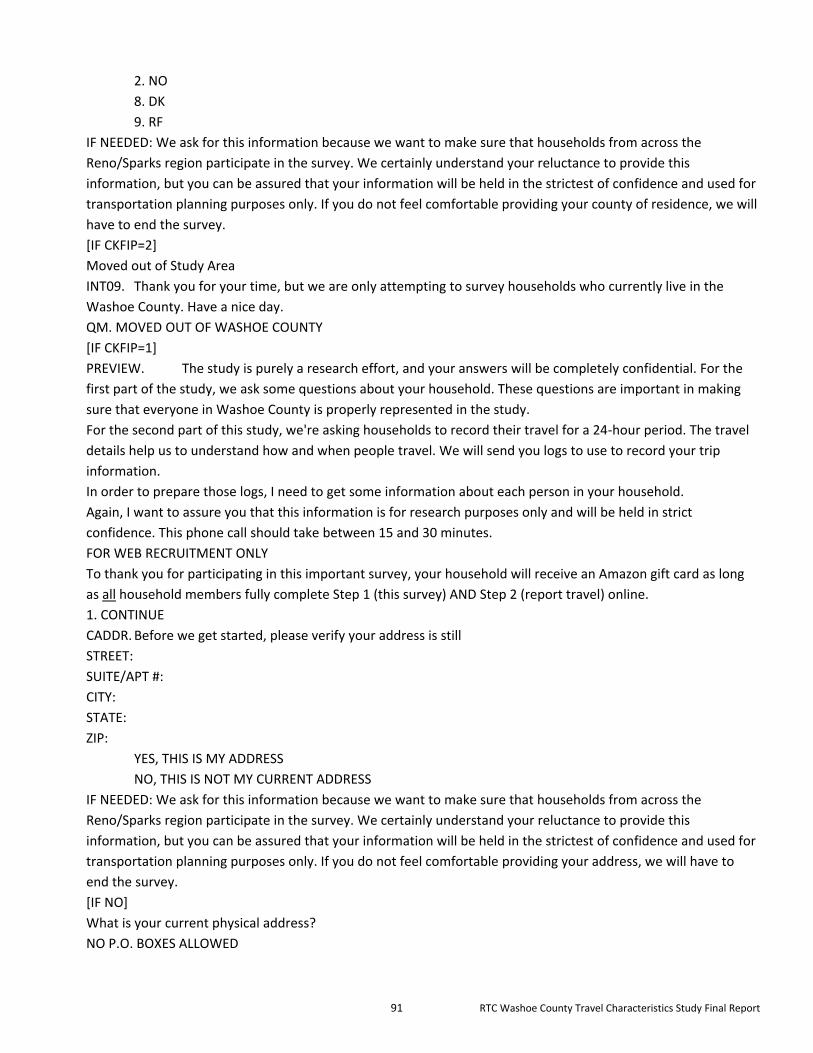
91 RTC Washoe County Travel Characteristics Study Final Report
2. NO
8. DK
9. RF
IF NEEDED: We ask for this information because we want to make sure that households from across the
Reno/Sparks region participate in the survey. We certainly understand your reluctance to provide this
information, but you can be assured that your information will be held in the strictest of confidence and used for
transportation planning purposes only. If you do not feel comfortable providing your county of residence, we will
have to end the survey.
[IF CKFIP=2]
Moved out of Study Area
INT09. Thank you for your time, but we are only attempting to survey households who currently live in the
Washoe County. Have a nice day.
QM. MOVED OUT OF WASHOE COUNTY
[IF CKFIP=1]
PREVIEW. The study is purely a research effort, and your answers will be completely confidential. For the
first part of the study, we ask some questions about your household. These questions are important in making
sure that everyone in Washoe County is properly represented in the study.
For the second part of this study, we're asking households to record their travel for a 24-hour period. The travel
details help us to understand how and when people travel. We will send you logs to use to record your trip
information.
In order to prepare those logs, I need to get some information about each person in your household.
Again, I want to assure you that this information is for research purposes only and will be held in strict
confidence. This phone call should take between 15 and 30 minutes.
FOR WEB RECRUITMENT ONLY
To thank you for participating in this important survey, your household will receive an Amazon gift card as long
as all household members fully complete Step 1 (this survey) AND Step 2 (report travel) online.
1. CONTINUE
CADDR. Before we get started, please verify your address is still
STREET:
SUITE/APT #:
CITY:
STATE:
ZIP:
YES, THIS IS MY ADDRESS
NO, THIS IS NOT MY CURRENT ADDRESS
IF NEEDED: We ask for this information because we want to make sure that households from across the
Reno/Sparks region participate in the survey. We certainly understand your reluctance to provide this
information, but you can be assured that your information will be held in the strictest of confidence and used for
transportation planning purposes only. If you do not feel comfortable providing your address, we will have to
end the survey.
[IF NO]
What is your current physical address?
NO P.O. BOXES ALLOWED

92 RTC Washoe County Travel Characteristics Study Final Report
Street Address:
Suite/Apt #:
City:
State:
Zip Code:
[IF YES]
HHSIZ. Before we begin the survey, we would like to ask you some general information about your household.
This information will help us make sure we include all types of households in the county.
How many people, including yourself, live in your home?
IF NEEDED: This information will help us to be sure that we include all types of households in your area. We
understand your concerns regarding this question, but this information helps transportation planners
understand the relationship between the number of people in a household and the number of trips they make.
Without this information, your household will not be eligible to participate in this survey.
INCLUDE: FOSTER CHILDREN, ROOMMATES, HOUSEMATES, AND PEOPLE LIVING HERE MOST OF THE TIME WHILE
WORKING, EVEN IF THEY HAVE ANOTHER PLACE TO LIVE.
DO NOT INCLUDE: COLLEGE STUDENTS LIVING AWAY WHILE ATTENDING COLLEGE OR PEOPLE WHO LIVE AT
ANOTHER PLACE MOST OF THE TIME.
98. DK
99. RF
HHWRK. And of these, how many are employed full-time or part-time in paid working positions?
98. DK
99. RF
RIBUS. Do you or any members of your household use transit at least once a week?
1. YES
2. NO
9. DK
8. RF
HHVEH. How many motor vehicles are owned, leased, or available for regular use by the people who currently
live in your household? Please be sure to include motorcycles, mopeds, and RVs.
[Range 0-99]
98. DK
99. RF
VEHOP. How many of these vehicles are operational and used regularly during the week?
[Range 0-99]
98. DK
99. RF
HHBIC. And how many bicycles in working condition are available to people in your household?
98. DK
99. RF
INT10. Thank you.
We asked these questions to help us to make sure we are talking with all types of households.
An important part of this study is to understand why, when, and where people travel in Washoe County.
To do this, we're asking households to write down their travel for a 24-hour period.
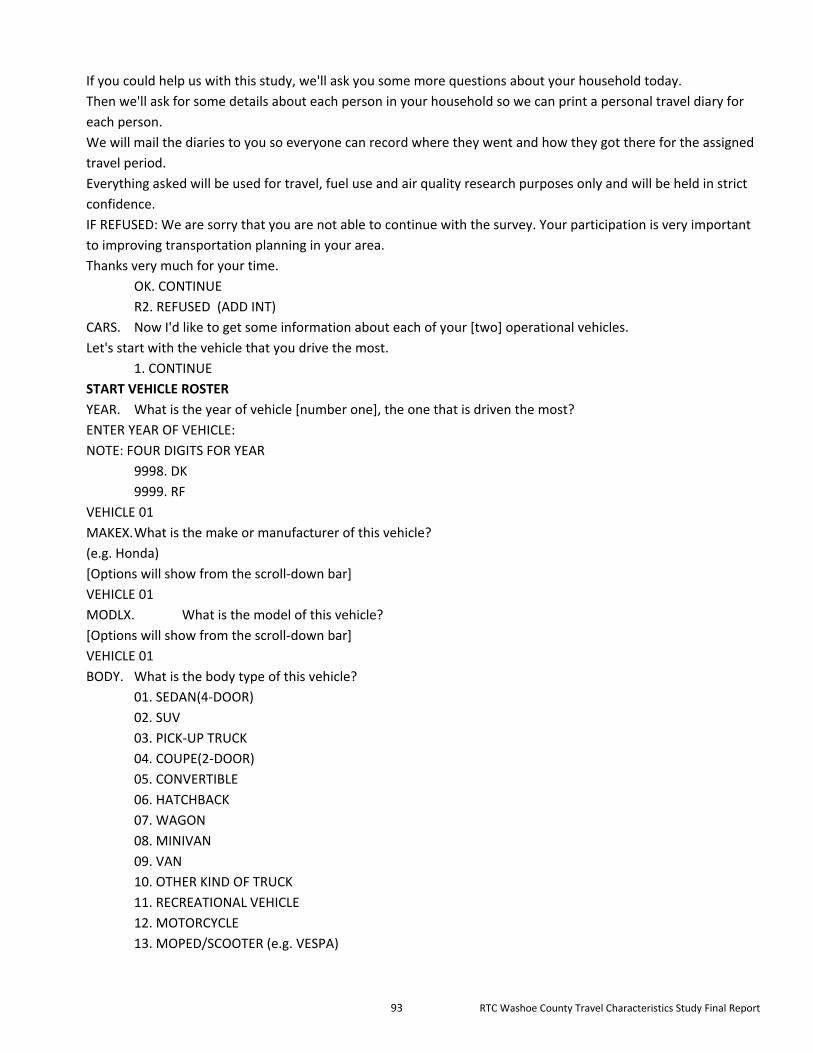
93 RTC Washoe County Travel Characteristics Study Final Report
If you could help us with this study, we'll ask you some more questions about your household today.
Then we'll ask for some details about each person in your household so we can print a personal travel diary for
each person.
We will mail the diaries to you so everyone can record where they went and how they got there for the assigned
travel period.
Everything asked will be used for travel, fuel use and air quality research purposes only and will be held in strict
confidence.
IF REFUSED: We are sorry that you are not able to continue with the survey. Your participation is very important
to improving transportation planning in your area.
Thanks very much for your time.
OK. CONTINUE
R2. REFUSED (ADD INT)
CARS. Now I'd like to get some information about each of your [two] operational vehicles.
Let's start with the vehicle that you drive the most.
1. CONTINUE
START VEHICLE ROSTER
YEAR. What is the year of vehicle [number one], the one that is driven the most?
ENTER YEAR OF VEHICLE:
NOTE: FOUR DIGITS FOR YEAR
9998. DK
9999. RF
VEHICLE 01
MAKEX. What is the make or manufacturer of this vehicle?
(e.g. Honda)
[Options will show from the scroll-down bar]
VEHICLE 01
MODLX. What is the model of this vehicle?
[Options will show from the scroll-down bar]
VEHICLE 01
BODY. What is the body type of this vehicle?
01. SEDAN(4-DOOR)
02. SUV
03. PICK-UP TRUCK
04. COUPE(2-DOOR)
05. CONVERTIBLE
06. HATCHBACK
07. WAGON
08. MINIVAN
09. VAN
10. OTHER KIND OF TRUCK
11. RECREATIONAL VEHICLE
12. MOTORCYCLE
13. MOPED/SCOOTER (e.g. VESPA)

94 RTC Washoe County Travel Characteristics Study Final Report
97. OTHER, SPECIFY (WATERCRAFT, CROSSOVER, ETC)
98. DK
99. RF
VEHICLE 01
VEHT. Is this vehicle:
1. Hybrid Vehicle
2. Gasoline Only Vehicle
3. Diesel Only Vehicle
4. Plug In Hybrid Electric Vehicle
5. CNG
6. Electric Only
7. OTHER
VEHICLE 01
FUELT. What type(s) of fuel does this vehicle use?
READ ALL. SELECT ALL THAT APPLY
1. Gasoline
2. Diesel
3. Electric / Electric Battery
4. CNG - Natural Gas
5. Biofuel, Ethanol, Biodiesel
7. OTHER, SPECIFY
8. DK
9. RF
END OF VEHICLE ROSTER
RESTY. Which of the following best describes your home?
01. Single family house not attached to any other house
02. Single family house attached to one or more houses (townhouse, duplex, triplex) each with separate
entry
03. A mobile home
04. Building with 2-4 apartments/ condos / studios /rooms
05. Building with 5-19 apartments/ condos / studios / rooms
06. Building with 20 or more apartments/ condos / studios / rooms (NOTE TO INTERVIEWERS: includes
dorms, etc.)
07. Boat, RV, Van, etc.
97. OTHER, SPECIFY
98. DK
99. RF
OWN. Do you own or rent your home?
1. OWN/BUYING
2. RENT
7. OTHER, SPECIFY
8. DK
9. RF

95 RTC Washoe County Travel Characteristics Study Final Report
TEN. How many years have you lived at your current residence?
NOTE: IF LESS THAN 1, ENTER 1
98. DK
99. RF
START PERSON ROSTER
PERSON 1
FNAME. Now we'll ask you to answer a few questions about each household member, including yourself.
Earlier you said there are [two people] in your household.
Let's begin with you.
What is your first name?
PERSON 1
LNAME. What last name should we use for your household when mailing the materials?
PERSON 1:
GEND. INTERVIEWER NOTE: BY OBSERVATION
And what is your gender?
1. MALE
2. FEMALE
9. RF
PERSON 1
RELAT. What is this person's relationship to you?
01. SELF
02. SPOUSE/PARTNER
03. CHILD/DAUGHTER/SON/ADOPTED CHILD/STEPCHILD/SON-IN-LAW/DAUGHTER-IN-LAW
04. PARENT/PARENT-IN-LAW/STEP-PARENT
05. BROTHER OR SISTER (STEPBROTHER/STEPSISTER)
06. GRANDPARENT
07. GRANDCHILD
08. OTHER RELATIVE
09. NO RELATION/HOUSEMATE/ROOMMATE/FOSTER CHILD
99. RF
PERSON 1:
AGE. What is your age?
IF A CHILD IS UNDER 1 YEARS OLD THEN ENTER AS 1
IF GREATER THAN 99, ENTER 99
998. DK
999. RF
[IF DK/RF]
AGEB: I understand your reluctance to provide your age. However, age is a very important factor. As we age,
our travel needs and patterns change dramatically.
Can you tell me if you are between 16 and 75?
1. LESS THAN 16 OR OVER 75
2. BETWEEN 16 AND 75
8. DK

96 RTC Washoe County Travel Characteristics Study Final Report
9. RF
PERSON 1:
HISP. Are you of Hispanic, Latino, or Spanish origin?
1. YES
2. NO
8. DK
9. RF
PERSON 1:
RACE. What is your ethnicity?
01. White
02. Black or African American
03. American Indian or Alaska Native
04. Asian (Asian Indian, Japanese, Chinese, Korean, Filipino, Vietnamese)
05. Native Hawaiian or Pacific Islander (Guamanian, Samoan, Fijian)
97. Other (please specify)
98. DK
99. RF
LIC: Do you have a valid driver's license?
1. YES
2. NO
8. DK
9. RF
[IF MORE THAN ONE VEHICLE]
PERSON 1:
USER. Which vehicle is driven most by you?
98. DK
99. RF
PERSON 1:
EMPLY. Are/Is you employed, either full-time or part-time?
1. YES, FULL TIME
2. YES, PART TIME
3. NO
8. DK
9. RF
PERSON 1:
JOBS. How many jobs do you have?
Please include all paid positions that you work on a regular basis.
98. DK
99. RF
[IF MORE THAN ONE JOB]
PERSON 1:
WLOC. Let's talk about your primary job. Is your primary work address fixed, is it your home, or does it vary from
day to day or week to week?

97 RTC Washoe County Travel Characteristics Study Final Report
IF NEEDED: This is the work location where you spend the most time.
1. Fixed
2. Home
3. No fixed workplace, varies (e.g. construction)
8. DK
9. RF
PERSON 1:
WNAME. What is the name of your primary employer?
CWADD. Do you know the exact street address or the nearest cross streets?
Street Address:
Suite/Apt #
CITY:
STATE:
ZIP
What are the nearest cross streets of this primary job?
PERSON 1:
WDAY. What days of the week do you typically work at this primary job?
SELECT ALL THAT APPLY
08. MONDAY - FRIDAY
01. MONDAY
02. TUESDAY
03. WEDNESDAY
04. THURSDAY
05. FRIDAY
06. SATURDAY
07. SUNDAY
98. DK
99. RF
PERSON 1:
HOURS. How many hours per week do you typically work at this primary job?
998. DK
999. RF
PERSON 1:
WSCHED. Which of the following statements best describes your work schedule:
1. I have no flexibility in my work schedule.
2. I have some flexibility in my work schedule.
3. I'm free to adjust my schedule as I like.
8. DK
9. RF
PERSON 1:
COMPR. Does your primary employer offer alternative work schedule options such as a compressed work
week?
IF NEEDED: A compressed work week is working 40 hours in less than 5 days.
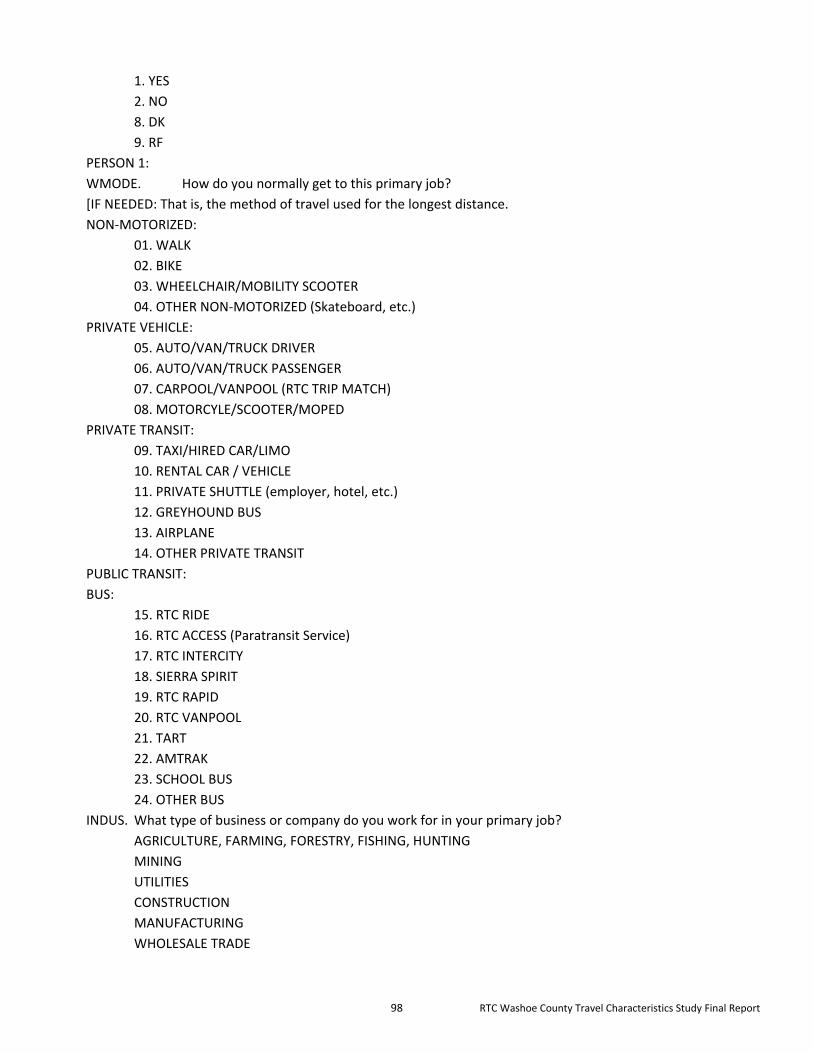
98 RTC Washoe County Travel Characteristics Study Final Report
1. YES
2. NO
8. DK
9. RF
PERSON 1:
WMODE. How do you normally get to this primary job?
[IF NEEDED: That is, the method of travel used for the longest distance.
NON-MOTORIZED:
01. WALK
02. BIKE
03. WHEELCHAIR/MOBILITY SCOOTER
04. OTHER NON-MOTORIZED (Skateboard, etc.)
PRIVATE VEHICLE:
05. AUTO/VAN/TRUCK DRIVER
06. AUTO/VAN/TRUCK PASSENGER
07. CARPOOL/VANPOOL (RTC TRIP MATCH)
08. MOTORCYLE/SCOOTER/MOPED
PRIVATE TRANSIT:
09. TAXI/HIRED CAR/LIMO
10. RENTAL CAR / VEHICLE
11. PRIVATE SHUTTLE (employer, hotel, etc.)
12. GREYHOUND BUS
13. AIRPLANE
14. OTHER PRIVATE TRANSIT
PUBLIC TRANSIT:
BUS:
15. RTC RIDE
16. RTC ACCESS (Paratransit Service)
17. RTC INTERCITY
18. SIERRA SPIRIT
19. RTC RAPID
20. RTC VANPOOL
21. TART
22. AMTRAK
23. SCHOOL BUS
24. OTHER BUS
INDUS. What type of business or company do you work for in your primary job?
AGRICULTURE, FARMING, FORESTRY, FISHING, HUNTING
MINING
UTILITIES
CONSTRUCTION
MANUFACTURING
WHOLESALE TRADE

99 RTC Washoe County Travel Characteristics Study Final Report
RETAIL TRADE
TRANSPORTATION AND WAREHOUSING
INFORMATION
FINANCE AND INSURANCE
REAL ESTATE AND RENTAL AND LEASING
PROFESSIONAL, SCIENTIFIC AND TECHNICAL SERVICES
MANAGEMENT OF COMPANIES AND ENTERPRISES
ADMINISTRATIVE AND SUPPORT ANDWASTE MANAGEMENT
EDUCATIONAL SERVICES
HEALTH CARE AND SOCIAL ASSISTANCE
ARTS, ENTERTAINMENT AND RECREATION
ACCOMMODATION AND FOOD SERVICES
OTHER SERVICES (EXCEPT PUBLIC ADMINISTRATION)
CENTRAL ADMINISTRATIVE OFFICE ACTIVITY
OTHER: [SPECIFY]
DK
RF
PERSON 1:
OCCUP. What kind of work do you do at that company / business?
MANAGEMENT, BUSINESS AND FINANCIAL OCCUPATIONS
COMPUTER, ENGINEERING AND SCIENCE OCCUPATIONS
EDUCATION, LEGAL, COMMUNITY SERVICE, ARTS, AND MEDIA OCCUPATIONS
HEALTHCARE PRACTITIONERS AND TECHNICAL OCCUPATIONS
SERVICE OCCUPATIONS
SALES AND OFFICE OCCUPATIONS
OFFICE AND ADMINISTRATIVE SUPPORT OCCUPATIONS
FARMING, FISHING, AND FORESTRY OCCUPATIONS
CONSTRUCTION AND EXTRACTION OCCUPATIONS
INSTALLATION, MAINTENANCE, AND REPAIR OCCUPATIONS
PRODUCTION OCCUPATIONS
TRANSPORTATION AND MATERIAL MOVING OCCUPATIONS
MILITARY SPECIFIC OCCUPATIONS
OTHER: [SPECIFY]
DK
RF
PERSON 1:
WLOC2. Now let's talk about your secondary job.
Is your secondary work address fixed, is it your home, or does it vary from day to day or week to week?
IF NEEDED: This is the work location where you spend the second most time.
1. FIXED
2. HOME
3. VARIES
8. DK

100 RTC Washoe County Travel Characteristics Study Final Report
9. RF
PERSON 1:
WNAME. What is the name of this employer?
CWADD. Do you know the exact street address or the nearest cross streets?
Street Address:
Suite/Apt #
CITY:
STATE:
ZIP
What are the nearest cross streets of this job?
WDAYS2. How many days a week do you typically go to work at this address?
PERSON 1:
GROCNAME. What is the name of the primary grocery store where you shop most frequently?
GROCADD. Do you know the exact street address or the nearest cross streets?
Street Address:
Suite/Apt #
CITY:
STATE:
ZIP
What are the nearest cross streets of this grocery store?
PERSON 1:
DISAB. Do you have a temporary or permanent physical condition or disability that makes it difficult to travel
outside of the home?
1. YES
2. NO
8. DK
9. RF
[IF YES]
PERSON 1:
DTYPE. Can you tell me which of the following conditions you/this person has:
READ LIST MARK ALL THAT APPLY
01. Hearing impaired / deaf (serious difficulty hearing)
02. Sight impaired / blind (includes serious difficulty seeing even when wearing glasses)
03. Cognitive impaired, such as serious difficulty concentrating, remembering, or making decisions
04. Balance or respiratory impairment, such as difficulty walking or climbing stairs without difficulty
05. Difficulty dressing or bathing
06. Difficulty doing errands alone, such as visiting a doctor's office or shopping
97. Other condition that makes it difficult to travel outside your home
98. DK
99. RF
PERSON 1:
STUDE. Are you currently enrolled in any type of school, including daycare, technical school, or university as part
time or full time?

101 RTC Washoe County Travel Characteristics Study Final Report
1. YES - FULL TIME
2. YES - PART TIME
3. No
8. DK
9. RF
SCHOL. What school grade or level do you attend?
INTERVIEWER NOTE: CHECK AGE OF PERSON BEFORE ASKING CHOICES 1-4
01. DAYCARE
02. NURSERY SCHOOL, PRESCHOOL
03. KINDERGARTEN TO GRADE 8
04. GRADE 9 TO 12
05. TECHNICAL/VOCATIONAL SCHOOL
06. 2-YEAR COLLEGE (COMMUNITY COLLEGE)
07. 4-YEAR COLLEGE OR UNIVERSITY
08. GRADUATE SCHOOL/PROFESSIONAL
97. OTHER, SPECIFY
98. DK
99. RF
[IF 01-03]
And is he/she home schooled?
1. YES
2. No
8. DK
9. RF
PERSON 1:
SONLN. Please tell me which of the following best describes where you attend school:
1. On campus only
2. Online only
3. Both on campus and online
8. DK
9. RF
PERSON 1:
SNAME. What is the name of your school?
CSADD. What is the address of your school?
Please enter the address of this school.
Street Address:
Suite/Apt #
What is the city, state, and zip of this school. CITY:
STATE:
ZIP
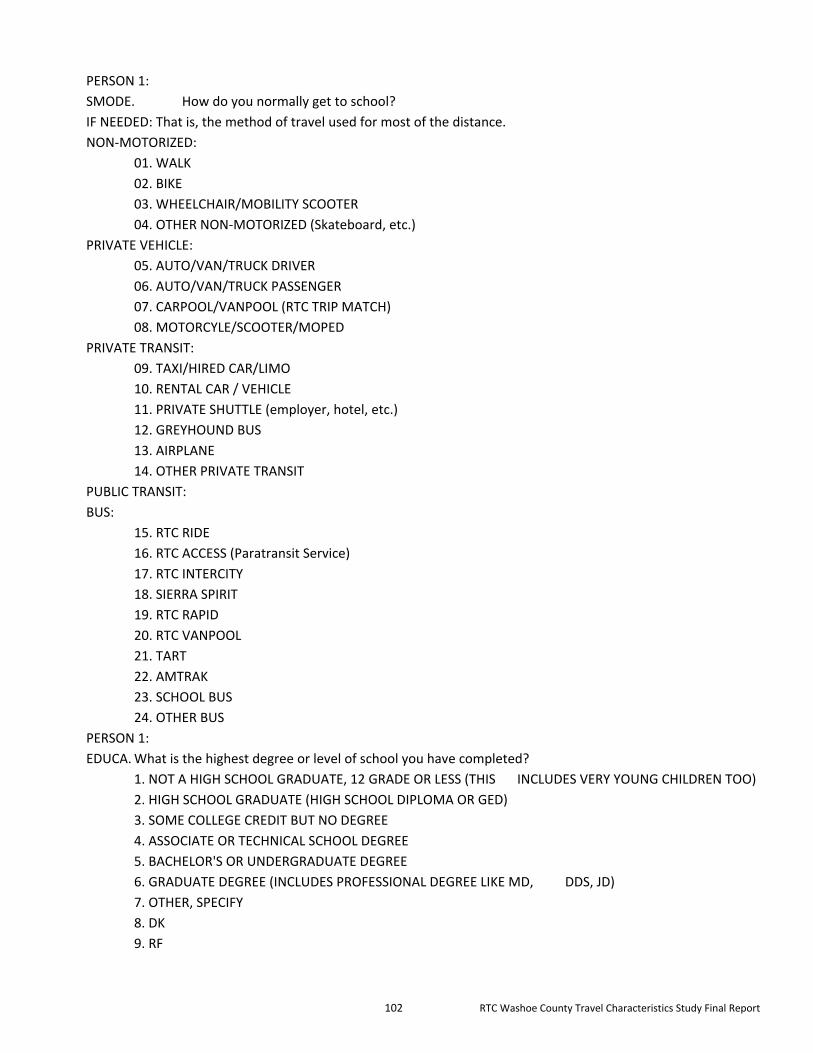
102 RTC Washoe County Travel Characteristics Study Final Report
PERSON 1:
SMODE. How do you normally get to school?
IF NEEDED: That is, the method of travel used for most of the distance.
NON-MOTORIZED:
01. WALK
02. BIKE
03. WHEELCHAIR/MOBILITY SCOOTER
04. OTHER NON-MOTORIZED (Skateboard, etc.)
PRIVATE VEHICLE:
05. AUTO/VAN/TRUCK DRIVER
06. AUTO/VAN/TRUCK PASSENGER
07. CARPOOL/VANPOOL (RTC TRIP MATCH)
08. MOTORCYLE/SCOOTER/MOPED
PRIVATE TRANSIT:
09. TAXI/HIRED CAR/LIMO
10. RENTAL CAR / VEHICLE
11. PRIVATE SHUTTLE (employer, hotel, etc.)
12. GREYHOUND BUS
13. AIRPLANE
14. OTHER PRIVATE TRANSIT
PUBLIC TRANSIT:
BUS:
15. RTC RIDE
16. RTC ACCESS (Paratransit Service)
17. RTC INTERCITY
18. SIERRA SPIRIT
19. RTC RAPID
20. RTC VANPOOL
21. TART
22. AMTRAK
23. SCHOOL BUS
24. OTHER BUS
PERSON 1:
EDUCA. What is the highest degree or level of school you have completed?
1. NOT A HIGH SCHOOL GRADUATE, 12 GRADE OR LESS (THIS INCLUDES VERY YOUNG CHILDREN TOO)
2. HIGH SCHOOL GRADUATE (HIGH SCHOOL DIPLOMA OR GED)
3. SOME COLLEGE CREDIT BUT NO DEGREE
4. ASSOCIATE OR TECHNICAL SCHOOL DEGREE
5. BACHELOR'S OR UNDERGRADUATE DEGREE
6. GRADUATE DEGREE (INCLUDES PROFESSIONAL DEGREE LIKE MD, DDS, JD)
7. OTHER, SPECIFY
8. DK
9. RF

103 RTC Washoe County Travel Characteristics Study Final Report
PERSON 1:
TTRIP. How many one-way trips (if any) using transit did you make in the past week?
A round trip counts as two one-way trips.
ENTER NUMBER
00. NONE
98. DK
99. RF
PERSON 1:
TRNSUBE. Does your employer pay for all or any part of your transit fare?
1. YES
2. NO
8. DK
9. RF
PERSON 1:
TRNSUBS. Does your school pay for all or any part of your transit fare?
1. YES
2. NO
8. DK
9. RF
BTRIP. How many trips (if any) using a bicycle did you make in the past week?
ENTER NUMBER
00. NONE
98. DK
99. RF
INCOM. Household income not only allows us to verify that we are including all types of households in the region,
but it also has been found to be related to the types of trips households typically make. With this in mind, please
tell me which category represents your total household income (total incomes for all persons living in the
household) for last year.
IF NEEDED: We ask for this information because we want to make sure that all types of households participate in
the survey. We certainly understand your reluctance to provide this information, but you can be assured that
your information will be held in the strictest of confidence and used for transportation planning purposes only.
IF REFUSED: I appreciate your concerns about providing this information, but I only need to properly identify
your household as belonging to one of the following categories: [READ APPROPRIATE RANGES]
01. $0 to $9,999
02. $10,000 to $24,999
03. $25,000 to $34,999
04. $35,000 to $49,999
05. $50,000 to $74,999
06. $75,000 to $99,999
07. $100,000 to $149,999

104 RTC Washoe County Travel Characteristics Study Final Report
08. $150,000 to $199,999
09. $200,000 to $249,999
10. $250,000 or more
98. DK
99. RF
NON GPS MODULE
ASSN. Understanding your household's travel and activities is very important for improving transportation in
your area.
We will send you a diary for each member of your household to keep track of your travel and activities for 24
hours on your assigned travel day.
It is important for your household to record your travel on your assigned travel day. {IF THEY SAY THEY CANNOT
RECORD THEIR TRAVEL THAT DAY, OFFER THE NEXT AVAILABLE DATE]
GPS MODULE
WRGPS
Your household is qualified to participate in the GPS portion of this study. We are asking you and everyone in
the household who is at least 12 years old to <<[GFLAG -GPS] wear a GPS device>> <<[GFLAG-RS] carry a
smartphone with the RouteScout application activated>> for 7 days in a row, starting on your assigned travel
day. GPS technology allows us to collect information not only about where people travel, but also the actual
path taken. This is very useful in transportation planning.
FOR GPS: To thank you for participating in this important survey, your household will receive an Amazon gift card
in the amount of <<INAMT>> as long as all household members fully complete their travel information and all
GPS units are returned.]
IF NEEDED FOR GPS: We will ask you to wear or carry your GPS units with you when you travel. They collect
details of your travel routes during your travel days. It is very important to the survey that households like yours
participate. The GPS units are small and easy to carry (you can clip them onto your belt, backpack, or purse).
IF NEEDED FOR ROUTESCOUT: The RouteScout application is a free application that you will download on your
Smartphone. This application uses your phone’s location services. We will ask you to wear or carry your
Smartphone with the RouteScout application activated with you when you travel. It will collect details of your
travel routes during your travel days. It is very important to the survey that households like yours participate.
Yes
No
[IF YES for GFLAG-GPS CONFIRM ALL HH MEMBERS ARE AT LEAST 12 YEARS OLD AND WILL CARRY GPS].
[IF YES FOR GFLAG-RS CONFIRM ALL HH MEMBERS ARE AT LEAST 12 YEARS OLD AND WILL CARRY SMARTPHONE;
COLLECT PHONE NUMBER; PHONE MODEL; CARRIER AND OPERATING SYSTEM OF EACH RS PARTICIPANT’S
SMARTPHONE. PARTICIPANTS MUST POSSESS A SMARTPHONE. PLEASE NOTE ROUTESCOUT IS NOT COMPATIBLE
WITH IPHONES OLDER THAN IPHONE 5.]
<GPS ROSTER>
GSGPS
Will <gsname> use one of our gps devices to participate in the survey?
1. Yes

105 RTC Washoe County Travel Characteristics Study Final Report
2. No (flag as diary person) <SMARTPHONE ROSTER>
GSSMART
Will <gsname> use a smartphone to participate in the survey?
1. Yes 2. No (flag as diary person)
GSSMART2
What is the operating system for <gsname>'s phone?
98. Specify
GSSMART3
What is <gsname>'s type of phone?
98. Specify
GSSMART4
What is <gsname>'s phone number?
98. Specify
GSSMART5
What is <gsname>'s phone service carrier?
98. Specify
FOR RS: To thank you for participating in this important survey, your household will receive an Amazon gift card
in the amount of $<<INAMT>> as long as all household members fully complete their travel information.]
[IF NO]
Your household may still participate in the study by providing travel information in the diaries we will send you.
1. CONTINUE AS DIARY HOUSEHOLD
2. AGREED TO PARTICIPATE IN GPS PORTION
3. REFUSED SURVEY
WASSN
Understanding your household's travel and activities is very important for improving transportation in your area.
GFLAG-GPS We will send a GPS device for each person who is 12 years of age or older for your household to keep
track of your travel and activities.
GFLAG-RS, We will send instructions to download and use RouteScout for each person who is 12 years of age or
older for your household to keep track of your travel and activities.
We ask that each person carry their smartphone with the RouteScout app activated for seven (7) consecutive
days starting on your assigned travel day.
It is important for your household to record your travel on your assigned travel day. {IF THEY SAY THEY CANNOT
RECORD THEIR TRAVEL THAT DAY, OFFER THE NEXT AVAILABLE DATE]
TRAVEL DAYS WILL BE UPDATED TO CORRECT DATES.
CATSI.
After your travel day, we will ask you to report details about the places you visited. Would you prefer to report
them by telephone interview or via the website?
1. Telephone Interview
2. Web Interview
3. Mail back

106 RTC Washoe County Travel Characteristics Study Final Report
[IF WEB]
WEBRC. We are glad you decided to participate in the final phase of the survey using our project website.
The purpose of this study is to understand how, why, and when people travel. This information will help
transportation planners improve car, bus, and train travel options, as well as air quality.
We will mail travel diaries for each household member to record your travel and activities on your assigned
travel day.
Once you have completed your travel diaries, you can provide your travel information online, by phone, or by
mailing back the completed travel diaries and log.
The project website is ____________
Your household's PIN is:________________
1. CONTINUE
[IF PHONE OR MAIL]
MAILING ADDRESS
CMADD.
In order to mail the survey materials to you, I need to confirm your mailing address.
Is it...
ADDRESS:
SUITE#/APPT#:
CITY:
STATE:
ZIP CODE:
IF NO OR IF ANYTHING IS BLANK, YOU WILL GO BACK TO TRY AGAIN
1. YES
2. NO
To whom should we address the envelope?
FIRST NAME:
LAST NAME:
INTERVIEWER NOTE: CONFIRM SPELLING AND READ BACK
NOT ALLOWED TO HAVE MR., MRS. OR UNKNOWN
INITIALS ARE OKAY IF RESPONDENT NOT WILLING TO GIVE FULL NAME
SLANG. In which language should I send your diary materials?
1. ENGLISH
2. SPANISH
FOR WEB RECRUITMENT ONLY
Question added: PRN75 “Thank you for participating in the RTC Washoe County Travel Characteristics Study! In
the event some of your information needs clarification, we may need to contact you. Please provide a phone
number, or email address we may use to contact you.” REQUIRED RESPONSE
Phone field added TEL03
Email field added EMAIL
REMN1.
Please note that we will contact you on the day before your travel day to remind you about your travel day and
to provide you with additional instructions about your participation. Reminders can be made by a telephone call,
by text message or by email. Which would you prefer?

107 RTC Washoe County Travel Characteristics Study Final Report
IF RESPONDENT REFUSES, SELECT 1=PHONE
1. PHONE
2. TEXT
3. EMAIL
[IF PHONE]
TEL02.
Can we confirm this telephone number as the number to call?
PHONE #:
IF NO: What is the best telephone number that we can call for the reminder call?
FORMAT:999-999-9999
[IF TEXT]
RMTXT.
What cell phone number should we use for reminder text messages?
FORMAT:999-999-9999
[IF EMAIL]
RMEML. What email address should we use to send reminder email messages?
FORMAT EXAMPLE: [email protected]
CBACK. When we call back to collect your travel and activities, we will not ask to speak with anyone under 16
years old, but we would like to ask about their travel. We will speak with one of the adults in the household.
1. Continue
THANK.
Thank you for participating in this first part of the RTC Washoe County Travel Characteristics Study. Please tell
the other members of your household how important their participation is for the success of the study.
We look forward to talking with you again. If you have any questions or comments, I have a toll free number
where you can reach us.
Would you like that number?
IF THEY WANT NUMBER: 1-877-221-7828.
Thank you and have a good afternoon/evening
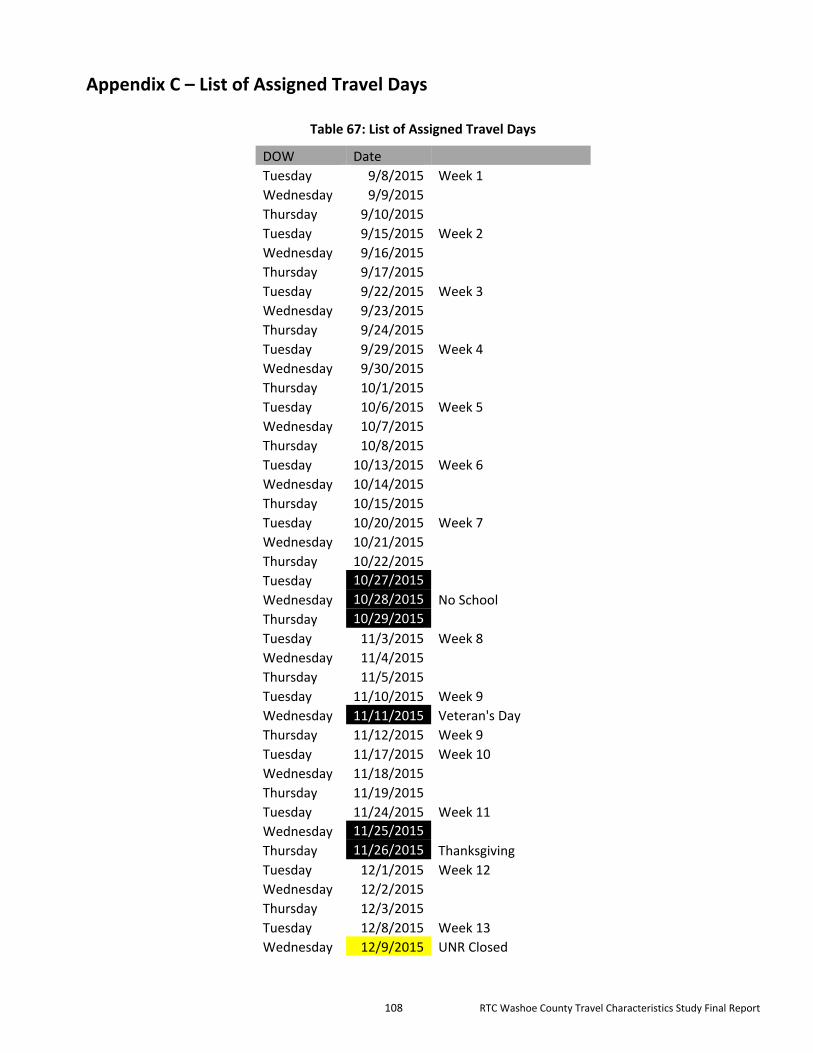
108 RTC Washoe County Travel Characteristics Study Final Report
Appendix C – List of Assigned Travel Days
Table 67: List of Assigned Travel Days
DOW Date Tuesday 9/8/2015 Week 1
Wednesday 9/9/2015 Thursday 9/10/2015 Tuesday 9/15/2015 Week 2
Wednesday 9/16/2015 Thursday 9/17/2015 Tuesday 9/22/2015 Week 3
Wednesday 9/23/2015 Thursday 9/24/2015 Tuesday 9/29/2015 Week 4
Wednesday 9/30/2015 Thursday 10/1/2015 Tuesday 10/6/2015 Week 5
Wednesday 10/7/2015 Thursday 10/8/2015 Tuesday 10/13/2015 Week 6
Wednesday 10/14/2015 Thursday 10/15/2015 Tuesday 10/20/2015 Week 7
Wednesday 10/21/2015 Thursday 10/22/2015 Tuesday 10/27/2015
Wednesday 10/28/2015 No School
Thursday 10/29/2015
Tuesday 11/3/2015 Week 8
Wednesday 11/4/2015 Thursday 11/5/2015 Tuesday 11/10/2015 Week 9
Wednesday 11/11/2015 Veteran's Day
Thursday 11/12/2015 Week 9
Tuesday 11/17/2015 Week 10
Wednesday 11/18/2015 Thursday 11/19/2015 Tuesday 11/24/2015 Week 11
Wednesday 11/25/2015
Thursday 11/26/2015 Thanksgiving
Tuesday 12/1/2015 Week 12
Wednesday 12/2/2015 Thursday 12/3/2015 Tuesday 12/8/2015 Week 13
Wednesday 12/9/2015 UNR Closed

109 RTC Washoe County Travel Characteristics Study Final Report
DOW Date Thursday 12/10/2015 Week 13
Tuesday 12/15/2015 Week 14
Wednesday 12/16/2015 Thursday 12/17/2015 Tuesday 12/22/2015
Wednesday 12/23/2015
Thursday 12/24/2015
Tuesday 12/29/2015 Winter break
Wednesday 12/30/2015
Thursday 12/31/2015
Tuesday 1/5/2016
Wednesday 1/6/2016
Thursday 1/7/2016
Tuesday 1/12/2016 Week 15
Wednesday 1/13/2016 Thursday 1/14/2016 Tuesday 1/19/2016 Week 16
Wednesday 1/20/2016 Thursday 1/21/2016 Tuesday 1/26/2016 Week 17
Wednesday 1/27/2016 Thursday 1/28/2016 indicates no travel day
Indicates travel day added after study began
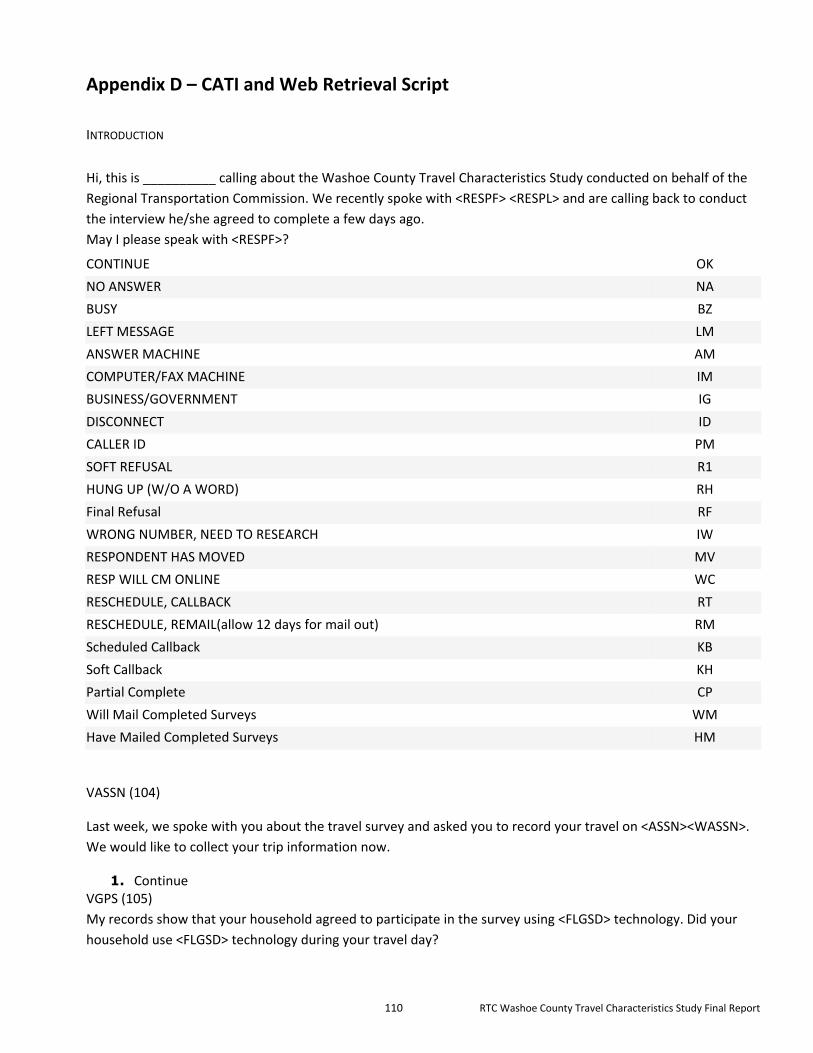
110 RTC Washoe County Travel Characteristics Study Final Report
Appendix D – CATI and Web Retrieval Script
INTRODUCTION
Hi, this is __________ calling about the Washoe County Travel Characteristics Study conducted on behalf of the
Regional Transportation Commission. We recently spoke with <RESPF> <RESPL> and are calling back to conduct
the interview he/she agreed to complete a few days ago.
May I please speak with <RESPF>?
CONTINUE OK
NO ANSWER NA
BUSY BZ
LEFT MESSAGE LM
ANSWER MACHINE AM
COMPUTER/FAX MACHINE IM
BUSINESS/GOVERNMENT IG
DISCONNECT ID
CALLER ID PM
SOFT REFUSAL R1
HUNG UP (W/O A WORD) RH
Final Refusal RF
WRONG NUMBER, NEED TO RESEARCH IW
RESPONDENT HAS MOVED MV
RESP WILL CM ONLINE WC
RESCHEDULE, CALLBACK RT
RESCHEDULE, REMAIL(allow 12 days for mail out) RM
Scheduled Callback KB
Soft Callback KH
Partial Complete CP
Will Mail Completed Surveys WM
Have Mailed Completed Surveys HM
VASSN (104)
Last week, we spoke with you about the travel survey and asked you to record your travel on <ASSN><WASSN>.
We would like to collect your trip information now.
1. Continue VGPS (105)
My records show that your household agreed to participate in the survey using <FLGSD> technology. Did your
household use <FLGSD> technology during your travel day?

111 RTC Washoe County Travel Characteristics Study Final Report
1. Yes, continue 2. No, did not get GPS Devices (CHOOSE A NEW DATE) ==> ASSNM 3. No, did not download RouteScout (CHOOSE A NEW DATE) ==> ASSNM 4. Forgot to use GPS or RS (CHOOSE A NEW DATE) ==> ASSNM
ASSNM (103)
CURRENT ASSN IS: <ASSN ><WASSN>
SELECT NEW ASSIGNMENT FOR RESENDING DIARY PACKET
15167 Tuesday, June 16
15168 Wednesday, June 17
15169 Thursday, June 18
15174 Tuesday, June 23
15175 Wednesday, June 24
15176 Thursday, June 25
15181 Tuesday, June 30
15182 Wednesday, July 01
15183 Thursday, July 02
VADD (106)
Let’s start by verifying the address where you live. Our records show that your address is:
Name: <FNAME> <LNAME>
Address: <HADDR>
Apt #: <HSUIT>
City: <HCITY>
State: <HSTAT>
Zip: <HZIP>
1. Yes, address is correct 2. No, address is wrong
HHSIZ (134)
Our records show that there is/are<OHSIZ> person/s living in your household. Is this correct?
I have listed:
<PERSON1>
<PERSON2>
<PERSON3> …
If this is not correct, please indicate the new number of people living in your household below.
Note: Please include in this number Foster Children, Roomers, Housemates, and/or people living in your home
most of time, even if they have another place to live.
We understand you may have concerns regarding this question, however, transportation planners need to know
if there is a relationship between the number of people in a household and the number of trips they make.
One
Two
Three
Four
Five
Six
Seven
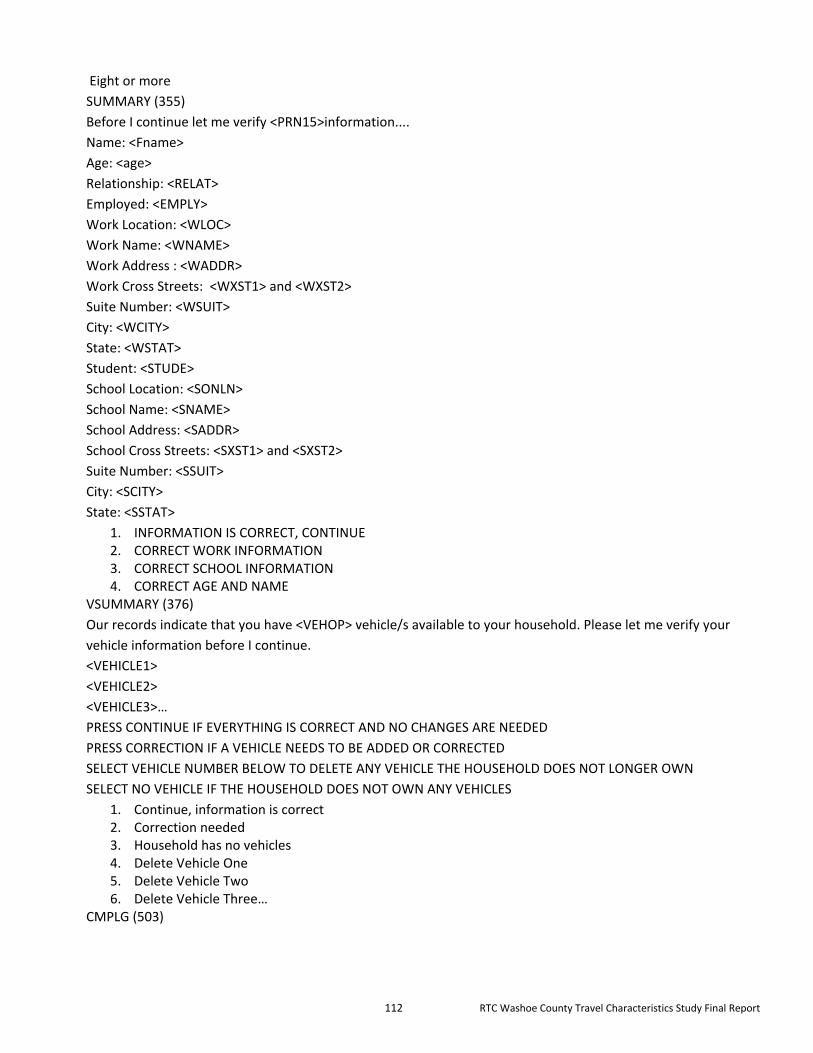
112 RTC Washoe County Travel Characteristics Study Final Report
Eight or more
SUMMARY (355)
Before I continue let me verify <PRN15>information....
Name: <Fname>
Age: <age>
Relationship: <RELAT>
Employed: <EMPLY>
Work Location: <WLOC>
Work Name: <WNAME>
Work Address : <WADDR>
Work Cross Streets: <WXST1> and <WXST2>
Suite Number: <WSUIT>
City: <WCITY>
State: <WSTAT>
Student: <STUDE>
School Location: <SONLN>
School Name: <SNAME>
School Address: <SADDR>
School Cross Streets: <SXST1> and <SXST2>
Suite Number: <SSUIT>
City: <SCITY>
State: <SSTAT>
1. INFORMATION IS CORRECT, CONTINUE 2. CORRECT WORK INFORMATION 3. CORRECT SCHOOL INFORMATION 4. CORRECT AGE AND NAME
VSUMMARY (376)
Our records indicate that you have <VEHOP> vehicle/s available to your household. Please let me verify your
vehicle information before I continue.
<VEHICLE1>
<VEHICLE2>
<VEHICLE3>…
PRESS CONTINUE IF EVERYTHING IS CORRECT AND NO CHANGES ARE NEEDED
PRESS CORRECTION IF A VEHICLE NEEDS TO BE ADDED OR CORRECTED
SELECT VEHICLE NUMBER BELOW TO DELETE ANY VEHICLE THE HOUSEHOLD DOES NOT LONGER OWN
SELECT NO VEHICLE IF THE HOUSEHOLD DOES NOT OWN ANY VEHICLES
1. Continue, information is correct 2. Correction needed 3. Household has no vehicles 4. Delete Vehicle One 5. Delete Vehicle Two 6. Delete Vehicle Three…
CMPLG (503)
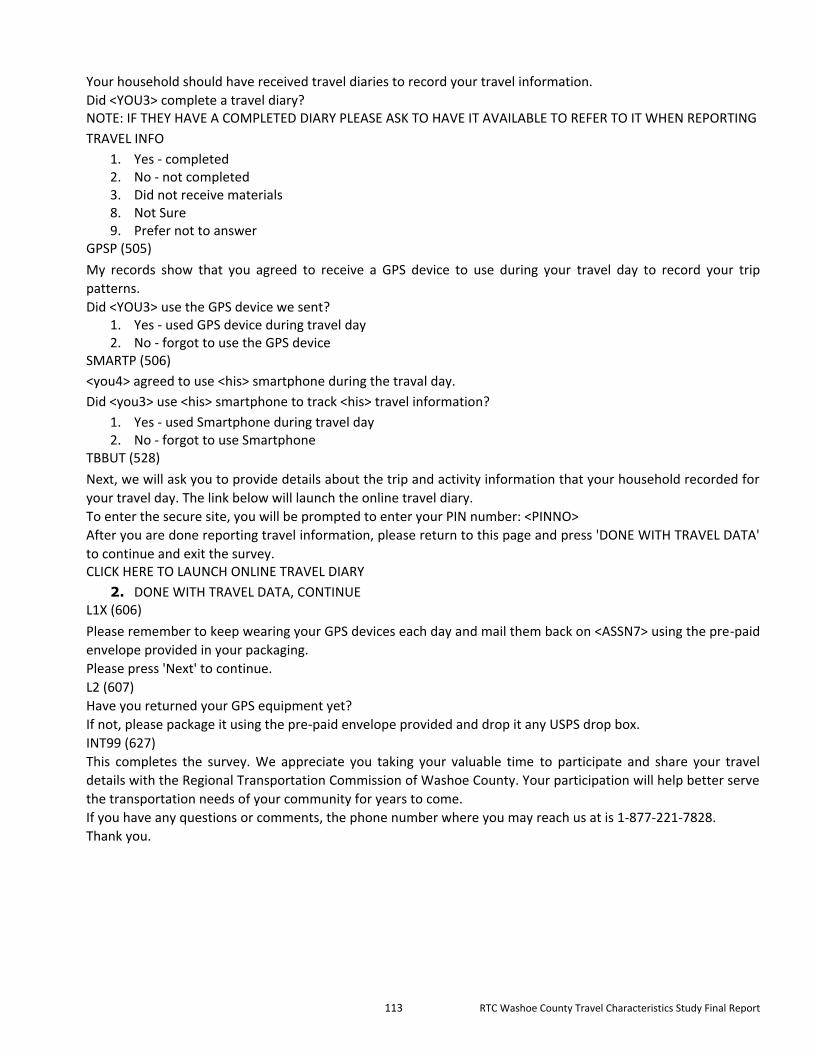
113 RTC Washoe County Travel Characteristics Study Final Report
Your household should have received travel diaries to record your travel information.
Did <YOU3> complete a travel diary? NOTE: IF THEY HAVE A COMPLETED DIARY PLEASE ASK TO HAVE IT AVAILABLE TO REFER TO IT WHEN REPORTING
TRAVEL INFO
1. Yes - completed 2. No - not completed 3. Did not receive materials 8. Not Sure 9. Prefer not to answer
GPSP (505)
My records show that you agreed to receive a GPS device to use during your travel day to record your trip
patterns.
Did <YOU3> use the GPS device we sent? 1. Yes - used GPS device during travel day 2. No - forgot to use the GPS device
SMARTP (506)
<you4> agreed to use <his> smartphone during the traval day.
Did <you3> use <his> smartphone to track <his> travel information?
1. Yes - used Smartphone during travel day 2. No - forgot to use Smartphone
TBBUT (528)
Next, we will ask you to provide details about the trip and activity information that your household recorded for
your travel day. The link below will launch the online travel diary.
To enter the secure site, you will be prompted to enter your PIN number: <PINNO>
After you are done reporting travel information, please return to this page and press 'DONE WITH TRAVEL DATA'
to continue and exit the survey. CLICK HERE TO LAUNCH ONLINE TRAVEL DIARY
2. DONE WITH TRAVEL DATA, CONTINUE L1X (606)
Please remember to keep wearing your GPS devices each day and mail them back on <ASSN7> using the pre-paid
envelope provided in your packaging.
Please press 'Next' to continue.
L2 (607)
Have you returned your GPS equipment yet?
If not, please package it using the pre-paid envelope provided and drop it any USPS drop box.
INT99 (627)
This completes the survey. We appreciate you taking your valuable time to participate and share your travel
details with the Regional Transportation Commission of Washoe County. Your participation will help better serve
the transportation needs of your community for years to come.
If you have any questions or comments, the phone number where you may reach us at is 1-877-221-7828.
Thank you.

114 RTC Washoe County Travel Characteristics Study Final Report
Appendix E – Non-GPS Survey Materials
This letter was sent with the diary materials to non-GPS households that had recruited online and would be eligible to receive an incentive if they also reported their travel online. All letters were formatted to fit on one page, and were printed on RTC letterhead. The diary, mailing envelope, and return mailing envelope follow the letters. A similar letter was sent to non-GPS households that were recruited via CATI, and not eligible for an incentive. «RFNAM» «RLNAM» MMDDYYYY «HADDR» «HUNIT» «HCITY», «HSTAT» «HZIP» Thank you for participating in the RTC Regional Household Travel Survey! The information you provide will help the RTC to plan transportation projects. This includes new roads, transit services, bike lanes, sidewalks, and maintenance on existing roads that improve safety and enhance quality of life in the Truckee Meadows. This information also helps the RTC to program funding for transportation projects. We value your input, no matter how much or how little you travel. Earn up to $25! Since your household completed Step 1 (enroll in the survey) online, if you also complete Step 2 (report travel) online AND your entire household reports complete travel information in Step 2, you earn a $25 Amazon gift card!
Complete the questionnaire enrolling your household in the travel survey.
Record travel information in your Travel Diary:
For 24 hours on «TDAY». Enclosed is a Travel Diary for each person in your household. Each person should carry their Travel Diary for the assigned 24-hour period to record details about their travel and activities. We ask that an adult help anyone under age 16 fill out their Travel Diary.
Report your travel information in ONE of the following ways:
To be eligible for the incentive - Online: Go to www.RTCSurvey.com. Click “Report Travel” and enter PIN: «PINNO» Each person should enter his/her own travel information. An adult can enter information for anyone under age 16.
Mail: Use the enclosed postage-paid envelope to return your completed travel diaries. If you choose this option, we may call you to clarify or collect any missing information.
Phone: NuStats will call after your travel day to collect your household’s travel information. Or, call toll-free 1-877-221-7828 to provide the information at your convenience.
The survey is being conducted for the RTC by NuStats, a professional survey firm. All information collected will not be shared, will be held strictly confidential and used only in combination with information provided from other participating households to the RTC. If you have questions about the survey or how to participate, visit www.RTCSurvey.com, or call our toll-free survey hotline at 1-877-221-7828 (4pm–8pm PST weekdays and 12pm–6pm PST Saturdays). Thank you again for providing the details that will help improve transportation choices for the region.
Sincerely,
Xuan Wang RTC Project Manager www.rtcwashoe.com
Next

115 RTC Washoe County Travel Characteristics Study Final Report
The mailing envelope and BRM are found below.
«HCITY», «HSTAT» «HZIP»
«BARSAMP»
«PROJECT»-«SAMPN»-«NDIARIES»-
«ASSN»
4115 Freidrich Lane Bldg L Suite 200
Austin, TX 78744
«RFNAM» «RLNAM»
«HADDR» «HUNIT»
«HCITY», «HSTAT» «HZIP»
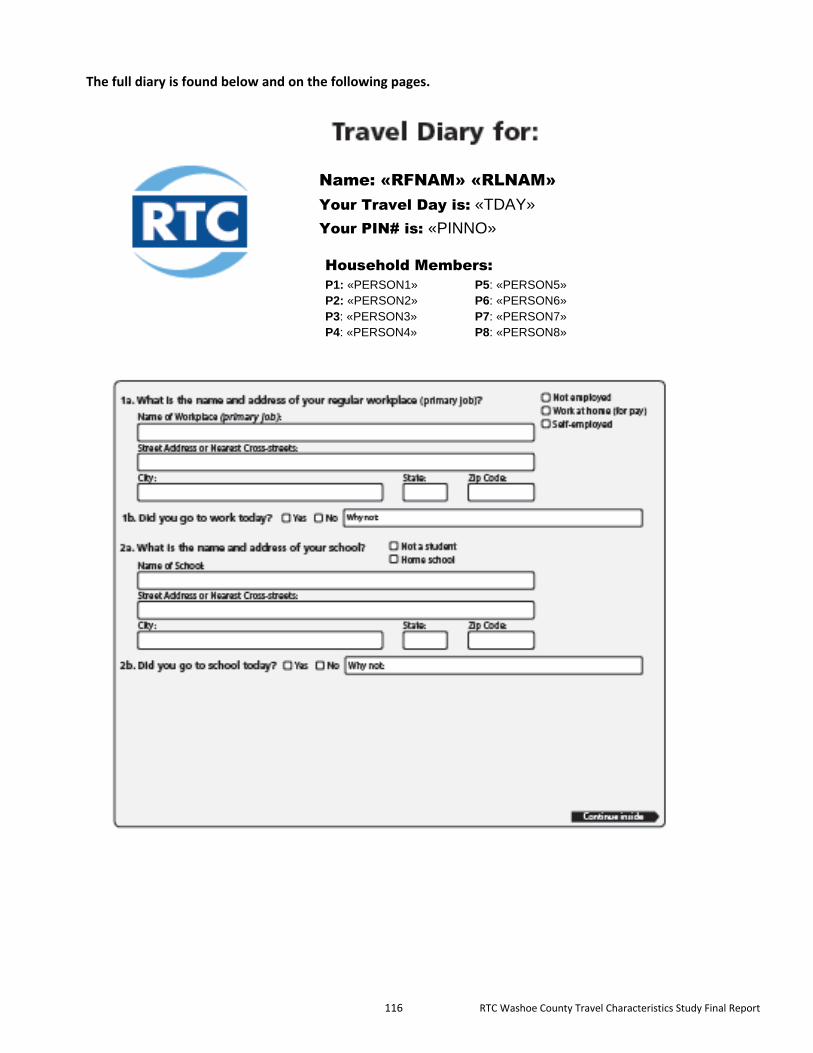
116 RTC Washoe County Travel Characteristics Study Final Report
The full diary is found below and on the following pages.
Name: «RFNAM» «RLNAM»
Your Travel Day is: «TDAY»
Your PIN# is: «PINNO»
Household Members:
P1: «PERSON1» P5: «PERSON5» P2: «PERSON2» P6: «PERSON6»
P3: «PERSON3» P7: «PERSON7»
P4: «PERSON4» P8: «PERSON8»

117 RTC Washoe County Travel Characteristics Study Final Report

118 RTC Washoe County Travel Characteristics Study Final Report
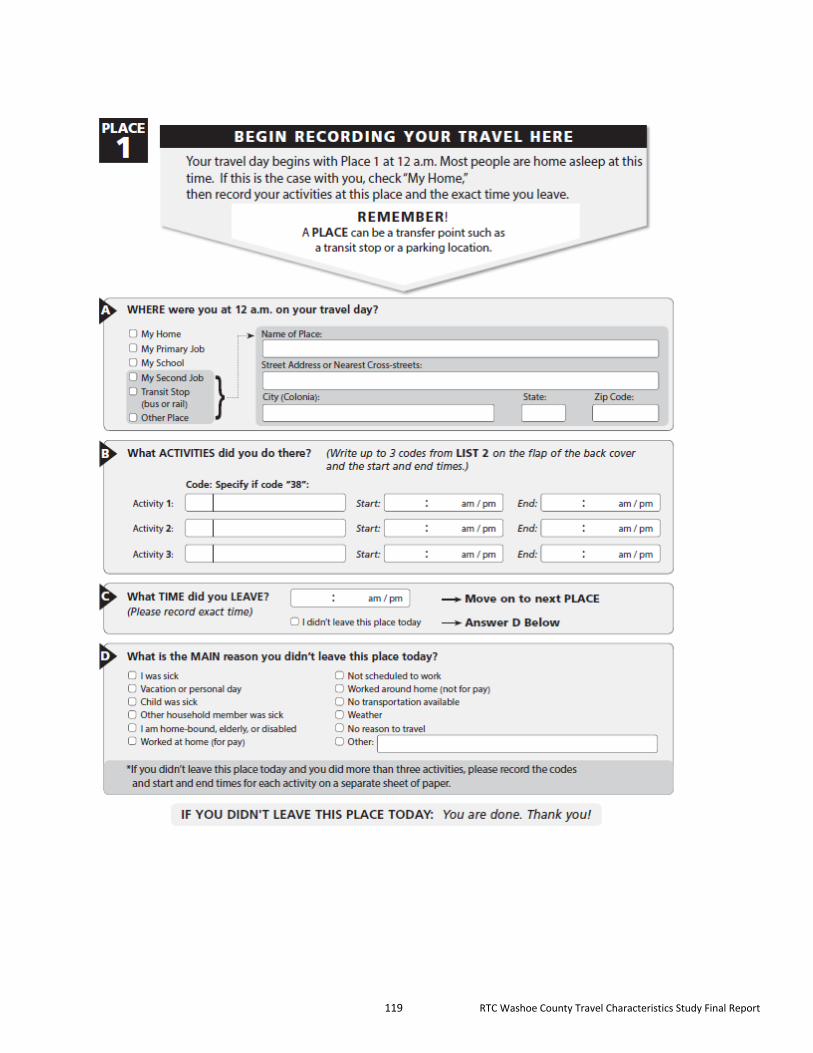
119 RTC Washoe County Travel Characteristics Study Final Report

120 RTC Washoe County Travel Characteristics Study Final Report
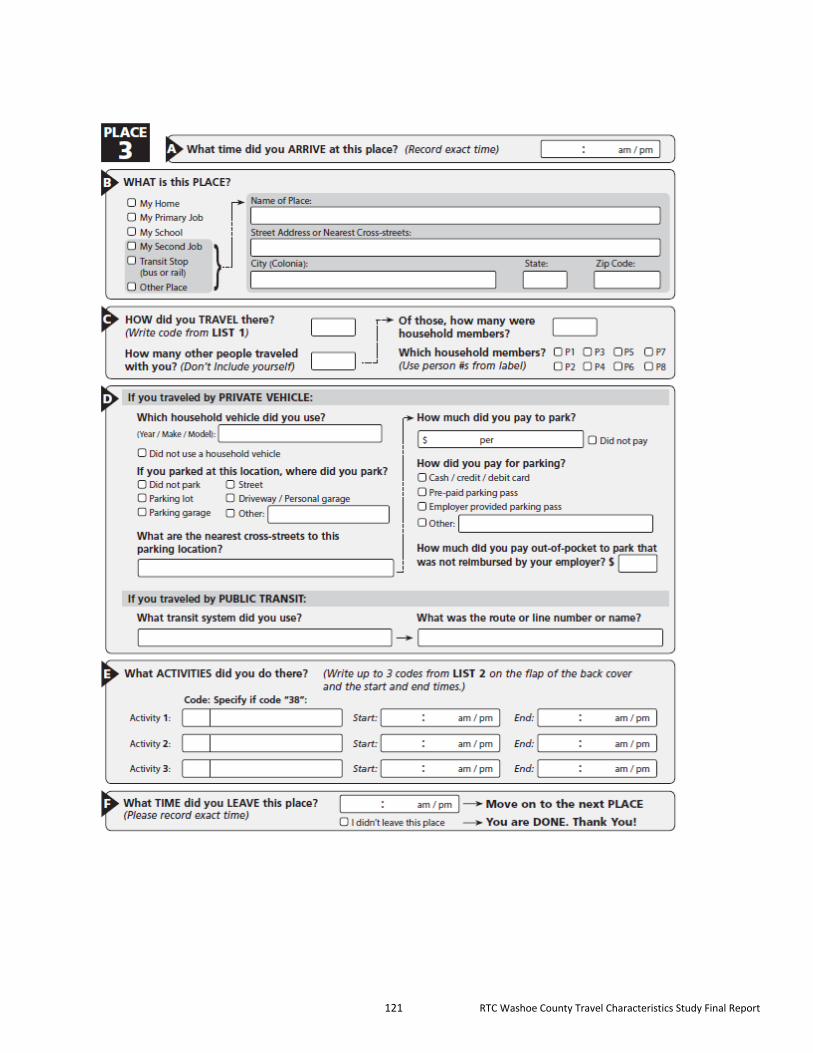
121 RTC Washoe County Travel Characteristics Study Final Report

122 RTC Washoe County Travel Characteristics Study Final Report

123 RTC Washoe County Travel Characteristics Study Final Report
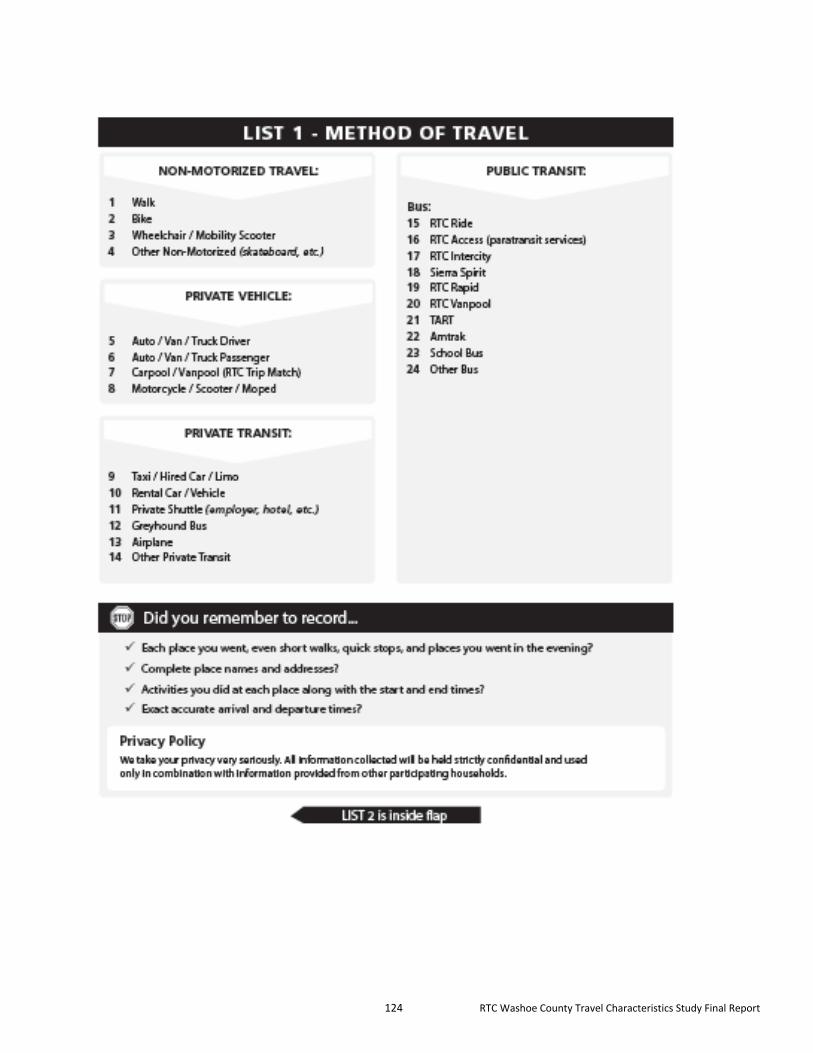
124 RTC Washoe County Travel Characteristics Study Final Report

125 RTC Washoe County Travel Characteristics Study Final Report

126 RTC Washoe County Travel Characteristics Study Final Report
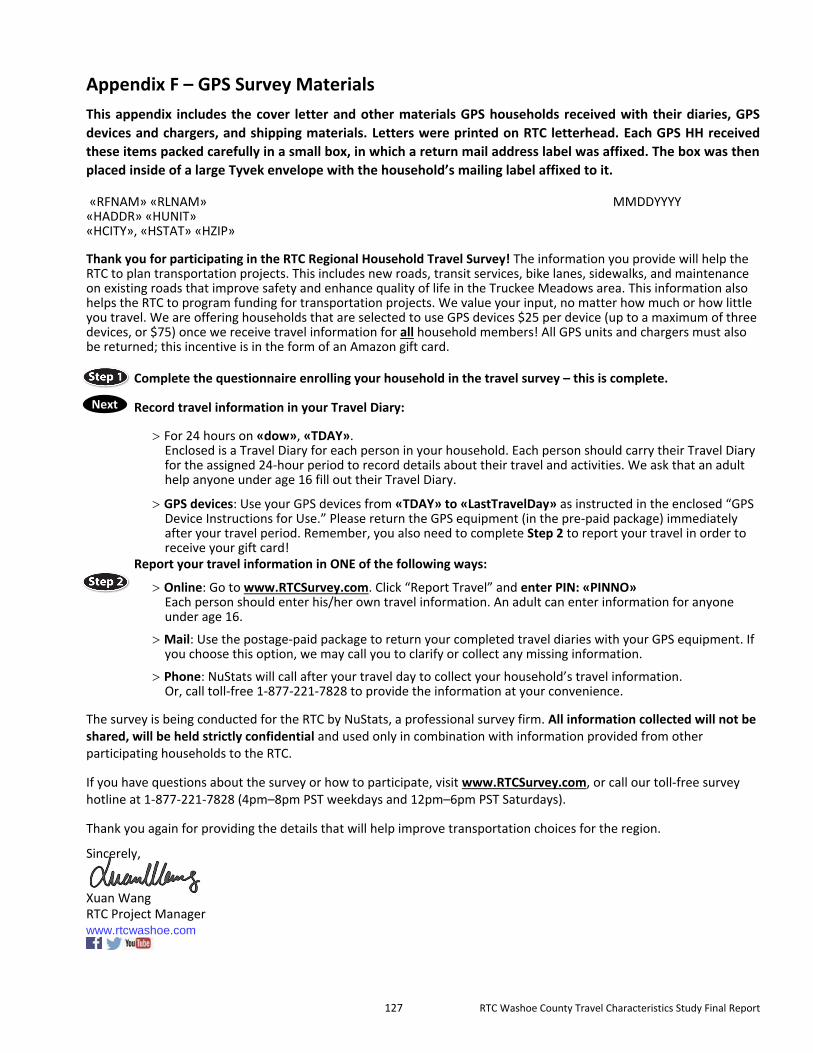
127 RTC Washoe County Travel Characteristics Study Final Report
Appendix F – GPS Survey Materials
This appendix includes the cover letter and other materials GPS households received with their diaries, GPS
devices and chargers, and shipping materials. Letters were printed on RTC letterhead. Each GPS HH received
these items packed carefully in a small box, in which a return mail address label was affixed. The box was then
placed inside of a large Tyvek envelope with the household’s mailing label affixed to it.
«RFNAM» «RLNAM» MMDDYYYY «HADDR» «HUNIT» «HCITY», «HSTAT» «HZIP»
Thank you for participating in the RTC Regional Household Travel Survey! The information you provide will help the RTC to plan transportation projects. This includes new roads, transit services, bike lanes, sidewalks, and maintenance on existing roads that improve safety and enhance quality of life in the Truckee Meadows area. This information also helps the RTC to program funding for transportation projects. We value your input, no matter how much or how little you travel. We are offering households that are selected to use GPS devices $25 per device (up to a maximum of three devices, or $75) once we receive travel information for all household members! All GPS units and chargers must also be returned; this incentive is in the form of an Amazon gift card.
Complete the questionnaire enrolling your household in the travel survey – this is complete.
Record travel information in your Travel Diary:
For 24 hours on «dow», «TDAY». Enclosed is a Travel Diary for each person in your household. Each person should carry their Travel Diary for the assigned 24-hour period to record details about their travel and activities. We ask that an adult help anyone under age 16 fill out their Travel Diary.
GPS devices: Use your GPS devices from «TDAY» to «LastTravelDay» as instructed in the enclosed “GPS Device Instructions for Use.” Please return the GPS equipment (in the pre-paid package) immediately after your travel period. Remember, you also need to complete Step 2 to report your travel in order to receive your gift card!
Report your travel information in ONE of the following ways:
Online: Go to www.RTCSurvey.com. Click “Report Travel” and enter PIN: «PINNO» Each person should enter his/her own travel information. An adult can enter information for anyone under age 16.
Mail: Use the postage-paid package to return your completed travel diaries with your GPS equipment. If you choose this option, we may call you to clarify or collect any missing information.
Phone: NuStats will call after your travel day to collect your household’s travel information. Or, call toll-free 1-877-221-7828 to provide the information at your convenience.
The survey is being conducted for the RTC by NuStats, a professional survey firm. All information collected will not be shared, will be held strictly confidential and used only in combination with information provided from other participating households to the RTC.
If you have questions about the survey or how to participate, visit www.RTCSurvey.com, or call our toll-free survey hotline at 1-877-221-7828 (4pm–8pm PST weekdays and 12pm–6pm PST Saturdays).
Thank you again for providing the details that will help improve transportation choices for the region.
Sincerely,
Xuan Wang RTC Project Manager www.rtcwashoe.com
Next

128 RTC Washoe County Travel Characteristics Study Final Report
Each GPS household received an instruction sheet with their materials.
GPS Instruction Sheet
BT

129 RTC Washoe County Travel Characteristics Study Final Report
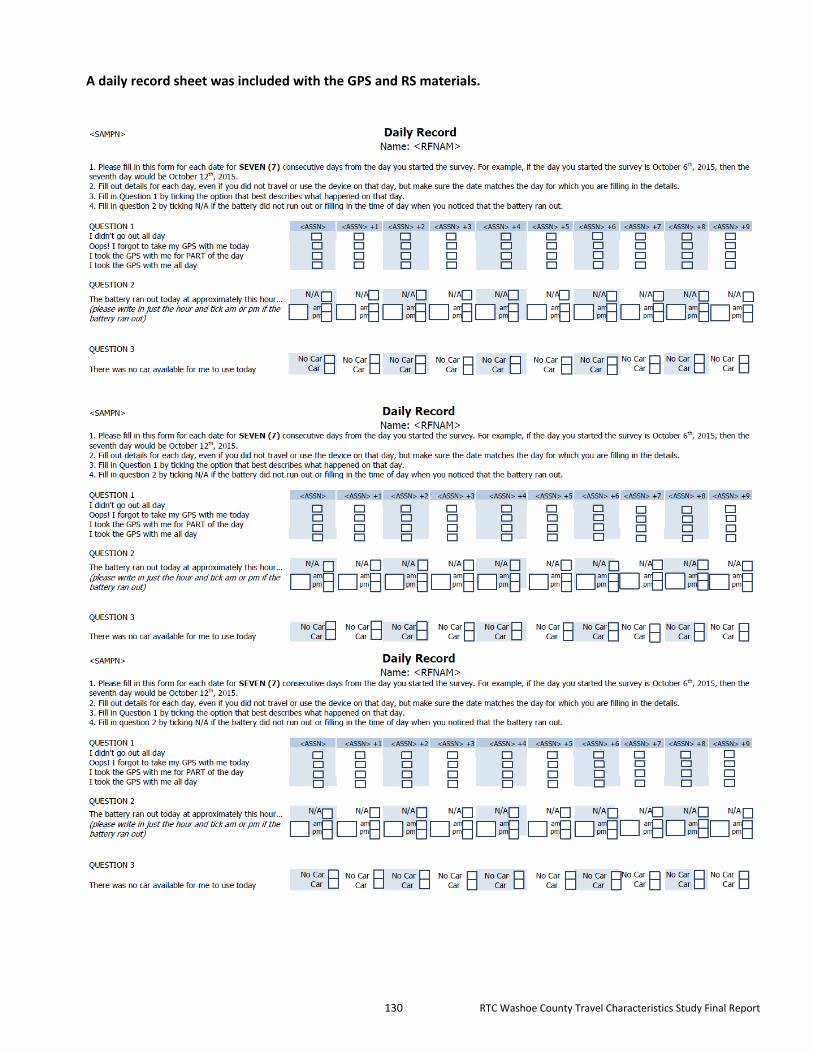
130 RTC Washoe County Travel Characteristics Study Final Report
A daily record sheet was included with the GPS and RS materials.

131 RTC Washoe County Travel Characteristics Study Final Report
Households that recruited via web and were GPS households, would be eligible for an additional $25 if they
completed all steps of the survey as directed. This flyer was placed in with the GPS materials.
Since your household completed Step 1 (enroll in the survey) online, if you also
complete Step 2 (report travel) online AND your entire household reports
complete travel information in Step 2, you earn a $25 Amazon gift card, in
addition to your GPS incentive!
To be eligible for the full incentive: Go to www.RTCSurvey.com. Click “Report
Travel” and enter PIN: «PINNO»
Each person should enter his/her own travel information. An adult can enter
information for anyone under age 16.
As long as all household members report complete travel information and all GPS
devices are returned, you will be eligible to receive the full incentive.
Thank you for participating in the RTC Regional Household Travel Survey!

132 RTC Washoe County Travel Characteristics Study Final Report
Appendix G – RouteScout Survey Materials
RouteScout participating households were mailed a packet that included a cover letter, RouteScout
instructions, a diary for each household member (found in Appendix E), daily record sheet (found in Appendix
F), and a BRM (found in Appendix E). The cover letters were printed on RTC letterhead.
«RFNAM» «RLNAM» MMDDYYYY «HADDR» «HUNIT» «HCITY», «HSTAT» «HZIP»
Thank you for participating in the RTC Regional Household Travel Survey! The information you provide will help the RTC to plan transportation projects. This includes new roads, transit services, bike lanes, sidewalks, and maintenance on existing roads that improve safety and enhance quality of life in the Truckee Meadows area. This information also helps the RTC to program funding for transportation projects. We are offering households that are selected to use RouteScout $25 per smartphone (up to a maximum of three smartphones, or $75) once we receive travel information for all household members. This incentive is in the form of an Amazon gift card.
Complete the questionnaire enrolling your household in the travel survey.
Record travel information in your Travel Diary:
For 24 hours on «dow», «TDAY». Enclosed is a Travel Diary for each person in your household. Each person should carry their Travel Diary for the assigned 24-hour period to record details about their travel and activities. We ask that an adult help anyone under age 16 fill out their Travel Diary.
RouteScout: Use your smartphone with the RouteScout application turned on from «TDAY» to «LastTravelDay» as instructed in the enclosed “RouteScout Instructions.” In order to keep your phone’s battery from running out of power, please keep your phone plugged in whenever you have a power source available. Remember, you also need to complete Step 2 to report your travel to receive your gift card!
Report your travel information in ONE of the following ways:
Online: Go to www.RTCSurvey.com. Click “Report Travel” and enter PIN: «PINNO» Each person should enter his/her own travel information. An adult can enter information for anyone under age 16.
Mail: Use the enclosed postage-paid envelope to return your completed travel diaries. If you choose this option, we may call you to clarify or collect any missing information.
Phone: NuStats will call after your travel day to collect your household’s travel information. Or, call toll-free 1-877-221-7828 to provide the information at your convenience.
The survey is being conducted for the RTC by NuStats, a professional survey firm. All information collected will not be shared, will be held strictly confidential and used only in combination with information provided from other participating households to the RTC.
If you have questions about the survey or how to participate, visit www.RTCSurvey.com, or call our toll-free survey hotline at 1-877-221-7828 (4pm–8pm PST weekdays and 12pm–6pm PST Saturdays).
Thank you again for providing the details that will help improve transportation choices for the region.
Sincerely,
Xuan Wang RTC Project Manager www.rtcwashoe.com
Next

133 RTC Washoe County Travel Characteristics Study Final Report
Households that recruited via web and were RS households, would be eligible for an additional $25 if they
completed all steps of the survey as directed. This flyer was placed in with the RS materials.
Since your household completed Step 1 (enroll in the survey) online, if you also
complete Step 2 (report travel) online AND your entire household reports
complete travel information in Step 2, you earn a $25 Amazon gift card, in
addition to your RouteScout incentive!
To be eligible for the full incentive: Go to www.RTCSurvey.com. Click “Report
Travel” and enter PIN: «PINNO»
Each person should enter his/her own travel information. An adult can enter
information for anyone under age 16.
As long as all household members report complete travel information, you will be
eligible to receive the full incentive.
Thank you for participating in the RTC Regional Household Travel Survey!

134 RTC Washoe County Travel Characteristics Study Final Report
Households participating utilizing RouteScout technology were mailed a instruction sheets for both iOS and
Android devices as part of their materials. Presented here is the iOS instruction sheet.
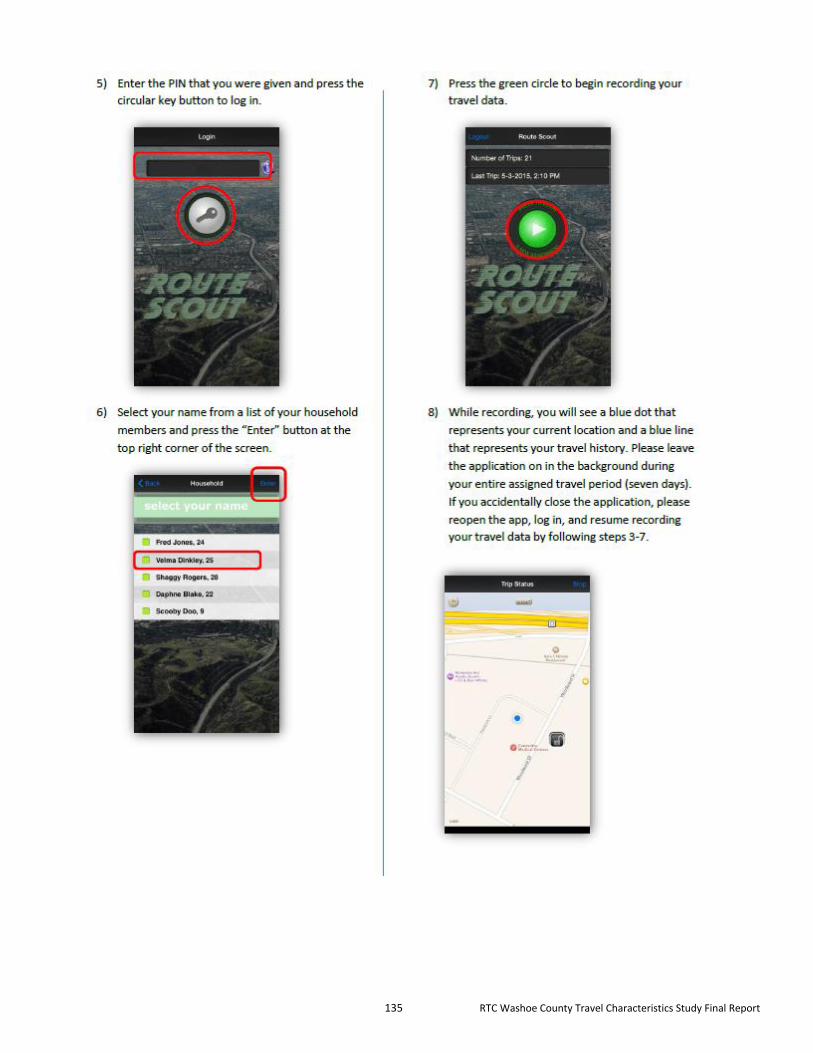
135 RTC Washoe County Travel Characteristics Study Final Report
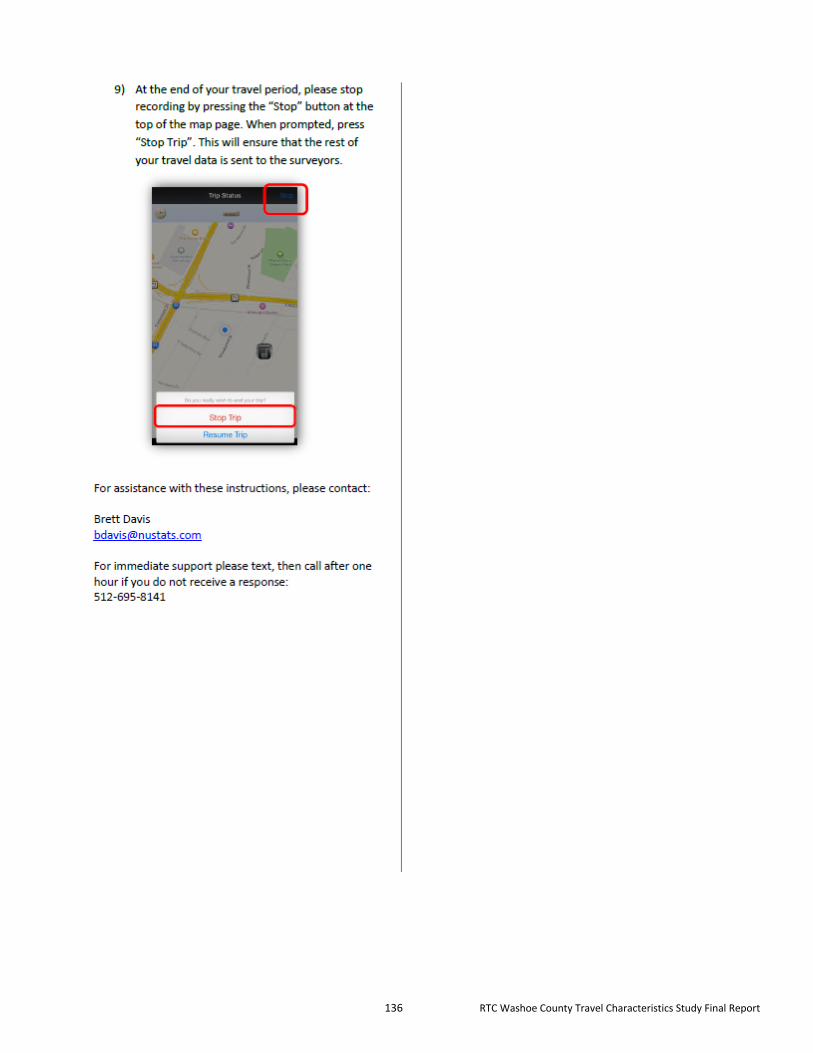
136 RTC Washoe County Travel Characteristics Study Final Report
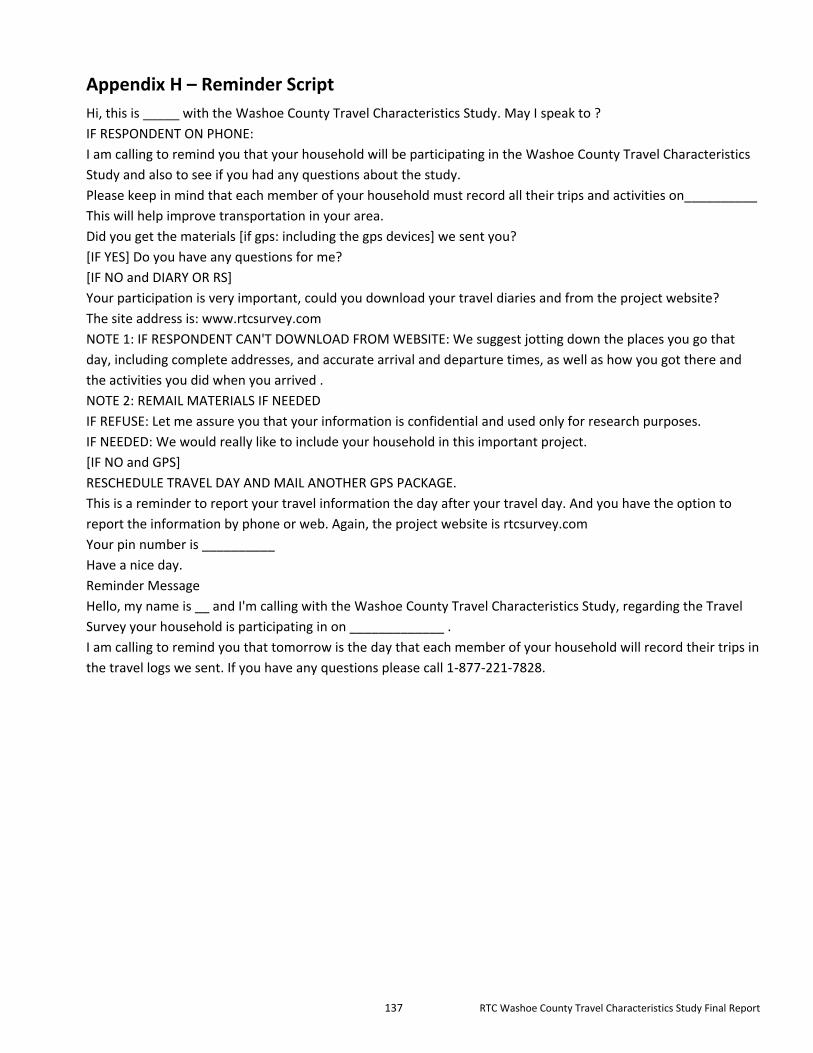
137 RTC Washoe County Travel Characteristics Study Final Report
Appendix H – Reminder Script
Hi, this is _____ with the Washoe County Travel Characteristics Study. May I speak to ?
IF RESPONDENT ON PHONE:
I am calling to remind you that your household will be participating in the Washoe County Travel Characteristics
Study and also to see if you had any questions about the study.
Please keep in mind that each member of your household must record all their trips and activities on__________
This will help improve transportation in your area.
Did you get the materials [if gps: including the gps devices] we sent you?
[IF YES] Do you have any questions for me?
[IF NO and DIARY OR RS]
Your participation is very important, could you download your travel diaries and from the project website?
The site address is: www.rtcsurvey.com
NOTE 1: IF RESPONDENT CAN'T DOWNLOAD FROM WEBSITE: We suggest jotting down the places you go that
day, including complete addresses, and accurate arrival and departure times, as well as how you got there and
the activities you did when you arrived .
NOTE 2: REMAIL MATERIALS IF NEEDED
IF REFUSE: Let me assure you that your information is confidential and used only for research purposes.
IF NEEDED: We would really like to include your household in this important project.
[IF NO and GPS]
RESCHEDULE TRAVEL DAY AND MAIL ANOTHER GPS PACKAGE.
This is a reminder to report your travel information the day after your travel day. And you have the option to
report the information by phone or web. Again, the project website is rtcsurvey.com
Your pin number is __________
Have a nice day.
Reminder Message
Hello, my name is __ and I'm calling with the Washoe County Travel Characteristics Study, regarding the Travel
Survey your household is participating in on _____________ .
I am calling to remind you that tomorrow is the day that each member of your household will record their trips in
the travel logs we sent. If you have any questions please call 1-877-221-7828.
138 RTC Washoe County Travel Characteristics Study Final Report
Appendix I – Pre-Paid Incentive Letter and Follow up Letter
139 RTC Washoe County Travel Characteristics Study Final Report

Visitor Survey
Final Report

Table of Contents 1.0 Introduction ............................................................................................................................... 1
1.1 Purpose of the Survey 1
1.2 Survey Design 1
1.3 Survey Summary Outcomes 2 2.0 Survey Methods ......................................................................................................................... 3
2.1 Survey Content 3
2.2 Tablet Interviewing Application 3
2.3 Item Response 4
2.4 Sample Design 5
2.5 Data Collection Procedures 7
2.6 Data Editing and Cleaning 7
2.7 Geocoding 7 3.0 Results ........................................................................................................................................ 9
3.1 Visitor Characteristics 9
3.2 Travel Behavior To and Within the Reno/Sparks Region 15 4.0 Conclusions and Recommendations for Future Surveys ......................................................... 26
Appendix A - Visitor Survey Questionnaire ........................................................................................... 28
Appendix B – Verbatim Responses to all “Other – please specify” Questions ..................................... 32

Table of Figures
Figure 1: Drop Down Menu Screen ...................................................................................................................................... 4
Figure 2: Survey Locations .................................................................................................................................................... 6
Figure 3: Visitor - Household Income ................................................................................................................................. 10
Figure 4: Visitor - Trip Purpose ........................................................................................................................................... 11
Figure 5: Expected Spending During Visit ........................................................................................................................... 16
Figure 6: Places Visited Overview ....................................................................................................................................... 19
Figure 7: Places Visited 1:10 Scale ...................................................................................................................................... 20
Figure 8: Places Visited 1:1.5 Scale ..................................................................................................................................... 21
Figure 9: Places Visited 1:.5 Scale ....................................................................................................................................... 22
Figure 10: Arrival Time to Places Visited ............................................................................................................................ 23
Figure 11: Departure Time from Places Visited .................................................................................................................. 23
Figure 12: Overall Number of People Accompanying Traveler .......................................................................................... 25
Table of Tables
As may be seen in Table 1, a total of 421 interviews were conducted. Of these, 354 were completed by short-term
visitors and 67 were completed by long-term visitors (staying 7 or more days in the area). Table 1: Survey Outcomes by
Length of Visit ....................................................................................................................................................................... 2
Table 2: Key Survey Item Response Rate .............................................................................................................................. 5
Table 3: Interviewing Sites .................................................................................................................................................... 6
Table 4: Visitor – Age and Gender ........................................................................................................................................ 9
Table 5: Visitor Travel Party Members ............................................................................................................................... 11
Table 6: Visitor Home State ................................................................................................................................................ 12
Table 7: Visitor Lodging Location ........................................................................................................................................ 14
Table 8: Visitor Length of Stay ............................................................................................................................................ 15
Table 9: Mode of Travel to Reno/Sparks Region ................................................................................................................ 15
Table 10: Mode of Travel to Lodging Site ........................................................................................................................... 16
Table 11: Places Visited in Previous 24 Hours .................................................................................................................... 17
Table 12: Mode of Transportation for Places Visited ......................................................................................................... 24
Table 13: Activity Purpose at Places Visited ....................................................................................................................... 24
Table 14: Number of Colleagues Accompanying Traveler .................................................................................................. 25
Table 15: Number of Family Members age 18 and Above Accompanying Traveler ........................................................... 26
Table 16: Number of Family Members 18 and Under Accompanying Traveler ................................................................. 26
Table 17: Other – Specify Responses .................................................................................................................................. 32
1 RTC Washoe County Travel Characteristics Study Final Report
1.0 Introduction
This report documents the design, implementation, and results of the Washoe County Travel
Characteristics Study - Visitor Travel Survey, sponsored by the Regional Transportation Commission (RTC),
which serves as the Metropolitan Planning Organization for the Reno/Sparks, Nevada region. The RTC
Visitor Survey was intended to capture accurate and reliable travel behaviors of visitors, who stayed
overnight, in the Reno/Sparks area. The visitor survey data collection combined with Kimley Horn’s
familiarity with travel modeling provided RTC with the necessary data to support the visitor travel
component of RTC’s Travel Demand Model.
According to the Reno/Sparks Convention and Visitors Authority, an estimated 4.6 million visitors traveled
to the Reno/Sparks and Washoe County area in 2014. The importance of the Visitor Survey provided
insight into visitors of the region and described who they were, what motivated them to travel to the
region, and their activity-based travel patterns throughout the area.
The Visitor Travel Survey was conducted in February and October 2016, and it complements a Household
Travel Behavior Survey and On-Board Transit Survey. RTC contracted with NuStats for the design and
implementation of the suite of travel surveys. Subcontractors to NuStats for the Visitor Travel Survey
included Reno-based firm Coulter & Associates, Kimley Horn and Associates, and temporary local field
staff provided through A+ Staffing.
1.1 Purpose of the Survey
The purpose of the Visitor Travel Survey was to obtain accurate information on regional travel
characteristics in order to develop and calibrate the regional travel demand model. The survey focused
on travel by visitors staying at least 24 hours in the area and with at least one overnight stay.
1.2 Survey Design
The Visitor Travel Survey was conducted as an interviewer-mediated intercept survey utilizing NuStats’
tablet application.
Visitors were interviewed at local venues, including hotels, casinos, resorts, and other activity centers. In
total, 13 survey sites were selected, representing a range of locations that would be frequented by visitors
to the area. Sites were surveyed at various hours, dependent upon the hours of operation at the location.
Interviews were conducted with visitors, residing outside Washoe County and that had been in the region
for at least 24 hours. Only one person per traveling party was eligible to respond. The data elements
included characteristics of the visit, of the traveling party, of trips taken while visiting the study area, and
an estimate of how much money the respondent anticipated spending while in the study area. Because
the sample was a "choice" sample and not probability sample, the resulting data set was neither weighted
nor expanded to reflect population parameters.

2 RTC Washoe County Travel Characteristics Study Final Report
1.3 Survey Summary Outcomes
As may be seen in Table 1, a total of 421 interviews were conducted. Of these, 354 were completed by
short-term visitors and 67 were completed by long-term visitors (staying 7 or more days in the area). Table
1: Survey Outcomes by Length of Visit
Length of Visit Count Percentage Average
(days)
Short-term (1-6 days)
354 84.1% 3.1
Long-term (7+ days)
67 15.9% 26.2
Total 421 100.0% 6.8
3 RTC Washoe County Travel Characteristics Study Final Report
2.0 Survey Methods
2.1 Survey Content
The tablet program utilized for the RTC Visitor Travel Survey is a maps-based intercept survey that
geocodes all locations as they are entered. It allowed for real-time data review with the respondents to
validate their data. To improve the efficiency and quality of data collected, a drop-down menu of the local
hotels was programmed to make input of the lodging data easy and consistent. Additionally, the program
utilized text box pop-ups to provide additional information when needed.
The average completion time for the RTC Visitor Travel Survey was ten minutes. During the interview
process, 100 percent of the spatial data were reviewed by a highly trained interviewer to detect issues
with the data. This real-time quality control allowed the interviewer to document atypical travel behavior,
which provided RTC with accurate and model-ready data. The application collected the following key
variables:
• Respondent characteristics (gender, household income, age, and home location); • Length of visit; • Visit purpose; • Traveling party size and characteristics; • Lodging location and type; • Travel modes to Washoe County; • Primary travel mode while visiting Washoe County;
Geocoding of all locations (home, lodging, and all destinations);
Anticipated amount of money to be spent while in the region; and • Trip characteristics for one day (including destinations, activities, activity durations, and
mode).
The complete Visitor Travel Survey questionnaire may be found in Appendix A - Visitor Survey
Questionnaire.
2.2 Tablet Interviewing Application
The visitor survey application is NuStats’ proprietary application that was developed in-house, and
modified specific to the needs of the RTC Visitor Survey. The application was programmed with a random
generator in which the surveyor keyed in the number of possible interviewees and instructed the surveyor
which visitor to approach to conduct the survey. The application is capable of performing real-time
geocoding so that locations were collected and validated by the visitor while they were being interviewed.
The application was rigorously tested throughout development following the items found in the next
section. Some points of note are:
Rapid data collection – Use of the tablet platform enabled faster and more efficient survey
completion, significantly boosting the number of completes per hour.
Offline data collection – All operations of the survey application were fully functional while
offline. The application incorporated an internal database system capable of collecting unlimited
surveys while offline for later uploading once data connection was restored.
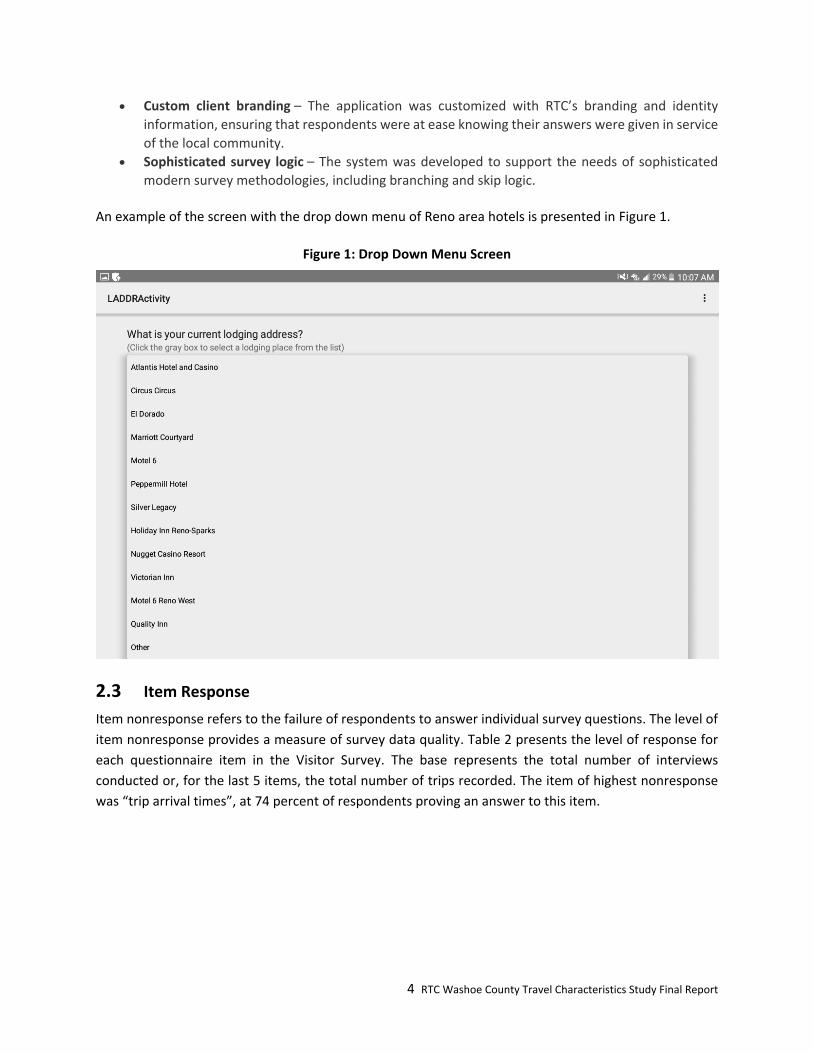
4 RTC Washoe County Travel Characteristics Study Final Report
Custom client branding – The application was customized with RTC’s branding and identity
information, ensuring that respondents were at ease knowing their answers were given in service
of the local community.
Sophisticated survey logic – The system was developed to support the needs of sophisticated
modern survey methodologies, including branching and skip logic.
An example of the screen with the drop down menu of Reno area hotels is presented in Figure 1.
Figure 1: Drop Down Menu Screen
2.3 Item Response
Item nonresponse refers to the failure of respondents to answer individual survey questions. The level of
item nonresponse provides a measure of survey data quality. Table 2 presents the level of response for
each questionnaire item in the Visitor Survey. The base represents the total number of interviews
conducted or, for the last 5 items, the total number of trips recorded. The item of highest nonresponse
was “trip arrival times”, at 74 percent of respondents proving an answer to this item.
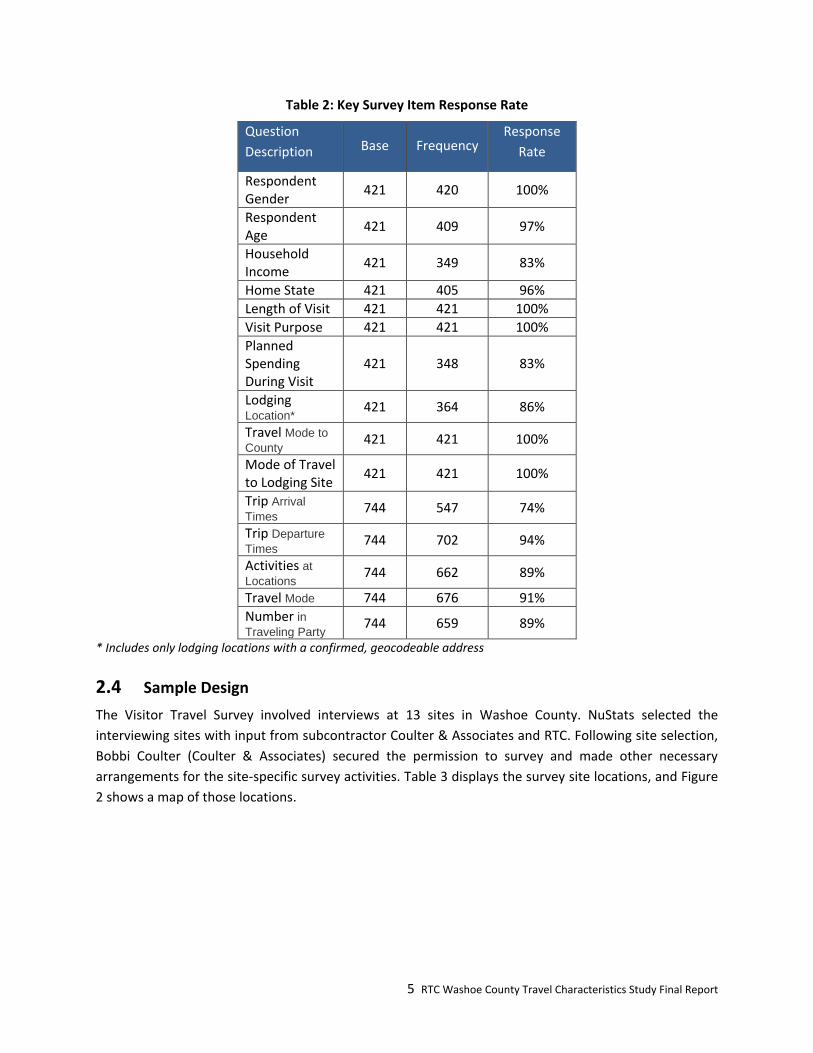
5 RTC Washoe County Travel Characteristics Study Final Report
Table 2: Key Survey Item Response Rate
Question
Description Base Frequency Response
Rate
Respondent Gender
421 420 100%
Respondent Age
421 409 97%
Household Income
421 349 83%
Home State 421 405 96%
Length of Visit 421 421 100%
Visit Purpose 421 421 100%
Planned Spending During Visit
421 348 83%
Lodging
Location* 421 364 86%
Travel Mode to
County 421 421 100%
Mode of Travel to Lodging Site
421 421 100%
Trip Arrival
Times 744 547 74%
Trip Departure
Times 744 702 94%
Activities at
Locations 744 662 89%
Travel Mode 744 676 91%
Number in
Traveling Party 744 659 89%
* Includes only lodging locations with a confirmed, geocodeable address
2.4 Sample Design
The Visitor Travel Survey involved interviews at 13 sites in Washoe County. NuStats selected the
interviewing sites with input from subcontractor Coulter & Associates and RTC. Following site selection,
Bobbi Coulter (Coulter & Associates) secured the permission to survey and made other necessary
arrangements for the site-specific survey activities. Table 3 displays the survey site locations, and Figure
2 shows a map of those locations.

6 RTC Washoe County Travel Characteristics Study Final Report
Table 3: Interviewing Sites
Site Timeframe Surveyed
Atlantis Hotel & Casino Spring 2016
Best Western Airport Plaza Hotel Spring 2016
Circus Circus Spring 2016
The Diamond Casino Fall 2016
El Dorado Spring 2016
Grand Sierra Resort Fall 2016
Harrah's Fall 2016
Marriott Courtyard Spring 2016
National Automobile Museum Fall 2016
Nugget Casino Resort Spring 2016
Sands Regency Fall 2016
Silver Legacy Spring 2016
Whitney Peak Hotel - PILOT SURVEY Spring 2016
Figure 2: Survey Locations
7 RTC Washoe County Travel Characteristics Study Final Report
2.5 Data Collection Procedures
The primary focus of the survey was to capture information about visitors to the county, the
characteristics of their visit, and the characteristics of their travel while in the county. Respondents were
eligible to be interviewed if they had been in the county for at least 24 hours, and were at least 18 years
of age. Multiple screening questions were used to assess respondent eligibility:
• Have you been in the Reno area for at least 24 hours?
• Are you 18 or older?
Visitors were asked general questions about their visit to the county. Then, they were asked about the
places that they traveled to in the previous 24 hours. Interviewers captured all locations reported by
respondents.
The interviews were conducted using surveyors from A+ Staffing and NuStats. NuStats conducted an in-
depth training session with surveyors assigned to the project prior to them entering the field. The surveyor
training session involved advising surveyors of the study purpose, fully acquainting them with the survey
instrument (review of all questions and intended responses), and instructing them in how to enter data
using the application. Survey data was uploaded data daily from the tablets through an FTP site. Uploaded
records were reviewed by a NuStats analyst for completeness and then run through rigorous data editing
and cleaning processes.
2.6 Data Editing and Cleaning
Once surveying has been completed, the dataset is exported from the project website to be verified. This
process begins with reviewing all surveys to ensure the proper data were collected. Range and spelling
queries are executed on the entire file. The interview data are then committed into a master database.
The master database is then reviewed, edited, and corrected using manual and automated edit checks.
When conducting the checks, outlying values that are illogical were identified, and inconsistent data
corrected when possible.
2.7 Geocoding
Visited locations were geocoded to coordinates in real time as the survey was taking place. The surveyor
was able to either enter a place name or address and search for the location on the map page, which
incorporated the Google Maps API, or they could touch the location on the map to get the coordinates.
NuStats utilized the tablet application to collect the spatial data. This program improved the efficiency
and quality of collected activity data because it allows for the data to be reviewed in real-time with the
respondent to validate their places. During the interview process, 100 percent of the spatial data was
reviewed by a highly trained tablet interviewer to detect issues with the data, such as unreasonable
walking distances or illogical arrival times for next locations.
The address collection pages of the application used the Google Maps API to search for and geocode a
location. The place name, cross-streets, or address can be entered into the search bar, and as the surveyor
types, a list of suggested entries pops up below the search bar for the surveyor to select. These suggestions
are based on the physical location of the tablet and list closest matching entries at the top so as to reduce
8 RTC Washoe County Travel Characteristics Study Final Report
selection of incorrect out-of-area places with the same name. Once selected, the location’s name,
address, and coordinates are recorded. Recorded address details include:
address o street number o street prefix o street pre-type o street name o street suffix
suite
city
state
zip code
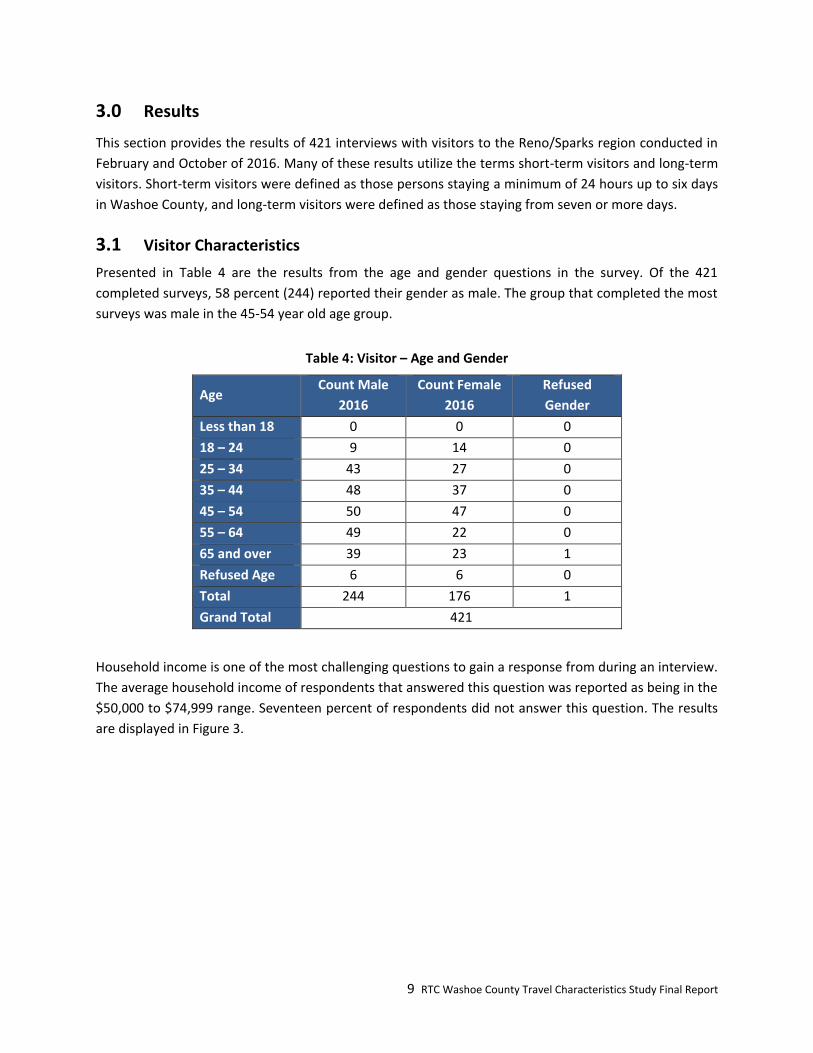
9 RTC Washoe County Travel Characteristics Study Final Report
3.0 Results
This section provides the results of 421 interviews with visitors to the Reno/Sparks region conducted in
February and October of 2016. Many of these results utilize the terms short-term visitors and long-term
visitors. Short-term visitors were defined as those persons staying a minimum of 24 hours up to six days
in Washoe County, and long-term visitors were defined as those staying from seven or more days.
3.1 Visitor Characteristics
Presented in Table 4 are the results from the age and gender questions in the survey. Of the 421
completed surveys, 58 percent (244) reported their gender as male. The group that completed the most
surveys was male in the 45-54 year old age group.
Table 4: Visitor – Age and Gender
Age Count Male
2016
Count Female
2016
Refused
Gender
Less than 18 0 0 0
18 – 24 9 14 0
25 – 34 43 27 0
35 – 44 48 37 0
45 – 54 50 47 0
55 – 64 49 22 0
65 and over 39 23 1
Refused Age 6 6 0
Total 244 176 1
Grand Total 421
Household income is one of the most challenging questions to gain a response from during an interview.
The average household income of respondents that answered this question was reported as being in the
$50,000 to $74,999 range. Seventeen percent of respondents did not answer this question. The results
are displayed in Figure 3.

10 RTC Washoe County Travel Characteristics Study Final Report
Figure 3: Visitor - Household Income
As is shown in Figure 4, 44 percent of visitors interviewed traveled to the Reno/Sparks region for
recreation. The trip purpose reported the least was “Other”, which showed slightly less than seven
percent of those interviewed traveled to the Reno/Sparks region for purposes other than Convention,
Recreation, Business, or Visiting Friends.
<$10k$10k -
$24,999$25k -
$34,999$35k -
$49,999$50k -
$74,999$75k-
$99,999$100k -
$149,999$150k+ Missing
Long-term 4.5% 4.5% 9.0% 9.0% 16.4% 17.9% 10.4% 7.5% 20.9%
Short-term 2.3% 4.5% 8.2% 11.3% 19.5% 16.4% 12.1% 9.3% 16.4%
Total 2.6% 4.5% 8.3% 10.9% 19.0% 16.6% 11.9% 9.0% 17.1%
0.0%
5.0%
10.0%
15.0%
20.0%
25.0%
Household Income
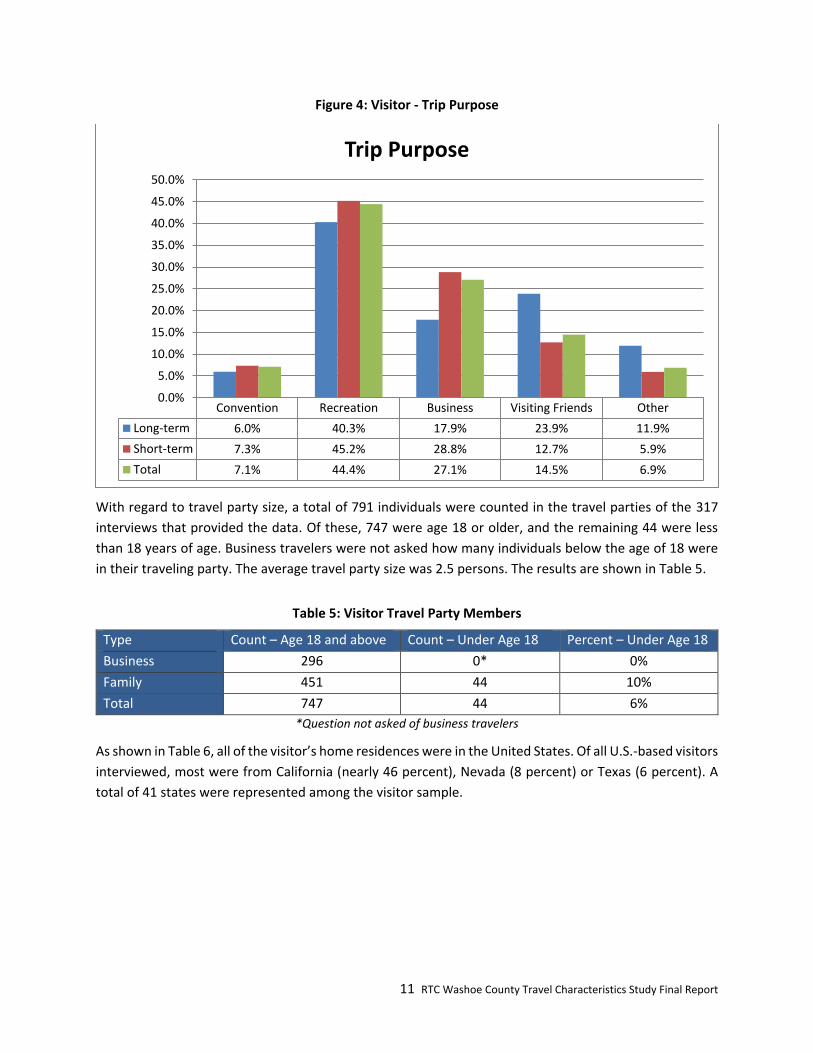
11 RTC Washoe County Travel Characteristics Study Final Report
Figure 4: Visitor - Trip Purpose
With regard to travel party size, a total of 791 individuals were counted in the travel parties of the 317
interviews that provided the data. Of these, 747 were age 18 or older, and the remaining 44 were less
than 18 years of age. Business travelers were not asked how many individuals below the age of 18 were
in their traveling party. The average travel party size was 2.5 persons. The results are shown in Table 5.
Table 5: Visitor Travel Party Members
Type Count – Age 18 and above Count – Under Age 18 Percent – Under Age 18
Business 296 0* 0%
Family 451 44 10%
Total 747 44 6%
*Question not asked of business travelers
As shown in Table 6, all of the visitor’s home residences were in the United States. Of all U.S.-based visitors
interviewed, most were from California (nearly 46 percent), Nevada (8 percent) or Texas (6 percent). A
total of 41 states were represented among the visitor sample.
Convention Recreation Business Visiting Friends Other
Long-term 6.0% 40.3% 17.9% 23.9% 11.9%
Short-term 7.3% 45.2% 28.8% 12.7% 5.9%
Total 7.1% 44.4% 27.1% 14.5% 6.9%
0.0%
5.0%
10.0%
15.0%
20.0%
25.0%
30.0%
35.0%
40.0%
45.0%
50.0%
Trip Purpose

12 RTC Washoe County Travel Characteristics Study Final Report
Table 6: Visitor Home State
State Short-term Long-term Total
Freq. % Freq. % Freq. %
California 152 45.6% 19 31.1% 171 43.4%
Nevada 25 7.5% 3 4.9% 28 7.1%
Texas 21 6.3% 1 1.6% 22 5.6%
Oregon 15 4.5% 3 4.9% 18 4.6%
Washington 12 3.6% 5 8.2% 17 4.3%
Utah 12 3.6% 2 3.3% 14 3.6%
Colorado 13 3.9% 1 1.6% 14 3.6%
Illinois 9 2.7% 1 1.6% 10 2.5%
Arizona 6 1.8% 3 4.9% 9 2.3%
Florida 2 0.6% 5 8.2% 7 1.8%
Idaho 6 1.8% 0 0.0% 6 1.5%
Missouri 6 1.8% 0 0.0% 6 1.5%
New York 6 1.8% 0 0.0% 6 1.5%
Nebraska 5 1.5% 0 0.0% 5 1.3%
Virginia 3 0.9% 2 3.3% 5 1.3%
Ohio 2 0.6% 2 3.3% 4 1.0%
Pennsylvania 2 0.6% 2 3.3% 4 1.0%
Kansas 2 0.6% 2 3.3% 4 1.0%
Arkansas 3 0.9% 0 0.0% 3 0.8%
Georgia 2 0.6% 1 1.6% 3 0.8%
Iowa 3 0.9% 0 0.0% 3 0.8%
Louisiana 2 0.6% 1 1.6% 3 0.8%
Massachusetts 3 0.9% 0 0.0% 3 0.8%
Michigan 3 0.9% 0 0.0% 3 0.8%
Oklahoma 3 0.9% 0 0.0% 3 0.8%
Not-stated* 1 0.3% 1 1.6% 2 0.5%
Alaska 1 0.3% 1 1.6% 2 0.5%
Kentucky 2 0.6% 0 0.0% 2 0.5%
North Carolina 2 0.6% 0 0.0% 2 0.5%

13 RTC Washoe County Travel Characteristics Study Final Report
State Short-term Long-term Total
Freq. % Freq. % Freq. %
New Jersey 1 0.3% 1 1.6% 2 0.5%
Wisconsin 1 0.3% 1 1.6% 2 0.5%
West Virginia 1 0.3% 1 1.6% 2 0.5%
Alabama 1 0.3% 0 0.0% 1 0.3%
Hawaii 0 0.0% 1 1.6% 1 0.3%
Indiana 0 0.0% 1 1.6% 1 0.3%
Minnesota 1 0.3% 0 0.0% 1 0.3%
New Mexico 0 0.0% 1 1.6% 1 0.3%
South Carolina 1 0.3% 0 0.0% 1 0.3%
South Dakota 1 0.3% 0 0.0% 1 0.3%
Vermont 1 0.3% 0 0.0% 1 0.3%
Wyoming 1 0.3% 0 0.0% 1 0.3%
District of Columbia 1 0.3%
Florida 6 1.6%
Mississippi 1 0.3%
Montana 2 0.5%
New Hampshire 1 0.3%
Tennessee 2 0.5%
Total** 333 100.0% 61 100.0% 394 100.0% *A full home address was not obtained from two respondents
**Totals may not be exact due to rounding

14 RTC Washoe County Travel Characteristics Study Final Report
When asked where visitors stayed while in the Reno/Sparks region, a total of 37 different lodging names
were reported. Hotels and casino resorts were the most common choice of lodging among respondents.
Of 382 responses, 62 (16%) respondents stayed at the Peppermill Resort Hotel. Other popular choices
were Circus Circus Reno Hotel & Casino (14 percent), and Whitney Peak Hotel (9 percent). The breakdown
by lodging site name is shown in Table 7.
Table 7: Visitor Lodging Location
Lodging Site Name Frequency Percentage
Atlantis Casino Resort Spa 34 8.9%
Best Western Airport 2 0.5%
Circus Circus Reno Hotel & Casino
52 13.6%
Condo Rental 1 0.3%
Econo Lodge 1 0.3%
El Dorado 21 5.5%
Family/Friends 12 3.1%
Gold Ranch RV Resort 1 0.3%
Grand Sierra Resort And Casino 9 2.4%
Harrah's Reno Hotel & Casino 22 5.8%
Holiday Inn Express 3 0.8%
Holiday Inn Reno-Sparks 5 1.3%
Hotel El Cortez 1 0.3%
Hyatt Place 9 2.4%
La Quinta 3 0.8%
Marriott 1 0.3%
Marriott Courtyard 18 4.7%
Motel 6 13 3.4%
Nugget Casino Resort 31 8.1%
Peppermill Resort Hotel 62 16.2%
Quality Inn 2 0.5%
Ramada 1 0.3%
Sands Regency 12 3.1%
Siegel Suites 1 0.3%
Siena Hotel 1 0.3%
Silver Legacy Resort & Casino 23 6.0%
Thunderbird Timeshare 1 0.3%
University Of Nevada Reno 2 0.5%
Vagabond Inn 1 0.3%
Victorian Inn 1 0.3%
Whitney Peak Hotel 36 9.4%
Total 382 100.0%
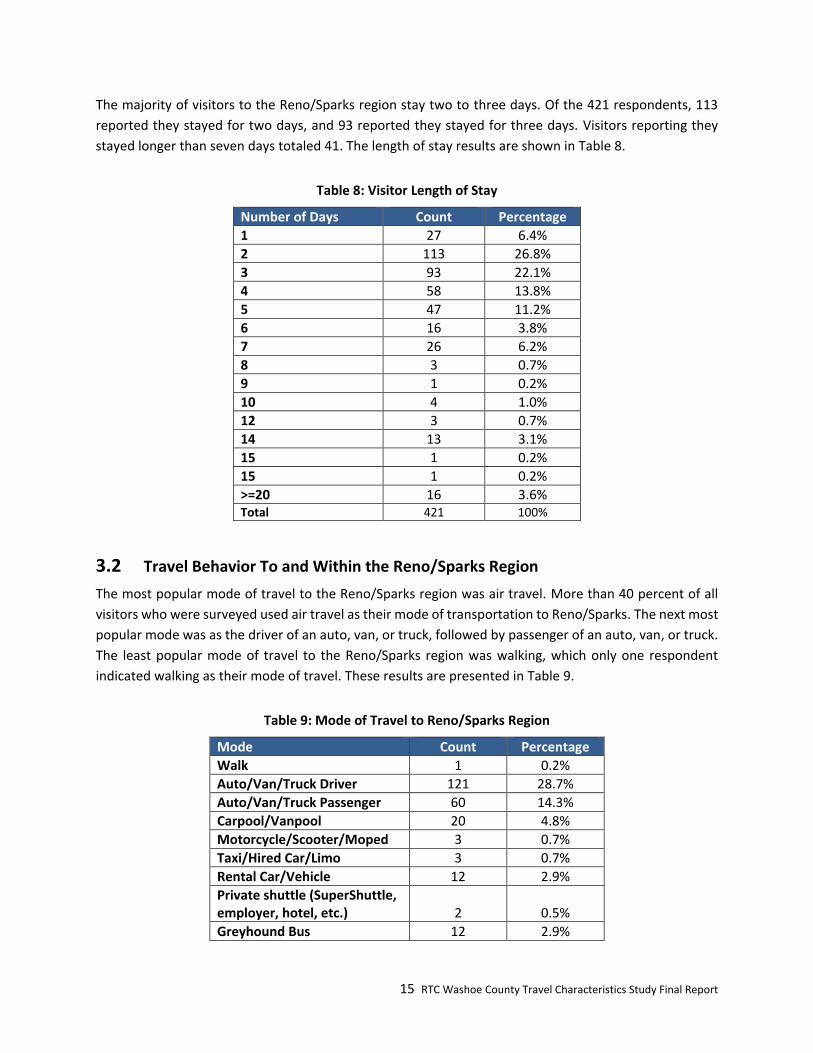
15 RTC Washoe County Travel Characteristics Study Final Report
The majority of visitors to the Reno/Sparks region stay two to three days. Of the 421 respondents, 113
reported they stayed for two days, and 93 reported they stayed for three days. Visitors reporting they
stayed longer than seven days totaled 41. The length of stay results are shown in Table 8.
Table 8: Visitor Length of Stay
Number of Days Count Percentage
1 27 6.4%
2 113 26.8%
3 93 22.1%
4 58 13.8%
5 47 11.2%
6 16 3.8%
7 26 6.2%
8 3 0.7%
9 1 0.2%
10 4 1.0%
12 3 0.7%
14 13 3.1%
15 1 0.2%
15 1 0.2%
>=20 16 3.6% Total 421 100%
3.2 Travel Behavior To and Within the Reno/Sparks Region
The most popular mode of travel to the Reno/Sparks region was air travel. More than 40 percent of all
visitors who were surveyed used air travel as their mode of transportation to Reno/Sparks. The next most
popular mode was as the driver of an auto, van, or truck, followed by passenger of an auto, van, or truck.
The least popular mode of travel to the Reno/Sparks region was walking, which only one respondent
indicated walking as their mode of travel. These results are presented in Table 9.
Table 9: Mode of Travel to Reno/Sparks Region
Mode Count Percentage
Walk 1 0.2%
Auto/Van/Truck Driver 121 28.7%
Auto/Van/Truck Passenger 60 14.3%
Carpool/Vanpool 20 4.8%
Motorcycle/Scooter/Moped 3 0.7%
Taxi/Hired Car/Limo 3 0.7%
Rental Car/Vehicle 12 2.9%
Private shuttle (SuperShuttle, employer, hotel, etc.) 2 0.5%
Greyhound Bus 12 2.9%

16 RTC Washoe County Travel Characteristics Study Final Report
Airplane 172 40.9%
Amtrak 15 3.6%
Total 421 100.0%
When asked what mode of travel was used to arrive at their lodging site, 39 percent of respondents
answered they traveled by auto, van, or truck as the driver, with an additional 12 percent of respondents
stating they traveled by auto, van or truck as the passenger. Table 10 presents the breakdown of travel
mode to lodging site.
Table 10: Mode of Travel to Lodging Site
Mode Count Percentage
Walk 20 4.8%
Auto/Van/Truck Driver 166 39.4%
Auto/Van/Truck Passenger 51 12.1%
Carpool/Vanpool 25 5.9%
Motorcycle/Scooter/Moped 3 0.7%
Taxi/Hired Car/Limo 45 10.7%
Rental Car/Vehicle 57 13.5%
Private shuttle (SuperShuttle, employer, hotel, etc.)
31 7.4%
Greyhound Bus 3 0.7%
Airplane 1 0.2%
Other Private Transit, please specify 4 1.0%
RTC Ride 4 1.0%
Amtrak 2 0.5%
Other 10 2.4%
Total 421 100%
One element that the RTC was interested in collecting for 2016 was an estimate of how much money
visitors expected to spend on their trip to the region. Seventeen percent of those surveyed answered
either that they didn’t know how much they would spend, or they refused to answer the question. Of the
remaining 83 percent that answered the question, 29 percent expected to spend between $0 and $499,
and 25 percent expected to spend between $500 and $999. A total of 29 percent of respondents reported
they expected to spend $1,000 or more. The results are shown in Figure 5.
Figure 5: Expected Spending During Visit

17 RTC Washoe County Travel Characteristics Study Final Report
When asked to name the places that were visited by respondents within the previous 24 hours, a total of
638 responses were collected. Only the top 35 places (385 responses) were included in the analysis. Places
named as being visited by less than four respondents were not included. Table 11 presents the results of
the top 35 places reported as being visited in the previous 24 hours. Casino resort hotels were the most
popular destination with a total of 35 percent of respondents reporting having visited one in the previous
24 hours. Places recognized as casino resort hotels are shaded in light blue in the table.
On an individual basis, the Silver Legacy Resort & Casino is shown as the place having the highest number
of visits.
Table 11: Places Visited in Previous 24 Hours
Place Name Frequency Percentage
Silver Legacy Resort & Casino 65 10.2%
Atlantis Casino Resort Spa 33 5.20%
Circus Circus Reno Hotel & Casino
22 3.40%
Peppermill Resort Spa Casino Hotel
22 3.40%
Grand Sierra Resort And Casino 21 3.30%
Eldorado Resort Casino 17 2.70%
Harrah's Reno Hotel & Casino 17 2.70%
University Of Nevada Reno 16 2.50%
Nugget Casino Resort 14 2.20%
Meadowood Mall 13 2.00%
Automobile Museum 10 1.60%
Century Riverside 10 1.60%
Reno-Sparks Convention Center 10 1.60%
$0 -$499
$500 -$999
$1,000 -$2,499
$2,500 -$4,999
$5,000 -$9,999
$10k -$24,999
$25k -$49,999
$50k -$74,999
Don'tKnow/
Refused
Long-term 14.9% 14.9% 9.0% 11.9% 11.9% 3.0% 1.5% 0.0% 32.8%
Short-term 31.6% 27.1% 19.2% 5.1% 1.4% 0.6% 0.3% 0.3% 14.4%
Total 29.0% 25.2% 17.6% 6.2% 3.1% 1.0% 0.5% 0.2% 17.3%
0.0%5.0%
10.0%15.0%20.0%25.0%30.0%35.0%
Expected Spending During Visit

18 RTC Washoe County Travel Characteristics Study Final Report
Place Name Frequency Percentage
Sparks Marina 10 1.60%
Cargo : Whitney Peak Hotel 8 1.30%
Club Cal Neva Hotel and Casino 8 1.30%
Reno Events Center 8 1.30%
The Outlets At Sparks 8 1.30%
McDonald’s 7 1.10%
Reno Ballroom 7 1.10%
Renown Regional Medical Center
7 1.10%
Residential 6 0.90%
Nevada Discovery Museum 5 0.80%
Nevada Museum Of Art 5 0.80%
Great Basin Brewing Company 4 0.60%
Petco 4 0.60%
Reno Koa At Boomtown 4 0.60%
Sands Regency 4 0.60%
Sparks Marina Park 4 0.60%
Starbucks 4 0.60%
Toque De Mexico 4 0.60%
VA Medical Ctr-Sierra 4 0.60%
Walmart 4 0.60%
Total 385 60.30%
*Includes only the top 35 locations of the 638 trips recorded with a valid location name.
The following maps present the places visited in progressively larger scales.
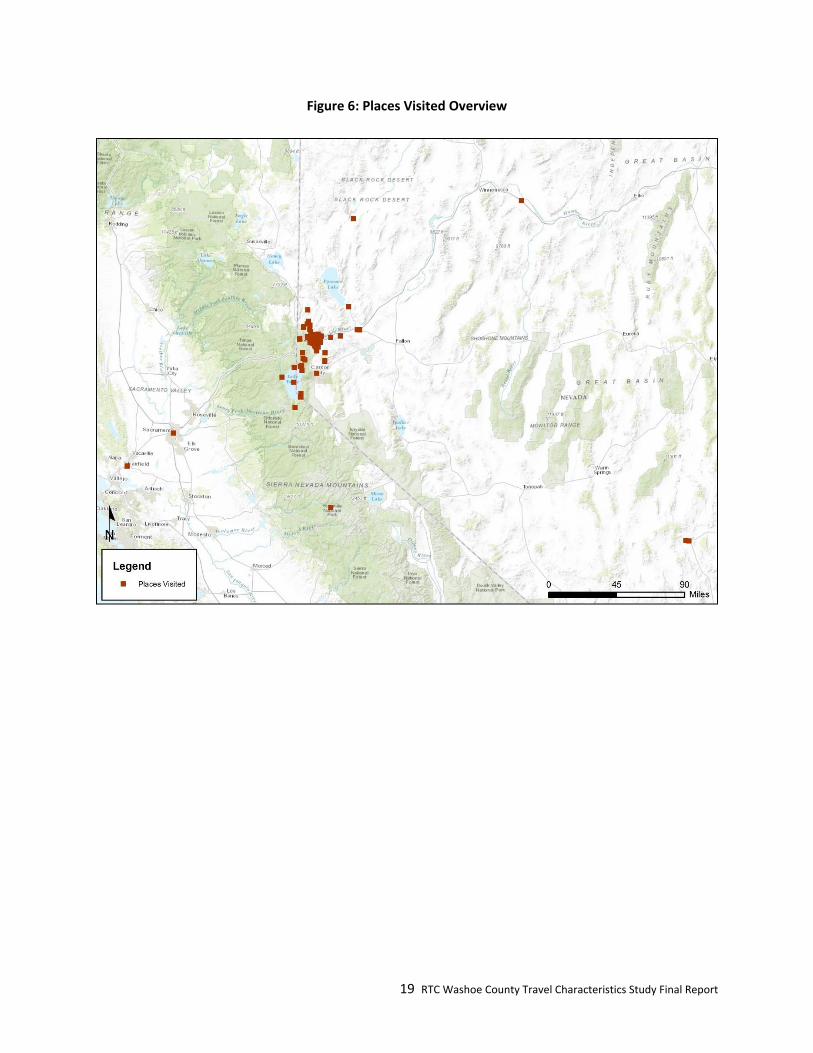
19 RTC Washoe County Travel Characteristics Study Final Report
Figure 6: Places Visited Overview

20 RTC Washoe County Travel Characteristics Study Final Report
Figure 7: Places Visited 1:10 Scale

21 RTC Washoe County Travel Characteristics Study Final Report
Figure 8: Places Visited 1:1.5 Scale

22 RTC Washoe County Travel Characteristics Study Final Report
Figure 9: Places Visited 1:.5 Scale
With each place respondents reported having visited in the previous 24 hours, the arrival and departure
times were recorded. In Figure 10 the arrival times are displayed. The peak arrival hours are 10 a.m. (13.7
percent), 12 p.m. (11.5 percent), and 11 a.m. (11.3 percent). Arrival times between 1:00 a.m. and 6:00
a.m. are the lowest volume hours.

23 RTC Washoe County Travel Characteristics Study Final Report
Figure 10: Arrival Time to Places Visited
Departure times from each visited place show the volume between 1:00 a.m. and 7:00 a.m. is fairly low.
There are several peak hours observed: 3:00 p.m. (7.4 percent); 4:00 p.m. (7.3 percent); 5:00 p.m. (7.7
percent); 7:00 p.m. (7.4 percent); and 8:00 p.m. (7.7 percent). The full results of departure times may be
seen in Figure 11.
Figure 11: Departure Time from Places Visited
When asked what mode of transportation was used to get to and from places visited, multiple modes
were allowed. Of the 638 places reported by respondents, 674 modes of travel were reported. Auto, Van,
0.0%2.0%4.0%6.0%8.0%
10.0%12.0%14.0%16.0%
Pe
rce
nta
ge
Time of Arrival
Arrival Time of Places Visited
0.0%1.0%2.0%3.0%4.0%5.0%6.0%7.0%8.0%9.0%
Pe
rce
nta
ge
Time of Departure
Departure Time of Places Visited

24 RTC Washoe County Travel Characteristics Study Final Report
Truck driver was the mode reported at the largest percentage (28 percent). The mode reported by the
next highest percentage was walking at 24 percent. The results are displayed in Table 12.
Table 12: Mode of Transportation for Places Visited
Mode Count Percentage
Walk 161 23.9%
Bike 3 0.4%
Wheelchair/Mobility Scooter 1 0.1%
Auto/Van/Truck Driver 191 28.3%
Auto/Van/Truck Passenger 81 12.0%
Carpool/Vanpool 48 7.1%
Motorcycle/Scooter/Moped 4 0.6%
Taxi/Hired Car/Limo 49 7.3%
Rental Car/Vehicle 82 12.2%
Private shuttle (SuperShuttle, employer, hotel, etc.)
10 1.5%
Other Private Transit, please specify 7 1.0%
RTC Transit 22 3.3%
Other 15 2.2%
Total 674 100.0%
The most common activity while visiting Reno/Sparks was Entertainment or Cultural Activity. Thirty-eight
percent of respondents reported the reason for the places visited was for this activity. The next largest
category was for Other Activity. A table of these verbatim responses may be found in Appendix B –
Verbatim Responses to all “Other – please specify” Questions. Table 13 presents the reported activity at
places visited.
Table 13: Activity Purpose at Places Visited
Activity Count Percentage
Home/Lodging 22 3.3%
Work 48 7.3%
Work-related or business meeting
44 6.7%
School, including day-care or pre-school
6 0.9%
Visiting friends or relatives 42 6.4%
Medical or health services 14 2.1%
Shopping 71 10.8%
Entertainment or cultural activity
252 38.2%
Sports, nature activity, hiking, stroll
36 5.5%

25 RTC Washoe County Travel Characteristics Study Final Report
Activity Count Percentage
Passenger drop-off or pick-up, accompanying other
7 1.1%
Transfer of travel mode or transit line
1 0.2%
Other, please specify 117 17.7%
Total 660 100.0%
Overall, more than half (55 percent) of the visitors to the region and that were interviewed, traveled with
one other person to at least one place they visited. Slightly less than one-quarter (23 percent) reported
they traveled with two other people. Please see Figure 12 for these results.
Figure 12: Overall Number of People Accompanying Traveler
When collecting this information, respondents that identified the reason for their visit as “business” were
asked how many colleagues were accompanying them. Respondents that indicated they were traveling
alone are not included in the following tables. Fifty-one percent of convention and business travelers
reported they were accompanied by one colleague. The results of this question are presented in Table 14.
Table 14: Number of Colleagues Accompanying Traveler
Number of Colleagues
Purpose of Visit Total
Convention Business
Count % Count % Count %
1 15 65.2% 37 46.8% 52 51.0%
2 1 4.3% 23 29.1% 24 23.5%
3 1 4.3% 8 10.1% 9 8.8%
1 2 3 4 5 6 7 8 10 19 22 29
Percent 54.7% 23.2% 12.3% 4.0% 2.4% 1.2% 1.4% 0.2% 0.2% 0.2% 0.2% 0.2%
# Responses 276 117 62 20 12 6 7 1 1 1 1 1
0.0%
5000.0%
10000.0%
15000.0%
20000.0%
25000.0%
30000.0%
Pe
rce
nta
ge
Number of People
Number of People Accompanying Traveler

26 RTC Washoe County Travel Characteristics Study Final Report
4 1 4.3% 2 2.5% 3 2.9%
5 1 4.3% 2 2.5% 3 2.9%
7 1 4.3% 0 0.0% 1 1.0%
8 0 0.0% 1 1.3% 1 1.0%
9 1 4.3% 1 1.3% 2 2.0%
>=10 2 8.6% 5 6.4% 7 6.9%
Total 23 100.0% 79 100.0% 102 100.0%
Respondents that identified the reason for their visit as all reasons other than convention or business
were asked how many family members above the age of 18 were accompanying them and how many
family members age 18 and below were accompanying them. These results are displayed in Table 15 and
Table 16.
Table 15: Number of Family Members age 18 and Above Accompanying Traveler
Number of Family Members Above
18 yrs old
Purpose of Visit Total
Recreation Visiting Friends
Count % Count % Count %
1 69 41.8% 19 38.8% 88 41.1%
2 70 42.4% 20 40.8% 90 42.1%
3 16 9.7% 5 10.2% 21 9.8%
4 4 2.4% 4 8.2% 8 3.7%
>=5 6 3.7% 1 2.0% 7 3.3%
Total 165 100.0% 49 100.0% 214 100.0%
Table 16: Number of Family Members 18 and Under Accompanying Traveler
Number of Family Members Under
18 yrs old
Purpose of Visit Total
Recreation Visiting Friends
Count % Count % Count %
1 16 61.5% 3 60.0% 19 61.3%
2 9 34.6% 2 40.0% 11 35.5%
3 1 3.8% 0 0.0% 1 3.2%
Total 26 100.0% 5 100.0% 31 100.0%
4.0 Conclusions and Recommendations for Future Surveys
There was considerable difficulty in obtaining permission from some of the hotels, resorts, and casinos in
the Reno/Sparks region to conduct the visitor survey. In addition, there were stringent controls at to the
27 RTC Washoe County Travel Characteristics Study Final Report
day of week and time of day that the survey could be conducted. As a result, in the fall of 2016, NuStats
made a concerted effort to collect as many surveys as possible. The requirement to survey only on
weekdays was lifted to allow surveys to be conducted on weekends as well.
NuStats recommends that future visitor surveys be conducted in several waves, and to allow weekend
surveying. Additionally, it is important for the area businesses to have a relationship with the RTC with
the thought they may more readily agree to allow surveying in their businesses in the future.
Exploration of potential data expansion options is suggested for future surveys. Obtaining hotel occupancy
during the survey period may assist in expansion of the dataset to represent all visitors to the region.
The questionnaire worked as expected. Revising of the wording of questions is typically recommended
when developing future surveys. Technology will have significantly advanced at that time, as well. There
are surveys conducted utilizing kiosks fitted with tablets. The possibility exists that this technology will be
improved to the point it may be used to supplement the in-person intercept surveyors.

28 RTC Washoe County Travel Characteristics Study Final Report
Appendix A - Visitor Survey Questionnaire
"How many people are available to interview?" "Start with passenger #: " + (getRando + 1) "The Regional Transportation Commission of Washoe County is conducting a brief Visitor survey to gain a better understanding of how visitors travel in the region and to assist with planning for the future. Are you a Resident of Washoe County (see SCREEN variable)?" * "Yes" * “No” "Would you like to participate in the survey?" * "Yes, I would like to take the Visitor Survey" * "No, I would not like to take the Visitor Survey" "Have you been in the Reno area for at least 24 hours?" * "Yes" * “No” "What is your age? " 1 "Less than 18" 2 "18-24" 3 "25-34" 4 ”35-44" 5 "45-54" 6 "55-64" 7 "65+" 8 "Refused" "What is your gender?" 1 ”Male" 2 ”Female" 9 ”Refused" "Including all sources, what was your annual household income in 2014?" 1 "$0 - $9,999" 2 "$10,000 - $24,999" 3 "$25,000 - $34,999" 4 "$35,000 - $49,999" 5 "$50,000 - $74,999" 6 "$75,000 - $99,999" 7 "$100,000 - $149,999" 8 ”$150,000 - $199,999" 9 "$200,000 - $249,999" 10 "$250,000 or more" 98 "Don’t Know" 99 "Refused" "What is the main purpose of your visit?" 1 "Convention" 2 "Recreation" 3 "Business" 4 "Visiting Friends"

29 RTC Washoe County Travel Characteristics Study Final Report
5 "Other (Specify)" (If business:) "How many colleagues are in your travel party?" (If Family:) "How many family members in your travel party are above the age of 18?" "How many family members in your travel party are under the age of 18?" "What is your current home address?" "What is your current lodging address?" "(Click the gray box to select a lodging place from the list)" "What is the length of your stay in Washoe County? (In days)" “How did you travel to the region?" 1 ”Walk" 2 ”Bike" 3 ”Wheelchair/Mobility Scooter" 4 ”Auto/Van/Truck Driver" 5 ”Auto/Van/Truck Passenger" 6 ”Carpool/Vanpool" 7 ”Motorcycle/Scooter/Moped" 8 ”Taxi/Hired Car/Limo" 9 ”Rental Car/Vehicle" 10 ”Private shuttle (SuperShuttle, employer, hotel, etc.)" 11 ”Greyhound Bus" 12 ”Airplane" 13 ”Amtrak" 14 ”Other, specify" "How did you travel to your lodging site?" 1 ”Walk" 2 ”Bike" 3 "Wheelchair/Mobility Scooter" 4 "Other Non-Motorized (please specify)" 5 "Auto/Van/Truck Driver" 6 "Auto/Van/Truck Passenger" 7 "Carpool/Vanpool" 8 "Motorcycle/Scooter/Moped" 9 "Taxi/Hired Car/Limo" 10 "Rental Car/Vehicle" 11 "Private shuttle (SuperShuttle, employer, hotel, etc.)" 12 "Greyhound Bus" 13 "Airplane" 14 "Other Private Transit (please specify)" 15 "RTC Ride" 16 "RTC Access (Paratransit Service)" 17 "RTC Intercity" 18 "Sierra Spirit" 19 "RTC Rapid" 20 "RTC Vanpool" 21 "TART"
30 RTC Washoe County Travel Characteristics Study Final Report
22 "Amtrak" 24 "Other, specify" "What is the amount of money you intend on spending during your stay in Washoe County? (In U.S. currency)" 1 "$0 - $499" 2 "$500 - $999" 3 "$1,000 - $2,499" 4 "$2,500 - $4,999" 5 "$5,000 - $9,999" 6 "$10,000 - $24,999" 7 "$25,000 - $49,999" 8 "$50,000 - $74,999" 9 "$75,000 - $99,999" 10 "$100,000 - $249,999" 11 "$250,000 or more" 12 "Don’t Know" 13 "Refused" (Repeat below:) "Thinking about the last 24 hours, please tell me all the places you visited yesterday." "What time did you arrive at this place?" "What time did you depart this place?" "What mode of transportation did you use to get there?" 1 ”Walk" 2 ”Bike" 3 "Wheelchair/Mobility Scooter" 4 "Other Non-Motorized (please specify)" 5 "Auto/Van/Truck Driver" 6 "Auto/Van/Truck Passenger" 7 "Carpool/Vanpool" 8 "Motorcycle/Scooter/Moped" 9 "Taxi/Hired Car/Limo" 10 "Rental Car/Vehicle" 11 "Private shuttle (SuperShuttle, employer, hotel, etc.)" 12 "Greyhound Bus" 13 "Airplane" 14 "Other Private Transit (please specify)" 15 "RTC Ride" 16 "RTC Access (Paratransit Service)" 17 "RTC Intercity" 18 "Sierra Spirit" 19 "RTC Rapid" 20 "RTC Vanpool" 21 "TART" 22 "Amtrak" 24 "Other, specify" "What was the activity purpose?" 1 "Home/Lodging"
31 RTC Washoe County Travel Characteristics Study Final Report
2 "Work" 3 "Work-related or business meeting" 4 "School, including day-care or pre-school" 5 "Visiting friends or relatives" 6 "Medical or health services" 7 "Shopping" 8 "Entertainment or cultural activity" 9 "Sports, nature activity, hiking, stroll" 10 "Passenger drop-off or pick-up, accompanying other" 11 "Transfer of travel mode or transit line" 12 "Parking" 13 ”Other, specify" "How many others traveled with you?" "Thank you for participating in the Visitor Survey. Have a nice day!" "End Survey and Start New Survey"

32 RTC Washoe County Travel Characteristics Study Final Report
Appendix B – Verbatim Responses to all “Other – please specify” Questions
Table 17: Other – Specify Responses
Question Responses Count
How did you travel to the region? train 1
How did you travel to your lodging site?
Bus but they don't remember which 1
Flew here then took taxi 1
Friend 3
Harrah’s bus 1
Shuttle 2
Tour bus 1
Uber 5
For all places - What mode of transportation did you use to get there?
Friend 1
Uber 11
Corporate Transportation/Chauffer 5
For all activity purposes - What was the activity purpose?
Dining 84
Banking 1
Get car washed 1
Getting gas 3
Hotel and dining 1
Job interview 2
Looking at real estate 1
Pay respects 1
Picking up a car 1
Realtor visit 1
Storage unit 1
Petco corporate meeting drove there via company shuttle
1
Skateboard. With brother 1
Like bowling wanted to check it out 1
Check out a casino for first time! 1
Entertainment and lodging 1
Swimming 1
Crashed there this night 1
For fun and food 1
Mystery shop evaluation 2
Lunch and hanging out with girlfriend 1
Met with prospective manager of Petco 1
Back to hotel for lunch 1
On-to-off and Onboard
Surveys
Final Report

Table of Contents
1 Executive Summary 1
2 Key Findings 2
3 Introduction 3
4 Survey Methods 4
4.1 Survey Design 4
4.2 Sampling Plan 5
4.3 On-to-Off and Onboard Survey Instruments 7
4.4 Survey Procedures 8
5 Analysis 14
5.1 Sample Weighting 14
6 Summary of Survey Results - Onboard 18
7 Summary of Results – On-to-Off Board 30
8 Maps 31
Appendix A: Survey Card 39
Appendix B: RideTrack Application 40
Appendix C: TransiTap Application – Onboard Questionnaire 42
List of Tables and Figures
Table 1: RTC On-to-Off & Onboard Sample Sizes 6
Table 2: Data Elements and Capture Method 8
Figure 1: Website Assignment Tool 11
Figure 2: Survey Process Flow Chart 13
Table 3: Bus Goals 18
Table 4: Cross-Tabulation of Line by Time of Day 19
Table 5: Expansion of Bus Route Data 20
Table 6: Cross-Tabulation of Vehicle Ownership and Household Income 21
Figure 3: Distribution of Origin Trip Purpose 22
Figure 4: Distribution of Destination Trip Purpose 22
Table 7: Cross-Tabulation of Egress Mode by Access Mode 23
Figure 5: Distribution of Access Mode 23
Figure 6: Distribution of Egress Mode 24
Table 8: Cross-Tabulation of Line by Total Bus Vehicles Used 24
Figure 7: Vehicle Availability 25
Figure 8: Distribution of Fare 26
Figure 9: Distribution of Household Workers 26
Figure 10: Distribution of Valid Driver’s License 27
Figure 11: Distribution of Employment Status 27
Figure 12: Distribution of Age 28
Figure 13: Distribution of Ethnicity 28
Figure 14: Distribution of Household Annual Income 29
Figure 15: Distribution of Language 29
Table 9: Observed Boardings and Alightings by Route 30
Figure 16: RTC Transit Work Origin 31
Figure 17: RTC Transit Work Destination 32
Figure 18: RTC Transit Home Origin 33
Figure 19: RTC Transit Home Destination 34
Figure 20: RTC Transit Origin Mode Walk 35
Figure 21: Origin Mode Other 36
Figure 22: RTC Transit Destination Mode Walk 37
Figure 23: RTC Destination Mode Other 38
Figure 24: English Onboard Survey Instrument 39
Figure 25: Spanish Onboard Survey Instrument 39

1 RTC Washoe County Travel Characteristics Study Final Report
1 Executive Summary
This report documents the activities and findings for the Regional Transportation Commission (RTC) –
Washoe County Onboard and On-to-Off surveys conducted by NuStats and A+ Staffing. The pilot survey was
conducted beginning in the fall of 2015, followed by the main survey. Data collection concluded in February,
2016. NuStats, in collaboration with RTC, designed a sampling plan targeting to collect a sample of 1,200
completed Onboard surveys and 1,200 completed On-to-Off surveys that would be representative of bus
riders in the region. The most recent ridership numbers available were from 2014, which were utilized as a
guide to develop the sampling plan.
The survey approach for both the On-to-Off and Onboard surveys was grounded in two main principles: 1.)
reduce respondent burden while increasing participation; and 2.) enhance the quality of the data. The
Onboard survey was conducted utilizing TransiTap, NuStats’ tablet technology. During the interview process,
data were subjected to real-time geocoding, and quality control procedures to ensure that respondents
provided accurate information and to identify and correct illogical trips. For the On-to-Off survey, cards
were handed to boarding passengers, and then collected from them as they alighted. Further detail about
methodology and survey instruments is found in subsequent sections of this report.
Data collection for both the Onboard and On-to-Off surveys was conducted on all routes as determined in
collaboration with RTC, NuStats, and RTC’s modeler.

2 RTC Washoe County Travel Characteristics Study Final Report
2 Key Findings
The completed project yielded 1,209 Onboard surveys. The objectives of the full study were two-fold: 1)
examine and confirm the travel behavior characteristics of RTC bus passengers; and 2) obtain the socio-
economic characteristics of RTC bus passengers. The data weighting and expansion provide an appropriate
representation of the RTC system.
Important findings from the analysis of the RTC bus system ridership are presented below:
Fifty-three percent of RTC bus passengers are from households with an annual income of less than $25,000.
Fifty-five percent of RTC bus passengers are transit-captive riders (i.e., they are from households that did not have a vehicle available to complete their one-way trip).
Fifty-eight percent of RTC bus passengers are employed, with 38 percent employed full-time.
Nearly two-thirds (61 percent) of RTC bus passengers do not possess a valid driver’s license.
Almost the entire group (99.7 percent) of RTC bus passengers took the survey in English with less than one-half of one percent taking the survey in Spanish.
Fifty-six percent of RTC bus passengers are between the ages of 18 and 44.
Thirty-seven percent of RTC bus passengers reported paying their fare with cash while 26 percent used a PrePurchase – 31 day pass.
Travel behavior characteristics of RTC bus passengers indicate that home and work are the most prevalent trip origins and destinations.
Nearly one half (49 percent) of trips originate from home, 22 percent of trips originate from work, both school categories (K-12 and College/University) account for 3 percent of origin trip purposes.
The final destination for 34 percent of trips is home, whereas 22 percent end at work. Other common destination trip attractions are Social or Recreational, which represent 17 percent of all destinations, and shopping (11 percent).
Overall, 93 percent of RTC bus passengers reported walk as their mode of access and/or egress.

3 RTC Washoe County Travel Characteristics Study Final Report
3 Introduction
The 2015 RTC Washoe Country Regional Travel Characteristics Study conducted two separate transit related
studies to provide supplemental data to update and calibrate the transit sub-model within the RTC Travel
Demand Model. Two survey instruments were developed: one to collect travel behavior information from a
large sample of RTC riders (On-to-Off study); and one to administer a more complex survey to a smaller
sample of RTC riders (Onboard study).
In recent years, the Federal Transit Administration (FTA) has introduced stricter guidelines for conducting
O/D onboard studies, including FTA New Starts/Small Starts requirements. As a result, NuStats utilized
updated methodologies and newly developed ones to meet these requirements. NuStats targeted to collect,
at a minimum, five percent of the total ridership or approximately 1,200 clean and usable surveys for
updating the RTC Travel Demand Model.
NuStats teamed with Coulter and Associates, a local Public Relations firm, in development of a strategic plan
to notify the public of their opportunity to participate in the On-to-Off and Transit Onboard surveys.
A high level review of the 2015 RTC operations and vehicle schedule was performed during the design phase
in order to develop an understanding of how RTC conducts business with regards to the dispatch, operators,
riders, and overall transit system. This was helpful in order to understand the idiosyncrasies of the schedules
of each individual vehicle at the block, work run, or trip level. Additional meetings with key staff were held
to ensure all parties understood the goals and mechanisms of the On-to-Off and Onboard Transit Surveys.
General Transit Feed Specification (GTFS) and other pertinent data were requested to assist in this review.

4 RTC Washoe County Travel Characteristics Study Final Report
4 Survey Methods
4.1 Survey Design
Based on initial guidance from RTC and review of the project objectives, the sampling design for all projects
was based on a collaborative effort between RTC and NuStats to identify routes, sites, and corridors of
interest throughout Washoe County. The steps undertaken to implement this design follow:
A review was performed of current RTC transit operation data and the transit sub-model of RTC’s
Travel Demand Model;
A public outreach plan was developed that served to inform the public about the survey effort;
A geographically stratified sampling plan was developed to ensure that the collected data
appropriately reflected travel patterns and demographic information about the transit users in
Washoe County, optimizing the statistical representativeness and randomness;
An intercept approach was utilized for data collection to reduce respondent burden and capture
accurate transit patterns that through weighting is representative of the RTC system.
The study population for the On-to-Off survey consisted of all RTC riders who utilize RTC’s fixed route
system. Infants and children were counted, but they were not distributed an On-to-Off card.
The study population for the Onboard survey was riders who board a surveyed vehicle age 16 and above.
At project kick-off NuStats requested several pieces of information from RTC. These items were:
Average daily ridership by year or month (preferably Spring or Fall ridership);
Points of Interest (POI) list (if available) – based on individual routes listed on website;
GTFS feed;
Notice of any projected schedule changes due to realignment or construction; and
Projections RTC uses to produce any GIS products (e.g., WGS 84).
NuStats’ strategy to collect the most accurate and reliable data was to conduct the On-to-Off survey in
conjunction with the Onboard Transit Survey in the following fashion:
During a given week, the On-to-Off survey would focus on a segment of routes to collect the
necessary data to instruct the Onboard Transit Survey where to anticipate riders.
The following week resulted in a targeted sample approach to ensure an accurate representation of
ridership patterns was captured in the Onboard Transit Survey.
4.1.1 Public Outreach Plan
NuStats and Coulter and Associates developed a public outreach plan that distributed news releases to local
and regional media announcing the start of the surveys, and also any updates. Each news release was
researched, written, and distributed to local area media. Follow-up with each media contact was conducted
and carried out to ensure receipt of news releases and possible placement. Media announcements and
outreach included television, radio and online venues. Media outlets included:
Reno Gazette Journal
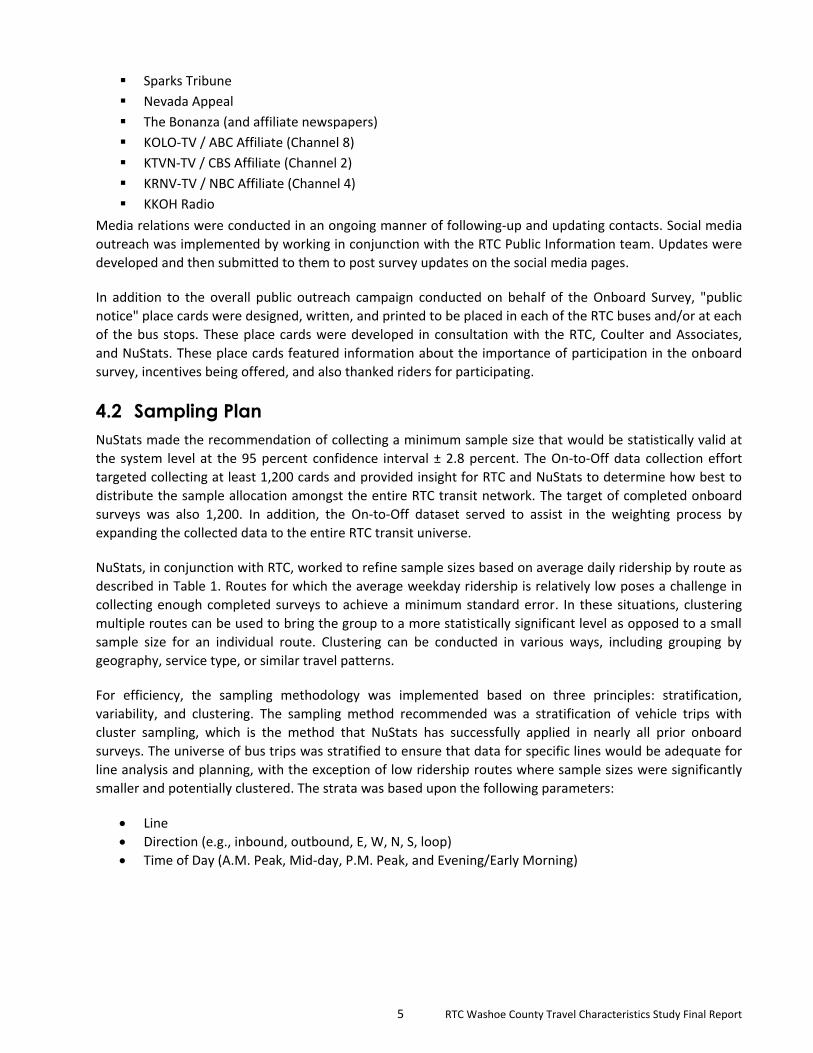
5 RTC Washoe County Travel Characteristics Study Final Report
Sparks Tribune
Nevada Appeal
The Bonanza (and affiliate newspapers)
KOLO-TV / ABC Affiliate (Channel 8)
KTVN-TV / CBS Affiliate (Channel 2)
KRNV-TV / NBC Affiliate (Channel 4)
KKOH Radio
Media relations were conducted in an ongoing manner of following-up and updating contacts. Social media
outreach was implemented by working in conjunction with the RTC Public Information team. Updates were
developed and then submitted to them to post survey updates on the social media pages.
In addition to the overall public outreach campaign conducted on behalf of the Onboard Survey, "public
notice" place cards were designed, written, and printed to be placed in each of the RTC buses and/or at each
of the bus stops. These place cards were developed in consultation with the RTC, Coulter and Associates,
and NuStats. These place cards featured information about the importance of participation in the onboard
survey, incentives being offered, and also thanked riders for participating.
4.2 Sampling Plan
NuStats made the recommendation of collecting a minimum sample size that would be statistically valid at
the system level at the 95 percent confidence interval ± 2.8 percent. The On-to-Off data collection effort
targeted collecting at least 1,200 cards and provided insight for RTC and NuStats to determine how best to
distribute the sample allocation amongst the entire RTC transit network. The target of completed onboard
surveys was also 1,200. In addition, the On-to-Off dataset served to assist in the weighting process by
expanding the collected data to the entire RTC transit universe.
NuStats, in conjunction with RTC, worked to refine sample sizes based on average daily ridership by route as
described in Table 1. Routes for which the average weekday ridership is relatively low poses a challenge in
collecting enough completed surveys to achieve a minimum standard error. In these situations, clustering
multiple routes can be used to bring the group to a more statistically significant level as opposed to a small
sample size for an individual route. Clustering can be conducted in various ways, including grouping by
geography, service type, or similar travel patterns.
For efficiency, the sampling methodology was implemented based on three principles: stratification,
variability, and clustering. The sampling method recommended was a stratification of vehicle trips with
cluster sampling, which is the method that NuStats has successfully applied in nearly all prior onboard
surveys. The universe of bus trips was stratified to ensure that data for specific lines would be adequate for
line analysis and planning, with the exception of low ridership routes where sample sizes were significantly
smaller and potentially clustered. The strata was based upon the following parameters:
Line
Direction (e.g., inbound, outbound, E, W, N, S, loop)
Time of Day (A.M. Peak, Mid-day, P.M. Peak, and Evening/Early Morning)

6 RTC Washoe County Travel Characteristics Study Final Report
Table 1: RTC On-to-Off & Onboard Sample Sizes
Route Average Percent of Total Sample - OO Sample - OB
RAPD 3,792 13.4% 193 193
1 1,997 7.0% 91 91
2 1,968 6.9% 94 94
2S 430 1.5% 19 19
3CC 183 0.6% 8 8
3CL 866 3.1% 33 33
4 726 2.6% 31 31
5 1,699 6.0% 71 71
6 697 2.5% 30 30
7 1,824 6.4% 72 72
9 1,246 4.4% 53 53
11 2,366 8.4% 98 98
12 2,198 7.8% 64 64
13 626 2.2% 28 28
14 1,000 3.5% 38 38
15 1,200 4.2% 56 56
16 440 1.6% 18 18
17 488 1.7% 22 22
18 1,195 4.2% 43 43
18X 75 0.3% 3 3
19 315 1.1% 13 13
21 470 1.7% 19 19
25 304 1.1% 12 12
26 311 1.1% 13 13
54 435 1.5% 22 22
56 742 2.6% 28 28
INT C 149 0.5% 6 6
SS 589 2.1% 22 22
TOTAL 28,330 100.0% 1,200 1,200
The definition of a completed survey was developed collaboratively with RTC, the FTA, the modeling firm PB
World, and NuStats. The process of defining a completed survey was two-fold: 1) review the previous travel
demand model inputs and 2) work with RTC and the FTA to finalize a set of data and activity elements that
would be needed for the 2015 model update. By applying a definition of a complete to each individual
survey, it provides RTC the confidence to update their Travel Demand Model.
4.2.1 Approach to Sampling Bus Trips
NuStats prepared a plan to sample weekday bus trips based on the average daily ridership from FY 2014 as
was provided by RTC. It was geared to capture five percent of passengers at the system level. The individual
route goals are contained in Table 1, and found in the columns headed “Sample – OO” and “Sample- OB”.
The proposed sample plan was based on three main factors:
First, the plan ensured that the sample adequately met data needs at the global level.

7 RTC Washoe County Travel Characteristics Study Final Report
Second, the plan ensured the collection of adequate samples at the various times of day. Times of day (TOD) are defined as AM Peak (6:00 a.m.–9:00 a.m.), Mid-day (9:01 a.m.–2:59 p.m.), PM Peak (3:00 p.m.–7:00 p.m.), and Evening/Early Morning (7:01 p.m.–3:00 a.m.).
Third, the plan ensured that staff would have the ability to segment the sample on key variables, such as route, day of the week, time of day, and direction.
4.2.2 Bus Trip Selection
The number of sampled trips was calculated by assuming an average response rate of five percent,
depending on service type and service period, of typical passenger loads by trip. Thus, a route that had an
average load of 500 passengers and made 10 trips a day was determined to have an average passenger load
of 50 passengers per trip. Assuming the route had a sample goal of 50 valid questionnaires, it was
determined that 20 bus trips would need to be sampled to meet the requirements at an estimated five
percent response rate (500/10 = 50 x .05 = 2.5; 50/2.5 = 20). The number of trips sampled was rounded up
to the nearest whole number for trip selection purposes.
4.2.3 Surveyor Assignments
The final sampling task was uploading the sampled bus trips to a Web-based field management system to
create surveyor assignment sheets. Trips were selected for assignments based on the following criteria:
Consecutive trips within the same block/run
Trips starting and ending at the same location
An equal number of AM Peak Period trips as PM Peak Period trips (when possible)
Surveyor assignment sheets were printed from the Web-based management system and included the
organized trips to be sampled, along with the division address from which the assignment originated. The
assignment sheets were also bar-coded to link them to the field management system.
4.3 On-to-Off and Onboard Survey Instruments
NuStats and RTC worked together to develop two instruments for the purposes of this study: 1) an On-to-Off
survey card that was easy to administer, easy to comprehend, and, collected data that supports the travel
demand model, and 2) the Onboard Transit survey capturing origins and destinations, transfer locations,
access and egress modes, and other demographic information.
Based on similar data collection efforts and input received from RTC and FTA as a tool in the development of
these instruments, NuStats developed a draft version of the survey instruments for RTC to review. This
process allowed RTC to review and collaborate with NuStats on the instruments, while ensuring sufficient
time and attention in preparing, programming, and printing the survey instruments for survey
administration. In addition to capturing critical data elements in the study, focus of survey instrument
design is placed on the respondent. The survey instruments were designed to clearly and concisely convey
project information in a respondent-friendly and straightforward manner.
The On-to-Off Survey card was designed to collect On-to-Off information at the rider level. For riders that
were not proficient in reading English or Spanish, graphic instructions displayed the surveying steps. The
cards were serialized so that they can be traced back to the On-to-Off location. Each card was serialized,
barcoded, and packaged in bundles of 50 for ease of handling and tracking by the surveyors. Once the On-
to-Off survey cards were finalized, they were sent for printing.

8 RTC Washoe County Travel Characteristics Study Final Report
The Onboard Survey instrument was programmed utilizing NuStats’ proprietary app, TransiTap. The
questions were developed collaboratively between NuStats and RTC. Where appropriate, drop down menus
were provided. By allowing surveyors to select items from a drop down menu, rather than manually
entering data, the resulting data is cleaner and more consistent.
The On-to-Off Survey card is found in Appendix A: Survey Card.
Onboard Transit Survey - A pre-programmed tablet was utilized for the Onboard Transit Survey. NuStats
proprietary app TransiTap was modified specific to the RTC region and was programmed in the tablets used
by the surveyors. Using a survey instrument displayed on a tablet allowed the surveyors to collect all of the
activity based data with the ability to display the rider’s one-way trip information to verify all data was
captured accurately. This approach minimized self-reported errors and provided the transit community to
see the transparent process in an effort to maximize rider participation. Additionally, by using our
technological capabilities NuStats was able to efficiently combine the data entry and verification process
resulting in streamlining these two necessary data processing steps.
Table 2 provides the data elements that were captured, and the method of capture.
Table 2: Data Elements and Capture Method
QUEST VARIABLE DESCRIPTION CODESET
1 SAMPN Unique Sample Number QR code
2 DATE Calendar date Automatically captured
3 TOD Time of day Automatically captured
4 ROUTE Route surveyed Automatically captured
5 DIRECTION Direction surveyed Automatically captured
6 BOARD Boarding location Automatically captured
7 B_GPS Boarding X&Y cords Automatically captured
8 ALIGHT Alighting location Automatically captured
9 A_GPS Alighting X&Y cords Automatically captured
4.4 Survey Procedures
Prior to the Onboard Survey, internal staff load the data (transit network and tablet survey) into our
management software. Using this software, we have the ability to set up and monitor specific goals using
lines, sample type, demographic criteria, and/or other predetermined targets provided by RTC. Given the
current sample management software in place and protocols we have developed, we were able to ensure
strategic release of sample allocation based upon the On-to-Off Survey results. This level of sample
management — which includes prioritization, daily assignments, and goal stratification — enabled us to
collect trip information according to the most representative distribution of actual ridership.
Expected levels of productivity were closely monitored throughout the data collection portion of the study.
NuStats team members worked side-by-side with interviewer staff and shift leaders to ensure efficiency,
data quality, and survey knowledge. Weekly reports were developed by the NuStats Production Manager
and submitted to RTC for review prior to weekly/bi-weekly meetings. These reports included a breakdown of
daily and weekly productivity levels, a full sample report, and a table outlining daily completed survey
distribution by goal.
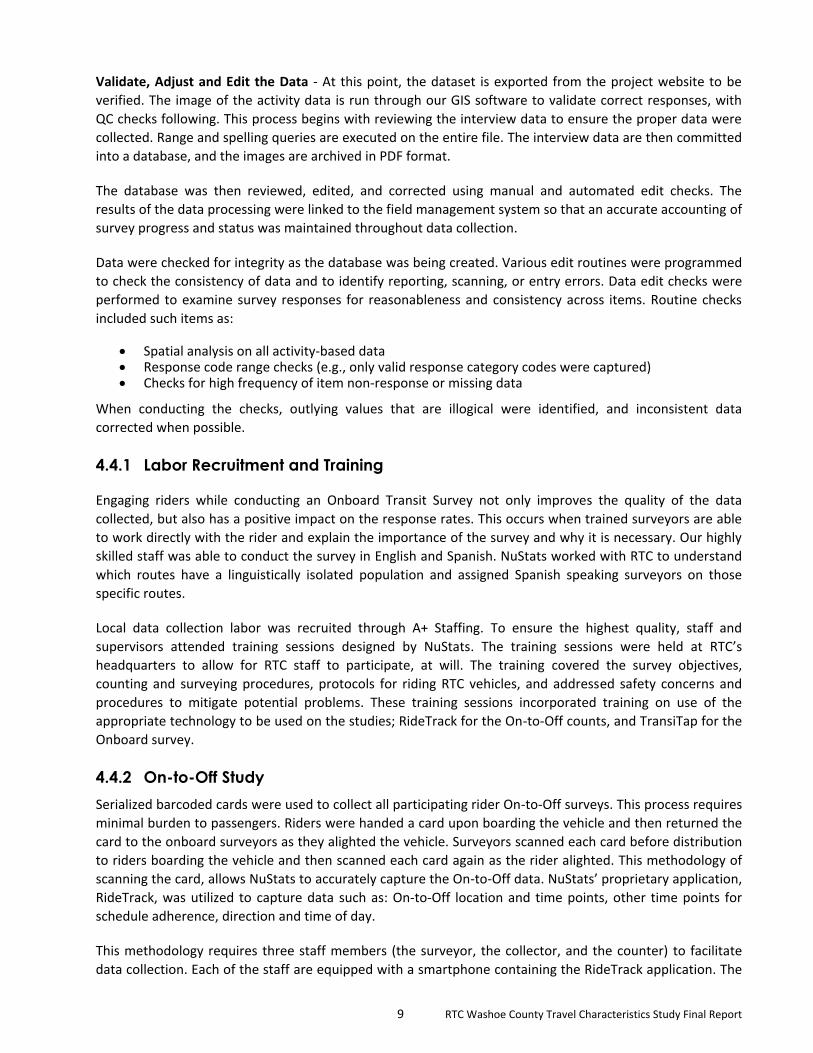
9 RTC Washoe County Travel Characteristics Study Final Report
Validate, Adjust and Edit the Data - At this point, the dataset is exported from the project website to be
verified. The image of the activity data is run through our GIS software to validate correct responses, with
QC checks following. This process begins with reviewing the interview data to ensure the proper data were
collected. Range and spelling queries are executed on the entire file. The interview data are then committed
into a database, and the images are archived in PDF format.
The database was then reviewed, edited, and corrected using manual and automated edit checks. The
results of the data processing were linked to the field management system so that an accurate accounting of
survey progress and status was maintained throughout data collection.
Data were checked for integrity as the database was being created. Various edit routines were programmed
to check the consistency of data and to identify reporting, scanning, or entry errors. Data edit checks were
performed to examine survey responses for reasonableness and consistency across items. Routine checks
included such items as:
Spatial analysis on all activity-based data Response code range checks (e.g., only valid response category codes were captured) Checks for high frequency of item non-response or missing data
When conducting the checks, outlying values that are illogical were identified, and inconsistent data
corrected when possible.
4.4.1 Labor Recruitment and Training
Engaging riders while conducting an Onboard Transit Survey not only improves the quality of the data
collected, but also has a positive impact on the response rates. This occurs when trained surveyors are able
to work directly with the rider and explain the importance of the survey and why it is necessary. Our highly
skilled staff was able to conduct the survey in English and Spanish. NuStats worked with RTC to understand
which routes have a linguistically isolated population and assigned Spanish speaking surveyors on those
specific routes.
Local data collection labor was recruited through A+ Staffing. To ensure the highest quality, staff and
supervisors attended training sessions designed by NuStats. The training sessions were held at RTC’s
headquarters to allow for RTC staff to participate, at will. The training covered the survey objectives,
counting and surveying procedures, protocols for riding RTC vehicles, and addressed safety concerns and
procedures to mitigate potential problems. These training sessions incorporated training on use of the
appropriate technology to be used on the studies; RideTrack for the On-to-Off counts, and TransiTap for the
Onboard survey.
4.4.2 On-to-Off Study
Serialized barcoded cards were used to collect all participating rider On-to-Off surveys. This process requires
minimal burden to passengers. Riders were handed a card upon boarding the vehicle and then returned the
card to the onboard surveyors as they alighted the vehicle. Surveyors scanned each card before distribution
to riders boarding the vehicle and then scanned each card again as the rider alighted. This methodology of
scanning the card, allows NuStats to accurately capture the On-to-Off data. NuStats’ proprietary application,
RideTrack, was utilized to capture data such as: On-to-Off location and time points, other time points for
schedule adherence, direction and time of day.
This methodology requires three staff members (the surveyor, the collector, and the counter) to facilitate
data collection. Each of the staff are equipped with a smartphone containing the RideTrack application. The

10 RTC Washoe County Travel Characteristics Study Final Report
surveyor is charged with scanning and distributing the cards to all boarding passengers, while the collector is
charged with scanning and collecting the cards from all the alighting passengers. The counter is tasked with
maintaining all of the boarding and alighting activity at the vehicle stop level. Screen shots of the RideTrack
application may be found in Appendix B: RideTrack Application.
With the proper trip and stop selected, the surveyor scans the barcode of the first card and proceeds
handing cards to all of the boarding passengers at the first stop (that is identified by a GPS component and
verified by the surveyor by selecting the physical bus stop). In addition to handing out cards, the surveyor
records the number of passengers who refuse to take the card. Once all passengers board the vehicle, the
surveyor enters the number of “boarding refusals” into the smartphone. This process is continued at each
subsequent stop on the trip. Because the first card is scanned prior to distribution for each stop, a range of
cards distributed for each stop is produced in the smartphone.
The collector selects the proper trip and stop as the vehicle arrives at a stop. Positioned next to the exit
door, the collector retrieves all of the cards from alighting passengers. In addition to the surveyor, the
counter also maintains the number of passengers who do not return a card and enters the total “alighting
refusals” for each specific station. At that point, the collector scans the barcode for all the cards collected at
that stop. If a large number of passengers alight at a single location, then the first card is scanned and the
remaining cards are bound to the first card so that they can be scanned at a later time.
Results for the On-to-Off Board survey are found in Section 7: Summary of Results – On-to-Off Board.
4.4.3 Survey Administration
Survey Administration – The survey administration team was comprised of a data collection manager, a
field coordinator, surveyors, counters, and collectors. Onboard surveying teams were deployed on
assignments ranging between 6–9 hours per shift. Additionally, protocols were established on how the team
would conduct surveys when the vehicles experience a crush load or is 100 percent full.
As assignments were handed out, information was updated in the Web-based field management system.
When teams returned from an assignment, the field coordinator(s) checked the assignment results (i.e.,
quickly reviewed the cards to spot performance issues) and downloaded the passenger count data from the
smartphone devices. Feedback and additional training were provided when errors were found in the data. If
errors persisted, staff would be removed from the survey. The field coordinator updated the assignment
status in the Web-based field management system (Figure 2) and then handed out the next assignment.
Once the completed assignments were reviewed, the cards went through the in-field editing process for
inspection and coding prior to being scanned.
The Web-based management system tracks data progress and surveyor effectiveness for the onboard
survey. On a daily basis, with only a 24-hour lag, assignments completed were available for the RTC team to
review. Additionally, the Web-based management system tracks the trips surveyed, date and shift time,
number of cards distributed, and number of cards refused. Any trips missed are documented and reassigned
on the site. On a weekly basis, the daily reports are summarized, and the initial completes for those shifts
are captured and optically scanned, creating a database.
Riders were randomly selected as they boarded the vehicle through an automated process conducted by the
surveyor. Surveyors keyed in the total number of boarding passengers and then a random selector,
programmed on the tablet, randomly selected a number. The number selected by the tablet corresponded
with the passenger to be approached to participate in the onboard survey. If this individual refused to
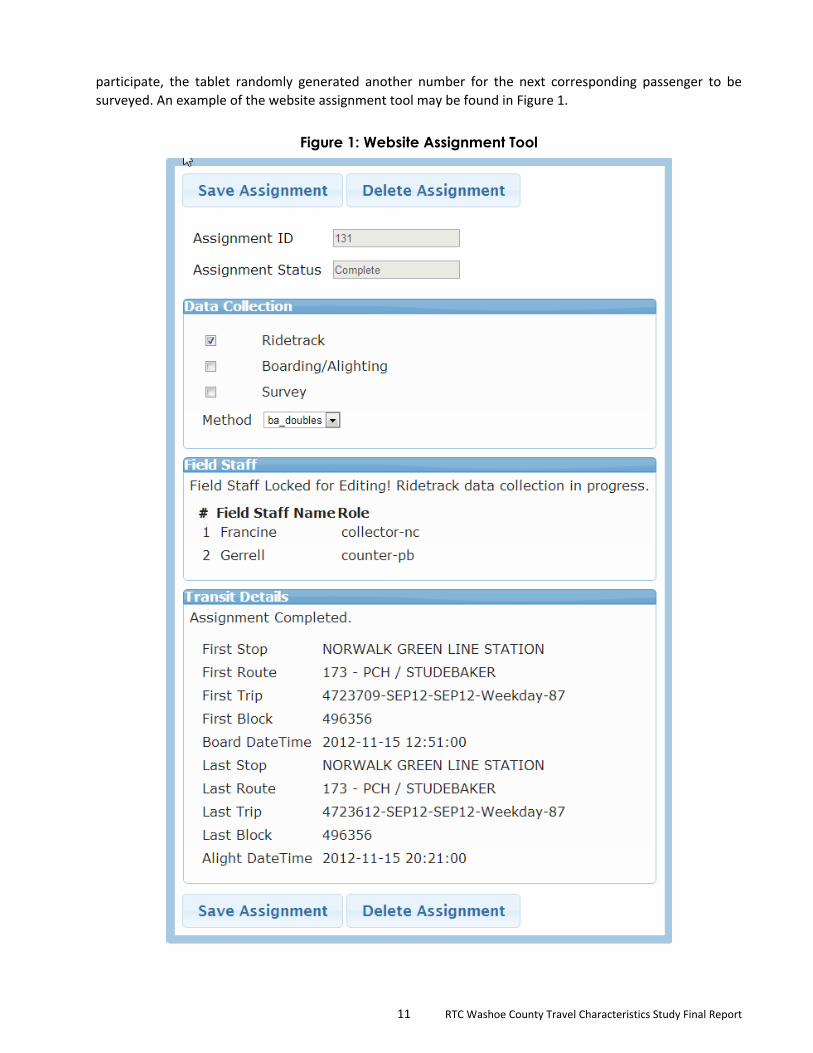
11 RTC Washoe County Travel Characteristics Study Final Report
participate, the tablet randomly generated another number for the next corresponding passenger to be
surveyed. An example of the website assignment tool may be found in Figure 1.
Figure 1: Website Assignment Tool

12 RTC Washoe County Travel Characteristics Study Final Report
4.4.4 Status Reporting
As previously noted NuStats uses a transparent project-specific Website to monitor all phases of our data
collection efforts. This critical management tool also allows NuStats to share progress with RTC regarding
line-level response rates, percentage of route goals completed, and surveyor-level response rates. The
system integrates barcode technology to track each returned card with the specific “control file”
information regarding a trip (boarding and alighting, route, direction, and time of day). The system also
provides a means to track assignment completion to avoid unintentional over- or under-sampling of lines;
this has proven to be a very effective schedule and cost-control mechanism. The RTC Onboard Survey
project Website served as a central location for all assignment information. Reports were generated by the
Website and disseminated by the NuStats Project Manager for monitoring and for identifying surveying
deficiencies for correction.
The surveyor manager prepared status reports from the Web-based field management system. This
automated application conducted consistency checks, flagged problem records, and cleaned and purged
flagged records. The field coordinator reviewed this information for accuracy in the status, response, and
performance reports to the Web-based field management system.
4.4.5 In-Field Scanning
Following the team check-in, all returned BA cards were presented to the field coordinator for alighting
location entry. Each stack of cards returned by the surveyors represents all of the cards returned by riders at
one alighting location. One card in each stack was scanned and associated with the alighting location during
surveying, so any additional cards in each stack must be entered and matched to that location.
4.4.6 Geocoding Tool
NuStats utilized TransiTap, a proprietary application loaded onto our tablet technology, to collect spatial
data. This program improves the efficiency and quality of collecting activity data based on that they are
reviewed in real-time with the respondent to validate their one-way trip. TransiTap also collects waypoints
for transit users who make transfers to complete their trip. Obtaining valid waypoints is essential if transit
providers are to understand their market and the symbiotic relationship with other routes and transit
services. Throughout the interview process, 100 percent of the spatial data was reviewed by a highly trained
TransiTap interviewer to detect issues with the data, such as unreasonable walking distances or illogical
rider alightment locations based on rider final destination. This real-time quality control allowed the
interviewer to document atypical travel behavior, and ensures RTC has been provided with accurate and
model-ready data.
4.4.7 Research Edit Check
Data was required to pass both automated and manual checks for data integrity before being delivered.
Cases that did not meet the appropriate criteria were resolved prior to being delivered. The quality
assurance (QA) department implemented these checks as an additional tool to ensure continued data
quality.
Interviewers are individually updated regarding each of their completed records that fail the edit check process, and receive additional QA support.
Cumulative Edit Check results are used to determine problematic trends and initialize shift-based QA strategies to resolve them.
Edit check statistics are used to provide the interviewer team with group-based feedback.

13 RTC Washoe County Travel Characteristics Study Final Report
4.4.8 Survey Process Flow Chart
Since the survey is web based (both on-line and off-line), the information collected from transit users is
housed in a web dataset that could be accessed at any time by NuStats data processing staff. NuStats
conducted ongoing verification of the aggregate, cumulative data files utilizing a specialized program to
perform routine and customized quality checks on the data to meet agreed-upon quality requirements. The
flow of the collected survey data is presented in Figure 2. With each data collection shift, NuStats’ field
management team provides feedback to the teams.
Figure 2: Survey Process Flow Chart
KEY Blue – Field Work Purple – NuStats (Austin)
Teams Repeat Survey
Distribute, Collect & Scan Cards
Route-based assignments
Random selection of passenger
Conduct table survey
Audit TransiTap files
Upload RideTrack files
Upload TransiTap files
Verification
Run Edit Check
Teams Repeat Survey
Route-based assignments
Random selection of passenger
Teams Repeat Survey
Route-based assignments
Random selection of passenger
Distribute, Collect & Scan Cards
Conduct table survey
Audit TransiTap files
Upload RideTrack files
Upload TransiTap files
Verification
Teams Repeat Survey
Route-based assignments
Random selection of passenger
Complete Record Failed Record
Load into Website for tracking.
Distribute, Collect & Scan Cards
Conduct tablet survey
Audit TransiTap files
Upload RideTrack files
Upload TransiTap files
Verification
Teams Repeat Survey
Route-based assignments
Random selection of passenger
Run Edit Check
Complete Record Failed Record
Add to Final Data File.
Distribute, Collect & Scan BA Cards
Conduct OB tablet survey
Verification
Upload RideTrack Data
to Server
Upload TransiTap Data to Server
Audit RideTrack Files
Teams Repeat Survey
Route-based assignments
Random selection of passenger

14 RTC Washoe County Travel Characteristics Study Final Report
5 Analysis
From a finite population sampling theory perspective, analytic weights are needed to develop estimates of
population parameters and, more generally, to draw inferences about the population that was sampled.
Without the use of analytic weights, population estimates are subject to biases of unknown (possibly large)
magnitude.
In onboard surveys, the universe of trips operated by transit routes cannot be sampled. At the same time, all
the riders who board the sampled routes cannot be surveyed due to non-response. All these factors lead to
biases in the survey data. Consequently, sample weighting and expansion is critical to account and correct
for these biases. In particular, sample weighting adjusts for non-response at the bus stop level and accounts
for trip sampling rates at the route, time of day, and direction level (RTD). Sample expansion on the other
hand, expands the weighted sample to reflect the population ridership at the system-wide level.
5.1 Sample Weighting
Sample weighting is a critical consideration to account and correct for biases in the survey data. As a simple
example, one route may have 1,000 passengers per day and another, 100 passengers. If 50 surveys were
collected on each route, the percentage collected would be 5 and 50%, respectively. Without weighting, the
data collected on the route with 100 passengers would be over-represented in the results. Thus, weighting
balances these differences and aligns the weighted sample to the known distribution of population
ridership.
The sample weighting process includes calculation of: (1) Response factor that corrects for non-response at
the bus stop level for both boardings and alightings, (2) Adjustment factors that correct for trip sampling
rates at the direction and time of day level. Each of these factors is discussed below in detail.
5.1.1 Response Factor
In order to capture all the non-responding passengers, a response factor was computed and applied to all
the respondents in the survey. The response factor was computed at boarding-alighting stop (group) pair
level for each bus trip as follows,
(i)
Where = Response factor for respondents boarding at stop (group) i and alighting at
stop (group) j
= number of passengers boarding at stop (group) i and alighting at stop group j
= number of respondents (who completed the survey) boarding at stop (group) i
and alighting at stop (group) j
i = ID of the boarding stop (group) along the specific bus trip
j = ID of the alighting stop (group) along the specific bus trip

15 RTC Washoe County Travel Characteristics Study Final Report
Ideally, the response factor would expand the respondents who had completed the survey to the total
number of passengers who ever rode the bus trips, while, at the same time, maintain the proportion of
passengers who boarded and alighted at each specific stop (group) pair. However, the boarding or alighting
counts only recorded the marginal distribution of bus ridership, i.e. the total number of passengers who
boarded (= )or alighted (= ) at each stop, but not the information of the corresponding alighting
or boarding stops of the counted passengers. In other words, the Pij is not available directly from the survey
results for computation of response factor in the equation (i). Therefore, an iterative proportional fitting
(IPF) procedure was employed to estimate Pij based on the marginal distribution of boardings and alightings
along bus stops and the distribution of the sample respondents among bus stop OD pairs (Rij).
The IPF procedure would not converge or produce stable results if there are zero-value cells in the marginal
distribution or in the sample respondent distribution. The zero-value cells in the sample respondent
distribution are unavoidable. This is because the number of passengers boarding at stop A and alighting at
stop B must be zero if B locates ahead of A in the bus stop sequence along the bus trip. In order to achieve a
converged result, a relatively very small number was assigned to these cells as initial values during IPF. In
addition, a pair of boarding stop and alighting stop was grouped to resolve a few issues that prevent IPF
from conversing. These issues include (1) no completed surveys at bus stops where at least one adult
boarded the bus (response issue), and (2) fewer adult boardings than the number of completed surveys
collected at the bus stop (counter error). The following gives the essential of the algorithm for grouping
stops of case (1) and (2) above,
1. All the stops are scanned according to the sequence of stops along the bus trip;
2. A bus stop of case (1) or (2) above would be grouped with either the subsequent or the previous stop according to the distance them to the current stop, i.e. the closest stop would be grouped with the current stop; This step should be repeated until a balanced group is formed, i.e. both cases (1) and (2) are eliminated
3. If the previous stop has been assigned to a group during the previous steps, the current would be grouped with the subsequent stop or stops until a balanced group is formed;
4. If the destination stop has been reached before a balanced group is formed, merge the current stop with the previous stop group. If the balance in the previous group is broken after merging the current stop, consider the unbalanced group as the current stop and go back to step 2.
5. All the stops would form a single-stop group by themselves or be assigned to a balanced group; the largest balanced group would be the group including all the bus stops along the trip.
The IPF procedure would produce a new Pij distribution matrix based on the new stop grouping, where i and
j are the new stop group ID instead of individual stop ID. Thereafter, the response factor can be computed
using equation (i).
In the new Pij distribution matrix, the sum of values in each column or each row will be equal or very close to
the marginal distribution of boardings and alightings. Therefore, the total of cell values would be equal or
very close to the total of boardings or alightings. However, the IPF procedure also assigns non-zero values to
the cells where, theoretically, Pij should be equal to zero, i.e. where stop j locates in front of stop i along the
bus trip since we have assigned them a very small initial value. For those cells, response factors cannot be
computed using equation (i) due to zero denominators, and a default weight of 1.0 was assigned. So the
total number of respondents will not be expanded to the total boardings or alighting by the response factors

16 RTC Washoe County Travel Characteristics Study Final Report
due to loss of counts in such cells. In order to minimize such impact, another weighting factor was computed
at bus trip level as,
(ii)
Where = Trip weight of trip k
= Response factor for respondents boarding at stop (group) i and alighting at
stop (group) j through
= The number of respondents (who completed the survey) boarding at stop
(group) i and alighting at stop (group) j
= The number of respondents who boarded at stop (group) i
The final weight applied to respondents should be,
(iii)
In (iii), the k, i, j are the trip id, boarding stop group id, and alighting stop group id of the trip that the
respondent rode.
Following the calculation of the final weights, any small and large weights were trimmed to have a minimum
and maximum value equivalent to the first and third quartile, respectively. This is done to avoid the side
effect of very small and large weights, a by-product of the IPF procedure. The total amount trimmed is
distributed among the records that were not trimmed to retain the total weight.
5.1.2 Adjustment Factors
Not every trip in the survey universe was sampled, so adjustment factors are needed to allow
representation of riders who did not have a chance to be sampled. These factors are described below:
The Headway factor is calculated as the number of trip direction for a route per time period of day divided
by the number of sampled trip direction.
Headway Factor = Total number of trip direction / Sampled trip direction
The time of day factor is calculated as the number of time periods in a day for a route divided by the number
of sampled time periods.
Time of Day Factor = Total number of time periods / Sampled time periods
5.1.3 Sample Expansion
Sample expansion factors adjust the weighted sample to the total trips at the system-wide level. The
calculation of the Expansion factor is described in the following sections.

17 RTC Washoe County Travel Characteristics Study Final Report
5.1.3.1 Expansion Factor
The Expansion factor is calculated by comparing the expected ridership given the observations and the
average weekday daily ridership at a route level using the formula below. As an example, assume that the
weighted sample ridership for Route 1 is 7,270 and the population average daily weekday ridership for this
route is 7,742. This produces an expansion factor of 1.06 (7,742 divided by 7,270).
Expansion Factor = Population Average Daily Ridership / Weighted Ridership
5.1.3.2 Expansion Weight
The final sample ‘weighting and expansion’ weight is referred to as the Expansion weight. In particular, the
Expansion weight is calculated by multiplying the weight by the Expansion factor. Following the application
of the Expansion weight, the weighted data represents the population boarding to alighting trips.
Expansion Weight = Weight Factor * Expansion Factor
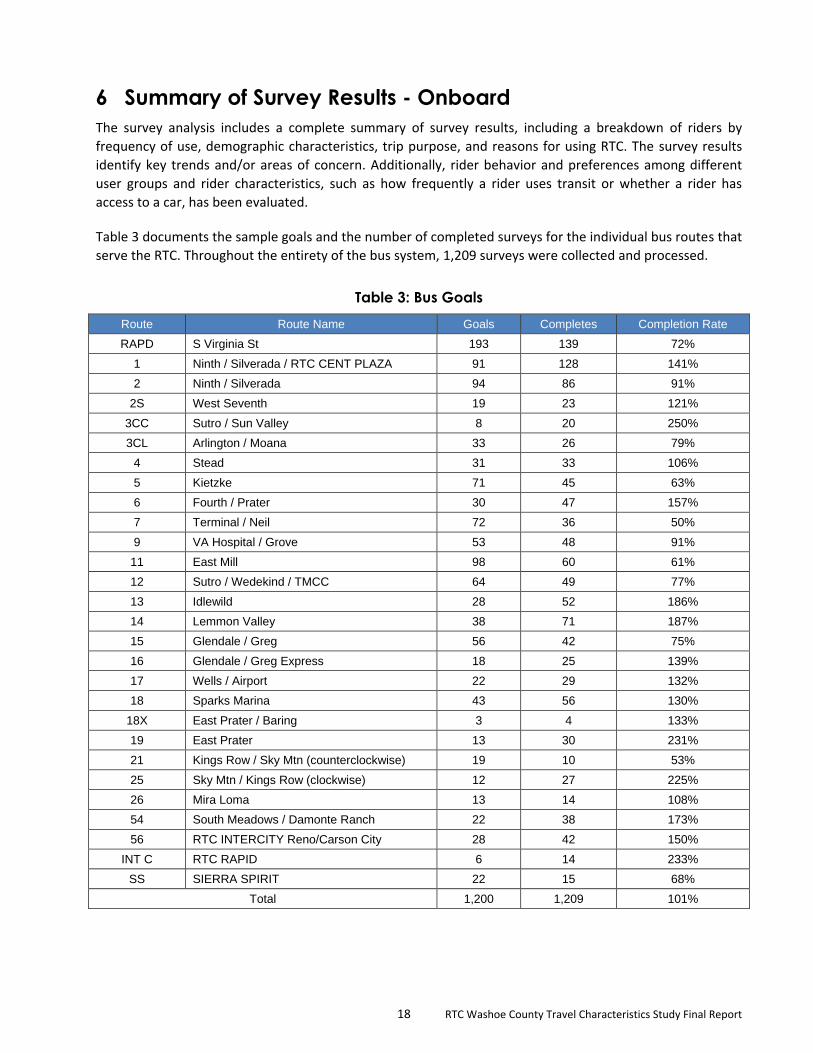
18 RTC Washoe County Travel Characteristics Study Final Report
6 Summary of Survey Results - Onboard
The survey analysis includes a complete summary of survey results, including a breakdown of riders by
frequency of use, demographic characteristics, trip purpose, and reasons for using RTC. The survey results
identify key trends and/or areas of concern. Additionally, rider behavior and preferences among different
user groups and rider characteristics, such as how frequently a rider uses transit or whether a rider has
access to a car, has been evaluated.
Table 3 documents the sample goals and the number of completed surveys for the individual bus routes that
serve the RTC. Throughout the entirety of the bus system, 1,209 surveys were collected and processed.
Table 3: Bus Goals
Route Route Name Goals Completes Completion Rate
RAPD S Virginia St 193 139 72%
1 Ninth / Silverada / RTC CENT PLAZA 91 128 141%
2 Ninth / Silverada 94 86 91%
2S West Seventh 19 23 121%
3CC Sutro / Sun Valley 8 20 250%
3CL Arlington / Moana 33 26 79%
4 Stead 31 33 106%
5 Kietzke 71 45 63%
6 Fourth / Prater 30 47 157%
7 Terminal / Neil 72 36 50%
9 VA Hospital / Grove 53 48 91%
11 East Mill 98 60 61%
12 Sutro / Wedekind / TMCC 64 49 77%
13 Idlewild 28 52 186%
14 Lemmon Valley 38 71 187%
15 Glendale / Greg 56 42 75%
16 Glendale / Greg Express 18 25 139%
17 Wells / Airport 22 29 132%
18 Sparks Marina 43 56 130%
18X East Prater / Baring 3 4 133%
19 East Prater 13 30 231%
21 Kings Row / Sky Mtn (counterclockwise) 19 10 53%
25 Sky Mtn / Kings Row (clockwise) 12 27 225%
26 Mira Loma 13 14 108%
54 South Meadows / Damonte Ranch 22 38 173%
56 RTC INTERCITY Reno/Carson City 28 42 150%
INT C RTC RAPID 6 14 233%
SS SIERRA SPIRIT 22 15 68%
Total 1,200 1,209 101%
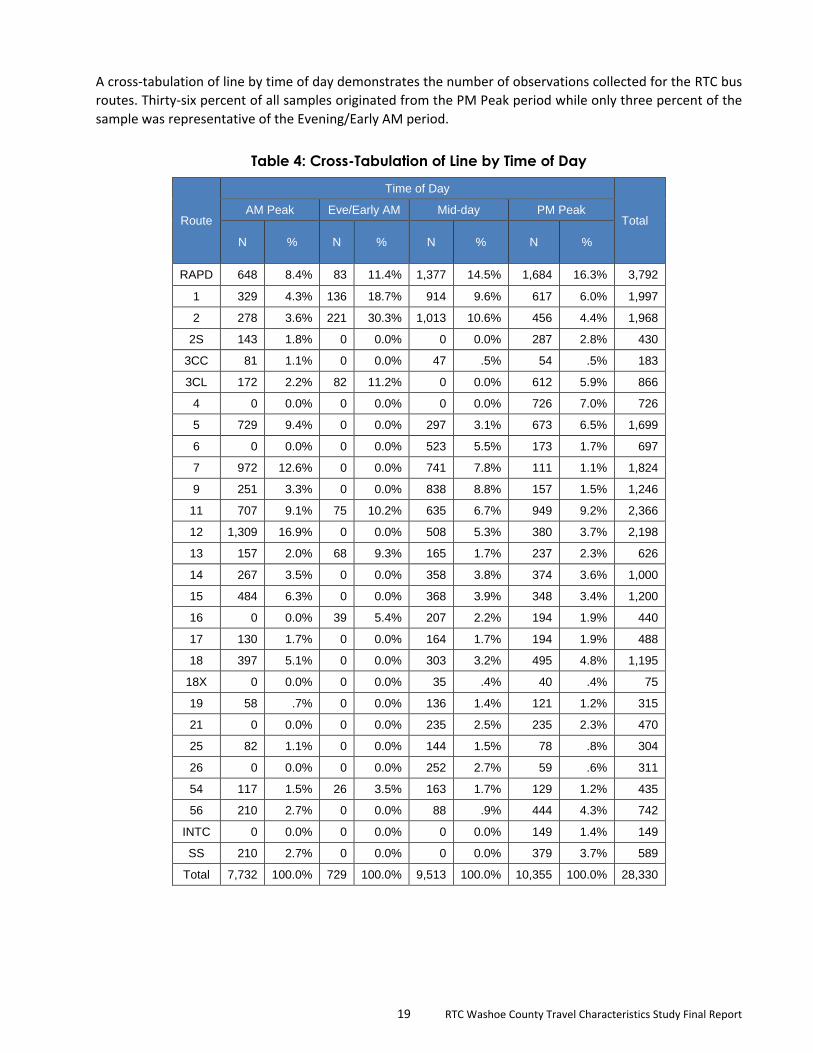
19 RTC Washoe County Travel Characteristics Study Final Report
A cross-tabulation of line by time of day demonstrates the number of observations collected for the RTC bus
routes. Thirty-six percent of all samples originated from the PM Peak period while only three percent of the
sample was representative of the Evening/Early AM period.
Table 4: Cross-Tabulation of Line by Time of Day
Route
Time of Day
Total AM Peak Eve/Early AM Mid-day PM Peak
N % N % N % N %
RAPD 648 8.4% 83 11.4% 1,377 14.5% 1,684 16.3% 3,792
1 329 4.3% 136 18.7% 914 9.6% 617 6.0% 1,997
2 278 3.6% 221 30.3% 1,013 10.6% 456 4.4% 1,968
2S 143 1.8% 0 0.0% 0 0.0% 287 2.8% 430
3CC 81 1.1% 0 0.0% 47 .5% 54 .5% 183
3CL 172 2.2% 82 11.2% 0 0.0% 612 5.9% 866
4 0 0.0% 0 0.0% 0 0.0% 726 7.0% 726
5 729 9.4% 0 0.0% 297 3.1% 673 6.5% 1,699
6 0 0.0% 0 0.0% 523 5.5% 173 1.7% 697
7 972 12.6% 0 0.0% 741 7.8% 111 1.1% 1,824
9 251 3.3% 0 0.0% 838 8.8% 157 1.5% 1,246
11 707 9.1% 75 10.2% 635 6.7% 949 9.2% 2,366
12 1,309 16.9% 0 0.0% 508 5.3% 380 3.7% 2,198
13 157 2.0% 68 9.3% 165 1.7% 237 2.3% 626
14 267 3.5% 0 0.0% 358 3.8% 374 3.6% 1,000
15 484 6.3% 0 0.0% 368 3.9% 348 3.4% 1,200
16 0 0.0% 39 5.4% 207 2.2% 194 1.9% 440
17 130 1.7% 0 0.0% 164 1.7% 194 1.9% 488
18 397 5.1% 0 0.0% 303 3.2% 495 4.8% 1,195
18X 0 0.0% 0 0.0% 35 .4% 40 .4% 75
19 58 .7% 0 0.0% 136 1.4% 121 1.2% 315
21 0 0.0% 0 0.0% 235 2.5% 235 2.3% 470
25 82 1.1% 0 0.0% 144 1.5% 78 .8% 304
26 0 0.0% 0 0.0% 252 2.7% 59 .6% 311
54 117 1.5% 26 3.5% 163 1.7% 129 1.2% 435
56 210 2.7% 0 0.0% 88 .9% 444 4.3% 742
INTC 0 0.0% 0 0.0% 0 0.0% 149 1.4% 149
SS 210 2.7% 0 0.0% 0 0.0% 379 3.7% 589
Total 7,732 100.0% 729 100.0% 9,513 100.0% 10,355 100.0% 28,330

20 RTC Washoe County Travel Characteristics Study Final Report
Table 5 documents the usable route observations and the bus population; it was expanded based on
ridership figures from fiscal year 2014. Bus data were weighted and expanded to a total population of
28,330 from the 1,209 pieces of sample collected.
Table 5: Expansion of Bus Route Data
Route Route Name Total Usable Records Total Expanded Data
RAPD S Virginia St 139 3,792
1 Ninth / Silverada / RTC CENT PLAZA 128 1,997
2 Ninth / Silverada 86 1,968
2S West Seventh 23 430
3CC Sutro / Sun Valley 20 183
3CL Arlington / Moana 26 866
4 Stead 33 726
5 Kietzke 45 1,699
6 Fourth / Prater 47 697
7 Terminal / Neil 36 1,824
9 VA Hospital / Grove 48 1,246
11 East Mill 60 2,366
12 Sutro / Wedekind / TMCC 49 2,198
13 Idlewild 52 626
14 Lemmon Valley 71 1,000
15 Glendale / Greg 42 1,200
16 Glendale / Greg Express 25 440
17 Wells / Airport 29 488
18 Sparks Marina 56 1,195
18X East Prater / Baring 4 75
19 East Prater 30 315
21 Kings Row / Sky Mtn (counterclockwise) 10 470
25 Sky Mtn / Kings Row (clockwise) 27 304
26 Mira Loma 14 311
54 South Meadows / Damonte Ranch 38 435
56 RTC INTERCITY Reno/Carson City 42 742
INT C RTC RAPID 14 149
SS SIERRA SPIRIT 15 589
Total 1,209 28,330

21 RTC Washoe County Travel Characteristics Study Final Report
Table 6 shows the relationship between vehicle ownership and household income. Overall, the vast majority (55 percent) of bus respondents reported
not owning any vehicles. Bus respondents with an average annual income of between $10,000 and $24,999 were the most likely to own one vehicle. Bus
respondents reporting an annual income of between $10,000 and $24,999 were also the group most likely to not own any vehicles.
Table 6: Cross-Tabulation of Vehicle Ownership and Household Income
Vehicle Owner-ship
Household Income
Total $0-$9,999
$10k-$24,999
$25k-$34,999
$35k-$49,999
$50k-$74,999
$75k-$99,999
$100k-$149,999
$150k-$199,999
$200k-$249,999
$250k + DK RF
None 3,167 5,691 3,867 1,400 237 94 70 0 0 0 540 183 15,248
1 1,918 2,079 1,569 887 381 60 3 25 29 39 354 120 7,463
2 776 546 588 366 257 50 43 14 0 0 391 92 3,122
3 103 213 184 85 135 100 27 4 0 0 154 84 1,088
>=4 224 160 189 104 30 19 16 12 0 0 34 0 790
Total 6,188 8,689 6,397 2,842 1,039 323 159 55 29 39 1,471 479 27,711

22 RTC Washoe County Travel Characteristics Study Final Report
Figure 3 shows the distribution of origin trip purposes for bus passengers. Nearly half (49 percent) of bus
passengers’ origin location was home. Respondents who were coming from work or work related activities
comprised the next largest percentage with 22 percent of the bus population.
Figure 3: Distribution of Origin Trip Purpose
Slightly more than one-third (34 percent) of bus passengers’ destination location was home, as illustrated in
Figure 4. Work or work related made up 22 percent of passengers’ destination purposes.
Figure 4: Distribution of Destination Trip Purpose

23 RTC Washoe County Travel Characteristics Study Final Report
More than 90 percent of bus passengers walked from their origin location to their first stop and walked after
their final stop to their destination location, as described in Table 7.
Table 7: Cross-Tabulation of Egress Mode by Access Mode
Egress Mode
Access Mode
Total Walked Wheelchair Bicycle Dropped off Drove Other, please Specify
Walked 25,057 82 17 704 210 468 26,539
Wheelchair 0 111 0 0 0 0 111
Bicycle 36 0 462 55 0 16 570
Picked up 342 0 0 79 0 0 421
Drove 52 0 0 14 0 0 66
Other, please specify 552 0 42 30 0 0 624
Total 26,039 193 521 883 210 485 28,330
Figure 5 presents how bus passengers access transit. An overwhelming majority of passengers (92 percent)
walked from their origin location to their first bus or train.
Figure 5: Distribution of Access Mode

24 RTC Washoe County Travel Characteristics Study Final Report
Figure 6 presents how RTC bus passengers egress transit. The egress mode results closely mirror those for
the access mode. The vast majority of passengers (94 percent) walked to their final destination after their
last bus or train.
Figure 6: Distribution of Egress Mode
Table 8 illustrates the relationship between the bus route surveyed, and the total number of bus vehicles
needed to complete respondents’ one-way trips. Forty-nine percent of all bus passengers used one bus
vehicle to complete their one-way-trip. Forty-four percent of passengers used two bus vehicles to complete
their one-way trip. No passengers reported needing greater than four bus vehicles to complete a one-way
trip.
Table 8: Cross-Tabulation of Line by Total Bus Vehicles Used
Route Total Vehicles
Total 1 2 3 4
RAPD 2,215 1,458 119 0 3,792
1 1,318 679 0 0 1,997
2 693 1,039 236 0 1,968
2S 251 179 0 0 430
3CC 133 50 0 0 183
3CL 506 360 0 0 866
4 274 416 36 0 726
5 736 802 161 0 1699
6 420 251 26 0 697
7 1,111 658 55 0 1,824
9 651 549 19 27 1,246
11 1,037 1,142 187 0 2,366

25 RTC Washoe County Travel Characteristics Study Final Report
Route Total Vehicles
Total 1 2 3 4
12 975 1,223 0 0 2,198
13 360 231 35 0 626
14 414 554 31 0 1,000
15 465 734 0 0 1,200
16 55 385 0 0 440
17 80 391 17 0 488
18 881 284 30 0 1,195
18X 39 36 0 0 75
19 198 116 0 0 315
21 94 188 188 0 470
25 109 80 116 0 304
26 147 7 132 25 311
54 90 272 72 0 435
56 153 270 319 0 742
INT C 97 30 22 0 149
SS 406 145 39 0 589
Total 13,907 12,531 1,841 52 28,330
Figure 7 details the number of working vehicles available to RTC Transit users. Fifty-five percent of users
stated they did not have a vehicle available to make their one-way trip.
Figure 7: Vehicle Availability

26 RTC Washoe County Travel Characteristics Study Final Report
Figure 8 documents how bus passengers paid their fare. Thirty-seven percent of bus passengers used cash to
pay for their trip, while 26 percent of bus passengers paid their fare using a PrePurchase – 31 day pass.
Figure 8: Distribution of Fare
Figure 9 summarizes the number of full-time or part-time workers in a surveyed household. Sixty-one
percent of bus passengers have one or fewer employed household members. Bus passengers living in
households with two or more employed members account for 39 percent the ridership.
Figure 9: Distribution of Household Workers

27 RTC Washoe County Travel Characteristics Study Final Report
Figure 10 characterizes bus passengers’ driver’s license status. Nearly two-thirds of bus passengers do not
possess a valid driver’s license.
Figure 10: Distribution of Valid Driver’s License
Bus passengers who participated in the survey specified their employment status as reported in Figure 11.
Fifty-eight percent of bus passengers are employed either full- or part-time. Twelve percent of bus
passengers are students, while 29 percent of bus passengers are not employed, either unemployed, retired,
or a homemaker.
Figure 11: Distribution of Employment Status

28 RTC Washoe County Travel Characteristics Study Final Report
Figure 12 shows the age distribution of bus passengers. One fifth of bus passengers are between the ages of
25 and 34 years old. Forty-two percent of bus passengers are younger than 35, and 24 percent of passengers
are 55 years of age or older.
Figure 12: Distribution of Age
Figure 13 shows the distribution of ethnicity of bus passengers. White/Caucasian, at 61 percent of the
ridership, makes up the majority of bus passengers; Hispanic passengers make up the second largest group,
at 20 percent of the ridership.
Figure 13: Distribution of Ethnicity

29 RTC Washoe County Travel Characteristics Study Final Report
As seen in Figure 14, more than one-half (53 percent) of bus passengers’ household income is less than
$25,000 annually, while between six and seven percent of passengers make an annual income of $50,000 or
more.
Figure 14: Distribution of Household Annual Income
Overwhelmingly 99.7 percent of bus surveys were completed in English, while less than one-half percent of
bus passengers took the survey in Spanish.
Figure 15: Distribution of Language

30 RTC Washoe County Travel Characteristics Study Final Report
7 Summary of Results – On-to-Off Board
This section discusses the results of the on-to-Off Board survey.
Table 9 illustrates the comparison between the average daily boardings and alightings, observed boardings
and alightings. No surveyable boardings and alightings were observed for Routes 2S, 3CC, 13, 14, 16, 17, and
21. Route RAPD, with the largest volume of daily average boardings and alightings, showed the highest
volume of responses, however when looking at the percentage of observed surveys, the largest percentage
of surveys was observed for Route 19.
Table 9: Observed Boardings and Alightings by Route
Route Route Name Daily Average Observed
% of Daily Average Observed
Boardings Alightings Boardings Alightings Boardings Alightings
RAPD S Virginia St 3,639 3,638 599 619 16% 17%
1 Ninth / Silverada / RTC CENT PLAZA
1,840 1,846 15 15 1% 1%
2 Ninth / Silverada 1,774 1,718 229 229 13% 13%
2S West Seventh 390 392
0% 0%
3CC Sutro / Sun Valley 156 163
0% 0%
3CL Arlington / Moana 812 825 364 364 45% 44%
4 Stead 711 714 381 382 54% 53%
5 Kietzke 1,498 1,497 448 457 30% 31%
6 Fourth / Prater 629 633 49 49 8% 8%
7 Terminal / Neil 1,707 1,482 51 92 3% 6%
9 VA Hospital / Grove 1,167 1,173 39 39 3% 3%
11 East Mill 2,438 2,261 76 76 3% 3%
12 Sutro / Wedekind / TMCC 1,599 1,604 43 43 3% 3%
13 Idlewild 603 601
0% 0%
14 Lemmon Valley 941 940
0% 0%
15 Glendale / Greg 1,201 1,203 159 187 13% 16%
16 Glendale / Greg Express 410 410
0% 0%
17 Wells / Airport 465 465
0% 0%
18 Sparks Marina 1,041 1,040 277 288 27% 28%
18X East Prater / Baring 59 58 17 17 29% 29%
19 East Prater 262 273 140 151 53% 55%
21 Kings Row / Sky Mtn (counterclockwise)
489 490
0% 0%
25 Sky Mtn / Kings Row (clockwise)
144 204 37 37 26% 18%
26 Mira Loma 303 301 24 24 8% 8%
54 South Meadows / Damonte Ranch
431 432 186 186 43% 43%
56 RTC INTERCITY Reno/Carson City
731 728 336 336 46% 46%
INT C RTC RAPID 171 177 70 70 41% 39%
SS SIERRA SPIRIT 179 177 91 91 51% 51%
TOTAL 25,789 25,446 3,631 3,752 14% 15%

31 RTC Washoe County Travel Characteristics Study Final Report
8 Maps
Figure 16: RTC Transit Work Origin

32 RTC Washoe County Travel Characteristics Study Final Report
Figure 17: RTC Transit Work Destination

33 RTC Washoe County Travel Characteristics Study Final Report
Figure 18: RTC Transit Home Origin

34 RTC Washoe County Travel Characteristics Study Final Report
Figure 19: RTC Transit Home Destination

35 RTC Washoe County Travel Characteristics Study Final Report
Figure 20: RTC Transit Origin Mode Walk

36 RTC Washoe County Travel Characteristics Study Final Report
Figure 21: Origin Mode Other

37 RTC Washoe County Travel Characteristics Study Final Report
Figure 22: RTC Transit Destination Mode Walk

38 RTC Washoe County Travel Characteristics Study Final Report
Figure 23: RTC Destination Mode Other
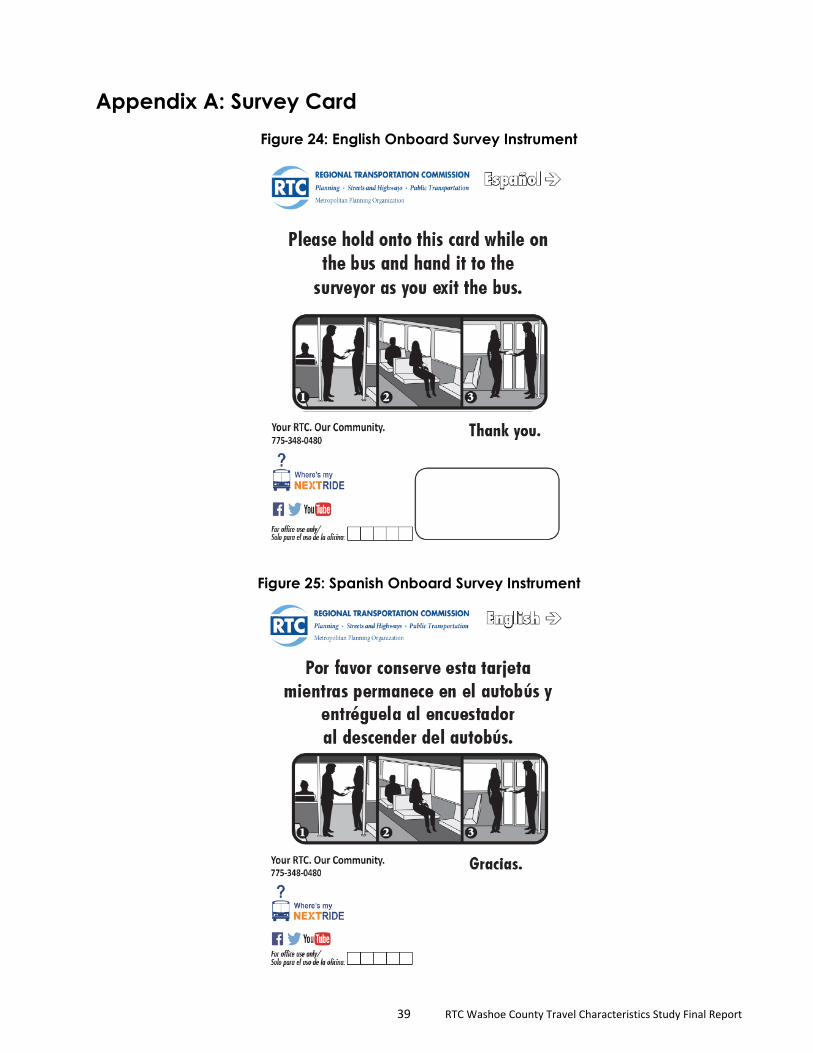
39 RTC Washoe County Travel Characteristics Study Final Report
Appendix A: Survey Card
Figure 24: English Onboard Survey Instrument
Figure 25: Spanish Onboard Survey Instrument
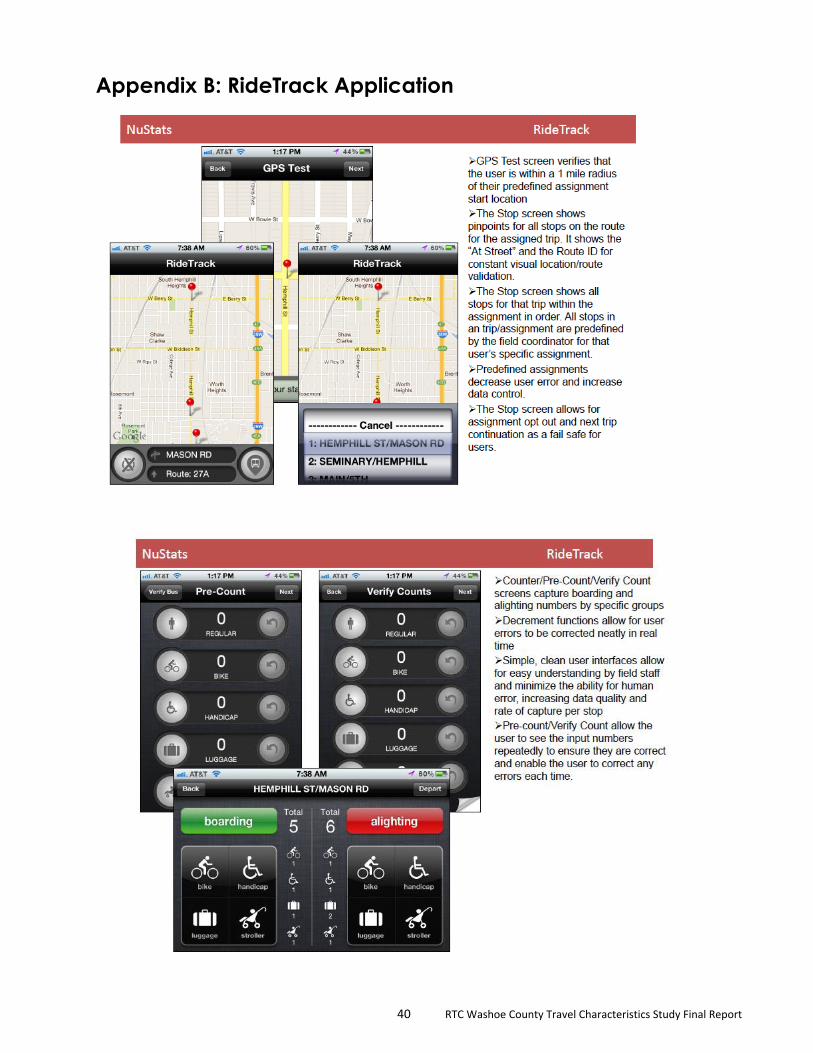
40 RTC Washoe County Travel Characteristics Study Final Report
Appendix B: RideTrack Application

41 RTC Washoe County Travel Characteristics Study Final Report

42 RTC Washoe County Travel Characteristics Study Final Report
Appendix C: TransiTap Application – Onboard Questionnaire
The first five items in the onboard questionnaire were not actual questions. The TransiTap application had preloaded
items that the surveyor would complete for each variable, as listed in the VARIABLE column, and complete each value as
listed in the VALUES column.
QUESTION VARIABLE VALUES
AUTO RECORD unique ID for this record
route Current route being surveyed (from GTFS)
service_id Service Id being surveyed (from GTFS)
TOD_trip Time of Day
direction trip headsign from GTFS
TRIPID Current trip_id being surveyed (from GTFS)
SCREEN Only filled in if on bus less than 5 minutes, so we can call them.
SCREENNUMBER Only filled in if on bus less than 5 minutes, so we can call them.
SCREENDATE Only filled in if on bus less than 5 minutes, so we can call them.
BRDDAT Boarding time formatted (MM/DD/YYYY)
BRDTIM Boarding time formatted (HH:MM:SS)
BRDDATTIM Boarding date and time
BRDTIM_UNIX Boarding time in UNIX timestamp format
AUTO BRD_COORDS Boarding stop x/y coordinates
AUTO BRD_LAT Boarding latitude (decimal degrees)
AUTO BRD_LONG Boarding longitude (decimal degrees)
AUTO BRD_STOPID Boarding stop stop_id from GTFS
BRD_STOP_NAME Boarding stop name from GTFS
ORIG_NAME Origin name
Search for Origin Address or Long Press Map for Cross Streets
ORIG_COORDS Origin stop x/y coordinates
AUTO ORIG_LAT Origin latitude (decimal degrees)
AUTO ORIG_LONG Origin longitude (decimal degrees)
ORIG_ADDR Origin location address
ALTDATTIM Alighting time formatted (pilot only)
ALTTIM_UNIX Alighting time in UNIX timestamp format
ALT_STOPID Alighting stop stop_id from GTFS
ALT_COORDS Alighting stop x/y coordinates
ALT_LAT Alighting latitude (decimal degrees)
ALT_LONG Alighting longitude (decimal degrees)
ALT_STOP_NAME Alighting stop name
DEST_NAME Destination name
Search for Destination Address or Long Press Map to Set Location
DEST_COORDS Destination location x/y coordinates
AUTO DEST_LAT Destination latitude (decimal degrees)
AUTO DEST_LONG Destination longitude (decimal degrees)
DEST_ADDR Destination location address
Questions asked of the respondent follow.
1. How many transfers did you make?

43 RTC Washoe County Travel Characteristics Study Final Report
1. 0 GO TO Q2
2. 1 GO TO Q1.a.
3. 2 GO TO Q1.d.
4. 3 GO TO Q1.g.
5. 4 GO TO Q1.j.
6. 5 GO TO Q1.m.
1.a. Select 1st transfer from drop down menu.
1.b. Select boarding transfer stop from drop down menu.
1.c. Select alighting transfer stop from drop down menu. IF Q1 = 2. GO TO Q2; IF Q1 = 3. GO TO Q1.d.
1.d. Select 2nd transfer from drop down menu.
1.e. Select 2nd boarding transfer stop from drop down menu.
1.f. Select 2nd alighting transfer stop from drop down menu. IF Q1 = 3. GO TO Q2; IF Q1 = 4. GO TO Q1.g.
1.g. Select 3rd transfer from drop down menu.
1.h. Select 3rd boarding transfer stop from drop down menu.
1.i. Select 3rd alighting transfer stop from drop down menu. IF Q1 = 4. GO TO Q2; IF Q1 = 5. GO TO Q1.j.
1.j. Select 4th transfer from drop down menu.
1.k. Select 4th boarding transfer stop from drop down menu.
1.l. Select 4th alighting transfer stop from drop down menu. IF Q1 = 5. GO TO Q2; IF Q1 = 6. GO TO 1.m.
1.m. Select 5th transfer from drop down menu.
1.n. Select 5th boarding transfer stop from drop down menu.
1.o. Select 5th alighting transfer stop from drop down menu. GO TO Q2
2. How did you access the first (your origin) vehicle?
1 Walked 2 Wheelchair 3 Bicycle 4 Dropped off 5 Drove
97 Other, please specify
3. How did you get to your final destination?
1 Walked 2 Wheelchair 3 Bicycle 4 Dropped off 5 Drove
97 Other, please specify
4. Where are you coming FROM now?
1 Work or Work Related 2 School (K-12)(student only) 3 Social or Recreational 4 My Home 5 Hotel (guest only) 6 College or University (student only)
7 Shopping 8 Airport (airline passenger only)
97 Other, please specify
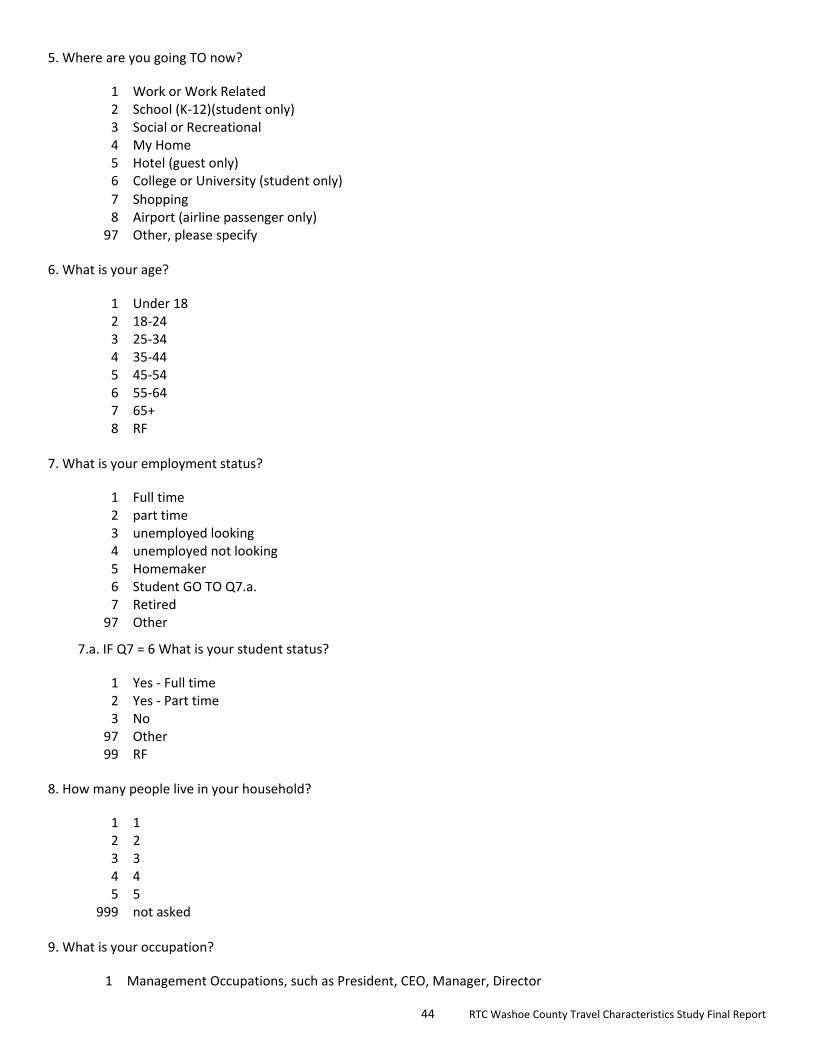
44 RTC Washoe County Travel Characteristics Study Final Report
5. Where are you going TO now?
1 Work or Work Related 2 School (K-12)(student only) 3 Social or Recreational 4 My Home 5 Hotel (guest only) 6 College or University (student only)
7 Shopping 8 Airport (airline passenger only)
97 Other, please specify
6. What is your age?
1 Under 18 2 18-24 3 25-34 4 35-44 5 45-54 6 55-64 7 65+ 8 RF
7. What is your employment status?
1 Full time 2 part time 3 unemployed looking 4 unemployed not looking 5 Homemaker 6 Student GO TO Q7.a. 7 Retired
97 Other
7.a. IF Q7 = 6 What is your student status?
1 Yes - Full time 2 Yes - Part time 3 No
97 Other 99 RF
8. How many people live in your household?
1 1 2 2 3 3 4 4 5 5
999 not asked
9. What is your occupation?
1 Management Occupations, such as President, CEO, Manager, Director
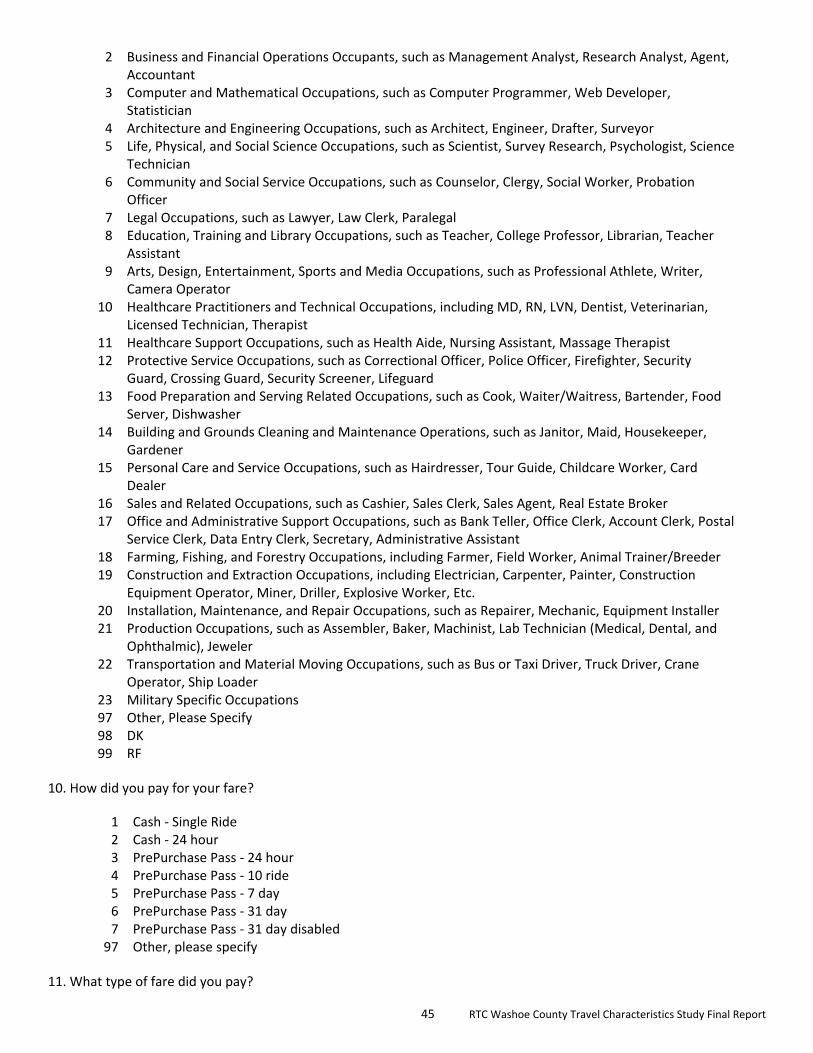
45 RTC Washoe County Travel Characteristics Study Final Report
2 Business and Financial Operations Occupants, such as Management Analyst, Research Analyst, Agent, Accountant
3 Computer and Mathematical Occupations, such as Computer Programmer, Web Developer, Statistician
4 Architecture and Engineering Occupations, such as Architect, Engineer, Drafter, Surveyor 5 Life, Physical, and Social Science Occupations, such as Scientist, Survey Research, Psychologist, Science
Technician 6 Community and Social Service Occupations, such as Counselor, Clergy, Social Worker, Probation
Officer 7 Legal Occupations, such as Lawyer, Law Clerk, Paralegal 8 Education, Training and Library Occupations, such as Teacher, College Professor, Librarian, Teacher
Assistant 9 Arts, Design, Entertainment, Sports and Media Occupations, such as Professional Athlete, Writer,
Camera Operator 10 Healthcare Practitioners and Technical Occupations, including MD, RN, LVN, Dentist, Veterinarian,
Licensed Technician, Therapist 11 Healthcare Support Occupations, such as Health Aide, Nursing Assistant, Massage Therapist 12 Protective Service Occupations, such as Correctional Officer, Police Officer, Firefighter, Security
Guard, Crossing Guard, Security Screener, Lifeguard 13 Food Preparation and Serving Related Occupations, such as Cook, Waiter/Waitress, Bartender, Food
Server, Dishwasher 14 Building and Grounds Cleaning and Maintenance Operations, such as Janitor, Maid, Housekeeper,
Gardener 15 Personal Care and Service Occupations, such as Hairdresser, Tour Guide, Childcare Worker, Card
Dealer 16 Sales and Related Occupations, such as Cashier, Sales Clerk, Sales Agent, Real Estate Broker 17 Office and Administrative Support Occupations, such as Bank Teller, Office Clerk, Account Clerk, Postal
Service Clerk, Data Entry Clerk, Secretary, Administrative Assistant 18 Farming, Fishing, and Forestry Occupations, including Farmer, Field Worker, Animal Trainer/Breeder 19 Construction and Extraction Occupations, including Electrician, Carpenter, Painter, Construction
Equipment Operator, Miner, Driller, Explosive Worker, Etc. 20 Installation, Maintenance, and Repair Occupations, such as Repairer, Mechanic, Equipment Installer 21 Production Occupations, such as Assembler, Baker, Machinist, Lab Technician (Medical, Dental, and
Ophthalmic), Jeweler 22 Transportation and Material Moving Occupations, such as Bus or Taxi Driver, Truck Driver, Crane
Operator, Ship Loader 23 Military Specific Occupations 97 Other, Please Specify 98 DK 99 RF
10. How did you pay for your fare?
1 Cash - Single Ride 2 Cash - 24 hour 3 PrePurchase Pass - 24 hour 4 PrePurchase Pass - 10 ride 5 PrePurchase Pass - 7 day 6 PrePurchase Pass - 31 day 7 PrePurchase Pass - 31 day disabled
97 Other, please specify
11. What type of fare did you pay?

46 RTC Washoe County Travel Characteristics Study Final Report
1 Adult
2 Reduced
12. What is your gender?
1 Female
2 Male
13. How many working vehicles are in your household?
0 0 1 1 2 2 3 3 4 4 5 5+
999 not asked
14. How many people in your household are currently employed?
0 0 1 1 2 2 3 3 4 4 5 5+
97 DF/RF 999 not asked
15. Do you have a temporary or permanent condition that makes it difficult to travel outside the home?
1 Yes 2 No
16. LANGUAGE – QUESTION NOT ASKED; INTERVIEWER SELECTS
1 English 2 Spanish
17. Do you have a current driver’s license?
1 Yes 2 No
18. In what range does your household income fall?
1 $0-$9,999 2 10k-24,999 3 25k-34,999 4 35k-49,999 5 50k-74,999 6 75k-99,999 7 100k-149,999 8 150k-199,999

47 RTC Washoe County Travel Characteristics Study Final Report
9 200k-249,999 10 250k+ 10 DK 12 RF
999 not asked
Thank you for participating in the RTC Onboard survey!