washoe county school district data summit 2015 63k
TRANSCRIPT
e
are
WCSD
63,000 Reasons to be inspired63,000 Reasons to succeed
www.washoeschools.net #WeAreWCSD
SM
63KWashoe County School District
Data Summit 2015
63K63,000 Reasons to be Inspired
63,000 Reasons to Succeed
WCSD Board of Trustees
John Mayer, President Angela Taylor, Ph.D., Vice President
Barbara McLaury, Ed.D., Clerk Lisa Ruggerio, District A
Nick Smith, District C Howard Rosenberg, District D
Veronica Frenkel, District F
Traci Davis, Interim Superintendent

Washoe County School District
2015 Data Summit
District Overview
The Washoe County School District (WCSD) is the 62nd
largest school district in the country1 and operates 103 schools
(including charter schools) serving urban, suburban and rural
settings. The WCSD has 62 elementary schools, 14 middle
schools, 12 high schools, 1 magnet school (TMCC), 5
alternative schools, and 8 District-sponsored charter schools.
The WCSD includes schools in the Gerlach-Empire,
Wadsworth, and Incline Village. The remaining schools are
located in the Reno/Sparks metropolitan area.
The total enrollment for all non-Charter WCSD schools is 62,986. The WCSD employs
approximately 7,041 full-time equivalent employees. This includes 406 administrators (certified and
pro-tech), 4,110 certified employees (teachers, counselors, nurses, etc.), 2,489 classified support
professionals, and 36 school police officers, sergeants, and investigators.
2013-2014 Performance Highlights2
The Class of 2014 saw 3,474 students cross the stage to accept their diplomas, which is
the largest number of students to graduate in the history of WCSD. Of them, nearly 50
percent graduated with an advanced or honors diploma. The graduation rate increased by
3 percentage points from 70 percent in 2012-13 to 73 percent in 2013-14.
The percent of students who completed at least on AP/IB or Dual Credit course by
graduation increased by 7 percentage points over the last three years, from 51 percent in
2012 to 58 percent in 2014.
The majority of students (86%) earn credits at the expected pace in the ninth and tenth
grades.
Select Strategies for Student Success
Reading Strategies Classes Advanced Placement (AP) “Stretch Run”
School-Day Proficiency Prep Classes Saturday Academies
Credit Recovery Classes “Bootcamps” for AP Students
College Math Remediation “Jumpstart” for Incoming Freshman
After-School Tutoring Home Visits
After-School Plato/A+ Support Door to Door Campaign
1 Source: http://proximityone.com/lgsd.htm 2 Additional information regarding WCSD performance can be found at www.nevadareportcard.com

A Brave and Startling Truth by Maya Angelou
We, this people, on a small and lonely planetTraveling through casual space Past aloof stars, across the way of indifferent suns To a destination where all signs tell us It is possible and imperative that we learn A brave and startling truth
And when we come to it To the day of peacemaking When we release our fingers From fists of hostility And allow the pure air to cool our palms
When we come to it When the curtain falls on the minstrel show of hate And faces sooted with scorn are scrubbed clean When battlefields and coliseum No longer rake our unique and particular sons and daughters Up with the bruised and bloody grass To lie in identical plots in foreign soil
When the rapacious storming of the churches The screaming racket in the temples have ceased When the pennants are waving gaily When the banners of the world tremble Stoutly in the good, clean breeze
When we come to it When we let the rifles fall from our shoulders And children dress their dolls in flags of truce When land mines of death have been removed And the aged can walk into evenings of peace When religious ritual is not perfumed By the incense of burning flesh And childhood dreams are not kicked awake By nightmares of abuse
When we come to it Then we will confess that not the Pyramids With their stones set in mysterious perfection Nor the Gardens of Babylon Hanging as eternal beauty In our collective memory Not the Grand Canyon Kindled into delicious color By Western sunsets
Continued on the following page
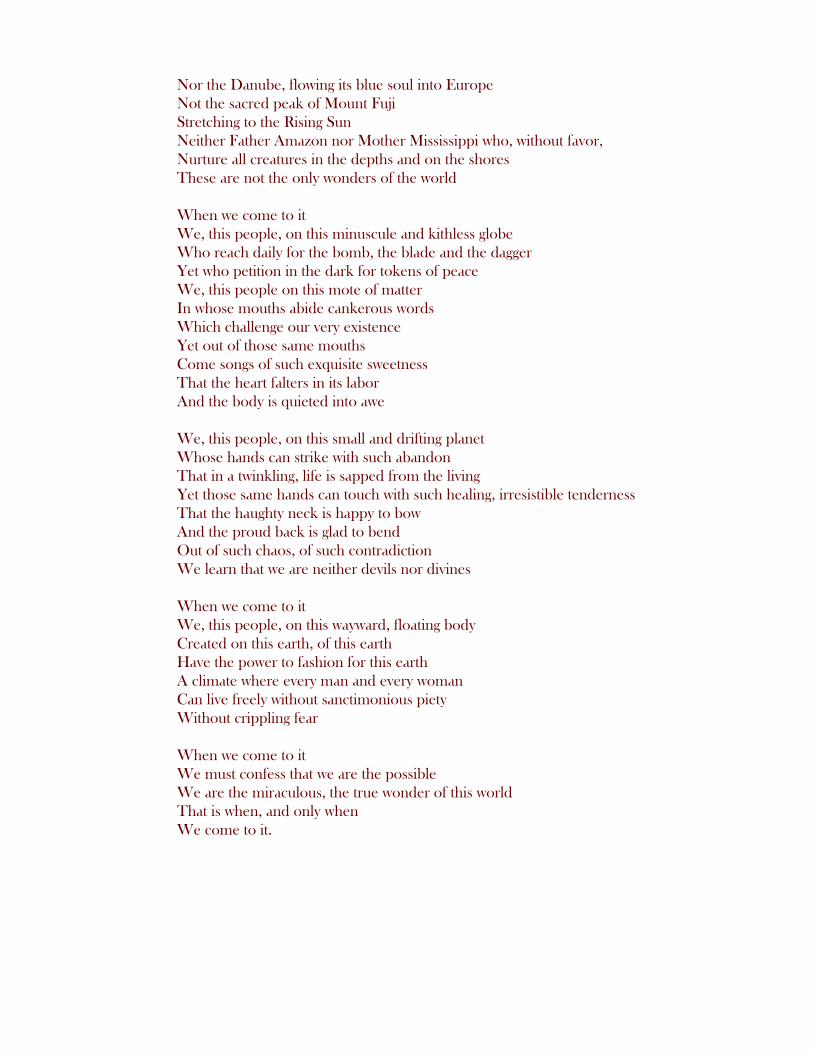
Nor the Danube, flowing its blue soul into Europe Not the sacred peak of Mount Fuji Stretching to the Rising Sun Neither Father Amazon nor Mother Mississippi who, without favor, Nurture all creatures in the depths and on the shores These are not the only wonders of the world
When we come to it We, this people, on this minuscule and kithless globe Who reach daily for the bomb, the blade and the dagger Yet who petition in the dark for tokens of peace We, this people on this mote of matter In whose mouths abide cankerous words Which challenge our very existence Yet out of those same mouths Come songs of such exquisite sweetness That the heart falters in its labor And the body is quieted into awe
We, this people, on this small and drifting planet Whose hands can strike with such abandon That in a twinkling, life is sapped from the living Yet those same hands can touch with such healing, irresistible tenderness That the haughty neck is happy to bow And the proud back is glad to bend Out of such chaos, of such contradictionWe learn that we are neither devils nor divines
When we come to it We, this people, on this wayward, floating body Created on this earth, of this earth Have the power to fashion for this earth A climate where every man and every woman Can live freely without sanctimonious piety Without crippling fear
When we come to it We must confess that we are the possible We are the miraculous, the true wonder of this world That is when, and only when We come to it.
Continued on the following page

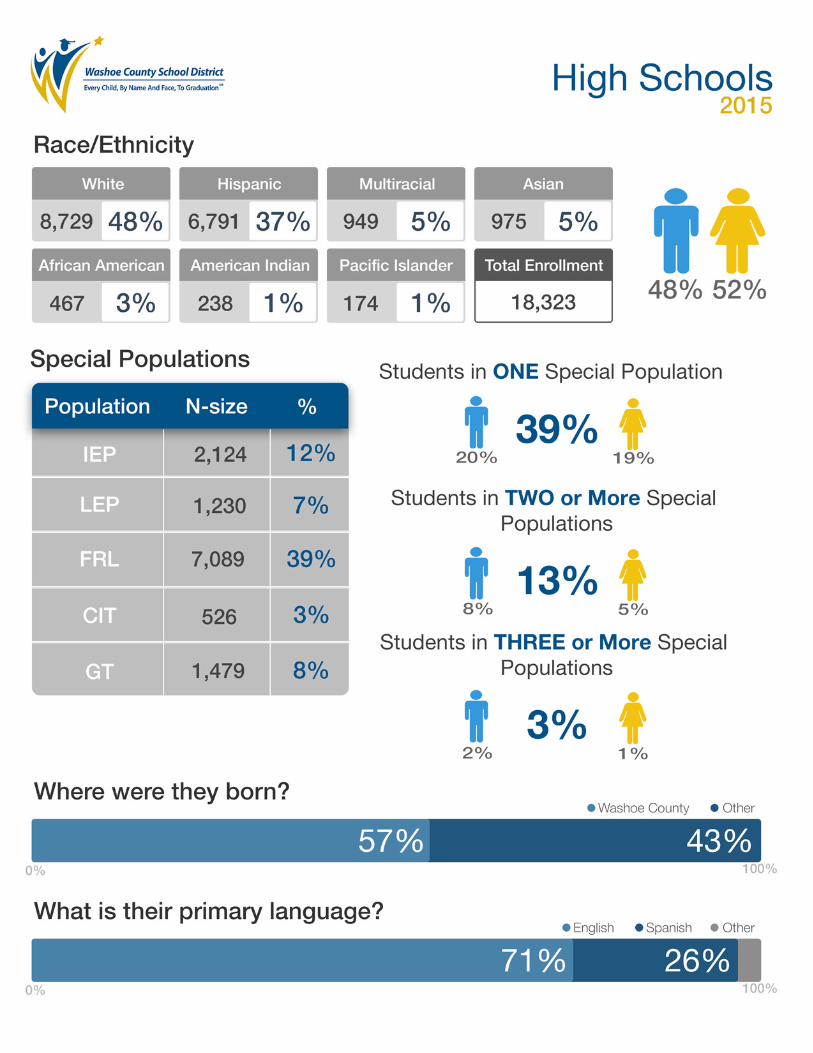
We Are WCSD
A Look at our Students


Brief Findings We are WCSD: A Look at Our Students
In the last twenty years (1994-2014), the proportion of White students hasdecreased 31 percentage points and the proportion of Hispanic studentshas increased 26 percentage points.
In the last ten years (2004-2014), the proportion of White students has decreased 15 percentage points and the proportion of Hispanic students has increased 12 percentage points.
Minority students (African American, American Indian, Asian, Hispanic,Multiracial, and Pacific Islanders) now account for the majority (54%) ofour student population.
In the last ten years, the racial/ethnic makeup of our teachers haschanged very little. Our White teachers accounted for 93% of our totalteacher population in 2004 and still account for 91% in 2014.
The proportion of IEP, LEP, FRL, and CIT students in our district have allincreased in the last ten years, with the largest increases seen in ourFree/Reduced Lunch population (FRL) and our Children in Transition(CIT) population.
Today, 30% of our elementary school students are in two or more specialpopulations. That same measure goes down to 13% in high school.
71% of our students list their primary language as English and 26% list itas Spanish.
71% of our elementary school students were born in Washoe County, butonly 57% of our high school students were born here.
Significant portions of our high school students are engaging in Arts,Sports, Foreign Languages, or ROTC.

Data Summit Advanced Organizer:
What conclusions can I draw from the presented data/information?
What is the connection to other points along the pathway to graduation and post-secondary readiness?
What is missing or is needed to strengthen/complete this relationship or my understanding?

School Climate
What do our Students Think?
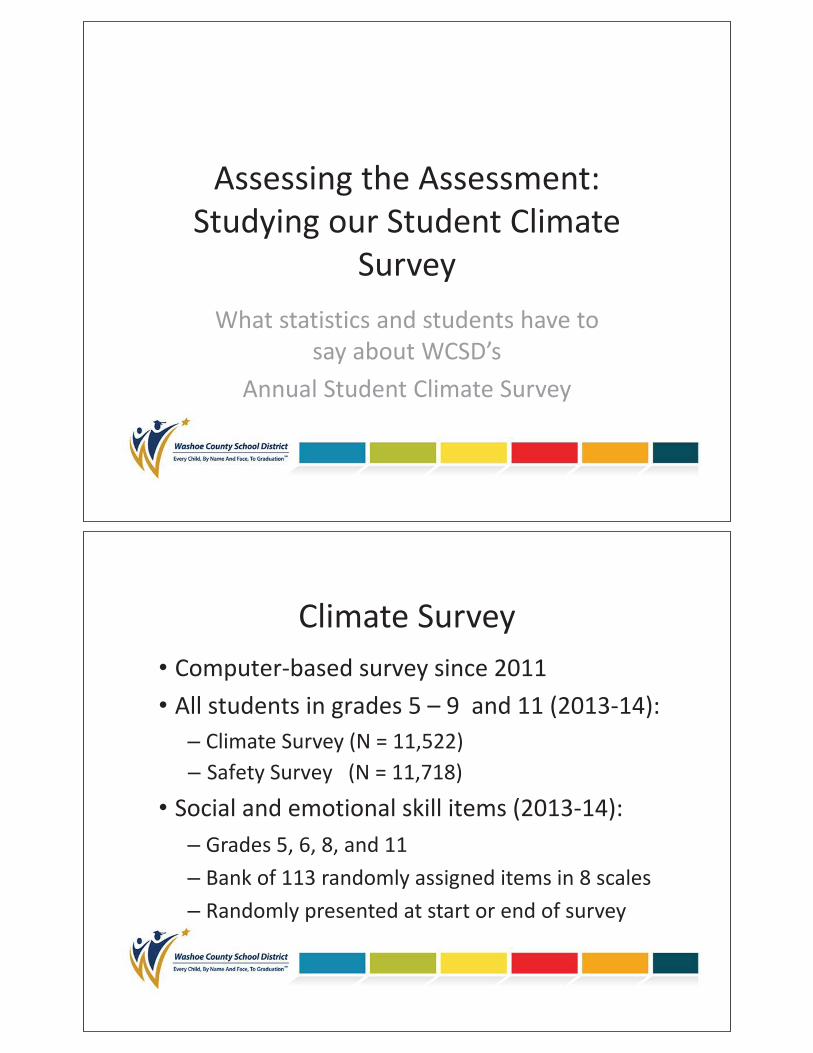
Assessing the Assessment:Studying our Student Climate
SurveyWhat statistics and students have to
say about WCSD’sAnnual Student Climate Survey
Climate Survey Computer based survey since 2011 All students in grades 5 – 9 and 11 (2013 14):
Climate Survey (N = 11,522) Safety Survey (N = 11,718)
Social and emotional skill items (2013 14):Grades 5, 6, 8, and 11Bank of 113 randomly assigned items in 8 scalesRandomly presented at start or end of survey

2014 Victimization by LevelDuring the past 12 months, how many times on school property have you beenvictimized…(sum of all victimization questions):
77%
77%
75%
80%
14%
14%
15%
12%
4%
4%
4%
4%
2%
2%
2%
1%
4%
4%
4%
3%
District (N = 11,570)
ES (N = 3,652)
MS (N = 4,427)
HS (N = 3,513)
0 Times 1 2 Times 3 4 Times 5 6 Times 7 or More Times
89%79%
67%
31%
3%9%
18%
39%
No Risk Low Risk Moderate Risk High Risk
9th Grader Risk Status (2010-11) and Preliminary 4-Year Cohort Graduation Outcomes (2013-14)
Graduated(N = 2,995)
Dropout/Vanished(N = 784)
High Risk Students MUCH More Likely to Drop Out or Vanish
But…31% of High Risk Students “Beat the
Odds” and Graduated!

IES Grant: “Creating a Monitoring System forSchool Districts to Promote Academic, Social,and Emotional Learning: A ResearcherPractitioner Partnership”
$$$ + Statisticians + SEL Experts +Graduate Research Assistants
to study and improve the way we measure students’ self reportedsocial and emotional skills (and our Climate Survey generally)
Research Questions
Are Social and Emotional Skills and otherClimate Survey indicators the “glue” that bindsstudents to school and helps them persist in the
face of obstacles?
Can we measure them???

Emotion Knowledge: “I can predict how I will feel in most situations.”
Self-Concept:“I am satisfied with who I am as a person.”
“When I make a decision, I think about what might happen afterwards.”
Schoolwork: “I come to class prepared.”
Emotion Regulation:“I can calm myself down when I get upset.”
Goal Management:“I try hard to do well in school.”
“I learn from people whose views are different from my own.”
“There are very few people I don’t get along with at school.”
Answer Choices1 = Never True for Me2 = Rarely True for Me3 = Somewhat True for Me4 = Usually True for Me5 = Always True for Me
Answer Choices1 = Never True for Me2 = Rarely True for Me3 = Somewhat True for Me4 = Usually True for Me5 = Always True for Me
Discuss
Are social and emotional competencies skillsthat we can measure?If so, what would we do with this informationat home, at school, in our classrooms?

What the Statistics Say about ourAnnual Student Climate Survey
What the Statistics Say
Good bank of itemsBut, we have a Ceiling Effect(way too many “Always true for me” answers)
How do we know who has exceptional social andemotional skills and who has good social and
emotional skills?

When I make a decision, I think about whatmight happen afterwards.
My classmates can count on me to behonest.
Ceiling Effect
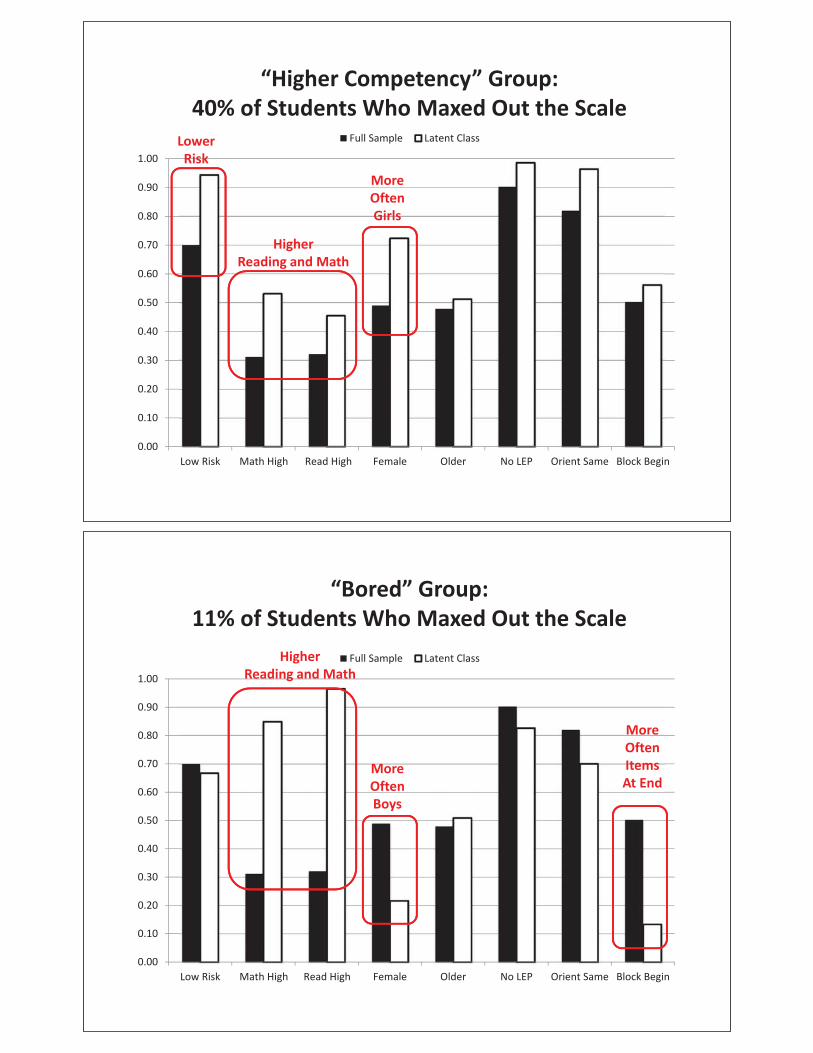
Why Do We See So Many Fives?
Are the students really all highly competent?Or are they bored?Or do they not understand the questions?
Latent Class Analysis:Tells us if students who “max out” thescale share certain characteristics like
age, gender, and test scores
0.00
0.10
0.20
0.30
0.40
0.50
0.60
0.70
0.80
0.90
1.00
Low Risk Math High Read High Female Older No LEP Orient Same Block Begin
Full Sample Latent ClassLowerRisk
HigherReading and Math
MoreOftenGirls
“Higher Competency” Group:40% of Students Who Maxed Out the Scale
0.00
0.10
0.20
0.30
0.40
0.50
0.60
0.70
0.80
0.90
1.00
Low Risk Math High Read High Female Older No LEP Orient Same Block Begin
Full Sample Latent Class
“Bored” Group:11% of Students Who Maxed Out the Scale
MoreOftenItemsAt End
HigherReading and Math
MoreOftenBoys
0.00
0.10
0.20
0.30
0.40
0.50
0.60
0.70
0.80
0.90
1.00
Low Risk Math High Read High Female Older No LEP Orient Same Block Begin
Full Sample Latent Class
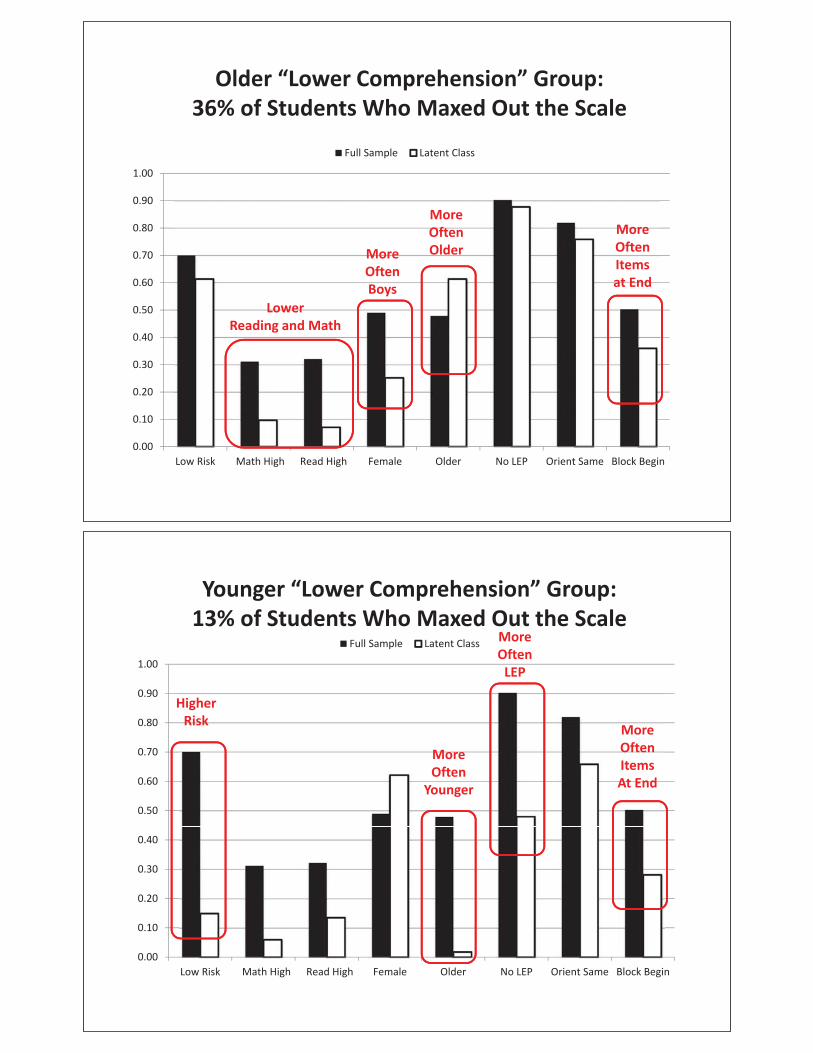
Older “Lower Comprehension” Group:36% of Students Who Maxed Out the Scale
MoreOftenOlder
LowerReading and Math
MoreOftenBoys
MoreOftenItemsat End
0.00
0.10
0.20
0.30
0.40
0.50
0.60
0.70
0.80
0.90
1.00
Low Risk Math High Read High Female Older No LEP Orient Same Block Begin
Full Sample Latent Class
Younger “Lower Comprehension” Group:13% of Students Who Maxed Out the Scale
HigherRisk
MoreOftenYounger
MoreOftenItemsAt End
MoreOftenLEP
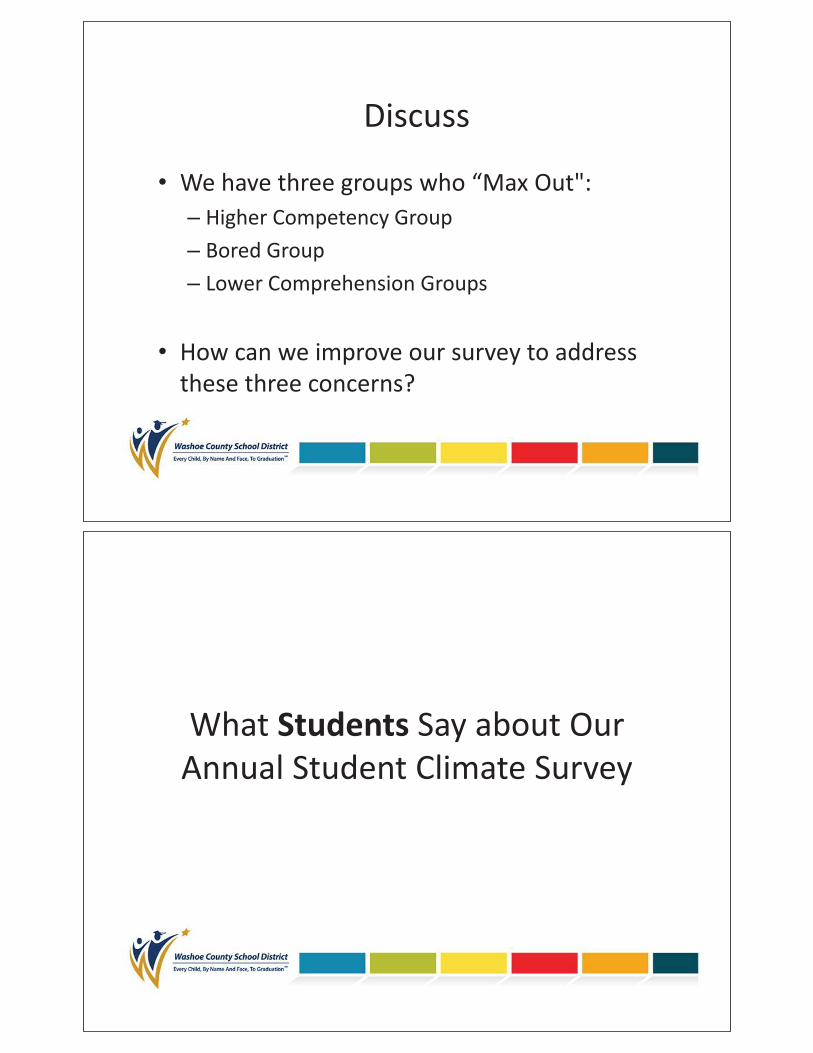
Discuss
We have three groups who “Max Out":Higher Competency GroupBored GroupLower Comprehension Groups
How can we improve our survey to addressthese three concerns?
What Students Say about OurAnnual Student Climate Survey

What the Students Say
“I almost feel like it would help to have kids write the questions, and then adultsrevise them and stuff, just because—you figure you guys are like, way, way out ofhigh school—oh, sorry, don’t take it like that. I'm talking about the school board.They're, like, more than twice our age, they're like all 50 and have Masters andDoctorates. They don’t know what we're like, so— Yeah, when we do the survey, Ifeel like they have this stereotype of who I am. They're like, ‘Oh, they think I am aperson who tweets all day and does nothing.’ That’s how I feel sometimes when Iread the questions… Damonte Ranch HS Student
Methods
Three types of groups based on results of LCAElementary Students (3 groups)
Focus: Comprehension of ItemsMiddle and High School Students (3 groups)
Focus: Engagement in Climate SurveyHigh Achieving High School Students (2 groups)
Focus: Brainstorm of Most Difficult SEL Skills

Item Generation
Which Skills Were Most/LeastChallenging for Students?
Getting along with othersHelping resolve other people’s conflictsWorking in teams at schoolDescribing thoughts and feelingsArguing while controlling emotionsKnowing how to “agree to disagree”Resolving other peoples’ conflicts

Least Challenging (All)
23
Getting Along withOthers/Working in Teams
Used to working in teamsWe are around random people allthe time at school, so this issomething we do a lotI’m good at finding commoninterests
High School: Solving Others’ ConflictsFriends trust my opinions
Middle School: Most ChallengingDescribing Thoughts andFeelingsUnderstanding Others’Behaviors
Hard to understand how others canbe mean, do drugs
Calming Down OthersDon’t want to make situationworseDon’t know how to empathizewhen haven’t been through it

SWAS Students: Most Challenging
Confrontation/Argumentation“I mean you pop off at me, I’m gonnapop off at you.”People have to earn respect before I’llbe nice
High Achievers: Most ChallengingAgreeing to disagree
Like to be right/persuade peopleto my opinionDon’t like admitting when wrongDon’t understand closemindedness

Negative Reactions to SurveyConcerns about privacy affecting honesty
Survey setting not privateUnsure who sees dataYounger students think survey is a “test”
No one takes it seriouslyTeachers do not say it is importantStudents never see any change or any dataBoring and repetitiveQuestions/format hard for young studentsQuestions too personal
Positive Reactions to Survey
Nearly all students remembered surveyUnique opportunity to express themselvesMost proctors conveyed:
Importance of surveyConfidentiality of survey
Most understand survey used to improveschool

ConclusionGood start on item bank, but need morechallenging questionsStudents value opportunity, but work to do!Next Steps:
Training and embedded videoItem rewrites/more engaging formatsMore focus groupsGrants and additional funding
Discuss
Can we measure social and emotional skills?What are the implications for how we teach,test, and survey?
Are these patterns we would see on MAP/CRT/anysurvey?Are these patterns we would see in students’approaches to school?What can we do about it?

Brief Findings Climate Survey: What do Our Students Think?
Students classified as “High Risk” for dropout in the ninth grade are indeedmore likely to drop out of high school four years later. However, almost athird of ninth grade students we predicted were at high risk for dropping outin high school ultimately graduated.
A research project in collaboration with CASEL and the University of Illinois,Chicago may help to illuminate whether social and emotional skills andother Climate Survey measures might buffer against the risks many WCSDstudents face on the way to graduation.
Analyses of the social and emotional skill questions on the Student ClimateSurvey indicate a ceiling effect, in which too many students are saying“Always True for Me” on all of the items.
Latent Class Analyses indicate that these students who respond “AlwaysTrue for Me” on all of the social and emotional skill survey questionstypically fall into three “types” of students:
o Older, female, higher achieving students (“High Competency to doSkills”)
o Older, higher achieving males answering questions at the end ofthe survey (“Bored by Task”)
o Younger, lower achieving students who may have troubleunderstanding the questions (“Lower Comprehension ofQuestions”)
Focus groups with students indicate that there are distinct developmentaldifferences in which social and emotional skills students perceive as mostand least challenging to do.
Focus groups with students also indicate that while many students valuethe opportunity to provide feedback about their school through the StudentClimate Survey, concerns about confidentiality and beliefs that no oneuses the information collected affects how honestly they answer surveyquestions.

Data Summit Advanced Organizer:
What conclusions can I draw from the presented data/information?
What is the connection to other points along the pathway to graduation and post-secondary readiness?
What is missing or is needed to strengthen/complete this relationship or my understanding?

School Discipline
Discipline Indicators in WCSD
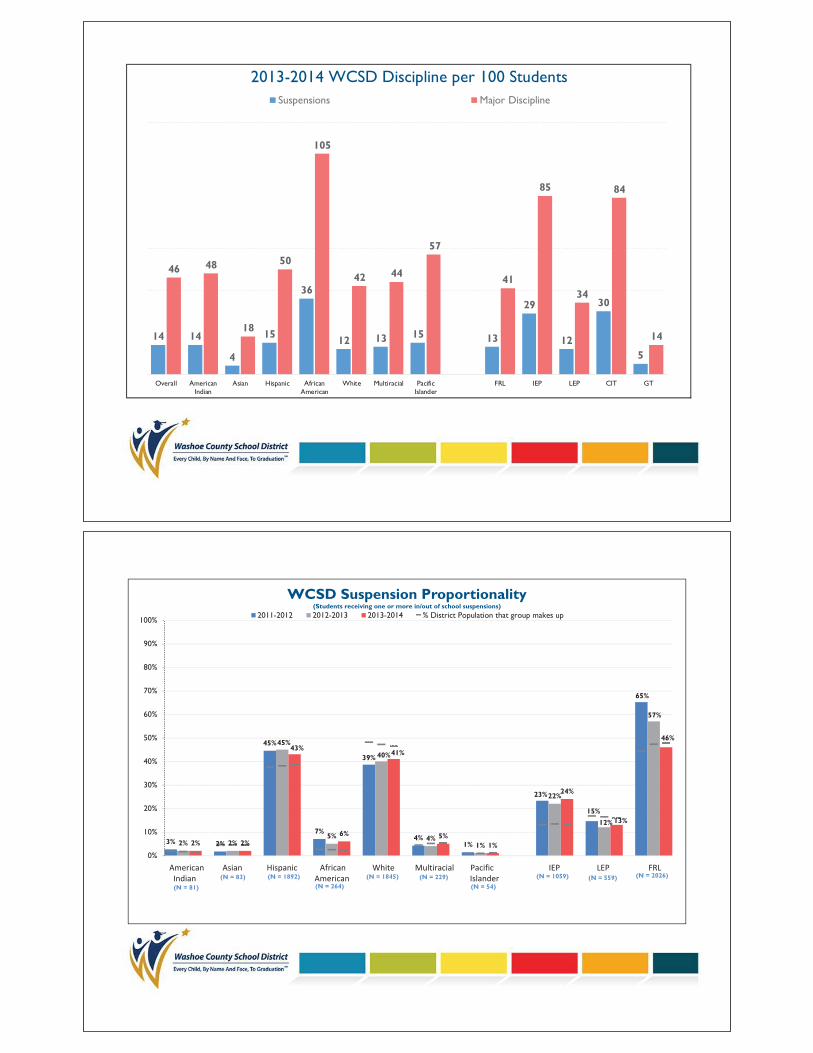
2013-2014 WCSD Discipline per 100 Students
14 14
4
15
36
12 13 15 13
29
12
30
5
46 48
18
50
105
42 44
57
41
85
34
84
14
Overall AmericanIndian
Asian Hispanic AfricanAmerican
White Multiracial PacificIslander
FRL IEP LEP CIT GT
Suspensions Major Discipline
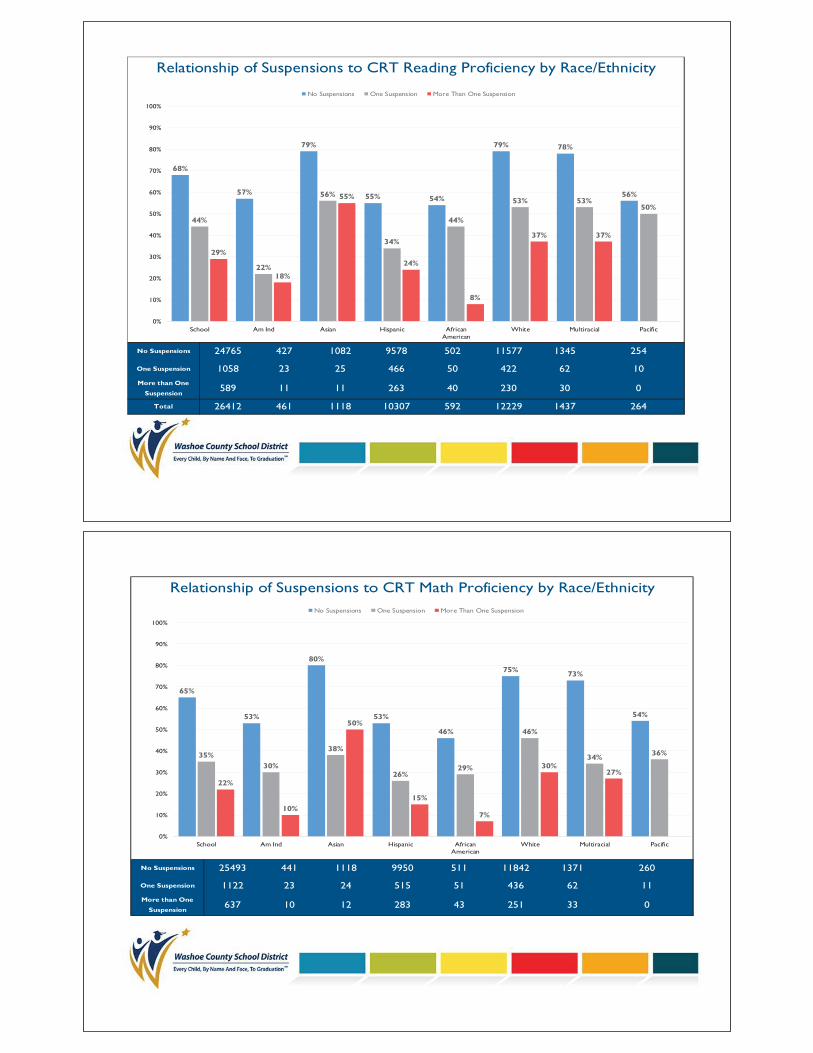
3% 2%
45%
7%
39%
4%1%
23%
15%
65%
2% 2%
45%
5%
40%
4%1%
22%
12%
57%
2% 2%
43%
6%
41%
5%1%
24%
13%
46%
0%
10%
20%
30%
40%
50%
60%
70%
80%
90%
100%
WCSD Suspension Proportionality(Students receiving one or more in/out of school suspensions)
2011-2012 2012-2013 2013-2014 % District Population that group makes up
American Asian Hispanic African White Multiracial Pacific IEP LEP FRLIndian American Islander(N = 81)
(N = 83) (N = 1892)(N = 264)
(N = 1845) (N = 229)(N = 54)
(N = 1059) (N = 559) (N = 2026)

64%
1% 2%
26%
3%
29%
3%1%
14%
7%
27%
36%
1% 1%
15%
1%
16%
2%0%
5%3%
15%
0%
10%
20%
30%
40%
50%
60%
70%
80%
90%
100%
WCSD Gender Major Discipline Proportionality(Students receiving one or more major discipline events logged in 2013-2014)
Male Female % District Population That Group Makes Up
All Students American Asian Hispanic African White Multiracial Pacific IEP LEP FRLIndian American Islander
Male N Size 6571 108 166 2638 297 2945 339 78 2740 1446 749Female N Size 3746 67 86 1567 153 1624 201 48 1534 532 347
j pFor every 100 Female students who would (proportionally) be involved in a major discipline event, there are 75 who are.
j pFor every 100 Male students who would (proportionally) be involved in a major discipline event, there are 137 who are.
j pFor every 100 Female IEP students who would (proportionally) be involved in a major discipline event, there are 80 who are.
j pFor very 100 Male IEP students who would (proportionally) be involved in a major discipline event, there are 156 who are.
71%
1% 2%
29%
4%
31%
4%1%
19%
9%
32%29%
1% 0%
13%
2%
11%
2% 0%5%
4%
14%
0%
10%
20%
30%
40%
50%
60%
70%
80%
90%
100%
WCSD Gender Suspension Proportionality(Students receiving one or more in/out of school suspensions)
Male Female % District Population That Group Makes Up
All Students American Asian Hispanic African White Multiracial Pacific IEP LEP FRLIndian American Islander
Male N Size 3159 58 68 1302 178 1358 157 38 832 396 1412Female N Size 1289 23 15 590 86 487 72 16 227 163 614
For every 100 Male students who would (proportionally) be suspended, there are 137 who are.
For every 100 Female Hispanic students who would (proportionally) be suspended, there are 60 who are.
(p p y) p ,For every 100 Male FRL students who would (proportionally) be suspended, there are 128 who are.
(p p y) p ,For every 100 Female FRL students who would (proportionally) be suspended, there are 68 who are.
No Suspensions
One Suspension
More than One
Suspension
Total 12229 1437 26426412 461 1118 10307 592
62 10
589 11 11 263 40 230 30 0
1058 23 25 466 50 422
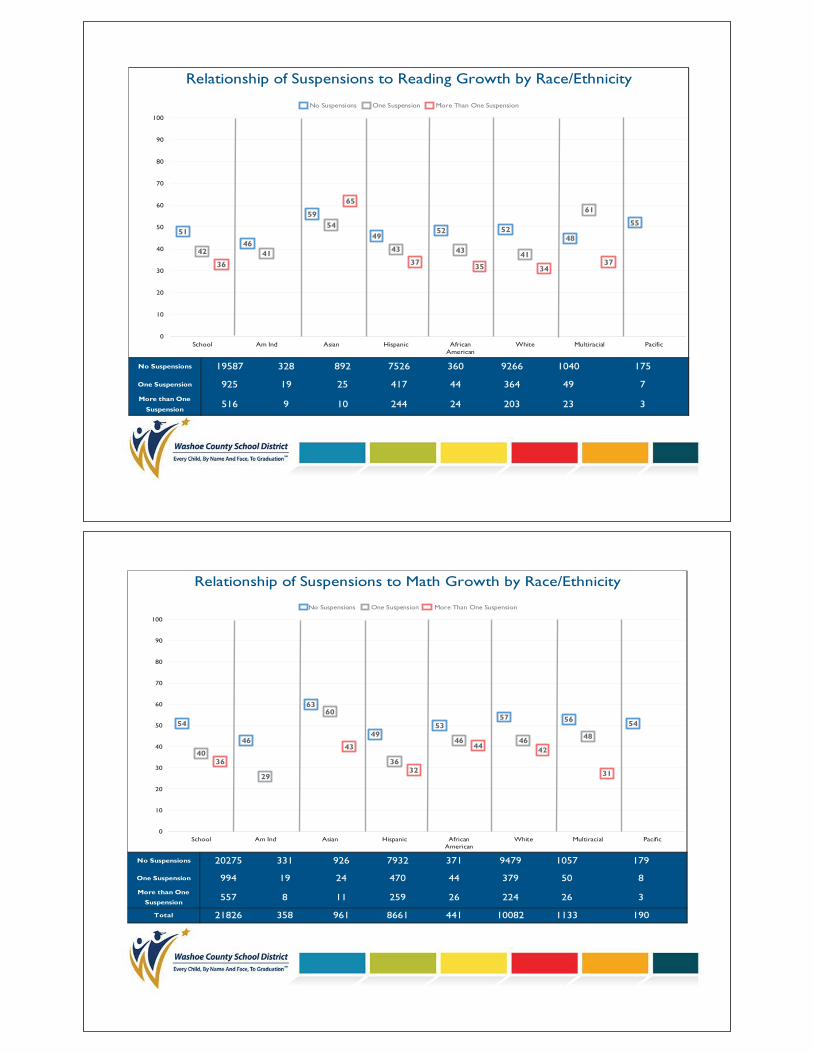
Relationship of Suspensions to CRT Reading Proficiency by Race/Ethnicity
24765 427 1082 9578 502 11577 1345 254
68%
57%
79%
55% 54%
79% 78%
56%
44%
22%
56%
34%
44%
53% 53%50%
29%
18%
55%
24%
8%
37% 37%
0%
10%
20%
30%
40%
50%
60%
70%
80%
90%
100%
School Am Ind Asian Hispanic AfricanAmerican
White Multiracial Pacific
No Suspensions One Suspension More Than One Suspension
No Suspensions
One Suspension
More than One
Suspension
62 11
637 10 12 283 43 251 33 0
1122 23 24 515 51 436
Relationship of Suspensions to CRT Math Proficiency by Race/Ethnicity
25493 441 1118 9950 511 11842 1371 260
65%
53%
80%
53%
46%
75% 73%
54%
35%30%
38%
26%29%
46%
34% 36%
22%
10%
50%
15%
7%
30%27%
0%
10%
20%
30%
40%
50%
60%
70%
80%
90%
100%
School Am Ind Asian Hispanic AfricanAmerican
White Multiracial Pacific
No Suspensions One Suspension More Than One Suspension

No Suspensions
One Suspension
More than One
Suspension
Total
Relationship of Suspensions to CRT Reading Proficiency by Student Population
99
176
4214
589
1058
24765
172
216
2882
436
707
12525
26412 13668 3270 4489
68%
56%
23%
30%
44%
36%
11% 12%
29%
23%
12%7%
0%
10%
20%
30%
40%
50%
60%
70%
80%
90%
100%
School FRL IEP LEP
No Suspensions One Suspension More Than One Suspension
No Suspensions
One Suspension
More than One
Suspension
Total
198
27252 14132 3387 4627
Relationship of Suspensions to CRT Math Proficiency by Student Population
25493
637 467 184 108
12915 2975 4321
1122 750 228
65%
53%
26%
37%35%
29%
16%13%
22%19%
10%5%
0%
10%
20%
30%
40%
50%
60%
70%
80%
90%
100%
School FRL IEP LEP
No Suspensions One Suspension More Than One Suspension

No Events
One Event
More than One
Event
Total
90 22
1446 31 27 642 68 584 86
1790 31 33 780 70 764
Relationship of Discipline to CRT Reading Proficiency by Race/Ethnicity
23176 399 1058 8885 454 10881 1261 238
12229 1437 26026412 461 1118 10307 592
70%
58%
79%
56% 54%
80% 80%
56%
49%
29%
73%
38%
49%
61%
53%
36%35%
26%
52%
28%
21%
41%
49%
0%
10%
20%
30%
40%
50%
60%
70%
80%
90%
100%
School Am Ind Asian Hispanic AfricanAmerican
White Multiracial Pacific
No Events One Event More Than One Event
No Events
One Event
More than One
Event
Total 12529 1466 26727252 474 1154 10748 605
Relationship of Discipline to CRT Math Proficiency by Race/Ethnicity
23803 410 1093 9202 463 11109 1281 245
93 22
1560 29 27 708 73 622 92
1889 35 34 838 69 798
67%
55%
80%
55%
48%
77% 75%
55%
43%
29%
59%
33% 33%
54%
43%
32%
25%21%
33%
18%
11%
33% 34%
0%
10%
20%
30%
40%
50%
60%
70%
80%
90%
100%
School Am Ind Asian Hispanic AfricanAmerican
White Multiracial Pacific
No Events One Event More Than One Event

No Events
One Event
More than One
Event
Total 26412 13668 3270 4489
Relationship of Discipline to CRT Reading Proficiency by Student Population
23176
1446 1020 376 234
11538 2600 3953
1790 1110 294 302
70%
57%
23%
31%
49%
41%
14% 16%
35%
29%
12%8%
0%
10%
20%
30%
40%
50%
60%
70%
80%
90%
100%
School FRL IEP LEP
No Events One Event More Than One Event
No Events
One Event
More than One
Event
Total
325
27252 13973 3387 4627
Relationship of Discipline to CRT Math Proficiency by Student Population
23803
1560 934 394 266
11855 2678 4036
1889 1184 315
67%
55%
80%
55%
43%
29%
59%
33%
25%21%
33%
18%
0%
10%
20%
30%
40%
50%
60%
70%
80%
90%
100%
School FRL IEP LEP
No Events One Event More Than One Event
No Suspensions
One Suspension
More than One
Suspension
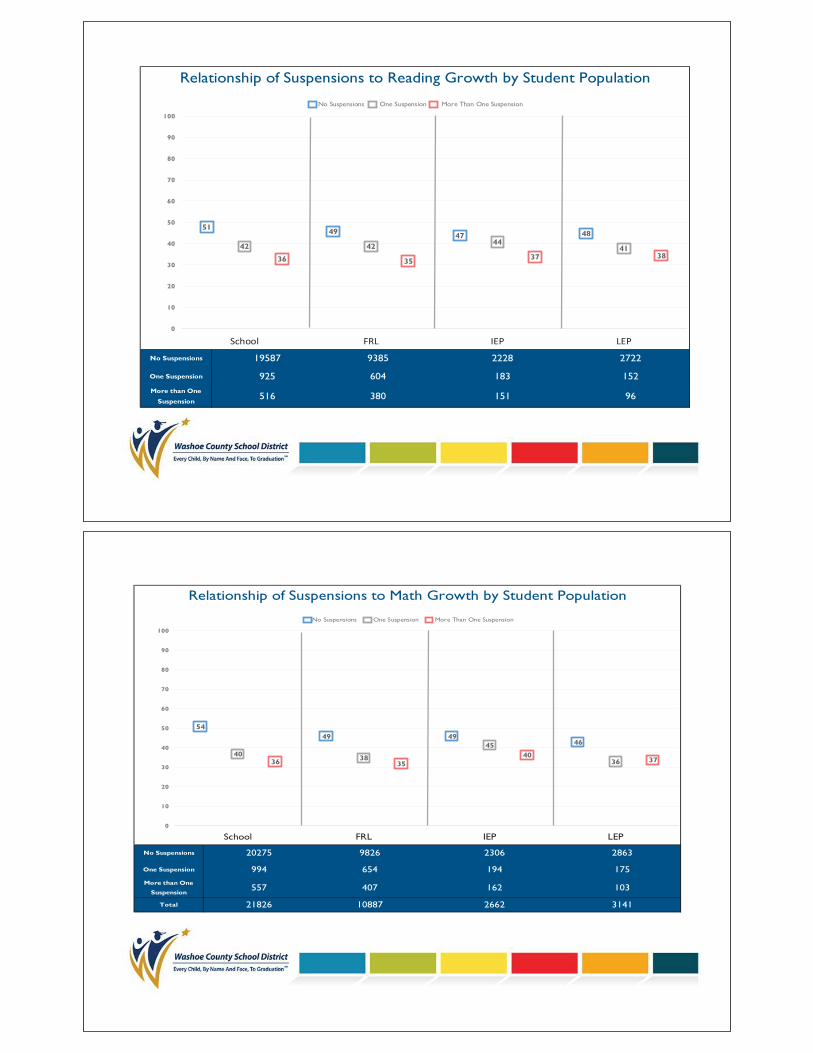
Relationship of Suspensions to Reading Growth by Race/Ethnicity
19587 328 892 7526 360 9266 1040 175
49 7
516 9 10 244 24 203 23 3
925 19 25 417 44 364
5146
59
4952 52
48
55
42 41
54
43 43 41
61
36
65
37 35 3437
0
10
20
30
40
50
60
70
80
90
100
School Am Ind Asian Hispanic AfricanAmerican
White Multiracial Pacific
No Suspensions One Suspension More Than One Suspension
No Suspensions
One Suspension
More than One
Suspension
Total 10082 1133 19021826 358 961 8661 441
Relationship of Suspensions to Math Growth by Race/Ethnicity
20275 331 926 7932 371 9479 1057 179
50 8
557 8 11 259 26 224 26 3
994 19 24 470 44 379
54
46
63
4953
57 56 54
40
29
60
36
46 46 48
36
43
32
44 42
31
0
10
20
30
40
50
60
70
80
90
100
School Am Ind Asian Hispanic AfricanAmerican
White Multiracial Pacific
No Suspensions One Suspension More Than One Suspension
No Suspensions
One Suspension
More than One
Suspension
Relationship of Suspensions to Reading Growth by Student Population
96
152
2722
151
183
2228
604
9385
516
925
19587
380
51 49 47 48
42 42 4441
36 35 37 38
0
10
20
30
40
50
60
70
80
90
100
School FRL IEP LEP
No Suspensions One Suspension More Than One Suspension
No Suspensions
One Suspension
More than One
Suspension
Total
Relationship of Suspensions to Math Growth by Student Population
20275
557 407 162 103
9826 2306 2863
994 654 194 175
21826 10887 2662 3141
5449 49
46
40 38
45
3636 3540
37
0
10
20
30
40
50
60
70
80
90
100
School FRL IEP LEP
No Suspensions One Suspension More Than One Suspension

No Events
One Event
More than One
Event
Total
73 14
1255 26 25 581 47 503 67 6
1511 29 30 660 54 651
How do Discipline Relate to Reading Growth?
18262 301 872 6946 327 8679 972 165
9833 1112 18521028 356 927 8187 428
5146
59
50 52 5248
57
45
25
61
4643 43
62
3938 39
56
39
3235
45
0
10
20
30
40
50
60
70
80
90
100
School Am Ind Asian Hispanic AfricanAmerican
White Multiracial Pacific
No Events One Event More than One Event
Relationship of Discipline to Reading Growth by Race/Ethnicity
No Events
One Event
More than One
Event
Total 10082 1133 19021826 358 961 8661 441
Relationship of Discipline to Math Growth by Race/Ethnicity
18850 301 905 7299 338 8854 983 170
77 14
1364 24 25 643 51 542 73 6
1612 33 31 719 52 686
55
48
63
4952
58 56 55
4642
55
41
58
48 49
4338
26
55
34
44 43 41
0
10
20
30
40
50
60
70
80
90
100
School Am Ind Asian Hispanic AfricanAmerican
White Multiracial Pacific
No Events One Event More than One Event

No Events
One Event
More than One
Event
Total
How do Discipline Relate to Reading Growth?
18262
1255 878 327 216
8581 1991 2521
1511 910 244 233
21028 10369 2562 2970
51 49 47 4945 45 46 44
38 3640
43
0
10
20
30
40
50
60
70
80
90
100
School FRL IEP LEP
No Events One Event More than One Event
Relationship of Discipline to Reading Growth by Student Population
No Events
One Event
More than One
Event
Total 21826 10887 2662 3141
Relationship of Discipline to Math Growth by Student Population
18850
1364 949 342 245
8950 2055 2638
1612 988 265 258
55
49 504646 44 43 42
38 3741 39
0
10
20
30
40
50
60
70
80
90
100
School FRL IEP LEP
No Events One Event More than One Event

No Suspensions
One Suspension
More than One
Suspension
Total
Suspensions and Graduation Status
560
124403204Off Track On Track
4337 13300
220573
640
80%
53%
28%
0%
10%
20%
30%
40%
50%
60%
70%
80%
90%
100%
On Track To Graduate
No Suspensions One Suspension More than One Suspension

Brief Findings Discipline Indicators in WCSD
Being suspended, or getting a Major Discipline Referral (MDR) leads tomarkedly lower student achievement outcomes.
o Students who are suspended or have an MDR are less likely to beproficient.
o Students who are suspended or have an MDR grow much lessacademically than their peers.
o Students who are suspended or have an MDR are less likely to beon track to graduate.
Of the high school students who were not suspended lastyear, 80% are on track to graduate (n = 15,644);
Of the students who were suspended once last year(n=1,200), only 53% are currently on-track to graduate;
Of the students who were suspended more than once lastyear (n=793), 28% are on track to graduate.
Some student sub-populations are substantially more likely to receive adisciplinary infraction:
o African American students, students with an IEP, and Children inTransition are much more likely to be suspended or have an MDRthan their peers.
o Fortunately, we have seen a decrease in suspensiondisproportionality among students receiving Free/Reduced Lunch.

Data Summit Advanced Organizer:
What conclusions can I draw from the presented data/information?
What is the connection to other points along the pathway to graduation and post-secondary readiness?
What is missing or is needed to strengthen/complete this relationship or my understanding?

Children in Transition
An Examination of
Data on Children in Transition


-
due toloss of housing, economichardship, or similar reason
due toloss of housing, economichardship, or similar reason


Staying at One High School Makes aDifference

CIT Students Receiving Transportation

53.3%
74.1%
36.0%
54.9%
Percent of CIT & Non CIT StudentsProficient inMath for 2012 2013
47.4%
71.1%
44.2%
63.7%
Percent of CIT & Non CIT StudentsProficient in Reading for 2012 2013
Graduation Rates (Class of 2014)

»»»»»»»»»»
Brief Findings An Examination of Data on Children In Transition
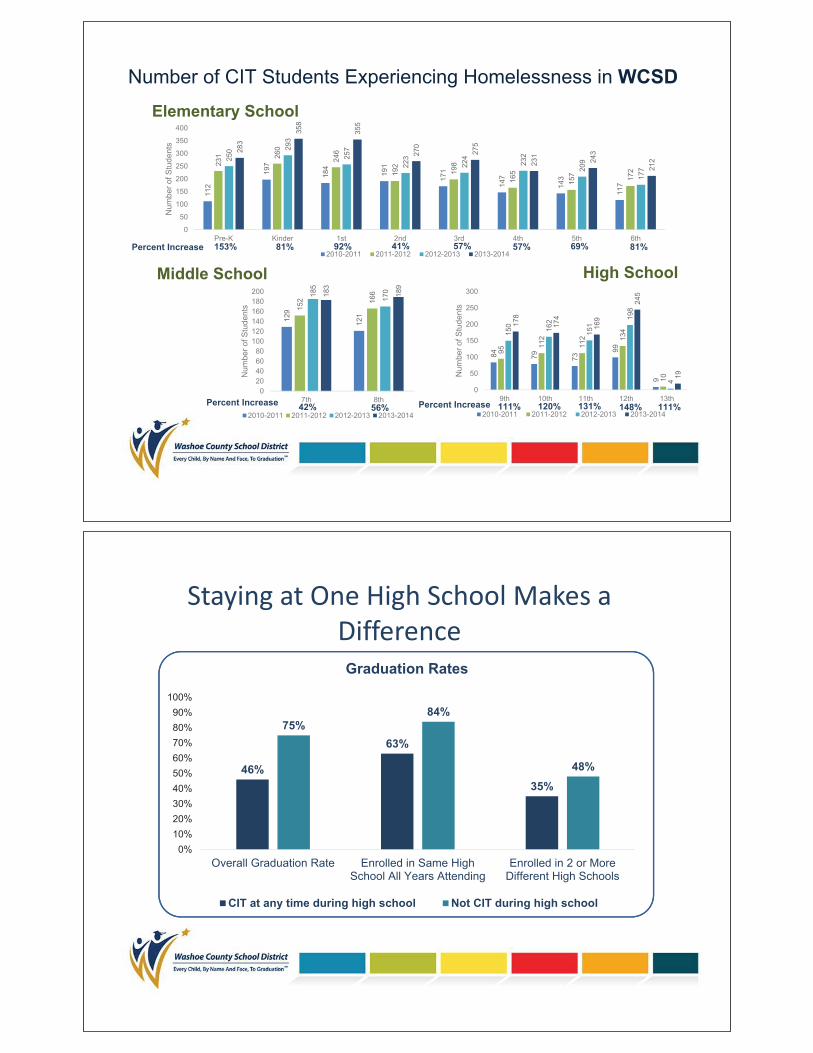
Homelessness is defined through the McKinney-Vento Act as individualswho lack a fixed, regular, or adequate nighttime residence.
Over the past four years, there has been an 82% increase in the numberof WCSD students identified as Children in Transition (CIT).
Transportation assistance for WCSD CIT students has doubled in the pastfour years, providing more stability and more opportunities for students tomaintain long-term relationships with school staff.
Services provided for WCSD CIT students include:o Free breakfast and luncho Clothing and hygiene packetso Uniformso Transportation (best interest of the child)o School/Sport Feeso Birth certificateso Shot recordso School supplieso Field trip cost supporto Tutors
In WCSD, there are proportionally more CIT students in early grades,especially Kindergarten and First grade.
o There is a marked achievement gap between CIT and non-CITstudents that begins at an early age. Thus the high percentage ofyoung CIT students is concerning.
Children in Transition are more likely to have an Individualized EducationPlan (IEP) than their peers.
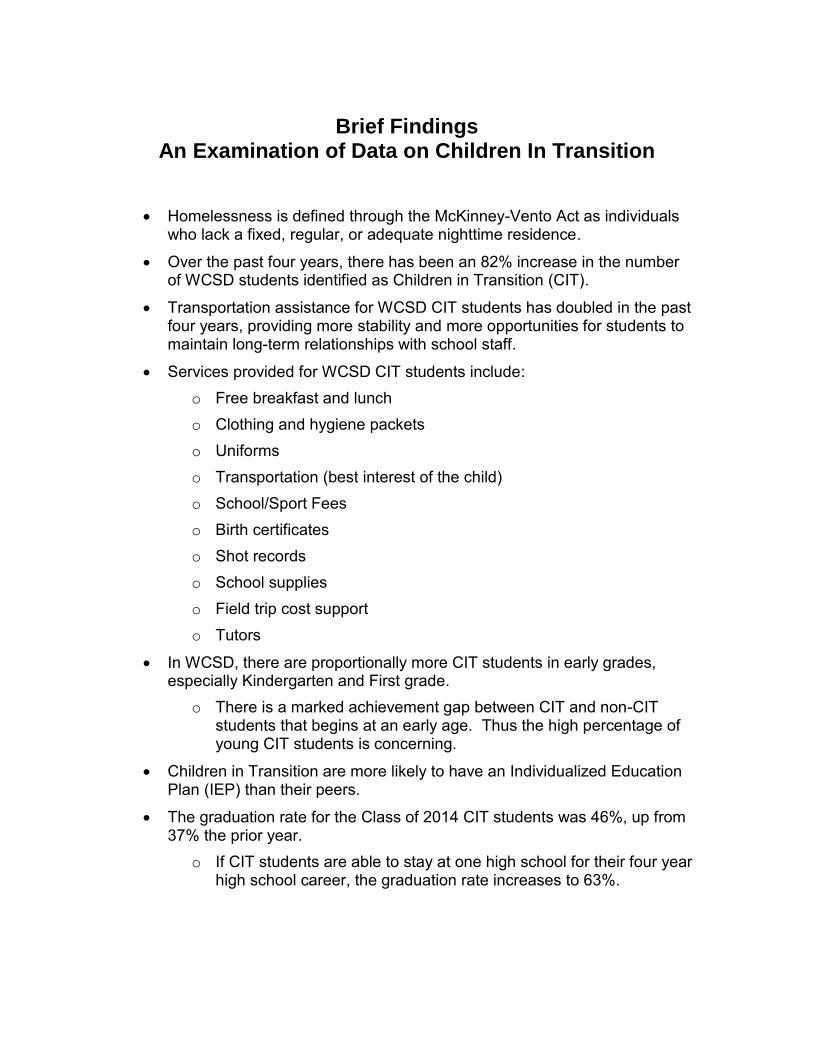
The graduation rate for the Class of 2014 CIT students was 46%, up from37% the prior year.
o If CIT students are able to stay at one high school for their four yearhigh school career, the graduation rate increases to 63%.
Data Summit Advanced Organizer:
What conclusions can I draw from the presented data/information?
What is the connection to other points along the pathway to graduation and post-secondary readiness?
What is missing or is needed to strengthen/complete this relationship or my understanding?

Equity, Access and Achievement Gaps
A look at Achievement
and Access Gaps
Today’s topics
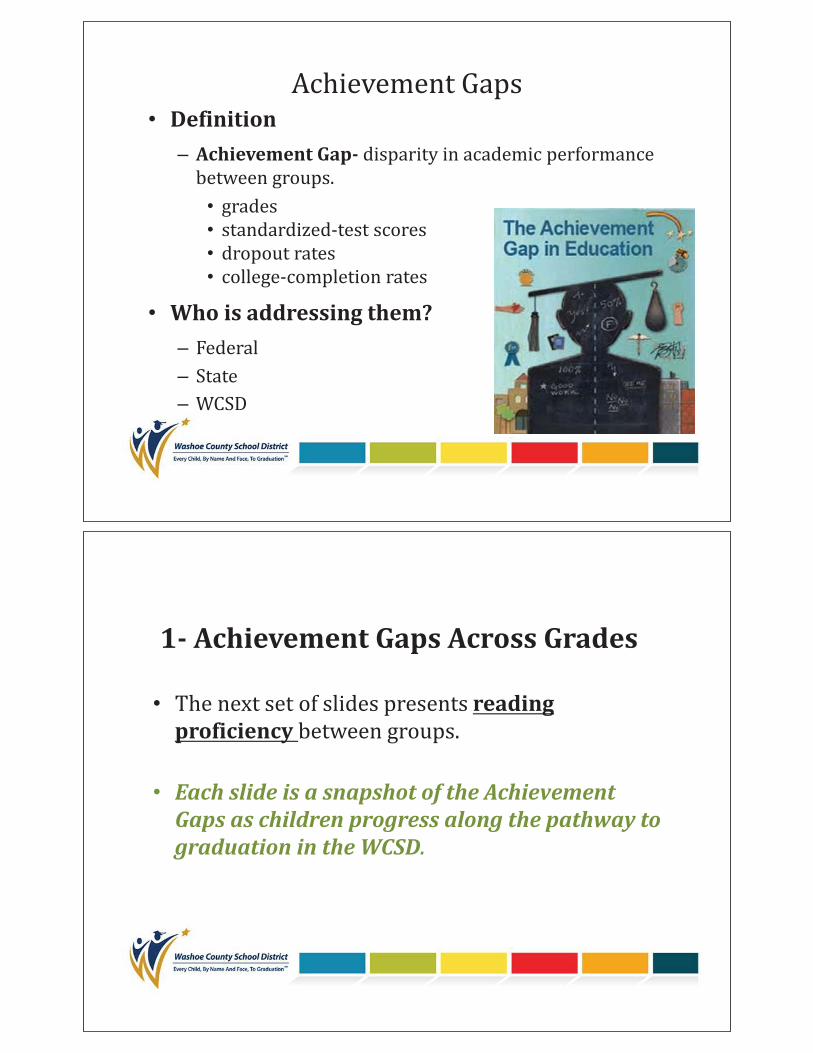
DefinitionAchievement Gap
Who is addressing them?
1 Achievement Gaps Across Grades
readingproficiency
Each slide is a snapshot of the AchievementGaps as children progress along the pathway tograduation in theWCSD.
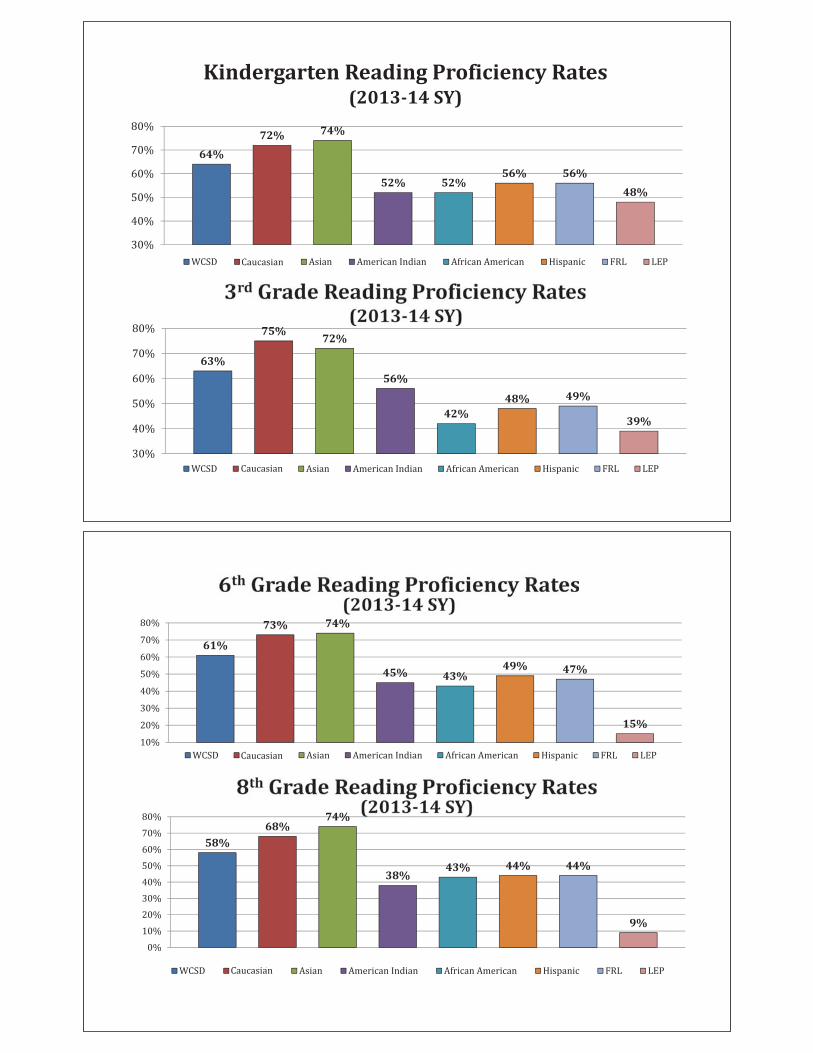
Kindergarten Reading Proficiency Rates(2013 14 SY)
64%
72% 74%
52% 52%56% 56%
48%
63%
75%72%
56%
42%48% 49%
39%
61%
73% 74%
45% 43%49% 47%
15%
58%68%
74%
38%43% 44% 44%
9%

So let’s look across grades for each groupAsian Achievement Gap
64%63% 61% 58%
74% 75% 74% 74%
K 3rd 6th 8th
Hispanic Achievement Gap
64% 63% 61% 58%56%
48% 49%44%
K 3rd 6th 8th
64% 63%61%
58%52% 56%
45%38%
K 3rd 6th 8th
64% 63% 61% 58%52%
42% 43% 43%
K 3rd 6th 8th
9th Grade Core Credit Attainment(2013 14 SY)
68%76%
90%
60% 64%55% 54%
44%
56%66% 70%
41% 41% 42% 41%
3%

Disproportionality
1%
9%
27%
1%
58%
5%0% 2% 1%
23%
1%
7%
24%
2%
61%
4%1% 0% 1%
23%
1%
8%
26%
2%
57%
5%1% 1% 1%
26%
0%
10%
20%
30%
40%
50%
60%
70%
80%WCSD Graduates AP/IB Completion Proportionality
(N = 9) (N = 150) (N = 472) (N = 43) (N = 1049) (N = 96) (N = 9) (N = 27) (N = 21) (N = 481)
Disproportionality is defined as the overrepresentation andunderrepresentation of a particular group of people in a particulargroup or system.
Disproportionality Cont.
3%2%
45%
7%
39%
4%1%
23%
15%
65%
2% 2%
45%
5%
40%
4%1%
22%
12%
57%
2% 2%
43%
6%
41%
5%1%
24%
13%
46%
WCSD Suspension Proportionality(Students receiving one or more in/out of school suspensions)
(N = 81) (N = 83) (N = 1892) (N = 264) (N = 1845) (N = 229) (N = 54) (N = 1059) (N = 559) (N = 2026)

What DoWe Notice
Take a few minutes and talk to the people next to you.
Discuss
56%
64%67%
47%
35%38%
13%
70%
78% 77%
49%54% 55%
16%
73%
80%86%
48%
60% 61%
26%
WCSD Caucasian Asian AmericanIndian
AfricanAmerican
Hispanic LEP
2 Grad Rate Across Time
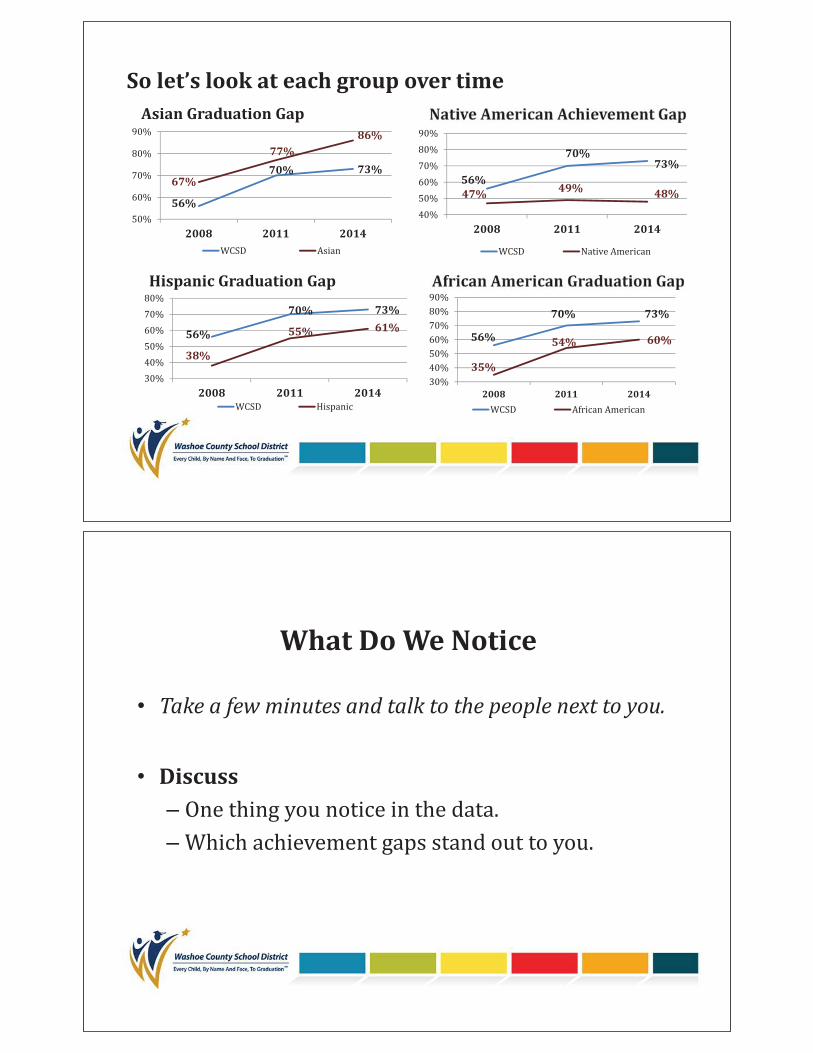
So let’s look at each group over time
56%
70% 73%67%
77%86%
2008 2011 2014
Asian Graduation Gap
56%
70%73%
47% 49% 48%
2008 2011 2014
Hispanic Graduation Gap
56%
70% 73%
38%
55% 61%
2008 2011 2014
56%
70% 73%
35%
54% 60%
2008 2011 2014
What DoWe Notice
Take a few minutes and talk to the people next to you.
Discuss

3 Additional data related to Achievement GAP
Climate Survey & Teacher/Educator Expectations
Parent Climate Survey Responses
Other “GAP” Measures: Parent Perceptions
Parent Survey Response Averages (High Schools)Measure District Caucasian Hispanic African
AmericanNative
American

Other “GAP” Measures: Student PerceptionsStudent Climate Survey Responses
Student Survey Response Averages (High Schools)Measure District Caucasian Hispanic African
AmericanNative
American
Teacher Perceptions

What DoWe Notice
Take a few minutes and talk to the people next to you.
Discuss
Action Steps

Conclusion

Brief Findings Equity: A Look at Achievement and Access Gaps
There are achievement gaps in Reading proficiency rates between racialand ethnic minority students as compared to the overall student populationin the WCSD.
The achievement gap between ethnic and racial minorities and the overallWCSD population increases as students progress through grades.
Racial and ethnic minority students are suspended at a disproportionaterate, with African American students being suspended most often ascompared to other demographics.
Many racial and ethnic minority groups are underrepresented in highschool AP/IB courses.
WCSD graduation rates from 2008 through 2014 indicate thatachievement gaps have decreased over time.
WCSD is actively addressing achievement gaps in various ways, includingbut not limited to, the creation of the Equity and Diversity Department andan Equity and Diversity taskforce, substantial training of school andCentral Office staff, and the inclusion of achievement gaps in the WCSDAccountability Framework.

Data Summit Advanced Organizer:
What conclusions can I draw from the presented data/information?
What is the connection to other points along the pathway to graduation and post-secondary readiness?
What is missing or is needed to strengthen/complete this relationship or my understanding?

Farewell CRT, Hello SBAC

CRT vs. Smarter Balanced

Claims – ELA and Mathematics
CRT vs. Smarter Balanced

CRT – Scale Scores Within Each Grade
Smarter Balanced –Continuous Vertical Scale
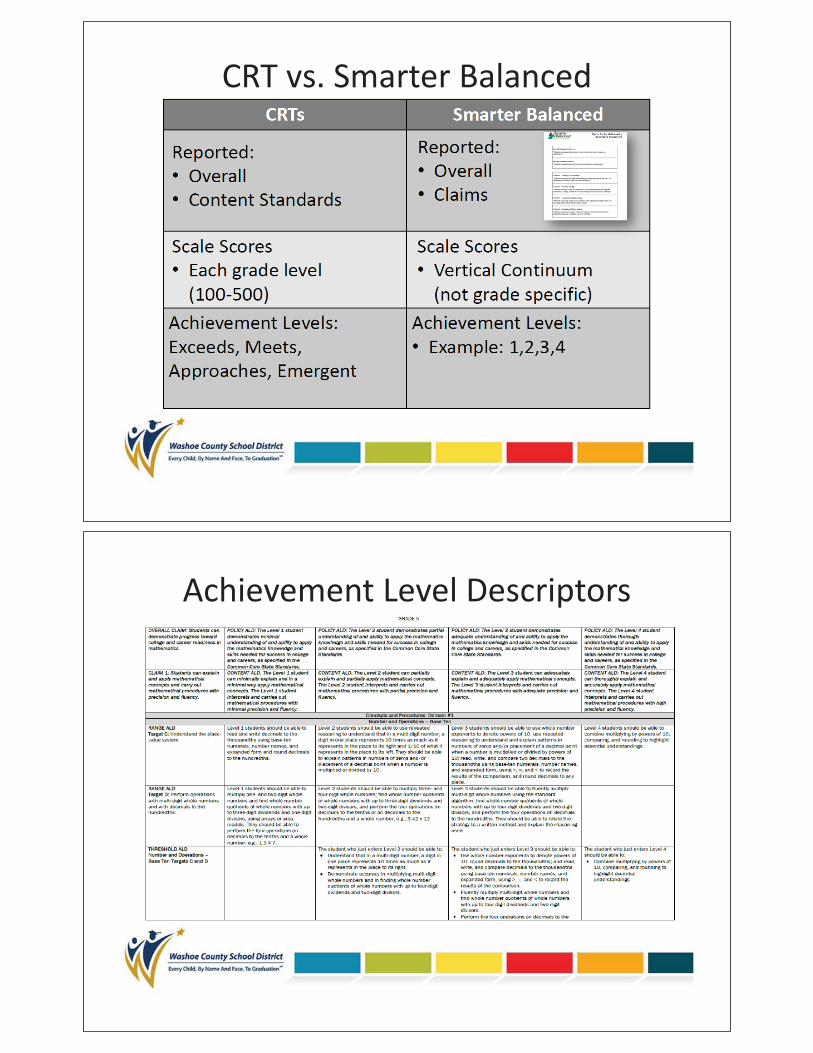
CRT vs. Smarter Balanced
Achievement Level Descriptors
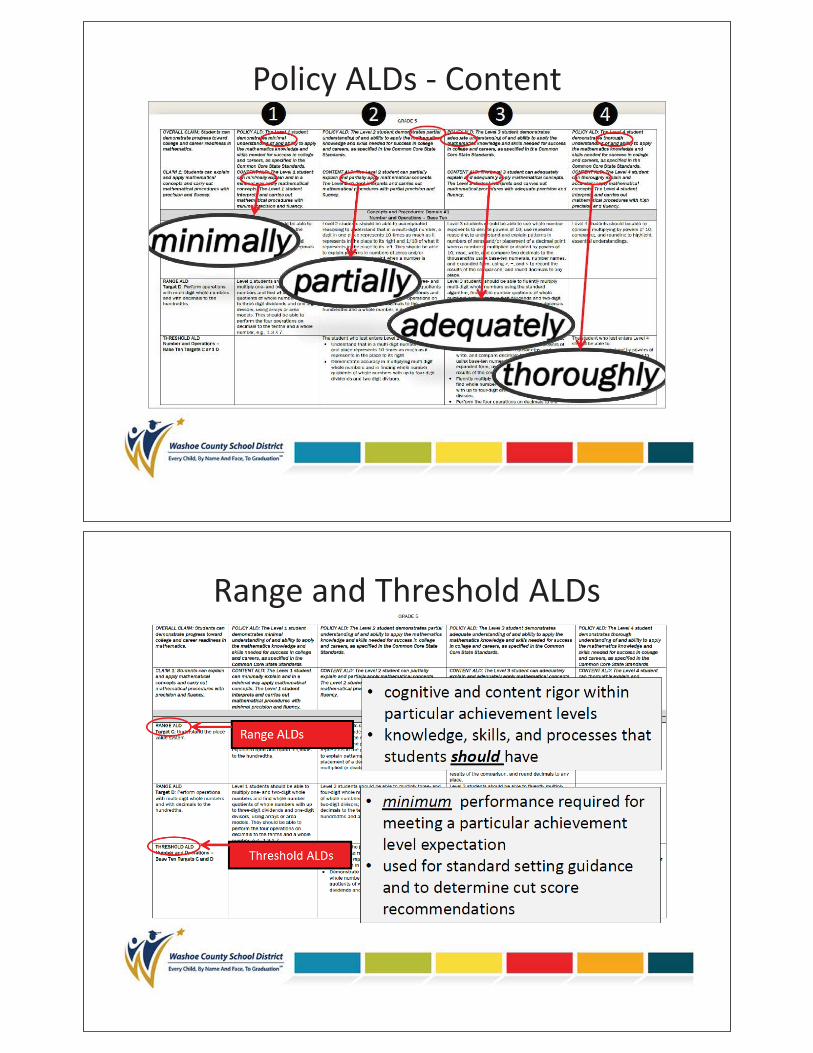
Policy ALDs Content
Range and Threshold ALDs

Smarter Balanced ALD’s …Linked to College Readiness
CRT Proficiency = College Readiness/

Additional Information…
http://www.doe.nv.gov/Boards_Commissions_Councils/State_Board_of_Education/2014/Meetings/December/Item4bJagenda/

References

1
FOR IMMEDIATE RELEASE Contact: Nov. 17, 2014 [email protected]
(657) 222-1257
Smarter Balanced States Approve Achievement Level Recommendations Inclusive, collaborative process collected input from thousands of educators and community
members using rigorous design; initial achievement levels will help teachers and parents monitor student progress and focus support in the classroom
OLYMPIA, WASH. (November 17, 2014) —Members of the Smarter Balanced Assessment Consortium have voted to approve initial achievement levels for the mathematics and English language arts/literacy (ELA) assessments that will be administered in 17 states and one territory this school year. The vote marks an important milestone in the development of the assessment system.
“These initial achievement levels were developed with input from thousands of educators and community members, reflecting a diverse cross-section of views on education. Moving forward, the achievement levels, along with scale scores that also will be reported, will help teachers and parents understand student performance and needs for support,” said Smarter Balanced Executive Director Joe Willhoft.
The achievement levels serve as a starting point for discussion about the performance of individual students and of groups of students in mathematics and English Language arts. There are other measures that students, teachers and parents can also use to help evaluate the academic progress of students and schools, such as scale scores, growth models, and portfolios of student work. The states also unanimously approved a position paper to provide broad guidelines for how the scores and achievement levels can be used and interpreted by state officials, parents, teachers and other stakeholders (see attached).
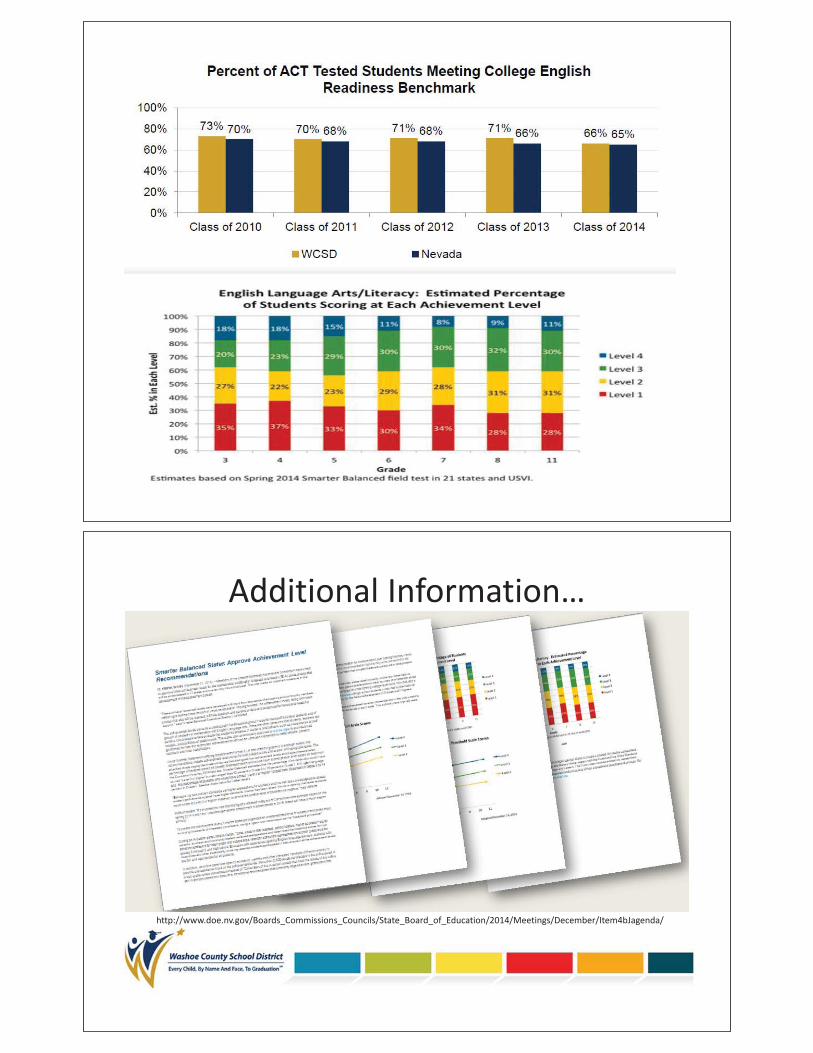
Since Smarter Balanced is offering assessments for both ELA and math for grades 3-8 and high school, the recommendations include achievement level scores for both subject areas and at each of those grade levels. The attached charts display the threshold scores that distinguish four achievement levels and display the estimated percentage of students across all Smarter Balanced states who would have scored at each level based on data from the Consortium’s spring 2014 field test. Smarter Balanced estimates that the percentage of students who would have scored “Level 3 or higher” in math ranged from 32 percent in Grade 8 to 39 percent in Grade 3. In English language arts, the percentage of students who would have scored “Level 3 or higher” ranged from 38 percent in Grade 3 to 44 percent in Grade 5. See the attached charts for further details.
“Because the new content standards set higher expectations for students and the new tests are designed to assess student performance against those higher standards, the bar has been raised. It’s not surprising that fewer students could score at Level 3 or higher. However, over time the performance of students will improve,” said Willhoft.
Willhoft added, “It’s important to note that the figures released today are a Consortium-wide estimate based on the spring 2014 Field Test. Once the operational assessment is administered in 2015, states will have a much clearer picture.”
To create the achievement levels, Smarter Balanced organized an unprecedented level of educator and public input, involving thousands of interested constituents, using a rigorous process known as the “bookmark procedure.”
2
During an in-person panel, held in Dallas, Texas, close to 500 teachers, school leaders, higher education faculty, parents, business and community leaders reviewed test questions and determined the threshold scores for four achievement levels for each grade and subject area. Member states had representatives at each grade level for grades 3 through 8 and high school. Educators with experience teaching English language learners, students with disabilities and other traditionally under-represented students participated to help ensure that the achievement levels are fair and appropriate for all students.
In addition, an online panel was open to educators, parents and other interested members of the community to provide unprecedented input on the achievement levels. More than 2,500 people participated in the online panel.
A cross-grade review committee composed of 72 members of the in-person panels then took the results of the online and in-person panels into account to develop recommendations that coherently aligned across grades and that reflected student progress from year to year.
As an additional step, Smarter Balanced engaged an external auditor, an Achievement Level Setting Advisory Panel and its standing Technical Advisory Committee to review the recommendations before they were presented to the states for approval. The auditor and both advisory panels certified that Smarter Balanced conducted a valid process that is consistent with best practice in the field.
In approving the Achievement Levels, Smarter Balanced member states relied primarily on the recommendations from the Achievement Level Setting process. Members also gave consideration to other sources of information about the general content readiness of high school students to engage in credit-bearing college-level work. This included a comprehensive body of research on college academic preparedness of high school students conducted by the National Assessment Governing Board (NAGB), the oversight body for the National Assessment of Educational Progress.
Over the coming months, member states will present these achievement level recommendations to the policy-making entities that have the authority to formally adopt achievement levels in each state. This authority most typically rests with the state board of education.
###
About Smarter Balanced
The Smarter Balanced Assessment Consortium brings together states to create a shared, innovative assessment system for mathematics and English language arts/literacy that is aligned with the Common Core State Standards and helps prepare students for success in college and careers. The Consortium involves educators, researchers, policymakers, and community groups in a transparent and consensus-driven assessment development process. For more information, please visit www.smarterbalanced.org.

3
Interpretation and Use of Scores and Achievement Levels
States in the Smarter Balanced Assessment Consortium (Smarter Balanced) will report scores on its assessments in several ways, which can serve different purposes for their stakeholders. Scale scores are the basic units of reporting. These scores, which fall along a continuous vertical scale (from approximately 2000 to 3000) that increases across grade levels, can be used to illustrate students’ current level of achievement and their growth over time in a relatively fine-grained fashion. When aggregated, these scores can also describe school- or district-level changes in performance on the tests and can measure gaps in achievement among different groups of students.
Smarter Balanced has also developed a set of initial, policy achievement level descriptors (ALDs) for English language arts/Literacy (ELA/Literacy) and mathematics that are aligned with the Common Core State Standards (CCSS) and the Smarter Balanced assessment claims. The purpose of these descriptors is to specify, in content terms, the knowledge and skills that students display at four levels of achievement (i.e., Level 1, Level 2, Level 3, and Level 4), which in some contexts may also be described qualitatively in terms such as “novice, developing, proficient, advanced” or others.1
Defining these levels of achievement (“Achievement Levels”) is a reporting feature that is federally required under the No Child Left Behind Act, and one that has become familiar to many educators. However, characterizing a student’s achievement solely in terms of falling in one of four categories is an oversimplification. Achievement Levels should serve only as a starting point for discussion about the performance of students and of groups of students. That is, the Achievement Levels should not be interpreted as infallible predictors of students’ futures. They must continuously be validated, and should be used only in the context of the multiple sources of information that we have about students and schools. Achievement level descriptors do not equate directly to expectations for “on-grade” performance; rather, they represent differing levels of performance for students within a grade level. Additionally, the Achievement Levels do not preclude or replace other methods of evaluating assessment results, including measures of year-to-year growth that use the underlying scale scores.
Although the Achievement Level Descriptors are intended to aid interpretation of Achievement Levels, they will be less precise than scale scores for describing student gains over time or changes in achievement gaps among groups, since they do not reveal changes
1 The Achievement Level Descriptors were developed based on the feedback of reviewers who engaged in a validation process based on examining the Common Core State Standards in each content area and the items on the examination. Additional research will be needed to validate the achievement level descriptors in relation to the actual success rates of students when they enter college and careers.

4
of student scores within the bands defined by the achievement levels. Furthermore, there is not a critical shift in student knowledge or understanding that occurs at a single cut score point. Thus, the achievement levels should be understood as representing approximations of levels at which students demonstrate mastery of a set of concepts and skills, and the scale scores just above and below an achievement level as within a general band of performance.
As Smarter Balanced states consider these Achievement Levels, they will continue to investigate and apply a variety of methods of analyzing and reporting the data that provide information to their students, parents and teachers, including but not limited to student and student subgroup averages, medians, and other descriptive statistics that utilize the underlying vertical scale.
The Achievement Level Descriptors presented here are linked to an operational definition of college content-readiness to inform score interpretation for high schools and colleges. In particular, a score at or above “Level 3” in 11th grade is meant to suggest conditional evidence of readiness for entry-level, transferable, credit-bearing college courses. Since college readiness encompasses a wide array of knowledge, skills, and dispositions, only some of which can be measured by the Smarter Balanced assessments, “college readiness” in this context is defined as “content-readiness” in the core areas of ELA/Literacy and mathematics.
High schools may combine scores at 11th grade with additional data (courses completed, grades, portfolios, performance assessments, other test data) to determine appropriate courses of study and supports for students in the 12th grade. Similarly, as colleges interpret scores on Smarter Balanced assessments, they are encouraged to evaluate additional data (courses completed, grades, portfolios, performance assessments) to determine admissions, advisement, and placement in developmental or credit-bearing courses.
Smarter Balanced does not yet have a parallel operational definition and framework for career readiness .
Adopted November 14, 2014

5
2300
2350
2400
2450
2500
2550
2600
2650
2700
2750
2800
3 4 5 6 7 8 9 10 11
Threshold Scale Score
Grade
Mathema1cs: Threshold Scale Scores
Level 4
Level 3
Level 2
Adopted November 14, 2014
32% 27% 35% 35% 36% 38% 40%
29% 36% 32% 32% 31% 30% 27%
27% 24% 18% 19% 20% 19% 22%
12% 13% 15% 14% 13% 13% 11%
0%
10%
20%
30%
40%
50%
60%
70%
80%
90%
100%
3 4 5 6 7 8 11
Est. % in Each Level
Grade
Mathema1cs: Es1mated Percentage of Students Scoring at Each Achievement Level
Level 4
Level 3
Level 2
Level 1
Es=mates based on Spring 2014 Smarter Balanced field test in 21 states and USVI.

6
2300
2350
2400
2450
2500
2550
2600
2650
2700
2750
2800
3 4 5 6 7 8 9 10 11
Threshold Scale Score
Grade
English Language Arts/Literacy: Threshold Scale Scores
Level 4
Level 3
Level 2
Adopted November 14, 2014
35% 37% 33% 30% 34% 28% 28%
27% 22% 23% 29%
28% 31% 31%
20% 23% 29% 30% 30% 32% 30%
18% 18% 15% 11% 8% 9% 11%
0%
10%
20%
30%
40%
50%
60%
70%
80%
90%
100%
3 4 5 6 7 8 11
Est. % in Each Level
Grade
English Language Arts/Literacy: Es1mated Percentage of Students Scoring at Each Achievement Level
Level 4
Level 3
Level 2
Level 1
Es=mates based on Spring 2014 Smarter Balanced field test in 21 states and USVI.

Final Threshold Scores for Four Achievement Levels
Math Scale Score Thresholds
Grade Level 1-to-2 Level 2-to-3 Level 3-to-4
3 2381 2436 2501
4 2411 2485 2549
5 2455 2528 2579
6 2473 2552 2610
7 2484 2567 2635
8 2504 2586 2653
ELA Scale Score Thresholds
Grade Level 1-to-2 Level 2-to-3 Level 3-to-4
3 2367 2432 2490
4 2416 2473 2533
5 2442 2502 2582
6 2457 2531 2618
7 2479 2552 2649
8 2487 2567 2668

Brief Findings Farewell CRT, Hello SBAC
In 2014, the Nevada State Board of Education adopted the newachievement cut scores proposed by the Smarter Balanced AssessmentConsortium (SBAC). Results from the 2013-2014 SBAC field test indicatethat fewer students are now scoring in the top two quartiles of the newachievement levels as compared to the Criterion Referenced Test.
It will be critical to clearly communicate what the new SBAC scores meanto avoid misinterpretations of the data. SBAC’s achievement leveldescriptors are aligned to new standards. These new achievementdescriptors are designed to measure “college-content readiness”, which islikely to be a more rigorous level of achievement than the CRTrepresented.
SBAC results may parallel what we see on the ACT, another assessmentof students’ college readiness. Of WCSD students taking the ACT in 2014,30% met all four college readiness benchmarks, higher than the statewiderate (26%). These ACT college readiness rates are much lower than ourCRT proficiency rates, which might indicate that students who used toscore at a “Meets Standard” level on CRT may score below the new“Meets Standard” level on SBAC, as the latter indicates college readinesswhile the former indicates more basic proficiency.
As stated by Dr. Joe Willhoft, Executive Director for the Smarter BalancedAssessment Consortium, “Because the new content standards set higherexpectations for students and the new tests are designed to assessstudent performance against those higher standards, the bar has beenraised. It’s not surprising that fewer students could score at Level 3 orhigher. However, over time the performance of students will improve.”
Smarter Balanced assessment results will be reported using scale scoresas well as achievement levels. Results will be reported at both an overalllevel as well as by claims. These results will be used, along with othermeasures, to inform instructional decisions and evaluate student progresstoward college/career readiness.

Data Summit Advanced Organizer:
What conclusions can I draw from the presented data/information?
What is the connection to other points along the pathway to graduation and post-secondary readiness?
What is missing or is needed to strengthen/complete this relationship or my understanding?

The High School Pathway

Cohort Graduation Rate
Cohort Graduation Rate Trends by Ethnicity
2014 N Size 4766 69 261 1632 148 2410 204 42

Cohort Graduation Rate Trends by Special Programs
2014 N Size 4766 1726 564 302 360
Honors and Advanced Diplomas
Standard Diploma Requirements
Advanced Diploma Requirements
Honors Diploma Requirements
22.5 credits earned16 in required courses plus 6.5 in electives
Passing score on the Nevada High School Proficiency Exam
All of the standard diploma requirements plus:An additional 1.5 credits (24 credits earned)1 additional math credit and 1 additional science creditMinimum 3.25 GPA (grade point average)
All of the standard diploma requirements plus:An additional 1.5 credits (24 credits earned)
20 credits in required courses, 4 electives8 of the required credits must be in honors, AP, and/or IB courses2 of the required credits must be in the same world language
Minimum 3.40 GPA (grade point average)

Honors and Advanced Diplomas
%of Grads % of Grads % of Grads % of Grads % of Grads
46% 45% 48% 49% 50%54% 55% 52% 51% 50%
Standard and Adult DiplomasHonors and Advanced Diplomas
17441705162517301712
Graduates Enrolling in College ImmediatelyAfter High School
State and national rates are not available for 2014
313763%
WCSD
High School GraduatesCollege Going Rate
20102187316369%
College Enrollments20132137332164%
20142157347462%
20112074317065%
20121968

Percent of Graduates Completing AP/IB/CTE or Dual CreditCourses by Ethnicity
2014 N Size 3474 33 224 996 89 1940 163 29
Percent of 2014 Graduates Completing AP/IB/CTE or DualCredit Courses by Gender
Female N Size 1837 17 95 550 46 1026 87 16 581 62 44
Male N Size 1637 16 129 446 43 914 76 13 451 93 36

Percent of 2014 Grade 10 Students Who Earned the Full 7Core Credits by the End of 10th Grade by Gender
Female N Size 2278 30 110 812 43 1126 129 28 845 145 78
Male N Size 2317 36 135 867 65 1086 101 27 914 297 147
Remedial College Placement and EnrollmentWCSD 2013 Graduates Enrolled in the Nevada System of Higher Education (NSHE)*
*NSHE Institutions: UNLV, UNR, NV State College, College of Southern NV, Great Basin College, TMCC, Western NV College
Source: https://www.nevada.edu/ir/Documents/RemedialEnrollment/2013_14_Remedial_Placement_&_Enrollment_Report.pdf

College Persistence: WCSD Grads, Other Nevada High SchoolGrads and All 1st Time Freshmen Attending UNR

Brief Findings The High School Pathway
The high school graduation rate has steadily increased over the past threeyears, rising to an all-time high of 73% in 2014, with 3,474 graduates.
Nearly all racial/ethnic and special program groups showed similargraduation rate increases. However, there are still significant achievementgaps: Only 61% of Hispanics, 60% of African Americans and 60% ofstudents receiving free or reduced-price lunch graduated in 2014.Achievement gaps for English-language learners and students on anIndividualized Education Plan are even larger, with 26% and 27%graduation rates, respectively, in 2014.
An increased level of academic achievement has accompanied theincreased graduation rate. In 2014, half of our graduates earned honors oradvanced diplomas, compared to 46% in 2010.
Overall, 58% of 2014 graduates completed one or more AP, IB, CTE ordual credit college-level courses. More female graduates (64%) thanmales (53%) completed these higher-level courses.
Female students were also more likely than male students to have earnedthe full seven core credits in math, English, science and social studies bythe end of 10th grade, with 63% of female and 51% of male 10th gradersreaching this standard in 2014.
Sixty-two percent of 2014 graduates enrolled in college in the summer orfall immediately following graduation. This is slightly lower than the 2012and 2013 college-going rates.
Of the WCSD 2013 graduates who enrolled in college within the Nevada
System of Higher Education, 56% placed into or enrolled in remedial-levelcourses; 26% required remediation in both English and math, 26%required remediation in math only, and 4% in English only.
WCSD graduates enrolled at UNR were more likely to continue beyondtheir second semester than other Nevada high school graduates, and allUNR first-time freshmen, with 85% of WCSD 2013 graduates persistingbeyond the second semester, compared to 78% of other Nevada highschool graduates, and 82% of all UNR first-time freshmen enrolling fall2013.


Data Summit Advanced Organizer:
What conclusions can I draw from the presented data/information?
What is the connection to other points along the pathway to graduation and post-secondary readiness?
What is missing or is needed to strengthen/complete this relationship or my understanding?

Data Summit Advanced Organizer:
What conclusions can I draw from the presented data/information?
What is the connection to other points along the pathway to graduation and post-secondary readiness?
What is missing or is needed to strengthen/complete this relationship or my understanding?

Data Summit Advanced Organizer:
What conclusions can I draw from the presented data/information?
What is the connection to other points along the pathway to graduation and post-secondary readiness?
What is missing or is needed to strengthen/complete this relationship or my understanding?

Data Summit Advanced Organizer:
What conclusions can I draw from the presented data/information?
What is the connection to other points along the pathway to graduation and post-secondary readiness?
What is missing or is needed to strengthen/complete this relationship or my understanding?
