waste activated sludge as a feedstock and inoculum of...
TRANSCRIPT

Waste Activated Sludge as a Feedstock and Inoculum for
Anaerobic Digestion
Candice Prince 2012 BioEnergy and Sustainability School
August 7, 2012

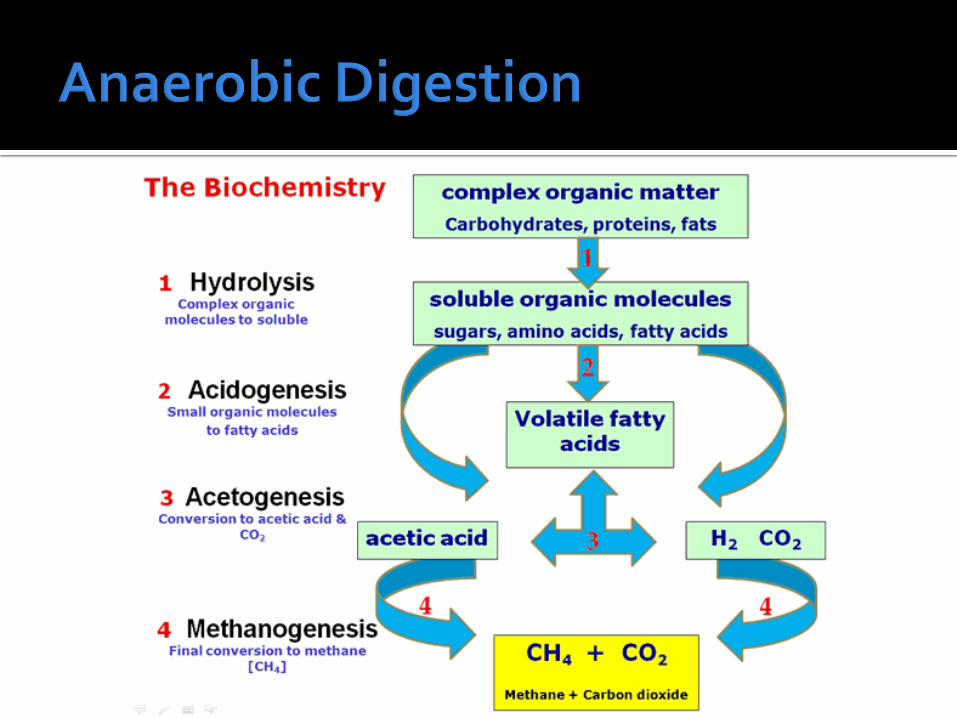
WAS: Excess biosolids produced in the activated sludge process of waste water treatment

WAS management accounts for 60% of the total operating cost
Current disposal methods:
Land application
Landfill
Incineration
Anaerobic Digestion

The University of Florida treats its own wastewater
3 million – 5 million gallons/day
WAS picked up once a week by GRU
Treated and land applied
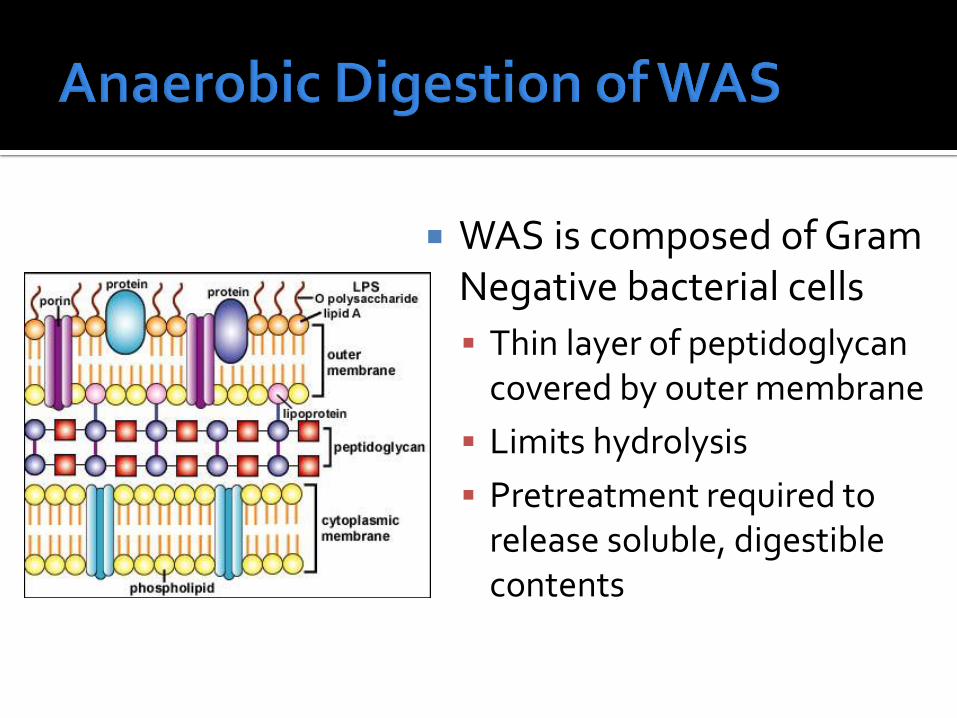
WAS is composed of Gram Negative bacterial cells
Thin layer of peptidoglycan covered by outer membrane
Limits hydrolysis
Pretreatment required to release soluble, digestible contents

Waste water treatment: anaerobic and aerobic conditions
Methanogens: anaerobic conditions If methanogens are present, WAS could
inoculate itself Eliminate need for external inoculum lower
operating cost

Test pretreatment methods of WAS and compare levels of cell destruction
Determine the potential of using WAS as an inoculum for anaerobic digestion

Pretreatment of WAS
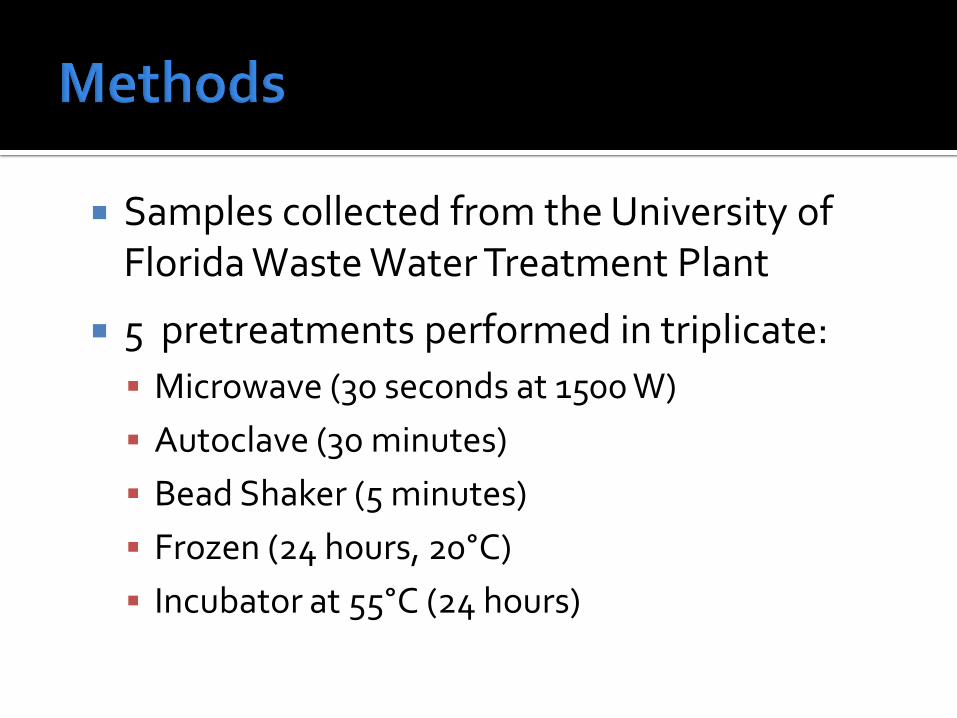
Samples collected from the University of Florida Waste Water Treatment Plant
5 pretreatments performed in triplicate:
Microwave (30 seconds at 1500 W)
Autoclave (30 minutes)
Bead Shaker (5 minutes)
Frozen (24 hours, 20°C)
Incubator at 55°C (24 hours)

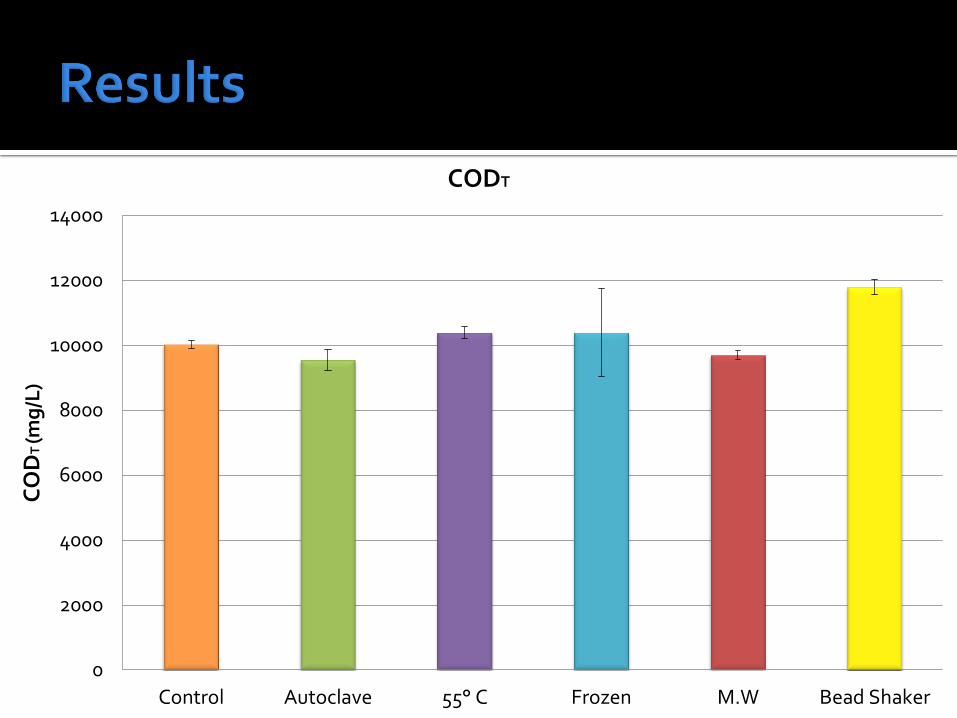
Total Chemical Oxygen Demand (CODT) measured
Samples (triplicate) diluted 1:10 with deionized water
Soluble Chemical Oxygen Demand (CODS)
measured
Centrifuged at 4,000 rpm for 30 minutes, supernatant tested
Microscopic examination for fractured cells
0
2000
4000
6000
8000
10000
12000
14000
Control Autoclave 55° C Frozen M.W Bead Shaker
CO
DT
(mg
/L)
CODT

0
200
400
600
800
1000
1200
1400
1600
Control Autoclave 55° C Frozen M.W Bead Shaker
CO
Ds
(mg
/L)
CODs

Control (Untreated WAS)
Intact cells under phase contrast illumination
500x 1250x

Pretreatment: Autoclave for 30 minutes
500x 1250x
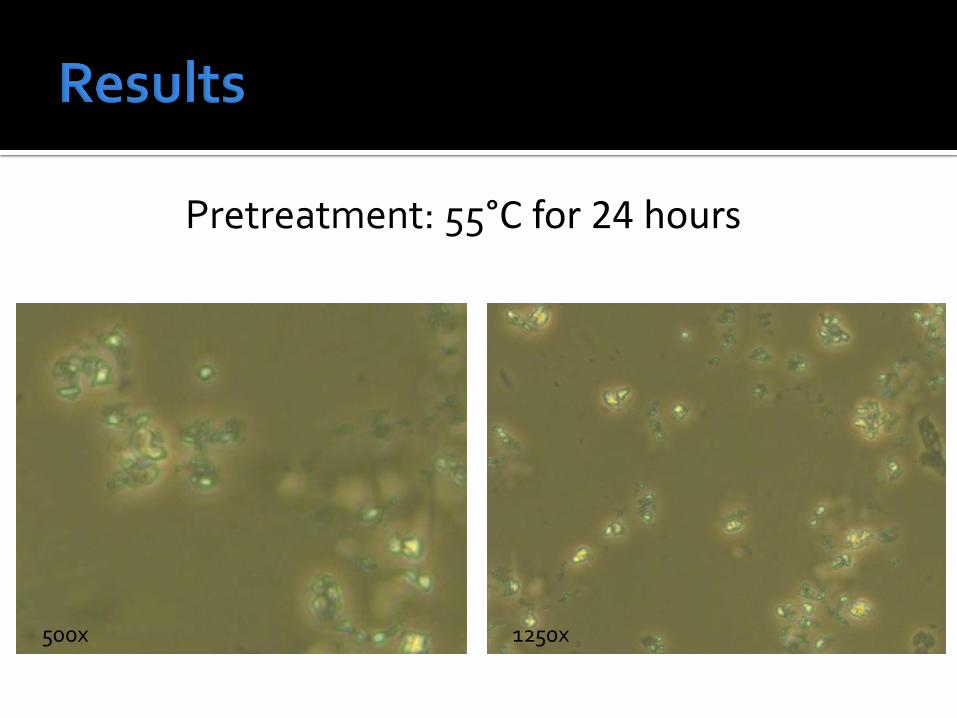
Pretreatment: 55°C for 24 hours
500x 1250x

Pretreatment: Frozen for 24 hours
500x 1250x

Pretreatment: Microwaved for 30 seconds (1500 W)
500x 1250x

Pretreatment: Bead Shaker for 5 minutes
500x 1250x

WAS as an Inoculum

Incubation Test:
WAS and Dairy Manure used to digest glucose and cellulose
Incubated at 35°C for 16 days
Biochemical Methane Potential (BMP) assays measured
Inocula Substrate WAS (200 mL) Glucose (0.4 g)
Cellulose (0.4 g)
Dairy Manure (200 mL) Glucose (0.4 g)
Cellulose (0.4 g)

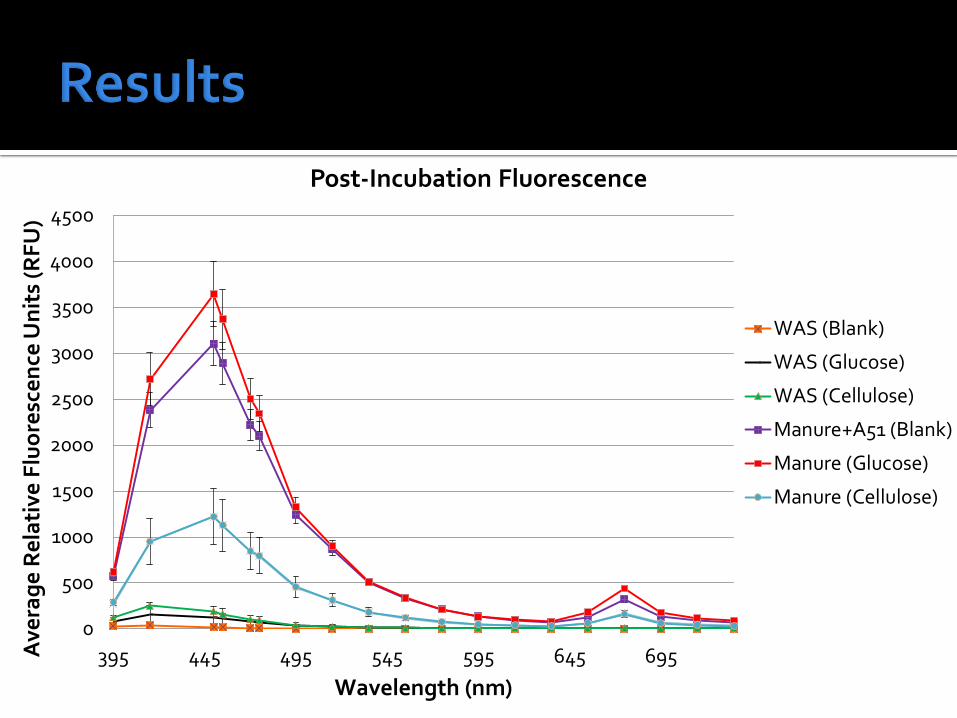
pH measured after incubation test A fluorospectrometer (Nanodrop 3300) was
used for methanogen detection before and after incubation test
Methanogens fluoresce blue (F420 Coenzyme)
2ɥL of sample exposed to UV light and fluorescence recorded at 470nm

0
20
40
60
80
100
120
140
160
0 2 4 6 8 10 12 14 16 18
Cu
mu
lati
ve A
vera
ge
(m
L/g
VS
)
Day of Incubation
Methane Production from Glucose
WAS
Manure
0
20
40
60
80
100
120
140
0 2 4 6 8 10 12 14 16 18
Cu
mu
lati
ve A
vera
ge
(m
L/g
VS
)
Day of Incubation
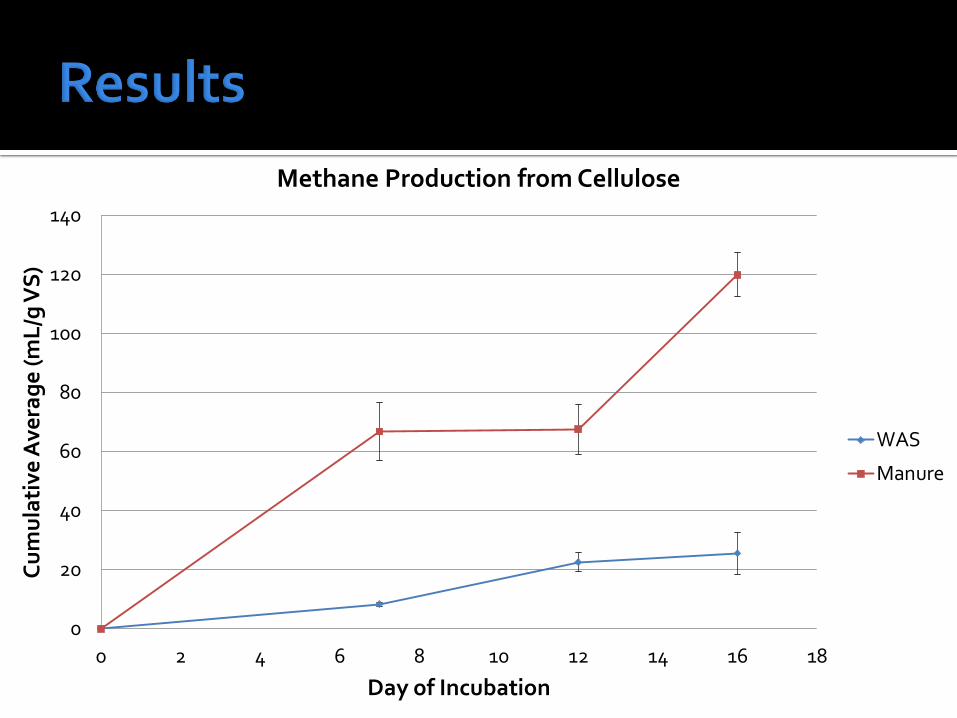
Methane Production from Cellulose
WAS
Manure

0
1
2
3
4
5
6
7
8
WAS Blank WASGlucose
WASCellulose
DairyManure
Blank
DairyManureGlucose
DairyManure
Cellulose
pH
Average pH of Samples

0
500
1000
1500
2000
2500
395 445 495 545 595 645 695
Re
lati
ve F
luo
resc
en
ce U
nit
s (R
FU
s)
Wavelength (nm)
Preliminary Fluorescence
Manure (Avg.)
WAS (Avg.)
0
500
1000
1500
2000
2500
3000
3500
4000
4500
395 445 495 545 595 645 695Ave
rag
e R
ela
tive
Flu
ore
sce
nce
Un
its
(RF
U)
Wavelength (nm)
Post-Incubation Fluorescence
WAS (Blank)
WAS (Glucose)
WAS (Cellulose)
Manure+A51 (Blank)
Manure (Glucose)
Manure (Cellulose)

WAS Pretreatment:
Cell lysis achieved under pretreatments
The autoclave was the best form of pretreatment, followed by heating at 55°C
WAS as an inoculum:
Not as effective as the control
Became rapidly too acidic

WAS Pretreatment:
Optimization of pretreatment techniques
Comparison of energy requirements for each pretreatment
WAS as an Inoculum
Determine optimal loading rate
Full scale testing using pretreated W.A.S. as a feedstock
Any questions?