waste and recycling characterization results
TRANSCRIPT
Waste and Recycling Characterization Results
February 13, 2020
Resource Conservation Council
Scott Pasternak

► Study methodology changes between 2018 and 2019
• Two cities unable to participate in 2019
• Included hand-sorting of recycling in 2019
• Added e-commerce OCC, pizza boxes, and polypropylene (#5
plastic) categories to provide additional perspective
2
Waste Characterization Study Methodologies
2018 2019
Participating Cities 10 8
Trash Samples 50 49
Recycling SamplesNone; used MRF
audit data44
Material Categories 31 34

3
Participating Cities Involvement
Cities
Dallas
Fort Worth
Arlington
Garland
Grand Prairie
Irving*
Frisco
Mesquite
Allen*
Weatherford
*unavailable to participate in 2019 sorting event
► Collected samples and tracked pickups
► Transported and delivered samples
► Represented a range of solid waste collection
programs varying by
• Size of program
• Set out type (e.g. cart, bags)
• Collection frequency (e.g. weekly, every
other week)

4
Waste Delivery

5
Hand-Sorting Material

6
Fines Screens

7
Weight Data Collection

8
Sorting Bins From Participating Cities

►Regional analysis replicated 2018 study plus hand-
sorted recycling to provide
• Waste and recycling composition
• Contamination rate
• Capture rate
• Value of material disposed
►Hand-sorting recycling allowed additional analysis
on participating cities including
• Individual waste and recycling composition
• Participating cities’ capture rate
9
Waste and Recycling Characterization Data Analysis

1 0
Data Analysis Limitations
Year over Year Comparison
• 2018 recycling data based on MRF audits
• 2019 recycling data based on hand-sort
• Cannot directly compare region-wide and participating cities capture rates
Extrapolating Data
• Individual city composition / capture rate cannot be extrapolated due to small sample size
• Hand-sorted recycling contamination higher than MRF audits
Effectiveness of Regional
Campaign
• Behavior change requires sustained campaign
• Individual cities adopting campaign critical
• Behavior change occurs at the source of recycling

1 1
2019 Regional Garbage Composition
Paper 19%
Plastic16%
Metal3%
Glass5%
Organics50%
C&D1%
Problem Materials2%
Other4%
Note: see handout for detailed waste composition profile

1 2
2019 Regional Recycling Composition
Paper 50%
Plastic17%
Metal4%
Glass16%
Organics10%
C&D1%
Problem Materials1% Other
1%
Regional contamination rate estimated at 24%. Included material categories
• Non-recyclable OCC• Other non-recyclable paper• Non-recyclable plastic*• Non-recyclable glass• Organics*• C&D• Problem material• Fines and other organics
*higher percentage than typical MRF audit due to material category differences and handling
Note: see handout for detailed waste composition profile
1 3
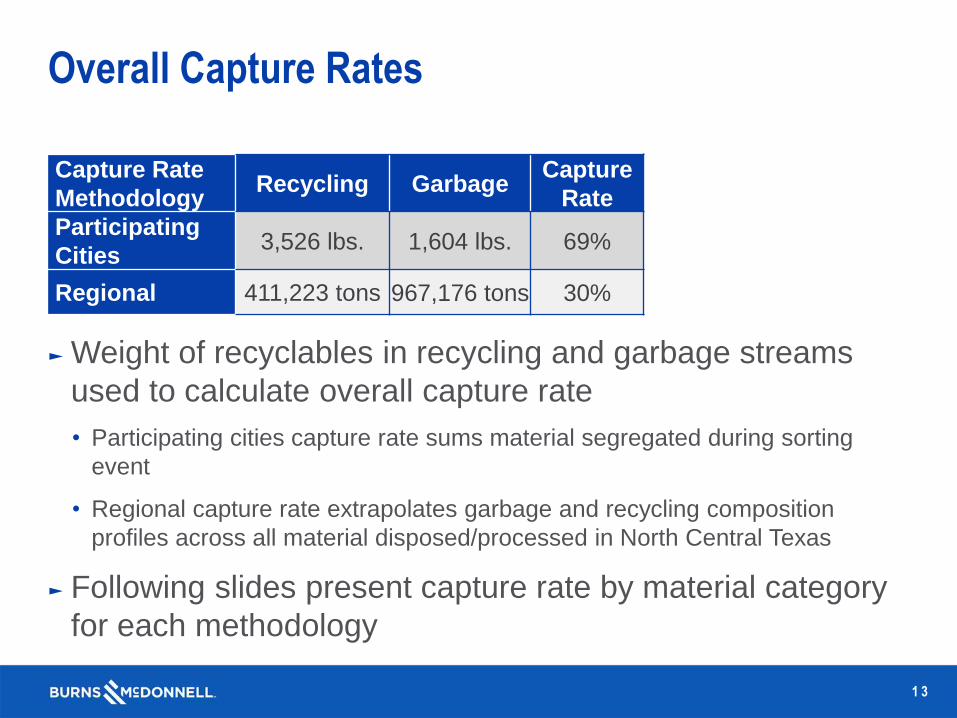
Overall Capture Rates
Capture Rate
MethodologyRecycling Garbage
Capture
Rate
Participating
Cities3,526 lbs. 1,604 lbs. 69%
Regional 411,223 tons 967,176 tons 30%
► Weight of recyclables in recycling and garbage streams
used to calculate overall capture rate
• Participating cities capture rate sums material segregated during sorting
event
• Regional capture rate extrapolates garbage and recycling composition
profiles across all material disposed/processed in North Central Texas
► Following slides present capture rate by material category
for each methodology

1 4
2019 Participating Cities Capture Rate
Recyclable Material2019 Participating Cities
Capture Rate
Recyclable OCC 86%
Mixed Paper 65%
PET Containers 56%
HDPE Containers - Natural 65%
HDPE Containers - Colored 61%
#3-#7 Containers 35%
Aluminum Used Beverage
Containers63%
Ferrous Metal Food Containers 44%
Recyclable Glass 68%
Note: figures calculated by compiling total weight of material segregated at the sorting event – does not represent region-wide capture rate
1 5
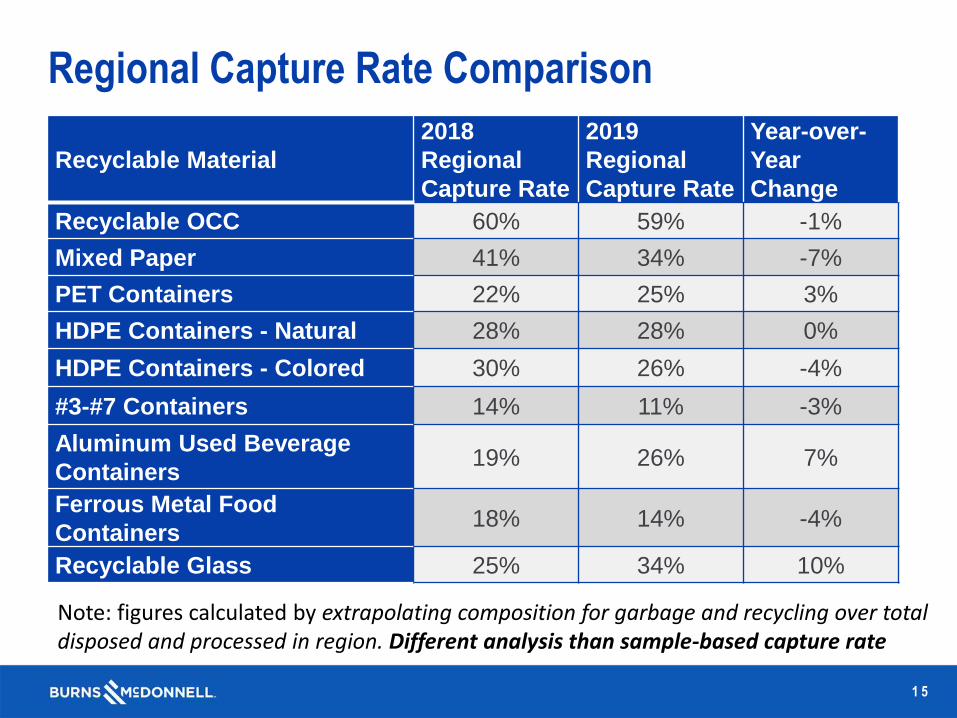
Regional Capture Rate Comparison
Recyclable Material
2018
Regional
Capture Rate
2019
Regional
Capture Rate
Year-over-
Year
Change
Recyclable OCC 60% 59% -1%
Mixed Paper 41% 34% -7%
PET Containers 22% 25% 3%
HDPE Containers - Natural 28% 28% 0%
HDPE Containers - Colored 30% 26% -4%
#3-#7 Containers 14% 11% -3%
Aluminum Used Beverage
Containers19% 26% 7%
Ferrous Metal Food
Containers18% 14% -4%
Recyclable Glass 25% 34% 10%
Note: figures calculated by extrapolating composition for garbage and recycling over total disposed and processed in region. Different analysis than sample-based capture rate
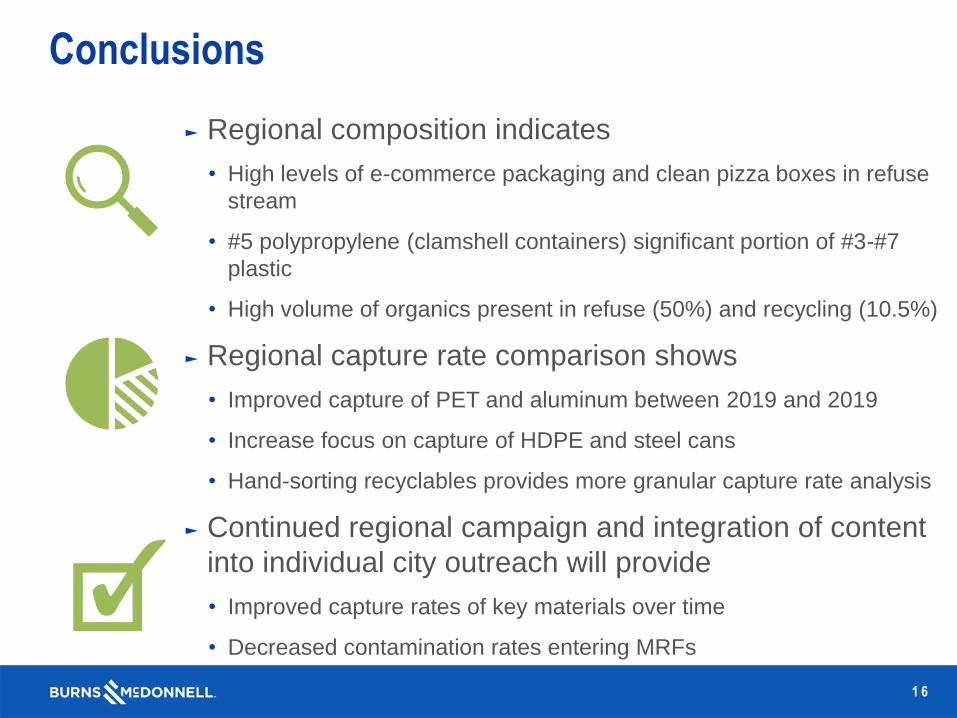
► Regional composition indicates
• High levels of e-commerce packaging and clean pizza boxes in refuse
stream
• #5 polypropylene (clamshell containers) significant portion of #3-#7
plastic
• High volume of organics present in refuse (50%) and recycling (10.5%)
► Regional capture rate comparison shows
• Improved capture of PET and aluminum between 2019 and 2019
• Increase focus on capture of HDPE and steel cans
• Hand-sorting recyclables provides more granular capture rate analysis
► Continued regional campaign and integration of content
into individual city outreach will provide
• Improved capture rates of key materials over time
• Decreased contamination rates entering MRFs
Conclusions
1 6

Questions?
Scott Pasternak
Burns & McDonnell
512-872-7141
Eric Weiss
Burns & McDonnell
512-975-7873
1 7
