waste management project contingency analysis · pdf filewaste management project contingency...
TRANSCRIPT
DOE/FETC-99/1100
Waste Management Project Contingency Analysis
Edward L. Parsons, Jr.
Center for Acquisition and Business Excellence
August 1999
U.S. Department of EnergyFederal Energy Technology Center
Pittsburgh, PennsylvaniaMorgantown, West Virginia
FETC’s Customer Service Line: (800)553-7681FETC’s Homepage: http://www.fetc.doe.gov/
2
Disclaimer
This report was prepared as an account of work sponsored by an agency of the UnitedStates Government. Neither the United States Government nor any agency thereof, nor any oftheir employees, makes any warranty, express or implied, or assumes any legal liability orresponsibility for the accuracy, completeness, or usefulness of any information, apparatus,product, or process disclosed, or represents that its use would not infringe privately ownedrights. Reference therein to any specific commercial product, process, or service by tradename, trademark, manufacturer, or otherwise does not necessarily constitute or imply itsendorsement, recommendation, or favoring by the United States Government or any agencythereof. The views and opinions of authors expressed therein do not necessarily state or reflectthose of the United States Government or any agency thereof.
Available to DOE and DOE contractors from the Office of Scientific and TechnicalInformation, P.O. Box 62, 175 Oak Ridge Turnpike, Oak Ridge, TN 37831; prices areavailable by phone: (423)576-8401; fax: (423)576-5725; or e-mail: [email protected].
Available to the public from the National Technical Information Service, U.S.Department of Commerce, 5285 Port Royal Road, Springfield, VA 22161; phone ordersaccepted at (703) 487-4650.

3
Abstract
The purpose of this report is to provide the office of Waste Management (WM) withreccommended contingency calculation procedures for typical WM projects. Typical projectswere defined as conventional construction-type activities that use innovative elements whennecessary to meet the project objectives. Projects involve treatment, storage, and disposal oflow level, mixed low level, hazardous, transuranic, and high level waste.
Cost contigencies are an essential part of Total Cost Management. A contingency is anamount added to a cost estimate to compensate for unexpected expenses resulting fromincomplete design, unforseen and unpredictable conditions, or uncertainties in the project scope(DOE 1994, AACE 1998). Contingency allowances are expressed as percentages ofestimated cost and improve cost estimates by accounting for uncertainties. The contingencyallowance is large at the beginning of a project because there are more uncertainties, but as aproject develops, the allowance shrinks to adjust for costs already incurred. Ideally, the totalestimated cost remains the same throughout a project. Project contingency reflects the degreeof uncertainty caused by lack of project definition, and process contingency reflects the degreeof uncertainty caused by use of new technology. Different cost estimation methods werereviewed and compared with respect to terminology, accuracy, and Cost Guide standards.
The Association for the Advancement of Cost Engineering (AACE) methods for costestimation were selected to represent best industry practice. AACE methodology forcontingency analysis can be readily applied to WM Projets, accounts for uncertaintiesassociated with different stages of a project, and considers both project and processcontingencies and the stage of technical readiness. As reccommended, AACE contingencyallowances taper off linearly as a project nears completion.
4
Contents Page
Objective . . . . . . . . . . . . . . . . . . . . . . . . . . . . . . . . . . . . . . . . . . . . . . . . . . . . . . . . . . . . . . 7
Introduction . . . . . . . . . . . . . . . . . . . . . . . . . . . . . . . . . . . . . . . . . . . . . . . . . . . . . . . . . . . . 8Total Cost Management . . . . . . . . . . . . . . . . . . . . . . . . . . . . . . . . . . . . . . . . . . . . . 8Contingency Definitions . . . . . . . . . . . . . . . . . . . . . . . . . . . . . . . . . . . . . . . . . . . . 8
Discussion and Analysis . . . . . . . . . . . . . . . . . . . . . . . . . . . . . . . . . . . . . . . . . . . . . . . . . . 9Types of Cost Estimates . . . . . . . . . . . . . . . . . . . . . . . . . . . . . . . . . . . . . . . . . . . . 9Waste Management Project Analysis . . . . . . . . . . . . . . . . . . . . . . . . . . . . . . . . . . . 9Accuracy of Estimates . . . . . . . . . . . . . . . . . . . . . . . . . . . . . . . . . . . . . . . . . . . . . . 9Application of Contingency Allowance to Total Estimated Cost . . . . . . . . . . . . 13
Contingency Allowance Model for WM Projects . . . . . . . . . . . . . . . . . . . . . . . . . . . . . . 14Waste Management Project Analysis . . . . . . . . . . . . . . . . . . . . . . . . . . . . 14Types of Contingency for WM Projects . . . . . . . . . . . . . . . . . . . . . . . . . 14Contingency Calculation . . . . . . . . . . . . . . . . . . . . . . . . . . . . . . . . . . . . . 14Best Industry Practice . . . . . . . . . . . . . . . . . . . . . . . . . . . . . . . . . . . . . . . 15Recommended Practice . . . . . . . . . . . . . . . . . . . . . . . . . . . . . . . . . . . . . . 17Current Working Estimate . . . . . . . . . . . . . . . . . . . . . . . . . . . . . . . . . . . . 18
References . . . . . . . . . . . . . . . . . . . . . . . . . . . . . . . . . . . . . . . . . . . . . . . . . . . . . . . . . . . . 21
Abbreviations Glossary . . . . . . . . . . . . . . . . . . . . . . . . . . . . . . . . . . . . . . . . . . . . . . . . . . 22

5
List of FiguresFigure Page
1. Estimated Accuracy vs. Project Phase . . . . . . . . . . . . . . . . . . . . . . . . . . . . . . . . . . . . 12
2. Engineering Completion vs. Project Phases . . . . . . . . . . . . . . . . . . . . . . . . . . . . . . . . 12
3. Ideal Cost Profile – Construction Projects . . . . . . . . . . . . . . . . . . . . . . . . . . . . . . . . . 13

6
List of Tables
Table Page
1. Cost Estimate Classes and Characteristics . . . . . . . . . . . . . . . . . . . . . . . . . . . . . . . . . 10
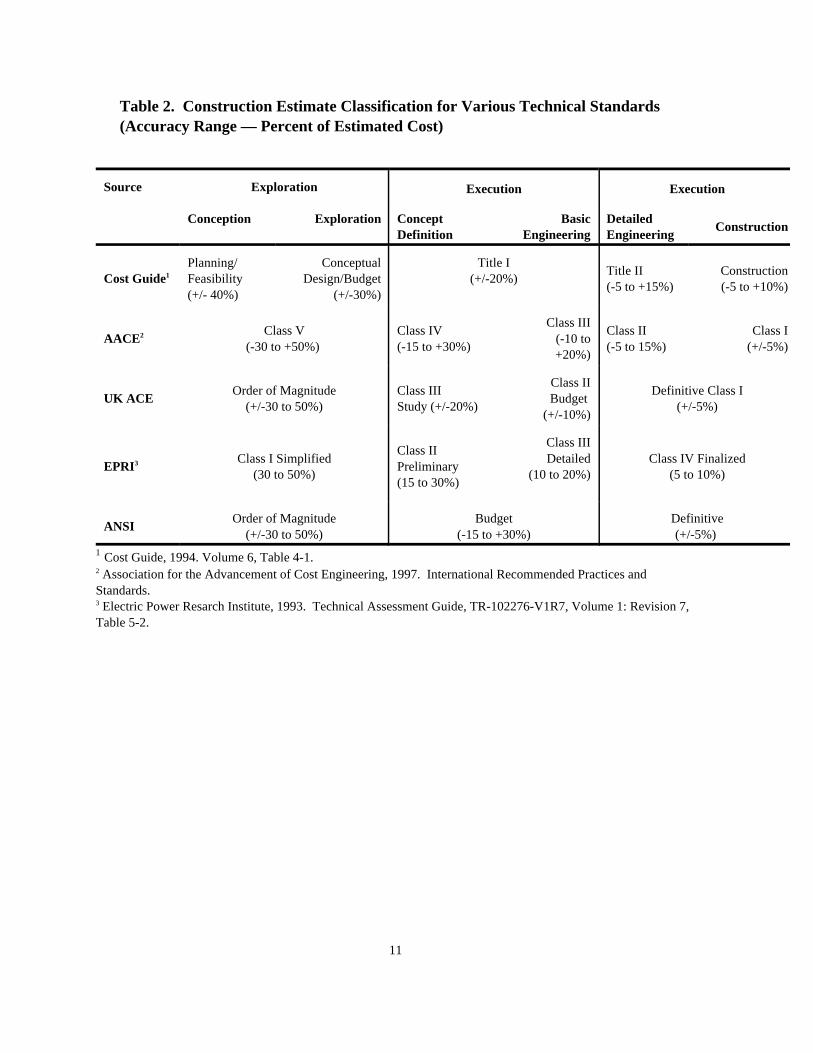
2. Construction Estimate Classification for Various Technical Standards (Accuracy Range — Percent of Estimated Cost) . . . . . . . . . . . . . . . . . . . . . . . . . . . . . . . . . . . . . . . 11
3. Project Contingency Allowance per WBS Item (Expressed as Percent of Estimated Cost) Estimate Classification Comparison . . . . . . . . . . . . . . . . . . . . . . . . . . . . . 15
4. Process Contingency per WBS Item: Comparison of Estimate Classes for Various Situations . . . . . . . . . . . . . . . . . . . . . . . . . . . . . . . . . . . . . . . . . . . . . . . . . . . . . . . 16
5. Process Contingency Allowance per WBS Item (Expressed as Percent of Estimate Cost) . . . . . . . . . . . . . . . . . . . . . . . . . . . . . . . 16
6. Recommended Project Contingency Allowances (Expressed as Percent of Estimated Cost) . . . . . . . . . . . . . . . . . . . . . . . . . . . . . . . . . . . . . . . . . . . . . . . . . . . . . . . . . . . 17
7. Recommended Contingency Allowances (Expressed as Percent of Estimated Cost): New Design That Requires SOTA Technology . . . . . . . . . . . . . . . . . . . . . . . . . . 19
8. Recommended Contingency Allowances (Expressed as Percent of Estimated Cost): New Design with Conceptual Design Report . . . . . . . . . . . . . . . . . . . . . . . . . . . 19
9. Recommended Contingency Allowances (Expressed as Percent of Estimated Cost): New Design with Preliminary Design Report . . . . . . . . . . . . . . . . . . . . . . . . . . . 19
10. Recommended Contingency Allowances (Expressed as Percent of Estimated Cost): Modifications Required to Existing Hardware . . . . . . . . . . . . . . . . . . . . . . . . . . 20
11. Recommended Contingency Allowances (Expressed as Percent of Estimated Cost): Existing Hardware Used with No Modifications . . . . . . . . . . . . . . . . . . . . . . . . . 20

7
Objective
The objective is to provide the Office of Waste Management Construction ProjectsTeam with recommended contingency values for typical waste management projects intreatment, storage, and disposal of low level, mixed low level, hazardous, transuranic, and highlevel waste. This will assist the Projects Team and Waste Management program managers inthe review and analysis of waste management project cost estimates.

8
Introduction
Total Cost Management
Cost contingencies are an essential part of project cost estimating — the keystone ofcost engineering and Total Cost Management (TCM). TCM comprises cost analysis, costcontrol, and cost management at all stages of a project (AACE 1996). From long rangeplanning, through conceptual design, detailed design, and construction, TCM is an essential partof modern project management.
Contingency Definitions
FAR 31.205-7 defines contingency as a possible future event or condition arising frompresently known or unknown causes, the outcome of which is indeterminable at this time. Costcontingencies are used solely for cost estimating. They are not a reimbursable cost undergovernment acquisition rules. FAR 31.205-7 states that costs for contingencies are generallyunallowable for historical costing purposes because such costing deals with costs incurred andrecorded on the contractor’s books.
DOE definines cost contingency as follows:
Cost contingency covers the costs that may result from incomplete design, unforeseenand unpredictable conditions, or uncertainties within the defined project scope. Theamount of the contingency will depend on the status of the design, procurement, andconstruction; and the complexities and uncertainties of the component parts of theproject. Contingency is not to be used to avoid making an accurate assessment of theexpected cost.
Contingency does not cover major changes in scope or schedule, Acts-of-God, or other ForceMajeure situations (DOE 1994).
AACE defines cost contingency as follows:
Contingency is an amount added to an estimate to allow for additional costs thatexperience shows will likely be required. This may be derived either through statisticalanalysis of past project costs, or by applying experience gained on similar projects.Contingency usually does not include changes in scope or schedule or unforeseeablemajor events such as strikes or earthquakes (AACE 1998).

9
Discussion and Analysis
Types of Cost Estimates
The Association for the Advancement of Cost Engineering (AACE) defines a costestimate as a compilation of all costs of the elements of a project or effort included within anagreed upon scope (AACE 1998).
Throughout a project, various cost estimates are prepared (each using differentmethods and data) depending on the degree of project definition that exists at the time of theestimate. AACE identifies three major project stages as exploration, evaluation, and execution.
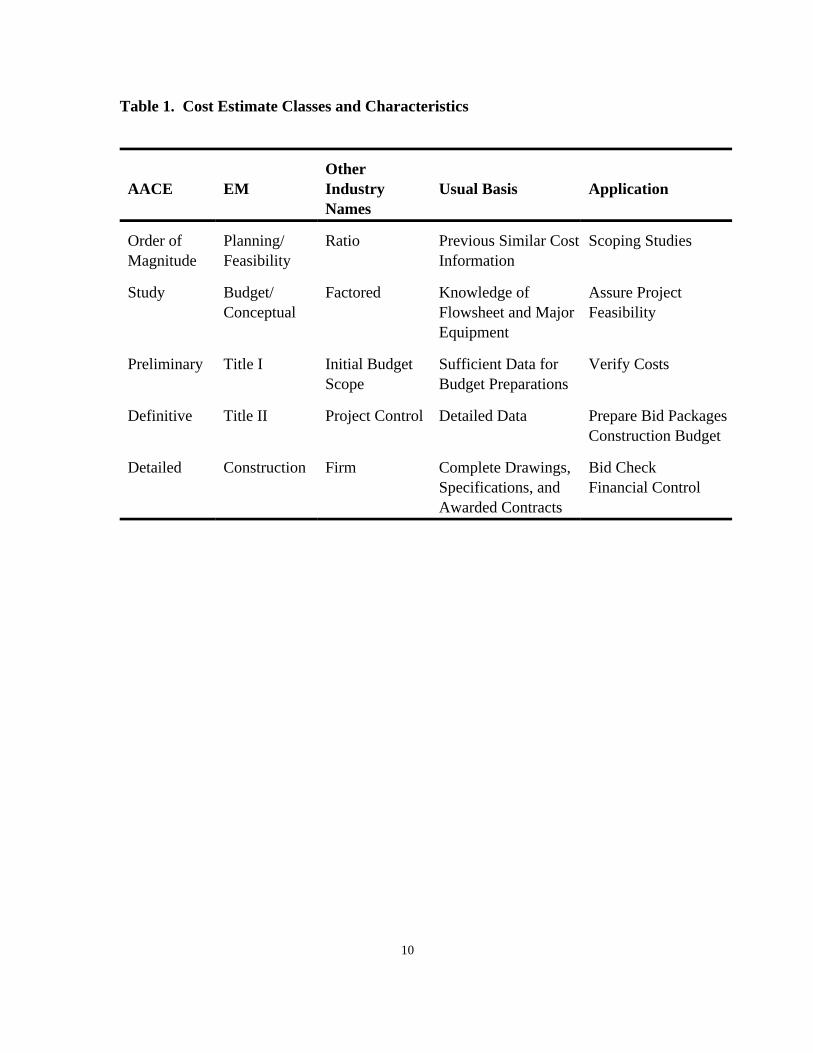
Estimate terminology, basis, and application as described by EnvironmentalManagement (EM) and AACE terminology, are summarized in Table 1. In EM terminology,the exploratory stage (conception) consists of Planning and Conceptual phases. The evaluationstage (basic engineering) consists of Title I design, and the execution stage (detailed engineeringand construction) consists of the Title II Design and Construction phases (AACE 1998, DOE1994).
Waste Management Project Analysis
Typical WM projects consist largely of conventional construction-type activities andalso may use innovative elements where necessary to meet the project objectives. Usinginnovative elements introduces an additional risk because of uncertainty in the technicalperformance of a technology (Cost Guide 1995).
Accuracy of Estimates
As the project stage changes from exploration to evaluation and execution, detailsbecome better defined and associated cost estimates become more accurate. Table 2compares EM and industry estimate classifications, standards of accuracy, and degree ofproject definition. Stated accuracies have been determined from analysis of past projects (CostGuide 1995). Estimated accuracy versus project phase was plotted. Electric Power ResearchInstitute (EPRI) and AACE are more conservative than EM with respect to accuracy ofestimates at each project phase (Figure 1). The degree of technical definition in terms ofpercent engineering complete versus project phase was plotted. EM has a higher percentengineering complete at all project phases than AACE (Figure 2).
10
Table 1. Cost Estimate Classes and Characteristics
AACE EM Industry Usual Basis ApplicationOther
Names
Order of Planning/ Ratio Previous Similar Cost Scoping StudiesMagnitude Feasibility Information
Study Budget/ Factored Knowledge of Assure ProjectConceptual Flowsheet and Major Feasibility
Equipment
Preliminary Title I Initial Budget Sufficient Data for Verify CostsScope Budget Preparations
Definitive Title II Project Control Detailed Data Prepare Bid PackagesConstruction Budget
Detailed Construction Firm Complete Drawings, Bid CheckSpecifications, and Financial ControlAwarded Contracts
11
Table 2. Construction Estimate Classification for Various Technical Standards(Accuracy Range — Percent of Estimated Cost)
Source Exploration Execution Execution
Conception Exploration Concept Basic DetailedDefinition Engineering Engineering
Construction
Cost Guide Feasibility Design/Budget (+/-20%)1
Planning/ Conceptual Title I
(+/- 40%) (+/-30%)
Title II Construction(-5 to +15%) (-5 to +10%)
AACE (-10 to2 Class V Class IV Class II Class I(-30 to +50%) (-15 to +30%) (-5 to 15%) (+/-5%)
Class III
+20%)
UK ACE Budget Order of Magnitude Class III Definitive Class I
(+/-30 to 50%) Study (+/-20%) (+/-5%)
Class II
(+/-10%)
EPRI Preliminary3 Class I Simplified Detailed Class IV Finalized(30 to 50%) (10 to 20%) (5 to 10%)
Class II
(15 to 30%)
Class III
ANSI Order of Magnitude Budget Definitive
(+/-30 to 50%) (-15 to +30%) (+/-5%)
Cost Guide, 1994. Volume 6, Table 4-1.1
Association for the Advancement of Cost Engineering, 1997. International Recommended Practices and2
Standards. Electric Power Resarch Institute, 1993. Technical Assessment Guide, TR-102276-V1R7, Volume 1: Revision 7,3
Table 5-2.

60
50
40
30
20
10
0
-10
-20
-30
-40
-50
Planning Budget Title I Title II Bid Check
Project Phase
Per
cent
Est
imat
e E
rror
Figure 1. Estimate Accuracy vs. Project Phase
High - EPRI
Low - AACELow - EM
High - EM
High - AACE
Low - EPRI
M99000441 C7
100
80
60
40
Title I Title II Bid Check
Project Phase
Perc
ent E
stim
ate
Err
or
Figure 2. Engineering Completion vs. Project Phase
High - AACE
Low - AACE
High - EM
Low - EM
20
0
Planning Budget
M99000442 C7
12

100
80
60
40
Title I Title II Bid Check
Perc
ent F
inal A
ctual C
ost
Project Phase
Figure 3. Ideal Cost Profile - Construction Projects
20
0
Planning Budget
Estimate Contingency TEC
M99000443 C7
13
Application of Contingency Allowance to Total Estimated Cost
The purpose of contingency allowances is to improve the accuracy of cost estimates bycompensating for inherent inaccuracies. This compensation is provided in the form of a contingencyallowance.
TEC = Estimated Cost + Contingency Allowance,where the contingency allowance is large enough to compensate for the maximum range ofinaccuracy associated with the estimate.
Early in the project, uncertainties are large and so are inaccuracies. The TEC is calculatedby adding a large contingency allowance to a small estimated cost. As the project becomes betterdefined, more items are included, the estimated cost grows, and the contingency becomes lower,reflecting the reduced degree of uncertainty at that phase of the project. Ideally, the TEC willremain constant throughout a project. As the definition of the project develops, the cost estimateincreases and the contingency allowance decreases (Figure 3).

14
Contingency Allowance Model for WM Projects
Waste Management Project Analysis
The Project Performance Study conducted by Independent Project Analysis, Inc.concluded that WM employs conventional technology and innovates only when there is no availabletechnology that will meet project objectives. Waste Management projects may then be treated asconventional construction projects, with corrections for those innovative elements with highertechnical risk involved (Independent Project Analysis, Inc. 1995).
Types of Contingency for WM Projects
Two types of contingencies are used to compensate for the different types of uncertaintiestypically encountered in engineering projects — project contingency and process contingency.
Project Contingency is based on the degree of project definition available at the time ofmaking the estimate. This type of contingency covers expected omissions and unforeseen costscaused by lack of complete engineering (Table 3). Project contingency compensates for theinherent estimate inaccuracy associated with each stage of a project (Figure 1). The projectcontingencies recommended for WM projects are for conventional construction projects.
Process Contingency is based on the degree of uncertainty caused by use of newtechnology. It is an effort to quantify the uncertainty in performance because of limited technicaldata. For those technical areas with greater risk, the process contingency is designed tocompensate for the inherently greater inaccuracy associated with the cost elements (Table 4).
Contingency Calculation
The recommended contingency allowance is calculated for each WBS element, using acombination of project and process contingency. Recommended values change according totechnology status and project phase (Table 5). AACE has recommended process contingencyallowances for each technology situation (Table 6).
15
Best Industry Practice
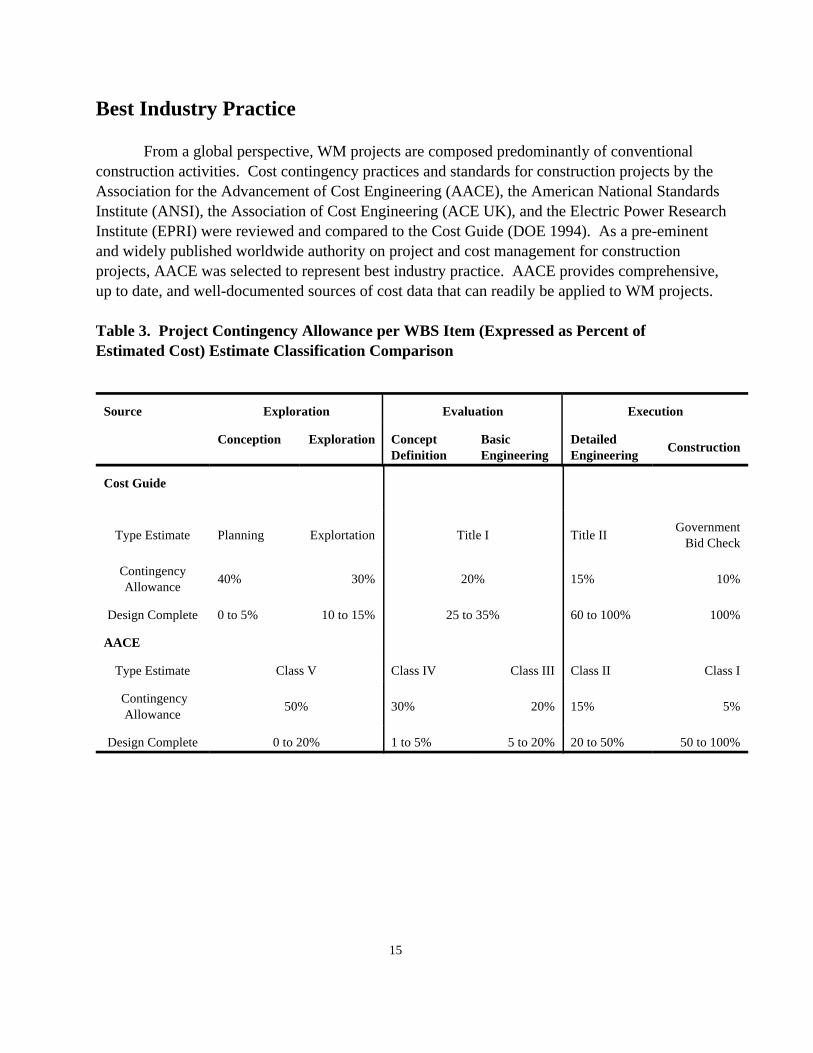
From a global perspective, WM projects are composed predominantly of conventionalconstruction activities. Cost contingency practices and standards for construction projects by theAssociation for the Advancement of Cost Engineering (AACE), the American National StandardsInstitute (ANSI), the Association of Cost Engineering (ACE UK), and the Electric Power ResearchInstitute (EPRI) were reviewed and compared to the Cost Guide (DOE 1994). As a pre-eminentand widely published worldwide authority on project and cost management for constructionprojects, AACE was selected to represent best industry practice. AACE provides comprehensive,up to date, and well-documented sources of cost data that can readily be applied to WM projects.
Table 3. Project Contingency Allowance per WBS Item (Expressed as Percent ofEstimated Cost) Estimate Classification Comparison
Source Exploration Evaluation Execution
Conception Exploration Concept Basic DetailedDefinition Engineering Engineering
Construction
Cost Guide
Type Estimate Planning Explortation Title I Title IIGovernment
Bid Check
ContingencyAllowance
40% 30% 20% 15% 10%
Design Complete 0 to 5% 10 to 15% 25 to 35% 60 to 100% 100%
AACE
Type Estimate Class V Class IV Class III Class II Class I
ContingencyAllowance
50% 30% 20% 15% 5%
Design Complete 0 to 20% 1 to 5% 5 to 20% 20 to 50% 50 to 100%

16
Table 4. Process Contingency per WBS Item: Comparison of Estimate Classes forVarious Situations
State of Development AACE NASA EPRI Cost Guide1
New Design beyond 40% + 50% 40% + up to 50%SOTA
New Design within SOTA n/a 35% n/a n/a
New Design Hardware 30 - 70% 25% 30-70% up to 40%through PDR
New Design Hardware 20-35% 20% 20-35% 15-25%through CDR
Modifications Required 5-20% 15% 5-20% 10-20%to Existing Hardware
No Modifications 0-10% 10% 0-10% 5-15%Required
Cost Guide, 1994. Volume 6, Table 11-1.1
Table 5. Process Contingency Allowance per WBS Item (Expressed as Percent ofEstimate Cost)
State of Development
AACERecommendation
New Design beyondSOTA
40% +
New Design Hardwarethrough CDR
30 - 70%
New Desighn Hardwarethrough PDR 20-35%
Modifications Requiredto Existing Hardware
5-20%
No ModificationsRequired
0-10%

17
Table 6. Recommended Project Contingency Allowances (Expressed as Percent ofEstimated Cost)
Project Stage
Project DesignContingency Complete
Planning 50% 0-2%Conceptual 40% 1-5%Title I 30% 5-20%Title II 15% 20-50%Construction 5% 50-100%
Recommended Practice
The recommended contingency analysis, based on AACE guidelines, is performed for eachWork Breakdown Structure (WBS) element. This method accounts for uncertainties associatedwith different phases of the project and uses a combination of project and process contingency. The project contingency reflects the degree of uncertainty in the estimated cost because ofincomplete technical definition, and process contingency reflects the degree of uncertainty in theestimated cost because of incomplete design data for new technologies.
For each WBS element, total contingency is calculated as delineated in tables 7, 8, 9, and10. The recommended allowances are expressed as percentages of estimated cost. Totalcontingency allowances are summarized versus project phase at different stages of technicalreadiness. Stages range from a new design that requires technology beyond the current state of theart (SOTA) to existing hardware may be used with no modification.
The exact value is decided by the cost estimator. Total Estimated Cost (TEC) for eachelement is calculated as follows:
TEC = Estimated Cost + Total Contingency Allowance
Total Contingency Allowance = Project Contingency + Process Contingency
The TEC for the total project is determined by summing the TECs for all WBS elements.

18
Current Working Estimates
A practical concern in the management of large construction projects is how to budgetappropriately for contingencies in the latter stages of the project. As substantial portions of the jobare completed and actual costs are incurred, it is unrealistic to continue budgeting for the fullcontingency allowance. Total dollar exposure to cost uncertainties in remaining work is continuallyreduced as the value of work remaining to be done diminishes. To recognize this reality, thefollowing practice is recommended:
For the preparation of current working estimates of cost-to-complete during theconstruction phase of the project, it is recommended that the contingency reserve budgetedat the outset of construction be tapered off linearly as the work is accomplished.
TEC = Cost Incurred to Date + Estimated Remaining Cost + Scaled Contingency Allowance
Scaled Contingency Allowance = Original Contingency Allowance x ( % Work Remaining/100)
For example, consider a construction project in which a $100 million was the estimatedcost for a major WBS element with a contingency allowance of $5 million, yielding a TEC of $105million. If the construction phase on the element is 50% complete, the current working TEC tocomplete the element would now be the sum of costs incurred to date, the estimated cost remaining,plus one half of the original contingency allowance, or $2.5 million.

19
Table 7. Recommended Contingency Allowances (Expressed as Percent of EstimatedCost): New Design That Requires SOTA technology
Project Phase Design
Contingency
CompleteProject Process Total
Planning 50% 40% + 90% + 0 - 2%
Title I 30% 40% + 70% + 5-20%
Title II 15% 40% + 55% + 20-50%
Construction 5% 40% + 45% + 50-100%
Table 8. Recommended Contingency Allowances (Expressed as Percent of EstimatedCost): New Design With Conceptual Design Report
Project Phase DesignContingency
CompleteProject Process Total
Conceptual 40% 30-70% 70-110% 1-5%
Title I 30% 30-70% 60-100% 5-20%
Title II 15% 30-70% 45-85% 20-50%
Construction 5% 30-70% 35-75% 50-100%
20
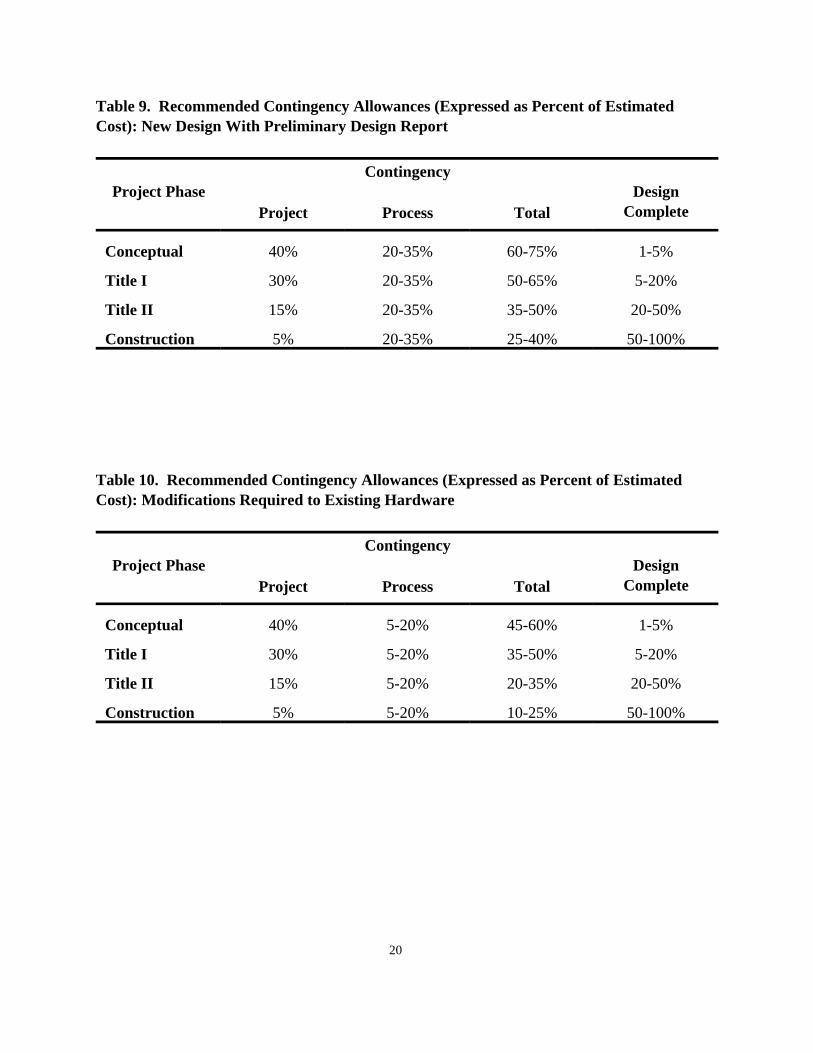
Table 9. Recommended Contingency Allowances (Expressed as Percent of EstimatedCost): New Design With Preliminary Design Report
Project Phase DesignContingency
CompleteProject Process Total
Conceptual 40% 20-35% 60-75% 1-5%
Title I 30% 20-35% 50-65% 5-20%
Title II 15% 20-35% 35-50% 20-50%
Construction 5% 20-35% 25-40% 50-100%
Table 10. Recommended Contingency Allowances (Expressed as Percent of EstimatedCost): Modifications Required to Existing Hardware
Project Phase DesignContingency
CompleteProject Process Total
Conceptual 40% 5-20% 45-60% 1-5%
Title I 30% 5-20% 35-50% 5-20%
Title II 15% 5-20% 20-35% 20-50%
Construction 5% 5-20% 10-25% 50-100%

21
Table 11. Recommended Contingency Allowances (Expressed as Percent of EstimatedCost): Existing Hardware Used With No Modifications
Project Phase
Contingency
DesignCompleteProject Process Total
Conceptual 40% 0-10% 40-50% 1-5%
Title I 30% 0-10% 30-40% 5-20%
Title II 15% 0-10% 15-25% 20-50%
Construction 5% 0-10% 5-15% 50-100%

22
References
Association for the Advancement of Cost Engineering (AACE), 1998. Construction Cost Estimating.
Association for the Advancement of Cost Engineering (AACE), 1997. International Recommended Practices and Standards.
Association for the Advancement of Cost Engineering (AACE), 1996. Preliminary Capital andOperating Cost Estimating.
Cost Guide, 1994. Volume 6.
Department of Energy, year. Project Management System, DOE Order 4700.1
Electric Power Research Institute (EPRI), 1993. Technical Assessment Guide, TR-102276-V1R7, Vol. 1:Rev. 7.
Independent Project Analysis Inc., 1996. Project Performance Study Update, Waste Management Addendum, Federal Energy Technology center.
Independent Project Analysis Inc., 1995. Project Performance Study, Waste Management Addendum, Federal Energy Technology Center.
National Aeronautics and Space Administration (NASA), 1999. Parametric Cost Estimating Manual, Johnson Space Center, http://www.jsc.nasa.gov/ [April 1999].

23
Abbreviations
AACE Association for the Advancement of Cost Engineering
ANSI American National Standards Institute
CDR Conceptual Design Report
EPRI Electric Power Research Institute
EM Environmental Management
PDR Preliminary Design Report
SOTA State of the Art
TCM Total Cost Management
TEC Total Estimated Cost
WM Waste Management