waste minimization studies in an … · sustainable development is a requirement to improve the...
TRANSCRIPT
WASTE MINIMIZATION STUDIES IN AN ELECTRICAL DEVICES MANUFACTURING
INDUSTRY
by
Hilal YAĞCI
October, 2003
İZMİR
ABSTRACT
In this article, the ISO 14001 Environmental Management System
implementation studies, the waste minimization studies which shows parallel
improvement with ISO 14001 Environmental Management System practices and the
positive reflections of these works on pollution prevention, raw material and natural
resources consumption was explained.
Waste minimization applications are used by companies to increase the
operational efficiency. ISO 14001 Environmental Management System applications
helps to increase the process efficiency and reengineering applications by providing
systematical approach to the waste minimization applications.
ÖZET
Bu makale ile elektrik ekipmanları üreten bir fabrikada yapılan ISO 14001 çevre
yönetim sistemi kurma çalışmaları; ISO 14001 çevre yönetim sisteminin
uygulanması ile paralel doğrultuda gelişen atık minimizasyon çalışmalarının
gelişimi; bu çalışmaların kirliliğin önlenmesi, ham madde ve doğal kaynak
kullanımının azalması üzerindeki olumlu yansımaları gösterilmektedir.
Atık minimizasyon çalışmaları şirketler tarafından operasyonel verimliliğin
artırılması amacıyla kullanılmaktadır. ISO 14001 Çevre Yönetim Sistemi
uygulamaları, atık azaltım çalışmalarına getirdiği sistematik ve geniş kapsamlı
yaklaşımla süreçlerin yeniden incelenmesine ve verimliliklerinin artırılmasına
yardımcı olmaktadır.
1. Introduction
Environmental problems have emerged with the beginning of the industrial
revolution and with the increase of population. By the mid of 1970’s, environmental
problem has joined importance because negative impacts of the economy and rapid
population grow on natural resources.
Nowadays, the countries all over the world are following the technological
developments. They prefer environmental friendly raw materials and production
processes, they evaluate waste minimization techniques for their operations, also
they all implement environmental management systems (BS 7750, EMAS and ISO
14001) to improve their environmental performances, to identify and to control their
environmental aspects at all steps from entering the raw material to final product.
Sustainable development is a requirement to improve the standard of living and
quality of life in developing countries. It is known that the development of waste
minimization techniques and implementation of environmental management systems
are the most important contribution of industries to sustainable development.
Industries can make product life cycle analysis and assessments in existing and new
product designs, production processes and for all activities. Meanwhile they can
identify their environmental aspects and can prevent their negative environmental
impacts.
BS 7750 is the first step of standardisation works for Environmental Management
System in the world. BS7750 was published by the British Standard Institution in
1992. This was a model standard for ISO 14000 series. ISO 14001 is the most widely
accepted international standard .It was published in 1996. BS 7750 was the base for
the European Union’s Eco-Management and Audit program, which is known as
EMAS.
ISO 14001,EMAS and BS 7750 are very similar in their approach. If any
company implement the BS 7750 requirements, it can implement the other two
systems (ISO 14001 and EMAS) with a little effort; they are too similar to each
other, so it is easy to transfer the systems.
ISO 14000 is a new approach to environmental protection view and it is a
systematic strategy to environmental developments.
Environmental issues are a top priority in the world today, and so is completion of
relevant international standardization system. During the Earth Summit in Rio in
1992, the Business Council for Sustainable Development (BCSD) emphasized that
“business and industry need tools to help measure environmental performance, and
develop powerful environmental management techniques” (Dods, 1997).
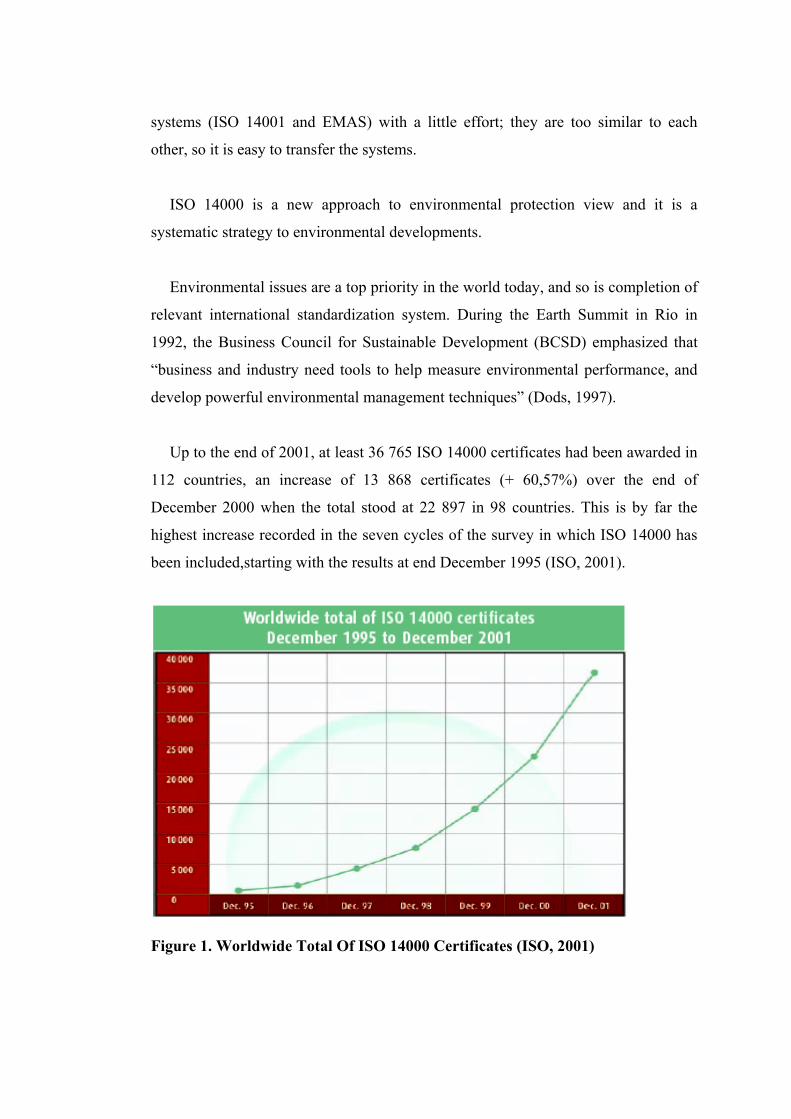
Up to the end of 2001, at least 36 765 ISO 14000 certificates had been awarded in
112 countries, an increase of 13 868 certificates (+ 60,57%) over the end of
December 2000 when the total stood at 22 897 in 98 countries. This is by far the
highest increase recorded in the seven cycles of the survey in which ISO 14000 has
been included,starting with the results at end December 1995 (ISO, 2001).
Figure 1. Worldwide Total Of ISO 14000 Certificates (ISO, 2001)
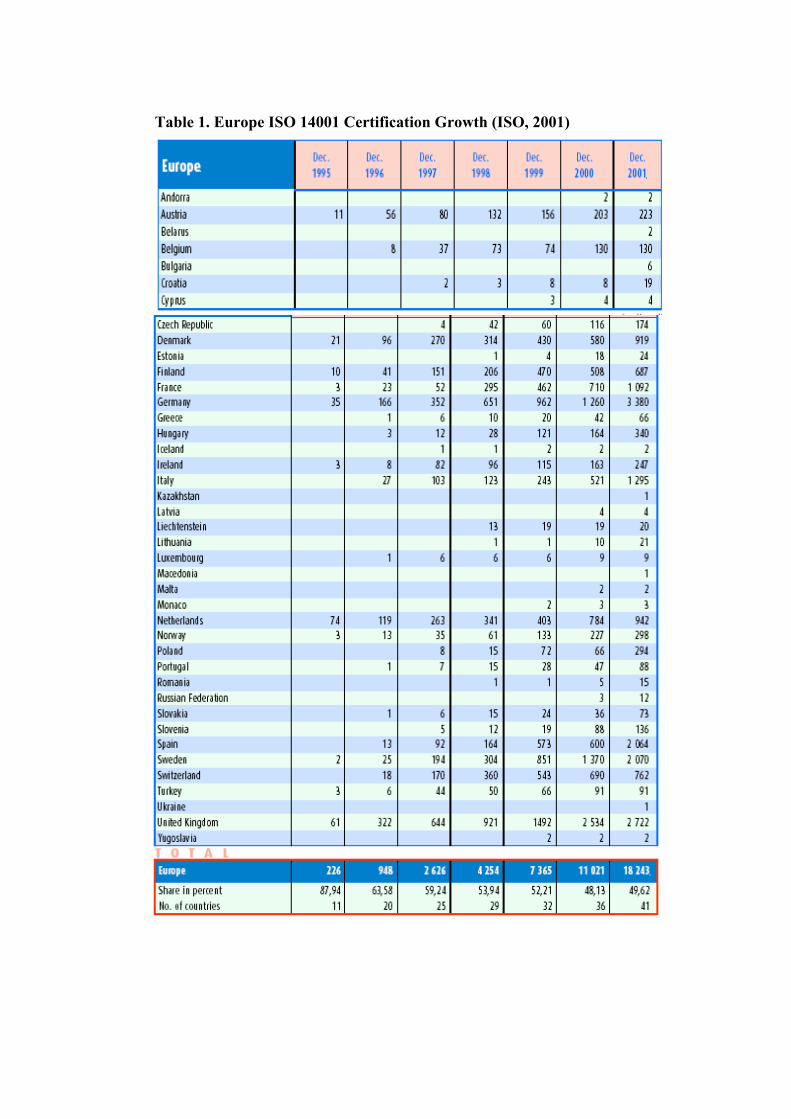
Table 1. Europe ISO 14001 Certification Growth (ISO, 2001)
Also these numbers in the world are increasing day by day because of improving
the market share in world market.
In our country, especially in last five years the certificated organization number is
increasing very fastly. It is expected that in our country in 2003, the certification
number reached to 150.
In Izmir, the ISO 14001 certification number is about 15. (EBSO, Chamber of
Aegean Region Industry, 2003) For Turkey, according to only one certification firm
records, the organization number, which has ISO 14001 certification, is 53 (BWQI,
2003).
1.1 Waste Minimization Techniques
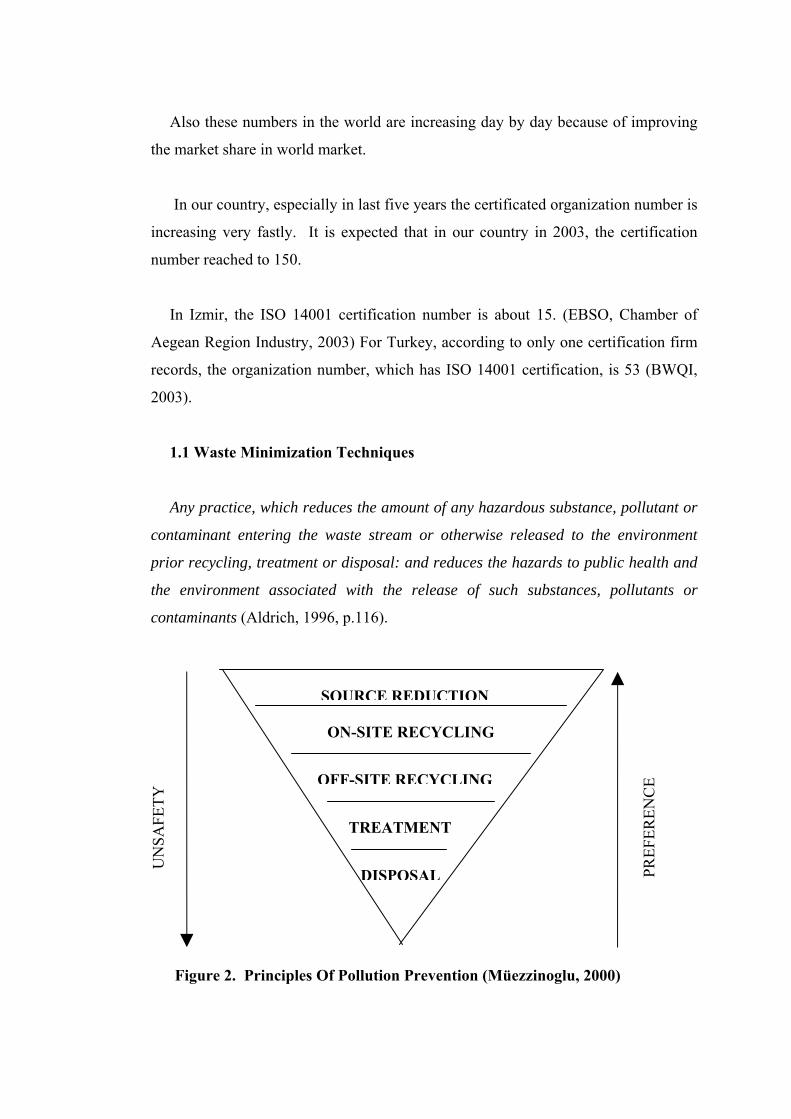
Any practice, which reduces the amount of any hazardous substance, pollutant or
contaminant entering the waste stream or otherwise released to the environment
prior recycling, treatment or disposal: and reduces the hazards to public health and
the environment associated with the release of such substances, pollutants or
contaminants (Aldrich, 1996, p.116).
Figure 2. Principles Of Pollution Prevention (Müezzinoglu, 2000)
UN
SAFE
TY
PREF
EREN
CE
SOURCE REDUCTION
ON-SITE RECYCLING
OFF-SITE RECYCLING
TREATMENT
DISPOSAL
Pollution prevention programs help to reach to national environmental targets
and companies has economical and social benefits by applying pollution preventive
actions. Increasing awareness of population for environmental pollutants force to
companies to reduce the toxicity and sheer volume of the waste they generate.
Decreasing wastes ensures upstream benefits because it decreases environmental
damage from raw material extraction and pollutants releasing during the
manufacturing process and during the manufacturing process and during waste
recycling, treatment, and disposal operations. A company can reduce production
costs by reducing waste amounts, it generates productivity. Also, pollution
prevention applications help to improve company’s public image, public health, and
overall environmental benefits.
A pollution prevention project can benefit from water, energy, and material
savings as well as from waste reduction, recycling, and reuse. It may also deliver
substantial benefits from an improved product and company image or from improved
employee health. These benefits remain largely unexamined in environmental
investment decisions. Although they are often difficult to measure, they should be
incorporated into assessment whenever feasible. At the very least, they should be
highlighted for managers after presenting costs that can be the more easily
quantified and allocated.
Intangible benefits may include:
• increased sales due to improved product quality, enhanced company image,
and consumer trust in green products;
• improved supplier-customer relationship;
• reduced health maintenance costs;
• increased productivity due to improved employee relations; and
• improved relationships with regulators (Shen, 1995, p.101).
2. ISO 14001 Environmental Management System Implementation and
Waste Minimization Studies of Factory A
2.1. General look to the Factory A
Factory A is producing low voltage products, low voltage equipments, high
voltage products and high voltage equipments.
Factory A is located in Izmir, established in Kemalpaşa Organized Industrial
District Area and being managed with ISO 9002 quality assurance system since
1994.
There are 300 employees are working permanently and 50 employees are
working as temporarily according to production volume.
Factory A has implemented ISO14001 environmental management system in
2001 and has been certificated on June 2001 by Turkish Standardization Institute.
In Factory A, the total ISO 14001 Environmental Management System
implementation time has taken along eight months. And in Figure 3 you can see the
timing schedule of ISO 14001 Environmental Management System implementation
studies according to ISO 14001 phases.
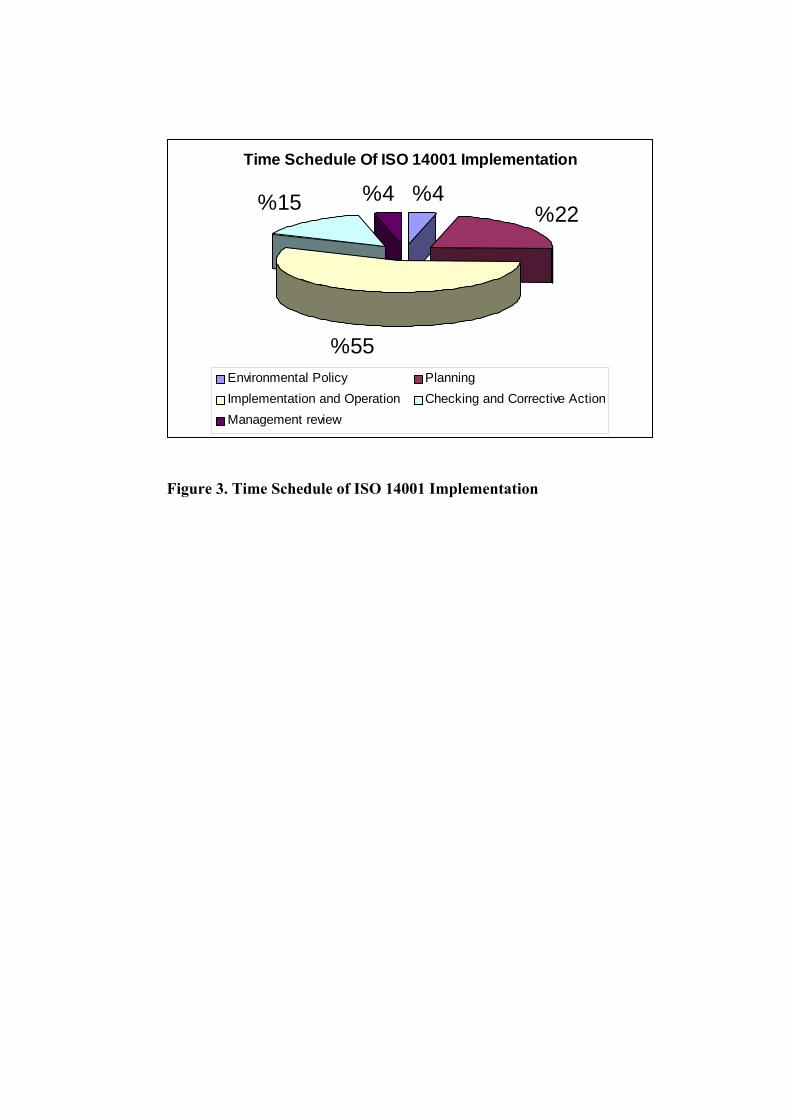
Figure 3. Time Schedule of ISO 14001 Implementation
Time Schedule Of ISO 14001 Implementation
%4%22
%55
%15 %4
Environmental Policy PlanningImplementation and Operation Checking and Corrective ActionManagement review
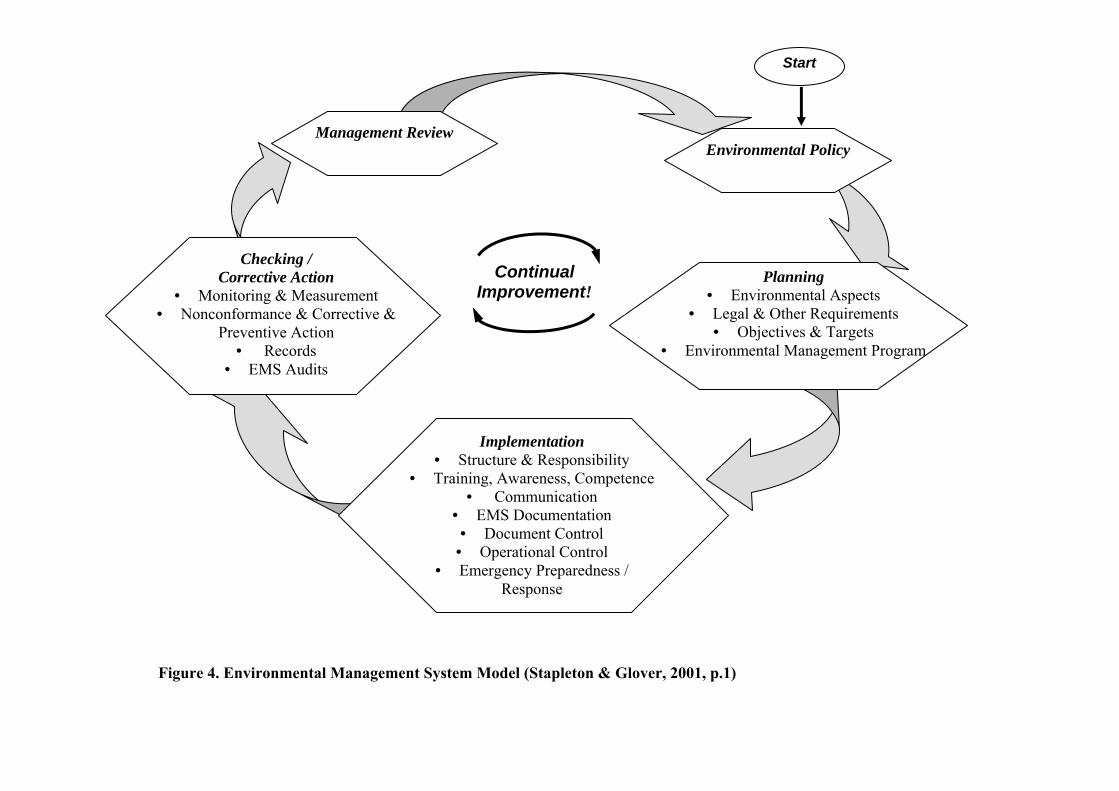
Figure 4. Environmental Management System Model (Stapleton & Glover, 2001, p.1)
Planning
• Environmental Aspects • Legal & Other Requirements
• Objectives & Targets • Environmental Management Program
Implementation • Structure & Responsibility
• Training, Awareness, Competence • Communication
• EMS Documentation • Document Control • Operational Control
• Emergency Preparedness / Response
Start
Environmental Policy
Checking / Corrective Action
• Monitoring & Measurement • Nonconformance & Corrective &
Preventive Action • Records
• EMS Audits
Continual Improvement!
Management Review
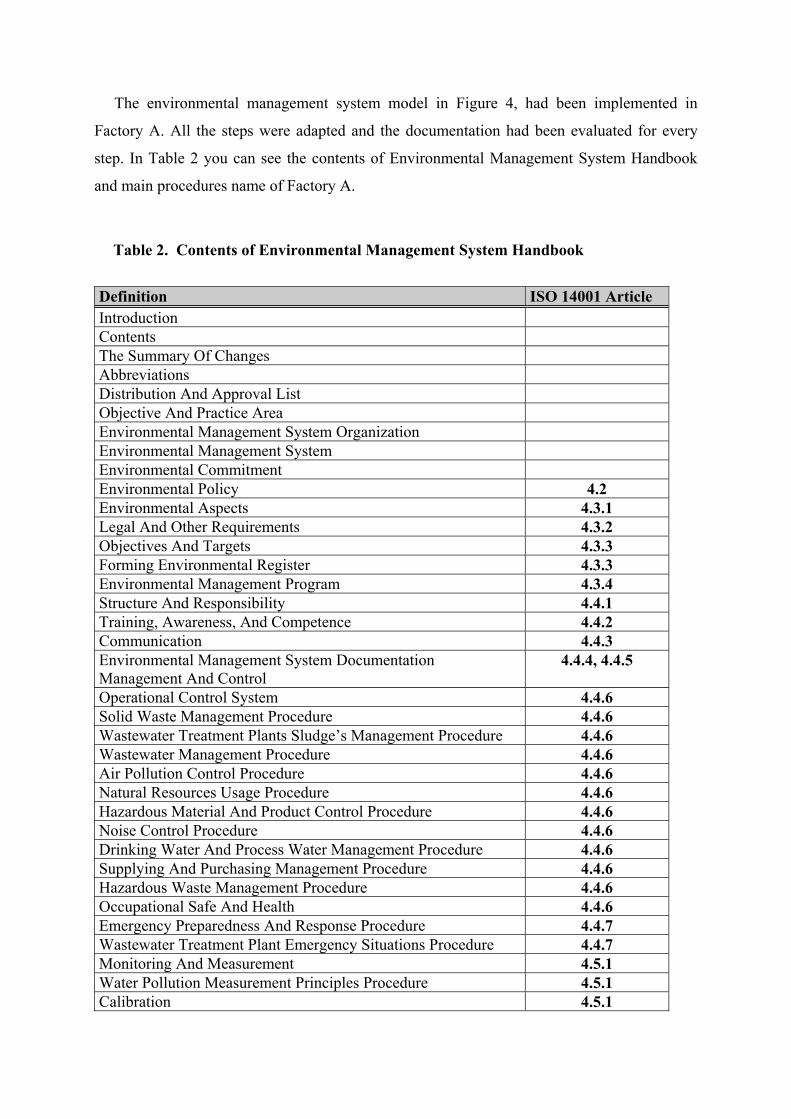
The environmental management system model in Figure 4, had been implemented in
Factory A. All the steps were adapted and the documentation had been evaluated for every
step. In Table 2 you can see the contents of Environmental Management System Handbook
and main procedures name of Factory A.
Table 2. Contents of Environmental Management System Handbook
Definition ISO 14001 Article Introduction Contents The Summary Of Changes Abbreviations Distribution And Approval List Objective And Practice Area Environmental Management System Organization Environmental Management System Environmental Commitment Environmental Policy 4.2 Environmental Aspects 4.3.1 Legal And Other Requirements 4.3.2 Objectives And Targets 4.3.3 Forming Environmental Register 4.3.3 Environmental Management Program 4.3.4 Structure And Responsibility 4.4.1 Training, Awareness, And Competence 4.4.2 Communication 4.4.3 Environmental Management System Documentation Management And Control
4.4.4, 4.4.5
Operational Control System 4.4.6 Solid Waste Management Procedure 4.4.6 Wastewater Treatment Plants Sludge’s Management Procedure 4.4.6 Wastewater Management Procedure 4.4.6 Air Pollution Control Procedure 4.4.6 Natural Resources Usage Procedure 4.4.6 Hazardous Material And Product Control Procedure 4.4.6 Noise Control Procedure 4.4.6 Drinking Water And Process Water Management Procedure 4.4.6 Supplying And Purchasing Management Procedure 4.4.6 Hazardous Waste Management Procedure 4.4.6 Occupational Safe And Health 4.4.6 Emergency Preparedness And Response Procedure 4.4.7 Wastewater Treatment Plant Emergency Situations Procedure 4.4.7 Monitoring And Measurement 4.5.1 Water Pollution Measurement Principles Procedure 4.5.1 Calibration 4.5.1
Nonconformance And Corrective And Preventive Action 4.5.2 Records 4.5.3 Environmental Management System Audits 4.5.4 Management Review 4.6 Instructions List Forms List
While beginning waste minimization studies, firstly a process flow diagram had been
created which was used as a guide. Then several waste minimization applications had been
evaluated as expressed below.
2.2 Waste Minimization Applications
2.2.1 Source Reduction Applications
2.2.1.1 Modification in Mould of Part A
Net weight of Part A is 4960 grams. While moulding operation, 5902 grams epoxy mix
was injecting to mould and 942 grams scrap was being generated due to leakages and gates.
This value equals to 16 % of total injected raw material. Epoxy leakage sources had been
investigated. After this investigation, it has been understood that these leakages could be
prevented by putting a special seal over the touching points of male and female sides of
mould. It has been decided to do this modification, first one channel was made by grinding in
both side of mould. Later, a special seal has been inserted to these channels. After closing of
all gaps which are situated in touching place of moulds, 570 grams raw material gained. As a
result 60.5% improvement were obtained in scrap weight, totally 9% scrap saving have been
obtained by this modification. Additionally 2 % man power saving gained after this
modification, because no longer there was no need to do extra cleaning works to remove
scraps over the moulded parts.
2.2.1.2 Epoxy Pulp Recovery
First, epoxy mixes are prepared in fix epoxy mixers. Later, mixed pulp transferred from fix
mixers to mobile mixers by flexible tubes and then mixed epoxy pulp is injected trough
flexible tubes from mobile mixers to injection machine. After this loading operation, injection
machines use this epoxy pulp during 1-1.5 hours (usage time depends on injected part’s
weight). But during 1-1.5 hours, remaining pulp’s viscosity which is inside the mixer’s
flexible tube, falling down and pulp became contaminated. Later contaminated epoxy pulps
removed from inside the flexible tube and are separated as scrap, 275 grams contaminated
pulp generated during one loading operation. Approximately 1375 grams virgin epoxy pulp
became scrap due to this reason in a one shift per machine. Production engineer decided to
close the edges of tubes by using special fitting components. Totally, 20.6 kilograms epoxy
pulp gained during one shift and 61.8 kilograms saving obtained per a day. 1856 kilograms
have been obtained by this modification in a month. As a result, 43.7saving have been
obtained in scrap weight and this saving is equal to 5.6% improvement in scrap ratio.
2.2.1.3 Automated Loading System
Quarts come from suppliers with 250 kilograms big bags by truck. Big bags are brought by
crane over the fix mixers tanks, edge of big bag is teared and powder quarts fall down inside
the mixer’s tank. But while powder quarts falling down from big bag to tank, some of powder
quarts run away from tank by air movements. After loading operation, workshop floor is
cleaned. When powder quarts and dusts are mixed in the workshop floor, powder quarts
became scrap. For this reason, powder quarts can not be used again in the process. After
investigation, it is observed that approximately 0.83% powder quarts were missing due to
unprotected loading operation. Later the corrective action decision had been taken by
production team to prevent this leakage, they put this corrective action into annual
environmental program. According to plan one huge silo with 40 tones capacity were
constructed and big bag usage were cancelled. Quarts started to come with in bunker instead
of big bags. Two helical gear mechanisms were established. First helical gear system was for
quarts transferring to bunker to silo, second helical gear system was for loading quarts from
silo to fix mixer tanks. All these operations are in closed area, so that there was no chance for
leakage while transferring the raw material. Before modification quarts leakage was 350
kilograms/month, after modification leakage amount were decreased to 42 kilograms/month.
So, 0.73% saving have been obtained.
2.2.1.4 Renewal Of Old Injection Machinery
Three of injection machines were more than 15 years old and they were causing oil
leakages, bad quality in injection, pressed air leakage and ineffective working. Management
decided to renewal these benches in 2002 and budgeted for 2003 annual environmental
management program. Beginning of 2003 three new PLC controlled injection machines were
ordered and machines were established in the middle of March. After renewal non quality
ratio of these benches were reduced from 12% to 1.7%.
2.2.1.5 Electricity Reduction
There are lots of machinery and equipment in factory A (injection machinery, mixers,
electrical heaters, motors etc.) Related with ISO 14001 Environmental Management System
requirements, it was necessary to follow up of process, measure the results and then define the
indicators after realize the plan of actions to reach the defined targets. For this reason a special
automation system was designed to manage all electrical activities around the factory,
especially in Epoxy casting workshop. This system had advanced software and hardware
based system which allows adjusting, managing, and reporting the lots of electrical
operations. Furthermore this system was integrated with web based programs. By this
integration, it was able to adjust all parameters of main electrical equipment’s functions by
reaching internet. System was adjusting all working parameters of machinery and reporting
the electrical consumption levels and also if any broken happened on the machinery, it was
giving an error message which shows the source of problem, by this system average
maintenance time, scrap ratios were reduced, production quality and productivity, overall
equipment efficiency have been increased.
2.2.1.6 Heat Isolation Plates
In injection machinery, epoxy pulp is injected into mould and cooked inside the mould in
200 ºC during 25-35 minutes (cooking time depends on thickness of part). Cooking
temperature should be same during all operations, otherwise injected pulp can be scrap due to
insufficient heating or over heating. To manage the heat stabilization there are thermocouples
which is inserted inside the mould. Moulds are connected to injection machine body by
special connecting parts but heat transfer realize from mould to machine body. It cause over
electricity consumption. Special heat isolation materials were researched to decrease this
unwanted heat transfer. A special heat isolation plates have been found in Swiss. Heat transfer
coefficient was very low. 30 isolation plates imported from Swiss and then plates were
adapted between mould and machine. After this modification electricity consumption were
started to follow up. Before modification there was 1.6 kWh electricity consumption per 1
kilogram epoxy pulp, after modification electricity consumption per 1 kilogram epoxy pulp
had been decreased to 1.15 kWh, it is equal to 28% electricity saving per kilogram.
2.2.1.7 Improvement of Lighting System
One timer was installed in electricity distribution panel to manage lighting lamps. Timer
was set to close lamps at 07 o’clock in the morning and open the lamps at 08 o’clock pm.
Later one shadow sensor were adapted to system, system became more powerful to manage
the lighting operations. Shadow sensor help to manage the lighting system according to light
flux level. Daylight usage increased by this modification.
2.2.1.8 Reduction of LPG Usage
Workshops are heated by radiant heating system. Three thermostats were added to control
workshop’s ambient temperature. There were two manual controlled heavy doors in
workshop. There were some gaps around the door’s frame which allows air ventilation. It is
decided to replace the existing doors with remote controlled, automated door systems. This
modification was budgeted and put the annual environmental management program and this
modification was realized in 2002. Before modifications, there was 1.3 Lt/m² LPG
consumption, after modification LPG consumption ratio had been decreased to 0.8 Lt/m² and
ambient temperature stabilization were provided by this way.
2.2.1.9 Recovery of Epoxy Scraps
After changing solid waste regulation in 2002, disposal method and place were
researched. First, necessary tests has been done in a cement factory and it was observed that
the burning gases effects of epoxy scraps on the existing ratios of other flue gases were not
critical. After these tests, Factory A agreed with Cement Factory to make disposal the epoxy
scraps in cement factory. Factory A prepared an agreement for disposal firm, according to this
agreement disposal firm started to brake scraps to take the worthy materials which are inside
the scraps (copper, iron, aluminum), later scrap firm transferred the pure epoxy scraps to
cement factory. Cement factory started to use epoxy scrap as fuel by mixing other coals. After
this arrangement 180 kilograms aluminum, 1144 kilograms copper, and 3090 kilograms
epoxy and 287 kilograms iron were recovered during first three months of 2003.
2.2.2 Off Site Recycling Applications
2.2.2.1 Solid Epoxy Wastes
These wastes are segregated in special containers and collected in different areas. Than
they are sold to scrap dealer because these wastes can be used. Scrap dealer breaks the
polymerized epoxy wastes into pieces and segregate the metallic parts. Than they sell these
pieces to cement factories as a fuel for off site recycling.
2.2.2.2 Metal Scraps
Copper, Aluminum, Brass and Iron are the main kinds of metal scraps. These scraps are
collected separately in different containers and sold to a scrap dealer for off site recycling.
2.2.2.3 Waste Oils
Waste oils (generally originated from hydraulic oil leakages) are collected and sold to
licensed firm for off site recycling.
2.2.3 Treatment Applications
2.2.3.1 Domestic Wastewaters
The daily usage sourced domestic wastewater is collected separately by sewer system and
sent to wastewater treatment plant of the factory.
2.2.3.2 Industrial Wastewaters
The process based wastewaters are collected and treated with a separate wastewater
treatment plant, which has a capacity of 10 m3/day.
2.2.4 Disposal Applications
2.2.4.1 Quarts Dusts
The dirty sacks of quarts dusts and quarts dusts on the floor are collected in special containers and sent to incineration plant for disposal.
2.2.4.2 Waste Sludges
The waste sludges generated from treatment applications are collected in special basins for
sludge dewatering.
2.3 Obtained Results
In Factory A, four main performance indicators were defined to measure the effectiveness
of Environmental Management System. These indicators are waste ratios, electricity
consumption/ unit product, LPG consumption / unit product and water consumption / unit
product.
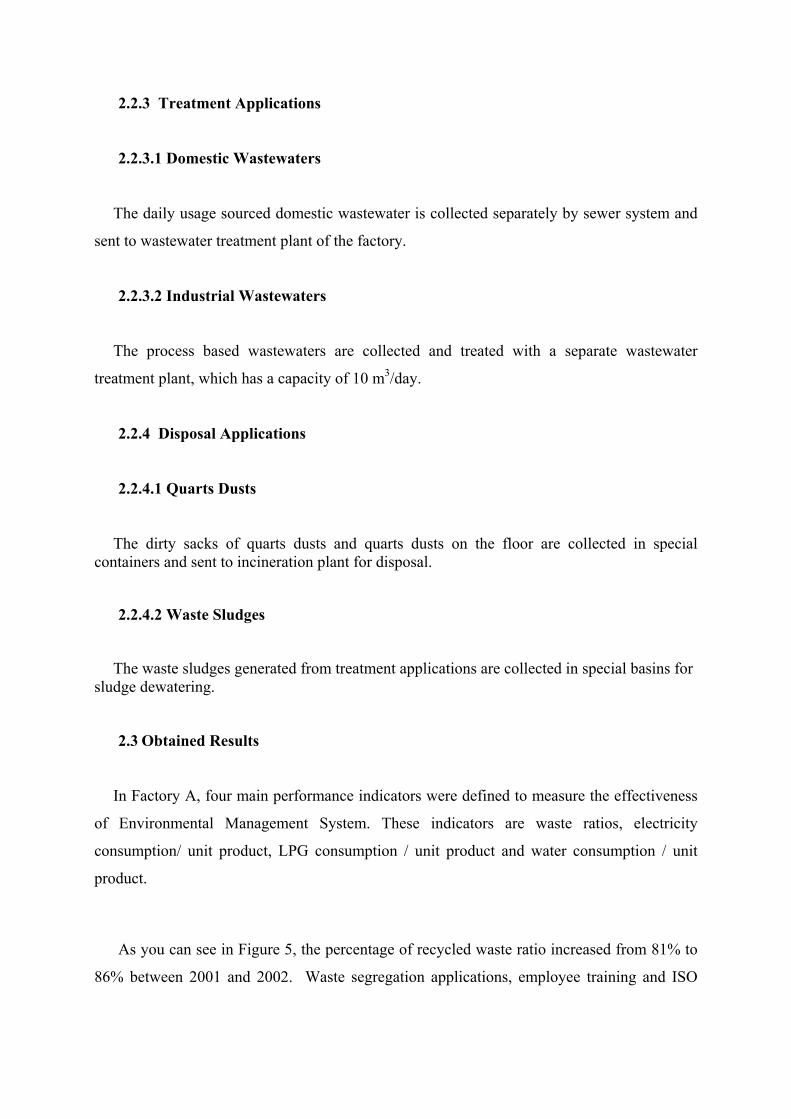
As you can see in Figure 5, the percentage of recycled waste ratio increased from 81% to
86% between 2001 and 2002. Waste segregation applications, employee training and ISO
14001 Environmental Management System implementation studies explain us the reason of
this positive increasing in recycled waste ratio.
Figure 5 Comparison of Waste Ratios
Also we can see the other positive effect on decreasing of hazardous & industrial waste
ratios. After waste minimization applications the hazardous and industrial waste ratio had
been decreased, some of these wastes had been recycled and recycled waste ratio had been
increased by this way. If you look at the domestic waste ratio’s comparison; you will see that
2002 domestic waste ratio is slightly higher than 2001 results. When increasing reasons have
been investigated, it was understood that employee quantity’s increasing in 2002 is the main
reason of increasing in 2002’s domestic waste ratio.
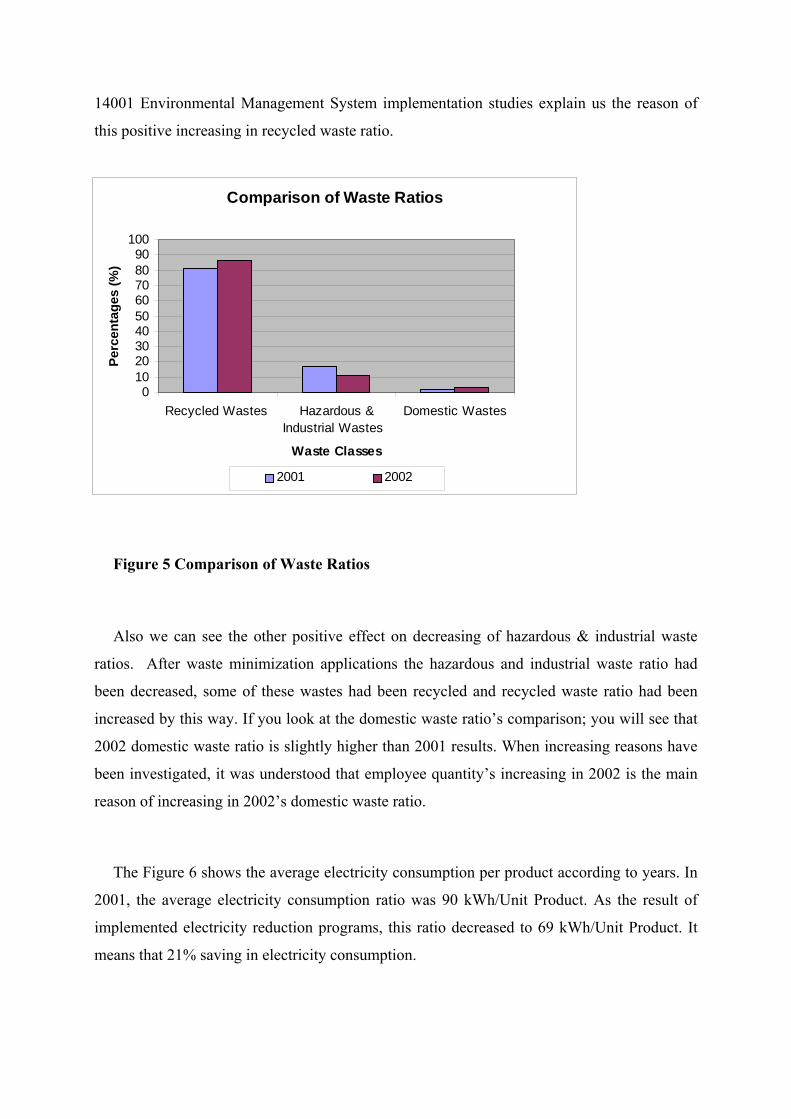
The Figure 6 shows the average electricity consumption per product according to years. In
2001, the average electricity consumption ratio was 90 kWh/Unit Product. As the result of
implemented electricity reduction programs, this ratio decreased to 69 kWh/Unit Product. It
means that 21% saving in electricity consumption.
Comparison of Waste Ratios
0102030405060708090
100
Recycled Wastes Hazardous &Industrial Wastes
Domestic Wastes
Waste Classes
Perc
enta
ges
(%)
2001 2002
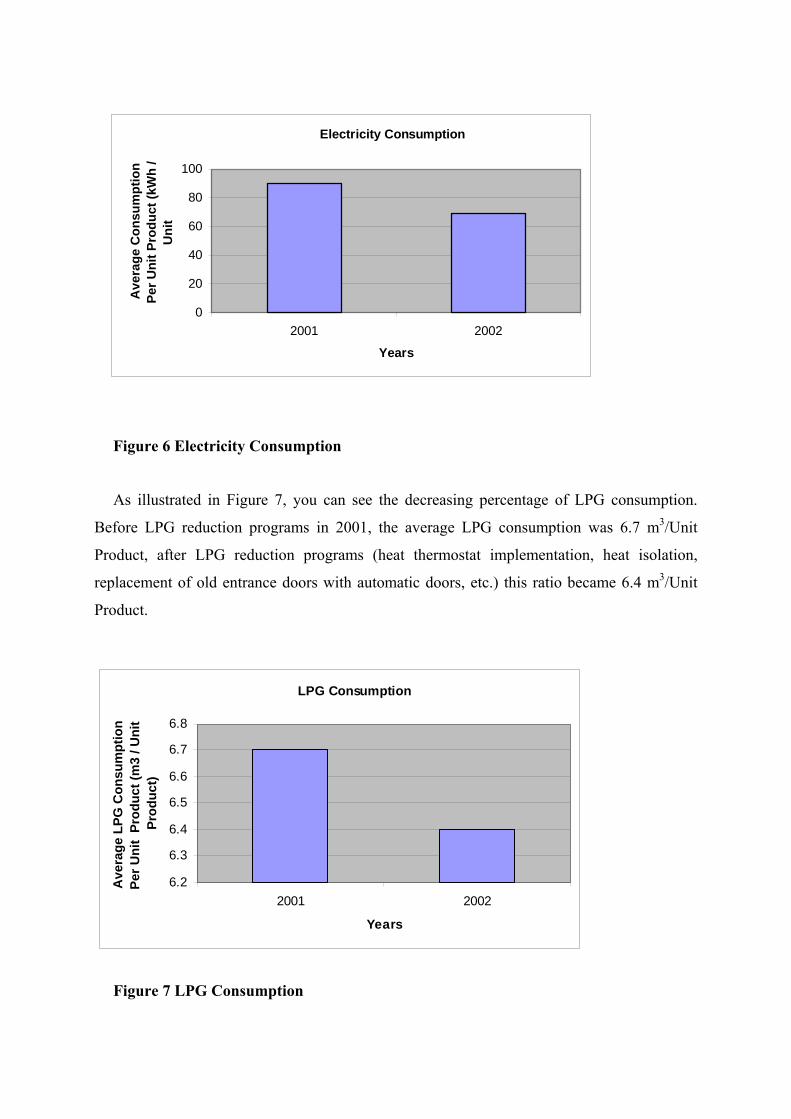
Figure 6 Electricity Consumption
As illustrated in Figure 7, you can see the decreasing percentage of LPG consumption.
Before LPG reduction programs in 2001, the average LPG consumption was 6.7 m3/Unit
Product, after LPG reduction programs (heat thermostat implementation, heat isolation,
replacement of old entrance doors with automatic doors, etc.) this ratio became 6.4 m3/Unit
Product.
Figure 7 LPG Consumption
Electricity Consumption
0
20
40
60
80
100
2001 2002
Years
Ave
rage
Con
sum
ptio
n Pe
r Uni
t Pro
duct
(kW
h /
Uni
t
LPG Consumption
6.2
6.3
6.4
6.5
6.6
6.7
6.8
2001 2002
Years
Ave
rage
LPG
Con
sum
ptio
n Pe
r Uni
t Pr
oduc
t (m
3 / U
nit
Prod
uct)
Environmental Management System forces the companies to measure and monitor their
sources and offers a systematic approach to evaluate results. Continuous improvement rule
of Environmental Management System forces the companies to take actions to save
sources.
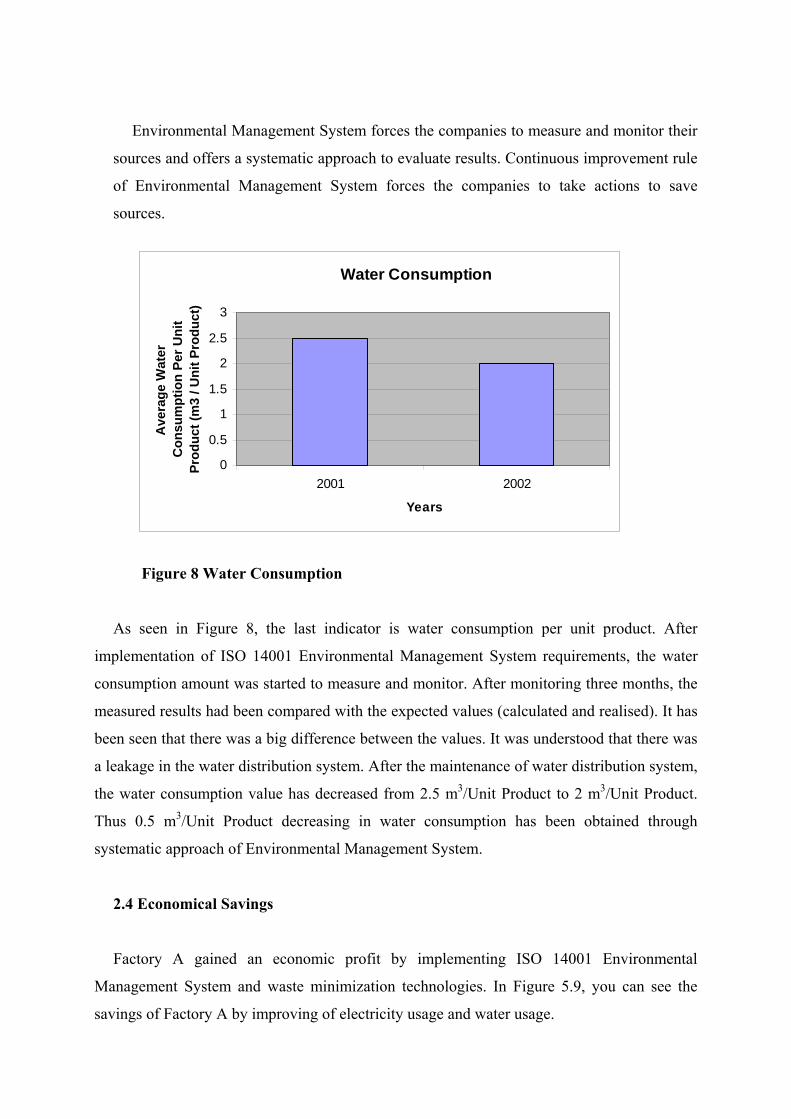
Figure 8 Water Consumption
As seen in Figure 8, the last indicator is water consumption per unit product. After
implementation of ISO 14001 Environmental Management System requirements, the water
consumption amount was started to measure and monitor. After monitoring three months, the
measured results had been compared with the expected values (calculated and realised). It has
been seen that there was a big difference between the values. It was understood that there was
a leakage in the water distribution system. After the maintenance of water distribution system,
the water consumption value has decreased from 2.5 m3/Unit Product to 2 m3/Unit Product.
Thus 0.5 m3/Unit Product decreasing in water consumption has been obtained through
systematic approach of Environmental Management System.
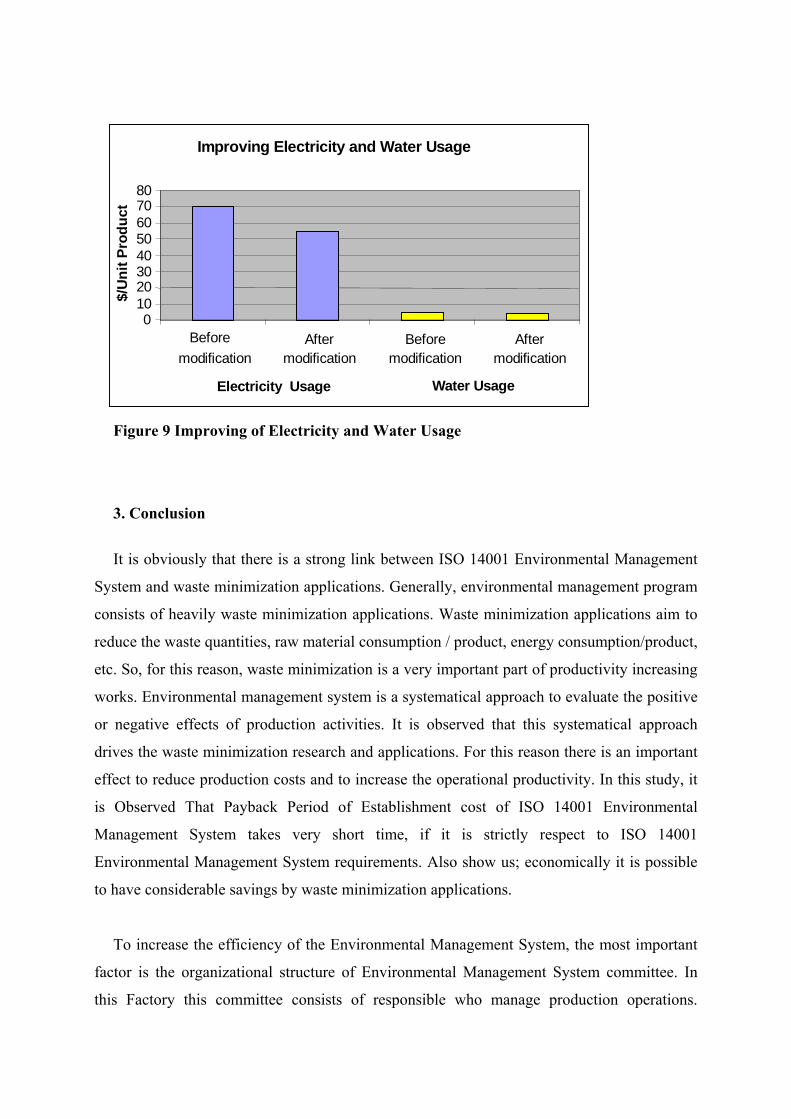
2.4 Economical Savings
Factory A gained an economic profit by implementing ISO 14001 Environmental
Management System and waste minimization technologies. In Figure 5.9, you can see the
savings of Factory A by improving of electricity usage and water usage.
Water Consumption
0
0.5
1
1.5
2
2.5
3
2001 2002
Years
Ave
rage
Wat
er
Con
sum
ptio
n Pe
r Uni
t Pr
oduc
t (m
3 / U
nit P
rodu
ct)
Improving Electricity and Water Usage
01020304050607080
Beforemodification
Aftermodification
Beforemodification
Aftermodification
Water Usage
$/U
nit P
rodu
ct
Electricity Usage
Figure 9 Improving of Electricity and Water Usage
3. Conclusion
It is obviously that there is a strong link between ISO 14001 Environmental Management
System and waste minimization applications. Generally, environmental management program
consists of heavily waste minimization applications. Waste minimization applications aim to
reduce the waste quantities, raw material consumption / product, energy consumption/product,
etc. So, for this reason, waste minimization is a very important part of productivity increasing
works. Environmental management system is a systematical approach to evaluate the positive
or negative effects of production activities. It is observed that this systematical approach
drives the waste minimization research and applications. For this reason there is an important
effect to reduce production costs and to increase the operational productivity. In this study, it
is Observed That Payback Period of Establishment cost of ISO 14001 Environmental
Management System takes very short time, if it is strictly respect to ISO 14001
Environmental Management System requirements. Also show us; economically it is possible
to have considerable savings by waste minimization applications.
To increase the efficiency of the Environmental Management System, the most important
factor is the organizational structure of Environmental Management System committee. In
this Factory this committee consists of responsible who manage production operations.
Additionally environmental responsibilities added to their job descriptions. By this way, the
responsibility of the Environmental Management System do not belong to only
Environmental Management System Representative, this responsibility was penetrated to all
employees from top management to operators.
Environmental Management System training was organized to suppliers and
subcontractors, which works for factory to give information about Environmental
Management System requirements. It is aimed to penetrate the Environmental Management
System applications to the suppliers and subcontractors. But general economic conditions of
Turkey are not suitable to implement Environmental Management System in small sized
companies. Especially they could not achieve expected waste segregation and disposal
performance due to economical reasons.
It is observed that Environmental Management System applications have been taken as a
systematical tool in waste minimization studies and results has been taken in a very short
time. Environmental Management System has a positive effect for decreasing costs,
increasing productivity and improving work conditions. It is strongly advised to other
companies due to explained reasons and economical benefits, to have competitive advantage
in world market.
In factory A, the total ISO 14001 Environmental Management System implementation
time has taken along eight months. The phases and their time plan can be seen exactly in
Figure 3, Time Schedule of ISO 14001 Implementation. The main operation steps, planning
phase has taken 7 weeks; implementation and operation phase has taken 18 weeks and
checking and corrective action phase has taken 4 weeks.
By implementing ISO 14001 Environmental Management System and by developing
special waste minimization techniques, organizations can gain economical advantages. In
Figure 9, the economical savings of Factory A about water and electricity consumption pays
can be seen. This figure does not mean the organizations implementing these systems only
gain savings by improving water and electricity usage. They can make economical savings on
several subjects (by raw material saving, by waste recycling, etc.). ISO 14001 Environmental
Management is a system, which has several benefits on several issues; economical benefits
should be announced by the organizations, which are implementing this system and
government. By this way the organizations should be supported and convinced to implement
this system.
References
Dods, O.A. (1997). How It All Began- The Story Behind ISO and the Environment. The ISO
14000 Environment. P.4.
ISO, 2001. The ISO Survey of ISO 9000 and ISO 14000 Certificates. Eleventh Cycle: Up
To and Including 31 December 2001. ISO.
BWQI, Bureau Veritas Quality International (2003, August 22). (Personal interview)
Shen, T.T. (1995). Industrial Pollution Prevention. Germany: Springer – Verlag Berlin
Heidelberg.
Stapleton P.J., Glover M.A. (2001). Environmental Management Systems: An
Implementation Guide for Small and Medium-Sized Organizations. United States of
America: NSF International