waste rock segregation methodology
TRANSCRIPT
Midwest Project Environmental Impact Statement
Appendix X
Waste Rock Segregation Methodology
AREVA Resources Canada Inc. September 2011

Appendix X Table of Contents
AREVA Resources Canada Inc. Page i September 2011 Midwest Project EIS
APPENDIX X
Waste Rock Segregation Methodology
TABLE OF CONTENTS
SECTION PAGE
1 INTRODUCTION .................................................................................................... 1
2 XRF TECHNOLOGY .............................................................................................. 3
2.1 Background ............................................................................................................ 3
2.2 Limitations .............................................................................................................. 3
2.3 Instrumentation ...................................................................................................... 4
3 PROCEDURES ...................................................................................................... 5
3.1 Introduction ............................................................................................................ 5
3.2 Sampling Protocol ................................................................................................. 5
3.3 Sample Preparation and Analysis ........................................................................ 6
4 RESULTS............................................................................................................... 7
4.1 Initial Test Samples................................................................................................ 7
4.1.1 Methodology............................................................................................... 7 4.1.2 Results ....................................................................................................... 8
4.2 Sue A Mining .......................................................................................................... 9
4.2.1 Methodology............................................................................................... 9 4.2.2 Results ....................................................................................................... 9
4.3 Sue E Mining......................................................................................................... 10
4.3.1 Methodology............................................................................................. 10 4.3.2 Results ..................................................................................................... 10
5 CONCLUSIONS ................................................................................................... 11
6 REFERENCES ..................................................................................................... 12
Appendix X List of Tables
AREVA Resources Canada Inc. Page ii September 2011 Midwest Project EIS
LIST OF TABLES
Table 4.1 Sue E mining – XRF results (Arsenic Concentrations in ppm)
Appendix X List of Figures
AREVA Resources Canada Inc. Page iii September 2011 Midwest Project EIS
LIST OF FIGURES
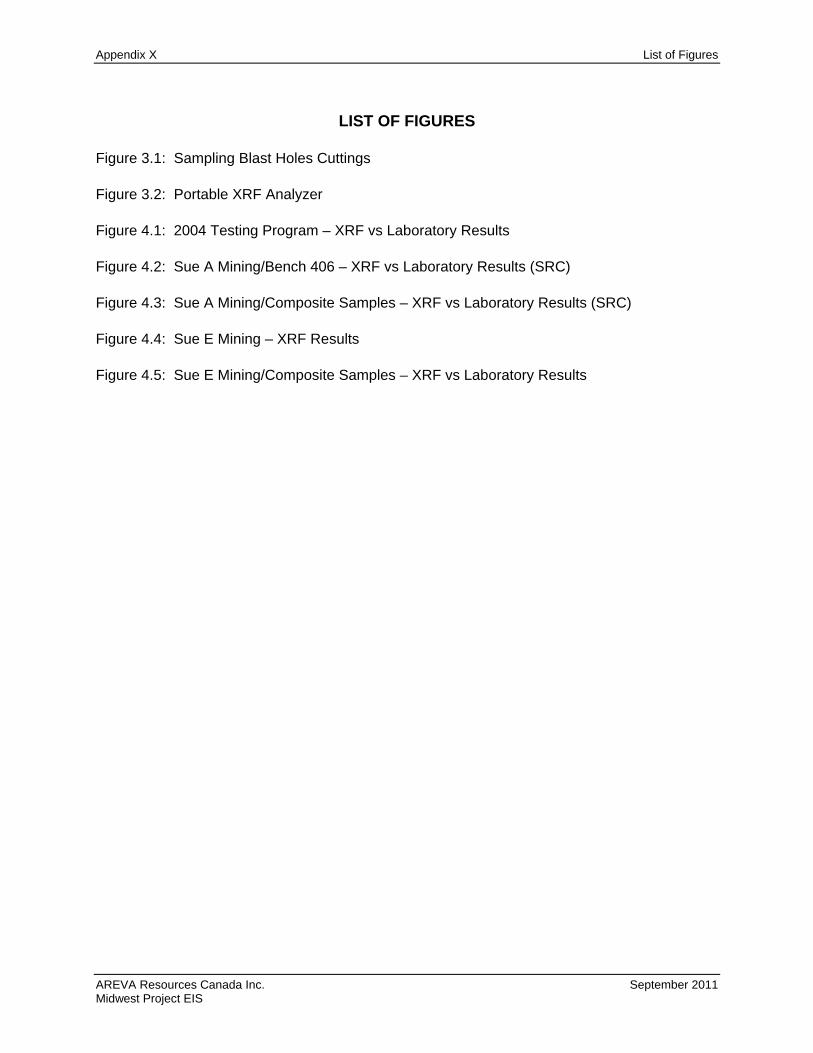
Figure 3.1: Sampling Blast Holes Cuttings
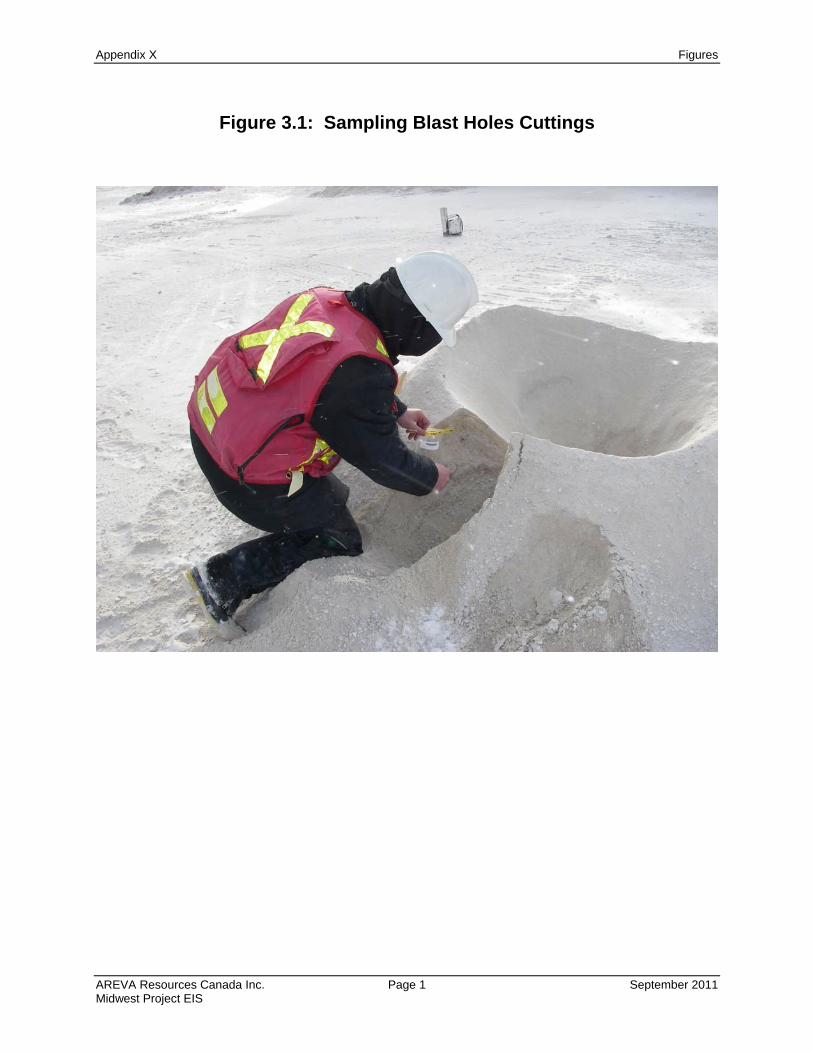
Figure 3.2: Portable XRF Analyzer
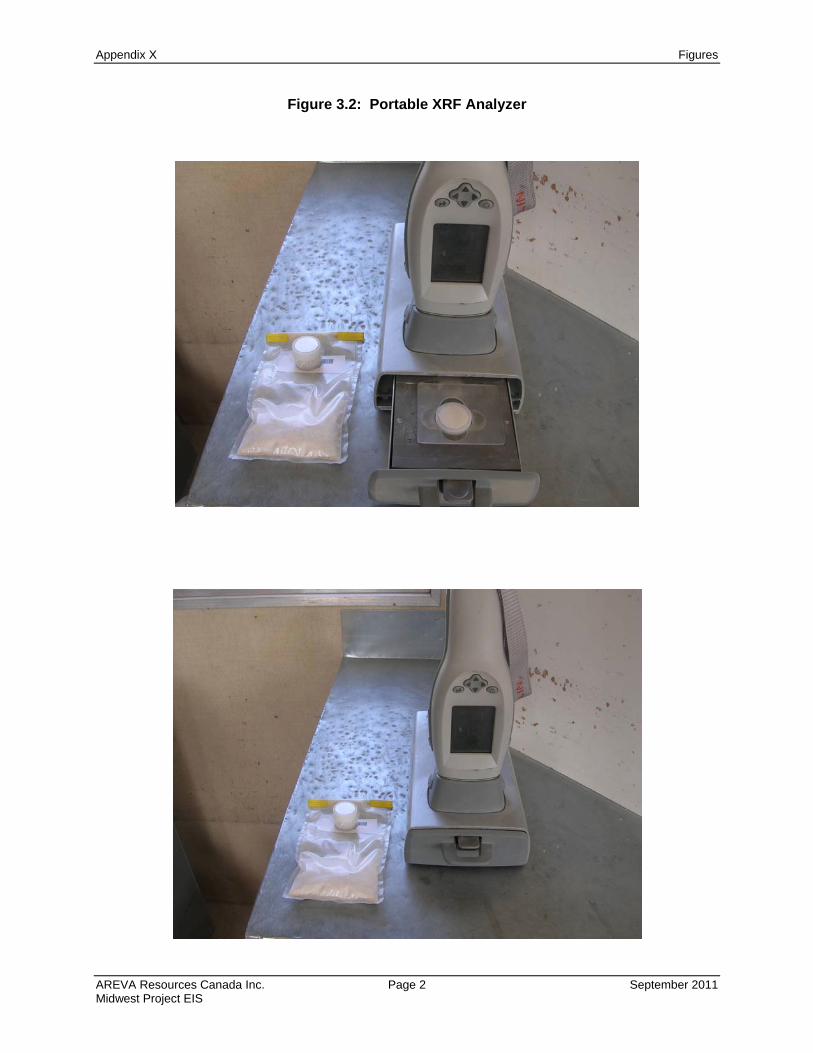
Figure 4.1: 2004 Testing Program – XRF vs Laboratory Results
Figure 4.2: Sue A Mining/Bench 406 – XRF vs Laboratory Results (SRC)
Figure 4.3: Sue A Mining/Composite Samples – XRF vs Laboratory Results (SRC)
Figure 4.4: Sue E Mining – XRF Results
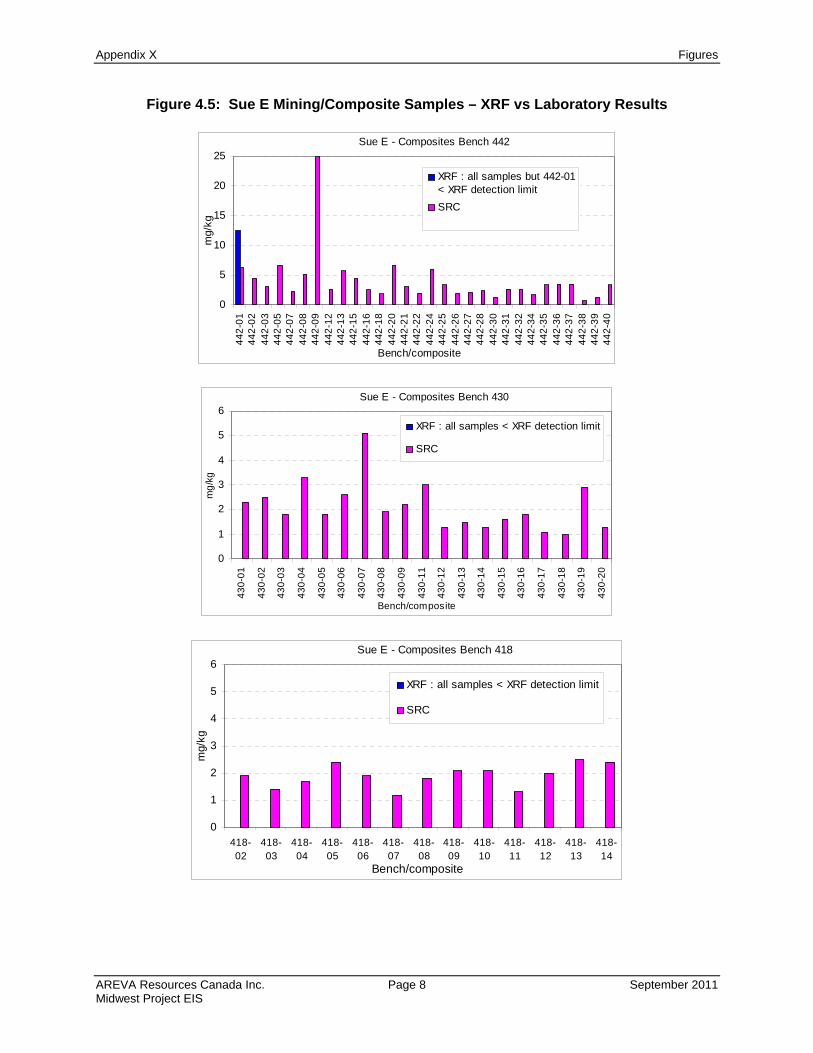
Figure 4.5: Sue E Mining/Composite Samples – XRF vs Laboratory Results

Appendix X - Section 1 Introduction
AREVA Resources Canada Inc. Page 1 September 2011 Midwest Project EIS
1 INTRODUCTION
During mining of the Midwest open pit, it will be necessary to ensure that all waste rock placed on the clean waste rock stockpiles contains no significant concentration of contaminant elements, particularly uranium and arsenic. Furthermore, it will be essential to be able to make this separation during mining, prior to emplacement in surface stockpiles, and to base the segregation procedure on measured element concentrations rather than radiometric measurements alone.
Radiometric techniques have proven reliable for estimating uranium content of waste rock and will continue to be applied for waste rock segregation based on uranium grade. A similarly reliable field technique was required to estimate the arsenic content in order to properly identify clean waste rock from potentially problematic waste rock. The XRF technology was selected as the best tool able to achieve this goal. The XRF technology is capable of rapid determinations of arsenic and several other potentially problematic elements with minimal sample preparation. The technology has greatly advanced in recent years and is generally accepted as a quantitative screening tool for environmental investigations and industrial site clean up.
An evaluation program of the XRF technology was initiated in 2004. The primary objective of this program was to evaluate the analytical performance and data quality of the portable XRF technology on typical waste rock materials associated with uranium deposits located typically at the unconformity between the basement rock and the Athabasca Sandstone. The program also assessed the practical application of the instrumentation for waste rock segregation during mining.
Based on the conclusive results of the initial 2004 evaluation program, the XRF technology was further evaluated during the Sue A and Sue E open pit mining operations. The Sue A mining operation in 2005/2006 was used to assess the operational constraints associated with the XRF technology and to develop work procedures for sampling and analysis of blast holes. The waste rock management plan for the Sue A pit considered that all of the waste rock material was potentially problematic and as such all Sue A mine rock was placed in the Sue C pit. Therefore a waste rock segregation methodology was not required. However, Sue A mining provided the opportunity of a “dry run” to evaluate the performance of the XRF technology under actual mining conditions. The XRF technology is currently used as part of the Sue E open pit mining. Mining of the Sue E pit was initiated in September 2005. Since that date, systematic sampling and analysis of blast holes cuttings by XRF technology is conducted for waste rock monitoring purposes.
Appendix X - Section 1 Introduction
AREVA Resources Canada Inc. Page 2 September 2011 Midwest Project EIS
The sections following this introduction have been organized to present:
a summary of the XRF technology in Section 2,
a summary in Section 3 of the work procedures developed by the McClean Lake Geology Department concerning the use of the XRF technology for waste rock segregation purposes,
results of the initial 2004 evaluation program and results obtained as part of the Sue A and Sue E open pit mining operations in Section 4,
conclusions of the XRF technology assessment in Section 5, followed by references in Section 6.
Appendix X - Section 2 XRF Technology
AREVA Resources Canada Inc. Page 3 September 2011 Midwest Project EIS
2 XRF TECHNOLOGY
2.1 Background
Portable X-ray fluorescence (XRF) analysis has recently been accepted as a field technique to measure arsenic in dry solid samples, such as soil and dried sludge (US EPA, 2004). Improvements continue on the initial application of this field technology.
The principle of X-ray fluorescence forms the basis of the XRF analyser technology. Samples are irradiated with high-energy X-rays. For arsenic detection, a sealed 109Cd radioisotope source is used. After the sample is irradiated, atoms of certain elements in the sample may absorb the X-ray energy, dislodging electrons from the inner shell of the atoms. In this process, known as the photoelectric effect, the resulting vacancy is filled by an electron that cascades in from outer electron shells. This rearrangement of electrons results in emission of X-rays characteristics of each atom, termed X-ray fluorescence.
The XRF technique is made possible by advanced electronics and micro processors. The basic components are high performance detectors and multi channel analyzers. These are used to measure characteristic X-ray energies, which identify elements and to measure the intensity of these X-rays to estimate the concentration of the elements. The technique provides a non- destructive means of multi-element analysis.
2.2 Limitations
The analytical performance of the XRF technique is affected by a number of factors, which range from atomic structure to instrument design to sample properties. The most significant effect at the atomic level is the interference from overlapping energy spectrums and absorption of X-rays by other elements. These effects can be partly corrected by calibration using certified standards and site specific samples, by mathematical corrections to compensate for geometric effects and secondary fluorescence effects and by selecting appropriate X-ray energy levels for interference prone elements. At the instrumentation level, the measurements are strongly affected by the type of detector, the energy resolution of the detector, the X-ray energy of the source and the strength of the source.
Generally, the stronger the source and the finer the resolution of the detector, the greater the sensitivity and precision. Sample properties also have a significant effect on the measurements and include sample homogeneity, particle size, chemical composition, moisture content and temperature. Generally, sensitivity and precision increase with decreasing particle size and increasing uniformity of particle size. Moisture content below 20% does not significantly affect analytical performance.
Appendix X - Section 2 XRF Technology
AREVA Resources Canada Inc. Page 4 September 2011 Midwest Project EIS
2.3 Instrumentation
There are a number of portable XRF instrument manufacturers world wide. The instrument that was selected is a NlTON XL-702s bulk sample analyzer with a 0.35 keV resolution Si PIN detector. The unit is equipped with a 10 mCi 109Cd isotope source. The instrument is capable of simultaneously analyzing for 16 elements including uranium, which is substituted for Mo in the regular element package. The operation is relatively simple, the sample is placed below the detector and the switch to activate the unit is then depressed. The data is displayed on a LCD display in parts per million (ppm) and stored internally for downloading onto a personal computer. A total of 3,000 readings can be stored in the internal memory. The 109Cd source has a half live of 1.3 years and requires replacement every 4 years.
Appendix X -Section 3 Procedures
AREVA Resources Canada Inc. Page 5 September 2011 Midwest Project EIS
3 PROCEDURES
3.1 Introduction
Initially, it was considered that the portable XRF analyzer could be used in the field to make determinations directly from rock surfaces or blast hole cuttings. However it was realized that this would produce inconsistent and generally unreliable results given the extreme conditions present in the field; highly variable temperature and moisture conditions and variable sample properties and geometry. In addition, field use would expose the instrument to a very harsh environment where it would very likely to be damaged.
A number of procedures (“Work Instruction”) were developed in association with the use of the XRF technology for waste rock segregation purposes (AREVA, 2006a, 2006b, 2006c and 2006d). These procedures were tested and applied during Sue A and Sue E mining and will be used for the Midwest project. They are summarized in the following sections.
3.2 Sampling Protocol
To take full advantage of the XRF analyzer abilities and obtain the maximum information for reliable waste rock segregation, it was considered that the best approach is to sample all blast hole cuttings. The purpose of blast hole sampling is to provide systematic geochemical data in order to identify and properly classify waste rock material excavated from the pit. Blast hole cuttings represent bulk samples of the material intersected in each drill hole. Cuttings from regularly spaced blast holes represent systematic samples of the material contained within a given blasted volume.
For each blast, a representative sample of about 500 gms is collected from each blast hole cuttings pile. Samples are collected from drill hole cuttings on each production blast pattern. Ideally, all blast holes of regular production patterns should be sampled. However, due to numerous factors it is often not possible to sample every single blast hole. Blast hole sampling requires the following equipment: shovel and sampling spoon, labeled sample bags, clipboard with map of the current design blast pattern.
In the office; a blast layout map for the current blast pattern is printed out. Stick-on labels for the sample bags are prepared. A list of the sample numbers is first generated then imported to the label maker program. The label maker prints the date, sample number and corresponding bar code on each label. The bar code is used during the XRF analysis to read the sample number.
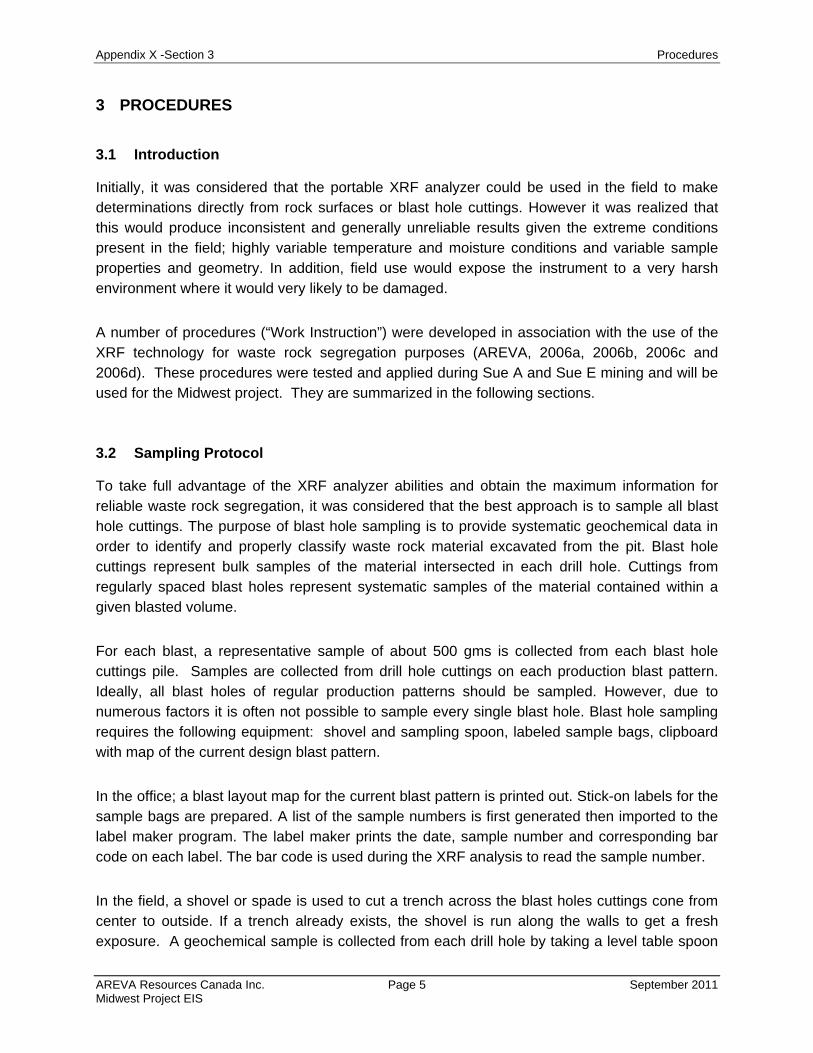
In the field, a shovel or spade is used to cut a trench across the blast holes cuttings cone from center to outside. If a trench already exists, the shovel is run along the walls to get a fresh exposure. A geochemical sample is collected from each drill hole by taking a level table spoon
Appendix X -Section 3 Procedures
AREVA Resources Canada Inc. Page 6 September 2011 Midwest Project EIS
full of material at several spots along the side of the trench to obtain about a half bag of sample. Samples are collected only from regular production holes. Pre-shear or buffer holes are not included, since these are not part of the regular grid. On ore benches, samples are collected outside the ore grids only. The samples are brought to the Geology Laboratory for processing (i.e., preparation and analysis). Figure 3.1 shows the sampling of blast holes cuttings.
3.3 Sample Preparation and Analysis
Blast hole samples are prepared and analyzed on site in order to provide immediate geochemical data for material classification. All sample preparation and geochemical analysis is done in the Geology laboratory and requires the following equipment: XRF analyzer, soil sample kit, foil sample pans and XRF sample cups.
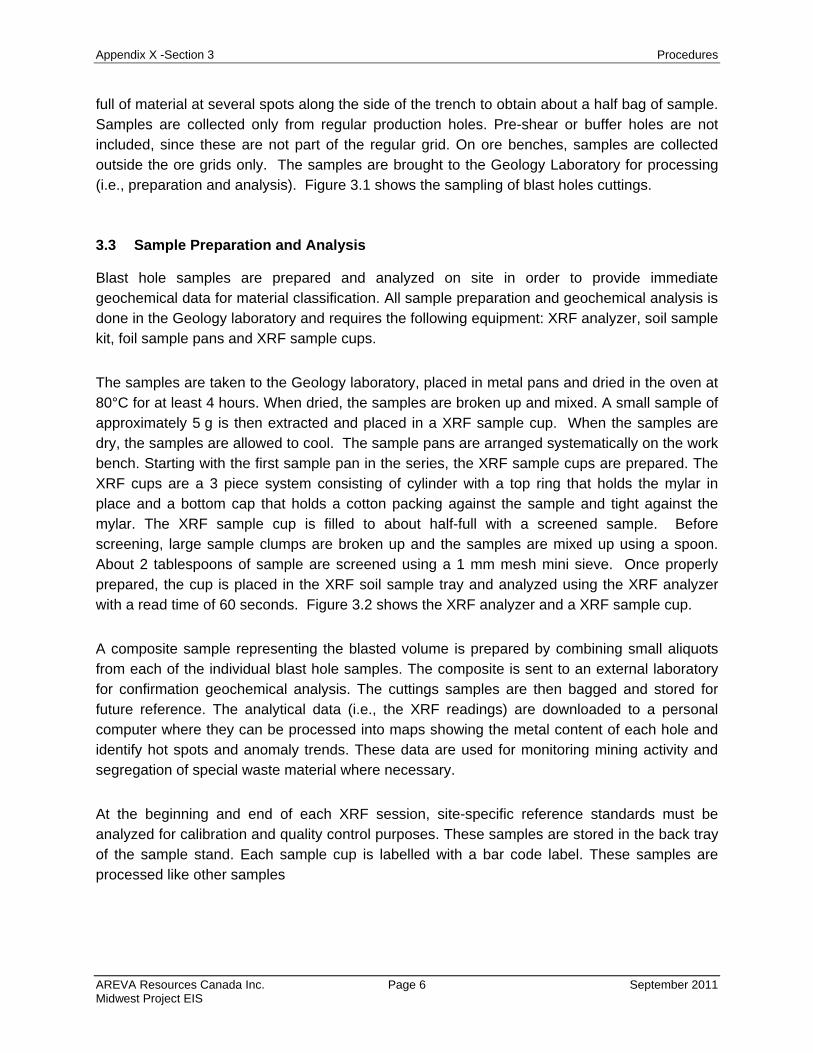
The samples are taken to the Geology laboratory, placed in metal pans and dried in the oven at 80°C for at least 4 hours. When dried, the samples are broken up and mixed. A small sample of approximately 5 g is then extracted and placed in a XRF sample cup. When the samples are dry, the samples are allowed to cool. The sample pans are arranged systematically on the work bench. Starting with the first sample pan in the series, the XRF sample cups are prepared. The XRF cups are a 3 piece system consisting of cylinder with a top ring that holds the mylar in place and a bottom cap that holds a cotton packing against the sample and tight against the mylar. The XRF sample cup is filled to about half-full with a screened sample. Before screening, large sample clumps are broken up and the samples are mixed up using a spoon. About 2 tablespoons of sample are screened using a 1 mm mesh mini sieve. Once properly prepared, the cup is placed in the XRF soil sample tray and analyzed using the XRF analyzer with a read time of 60 seconds. Figure 3.2 shows the XRF analyzer and a XRF sample cup.
A composite sample representing the blasted volume is prepared by combining small aliquots from each of the individual blast hole samples. The composite is sent to an external laboratory for confirmation geochemical analysis. The cuttings samples are then bagged and stored for future reference. The analytical data (i.e., the XRF readings) are downloaded to a personal computer where they can be processed into maps showing the metal content of each hole and identify hot spots and anomaly trends. These data are used for monitoring mining activity and segregation of special waste material where necessary.
At the beginning and end of each XRF session, site-specific reference standards must be analyzed for calibration and quality control purposes. These samples are stored in the back tray of the sample stand. Each sample cup is labelled with a bar code label. These samples are processed like other samples
Appendix X - Section 4 Results
AREVA Resources Canada Inc. Page 7 September 2011 Midwest Project EIS
4 RESULTS
4.1 Initial Test Samples
4.1.1 Methodology
The materials selected for the initial tests were blast hole cutting samples derived from the upper levels of the Sue C pit. The samples were originally analyzed for arsenic, lead, nickel, molybdenum and uranium by ICP methods at the SRC geochemical laboratory in Saskatoon and were selected to represent a range of element concentrations. A total of 6 samples were used for testing, 3 from blast 45 and 3 from blast 46 on the 406 bench. The sample material was comprised of altered Athabasca sandstone, which is predominately a fine to medium grained quartz which may contain minor amounts of arsenic bearing minerals. The objective was to obtain samples which would resemble as near as possible, the type of material to be sorted during mining.
The original blast hole cuttings samples were a 5 kg composite from a 250 mm diameter, 12 m deep blast hole. The material was dried at 80°C, crushed in a jaw crusher to about 2 mm size and split in a riffle splitter. A portion of the split was pulverized in a ring pulverizer and sent for analysis. The remainder, about 2 kg was bagged and stored. The 2 kg sample was retrieved from storage and used for this test.
Reference analyses were performed by the mill assay laboratory. Samples were analyzed for arsenic, lead, nickel, molybdenum and uranium by ICP (Perkin Elmer-Optima 3000DV) and checked by XRF (Philips-PW2510). The primary elements of concern for waste rock segregation are arsenic and uranium. However, lead, nickel and molybdenum were included due to their close association with the uranium mineralization and therefore possible enrichment in the zone above the ore. Seven replicates of each of the six bulk samples were collected. Each consisted of approximately 30 g of material randomly selected from the bulk 2 kg sample. The selected samples contained relatively low uranium levels close to the ICP detection limit. Nickel levels were consistently below the ICP detection limit. Arsenic content ranged from 70 to 870 ppm and lead ranged from 130 to 1020 ppm. The bulk samples were relatively homogeneous.
An ideal screening tool for waste rock segregation would require minimal sample preparation. However, in order to fairly evaluate the method and maintain a consistent sample set-up and reduce any bias due to sample geometry, the samples were prepared in 32 mm XRF sample cups. The cups were placed in the soil sampling kit supplied with the NlTON analyzer.
Similar to the reference samples, seven individual replicate samples were made from each of the 6 bulk samples. Each sample consisted of about 5 g of material randomly selected from the

Appendix X - Section 4 Results
AREVA Resources Canada Inc. Page 8 September 2011 Midwest Project EIS
bulk sample and placed in an XRF sample cup. Each sample cup was analyzed using the NITON XL702S analyzer and run five separate times without moving the sample cup or the instrument from the test stand. A total of 210 determinations were made with the analyzer.
The measurement read time is an important factor for XRF data quality. Generally longer read times produce higher precision and accuracy. In order to balance quality data and production, a read time of 60 seconds was selected. This interval is suggested in most protocols for screening applications. A read time of 60 seconds (instrument time) was used as the standard read time for all analysis by the NlTON analyzer for this test.
4.1.2 Results
Detection Limit
The detection limit is affected by a number of factors including the uncertainty in the calibration, instrumentation efficiency and sample properties and composition. The detection limit reported by NlTON for the XL700 series analyzers (109Cd source) at 60 second count time on NlST
standard reference soil materials is 25 g/g for arsenic.
Replicate analysis of low-concentration samples were used to determine the average method- based detection limit; that is the detection limit associated with the current analyzer-sample material combination. The detection limit for arsenic in the test samples was roughly 40 ppm, based on the occurrence of some less than detection determinations in samples with an average As content of 40 ppm. The method based detection limit, defined as three times the standard deviation of the low-concentration samples was estimated at 44 ppm. This value is the average of 21 replicate samples. These values are consistent with results presented in the EPA test method SW-846 6200 (US EPA 2004), which suggests an interference free detection limit
of 40 g/g.
Precision
Precision is the reproducibility of a measurement and was estimated by analyzing a series of samples with a range of target element concentration. Five separate measurements were made on each of the replicate samples. Generally, the precision in the range of the action or cut-off level of a specific element is the more important precision measurement. The relative standard deviation was used to asses the method based precision, a value of less than 20% was considered adequately precise for most applications.
For arsenic, in the 100-200 ppm range the average relative standard deviation was 9% with a maximum of 16%. The average standard deviation for all test samples, with arsenic concentrations ranging from 40 ppm to 100 ppm, was 7%.

Appendix X - Section 4 Results
AREVA Resources Canada Inc. Page 9 September 2011 Midwest Project EIS
Accuracy
Accuracy is the comparability to an accepted reference analysis and was evaluated by using linear regression analysis. The correlation between the arsenic analysis by XRF and the reference analysis for all samples was high (r2=0.98), indicating a regular relationship between the two data sets. In general, the XRF values were slightly lower than the reference values at low concentration but higher at high concentration (Figure 4.1). The cross over seemed to occur at approximately 150 - 200 ppm. The differences were significant in the range of concentrations encountered in the sample set, ranging from -16% in the low content sample to +43% in the high content sample. This trend indicates that the built-in instrument calibration requires a correction and must be adjusted by varying the slope of the line or the intercept to best fit the XRF values to the reference values in order to obtain accurate data. Generally an acceptable difference is within 20%. This adjustment is made by the manufacturer. Note that since the cross over occurred in the cut-off range for arsenic, the method based accuracy can be represented by the XRF readings for a sample in the 200 ppm range. An accuracy of 5% is estimated for the arsenic values by XRF.
4.2 Sue A Mining
4.2.1 Methodology
Mining of the Sue A open pit was initiated in late July 2005 with the first blast shot July 19th.
Based on the conclusive results of the initial 2004 evaluation program, the XRF technology was further evaluated during Sue A mining and XRF geochemical analysis of the blast holes cuttings were initiated at the 442 bench of the pit. Mining activities ceased in the Sue A pit on March 31, 2006 after all economic ore on the 376 bench had been extracted. From the 442 bench to the 376 bench, a total of approximately 1,000 blast holes samples were collected and analyzed. In addition a systematic comparison between XRF and laboratory results was conducted for 51 blast holes samples from the 406 bench/blast 01, and 12 composite samples from the 406 and 394 benches.
The waste rock management plan for the Sue A pit considered the placement of all Sue A mine rock in the Sue C pit. Therefore a waste rock segregation methodology was not required. Sue A mining was used as a “dry run” to assess the operational constraints associated with the XRF technology and to develop work procedures for sampling and analysis of blast holes.
4.2.2 Results
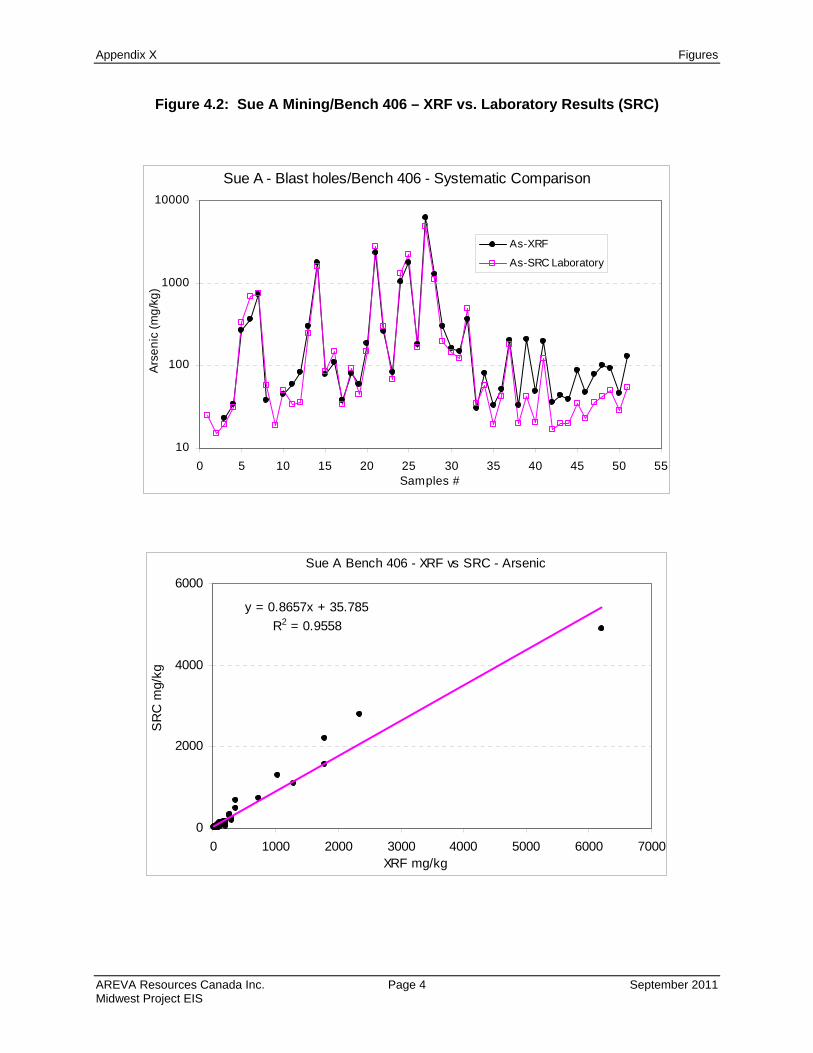
Figure 4.2 shows the comparison between portable XRF and laboratory (SRC) analysis for 51 blast hole samples from the 406 bench. In the Sue A pit, the samples from blast 406-01 were
Appendix X - Section 4 Results
AREVA Resources Canada Inc. Page 10 September 2011 Midwest Project EIS
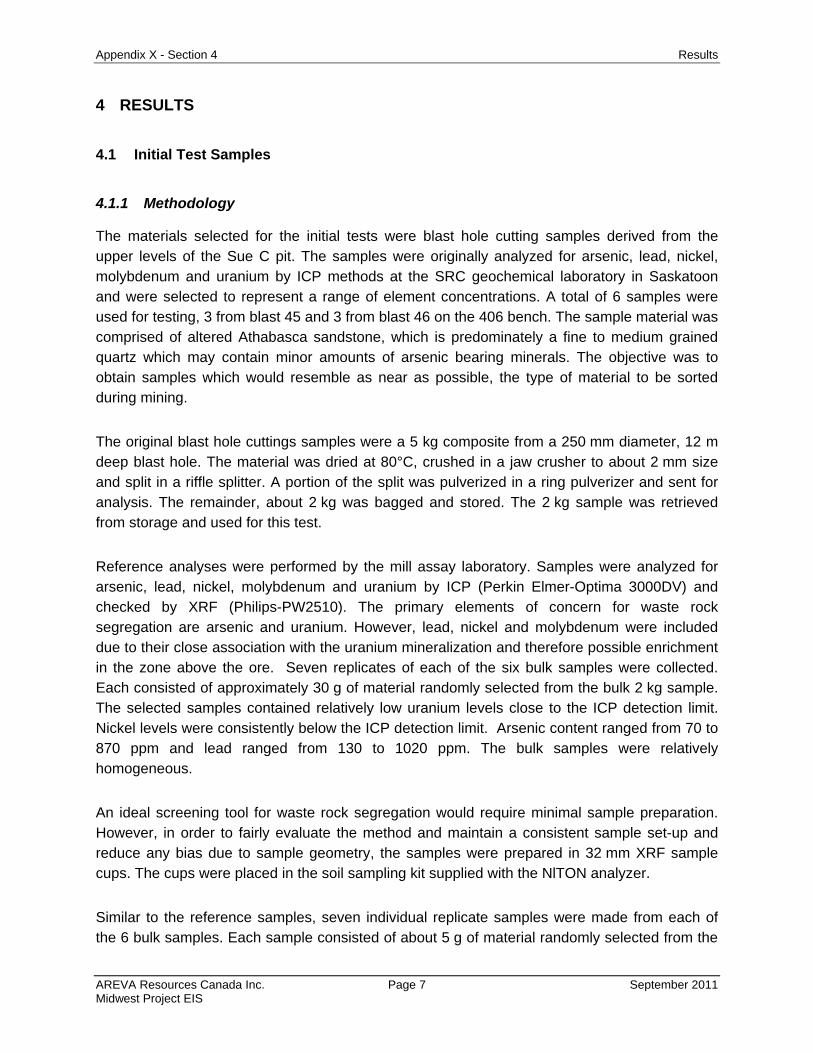
consistently anomalous in arsenic with concentrations ranging from 23 ppm to 6,200 ppm, averaging approximately 400 ppm arsenic while the maximum uranium concentration was 67 ppm. The samples from blast 406-02 and 406-04 were also highly anomalous in arsenic, averaging approximately 13,284 ppm arsenic and a maximum uranium value of 209 ppm. Figure 4.2 indicates a good correlation between portable XRF and laboratory results (r2 ~ 0.96). For arsenic concentrations lower than 200 ppm, the XRF results tend to be slightly higher than the laboratory results.
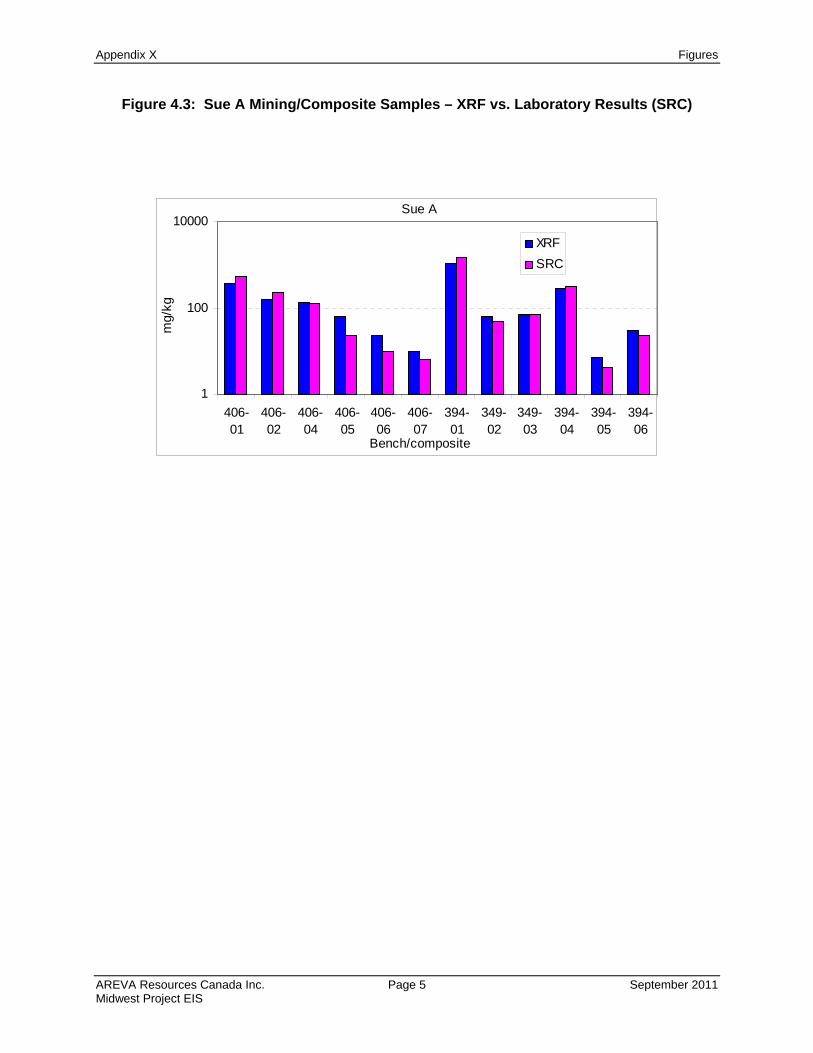
Figure 4.3 shows also a good correlation between XRF and laboratory results for the composite samples. For arsenic concentrations lower than 100 ppm, the XRF results tend to be slightly higher than the laboratory results.
4.3 Sue E Mining
4.3.1 Methodology
Mining of the Sue E pit was initiated in September 2005. Since that date, systematic sampling and analysis of blast holes cuttings by XRF analyzer was conducted for waste rock monitoring and segregation purposes.
From the 442 bench to the 406 bench, a total of approximately 5,500 blast holes samples were collected and analyzed. In addition a systematic comparison between XRF and laboratory results was conducted for 69 composite samples from the bench 442 to the bench 406.
4.3.2 Results
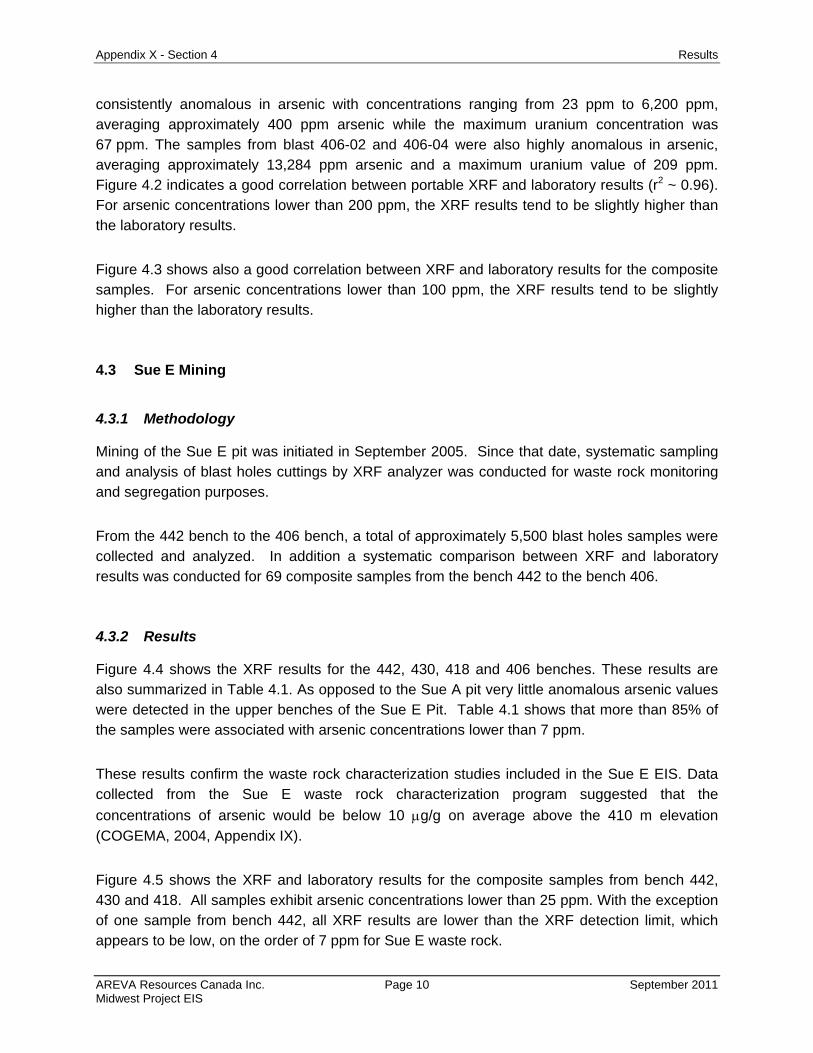
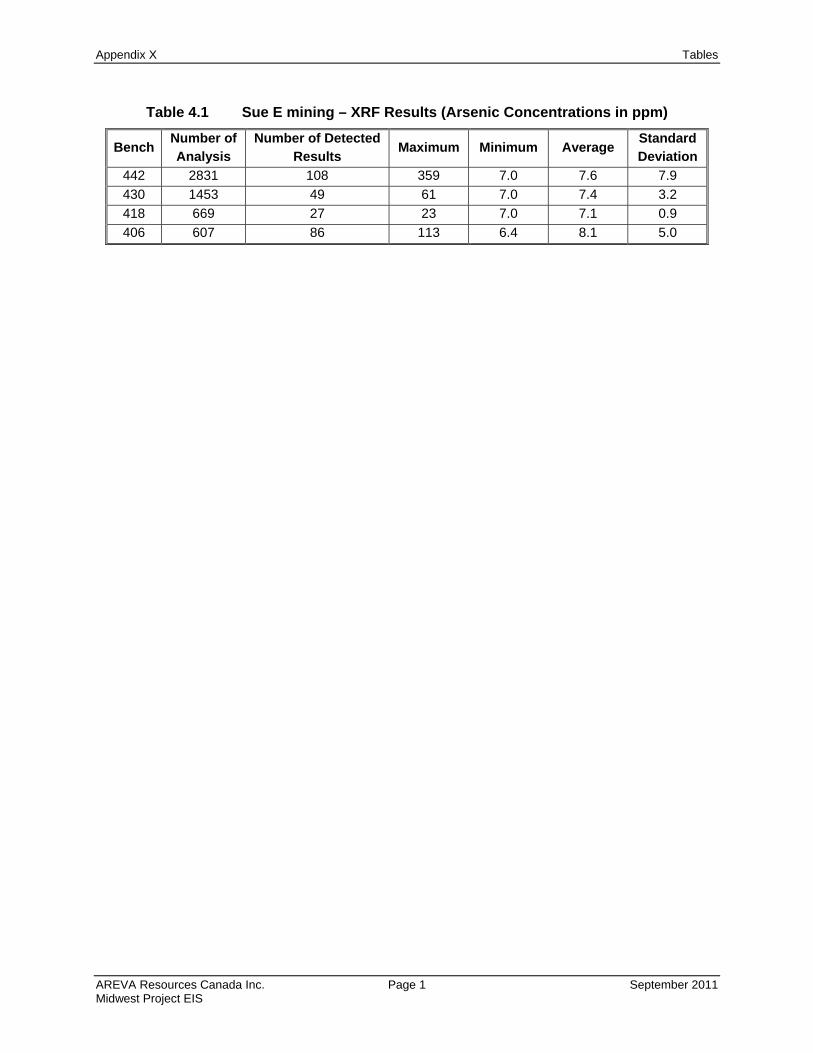
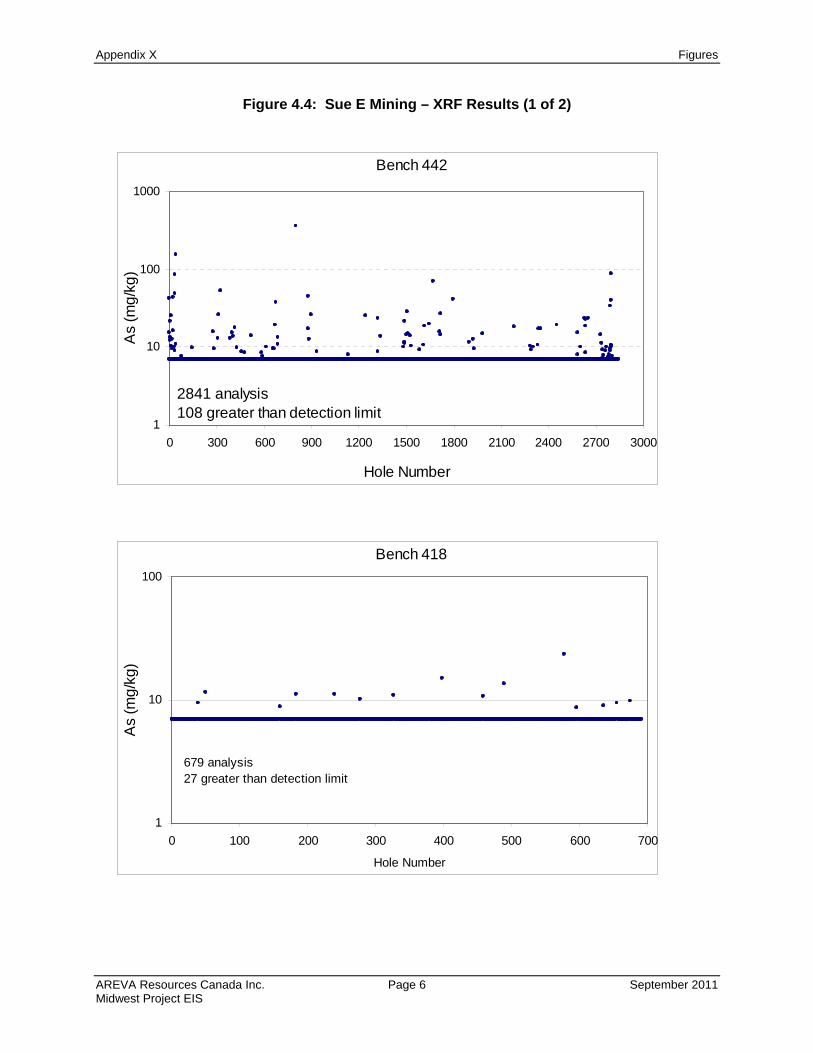
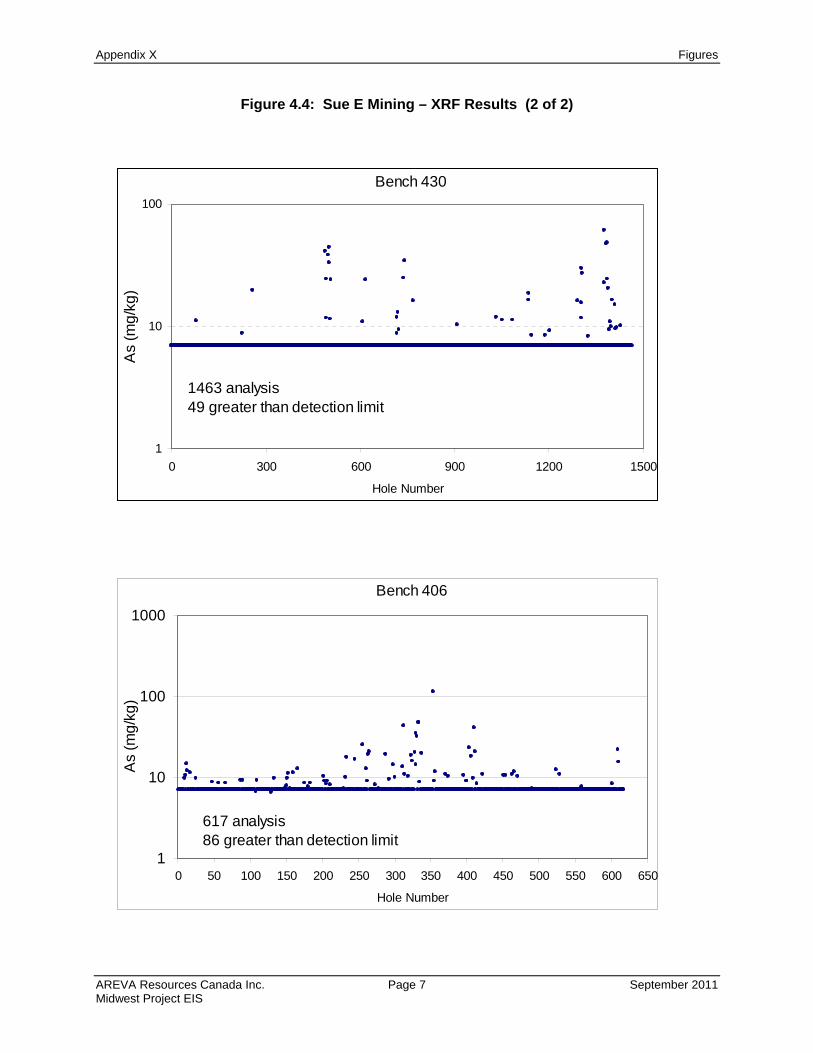
Figure 4.4 shows the XRF results for the 442, 430, 418 and 406 benches. These results are also summarized in Table 4.1. As opposed to the Sue A pit very little anomalous arsenic values were detected in the upper benches of the Sue E Pit. Table 4.1 shows that more than 85% of the samples were associated with arsenic concentrations lower than 7 ppm.
These results confirm the waste rock characterization studies included in the Sue E EIS. Data collected from the Sue E waste rock characterization program suggested that the
concentrations of arsenic would be below 10 g/g on average above the 410 m elevation
(COGEMA, 2004, Appendix IX).
Figure 4.5 shows the XRF and laboratory results for the composite samples from bench 442, 430 and 418. All samples exhibit arsenic concentrations lower than 25 ppm. With the exception of one sample from bench 442, all XRF results are lower than the XRF detection limit, which appears to be low, on the order of 7 ppm for Sue E waste rock.
Appendix X - Section 5 Conclusions
AREVA Resources Canada Inc. Page 11 September 2011 Midwest Project EIS
5 CONCLUSIONS
The tests performed on typical site waste rock samples indicate that the XRF technique is a reliable screening tool for waste rock classification and segregation on the basis of arsenic content. The XRF analyzer provides a rapid, analytical capability with a minimum of sample preparation, yet returning sufficiently accurate and precise data for reliable classification of waste rock materials. The portability of the instrument is an asset, particularity for field use. For instance, the use of the XRF analyzer directly in the field may be appropriate for general identification of anomalous zones, for "hot spots" that need monitoring or to verify that a "hot spot" had been separated out from the clean material, and for spot checks of the clean waste stockpile. However, for systematic mapping of element content for segregation purposes and for optimum data quality, it is considered that the XRF analyzer should be used in more controlled conditions with a standardized sample preparation and sample set up.
The test work performed on the Sue A, Sue C and Sue E materials shows that the XRF provides relatively low detection limits. Results from the test samples indicate that for arsenic the detection limits are well below the proposed 75 ppm cut-off level for the Midwest waste rock. The precision and accuracy are well within acceptable limits for screening purposes.
As is the case for all analytical techniques, a critical aspect is the need for a representative sample. The greatest uncertainty in the XRF analysis is probably not from the analyzer, but from the heterogeneity of the sample materials. For the above reasons, sample collection and preparation procedures have been developed and successfully tested during mining of the Sue A and Sue E pits. These procedures will be used in an analogous manner for the Midwest project.
Appendix X – Section 6 References
AREVA Resources Canada Inc. Page 12 September 2011 Midwest Project EIS
6 REFERENCES
AREVA (AREVA Canada Resources Inc.). 2006a McClean Lake Operation – Procedure No: 450, Waste Rock Mining and Monitoring, version 04, July 27, 2006.
AREVA. 2006b. McClean Lake Operation – Procedure No: 450-02, Sampling Waste Blasts, version 04, July 27, 2006.
AREVA. 2006c. McClean Lake Operation – Procedure No: 450-03, Sample Preparation and Analysis, version 04, August 10, 2006.
AREVA. 2006d. McClean Lake Operation – Procedure No: 450-09, Using the XRF Analyzer, version 04, August 10, 2006.
COGEMA (COGEMA Resources Inc.). 2004. McClean Lake Operation – Sue E Project Environmental Impact Statement, November 2004.
U.S. EPA (United States Environmental Protection Agency). 2004. Monitoring Arsenic in the Environment: A Review of Science and Technologies for Field Measurements and Sensors. EPA 542/R-04/002, April 2004.
U.S. EPA. 2004. Test Methods for Evaluation of Solid Waste, Physical/Chemical Methods (SW-846). (http://www.epa.gov/epaoswer/hazwaste/test/sw846.htm)
Appendix X List of Tables
AREVA Resources Canada Inc. September 2011 Midwest Project EIS
LIST OF TABLES
Table 4.1 Sue E mining – XRF Results (Arsenic Concentrations in ppm)
Appendix X Tables
AREVA Resources Canada Inc. Page 1 September 2011 Midwest Project EIS
Table 4.1 Sue E mining – XRF Results (Arsenic Concentrations in ppm)
Bench Number of Analysis
Number of Detected Results
Maximum Minimum Average Standard Deviation
442 2831 108 359 7.0 7.6 7.9
430 1453 49 61 7.0 7.4 3.2
418 669 27 23 7.0 7.1 0.9
406 607 86 113 6.4 8.1 5.0
Appendix X List of Figures
AREVA Resources Canada Inc. September 2011 Midwest Project EIS
LIST OF FIGURES
Figure 3.1: Sampling Blast Holes Cuttings
Figure 3.2: Portable XRF Analyzer
Figure 4.1: 2004 Testing Program – XRF vs Laboratory Results
Figure 4.2: Sue A Mining/Bench 406 – XRF vs Laboratory Results (SRC)
Figure 4.3: Sue A Mining/Composite Samples – XRF vs Laboratory Results (SRC)
Figure 4.4: Sue E Mining – XRF Results
Figure 4.5: Sue E Mining/Composite Samples – XRF vs Laboratory Results
Appendix X Figures
AREVA Resources Canada Inc. Page 1 September 2011 Midwest Project EIS
Figure 3.1: Sampling Blast Holes Cuttings
Appendix X Figures
AREVA Resources Canada Inc. Page 2 September 2011 Midwest Project EIS
Figure 3.2: Portable XRF Analyzer
Appendix X Figures
AREVA Resources Canada Inc. Page 3 September 2011 Midwest Project EIS
Figure 4.1: 2004 Testing Program – XRF vs. Laboratory Results
Arsenic - Sue C Samples
0
200
400
600
800
1000
1200
0 200 400 600 800 1000 1200
Laboratory (mg/kg)
XR
F (
mg/
kg)
Test Samples
1:1
Appendix X Figures
AREVA Resources Canada Inc. Page 4 September 2011 Midwest Project EIS
Figure 4.2: Sue A Mining/Bench 406 – XRF vs. Laboratory Results (SRC)
Sue A - Blast holes/Bench 406 - Systematic Comparison
10
100
1000
10000
0 5 10 15 20 25 30 35 40 45 50 55Samples #
Ars
en
ic (
mg
/kg
)
As-XRF
As-SRC Laboratory
Sue A Bench 406 - XRF vs SRC - Arsenic
y = 0.8657x + 35.785
R2 = 0.9558
0
2000
4000
6000
0 1000 2000 3000 4000 5000 6000 7000XRF mg/kg
SR
C m
g/kg
Appendix X Figures
AREVA Resources Canada Inc. Page 5 September 2011 Midwest Project EIS
Figure 4.3: Sue A Mining/Composite Samples – XRF vs. Laboratory Results (SRC)
Sue A
1
100
10000
406-01
406-02
406-04
406-05
406-06
406-07
394-01
349-02
349-03
394-04
394-05
394-06
Bench/composite
mg/
kg
XRF
SRC
Appendix X Figures
AREVA Resources Canada Inc. Page 6 September 2011 Midwest Project EIS
Figure 4.4: Sue E Mining – XRF Results (1 of 2)
Bench 442
1
10
100
1000
0 300 600 900 1200 1500 1800 2100 2400 2700 3000
Hole Number
As
(mg
/kg
)
2841 analysis108 greater than detection limit
Bench 418
1
10
100
0 100 200 300 400 500 600 700
Hole Number
As
(mg
/kg
)
679 analysis27 greater than detection limit
Appendix X Figures
AREVA Resources Canada Inc. Page 7 September 2011 Midwest Project EIS
Figure 4.4: Sue E Mining – XRF Results (2 of 2)
Bench 430
1
10
100
0 300 600 900 1200 1500
Hole Number
As
(mg
/kg
)
1463 analysis49 greater than detection limit
Bench 406
1
10
100
1000
0 50 100 150 200 250 300 350 400 450 500 550 600 650
Hole Number
As
(mg
/kg
)
617 analysis86 greater than detection limit
Appendix X Figures
AREVA Resources Canada Inc. Page 8 September 2011 Midwest Project EIS
Figure 4.5: Sue E Mining/Composite Samples – XRF vs Laboratory Results
Sue E - Composites Bench 442
0
5
10
15
20
25
44
2-0
14
42
-02
44
2-0
34
42
-05
44
2-0
74
42
-08
44
2-0
94
42
-12
44
2-1
34
42
-15
44
2-1
64
42
-18
44
2-2
04
42
-21
44
2-2
24
42
-24
44
2-2
54
42
-26
44
2-2
74
42
-28
44
2-3
04
42
-31
44
2-3
24
42
-34
44
2-3
54
42
-36
44
2-3
74
42
-38
44
2-3
94
42
-40
Bench/composite
mg/
kg
XRF : all samples but 442-01< XRF detection limit
SRC
Sue E - Composites Bench 430
0
1
2
3
4
5
6
43
0-0
1
43
0-0
2
43
0-0
3
43
0-0
4
43
0-0
5
43
0-0
6
43
0-0
7
43
0-0
8
43
0-0
9
43
0-1
1
43
0-1
2
43
0-1
3
43
0-1
4
43
0-1
5
43
0-1
6
43
0-1
7
43
0-1
8
43
0-1
9
43
0-2
0Bench/composite
mg
/kg
XRF : all samples < XRF detection limit
SRC
Sue E - Composites Bench 418
0
1
2
3
4
5
6
418-02
418-03
418-04
418-05
418-06
418-07
418-08
418-09
418-10
418-11
418-12
418-13
418-14
Bench/composite
mg/
kg
XRF : all samples < XRF detection limit
SRC