waste-to-energy technologies and applications
TRANSCRIPT
NREL is a national laboratory of the U.S. Department of Energy Office of Energy Efficiency and Renewable Energy operated by the Alliance for Sustainable Energy, LLC
Waste-to-Energy Technologies and Applications
E2S2 Conference
Jerry DavisMay 10, 2011
Technology Overview
Commercial and Emerging Applications
Driving Factors for Waste-to-Energy (WTE)
Variables to Consider for WTE Projects
Hybrid Plant Study
Overview
National Renewable Energy Laboratory Innovation for Our Energy Future

Thermal Biochemical
Combustion Gasification Pyrolysis
Heat Fuel Gases (producer gas) (CO + H2+CH4)
Char, gases, aerosols (syn gas)
Pretreatment
Fermentation
Transesterification
Ethanol
Biodiesel
No Oxygen
Partial Oxygen
Excess Oxygen
Digestion
CH4
Energy Pathways
National Renewable Energy Laboratory Innovation for Our Energy Future
• Heat/power/CHP
• Boiler, steam turbine
• Co-fire with coal
• Burn gas for hot water/steam (commercial)• Use in IC engine for CHP (pre-commercial)• Catalytic conversion to alcohols, chemicals, synthetic diesel (development)
•Torrefied wood for pellets, coal replacement •Pyrolysis oil for boilers and power (early commercial)• Specialty chemicals (commercial)• Further refining for transportation fuels (development)

Combustion Overview
• 86 existing commercial facilities combust 26 million tons of MSW per year in 24 states.
• Typical minimum for feasibility is 300 tons per day (tpd)
National Renewable Energy Laboratory Innovation for Our Energy Future
Typical Mass Burn WTE Layout
Source: C.S. Psomopoulos et al (2009), Waste Management 29, 1718-1724)
Avg. Emissions Profile: U.S. WTE Plants

Combustion: Emissions Profile
National Renewable Energy Laboratory Innovation for Our Energy Future
0
50
100
150
200
250
300
(mg/
Nm
3) x
sca
ling
EPA Standard (mg/Nm3)Avg. WTE (mg/Nm3) *Best-in-Class WTE (mg/Nm3) **
* Source: C.S. Psomopoulos et al (2009), Waste Management 29, 1718-1724
** Source: Themelis, N.J. (2007), Thermal treatment review, Waste Management World (July-August), 37-45•:

Gasification OverviewExothermic/Combustion Reaction Endothermic/Gasification Reactions
C + O2 -> CO2 C + H2O CO + H2 C + CO2 2COC + 2H2 CH4 CO + H2O CO2 + H2
National Renewable Energy Laboratory Innovation for Our Energy Future
Example of Biomass Gasifier
Source: Princeton Environmental
Gasification Emissions Profile: Kinsei Technology
- About 25 units operable in the U.S. using waste material feedstocks, including biomass- Primary challenge for WTE application is inconsistency of MSW as feedstock

Gasification Flexibility
National Renewable Energy Laboratory Innovation for Our Energy Future
PrimaryFeedstock
ProductsGasification
Biomass
MSW
Others
Syngas(CO+H2)
Syngas to Liquids
Syngas to Chemicals
Fischer Tropsch Upgrading
Liquid Fuels
Others
HydrogenMixed alcohols•Ethanol•Propanol
Others
Close Coupled Combustion
Boiler IC Engine Combustion Turbine

Commercial Applications
• Large scale (>300 tpd) combustion units commercially viable
National Renewable Energy Laboratory Innovation for Our Energy Future
Economy of scale due to high capital cost of emissions control equipment
Almost all commercial power systems are combustion/steam turbine Efficiencies in 15% – 30% range power only, (60% – 70% CHP) 550-650 kWh per ton of MSW Stoker and fluidized bed boilers Avg. size in the U.S. is 20 MW Installed cost: $4,000 per kW Residual material (ash) about
10% by volume, 20% by weight LCOE = $0.06 – $0.20 per kWh
(depends on tipping fee revenue)
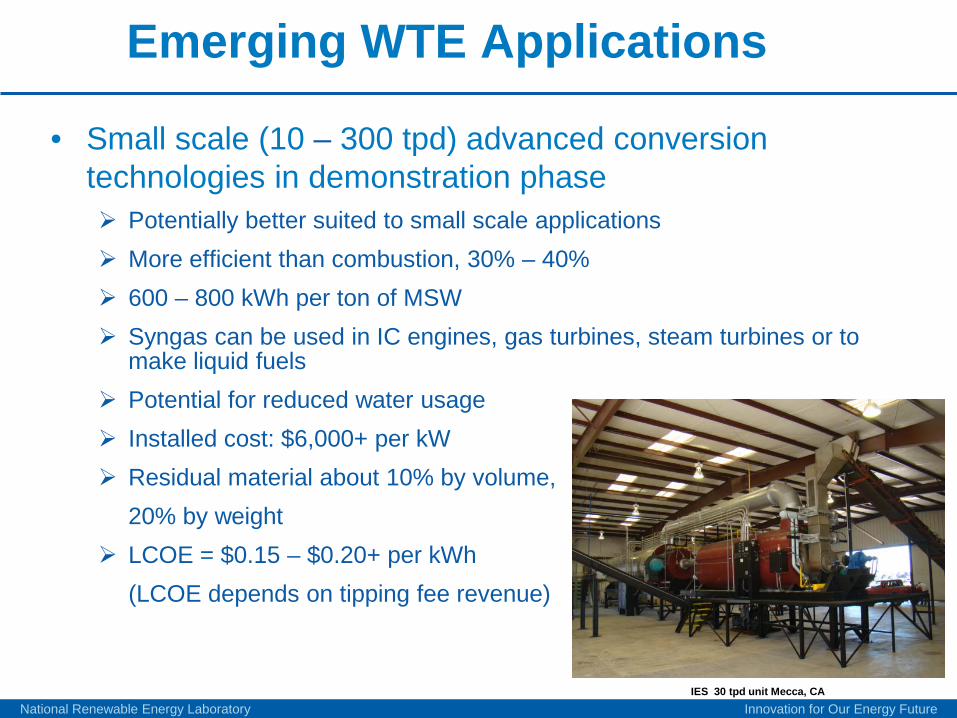
Emerging WTE Applications
• Small scale (10 – 300 tpd) advanced conversion technologies in demonstration phase Potentially better suited to small scale applications More efficient than combustion, 30% – 40% 600 – 800 kWh per ton of MSW Syngas can be used in IC engines, gas turbines, steam turbines or to
make liquid fuels Potential for reduced water usage Installed cost: $6,000+ per kW Residual material about 10% by volume,
20% by weight LCOE = $0.15 – $0.20+ per kWh
(LCOE depends on tipping fee revenue)
National Renewable Energy Laboratory Innovation for Our Energy FutureIES 30 tpd unit Mecca, CA

Emerging WTE Applications
• Expeditionary scale (.5 – 3 tpd) WTE entering limited demonstration phase Demonstration projects at Fort Irwin, Aberdeen Proving Grounds,
Edwards Air Force Base Potential forward operating base (FOB) applications Estimated loads of .32 KW – .8 KW per person 3 – 18 lb of waste generated per person per day 250 – 600 kWh per ton MSW WTE may provide 7 – 38% of the power requirement
National Renewable Energy Laboratory Innovation for Our Energy Future
Community Power Corp: MEWEPS System

Driving Factors: DoD Installations
• Cost National average solid waste disposal cost is $44 per ton Lifecycle costs for DoD landfills can exceed $100 per ton
• Space 71 active landfills on DoD installations; these are quickly reaching
capacity 400 closed landfills occupy over 5000 acres; may be possible to
“mine” these landfills for WTE and recover the land for use Currently not considered diversion per DoD’s Integrated Solid
Waste Management plan (a challenge for net zero waste goals)
• Energy WTE contributes to renewable energy generation and greenhouse
gas reduction executive orders and goals
National Renewable Energy Laboratory Innovation for Our Energy Future

Driving Factors: Operational Energy• Fully Burdened Cost of Waste Disposal
$500 per ton• Government Accountability Office (GAO) Report
251 burn pits in Afghanistan, 21 in Iraq as of Aug. 2010 Poor air quality: Over 90% of air samples exceeded Military Exposure
Guidelines for particulate matter (see graph below) Lawsuits filed in 43 states against Government waste management
contractors
National Renewable Energy Laboratory Innovation for Our Energy Future
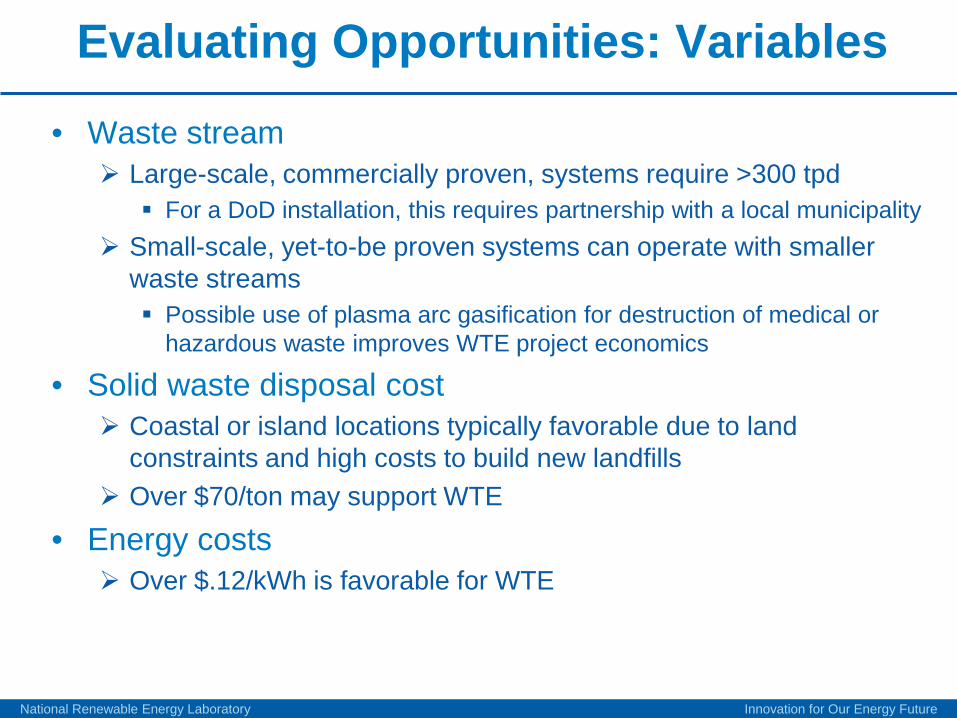
Evaluating Opportunities: Variables
• Waste stream Large-scale, commercially proven, systems require >300 tpd For a DoD installation, this requires partnership with a local municipality
Small-scale, yet-to-be proven systems can operate with smaller waste streams Possible use of plasma arc gasification for destruction of medical or
hazardous waste improves WTE project economics
• Solid waste disposal cost Coastal or island locations typically favorable due to land
constraints and high costs to build new landfills Over $70/ton may support WTE
• Energy costs Over $.12/kWh is favorable for WTE
National Renewable Energy Laboratory Innovation for Our Energy Future
16 MW Waste to Energy Plant, Tulsa, OK Covanta Energy
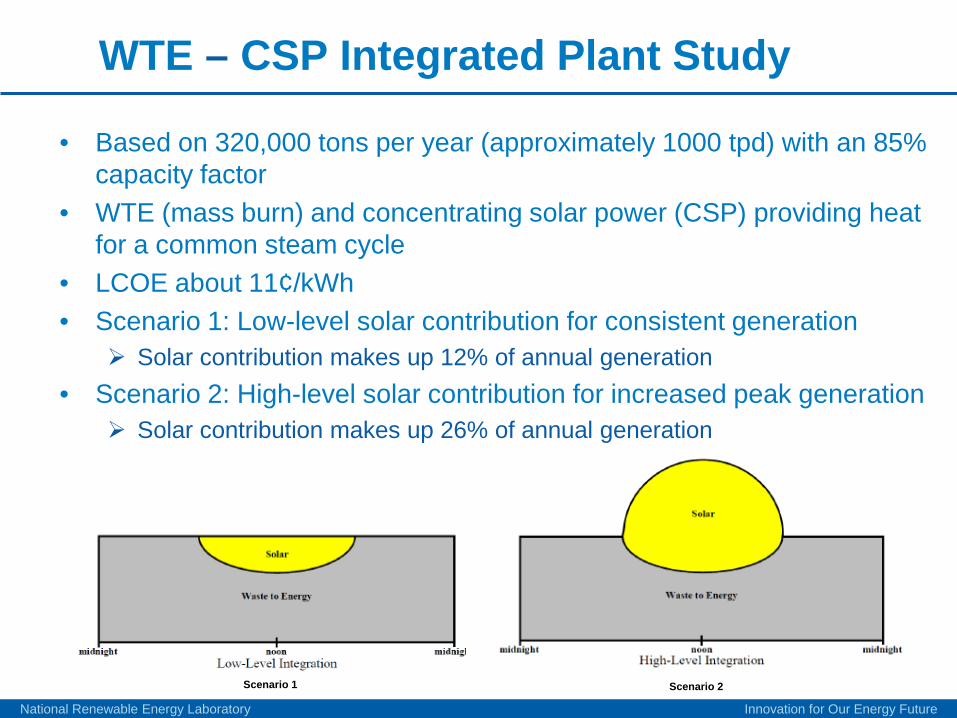
WTE – CSP Integrated Plant Study
• Based on 320,000 tons per year (approximately 1000 tpd) with an 85% capacity factor
• WTE (mass burn) and concentrating solar power (CSP) providing heat for a common steam cycle
• LCOE about 11¢/kWh• Scenario 1: Low-level solar contribution for consistent generation
Solar contribution makes up 12% of annual generation• Scenario 2: High-level solar contribution for increased peak generation
Solar contribution makes up 26% of annual generation
National Renewable Energy Laboratory Innovation for Our Energy Future
Scenario 1 Scenario 2

Jerry DavisSenior EngineerDeployment & Market TransformationNational Renewable Energy Laboratory1617 Cole Blvd, MS:RSF-402Golden, CO [email protected]
Contact Info
National Renewable Energy Laboratory Innovation for Our Energy Future