wastewater management - yemenwater
TRANSCRIPT

0
Table of Contents 1Wastewater management ......................................................................................1 1.1Wastewater treatment in relation to Integrated Water Resource Management ....1
1.1.1Introduction....................................................................................................1 1.1.2The Relation between IWRM and Sub-sectors..............................................4 1.1.3Impacts of Water Use Sectors on Water Resources.......................................4 1.1.4Water Supply and Sanitation according to IWRM in Yemen........................5
1.2Health aspects .......................................................................................................7 2Wastewater characteristics ...................................................................................9 2.1Introduction...........................................................................................................9 2.2The composition of domestic wastewater...........................................................13 2.3Wastewater constituents......................................................................................16
2.3.1Constituents of concern................................................................................17 2.3.2Physical Characteristics ...............................................................................18 2.3.3Chemical Characteristics .............................................................................30 2.3.4Biological Characteristics ............................................................................58
2.4Classification of wastewater strength .................................................................71 2.5References and further readings..........................................................................72 3Wastewater treatment .........................................................................................72 3.1Overview of wastewater treatment systems........................................................72
3.1.1Wastewater treatment Levels.......................................................................72 3.1.2Reactors used for the treatment of wastewater ............................................74 3.1.3Process combination possibilities ................................................................77 3.1.4On-site vs. Off-site treatment.......................................................................80
3.2Process selection .................................................................................................80 3.3Parameter ............................................................................................................83
3.3.1Solids retention time ....................................................................................83 3.3.2Food to microorganism ratio........................................................................84 3.3.3Volumetric organic loading rate ..................................................................84 3.3.4Sludge production ........................................................................................84 3.3.5Mixed liquor settling characteristics............................................................85 3.3.6Microscopic observations ............................................................................87
3.4Basic Processes ...................................................................................................87 3.4.1Physical unit operations ...............................................................................87 3.4.2Chemical unit processes...............................................................................91 3.4.3Biological unit processes .............................................................................92
3.5Treatment levels..................................................................................................95 3.5.1Preliminary treatment...................................................................................95 3.5.2Primary treatment.......................................................................................106 3.5.3Secondary treatment...................................................................................109 3.5.4Secondary treatment, anaerobe .................................................................147 3.5.5Secondary treatment, low rate....................................................................162 3.5.6Tertiary treatment.......................................................................................175 3.5.7Disinfection................................................................................................175
3.6Sludge treatment and disposal ..........................................................................176 3.7References and further readings........................................................................176 4Wastewater collection system ...........................................................................176

1
1 Wastewater management
1.1 Wastewater treatment in relation to Integrated Water
Resource Management
1.1.1 Introduction
In order to understand the function of wastewater treatment in relation to Integrated
Water Resource Management (IWRM), one has to realize the importance of
wastewater management for the entire water sector. IWRM seeks, in an integrated and
participatory way, to find the most optimal management solutions for the resource
water in all dimensions and levels of use, and to promote public awareness.
Therefore, for wastewater management, the current situation has to be analyzed, and
the management has to be implemented in a cross-sectoral integrated way with the
involvement of different points of view within different levels of scale. A key aspect
of the IWRM approach is to understand complex interactions among resources and
stakeholders of the whole water chain. The World Summit on Sustainable
Development (WSSD) in 2002 called upon all countries to develop IWRM as a
framework to use water resources efficiently, to promote their allocation among
competing uses for human needs, and to preserve or restore ecosystems and their
functions. This goal is also aimed at in Yemen where water is a scarce resource.
Regarding the ecosystem as a water user, leads to a holistic management approach
and reveals the importance of the wastewater treatment process. Water treatment is
the tool that enables the transformation from a disposal-based linear management
system to a sustainable cycle of water use and resource recovery. In this sense
wastewater management enables different users to use water in beneficial ways one
after another. The use of water is modifying its physical, chemical, microbiological
characteristics, as well as its location. Analyzing the demand of all stakeholders
reveals at which point in the water chain a purification step with wastewater treatment
has to be placed in order to assure the required quality for the next user.
A simple example is the use of water for domestic purposes. The domestic utilization
is followed up by a treatment step in order to hand the water in sufficient quality over
to the stakeholder: ecosystem. The ecosystem is using water to preserve its function
and has a positive effect on the quality of the water. After a certain period, water can

2
again be extracted from ground- or surface- water and allocated for human use in the
circle. This example is very simple and can be extended by multiple use of water from
different stakeholders before handing it over to the ecosystem. The IWRM approach
enables us to analyze the required quality for each water user. An example for
multiple use would be to take water which was used by a stakeholder (eg. for
domestic purposes) and restore its characteristics in a way that it is of sufficient
quality to be used (by another stakeholder) for instance for agricultural purpose before
it gets handed over to the ecosystem again.
Designing appropriate wastewater treatment processes enables the unlimited
circulation of water. Furthermore, users added nutrients can be recovered and also
reused beneficially. IWRM is providing the conceptual framework to embed the
process in the required socio-economic context in respect to required guidelines and is
aiming to reduce the overall water-user-demand in order to preserve the ecosystem.
The approach looks at the whole water circle and across the urban-rural continuum at
environmental consequences downstream, as well as at socio-economic benefits of
resource recovery. Solutions that are adapted to local social, technical, economic and
environmental circumstances require the active involvement of stakeholders from
different sectors. This has to be combined with locally appropriate and sustainable
risk reduction measures.
Besides resource conservation, IWRM in relation to wastewater treatment is also
referred to as a public health securing function in several international conventions.
Health aspects have significant importance in wastewater treatment. Safe drinking
water and hygienic sanitation facilities are a precondition for assuring public health
and are also central to the human rights and personal dignity of every woman, man
and child on earth. The Millennium Development Goals (MDGs) set up by the United
Nations (UN) Millennium Summit in 2000 aim amongst others to cut the proportion
of people without sustainable access to safe drinking water and basic sanitation in half
by 2015. The World Health Organization (WHO) estimates that 2.6 billion people
lack adequate sanitation facilities (more data can be found on the web-site:
www.who.int). It is important to be aware of the key role of proper sanitation and
water management in the fight against poverty, hunger, child deaths and gender
inequality and its significance in achieving all MDGs. The WHO has, therefore,
declared 2005-2015 the decade of water, with the goal to establishing the framework
of eventually providing full access to water supply and sanitation for all people. WHO

3
also declared the year 2008 as the year of sanitation to raise the awareness of
sanitation issues on the international agenda and to accelerate the progress towards
meeting the MDGs.
The WHO also considers wastewater treatment as a crucial component of an
integrated risk management strategy. Waterborne diseases like diarrhoea are the third
largest cause of morbidity and the sixth largest cause of mortality globally (WHO
estimates that 1.8 million people die each year from diarrhoeal diseases, 85% of them
children under five). Realizing that high infectious diseases like diarrhoea and cholera
are directly connected to an environment of poor hygiene and inadequate water supply
and sanitation gives wastewater treatment the role of being an important tool in
cutting transmitting routs. A statement of WHO Director-General Dr Margaret Chan
in 2008 underlines this issue: “Sanitation is a cornerstone of public health. Improved
sanitation contributes enormously to human health and well-being, especially for girls
and women. We know that simple, achievable interventions can reduce the risk of
contracting diarrhoeal disease by a third." On a national level it has to be realized that
health risks and epidemics from waterborne diseases, besides having dramatic
medical costs, can greatly reduce tourism and agricultural exports, with economic
losses much greater than the cost of investments in water supply and sanitation to
address the problems.
According to the World Bank, the recovery of nutrients and water resources in order
to reduce the overall user–demand for water resources is one main goal of wastewater
treatment. The other goal is to develop wastewater management strategies in order to
reduce pathogens in surface and groundwater to improve public health.
In conclusion, one can identify four main goals of wastewater treatment in the IWRM
concept:
• Recovery and multiple use of the resource water;
• Conserving the environment by effluent control and minimizing the total
human water demand;
• Recovery and reuse of added nutrients in the water;
• Protecting public health by preventing spread of water born diseases.

4
The last issue is the most significant one and is discussed in several international and
conventions. See appendix 1 for a training paper for the practical application of
IWRM Guidelines in the Arab Region.
In this reader we will focus on the technical issues of wastewater treatment to provide
you with the required technical expertise to plan and manage wastewater treatment
plants in the trans-disciplinary and trans-sectoral context of IWRM.
1.1.2 The Relation between IWRM and Sub-sectors
The cross sectoral approach of IWRM is illustrated in Figure 1-1. It can be seen that
all sectors are embedded in the same framework. Wastewater treatment has a special
function since it is capable to link all water users with each other.
1.1.3 Impacts of Water Use Sectors on Water Resources
Depending on conditions of use and environmental surroundings the sub sectors of
Figure 1-1 have certain negative or positive effects on the water resource. The
possible impacts of different water use sectors on water resources are illustrated in
Table 1-1.
Figure 1-1: IWRM and its linkage to the sub sectors

5
Table 1-1: Possible impacts of the water use sectors on water resources
Sector Positive impacts Negative impacts
Environment • Purification
• Storage
• Preserving the
hydrological cycle
Agriculture • Return flows
• Increased infiltration
• Decreased erosion
• Groundwater recharge
• Nutrient recycling
• Depletion
• Pollution
• Salinization
• Water logging
• Erosion
Water supply
& Sanitation
• Nutrient recycling
• Purification
• High level of water
security required
• Surface and groundwater
pollution
1.1.4 Water Supply and Sanitation according to IWRM in Yemen The implementation of IWRM based policies should mean increased security of
domestic water supplies, as well as reduced costs of treatment as pollution is tackled
more effectively.
Recognizing the rights of people, and particularly women and the poor, to a fair share
of water resources for both domestic and household-based productive uses, leads
inevitably to the need to ensure proper representation of these groups on the bodies
that make water resource allocation decisions.
The focus on integrated management and efficient use should be a stimulus to the
sector to push for recycling, reuse and waste reduction. High pollution charges backed
by rigid enforcement have led to impressive improvements in industrial water-use
efficiencies in the industrialized countries, with benefits for domestic water supplies
and the environment.
Past sanitation systems often focused on removing the waste problem from the areas
of human occupation, thus keeping the human territories clean and healthy, but
merely replacing the waste problem, with often detrimental environmental effects
elsewhere. Introduction of IWRM will improve the opportunity for introduction of

6
sustainable sanitation solutions that aim to minimize waste-generating inputs,
reduction of waste outputs, and to solve sanitation problems as close as possible to
where they occur.
At a practical local level, improved integration of water resource management could
lead to greatly reduced costs of providing domestic water services, if for instance
more irrigation schemes are designed with a domestic water component explicitly
involved from the start.
By respecting the described principals a selection for wastewater treatment
technology leads to a systematic approach.
The process of selection of an appropriate sanitation technology for a certain location
encompasses two stages: screening and comparison. Screening determines whether
the technology could satisfy the local conditions (local institutional and socio-cultural
circumstances) and required standards/guidelines or not. Some technologies will not
satisfy at all and are discarded as inappropriate. After screening the decision –makers
may remain with a set of potentially satisfying technologies. In a process of
comparison now the most appropriate technology in the given situation is selected.
Table 1-2: Criteria for assessment of appropriateness of sanitation technologies.
Criteria Sub-criteria of the infrastructure/technology (list is not
exhaustive)
Technical Efficiency in meeting discharge standards
Reliability
Availability
Environmental Need of materials, equipments, land use
Emissions
Production of useful end products
Social Management requirements
Legislative requirements
Cultural acceptance
Economic Construction and operational costs
Lifetime of the infrastructure
Production of economic valuable products (water reuse)

7
For comparison of sanitation technologies available for a given situation often types
of criteria as shown in Table 1-2 are used. Additional the degree of
centralization/decentralization should be considered for making a decision. These
criteria and sub criteria have to be defined and evaluated in an integrated and
participatory way to fit in the given local situation. By evaluating the sub-criteria and
finding a total evaluation per technical option, the appropriateness of technological
systems can be compared and the best one picked.
1.2 Health aspects
Above described health issues linked to excreta-related diseases can be targeted
directly by wastewater management. In the following mechanisms of transmission of
water-, excreta- and reuse-related diseases and the measures to prevent these diseases
by cutting transmission routes will be discussed. The emphasis is laid on the role of
improved water supply and sanitation.
A disease is infectious if it can be transmitted from one person to another or from an
animal. All infectious diseases are caused by living organisms that are classified as
bacteria, viruses, protozoa and parasitic worms. A disease can be transmitted when
one or more of these organisms pass from one person’s body to another’s. During the
transmission the organisms may be exposed to the environment, and their passage to
the body of a new host organism can be impeded by changes in the environment. The
so-called fecal-oral transmission routes are depicted in Figure 1-2.
Figure 1-2: The F-diagram summarizes the main ways diarrhoea is spread: by faecal pathogens contaminating fingers, flies, fields, food and fluids and the swallowed.
FAECES FACE
FINGERS
FLUIDS
FOOD
FIELDS
FLIES
8
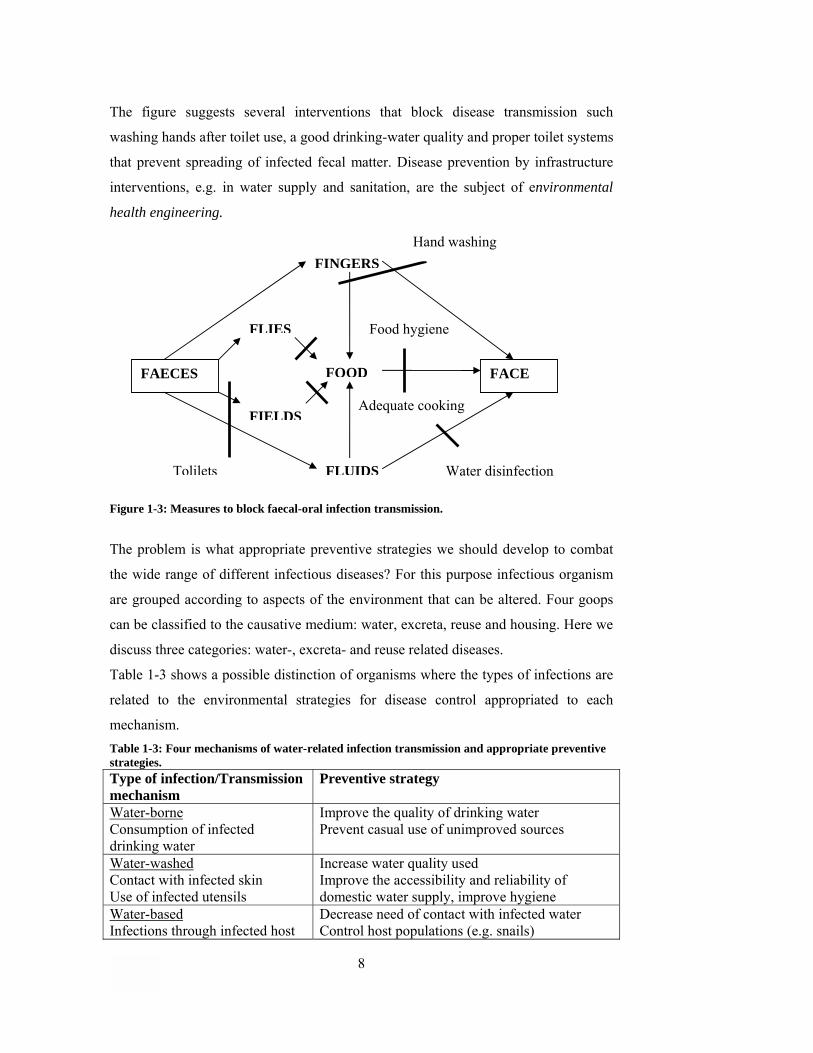
The figure suggests several interventions that block disease transmission such
washing hands after toilet use, a good drinking-water quality and proper toilet systems
that prevent spreading of infected fecal matter. Disease prevention by infrastructure
interventions, e.g. in water supply and sanitation, are the subject of environmental
health engineering.
Figure 1-3: Measures to block faecal-oral infection transmission.
The problem is what appropriate preventive strategies we should develop to combat
the wide range of different infectious diseases? For this purpose infectious organism
are grouped according to aspects of the environment that can be altered. Four goops
can be classified to the causative medium: water, excreta, reuse and housing. Here we
discuss three categories: water-, excreta- and reuse related diseases.
Table 1-3 shows a possible distinction of organisms where the types of infections are
related to the environmental strategies for disease control appropriated to each
mechanism. Table 1-3: Four mechanisms of water-related infection transmission and appropriate preventive strategies. Type of infection/Transmission mechanism
Preventive strategy
borne-WaterConsumption of infected drinking water
Improve the quality of drinking waterPrevent casual use of unimproved sources
washed-WaterContact with infected skinUse of infected utensils
Increase water quality usedImprove the accessibility and reliability of domestic water supply, improve hygiene
based-WaterInfections through infected host
Decrease need of contact with infected waterControl host populations (e.g. snails)
Adequate cooking
Food hygiene
FAECES FACE
FINGERS
FLUIDS
FOOD
FIELDS
FLIES
Tolilets
Hand washing
Water disinfection

9
organisms Reduce contamination of water with human excreta
related insect vector-WaterInfection through insects that breed near water
Improve surface water managementDestroy breeding sites of insectsDecrease need of visiting breeding areasUse mosquito nets
It is important to notice, that a water-related disease is in some way related to water or
to impurities in water. Hereby it is necessary to distinguish the infectious water-
related diseases from those related to one or more chemical substances in water. A
notorious case of chemical-caused disease is arsenic poisoning though contaminated
groundwater consumption.
Most of infectious diseases are caused by pathogens transmitted in human excreta,
normally in the faeces. Those excreta-related diseases that are also water-related can
of course be controlled, at least partially, by improvements in water supply and
hygiene. But these and other excreta-related diseases are also affected by
improvements in excreta disposal, ranging from the construction or improvement of
toilets to the choice of methods for transport, treatment and final disposal or re-use of
excreta.
For a sustainable wastewater management these aspects have to be respected.
2 Wastewater characteristics
2.1 Introduction
The term wastewater is a composition of the word waste and the word water.
According to this, wastewater is water that carries liquid-transportable waste. Waste
is unwanted or undesired material. In the sense of sustainable development wastes are
considered to be resources out of place. Water is liquid H2O and has the properties of
a chemical solvent and a capacity to transport particles. Hence, it incorporates various
impurities that characterize the water quality.
Water quality is the result of natural phenomena and the acts of human beings. A
treatment process can modify the water quality. The treatment process and the water
quality can be looked upon, and be evaluated from either the side of the source of
generation, or from the side of intended use.

10
Figure 2-1: Possible angles of view on water quality and the wastewater treatment process.
The perspective towards wastewater treatment from the side of intended use of water
is classically not recognized to be related to wastewater. The consumer is typically
concerned about treating water from a surface or groundwater reservoir in order to use
it. With an integrated view, aiming at closed circles for the resource water, one has to
recognize that discharging water (wastewater) after use represents the resource for the
next user. In case wastewater is not directly reused, the ecosystem as a natural buffer
is standing between the wastewater discharger and the next user. In this sense it is
essential to recognize both possible angles of view. Nevertheless it is appropriate to
place wastewater treatment close to its source. In that way, a specific treatment of a
minimal volume can be carried out. Thus, it seems logical to look closely at the
sources of wastewater generation, when designing a wastewater treatment unit, while
in the same time keeping the following uses in mind.
In this reader we will focus on the classical view of the inflow based design of
technically possible treatment processes. However, first we will recapitulate different
water uses and their requirements on water quality in Table 2-1, in order to keep this
angle of view on the treatment process in mind. This point of view is referred to in the
literature as the “reversed water chain approach”. The water quality demands of the
user side can be looked upon in more depth in other readers of the MSc-Program that
discuss water use.
Table 2-1 shows the major water uses, and their percentage of the total water
withdrawal in the Yemen of the year 2000 (FAO). For the presented uses the summed
up withdrawal is 6.63 x 10⁹ m3/year. Preservation of the ecosystem does not have a
percentage because it can be seen as the follow up user of all other uses, and thus
receives 100% of the water. The quality requirements on water for the ecosystem are
often ignored because there is no direct economical benefit. Consequently, water
Source, User
TreatmentWater flow Water flow
Point of View on water quality and Treatment process
Point of View on water quality and Treatment process
User, Ecosystem

11
discharged in the environment is often of poor quality. Minor uses that are not
regarded in the listing are: animal supply, recreation and leisure, generation of
electricity, landscape harmony and the dilution and transport of wastes.
Table 2-1: Examples for water use with the percentage of the total amount of withdrawn water
(FAO, 2000), (modified, from Sperling and Chernicharo, 2005)
General use Specific use Required quality
Uses in direct contact with the
human body:
- drinking
- cooking
- washing
Domestic
supply
4.1 %
Uses not in direct contact
with human body:
- cleaning
- toilet flushing
- watering plants
- Free from chemical substances
harmful to human health
- Free from organisms harmful to
human health
- Low aggressiveness and hardness
- Aesthetically pleasant (low
turbidity, color, taste and odor;
absence of macro-organisms)
Horticulture, products
ingested raw or with skin
- Free from chemical substances
harmful to human health and/or
plant growth and soil
- Free from organisms harmful to
human health and/or plant growth
- Non-excessive salinity
Agricultural
Irrigation
95.3%
Other plantations - Free from chemical substances
harmful to the soil and plantations
- Non-excessive salinity
Industrial
supply
0.6%
Water incorporated into the
product:
- food
- drinks
- medicines
- Free from chemical substances
harmful to human health or
product
- Free from organisms harmful to
human health or product
- Aesthetically pleasant (low
turbidity, color, taste and odor;

12
absence of macro-organisms)
Water that comes into contact
with the product
- Variable with the product
Water that does not come in
contact with the product:
- refrigeration units
- boilers
- Low hardness
- Low aggressiveness
- Low particle concentration
Preservation
of the
Ecosystem
Natural Water circle:
- Surface water bodies
- Groundwater bodies
- Soil of water bodies
and aquifers
- In the circle Included
animals, plants and
microorganisms
- Coastal zones
- Free from chemical substances
harmful to animals and plants
- Free from organisms harmful to
animals and plants
- Low levels of suspended solids,
Nutrients, BOD, COD, oils and
greases to avoid eutrophication
- Low aggressiveness / natural pH
Looking at water treatment from the side of the discharger raises certain issues
regarding wastewater characteristics which are listed below:
- quality of user emitted wastewater
- quantity of user emitted wastewater
- spatial and temporal distribution of user emitted wastewater
To assess these factors we have to look at the water users again. This time we are not
interested in the quality requirements of the different users, but in the characteristics
the consumer is giving the water by using it.
A general description of wastewater characteristics for different uses can only be done
in a general and broad way. Characteristics of domestic use are strongly depending on
cultural, regional, and socio-economical factors, as well as the time of the year.
Similarly are the characteristics of industrial uses, these depend on the kind of
industry and the type of technique used. Industrial water is either being treated on-site

13
with specialized treatment techniques, mixed together with domestic wastewater, or,
in the worst case, emitted directly to the ecosystem. The effluent of agricultural water
uses depends on agricultural practice, crop type, climatic conditions, soil quality and
geological formation. Agricultural effluents are usually not treated directly in a
wastewater treatment plant, but occur sometimes as infiltration inflows.
The components that make up the wastewater flow from a community depend in
praxis on the type of collection system used and may include:
- Domestic wastewater
- Industrial wastewater
- Infiltration and diffuse inflow
- Storm water
The different types of collection systems determining the composition of wastewater
will be discussed in later chapters.
2.2 The composition of domestic wastewater
Since wastewater treatment is mainly applied to domestic wastewater we will have a
closer look at this sector.
To get an idea of the quantitative and qualitative issues it is required to take a look at
the domestic water use itself. Consumption practices determine directly the
characteristics of emitted wastewater.
The consumption of drinking water depends much upon the type of drinking-water
supply system available. In rural and peri-urban areas of developing countries where
there are few piped supply systems, the water consumption is usually much lower
than in the urban areas. In Yemen the domestic water consumption per capital has
values from 35 l/d to 120 l/d. Not every inhabitant consumes the same amount of
water.
Table 2-2 shows average figures from developing countries with the water
consumption depending on the water supply system.

14
Table 2-2: Water consumption in dependency relationship with the water supply system (from
van Buuren, 2007)
Water supply system
(cases)
Water consumption
(l/cap.day)
1.No piped supply (water vendors, public stand posts, shallow
wells)
2.Yard tap (hand-carried to the house)
3.Multiple tab in the household
14-40
50-80
100-200
Taking into account the fact that approximately 75% of the Yemenis people live in
rural areas (FAO, 2004) and that the Tunisian Family Health Survey (TFHS)
investigated that in 2002 54% of the urban and 22% of the rural households had
access to piped drinking water supply (case 2 and 3); the relationship from Table 2-2
also counts for Yemen. The Joint Monitoring Program (JMP) of the WHO (2006)
sates different values for water supply from “improved sources (case 2, 3 and safe
wells)” in 2004 in Yemen. In urban areas 71% had access to improved water sources,
and 59% even had a household connection (case 3). In rural areas 65% had access to
improved water sources and 10% had a household connection (case 3). Apart from the
water supply system the water consumption may depend upon several other factors
such as climate, availability of water, culture, community size, income level of users,
water costs and other factors.
In households, water is used for different purposes depending on the water supply
system and the available water. The domestic water consumption in the Netherlands,
where the most households are connected to a multiple tab supply system should
visualize the possible different uses of drinking water in a household. The example is
from 1992 when the average consumption per capita and day was 135 liters.

15
Laundry19%
Dish washing7%
Toilet flushing32%
Personal hygiene
3%
Shower/Bath34%
Others2%
Drinking/Food preparation
3%
Figure 2-2: Domestic drinking- water consumption in the Netherlands in percent, for 135 liters
per capita per day (1992) (modified from NIPO, 1992)
Due to the different uses in the household, wastewater can be grouped according to its
quality and quantity. The terms yellow, brown, grey and black water are commonly
used in literature concerned with wastewater treatment. The composition of these
different groups of water can be understood with Figure 2-3. It is important to realize
that faeces are the crucial source for health concerns due to their high degree of
pathogens. Nutrients, especially Nitrate, Phosphorus and Potassium orginate to a high
degree from urine.
Looking at the quantities (in liters per capital per month) of the different fractions in
Figure 2-3 makes clear that the critical components represent only a small quantity of
the total wastewater flow.
In the conventional practice of sewerage all waste streams are combined so that the
concentrated wastes, faeces and urine are mixed and diluted to a considerable degree.
This dilution and mixing, especially when sanitary sewage is combined with
stormwater (rain and water from streets), renders the treatment costly and the reuse
risky, since the critical components are than dissolved into a large volume of water
and the whole volume then has to be treated. The situation gets even more difficult
when wastewater from industry, contaminated with chemical substances and heavy
metals is added to the mixed sewage.

16
This shows that a large potential lies in short closed cycles: separating wastewater
streams, reusing large volumes of low contaminated water for example for irrigation
and treating high contaminated brown and/or black water close to the source.
Figure 2-3: Different types of water occurring in the household with relative quantities from the
Netherlands in liters per capita per month (in italic). Note that especially the Stormwater Volume
is much lower in Yemen, due to low precipitation.
2.3 Wastewater constituents
To gain a deeper understanding of the treatment process we need to introduce certain
water quality parameters that allow us to quantify the quality of wastewater and the
efficiency of a treatment process. The term water quality relates to all physical,
chemical, and biological characteristics of wastewater.
Dealing with water quality in wastewater treatment makes it important to make a
distinction between constituents found in wastewater and the constituents of concern.
Constituents of concern are so called target substances the treatment process is design
for. These substances we want to eliminate are fixed in guidelines and regulations for
outlet limits (APENDIX) and the intended following use of the treated water.
To measure water quality parameters we need to take samples. Sampling is of
fundamental importance for the characterization of wastewater. It is performed in a
standardized procedure that must be:
Yellow Water
Brown Water
Stormwater 1500-6000 L/cap.M
Laundry Bath / Shower
Kitchen Faeces
50 L/cap.M Toilet
Flushing 1000 L/cap.M
Urine 5 L/cap.M
Combined Sewage
Domestic Sewage
Grey Water 2000 L/cap.M
Black Water
1055 L/cap.M

17
- Representative. The data must represent the wastewater or environment being
sampled.
- Reproducible. The data obtained must be reproducible by others following the
same sampling and analytical protocols.
- Defensible. Documentation must be available to validate the sampling
procedures. The data must have a known degree of accuracy and precision.
- Useful. The data can be used to meet the objectives of a monitoring plan.
Analyzing water quality is used for:
- Design. The wastewater is characterized and according to the found results the
treatment step is designed.
- Monitoring. The change in water quality in different treatment steps is
measured in order to assess the performance of each step and adjust the
operation management if needed.
- Evaluation. The water quality of the outflow is measured to check if the
treatment goals are met and regulations are satisfied.
2.3.1 Constituents of concern
Contaminants and pollutants that are normally constituents of concern are listed in
Table 2-3 below with a description of the need for treatment.
Table 2-3: Contaminants in wastewater and its importance Contaminants Reason of importance
Suspended solids
Suspended solids can lead to the development of sludge deposits and anaerobic conditions when untreated wastewater is discharged in the aquatic environment.
Biodegradable organics
Composed principally of proteins, carbohydrates and fats, biodegrable organics are measured most commonly in terms of BOD (biochemical oxygen demand) and COD (chemical oxygen demand). If discharged untreated to the environment, their biological stabilization can lead to the depletion of natural oxygen resources and to the development of septic conditions.
Pathogens Communicable diseases can be transmitted by the pathogenic organisms in wastewater.
Nutrients
Both nitrogen and phosphorus, along with carbon, are essential nutrients for growth. When discharged to the aquatic environment, these nutrients can lead to the growth of undesirable aquatic life. When discharged in excessive amounts on land, they can also lead to the pollution of groundwater.
Priority Organic and inorganic compounds selected on the basis of their

18
pollutants known or suspected carcionogenicity, mutagenicity, teratogenicity, or high acute toxicity. Many of these compounds are found in wastewater.
Refractory organics
These organics tend to resist conventional methods of wastewater treatment. Typical examples include surfactants, phenols and agricultural pesticides.
Heavy metals Heavy metals are usually added to wastewater from commercial and industrial activities and may have to be removed if the wastewater is to be reused.
Dissolved inorganics
Inorganic constituents such as calcium, sodium and sulfate are added to the original domestic water supply as a result of water used and may have to be removed if the wastewater is to be reused.
In the following chapters a detailed description of wastewater constituents is given.
2.3.2 Physical Characteristics
The most important physical characteristic of wastewater are:
• Total solids content;
• Turbidity;
• Color;
• Temperature;
• Conductivity;
• Odor.
We are going to discuss them one by one in the following sub-chapters.
2.3.2.1 Total solids content
The total solids content in wastewater is composed of:
o floating matter,
o settleable matter,
o colloidal matter, and
o matter in solution.
All the contaminants of water, with the exception of dissolved gases, contribute to the
solids loaded. The Total solid content can be subdivided with standard analytical
methods into different factions. The classification and quantification of the different
solid fractions is used to characterize wastewater. The interrelationship between the
various solids fractions is illustrated in Figure 2-4. The different fractions and their
abbreviations with explanations are listed in Table 2-4 and discussed in detail in the

19
following sub-chapters. In general the subdivision of solids in wastewater can be done
in terms of:
o Classification by size and state
- Suspended solids (non-filterable)
- Dissolved solids (filterable)
o Classification by chemical characteristics
- Volatile solids (organic)
- Fixed solids (inorganic)
o Classification by settleability
- Settleable suspended solids
- Non-settleable suspended solids
Figure 2-4: Interrelationship of solids found in water and wastewater (from, Metcalf & Eddy, 2003).

20
Table 2-4: Definitions for solids found in wastewater (besides of settleable solids, all solids values are expressed in mg/l). Test Description
Total solids
(TS)
The residue remaining after a wastewater sample has been
evaporated and dried at a specified temperature (103 to 105˚C)
Total volatile
solids (TVS)
Those solids that can be volatilized and burned off when the TS
are ignited at 500 ± 50˚C
Total fixed
solids (TFS)
The residue that remains after TS are ignited at 500 ± 50˚C
Total suspended
solids (TSS)
Portion of the TS retained on a filter (see Figure 2-4) with a
specified pore size, measured after being dried at a specified
temperature (105˚C). The filter used most commonly for the
determination of TSS is the Whatman glass fiber filter, which has
nominal pore size of about 1.58 μm
Volatile
suspended
solids (VSS)
Those solids that can be volatilized and burned off when the TSS
are ignited (500 ± 50˚C)
Fixed
suspended
solids (FSS)
The residue that remains after TSS are ignited at 500 ± 50˚C
Total dissolved
solids (TDS)
(TS - TSS)
Those solids that pass through the filter, and are then evaporated
and dried at specified temperature. It should be noted that what is
measured as TDS is comprised of colloidal and dissolved solids.
Colloids are typically in the size range from 0.001 to 1 μm
Total volatile
dissolved solids
(VDS)
Those solids that con be volatilized and burned off when the TDS
are ignited (500 ± 50˚C)
Fixed dissolved
solids (FDS)
The residue that remains after TDS are ignited
(500 ± 50˚C)
Sett1eable solids Suspended solids, expressed as milliliters per liter, that will settle
out of suspension within a specified period of time
Settleable solids:

21
are found with Imhoff cone using a sample of l-liter of wastewater. The height of
settled solids in mm after a specific time (1 h) represents the settleable solids (see Fig.
2-2). Typically, about 60% of the suspended solids in a municipal wastewater are
settleable.
Total solids (TS):
are obtained by evaporating a sample of wastewater to dryness and measuring the
mass of the residue. A filtration step is used to separate the total suspended solids
(TSS) from the total dissolved solids (TDS). The apparatus used to determine TSS is
shown in Figure 2-6. A vacuum is created in the Erlenmeyer flask by the connected
hose. A defined volume of water is applied in the head hopper and is sucked through a
filter paper in the Erlenmeyer flask. After wastewater sample has been filtered, the
pre-weighted filter paper is placed in an aluminum dish for drying before weighing.
Figure 2-5: Imhoff cone used to determine settleable solids in wastewater. Solids that accumulate in the bottom of the cone after 60 min are reported as ml/l (from, Metcalf & Eddy, 2003).
Total Suspended Solids
Because a filter is used to separate the TSS from the TDS, the TSS test is somewhat
arbitrary, depending on the pore size of the filter paper used for the test. Filters with
nominal pore sizes varying from 0.45 μm to about 2.0 μm have been used for the TSS
test. More TSS will be measured as the pore size of the filter used is reduced. Thus, it

22
is important to note the pore size of the filter paper used, when comparing reported
TSS values.
Figure 2-6: Apparatus used for the determination of total suspended solids (from, Metcalf & Eddy, 2003).
The analysis of laboratory data is illustrated in Example 2-1. Comment [r1]: Fadhl please add example or deled it

23
Total Dissolved Solids
By definition, the solids contained in the filtrate that passes through a filter with a
nominal pore size of 2.0 μm or less are classified as dissolved (Standard Methods,
1998). Yet it is known that wastewater contains a high fraction of colloidal solids. The
size of colloidal particles in wastewater is typically in the range from 0.01 to 1.0 μm.
Volatile and Fixed Solids
Material that can be volatilized and burned off when ignited at 500 ± 50˚C is
classified as volatile. In general, volatile solids (VS) are presumed to be organic
matter, although some organic matter will not burn and some inorganic solids break
down at high temperatures. Fixed solids (FS) comprise the residue that remains after a
sample has been ignited. Thus, TS, TSS, and TDS are comprised of both fixed solids
and volatile solids. The ratio of the VS to FS is often used to characterize the
wastewater with respect to amount of organic matter present. Especially samples that
are drawn during the treatment process are analyses with this technique on the amount
of biomass. The biomass is an indicator for the content of microorganisms that are
taking part in the degradation of substances of the wastewater during the treatment
process.
Figure 2-7 shows a typical distribution between the various types of solids present in
raw sewage of average composition.
Figure 2-7: Approximate distribution of the solids in raw sewage (from Sperling & Chernicharo, 2005)
TOTAL (TS) 1000 mg/L
DISSOLVED (TDS) 650 mg/L
SUSPENDED (TSS) 350 mg/L
VOLATILE (VDS) 250 mg/L
FIXED (FDS) 400 mg/L
VOLATILE (VSS) 300 mg/L
FIXED (FSS) 50 mg/L

24
2.3.2.2 Turbidity
Turbidity, a measure of the light -transmitting properties of water, is another
parameter used to indicate the quality of waste discharges and natural waters with
respect to colloidal and suspended matter. The measurement of turbidity is based on
comparison of the intensity of light scattered by a sample to the light scattered by a
reference suspension under the same conditions (Standard Methods, 1998). Formazin
suspensions are used as the primary reference standard. The results of turbidity
measurements are reported as nephelometric turbidity units (NTU). Colloidal matter
will scatter or absorb light and thus prevent its transmission (Figure 2-8 and Figure
2-9). It should be noted that the presence of air bubbles in the fluid will cause
erroneous turbidity readings. In general, there is no relationship between turbidity and
the concentration of total suspended solids in untreated wastewater.
Figure 2-8: Turbid meter and example samples.
Figure 2-9: Principle of Turbidity measurement. There is, however, a reasonable relationship between turbidity and total suspended
solids for the settled and filtered secondary effluent from the activated sludge process.

25
The general form of the relationship is as follows:
TSS, mg/L = (TSSf) (T)
where TSS = total suspended solids, mg/L
TSSf = factor used to convert turbidity readings to total suspended solids,
T = turbidity, NTU
The specific value of the conversion factor will vary for each treatment plant,
depending primarily on the operation of the biological treatment process. The
conversion factors for settled secondary effluent and for secondary effluent filtered
with a granular medium depth filter will typically vary from 2.3 to 2.4 and 1.3 to 1.6,
respectively. Turbidity readings at a given facility can be used for process control.
2.3.2.3 Color
Historically, the term "condition" was used along with composition and concentration
to describe wastewater. Condition refers to the age of the wastewater, which is
determined qualitatively by its color and odor. Fresh wastewater is usually a light
brownish-gray color. However, as the travel time in the collection system increases,
and more anaerobic conditions develop, the color of the wastewater changes
sequentially from gray to dark gray, and ultimately to black. When the color of the
wastewater is black, the wastewater is often described as septic. Some industrial
wastewaters may also add color to domestic wastewater. In most cases, the gray, dark
gray and black color of the wastewater is due to the formation of metallic sulfides,
which form as the sulfide produced under anaerobic conditions reacts with the metals
in the wastewater.
2.3.2.4 Temperature
The temperature of wastewater is commonly higher than that of the local water supply,
because of the addition of warm water from households and industrial activities.
Depending on the geographic location and time of the year, the temperature of
wastewater in Africa and the Middle East can go up to 30 to 35°C. Depending on the
location, time of year and water source, the effluent temperatures can be either higher
or lower than the corresponding influent values.
Effects of Temperature
The temperature of water is a very important parameter because of its effect on

26
chemical reactions and reaction rates, aquatic life, and the suitability of the water for
beneficial uses. Increased temperature, for example, can cause a change in the species
of fish that can exist in the receiving water body. Industrial establishments that use
surface water for cooling-water purposes are particularly concerned with the
temperature of the intake water.
In addition, oxygen and other gases are less soluble in warm water than in cold water.
The increase in the rate of biochemical reactions that accompanies an increase in
temperature, combined with the decrease in the quantity of oxygen present in surface
waters, can often cause serious depletions in dissolved oxygen concentrations in the
summer months.
High temperatures also cause a increase in viscosity of liquids.
Optimum Temperatures for Biological Activity
Optimum temperatures for bacterial activity are in the range from 25 to 35°C.
Different types of microorganisms have their temperature optimum and tolerance
spectrum at different temperatures. Aerobic digestion and nitrification stops when the
temperature rises above 50°C. When the temperature drops to about 15°C, methane-
producing bacteria become quite inactive, and at about 5°C, the autotrophic nitrifying
bacteria practically cease functioning. At 2°C, even the chemo heterotrophic bacteria
acting on carbonaceous material become essentially dormant.
2.3.2.5 Conductivity
The electrical conductivity (EC) of water is a measure of the ability of a solution to
conduct an electrical current. Because the electrical current is transported by the ions
in solution, the conductivity increases as the concentration of ions increases. In effect,
the measured EC value is used as a surrogate measure of total dissolved solids (TDS)
concentration. At present, the EC of a water is one of the important parameters used
to determine the suitability of a water for irrigation. The salinity of treated wastewater
to be used for irrigation is estimated by measuring its electrical conductivity. The
electrical conductivity is expressed with the unit mS/m and in μmho/cm (1 mS/m is
equivalent to 10 μmho/cm).
The Equation that can be used to estimate the TDS of a water sample based on the
measured EC value (Standard Methods, 1998) is as follows:

27
TDS (mg/L) == EC *(dS/m) x (0.55 - 0.70)
The above relationship does not necessarily apply to raw wastewater or high-strength
industrial wastewater. The above relationship can also be used to check the
acceptability of chemical analyses (see Standard Methods, 1998).
2.3.2.6 Odor
Odors in domestic wastewater usually are caused by gases produced by the
decomposition of organic matter or by substances added to the wastewater. Fresh
wastewater has a distinctive, somewhat disagreeable odor, which is less objectionable
than the odor of wastewater which has undergone anaerobic (devoid of oxygen)
decomposition. The most characteristic odor of stale or septic wastewater is that of
hydrogen sulfide (H2S), which is produced by anaerobic microorganisms that reduce
sulfate (SO42-) to sulfide (S2-). Industrial wastewater may contain either odorous
compounds or compounds that produce odors during the process of wastewater
treatment. Odors have been rated as the foremost concern of the public related to the
implementation of wastewater-treatment facilities. Within the past few years, the
control of odors has become a major consideration in the design and operation of
wastewater collection, treatment, and disposal facilities, especially with respect to the
public acceptance of these facilities. In many areas, projects have been rejected
because of the concern over the potential for odors. In view of the importance of
odors in the field of wastewater management, it is appropriate to consider the effects
they produce, how they are detected, and their characterization and measurement.
Effects of Odors
The importance of odors at low concentrations in human terms is related primarily to
the psychological stress they produce, rather than to the harm they do to the body.
Offensive odors can cause poor appetite for food, lowered water consumption,
impaired respiration, nausea and vomiting, and mental perturbation. In extreme
situations, offensive odors can lead to the deterioration of personal and community
pride, interfere with human relations, discourage capital investment, lower
socioeconomic status, and deter growth. Also, some odorous compounds (e.g., H2S)
are toxic at elevated concentrations. These problems can result in a decline in market
and rental property values, tax revenues, payrolls, and sales.

28
Detection of Odors
Over the years, a number of attempts have been made to classify odors in a systematic
fashion. The major categories of offensive odors and the compounds involved are
listed in Table 2-5.
Table 2-5: Major catergories of odorous compounds associated with untreated wastewater
Odorous compound Odor quality
Amines Fishy
Ammonia Ammonical
Diamines Decayed fish
Hydrogen sulfide Rotten eggs
Mercaptance (Methyl and Ethyl or
cratyl and butyl)
Decayed Cabbage or Skunk
Organic sulfides Rotten cabbage
Skatole Fecal matter
All these compounds may be found or may develop in domestic wastewater,
depending on local conditions. The odor thresholds for specific malodorous
compounds associated with untreated wastewater are listed in Table 2-6.
Table 2-6: Odor thresholds of odorous compounds associated with untreated wastewater Odorous compound Odor threshold (ppm)
Ammonia 46.8
Chlorine 0.314
Crotyl mercaptan 0.000029
Dimethyl sulfide 0.0001
Diphenyl sulfide 0.0047
Ethyl mercaptan 0.00019
Hydrogen sulfide 0.00047
Indole 0.0001
Methyl amine 21.0
Methyl mercaptan 0.0021
Skatole 0.019
Sulfur dioxide 0.009
Thiocresol 0.000062

29
Odor Characterization and Measurement
It has been suggested that four independent factors are required for the complete
characterization of an odor: intensity, character, hedonics, and detectability. To date,
detectability is the only factor that has been used in the development of statutory
regulations for nuisance odors. Odor can be measured by sensory methods, and
specific odorant concentrations can be measured by instrumental methods. It has been
shown that, under carefully controlled conditions, the sensory (organoleptic)
measurement of odors by the human olfactory system can provide meaningful and
reliable information. Therefore, the sensory method is often used to measure the odors
emanating from wastewater-treatment facilities. The availability of a direct reading
meter for hydrogen sulfide (see Figure 2-10) which can be used to detect
concentrations as low as 1 ppb is a significant development. The reading meter can
also be useful in terms of work safety, since high concentrations of H2S are toxic for
humans and in high concentrations it dazes the smell nerves (receptors) so that we do
not notice the danger.
In the sensory method, human subjects (often a panel of subjects) are exposed to
odors that have been diluted with odor-free air, and the number of dilutions required
to reduce an odor to its minimum detectable threshold odor concentration (MDTOC)
is noted. The detectable odor concentration is reported as the dilutions to the MDTOC,
commonly called DfT (dilutions to threshold). Thus, if four volumes of diluted air
must be added to one unit volume of sampled air to reduce the odorant to its MDTOC.
Figure 2-10: Portable H2S-meter used for field odor studies.

30
2.3.3 Chemical Characteristics
The chemical constituents of wastewater are typically classified as inorganic and
organic. Inorganic chemical constituents of concern include nutrients, nonmetallic
constituents, metals, and gases. Organic compounds are usually composed of a
combination of carbon, hydrogen, and oxygen, together with nitrogen in some cases.
In chemistry, organic is defined as a carbon (C-) compound, beside of CO2, CO and a
group of carbonates, which are inorganic. In wastewater organic constituents are
separated in the group of aggregate organic constituents, which includes all kind of
complex organic mater like: protein, fat, etc. and the group of individual organic
compounds. Organic mater is usually measured with sum parameters, we will explain
later.
2.3.3.1 Inorganic, nonmetallic constituents
The sources of inorganic nonmetallic and metallic constituents in wastewater derive
from the background levels in the water supply and from the additions resulting from
domestic use, from the addition of highly mineralized water from private wells and
groundwater, and from industrial use. Domestic and industrial water softeners also
contribute significantly to the increase in mineral content and, in some areas, may
represent the major source. Occasionally, water added from private wells and
groundwater infiltration will (because of its high quality) serve to dilute the mineral
concentration in the wastewater. Because concentrations of various inorganic
constituents can greatly affect the beneficial uses made of the waters, the constituents
in each wastewater must be considered separately. Inorganic nonmetallic constituents
considered include pH, nitrogen, phosphorus, alkalinity, chlorides, sulfur, other
inorganic constituents, gases, and odors. Because the concentration of the species of
most chemical constituents is dependent on the hydrogen-ion concentration in
solution, pH is considered first in the following discussion.
pH
The hydrogen-ion concentration is an important quality parameter of both natural
waters and wastewaters. The usual means of expressing the hydrogen-ion
concentration is as pH, which is defined as the negative logarithm of the hydrogen-ion
concentration.

31
pH = -log [H+]
The concentration range suitable for the existence of most biological life is quite
narrow and critical (typically 6 to 9). Wastewater with an extreme concentration of
hydrogen-ion is difficult to treat by biological means, and if the concentration is not
altered before discharge, the wastewater effluent may alter the concentration in the
natural waters. For treated effluents discharged to the environment the allowable pH
range usually varies from 6.5 to 8.5. Measuring devices for the field can be seen in
Figure 2-11, for analytics its important to know that the measuring diodes has to be
calibrated before starting new measurements and consumes itself after longer use,
since the measurement is based on a chemical reaction. Its recommendable to make
some test measurements before starting an analytical series.
Figure 2-11: pH and dissolved oxygen (DO) measuring devices
Chlorides
Chloride is a constituent of concern in wastewater as it can impact the final reuse
applications of treated wastewater. Chlorides in natural water result from the leaching
of chloride-containing rocks and soils with which the water comes in contact, and in
coastal areas from saltwater intrusion. In addition, agricultural, industrial, and
domestic wastewaters discharged to surface waters are a source of chlorides. Human
excreta, for example, contain about 6 g of chlorides per person per day. Note that
ordinary Salt is composed of Chloride and Sodium (NaCl). In areas where the
hardness of water is high, home regeneration type water softeners will also add large
quantities of chlorides. Because conventional methods of waste treatment do not
remove chloride to any significant extent, higher than usual chloride concentrations
can be taken as an indication that a body of water is being used for waste disposal.

32
Infiltration of ground water into sewers adjacent to saltwater is also a potential source
of high chlorides as well as sulfates.
Alkalinity
Alkalinity in wastewater results from the presence of the hydroxides [OH-],
carbonates [CO3], and bicarbonates [HCO3] of elements such as calcium, magnesium,
sodium, potassium, and ammonia. Of these, calcium and magnesium bicarbonates are
most common. Borates, silicates, phosphates, and similar compounds can also
contribute to the alkalinity. The alkalinity in wastewater helps to resist changes in pH
caused by the addition of acids. Wastewater is normally alkaline, receiving its
alkalinity from the water supply, the ground water, and the materials added during
domestic use. The concentration of alkalinity in wastewater is important where
chemical and biological treatment is to be used, in biological nutrient removal, and
where ammonia is to be removed by air stripping.
Nitrogen
The elements nitrogen and phosphorus, essential to the growth of microorganisms,
plants, and animals, are known as nutrients or biostimulants. Trace quantities of other
elements, such as iron, are also needed for biological growth, but nitrogen and
phosphorus are, in most cases, the major nutrients of importance. Because nitrogen is
an essential building block in the synthesis of protein, nitrogen data will be required
to evaluate the treatability of wastewater by biological processes. Insufficient nitrogen
can necessitate the addition of nitrogen to make the waste treatable. Where control of
algal growths in the receiving water is necessary, removal or reduction of nitrogen in
wastewater prior to discharge may be desirable. In phytoplankton the stoichiometric
ratio from Nutrients to each other is C:N:P = 106:16:1 (Redfield ratio). Decreasing
one factor makes this Nutrient to the limiting factor that inhibits the total algal growth.
Sources of Nitrogen
The principal sources of nitrogen compounds are (1) the nitrogenous compounds of
plant and animal origin, (2) sodium nitrate, and (3) atmospheric nitrogen. Nitrogen
from decayed plant and animal material where organic bound nitrogen is a major
compound. Sodium nitrate (NaNO3) is found principally in mineral deposits and in
the manure found in seabird rookeries. The production of nitrogen from the

33
atmosphere is termed fixation. Because fixation is a biologically mediated process and
because NaNO3 deposits are relatively scarce, most sources of nitrogen in
soil/groundwater are of biological origin.
Forms of Nitrogen
The most common and important forms of nitrogen in wastewater and their
corresponding oxidation state in the water/soil environment are ammonia (NH3),
ammonium (NH4), nitrogen gas (N2), nitrite ion (NO2), and nitrate ion (NO3).
As can be seen in Table 2-7, Total nitrogen is comprised of organic nitrogen,
ammonia, nitrite, and nitrate. The organic fraction consists of a complex mixture of
compounds including amino acids, amino sugars, and proteins (polymers of amino
acids). The compounds that comprise the organic fraction can be soluble or particulate.
The nitrogen in these compounds is readily converted to ammonium through the
selection of microorganisms in the aquatic or soil environment. Organic nitrogen can
be determined analytically using the Kjeldahl method. The aqueous sample is first
boiled to drive off the ammonia, and then it is digested. During digestion the organic
nitrogen is converted to ammonium through the action of heat and acid. Total
Kjeldahl nitrogen (TKN) is determined in the same manner as organic nitrogen,
except that the ammonia is not driven off before the digestion step. Total Kjeldahl
nitrogen is therefore the total of the organic and ammonia nitrogen.
Table 2-7: Definition of the various terms used to define various nitrogen species Form of nitrogen Abbrev. Definition Ammonia gas NH3 NH3 Ammonium ion NH4 NH4 Total Ammonia nitrogen TAN NH3+NH4 Nitrite NO2 NO2 Nitrate NO3 NO3 Total inorganic nitrogen TIN NH3+NH4+NO2+NO3 Total kjeldahl nitrogen TKN Orgnaic N+NH3+NH4 Organic nitrogen Orgnic N TKN- (NH3+NH4) Total nitrogen TN Organic N+NH3+NH4+NO2+NO3
As biological nutrient removal has become more common, information on the various
organic nitrogen fractions has become important. The principal fractions are
particulate and soluble. In biological treatment studies, the particulate and soluble
34
fractions of organic nitrogen are fractionated further to assess wastewater treatability .
Fractions that have been used include (1) free ammonia, (2) biodegradable soluble
organic nitrogen, (3) biodegradable particulate organic carbon, (4) nonbiodegradable
soluble organic nitrogen, and (5) nonbiodegradable particulate organic nitrogen.
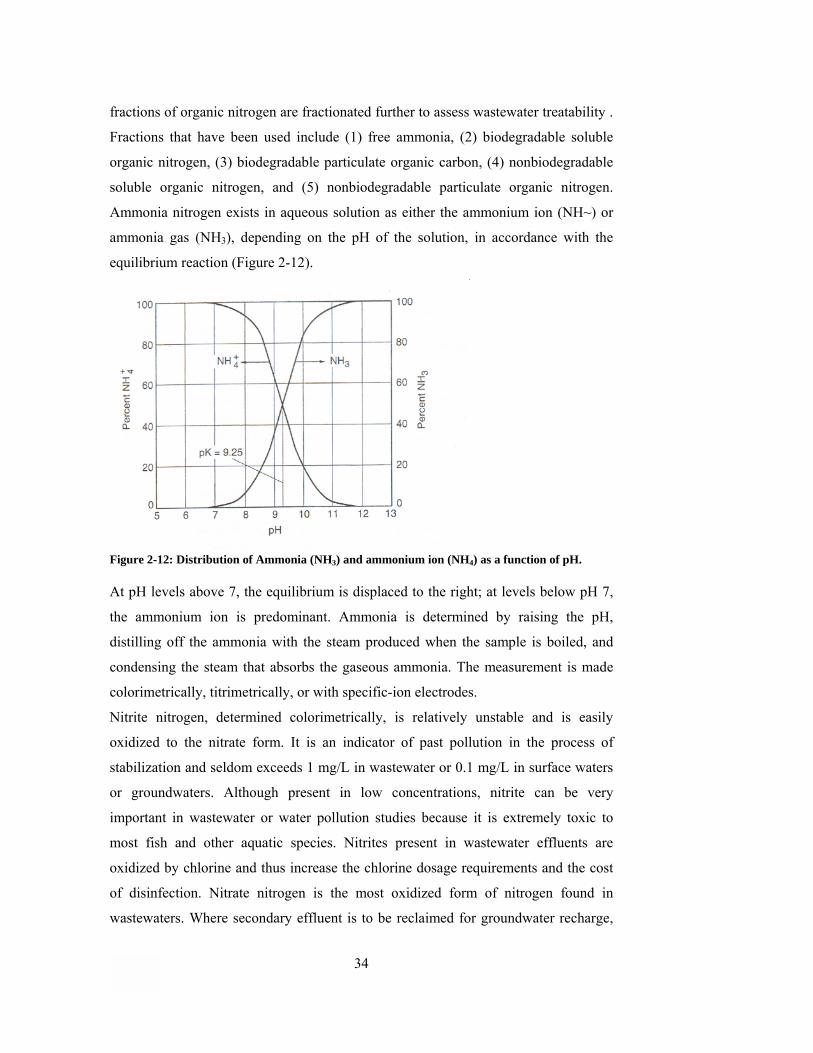
Ammonia nitrogen exists in aqueous solution as either the ammonium ion (NH~) or
ammonia gas (NH3), depending on the pH of the solution, in accordance with the
equilibrium reaction (Figure 2-12).
Figure 2-12: Distribution of Ammonia (NH3) and ammonium ion (NH4) as a function of pH. At pH levels above 7, the equilibrium is displaced to the right; at levels below pH 7,
the ammonium ion is predominant. Ammonia is determined by raising the pH,
distilling off the ammonia with the steam produced when the sample is boiled, and
condensing the steam that absorbs the gaseous ammonia. The measurement is made
colorimetrically, titrimetrically, or with specific-ion electrodes.
Nitrite nitrogen, determined colorimetrically, is relatively unstable and is easily
oxidized to the nitrate form. It is an indicator of past pollution in the process of
stabilization and seldom exceeds 1 mg/L in wastewater or 0.1 mg/L in surface waters
or groundwaters. Although present in low concentrations, nitrite can be very
important in wastewater or water pollution studies because it is extremely toxic to
most fish and other aquatic species. Nitrites present in wastewater effluents are
oxidized by chlorine and thus increase the chlorine dosage requirements and the cost
of disinfection. Nitrate nitrogen is the most oxidized form of nitrogen found in
wastewaters. Where secondary effluent is to be reclaimed for groundwater recharge,

35
the nitrate concentration is important. The WHO drinking water guidelines (WHO,
2006) limit nitrogen to 50 mg/L as NO3-, because of its serious and occasionally fatal
effects on infants. Nitrates may vary in concentration from 0 to 20 mg/L as N in
wastewater effluents. Assuming complete nitrification has taken place, the typical
range found in treated effluents is from 15 to 20 mg/L as N. The nitrate concentration
is typically determined by colorimetric methods or with specific-ion electrodes.
Nitrogen Pathways in Nature
The various forms of nitrogen that are present in nature and the pathways by which
the forms are changed in an aquatic environment are depicted on Figure 2-14. The
nitrogen present in fresh wastewater is primarily combined in proteinaceous matter
and urea. Decomposition by bacteria readily changes the organic form to ammonia.
The microbiologic nitrogen circle which is important for the treatment process is
shown in Figure 2-13. The age of wastewater is indicated by the relative amount of
ammonia that is present. In an aerobic environment, bacteria can oxidize the ammonia
nitrogen to nitrites and nitrates. The predominance of nitrate nitrogen in wastewater
indicates that the waste has been stabilized with respect to oxygen demand. Nitrates,
however, can be used by plants and animals to form protein. Death and decomposition
of the plant and animal protein by bacteria again yields ammonia. If nitrogen in the
form of nitrates can be reused to make protein by algae and other plants, it may be
necessary to remove or reduce the nitrogen that is present to prevent these growths.
Figure 2-13: Microbiologic nitrogen circle (aerob/anaerob)

36

37
Figure 2-14: Generalized nitrogen cycle in the aquatic and soil environment

38
Phosphorus
Phosphorus is also essential to the growth of algae and other biological organisms. Because of
noxious algal blooms that occur in surface waters, there is presently much interest in controlling
the amount of phosphorus compounds that enter surface waters in domestic and industrial waste
discharges and natural runoff. Municipal wastewaters, for example, may contain from 4 to 16
mg/L of phosphorus as P. The usual forms of phosphorus that are found in aqueous solutions
include the orthophosphate, polyphosphate, and organic phosphate. The orthophosphates as PO4,
H3PO4, are available for biological metabolism without further breakdown. Orthophosphate can
be determined by directly adding a substance such as ammonium molybdate which will form a
colored complex with the phosphate. The polyphosphates and organic phosphates must be
converted to orthophosphates using an acid digestion step before they can be determined in a
similar manner
Sulfur
The sulfate ion occurs naturally in most water supplies and is present in wastewater as well.
Sulfur is required in the synthesis of proteins and is released in their degradation. Sulfate is
reduced biologically under anaerobic conditions to sulfide which, in turn, can combine with
hydrogen to form hydrogen sulfide (H2S). The following generalized reactions are typical.
Bacteria
Organic matter + SO4------------> S2- + H2 + CO2
S2- + 2H+ ---------------------- H2S
Hydrogen sulfide gas, which will diffuse into the headspace above the wastewater in sewers that
are not flowing full, tends to collect at the crown of the pipe. The accumulated H2S can then be
oxidized biologically to sulfuric acid, which is corrosive to concrete sewer pipes. This corrosive
effect, known as "crown rot," can seriously threaten the structural integrity of the sewer pipe
(ASCE, 1989; D.S. EPA, 1985e)
Sulfates are reduced to sulfides in sludge digesters and may upset the biological process if the
sulfide concentration exceeds 200 mg/L. Fortunately, such concentrations are rare. The H2S gas,

39
which is evolved and mixed with the wastewater gas (CH4 + CO2), is corrosive to the gas piping
and, if burned in gas engines, the products of combustion can damage the engine and severely
corrode exhaust gas heat recovery equipment, especially if allowed to cool below the dew point
Gases
Gases commonly found in untreated wastewater include nitrogen (N2), oxygen (O2), carbon
dioxide (CO2), hydrogen sulfide (H2S), ammonia (NH3), and methane (CH4). The first three are
common gases of the atmosphere and will be found in all waters exposed to air. The latter three
are derived from the decomposition of the organic matter present in wastewater and are of
concern with respect to worker health and safety. Although not found in untreated wastewater,
other gases with which the environmental engineer must be familiar include chlorine (Cl2) and
ozone (O3) (for disinfection and odor control), and the oxides of sulfur and nitrogen (in
combustion processes). The following discussion is limited to those gases that are of interest in
untreated wastewater. Under most circumstances, the ammonia in untreated wastewater will be
present as the ammonium ion.
Dissolved Oxygen
Dissolved oxygen (DO) is required for the respiration of aerobic microorganisms as well as all
other aerobic life forms. However, oxygen is only slightly soluble in water. The actual quantity of
oxygen (other gases too) that can be present in solution is governed by (1) the solubility of the
gas, (2) the partial pressure of the gas in the atmosphere, (3) the temperature, and (4) the
concentration of the impurities in the water (e.g., salinity, suspended solids, etc.). Water at 20°C,
that is standing in equilibrium with air at atmospheric pressure has a oxygen concentration of 6.2
mg/L (Schlegel, 1976). Because the rate of biochemical reactions that use oxygen increases with
increasing temperature, dissolved oxygen levels tend to be more critical in the summer months.
The presence of dissolved oxygen in wastewater is desirable because it prevents the formation of
noxious odors.
Hydrogen Sulfide
Hydrogen sulfide is formed, as mentioned previously, from the anaerobic decomposition of
organic matter containing sulfur or from the reduction of mineral sulfites and sulfates. It is not

40
formed in the presence of an abundant supply of oxygen. This gas is a colorless, inflammable
compound having the characteristic odor of rotten eggs. Hydrogen sulfide is also toxic, and great
care must be taken in its presence. High concentrations can overwhelm olfactory glands, resulting
in a loss of smell. This loss of smell can lead to a false sense of security that is very dangerous.
The blackening of wastewater and sludge usually results from the formation of hydrogen sulfide
that has combined with the iron present to form ferrous sulfide (FeS). Various other metallic
sulfides are also formed. Although hydrogen sulfide is the most important gas formed from the
standpoint of odors, other volatile compounds such as indol, skatol, and mercaptans, which may
also be formed during anaerobic decomposition, may cause odors far more offensive than that of
hydrogen sulfide
Carbon Dioxide
Carbon dioxide (CO2) is the end product of aerobic digestion. Its produced in large quantities in
the aerobic treatment process. Carbon compounds (organic matter) are in a complete treatment
process either bound in biomass of active microorganisms or leave the reactor in form of carbon
dioxide. Carbon dioxide in solution has a complex equilibrium, dependent on its concentration,
pH and temperature with a Aquarius form of carbon dioxide (CO2-aq), carbonic acid (H2CO3),
bicarbonate (HCO3-), carbonate (CO2
2-) and solid containing carbonates. Therefore it is directly
related to Alkalinity and Hardness.
Methane
The principal byproduct from the anaerobic decomposition of the organic matter in wastewater is
methane gas. Methane is a colorless, odorless, combustible hydrocarbon of high fuel value.
Normally, large quantities are not encountered in untreated wastewater because even small
amounts of oxygen tend to be toxic to the organisms responsible for the production of methane.
Occasionally, however, as a result of anaerobic decay in accumulated bottom deposits, methane
has been produced. Because methane is highly combustible and the explosion hazard is high,
access ports (manholes) and sewer junctions or junction chambers where there is an opportunity
for gas to collect should be ventilated with a portable blower during and before the time required
for operating personnel to work in them for inspection, renewals, or repairs. In treatment plants,
methane is produced from the anaerobic treatment process used to stabilize wastewater sludges.

41
In treatment plants where methane is produced, notices should be posted about the plant warning
of explosion hazards, and plant employees should be instructed in safety measures to be
maintained while working in and about the structures where gas may be present.
2.3.3.2 Metallic constituents
Trace quantities of many metals, such as cadmium (Cd), chromium (Cr), copper (Cu), iron (Fe),
lead (Pb), manganese (Mn), mercury (Hg), nickel (Ni), and zinc (Zn) are important constituents
of most waters. Many of these metals are classified as priority pollutants. However, most of these
metals are necessary for growth of biological life, and absence of sufficient quantities of them
could limit growth of algae, for example. The presence of any of these metals in excessive
quantities will interfere with many beneficial uses of the water because of their toxicity; therefore,
it is frequently desirable to measure and control the concentrations of these substances.
Importance of Metals
Metals of importance in the treatment, reuse, and disposal of treated effluents and biosolids are
summarized in Table 2-8. All living organisms require varying amounts (macro and micro) of
metallic elements, such as iron, chromium, copper, zinc, and cobalt, for proper growth. Although
macro and micro amounts of metals are required for proper growth, the same metals can be toxic
when present in elevated concentrations. As more use is made of treated wastewater effluent for
irrigation and landscape watering, a variety of metals must be determined to assess any adverse
effects that may occur. Calcium, magnesium, and sodium are of importance in determining the
sodium adsorption ratio (SAR), which is used to assess the suitability of treated effluent for
agricultural use. Where composted sludge is applied in agricultural applications, arsenic,
cadmium, copper, lead, mercury, molybdenum, nickel, selenium, and zinc must be determined.
Table 2-8: Metals of importance in wastewater management
Metal symbol Nutrients necessary for biological growth
Conc. Threshold of inhibatory effect on heterotrophic organisms (mg/L)
Used to determine SAR for land application of effluent
Used to determine if biosolids are suitabe for land application
macro micro
Comment [r2]: In the end of this gas storry it would be nice to tell the greenhouse gasses… even though not realy fitting to the subject

42
Arsenic As 0.05 Cadmium Cd 1.0 Calcium Ca Chromium Cr 10 Cobalt Co Copper Cu 1.0 Iron Fe Lead Pb 0.1 Magnesium Mg Mangnese Mn Mercury Hg 0.1 Molybdenum Mo Nickel Ni 1.0 Potassium K Selenium Se Sodium Na Tungsten W Vandium V Zinc Zn 1.0
Sources of Metals
The sources of trace metals in wastewater include the discharges from residential dwellings,
groundwater infiltration, and commercial and industrial discharges. Many of the sources of heavy
metals are identified in Table 2-9. For example, cadmium, chromates, lead, and mercury are often
present in industrial wastes. These are found particularly in metal-plating wastes and should be
removed by pretreatment at the site of the industry rather than be mixed with the municipal
wastewater. Fluoride, a toxic anion, is found commonly in wastewater from electronics
manufacturing facilities
Table 2-9: Typical wastewater compounds that have been classified as priority pollutants, produced by commercial, industrial and agricultural activities. Name formula Use
Concern
Arsenic As Alloying additive for metals, especially lead and copper as shot, battery grids, cable sheaths, boiler tubes. High-purity (semiconductor) grade
Carcinogen and mutagen. Long term-sometimes can cause fatigue and loss of energy; dermatitis
Barium Ba Getter alloys in vacuum tubes, deoxidizer for copper, Frary' s metal, lubricant for anode rotors in x-ray tubes, spark-plug alloys
Flammable at room temperature in powder form. Long-term-Increased blood pressure and nerve block
Cadmium Cd Electrodeposited and dipped coatings on Flammable in powder form.

43
metals bearing and low-melting alloys, brazing alloys fire protection system, nickel-cadmium starage batteries power transmission wire, TV phosphors basis of pigments used in ceramic glazes machinery enamels, fungicide, photography and lithography, selenium rectifiers, electrodes for cadmium-vapor lamps and photoelectric cells
Toxic by inhalation of dust or fume. A carcinogen. Soluble compounds of cadmium are highly toxic Long-term -concentrates in the liver, kidneys, pancreas, and thyroid; hypertension suspected effect
Chromium Cr Alloying and plating element on metal and plastic substrates for corrosion resistance, chromium- containing and stainless steels, protective coating for automotive and equipment accessories, nuclear and high-temperature research, constituent of inorganic pigments
Hexavalent chromium compounds are carcinogenic and corrosive on tissue. Long-term-skin sensitization and kidney damage
Lead Pb Storage batteries, gasoline additive, cable covering, ammunition, piping, tank linings, solder and fusible alloys, vibration damping in heavy construction, foil, Babbitt and other bearing alloys
Toxic by ingestion or inhalation of dust or fumes. Long-ferm-brain and kidney damage; birth defects
Mercury Hg Amalgams, catalyst electrical apparatus, cathodes for production of chlorine and caustic soda, instruments, mercury vapor lamps, mirror coating, arc lamps, boilers
Highly toxic by skin absorption and inhalation of fume or vapor. Long-term -toxic to central nervous system, may cause birth defects
selenium Se Electronics, xerographic plates, TV cameras, photocells, magnetic computer cores, solar batteries (rectifiers, relays). ceramics (colorant for glass), steel and copper, rubber accelerator, catalyst, trace element in animal feeds
Long-term-red staining of fingers, teeth, and hair; general weakness; depression; irritation of nose and mouth
Silver Ag Manufacture of silver nitrate, silver bromide photochemicals; lining vats and other equipment for chemical reaction vessels, water distillation, etc. mirrors, electric conductors, silver plating electronic equipment; sterilant, water purification, surgical cements, hydration and oxidation catalyst, special batteries, solar cells, Rectors for solar towers, low-temperature brazing alloys, jewelry, dental, medical, and scientific equipment, electrical contacts, bearing metal, magnet windings, dental amalgams, colloidal silver used as a nucleating agent in photography and medicine, often combined with protein
Toxic metal. Long-term-permanent gray discoloration of skin, eyes, and mucous membranes
Comment [r3]: Not YEMINIZED…but what industry in the YEMEN with what techniques???

44
2.3.3.3 Aggregate organic constituents
The organic matter in wastewater typically consists of proteins (40 to 60 percent), carbohydrates
(25 to 50 percent), and oils and fats (8 to 12 percent). Urea ((NH2)2CO), the major constituent of
urine, is another important organic compound contributing to fresh wastewater. Because urea
decomposes rapidly, it is seldom found in other than very fresh wastewater. Along with the
proteins, carbohydrates, fats and oils, and urea, wastewater typically contains small quantities of
a very large number of different synthetic organic molecules, with structures ranging from simple
to extremely complex. Surface water contaminated by industrial runoff can contain up to 106
different types of organic substances.
Over the years, a number of different analyses have been developed to determine the organic
content of wastewaters. In general, the analyses may be classified into those used to measure
aggregate organic matter comprising a number of organic constituents with similar characteristics
that cannot be distinguished separately in this type of analyze, and those analyses used to
quantify individual organic compounds (Standard Methods, 1998). The measurement of
aggregate organic matter as a sum parameter is very popular since the analytical procedures are in
comparison with analyzing several organic compounds, simple, fast and cheap. For lots of
specific organic compounds are even no analytic methods available to detect them in the
concentration they are present. For a treatment process it is also more important to get an
overview of the total amount of degradable substances than to know exact which substances these
are. Different measurements for aggregate organic matter also give information about the
biodegradability of the wastewater ingredients.
Measurement of Organic Content
In general, the analyses used to measure aggregate organic material may be divided into those
used to measure gross concentrations of organic matter greater than about 1.0 mg/L and those
used to measure trace concentrations in the range of 10-12 to 100mg/L. Laboratory methods
commonly used today to measure gross amounts of organic matter (typically greater than 1 mg/L)
in wastewater include: (1) biochemical oxygen demand (BOD), (2) chemical oxygen demand
(COD), and (3) total organic carbon (TOC). Complementing these laboratory tests is the

45
theoretical oxygen demand (ThOD), which is determined from the chemical formula of the
organic matter.
Biochemical Oxygen Demand (BOD)
The most widely used parameter of organic pollution applied to both wastewater and surface
water is the 5-day BOD (BOD5). This determination involves the measurement of the dissolved
oxygen used by microorganisms in the biochemical oxidation of organic matter over the period of
fife days. BOD test results are now used (1) to determine the approximate quantity of oxygen that
will be required to biologically stabilize the organic matter present, (2) to determine the size of
wastewater treatment facilities, (3) to measure the efficiency of some treatment processes, and (4)
to determine compliance with wastewater discharge permits. Because it is likely that the BOD
test will continue to be used for some time, it is important to know the details of the test and its
limitations.
Basis for BOD Test
If sufficient oxygen is available, the aerobic biological decomposition of an organic waste will
continue until all of the waste is consumed. Three more or less distinct activities occur. (1) A
portion of the waste is oxidized to end products to obtain energy for (2) synthesis of new cell
tissue and the (3) cell maintenance.
Using the term COHNS (which represents the elements carbon, oxygen, hydrogen, nitrogen, and
sulfur) to represent the organic waste and the term C5H7NO2 [first proposed by Hoover and
Porges (1952)] to represent cell tissue, the three processes are defined by the following
generalized chemical reactions:
1. Oxidation:
COHNS + O2 ------bacteria ------ CO2 + H2O + NH3 + other end products + energy
2. Synthesis:
COHNS + O2 + energy -----bacteria ---- C5H7NO2 (New cell tissue)

46
3. Endogenous respiration:
C5H7NO2 + 5O2-----bacteria---- 5CO2 + NH3 + 2H2O
If only the oxidation of the organic carbon that is present in the waste is considered, the ultimate
BOD is the oxygen required to complete the three reactions given above. This oxygen demand is
known as the ultimate carbonaceous or first-stage BOD, and is usually denoted as UBOD.
BOD Test Procedure
In the standard BOD test (Figure 2-15), a small sample of the wastewater to be tested is placed in
a BOD bottle (volume = 300 mL). The bottle is then filled with dilution water saturated in
oxygen and containing the nutrients required for biological growth. To ensure that meaningful
results are obtained, the sample must be suitably diluted with specially prepared dilution water so
that adequate nutrients and oxygen will be available during the incubation period.

47
Figure 2-15: Biochemical Oxygen Demand (BOD) measurement.
Normally, several dilutions are prepared to cover the complete range of possible BOD values.
This procedure is also important to identify if there are toxic substances in the sample that inhibit
with a certain concentration microbiologic action.
When testing waters with low concentrations of microorganisms, a seeded BOD test is conducted.
The organisms contained in the effluent from primary sedimentation facilities are used commonly
as the seed for the BOD test. Seed organisms can also be obtained commercially. When the
sample contains a large population of microorganisms (e.g., untreated wastewater), seeding is not

48
necessary. The outcome of the test is strongly dependent on the conditions of the wastewater the
sample is taken from (settled, filtered or mixed raw-wastewater).
The standard incubation period is usually 5 days at 20°C, but other lengths of time and
temperatures can be used. Longer time periods (typically 7 days), which correspond to work
schedules, are often used, especially in small plants where the laboratory staff is not available on
the weekends or when microorganisms need time to adapt on the wastwater. The temperature,
however, should be constant throughout the test. The 20°C temperature used is an average value
for slow-moving streams in temperate climates and is easily duplicated in an incubator. Different
results would be obtained at different temperatures, because biochemical reaction rates are
temperature dependent.
Biochemical oxidation theoretically takes an infinite time to go to completion because the rate of
oxidation is assumed to be proportional to the amount of organic matter remaining. Within a 20-
day period, the oxidation of the carbonaceous organic matter is usually about 95 to 99 percent
complete, and in the 5-day period used for the BOD test, oxidation is from 60 to 70 percent
complete.
Nitrification in the BOD Test
Non carbonaceous matter, such as ammonia, is produced during the hydrolysis of proteins. It is
now known that a number of bacteria are capable of oxidizing ammonia to nitrite and
subsequently to nitrate. This process is called Nitrification. The generalized reactions are as
follows:
Conversion of ammonia to nitrite (as typified by Nitrosomonas)
NH3 + (3/2)O2 HNO2 + H2O
Conversion of nitrite to nitrate (as typified by Nitrobacter)
HNO2 + (1/2)O2 HNO3
Overall conversion of ammonia to nitrate:
NH3 + 2O2 HNO3 + H2O

49
The oxygen demand associated with the oxidation of ammonia to nitrate is called the nitrogenous
biochemical oxygen demand (NBOD). The normal exertion of the oxygen demand in a BOD test
for a domestic wastewater is shown on Figure 2-16. Because the reproductive rate of the
nitrifying bacteria is slow, it normally takes from 6 to 10 days for them to reach significant
numbers to exert a measurable oxygen demand. If nitrification has too high influence on the
oxygen uptake, it is possible to pretreat the sample and remove the specific bacteria or to add
chemical nitrification inhibiters to the sample that suppress these types of bacteria. The BOD test,
in which the nitrification reaction is suppressed chemically, should be used only on samples that
contain small amounts of organic carbon (e.g., treated effluent) because the inhibitors can cause
measuring errors up to 20%. The oxygen demand without Nitrification is called the carbonaceous
biochemical oxygen demand (CBOD).
Figure 2-16: Definition sketch for the exertion of the carbonaceous and nitrogenous biochemical oxygen demand in a waste sample.
Methods for Respirometric Determination of BOD
Determination of the BOD value and the corresponding rate constant k1 can be accomplished
more effectively in the laboratory using an instrumented large-volume electrolysis cell
respirometer. An electrolysis cell may also be used to obtain a continuous BOD (Young and
Baumann, 1976a, 1976b). Within the cell, oxygen pressure over the sample is maintained
constant by continuously replacing the oxygen used by the micoorganisms. Oxygen replacement

50
is accomplished by means of an electrolysis reaction in which oxygen is produced in response to
changes in the pressure. The BOD readings are determined by noting the length of time that the
oxygen was generated and correlating it to the amount of oxygen produced by the electrolysis
reaction. The modern electrolysis cell respirometer has replaced the Gilson and Warburg
respirometer, used previously, in which the oxygen consumed was calculated from pressure drop
measurements made with a manometer (Tchobanoglous and Burton, 1991). The principal
advantages of the electrolysis cell over the Gilson and Warburg respirometers are that (I) the use
of a large (1-L) sample minimize the errors of grab sampling and pipetting in dilutions, and (2)
the value of the BOD is available directly. A typical example of a commercially available
electrolytic respirometer with multiple electrolysis cells is shown in Fig. 2-13.
Figure 2-17: Respirometer with multiple electrolysis cells
Limitations in the BOD Test
The limitations of the BOD test are as follows: (I) a high concentration of active, acclimated seed
bacteria is required; (2) pretreatment is needed when dealing with toxic wastes, and the effects of
nitrifying organisms must be reduced; (3) only the biodegradable organics are measured; (4) the
test does not have stoichiometric validity after the soluble organic matter present in solution has
been used; and (5) the relatively long period of time required to obtain test results (originally
chosen to minimize variance). Of the above, perhaps the most serious limitation is that the 5-day
period may or may not correspond to the point where the soluble organic matter is present has
been used.
Total and Soluble Chemical Oxygen Demand (COD and SCOD)

51
The COD test is used to measure the required amount of oxygen to oxidize the organic material
in wastewater chemically in units [mg O2/L]. As chemical oxidation agent is used potassic-
dichromate (K2Cr2O7) in an acid solution, afterwards the amount of used oxygen is derived by
titration. The chemical oxidation process is taking part for two hours in a heating device (Figure
2-18).
Figure 2-18: COD analytical equipment
Although it would be expected that the value of the ultimate carbonaceous BOD would be as high
as the COD, this is seldom the case. Some of the reasons for the observed differences are as
follows: (1) many organic substances which are difficult to oxidize biologically, such as lignin,
can be oxidized chemically, (2) inorganic substances that are oxidized by the dichromate increase
the apparent organic content of the sample, (3) certain organic substances may be toxic to the
microorganisms used in the BOD test, and (4) high COD values may occur because of the
presence of inorganic substances with which the dichromate can react. From an operational
standpoint, one of the main advantages of the COD test is that it can be completed in about 2.5 h,
compared to 5 or more days for the BOD test. To reduce the time further, a rapid COD test that
takes only about 15 min has been developed.
As new methods of biological treatment have been developed, especially with respect to
biological nutrient removal, it has become more important to fractionate the COD. The principal
fractions are particulate and soluble COD. In sophisticated biological treatment studies, the

52
particulate and soluble fractions are fractionated further to assess wastewater treatability.
Fractions that have been used include: (1) readily biodegradable soluble COD, (2) slowly
biodegradable colloidal and particulate (enmeshed) COD, (3) nonbiodegradable soluble COD,
and (4) nonbiodegradable colloidal and particulate COD (Figure 2-19). The readily biodegradable
soluble COD is often fractionated further into complex COD that can be fermented to volatile
fatty acids (VFAs) and short chain VFAs.
Figure 2-19: COD subdivision. Unfortunately, as noted previously, there is little standardization on the definition of soluble
versus particulate COD. Where filtration is the technique used to fractionate the sample, the
relative distribution between soluble and particulate COD will vary greatly depending on the pore
size of the filter. An alternative method used to determine the soluble COD involves precipitation
of the suspended solids and a portion of the colloidal material. The COD of the clarified liquid
corresponds to the soluble COD.
Total and Dissolved Organic Carbon (TOC and DOC)
The TOC test, done instrumentally, is used to determine the total organic carbon in an aqueous
sample. The test methods for TOC utilize heat and oxygen, ultraviolet radiation, chemical
oxidants, or some combination of these methods to convert organic carbon to carbon dioxide
which is measured with an infrared analyzer or by other means. The TOC of a wastewater can
also be used as a measure of its pollutional characteristics, and in some cases it has been possible
Total COD
Biodegradable
COD
Active Biomass
Nonbiodegradable COD
Nonbiodegradable
soluble COD
Nonbiodegradable
colloidal and particulate COD
Readily
biodegradable soluble COD
Slowly biodegradable colloidal and
particulate COD

53
to relate TOC to BOO and COD values. The TOC test is also gaining in favor because it takes
only 5 to 10 min to complete, but needs more sophisticated laboratory equipment. If a valid
relationship can be established between results obtained with the TOC test and the results of the
BOD test for a given wastewater, use of the TOC test for process control is recommended.
More recently, a continuous on-line TOC analyzer has been developed, in conjunction with the
space program, that can be used to detect TOC concentrations in the ppb (parts per billion) range.
Such instruments are currently being used to detect the residual TOC in the treated effluent from
micro filtration and reverse osmosis (RO) treatment units.
Theoretical Oxygen Demand (ThOD)
If the chemical formula of the organic matter is known, the ThOD may be computed as illustrated
in Example 2-11. Comment [WR4]: Same as other example!

54
Interrelationships between BOD, COD, and TOC
Typical values for the ratio of BOD/COD for untreated municipal wastewater are in the range
from 0.3 to 0.8 (see Table 2-10). If the BOD/COD ratio for untreated wastewater is 0.5 or greater,
the waste is considered to be easily treatable by biological means. If the ratio is below about 0.3,
either the waste may have some toxic components or acclimated microorganisms may be required
in its stabilization. The corresponding BOD/ TOC ratio for untreated wastewater varies from 1.2
to 2.0. In using these ratios it is important to remember that they will change significantly with
the degree of treatment the waste has undergone, as reported in Table 2-10.
Table 2-10: Comparison of ratios of various parameters used to characterize wastewater Type of wastewater BOD/COD BOD/TOC Untreated 0.3-0.8 1.2-2 After primary settling 0.4-0.6 0.8-1.2 Final effluent 0.1-0.3 0.2-0.5 Oil and Grease
The term oil and grease, as commonly used, includes the fats, oils, waxes, and other related
constituents found in wastewater. The term fats, oil, and grease (FOG) used previously in the
literature has been replaced by the term oil and grease. The oil and grease content of a wastewater
is determined by extraction of the waste sample with trichlorotrifluoroethane (oil and grease are
soluble in trichlorotrifluoroethane). Other extractable substances include mineral oils, such as
kerosene and lubricating and road oils. Oil and grease are quite similar chemically; they are
compounds (esters) of alcohol or glycerol (glycerin) with fatty acids. The glycerides of fatty acids
that are liquid at ordinary temperatures are called oils, and those that are solids are called grease
(or fats).
If grease is not removed before discharge of treated wastewater, it can interfere with the
biological life in the surface waters and create unsightly films. Fats and oils are contributed to
domestic wastewater in butter, lard, margarine, and vegetable fats and oils. The low solubility of
fats and oils reduces their rate of microbial degradation. Alkali salts are known as soaps.
Common soaps are made by saponification of fats with sodium hydroxide. They are soluble in
water, but in the presence of hardness constituents, the sodium salts are changed to calcium and
magnesium salts of the fatty acids, or so-called mineral soaps. These are insoluble and are
precipitated.

55
Kerosene, lubricating, and road oils are derived from petroleum and coal tar and contain
essentially carbon and hydrogen. These oils sometimes reach the sewers in considerable volume
from shops, garages, and streets. For the most part, they float on the wastewater, although a
portion is carried into the sludge on settling solids. To an even greater extent than fats, oils, and
soaps, the mineral oils tend to coat surfaces.
Surfactants
Surfactants, or surface-active agents, are large organic molecules that are slightly soluble in water
and cause foaming in wastewater treatment plants and in the surface waters into which the waste
effluent is discharged. Surfactants are most commonly composed of a strongly hydrophobic
group combined with a strongly hydrophilic group. Two tests are now used to determine the
presence of surfactants in water and wastewater. The MBAS (methylene blue active substances)
test is used for anionic surfactants. The determination of surfactants is accomplished by
measuring the color change in a standard solution of methylene blue dye. Nonionic surfactants
are measured using the CTAS (cobalt thiocyapate active substances) test.
2.3.3.4 Individual organic compounds
Individual organic compounds are determined to assess the presence of specific priority
pollutants (both inorganic and organic) that have been and are continuing to be selected on the
basis of their known or suspected carcinogenicity, mutagenicity, teratogenicity, or high acute
toxicity. As the techniques used to identify specific compounds continue to improve, a number of
other organic compounds have been detected in public water supplies and in treated wastewater
effluents.
Priority Pollutants
In USA the Environmental Protection Agency has identified approximately 129 priority
pollutants in 65 classes to be regulated by categorical discharge standards (Federal Register,
1981). Priority pollutants (both inorganic and organic) were selected on the basis of their known
or suspected carcinogenicity, mutagenicity, teratogenicity, or high acute toxicity. Many of the
organic priority pollutants are also classified as volatile organic compounds (VOCs). The types of

56
standards are used to control pollutant discharges to publicly owned treatment works (POTWs).
The first, "prohibited discharge standards," applies to all commercial and industrial
establishments which discharge to POTWs. Prohibited standards restrict the discharge of
pollutants that may create a fire or explosion hazard in sewers or treatment works, are corrosive
(pH < 5.0), obstruct flow, upset treatment processes, or increase the temperature of the
wastewater entering the plant to above 40ºC. "Categorical standards" apply to industrial and
commercial discharges in 25 industrial categories ("categorical industries"), and are intended to
restrict the discharge of the 129 priority pollutants. In WHO and Yemen, no standards for priority
substances for wastewater outlet are given. The presence of these substances is relevant for the
following user.
Analysis of Individual Organic Compounds
The analytical methods used to determine individual organic compounds require the use of
sophisticated instrumentation capable of measuring trace concentrations in the range of 10-12 to
10-3 mg/L. Gas chromatographic (GC) and high-performance liquid chromatographic (HPLC)
methods are most commonly used to detect individual organic compounds. Different types of
detectors are used with each method, depending on the nature of the compound being analyzed.
Typical detectors used in conjunction with gas chromatography include electrolytic conductivity,
electron capture (ECD), flame ionization (FID), photoionization (PID), and mass spectrometer
(GCMS). Typical detectors for highperformance liquid chromatography include photodiode array
(PDAD) and post column reactor (PCR). It should also be noted that many of the individual
organic constituents can be determined by two or more of the above methods (Standard Methods,
1998). The most important individual organic compounds are listed in Table 2-11.
As instrumental methods of analysis have improved, the detection limits for these compounds
have become increasingly small, typically below 10 mg/L. The specific organic compounds that
are analyzed will depend on the application. For example, for indirect reuse applications scans of
disinfection byproducts may be required where chlorine is used for disinfection.
Volatile Organic Compounds (VOCs)
Organic compounds that have a boiling point less than or equal to 100°C and/or a vapor pressure
greater than I mm Hg at 25°C are generally considered to be volatile organic compounds (VOCs).
Comment [r5]: Is that correct? I did not found any!

57
For example, vinyl chloride, which has a boiling point of -13.98C and a vapor pressure of 2548
mm Hg at 20°C, is an example of an extremely volatile organic compound. Volatile organic
compounds are of great concern because (1) once such compounds are in the vapor state they are
much more mobile and therefore more likely to be released to the environment, (2) the presence
of some of these compounds in the atmosphere may pose a significant public health risk, and (3)
they contribute to a general increase in reactive hydrocarbons in the atmosphere, which can lead
to the formation of photochemical oxidants. The release of these compounds in sewers and at
treatment plants, especially at the headworks, is of particular concern with respect to the health of
collection system and treatment plant workers.
Table 2-11: Typical classes of organic compounds whose members are indentified as individual compounds. Name Occurrence /source Concern Volatile organic compounds
Found in ground- and surface waters
Potential for tetratogenesis or carcinogenesis in humans
1,2Dibromoethane (EDB) and 1,2-dibromo3-chloropropane (DBCP)
Found in groundwater .supplies, especially where these compounds have been used as fumigants
Detrimental effects on human health
Trihalomethanes (THMs)
Found in most chlorinated water supplies
Disinfection byproduct. Potential human carcinogen
Chlorinated organic solvents
Found in raw water supplies resulting from industrial contamination
Potential human carcinogen
Haloacetic acids (HAAs)
Formed From the chlorination of natural organic matter (Humic and Fulvic acids)
Disinfection byproduct. Potential human carcinogen
Trichlorophenol Formed from the chlorination of natural organic matter (humic and fulvic acids
Disinfection byproduct. Dichloroacetic acid and trichloroacetic acid are animal carcinogens
Aldehydes Formed from the application of ozone to water containing organic matter
Disinfection byproduct
Extractable base/neutral and acids
Many semivolatile compounds including polynuclear aromatic hydrocarbons, phthalates, phenolics, organochlorine pesticides, and PCBs
Many of the listed compounds are toxic or carcinogenic

58
Phenols Generally traceable to industrial discharges or landfills
Impart a taste to water at low levels. May have detrimental impact on human health at higher levels
Polychlorinated biphenyls (PCB
Found in water supplies contaminated by transformer oils
These compounds are toxic, bioaccumulative, and extremely stable in water
Polynuclear aromatic hydrocarbons (PAHs
Byproducts of petroleum processing or combustion
Many compounds in this group are highly carcinogenic at relatively low levels
Carbanate pesticides
Found in water supplies contaminated by pesticides
Organochlorine pesticides
Found in water supplies contaminated by pesticides
Many compounds in this group are bioaccumulative, and relatively stable, as well as toxic or carcinogenic
Acidic herbicide compounds
Used for weed control, these compounds are found in aquatic systems
Glyphosphate herbicide
Broad spectrum nonselective postemergence herbicide. Water supplies can become contaminated through runoff and spray drift
2.3.4 Biological Characteristics The biological characteristics of wastewater are of fundamental importance in the control of
diseases caused by pathogenic organisms of human origin, and because of the fundamental role
played by bacteria and other microorganisms in the decomposition and stabilization of the
organic matter, both in nature and in wastewater treatment plants. The inflow of wastewater to
treatment plants and the water during the treatment process have usually very high
microorganism content. An exact classification and quantification is usually not done in these
stages. For measuring the microorganism content in the wastewater treatment process estimations
with the above described determination of VS to FS relation are used. The purpose of this section
is to introduce (1) the microorganisms found in surface waters and wastewater (2) the pathogenic
microorganisms associated with human disease, (3) the use of indicator organisms, (4) the

59
methods and techniques used for the enumeration of bacteria. Figure 2-20 gives an overview on
the size of microorganisms and organic components found in water.
Figure 2-20: Size of components in water
2.3.4.1 Microorganisms found in surface water and wastewater
Organisms found in surface water and wastewater includes bacteria, fungi, algae, protozoa, plants
and animals, and virus. Bacteria, fungi, algae, protozoa, and viruses can only be observed
microscopically and classified and quantified with microbiological methods.
General Classification
Living single-cell microorganisms that can only be seen with a microscope are mainly
responsible for the activity in biological wastewater treatment. The basic functional and structural
unit of all living matter is the cell. Living organisms are divided into either prokaryote or
eukaryote cells in distinction of their genetic information and cell complexity. The prokaryotes
have the simplest cell structure and include bacteria, blue-green algae (cyanobacter), and archaea.
The archaea are separated from bacteria due to their DNA composition and unique cellular
chemistry, such as differences in the cell wall and ribosome structure. Many archaea are bacteria
that can grow under extreme conditions of temperature and salinity, and also include
methanogenic methane-producing bacteria, important in anaerobic treatment processes. In
contrast to the prokaryotes, the eukaryotes are much more complex and contain plants and
animals and single-celled organisms of importance in wastewater treatment including protozoa,
fungi, and green algae Table 2-12. Prokaryotes and eukaryotes have a huge variety of processes
they are able to perform. For every process in nature there is one specified microorganism that
performs one step of it, or the whole process at once. The fascinating aspect is that with every

60
synthesis step they have benefit, like wining energy to grow and run cell processes, by that they
enable all natural substance cycles.
Viruses are classified separately according to the host infected. For example Bacteriophage, as
the name implies, are viruses that infect bacteria.
Table 2-12: Comparison of prokaryote and eukaryote cells Cell characteristics Prokaryote Eukaryote Phylogenetic group Bacteria, blue-green algae
(cynobacteria), archaea Single cell: algae, fungi, protozoa Multicell: plants, animals
Size 0.2-3.0 μm 2-100 μm for single –cell organisms
General Description.
A general description of the microorganisms found in wastewater is given in Table 2-13 using the
terminology introduced in the previous paragraphs.
Table 2-13 General description of microorganisms found in wastewater Organisms Description Bacteria Bacteria are single-cell prokaryotic organisms. The interior of the cell
contains a colloidal suspension of proteins, carbohydrates, and other complex organic compounds, called the cytoplasm. The cytoplasmic area contains ribonucleic acid (RNA), whose major role is in the synthesis of proteins. Also within the cytoplasm is deoxyribonucleic acid (DNA). DNA contains all the information necessary for the reproduction of all the cell components and may be considered to be the blueprint of the cell. Their usual mode of reproduction is by binary fission, although some species reproduce sexually or by budding.
Archaea Similar to bacteria in size and basic cell components. Their cell wall, cell material, and RNA composition are different. Important in anaerobic processes and also found under extreme conditions of temperature and chemical composition.
Fungi/ Yeast
Fungi are multicellular, nonphotosynthetic, heterotrophic eukaryotes. Most fungi are either strict or facultative aerobes which reproduce sexually or asexually, by fission, budding, or spore formation. Maids, or "true fungi," produce microscopic units (hyphae), which collectively form a filamentous mass called the mycelium. Yeasts are fungi that cannot form a mycelium and ore therefore unicellular. Fungi have the ability to grow under low-moisture, low-nitrogen conditions and can tolerate an environment with a relatively low pH. The ability of the fungi to survive under low-pH and nitrogen-limiting conditions, coupled with their ability to degrade cellulose, makes them very important in the composting of sludge.

61
Protozoa Protozoa are motile, microscopic eukaryotes that are usually single cells. The majority of protozoa are aerobic heterotrophs, some are aerotolerant anaerobes, and a few are anaerobic. Protozoa are generally an order of magnitude larger than bacteria and often consume bacteria as an energy source. In effect, the protozoa act as polishers of the effluents from biological waste-treatment processes by consuming bacteria and particulate organic matter.
Rotifiers Rotifers are aerobic heterotrophic animal eukaryotes. The name is derived from the fact that they have two sets of rotating cilia on their head which are used for motility and capturing food. Rotifers are very effective in consuming dispersed and flocculated bacteria and small particles of organic matter. Their presence in an effluent indicates a highly efficient aerobic biological purification process.
Algae Algae are unicellular or multicellular, autotrophic, photosynthetic eukaryotes. They are of importance in biological treatment processes. In wastewater-treatment lagoons, the ability of algae to produce oxygen by photosynthesis is vital to the ecology of the water environment. The blue-green alga cyanobacter is a prokaryotic organism.
Viruses Viruses are composed of a nucleic acid core (either DNA or RNA) surrounded by on outer shell of protein called a capsid. Viruses are obligate intracellular parasites that multiply only within a host cell, where they redirect the cell's biochemical system to reproduce themselves. Viruses can also exist in an extracellular state in which the virus particle (known as a viron) is metabolically inert. Bacteriophages are viruses that infect bacteria as the host; they have not been implicated in human infections.
Data on the microorganisms found in wastewater and their species are presented in Table 2-14.
Table 2-14: Typical Micro-organism and selected species found in wastewater Bacteria:
Protozoa:
Helminths: Viruses
Bacilli Bacillus (E.coli) Cocci Spirilla Vibrio
Cryptosporidium Oocysts Sporozoite Entamoeba histalytica Cysts Trophozoite Giardia lambliad Cysts Trophozoite
Ancylostoma duodenale (hookworm) eggs. Ascaris lumbricoides (roundworm) eggs. Trichuris trichiura (whipworm) eggs
MS2 Enterovirus Norwalk Polio Rotavirus
Pathogenic Organisms
Pathogenic organisms found in wastewater may be excreted by human beings and animals who
are infected with disease or who are carriers of a particular infectious disease. The pathogenic
organisms found in wastewater can be classified into four broad categories, bacteria, protozoa,

62
helminths, and viruses. The principal pathogenic organisms found in untreated wastewater are
reported in Table 2-15, along with the diseases and disease symptoms associated with each
pathogen. Bacterial pathogenic organisms of human origin typically cause diseases of the
gastrointestinal tract, such as typhoid and paratyphoid fever, dysentery, diarrhea, and cholera.
Because these organisms are highly infectious, they are responsible for many thousands of deaths
each year in areas with poor sanitation, especially in the tropics. It has been estimated that up to
4.5 billion people are or have been infected with some parasite (Madigan et al., 2000).
Bacteria
Many types of harmless bacteria colonize the human intestinal tract and are routinely shed in the
feces. Because pathogenic bacteria are present in the feces of infected individuals, domestic
wastewater contains a wide variety and concentration range of nonpathogenic and pathogenic
bacteria. One of the most common bacterial pathogens found in domestic wastewater is the genus
Salmonella. The Salmonella group contains a wide variety of species that can cause disease in
humans and animals. Typhoid fever, caused by Salmonella typhi, is the most severe and serious.
The most common disease associated with Salmonella is food poisoning identified as
salmonellosis. Shigella, a less common genus of bacteria, is responsible for an intestinal disease
known as bacillary dysentery or shigellosis. Waterborne outbreaks of shigellosis have been
reported from recreational swimming areas and where wastewater has contaminated wells used
for drinking water (Crook, 1998; Maier et al., 2000).
Other bacteria isolated from raw wastewater include Vibrio, Mycobacterium, Clostridium,
Leptospira, and Yersinia species. Vibrio cholerae is the disease agent for cholera. Humans are the
only known hosts, and the most frequent mode of transmission is through water. Mycobacterium
tuberculosis has been found in municipal wastewater, and outbreaks have been reported among
persons swimming in water contaminated with wastewater (Crook, 1998; Maier et al., 2000).
Waterborne gastroenteritis of unknown cause is frequently reported, with the suspected agent
being bacterial. One potential source of this disease is certain gram-negative bacteria normally
considered to be nonpathogenic. These include the enteropathogenic Escherichia coli and certain
strains of Pseudomonas which may affect the newborn and have been implicated in
gastrointestinal disease outbreaks. Campylobacter jejuni has been identified as the cause of a

63
form of bacterial diarrhea in humans. While it has been well established that this organism causes
disease in animals, it has also been implicated as the etiologic agent in human waterborne disease
outbreaks (Crook, 1998).
Table 2-15: Infectious microorganisms potentially present in untreated domestic wastewater. Organism Disease Remarks/ symptoms Bacteria Campylobacter jejuni Escherichia coli (enteropathogenic) Legionella pneumophila Leptospira (spp) Salmonella (=2100 serotypes) Salmonella typhi Shigella (4 spp) Vibrio cholerae Yersinia enterocolitica
Gastroenteritis Gastroenteritis legionnaires' disease leptospirosis Salmonellosis Typhoid fever Shigellosis Cholera Yersiniosis
Diarrhea Diarrhea Malaise, myalgia, fever, headache, respiratory illness Jaundice, fever (Weil's disease( Food poisoning High fever, diarrhea, ulceration of small intestine Bacillary dysentery Extremely heavy diarrhea, dehydration Diarrhea
Protozoa: Balantidium coli Cryptosporidium parvum Cyclospora cayetonensis Entomoeba histolytica Giardia lamblia
Balantidiasis Cryptasporidiosis Cydosporasis Amebiasis (amoebic dysentery) Giardiasis
Diarrhea, dysentery Diarrhea Severe diarrhea, vomiting Prolonged diarrhea with bleeding Mild to sever diarrhea, nausea, indigestion
Helminths: Ascaris lumbricoides Enterobius vermicularis Fasciola hepatica Hymenolepis nana Taenia saginata T solium Trichuris Trichiura
Ascariasis Enterobiasis Fascioliasis Hymenolepiasis Taeniasis Taeniasis Trichuriasis
Roundworm infestation Pinworm Sheep liver fluke Dwarf tapeworm Beef tapeworm Pork tapeworm Whipworm
Viruses: Adenovirus (31 types) Enteroviruses (> 100 types) Hepatitis A virus Norwalk agent Parvovirus (2 types) Rotavirus
Respiratory disease Gastroenteritis, heart anomalies, meningitis Infectious hepatitis Gastroenteritis Gastroenteriti s Gastroenteritis
Jaundice, fever Vomiting
Typical data on the quantity of selected pathogenic organisms found in wastewater and the
corresponding concentration needed for an infectious dose are reported in Table 2-16.
Table 2-16: Microorganism concentrations found in untreated wastewater and the corresponding infectious dose in most probably number (mpn) per 100ml. Organism Concentration in raw
wastewater mpn/100ml
Infectious dose, number of organisms
Bacteria: Bacterioides Coliform (total) Coliform (fecal) Clostridium perfringens Enterococci
107-1010
107-109
106-108
103-105
104-105
106-1010
1-1010

64
Faecal streptococci Pseudomonas oeruginosa Shigela Salmonella
104-107
103-106
100-103
102-104
10-20 101-108
Protozoa: Cryptosporidium parvum oocysts Entamoeba histolytica cysts Giardia lamblia cysts
101-103
10-1-101
103-104
1-10 10-20 <20
Helmint: Ova Ascaris lumbricoides
101-103
10-2-100
1-10
Viruses: Enteric viruses Coliphage
103-104
103-104
1-10
Protozoa
Of the disease causing organisms reported in Table 2-15, the protozoans Cryptosporidium
parvum, Cyclospora, and Giardia lamblia are of great concern because of their significant impact
on individuals with compromised immune systems, including very young children, the elderly,
persons undergoing treatment for cancer, and individuals with acquired immune deficiency
syndrome (AIDS). Infection is caused by the ingestion of water contaminated with oocysts and
cysts. It is also important to note that numerous nonhuman sources of Cryptosporidium parvum
and Giardia lamblia are present in the environment. Further, not all of the oocysts and cysts that
are present are viable in terms of their ability to cause diseases. To determine the potential risk
from these microorganisms, infectivity studies must be conducted
As noted in Table 2-15, these protozoan organisms may cause symptoms which can include
severe diarrhea, stomach cramps, nausea, and vomiting lasting for extended periods. These
organisms are of particular concern because they are found in almost all wastewaters, and
because conventional disinfection techniques using chlorine have not proved to be effective in
their inactivation or destruction. However, in recent studies, it has been found that UV
disinfection is extremely effective in the inactivation of oocysts of Cryptosporidium parvum and
the cysts of Giardia lamblia.
Helminths
The term helminths is used to describe worms collectively. In developed countries, as a result of
the improvements in the provision of sanitation and wastewater treatment facilities and in food-

65
handling practices, the prevalence of helminth infections has decreased dramatically over the last
century. Nevertheless, the transmission of helminths by wastewater and particularly by biosolids
remains a concern. In fact, the eggs of worms are found in wastewater everywhere. In particular,
small nonparasitic nematodes are universally present, even in finished drinking water at the tap
(Cooper, 2001). Worldwide, worms are one of the principal causative agents of human disease. It
is estimated that the number of human infections caused by helminths collectively is on the order
of 4.5 billion (Roberts and Janovy, 1996)
Most of the helminths fall into three major phyla: Nematoda (roundworms), Platyhelminthes
(flatworms), and Annelida (segmented worms). Most human infections are associated with round-
and flat-worms, while the segmented worms are primarily ectoparasitic, such as leaches. More
than 200 mi1lion infections are ascribed to these worms worldwide.
The human infective stage of helminths varies; in some species it is either the adult organism or
larvae, while in other species it is the eggs, but it is primarily the eggs that are present in
wastewater. Helminth eggs, which range in size from about 10μm to more than 100μm, can be
removed by many commonly used wastewater-treatment processes such as sedimentation,
filtration, and stabilization ponds. However, some helminth eggs are extremely resistant to
environmental stresses and may survive usual wastewater and sludge disinfection procedures.
Chlorine disinfection and mesophilic anaerobic digestion, for example, are not effective at
inactivating many helminth eggs. In a recent study, it has been found that the eggs of Ascaris can
survive for up to 10 years in the sediments of oxidation ponds (Nelson, 2001). The long survival
times of Ascaris and other worm eggs are of particular importance in the management of
biosolids
Viruses
More than 100 different types of enteric viruses capable of producing infection or disease are
excreted by humans. Enteric viruses multiply in the intestinal tract and are released in the fecal
matter of infected persons. From the standpoint of health, the most important human enteric
viruses are the enteroviruses (polio, echo, and coxsackie), Norwalk viruses, rotaviruses,
reoviruses, caIiciviruses, adenoviruses, and hepatitis A virus. Of the viruses that cause diarrheal
disease, only the Norwalk virus and rotavirus have been shown to be major waterborne pathogens.
There is no evidence that the human immunodeficiency virus (RN), the pathogen that causes the

66
acquired immunodeficiency syndrome (AIDS), can be transmitted via the waterborne route
(Crook, 1998; Madigan et al., 2000; Maier et al., 2000; Rose and Gerba, 1991).
Survival of Pathogenic Organisms
Of great concern in the management of disease-causing organisms is the survival of these
organisms in the environment. Typical data on the survival of microorganisms in the environment
are presented in Table 2-17. Table 2-17: Typical pathogen survival times at 20-30°C in various environments. Note: in seawater, viral survival is less, and bacterial survival is very much less than in fresh water. Pathogen Survival time, days Fresh water and wastewater Crops Soil Bacteria: Faecal Coliform Salmonella spp Shigella Vibriocholera
<60 but usually <30 <60 but usually <30 <30 but usually <10 <30but usually < 10
<30 but usually <15 <30 but usually<15 <10 but usually<5 <5 but usually<2
<120 but usually<50 <120 but usually<50 <120 but usually<50 <120 but usually<50
Protozoa: Entameoba hitolytica cysts
<30 but usually <15
<10 but usually<2
<20 but usually<10
Helminths: A. lumbricoides eggs
Many monts
<60 but usually <30
Many months
Viruses: Enteroviruses
<120 but usually<50
<60 but usually<15
<100 but usually<20
2.3.4.2 Use of Indicator Organisms
Because the numbers of pathogenic organisms present in wastes and polluted waters are usually
few and difficult to isolate and identify, microorganisms, which are more numerous and more
easily tested for, are commonly used as surrogate (i.e., an indicator) organisms for the target
pathogen(s). The general features of an ideal indicator organism and the use of bacterial and other
indicators are considered briefly in the following discussion.
Characteristics of an ideal indicator organism
An ideal organism should have the following characteristics (adapted from Cooper, 2001; Maier
et al., 2000)
1. The indicator organism must be present when fecal contamination is present.

67
2. The numbers of indicator organisms present should be equal to or greater than those of the
target pathogenic organism (e.g., pathogenic viruses).
3. The indicator organism must exhibit the same or greater survival characteristics in the
environment as the target pathogen organism for which it is a surrogate.
4. The indicator organism must not reproduce outside of the host organism (i.e., the culturing
procedure itself should not produce a serious health threat to laboratory workers).
5. The isolation and quantification of the indicator organism must be faster than that of the target
pathogen (i.e, the procedure must be cheaper and easier for cultivating the indicator organisms
than for the target pathogen.)
6. The organism should be a member of the intestinal microflora of warm blooded animals.
Some authors have stated the first characteristic as "The indicator organism must be present when
the target pathogen is present." Unfortunately, the target pathogen(s) may not be present during
the entire year, because the shedding of pathogenic organisms is not uniform throughout the year.
Thus, it is important that the indicator organism be present when fecal contamination is present, if
public health is to be protected. To date, no ideal indicator organism has been found.
Bacterial Indicators
The intestinal tract of humans contains a large population of rod-shaped bacteria known
collectively as coliform bacteria. Each person discharges from 100 to 400 billion coliform
bacteria per day, in addition to other kinds of bacteria. Thus, the presence of coliform bacteria in
environmental samples has, over the years, been taken as an indication that pathogenic organisms
associated with feces (e.g., viruses) may also be present. The absence of coliform bacteria is
taken as an indication that the water is free from disease-producing organisms. Microorganisms
that have been proposed for use as indicators of fecal contamination are summarized in Table
2-18.
Table 2-18: Specific organisms that have been used or proposed for use as indicators of fecal contamination. Indicator organisms
Characteristics
Total coliform bacteria
Species of gram-negative rods that may ferment lactose with gas production (or produce a distinctive colony within 24±2 h to 48±3 h incubation on a suitable medium) at 35±0.5oC. There are strains that

68
do not conform to the definition. The total coliform group includes four genera in the Enterobacteriaceae family. These are Escherichia, Cilrobacter, Enterobacter, and Klebsiella. of the group, the Escherichia genus (E. coli species) appears to be most representative of faecal contamination.
Faecal coliform bacteria
A fecal coliform bacteria group was established based on the ability to produce gas (or colonies) at an elevated incubation temperature (44.5±0.2oC for 24±2 h).
Klebsiella
The total coliform population includes the genera Klebsiella. The thermotolerant Klebsiella are also included in the faecal coliform group. This group is cultured at 35±0.5 oC for 24±2 h.
E. coli
The E. coli is one of the coliform bacteria population and is more representative of faecal sources than other coliform genera.
Bacteroides
Bacteroides, an anaerobic organism, has been proposed as a human specific indicator.
Fecal streptococci
This group had been used in conjunction with fecal coliforms to determine the source of recent faecal contamination (from man or animals). Several strains appear to be ubiquitous and cannot be distinguished from the true faeceal streptococci under usual analytical procedures, which detract from their use as an indicator organism.
Enterococci
Two strains of faecal streptococci, S. faecal is and S. faecium, are the most human-specific members of the faecal streptococcus group. By eliminating the other strains through the analytical procedures, the two strains known as enterococci can be isolated and enumerated, The enterococci are generally found in lower numbers than other indicator organisms; however, they exhibit better survival in seawater.
Clostridium perfringens
This organism is a spore-forming anaerobic persistent bacteria, and the characteristics make it a desirable indicator where disinfection is employed, where pollution may have occurred in the past, or ,where the interval before analysis is protracted.
P. aeruginosa and A. hydrophila
These organisms may be present in domestic wastewater in large numbers. Both can be considered aquatic organisms and can be recovered in water in the absence of immediate sources of fecal pollution
2.3.4.3 Enumeration and identification of bacteria
Membrane-Filter Technique
In the membrane-filter (MF) technique (see Figure 2-21) a known volume of water sample is
passed through a membrane filter that has a small pore size (typically 0.45 μm). Bacteria are

69
retained on the filter because they are larger than the size of the pores of the membrane filter. The
membrane filter containing the bacteria is then placed, filtered side up, in contact with an agar
that contains the nutrients necessary for the growth of the specific target bacteria. After
incubation, the colonies formed on the surface of the filter can be counted and the concentration
in the original water sample determined. The membrane filter technique has the advantage of
being faster than the MPN (most probable number) procedure, which is a dilution chain technique
and of giving a direct count of the number of organisms (e.g., coliform organisms). In the
environmental field, the MF method is used for coliform and fecal streptococcus enumeration as
opposed to direct and pour and spread plate methods. All of these methods are subject to
limitations in interpretation (Standard Methods, 1998)
Figure 2-21: Membrane filter
Membrane filter apparatus used to test or bacteria in relatively clean waters. After centering the
membrane filter on the filter support, the funnel top is attached and the water sample to be tested
is poured into the funnel. To aid in the filtration process, a vacuum line is attached to the base of
the filter apparatus. After the sample has been filtered, the membrane filter is placed in a petri
dish containing a culture medium for bacterial analysis.
Toxicity Tests

70
Toxicity tests are used to:
1. Assess the suitability of environmental conditions for aquatic life;
2. Establish acceptable receiving water concentrations for conventional parameters (such as DO,
pH, temperature, salinity, or turbidity);
3. Study the effects of water quality parameters on wastewater toxicity;
4. Assess the toxicity of wastewater to one or more freshwater, estuarine, or marine test
organisms;
5. Establish relative sensitivity of a group of standard aquatic organisms to effluent as well as
standard toxicants;
6. Assess the degree of wastewater treatment needed to meet water pollution control requirements;
7. Determine the effectiveness of wastewater-treatment methods;
8. Establish permissible effluent discharge rates.
Such tests provide results that are useful in protecting human health, aquatic biota, and the
environment from impacts caused by the release of constituents found in wastewater into surface
waters. Toxicity identification, in which the constituents or compounds responsible for the
observed toxicity are delineated, is another important aspect of toxicity assessment.
During the past several decades, pollution control measures were focused primarily on
conventional pollutants (such as oxygen-demanding materials, suspended solids, etc.) which were
identified as causing water quality degradation. In the past 10 years, increased attention has been
focused on the control of toxic substances, especially those contained in wastewater treatment
plant discharges. The early requirements for monitoring and regulating toxic discharges were on
a "chemical-specific" basis. The chemical specific approach has many shortcomings, including
the inability to identify synergistic effects or the bioavailability of the toxin. The more
contemporary whole-effluent, or toxicity-based, approach to toxicity control involving the use of
toxicity tests to measure the toxicity of treated wastewater discharges. The whole-effluent test
procedure is used to determine the aggregate toxicity of unaltered effluent discharged into
receiving waters; toxicity is the only parameter measured.
Because it is not economically feasible to determine the specific toxicity of each of the thousands
of potentially toxic substances in complex effluents, whole-effluent toxicity testing using aquatic
organisms is a direct, cost-effective means of determining effluent toxicity. Whole-effluent

71
toxicity testing involves the introduction of appropriate bioassay organisms into test aquariums
(see Figure 2-22) containing various concentrations of the effluent in question and observing their
responses.
Figure 2-22: Typical setup used to conduct whole-effluent toxicity tests using fish where mortality is the test end point.
2.4 Classification of wastewater strength A commonly used international classification of wastewater strength is shown in Table 2-19. Table 2-19: Classification of wastewater strength.
Concentration Contaminants Unit Weak Medium Strong Solid, total (TS) mg/L 350 720 1200 Dissolved, total (TDS) mg/L 250 500 850 Fixed mg/L 145 300 525 Volatile mg/L 105 200 325 Suspended solids (SS) mg/L 100 220 350 Fixed mg/L 20 55 75 Volatile mg/L 80 165 375 Settleable solids mg/L 5 10 20 BOD5, 20°C mg/L 110 220 400 TOC mg/L 80 60 290 COD mg/L 250 500 1000 Nitrogen, total mg/L 20 40 85 Organic mg/L 8 15 35 Free ammonia mg/L 12 25 50 Nitrites mg/L 0 0 0 Nitrates mg/L 0 0 0 Phosphorus, total mg/L 4 8 15 Organic mg/L 1 3 5 Inorganic mg/L 3 5 10

72
Chlorides mg/L 30 50 100 Sulfate mg/L 20 30 50 Alkalinity (as CaCO3) mg/L 50 100 200 Grease mg/L 50 100 150 Total coliform #/100 mL 106-107 107-108 108-109
VOC µg/L <100 100-400 >400
2.5 References and further readings
Metcalf & Eddy; 2003, Wastewater Engineering-Treatment and Reuse, McGraw-Hill, International Edition Sperling M. von, Lemos Chernicharo C.A. de; 2005, Biological Wastewater Treatment in Warm Climate Regions, IWA Publishing (2005) Madigan M.T. et al., 2003, Brock-Biology of Microorganisms, Pearson Education (2003) Buuren J. van, Lier J. van; 2007, Urban Environmental Infrastructure in Transition, Reader ETE-31306, Wageningen University www.fao.org www.who.org www.papfam.org http://openlearn.open.ac.uk/rss/file.php/stdfeed/2457/formats/T210_1_rss.xml
3 Wastewater treatment
3.1 Overview of wastewater treatment systems
3.1.1 Wastewater treatment Levels
In planning and design of wastewater treatment, the following points must be clearly addressed:
- Environmental impact studies on the receiving body;
- Treatment objectives;
- Treatment level and removal efficiencies.
The environmental impact studies that are necessary for the evaluation of the compliance with the
receiving body standard are discussed in the lecture “Environmental Impact Assessment” of the
MSc program in detail. The requirements to be reached for the effluent are influenced by

73
legislation, guidelines and the intended following use. The removal of pollutants during treatment
in order to reach a desired quality or required discharge standard is associated with the concepts
of treatment level and treatment efficiency.
Wastewater treatment is usually classified according to the following levels:
- Preliminary
- Primary
- Secondary
- Tertiary / Advanced
In a full range treatment these levels are performed successively. Usual a combination of not all
elements form this list is used. The Tertiary or Advanced level is performed rarely outside of
Europe and USA; this is the reason why this sophisticated and costly step is only discussed very
briefly in this reader. In Table 3-1 the main characteristics of the treatment levels are shown. The
displayed properties are rough figures and only valid for average wastewater and for correct
dimensioned and managed treatment systems. The reduction of coliforms in the primary
treatment step can be explained by attachment of coliforms to suspended solids (SS) which are
removed.
The removal efficiency (E) [%] is calculated with the influent concentration of the pollutant (C0)
[mg/L] and the effluent concentration of the pollutant (Ce) [mg/L] by the following formula:
1000
0 ⋅= −C
CC eE
Table 3-1: Overview of characteristics of wastewater treatment levels. Level Predominant
treatment
mechanism
Target Pollutants Removal Efficiency
Preliminary physical - coarse suspended solids (large
material and sand)
Primary physical - Settleable suspended solids
- Particulate (suspended) BOD
SS: 60-70%
BOD: 25-40%
Coliforms: 30-40%
Secondary biological - Non-Settleable solids SS: 65-95%
1 Depending on the treatment process, nutrients and pathogens may be removed in the secondary stage.

74
- Particulate (suspended) BOD
- Soluble BOD
- Nutrients1
- Pathogens1
BOD: 60-99%
Coliforms: 60-99%1
Tertiary /
Advanced
chemical
physical
- Nutrients
- Pathogenic organisms
- Non/biodegradable compounds
- Metals
- Inorganic dissolved solids
- Remaining suspended solids
Very high Removal
efficiency depending
on the specific
treatment objectives
and design.
The treatment methods are composed by unit operations and processes. The following definitions
can be used to describe treatment mechanisms as in Table 3-1:
- Physical unit operation: treatment methods in which physical forces are predominant (e.g.
screening, mixing, flocculation, sedimentation, flotation, filtration, diffusion, UV-
radiation).
- Chemical unit processes: treatment methods in which the removal or the conversion of the
contaminates occurs by the addition of chemical products or due to chemical reactions
(e.g. precipitation, adsorption, disinfection).
- Biological unit processes: treatment methods in which the removal of the contaminants
occurs by means of biological activity (e.g. carbonaceous organic matter removal,
nitrification, denitrification).
Underlying processes that are used for wastewater treatment will be discussed more into depth in
Chapter 3.4.
3.1.2 Reactors used for the treatment of wastewater
Wastewater treatment involving physical unit operations and chemical and biological unit
processes are carried out in vessels or tanks commonly known as "reactors". The types of reactors
that are available and their applications are introduced in this section.

75
3.1.2.1 Types of Reactors
The principal types of reactors used for the treatment of wastewater, illustrated in Figure 3-1, are
(1) the batch reactor, (2) the complete-mix reactor [also known as the continuous-flow stirred-
tank reactor (CFSTR)], (3) the plug-flow reactor (also known as a tubular-flow reactor), (4)
complete-mix reactors in series, (5) the packed-bed reactor, and (6) the fluidized-bed reactor.
Brief descriptions of these reactors are presented below.
1. Batch Reactor. In the batch reactor (see Figure 3-1a), flow is neither entering nor
leaving the reactor (i.e., flow enters, is treated, and then is discharged, and the cyc1e repeats).
The liquid contents of the reactor are mixed completely. For example, the BOD test is carried out
in a batch reactor. Batch reactors are often used to blend chemicals or to dilute concentrated
chemicals.
2. Complete-Mix Reactor. In the complete-mix reactor (see Figure 3-1b), it is assumed
that complete mixing occurs instantaneously and uniformly throughout the reactor as fluid
particles enter the reactor. Fluid particles leave the reactor in proportion to their statistical
population. Complete mixing can be accomplished in round or square reactors if the contents of
the reactor are uniformly and continuously redistributed. The actual time required to achieve
completely mixed conditions will depend on the reactor geometry, the wastewater characteristics
and the power input.
3. Plug-Flow Reactor. Fluid particles pass through the reactor with little or no longitudinal
mixing and exit from the reactor in the same sequence in which they entered. The particles retain
their identity and remain in the reactor for a time equal to the theoretical detention time. This type
of flow is approximated in long open tanks with a high length-to-width ratio in which
longitudinal dispersion is minimal or absent (see Figure 3-1c) or closed tubular reactors (e.g.,
pipelines, see Figure 3-1d).
4. Complete-Mix Reactors in Series. The series of complete-mix reactors (see Figure
3-1e) is used to model the flow regime that exists between the ideal hydraulic flow patterns
corresponding to the complete-mix and plug-flow reactors. If the series is composed of one
reactor, the complete-mix regime prevails. If the series consists of an infinite number of reactors
in series, the plug-flow regime prevails.

76
Figure 3-1: Different types of reactors
5. Packed-Bed Reactors. The packed-bed reactor is filled with some type of packing
material, such as rock, slag, ceramic, or, now more commonly, plastic. With respect to flow, the
packed-bed reactor can be operated in either the downflow or upflow mode. Dosing can be
continuous or intermittent (e.g., trickling filter). A packed-bed upflow anaerobic (without
oxygen) reactor is shown in Figure 3-1g.
6. Fluidized-Bed Reactor. The fluidized-bed reactor is similar to the packed-bed reactor in
many respects, but the packing material is expanded by the upward movement of fluid (air or
water) through the bed (see Figure 3-1h). The expanded porosity of the fluidized-bed packing
material can be varied by controlling the flowrate of the fluid.

77
3.1.2.2 Application of Reactors
The principal applications of reactor types used for wastewater treatment are reported in Table
3-2. Operational factors that must be considered in the selection of the type of reactor or reactors
to be used in the treatment process include (1) the nature of the wastewater to be treated, (2) the
nature of the reaction (i.e., homogeneous or heterogeneous), (3) the reaction kinetics governing
the treatment process, (4) the process performance requirements, and (5) local environmental
conditions.
Table 3-2: Principal applications of reactor types used for wastewater treatment Type of reactor applications in wastewater treatment Batch Activated-sludge biological treatment in a sequence batch.
reactor, mixing of concentrated solutions into working solutions
Complete-mix
Aerated lagoons, aerobic sludge digestion
Complete-mix with recycle Plug-flow
Activated-sludge biological treatment
Plug-flow Chlorine contact basin, natural treatment systems Plug-flow with recycle
Activated-sludge biological treatment, aquatic treatment systems
Complete-mix reactors in series
Lagoon treatment systems, used to simulate non ideal Row in plug-Row reactors
Packed-bed
Nonsubmerged and submerged trickling-filter biological treatment units, depth filtration, natural treatment systems, air stripping
Fluidized-bed Fluidized-bed reactors for aerobic and anaerobic biological treatment, upfow sludge blanket reactors, air stripping
In Practice, the construction costs and operation and maintenance costs also affect reactor
selection. Because the relative importance of these factors varies with each application, each
factor should be considered separately when the type of reactor is to be selected.
3.1.3 Process combination possibilities
In the flowchart in Figure 3-2 possible combination of unit operations and processes are
displayed. In the following chapter we will go step by step through the treatment levels and
discuss the main technology options. In the design process, the choice of the appropriate

78
combination of techniques for each treatment level can only be done based on wastewater inflow
quality, the treatment objectives in order to meet a certain effluent quality and other factors as
discussed in chapter 3.2. Sludge processing and Disinfection will be discussed in the end of the
chapter. Before going into the different treatment options, the following chapters will give a
deeper insight in the general underlying processes and used parameters.

79
Figure 3-2: flowchart of processes!

80
3.1.4 On-site vs. Off-site treatment
Fadhl please add here chapter 2.1.1 form the old reader!
In this reader it is not possible to explain on-site treatment options in detail. It is important to
recognize that on-site treatment techniques often combine several treatment steps in one simple,
compact reactor. The underlying operations and processes though are the same as for centralized
municipal wastewater treatment, as discussed in this reader.
Further literature on this topic is as follows:
- Selection of sustainable sanitation arrangements
Mara, D.; Drangert, J.; Anh, N. V.; Tonderski, A.; Gulyas, H.; Tonderski, K
Water Policy 9 (2007) 305-318, IWA Publishing
- A Directory of Environmentally Sound Technologies for the Integrated Management of
Solid, Liquid and Hazardous Waste for Small Island Developing States (SIDS) in Pacific
Region
United Nations Environment Program (UNEP): 2002
- A Directory of Environmentally Sound Technologies for the Integrated Management of
Solid, Liquid and Hazardous Waste for Small Island Developing States (SIDS) in Caribbean
Region
United Nations Environment Program (UNEP): 2004
- A Guide to the Development of On-site Sanitation
R. Franceys, J. Pickford & R. Reed
Water, Engineering and Development Centre; Loughborough University of Technology, UK.
WHO, Geneva, 1992
- The following website:
http://www.unep.or.jp/ietc/Publications/TechPublications/TechPub-15/main_index.asp
3.2 Process selection
The most important factors that must be evaluated in process analysis and selection are identified
in Table 3-3. Each factor is important in its own right, but some factors require additional
attention and explanation. A more into depth discussion of the process selection including a
sustainability assessment will be done in the course “water chain management”.

81
The first factor, "process applicability" stands out above all others and reflects directly upon the
skill and experience of the design engineer. Many resources are available to the designer to
determine applicability, including past experience in similar type of projects. Available resources
include performance data from operating installations, published information in technical journals
manuals of practice published by the Water Environment Federation, process design manuals,
and the results of pilot-plant studies. Where the applicability of a process to a given situations
unknown or uncertain, pilot plant studies must be conducted to determine performance
capabilities and to obtain design data upon which a full –scale design can be based.
Table 3-3: Important factors that must be considered when evaluating and selecting unit operations and processes Factor Comments
1.Process
applicability
The applicability of a process is evaluated on the basis of past experience, data from full-scale plants, published data, and from pilot-plant studies. If new or unusual conditions are encountered, pilot-plant studies are essential
2.Applicable
flow range
The process should be matched to the expected range of flowrates. For example, stabilization ponds are not suitable for extremely large flowrates in highly populated areas
3.Applicable
flow variation
Most unit operations and processes have to be designed to operate over a wide range of flowrates. Most processes work best at a relatively constant flowrate. If the flow variation is too great, flow equalization may be necessary
4.Influent
wastewater
characteristics
The characteristics of the influent wastewater affect the types of processes to be used (e.g., chemical or biological) and the requirements for their proper operation
5.inhibition and
unaffected
constituents
What constituents are present and may be inhibitory to the treatment processes? What constituents are not affected during treatment?
6.Climate
constraints
Temperature affects the rate of reaction of most chemical and biological processes. Temperature may also affect the physical operation of the facilities. Warm temperatures may accelerate odor generation and also limit atmospheric dispersion
7.process sizing
based on reaction
kinetics or
process loading
criteria
Reactor sizing is based on the governing reaction kinetics and kinetic coefficients. If kinetic expressions are not available, process loading criteria are used. Data for kinetic expressions and process loading criteria usually are derived from experience, published literature, and the results of pilot-plant studies

82
8.process sizing
based on mass
transfer for rates
or process
loading criteria
Reactor sizing is based on mass transfer coefficients. If mass transfer rates are not available, process loading criteria are used. Data for mass transfer coefficients and process loading criteria usually are derived from experience, published literature, and the results of pilot-plant studies
9. performance Performance is usually measured in terms of effluent quality and its variability, which must be consistent with the effluent discharge requirements
10.treatment
residuals
The types and amounts of solid, liquid, and gaseous residuals produced must be known or estimated. Often, pilot-plant studies are used to identify and quantify residuals
11.sludge
processing
Are there any constraints that would make sludge processing and disposal infeasible or expensive? How might recycle loads from sludge processing affect the liquid unit operations or processes? The selection of the sludge processing system should go
12.Environmental
constraints
Environmental factors, such as prevailing winds and wind directions and proximity to residential areas, may restrict or affect the use of certain processes, especially where odors may be produced. Noise and traffic may affect selection of a plant site. Receiving waters may have special limitations, requiring the removal of specific constituents such as nutrients
13.chemical
requirements
What resources and what amounts must be committed for a long period of time for the successful operation of the unit operation or process? What effects might the addition of chemicals have on the characteristics of the treatment residuals and the cost of treatment?
14.Energy
requirements
The energy requirements, as well as probable future energy cost, must be known if cost-effective treatment systems are to be designed
15.Other
resources
requirements
What, if any, additional resources must be committed to the successful implementation of the proposed treatment system using the unit operation or process being considered?
16.personnel
requirements
How many people and what levels of skills are needed to operate the unit operation or process? Are these skills readily available? How much training will be required?
17.operating and
maintenance
requirements
What special operating or maintenance requirements will need to be provided? What spare parts will be required and what will be their availability and cost?
18.ancillary
processes
What support processes are required? How do they affect the effluent quality, especially when they become inoperative?
19. reliability What is the long-term reliability of the unit operation or process being considered? Is the operation or process easily upset? Can it stand periodic shock loadings? If so, how do such occurrences affect the quality of the effluent?
20. complexity How complex is the process to operate under routine or emergency conditions? What levels of training must the operators have to operate the process?
21. compatibility Can the unit operation or process be used successfully with existing facilities? Can plant expansion be accomplished easily?

83
22. adaptability Can the process be modified to meet future treatment requirements?
23.economic life-
cycle analysis
Cost evaluation must consider initial capital cost and long-term operating and maintenance costs. The plant with lowest initial capital cost may not be the most effective with respect to operating and maintenance costs. The nature of the available funding will also affect the choice of process
24.land
availability
Is there sufficient space to accommodate not only the facilities currently being considered but possible future expansion? How much of a buffer zone is available to provide landscaping to minimize visual and other impacts?
3.3 Parameter
In the following chapters commonly used parameters to characterize mainly the activated sludge
process are introduced.
3.3.1 Solids retention time
The Solids Retention Time (SRT) represents the average period of time during which the sludge
has remained in the treatment system. SRT is the most critical parameter for activated-sludge
design as SRT affects the treatment process performance, aeration tank volume, sludge
production, and oxygen requirements. For BOD removal, SRT values may range from 3 to 5 d,
depending on the mixed-liquor temperature. At 18 to 25°C an SRT value close to 3 d is desired
where only BOD removal is required and to discourage nitrification and eliminate the associated
oxygen demand. To limit nitrification, some activated-sludge plants have been operated at SRT
values of 1 d or less. At 10°C, SRT values of 5 to 6 d are common for BOD removal only.
Temperature and other factors that affect SRT in various treatment applications are summarized
in Table 3-4.
Table 3-4: Typical minimum SRT ranges for activated sludge treatment Treatment goal SRT range (day) Factors affecting SRT Removal of soluble BOD in domestic wastewater 1-2 Temperature Conversion of particulate organics in domestic wastewater
2-4 Temperature
Develop flocculent biomass for treating domestic wastewater
1-3 Temperature
Develop flocculent biomass for treating industrial wastewater
3-5 Temperature/ Compounds
Provide complete nitrification 3-18 Temperature/ Compounds
Biological phosphorus removal 2-4 Temperature Stabilization of activated sludge 20-40 Temperature Degradation of xenobiotic compounds 5-50 Temperature/ Specific
bacteria! compounds

84
Because nitrification is temperature-dependent, the design SRT for nitrification must be selected
with caution as variable nitrification growth rates have been observed at different sites,
presumably due to the presence of inhibitory substances (Barker and Dold, 1997; Fillos et al.,
2000).
3.3.2 Food to microorganism ratio
A process parameter commonly used to characterize process designs and operating conditions is
the food to microorganism (biomass) ratio (F/M). Typical values for the BOD F/M ratio reported
in the literature vary from 0.04 g substrate to 1 g biomass per day for extended aeration processes
to 1.0 g/g*d for high rate processes. The BOD F/M ratio is usually evaluated for systems that
were designed based on SRT to provide a reference point to previous activated-sludge design and
operating performance.
3.3.3 Volumetric organic loading rate
The volumetric organic loading rate is defined as the amount of BOD or COD applied to the
aeration tank volume per day. Organic loadings, expressed in kg BOD or COD/m3*d, may vary
from 0.3 to more than 3.0. While the mixed-liquor concentration, the F/M ratio, and the SRT
(which may be considered an operating variable as well as a design parameter) are ignored when
such empirical relationships are used, these relationships do have the merit of requiring a
minimum aeration tank volume that has proved to be adequate for the treatment of domestic
wastewater. These empirical parameters are not adequate for predicting effluent quality, however,
when such relationships are used to design facilities for the treatment of wastewater containing
industrial wastes or for biological nitrogen- and phosphorus-removal processes. Higher
volumetric organic loadings generally result in higher required oxygen transfer rates per unit
volume for the aeration system.
3.3.4 Sludge production
The design of the sludge-handling and disposal/reuse facility depends on the prediction of sludge
production for the activated-sludge process. If the sludge-handling facilities are undersized, then
the treatment process performance may be compromised. Sludge will accumulate in the
activated-sludge process if it cannot be processed fast enough by an undersized sludge-handling

85
facility. Eventually, the sludge inventory capacity of the activated-sludge system will be
exceeded and excess solids will exit in the secondary clarifier effluent, potentially violating
discharge limits. The sludge production relative to the amount of BOD removed also affects the
aeration tank size.
Observed volatile suspended solids yield values, based on BOD, are illustrated in Figure 3-3. The
observed yield decreases as the SRT is increased due to biomass loss by more endogenous
respiration. The yield is lower with increasing temperature as a result of a higher endogenous
respiration rate at higher temperature. The yield is higher when no primary treatment is used, as
more non biodegradable VSS remains in the influent wastewater.
3.3.5 Mixed liquor settling characteristics
Two commonly used measures developed to quantify the settling characteristics of activated
sludge are the sludge volume index (SVI) and zone settling (WEF, 1998). The SVI is the volume
of 1 g of sludge after 30 min of settling. The SVI is determined by placing a mixed-liquor sample
in a 1- to 2-L cylinder and measuring the settled volume after 30 min and the corresponding
sample MLSS concentration. The numerical value is computed using the following expression: SVI= (settled volume of sludge, mL/L) (103 mg/ g)/ suspended solids, mg/L)= mL/g
For example, a mixed-liquor sample with a 3000 mg/L TSS concentration that settles to a volume
of 300 mL in 30 min in a l-L cylinder would have an SVI of 100 mL/g.
Figure 3-3: Net solids production vs. solids retention time [SRT] and temperature with primary sedimentation tank (left) and without primary treatment (right).

86
A value of 100 mL/g is considered a good settling sludge (SVI values below 100 are desired).
SVI values above 150 are typically associated with filamentous growth. Because the SVI test is
empirical, it is subject to significant errors. For example, if sludge with a concentration of 10,000
mg/L did not settle at all after 30 min, the SVI value would be 100. To avoid erroneous results
and to allow for a meaningful comparison of SVI results for different sludges, the diluted SVI
(DSVI) test can be used. Thereby, the sludge sample is diluted with process effluent until the
settled volume after 30 min is 250 mL/L or less. The standard SVI test is then followed with this
sample.
Many SVI tests at wastewater treatment plants are done in a 2-L settleometer that has a larger
diameter than 1- or 2-L graduated cylinders (see Figure 3-4). To eliminate well effects on solids
settling in a small-diameter test apparatus, use of a slow-speed stirring device is encouraged. The
test is called a stirred SVI when a stirring device is used (see Standard Methods, WEF, 1998).
The stirred SVI test is used frequently in Europe.
Figure 3-4: Field test for determining sludge volume index (SVI).

87
3.3.6 Microscopic observations
Routine microscopic observations provide valuable monitoring information about the condition
of the microbial population in the activated sludge process. Specific information gathered
includes changes in floc size and density, the status of filamentous organism growth in the floc,
the presence of Nocardia bacteria, and the type and abundance of higher life-forms such as
protozoans and rotifers. Changes in these characteristics can provide an indication of changes in
the wastewater characteristics or of an operational problem. Examples of the changes in
predominance of microorganisms versus F/M ratio and SRT are shown in Figure 3-17. A
decrease in the protozoan population may be indicative of DO limitations, operation at a lower
SRT, or inhibitory substances in the wastewater. Early detection of filamentous or Nocardia
growth will allow time for corrective action to be taken to minimize potential problems
associated with excessive growth of these organisms. Procedures may be followed to identify the
specific type of filamentous organism, which may help identify an operating or design condition
that encourages their growth (Jenkins et al., 1993).
3.4 Basic Processes
As mentioned before, the basic processes underlying wastewater treatment technologies are
physical unit operations, chemical unit processes and biological unit processes. In the following
chapters these processes will be discussed in detail.
3.4.1 Physical unit operations
3.4.1.1 Sedimentation
Sedimentation is used for the removal of grit in the preliminary treatment, TSS in primary
settling basins, biological floc removal in the activated-sludge settling basin, and chemical floc
removal when the chemical coagulation process is used. Sedimentation is also used for solids
concentration in sludge thickeners. In most cases, the primary purpose is to produce a clarified
effluent, but it is also necessary to produce sludge with a solids concentration that can be handled
and treated easily. Gravitational phenomena utilized in wastewater treatment are summarized in
Table 3-5.

88
Table 3-5: Types of gravitational phenomena utilized in wastewater treatment. Type of. separation phenomenon
Description
Application/ occurrence
Discrete particle settling
Refers to the settling of particles in a suspension of low solids concentration by gravity in a constant acceleration field. Particles settle as individual entities, and there is no significant interaction with neighboring particles.
Removal of grit and sand particles from wastewater.
Flocculent settling
Refers to a rather dilute suspension of particles that coalesce, or flocculate, during the settling operation. By coalescing, the particles increase in mass and settle at a faster rate.
Removal of a portion of the TSS in untreated wastewater in primary settling facilities, and in upper portions of secondary settling facilities. Also removes chemical floc in settling tanks.
Ballasted Aocculent settling
Refers to the addition of an inert ballasting agent and a polymer to a partially Aocculated suspension to promote rapid settling and improved solids reduction. A portion of the recovered ballasting agent is recycled to the process.
Removal of a portion of the TSS in untreated wastewater, wastewater from combined systems, and industrial wastewater. Also reduces BOD and phosphorus.
Hindered settling (also called zone settling)
Refers to suspensions of intermediate concentration, in which interparticle forces are sufficient to hinder the settling of neigh boring particles. The particles tend to remain in fixed positions with respect to each other, and the mass of particles settles as a unit. A solids-liquid interface develops at the top of the settling mass.
Occurs in secondary settling facilities used in conjunction with biological treatment facilities.
Compression settling
Refers to settling in which the particles are of such concentration that a structure is formed, and further settling can occur only by compression of the structure. Compression takes
Usually occurs in the lower layers of a deep solids or biosolids mass, such as in the bottom of deep secondary settling facilities and in solids-

89
place from the weight of the particles, which are constantly being added to the structure by sedimentation from the supernatant liquid.
thickening facilities.
Accelerated gravity settling Flotation
Removal of particles in suspension by gravity settling in an acceleration field. Removal of particles in suspension that are lighter than water by air or gas flotation.
Removal of grit and sand particles from wastewater Removal of greases and oils, light material that floats, thickening of solids suspensions.
3.4.1.2 Coagulation and flocculation
Coagulation is always considered along with flocculation and is used to remove particles which
cannot be removed by sedimentation or filtration alone. These particles are usually less than 1 μm
in size and are termed colloids. They have poor settling characteristics and are partly responsible
for the color and turbidity of water. The important property which they all have is that they carry
a negative charge and this, along with the interaction between the colloidal particles and the
water, prevents them from aggregating and settling in water with low velocities. The particles can
be aggregated by adding either multivalent ions or colloids having an opposite (positive) charge.
These are added as chemical coagulants.
Chemicals commonly used as coagulants in water treatment are aluminium and ferric salts which
are present as the ions Al3+ and Fe3+. These positively charged multivalent ions neutralise the
naturally occurring negatively charged particles, thus allowing the particles to aggregate. At high
concentrations of aluminium or ferric salts, and in the presence of sufficient alkalinity, insoluble
hydroxides of aluminium or iron are formed. In the precipitation reaction the colloidal particles
are enmeshed within the precipitate and thus removed. The use of aluminium salts is not popular
because of the (unproven) scare about Alzheimer's disease. Most plants nowadays use ferric salts.
If there is inadequate alkalinity in the water, it can be added in the form of lime (calcium
hydroxide Ca(OH)2) or soda ash (sodium carbonate Na2CO3).
In some waters, even with the optimum dose of coagulant, coagulation is poor and so it is
necessary to add extra substances known as coagulant aids. These aids can be clay, silica or
polyelectrolytes. Polyelectrolytes are long-chain organic molecules with chemical groups
attached along the length of the chain, which becomes charged when the molecule is dissolved in

90
water. The negative colloidal particles are attracted to positively charged chemical groups on the
polyelectrolyte.
When coagulants are added, the water is mixed rapidly in a mixing chamber using a high-speed
turbine. Once coagulation has taken place, a very fine precipitate or floc will form. To aid this
floc to coalesce with neighbouring particles and grow into larger flocs with more settleable
masses, the water is gently stirred. The process of coalescence is known as flocculation. The
gentle stirring can be achieved using paddles or baffles to induce a rolling motion in the water,
and this continues for some 20–45 minutes. After this treatment, the water is passed for
sedimentation.
3.4.1.3 Flotation
An alternative technique to that of sedimentation is flotation. This uses gas bubbles to increase
the buoyancy of suspended solids. The gas bubbles attach to the particles and make their effective
density lower than that of the water. This causes the particles to rise through the water to float to
the top. Flotation may be achieved by several methods but the most effective form is dissolved air
flotation. In this process air is dissolved in water at elevated pressures and then released as tiny
bubbles (30–120 μm) by reducing the pressure to atmospheric level.
The principal advantages of flotation over sedimentation are that very small or light particles that
settle slowly can be removed more completely and in a shorter time. Once the particles have
reached the surface, they can be collected by a skimmer. Flotation does, however, require careful
control to achieve high quality output.
3.4.1.4 Filtration
In filtration, the partially treated water is passed through a medium such as sand or anthracite,
which acts as a ‘strainer’, retaining the fine organic and inorganic material and allowing clean
water through. The action of filters is complex and in some types of filter biological action also
takes place. Sand filters are used in water treatment to remove the fine particles which cannot be
economically removed by sedimentation. They have been effective in removing Cryptosporidium,
a protozoan parasite.
Mechanical straining of the water is only a minor part of the filtration process, as the main
process by which particles are retained is adsorption. In adsorption, the particles adhere to the

91
filter material or previously adsorbed particles. If a particle passes close to a solid surface, there
may be either electrical attraction or repulsion, depending on the surface charges of both the
particle and the solid surface.
Filtration as the tertiary treatment step can be carried out using simple slow sand filters or, as it is
more usual for flocculated water, rapid gravity sand filters.
Rapid gravity sand filters are particularly effective for water treated with coagulants and less
expensive than slow sand filters. The flow is much greater than in slow sand filters, being 4–8
m³/m²*h; hence a smaller filter (requiring a smaller space) will be adequate. Particles that are
being filtered out are removed frequently at intervals of 24–48 hours by pumping water and air
(to assist in scouring) under pressure backwards through the filter to wash out the trapped
impurities. This process is called backwashing. (see Figure 3-5)
Figure 3-5: Rapid gravity sand filter (cross section)
3.4.2 Chemical unit processes
Those processes used for the treatment of wastewater in which change is brought about by means
of or through chemical reactions are known as chemical unit processes. In the field of wastewater
treatment, chemical unit processes usually are used in conjunction with the physical unit
operations and the biological unit processes, to meet specific treatment objectives.
The principal chemical unit processes used for wastewater treatment and their application are
displayed in Table 3-6.

92
Table 3-6: Applications of chemical unit processes in wastewater treatment: Process Application
Advanced oxidation processes Removal of refractory organic compounds
Chemical coagulation The chemical destabilization of particles in wastewater to bring about
their aggregation during flocculation
Chemical disinfection Disinfection with chlorine, chlorine compounds, bromine, and ozone
Control of slime growth in sewers
Control of odors
Chemical neutralization Control of pH
Chemical oxidation Removal of BOD, grease, etc.
Removal of ammonia (NH4+)
Destruction of microorganisms
Control of odors in sewers, pump stations, and treatment plants
Removal of resistant organic compounds
Chemical precipitation Enhancement removal of total suspended solids and BOD in primary
sedimentation facilities
Removal of phosphorus
Removal of heavy metals
Physical-chemical treatment
Corrosion control in sewers due to H2S
Chemical scale control Control of scaling due to calcium carbonate and related compounds
Chemical stabilization Stabilization of treated effluents
Ion exchange Removal of ammonia (NH4+), heavy metals, total dissolved solids
Removal of organic compounds
Chemical processes are complex and difficult to generalize. In this reader the detailed mechanism
underlying chemical processes will not be further discussed. For additional see the referred
technical literature.
3.4.3 Biological unit processes
The common terminology processes used for biological wastewater treatment is mentioned in
Table 3-7 and Table 3-8. Table 3-7: Definitions of common terminology used for biological wastewater treatment
Term Definition

93
Metabolic function Aerobic processes Anaerobic processes Anoxic processes
Facultative processes
Combined aerobic/ anoxic/anaerobic processes
Biological treatment processes that occur in the presence of oxygen Biological treatment processes that occur in the absence of oxygen The process by which nitrate nitrogen is converted biologically to nitrogen gas in
the absence of oxygen. This process is also known as Denitrification
Biological treatment processes in which the organisms can function in the presence or absence of molecular oxygen
Various combinations of aerobic, anoxic, and anaerobic processes grouped
together to achieve a specific treatment objective
Treatment processes Suspended-growth
processes Attached-growth
processes Combined processes Lagoon processes
Biological treatment processes in which the microorganisms responsible for the conversion of the organic matter or other constituents i the wastewater to gases and cell tissue are maintained in suspension within the liquid
Biological treatment processes in which the microorganisms responsible for the
conversion of the organic matter or other constituents in the wastewater to gases and cell tissue are attached to some inert medium, such as rocks, slag, or specially designed ceramic or plastic materials. Attached-growth treatment processes are also known as fixed-film processes
Term used to describe combined processes (e.g., combined suspended and
attached growth processes) A generic term applied to treatment processes that take place in ponds or lagoons
with various aspect ratios and depths Treatment functions Biological nutrient
removal Biological phosphorus
removal Carbonaceous BOD
removal Nitrification Denitrification Stabilization Substrate
The term applied to the removal of nitrogen and phosphorus in biological treatment processes
The term applied to the biological removal of phosphorus by accumulation in
biomass and subsequent solids separation Biological conversion of the carbonaceous organic matter in wastewater to cell
tissue and various gaseous end products. In the conversion, it is assumed that the nitrogen present in the various compounds is converted to ammonia
The two-step biological process by which ammonia is converted first to nitrite
and then to nitrate The biological process by which nitrate is reduced to nitrogen and other gaseous
end products The biological process by which the organic matter in the sludges produced from
the primary settling and biological treatment of wastewater is stabilized, usually by conversion to gases and cell tissue. Depending on whether this stabilization is carried out under aerobic or anaerobic conditions, the process is known as aerobic or anaerobic digestion
The term used to denote the organic matter or nutrients that are converted during
biological treatment or that may be limiting in biological treatment. For

94
example, the carbonaceous organic matter in wastewater is referred to as the substrate that is converted during biological treatment
Table 3-8: Major biological treatment processes used for wastewater treatment.
Type Common name Use Aerobic processes
Suspended growth Attached growth Hybrid (combined)
suspended and attached growth processes
Activated-sludge process(es) Aerated lagoons Aerobic digestion Trickling filters Rotating biological contactors Packed-bed reactors Trickling filter/activated sludge
Carbonaceous BOD removal, nitrification Carbonaceous BOD removal, nitrification Stabilization, carbonaceous BOD removal Carbonaceous BOD removal, nitrification Carbonaceous BOD removal, nitrification Carbonaceous BOD removal, nitrification Carbonaceous BOD removal, nitrification
Anoxic processes Suspended growth Attached growth
Suspended-growth denitrification
Attached-growth denitrification
Denitrification Denitrification
Anaerobic processes Suspended growth Attached growth Sludge blanket Hybrid
Anaerobic contact processes Anaerobic digestion Anaerobic packed and fluidized
bed Upflow anaerobic sludge blanket Upflow sludge blanket/attached
growth
Carbonaceous BOD removal Stabilization, solids destruction, pathogen
kill Carbonaceous BOD removal, waste
stabilization, denitrification Carbonaceous BOD removal, especially
high-strength wastes Carbonaceous BOD removal
Combined aerobic, anoxic, and anaerobic processes Suspended growth Hybrid
Single- or multistage processes, various proprietary processes Single- or multistage processes
with packing for attached growth
Carbonaceous BOD removal, nitrification, denitrification, and phosphorus removal
Carbonaceous BOD removal, nitrification, denitrification, and phosphorus removal
Lagoon processes Aerobic lagoons Maturation (tertiary) lagoons Facultative lagoons Anaerobic lagoons
Aerobic lagoons Maturation (tertiary) lagoons Facultative lagoons Anaerobic lagoons
Carbonaceous BOD removal Carbonaceous BOD removal,
nitrification Carbonaceous BOD removal Carbonaceous BOD removal, waste stabilization

95
3.5 Treatment levels
3.5.1 Preliminary treatment
3.5.1.1 Screening
The first unit operation generally encountered in wastewater treatment plants is screening. A
screen is a device with openings, generally of uniform size, that is used to retain solids found in
the influent wastewater to the treatment plant or in combined wastewater collection systems
subject to overflows, especially from stormwater. The principal role of screening is to remove
coarse materials from the flow stream that could (1) damage subsequent process equipment, (2)
reduce overall treatment process reliability and effectiveness, or (3) contaminate waterways. Fine
screens are sometimes used in place of or following coarse screens where greater removals of
solids are required to (1) protect process equipment or (2) eliminate materials that may inhibit the
beneficial reuse of biosolids.
All aspects of screenings removal, transport, and disposal must be considered in the application
of screening devices, including (1) the degree of screenings removal required because of potential
effects on downstream processes, (2) health and safety of the operators as screenings contain
pathogenic organisms and attract insects, (3) odor potential, and (4) requirements for handling,
transport, and disposal, i.e., removal of organics (by washing) and reduced water content (by
pressing), and (5) disposal options. Thus, an integrated approach is required to achieve effective
screenings management.
Classification of Screens
The types of screening devices commonly used in wastewater treatment are displayed in Figure
3-6 and characterized as follows. Two general types of screens, coarse screens and fine screens,
are used in preliminary treatment of wastewater. Coarse screens have clear openings ranging
from 6 to 150 mm; fine screens have clear openings less than 6 mm. Microscreens, which
generally have screen openings less than 50 μm, are used principally in removing fine solids from
treated effluents.

96
Figure 3-6: Definition sketch for types of screens used in wastewater treatment
The screening element may consist of parallel bars, rods or wires, grating, wire mesh, or
perforated plate, and the openings may be of any shape but generally are circular or rectangular
slots. A screen composed of parallel bars or rods is often called a "bar rack" or a coarse screen
and is used for the removal of coarse solids. Fine screens are devices consisting of perforated
plates, wedge wire elements, and wire cloth that have smaller openings. The materials removed
by these devices are known as screenings.
3.5.1.1.1 Coarse Screens (Bar Racks)
In wastewater treatment, coarse screens are used to protect pumps, valves, pipelines, and other
appurtenances from damage or clogging by rags and large objects.
Industrial waste-treatment plants may or may not need them, depending on the character of the
wastes. According to the method used to clean them, coarse screens are designated as either
hand-cleaned or mechanically cleaned
Hand-Cleaned Coarse Screens
Hand-cleaned coarse screens are used frequently ahead of pumps in small wastewater pumping
stations and sometimes used at the headworks of small- to medium-sized wastewater-treatment
plants. Often they are used for standby screening in bypass channels for service during high-flow
Screening
Coarse screens 6 – 150 mm
Microscreens < 50 µm
Fine screens < 6 mm
Hand cleaned Mechanically cleaned
Chaindriven Reciprocating rake
Catenary Continous belt
Static wedgewire Drum Step

97
periods, when mechanically cleaned screens are being repaired, or in the event of a power failure.
Normally, mechanically cleaned screens are provided instead of hand-cleaned screens to
minimize manual labor required to clean the screens and to reduce flooding due to clogging.
Where used, the length of the hand-cleaned bar rack should not exceed the distance that can be
conveniently raked by hand, approximately 3 m. The screen bars are welded to spacing bars
located at the rear face, out of the way of the tines of the rake. A perforated drainage plate should
be provided at the top of the rack where the rakings may be stored temporarily for drainage.
The screen channel should be designed to prevent the accumulation of grit and other heavy
materials in the channel ahead of the screen and following it. The channel floor should be level or
should slope downward through the screen without pockets to trap solids. Fillets may be desirable
at the base of the sidewalls. The channel preferably should have a straight approach,
perpendicular to the bar screen, to promote uniform distribution of screenable solids throughout
the flow and on the screen.
Typical design information for hand-cleaned bar screens is provided in Table 3-9.
Table 3-9: Typical design information for manually and mechanically cleaned bar racks. Parameter Cleaning method Unit Manual Mechanical Bar size Width Depth
mm mm
5-15 25-38
5-15 25-38
Clear spacing between bars mm 25-50 15-75 Slope from vertical º 30-45 0-30 Approach velocity Maximum Minimum Allowable headloss
m/s m/s mm
0.3-0.6 150
0.6-1 0.3-0.5 150-600
Mechanically Cleaned Bar Screens
The design of mechanically cleaned bar screens has evolved over the years to reduce the
operating and maintenance problems and to improve the screenings removal capabilities. Many
of the newer designs include extensive use of corrosion-resistant materials including stainless
steel and plastics.
Mechanically cleaned bar screens are divided into four principal types: (1) chain driven, (2)
reciprocating rake, (3) catenary, and (4) continuous belt. Cable-driven bar screens were used

98
extensively in the past but largely have been replaced in wastewater applications by the other
types of screens. Typical design information for mechanically cleaned is also included in Table
3-9. Examples of the different types of mechanically cleaned bar screens are shown on Figure 3-7
and the advantages and disadvantages of each type are presented in Table 3-10.
Chain-Driven Screens
Chain-driven mechanically cleaned bar screens can be divided into categories based on whether
the screen is raked to clean from the front (upstream) side or the back (downstream) side and
whether the rakes return to the bottom of the bar screen from the front or back. Each type has
slide advantages and disadvantages, although the general mode of operation is similar.
Figure 3-7 Typical mechanically cleaned coarse screens: a) front-cleaned, front return chain-driven, b) reciprocating rake, c) catenary, and d) continuous belt.

99
Table 3-10: Advantages and disadvantages of various types of bar screens Type of screen
Advantage Disadvantage
Chain-driven screen Front clean/ back return
- Multiple cleaning elements (short cleaning cycle)
- Used for heavy-duty applications
- Unit has submerged moving parts that require channel dewatering for maintenance
- Less efficient screenings removal, i.e., carryover of residual screenings to screened wastewater channel
Front clean/ front return
- Multiple cleaning elements (short cleaning cycle)
- Very little screenings carryover
- Unit has submerged moving parts that require channel dewatering for maintenance
- Submerged moving parts (chains, sprockets and shafts) are subject to fouling
- Heavy objects may cause rake to jam
Back clean/ back return
- Multiple cleaning elements (short cleaning cycle
- Submerged moving parts (chains, sprockets, and shafts) are protected by bar rack
- Unit has submerged moving parts that require channel dewatering for maintenance
- Long rake teeth are susceptible to breakage
- Some susceptibility to screenings carryover
Reciprocating rake
- No submerged moving parts; maintenance and repairs can be done above operating floor
- Can handle large objects (bricks, tires, etc)
- Effective raking of screenings and efficient discharge of screenings
- Relatively low operating and maintenance costs
- Stainless-steel construction reduces corrosion
- High Row capacity
- Unaccounted for high channel water level can submerge rake motor and cause motor burnout
- Requires more headroom than other screens
- Long cycle time; raking capacity may be limiting
- Grit accumulation in front of bar may impede rake movement
- Relatively high cost due to stainless-steel construction

100
Catenary
- Sprockets are not submerged; most maintenance can be done above the operating floor
- Required headroom is relatively low
- Multiple cleaning elements (short cleaning cycle)
- Can handle large objects
- Very little screenings carryover
- Because design relies on weight of chain for engagement of rakes with bars, chains are very heavy and difficult to handle
- Because of the angle of inclination of the screen (45 to 75°), screen has a large footprint
- Misalignment and warpage can occur when rakes are jammed
- May emit odors because of open design
Continuous belt
- Most maintenance can be done above operating floor
- Unit is difficult to jam
- Overhaul or replacement of the screening elements is a time-consuming and expensive operation
3.5.1.1.2 Fine Screens
The application for fine screens range over a broad spectrum not exclusively for Preliminary
treatment. In preliminary treatment, fine screens can follow coarse bar screens, in primary
treatment they can be used as a substitute for primary clarifiers in small treatment plants, and they
are used for simple treatment of combined sewer overflows. Fine screens can also be used to
remove solids from primary effluent that could cause clogging problems in trickling filters.
Screens used for preliminary treatment are of the (1) static (fixed) with a cleaning mechanism
(Figure 3-8), (2) rotary drum (Figure 3-9), or (3) step type (similar to Figure 3-7d). Typically the
openings vary from 0.2-6mm. Fines screens are often limited in use since they have a high head
loss.

101
Figure 3-8: Fine screen with circular cleaner
Figure 3-9: Fine screen with rotary drum
Fine screens used for replacement of primary treatment at small wastewater plants (less than 0.2
m³/s) have pore sizes from 0.25-2.5mm. Stainless-steel mesh or special wedge-shaped bars are
used as the screening medium. They require high maintenance effort to keep the screens clear.
Nevertheless headloss may range from 0.8-1.4 m. Typical removal rates of BOD and TSS are
reported in Table 3-11.

102
Table 3-11:Typical data on the removal of BOD and TSS with fine screens used to replace primary sedimentation Type of screen Size of openings [mm] BOD removed [%] TSS removed [%] Fixed parabolic 1.6 5-20 5-30 Rotary drum 0.25 25-50 25-45
3.5.1.2 Comminutors
Comminutors are used most commonly in small wastewater-treatment plants, less than 0.2 m3/s.
Comminutors are installed in a wastewater flow channel to screen and shred material to sizes
from 6 to 20 mm without removing the shredded solids from the flow stream. The solids are cut
up into a smaller, more uniform size and are returned to the flow stream for better handling and
subsequent removal by downstream treatment operations and processes. This technique should
only be used in specific cases, since usually once captured material should be removed and not
remixed with the stream. Comminutors make for example sence in pumping stations were coarse
material can damage pumps and a constant cleaning of screens is not possible. A typical
comminutor uses a stationary horizontal screen to intercept the flow (see Figure 3-10) and a
rotating or oscillating arm that contains cutting teeth to mesh with the screen. The cutting teeth
and the shear bars cut coarse material. The small sheared particles pass through the screen and
into the downstream channel. Similar machinery used for the same purpose are Macerators and
Grinders.
Figure 3-10: Typical comminutor used for particle size reduction of solids.

103
3.5.1.3 Grit chambers
Grit chambers are provided to (1) protect moving mechanical equipment from abrasion and
accompanying abnormal wear; (2) reduce formation of heavy deposits in pipelines, channels, and
conduits; and (3) reduce the frequency of digester cleaning caused by excessive accumulations of
grit. The removal of grit is essential ahead of centrifuges, heat exchangers, and high-pressure
diaphragm pumps. Grit chambers are used in preliminary treatment usually behind a screen to
also remove the grit. The goal is to remove the pure grit and leave organic particles in the water
stream in order to treat them afterwards. Like that the settled out heavy grit represents from a
toxicological point of view a relatively harmless waste product of the treatment plant with low
organic matter content. The most common method of grit disposal is transport to a landfill.
There are three general types of grit chambers: horizontal-flow, of either a rectangular or a square
configuration; aerated; or vortex type.
3.5.1.3.1 Horizontal-flow type
In the mainly used horizontal-flow type, the flow passes through the chamber in a horizontal
direction and the straight-line velocity of flow is controlled by the dimensions of the unit, an
influent distribution gate, and a weir at the effluent end. The underlying physical principle is that
gravity forces matter at low velocities to sediment. The design is consequently a function of
target grit size/mass, wastewater temperature, water velocity, length and depth of the chamber.
Representative design figures are given in
Table 3-12. Horizontal-flow grit chambers are either build in rectangular or square form. The
main difference is the removal of the grit from the ground of the chamber. Rectangular shaped
chambers have an opening on the ground and the grid is transported there by a slowly moving
rotating raking mechanism. The much less complex variant of rectangular chambers is cleaned by
a grab bucket, scraper of plow, running on a trolley stand over the chamber (Figure 3-11). In
small plants grit chambers are also cleaned by hand. The advantage of rectangular chambers is
that the distance the water flows is usually quite long, like that most of the organic particles will
be carried though the chamber and settled organic particles will tend to resuspend. Table 3-12: Typical design information for horizontal-flow grit chambers (for design wastewater temperature of 15.5°C). Item Unit Range Typical

104
Detention time Horizontal velocity Settling velocity for removal of : 0.21mm material 0.15mm material Headloss in a control section as percent of depth in channel. Added length allowance for inlet and outlet turbulence
s m/s m/min m/min % %
45-90 0.25-0.4 1.0-1.3 0.6-0.9 30-40 25-50
60 0.3 1.15 0.75 36 30
Figure 3-11: Grab bucket used to remove grit from grit chamber
3.5.1.3.2 Aerated type
The aerated type consists of a spiral-flow aeration tank where the spiral velocity is induced and
controlled by the tank dimensions and quantity of air blown in the tank on one side allong the
chamber (Figure 3-12). Correct adjusted spiral flow pattern allow heavier grit particles with high
settling velocities to settle on the bottom and lighter, principally organic, particles remain in

105
suspension and pass through the tank. The settled grit can be removed with the same techniques
as described for the horizontal-flow chambers.
Figure 3-12: Spiral flow pattern in an aerated grit chamber.
3.5.1.3.3 Vortex type
The vortex type consists of a cylindrical tank in
which the flow enters tangentially creating a vortex
flow pattern; centrifugal and gravitational forces
cause the grit to separate. A grit chamber is
designed for a minimal size of grit particles with a
certain specific gravity and a given wastewater
temperature. The vortex flow pattern can also be
created by a rotating turbine with controlled
velocity (Figure 3-13). The separated grit is taken
out of the structure by a sucking pipe on the ground.
Figure 3-13: Vortex type grit chamber

106
3.5.1.4 Other installations found in the preliminary treatment step
3.5.1.4.1 Grease trap
In some wastewater treatment plants a grease trap is installed in the preliminary or primary
treatment step. It is suppose to separate and collect grease and fat that swim usually on the water
surface from the wastewater. In a biological treatment step, excessive fat can cause problems
with microbiologic action.
3.5.1.4.2 Measuring device
Behind the preliminary treatment step there is usually a measuring device, like a parshal flume
installed. It is used to determine the volume stream entering the Treatment plant. Chemical and
physical measurements for monitoring reasons can be taken at this stage as well.
3.5.2 Primary treatment
The objective of treatment by sedimentation is to remove readily settlable solids and floating
material and thus reduce the suspended solids content. Primary sedimentation is used as a
preliminary step in the further processing of the wastewater. Efficiently designed and operated
primary sedimentation tanks should remove from 50 to 70 percent of the suspended solids and
from 25 to 40 percent of the BOD. The reduction of the BOD load in the primary treatment step
is favored, since the removal in the secondary treatment is more expensive. Sewage flows slowly
through the sedimentation tanks, allowing the suspended solids with a greater density than the
surrounding liquid to slowly settle to the bottom. The mass of solids accumulated in the bottom is
called raw primary sludge. This sludge is removed through a single pipe in small sized tanks or
through mechanical scrapers and pumps in larger tanks.
The efficiency of primary treatment in the removal of suspended solids, and, as result, BOD, may
be enhanced by the addition of coagulants. This is called advanced primary treatment or
chemically enhanced primary treatment (CEPT). Coagulants may be aluminium suphate, ferric
chloride or other, aided or not by a polymer. Phosphorus may be also removed by precipitation.
More sludge is formed, resulting from the higher amount of solids removed from the liquid and
from the chemical products added.

107
Septic tanks used in on-site, decentralized wastewater treatment are also a form of primary
treatment. The septic tans and their variants are basically sedimentation tanks, where the
settleable solids are removed to the bottom. These solids (sludge) remain at the bottom of the
tanks for a long period of time (various months) which is sufficient for their digestion. This
stabilization occurs under anaerobic conditions.
Almost all treatment plants use mechanically cleaned sedimentation tanks of standardized
circular or rectangular design. Two or more tanks should be provided so that the process may
remain in operation while one tank is out of service for maintenance and repair work. Typical
design information and dimensions for rectangular and circular sedimentation tanks used for
primary treatment are presented in Table 3-13. Schematic figures of rectangular and circular
primary sedimentation basins are shown in Figure 3-14 and Figure 3-15: circular primary
sedimentation tank.Figure 3-15.
The efficiency of sedimentation basins with respect to the removal of BOD and TSS is reduced
by:
- Complex electro-physical effects (eddy currents);
- Wind- induced circulation cells formed in uncovered tanks;
- Thermal convection currents;
- Cold or warm water causing the formation of density currents that move along the bottom
of the basin and warm water rising and flowing across the top of the tank;
- Thermal stratification in ho arid climates.
Table 3-13: Typical design information for primary sedimentation tanks.
Item Unit Range Typical
Primary sedimentation tanks followed by secondary treatment
Detention time
Overflow rate
Average flow
Peak hourly flow
Weir loading
h
m³/m².d
m³/m².d
m³/m.d
1.5-2.5
30-50
80-120
125-500
2.0
40
100
250

108
Figure 3-14: Rectangular primary sedimentation tank. (a: top view; b: cross section)

109
Figure 3-15: circular primary sedimentation tank.
3.5.3 Secondary treatment
The main objective of secondary treatment is the removal of organic matter in form of dissolved
organic matter and organic matter in suspension. Last is already partly removed by primary
treatment, if designed correctly.
The secondary treatment processes are conceived in such a way as to accelerate the
decomposition mechanisms that naturally occur in the receiving bodies. Thus, the decomposition
of the degradable organic pollutants is achieved under controlled conditions, and at smaller time
intervals than in the natural systems. The essence of secondary treatment of domestic sewage is
the inclusion of a biological stage. While preliminary and primary treatments have predominantly
physical mechanisms, the removal of the organic matter in the secondary stage is carried out
through biochemical reactions, undertaken by microorganisms.
A great variety of microorganisms take part in the process: bacteria, protozoa, fungi and others.
The basis of the whole biological process is the effective contact between these organisms and
the organic matter contained in the sewage, in such a way that it can be used as food for the
microorganisms. Microbiologic degradation is performed by lots of different types of
microorganisms under different conditions. The main distinction is between aerobic and
anaerobic processes. Characteristics of these two processes can be seen in Table 3-14. Another

110
distinction is made about the speed that treatment is taking place (connected to SRT). Here high
rated (fast) and low rated (slow) treatment setups are differentiated.
Table 3-14: Criteria relevant for wastewater treatment, the + means a potential advantage over the other. Criterion Aerobic Anaerobic
Range of water that can be treated +
Process stability and control +
Volumetric loading rates applicable +
Power input +
Heat input +
Surplus sludge production +
No Nutrient requirements +
No Oxygen requirements +
Degree of BOD removal +
Degree of NOD or N removal +
Degree of P removal +
Production of valuable by-products +
Chlorinated organics may be degraded +
3.5.3.1 Aerobic treatment
Under aerobic conditions organic substances (BOD) is oxidized and Carbon dioxide is being
created.
OHCOcessubsorganicOHC ismsmicroorgan2226126 6660)tan( +⎯⎯⎯⎯ →⎯+
The positive attributes of aerobic treatment is its simple handling and flexibility to remove a large
variety of organic compounds with a high efficiency. Aerobic systems are also quite old and
widely in use, though it has some striking disadvantages that are listed underneath:
- More expensive to operate than a anaerobic system
- Requires electricity
- Includes mechanical parts that can break down
- Requires more frequent routine maintenance

111
- Subject to upsets under sudden heavy loads or when neglected
- May release more nitrates to groundwater than a septic system
3.5.3.2 Activated sludge system
The activated sludge system is treating wastewater by bubbling atmospheric air or pure oxygen
through primary treated sewage, combined with organisms to develop a biological floc which
reduces the organic content of the sewage. In all activated sludge plants, once the sewage has
reached sufficient treatment, excess mixed liquor is discharged into settling tanks and the treated
overflow is run off to undergo further treatment before discharge. Part of the settled material, the
sludge, is returned to the head of the aeration system to re-seed the new sewage entering the tank.
This fraction of the flocs is called Return Activated Sludge (R.A.S.). Excess sludge which
eventually accumulates beyond what is returned is called Waste Activated Sludge (W.A.S.).
W.A.S. is removed from the treatment process to keep the F/M ratio in balance. W.A.S. is stored
away from the main treatment process in storage tanks and is further treated by digestion, either
under anaerobic or aerobic conditions prior to disposal. The flow chart for an activated sludge
system is shown in Figure 3-16.
Figure 3-16: Flow chart for Activated sludge process
In Table 3-15 and Table 3-16, the typical design parameters and limitations for commonly used
activated sludge processes are listed.
Table 3-15: typical design parameters for commonly use activated sludge processes. Process name Type SRT F/M Volumetric MLSS HRT RAS

112
of
reactor
(d) (kg BOD/kg
MLVSS/d) loading
(kgBOD/m3.d)
(mg/L) (h) (% of
influent)
Conventional
plug flow
Plug
flow
3-15 0.2-0.4 0.3-0.7 1000-
3000
4-8 25-75
Complete mix CMAS 3-15 0.2-0.6 0.3-1.6 1500-
4000
3-5 25-100
Extended
aeration
Plug
flow
20-40 0.04-0.10 0.1-0.3 2000-
5000
20-30 50-150
Oxidation ditch Plug
flow
15-30 0.04-0,1 0.1-0.3 3000-
5000
15-30 75-150
High purity
oxygen
Plug
flow
1-4 0.5-1 1.3-3,2 2000-
5000
1-3 25-50
Table 3-16: Advantages and limitations of activated-sludge processes for BOD removal and nitrification Process Process Advantages Limitations
Complete mix Common, proven process Adaptable to amany types of wastewater Large dilution capacity for shock and toxic loads Uniform oxygen demand Design is relatively uncomplicated Suitable for all types of aeration equipment
Susceptible to filamentous sludge bulking
Conventional plug flow
Proven process May achieve a somewhat higher level of ammonia removal than the complete mix process Adaptable to many operating schemes including step-feed, selector design, and anoxic/ aerobic processes
Design and operation for tapered aeration is more complex May be difficult to match oxygen supply to oxygen demand in first pass
High rate Requires less aeration tank volume than conventional plug flow Uses less aeration energy
Less stable operation; produces lower quality effluent Not suitable for nitrification Sludge production is higher High peak flows can disrupt operation by wasting out MLSS
Extended aeration
High quality effluent possible Relatively uncomplicated design and operation Capable of treating shock/toxic loads Well stabilized sludge; low biosolids production
Aeration energy use is high Relatively large aeration tanks Adaptable mostly to small plants
High-purity oxygen
Requires relatively small aeration tank volume Emits less VOC and off-gas volume Generally produces good settling sludge Operation and DO controld and relatively uncomplicated
Limited capability for nitrification More complex equipment to install, operate and maintain. Nocardia foaming High peak flow can disrupt operation by washing out MLSS

113
Adaptable to many types of wastewater
FUNDAMENTALS OF PROCESS ANALYSIS AND CONTROL
The purpose of this section is to introduce (1) the basic considerations involved in process design,
(2) process control measures, (3) operating problems associated with the activated-sludge process,
and (4) activated-sludge selector processes.
3.5.3.2.1 Process design considerations
In the design of the activated-sludge process, consideration must be given to (1) selection of the
reactor type, (2) applicable kinetic relationships, (3) solids retention time and loading criteria to
be used, (4) sludge production, (5), oxygen requirements and transfer, (6) nutrient requirements,
(7) other chemical requirements, (8) settling characteristics of biosolids, (9) use of selectors, and
(10) effluent characteristics.
Selection of Reactor Type
Important factors that must be considered in the selection of reactor types for the activated-sludge
process include (1) the effects of reaction kinetics, (2) oxygen transfer requirements, (3) nature of
the wastewater, (4) local environmental conditions, (5) presence of toxic or inhibitory substances
in the influent wastewater, (6) costs and (7) expansion to meet future treatment needs.
Information on these factors is summarized in Table 3-17: General considerations for the
selection of the type of suspended growth activated sludge reactor.Table 3-17.
Table 3-17: General considerations for the selection of the type of suspended growth activated sludge reactor. Factor Description Effect of reaction kinetics
The two types of reactors used commonly are the complete-mix and the plug-flow reactor. From a practical standpoint, the hydraulic detention times of many of the complete-mix and plug-flow reactors in actual use are about the same. The reason is that the designs for BOD removal are generally governed by an SRT sufficient to assure good settling properties and of a duration longer than that needed for BOD removal. For nitrification, the possible reaction kinetic benefits from using a staged-reactor or plug-flow system may be exploited, provided that the aeration equipment has a high enough oxygen transfer rate in first stage or at the front of a plug-flow tank to satisfy the demand from higher BOD removal and nitrification rates.
Oxygen transfer requirements
Historically, in conventional plug-flow aeration systems, sufficient oxygen often could not be supplied at the beginning of the reactor to meet the demand. The inability to supply the needed oxygen led to development of the following modifications to the activated-sludge process:
)1 ( tapered aeration in which an attempt was made to match the air supplied to the oxygen demand, (2) the step-feed process where the incoming wastewater is distributed along the length of the reactor (usually at quarter points), and (3) the complete-mix process where the air

114
supplied uniformly matches or exceeds the oxygen demand. Most of the past oxygen transfer limitations have been overcome by better selection of process operational parameters and improvements in the design and application of aeration equipment
Nature of wastewater
The nature of the wastewater includes the overall characteristics of the wastewater as affected by contributions such as domestic wastewater, industrial discharges, and inflow/infiltration. Alkalinity and pH are important, particularly in the operation of nitrification processes . Because low pH values inhibit the growth of nitrifying organisms (and encourage the growth of filamentous organisms), pH adjustments may be required. Industrial waste discharges may also affect the pH in low-alkalinity wastewaters.
Local environmental conditions
Temperature is an important environmental condition that affects treatment performance because changes in the wastewater temperature can affect the biological reaction rate. Temperature is especially important in nitrification design as the expected mixed-liquor temperature will affect the design SRT. Precipitation effects and groundwater infiltration are local factors that can affect both flowrates and constituent concentrations. High peak flowrates can cause the washout of solids in biological reactors
Toxic or inhibitory substances
For municipal wastewater treatment systems with a large number of industrial connections, a potential exists for receiving inhibitory substances that can depress biological nitrification rates. Where such potential exists, laboratory treatability studies are recommended to assess nitrification kinetics. If shock loads or toxic discharges are a design consideration, a complete mix reactor can more easily withstand changing wastewater characteristics because the incoming wastewater is more or less uniformly dispersed with the reactor contents, as compared to a plug-flow reactor. The complete mix process has been used in a number of installations to mitigate the impacts caused by shock loads and toxic discharges, especially from industrial installations
Cost
Construction and operating costs are very important considerations in selecting the type and size of reactor. Because the associated settling facilities are an integral part of the activated sludge process, the selection of the reactor and the solids separation facilities must be considered as a unit
Future treatment needs
Potential future treatment needs can have an impact on present process selection. For example, if water reuse is anticipated in the future, the process selection should favor designs that can easily accommodate nitrogen removal and effluent filtration
Selection of Solids Retention Time and Loading Criteria.
Certain design and operating parameters distinguish one activated-sludge process from another.
The common parameters used are the solids retention time (SRT), the food to biomass (F/M)
ratio (also known as food to microorganism ratio), and the volumetric organic loading rate. While
the SRT is the basic design and operating parameter, the F/M ratio and volumetric loading rate
provide values that are useful for comparison to historical data and typical observed operating
conditions. See chapter 3.1.4 for further information on parameters.
3.5.3.2.2 Operational problems
The most common problems encountered in the operation of an activated-sludge plant are
bulking sludge, rising sludge, and Nocardia foam. Because few plants have escaped these
problems, it is appropriate to discuss their nature and methods for their control.

115
Figure 3-17 The changes in predominance of microorganisms versus F/M ratio and SRT.
Bulking Sludge
In many cases Mixed Liquor Suspended Solids (MLSS) with poor settling characteristics has
developed into what is known as a bulking sludge condition, which defines a condition in the
activated-sludge clarifier that can cause high effluent suspended solids and poor treatment
performance. In a bulking sludge condition, the MLSS floc does not compact or settle well, and
floc particles are discharged in the clarifier effluent. With good settling sludge, sludge levels may
be as low as 10 to 30 cm at the bottom of the clarifier. In extreme bulking sludge conditions, the
sludge blanket cannot be contained and large quantities of MLSS are carried into the system
effluent, potentially resulting in violation of permit requirements, inadequate disinfection, and
clogging of effluent filters.
Two principal types of sludge bulking problems have been identified. One type, filamentous
bulking, is caused by the growth of filamentous organisms or organisms that can grow in a
filamentous form under adverse conditions, and is the predominant form of bulking that occurs.
The other type of bulking, viscous bulking, is caused by an excessive amount of extracellular
biopolymer, which produces a sludge with a slimy, jellylike consistency (Wanner, 1994). As the

116
biopolymers are hydrophilic, the activated sludge is highly water-retentive, and this condition is
referred to as hydrous bulking.
The resultant sludge has a low density with low settling velocities and poor compaction. Viscous
bulking is usually found with nutrient-limited systems or in a very high loading condition with
wastewater having a high amount of rbCOD.
Bulking sludge problems due to the growth of filamentous bacteria are more common. In
filamentous growth, bacteria form filaments of single-cell organisms that attach end-to-end, and
the filaments normally protrude out of the sludge floc. This structure, in contrast to the preferred
dense floc with good settling properties, has an increased surface area to mass ratio, which results
in poor settling.
On Figure 3-18, a good settling, dense nonfilamentous floc is contrasted to floc containing
filamentous growth. Many types of filamentous bacteria exist, and means have been developed
for the identification and classification of filamentous bacteria found commonly in activated-
sludge systems (Eikelboom, 2000). The classification system is based on morphology (size and
shape of cells, length and shape of filaments), staining responses, and cell inclusions. Sludge
bulking can be caused by a variety of factors, including wastewater characteristics, design
limitations, and operational issues (Table 3-18).
Table 3-18: Factors that affect sludge bulking Factor Description
Wastewater characteristics Variation in flowrates
Variations in composition
pH
Temperature
Septicity
Nutrient content
Nature of waste components
Design limitations Limited air supply
Poor mixing
Short circuiting (aeration tanks and
clarifiers)

117
Clarifier design (sludge collection and
removal)
Limited return sludge pumping capacity
Operational issues Low dissolved oxygen
Insufficient nutrients
Low F/M
Insufficient soluble BOD
Activated-sludge reactor operating conditions (low DO, low F/M, and complete mix operation)
clearly have an effect on the development of filamentous populations. One of the kinetic features
of filamentous organisms that relates to these conditions is that they are very competitive at low
substrate concentrations whether it be organic substrates, DO, or nutrients. Thus, lightly loaded
complete-mix activated-sludge systems or low DO (<0.5 mg/L) operating conditions provide an
environment more favorable to filamentous bacteria than to the desired floc-forming bacteria.
Filamentous bacteria such as Beggiatoa and Thiothrix grow well on hydrogen sulfide and reduced
substrates, respectively, that would be found in septic wastewaters (Wanner, 1994). When the
influent wastewater contains fermentation products such as volatile fatty acids and reduced sulfur
compounds (sulfides and thiosulfate), Thiothrix can proliferate. Prechlorination of the
wastewaters has been done in some cases to prevent their growth. Besides causing bulking
problems in activated-sludge systems, Beggiatoa and Thiothrix can create problems in fixed-film
systems, including trickling filters and rotating biological contactor. In the control of bulking,
where a number of variables are possible causes, a checklist of items to investigate is valuable.
The following items are recommended: (1) wastewater characteristics, (2) dissolved oxygen
content, (3) process loading, (4) return and waste sludge pumping rates, (5) internal plant
overloading, and (6) clarifier operation.

118
Figure 3-18: Examples of good and poor settling floc particles: (a) nonfilamentous good settling floc, (b) floc particles bridged by filamentous microorganisms, (c) floc particles with limited filamentous microorganisms and secondary form, (d) filaments extending from floc causing poor settling, (e) Thiothrix filaments with sulfur granules, and (f) type 1701 filamentous microorganism observed under low dissolved oxygen conditions. (Courtesy Dr. David Jenkins, University of California, Berkeley)
One of the first steps to be taken when sludge settling characteristics change is to view the mixed
liquor under the microscope: to determine what type of microbial growth changes or floc
structure changes can be related to the development of bulking sludge. A reasonable quality
phase-contrast microscope with magnification up to 1000 times (oil immersion) is necessary to
view the filamentous bacteria structure and size.

119
Rising Sludge
Occasionally, sludge that has good settling characteristics will be observed to rise or float to the
surface after a relatively short settling period. The most common cause of this phenomenon is
denitrification, in which nitrites, and nitrates in the wastewater are converted to nitrogen gas. As
nitrogen gas is formed in the sludge layer, much of it is trapped in the sludge mass. If enough gas
is formed, the sludge mass becomes buoyant and rises or floats to the surface. Rising sludge can
be differentiated from bulking sludge by noting the presence of small gas bubbles attached to the
floating solids and the presence of more floating sludge on the secondary clarifier surface. Rising
sludge is common in short SRT systems, where the temperature encourages the initiation of
nitrification, and the mixed liquor is very active due to the low sludge age.
Rising sludge problems may be overcome by (1) increasing the return activated sludge
withdrawal rate from the clarifier to reduce the detention time of the sludge in the clarifier, (2)
decreasing the rate of flow of aeration liquor into the offending clarifier if the sludge depth
cannot be reduced by increasing the return activated-sludge withdrawal rate, (3) where possible,
increasing the speed of the sludge-collecting mechanism in the settling tanks, and (4) decreasing
the SRT to bring the activated sludge out of nitrification. For warm climates where it is very
difficult to operate at a low enough SRT to limit nitrification, an anoxic/aerobic process is
preferred to denitrification to prevent rising sludge and to improve sludge settling characteristics.
Nocardia Foam
Two bacteria genera, Nocardia and Microthrix parvicella, are associated with extensive foaming
in activated-sludge processes. These organisms have hydrophobic cell surfaces and attach to air
bubbles, where they stabilize the bubbles to cause foam. The organisms can be found at high
concentrations in the foam above the mixed liquor. Both types of bacteria can be identified under
microscopic examination. Nocardia has a filamentous structure, and the filaments are very short
and are contained within the floc particles. Microthrix parvicella has thin filaments extending
from the floc particles. Foaming on an activated-sludge basin and a microscopic view of
Nocardia are shown on Figure 3-19. The foam is thick, has a brown color, and can build up in
thickness of 0.5 to 1 m.

120
Figure 3-19: Nocardia foam: (a) example of foam on an aeration tank and (b) microscopic observation of gram-stained Nocardia filaments. (Courtesy Dr. David Jenkins, University of California, Berkeley).
The foam production can occur with both diffused and mechanical aeration but is more
pronounced with diffused aeration and with higher air flowrates. Problems of Nocardia foaming
in the activated sludge can also lead to foaming in anaerobic and aerobic digesters that receive
the waste-activated sludge. Nocardia growth is common where surface scum is trapped in either
the aeration basin or secondary clarifiers. Aeration basins that are baffled with flow from one cell
to the next occurring under the baffles, instead of over the top, encourage Nocardia growth and
foam collection. Methods that can be used to control Nocardia include (1) avoiding trapping foam
in the secondary treatment process, (2) avoiding the recycle of skimmings into the secondary
treatment process, and (3) using chlorine spray on the surface of the Nocardia foam. The use of a
selector design may help to discourage Nocardia foaming, but significant foaming has been
observed with anoxic/aerobic processes. The addition of a small concentration of cationic
polymer has been used with some success for controlling Nocardia foaming (Shao et aI., 1997).
The presence of Nocardia has also been associated with the presence of Nocardia-Microthrix with
fats and edible oils in wastewater. Reducing the oil and grease content from discharges to the
collection system from restaurants, truck stops, and meatpacking facilities by effective degreasing
processes can help control potential Nocardia problems.
SELECTION AND DESIGN OF PHYSICAL FACILITIES FOR ACTIVATED-SLUDGE
PROCESSES

121
The physical facilities used in the design of activated-sludge treatment systems are presented and
discussed in this section. The subjects discussed include (1) the aeration system, (2) aeration
tanks and appurtenances, (3) solids separation, and (4) solids separation facilities.
3.5.3.2.3 Aeration system
The aeration system design for the activated-sludge process must be adequate to (1) satisfy the
bCOD of the waste, (2) satisfy the endogenous respiration by the biomass, (3) satisfy the oxygen
demand for nitrification, (4) provide adequate mixing, and (5) maintain a minimum dissolved
oxygen concentration throughout the aeration tank. If the oxygen transfer efficiency of the
aeration system is known or can be estimated, the actual air requirements for diffused air aeration
or installed power of mechanical surface aerators may be determined.
To meet sustained organic loadings at peak conditions discussed in Chap. 3, aeration equipment
should be designed with a peaking factor of at least 1.5 to 2.0 times the average BOD load.
Aeration equipment should also be sized based on residual dissolved oxygen (DO) of 2 mg/L in
the aeration tank at the average load and 1.0 mg/L at peak load. The aeration equipment must be
designed with enough flexibility to (1) meet minimum oxygen demands, (2) prevent excessive
aeration and save energy, and (3) meet maximum oxygen demands.
Aeration Tanks and Appurtenances
After the activated-sludge process and the aeration system have been selected and a preliminary
design has been prepared, the next step is to design the aeration tanks and support facilities. The
following discussion covers (1) aeration tanks, (2) flow distribution, and (3) froth control
systems.
Aeration Tanks
Aeration tanks usually are constructed of reinforced concrete and left open to the atmosphere.
The rectangular shape permits common-wall construction for multiple tanks. The total tank
capacity required should be determined from the biological process design. For plants in a
capacity range of 0.22 to 0.44 m3/s, at least two tanks should be provided (a minimum of two
tanks is preferred for smaller plants as well, for redundancy). In the range of 0.44 to 2.2 m3/s,

122
four tanks are often provided to allow operational flexibility and ease of maintenance. Large
plants, over 2.2 m3/s in capacity, should contain six or more tanks. Some of the largest plants
have from 30 to 40 tanks arranged in several groups or batteries. Although the air bubbles
dispersed in the wastewater occupy perhaps 1 percent of the total volume, no allowance is made
for this in tank sizing.
If the wastewater is to be aerated with diffused air, the geometry of the tank may significantly
affect the aeration efficiency and the amount of mixing obtained. The depth of wastewater in the
tank should be between 4.5 and 7.5 m to maximize the energy efficiency of the diffuser systems.
Freeboard from 0.3 to 0.6 m above the waterline should be provided. The width of the tank in
relation to its depth is important if spiral-flow mixing is used in the plug-flow configuration. The
width-to-depth ratio for such tanks may vary from 1.0:1 to 2.2:1, with 1.5:1 being the most
common. In large plants, the channels become quite long and sometimes exceed 150m per tank.
Tanks may consist of one to four channels with round-the end flow in multiple-channel tanks.
The length-to-width ratio of each channel should be at least 5:1. Where complete-mix diffused air
systems are used, the length-to-width ratio may be reduced to save construction cost
For tanks with diffusers on both sides or in a grid or panel pattern, greater widths are permissible.
The important point is to restrict the width of the tank so that "dead spots" or zones of inadequate
mixing are avoided. The dimensions and proportions of each independent unit should be such as
to maintain adequate velocities so that deposition of solids will not occur. In spiral-flow tanks,
triangular baffles or fillets may be placed longitudinally in the corners of the channels to
eliminate dead spots and to deflect the spiral flow.
For mechanical aeration systems, the most efficient arrangement is one aerator per tank. Where
multiple aerators are installed in the same tank for best efficiency, the length-to-width ratio of the
tank should be in even multiples with the aerator centered in a square configuration to avoid
interference at the hydraulic boundaries. The width and depth should be sized in accordance with
the power rating of the aerator as illustrated in Table 3-19. Two-speed aerators are desirable to
provide operating flexibility to cover a wide range of oxygen demand conditions. Freeboard of
about 1 to 1.5 m should be provided for mechanical aeration systems
Table 3-19: Typical aeration tank dimensions for mechanical surface aerators
Aerator size Tank depth Tank width Hp Kw m M 10 7.5 3-3.6 9-12

123
20 15 3.6-4.2 10.5-15 30 22.5 3.9-4.5 12-18 40 30 3.6-5.1 13.5-20 50 37.5 4.5-5.5 13.5-23 75 56 4.5-6 15-26 100 75 4.5-6 18-27 Individual tanks should have inlet and outlet gates or valves so that they may be removed from
service for inspection and repair. The common walls of multiple tanks must therefore be able to
withstand the full hydrostatic pressure from either side.
Aeration tanks must have adequate foundations to prevent settlement, and, in saturated soil, they
must be designed to prevent flotation when the tanks are dewatered. Methods of preventing
flotation include thickening the floor slab, installing hold-down piles, or installing hydrostatic
pressure relief valves. Drains or sumps for aeration tanks are desirable for dewatering. In large
plants where tank dewatering might be more common, it may be desirable to install mud valves
in the bottoms of all tanks. The mud valves should be connected to a central dewatering pump or
to a plant drain discharging to the wet well of the plant pumping station. Dewatering systems are
commonly designed to empty a tank in 12 to 24 h.
Flow Distribution
For wastewater treatment plants containing multiple units of primary sedimentation basins and
aeration tanks, consideration has to be given to equalizing the distribution of flow to the aeration
tanks. In many designs, the wastewater from the primary sedimentation basins is collected in a
common conduit or channel for transport to the aeration tanks. For efficient use of the aeration
tanks, a method of splitting or controlling the flow rate to each of the individual tanks should be
used. Methods commonly used are splitter boxes equipped with weirs or control valves or
aeration tank influent control gates. Hydraulic balancing of the flow by equalizing the head loss
from the primary sedimentation basins to the individual aeration tanks is also practiced. Flow
regimes using a form of step feed particularly need a positive means of flow control. Where
channels are used for aeration tank influent or effluent transport, they can be equipped with
aeration devices to prevent deposition of solids. The air required ranges from 0.2 to 0.5 m3/lin m-
.min of channel.

124
Froth Control Systems
Wastewater normally contains soap, detergents, and other surfactants that produce foam when the
wastewater is aerated. If the concentration of mixed-liquor suspended solids is high, the foaming
tendency is minimized. Large quantities of foam may be produced during startup of the process,
when surfactants are present in the wastewater. The foaming action produces a froth that contains
sludge solids, grease, and large numbers of wastewater bacteria (see Figure 3-20). The wind may
lift the froth off the tank surface and blow it about, contaminating whatever it touches. The froth,
besides being unsightly, is a hazard to those working with it because it is very slippery, even after
it collapses. In addition, once the froth has dried, it is difficult to remove.
Figure 3-20: Typical non-Nocardia froth on activated sludge aeration tank sludge return channels.
It is important, therefore, to consider some method for controlling froth formation, particularly in
spiral-flow tanks where the froth collects along the side of the tank, aerated channels, and free-
fall from weirs. A commonly used system for spiral-roll tanks consists of a series of spray
nozzles mounted above the surface in areas where the froth collects. Screened effluent or clear
water is sprayed through these nozzles and physically breaks down the froth as it forms. Another
approach is to meter a small quantity of antifoaming chemical additive into the spray water.
Nocardia Foam Control
Nocardia foam is a thick layer of brown, biological foam that forms on the top of aeration tanks
and clarifiers. When the Nocardia organisms grow in sufficient numbers, they tend to trap air
bubbles that subsequently float to the surface and accumulate as scum. When Nocardia foam
occurs, it should be removed from the system, as it will also cause foaming problems in
anaerobic and aerobic digesters. Nocardia foam has been controlled by spraying a chlorine

125
solution directly into the foam layer. In some cases, spray nozzles have been installed within a
hood located across the width of plug-flow aeration tanks. The addition of a cationic polymer to
the activated-sludge process has also been used to control the production of Nocardia foam (Shao
et al., 1997). Chlorinating the return activated sludge (RAS) for bulking control may not be
effective, as it may cause floc breakup and inhibit BOD removal and nitrification.
Solids Separation
The separation of solids in the activated-sludge process is a very important function in order to
provide well-clarified effluent and concentrated solids that are returned to the biological
treatment system or wasted to the solids processing facilities. The design of secondary clarifiers
following suspended growth biological treatment considers two functions: (1) a sufficient time is
needed to provide gravity settling of particles and a relatively clear liquid and (2) thickening of
the settled solids to provide higher solids concentration in the return activated sludge.
For solids-thickening considerations, the solids loading rate (kg/m2'd), which is the rate of solids
feed relative to the clarifier cross-sectional area, is the primary process parameter. In this section,
methods are presented to determine solids loading rates as a function of the sludge-settling
properties and clarifier return sludge flowrate. The analysis to determine acceptable loadings
requires knowledge of the sludge-thickening characteristics. Thus, the procedures presented in
this section are more applicable for the evaluation and optimization of existing systems than the
design for new systems
Solids Flux Analysis
The area required for thickening of the applied mixed liquor depends on the limiting solids flux
that can be transported to the bottom of the sedimentation basin. Because the solids flux varies
with the characteristics of the sludge, column settling tests should be conducted to determine the
relationship between the sludge concentration and the settling rate. The required area can then be
determined using the solids flux analysis procedure described below. The depth of the thickening
portion of the sedimentation tank must be sufficient to (1) ensure maintenance of an adequate
sludge blanket depth so that unthickened solids are not recycled, and (2) temporarily store excess
solids that may be applied.

126
A method used to determine the area required for hindered settling is based on an analysis of the
solids (mass) flux. Data derived from settling tests must be available when applying this method,
which is based on an analysis of the mass flux (movement across a boundary) of the solids in the
settling basin.
3.5.3.2.4 Typical devices of aeration system
The various types of aeration systems use and their applications are described in Table 3-20. The
principal types, diffused –air systems, mechanical aeration and, high-purity oxygen systems.
Table 3-20: Description of commonly used devices for wastewater aeration. Classifcation Description Use or application Submerged: Diffused air fine bubble (fine pore)system Course bubble (nonporous) system Spartger turbine Static tube mixer Jet
Bubbles generated with ceramic, plastic, or flexible membranes (domes, tubes, disks, plates, or panel configurations Bubbles generated with orifices, injectors and nozzles, or shear plates low-speed turbine and compressed-air injection Short tubes with internal baffles designed to retain air injected at bottom of tube in contact with liquid Compressed air injected into mixed liquor as it is pumped under pressure through jet device
All types of activated-sludge processes All types of activated-sludge processes, channel and grit chamber aeration, and aerobic digestion All types of activated-sludge processes and aerobic digestion Aerated lagoons and activated-sludge processes All types of activated-sludge processes, equalization tank mixing and aeration, and deep tank aeration
Surface: Low speed turbine aerator High speed floating aerator Aspirating Rotor brush or rotating disk assembly
large-diameter turbine used to expose liquid droplets to the atmosphere Small-diameter propeller used to expose liquid droplets to the atmosphere Inclined propeller assembly Blades or disks mounted on a horizontal central shaft are rotated through the liquid.
Conventional activated-sludge processes, aerated lagoons, and aerobic digestion Aerated lagoons and aerobic digestion Aerated lagoons Oxidation ditch, channel aeration, and

127
Cascades
Oxygen is induced into the liquid by the splashing action of the rotor and by exposure of liquid droplets to the atmosphere Wastewater Rows over a series of steps in sheet flow
aerated lagoons Post aeration
Diffused –Air aeration: The two basic methods of aerating wastewater are (1) to introduce air or pure oxygen into the
wastewater with submerged diffusers or other aeration devices or (2) to agitate the wastewater
mechanically so as to promote solution of air from the atmosphere. A diffused-air system consists
of diffusers that are submerged in the wastewater, headers pipes, air mains, and the blowers and
appurtenances through which the air passes. The following discussion covers the selection of
diffusers, the design of blowers, and air piping design
Diffusers
In the past, the various diffusion devices have been classified as either fine bubble or coarse
bubble, with the connotation that fine bubbles were more efficient in transferring oxygen. The
definition of terms and the demarcation between fine and coarse bubbles, however, have not been
clear, but they-continue to be used. The current preference is to categorize the diffused aeration
systems by the physical characteristics of the equipment. Three categories are defined: (1) porous
or fine-pore diffusers, (2) nonporous diffusers, and (3) other diffusion devices such as jet aerators,
aspirating aerators, and U tube aerators. The various types of diffused-air devices are described in
Table 3-21.
Table 3-21: Description of commonly used air diffusion devices
Description Trnsfer efficiency
Type of diffuser or device
Rigid ceramic disks mounted on air-distribution pipes near the tank floor
High Porous Disk
Dome-shaped ceramic diffusers mounted on air-distribution pipes near the tank floor
High Dome
Flexible porous membrane supported on disk mounted on an air-distribution grid
High Membrane
Rectangular panel with a flexible plastic perforated membrane Very high Panel
Devices usually constructed of molded plastic and mounted on air-distribution pipes
Low Nonporous Fixed orifice Orifice

128
Stainless-steel tubing containing perforations and slots to provide a wide band of diffused air
Low Slotted tube
Stationary vertical tube mounted on basin bottom and functions like an air-lift pump
Low Static tube
Porous Diffusers
Porous diffusers are made in many shapes, the most common being domes, disks, and membranes
(see Figure 3-21). Tubes are also used. Plates were once the most popular but are costly to install
and difficult to maintain. Porous domes, disks, and membranes have largely supplanted plates in
newer installations. Domes, disks, or tube diffusers are mounted on or screwed into air manifolds,
which may run the length of the tank close to the bottom and along one or two sides, or short
manifold headers may be mounted on movable drop pipes on one side of the tank. Dome and disk
diffusers may also be installed in a grid pattern on the bottom of the aeration tank to provide
uniform aeration throughout the tank (see Figure 3-22)
Numerous materials have been used in the manufacture of porous diffusers. These materials
generally fall into the categories of rigid ceramic and plastic materials and flexible plastic,
rubber, or cloth sheaths. The ceramic materials consist of rounded or irregular-shaped mineral
particles bonded together to produce a network of interconnecting passageways through which
compressed air flows. As the air emerges from the surface pores, pore size, surface tension, and
air flow-rate interact to produce the bubble size. Porous plastic materials are newer
developments. Similar to the ceramic materials, the plastics contain a number of interconnecting
channels or pores through which the compressed air can pass.

129
Figure 3-21: Typical porous air diffusers: (a) aluminum oxide disk, (b) ceramic dome, (c) polyethylene disk, and (d) perforated membrane.
Thin, flexible sheaths made from soft plastic or synthetic rubber have also been developed and
adapted to disks and tubes. Air passages are created by punching minute holes in the sheath
material. When the air is turned on, the sheath expands and each slot acts as a variable aperture
opening; the higher the air flowrate, the greater the opening.
Rectangular panels that use a flexible polyurethane sheet (see Figure 3-23) are also used in
activated-sludge aeration. The panels are constructed with a stainless-steel frame and are placed
on or close to the bottom of the tank and anchored. Advantages cited for aeration panels are (1)
ultra-fine bubbles are produced that significantly improve oxygen transfer and system energy
efficiency, (2) large areas of the tank floor can be covered, which facilitates mixing and oxygen
transfer, and (3) foulants can be dislodged by "bumping," i.e., increasing the airflow to flex the
membrane. Disadvantages are (1) the panel is a proprietary design and thus lacks competitive
bidding, (2) the membrane has a higher head loss, which may affect blower performance in
retrofit applications, and (3) increased blower air filtration is required to prevent internal fouling
With all porous diffusers, it is essential that the air supplied be clean and free of dust particles
that might clog the diffusers. Air filters, often consisting of viscous impingement and dry-barrier

130
types, are commonly used. Precoated bag filters and electrostatic filters have also been used. The
filters should be installed on the blower inlet
Figure 3-22: Plug flow aeration tank equipped with dome aeration devices.
Nonporous Diffusers
Several types of nonporous diffusers are available (see Figure 3-24). Nonporous diffusers
produce larger bubbles than porous diffusers and consequently have lower aeration efficiency;
but the advantages of lower cost, less maintenance, and the absence of stringent air-purity
requirements may offset the lower oxygen transfer efficiency and energy cost. Typical system
layouts for orifice diffusers closely parallel the layouts for porous dome and disk diffusers;
however, single- and dual-roll spiral patterns using narrow- or wide-band diffuser placement are
the most common. Applications for orifice and tube diffusers include aerated grit chambers,
Figure 3-23: Ultra-fine pore membrane aeration panels: (a) schematic (Courtesy Parkson Corp.) and (b) panels placed in bottom of an activated-sludge reactor.

131
channel aeration, flocculation basin mixing, aerobic digestion, and industrial waste treatment
(WEF, 1998b)
Other Air-Diffusion Devices
Jet aeration combines liquid pumping with air diffusion. The pumping system recirculates liquid
in the aeration basin, ejecting it with compressed air through a nozzle assembly. This system is
particularly suited for deep (>8 m) tanks. Aspirating aeration consists of a motor driven aspirator
pump. The pump draws air in through a hollow tube and injects it underwater where both high
velocity and propeller action create turbulence and diffuse the air bubbles. The aspirating device
can be mounted on a fixed structure or on pontoons.
Mechanical Aerators
Mechanical aerators are commonly divided into two groups based on major design and operating
features: aerators with vertical axis and aerators with horizontal axis. Both groups are further
subdivided into surface and submerged aerators. In surface aerators, oxygen is entrained from the
atmosphere; in submerged aerators, oxygen is entrained from the atmosphere and, for some types,
from air or pure oxygen introduced in the tank bottom. In either case, the pumping or agitating
action of the aerators helps to keep the contents of the aeration tank or basin mixed. In the
following discussion, the various types of aerators will be described, along with aerator
performance and the energy requirement for mixing. Surface Mechanical Aerators with Vertical Axis
Surface mechanical aerators with a vertical axis are designed to induce either updraft or
downdraft flows through a pumping action (see Figure 3-25). Surface aerators consist of
submerged or partially submerged impellers that are attached to motors mounted on floats or on
Figure 3-24: Nonporous diffusers used for the transfer of oxygen: (a) orifice and (b) tube

132
fixed structures. The impellers are fabricated from steel, cast iron, noncorrosive alloys, and
fiberglass-reinforced plastic and are used to agitate the wastewater vigorously, entraining air in
the wastewater and causing a rapid change in the air-water interface to facilitate solution of the
air. Surface aerators may be classified according to the type of impeller used: centrifugal, radial-
axial, or axial; or the speed of rotation of the impeller: low and high speed. Centrifugal impellers
belong to the low-speed category; the axial flow impeller type aerators operate at high speed. In
low-speed aerators, the impeller is driven through a reduction gear by an electric motor (see
Figure 3-25 a). The motor and gearbox are usually mounted on a platform that is supported either
by piers extending to the bottom of the tank or by beams that span the tank. Low-speed aerators
may also be mounted on floats. In high-speed aerators, the impeller is coupled directly to the
rotating element of the electric motor (see Figure 3-25 c). High-speed aerators are almost always
mounted on floats. These units were originally developed for use in ponds or lagoons where the
water surface elevation fluctuates, or where a rigid support would be impractical. Surface aerators
may be obtained in sizes from 0.75 to 100 kW (l tol50 hp).

133
Figure 3-25: Typical mechanical aeration: (a)schematic low-speed surface aerator, (b) low –speed surface aerator mounted on fixed platform, (c) schematic high-speed surface aerator, and (d) view of high speed surface aerator in aeration test basin.
Submerged Mechanical Aerators with Vertical Axis
Most surface mechanical aerators are upflow types that rely on violent agitation of the surface and air entrainment for their efficiency.
With submerged mechanical aerators, however, air or pure oxygen may also be introduced by
diffusion into the wastewater beneath the impeller or down flow of radial aerators (see Figure
3-26 a). The impeller is used to disperse the air bubbles and mix the tank contents. A draft tube
may be used with either upflow or downflow models to control the flow pattern of the circulating
liquid within the aeration tank (see Figure 3-26 b). The draft tube is a cylinder, usually with
flared ends, mounted concentrically with the impeller. The length of the draft tube depends upon
the aerator manufacturer. Submerged mechanical aerators may be obtained in sizes from 0.75 to
100 kW (1 to 150 hp).

134
With submerged mechanical aerators, however, air or pure oxygen may also be introduced by
diffusion into the wastewater beneath the impeller or downflow of radial aerators (see Figure
3-26 a). The impeller is used to disperse the air bubbles and mix the tank contents. A draft tube
may be used with either upflow or downflow models to control the flow pattern of the circulating
liquid within the aeration tank (see Figure 3-26 b). The draft tube is a cylinder, usually with
flared ends, mounted concentrically with the impeller. The length of the draft tube depends upon
the aerator manufacturer. Submerged mechanical aerators may be obtained in sizes from 0.75 to
100 kW (1 to 150 hp).
Figure 3-26 Typical submerged mechanical aerators: (a) turbine type with supplementary air or oxygen feed introduced below the turbine, and (b) draft tube turbine aerator equipped with an air sparger.
Mechanical Aerators with Horizontal Axis
Mechanical aerators with horizontal axis are divided into two groups: surface and submerged
aerators. The surface aerator is patterned after the original Kessener brush aerator, a device used
to provide both aeration and circulation in oxidation ditches. The brush-type aerator had a
horizontal cylinder with bristles mounted just above the water surface. The bristles were
submerged in the water and the cylinder was rotated rapidly by an electric motor drive, spraying
wastewater across the tank, promoting circulation, and entraining air in the wastewater. Angle
steel, steel of other shapes, or plastic bars or blades are now used instead of bristles. A typical
horizontal-axis surface aerator is shown on Figure 3-27.

135
Figure 3-27: Horizontal-axis aerators: (a) rotary brush (also known as a Kessener brush), and (b) disk aerators.
Submerged horizontal-axis aerators are similar in principle to surface aerators except disks or
paddles attached to rotating shafts are used to agitate the water. The disk aerator has been used in
numerous applications for channel and oxidation ditch aeration. The disks are submerged in the
wastewater for approximately one-eighth to threeeighths of the diameter and enter the water in a
continuous, nonpulsating manner. Recesses in the disks introduce entrapped air beneath the
surface as the disk turns. Spacing of the disks can vary depending on the oxygen and mixing
requirements of the process. Typical power requirements are reported as 0.1 to 0.75 kW/disk
(0.15 to 1.00 hp/disk) (WPCF, 1988).
3.5.3.3 Trickling filters Trickling filters have been used to provide biological wastewater treatment of municipal and
industrial wastewaters for nearly 100 years. The trickling filter is a nonsubmerged fixed-film
biological reactor using rock or plastic packing over which wastewater is distributed
continuously. Treatment occurs as the liquid flows over the attached biofilm. The depth of the
rock packing ranges from 0.9 to 2.5 m and averages 1.8 m. Rock filter beds are usually circular,
and the liquid wastewater is distributed over the top of the bed by a rotary distributor (see Figure
3-28).

136
Figure 3-28: Typical examples of trickling filters: (a) conventional shallow-depth rock trickling filter, (b) seven-sided trickling filter (older design) with rock replaced by random plastic packing, (c) intermediate-depth trickling filter converted to tower trickling filter, and (d) one of four tower trickling Filters 10 m high and 50 m in diameter with plastic packing.
Many conventional trickling filters using rock as the packing material have been converted to
plastic packing to increase treatment capacity. Virtually all new trickling filters are now
constructed with plastic packing. Trickling filters that use plastic packing have been built in
round, square, and other shapes with depths varying from 4 to 12 m. In addition to the packing.
other components of the trickling filter include a wastewater dosing or application system, an
underdrain, and a structure to contain the packing. The underdrain system is important both for
collecting the trickling filter effluent liquid and as a porous structure through which air can
circulate. The collected liquid is passed to a sedimentation tank where solids are separated from
the treated wastewater. In practice, a portion of the liquid collected in the underdrain system or
the settled effluent is recycled to the trickling filter feed flow, usually to dilute the strength of the

137
incoming wastewater and to maintain enough wetting to keep the biological slime layer moist.
Influent wastewater is normally applied at the top of the packing through distributor arms that
extend across the trickling filter inner diameter and have variable openings to provide a uniform
application rate per unit area. The distributor arms are rotated by the force of the water exiting
through their opening or by the use of electric drives. The electric drive designs provide more
control flexibility and a wider range of distributor rotational speed than possible by te simple
hydraulic designs.
The typical trickling filter process flow diagrams are shown in Figure 3-29.

138
.
PS PST FSTTF
PST FST TF
PST FST FST TF TF
PST TF TF FST
FST TF PST
Bar racks
Grit Chamber
Primary sedimentat
ion
Trickling titers
Settling tank
Chlorine contact
chamber
Screenin
Grit
Sludge
Cl2 or Na OCl
Influent
Waste sludge (Options)
Return effluent
Efflue
Figure 3-29: Typical trickling filter process flow diagrams: (a) single stage and two stages with and without circulation.

139
Trickling filter classification and Applications
Trickling filter applications and loadings for filter designs are summarized in Table
3-22.
Table 3-22: Historical classification of trickling filters applications Design
characteristics
Low or
standard rate
Intermediate
rate
High rate High rate Roughing
Type of packing Rock Rock Rock Plastic Rock/Plastic
Hydraulic loading
(m3/m2.d
1-4 4-10 10-40 10-75 40-200
Organic loading
(kgBOD/m3.d
0.07-0.22 0.24-0.48 0.4-2.4 0.6-3.2 >1.5
Recirculation ratio 0 0-1 1-2 1-2 0-2
Sloughing Intermittent Intermittent Continuous Continuous Continuous
Depth (m) 1.8-2.4 1.8-2.4 1.8-2.4 3-12.2 0.9-6
BOD removal
efficiency (%)
80-90 50-80 50-90 60-90 40-70
Effluent quality Well nitrified Some
nitrification
No
nitrification
No
nitrification
No
nitrification
Power (kW/103
m3
2-4 2-8 6-10 6-10 10-20
3.5.3.3.1 Filter Packing
Where locally available, rock has the advantage of low cost. The most suitable
material is rounded river rock or crushed stone, graded to a uniform size so that 95%
is within the range of 75-100mm. Because of the weight of the packing, the depth of
rock filters is usually on the order of 2m. The low void volume of rock limits the
space available for air flow and increase the potential for plugging the flow short
circuiting. Because of plugging, the organic loading to rock filters is more commonly
in the range of 0.3-1 kgBOD/m3.d. Various forms of plastic packings are shown in
Figure 3-29 also physical properties of trickling filter packing material are listed in
Table 3-23.

140
Table 3-23: Physical properties of trickling filter packing materials
Figure 3-30: Typical packing material for trickling filters: (a) rock, (b) and (c) plastic vertical flow, (d) plastic cross-flow, (e) redwood horizontal, and (f) random pack.
3.5.3.3.2 Distribution systems
A distributor consists of two or more arms that are mounted on a pivot in the center
of the filter and revolve in a horizontal plate (see Figure 3-31).

141
Figure 3-31: Typical distribution used to apply wastewater to trickling filter packing. (a) view of conventional rock filter with two-arm rotary distributor, (b) view of early rock filer with a fixed distribution system and (c) view of top of tower trickling filter with four-arm rotary distributor.
3.5.3.3.3 Process Design considerations
The trickling filters process appears simple, consisting of a bed of packing material
though which wastewater flows and an external clarifier. In reality, a trickling filter
is a very complex system in terms of characteristics of the attached growth and
internal hydrodynamics. In view of these complexities, trickling filters designs are
based mainly on empirical relationships derived from pilot-plant and full-scale plant
experience.
Effluent characteristics
Historically, trickling filters have been considered to have major advantages of using
less energy than activated sludge treatment and being easier to operate, but have
disadvantages of more potential for odors and lower-quality effluent. Some of these
shortcomings, however, have been due more to inadequate ventilation, poor clarifier
design, inadequate protection from cold temperatures, and the dosing operation. With
proper design, trickling filters have been used successfully in a number of
applications. Typical applications, process loadings, and effluent quality are
summarized in Table 3-24.

142
Table 3-24: Trickling filter applications, loadings and effluent quality.
Loading Effluent quality Application
Unit Range Unit Range
Secondary
treatment
Kg BOD/m3.d 0.3-1 BOD (mg/L)
TSS (mg/L)
15-30
15-30
Partial BOD
removal
Kg BOD/m3.d 1.5-4 % BOD removal 40-70
Combined BOD
removal and
nitrification
Kg BOD/m3.d
g TKN /m2.d
0.1-0.3
0.2-1
BOD (mg/L)
NH4-N (mg/L)
<10
<3

143
3.5.3.4 Rotating biological contractors Rotating biological contactors (RBCs) were first installed in West Germany in 1960
and later introduced in the United Stages, Hundreds of RBC installations were
installed in the 1970s and the process has been reviewed in a number of reports
(USA, EPA, 1984, 1985, and 1993); WEF, 1998 and 2000). An RBC consists of a
series of closely spaced circular disks of polystyrene or polyvinyl chloride that are
submerged in wastewater and rotated through it (see Figure 3-32).
Figure 3-32: Typical RBC units: (a) conventional RBC with mechanical drive and optional air input, (b) conventional RBC in enclosed reactor, (c) submerged-type RBC equipped with air caps (air is used both to rotate and to aerate the biodisks), and (d) typical submerged RBC equipped with air capture cups.
The cylindrical plastic disks are attached to a horizontal shaft and are provided at
standard unit sizes of approximately 3.5m in diameter and 7.5m in length. The

144
surface area of the disks for a standard unit is about 9300m2, and a unit with a higher
density of disks is also available with approximately 13,900m2 of surface area.
3.5.3.4.1 Process design considerations
There are mainly similarities between RBC design considerations and those
described for trickling filters. Both systems develop a large biofilm surface area and
rely on mass transfer of oxygen and substrate from the bulk liquid to the biofilm. The
design of and RBC system must include the following considerations: (1) staging of
the RBC units, (2) loading criteria, (3) effluent characteristics and (4) secondary
clarifier design. Typical design information for RBCs is presented in Table 3-25.
Table 3-25: Typical design information for rotating biological contactors.
3.5.3.5 Secondary Clarifier
After an aerobic secondary treatment process, produced flocks have to be removed
by a settling basin. Secondary clarifiers are similar with primary settling tanks but
are suppose to remove created flocks from the treatment process. Typical secondary
clarifiers are either circular with peripheral drive mechanism for sludge collection or
rectangular.

145
Figure 3-33: Typical circular sludge-collection mechanisms: (a) suction-type (left) and (b) spiral-type scraper (right) used commonly in Europe
Rectangular tanks must be proportioned to achieve proper distribution of incoming
flow so that horizontal velocities are not excessive. The maximum length of
rectangular tanks normally should not exceed 10 times the depth, but lengths up to
90m have been used successfully in large plants. Where widths of rectangular tanks
exceed 6 m, multiple sludge collection mechanisms may be used to permit tank
widths up to 24 m, Regardless of tank shape, the sludge collector selected should be
able to meet the following operational conditions: (1) the collector should have
enough capacity so that when a high sludge-recirculation rate is desired, channeling
of the overlying liquid through the sludge will not result, and (2) the mechanism
should be sufficiently rugged to transport and remove very dense sludge that could
accumulate in the settling tank during periods of mechanical breakdown or power
failure.
Two types of sludge collectors are commonly used in rectangular tanks: (1) traveling
flights, and (2) traveling bridges (see Figure 3-34). Traveling flights are similar to
those used for the removal of sludge in primary settling tanks. For very long tanks, it
is desirable to use two sets of chains and flights in tandem with a central hopper to
receive the sludge to minimize the sludge transport distance. Sludge may be collected
at the influent or effluent end of the tank. The traveling bridge, which is similar to a
traveling overhead crane, travels along the sides of the sedimentation tank or on a
support structure if several bridges are used. The bridge serves as the support for the
sludge-removal system, which usually consists of a scraper or a suction manifold

146
from which sludge is pumped. The sludge is discharged to a collection trough that
runs the length of the tank.
Figure 3-34: Typical rectangular sludge collection mechanisms (a) chain and flight and (b) traveling bridge.
Weir placement and loading
When density currents occurs in a secondary clarifier, mixed liquor entering the tank
flows along the tank bottom until it encounters a countercurrent pattern or an end
wall. Unless density currents are considered in the design solids may be discharged
over the effluent weir (Figure 3-35).

147
Figure 3-35: Alternative peripheral baffle arrangements: (a) stamford, (b) unnamed, (c) McKinney and (d) interior trough. Scum removal
In many well-operating secondary plants, very little scum is formed in the secondary
clarifiers. However, occasions arise when some floating material is present
necessitating its removal. Where primary settling tanks are not used, skimming of the
final tanks is essential. Most designs recent years provide scum removal for both
circular and rectangular secondary clarifiers.
Scum should not be returned to the plant headworks because microorganisms
responsible for foaming (typically Nocardia) will be recycled, causing foaming
problems to persist because of continuous seeding of the unwanted microorganisms.
In some plants, scum is discharged to sludge-thickening facilities or is added directly
to digester feed streams, as appropriate.
3.5.4 Secondary treatment, anaerobe
3.5.4.1 Anaerobic treatment
There are many variants of anaerobic reactors in use for treatment of industrial as
well as domestic wastewater. This section presents only the two most widely applied

148
for domestic sewage treatment:
- Anaerobic filter (frequently treating septic tank effluents)
- UASB (upflow anaerobic sludge blanket) reactor.
Initially anaerobic treatment processes in general will be discussed.
The rationale for and interest in the use of anaerobic treatment processes can be
explained by considering the advantages and disadvantages of these processes. The
principal advantages and disadvantages of anaerobic treatment are listed in Table
3-26 as follows:
Table 3-26: Advantages and disadvantages of anaerobic processes compared to aerobic processes
Advantages
Disadvantages
• .Less energy required • .Less biological sludge
production • .Fewer nutrients required • .Methane production, a
potential energy source • .Smaller reactor volume
required • .With acclimation most
organic compounds can be transformed
• .Rapid response to substrate addition after long periods without feeding
• Longer start-up time to develop necessary biomass inventory • .May require alkalinity and/or specific ion addition • .May require further treatment with an aerobic treatment process to meet • discharge requirements • .Biological nitrogen and phosphorus removal is not possible • .Much more sensitive to the adverse effect of lower temperatures on • reaction rates • .May be more susceptible to upsets due to toxic substances • .Potential for production of odors and corrosive gases
Disadvantages of Anaerobic Treatment Processes Operational considerations
The major concerns with anaerobic processes are their longer start-up time (months
for anaerobic versus days for aerobic growth), their sensitivity to possible toxic
compounds, operational stability, the potential for odor production, and
corrosiveness of the digester gas. However, with proper wastewater characterization
and process design these problems can be avoided and/or managed.
Need for alkalinity addition
The most significant negative factor that can affect the economics of anaerobic

149
versus aerobic treatment is the possible need to add alkalinity. Alkalinity
concentrations of 2000 to 3000 mg/L as CaCO3 may be needed in anaerobic
processes to maintain an acceptable pH with the high gas phase CO2 concentration. If
this amount of alkalinity is not available in the influent wastewater or can not be
produced by the degradation of proteins and amino acid, a significant cost may be
incurred to purchase alkalinity, which can affect the overall economics of the
process.
Need for further treatment
Anaerobic processes can also be followed by aerobic processes for effluent polishing
to utilize the benefits of both processes. Series reactors of anaerobic-aerobic
processes have been shown feasible for treating municipal wastewaters in warmer
climates resulting in lower energy requirements and less sludge production
(Goncalves and Avaujo, 1999; Garuti et aI., 1992).
Summary Assessment In general, for municipal wastewaters with lower concentrations of biodegradable
COD, lower temperatures, higher effluent quality needs, and nutrient removal
requirements, aerobic processes are favored at present. For industrial wastewaters
with much higher biodegradable COD concentrations and elevated temperatures,
anaerobic processes may be more economical. In the future, as more is learned about
anaerobic treatment processes, it is anticipated that their use will become more
widespread in a variety of applications.
3.5.4.1.1 General Design considerations for anaerobic treatment processes
The type of wastewater and its characteristics are important in the evaluation and
design of anaerobic processes. The characteristics presented here apply to the
suspended growth, sludge blanket, attached growth, and membrane separation
anaerobic processes. Important factors and wastewater characteristics that need to be
considered in the evaluation of anaerobic processes for wastewater treatment are
discussed below.
Characteristics of the wastewater Anaerobic processes are attractive, especially for high strength and warm
150
temperature wastewaters because: (1) aeration is not required, thus saving energy
cost, and (2) the low amount of solids generated. Food processing and distillery
wastewaters, for example, can have COD concentrations ranging from 3000 to
30,000 mg/L. Other considerations that may apply to different wastewater sources
are the presence of potential toxic streams, flow variations, inorganic concentrations,
and seasonal load variations. Anaerobic processes are capable of responding quickly
to wastewater feed after long periods without substrate addition. In some cases with
warmer climates, anaerobic treatment has also been considered for municipal
wastewater treatment.
Flow and loading variations
Wide variations in influent flow and organic loads can upset the balance between
acid fermentation and methanogenesis in anaerobic processes. For soluble, easily
degradable substrates, such as sugars and soluble starches, the acidogenic reactions
can be much faster at high loadings and may increase the reactor volatile fatty acids
(VFA) and hydrogen concentrations and depress the pH. Higher hydrogen
concentrations can inhibit propionic and butyric acid conversion. The lower pH can
inhibit methanogenesis, a process where organic compounds are degradated to
Methane gas. Flow equalization or additional capacity must be provided to meet peak
flow and loading conditions.
Organic concentration and temperature
The wastewater strength and temperature greatly affect the, economics and feasibility
of anaerobic treatment. Reactor temperatures of 25 to 35°C are generally preferred to
support more optimal biological reaction rates and to provide more stable treatment.
Generally, COD concentrations greater than 1500 to 2000 mg/L are needed to
produce sufficient quantities of methane to heat the wastewater without an external
fuel source. At 1300 mg/L COD or less, air-temperatures have to be high or aerobic
treatment may be the preferred selection.
Anaerobic treatment can be applied at lower temperatures and has been sustained at
10 to 20°C in suspended and attached growth reactors. At the lower temperatures,
slower reaction rates occur and longer SRTs, larger reactor volumes, and lower
organic COD loadings are needed. Further, at temperatures in the range from 10 to
20°C, the degradation of long chain fatty acids is often rate limiting. If long chain

151
fatty acids accumulate, foaming may occur in the reactor. When higher SRTs are
needed, the solids loss in an anaerobic reactor can become a critical limiting factor.
Anaerobic reactors generally produce more dispersed, less flocculent solids than
aerobic systems, with effluent TSS concentrations for suspended growth processes in
the 100 to 200 mg/L range. For dilute wastewaters, the effluent TSS concentration
will limit the possible SRT of the process and treatment potential. Either a lower
treatment performance occurs or it is necessary to operate the reactor at a higher
temperature. Thus, the method used to retain solids in the anaerobic reactor is
important in the overall process design and performance.
Fraction of nondissolved organic material
The composition of the wastewater in terms of its particulate and soluble fractions
affects the type of anaerobic reactor selected and its design. Wastewaters with high
solids concentrations are treated more appropriately in suspended growth reactors
than by upflow or downflow attached growth processes. Where greater conversion of
particulate organic matter is required, longer SRT values may be needed if solids
hydrolysis is the rate-limiting step as compared to acid fermentation or
methanogenesis in anaerobic treatment.
Wastewater alkalinity
With the high CO2 content (typically in the range from 30 to 50 percent) in the gas
produced in anaerobic treatment, alkalinity concentrations in the range from 2000 to
4000 mg/L as CaCO3 are typically required to maintain the pH at or near neutral. The
level of alkalinity needed is seldom available in the influent wastewater, but may be
generated in some cases by the degradation of protein and amino acids (e.g.,
meatpacking wastewaters). The requirement to purchase chemicals for pH control
can have a significant impact on the economics of anaerobic treatment. Nutrients
Anaerobic processes produce less sludge and thus require less nitrogen and
phosphorus for biomass growth. However, sometimes the addition of nitrogen and/or
phosphorus may be needed. Depending on the characteristics of the substrate and the
SRT value, typical nutrient requirements for nitrogen, phosphorus, and sulfur are in
the range from 10 to 13, 2 to 2.6, and 1 to 2 mg per 100 mg of biomass, respectively.

152
The values for nitrogen and phosphorus are consistent with the values for these
constituents estimated on the basis of the composition of the cell biomass. Further, to
maintain maximum methanogenic activity, liquid phase concentrations of nitrogen,
phosphorus, and sulfur on the order of 50, 10, and 5 mg/L, respectively are desirable.
Macronutrients
The importance of trace metals to stimulate methanogenic activity has been noted
and discussed in the literature. The recommended requirements for iron, cobalt,
nickel, and zinc are 0.02, 0.004, 0.003, and 0.02 mg/g acetate produced respectively.
Examples of increased anaerobic activity were noted after trace additions of iron,
nickel, or cobalt. The exact amounts of trace nutrients needed can vary for different
wastewaters, and thus trial approaches are used to assess their benefit for anaerobic
processes with high VFA concentrations. A recommended dose of trace metals per
liter of reactor volume is 1.0 mg FeCl2, 0.1 mg CoCl2, 0.1 mg NiCl2, and 0.1 ZnCI2.
Inorganic and organic toxic compounds
Proper analysis and treatability studies are needed to assure that a chronic toxicity
does not exist for wastewater treated by anaerobic processes. At the same time, the
presence of a toxic substance does not mean the process cannot function. Some toxic
compounds inhibit anaerobic methanogenic reaction rates, but with a high biomass
inventory and low enough loading, the process can be sustained.
Pre-treatment steps may be used to remove the toxic constituents, and, in some cases,
phase separation can prevent toxicity problems by providing for degradation of the
toxic constituents in the acid phase, before exposure of the more sensitive
methanogenic bacteria to the toxic constituents.
Solids retention time
The solids retention time is a fundamental design and operating parameter for all
anaerobic processes. In general, SRT values greater than 20 d are needed for
anaerobic processes at 30°C for effective treatment performance, with much higher
SRT values at lower temperatures.
Expected methane gas production

153
Higher-strength wastewaters will produce a greater amount of methane per volume
of liquid treated to provide a relatively higher amount of energy to raise the liquid
temperature, if needed. The amount of methane (CH4) produced per unit of COD
converted under anaerobic conditions is equal to 0.35 L CH4/g COD at standard
conditions (O°C and 1 atm).
Treatment efficiency needed
Anaerobic treatment processes are capable of high COD conversion efficiency to
methane with minimal biomass production. At SRT values greater than 20 to 50 d,
maximum conversion of solids may occur at temperatures above 25°C. However,
high-effluent suspended solids (50 to 200 mg/L) are common for anaerobic processes.
Without pilotplant studies and extreme measures to control effluent suspended solids
concentrations, such as chemical flocculation or membrane separation, anaerobic
processes alone can not be depended on to achieve secondary treatment levels. Some
form of aerobic treatment would be necessary to provide effluent polishing, either
attached growth or suspended growth processes. For high-strength wastewaters the
combination of anaerobic and aerobic treatment can be economical.
Sulfide production
Oxidized sulfur compounds, such as sulfate, sulfite, and thiosulfate, may be present
in significant concentrations in various industrial wastewaters and to some degree in
municipal wastewaters. These compounds can serve as electron acceptors for
sulphate reducing bacteria, which consume organic compounds in the anaerobic
reactor and produce hydrogen sulfide (H2S).
The amount of COD used for sulfate reduction is 0.89 g COD/g sulfate, which is in
the range of 0.67 g COD/g sulfate reduced. The higher value is due to the lower
biomass yield coefficient associated with methanol oxidation. Based on the following
stoichiometry for H2S oxidation, 2 moles of oxygen are required per mole of H2S, as
was the case for methane oxidation: H2S + 2O2 H2SO4
Thus, the amount of H2S produced per unit COD is the same as that for methane:
(0.40 L H2S/g COD used at 35°C)
Hydrogen sulfide is malodorous and corrosive to metals. Combustion products
formed from sulfur oxidation are considered air pollutants. In contrast to methane,
H2S is highly soluble in water, with a solubility of 2650 mg/L at 35°C, for example.

154
The concentration of oxidized sulfur compounds in the influent wastewater to an
anaerobic treatment process is important, as high concentrations can have a negative
effect on anaerobic treatment. Sulfate-reducing bacteria compete with the
methanogenic bacteria for COD and thus can decrease the amount of methane gas
production. While low concentrations of sulfide (less than 20 mg/L) are needed for
optimal methanogenic activity, higher concentrations can be toxic. Methanogenic
activity has been decreased by 50 percent or more at H2S concentrations ranging
from 50 to 250 mg/L.
Because unionized H2S is considered more toxic than ionized sulfide, pH is
important in determining H2S toxicity. The degree of H2S toxicity is also
complicated by the type of anaerobic biomass present (granular versus dispersed),
the particular methanogenic population, and the feed COD/SO4 ratio. With higher
COD concentrations, more methane gas is produced to dilute the H2S and transfer
more H2S to the gas phase. Hydrogen sulfide exists in aqueous solution as either the
hydrogen sulfide gas (H2S), the ion (HS-), or the sulfide ion (S2-), depending on the
pH of the solution, in accordance with the following equilibrium reactions:
H2S HS - + H+
HS S2- + H+ Dissociation constants for hydrogen sulfide as a function of temperature are
presented in Figure 3-36, at a pH value of 7, at 30°C, about 60 percent of the total
H2S is present as gaseous H2S.
Figure 3-36: Percent of hydrogen sulphide present as H2S and HS- as a function of pH

155
Ammonia Toxicity
Ammonia toxicity may be of concern for anaerobic treatment of wastewaters
containing high concentrations of ammonium or proteins and/or amino acids, which
can be degraded to produce ammonium. Free ammonia (NH3), at high enough
concentrations, is considered toxic to methanogenic bacteria.
The amount of free ammonia is a function of temperature and pH. Dissociation
constants for NH3 is a function of temperature. At a pH of 7.5 and at 30 to 35°C, 2
to 4 percent of the ammonium present will be as free ammonia.
The toxicity threshold for ammonia has been reported to be 100 mg/L as NH4-N,
but with acclimatization time, higher concentrations may be tolerated.
3.5.4.2 Septic tank
The efficiency of a septic tank – anaerobic filter is usually less compared with fully
aerobic systems, although in most situations sufficient. The system has been widely
used for small populations and on side treatment, but there has been a trend in terms
of anaerobic treatment favouring the use of UASB reactors.
Sludge production in anaerobic systems is very low. The excess sludge is already
digested and can go directly to dewatering (in this system, typically by drying beds).
In a two chamber system (see Figure 3-37), wastewater enters the first chamber of
the tank, allowing solids to settle and scum to float. The settled solids are
anaerobically digested reducing the volume of solids. The liquid component flows
through the dividing wall into the second chamber where further settlement takes
place with the excess liquid then draining in a relatively clear condition from the
outlet into the receiving water body or a drain field, or seepage field, depending upon
locality.

156
Figure 3-37: Septic tank
An Imhoff tank is a two-stage septic system where the sludge is digested in a
separate tank. This avoids mixing digested sludge with incoming sewage. Also, some
septic tank designs have a second stage where the effluent from the anaerobic first
stage is aerated before it drains into the seepage field.
3.5.4.3 Upflow anaerobic sludge blanket processes (UASB)
The basic UASB reactor is illustrated on Figure 3-38a. As shown on Figure 3-38a,
influent wastewater is distributed at the bottom of the UASB reactor and travels in an
upflow mode through the sludge blanket. Critical elements of the UASB reactor
design are the influent distribution system, the gas-solids separator, and the effluent
withdrawal design. Modifications to the basic UASB design include adding a settling
tank (see Figure 3-38b) or the use of packing material at the top of the reactor (see
Figure 3-38c). Both modifycations are intended to provide better solids capture in the
system and to prevent the loss of large amounts of the UASB reactor solids due to
process upsets or changes in the UASB sludge blanket characteristics and density.
The use of an external solids capture system to prevent major losses of the system
biomass is recommended strongly. A view of a sludge blanket fixed-film reactor
installation is shown on Figure 3-39.

157
.
The key feature of the UASB process that allows the use of high volumetric COD
loadings compared to other anaerobic processes is the development of a dense
granulated sludge. Because of the granulated sludge floc formation, the solids
concentration can range from 50 to 100 g/L at the bottom of the reactor and 5 to 40
g/L in a more diffuse zone at the top of the UASB sludge blanket. The granulated
sludge particles have a size range of 1.0 to 3.0 mm and result in excellent sludge-
thickening properties with SVI values less than 20 ml/g. Several months may be
required to develop the granulated sludge, and seed is often supplied from other
facilities to accelerate the system startup. Variations in morphology were observed
for anaerobic granulated sludge developed at 30 and 20°C, but both exhibited
similar floc size and settling properties.
The development of granulated sludge solids is affected by the wastewater
characteristics. Granulation is very successful with high carbohydrate or sugar
wastewaters, but less so with wastewaters high in protein, resulting in a more fluffy
floc instead. Other factors affecting the development of granulated solids are pH,
Figure 3-38: Schematic of the UASB process and some modifications: (a) original UASB process, (b) UASB reactor with sedimentation tank and sludge recycle, and (c) UASB reactor with internal packing for fixed-film affected growth, placed above the sludge blanket.
Figure 3-39 View of UASB reactor equipped with internal packing above the sludge blanket. The exterior physical appearance of a UASB reactor without and with internal packing is the same (see Figure 3-38c for location of internal packing).

158
upflow velocity, and nutrient addition. The pH should be maintained near 7.0, and a
recommended COD:N:P ratio during startup is 300:5:1, while a lower ratio can be
used during steady-state operation at 600:5:1. Control of the upflow velocity is
recommended during startup by having it high enough to wash out nonflocculent
sludge.
3.5.4.3.1 Design Considerations for UASB Process
Important design considerations are (1) wastewater characteristics in terms of
composition and solids content, (2) volumetric organic load, (3) upflow velocity, (4)
reactor volume, (5) physical features including the influent distribution system, and
(6) gas collection system.
Wastewater characteristics
Wastewaters that contain substances that can adversely affect the sludge granulation,
cause foaming, or cause scum formation are of concern. Wastewaters with higher
concentrations of proteins and/or fats tend to create more of the above problems. The
fraction of particulate versus soluble COD is important in determining the design
loadings for UASB reactors as well as determining the applicability of the process.
As the fraction of solids in the wastewater increases, the ability to form a dense
granulated sludge decreases. At a certain solids concentration (greater than 6 g
TSS/L) anaerobic digestion and anaerobic contact processes may be more
appropriate.
Volumetric organic loadings
Typical COD loadings as a function of the wastewater strength, fraction of
particulate COD in the wastewater, and TSS concentrations in the effluent are
summarized in Table 3-27. Removal efficiencies of 90 to 95 percent for COD have
been achieved at COD loadings ranging from 12 to 20 kg COD/m³.d on a variety of
wastes at 30 to 35°C with UASB reactors. Values for T for high-strength wastewater
have been as low as 4 to 8 h at these loadings. Where less than 90 percent COD
removal and higher-effluent TSS concentrations are acceptable, higher upflow
velocities can be used, which will develop a more dense granulated sludge by
flushing out other solids. Thus, the higher volumetric COD loadings are shown for

159
this condition. Table 3-27: Recommended volumetric COD loading for UASB reactors at 30°C to achieve 85 to 95 percent COD removal.
Volumetric loading, kg COD/m3.d
COD mg/L
Fraction as particulate
COD
Flocculent sludge
Granular: sludge with
high TSS .removal
Granular sludge with little TSS
removal
0.10-0.30 2-4 2-4 8-12 0.30-0.60 2-4 2-4 8-14
1000-2000
0.60-1.00 No No No 0.10-0.30 3-5 3-5 12-18 0.30-0.60 4-8 2-6 12-24
2000-6000
0.60-1.00 4-8 2-6 No 0.10-0.30 4-6 4-6 15-20 0.30-0.60 5-7 3-7 15-24
6000-9000
0.60-1.00 6-8 3-8 No 0.10-0.30 5-8 4-6 15-24 0.30-0.60 No 3-7 No
9000-18000
0.60-1.00 No 3-7 No
Recommended loadings as a function of temperature for waste waters with mainly
soluble COD are presented in Table 3-28. These loadings apply to the sludge blanket
volume, and a reactor effectiveness factor of 0.8 to 0.9 as discussed below is used to
determine the reactor liquid below the gas collector. The higher loading
recommendation for the wastewater containing mainly volatile fatty acids (VFA) is
based on the potential of obtaining a more dense granulated sludge. Design 'T values
are also given for the treatment of domestic wastewater in Table 3-29 based on pilot-
plant experience. The 'T value needed is longer than that used in aerobic processes
for secondary treatment for BOD removal. In addition, an aerobic polishing step
would likely be needed. The economic benefits of energy savings and lower sludge
production would have to be sufficient to justify the higher capital costs for liquid
treatment with a UASB process.
Upflow Velocity
The upflow velocity, based on the flowrate and reactor area, is a critical design
parameter. Recommended design velocities are shown in Table 3-30. Temporary
peak superficial velocities of 6 m/h and 2 m/h can be allowed for soluble and

160
partially soluble wastewaters, respectively. For weaker wastewaters the allowable
velocity and reactor height will determine the UASB reactor volume, and for
stronger wastewaters it will be determined by the volumetric COD loading. The
upflow velocity is equal to the feed rate divided by the reactor cross-section area: Table 3-28: Recommended volumetric loadings as a function temperature for soluble COD substrates for 85 to 95%COD removal. Average sludge concentration is 25g/L.
Volumetric loading, kg COD /m2.d VFA wastewater Non- VFA wastewater Temperature
(oC) Range Typical Range Typical 15 2-4 3 2-3 2 20 4-6 5 2-4 3 25 6-12 6 4-8 4 30 10-18 12 8-12 10 35 15-24 18 12-18 14 40 20-32 25 15-24 18 Note: kg/m2.d x 62.4280 = Ib/103 ft3.d. Table 3-29: Applicable hydraulic retention for treatment of raw domestic wastewater in a 4-m-high UASB reactor Temp (oC) Average retention time (h) Maximum retention time for
4-6h peak (h) 16-19 10-14 7-9 22-26 7-9 5-7 >26 6-8 4-5 Table 3-30: Upflow velocities and reactor heights recommended for UASB reactors.
Upflow velocity (m/h) Reactor height (m) Wastewater type Range Typical Range Typical COD nearly 100% soluble 1.0-3.0 1.5 6-10 8 COD partially soluble 1.0-1.25 1.0 3-7 6 Domestic wastewater 0.8-1.0 0.7 3-5 5
Reactor volume and dimensions
To determine the required reactor volume and dimensions, the organic loading,
superficial velocity, and effective treatment volume must all be considered. The
effective treatment volume is the volume occupied by the sludge blanket and active
biomass. An additional volume exists between the effective volume and the gas
collection unit where some additional solids separation occurs and the biomass is
dilute.
Physical features
The main physical features requiring careful consideration are the feed inlet, gas
separation, gas collection, and effluent withdrawal. The inlet and gas separation
designs are unique to the UASB reactor. The feed inlet must be designed to provide

161
uniform distribution and to avoid channeling or the formation of dead zones. The
avoidance of channeling is more critical for weaker wastewaters, as there would be
less gas production to help mix the sludge blanket. A number of inlet feed pipes are
used to direct flow to different areas of the bottom of the UASB reactor from a
common feed source. Access must be provided to clean the pipes in the event of
clogging. Guidelines for determining the area served by the individual inlet feed
pipes as a function of the sludge characteristics and organic loading are provided in
Table 3-31. Table 3-31: Guidelines for sizing the area served by inlet feed pipes for UASB reactor. Sludge type COD loading (kg/m3.d) Area per feed inlet (m2)
Dense flocculent sludge
>40kgTSS/m3
<1.0
1-2
>2
0.5-1
1-2
2-3
Medium flocculent sludge 20-
40kgTSS/m3
<1-2
>3
1-2
2-5
Granular sludge 1-2
2-4
>4
0.5-1
0.5-2
>2
Note: kg/m3.d x 62.4280 = Ib/103 ft3.d.
Gas Collection and Solid Separation
The gas solids separator (GSS) is designed to collect the biogas, prevent washout of
solids, encourage separation of gas and solid particles, allow for solids to slide back
into the sludge blanket zone, and help improve effluent solids removal. A series of
upside-down V-shaped baffles is used next to effluent weirs to accomplish the above
objectives. Guidelines for the GSS design are summarized as follow:
• The slope of the settler bottom, i.e., the inclined wall of the gas collector,
should be between 45 and 60°.
• The surface area of the apertures between the gas collectors should not be
smaller than 15 to 20 percent of the total reactor surface area.
• The height of the gas collector should be between 1.5 and 2 m at reactor
heights of 5-7 m.
• A liquid-gas interface should be maintained in the gas collector to facilitate
the release and collection of gas bubbles and to control scum layer formation.
• The overlap of the baffles installed beneath the apertures should be 100 to

162
200 mm to avoid upward-flowing gas bubbles entering the settler
compartment.
• Generally scum layer baffles should be installed in front of the effluent weirs.
• The diameter of the gas exhaust pipes should be sufficient to guarantee the
easy removal of the biogas from the gas collection cap, particularly in the
case where foaming occurs.
• In the upper part of the gas cap, antifoam spray nozzles should be installed in
the case where the treatment of the wastewater is accompanied by heavy
foaming.
The advantages of the UASB process are the high loadings and relatively low
detention times possible for anaerobic treatment and the elimination of the cost of
packing material. Another major advantage with the UASB process is a proven
process with more than 500 full-scale facilities in operation. Limitations of the
process are related to those wastewaters that are high in solids content or where their
nature prevents the development of the dense granular sludge.
3.5.5 Secondary treatment, low rate
3.5.5.1 Waste stabilization ponds
Waste Stabilization ponds (WSP) are the simplest biological process and most
important natural methods for treating wastewater (see Figure 3-40). Waste
stabilization ponds are mainly shallow man-made basins comprising a single or
several series of anaerobic, facultative or maturation ponds Primary treatment takes
place in the anaerobic pond, which is mainly designed for removing suspended
solids, and some of the soluble element of organic matter (BOD5). Due to the high
concentration of the wastewater at the inlet, dissolved oxygen is consumed rapidly
and renders the ponds as anaerobic.
During the secondary stage in the facultative pond most of the remaining BOD5 is
removed through the coordinated activity of algae and heterotrophic bacteria.
The main function of the tertiary treatment in the maturation pond is the removal of
pathogens and nutrients (especially nitrogen). Waste stabilization pond technology is
the most cost-effective wastewater treatment technology for the removal of

163
pathogenic micro-organisms. The treatment is achieved through natural disinfection
mechanisms. It is particularly well suited for tropical and subtropical countries
because the intensity of the sunlight and temperature are key factors for the
efficiency of the removal processes.
Table 3-32 explains the different operations at each type of WSPs and the needed of
maintenance.
Table 3-32: The different operations at each type of WSPs and the needed maintenance. Type of
WSPs
Operations Main objectives Needed maintenance
Anaerobic
ponds
Precipitation and
anaerobic digestion of
organic matter
Partial
treatment of
organic matter
Desludging every 2-5
years when the ponds are
half full.
Removal of plants grown
at each bank of the ponds
Facultative Further precipitation, Further organic Removal of plants grown
Figure 3-40: WSP in Aden, the Republic of Yemen

164
ponds aerobic treatment at the
upper layer, with the
help of algal symbiosis
matter treatment at each bank of the ponds.
Maturation
ponds
More aerobic
environment due to less
organic matter and
more algal growth
Polishing for
organic matter
and pathogen
Removal of plants grown
at each bank of the ponds.
3.5.5.1.1 Anaerobic ponds
These units are the smallest of the series. Commonly they are 2-5 m deep and receive
high organic loads equivalent to100 g BOD5/m³ d. These high organic loads produce
strict anaerobic conditions (no dissolved oxygen) throughout the pond. In general
terms, anaerobic ponds function much like open septic tanks and work extremely
well in warm climates. A properly designed anaerobic pond can achieve around 60%
BOD5 removal at 20° C. One-day hydraulic retention time is sufficient for
wastewater with a BOD5 of up to 300 mg/l and temperatures higher than 20° C.
Designers have always been preoccupied by the possible odour they might cause.
However, odour problems can be minimised in well designed ponds, if the SO42-
concentration in wastewater is less than 500 mg/L. The removal of organic matter in
anaerobic ponds follows the same mechanisms that take place in any anaerobic
reactor.
Design
The design equations are as follows:
Based on wastewater temperature T (°C) in the coldest month of the year, the
advisable loading, L (as gBOD/m3.d) will be as follow (Eq. A1.1):
L= 20T- 100…………………….…………….(Eq. A1.1)
The well-designed anaerobic pond system can achieve up to the value calculated by
Equation A1.2
BOD removal (as %) = 2 T + 20………………(Eq. A1.2)

165
Applying design Equations A1.1 and A1.2 using the wastewater temperature in
January of 20°C
Allowable design load= 300g/m3.d with expected BOD removal of 60%.
The design values and removal efficiency are listed in Table 3-33.
Table 3-33: Design values and removal efficiency based on Temperature
Anaerobic Ponds Design Temp. Retention time BOD reduction
oC Days % 15 4 40 15 5 56 17 5 63 18 5 65 20 5 70
Temperature: should be above 15oC, since gas production becomes very little
below 15oC. as illustrated in fig. 3-34:
Figure 3-41: The Relationship between Temperature and Gas Production in anaerobic ponds. BOD load is constant and about 425 1b/acare-day
3.5.5.1.2 Facultative ponds
These ponds are of two types: primary facultative ponds receive raw wastewater, and
secondary facultative ponds receive the settled wastewater from the first stage
(usually the effluent from anaerobic ponds). Facultative ponds are designed for
BOD5 removal on the basis of a low organic surface load to permit the development

166
of an active algal population. This way, algae generate the oxygen needed to remove
soluble BOD5. Healthy algae populations give water a dark green colour but
occasionally they can turn red or pink due to the presence of purple sulphide-
oxidising photosynthetic activity. This ecological change occurs due to a slight
overload. Thus, the change of colouring in facultative ponds is a qualitative indicator
of an optimally performing removal process. The concentration of algae in an
optimally performing facultative pond depends on organic load and temperature, but
is usually in the range 500 to 2000 μg chlorophyll per liter. The photosynthetic
activity of the algae results in a diurnal variation in the concentration of dissolved
oxygen and pH values. Variables such as wind velocity have an important effect on
the behavior of facultative ponds, as they generate the mixing of the pond liquid. A
good degree of mixing ensures a uniform distribution of BOD5, dissolved oxygen,
bacteria and algae, and hence better wastewater stabilization. A schematic diagram
for the facultative ponds is illustrated in Figure 3-42.

167
evaporation
Nitrogen CO2
Methane
Oxygen Solar radiation
photosynthesis
Influent Effluent
Aerobic treatment
Sludge Anaerobic treatment
Percolation
Figure 3-42: A schematic diagram for Facultative ponds.

168
Facultative ponds are designed for a depth of 1-2m and that would separate it into three zones.
The lower zone is the settleable solid zone, where anaerobic conditions overrule. The surface
zone has liquid in aerobic condition, while the middle one has liquid with facultative bacteria
responsible to oxidize the incoming organic matters.
The Hydraulic retention time for facultative ponds should not be less than 15 days in order to
develop algae in the ponds.
Design
Design can be done with the McGarry and Pescod equation (WHO/EMRO, 1987) (ambient
temp. based equation). Mara later suggested a linear approximation of this equation and
concluded Equation A1.3:
Ls (kgBOD5 /ha.d) = 20 Ta - 60 ………………. (Eq. A1.3)
where:
Ls as maximum allowable surface loading (kgBOD/ha.d; Ta as the minimum of mean monthly
air temperature (°C).
Mara and Middlebrooks equation: Middlebrooks (1987) suggested equation based on applied
surface loading (Eq. A1.4):
La = 10.37+0.725 Ls …………………………….(Eq. A1.4)
where:
Ls and La as the surface BOD load applied and removed (kgBOD/ha.d), respectively.
Gloyna (1976) proposed Eq. A1.5:
V = 3.5* 10-5 Q Lu θ(35-T) ff' ……………………. (Eq. A1.5)
where:
V: as expected volume of pond (s) (m3);
Q: as daily flow entering the ponds (l/d);
Lu: as ultimate influent BOD (BODu or COD);
θ: as temperature reaction coefficient (assumed as 1.085 for facultative ponds treating
sewage comprising domestic and industrial wastewater);

169
T: as wastewater temperature in the ponds (°C);
f: as algal inhibition factor (f=1 for sewage and many industrial wastewaters);
f‘: as sulfide or other intermediate chemical oxygen demand (f ‘=1 for SO42-
concentrations <500mg/l).
Marais suggested the following Equation A1.6 based on the first order decay rate:
Se 1
------ = --------------…………….……………..(Eq. A1.6)
Si [1 + kb.t]n
where:
Se : the filtered BOD of the pond effluent (mg/l);
Si : the filtered BOD of the pond influent (mg/l);
kb : the biological degradation factor (d-1 );
t : hydraulic retention time in ponds (d);
n: number of ponds in series.
In this equation the substrates are only filtered BOD values. So, algal growth (the
concentration of suspended BOD in the form of algal biomass) will not disturb the actual
calculation of the performance. Values for kb ranges 0.10- 0.15d-1 depending on pond
temperature (Arceivala, 1986). At 20oC, kb=0.13d-1.
Marais also used an equation relating effluent BOD5 and pond depth. This equation was
developed for South Africa’s conditions. The equation is as follow (Eq. A1.7)
L= 600/(2d+8)………………………………..(Eq. A1.7)
where:
d: as the depth of the pond (m); L: effluent BOD5 (mg/l).
Solar radiation equation: Arceivala proposed for India Eq. A1.8 for latitude between 8 and
36°N (WHO/EMRO, 1987):
Ls =375-6.25 x lat.………………………………..(Eq. A1.8)
where:

170
Ls: as the admissible surface load (as kgBOD5/ha.d)
Neel et al. (1961) suggested a design ratio between ultimate BOD loading (as kg/ha.d) and
the average solar radiation (Langleys/d) is higher than 0.38 to maintain the dissolved
oxygen in the pond effluent (Arceivala, 1986). Indian experience advised to have the ratio
as 0.42.
Many empirical formulae had been developed for the design of the facultative pond, which
gives the recommended surface loading and/or the BOD removal efficiency.
(a) For surface loading: -
d
Lu =
10 (t
)
BODL
where: Lu = surface loading (kg/hac/day) (ultimate),
d = depth of pond (m),
t = detention time (day),
BODL = ultimate soluble BOD (mg/L) ≈ BOD5 x 1.46
To find the maximum value of L0 , there is 2 empirical formulas:
i) L0 (max) = 20T – 120
Where: T is temperature at 0C
ii) L0 (max) is function of latitude and hence solar radiation as illustrated in the
table Table 3-34: Table 3-34: Surface loading as a function of latitude in facultative ponds.
Latitude Yield of Photosynthetic O2
or Surface Loading Kg/ha/day
8oN 325
12oN 300
16oN 275
20oN 250
24oN 225
28oN 200
32oN 175
36oN 150

171
(b) BOD removal efficiency: -
Ce 1 i-
C0 =
(1 + t x 0.3 x 1.05(T-20))n ]
Where: Ce & C0 are effluent and influent concentration.
Ce 1 ii-
C0 = [
.
1 + Kct ]
n – Marais & Show (complete mix and first
order kinetics)
Marias and show proposed that is the maximum BOD5 concentration of the effluent of the
first pond
700 (Ce)max =
0.6 d + 8
Ce in mg/L of BOD5
d in feet.
V iii-
Q = t = 0.035 (BOD5 mg/L) x 1.099
Gloyana Modified Equation .
Light = Solar radiation, lang leys/day = cal/cm2/day
V = Volume, m3.
Q = Flow Rate, m3/d.
T = Temperature, oC.
Gloyna Equation can be used only for water temperatures range of 5 to 35oC and should
always be used on 1-m depth, the extra 0.5-m is used for sludge storage.
Gloyna also suggests using the average temperature of the pond in the coldest month.
Light (35-T) ( 250 )

172
Ce iv- C0
= e(–Kpt) Plug-flow Model
Ce
4 a e(1/2D) v-
C0
=
(1 + a)2 ea/2D – (1 – a)2 e-a/2D
Wehner-Wilhelm
(c) McGarry and Pescod Areal BOD Removal: for tropical temperature
zones
Lr = 9.23 + 0.725 L0
Where: Lr = areal BOD's removal (Lb/ac/day),
L0 = areal BOD's loading (Lb/ac/day).
Lb/ac/day * 1.1209 = Kg/ha/day.
(d) Areal BOD Removal as a function of BOD loading (fig. 3-36):
Fig. 3.36: Areal BOD removal as a function of BOD loading
3.5.5.1.3 Maturation Ponds
Maturation ponds are used to decrease the faecal coliform bacteria, viruses, protozoa and
helminth eggs.

173
These ponds receive the effluent from a facultative pond and its size and number depend on
the required bacteriological quality of the final effluent. Maturation ponds are shallow (1.0-
1.5 m) and show less vertical stratification, and their entire volume is well oxygenated
throughout the day. A detention time of 18 to 20 days had been suggested as the minimum
period required to provide for complete endogenous respiration of the residual solids. Their
algal population is much more diverse than that of facultative ponds. Thus, the algal diversity
increases from pond to pond along the series. The main removal mechanisms especially of
pathogens and faecal coliforms are ruled by algal activity in synergy with photo-oxidation.
On the other hand, maturation ponds only achieve a small removal of BOD5, but their
contribution to nitrogen and phosphorus removal is more significant. Mara et al. report a total
nitrogen removal of 80% in all waste stabilization pond systems, which in this figure
corresponds to 95% ammonia removal. It should be emphasised that most ammonia and
nitrogen is removed in maturation ponds. However, the total phosphorus removal in WSP
systems is low, usually less than 50%.
Pathogens removal in Ponds
It is found that coliforms is good indicator for the presence of pathogens in
wastewater effluent.
The die-off of pathogens follows the first order reaction:
Se 1
S0 =
1 + Kpt For each pond
Se 1
S0 =
[1 + Kpt]n
For series pond , Complete Mix
the proper value of Kb, is temperature dependent 1.6-2.6:
KbT = Kb2o θT–20 , where: θ = 1.19
3.5.5.1.4 Operation and maintenance
Starting up the system. Once the construction of the system has been completed it should be
checked that all ponds are free of vegetation. This is very important if the waste stabilization
pond is not waterproof. Facultative ponds should be filled prior to anaerobic ponds to avoid
odour release when anaerobic pond effluent discharges into an empty facultative pond.

174
Anaerobic ponds should be filled with raw wastewater and seeded whenever possible with
biosolids from another anaerobic reactor. Later, the anaerobic ponds can be gradually loaded
up to the design’s loading rate. This gradual loading period can be from one to four weeks
depending on the quality of the digester used or in case the pond was not seeded during the
start-up procedure. It is important to measure the pH in the anaerobic pond and maintain it
above 7 to permit the development of the methanogenic bacterial population. During the first
month it may be necessary to add lime, to avoid the acidification of the reactor.
Initially, facultative and maturation ponds should be filled with freshwater from a river, lake
or well, so as to permit the gradual development of the algal and heterotrophic bacterial
population. If freshwater is unavailable, facultative ponds should be filled with raw
wastewater and left for three to four weeks to allow the aforementioned microbial populations
to develop. A small amount of odour release is inevitable during the implementation of the
latter method in the facultative pond.
Routine maintenance
Once the waste stabilization ponds have started to operate, it is necessary to carry out regular
routine maintenance tasks. Although simple, these tasks are essential to the good operation of
the system. Routine maintenance tasks are as follows:
- Removal of screening and grit retained in the inlet works during the preliminary
treatment.
- Cutting, pruning and removing the grass and vegetation that grows on the
embankment to prevent it from falling into the pond and generating the formation of
mosquito breeding habitats. The use of slow-growing grass or vegetation is
recommended to minimise the frequency of this task.
- Removal of floating scum and macrophytes (e.g. Lemna spp.) from facultative and
maturation ponds to maximise photosynthesis and surface re-aeration, and prevent fly
and mosquito breeding.
- Spraying the scum on the surface of anaerobic ponds (which should not be removed as
it aids the treatment process). In the event fly breeding is detected this material should
be sprayed with clean water.
- Removal of any accumulated solids in the pond’s inlets and outlets.
- Repair of any damage to the embankments caused by rodents or other animals.
- Repair of any damage to external fences and gates or points of access to the system.

175
The operator responsible should register these activities in a pond maintenance record sheet.
Usually this operator is also in charge of taking samples and measurements of the pond’s
effluent flow. Monitoring and evaluation activities can be consulted in a specialized
bibliography.
3.5.6 Tertiary treatment The tertiary treatment step is an advanced treatment in order to remove nutrients, pathogenic
organisms, non/biodegradable compounds, metals, inorganic dissolved solids and remaining
suspended solids. There are many different variants which are very costly and difficult to
operate. Outside of Europe and USA this treatment step is hardly practiced, that is why it will
not be further discussed here. For information on tertiary treatment the reference literature can
be used.
3.5.7 Disinfection
Primary, secondary and even tertiary treatment cannot by expected to remove 100 percent of
the incoming waste load and as a result, many organisms still remain in the waste stream. To
prevent the spread of waterborne diseases and also to minimize public health problems,
regulatory agencies may require the destruction of pathogenic organisms in wastewaters.
While most of these microorganisms are not pathogens, pathogens must be assumed to be
potentially present. Thus, whenever wastewater effluents are discharged to receiving waters
which may be used for water supply, swimming or shellfishing, the reduction of bacterial
numbers to minimize health hazards is a very desirable goal.
Disinfection is treatment of the effluent for the destruction of all pathogens. Another term that
is sometimes also used in describing the destruction of microorganisms is sterilization.
Sterilization is the destruction of all microorganisms. While disinfection indicates the
destruction of all disease causing microorganisms, no attempt is made in wastewater treatment
to obtain sterilization. However, disinfection procedures applied to wastewaters will result in
a substantial reduction of all microbes so that bacterial numbers are reduced to a safe level.
In general, disinfection can be achieved by any method that destroys pathogens. A variety of
physical or chemical methods are capable of destroying microorganisms under certain
conditions. Physical methods might include, for example, irradiation with X-rays or
ultraviolet rays. Chemical methods might theoretically include the use of strong acids,
alcohols, or a variety of oxidizing chemicals or surface active agents. The most popular
chemical agent is chlorine because of its relatively easy handling, but also chlorine dioxide,

176
potassium permanganate, chloramines and peroxone, ozone are in use. However, the
treatment of wastewaters for the destruction of pathogens demands the use of practical
measures that can be used economically and efficiently at all times on large quantities of
wastewaters which have been treated to various degrees.
3.6 Sludge treatment and disposal Fadhl please add here the sludge treatment and disposal part from the old reader, it was good!
3.7 References and further readings
Metcalf & Eddy; 2003, Wastewater Engineering-Treatment and Reuse, McGraw-Hill, International Edition Sperling M. von, Lemos Chernicharo C.A. de; 2005, Biological Wastewater Treatment in Warm Climate Regions, IWA Publishing (2005) Madigan M.T. et al., 2003, Brock-Biology of Microorganisms, Pearson Education (2003) Buuren J. van, Lier J. van; 2007, Urban Environmental Infrastructure in Transition, Reader ETE-31306, Wageningen University www.fao.org www.who.org
http://openlearn.open.ac.uk/rss/file.php/stdfeed/2457/formats/T210_1_rss.xml
http://www.irc.nl/page/8237
http://www.fao.org/docrep/t0541e/T0541E08.htm
http://www.unep.or.jp/ietc/Publications/TechPublications/TechPub-15/main_index.asp
4 Wastewater collection system Fadhl please add here the sewage system part from the old reader.