water application for dust control in the central plateau
TRANSCRIPT

PNNL- 28061 DVZ-RPT-0008 Rev 0
Prepared for the U.S. Department of Energy under Contract DE-AC05-76RL01830
Water Application for Dust Control in the Central Plateau: Impacts, Alternatives, and Work Strategies
September 2018 CMR Yonkofski D Appriou X Song JL Downs CD Johnson VC Milbrath


PNNL- 28061 DVZ-RPT-0008 Rev 0
Water Application for Dust Control in the Central Plateau: Impacts, Alternatives, and Work Strategies
September 2018 CMR Yonkofski D Appriou X Song JL Downs CD Johnson VC Milbrath Prepared for the U.S. Department of Energy under Contract DE-AC05-76RL01830 Pacific Northwest National Laboratory Richland, Washington 99352
ii
Executive Summary
Dust control is needed during many activities at the Hanford Site for health and safety purposes and to prevent contaminant dispersal via atmospheric transport. Spraying of water is the baseline approach at the Hanford Site for dust control in most applications, including use during excavation activities, on roadways and disturbed areas, for facility demolition, and during construction activities. Use of water at or near waste sites may introduce infiltration to the subsurface. As such, the recharge rate (hydraulic driving force) through the vadose zone and to the groundwater may be increased by an extent related to the duration and amount of water applied. An increased recharge rate can increase contaminant fluxes toward the groundwater and potentially induce lateral movement depending on the magnitude of the recharge rate. Thus, dust suppression via water spray is of potential concern for contaminants in the vadose zone. Because Hanford remediation work is transitioning from the River Corridor to efforts on the Central Plateau where there is a significant inventory of contaminants in the vadose zone, dust suppression approaches for these efforts will need to understand the potential negative effects of water addition.
Observations of negative impacts of water application for dust suppression in several previous remediation actions provides context for the need to evaluate potential impacts for the Hanford Central Plateau. For instance, during and after excavation of the 100-C-7 waste site in the River Corridor, a spike in groundwater hexavalent chromium concentrations down gradient of the site were observed (U.S. DOE 2017a). This large excavation removed soils from the surface down to the water table such that impacts of dust suppression water on hexavalent chromium migration had a near-term impact on the groundwater. A similar increase in groundwater uranium concentration was potentially attributable to initial remediation activities for the 316-4 burial ground (PRC-PRO-SMP-53095), which also has a relatively thin vadose zone. Planning for potential dust suppression impacts to groundwater has been applied for some remediation activities (e.g., ECF-300FF5-17-0019, Rev. 00), demonstrating the importance of quantifying the relationship between added water and potential groundwater impacts.
Currently, no control measures are in place regarding the amount of water applied for dust suppression during surface remediation activities in the Central Plateau. A recent modeling study began an investigation into how infiltration of this water may provide a hydraulic driving force beneath the remediation zone (Zhang 2017); however, the magnitude of these driving forces with respect to mobilizing contaminants beneath the zone of application still needed to be fully characterized. Because use of water for dust suppression is a standard practice for surface remediation and is important for worker health and safety, this evaluation was needed to examine the potential magnitude of negative impacts, identify alternatives, and develop information suitable for consideration in feasibility studies. This evaluation specifically provides guidance to 1) identify potential dust generative activities on site, 2) assess potential subsurface contaminant mobilization from dust suppression water, 3) set bounds on water addition related to the magnitude of negative effects specific to the Central Plateau, and 4) evaluate potential alternative methods for dust control. Based on these results, candidate alternative methods of dust suppression are summarized here as well. This comprehensive report is intended to be used as a resource during dust suppression remedy selection and design in the Central Plateau.
A case study presented here used three-dimensional numerical modeling of the vadose zone to evaluate changes in moisture and solute movement induced by addition of water at the surface. An ensemble of scenarios, including configurations built to capture the subsurface hydrology that is representative of Hanford Central Plateau conditions, were used with a wide variation in the amount and rate water of addition to simulate potential effects of dust suppression water. Simulation results were interpreted to

iii
define thresholds for water addition, above which contaminant migration in the subsurface could result in an increased flux of contaminants into the groundwater. Results showed that every instance of water application led to increased contaminant flux with concentrations above the Federal Drinking Water Standard. This case study highlighted an urgent need for reduction in water usage for dust suppression. Recommended application thresholds were determined to be 2 mm/day or the equivalent volume of water over a 5-year period. The caveat to that recommendation is the assumption that water application is occurring over a reasonable amount of time. For instance, 2 mm/day for 5 years is equivalent to roughly 83 truckloads (1 truckload ≅ 4,000 gallons) of water total within the study area. It would be unreasonable to apply all of this water over the course of one day. It is recommended that this volume be used to provide a water application limit of 1 truckload per day to an equivalent area (345 m2) over 83 days, or a roughly 4 month work period with weekends excluded.
In response to modeled results, a dust suppression evaluation focused on methods to control “fugitive” dust emissions, or dust generated from open sources/surfaces while reducing water use. Dust control methods were evaluated specific to activities in the Hanford Central Plateau, though the information may also be applicable to activities in the Hanford River Corridor and/or other DOE sites. Given the nature of work performed during remediation, general construction, and site operations at Hanford, four categories of activities with the potential for generating fugitive dust were identified and evaluated:
1. Excavation 2. Stockpiles 3. Vehicle Movement on Unpaved Roads 4. General Construction and Other Surface-Disturbing Activities
Prior to implementing any new actions pertaining to dust control, it is essential to characterize both the nature of the dust generating activity and the site conditions in order to implement the most relevant combination of control methods. Applicable dust control methods were categorized as proactive measures, or work strategies (e.g., work scheduling, minimizing disturbed areas, limiting vehicle speed, limiting stockpile height, etc.) to mitigate the amount of dust generated, and reactive measures, or engineered controls (e.g., enclosures, mechanical stabilization, palliatives, etc.), which are enacted in response to fugitive dust. Application of dust palliatives like water may be the most prevalent approach but is not the only response for dust control and should always be considered as a complementary solution, which comes after or while appropriate proactive work strategies have been implemented. As an example, fluid application rates and scheduling should be recorded to manage infiltration of dust suppressant products into the subsurface and avoid or mitigate mobilization of contamination into water resources. While no dust control method alone or in combination will be appropriate in all circumstances, enclosure systems and foam sprays are the most promising dust control methods which minimize water use through dust generation prevention.

iv
Acknowledgments
This document was prepared by the Deep Vadose Zone − Applied Field Research Initiative at Pacific Northwest National Laboratory. Funding for this work was provided by the U.S. Department of Energy (DOE) Richland Operations Office. The Pacific Northwest National Laboratory is operated by Battelle Memorial Institute for the DOE under Contract DE-AC05-76RL01830.

v
Acronyms and Abbreviations
BCAA Benton County Clean Air Agency
BOD biochemical oxygen demand
BMP Best Management Practices
CMS cement-modified soil
DOE U. S. Department of Energy
DOH Department of Health
ERDF Environmental Restoration Disposal Facility
EPA U.S. Environmental Protection Agency
FCAA Federal Clean Air Act
PAH polycyclic aromatic hydrocarbons
PM particulate matter
NQAP Nuclear Quality Assurance Program
PIC PNNL Institutional Computing
PNNL Pacific Northwest National Laboratory
RTD removal, treatment, and disposal
UCPRC University of California Pavement Research Center
VOC volatile organic compound
WCAA Washington Clear Air Act
WIPP Waste Isolation Pilot Plant
WTP Hanford Tank Waste Treatment and Immobilization Plant

vi
Contents
Executive Summary ...................................................................................................................................... ii
Acknowledgments ........................................................................................................................................ iv
Acronyms and Abbreviations ....................................................................................................................... v
1.0 Introduction ....................................................................................................................................... 1.1
1.1 Scope and Objectives ................................................................................................................ 1.5
2.0 Central Plateau Context ..................................................................................................................... 2.1
2.1 Potential Dust-Generating Activities......................................................................................... 2.2
2.1.1 Excavation ...................................................................................................................... 2.4
2.1.2 Stockpiles ....................................................................................................................... 2.5
2.1.3 Traffic on Unpaved Roads and Materials Transportation .............................................. 2.5
2.1.4 General Construction and Other Surface-Disturbing Activities ..................................... 2.5
2.2 Regulations and Requirements .................................................................................................. 2.6
3.0 Impacts to Contaminant Mobilization ............................................................................................... 3.1
3.1 Modeled Scenarios .................................................................................................................... 3.1
3.1.1 Hydrogeologic Uncertainty ............................................................................................ 3.3
3.1.2 Water Application Volume and Rates ............................................................................ 3.4
3.1.3 Numerical Simulator ...................................................................................................... 3.4
3.2 Simulation Results .................................................................................................................... 3.4
4.0 Dust Control Method Evaluation ....................................................................................................... 4.1
4.1 Dust Suppressants ..................................................................................................................... 4.5
4.1.1 Categories of Dust Suppressants .................................................................................... 4.5
4.1.2 Application Methods .................................................................................................... 4.10
5.0 Dust Control Recommendations for Central Plateau Activities ........................................................ 5.1
5.1 Site/Environmental Considerations ........................................................................................... 5.1
5.2 Dust Control Relevant to Central Plateau Work ....................................................................... 5.1
5.2.1 Active and Inactive Excavation Sites ............................................................................. 5.2
5.2.2 Active and Inactive Stockpile......................................................................................... 5.3
5.2.3 Traffic on Unpaved Roads ............................................................................................. 5.4
5.2.4 General Construction and Other Surface-Disturbing Activities ..................................... 5.4
5.3 Relative Cost of Dust Control Measures ................................................................................... 5.7
5.4 Elements of a Dust Control Plan ............................................................................................... 5.8
6.0 Conclusions ....................................................................................................................................... 6.1
7.0 Quality Assurance .............................................................................................................................. 7.1
8.0 References ......................................................................................................................................... 8.1
Appendix A ............................................................................................................................................... A.1

vii
Figures
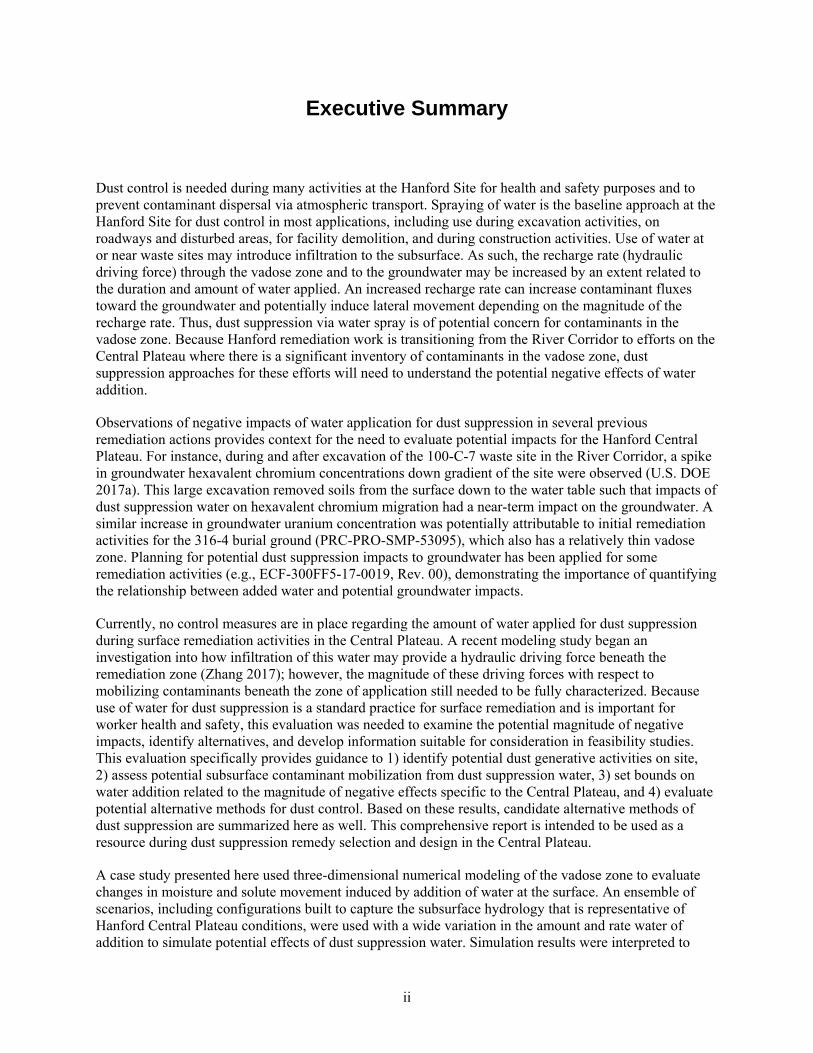
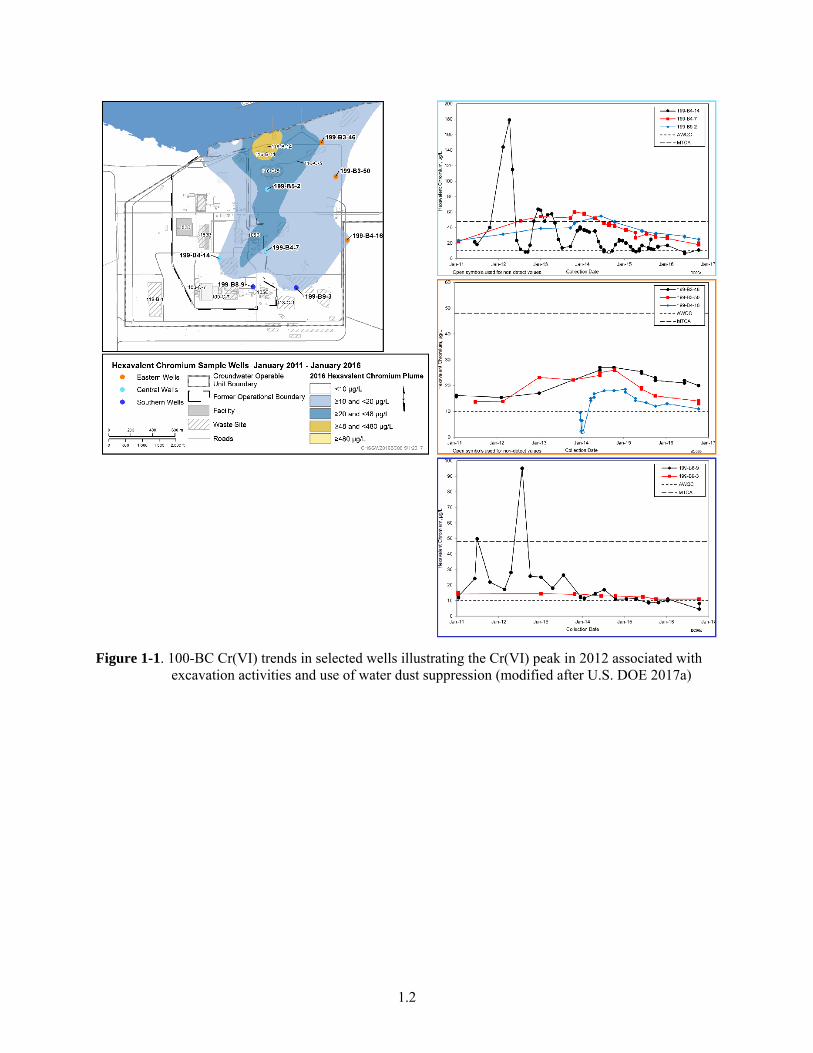
Figure 1-1. 100-BC Cr(VI) trends in selected wells illustrating the Cr(VI) peak in 2012 associated with excavation activities and use of water dust suppression (modified after U.S. DOE 2017a) .............. 1.2
Figure 1-2. Uranium concentration observed in four wells located in the 300 Area illustrating increase in uranium concentration attributed to the use of dust water control (from U.S. DOE 2017a) ............. 1.3
Figure 1-3. Hanford Site showing the 100 Areas and the Central Plateau (from U.S. DOE 2017a) ......... 1.4
Figure 1-4. Examples of water applications to control fugitive dust at Hanford. a) Water truck applying water to ground surface at 100K b) Water truck with canon spraying water at excavator c) Water canon used for dust suppression at 618-10 Burial Ground d) Hose end sprayer used to apply water for dust control for 200W Groundwater Treatment Project (https://www.hanford.gov/c.cfm/photogallery/tags.cfm/200%20Area/2) ......................................... 1.5
Figure 2-1. Conceptual diagram of contaminant sources and flow pathways through the vadose zone into the groundwater. Reproduced from Hartman et al. (2003). ............................................................... 2.1
Figure 2-2. Major Contaminant Plumes in the Central Plateau (adapted from U.S. DOE/RL 2017a) ...... 2.2
Figure 3-1. Aqueous and solute distributions below the S7 Crib (pink rectangle) on Jan. 1, 2018. The Cold Creek silt (CCUz) confining unit is specified. a) Aqueous saturations b) Contaminant concentrations .................................................................................................................................... 3.3
Figure 3-2. Mean contaminant concentration entering the water table below the application area (Case S7_M), a) contaminant flux of kd=0 cm3/g case, b) Contaminant flux of kd=0.1 cm3/g case. ........... 3.5
Figure 3-3. Aqueous and solute distributions on Jan. 1, 2023, at the end of the 5 year, 100 mm/day water application period. a) Aqueous saturation b) Contaminant concentration ......................................... 3.6
Figure 3-4. The peak of mean contaminant concentration entering the water table below the water application area. ................................................................................................................................. 3.7
Figure 3-5. The peak contaminant flux entering the aquifer below the water application area. ................ 3.8
Figure 3-6. Predicted saturation in the soil below the S7 Crib on Jan. 1, 2023, post water application period. a) 2 mm/day water application rate b) 50 mm/day water application rate ............................. 3.8
Figure 4-1. Comparison of seasonal application volumes. Relative magnitudes based on upper estimates of typical application rates. .............................................................................................................. 4.12
viii
Tables
Table 3-1. Best estimate physical and hydraulic properties for the sediment classes at the S7 site Zhang (2017). ................................................................................................................................................ 3.2
Table 3-2. CCUz Hydraulic Conductivity and Porosity values of S7 Crib ................................................ 3.4
Table 4-1. Key Guidance and Research Findings Regarding Dust Control Technologies ........................ 4.2
Table 4-2. Dust Control Methods .............................................................................................................. 4.3
Table 4-3. Performance and Limitations of Dust Suppressants ................................................................. 4.7
Table 4-4. Potential Environmental Impacts for Categories of Dust Suppressants ................................. 4.14
Table 5-1. Considerations influencing the selection of a dust control strategy ......................................... 5.1
Table 5-2. Applicability of Dust Control Measures for Central Plateau Activities ................................... 5.6
Table 5-3. Relative Effectiveness and Cost of Dust Control Measures ..................................................... 5.7

1.1
1.0 Introduction
Remediation and decommissioning activities are ongoing at the U.S. Department of Energy’s (DOE) Hanford Site (Figure 1-3) to address facilities and waste sites stemming from historical plutonium production operations. Environmental restoration activities take place primarily in the River Corridor (100, 300, and 1100 Areas) and in the Central Plateau (200 West and 200 East Areas). During remediation and decommissioning activities, such as excavation or building demolition, particulate matter (PM), may be mobilized into the air. Thus, dust control/abatement techniques are necessary to protect workers and the public from potential exposure to the resultant “fugitive” dust emissions which may be contaminated or inert. Here, “fugitive” dust emissions, are PM generated from open sources/surfaces, that becomes airborne via wind erosion or mechanical disturbance, in contrast with material discharged to the atmosphere from a controlled process stream, such as a smokestack.
Water sourced from the Columbia River is commonly sprayed to mitigate dust generation in contaminated work areas (e.g. waste disposal sites) as well as ancillary work areas (e.g., laydown areas, temporary parking lots, or temporary roadways) that are associated with remediation, but where contamination is not expected to be present. (Figure 1-4). The typical approach on site is to apply a sufficient amount of water to avoid visible dust. This practice may prove to be problematic specifically in the Central Plateau, as subsequent infiltration of dust suppressant water into the subsurface may facilitate mobilization of vadose zone contaminants of concern, potentially increasing the flux of contaminant migration into groundwater (U.S. DOE 2017a; Zhang 2017). For instance, a peak of hexavalent chromium was observed in 2012 in several monitoring wells (Figure 1-1) and was attributed to the remedial operations occurring at the 100-C-7 waste site in the River Corridor, remediated in 2011 and 2012 (U.S. DOE, 2017a). In order to remove hexavalent chromium, the major contaminant of the 100-C-7 waste site, a massive excavation was designed and performed. Approximately 2.3 million tons of clean and contaminated soils, and other debris were removed from the site. In order to complete this action, the waste site was dug to a depth of 85 feet, from the surface down to the water table. During the excavation operations, fugitive dust emissions were controlled using water, which lead to the migration of hexavalent chromium to the groundwater. A similar pattern in groundwater uranium concentration was observed in two wells located near the southeastern line of the 618-10 Burial Ground and the 316-4 Crib (699-S6-E4A and 699-S6-E4L, Figure 1-2). The first peak in uranium concentration was observed in these wells in 2004 and was attributed to the infiltration of dust control water applied during the 315-4 Crib excavation and backfilling activities. The second increase in uranium concentration occurred from 2012 through 2014 and is associated to the infiltration of dust control water during removal actions at the 618-10 Burial Ground (U.S. DOE, 2017a). These are two direct examples that demonstrate the importance of quantifying the relationship between added water and potential groundwater impacts, and that emphasized the need to evaluate alternative approaches to water application to control dust emissions.
1.2
Figure 1-1. 100-BC Cr(VI) trends in selected wells illustrating the Cr(VI) peak in 2012 associated with excavation activities and use of water dust suppression (modified after U.S. DOE 2017a)

1.3
Figure 1-2. Uranium concentration observed in four wells located in the 300 Area illustrating increase in uranium concentration attributed to the use of dust water control (from U.S. DOE 2017a)

1.4
Figure 1-3. Hanford Site showing the 100 Areas and the Central Plateau (from U.S. DOE 2017a)

1.5
Figure 1-4. Examples of water applications to control fugitive dust at Hanford. a) Water truck applying water to ground surface at 100K b) Water truck with canon spraying water at excavator c) Water canon used for dust suppression at 618-10 Burial Ground d) Hose end sprayer used to apply water for dust control for 200W Groundwater Treatment Project (https://www.hanford.gov/c.cfm/photogallery/tags.cfm/200%20Area/2)
1.1 Scope and Objectives
Currently, no control measures are in place for dust suppression water applied during surface remediation activities in the Central Plateau. A 2017 modeling study began an investigation into how infiltration of this water may provide a hydraulic driving force beneath the remediation zone (Zhang 2017); however, the magnitude of these driving forces with respect to mobilizing contaminants beneath the zone of application still needed to be fully characterized. Because use of water for dust suppression is a standard practice for surface remediation and is important for worker health and safety, this evaluation was needed to examine the potential magnitude of negative impacts, identify alternatives, and develop information suitable for consideration of these effects and costs in feasibility studies. This evaluation specifically provides guidance to 1) consider potential contaminant mobilization from dust suppression water, 2) set bounds on water addition related to the magnitude of negative effects, 3) evaluate potential alternative methods for dust suppression, and 4) evaluate the need for surface water control to avoid contaminant mobilization issues. The magnitude and drivers for dust suppression issues were evaluated and quantified using numerical simulations which build on the Hanford Site modeling study of FY17 (Zhang 2017). Based on these results, candidate alternative methods of dust suppression are summarized here as well. This comprehensive report may be used as a resource during dust suppression remedy selection and design in the Central Plateau.

1.6
Section 2.0 introduces the Hanford Central Plateau context, regulatory setting, and dust-generating activities at the Site. Section 3.0 presents a modeling case study which quantifies the impacts of water application to subsurface contaminant transport in the Central Plateau. Section 4.0 describes dust control methods and technologies, with a focus on categories of dust suppressants and their potential environmental impacts. Section 5.0 discusses elements of and key considerations for implementing a dust control strategy for Hanford-related activities. Appendix A provides background on the nature of dust and descriptions of dust suppressants and dust control approaches in general.

2.1
2.0 Central Plateau Context
The 75-square-mile Central Plateau region at the Hanford Site includes the 200 Areas (a National Priorities List site; U.S. Environmental Protection Agency (EPA) site number WA1890090078), Environmental Restoration Disposal Facility (ERDF), the Hanford Tank Waste Treatment and Immobilization Plant (WTP) construction site, and surrounding lands. Cleanup of the Central Plateau is a highly complex effort because of the large number of waste sites, surplus facilities, active treatment and disposal facilities, and areas of deep soil contamination resulting from historical chemical processing operations that occurred beginning in 1945. Numerous cleanup projects and remediation efforts involving both solid and liquid wastes are underway. Hundreds of solid waste sites are located in the 200 Areas where waste-filled containers (e.g., drums, boxes) or other waste materials were buried during historical Hanford operations. In the past, planned releases of process liquid wastes and waste water to the soil were made via discharge to engineered structures (cribs, trenches, ditches, ponds, leach fields, or injection wells) (Truex et al. 2015). Contaminant discharges to the subsurface also occurred during unplanned releases from tanks, pipelines, or other facilities. These planned and unplanned releases led to contaminant migration through the thick (up to 100 m) vadose zone and contamination of the groundwater beneath the Central Plateau (Figure 2-1 and Figure 2-2). As a result, water currently applied to sites in the Central Plateau as part of ongoing dust suppression activities could potentially infiltrate into the subsurface, accelerating contaminant migration through the vadose zone into the groundwater and, ultimately, into the Columbia River.
Figure 2-1. Conceptual diagram of contaminant sources and flow pathways through the vadose zone into the groundwater. Reproduced from Hartman et al. (2003).

2.2
Figure 2-2. Major Contaminant Plumes in the Central Plateau (adapted from U.S. DOE/RL 2017a)
The climatological and ecological setting for the Central Plateau is a semi-arid shrub-steppe ecosystem with hot, dry summers and cold, wet winters (Easterly et al. 2017). The semi-arid climate presents a number of dust control challenges. Soil moisture at the surface is relatively low throughout much of the late spring, summer, and early fall, and the dry soil conditions increase the susceptibility of disturbed soils to wind erosion. Winds at Hanford typically average between 7 and 8 mph and wind gusts over 25 mph are common (43% of year) (Hoitink et al. 2005). The shrub-steppe landscape is water-limited, with an average of 7 in/yr (177 mm/yr) precipitation and natural recharge rates varying up to 4 in/yr (100 mm/yr) depending on land cover (Hoitink et al. 2005; Truex et al., 2015). These conditions lead to relatively sparse and short vegetation (< 2 m height) compared to wetter environments (Hoitink et al. 2005). The biological soil crust (e.g. mosses, lichens, and algae that typically act to stabilize the soil surface in undisturbed communities and minimize water and wind erosion) is fragile and does not readily re-establish after soil disturbance. Due to limited water and low-density vegetation cover, Hanford soils tend to be particularly susceptible to wind erosion and fugitive dust emission.
2.1 Potential Dust-Generating Activities
Remediation, construction, demolition, and site operations activities performed in the Central Plateau area all have the potential to generate fugitive dust emissions. The degree of dust generation, and the nature of suitable dust control, is a factor of the type and duration of the activity (with potential periods of

2.3
inactivity), and the weather conditions (temperature, moisture, wind). Typical site activities that may be sources of fugitive dust are described in this section.
Several remedial actions alternatives were evaluated to mitigate risks posed by waste sites at the Central Plateau (U.S. DOE, 2009). The preferred alternatives evaluated in the feasibility study related to the 200-CW-5, 200-PW-1, 200-POW-3, and 200-PW-6 Operable Units include the following:
Maintaining and enhancing existing soil cover—contamination is left in place and long-term monitoring is conducted to assure that the contamination is contained;
Engineered surface barrier—construction of an engineered surface barrier over the waste site to create a separation between the contaminated soil and the ground surface;
Removal, Treatment and Disposal (RTD)—removal of a portion of the contaminated soil, sludge, and/or debris, followed by treatment and disposal of the waste;
Combination of the above alternatives;
In situ vitrification (not within the scope of this report).
Based on the feasibility study, the preferred alternatives generally are a combination of RTD activities along with implementation of a surface barrier. All these remedial actions can involve working with both contaminated and uncontaminated soils and materials in a variety of activities where dust may be generated. RTD of contaminated soils, subsurface structures, and debris comprise a large portion of the ongoing remediation efforts for Central Plateau waste sites. RTD entails (1) excavating and removing contaminated soil, structures, and debris, (2) treating these removed wastes to meet disposal requirements for ERDF or to meet waste acceptance criteria for off-site disposal at the Waste Isolation Pilot Plant (WIPP), and (3) shipment or transport of materials for disposal at ERDF or WIPP. Excavation work at a waste site includes removal of contaminated material, backfilling the excavated zone with clean material (materials excavated onsite and potentially stored in stockpiles), and revegetation of the ground surface.
Dusts that contain contaminants pose significant health and environmental risks if not controlled. It may be assumed that the contaminant concentration of dust at a site is equivalent to the contaminant concentration of soil at a site. However, smaller particles (such as those more likely to become airborne as dust) tend to adsorb more contaminants than larger particles, due to their greater proportional surface area (Mattigod and Martin 2001; Abouelnasr 2010). Depending on the soil moisture, the type of contaminants and the soil type, contaminant concentration in dusts could potentially exceed contaminant concentrations in soils. When contaminated materials are involved, controlling air dispersal presents an additional issue to be considered when selecting dust control measures. It is important to distinguish between dust control measures implemented to mitigate uncontaminated dusts generated by movement of equipment and materials handling, and dust control measures needed to mitigate dusts generated by remediation of contaminated sites or occurring on contaminated areas.
It should be noted that gaseous species, including volatilized contaminants (VCs) are not part of the scope of this evaluation. Depending on the location and type of remediation activities performed at the Central Plateau, PM, or dust emissions, may or may not be associated with contaminants and therefore may not necessarily require the same dust control measures.
Although dust control measures should be implemented to prevent dust emissions from vehicle movement and/or materials handling, the amount of water applied may not be a concern, depending on the remediation activity, if contaminants are not present. Site operations include various day-to-day activities such as maintenance, monitoring, waste management and storage, aboveground treatment, chemical analysis, security, and fire protection (U.S. DOE 2017b). Many site operations do not generate dust;

2.4
however, some of the site operation activities may include vehicle travel on unpaved roads (for remediation/waste monitoring, maintenance, security, etc.) and landscaping (e.g., grading/vegetation removal for fire protection).
Given the nature of work performed during remediation, general construction, and site operations at Hanford, four categories of activities with the potential for generating fugitive dust were identified and discussed in the following sections:
1. Excavation
2. Stockpiles
3. Vehicle Movement on Unpaved Roads
4. General Construction and Other Surface-Disturbing Activities
Dust control technologies and approaches are discussed in terms of applicability to these general categories of dust-generating activities.
2.1.1 Excavation
The excavation category of dust-generating activities pertains to remediation and quarrying/borrow pit work (construction-related work is discussed in Section 2.1.4). As noted, cleanup activities on the Hanford Site often involve excavation as part of RTD actions, as well as excavation to provide clean material for backfilling the waste site excavation. Excavation involves clearing the land surface in preparation, digging up contaminated materials (e.g., soil, drums/boxes, or structures) or quarrying sand/gravel for clean backfill material, and moving/dumping/unloading soil. Depending on the size and depth of the excavation, the site may include a layback area for side slope stabilization and access roads into the excavation pit. Excavation is usually accomplished using earthmoving equipment such as excavators, loaders, bulldozers, graders, scrapers, and dump trucks. Removal of contaminated material, loading/transfer of excavated material to shipping containers or trucks for transport, and vehicle movement on the remediation site are all activities that can generate dust. Backfill sand and gravel material are excavated from onsite pits or borrow areas (U.S. DOE 2013a) and entails dust-generating activities of excavation, loading, and unloading.
Potential dust emissions associated with excavation activities include windborne dust emissions from cleared areas surrounding the excavation and the exposed soils in the excavation pit, as well as from vehicle movement and loading/unloading material. The degree of dust generation will depend on excavating equipment, soil moisture, particle size, wind conditions in the context of the surface/excavation pit topography, work practices (e.g., vehicle speed, drop height, equipment size, etc.), and amount of site activity.
Controlling the air dispersal from excavation of contaminated area, where the hazardous level is likely to be the highest, is a fundamental challenge at Central Plateau. Soil particles from contaminated surfaces can be entrained into the air, transported by the wind and may potentially result in humane exposure by direct inhalation or indirect ingestion. The implementation of dust control methods on contaminated areas required then significantly more attention.

2.5
2.1.2 Stockpiles
Material excavated from onsite borrow areas (U.S. DOE 2013a) or waste site excavations may be managed in stockpiles for temporary or long-term storage of soils or quarried sand, gravel, and rock as part of RTD, construction, or maintenance operations (including topsoil stockpiles for revegetation activities) conducted in the Central Plateau. Fugitive dust can be emitted from stockpiles when working on the active face of the pile (depositing material or withdrawing material for loading) or when winds blow across the stockpile. The degree of dust generation from stockpiles depends on the stockpile material moisture content, material particle size, stockpile height, exposure to wind, surface roughness of the stockpile, and the frequency of disturbance of the stockpile. Dust emissions rate from a stockpile is likely to be higher than that for the original in-place materials as it has been recently disturbed. If contaminated soil or materials is staged on-site in stockpiles prior to treatment or disposal, emissions of hazardous materials can occur, leading to additional contaminant control issues.
2.1.3 Traffic on Unpaved Roads and Materials Transportation
As of 2013, the Hanford site had a maintained road system that included 122 miles of unpaved road (U.S. DOE 2013b), which are traversed by security/fire protection vehicles, traffic related to remediation efforts, vehicles engaged in field monitoring or maintenance activities, etc. Transport of bulk borrow-area materials is needed for waste site backfill and other onsite construction and maintenance.
Vehicle traffic on unpaved roads has several effects that act to facilitate dust generation. The force of a vehicle’s wheels moving on an unpaved surface can cause pulverization of surface material. Soil particles on the road are lifted by the rolling wheels and by the air turbulence caused by the movement of vehicle itself. The air turbulence effect behind the vehicle continues to act on the road surface after the vehicle has passed (U.S. EPA 2006). The quantity of dust emissions from a given section of unpaved road will vary proportionately with the volume of traffic. Parameters that influence unpaved road dust emissions include vehicle speed, vehicle weight, the number of wheels on the vehicle, the road surface texture, the particle distribution of the road surface material, and the moisture content.
The transport of bulk materials by vehicle can also be a dust generation source. In this context, bulk materials transport refers to conveyance of loose materials such as sand, gravel, rock, topsoil, debris, etc. in bulk, non-containerized form. The potential dust generation from transport of bulk material depends on the nature of the material (e.g., particle size, moisture content), the effectiveness of any open-bed truck cover, and the speed of the vehicle.
Emissions caused by traffic in uncontaminated areas would be limited to general nuisance dust that should appropriately be controlled. However, traffic in contaminated areas could potentially lead to the emissions of dust-containing contaminants that would contribute to site exposure hazards. While nuisance dust is not as hazardous as contaminated dust, it may be difficult to differentiate contaminated dust in the total particulate measurements that are commonly used to obtain real-time air quality measurements.
2.1.4 General Construction and Other Surface-Disturbing Activities
A variety of general construction, maintenance, and site operation activities have the potential to generate dust. The types of dust-generating activities in this category include facility construction (with associated earthmoving and moving/loading/handling/compaction of loose soil), trenching for utilities, and ground surface grading/vegetation removal to form work spaces or buffer areas (e.g., for well pads, laydown yards, construction sites, fire protection buffers, etc.). Such activities result in a disturbed ground surface and may themselves generate dust or result in windborne dust emissions from the cleared and exposed

2.6
ground surfaces. The degree of dust generation will depend on the size of the site, soil moisture, particle size, wind conditions in the context of the land surface topography, work practices (vehicle speed, drop height, equipment size, etc.), and amount of site activity. These activities are not likely to generate contaminated dust and associated fugitive emissions can therefore be considered as nuisance dust that required appropriate control.
2.2 Regulations and Requirements
Emissions of hazardous air pollutants from DOE facilities are regulated under the National Emission Standards for Hazardous Air Pollutants program (40 CFR 61 and 63), which was established under the Federal Clean Air Act (FCAA) of 1970 (42 U.S.C. 7401 et seq.). Where the FCAA establishes minimum requirements for air quality programs the provisions of the Washington Clean Air Act (WCAA) [RCW 70.94.161 and Appendix A to 40 CFR 70] mirror the requirements of the FCAA. The WCAA authorizes the State of Washington Department of Ecology (Ecology), the Department of Health (DOH), and several local agencies, including the Benton County Clean Air Agency (BCAA), to implement provisions and programs consistent with the FCAA (66 FR 48211). Ecology is the permitting authority for the Hanford Air Operating Permit (AOP), which incorporates underlying regulations from the three state agencies. As such, Ecology currently enforces regulations on the Hanford site pertaining to fugitive dust1, which is the primary source of air emissions resulting from remediation, excavation, decommissioning, and demolition activities at Hanford (U.S. DOE, 2012; Ecology, 2016). The DOH enforces regulations relating to radioactive air emissions, and the BCAA enforces regulations relating to asbestos and outdoor burning (DOE, 2012; Ecology, 2016).
The Washington Administrative Code, in sections WAC 173-400 (“General Regulations for Air Pollution Sources”) and WAC 173-460 (“Controls for New Sources of Toxic Air Pollutants”), establish requirements that that limit emissions of toxic air pollutants and fugitive dust. In accordance with WAC 173-400-040(3) and (8), reasonable precautions must be taken to prevent the release of air contaminants associated with fugitive emissions resulting from demolition, materials handling, or other operations, and to prevent fugitive dust from becoming airborne from fugitive sources of emissions. In cases of inert particulates, the standards for particulate matter emissions applicable to fugitive dust are given below.
1. WAC 173-400-040(9)(a) says: The owner or operator of a source, including developed or undeveloped property, or activity that generates fugitive dust must take reasonable precautions to prevent that fugitive dust from becoming airborne and must maintain and operate the source to minimize emissions.
2. Reasonable precautions may include, but are not limited to: watering, chemical stabilizers, physical barriers, compaction, gravel cover, vegetative stabilization, mulching, and minimizing the extent of open areas.
3. WAC 173-400-040(9)(b) says: The owner or operator of any existing source or activity that generates fugitive dust and that has been identified as a significant contributor to a PM10 or PM2.5 nonattainment area is required to use reasonably available control technology to control emissions. Significance is determined according to the criteria found in WAC 173-400-113(4).

2.2
In addition to regulatory requirements, work at Hanford includes contractual requirements dictating that contractors must prepare and implement dust control plans prescribing appropriate measures to prevent and control fugitive dust emissions (Benedict, 2016).

3.1
3.0 Impacts to Contaminant Mobilization
A modeling case study was completed in order to characterize the magnitude of contaminant migration under a variety of hypothetical water application scenarios. The goal of this modeling exercise was to better understand the impact of dust suppression practices on the subsurface in the Central Plateau. To complete this case study, hydrogeologic models from FY2017 (Zhang, 2017) were updated to be run as an ensemble of models that accounted for a higher range of water application rates (2 mm/d to 100 mm/day) as well as hydrologic heterogeneities to account for uncertainty in subsurface characterizations. These field scale simulations represent subsurface behavior of the 200 West Area. Results build off of FY17 models, capturing a range of contaminant fluxes and concentrations versus application rates which were used to bound the expected system response.
3.1 Modeled Scenarios
A site model of the 216-S-7 (S7) Crib in the Hanford 200 West Area was selected for reuse from previous investigations which evaluated subsurface contaminant transport of Iodine 129 (I-129) (Truex et al., 2016; Zhang 2017). A summary of the model set up from Zhang (2017) follows here:
The S7 Crib is located in the southern portion of the 200 West Area. The crib began operating in 1957 as a replacement for the 216-S-1 and 216-S-2 Cribs and was retired in 1965. The crib received a total of 3.9 × 10⁸ L of I-129 contaminated waste solution. The mean annual discharge volumes and I-129 concentrations were used to simulate the contaminant distribution before the hypothetical date (i.e., Jan. 1, 2018) of water application for dust control.
During operations in 1956 through 1965, the water table was at an elevation of about 140 to 143.5 m (67.9 to 64.4 m bgs). Water levels reached a peak of about 144.9 m in 1977, and have since dropped, reaching a low of about 131.8 m in October 2015. Thus, the vadose zone thickness has generally ranged from 63 to over 76 m since crib operations. Elevation and thickness of major stratigraphic units can be found in Appendix B, Table B.2, of Truex et al. (2016). Best estimate physical and hydraulic properties for each sediment class are listed in Table 3-1. Recharge estimates are based on assumptions regarding the surface soil conditions and recharge rates derived from field data and computer simulation results that were assembled into a suite of recharge classes described by Last et al. (2006). The soil conditions and recharge estimates have been defined for the S7 Crib for two different time intervals: 4.0 mm/yr for the pre-operations period and 44.0 mm/yr for the operations/post-operations period.

3.2
Table 3-1. Best estimate physical and hydraulic properties for the sediment classes at the S7 site Zhang (2017).
Property Class
(1/cm)
n s
(m3/m3)
Ks
(cm/sec) Sr
Bf 0.019 2.177 0.21 5.98E-4 0.118 H1_cs 0.038 1.945 0.38 1.09E-3 0.147 H1_g 0.011 1.845 0.23 2.88E-4 0.204 H2_cs 0.038 1.945 0.38 1.09E-3 0.099 H2_fs 0.013 2.451 0.34 1.71E-5 0.122 CCUz 0.004 2.285 0.35 7.27E-6 0.117 CCUc 0.011 1.740 0.34 8.45E-4 0.185 RTF 0.004 2.285 0.35 7.27E-6 0.117 Rwie 0.018 1.654 0.17 2.60E-4 0.055
Rg_SAT 0.018 1.654 0.17 0.317 0.055
The base model was parameterized with the best estimate, mean hydraulic properties and natural recharge rates (Truex et al., 2016; Zhang 2017). Initial and boundary conditions were kept the same as previously discussed in Zhang (2017), and are recalled here:
For the S7 Crib, the side boundaries in the vadose zone were no flow; a water flux rate of 36 m/yr was applied at the west boundary of the saturated zone and a hydraulic gradient at the east boundary of the saturated zone. The groundwater table was at the depth of 67 m. The solute distribution for S7 Crib at the beginning (i.e., Jan. 1, 2018) of dust-suppression water application was simulated based on estimates of disposal volumes, periods, and inventories.
The flow system was then initialized in two steps: 1. A steady-state flow period, which was achieved by running the simulations under constant recharge
conditions for 1000 years.
2. A contaminant release period during and after waste disposal, which started from 1955 with the steady-state conditions initialized to obtain subsurface moisture and contaminant distributions on Jan. 1 2018. Note that in the hypothetical scenarios considered here, an unspecified contaminant is considered in order to generalize findings.
Figure 3-1 shows the aqueous saturation and hypothetical aqueous contaminant concentration in the soil below the S7 Crib (delineated in pink) on Jan. 1, 2018, before water is applied for dust suppression.

3.3
Figure 3-1. Aqueous and solute distributions below the S7 Crib (pink rectangle) on Jan. 1, 2018. The Cold Creek silt (CCUz) confining unit is specified. a) Aqueous saturations b) Contaminant concentrations
After initialization, hundreds of simulations with progressively increasing water applications were run for each model set up to fully evaluate the potential impacts of water application. The water application simulations consisted of natural and man-made recharge due to hypothetical dust suppression between Jan. 1, 2018 to Dec. 31 2023. Note that the selection of the dust application start data and application period was arbitrary, and investigation results are dependent on initial contaminant distributions.
In addition to the base case parameterization, models were generated to capture the uncertainty in the Cold Creek silt (CCUz), which is a low-permeability layer within the Central Plateau and most likely to create perched water conditions. These models considered:
1. CCUz units with higher hydraulic conductivity and porosity.
2. CCUz units with lower hydraulic conductivity and porosity.
3. CCUz unit with heterogenous hydraulic conductivity and porosity fields. For this modification, five realizations of the S7 site with heterogeneous hydraulic parameters were generated to account for uncertainty and heterogeneity.
For the first set of simulations, the hypothetical contaminant was assumed to be conservatively transported and assigned a distribution coefficient, Kd, of 0.0 cm3/g. For the second set of simulations, the contaminant was assumed to adsorb to sediments, and was assigned a Kd of 0.1 cm3/g.
3.1.1 Hydrogeologic Uncertainty
The hydraulic conductivity and porosity of the CCUz unit were perturbed in this study to evaluate the impacts of uncertainty of hydrogeologic properties on contaminant migration results. The hydraulic conductivity and porosity of the CCUz for the high permeability cases (S7_H) and low permeability cases (S7_L) are listed in Table 3-2 along with the base cases (S7_M). Sequential Gaussian simulation was performed using GSLIB software (Deutsch and Journel, 1992) to generate random heterogeneous property distributions where porosities assumed normal distributions and permeabilities log normal distributions centered about mean values given in Table 3-2 (S7_R1 to S7_R5). Porosity was varied 0.1 about the mean and permeability was varied one order of magnitude about the mean (See Table B.23 from Last, 2006).
Aqueous Saturation (‐) Aqueous Contaminant Concentration (m/v)(a) (b)

3.4
Table 3-2. CCUz Hydraulic Conductivity and Porosity values of S7 Crib
Case group Hydraulic Conductivity,
Ks (cm/s) Porosity
(–)
S7_M 7.27× 10⁻⁶ 0.35
S7_L 7.27× 10⁻⁷ 0.30
S7_H 7.27× 10⁻⁴ 0.40
S7_R1-5 7.27× 10⁻⁶ 0.35
3.1.2 Water Application Volume and Rates
Dust suppression water was applied to the crib area plus a buffer zone of two cells on each side (4 m), save from the north boundary, where it was assumed that activities were taking place in the trench area. The size of the region of water application was 31.35 × 11.0 m (344.85 m2). The rates and scheduling of dust suppression water application are often not recorded nor reported in public documents, but generally, suggested application rates for dust suppression on roads are less than 5 mm/day (Jones 2017). In the previous report the water applicate rate was assumed to be 2 mm/day based on limited historical data during surface remediation activities (Gee et al., 1995; Zhang et al., 2009). For context, natural recharge within the S7 crib site is ~44 mm/yr (Zhang 2017).
To further evaluate the potential impacts of water application on subsurface water and geochemical dynamics, an ensemble of simulations was set up by iteratively increasing the application rate by at most 2 mm/day. Because the previous study by Zhang (2017) showed variation in application rate has very little impact on solute transport entering the water table, each rate was assumed constant over a five-year water application window. The minimum application rate was set as 2 mm/day; the maximum application rate was set at 100 mm/day. While the upper range far exceeds typical application rates, it was chosen to bookend subsurface impacts related to water application.
3.1.3 Numerical Simulator
All simulations were carried out using eSTOMP (Fang et al., 2015), the scalable version of the STOMP subsurface flow and reactive transport simulator (White et al., 2015) . All simulations were executed on Constance, a Linux-based cluster that is part of Pacific Northwest National Laboratory (PNNL) Institutional Computing (PIC). The eSTOMP simulator is managed as safety software and complies with NQA-1 quality assurance standards.
3.2 Simulation Results
This section summarizes the simulation findings. The impacts of the applied water for dust suppression on flow and contaminant transport are quantified by the solute flux rates entering the water table and solute concentration in the aquifer, or saturated zone, underlying the modeled S7 crib site. Because water application amounts are not meticulously recorded in the Central Plateau, some figures provide alternative units of measurement for context. For example, one 4,000-gallon truckload of water per day is the equivalent of 44 mm/day, or roughly the same amount of recharge received annually naturally.
A selection of application scenarios run with the base case model set up are shown in Figure 3-2, where the dashed black line represents contaminant concentrations entering the water table underlying the S7 crib under natural recharge conditions and the solid colored lines correspond to 2 mm/day, 25 mm/day, 50 mm/day, and 100 mm/day additional water application. Simulation results show the contaminant

3.5
concentrations entering the water table. Concentrations are given as m/v, where “m” is mass and “v” is volume. The drinking water standard here is hypothetically represented as 1 m/v. In relation to natural recharge rates, the relatively large amounts of water applied for dust suppression created a pulse of flow which accelerated solute transport, contaminating the aquifer. For example, in the 100 mm/day case, the contaminant concentration spiked to 16 m/v and then stabilized under 1 m/v by 2023 as the contaminant plume was flushed from the vadose zone (Figure 3-3).
Figure 3-2. Mean contaminant concentration entering the water table below the application area (Case S7_M), a) contaminant flux of kd=0 cm3/g case, b) Contaminant flux of kd=0.1 cm3/g case.

3.6
Figure 3-3. Aqueous and solute distributions on Jan. 1, 2023, at the end of the 5 year, 100 mm/day water application period. a) Aqueous saturation b) Contaminant concentration
Figure 3-4 shows the peaks of these pulses, where the x-axis displays the water application rate, and the line colors correspond with low (S7_L), mean (S7_M), high (S7_H), and heterogeneous (S7_R1 to SY_R5) material parameterizations. Dashed lines correspond to cases including adsorption. Other than one outlier (S7_L, kd =0.1 cm3/L), the maximum concentration of contaminant entering the groundwater was relatively insensitive to uncertainty in hydrologic parameters considered here. The outlier, representing a low permeability, low porosity parameterization case taking adsorption into account slowed downward flow and trapped more contaminant near the surface before water application began. This resulted in reduced impact on the groundwater throughout the water application scenarios. Excluding that case, the lowest water application rate tested, 2 mm/day, resulted in a range of concentrations near 7.5 (0.9) m/v. From 2 mm/day, impacts to groundwater increased until application rates of 25 mm/day. At which point, the maximum contaminant concentrations stabilized to 15.4 (1.5) m/v up to 100 mm/day.
Aqueous Saturation (‐) Aqueous Contaminant Concentration (m/v)(a) (b)
100 mm/day 100 mm/day

3.7
Figure 3-4. The peak of mean contaminant concentration entering the water table below the water application area.
The peak contaminant flux rates entering the water table for all model configurations simulated are shown in Figure 3-5, where the x-axis displays the water application rate, and the line colors correspond with low, mean, high, and heterogeneous material parameterizations. Dashed lines correspond to cases including adsorption. An S-shaped functional relationship between the contaminant flux rate and the water application rate was qualitatively observed across all model configurations, where the derivative of the contaminant flux rate gradually increased to 2 mm/day water application, then rapidly increased to a point of inflection.

3.8
Figure 3-5. The peak contaminant flux entering the aquifer below the water application area.
Results showed the aqueous and solute flux rates entering the groundwater were sensitive to modeled uncertainties. For example, in the absence of water application, the maximum flux rate of contaminant was 37,000 m/yr/m2. However, at 2 mm/day water application, the average contaminant flux rate was 155,000 (53,000) m/v; at 50 mm/day, the average contaminant flux rate was 2,106,000 (708,000) m/v. This led to perched water conditions above the CCUz unit in all of the application scenarios. Figure 3-6 shows aqueous saturations underlying the S7 crib at the end of the 5-year application period for the base case parameterization without adsorption. Distinct perched water tables formed in both cases, which can then act as hydraulic drivers for years to decades post water application, as seen in Figure 3-2.
Figure 3-6. Predicted saturation in the soil below the S7 Crib on Jan. 1, 2023, post water application period. a) 2 mm/day water application rate b) 50 mm/day water application rate
Aqueous Saturation (‐) Aqueous Saturation (‐)(a) (b)
2 mm/day 50 mm/day

3.9
None of the cases evaluated resulted in negligible impacts to groundwater. Instead, they highlight potential impacts if water application is not properly managed. While a no impact water application threshold cannot be identified for the Central Plateau by this case study, recommendations can be made to limit water applications to adhere to a lower application rate that accounts for the predicted S-curve flux to groundwater. It is recommended that water applications be limited to 2 mm/day (182 gallons/m2/day) or an equivalent volume over time, as Zhang (2017) showed that when the same amount of water is applied, the variation of water application rate has very little impact on solute transport entering the water table. The caveat to that recommendation is the assumption that water application is occurring over a reasonable amount of time. For instance, 2 mm/day for 5 years is equivalent to roughly 83 truckloads of water total within the S7 crib area. It would be unreasonable to apply all of this water over the course of one day. It is recommended that this volume be used to provide a water application limit of 1 truckload (44 mm) per day over an equivalent area over 83 days, or a roughly 4 month work period with weekends excluded. In scenarios where more water is being applied than recommended, a combination of methods may be used to reduce water use. These methods are discussed in detail in subsequent sections.

4.1
4.0 Dust Control Method Evaluation
Dust control methods evaluated here are specific to activities in the Hanford Central Plateau, though information provided may also be applicable to activities in the Hanford River Corridor and/or other DOE sites. Demolition of Hanford structures and disposal of materials (from building demolition and waste site remediation) at the EPA-regulated ERDF are governed by specific protocols, therefore discussion of dust control for these activities is not included in this scope. For any source of fugitive dust, the first consideration should be preventative measures or strategies to eliminate or reduce the primary generation of dust and the ensuing secondary re-entrainment. However, dust capture/control mitigation measures may also be necessary. Here information is compiled on the types of materials, practices, and technologies available for dust management, including dust palliatives/suppressants, engineered/physical controls, and work strategies. In addition, guidance is presented for effective implementation with a focus on minimizing water application rates to mitigate potential environmental impacts on subsurface contaminant migration.
Selection and implementation of an appropriate dust control method depends on a number of factors, including the nature of the activity generating dust, feasibility of use, frequency of application necessary to achieve desired level of control, cost of application, and whether the goal is interim suppression of uncontaminated dust, suppression of contaminated dusts, or final restoration of remediated areas. In addition, an evaluation of dust suppression technologies must consider whether dust suppression agents, if used, will break down to become hazardous or interact with site-specific conditions to present a future chemical/radiological hazard.
This section summarizes information on dust control methods and technologies. These methods and technologies are assessed with respect to their applicability to Central Plateau activities (Section 2.1). An objective of this work was to provide quantitative information on dust suppressant application rates to mitigate potential effects on subsurface contaminant migration. Thus, dust suppressants are specifically discussed in terms of advantages and disadvantages, application methods, and potential environmental impacts. More detailed information on dust control methods and technologies are provided in Appendix A.
The information on dust control technologies reviewed for this document includes numerous journal articles, federal, state, and county agency guidelines for dust control and revegetation, technical reports, product brochures, and online information from vendors. Key references that may provide supplementary information on dust control technologies are listed in Table 4-1.

4.2
Table 4-1. Key Guidance and Research Findings Regarding Dust Control Technologies
Title Citation Dust Palliative Selection and Application Guide Bolander and Yamada 1999 Guidelines for the Selection, Specification and Application of Chemical Dust Control and Stabilization Treatments on Unpaved Roads
Jones 2017
Soil Stabilization Methods with Potential for Application at the Nevada National Security Site: A Literature Review
Shilito and Fenstermaker 2014
Environmental Considerations for Selecting Cost-Effective Dust Control Technologies
USACOE 2013
Erosion Control Treatment Selection Guide Rivas 2006 Testing of Dust Suppressants for Water Quality Impacts Irwin et al. 2008 Research Findings: Data Collection on Toxicity of Dust Palliatives Used in Alaska
Eastern Research Group 2016
4.1 Dust Control Methods
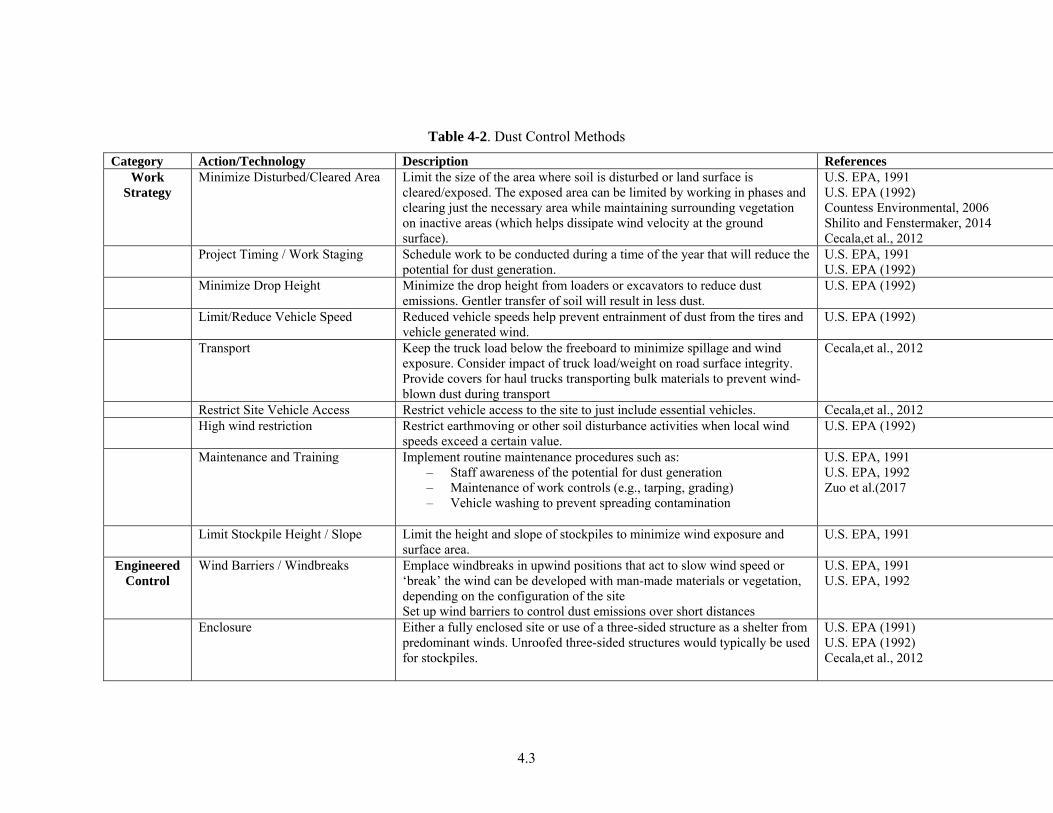
There are two high-level categories of approaches to dust control, proactive work strategies to minimize fugitive dust generation and reactive engineered controls to mitigate dust generation and/or capture fugitive dust. Because a variety of activities have the potential to generate fugitive dust on the Hanford site (see Section 2.1), there is no unique response to dust prevention and control. Dust generation and transport may be prevented through appropriate strategies, good construction and maintenance practices, and engineered controls (Gebhart et al. 1999). Work strategies that prevent dust generation include best management practices for construction/excavation activities, and scheduling work to minimize activities when weather or climate conditions are conducive to dust generation. Engineered control measures may be used to help stabilize soil surfaces, reduce wind speed at ground level, or otherwise minimize dust generation. These control measures include revegetation, ground covers/mulches, and wind barriers or windbreaks and the use of chemical dust palliatives. Table 4-2 provides a compilation of the main prevention and control measures that may be considered for certain activities. Measures are categorized as “work strategies” or “engineered controls.” Dust palliatives are described with additional details in the following sections and Appendix A, and describe their advantages and limitations, and potential adverse environmental impacts.
4.3
Table 4-2. Dust Control Methods
Category Action/Technology Description References Work
Strategy Minimize Disturbed/Cleared Area Limit the size of the area where soil is disturbed or land surface is
cleared/exposed. The exposed area can be limited by working in phases and clearing just the necessary area while maintaining surrounding vegetation on inactive areas (which helps dissipate wind velocity at the ground surface).
U.S. EPA, 1991 U.S. EPA (1992) Countess Environmental, 2006 Shilito and Fenstermaker, 2014 Cecala,et al., 2012
Project Timing / Work Staging Schedule work to be conducted during a time of the year that will reduce the potential for dust generation.
U.S. EPA, 1991 U.S. EPA (1992)
Minimize Drop Height Minimize the drop height from loaders or excavators to reduce dust emissions. Gentler transfer of soil will result in less dust.
U.S. EPA (1992)
Limit/Reduce Vehicle Speed Reduced vehicle speeds help prevent entrainment of dust from the tires and vehicle generated wind.
U.S. EPA (1992)
Transport Keep the truck load below the freeboard to minimize spillage and wind exposure. Consider impact of truck load/weight on road surface integrity. Provide covers for haul trucks transporting bulk materials to prevent wind-blown dust during transport
Cecala,et al., 2012
Restrict Site Vehicle Access Restrict vehicle access to the site to just include essential vehicles. Cecala,et al., 2012 High wind restriction Restrict earthmoving or other soil disturbance activities when local wind
speeds exceed a certain value. U.S. EPA (1992)
Maintenance and Training Implement routine maintenance procedures such as: – Staff awareness of the potential for dust generation – Maintenance of work controls (e.g., tarping, grading) – Vehicle washing to prevent spreading contamination
U.S. EPA, 1991 U.S. EPA, 1992 Zuo et al.(2017
Limit Stockpile Height / Slope Limit the height and slope of stockpiles to minimize wind exposure and surface area.
U.S. EPA, 1991
Engineered Control
Wind Barriers / Windbreaks Emplace windbreaks in upwind positions that act to slow wind speed or ‘break’ the wind can be developed with man-made materials or vegetation, depending on the configuration of the site Set up wind barriers to control dust emissions over short distances
U.S. EPA, 1991 U.S. EPA, 1992
Enclosure Either a fully enclosed site or use of a three-sided structure as a shelter from predominant winds. Unroofed three-sided structures would typically be used for stockpiles.
U.S. EPA (1991) U.S. EPA (1992) Cecala,et al., 2012

4.4
Category Action/Technology Description References Surface Roughening Stabilize an exposed area during periods of inactivity or when vegetation
cannot be immediately established by tilling or disking the surface of disturbed soils to produce a rough surface or ridges.
Kestler (2009) Rivas 2006
Surface Upgrade/Mechanical Stabilization
Increase surface strength by improving particle size distribution, shape, and/or mineral types, followed by compaction. Where a soil has few fines, clay additives can be added to improve mechanical stabilization. Technology is typically for unpaved roads.
Kestler (2009) Rivas (2006)
Mulch/Ground Cover Use of natural or synthetic mulch/cover materials such as gravel/rocks, wood chips/bark, rubber, and other materials as a barrier to wind entrainment and moisture loss. Applicable to inactive areas.
Rivas (2006)
Removable Ground Cover Use of anchored plastic/textile sheeting to cover open surfaces during windy periods, periods of project inactivity, or for areas not actively being worked.
Rivas (2006)
Vegetation/Revegetation Vegetation acts in several ways to achieve effective dust control. Plant roots act to mechanically stabilize and retain soil, while the aboveground plant bodies reduce wind speed at the ground surface. Revegetation is applicable for areas inactive for 30 days or more (to allow time for growth). This dust control method requires application of water to maintain plant health.
Wet Suppression Regular application of water (possibly with surfactants) to keep soil moist such that fine particles agglomerate and are too dense to become airborne fugitive dust. Also used to capture fugitive dust that is generated by site activities.
Jones (2017)
Chemical Stabilization Application of chemical dust suppressants to alter soil properties (particle size, agglomeration, density), mechanical strength, and/or wind exposure (e.g., with a coating/crust) to prevent dust generation. Chemical suppressants are less often used for dust capture.
Jones (2017) Jones (2013) Bolander and Yamada (1999)

4.5
4.2 Dust Suppressants
Dust suppressants are liquid or solid materials that can be applied to stabilize soil surfaces to prevent particles from becoming airborne or can be sprayed to capture/control suspended dust particles. These generally include the following categories: water, hygroscopic salts (water absorbing products), polymers, organic non-petroleum products, petroleum-based products, electrochemical additives, cementation products, and clay additives (Bolander and Yamada 1999; Jones 2017). Engineered control measures can help stabilize soil surfaces, reduce wind speed at ground level, or otherwise minimize dust generation. These control measures include revegetation, ground covers/mulches, and wind barriers or windbreaks. Work strategies that prevent dust generation include best management practices for construction/excavation activities, and scheduling work to minimize activities when weather or climate conditions are conducive to dust generation. Additional information is provided in Appendix A.
4.2.1 Categories of Dust Suppressants
For the purpose of this study, a data collection effort to gather information about chemical soil stabilizers and dust control agents was completed. Data collection involved literature review and vendor solicitation. Rather than provide a comprehensive list of products available, this effort focused on providing general guidance on performance advantages and limitations, as well as standard application rates.
A 2013 study from the University of California Pavement Research Center (Jones 2013) documented the existence of more than 200 proprietary chemical treatments on the U.S. marketplace. Most of the chemical treatments currently available focus on the prevention and control of dust on unpaved roads but may also be implemented for other dust generating activities. Materials used as dust palliatives include water, salts, vegetable oils, molasses, synthetic polymers, mulches, asphalt emulsion or lignin products and usually fall into the following categories:
Water/water with surfactants, the most commonly used dust suppressant
Water-absorbing products (hydroscopic salts), such as calcium chloride and magnesium chloride which are widely used on unpaved road
Organic non-petroleum products, such as lignosulfates, molasses, plants oils, or tree resins
Organic petroleum and synthetic fluids, such as asphalt emulsions, base or minerals oils, synthetic fluids.
Polymers, such as acrylates and acetates
Electro-chemical products, mostly hydrocarbon mineral oils modified with sulfuric acid to form sulfonic acid
Clay additives, such as bentonite.
Table 4-3 provides a compilation of the information available for each category of products listed above with their associated advantages and limitations. Appendix A provides a description and more details on each of these product categories. No national efforts have been conducted to date to evaluate the performance of the products available, the recommended treatments, or the potential adverse impacts (Piechota et al. 2004). As already stated at the end of the 1980’s in U.S. EPA (1988), little or no chemical compatibility data are available so the likelihood of initiating or accelerating reactive transport must be considered on a case by case basis which is outside the scope of this study. Knowledge on the potential for accelerating environmental contamination migration or the possible formulation of additional toxic

4.6
materials on-site due to dust suppressant and contaminant(s) reactions is also limited. Additionally, to date, few vendors of dust suppressants are experienced in applying their product in a contaminated environment. In thirty years, dust control measures have been widely discussed, improved and implemented in different sectors (e.g., industry, mines), however the chemical compatibility of dust suppressants with contaminants still remains a blurred domain. The scope of this study is focused on the hydraulic driving forces associated with dust suppressant application but we do recognize the necessity to study further the chemical interaction of dust palliatives with major contaminants. This at could potentially be assessed through reactive transport modeling in future work.
Most of the information available is based on local studies, research efforts conducted on specific products or comes from vendor marketing and product manufacturing information. Selection of dust suppressants more generally is based on their efficiency, cost-effectiveness, and potential environmental impacts.

4.7
Table 4-3. Performance and Limitations of Dust Suppressants
Dust Suppressant Category
Type of Product Typical Application
Rate/Frequency1 Performance Advantages2 Performance Limitations
Water
Freshwater
– Application rates depend on soil properties and weather conditions; however, pressurized spraybars used for application are recommended to operate between 0.1 and 4.5 L/m2
– Only effective for 0.5 to 12 hours
– Usually readily available, low material cost, easy to apply
– Frequent applications necessary during hot, dry weather; therefore, potentially labor intensive and expensive
– Over-application may result in muddy conditions, ponded water, or icy conditions during freezing weather
– Water application when evaporative demand is low, or over application of water may increase infiltration and cause mobilization of contamination
– Supply may be limited in some areas
Freshwater Plus Surfactants
– Application rates depend on soil properties and weather conditions; however, pressurized spraybars used for application are recommended to operate between 0.1 and 4.5 L/m2
– Only effective for 0.5 to 12 hours
– Dust control may be more efficient than with plain water, requiring fewer applications, and less water use
– Better water penetration into subsurface soil layers before or during active earthmoving
– Surfactants remain after water evaporates and residual surfactant may increase particle agglomeration
– Capital and operating costs are higher than water-only spray systems
Hygroscopic Salts/Brines
Calcium Chloride Magnesium Chloride Sodium Chloride
– Calcium Chloride: o Liquid: 0.9 to 1.6 L/m² o Flake: 0.9 kg/m² o Pellet: 0.5 kg/m²
– Magnesium Chloride: 1.4 to 2.3 L/m²
– Sodium Chloride (depend on Ca and Mg chloride content)
– Reduces the rate of surface moisture evaporation
– Lowers freezing point of water, minimizing frost heave and reducing freeze-thaw cycles
– Increases compacted density of road material; effectiveness is retained after re-blading. Increases compacted density of road material; effectiveness retained after re-blading.
– Water absorbed from air at humidity levels >20%; effectiveness may be limited in arid and semi-arid regions
– Corrosive to metals – Leaches out under saturated conditions – Solubility results in leaching during
heavy precipitation or water application

4.8
Organic Petroleum Products
Asphalt Emulsions
– 0.25 to 1.5 L/m2 – 1 treatment per season
– Binds and/or agglomerates surface particles because of asphalt
– adhesive properties—good dust mitigation
– Effective for use across a broad range of soil types and climates
– Serves to waterproof the surface
– Use is expensive due to the greater material costs and specialized application equipment
– May require multiple treatments – Under dry conditions some products
may not maintain resilience – If there are too many fines in the
surface and the product is high in asphaltenes, it can form a crust and fragment under traffic and in wet weather
– Some products are difficult to maintain
Petroleum Resins
– 0.5 to 2.5 L/m2 – Rejuvenation: 50 to 70% of
initial application rate (1 to 2 treatments per season)
Synthetic Fluids
– 1.1 L/m2 – Rejuvenation: 50 to 70% of
initial application rate (1 to 2 treatments per season)
Base and Mineral Oils
– 1.5 L/m2 – 2 to 3 light applications – Rejuvenation: 50 to 70% of
initial application rate (1 to 2 treatments per season)
Organic Non-Petroleum Products
Lignin Derivatives
– 2.3 to 4.5 L/m2 – Applied in multiple light
applications – Rejuvenation: 50 to 70% of
initial application rate (1 to 2 treatments per season)
– Binds surface particles together – Greatly increases dry strength of soil – Not humidity-dependent—retains
effectiveness during dry periods
– High solubility results in leaching during heavy precipitation
– Corrosive to aluminum alloys due to acidity (CaCO3 added ingredient, can neutralize acidity).
– Proper aggregate mix (4-8% fines) important to performance.
– Becomes slippery when wet; brittle when dry.
Tree Resins (Tall Oil Derivatives)
– 1.4 to 4.5 L/m2 – Applied in multiple light
applications – Rejuvenation: 50 to 70% of
initial application rate (1 to 2 treatments per season)
– Binds particles to cement soil surface – Greatly increases dry strength under dry
conditions – Some waterproofing effects – Require fewer applications than lignin
products
– Not widely available for dust suppression
– Heavy rains, saturated conditions may destroy surface cementation properties
Plant Oils
– 1.1 to 2.3 L/m2 – Applied in multiple light
applications
– Binds particles – May increase soil organic matter – May increase soil shear strength
– Limited availability – Oxidizes rapidly, and may become
brittle – Effect of plant oil penetration on soil
water infiltration is unknown

4.9
1 Application rates are based on information compiled by Jones (2017). Note that the recommendations are made for unpaved road and may differ if applied for other activities (e.g., stockpiles).
2 Information on advantages and limitations derived from Table 1 in Bollander and Yomada 1999, Appendix A of Washington State Department of Ecology, Technologies for Dust Prevention and Suppression, Publication 96-433, Revised March 2003; http://www.yakimacounty.us/DocumentCenter/View/2521/Appendix-A-Dust-Suppression-Ecology-PDF?bidId= , and USACOE. 2013. Environmental Considerations for Selecting Cost-Effective Dust Control Technologies, Public Works Technical Bulletin 200-1-133, U.S. Army Corps of Engineers, Washington D.C.
– Rejuvenation: 50 to 70% of initial application rate (1 to 2 treatments per season)
Molasses and Sugar-Based Treatments
– Depends on sugar content – Temporary binding of surface particles – Water soluble – May exhibit hygroscopic properties that
maintain surface moisture
– Effectiveness depends on type and quantity of complex sugars remaining after refining
– Limited availability
Glycerin
– 1.1 to 2.3 L/m2 – Rejuvenation: 50 to 70% of
initial application rate (1 to 2 treatments per season)
– Retains moisture – Useful in blends with other organic
non-petroleum products to promote particle agglomeration
– Resists leaching – Effective at low temperatures
– Duration of effectiveness depend on blended constituents
Synthetic Polymer Emulsions
Acrylates, acetates
– 1.4 to 4.5 L/m2 – Rejuvenation: 50 to 80% of
initial application rate (1 to 2 treatments per season)
– Applicable to range of emission sources – Functions well to control dust from
sandy soils – Some polymer types are compatible
with revegetation and do not preclude seed germination/plant establishment
– Requires appropriate weather conditions for application
– Certain polymers subject to UV (sunlight) degradation
– Application equipment must be cleaned immediately
– No residual effectiveness if surface is disturbed (e.g., rebladed)
Electrochemical/Enzyme Additives
Sulfonated oils, ammonium chloride enzymes, ionic products
– *diluted 1 part product to anywhere from 100 to 600 parts water
– Generally effective regardless of climatic conditions
– Performance dependent on fine-clay mineralogy
– Needs time to react with the clay fraction
– Limited life span
Clay Additives Bentonite/Montmorillonite
– 1 treatment every 5 years – 1 to 3% by dry weight
– Agglomerates with fine dust particles – Increases dry strength of material under
dry conditions
– the surface may become slippery when wet if high fines content in treated material,

4.10
4.2.2 Application Methods
There are four general methods for applying dust suppressants: dry fog, spray, foam, or direct application. Water can be applied as a dry fog, which would typically be used for industrial materials handling applications. Water or other liquid dust suppressants can also be misted or sprayed, though the liquid viscosity and other properties may limit the specific type of equipment that can be used.1 The type of liquid application will depend, among other things, on whether the objective is dust capture or prevention of dust generation. Capture involves spraying water or a water and chemical mixture into a dust cloud, while prevention of dust generation involves applying the dust suppressant to a surface to either penetrate the soil or form a film over the surface. For liquid application, distributor trucks must be designed, equipped, maintained, and operated so that the chemical treatment is applied uniformly through a pressurized spraybar on variable widths of surface up to16 ft. (5 m) at readily determined and controlled rates from 0.1 to 4.5 L/m2 (Jones 2017). Some liquid dust suppressants can be applied as a foam, which can be quite effective at controlling fine particles. Solid dust suppressants can be directly applied with spreaders as a surface application or bladed into the soil. Depending on the nature of the solid or liquid dust suppressant, the product may be applied topically or mixed into the top layer of the soil (Bolander and Yomada 1999; Jones 2017).
Most chemical dust suppressants are mixed in a carrier solution for application. They can be sprayed on a surface to form a film or crust, incorporated into the surface soil to bind particles, or sprayed into airborne dust clouds to capture particles. Many dust suppressants are applied in a water solution, and the degree of dust control that can be achieved is a function of the application intensity (volume of solution per area), dilution ratio, and the frequency of application, as well as the application method (surface application versus incorporation by mixing). The design of the water application system needs to be matched with the method and/or delivery system for effective dust control prior to soil disturbance. The duration of effectiveness of any of the dust suppressant technologies will depend the type of products used, soil properties, the weather, the application rate, and the traffic conditions. For these reasons, chemical dust suppressants may need to be applied more than once a year (e.g., seasonally) to provide adequate dust control. Certain types of binding agents are mixed in water solutions and sprayed to form a film over the surface (e.g., polymers) (Bolander and Yomada 1999; Jones 2017).
Some dust suppressants can also be applied as foams which are typically dry, stable, and small-bubbled with a consistency similar to shaving cream. Foaming agents are primarily composed of high foaming surfactants and may also contain wetting and binding agents that work to convert mixtures of water and air into foam that can be sprayed or blown on surfaces. Dust control foam functions in a similar manner to liquid spray wet suppression, in that the foamed liquid wets and agglomerates fine particles. The advantages of foam over liquid sprays are improved liquid distribution resulting in lower liquid feed rates; and improved fine particle capture, which can reduce breathable dust. Entrainment of air into the liquid to form bubbles increases the liquid surface area and thus provides better distribution of the liquid across the treatment area. The increased efficiency in distribution of the liquid can reduce water requirements in wet systems by as much as 50% (Wang et al., 2011, Wang et al. 2015).
The control methods for dust and vapor suppression rarely remove 100 percent of the contaminants from the air. These releases have to be estimated, along with the cost estimate for application of the control method to properly assess the feasibility of implementing the remediation technology being considered. 1 Blythe, David, Sealpump Engineering Ltd. A Practical Guide to Dust Suppression, https://consult.environment-agency.gov.uk/psc/bs24-8ry-new-west-gypsum-recycling-uk-limited/supporting_documents/Application%20Bespoke%20%20Dust%20Suppression%20Booklet%20%20whole.pdf Accessed September 2018.

4.11
Site conditions determine the effectiveness of specific control methods. Some methods have very limited periods of effectiveness, making the timing of excavations an important element in method selection.
4.2.2.1 Potential Environmental Impacts
Dust control is an important facet of remediation work, but the potential for environmental impacts must be considered when application of a dust suppressant is part of the dust control plan. Environmental impacts of dust suppressants depend on a range of factors, including the physical characteristics of the fluid, its chemical composition and concentration, potential transformation and migration, the soils composition, and the climate conditions (Piechota et al. 2004). Although manufacturers and independent agencies have conducted studies regarding the environmental impacts and health effects of dust palliative use, the knowledge still remains limited or not necessarily applicable to the Hanford site. The lack of information regarding the proprietary chemical compounds present in the dust suppressants often limits the assessment of environmental impacts associated with their application.
Some of the dust suppressants, such as hygroscopic salts, have a long history of application on unpaved roads and their adverse effects are well documented (Piechota et al. 2004; USACOE 2013). Other products, such as polymers and organic non-petroleum are now widely used but have limited documented research available.
General information related to potential effects of dust suppressants is described in the following sections with environmental impacts for each product category compiled in Table 4-4. While most of the adverse impacts of dust suppressants are expected to occur at the location of application, environmental impacts may also occur at locations beyond the application site. For instance, soils, flora, and fauna directly adjacent to the application site may be impacted. This information is not intended to be used as a basis for assessing the potential level of adverse impacts; as suggested by Jones (2017), proof of environmental testing should always be requested from the dust suppressant vendor.
4.2.2.2 Effects on Water Resources
As discussed in Section 3.0, water applied for dust suppression in the Central Plateau has the potential to infiltrate deep into the subsurface, providing a hydraulic driving force that accelerates migration rates of contaminants present in the vadose zone into the groundwater and ultimately discharges to the Columbia River. Because river water is used for dust suppression, geochemical reactions may also occur. The magnitude of driving forces mobilizing contaminants beneath the zone of application is dependent on a number of factors, from site specific subsurface flow properties, to surface climate conditions (precipitation rates, evapotranspiration rates, etc.), to operational parameters. Some factors are intrinsic to the system, while operational parameters, like fluid application rates and scheduling, can be controlled to minimize effects on groundwater.
Estimates of suggested application rates are often available for specific products, although most of the information found in the literature (Bolander and Yamada, 1999; Jones 2017) or provided by manufacturers is focused on unpaved roads, and not necessarily on other activities requiring dust control (e.g., excavation, stockpiles, etc.). Table 4-3 provides typical application rates for water as well as assorted dust control products, with ranges from 1.4 to 4.5 L/m² (0.3 to 1.0 gal/yd²). These reported application rates are highly variable depending on the dust suppressant being used, the manufacturer’s recommendations, soil moisture condition, climate, and the activity for which dust emissions must be controlled. Several light applications are recommended to allow a better penetration into the surface to be controlled.

4.12
As mentioned in Section 3.0, no quantitative control measures are in place for the volume or rate of dust suppression water applied during surface remediation activities and records detailing historical water applications are not formally kept for the Central Plateau, making assessments of historical impacts on ground- and surface water challenging. In the absence of specific volumes or rates used within the Central Plateau, alternative dust suppression methods may be compared to standard water application in a general way. Figure 4-1 compares the anticipated volume of fluid applied per select dust control categories over the course of one season. This comparison assumed the maximum typical application rates for all products with water application 5 days a week and alternative methods applied twice a season. This type of comparison highlights the significant reduction in fluid application expected from alternative dust control methods. Switching from simple river water applications to an alternative dust control method could cut down the total applied volume to a small percentage of the original, resulting in applied amounts which are less than natural precipitation and significantly reducing the effects on ground- and surface water.
Figure 4-1. Comparison of seasonal application volumes. Relative magnitudes based on upper estimates
of typical application rates.
4.2.2.3 Effects on Soils
Application of dust suppressants may have a range of adverse effects on soils, depending on the specific dust palliative selected. When water is applied as a dust control strategy, it may potentially cause chemical dissolution of compounds bound to soil particles, or result in mobilization of salts (Piechota et al. 2004). For chemical dust suppressants, the suppressant may potentially react with and leach hazardous components out of the soil. Where a dust suppressant alters soil properties, there may be a decrease of the surface permeability, which can cause reduced surface permeability, leading to increased runoff and affecting areas beyond the application site. Consequently, the reduced permeability could result in decreased soil moisture storage.
4.2.2.4 Effects on Air Quality
Dust suppressants attached to soil particles can potentially be remobilized into the air under high wind conditions. Thus, there is the potential that dust suppressant chemicals become airborne with the soil particles. Some dust suppressants (e.g., petroleum products) may contain volatile organic compounds (VOCs) that may be dispersed into the air when the product is applied.
Water
Salts
Org (Petro) Org (Other)
Polymers
Seasonal Fluid Application
4.13
4.2.2.5 Effects on Flora and Fauna
If dust suppressants are applied where vegetation exists at the application site or nearby, the constituents of the suppressants may potentially be taken up by plant roots. Depending on the chemicals involved and the concentrations, plant physiology or morphology may be adversely impacted. Microorganisms present in the soil may also biotransform dust suppressant chemicals into compounds that may potentially be toxic. Dust suppressants may also affect aquatic systems by leading to an increase in biochemical oxygen demand (BOD), if transported to nearby surface waters. An increase in BOD typically results in decreased dissolved oxygen (DO) concentrations, which affects health and survival of aquatic organisms. Mammals or insects may be attracted to certain dust suppressant products, such as salts, molasses, or plant oils, with adverse impact to their health.
4.2.2.6 Health Effects
Potential effects on health have to be taken into consideration and are very dependent on the chemical composition of the dust products being applied. Some products may be carcinogenic, as they may contain semi-volatile polycyclic aromatic hydrocarbons (PAHs) and VOCs. Others may cause irritation in the event of skin or eyes contact.
4.2.2.7 Summary of Potential Environmental Effects
The compilation of information provided in the Table 4-4 captured the main environmental effects known or suspected for specific products. This is based on literature reviews (Bolander and Yamada 1999; Piechota et al. 2004; Mctigue E. et al. 2016; Jones 2017) and should be updated as new information becomes available. This information should not be used for the determination of the potential level of environmental impact.

4.14
Table 4-4. Potential Environmental Impacts for Categories of Dust Suppressants
Category Sub-category Potential Environmental Impacts Reference Water N/A Surface and groundwater
– Water application when evaporative demand is low or over application of water may act as a driving force to increase infiltration and cause mobilization of contamination
Water with surfactants or Foaming Agents
Surfactants are typically soap based
Flora and Fauna – Potential impact to aquatic biota: may target gill tissue after
spills/leaching into small streams when added to water or plant oil
Soils – Potential concerns with spills
Jones (2017)
Water-absorbing Products / Salts and brines
Calcium chloride, magnesium chloride and sodium chloride
Surface and groundwater – Potential leaching and runoff of chloride
Flora and Fauna – May harm aquatic organisms – Repeated applications and long-term use may harm adjacent
and nearby vegetation – May attract animals
Health – No major human health effects – Irritation may occur in the event of skin or eye contact
Structures/Utilities – Corrosive to metals
Piechota et al. (2004) Bolander and Yamada (1999) Mctigue E. et al. (2016) Jones (2017)
Petroleum Products Health and other environmental impacts – Wide variety of ingredients (need product specific analysis) – “Used” product may be toxic – Oil in products may be toxic – Some petroleum-based products may be carcinogenic (may
contain semi-volatile PAHs and VOCs)
Bolander and Yamada (1999)

4.15
Category Sub-category Potential Environmental Impacts Reference Asphalt Emulsions Health effects
– May cause irritation in the respiratory tract if fumes generated from heating are inhaled
Surface and groundwater – None after curing – Maybe a concern if large volumes are spilled
Flora and Fauna – Flora: none provided direct application – Fauna: none
Soils – Potential concern with spills
Bolander and Yamada (1999) Jones (2017)
Petroleum Resins Surface and groundwater – None after curing – Maybe a concern if large volumes are spilled
Flora and Fauna – Flora: none provided direct application – Fauna: none
Soils – Potential concerns with spills
Jones (2017) Bolander and Yamada (1999)
Synthetic Fluids Must meet EPA environmental-based criteria (sediment toxicity, biodegradability, PAH content, aquatic toxicity, and soil-sheen free) Surface and groundwater
– None – maybe a concern if large volumes are spilled Flora and Fauna
– None Soils
– Potential impacts with spills
Jones (2017)
Base and Mineral Oils Limited documented research on environmental impacts Soils
– Potential impacts with spills and leaching before curing – Wide variety of ingredients (need product specific analysis) to
assess potential impacts Soils
– Potential concern with spills
Jones (2017) Bolander and Yamada (1999)

4.16
Category Sub-category Potential Environmental Impacts Reference Organic Non-Petroleum Products
Lignin Derivatives Surface and groundwater – If infiltrates into groundwater, could alter redox conditions and
result in concentration increases (e.g., of iron, sulfur compounds) Flora and Fauna
– Freshwater aquatic biota: biological oxygen demand may be high if spilled/leached into small streams, lowering dissolved oxygen, which can result in fish kills
– Plants: none expected Soils
– Potential concern with spills
Jones (2017) Bolander and Yamada (1999)
Tree Resins (Tall Oil Derivatives)
Limited documented research on environmental impacts Jones (2017) Bolander and Yamada (1999)
Plant Oils Limited documented research on environmental impacts Surface and groundwater
– Unknown or none recorded Flora and Fauna
– Biological oxygen demand may be high if spilled/leached into aquatic systems
– Plants: unknown, none expected – Fauna: animal and insects may be attracted
Soils – Potential concern with spills
Jones (2017) Bolander and Yamada (1999)
Molasses Sugar-Based Treatments
Limited documented research on environmental impacts Surface and groundwater
– Unknown or none recorded Flora and Fauna
– Fresh water aquatic biota: biological demand may be high if spilled/leached into aquatic systems
– Plants: unknown, none expected – Fauna: animal and insects may be attracted
Soils – Potential concern with spills
Jones (2017) Bolander and Yamada (1999)
Glycerin Limited documented research on environmental impacts Flora and Fauna
– May attract mammals Soils
– Potential concern with spills
Jones (2017) Bolander and Yamada (1999)

4.17
Category Sub-category Potential Environmental Impacts Reference Polymers Polyvinyl acrylate,
Polyvinyl acetate, polyvinyl chlorate, or styrene-butadiene-styrene based
Limited documented research on environmental impacts Impacts are dependent on specific product chemistry
Jones (2017) Bolander and Yamada (1999)
Electro-chemical and Enzyme Additives
High acidity Limited documented research on environmental impacts Impacts dependent on specific product chemistry pH of undiluted product is very low Surface and groundwater
– None expected unless large volume are spilled Flora and Fauna
– None expected Soils
– Potential concern with spills of concentrated product
Jones (2017) Bolander and Yamada (1999)
Low acidity/enzymes Limited documented research on environmental impacts Surface and groundwater – None expected Flora and Fauna – None expected Soils – Potential concern with spills of concentrated product
Jones (2017) Bolander and Yamada (1999)
Clay additives (mechanical stabilization)
Bentonite Surface water – May increase sediment in surface water, if unmanaged erosion
occurs No additional impacts are expected
Jones (2017) Bolander and Yamada (1999)

5.1
5.0 Dust Control Recommendations for Central Plateau Activities
5.1 Site/Environmental Considerations
The nature of site activities, the site conditions, the soil/dust itself, and nearby features should be characterized when developing a dust control strategy. Key considerations to help guide selection of appropriate dust control measures are summarized in Table 5-1.
Table 5-1. Considerations influencing the selection of a dust control strategy
Consideration Description Nature of the activity Type of work or activity (e.g., stockpiling, excavation)
Size of the disturbed area Duration and time of year of the dust generating activity Continuity of work/activity (e.g., continuous or intermittent) Size and degree of activity in traffic areas / non-traffic areas Evaluation of need for permanent dust control (e.g., paving)
Site characteristics Protection from wind provided by topography, surface features (i.e., structures), and/or undisturbed vegetation
Weather and climate conditions (time-of-year dependent): Prevailing wind direction and speed Temperature Precipitation/evaporation conditions
Concentrations and distributions of contaminants on the site Potential for chemical interaction (leaching)
Soil characteristics Soil type (particle size distribution) Soil moisture
Proximity to sensitive receptors, other waste sites, or other land uses
Distance/proximity to waterways, facilities, vegetation Distance to other land uses and nature of topography between
site and other land uses Effect of dominant wind direction on other land uses
Water requirements Depth/location of water table and saturated/oversaturated areas Side effects of technologies Knowledge of potential adverse effects of dust control methods.
5.2 Dust Control Relevant to Central Plateau Work
Implementing dust control measures is challenging as site-specific environmental conditions need to be considered. More importantly, dust-generating activities located in contaminated areas or that require handling hazardous materials, such as excavation or stockpiling activities, may lead to the implementation of specific dust control measures that differ from basic dust nuisances. This section discusses the range of measures that could be taken to control dust emissions for each general dust-generating activity presented. No dust control method alone or in combination will be appropriate in all circumstances. The relevance of dust control measures to the potential activities in the Central Plateau is summarized in Table 5-2.
Based on the general activities and remedial actions occurring at Central Plateau (see Sections 1 and 2, and U.S. DOE, 2009), recommendations for dust control measures are provided in the next sections for the four main dust generating activities identified: excavation, stockpiles, vehicle movements on unpaved roads and general construction and soil disturbance activities.

5.2
5.2.1 Active and Inactive Excavation Sites
As stated in Sections 1 and 2, there is high potential for fugitive dust emissions due to movement of equipment at the site during excavation activities associated with remediation actions (i.e., RTD), with a potential to generate emissions of hazardous particular matter into the air. RTD activities were indeed identified as one of the preferred remedial actions alternatives (U.S. DOE, 2009) and are therefore widely implemented at the Central Plateau. Dust emissions from excavation activities can vary substantially from day to day depending on the operations and the meteorological conditions.
Dust control methods occurring on an active excavation may be graded depending on the presence of contaminated materials. From a general stand point, wet suppression remains one of the most common dust suppression techniques for dust and contaminated dust particles, preventing release of hazardous materials in the atmosphere. On active excavation sites, the implementation of work strategies could lead to a significant decrease of dust emissions. For example, a proactive measure is limiting the entry to the active site to avoid unnecessary exposure and potential transfer of contaminants during site preparation and staging. Excavation activities can also be scheduled to minimize soil disturbance and associated fugitive dust emissions. Working under favorable meteorological conditions (e.g., no strong winds or rain) also limit dust emissions. Other measures related to work strategies are presented in Table 4-2 and Table 5-2.
Fugitive dust emissions can be controlled during excavation operations by spraying water or water with surfactants in uncontaminated areas if water usage is thoroughly controlled. Foam covering is an applicable alternative to consider. Foam technologies have been used to control dust emissions from excavation activities at Superfund and other hazardous waste sites (U.S. EPA, 1991). Foam systems and foaming agents are currently the object of important research that demonstrate their benefits compared to the use of water. For instance, foam coverings are often used in coal mines where similar challenges as the ones encountered at Central Plateau are present: protection of workers from fugitive dust is a priority, and watering systems are either not efficient or could lead to adverse impacts. Under certain conditions, the use of foam reduces the amount of respirable dust by 85%, while consuming 80 to 90% less water than conventional watering operations (Wang et al., 2011). Foams are easy to apply, effective and allow dust control on workings faces. Foaming agents come in different compositions which must be evaluated for compatibility with the surface being treated.
If contaminants of concern are present with the potential to be mobilized, either through wind erosion or mobilization via water application, more aggressive methods should be deployed. Windscreens are a suitable control to emplace, along with construction of temporary enclosures of the area being remediated (e.g., dome, flexible structures). These systems proactively mitigate suspension of dust emissions and minimize the amount of water required, if any is needed at all, while shielding the contaminated soils from precipitation. Additionally, covering exposed surfaces overnight or during periods of low excavation activity constitutes an efficient means to prevent dust emissions. Although the use of portable containment strategies can affect the overall schedule and budget of remediation activities, this approach is highly recommended on sites where the amount of infiltration must be controlled to prevent adverse impacts to the groundwater.
If enclosure systems are not a viable option, or if an acceptable amount of water is environmentally tolerable for a specific area based on a sound knowledge of the site conditions, the use of water spray systems can still be considered with dust surfactants added to the water, to provide a better binding of the particles. Choice of an appropriate system will be dependent on several variables such as the dust particle size, the spray drop size, the spray pattern or angle, and the application frequency.

5.3
Similar to active excavation sites, placing wind barriers along the sides of inactive excavation areas can reduce the amount of windblown dust. Surface covers can be placed to avoid long-term surface exposition to wind erosion. Additionally, a wider range of chemical soil stabilizers may be considered in lieu of water to create and maintain a crust on inactive areas.
5.2.2 Active and Inactive Stockpile
Most of the dust control methods applicable to stockpiles are related to materials handling operations and wind erosion. The control of dust emissions from stockpiles can be achieved through source extent reduction, work strategy implementation and surface treatment. Control measures for storage pile wind erosion are designed to stabilize the erodible surface, for instance by increasing the moisture content or to shield it from the ambient wind.
There are a number of work practices that prevent dust emissions. For instance, storage pile activity (i.e., loading and unloading) must be conducted on the downwind site of the storage pile to limit dust emission. Steep slopes must be avoided, and the height of the stockpile must be limited. The stockpile configuration (e.g., geometry, topography, layout based on dominant wind characteristics, any parameters related to aerodynamic considerations) can significantly reduce dust emissions (Cong, et al., 2012). Limiting drop heights from loading/unloading activities also contributes to limit dust emissions. During precipitations or strong wind events, covers, such as anchored plastic tarps, can be used to cover the piles of contaminated or uncontaminated materials.
Applying water to stockpiles during handling of material is known to have a minimal influence on reducing dust emissions. If water application is considered as a viable option to control dust emissions either from stockpiles with contaminated or uncontaminated materials, a customized water spray system can be implemented, allowing operators to control water application parameters such as frequency and water application rate. Fully automated systems are now available on the dust control market. Dust suppressants can also be applied to inactive piles and are known to achieve control efficiencies of at least 50% (U.S. EPA, 1985). However, stockpiles where material is being added or removed would have to be frequently retreated.
Alternatively, the surface of the pile can be treated with dust suppressants such as polymers or surfactants, after chemical compatibility with the materials has been assessed, and the amount of water allowed has been controlled. However, chemical stabilization is not as effective as foams for active stockpiles. Foam covering is considered an efficient alternative method to stabilize stockpiles (U.S. EPA, 1991) with a limited amount of water.
Studies have demonstrated that dust emissions could be decreased up to 75% using windscreens for reducing dust emissions from active and inactive stockpiles (U.S. EPA, 1985). Although the efficacy of windscreens is highly variable depending on the design and composition of the pile. Several studies concluded that windscreen material with 50% porosity provided an optimum configuration to reduce both wind velocity and turbulence (Cornelius and Gabriels, 2005, Countess Environmental, 2006. University of Missouri Center for Agroforestry. 2015).
Impermeable covers over the stockpile using liners, or even paved areas, are an efficient way to address both dust emission reduction and limit water application. Materials, such as high-density polyethylene plastic liner, can be placed over contaminated stockpiles until the hazardous materials can be treated properly, also preventing exposure to the atmosphere.
Overall, enclosure of the stockpile, active or not, is the most effective means to prevent wind erosion, control fugitive dust emissions, and limit the amount of water used. For contaminated areas, partial or

5.4
total enclosure of the stockpiles is highly recommended. The design of the structure should be evaluated. For instance, 3-sided enclosure systems should at least be as high as the stockpiles materials. It is also recognized that the sides’ length must be at least equal to the length of the pile. Additional design considerations are widely discussed in the literature.
5.2.3 Traffic on Unpaved Roads
Dust control methods related to the traffic on unpaved roads are the most documented of all measures discussed in literature. Many proactive measures can be implemented to prevent fugitive dust generation from unpaved roads. These measures start at the construction of the roads, where well graded materials must be appropriately chosen to ensure strength and durability. Selecting the right mechanical stabilization depending on the level of traffic expected (i.e., cement-soil, concrete, etc.) contributes to limit the erosion and can therefore limit dust generation. Trucks utilized for transport of bulk materials should be covered with tarps immediately after loading and throughout the transportation of bulk materials. Proactive measures such as vehicle speed/weight limitation, vehicle cleaning, or regular road maintenance are easy to implement and can have a significant impact on the amount of dust emitted.
Based on the environmental context of the Hanford site, spraying water or dust suppressants on unpaved roads should not be considered an issue as long as the areas being treated do not contain hazardous materials or are not directly located on top of or up gradient of contaminated soils. Similar to excavation and stockpiling, the use of water or any other chemical dust suppressants in contaminated areas must be evaluated based on the environmental conditions of the areas being treated. Water use may still be a preferred option if the amount of water being applied is rigorously controlled. Automated water-spray systems can provide an effective means to control application rate and frequency. Treating areas disturbed by vehicles with dust suppressants others than water would significantly reduce water use; however, this selection must be made after site characterization.
Additionally, in an effort to address contaminated area track-out, several options of track-out control can be implemented. For example, a gravel pad can be used to remove dirt from vehicle tires leaving contaminated areas. Road pavement is also a viable alternative for limiting erosion and subsequent dust generation but may be a cost prohibitive for short-term treatments.
A new tool developed by the University of California Pavement Research Center, Unpaved Road Chemical Treatment Selection Tool (UCPRC, 2018) can be used for selecting appropriate dust control methods. Based on site-specific data (e.g. material test results, traffic expected, objective of treatment, climate, etc.), the UCPRC’s tool provides treatment ratings and a list of suppliers. A limitation of this tool for an application to Central Plateau is that water limits cannot be specified for treatment selection.
5.2.4 General Construction and Other Surface-Disturbing Activities
Although general construction and other surface disturbing activities have the potential to generate dust emissions, they are typically limited to nuisance dust that can be appropriately controlled according to best management practices (BMP). BMP can consist of stabilizing soil surfaces, roughening surfaces, or reducing the surface wind velocity. A wide range of work strategies and engineered controls can be implemented. Staff awareness should be a priority so that tasks are adequately performed toward dust minimizing practices. Retaining or replanting as much vegetation as possible is also very effective form of reducing dust emissions. If plants must be removed, they can potentially be transplanted elsewhere to areas that need vegetation. Similar measures can be implemented for remedial actions such as maintaining and enhancing the existing soil cover, to isolate the waste from direct contact exposure. Land use restrictions would be required to limit access, and would also prevent unexpected dust emissions.

5.5
Construction or earthmoving activities occurring at waste sites, such as for the development of surface barriers must however be considered with more attention. The construction of a surface barrier consists by default to leave the contaminants in place at the waste site. Therefore, dust suppression water should be absolutely well controlled at these specific locations to avoid any unexpected remobilization of contaminants. Similarly to active excavation sites or stockpiles, managing the dust of an active disturbed surface during earthmoving activities without using water may be challenging. Therefore, a combination of proactive measures must be implemented Table 5-2. They may consists in windscreens, fences, timing of the activities, etc. More aggressive measures can also be implemented and may consists in using foaming agents, which, as stated before, are efficient to control dust and limit water use. Partial or total enclosure of the disturbed area may also be considered.
A summary of the different dust control measures that can be implemented depending on the activities are presented in Table 5-2.

5.6
Table 5-2. Applicability of Dust Control Measures for Central Plateau Activities
WORK STRATEGIES ENGINEERED CONTROLS Palliatives
ACTIVITY Minim
ize Disturbed/Cleared Area
Project Tim
ing/Work Schedulin
g
Minim
ize Drop Height
Limit/Reduce Vehicle Speed
Vehicle Cap
acity an
d Covers
Restrict Site Vehicle Access
Training of Site Personnel
Site/V
ehicle M
aintenan
ce
Limit Stockpile
Height/Slope
Street Sw
eepers
Windbreaks/Wind Barriers
Enclosure
Surface Rough
ening
Surface Upgrad
e/M
echan
ical
Stab
ilization
Mulch/G
round Cover
Removable Ground Cover
Vegetation/Revegetation
Water
Water plus Su
rfactants
Hygroscopic Salts
Polymers
Organ
ic Non‐Petroleum Products
Organ
ic Petroleum Products
Electrochemical Additives
Clay Additives
Active excavation site ✔ ✔ ✔ ✔ ✔ ✔ ✔ ✔ ✔ ✔ ✔ ✔ ✔ ✔
Inactive excavation site ✔ ✔ ✔ ✔ ✔ ✔ ✔ ✤ ✤ ✤ ✔ ✔
Active stockpile ✔ ✔ ✔ ✔ ✔ ✔ ✔ ✔ ✔ ✔ ✔
Inactive stockpile ✔ ✔ ✔ ✔ ✔ ✔ ✔ ✤ ✤ ✔ ✔ ✤ ✤
Traffic on unpaved roads ✔ ✔ ✔ ✔ ✔ ✔ ✔ ✔ ✔ ✔ ✔ ✔ ✔ ✔ ✔
Bulk materials transport ✔ ✔ ✔ ✔ ✔ ✔ ✔ ✤ ✤ ✤ ✤ Construction earthmoving/trenching
✔ ✔ ✔ ✔ ✔ ✔ ✔ ✔ ✔ ✔ ✔ ✔ ✔ ✔
Cleared/disturbed land surface
✔ ✔ ✔ ✔ ✔ ✔ ✔ ✔ ✔ ✔ ✔ ✔ ✤ ✔ ✔
Landscaping and Maintenance
✔ ✔ ✔ ✔ ✔ ✔ ✔ ✔ ✔ ✔ ✔ ✔
Legend:
✔ Applicable to Hanford
Likely Not Applicable
✤ Applicability depends on activity, duration, and material

5.7
5.3 Relative Cost of Dust Control Measures
The cost to implement dust control measures is a major factor in technology selection. Some methods (i.e., dust suppressants) have a limited period of performance, and require multiple applications. Similarly, initial cost of a dust control measure may be prohibitive (i.e., total enclosure, road stabilization) but may result in low maintenance cost thereafter which can make these measures cost effective in the long-term. Relative efficiency and cost of different dust control methods are listed in Table 5-3. This summary is based on a report from U.S. EPA (1991) including qualitative information about cost and efficiency of specific dust control methods, and cost range of dust palliatives provided in USACOE (2013) and Kestler (2009). However, costs associated with the implementation of a specific method is highly dependent on the site conditions, suppliers, products used, etc. Additionally, transport, installation and maintenance costs must be part of a comprehensive quote. While costs presented here are relative to each other, presenting them in this way highlights the advantages of implementing proactive work strategies in terms of effectiveness and cost compared to many of the more sophisticated, expensive engineered controls.
Table 5-3. Relative Effectiveness and Cost of Dust Control Measures
Dust Control Method Relative Effectiveness Low Medium High
Cost
Work Strategy Minimizing disturbed /cleared area X X X 1
Project timing/Work Scheduling X X 1 Minimize Drop Height X X 1 Limit/Reduce Vehicle Speed X X 1 Vehicle Capacity and Covers X 1 Restrict Vehicle Access X 1 Training of Site Personnel X 1 Site/Vehicle Maintenance X 1 Limit Stockpile Height/Slope X X 1 Street Sweepers X 1 Engineering Control Windbreaks/Wind Barriers X 1-2 Enclosure X 10 Surface Roughening X 1 Surface Upgrade/Mechanical Stabilization
X X 1-3
Covers/Ground Cover X X 2-3 Vegetation/Revegetation X X Palliatives Water X X 1 Water with Surfactants X X 2-3 Foam Suppressants X X 3-7 Water absorbing products X X 2-3 Organic Non-Petroleum Products X 2-6 Organic Petroleum Products X 2-6 Polymers X 2-4 Electrochemical and Enzymes additives
X 2-3

5.8
5.4 Elements of a Dust Control Plan
A dust control strategy to prevent and control fugitive dust emissions for work at a particular site are captured in dust control plans. Dust control plans related to Central Plateau activities need to specify an appropriate dust control technology for the activity, with objectives of protecting worker health and minimizing environmental impacts. With respect to application of liquids, minimizing environmental impacts implies minimizing the potential for facilitating contaminant mobilization in the subsurface. The type of dust control will depend on the type of activity and the site-specific meteorological conditions and soil characteristics.
The minimum requirements for a dust control plan (WDOE 2016) include:
Identification of all fugitive dust sources
A description of the dust control method(s) to be implemented for each source
A scheduled rate of application, with supporting calculations or other information to help identify how much and how often a control method should be applied
Information on monitoring and recordkeeping procedures
A backup plan in case the first dust control method is insufficient or is not working
Project roles and responsibilities, including contact information for the person in charge of implementing the dust control plan

6.1
6.0 Conclusions
Dust control measures are used to stabilize soil and reduce fugitive dust emissions from remediation activities occurring within the Central Plateau. Selection of dust suppressants should be based on their efficiency, cost-effectiveness, and potential environmental impacts. To date, water application is the only method used to prevent fugitive dust emissions on site; where the volume of water applied is determined based on visual monitoring. While this method is convenient due to the proximity of the Columbia River, potential infiltration of large amounts of dust suppressant water into the subsurface could facilitate mobilization of vadose zone contaminates and increase the flux of contaminants into groundwater and subsequent surface water.
To summarize dust control strategies relevant and applicable to reduce water application in the Central Plateau, the activities occurring at the Central Plateau and likely to generate fugitive dust were identified. Most of these activities are related to removal, treatment, and disposal of contaminated soils. These actions are likely to generate dust through excavation, vehicle movement, material transport, stockpiles, or backfilling actions occurring in different areas. Some of these activities may deal with contaminants, while some may not.
The impacts of water application for dust suppression were demonstrated through a case study generated for this assessment. A site within the 200 West Area was selected and an ensemble of hundreds of models were run varying water application rates and hydrogeologic properties to capture a representative system response in the Central Plateau. A wide range of aqueous and solute fluxes were simulated emphasizing the relationship between water application rate and contaminant transport. Based on the modeled behavior, a threshold was recommended limiting water application to 83 truckloads of water total over 5 years to a site of equivalent size (385 m2). This volume may be applied with continuous (2 mm/day) or variable rates; however, if larger rates are required, water application should not exceed 44 mm/day over an 83 day period. This recommendation may require additional dust control methods if the water application rate is not sufficient.
In response, dust control was shown to be implementable through various measures, including work strategies and engineered controls. Awareness is key to successful work strategies for dust control. Prior to implementing any new actions pertaining to dust control, it is essential to characterize both the nature of the dust generating activity and the site conditions to implement the most relevant combination of control methods. Duration of the activity, soil types, weather conditions, and environmental impacts are all the key considerations that must be evaluated. Reactionary application of dust palliatives may be the most prevalent approach but is indeed not the only response for dust control and should always be considered as a complementary solution to appropriate proactive work strategies.
With regard to environmental impacts, fluid application rates and scheduling should be recorded to manage infiltration of dust suppressant products into the subsurface and avoid or mitigate mobilization of contamination into water resources. While the application of chemical stabilizers may be an alternative to wet suppression, they are most effective in areas that receive limited traffic or disturbance and may lead to undesired adverse effects on human health and the environment if inappropriately applied. As previously stated, suppressant limitations, applications methods, and potential environmental impact will help narrow the selection of the most suitable palliative. Some dust palliatives may, for example, require a specific amount of fines content to properly bind and/or agglomerate. Also, in most cases, dust palliatives are not suitable for highly disturbed areas (i.e., stockpiles, active excavation sites). At Hanford, the use of chemical dust suppressant products must be evaluated to ensure that implementing a particular product as part of dust control strategy will be suitable for the evaluated need, meet all applicable federal, state, and local regulations and requirements for use and will not lead to adverse impacts.

6.2
In addition, a monitoring program to assess the effectiveness of dust control measures implemented is recommended. For example, air monitoring can be used to ensure the effectiveness of dust control measures at the site both in upwind and downwind positions, so that corrective actions can immediately be taken if needed. On-site weather station may also be used to control soil handling or excavation activities during high winds. While monitoring was not discussed in this evaluation, future work in this space includes development of dust control and monitoring plans that serve as templates for the Central Plateau.

7.1
7.0 Quality Assurance
The results presented in this report originate from work governed by the Pacific Northwest National Laboratory (PNNL) Nuclear Quality Assurance Program (NQAP). The NQAP implements the requirements of the United States Department of Energy Order 414.1D, Quality Assurance and 10 CFR 830 Subpart A, Quality Assurance Requirements. The NQAP uses ASME NQA-1-2012, Quality Assurance Requirements for Nuclear Facility Applications as its consensus standard and NQA-1-2012 Subpart 4.2.1 as the basis for its graded approach to quality.
Two quality grading levels are defined by the NQAP:
Basic Research - The required degree of formality and level of work control is limited. However, sufficient documentation is retained to allow the research to be performed again without recourse to the original researcher(s). The documentation is also reviewed by a technically competent individual other than the originator.
Not Basic Research - The level of work control is greater than basic research. Approved plans and procedures govern the research, software is qualified, calculations are documented and reviewed, externally sourced data is evaluated, and measuring instrumentation is calibrated. Sufficient documentation is retained to allow the research to be performed again without recourse to the original researcher(s). The documentation is also reviewed by a technically competent individual other than the originator.
The work supporting the results presented in this report was performed in accordance with the Not Basic Research grading level controls.

8.1
8.0 References
10 CFR 830, Subpart A. 2011. "Quality Assurance Requirements." Code of Federal Regulations, U.S. Department of Energy, Washington, D.C.
Abouelnasr, D. M. 2010. “The Relationship Between Soil Particle size and Lead Concentration.” In Proceedings of the Annual International Conference on Soils, Sediments, Water and Energy, Volume 14, Article 8, Available at: http://scholarworks.umass.edu/soilsproceedings/vol14/iss1/8
ADEC. 2008. Toxicity and Dust Suppressants, Air Quality Division, Alaska Department of Environmental Conservation, Juneau, Alaska. Antelope Valley Dustbusters Research Group. 2011. "Agricultural Guide to Controlling Windblown Sand and Dust." https://www.cdfa.ca.gov/oefi/docs/Drought_Measures_for_Dust.pdf ASME NQA-1-2012. "Quality Assurance Requirements for Nuclear Facility Applications." The American Society of Mechanical Engineers, New York, New York.
BCAA. 1996. Urban Fugitive Dust Policy. Beck, T. W., C. E. Seaman, M. R. Shahan, and S. E. Mischler. 2018. "Open-Air Sprays for Capturing and Controlling Airborne Float Coal Dust on Longwall Faces," Mining Engineering, 70(1):42-48. doi:10.19150/me.7978. http://www.ncbi.nlm.nih.gov/pmc/articles/PMC5769954/
Ben-Hur, M. and Keren, R., 1997. Polymer effects on water infiltration and soil aggregation. Soil Science Society of America Journal, 61(2), pp.565-570.
Ben-Hur, M., 2006. Using synthetic polymers as soil conditioners to control runoff and soil loss in arid and semi-arid regions—a review. Soil Research, 44(3), pp.191-204. Benedict, M. 2016. Methods for Dust Control, Department of Ecology, State of Washngton, Olympia, WA. Bilbro, J. D. and J. E. Stout. 1999. "Wind Velocity Patterns as Modified by Plastic Pipe Windbarriers," of Soil and Water Conservation, 54(3):551. Birst, S. and J. Hough. 1999. Chemical Additive Usage on Unpaved Roads in the Mountain Plains States, Upper Great Plains Transportation Institute N.D.S. University, Fargo, North Dakota. Blanco, H. and R. Lal. 2008. Principles of Soil Conservation and Management. Springer, New York. Bolander, P. and A. Yamada. 1999. Dust Palliative Selection and Application Guide, U.S. Department of Agriculture Forest Service Technology & Development Program, San Dimas, CA. Brandle, J. R., L. Hodges, and X. H. Zhou. 2004. "Windbreaks in North American Agricultural Systems," Agroforestry Systems, 61:65-78. Brown, J. and U. Turunc. 2014. "More Dust Control, Less Water," Mining Magazine, pp. 2.

8.2
Calvert, J. G. 1990. "Glossary of Atmospheric Chemistry Terms - (Recommendations 1990)," Pure and Applied Chemistry, 62(11):2167-2219. Cecala, AB, AD O’brien, J Schall, JF Colinet, WR Fox, RJ Franta, J Joy, WR Reed, PW Reeser, JR Rounds, and MJ Schultz. 2012. Dust Control Handbook for Industrial Minerals Mining and Processing Report of Investigations 9689 Department of Health and Human Services, Pittsburgh, PA. Chambers, J. C. 2000. "Seed Movements and Seedling Fates in Disturbed Sagebrush Steppe Ecosystems: Implications for Restoration," Ecological Applications,, 10(5):1400–1413. Chang, I., J. Im, and G.-C. Cho. 2016. "Introduction of Microbial Biopolymers in Soil Treatment for Future Environmentally-Friendly and Sustainable Geotechnical Engineering," Sustainability 8(3):251-260. Cong, XC, SL Yang, SQ Cao, ZL Chen, MX Dai, and ST Peng. 2012. "Effect of Aggregate Stockpile Configuration and Layout on Dust Emissions in an Open Yard," Applied Mathematical Modelling, 36(11):5482-5491. doi:https://doi.org/10.1016/j.apm.2012.01.014. Cornelis, W. M. and D. Gabriels. 2005. "Optimal Windbreak Design for Wind-Erosion Control.," Journal of Arid Environments, 61(2):315-332. Countess Environmental, 2006. WRAP Fugitive Dust Handbook. Contract No. 30204-111, Westlake Village, CA. Cruse, R. M., B. E. Berghoefer, C. W. Mize, and M. Ghaffarzadeh. 2000. "Water Drop Impact Angle and Soybean Protein Amendment Effects on Soil Detachment " Soil Science Society of America Journal, 64`(4). doi:10.2136/sssaj2000.6441474x. Deutsch, C.V. and Journel, A.G., 1992. GSLIB: Geostatistical Software Library and User's Guide. Hauptbd. Oxford university press. Easterly, R., D. Salstrom, and J. Pottmeyer. 2017. Upland Vegetation of the Central Hanford Site, HNF-61417, Prepared for U.S. Department of Energy, Mission Support Alliance, Richland, Washington. Eastern Research Group, I. 2016. Research Findings: Data Collection on Toxicity of Dust Palliatives Used in Alaska, EPA/600/R-16/166 O.O.R.a.D. U.S. Environmental Protection Agency, National Exposure Research Laboratory, Washington, DC.
Ecology. 2016. Hanford Air Operating Permit. Permit Number 00-05-006, Renewal 2, Revision B. Fang Y, D Appriou, DH Bacon, VL Freedman, ML Rockhold, CM Ruprecht, GD Tartakovsky, MD White, SK White, and ZF Zhang. 2015. eSTOMP User Guide. Available at http://stomp.pnnl.gov/user_guide/STOMP_guide.stm (Last updated March 2015). Fehmi, J. S. and T. M. Kong. 2012. "Effects of Soil Type, Rainfall, Straw Mulch, and Fertilizer on Semi-Arid Vegetation Establishment, Growth and Diversity," Ecological Engineering, 44 70– 77. Flerchinger, G. N., G. A. Lehrsch, and D. K. Mccool. 2013. "Freezing and Thawing | Processes." Elsevier, Inc., https://www.nwrc.ars.usda.gov/publications/2013/Flerchinger-Freezing%20and%20Thawing-Processes.pdf

8.3
Gebhart, D. L., M. L. Denight, and R. H. Grau. 1999. Dust Control Guidance and Technology Selection Key, USACERL REPORT 99/21, U.S. Army Construction Engineering Research Laboratories, Champaign, IL. Gee GW, AL Ward, BG Gilmore, MW Ligotke, and SO Link. 1995. Hanford Prototype-Barrier Status Report: FY 1995, PNL-10872, Pacific Northwest National Laboratory. Richland, WA. Graber, E.R., Fine, P. and Levy, G.J., 2006. Soil stabilization in semiarid and arid land agriculture. Journal of Materials in Civil Engineering, 18(2), pp.190-205. Grau, R. H. 1993. Evaluation of Methods for Controlling Dust, Technical Reppot GL-93-25, U.S. Army Corps of Engineers, Waterways Experiment Station W.E.S. U.S. Army Corps of Engineers, Vicksburg, MS. http://www.dtic.mil/dtic/tr/fulltext/u2/a270527.pdf Hajek, B. F. 1966. Soil Survey Hanford Project in Benton County Washington, Pacific Northwest Laboratory, Battelle Memorial Institute, Richland, WA. Halsted, GE, WS Adaska, and WT Mcconnell. 2008. Guide to Cement-Modified Soil (Cms), Portland Cement Association, Stokie, IL. Hartman, M.J., Morasch, L.F., Webber, W.D. 2003. Summary of Hanford Site Groundwater Monitoring for Fiscal Year 2002. PNNL-14187-SUM, Pacific Northwest National Laboratory, Richland, WA. Hoitink, D. J., K. W. Burk, J. V. Ramsdell, and W. J. Shaw. 2005. Hanford Site Climatological Summary 2004 with Historical Data, PNNL-15160, Pacific Northwest National Laboratory, Pacific Northwest National Laboratory, Richland, Washington. Hu, C., Y. Liu, L. Song, and D. Zhang. 2002. "Effect of Desert Soil Algae on the Stabilization of Fine Sands," Journal of Applied Phycology, 14:281-292. Irwin, K., Hall, F., Kemner, W., Beighley, E., and Husby, P.. 2008. Testing of Dust Suppressants Testing of Dust Suppressants for Water Quality Impacts, U.S. Environmental Protection Agency, Cincinnati, OH. Johnson, E. N. and R. C. Olson. 2009. Best Practices for Dust Control on Aggregate Roads, Minnesota Department of Transportation M.D.O. Transportation, St. Paul, Minnesota. http://www.lrrb.org/PDF/200904.pdf Jones, D. 2013. Literature Review on Selection and Specification of Unpaved Road Chemical Treatments, University of California. Jones, D. 2017. "Guidelines for the Selection, Specification and Application of Chemical Dust Control and Stabilization Treatments on Unpaved Roads." Guidelines, 156. University of California, Pavement Research Center, UC Davis, UC Berkeley. Kestler, M. 2009. Stabilization Selection Guide for Aggregate- and Native-Surfaced Low Volume Roads, USDA Forest Service. https://www.fs.fed.us/eng/pubs/pdf/08771805.pdf, last accessed September 2018. Kok, J. F., E. J. R. Parteli, T. I. Michaels, and D. Bou Karam. 2012. The Physics of Wind-Blown Sand and Dust, Reports on Progress in Physics, 75(10):72.

8.4
Last GV, GW Gee, EJ Freeman, WE Nichols, KJ Cantrell, BN Bjornstad, MJ Fayer, and DG Horton. 2006. Vadose Zone Hydrogeology Data Package for Hanford Assessments, PNNL-14702 Rev. 1, Pacific Northwest National Laboratory. Richland, Wasington. Lyles, L. 1988. "Basic Wind Erosion Processes," Agriculture, Ecosystems, and Environment, 22/23:91-101 Mattigod, S. V., and W. J. Martin. 2001. Radionuclide Activities in Contaminated Soils: Effects of Sampling Bias on Remediation of Coarse-Grained soils in Hanford Formation. PNNL-13624, Pacific Northwest National Laobratory, Richland, Washington. Mctigue E., J. H. Zimmerman, B. Duncan, L. Bertelsen, N. Gavrelis, and M. Deng. 2016. Research Findings: Data Collection on Toxicity of Dust Palliatives Used in Alaska, EPA/600/R-16/166, U.S. Environmental Protection Agency U.S.E.P. Agency, Washington, DC. Miller, R. L., R. V. Cakmur, J. Perlwitz, I. V. Geogdzhayev, P. Ginous, D. Koch, K. E. Kohfeld, C. Prigen, R. Ruedy, G. A. Schmidt, and I. Tegen. 2006. "Mineral Dust Aerosols in the Nasa Goddard Institute for Space Sciences Modele Atmospheric General Circulation Model," Journal of Geophysical Research, 111(D06208):19 NRCS, 2007. Fugitive Dust A Guide to the Control of Windblown Dust on Agricultural Lands in Nevada. USDA Natural Resources Conservation Service, Nevada. NQAP-2012, "Nuclear Quality Assurance Program (NQAP) Manual." Pacific Northwest National Laboratory, Richland, Washington.Bolander, P. and A. Yamada. 1999. Dust Palliative Selection and Application Guide, U.S. Department of Agriculture Forest Service technology & Development Program Piechota, T., J. Van Ee, J. Batista, K. Stave, and D. James. 2004. Potential Environmental Impacts of Dust Suppressants: “Avoiding Another Times Beach” U.S. EPA, Las Vegas, NV. Phillips, A. J. L., R. Gerlach, E. Lauchnor, A. C. Mitchell, A. B. Cunningham, and L. Spangler. 2013. "Engineered Applications of Ureolytic Biomineralization: A Review," Biofouling, 29(6):715-733. Pollack, D. and J. A. Organiscak. 2007. Airborne Dust Capture and Induced Airflow of Various Spray Nozzle Designs, Aerosol Science and Technology, 41(7):711-720. PRC-PRO-SMP- 53095, 2016, Data Quality Objectives Planning Process, Revision 0, Change 0, CH2M HILL Plateau Remediation Company, Richland, Washington. Rivas, T. 2006. Erosion Control Treatment Selection Guide. 0677 1203—SDTDC, U.S. Department of Agriculture, Forest Service SD1 (Sanitation District No. 1). 2007. Stormwater Best Management Practices (BMPs) Good Housekeeping Practices (GHPs) Activity: Dust Control and Tracking (DC). Ft. Wright, KY. Shao, Y., M. R. Raupach, and P. A. Findlater. 1993. "Effect of Saltation Bombardment on the Entrainment of Dust by Wind," Journal of Geophysical Research, 98(D7):12719-12726. Shillito, R. and L. Fenstermaker. 2014. "Soil Stabilization Methods with Potential for Application at the Nevada National Security Site: A Literature Review." 52. Desert Research Institute, Nevada System of Higher Education

8.5
Truex, M.J., Oostrom, M., Last, G.V., Strickland, C.E. and Tartakovsky, G.D., 2015. Evaluating Contaminant Flux from the Vadose Zone to the Groundwater in the Hanford Central Plateau. SX Tank Farms Case Study , PNNL-23737, Pacific Northwest National Laboratory, Richland, WA. Truex MJ, BD Lee, CD Johnson, NP Qafoku, JE Szecsody, JE Kyle, M Tfaily, MMV Snyder, AR Lawter, M Oostrom, GD Tartakovsky, II Leavy, EM Mcelroy, D Appriou, R Sahajpal, KC Carroll, L G.V., MH Lee, and DI Kaplan. 2016. Conceptual Model of Iodine Behavior in the Subsurface at the Hanford Site, PNNL-24709, Rev. 1, Pacific Northwest National Laboratory. Richland, Washington UCPRC. 2018. Unpaved Road Chemical Treatment Selection Tool. Accessed on 9/5/2018, 2018 at http://www.ucprc.ucdavis.edu/DustControl/Default.aspx (last updated 2018). University of Missouri Center for Agroforestry. 2015. "Chapter 6: Windbreaks." In Training Manual for Applied Agroforestry Practices – 2015 Edition, eds. M. Gold, M. Cernusca and M. Hall, pp. 92-114. University of Missouri, Center for Agroforestry, Columbia, Mo USACOE. 2013. Environmental Considerations for Selecting Cost-Effective Dust Control Technologies, Public Works Technical Bulletin 200-1-133 U.a.C.O. Engineers, Washington D.C. U.S. DOE. 2009. Proposed Plan for the Remediation of the 200-CW-5, 200-PW-1, 200-PW-3, and 200-PW-6 Operabale Units, DOE/RL-2009-117, revision 0, Richland, WA. U.S. DOE. 2012. Final tank closure and waste management environmental impact statement for the Hanford Site, U.S. DOE-RL, Richland, WA. U.S. DOE. 2013a. Environmental Assessment - Expansion of Borrow Areas on the Hanford Site, DOE/EA-1934, U.S. DOE-RL, Richland, WA. U.S. DOE. 2013b. "Hanford Site Assets and Attributes." Available at https://www.energy.gov/sites/prod/files/2013/04/f0/Hanford_Asset_Revitalization_Initiative.pdf U.S. DOE. 2013c. Hanford Site Revegetation Manual, DOE/RL-2011-116, Revision 1, U.S. Department of Energy, Richland, Washington. U.S. DOE. 2017a. Hanford Site Groundwater Monitoring Report for 2016, DOE/RL-2016-67, Revision 0, CH2MHill, U.S. Department of Energy, Richland, Washington. U.S. DOE. 2017b. Hanford Site Environmental Report for Calendar Year 2016, DOE/RL-2017-24, Prepared for U.S. Department of Energy, Mission Support Alliance, Richland, Washington. U.S., EPA. 1985. Handbook Dust Control at Hazardous Waste Sites, EPA/540/2-85/003. Hazardous Waste Engineering esearch LAboratory, Cincinnati, OH. U.S. EPA. 1988. Dust and Vapor Suppression Technologies for Excavating Contaminated Soils, GMM 006 1712, U.S. Environmental Protection Agency, Office or Research and Development, Cincinnati, Ohio.
U.S. EPA. 1992. Control of Air Emissions from Superfund Sites, EPA/265/R-92/012, U.S. Environmental Protection Agency, Washington, D.C.

8.6
U.S. EPA. 1991. Control of Air Emissions from Materials Handling During Remediation, Center for Environmental Research Information, Cincinnati, OH. U.S. EPA. 2006. "Compilation of Air Pollutant Emissions Factors (Ap-42) - Volume I: Stationary Point and Area Sources, Chapter 13: Miscellaneous Sources - Section 13.2.2 Unpaved Roads." U.S. Environmental Protection Agency, Research Triangle Park, North Carolina. WAC 173-400, “General Regulations for Air Pollution Sources.” Washington Administrative Code, Olympia, Washington. Available at: http://apps.leg.wa.gov/wac/default.aspx?cite=173-400.
WAC 173-460, “Controls for New Sources of Toxic Air Pollutants,” Washington Administrative Code, Olympia, Washington. Available at: http://apps.leg.wa.gov/wac/default.aspx?cite=173-460.
WAC 173-480, “Ambient Air Quality Standards and Emission Limits for Radionuclides,” Washington Administrative Code, Olympia, Washington. Available at: http://apps.leg.wa.gov/wac/default.aspx?cite=173-480.
Wang, Q., D. Wang, H. Wang, F. Han, X. Zhu, Y. Tang, and W. Si. 2015. "Optimization and Implementation of a Foam System to Suppress Dust in Coal Mine Excavation Face," Process Safety and Environmental Protection, 96:184-190.
Wang, HT, DM Wang, and WX Ren. 2011. "A New Technique for Preparation of Two-Phase Foam Materials for Controlling Mine Dust and Its Application," Advanced Materials Research, 328-330:372-375. doi:10.4028/www.scientific.net/AMR.328-330.372.
White MD, D Appriou, DH Bacon, Y Fang, VL Freedman, ML Rockhold, CM Ruprecht, GD Tartakovsky, SK White, and ZF Zhang. 2015. STOMP/eSTOMP User Guide PNNL-SA-108766. Available at http://stomp.pnnl.gov/user_guide/STOMP_guide.stm (Last updated March 2015).
Zhang ZF, CE Strickland, JG Field, and DL Parker. 2009. T Tank Farm Interim Surface Barrier Demonstration - Vadose Zone Monitoring FY08 Report, PNNL-18083 FINAL, Pacific Northwest National Laboratory. Richland, WA. Zhang, Z.F. 2017. Potential Impacts of Water Application for Dust Suppression on Contaminant Transport in the Vadose Zone, PNNL-26516, Pacific Northwest National Laboratory, Richland, WA.
Zuo, J, R Rameezdeen, M Hagger, ZH Zhou, and ZK Ding. 2017. "Dust Pollution Control on Construction Sites: Awareness and Self-Responsibility of Managers," Journal of Cleaner Production, 166:312-320.

A.1
Appendix A A.1 Source and Nature of Dust ................................................................................................. A.2
A.1.1 Erodibility and Particle Transport ......................................................................... A.3
A.2 Prevention through Work Strategies .................................................................................. A.4
A.3 Engineered Controls ........................................................................................................... A.5
A.3.1 Windbreaks or Wind Barriers ............................................................................... A.5
A.3.2 Mulches/Ground Covers ....................................................................................... A.7
A.3.3 Revegetation .......................................................................................................... A.7
A.3.4 Enclosure ............................................................................................................... A.8
A.3.5 Mechanical Stabilization ....................................................................................... A.9
A.3.6 Surface Roughening .............................................................................................. A.9
A.4 Dust Suppressants (Physiochemical Stabilizers) ................................................................ A.10
A.4.1 Water ..................................................................................................................... A.10
A.4.2 Water with Surfactants or Foaming Agents .......................................................... A.11
A.4.3 Water-Absorbing Products /Salts and Brines ........................................................ A.11
A.4.4 Petroleum Products ............................................................................................... A.12
A.4.5 Organic Non-Petroleum Products ......................................................................... A.12
A.4.6 Polymers ................................................................................................................ A.13
A.4.7 Electrochemical and Enzyme Additives ............................................................... A.14
A.4.8 Clay Additives ....................................................................................................... A.14
A.4.9 Cementation and Aggregation Agents .................................................................. A.14
A.4.10 Biological Binders ................................................................................................. A.15
Fugitive dust emissions are those generated from open sources/surfaces, in contrast with material discharged to the atmosphere from a controlled process stream, such as a smokestack or vehicle exhaust. A number of methods and technologies are available to control fugitive dusts, including methods to prevent surface dusts from becoming airborne and methods for capturing airborne dust. For any source of fugitive dust, the first consideration should be preventative measures to eliminate or reduce the primary generation of dust and the ensuing secondary re-entrainment. However, capture/control mitigation measures may also be necessary. In general, approaches to dust control are designed to achieve one or more of the following objectives:
Limit the creation or presence of dust-sized particles
Bind or agglomerate dust particles to prevent suspension

A.2
Reduce wind speed at ground level
Capture and remove airborne dust.
Identifying the best dust control technologies for a particular remediation activity or site requires knowledge of not only the site-specific conditions (including weather, climate, and soils) but also understanding the potential for dust generation. Section 8.0A.1 provides background information on the nature of dust. Subsequent sections discuss the methods and technologies available for dust suppression and control. Dust control methods fall into two high-level categories: work strategies and engineered controls. Engineered controls include methods to mitigate wind, protect open surfaces from wind, and suppress dust generation. Dust suppressants are liquid or solid materials that can be applied to stabilize soil surfaces to prevent particles from becoming airborne or can be applied to capture/control suspended dust particles.
A.1 Source and Nature of Dust
Dust can arise from a range of natural and man-made sources, with the composition of the dust depending on the nature of the source material. For the purposes of this report, “dust” generally refers to:
…small, dry solid particles projected into the air by natural forces, such as wind, volcanic eruption, and by mechanical or man-made processes such as crushing, grinding, milling, drilling, demolition, shoveling, conveying, screening, bagging, and sweeping. Dust particles are usually in the size range from about 1 to 100 µm in diameter, and they settle slowly under the influence of gravity. (Calvert 1990).
Dust forms from a wide range of materials, including sources such as disturbed soils, mine spoils, mineral deposits, construction and demolition debris, and pollen. Dust-forming activities common on the Hanford Central Plateau are discussed in Section 0 of this report. The amount of dust emission is affected by a wide range of factors:
material and site characteristics (e.g., particulate size distribution, moisture content, surface roughness)
climatic conditions (e.g., wind, precipitation, temperature)
control measures in place (e.g., wind barriers, soil stabilizers, dust suppression)
the amount and frequency of mechanical or climatic disturbance to which the material is exposed
Dust control is important for worker health because of the nature of the dust with respect to size and chemical composition. Particulate matter (PM) equal to or less than 10 µm in diameter—about 1/7th the thickness of a human hair—is referred to as PM10 (Figure A-1) and is categorized as respirable suspended particulate matter, which can be transported deep into the lungs. Respirable particulates can cause a broad range of health effects, in particular, respiratory and cardiovascular illnesses. Health risks are greater when the dust includes particle sizes of 2.5 µm or less, which are commonly referred to as fine suspended particles or PM2.5. Health effects from exposure to respirable dust stem from the small size, mineral content, and chemical composition. Silica, mercury, arsenic, and pesticide residues are some common examples of potential materials in dust that have health implications. The contaminants of concern at a waste site undergoing remediation may contribute to potential health risks; exposure to radionuclide contamination via fugitive dusts would be a particular concern at sites where the contaminants of concern are radionuclides.

A.3
Figure A-1. Size comparison of PM particles (from U.S. EPA website)
A.1.1 Erodibility and Particle Transport
The amount of dust generated during soil-disturbing construction and excavation activities or demolition depends primarily on the soil and site characteristics. In general, wind erodibility of soil depends on the soil sand/silt/clay composition, particle size, the aggregate size distribution, organic matter, calcareous nature, minerology, and soil moisture (Blanco and Lal 2008). Characteristics such as soil surface roughness, aggregate stability, vegetation cover, standing dry matter, and presence of frozen soil are additional factors influencing soil erodibility. Wind velocity and turbulence are, of course, key factors for wind erodibility of soil. Erodibility increases with decreasing soil particle size (e.g., a silt loam soil will be more susceptible than a gravelly loam at the same moisture content) (Blanco and Lal 2008). Erodibility of soils also varies by season according to the moisture content of the soils and whether soils are frozen or subject to multiple freeze-thaw cycles that can affect soil strength/aggregate stability (Flerchinger et al. 2013).
Wind erosion and transport of suspended dust involves three types of particle transport: suspension, saltation, and creep (Figure A-2). Suspension occurs when very fine dirt and dust particles are lifted into the air, either by the wind itself or as a result of impact with other particles (suspension can also occur as a result of mechanical entrainment from site activity, but that is not a component of wind erosion). The smallest particles (generally < 50 µm) can be transported long distances (miles to thousands of miles) when suspended (Shao et al. 1993; Kok et al. 2012 ). Saltation is the wind-driven, bouncing of particles across an erodible surface. As the particles bounce and jump along the ground, they impact the surface, which can disrupt soil crusts (both chemical and biological), dislodging additional particles, and causing finer particles of dust to be lofted and suspended in the air. Creep occurs when larger particles that are too heavy to be lifted into the air are rolled across the surface, which also acts to disrupt the surface and dislodge additional particles (Lyles 1988). The suspension and transport of dust particles by wind depends on their size, and the smallest particles of dust can remain suspended in the atmosphere up to several weeks (Miller et al. 2006). The largest and heaviest particles will settle first as wind velocity or air turbulence decreases, while the smallest particles will remain in suspension.
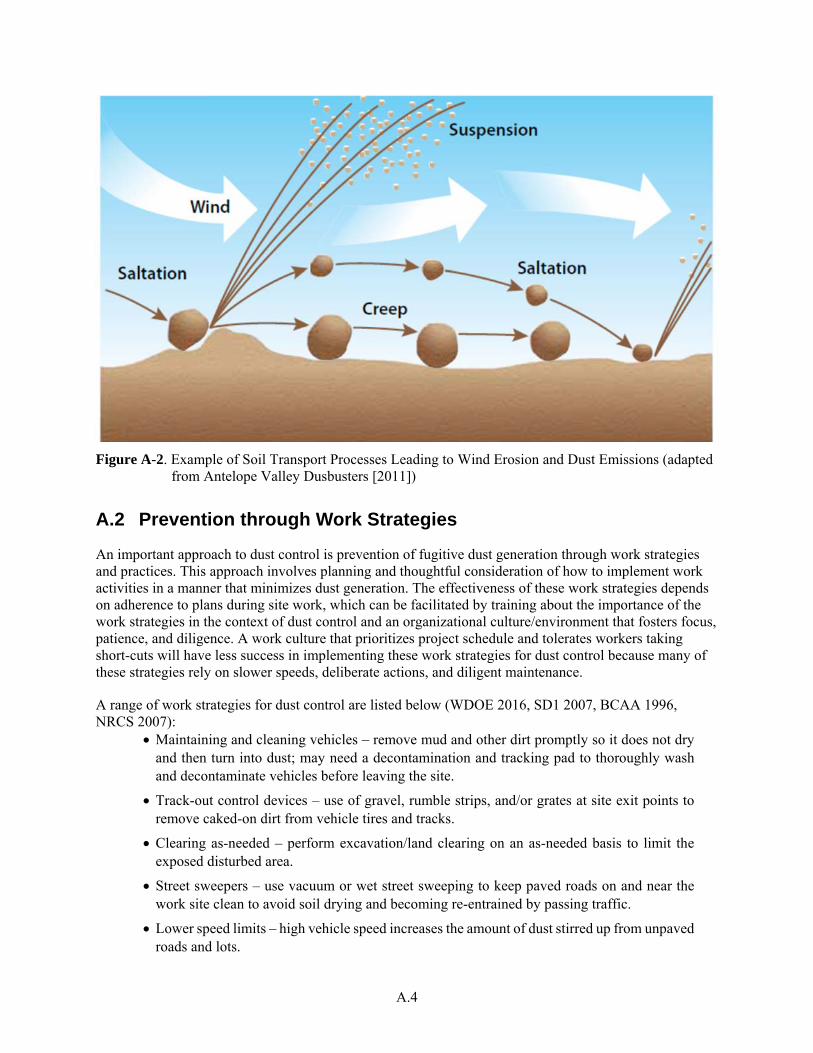
A.4
Figure A-2. Example of Soil Transport Processes Leading to Wind Erosion and Dust Emissions (adapted from Antelope Valley Dusbusters [2011])
A.2 Prevention through Work Strategies
An important approach to dust control is prevention of fugitive dust generation through work strategies and practices. This approach involves planning and thoughtful consideration of how to implement work activities in a manner that minimizes dust generation. The effectiveness of these work strategies depends on adherence to plans during site work, which can be facilitated by training about the importance of the work strategies in the context of dust control and an organizational culture/environment that fosters focus, patience, and diligence. A work culture that prioritizes project schedule and tolerates workers taking short-cuts will have less success in implementing these work strategies for dust control because many of these strategies rely on slower speeds, deliberate actions, and diligent maintenance.
A range of work strategies for dust control are listed below (WDOE 2016, SD1 2007, BCAA 1996, NRCS 2007):
Maintaining and cleaning vehicles – remove mud and other dirt promptly so it does not dry and then turn into dust; may need a decontamination and tracking pad to thoroughly wash and decontaminate vehicles before leaving the site.
Track-out control devices – use of gravel, rumble strips, and/or grates at site exit points to remove caked-on dirt from vehicle tires and tracks.
Clearing as-needed – perform excavation/land clearing on an as-needed basis to limit the exposed disturbed area.
Street sweepers – use vacuum or wet street sweeping to keep paved roads on and near the work site clean to avoid soil drying and becoming re-entrained by passing traffic.
Lower speed limits – high vehicle speed increases the amount of dust stirred up from unpaved roads and lots.

A.5
Work scheduling – limit dust-generating work on windy days and provide mechanism for work stoppage when conditions change.
Alternate routes – encourage the use of alternate, paved routes, if available.
Access control – limit access to the work site.
A.3 Engineered Controls
This section describes dust control methods that act to reduce the wind velocity at the soil surface—revegetation—or protect the ground surface—ground covers, and wind barriers or windbreaks. Revegetation and incorporated mulches also act to stabilize the upper layer of soil (e.g., through root penetration, changes in particle size distribution, or addition of organic matter which changes the erodibility of the soil).
A.3.1 Windbreaks or Wind Barriers
Reducing the wind velocity at the surface and across the area of potential dust generation can decrease the amount of fugitive dust transported away from the site and can also act to decrease the total amount of dust generated. Windbreaks and shelterbelts refer to structures and vegetation that reduce wind velocity (Brandle et al. 2004). Windbreaks can be a single element or a system of elements that act to reduce the effect of wind velocity not only at the windbreak, but at predictable windward and leeward distances. Barriers emplaced in upwind positions that act to slow wind speed or ‘break’ the wind can be developed using man-made materials or vegetation, depending on the site and timeline for activities occurring on and adjacent to the active surface. These types of structures may be referred to as wind barriers, windbreaks, and wind screens. Windbreaks can also refer to vegetation planted in rows along the upwind boundary of an area, called shelterbelts. Proper selection of material, installation, and maintenance are required for wind barriers to be effective.
The main structural elements that determine windbreak or windscreen performance include the height of the structure or plants, density, orientation, length, width, and continuity or uniformity of the windbreak materials (University of Missouri Center for Agroforestry 2015). The height of the windbreak is one of the most important factors to consider in reducing wind velocity and dust emissions. Windbreaks can act to reduce wind velocity for distances 2 to 5 times the height of the windbreak on the upwind side, and for distances as great as 30 times the height on the downwind side of the barrier, depending on the configuration.
Windbreak density or porosity is also a critical structural element affecting windbreak performance. The porosity refers to the ratio of the solid portion of the barrier to the total area of the barrier, and determines the degree to which approach winds can pass through the windbreak (University of Missouri Center for Agroforestry 2015). The more porous the windbreak, the more wind passes through it. Solid wind barriers or windbreaks with minimal porosity act to block the wind on the upwind side causing air pressure to build up on the windward side and a zone of low pressure to develop on the leeward side. The higher air pressure on the windward side acts to push air over the windbreak and the zone of lower pressure acts to pull air coming over the windbreak, creating turbulent conditions on the downwind side that, in turn, decrease the protective distance on the leeward side of the windbreak. As the porosity of the windbreak is increased, the amount of air passing through the windbreak increases, moderating the pressure differences between the windward and leeward sides, and thus reducing the level of turbulence.

A.6
Figure A-3. Illustration of the Effects of Windbreak Porosity on Protective Distance Achieved Downwind (from Saskatchewan Ministry of Agriculture website)
Wind barriers, such as solid board fencing, crate walls, or hay/straw bales can be placed in an upwind position of the dust source and positioned perpendicular to the prevailing wind direction to slow wind velocity and reduce dust emissions. Wind barriers can also create zones of deposition of PM on both the upwind and leeward sides of the barrier. Porous windbreaks can be constructed using plastic pipes, lath fencing, or other materials that are robust to the environmental conditions at the site and can be constructed to withstand the expected winds at Hanford. Cornelius and Gabriels (2005) indicate that a windbreak porosity between 20% and 50% is considered to give the maximum shelter over the longest leeward distance. The porosity can be achieved by vertical or horizontal slatting or by a mesh structure, as long as the element size is no more than about a fifth of the fence height.
In high elevation desert regions of Southern California, wind barriers were constructed of plastic pipes and tested as a dust control measure for large area land management (Antelope Valley Dustbusters Research Group 2011). The plastic-pipe (2.31 cm [0.91 in] diameter × 100 cm [3.3 ft] length), were emplaced to stand perpendicular to the soil surface, creating low-cost windbreaks. The efficiency of the plastic pipe windbreaks was compared to vegetation and slat-fence wind barriers, and was found to perform better than vegetation and nearly equal to the efficiency of a slat-fence in reducing downwind velocities (Bilbro and Stout 1999).
Vegetation can also be planted at various densities in a single row or multiple rows to achieve a more or less porous windbreak or shelterbelt. Development of a shelterbelt uses intensive management practices to grow trees, shrubs, and/or grasses in one or more closely spaced rows upwind or around the area to be protected. At the Hanford Site, it is likely that vegetation grown to produce shelterbelts designed to protect large disturbance areas would require irrigation to establish and maintain the desired vegetation type and density. The design of the shelterbelt always includes a row or rows of vegetation perpendicular to the prevailing winds that affect the area of dust emission and, depending on wind direction variability, may be designed to surround a disturbance area.

A.7
A.3.2 Mulches/Ground Covers
Mulch is a layer of material applied to the surface of soil. Organic or non-organic mulch can be applied by itself as a dust control method (though organic mulch can also be used alongside revegetation approaches, as noted in Section A.3.1). Potential mulching materials include gravel, large rocks, rubber, plastic sheeting, straw, pine needles, wood chips/bark, paper/pulp materials, bonded-fiber matrices, etc. (Rivas 2006), IDEQ 2005). These materials protect the soil surface from direct wind action and saltation processes, and can also act to reduce evaporation and maintain soil moisture. Lightweight organic mulches, such as paper or straw, can be blown away from the stabilization area and thus may be less effective in reducing dust than mulches consisting of denser materials such as wood fibers or gravels. Hydromulching techniques, as described in Section A.3.1, can be employed to spread some mulch materials, along with soil fixatives, across surfaces to be protected. Depending on site conditions, mulch materials may be crimped/pressed into the surface soil and are sometimes incorporated into the top 2 or 3 inches of soil (e.g., incorporating mixed-size gravel with surface soil).
A.3.3 Revegetation
Revegetation of sites can be implemented to reduce wind erosion and dust emission through the growth and development of root systems that stabilize shallow soils near the surface and by providing aboveground structures (plant stems and leaves) that reduce wind speed near the ground surface.
Revegetation strategies are implemented when an area will not be disturbed for a period of time or at the conclusion of soil-disturbing activities. Different strategies can be employed to achieve interim stabilization of an area with vegetation versus efforts to begin restoration of native vegetation on a remediated site that will not be further disturbed. The methods and recommended plant species for use on Hanford are outlined and discussed in detail in the Hanford Site Revegetation Manual (DOE 2013c).
Interim stabilization (per the Hanford Site Revegetation Manual) refers to planting or stabilizing the soil surface in areas that will be subject to future disturbance. For short-term stabilization (less than one year), the ground surface may be stabilized using fixatives and/or short-lived vegetation covers until final revegetation and restoration actions can be planned and implemented, or until the land area is utilized for other purposes. Interim stabilization of denuded areas with vegetation should be accomplished using non-persistent annual species or sterile hybrid species (such as sterile wheatgrass hybrids, white oats, barley, or cereal rye) that are not expected to colonize areas outside of the planted revegetation area. If an area needs to be stabilized for longer time periods (several years or more), the site should be revegetated by planting perennial grasses until the site can be fully remediated or developed for another purpose.
Conducting revegetation actions in semi-arid ecosystems is often difficult because water availability can severely limit plant establishment, growth, and survival. It is important to note that the timing of seeding or transplanting is critical to successful revegetation of sites at Hanford. Most of the plants appropriate for revegetation of upland areas of the Hanford site are cool-season plants that either germinate or can be established in late fall or very early spring (February and March) when soils are moist. Seeding or planting in later spring months or late in the summer will require supplemental irrigation for an extended period to ensure plant establishment and survival, and is not recommended (U.S. DOE 2013c).
Organic mulches can be added as a soil amendment as part of the revegetation strategy (either for interim stabilization or native plant restoration). These mulches control erosion and facilitate plant establishment (Fehmi and Kong 2012). Straw and hay mulch can be added to the top soil layer or crimped (implanted) into the surface soil after seeding to conserve soil water by decreasing surface evaporation. Soil treatments that increase roughness, provide a wind barrier, or prevent seeds from blowing away or being

A.8
washed away can trap or retain the highest numbers of seeds, and (Chambers 2000). Retaining seeds and retaining soil water improves the probability of seed establishment.
Soil amendments to aid plant establishment can also be applied using hydroseeding techniques. Hydroseeding, sometimes called hydraulic mulch seeding or hydromulching is a process that applies a slurry mixture of seed and mulch to the soil surface. The slurry mixture may also include other additives, such as fertilizer or soil fixatives (tackifiers), which can act to stabilize the soil surface and reduce dust emissions. In hydroseeding, water-laden mulch with seeds is shot from a high pressure hose or spray gun across the area to be planted (Figure A-4). This forms a mat or blanket that holds the seeds in place, retains soil moisture, and resists wind and water erosion to create favorable conditions for seed germination. Mulch used in hydroseeding often contains organic materials such as wood fibers, sawdust, cotton fibers, straw, or paper.
Figure A-4. Example Illustrating the Application of Hydromulch with Seeds for Revegetating Remediated Areas
A.3.4 Enclosure
Dust containments enclosure systems are an effective means to control fugitive dust emissions from open dust sources. Enclosure allows dust emissions to remain near the source by protecting or isolating the working areas from the near environment. Enclosure systems includes a wide range of structures, from partial enclosure (i.e., 2-, 3-, 4-sided enclosure) to complete enclosure (e.g., tent structure).
The modularity of the structures can offer different level of complexity and can be adapted to different needs depending on the work areas where dust emissions must be controlled. Enclosure wraps can be

A.9
made from polyethylene, vinyl, and various other fabrics, while the structure itself is often made of aluminum, or lightweight material. Erecting a complete enclosure system around an environmental remediation area ensures that the activities can continue undisturbed through any weather conditions as the enclosure wrap can offer rain-resistant, and wind-resistant properties. Most of the vendors of enclosure systems propose flexible structures with minimal foundations requirements. Additionally, options are available to obtain negative pressure in the confined work area which is particularly well suited for remediation sites, and excavation activities. Changes can usually be made to the design of the structure to meet the expected needs, and the system can potentially be relocated on the same site as work progress in specific areas.
Figure A-5. Example of Remediation Site Enclosure (https://www.bnd.com/news/local/article41718903.html)
A.3.5 Mechanical Stabilization
Mechanical stabilization consists in improving the physical properties of soils using mechanicals means. It involves soil compaction and densification. This can be achieved by blending soils of two or more classifications or gradations to obtain a material meeting required specifications. The blended material can then be spread and compacted. Alternatively, fibrous or other no biodegradable reinforcing material (e.g., geosynthetics, geocomposites, fibers), can be added or physically placed with the geomaterial to improve strength (Kestler, 2009).
A.3.6 Surface Roughening
Surface roughening is recognized as a dust control measure on unprotected surfaces. Surface roughening is a temporary practice, usually incorporated during grading of a surface that limits dust emissions by

A.10
reducing the flow velocity runoff. When wind blow across a smooth disturbed ground the entire surface, creating a potential for fugitive dust emissions. Tilling or discing the surface produces a rough surface, or ridges, which, when perpendicular to prevailing winds can reduce wind erosion and associated dust emission.
A.4 Dust Suppressants (Physiochemical Stabilizers)
Dust suppressants, sometimes referred to as dust palliatives, abate dust by changing the physical properties of the soil surface by either agglomerating the fine particles, adhering/binding the particles together, or increasing the density of the surface material. They reduce the ability of the surface particles to be lifted and suspended by light friction/abrasion or wind. Dust suppressants can also be sprayed at dust emission sources to abate dust by modifying the physical properties of the active surface or the material being handled. Methods to capture airborne dust at actively worked surfaces include the use of misters and spraying to entrain airborne particles as they are generated (e.g., water sprays directed at equipment conducting waste site excavation or building demolition to prevent formation and transport of contaminated dust).
Numerous dust suppressants are available and range from plain water to water with additives to other chemicals or blended mixtures. Most commercial product formulations are considered proprietary, so detailed information on the constituents is generally unavailable. Although product descriptions use terms such as “biodegradable,” “environmentally friendly,” and/or “safe and effective,” very little information is available to compare specific products or their efficacy (Shillito and Fenstermaker 2014). In general, dust suppressants fall into the following categories: water, water absorbing products (hygroscopic salts), cementation products, petroleum-based products, organic nonpetroleum products, electrochemical additives, polymers, and clay additives (Bolander and Yamada 1999; Shillito and Fenstermaker 2014).
A.4.1 Water
Water used alone is a common dust suppressant and is usually the most cost-effective short-term solution for dust control. It can be applied to soil surfaces or to materials to prevent dust generation—adding or spraying water prevents dust by increasing the humidity and moisture content at the surface, thereby temporarily agglomerating the particles and preventing them from being entrained, suspended, and transported. However, this effect is temporary, depending on the evaporative demand and the rate at which the surface dries. The length of time that particles remain agglomerated depends on the material properties, temperature, and relative humidity. Water can also be sprayed through the air to capture and control airborne dust—water droplets collide with dust particles, capturing the particles and carrying them to the ground. Disadvantages of regular use of water may include increasing the slipperiness of surfaces, formation of mud (Jones 2017), and limitation on use when temperatures fall below freezing. Adding too much water may form puddles of standing water, muddy conditions, and increased infiltration of water to groundwater. Too little water will not provide adequate wetting of the material, which is critical to ensure that smaller dust particles stay adhered to larger particles and do not become airborne.
Water can be sprayed through the air toward a working surface to prevent dust emissions during material handling or activities that disturb surfaces or crush/grind materials, such as excavation and soil removal/dumping, demolition of structures, or explosive demolition. Water sprayed through the air toward construction or demolition areas and surfaces captures airborne dust particles and carries the particles to the ground. Water applications intended to capture and remove airborne dust are most effective when the dust particles collide with water droplets of an equivalent size. Droplets that are too large don’t collide efficiently with smaller dust particles, but if the water droplets are too small, the water can evaporate too quickly and release any captured dust particles.

A.11
Water systems for dust suppression generally use some type of spray nozzle to apply water (with or without chemical additions) to the soil surface and/or to the equipment disrupting a surface or structure. The application equipment for prevention and suppression systems differs in the type and operation of the spray nozzles. The types of spray nozzles, addition of compressed air, and resulting droplet size can all be tailored to match the characteristics of the dust generated. Analysis of the dust characteristics (e.g., particle size, mineralogy) will help determine how much water is required, the best droplet size, and the best application method to prevent dust.
Studies have shown differences in airborne respirable dust removal rates for various spray nozzle designs (Pollack and Organiscak 2007; Beck et al. 2018). Pollock and Organiscak (2007 found that spray nozzle designs with wider nozzle angles reduce water droplet sizes and droplet velocities, but induce more air flow. Increasing water pressure to the spray also reduces water droplet sizes and increases the droplet velocities. There are tradeoffs between airflow inducement and dust capture efficiency—that is, spray designs that induce higher air flow tend to have lower dust capture efficiency, while sprays with high dust capture efficiency tend to have low airflow inducement. In most operations, drops less than 200 microns are better at suppressing airborne dust particles.
For situations where water must be applied repeatedly to prevent dust formation and emissions, chemicals such as synthetic polymers or other organic dust suppressants discussed in the following sections can be applied along with water to bind soil particles together, extend the period of dust control, and significantly decrease the amount of water necessary to achieve fugitive dust control. These chemicals can be used in lower concentrations with water to allow earthmoving or in higher concentrations to form a firm, stabilizing crust.
A.4.2 Water with Surfactants or Foaming Agents
Addition of surfactants to water can decrease the amount of water needed and improve the dust suppression. Surfactants are non-petroleum based organic chemicals that, when added to water, reduce surface tension and improve the water’s ability to wet surfaces and form fine droplets (Jones 2017). After water evaporates, the surfactants remain with the particulate matter and the residual surfactant can increase particle agglomeration through electrostatic attraction. Surfactants also allow for better water penetration into subsurface soil layers before or during active earthmoving.
Some dust suppressants can also be applied as foams. Foaming agents convert water and air (may require compressed air) into foam that can be sprayed or blown on surfaces. Foam provides greater surface area and better wetting and adhesion to dust particles. Dust control foam is a stable, small-bubbled foam with a consistency similar to shaving cream. Foaming agents are primarily high foaming surfactants, and dust control foams may also contain wetting and binding agents. Dust control foam functions similarly to liquid spray wet suppression, in that the foamed liquid wets and agglomerates fine particles (Brown and Turunc 2014). The advantages of foam over liquid sprays are improved liquid distribution resulting in lower liquid feed rates; and improved fine particle capture, which can reduce breathable dust. Entrainment of air into the liquid to form bubbles increases the liquid surface area and thus provides better distribution of the liquid across the treatment area. The increased efficiency in distribution of the liquid can reduce water requirements in wet systems by as much as 50% or more (Wang et al. 2015).
A.4.3 Water-Absorbing Products /Salts and Brines
Water-absorbing salts can be applied to surfaces or mixed into the surface to provide hygroscopic functionality by absorbing small quantities of water from the atmosphere, agglomerating the fines, and holding the aggregate matrix together through suction forces. The two most common water-absorbing

A.12
product treatments are calcium chloride and magnesium chloride (Jones 2017). This type of treatment is typically applied to suppress dust on gravel or aggregate roads. The salts can be purchased as powders, pellets, flakes, or in water solutions (Bolander and Yomada 1999). However, hygroscopic salts do not work well in excessively wet or excessively dry climates. In wet regions, the salts dissolve under heavy precipitation and leach through the soil. In semi-arid regions, such as Hanford, the low humidity during the summer months may not be sufficient for the salts to effectively absorb water. Both calcium chloride and magnesium chloride require relative humidity levels of greater than 20% to begin water absorption (Bolander and Yamada 1999). In addition, treatments on sandy gravels may be less effective than treatment of materials with finer particle sizes (Johnson and Olson 2009).
A.4.4 Petroleum Products
Petroleum-based products have a long history of use for stabilizing soils and reducing dust emissions. The available treatment products are derived from petroleum refining and include diluted asphalt emulsions (created by dispersing asphalts as small droplets of water), base and mineral oils, petroleum resins, and synthetic fluids (Jones, 2017). Petroleum products are generally not water soluble or prone to evaporation and can be very effective for dust control. Their adhesive and waterproofing properties provide excellent dust mitigation by binding surface particles. However, toxic materials in waste oils can cause significant adverse environmental effects unless processed to remove toxins. Currently a number of petroleum products are viewed as being detrimental to the environment. Diesel fuel, cutback asphalts (cutback asphalts are the result of a solvent added to asphalt cement), motor oil, and other related materials have been virtually eliminated from use. Petroleum products can also discolor the land surface and produce unpleasant odors (Shillito and Fenstermaker 2014). Some petroleum-based products may be carcinogenic. They contain semi-volatile (PAHs) and volatile organic compounds VOCs, some of which are known human carcinogens (Eastern Research Group 2016)
Asphalt emulsions, petroleum resins, and synthetic fluids with binders have a cementing action that stabilizes the treated surface and preserves fine particles. A number of asphalt emulsions have been approved for use and are effective for use across a broad range of soil types and climates. These products do not lose effectiveness through typical climatic variations and are most often applied to stabilize trafficked surfaces, but their use is expensive due to the greater material costs and specialized application equipment (USACOE 2013). Multiple treatments may also be necessary, depending on the dust control problem being addressed (Bolander and Yamada, 1999). Asphalt emulsions are often heated, which can result in the release of vapors containing PAHs and VOCs (ADEC 2008).
Base oils and synthetic fluids without binders also provide dust control/fines preservation. Base or mineral oil does not dissolve in water and is not diluted for application (Jones 2017). It is often mixed with a binder such as an organic non-petroleum treatment, another organic petroleum treatment, or a synthetic polymer to improve stabilization properties. Synthetic fluids are similar to base oils in terms of properties and performance, but the processing produces a more refined oil, which has less environmental impact and fewer use restrictions (Jones 2017).
A.4.5 Organic Non-Petroleum Products
Organic non-petroleum products include substances such as glycerin/glyceride-based treatments; lignosulfonates; molasses or sugar-based treatments; plant oils (e.g., soy, linseed, rapeseed, canola, or palm oils); and resins such as tall oil pitch rosins. Organic non-petroleum constituents are primarily derived from plant-based industries including the food industry and paper industry. Organic treatments are often blended to produce dust suppression products—either as a blend of two or more organic treatments or blends of an organic treatment with calcium or magnesium chloride, base/mineral oils,

A.13
synthetic fluids or synthetic polymers (Jones 2017). These products act as a “glue” to bind or agglomerate fines and coarser particles, and are effective to control dust either as a topical application or as a mixed in treatment. Most of the materials are water-soluble and generally require re-application to remain effective (Jones 2017).
Glycerin is derived from plant or animal based resources or can be produced from biodiesel production or from petroleum feedstock. Glycerin acts to retain moisture and can be blended with other organic non-petroleum products to promote particle agglomeration. These blends generally provide enhanced particle binding and resist leaching compared to individual treatments (Jones 2017).
Lignin is a crosslinked polymer in plant cells providing mechanical strength and its derivatives (lignosulfonate) are effective soil binders. Lignosulfonate is derived from wood that has been treated with sulfuric acid to produce paper fiber and waste liquor, which contains the lignin. Lignosulfonate is an effective soil binder, but it also acts as a clay dispersant, which allows soil particles to compact while increasing the plasticity of the treated surface. Lignin products may be applied topically mixed-in-place (Birst and Hough 1999). Lignosulfonate is water soluble and forms acids that may decrease the pH of waters that it contaminates (USDA, 2013), promoting corrosive effects. A study of application of pine sap treatment and a calcium lignosulfonate blend showed that the treatments withstood heavy vehicle traffic on unpaved roads in desert systems (Grau 1993; Birst and Hough 1999). Tree resins (tree sap obtained from trees or tall oil from pulping processes) can be mixed with additives (usually proprietary blends) to cement and provide some waterproofing of the soil surface. They are used as adhesives and emulsifiers and are not widely available for dust suppression (Jones 2017). Tall oil derivatives may require one treatment every few years, whereas lignin derivatives may require one to two treatments per season (Bolander and Yamada, 1999).
Plant oils can be used for dust suppression and include soybean, linseed, rapeseed, canola, corn, and palm oils (Jones 2017). Plant oils from food-industry wastes have many characteristics of light petroleum oils, provide a degree of particle binding, and may even provide organic matter to the soil (Skorseth and Selim, 2000; Graber et al. 2006). Soybean oil protein amendment was found to increase soil shear strength and decrease soil detachment (Cruse et al. 2000). The effect of plant oil penetration on soil water infiltration rates is unknown. Bolander and Yamada (1999) recommend one treatment per season for dust abatement.
Molasses and sugar-based treatments act to bind soil particles together. The effectiveness of these treatments depends on the procedures used to process the plant materials, and the type and quantity of complex sugars remaining after refining (Jones 2017). Molasses residues are water soluble. Molex is a by-product of sugar beet processing. Similar to chloride additives, molex also exhibits hygroscopic properties that help maintain a moist surface. The moisture agglomerates soil particles together, which are then less likely to become airborne.
A.4.6 Polymers
Polymers, both natural and synthetic, are probably the most ubiquitous constituent of soil stabilization additives besides water (Shillito and Fenstermaker 2014). Polymers are large, long-chain molecules with a high charge density composed of small, repeating units (monomers). Polymers can be cationic, anionic, or nonionic. Anionic polymers are the most common form used in soil amendments and can promote the formation of larger floccules (loose aggregations suspended in liquid) that settle out of solution in the presence of cations. As only a small part of the anionic polymer is involved in adsorption, the remaining polymer tail can form bridges between particles. The net effect is one of strengthening soil aggregates, increasing infiltration, and decreasing runoff; therefore, reducing erosion (Ben-Hur and Keren 1997; Ben-Hur 2006; Graber et al. 2006; Shillito and Fenstermaker 2014).

A.14
Synthetic polymer emulsions can be diluted in water when applied, but once they have dried they should not re-emulsify or leach from the road (Jones 2017). Generally, they are not effective as spray-on applications due to their forming a “skin” on the surface of the road that typically abrades relatively quickly under traffic; however, some manufacturers have introduced specific formulations that avoid this (Jones 2017). Ultimately, the effectiveness of any particular polymer formulation is dependent upon the type of polymer, as well as the physiochemical properties of the soil upon which it is applied and the application objective.
It should be noted that synthetic polymers generally do not meet the requirements of the USDA BioPreferred®
Program unless they contain a sizeable organic non-petroleum binder component; however, a few products that do meet the biobased qualifications. One example provided by the USDA is X-Hesion Pro®, a non-chloride soil stabilization product that helps eliminate chlorides from being introduced into the environment. X-Hesion Pro® will help bind smaller dust particles together and as a result, help reduce dust to a PM10 Standard. The use of X-Hesion results in a road surface that is compact, water resistant, and durable (USDA).
A.4.7 Electrochemical and Enzyme Additives
Electrochemical and enzyme stabilizers act by creating an electrochemical and/or enzymatic bond between fine particles that reduces the particles affinity for water (Jones 2017). Although these chemicals do promote binding of fine particles, dust control over long periods is often insufficient for the treatments to be considered as dust suppressants. These stabilizers may be incorporated and then followed by a separate dust suppression treatment on the surface. Electrochemical additives include sulfonated petroleum, ionic stabilizers, and bentonite. These products neutralize soil types that attract water and allow bonds to form between particles. Electrochemical stabilizers need to be worked into the upper layers to provide dust control and require relatively high clay contents to perform satisfactorily. It is unlikely that these types of products would be useful for application to most Hanford soils, which are generally silt loams, sandy loams or sands (Hajek 1966).
Enzymatic stabilizers contain protein molecules that lower surface tension in water and catalyze specific chemical reactions with soil molecules to form a cementing bond and reduce the soil’s affinity for water (Jones 2017). These products require the presence of clay and a relatively high fines content (typically more than 20 percent passing the #200 [0.075 mm] sieve) to work effectively. It is not likely that these products would work well with soils found on the Hanford Site.
A.4.8 Clay Additives
Clay additives are used to mechanically stabilize unpaved road materials that have low fines contents and/or too low plasticity. Bentonite is the most common clay additive—and the clays must be thoroughly mixed into the soils. Addition of clay leads to agglomeration of fine particles, but, as with electrochemical additives, the level of dust control is usually insufficient and an additional dust suppression treatment at the surface is required. Clay additives are most useful in construction and maintenance of unpaved roads and are not likely to be a satisfactory dust suppression treatment for Hanford applications.
A.4.9 Cementation and Aggregation Agents
Cement, concrete, and lime have a long history of use to stabilize soils and protect against wind and water erosion. A wide range of cement-based paving options are available and it would be elusive to list them all. From a general perspective, the type of application determines the amount of cement needed. For

A.15
instance, soil treated with a relatively small proportion of cement (2 to 6 percent) are referred to as “cement-modified soil” (CMS) (Halsted et al., 2008). The soil treatment consists in combining soil with cement and water which are then compacted. Because of the small quantities of cement used, CMS forms a semi-rigid pavement of relatively low strength that may be well suited for low traffic areas. Alternatively, “soil-cement” refers to a highly compacted mixture of soil, cement and water with a higher concentration of cement, generally ranging from 5 to 11 percent. Soil cement are impervious to water and provides a high strength, and are well suited for trafficked areas.
Hydrated lime is also a common method used for soil stabilization. Although hydrated lime (Ca(OH) may be more effective than cement to stabilize heavy clay soils, its efficiency is very limited in sandy soils.
Concrete contains the same ingredient as cement but in a different proportion (typically about 10 to 15 percent cement, 60 to 75 percent aggregate and 15 to 20 percent water). Concrete pavements are recommended whenever a durable, and low maintenance option is required and is particularly well adapted for high volume roads, parking lots, or very heavy trafficked areas.
A.4.10 Biological Binders
These types of dust suppression (e.g., blue-green algae (cyanobacteria) inoculants, microbial polymers, and bacteria-mediated biomineralization) may be future alternatives to chemical stabilization of soils in semi-arid and arid climates. Organism growth and/or secretion of biological compounds act to bind soil particles together, reducing the erodibility of the surface. Inoculants of cyanobacteria that can be applied as slurries to the surface are currently under development and field testing shows promise ((Hu et al. 2002). Without standard testing procedures to predict their performance under field conditions, small-scale trials should be initiated and evaluated for efficacy prior to large-scale applications. Biopolymers have high specific surfaces with electrical charges, which enable direct interactions between the biopolymers and fine soil particles, thereby creating biopolymer-soil matrices that may be able to resist wind erosion (Chang et al. 2016).
Biomineralization refers to mineral precipitation in soil pores via biological organisms. Microbial induced calcite precipitation (MICP) is the most recognized mechanism and has been suggested as a promising method for dust suppression (Phillips et al. 2013). MICP occurs when microorganism (e.g., Sporosarcina pasteurii and Bacillus pasteurii) convert urea to ammonium and carbonate, which allows calcium carbonate precipitates to form and subsequently bind with soil grains.

PNNL- 28061 DVZ-RPT-0008 Rev 0
Distribution
No. of No. of Copies Copies
Distr.1
# Name Organization Address City, State and ZIP Code
# Organization Address City, State and ZIP Code Name Name Name Name Name (#)
# Name Organization Address City, State and ZIP Code
# Foreign Distribution # Name
Organization Address Address line 2 COUNTRY
# Local Distribution Pacific Northwest National Laboratory Name Mailstop Name Mailstop Name Mailstop Name Mailstop Name (PDF)
