water binding by myosin
TRANSCRIPT

Steven Brandon 30 June 2004
1
WRITTEN PRELIMINARY DOCTORAL EXAMINATION FOR STEVEN BRANDON
Dr J C Acton - May 28 2004
WATER BINDING BY MYOSIN
Problem Statement The water holding capacity (WHC) of myosin is at a minimum at its isoelectric point When myosin is exposed to a low concentration of sodium chloride the
isoelectric point shifts to a lower pH and the water holding capacity at the new
isoelectric point is lower the water holding capacity at the zero-salt isoelectric
point Explain this phenomenon depicted in Figure 1 below
Figure 1 Illustration of problem statement
Background Information
The contractile elements of muscle fibers are the myofibrils which are composed
of bundles of protein filaments The thin filaments are composed mostly of the
protein actin together with smaller amounts of tropomyosin and troponin The thick filaments are aggregates of the very large (ca 500 kDa) elongated protein
myosin1
The following information about actin and myosin is from an excellent online
source with a great deal of useful information about protein chemistry2
Wate
r H
old
ing C
apacity
pH
Why
NaCl
No NaCl
Steven Brandon 30 June 2004
2
Actin
Under physiological conditions actin exists as a long helical polymer (fibrous
actin or F-actin) of a globular protein monomer G-actin (see Figure 2 below) The structure of the G-actin monomer is a two-domain molecule with a mass of
42 kDa The binding of ATP by a G-actin monomer leads to polymerization ie the formation of F-actin The ATP is subsequently hydrolyzed but the ADP is
retained in the actin filament Within F-actin filaments the G-actin monomers are
arranged in a two-strand helix Because the subunits are asymmetric each F-
actin filament has two distinguishable ends called the plus end and the minus end The polymerization reaction exhibits a preferred direction-the plus end
grows much more rapidly than the minus end Actin filaments carry sites on each
subunit that can bind to myosin
Figure 2 G-actin3 and F-actin4
Myosin
There are many types of myosin found in nature5 The functional myosin
molecule Figure 3 is composed of six polypeptide chains two identical heavy
chains (230 kDa) and two each of two kinds of light chains (20 kDa) which together they form a complex of molecular weight 540 kDa (For my analysis I used a molecular weight of 450 kDa6) The heavy chains have long α-helical tails
and globular head domains The α-helical tails are interwound into a two-strand coiled coil and the light chains are bound to the globular head domains Between
each head domain and tail domain is a flexible stalk
Steven Brandon 30 June 2004
3
Figure 3 The myosin molecule7
Myosin exhibits aspects of both fibrous and globular proteins and its functional domains play quite different roles The tail domains have a pronounced tendency
to aggregate causing myosin molecules to form thick bipolar filaments The head domains with their attached light chains are often called headpieces they have
a strong tendency to bind to actin
The following additional information about myosin is from Knipe 20008
Myosin is the most functional of all animal proteins in the production of cooked
meat products However the best way to extract myosin from meat is to remove the meat from carcasses prior to the development of rigor mortis and
mix the meat with salt immediately to prevent the development of the
contracted form of actomyosin While actomyosin is the protein form that is
most often used in the meat industry and relatively easily extracted and relatively good at binding water and fat it is not as functional as myosin which is
not bound to actin Once actin and myosin have contracted to form actomyosin
it is much more difficult to extract myosin from meat
In addition to the formation of actomyosin during rigor mortis there is a
reduction in muscle pH from 70 (living muscle) to about 56-58 (post-mortem)
This pH decline is due to the accumulation of lactic acid in the muscle which in
the living animal would normally be shunted to the liver through the blood
stream Glycogen during postmortem glycolysis converts to lactic acid which ultimately reduces the pH of the muscle
Steven Brandon 30 June 2004
4
The inhibition of glycolysis prevents lactic acid formation consequently
maintaining a high pH which may increase tenderness and water-holding
capacity9
Water-Holding Capacity
This information on Water holding capacity is from Knipe 200010
Water-holding capacity is the ability of meat to retain moisture during cutting grinding cooking pressing etc Sometimes water-binding capacity is used
particularly with the ability to bind (rather than hold) moisture during cooking
Chemically moisture is held by proteins to different degrees and the differences
in these types of moisture are referred to as bound water immobilized water and
free water Bound water is the most tightly bound and is not affected by the addition of salt or changes in pH However bound water is reduced as muscle
goes into rigor mortis and when cooked
The net charge effect of proteins is a major cause of changes in WHC of muscle during the rigor process Proteins have both negative and positive charges on
their side chains but at the time of death the charges on muscle proteins are predominately negative This predominance of negative charges causes the proteins to naturally repel one another much like two negative poles on a
magnet
As the pH of muscle drops during the rigor process due to the accumulation of
lactic acid the positive charges from the acid cancel out the negative charges of the muscle Therefore as muscle approaches the post-rigor state there is a
nearly equal number of positive and negative charges on the proteins The isoelectric point is the pH of muscle in which the number of positive charges
equals the negative charges on proteins In meat the isoelectric point is
approximately pH 51 to 53
The final postmortem pH of meat is in the range of 55 to 60 which is near the
isoelectric point The point of concern is that equal numbers of positive and
negative charges cause the protein side chains to be attracted to one another
which physically causes moisture to be forced out from between the protein chains and therefore reduces WHC
The formation of actomyosin physically reduces the space between protein chains and the potential binding sites for binding water which also reduces WHC
I found more useful information about protein water binding at another source11
Steven Brandon 30 June 2004
5
Water binding capacity is modified by pH and drops from a high around pH 10 to a low at the isoelectric point of meat proteins between pH 50 and 51 At its
isoelectric point a protein bears no net charge and its solubility is minimal Below
pH 5 a value only attained if the pH of a processed meat product is deliberately lowered water binding capacity starts to increase again Water absorption
follows water binding capacity in this regard Thus as the pH of pork declines
post mortem its water binding capacity decreases and much of the water associated with muscle proteins is free to leave the muscle fiber
Towards their isoelectric point thick and thin filaments in myofibrils move closer together and reduce the water space between them Thus as the pH declines
post mortem filaments move closer together myofibrils shrink and the volume
of sarcoplasm increases Eventually muscle fibers depleted all their ATP their
membranes no longer confine the cell water and fluid is lost from the muscle fiber and may contribute to exudate lost from the meat
Water escapes from the spaces between muscle fiber bundles when they are cut and the drip loss from PSE (pale soft exudative) pork is increased to about 170 from a normal value of about 077 of trimmed carcass weight In sliced
pork drip losses increase with storage from 9 after 1 day to 123 after 6 days This creates a serious weight loss from the carcass In the USA the
estimated incidence of PSE carcasses (18) and their typical extra shrink loss (5 to 6) causes a total national loss of about 95 million dollars Obviously this is
only a rough guess but it serves to emphasize the commercial importance of pH
in pork The excess weight loss from PSE pork during transport storage and
processing could exceed one million kilograms per annum in the USA
Protein Solubility Solubility of proteins depends on ionic strength and pH If the pH approaches the
pI of a given protein the net charge on that protein will go to zero and in the absence of electrostatic repulsion weak electrostatic attractive forces may lead
to aggregation and precipitation this tendency to interact can be promoted by
reducing the ionic strength12
By way of example Mathews amp van Holde give a good description of the behavior
of β-lactoglobulin solubility The effects of ionic strength of the medium on the interaction between charged macroions can be summarized as follows At very
low ionic strength the counterion atmosphere is highly expanded and diffuse
and screening is ineffective Like-charged particles repel strongly unlike charged
particles attract one another strongly As the ionic strength increases the counterion atmosphere shrinks and becomes concentrated about the macroion
Screening becomes effective 13
This is explained by the Debye-Huckel Theory Polyampholytes like proteins or polyelectrolytes like DNA are called macroions because they are large and
Steven Brandon 30 June 2004
6
because depending on the solution pH they may carry a substantial net charge As shown in Figure 4 below each macroion collects about it a counterion
atmosphere of oppositely charged mall ions These small ions such as Na+ and
Cl- are called counterions and they interact with macroions by charge-charge interactions The counterion atmosphere shields macroions from each other thus
diminishing their ability to interact on the basis of charge2
Figure 4 The influence of small ions on macroion interactions2
The thickness of the counterion atmosphere depends on the concentration of
counterions present in the solution The greater the concentration of counterions the thicker the counterion atmosphere and the more effective is the electrostatic
screening between individual macroions The amount of counterions in solution
is measured as the ionic strength I
2
12
1ii
i
n
ZMI
where i represents each of the n different counterions in the solution Mi is the
molarity of each counterion ldquoirdquo and Zi is the charge of each counterion ldquoirdquo
The Debye-Huckel Theory attempts to measure the radius across which
macroions can interact with each other
Steven Brandon 30 June 2004
7
21
I
Kr
where K is a constant and ldquorrdquo is the distance over which the two macroions can
affect each other As the ionic strength (concentration) increases the radius
with which macroions can influence each other decreases Another way to say
this is that as ldquorrdquo gets smaller macroions must be closer together before they can interact with each other due to the shielding or shell of the counterions2
The effects of charge and ionic strength on the solubility of polyampholytes such
as proteins can be explained in terms of these electrostatic interactions Consider
the behavior of the common milk protein β-lactoglobulin The isoelectric point of
this polyampholyte is about 53 Above or below this pH the molecules all have either negative or positive charges and repel one another so the protein is very soluble at either acidic or basic pH At the isoelectric point the net charge is zero but each molecule still carries surface patches of both positive charge and
negative charge The ionic interactions between them together with other kinds of intermolecular interactions such as van der Waals forces make the molecules
tend to clump together and precipitate Therefore solubility is minimal at the isoelectric point If the ionic strength is increased however the counterion
atmosphere shrinks about the charged regions and the attractive interactions between positive and negative groups are effectively screened Hence solubility
increases even at the isoelectric point This effect of putting proteins into
solution by increasing the salt concentration is called ldquosalting in 14
The behavior of β-lactoglobulin is illustrated by the Figure 5 below It is interesting to note that this plot indicates a shift in the pH of minimal solubility to
higher pH with decreasing NaCl concentration This behavior may be a consequence of the amino acid composition of β-lactoglobulin
Steven Brandon 30 June 2004
8
Figure 5 Solubility of β-Lactoglobulin vs pH at several NaCl concentrations15
It is interesting to note that according to the plot shown in Figure 5 above
increasing salt content appears to slightly reduce the pI of β-lactoglobulin but not to decrease the minimum solubility of the protein in water
Amino Acid Composition
The functionality of a protein is determined by the side chains of its component
amino acids Theoretically side chains determine the structure of proteins based upon hydrogen ionic and disulfide bonds as well as hydrophobic and
hydrophilic interactions between amino acids8 The amino acids are shown in
Table A1 in the Appendix The amino acid composition for beef pork and rabbit
myosin are presented by Price and Schweigert (see Table 1 below) 16
Steven Brandon 30 June 2004
9
Table 1 Myosin amino acid composition
This table lists the residues of each amino acid per 105 grams of myosin In
Price and Schweigertrsquos table (Table 1 above) the total number of amino acid residues in pork myosin is listed as 837 residues The actual sum of amino acid
residues listed in this table for pork myosin is 835 residues
As stated previously I assumed a molecular weight of 450 kDa for myosin6
With this molecular weight I determined the number of residues of each amino
acid per mole of myosin as shown in Table A2 in the Appendix
Steven Brandon 30 June 2004
10
In Price and Schweigertrsquos table asparagine and glutamine quantities are combined with the listed aspartic acid and glutamic acid quantities respectively
I assumed that asparagine accounts for 13 of the aspartic acid reported and that
glutamine accounts for 15 of the glutamic acid reported17
Henderson-Hasselbalch Equation Some amino acid residues in proteins (aspartic acid glutamic acid cysteine
tyrosine histidine lysine and arginine see Table 2) have dissociable R-groups
Table 2 Ionized Forms of Amino Acids18
It should be noted that the actual pKs of amino acid groups in proteins may differ somewhat from those measured for the side groups of free amino acids
In general acidic proteins have their pIs overestimated and basic proteins have
their pIs underestimated when calculated using pKs from model compound
studies This is expected For Asp side chains a pK = 41 is observed with
uncharged model compounds but a pK = 34 is the average value observed in proteins This results mainly because proteins have a net positive charge in the
region where Asp and Glu carboxyls titrate and this will tend to lower their pKs
relative to those measured in uncharged model The converse will be true for
Steven Brandon 30 June 2004
11
basic proteins where the proteins will have a net negative charge above the pI
that will tend to raise the pKs of the ionizable groups In addition to net charge
other environmental effects can change pKs Thus it is always best to measure
rather than estimate the pI of a protein unless the measured pKs of the ionizable
groups are available19
The Henderson-Hasselbalch equation describes the proportion of dissociated
groups as a function of pH With the Henderson-Hasselbalch equation
HA
A
apKpH
log
where [HA] is the concentration of the undissociated weak acid and [A-] is the
concentration of the conjugate base of [HA]2 one can calculate the ratio of
dissociated groups to undissociated groups [A-][HA] at different pHs with the
pKa of each amino acid R-group which are listed in Table A3 in the Appendix
With the Henderson-Hasselbalch equation I used Excel to calculate the
proportion of each amino acid residue with dissociable groups at 04-pH intervals from pH 32 to pH 96 This range exceeds the pH range of meat products (pH
52 to 60) but I was curious to see how the amino acid proportions varied over a wider pH range For my analysis I used pKa values for each amino acid R-group from a different source20 than that of Table A3 These values are
however very close to those reported in the Table A3
Since all but one the α-carboxyl group and all but one α-amino group are
involved in peptide bonds between amino acid residues forming the myosin protein molecule there can be very little contribution of these two terminal groups to the behavior of myosin which contains several thousand amino acid
residues For that reason I have chosen to exclude these two groups from my analysis Additionally the peptide bond groups forming the back bone of the protein polypeptide chain can attract some water by polar attraction but this
should be considerably less than that contributed by the side groups especially
those that are ionized So I have also not included the hydration due to the peptide groups in my calculations
The results of my calculations using the Henderson-Hasselbalch equation are
presented in Table A4 in the Appendix This table shows the fraction of
dissociated amino acid R-Groups as a function of pH Of particular interest in the pH range typical of meat products is the increasing proportion of anionic
aspartate and glutamate groups formed as the aspartic acid and glutamic acid R-
groups are deprotonated as the pH increases from around pH 4 (the approximate pKa of these two acidic R-groups where half the each type is deprotonated) to pH
6 (where about 99 of these acidic R-groups are deprotonated) Over the same
pH range the histidine R-groups are transition from about 99 cationic
Steven Brandon 30 June 2004
12
protonated groups at pH 4 to about 50 uncharged at pH 6 (near the pKa of histidine)
The calculated fractions of dissociated R-groups allowed me to determine the complete amino acid composition of beef pork and rabbit myosin The complete
amino acid composition for beef myosin is shown in Table A5 in the Appendix
Calculated Net Charge vs pH amp pI Armed with the complete amino acid composition of myosin at each pH it is possible to calculate the net charge of the myosin molecule To do this I
assumed a charge of -1 for de-protonated aspartic acid (aspartate) glutamic acid
(glutmate) cysteine and tyrosine groups and +1 for protonated histidine lysine and arginine groups The resulting charge inventory for beef myosin is given in
Table A6 in the Appendix The plot shown in Figure 6 below shows how the net
charge of beef pork and rabbit myosin vary with pH
Myosin Net Charge vs pH
-500
0
500
1000
30 40 50 60 70 80 90 100
pH
Ne
t C
ha
rge
of
My
os
in
Beef Pork Rabbit
Figure 6 Calculated Net Charge of Myosin versus pH
The pH at which the net charge is zero is the isoelectric point pI of the protein
From this analysis this occurs at different pH values for these myosin proteins
from three different animals as shown in Table 3 below
Table 3 Calculated Isoelectric Points of Beef Pork and Rabbit Myosin
Myosin Calculated pI
Beef pH 520
Steven Brandon 30 June 2004
13
Pork pH 555 Rabbit pH 463
The major cause of the lower pI for rabbit myosin appears to be the substantially
lower lysine content reported by Price and Schweigert compared that of beef and
pork myosin They report 85 lysine residues per 105 grams of rabbit myosin
compared to 107 and 105 lysine residues per 105 grams of beef and pork myosin
respectively
Calculated Hydration vs pH Water molecules bind to several groups in proteins These include charged groups (ion-dipole interactions) backbone peptide peptide groups the amide
groups of asparagines and glutamine hydroxyl groups of serine threoine and
tyrosine residues (all dipole-dipole interactions) and nonpolar residues (dipole-induced dipole interactions hydrophobic hydration)21 The following is extracted
from Duckworth 197522
Examination of proteins indicated that the amount of bound water is about 03 ndash
04 gg of protein The spread is values is reproducible and depends largely on
amino acid composition It can be represented by the approximate formula
NPC fffA 2040
where A is the amount of bound water in grams of water per gram of protein fC
is the fraction of charged side chains fP is the fraction of polar side chains and fN is the fraction of non-polar side chains This simple equation does make some
useful predictions [The equation is derived from measurements on
homopolypeptides (Kuntz 1971)]
The approximate range of protein hydration should be 02 ndash 10 g of water per gram of protein depending on the amino acid composition of the protein The
equation overestimates the amount of water slightly since all side chains are
counted but some (mostly non-polar ones) are ldquoburiedrdquo in the native protein This
leads us to predict that hydration will increase slightly upon denaturation and
decrease slightly on hydrophobic aggregation Lowering the pH below 4 should be strongly dehydrating since the number of carboxylate groups decreases sharply
Note that the equation counts carboxylate and cationic side chains equally This
errs in two ways First the carboxylate groups appear to be somewhat more
hydrated than lysine or arginine Second neutralization of the nitrogen charge at
high pH does not cause dehydration Thus the equation will make a moderate
under estimate (10-15) above pH 10 or if the basicacidic side chain ratio is much different from 1 Protein-protein interactions that are strongly ionic in
nature would be expected to cause marked dehydration on aggregation The
general philosophy behind this equation works reasonably well when extended to
other polymeric systems each cationic site holds about four water molecules
each anionic site holds about six each polar site (N or O atoms) holds about one
Steven Brandon 30 June 2004
14
Table 4 below shows the total numbers of anionic cationic polar and non-polar side groups in beef myosin at a range of pH values from 32 to 96 The numbers
of anionic cationic and polar change with pH as the various ionizable groups
become increasingly de-protonated with increasing pH
Table 4 Breakdown of Beef Myosin Amino Acid Groups by Type
pH 32 pH 36 pH 40 pH 44 pH 48 pH 52 pH 56 pH 60 pH 64 pH 68 pH 72 pH 76 pH 80 pH 84 pH 88 pH 92 pH 96
Anionic Total 107 222 387 551 665 725 752 763 768 770 770 771 771 772 774 778 787
Cationic Total 733 733 733 732 730 726 717 703 690 680 674 672 670 669 666 658 641
Polar Total 1477 1362 1198 1034 923 867 849 851 860 868 873 875 876 877 878 881 889
Non-Polar Total 1445 1445 1445 1445 1445 1445 1445 1445 1445 1445 1445 1445 1445 1445 1445 1445 1445
Since the simple equation presented by Duckworth above errs in treating
cationic and anionic side groups equally I have again used an Excel spreadsheet
approach similar to that used to determine net charge to calculate the amount of water bound to various myosin amino acid residues This technique requires
that I first obtain hydration data for each type of amino acid residue in myosin
Table 5 below was scanned from Fennema 1996
Table 5 Amino Acid Hydrations ndash Fennema
Steven Brandon 30 June 2004
15
Table 6 is scanned from the source reference for the table from Fennemarsquos text
Kuntz 197123
Table 6 Amino Acid Hydrations ndash Kuntz
These two sources agree however since Fennema has rounded off the numbers
in his table to one significant figure I have used the values presented by Kuntz in my analysis However neither source lists hydration capacities for uncharged
histidine or for de-protonated (charged) cysteine (Fennemarsquos table omits
cysteine entirely) I have used 4 moles of water per mole of residue for uncharged histidine (since uncharged lysine and arginine hold the same amount
Steven Brandon 30 June 2004
16
of water as charged lysine and arginine respectively) and 2 moles of water per mole of residue for de-protonated cysteine (since it is reasonable to guess that
the charged form might attract water more than uncharged cysteine which holds
1 mole of water per mole of residue) Multiplying the hydration capacities for each amino acid residue by the number of each type of amino acid residue per
myosin molecule gives the total hydration capacity of myosin at each pH Table
A7 in the Appendix shows the results of these calculations for beef myosin Figure 7 below shows how the total hydration of beef pork and rabbit myosin
vary with p based on these calculations
Myosin Hydration vs pH
6000
7000
8000
9000
10000
11000
12000
30 40 50 60 70 80 90 100
pH
Hy
dra
tio
n
mo
les H
2O
mo
le o
f M
yo
sin
Beef Pork Rabbit
Figure 7 Calculated Hydration of Myosin versus pH
It is obvious from this plot that this approach does not accurately predict the
observed increase in hydration at pH below the isoelectric point of meat proteins
Note that this analysis does not predict increasing hydration below the isoelectric
point of the protein as expected from the solubility behavior of proteins (see Figure 5) Since water is dipolar it has both positive (electron-poor) and
negative (electron-rich) regions as shown in Figure 8 below
Steven Brandon 30 June 2004
17
Figure 8 Dipolar structure of water2
This dipolar structure of water is responsible for the formation of hydrogen bonds between water molecules and between water and other and other polar or
charged species including both anionic and cationic amino acid R groups as well as dissolved salt ions such as sodium and chloride At pH above its isoelectric
point myosin has a net negative charge This results from the increasing number
of anionic (de-protonated) carboxyl groups on the aspartic and glutamic acid
residues of the protein molecule with increasing pH These charged groups (aspartate and glutamate) strongly attract water binding 6 to 75 water
molecules per residue in contrast to the uncharged aspartic and glutamic acid
residues which hold only 2 water molecules per residue (by polar attraction) As the pH is lowered to the isoelectric point as occurs naturally in meat by
formation of lactic acid via glycolysis there are fewer of de-protonated anionic
groups as the pH approaches the pKa values of aspartic and glutamic acid (near pH 4)
This trend continues as the pH is lowered below the isoelectric point of myosin (which would generally require the introduction of acid to the meat product) as
fewer and fewer of the aspartic and glutamic acid residues are charged The
basic R groups lysine and arginine are protonated (and cationic) across the essentially fully range of pH included in my analysis (pH 32 to 96) These
Steven Brandon 30 June 2004
18
cationic groups also bind water but to a lesser extent than the anionic groups holding only roughly half the number of water molecules compared to the anionic
groups (3 or 4 vs 6 or 7) Histidine (pKa = 604) becomes increasingly
protonated as the pH is lowered through the isoelectric point of myosin (around pH 5) gaining a positive charge Although neither Fennema nor Kuntz list
hydration data for uncharged histidine it is reasonable to assume that its water
holding capacity (WHC) behavior is similar to that of both arginine and lysine whose WHC does not change depending on whether the group is charged For
this reason the WHC due to all three basic amino acid groups remains constant
across the pH range included in my analysis
So even though the net charge of the myosin molecule is zero at the isoelectric
point (by definition) positive above the isoelectric point and negative below the
isoelectric point the total WHC of myosin as calculated from the hydration values of the individual amino acid residues comprising the myosin molecule does not show a minimum near the isoelectric point
However that does not mean that the actual WHC of myosin behaves as predicted based on an analysis of the WHC of the constituent amino acid
residues That is because this analysis ignores the effects of interactions between myosin molecules whether retained in their relative positions in the
muscle tissue structure or not (as in meat batter) Protein-protein interactions can affect WHC in two ways Firstly interactions between oppositely charged
residues of different protein molecules can effectively neutralize the net charge of
the effected groups thereby reducing WHC of both groups This effect is likely to
be minimal since the charged groups being part of the larger myosin polypeptide molecule are not free to move into position to form such
interactions Secondly and probably more significantly near the isoelectric point where the net charge of the protein is minimized the repulsion of protein
molecules due to like-charged groups is also minimized This means that near the isoelectric point the protein molecules are able to draw more closely together
thereby displacing water that is trapped by capillary action between the molecules This does not effect water that is bound to the protein by polar or
charge attraction Since the amount of water trapped between protein molecules
can be large in comparison to that chemically bound to the protein the spacing of protein molecules (due to net charge) can be expected to have a much greater
effect to the overall WHC of a meat product regardless of whether it retains the
structure of muscle tissue or not
The pH dependence on the solubility of β-lactoglobulin in water is also due to the
variation of net charge with pH (see Figure 9 below)
Steven Brandon 30 June 2004
19
Figure 9 Dependence of protein solubility on pH2
Above or below pI the molecules all have either negative or positive charges and
repel one another Protein is therefore very soluble at either acidic or basic pH At pI the net charge is zero but each molecule still carries surface patches of both
positive and negative charge The charge-charge interactions together with other
kinds of intermolecular interactions such as van der Waals forces make the molecules tend to clump together and precipitate Therefore β-lactoglobulin like
many other proteins has minimum solubility at its isoelectric point2
At low pHs proteins have a net positive charge At high pHs they have a net
negative charge due to the carboxyl on the protein backbone losing its proton
At their pI value a protein has no net charge This leads to reduced solubility because the protein is unable to interact with the medium and will then fall out of
solution24
Steven Brandon 30 June 2004
20
Effect of added NaCl
Background information on NaCl in solution
Ions arent the same size as the atoms they come from Figure 10 compares the
sizes of sodium and chloride ions with the sizes of sodium and chlorine atoms
Figure 10 Relative sizes of Na and Cl ions and atoms
Positive ions are smaller than the atoms they come from Sodium is 281 Na+ is
28 Youve lost a whole layer of electrons and the remaining 10 electrons are
pulled in by the full force of 11 protons Negative ions are bigger than the atoms they come from Chlorine is 287 Cl- is 288 Although the electrons are
still all in the 3-level the extra repulsion produced by the incoming electron causes the atom to expand There are still only 17 protons but they hold 18
electrons25 The diameter of the Na+ ion is 095 Aring which is about half that of the Cl- ion with a diameter of 181 Aring26
When sodium chloride dissolves in water the sodium and chloride ions and the
polar water molecules are strongly attracted to one another by ion-dipole
interactions The solvent molecules (water in this case) surround the ions removing them from the crystal and forming the solution As the dissolving
process proceeds the individual ions are removed from the solid surface becoming completely separate hydrated species in the solution27 Table 7 illustrates these salt ions in aqueous solution
Table 7 Hydration of chloride and sodium ions28
Hydrated
Chloride Ion
Cl-(aq)
Each ion in aqueous solution is surrounded by about six water
molecules in the inner hydration sphere These molecules exchange
rapidly with other solvent molecules
Hydrated
Sodium Ion
Na+(aq)
Each ion in aqueous solution is surrounded by about six water
molecules in the inner hydration sphere These molecules exchange
rapidly with other solvent molecules
Steven Brandon 30 June 2004
21
Salt interaction with protein
At high ionic strength protein solubility generally decreases with increasing salt
concentration due to reducing the activity of water and neutralization of surface charge This phenomenon is called ldquosalting outrdquo Each protein has a distinct
solubility profile as a function of salt concentration defined by Log S (mgmL) = β ndash KS (I2) where S is solubility I is ionic strength and KS and β are constants
Different types of salts affect the solubility of proteins to different extents (see
Figure 11 below) 29
Figure 11 Protein Solubility versus ionic strength 30
Solubility at low ionic strength increases with salt concentration This ldquosalting inrdquo
effect is explained as pairing of salt ions with charged groups of the protein
shields intramolecular repulsion Protein solubility is at a minimum near the isoelectric point (pI) of the protein 31
Salt along with phosphates improves water retention by enhancing protein
hydration NaCl increases the net charges on the protein structure helping to unfold and expose the protein surface by binding water Salt shifts the isoelectric
point to a pH of near 40 increasing the net negative charge at higher meat pH
attracting more water and thus increasing water holding capacity An optimal salt level of 25 - 28 is required to obtain maximum yield juiciness and flavor
quality32
Steven Brandon 30 June 2004
22
Clminus ions bind to the filaments and increase the electrostatic repulsive force between them A crucial factor in swelling is likely to be the removal at a critical
salt concentration of one or more transverse structural constraints in the
myofibril (probably crossbridges the M-line or the Z-line) allowing the filament lattice to expand33
Adding salt moves the pH of the isoelectric point of myosin and exposes
hydrophobic and sulfhydryl groups to the protein surface leading to loss of
helical structure according to research into the relationship between solubility and conformational changes of salmon (Oncorhynchus tshawytscha) myofibrillar
proteins These conformational changes form more surface for protein
solubilization therefore boosting its solubility34
Puolanne Ruusunen and Vainionpaumlauml (2001) of University of Helsinki gave a good review of the effects of added salt to WHC of meat The following information is
extracted from this paper35 References sited in these extracts are listed in Table A12 in the Appendix
Salt (NaCl) is added to meat products to improve their binding and water-holding
properties Chloride ions tend to penetrate into the myofilaments causing them to swell (Hamm 1972) and the sodium ions form an ion cloud around the filaments
(Offer amp Knight 1983) This results in local concentration differences which lead to
an increased osmotic pressure within the myofibrils which causes the filament lattice
to swell Simultaneously the enlargement of negative net charge within the myosin
filaments loosens the filaments and finally causes the disintegration of the filament at
an ionic strength of 08 (without added phosphate) or in 04 (with added phosphate) In sausages without added phosphate water-holding increases rather linearly to the
salt content of ca 4 (Hamm 1972) With added phosphate there is a marked
increase in water-holding in the range of 10ndash15 NaCl (Puolanne amp Ruusunen
1983) This is due to the cleavage of actomyosin bonds by phosphates thus
facilitating the swelling of the filament lattice (Offer amp Knight 1983)
Similar phenomena take place when pH increases The negative net charge of
filaments increases causing an uneven distribution of charges within the filaments Without added salt the water-holding increases as the pH rises from 50 to 90
According to Hamm (1972) there is however not a marked correlation between the
ultimate pH value and water-holding in pH values below 57 (pork) or 58 (beef)
when the same muscles of different animals are compared Animal-to-animal
differences are larger in pH values above the isoelectric point than below (Hamm 1962) Warriss (1982) however found a marked decrease in water-holding in pork
in the pH-range of 51ndash58
When salt is added the binding of chloride ions decreases with increasing pH but the
binding of sodium ions increases (Hamm 1972) As a result the maximum in water-
holding is reached by about pH 60 in meat (Hamm) or in myosin gel (Ishioroshi
Samejima amp Yasui 1979)
Steven Brandon 30 June 2004
23
Offer and Knight (1988) stress that NaCl depolymerizes the thick filament shafts by
weakening interactions between the tails presumably by favoring the exposure of
previously buried charged or andor hydrophilic groups According to Kivikari (1996)
this changes the amount and nature of titratable groups accessible to the solvent probably revealing new groups having pKa values in the pH range 60ndash69
The increase of NaCl content causes a minor shift to lower pH values but this is not
relevant in the narrow range of 05ndash25 NaCl (ca 01ndash04 M) and low pH values of
this study NaCl alone seems not to have had a statistically significant overall effect on batter pH at concentration levels of NaCl in this study On the other hand WHC
and sausage pH were clearly affected by added NaCl alone as well as in the
interaction with meat pH
All cooked sausage variables had a maximum in water-holding by 25 added NaCl The water-holding of the sausages increases with increasing pH-value up to pH 61
and a further increase causes only a minor increase This study shows that water-
holding is strongly affected by the pH of raw materials in combination with NaCl
which renders it important to keep the pH high enough to ensure a sufficiently high
level of water-holding when aiming at lowered salt additions35
The plots shown below in Figure 10 are from the paper by Puolanne Ruusunen and Vainionpaumlauml35
Figure 10 The effect of pH amp NaCl on WHC in cooked sausage WOP without WP with
added phosphate 35
Steven Brandon 30 June 2004
24
I have re-plotted their data for beef and pork without added phosphate to see
how WHC varies with pH at a range of salt contents for both beef and pork (see
Figures 11 amp 12 below) These plots show that WHC for both beef and pork increases steadily without added NaCl as the pH is raised from 55 to 60 but
shows little additional increase at pH gt 60 This observation agrees in general
with the shape of the calculated hydration curve (See Figure 7)
Water Holding Capacity of Pork
0
20
40
60
80
100
54 56 58 60 62 64 66
pH
WH
C
g H
2O
g m
eat
00 NaCl 05 NaCl 10 NaCl
15 NaCl 20 NaCl 25 NaCl
Figure 11 WHC vs pH for Pork without added phosphates
Water Holding Capacity of Beef
0
20
40
60
80
100
54 56 58 60 62 64 66
pH
WH
C
g H
2O
g m
eat
00 NaCl 05 NaCl 10 NaCl
15 NaCl 20 NaCl 25 NaCl
Figure 12 WHC vs pH for Beef without added phosphates
Steven Brandon 30 June 2004
25
Figures 11 and 12 also show that WHC increases substantially with increasing salt content at least up to 25 NaCl
Kao et al (2000) offer the following comments on the way salt affects protein hydration and other properties Proteins are surrounded by an ionic double
layer the structure and properties of which are determined by the balance
between disorganizing thermal forces and the organizing effects of electrostatic interactions and hydration at the protein-solvent interface The properties of the
double layer are influenced by the density of charged and polar groups on the
surface of a protein Therefore salt and pH effects are thermodynamically coupled Strong interactions between proteins and partially dehydrated site-
bound ions are not observed frequently The effects of salt on the stability of
proteins are frequently interpreted in terms of screening of electrostatic
interactions by the ionic strength This concept was inherited from Linderstroslashm-Lang who applied the solution of the linearized Poisson-Boltzmann equation achieved by Debye and Huumlckel less than a year after their original publication in
1923 to understand the ionization properties of proteins The understanding of the physical nature of interactions between proteins and ions continues to advance However at present there is no unifying theoretical framework based
on simple physical principles capable of accounting quantitatively and structurally for all of the different types of salt effects that have been observed in proteins36
Analysis of NaCl effects on charge and WHC of myosin
Model 1 All salt ions interact with charged side groups
I have attempted to model the screening of myosinrsquos charged surface groups by salt ions by recalculating the myosin charge inventory and total hydration as a
function of pH by assuming that the salt ions effectively neutralize the charge of oppositely charged sites Figure 13 below is an illustration of the amino acid
composition of beef myosin at pH 44 where each circle represents one amino acid residue which may be acidic basic polar or non-polar For simplicity I
have divided the total number of amino acid residues by 100 to produce this representative illustration
Acidic
Basic
Polar
Non-Polar
Figure 13 Representative illustration of myosin amino acid composition
The sodium cations (+) and chloride anions (-) are also shown in Figure 13
Here these salt ions are shown screening the charge of oppositely charged amino
acid groups in the myosin molecule
Steven Brandon 30 June 2004
26
For my analysis I selected a salt concentration of 400 moles of NaCl mole of myosin I chose this salt concentration as one sufficient to significantly affect the
behavior of myosin based on the model described above) The results of this
analysis (for beef myosin) are shown in Tables A8 and A9 in the appendix Table A8 lists the charge inventory for beef myosin with 400 moles of added NaCl
mole of myosin As described above this table assumes that the available Na+
and Cl- ions combine with oppositely charged side groups effectively neutralizing them Below pH 40 not all of the free Na+ ions are consumed in interactions
with side groups because there are too few available anionic side groups
(aspartate and glutamate) In reality these free Na+ ions would tend to compete with the cationic side groups to attract Cl- ions but I have not
attempted to account for this in my model
Figure 14 below shows the net charge of myosin versus pH in the presence of
added NaCl This analysis indicates no change in net charge pH gt 40 is the
same as was calculated without added NaCl This is because above pH 40 where all of the available salt ions are employed in interactions with myosin side groups an equal number of positive and negative charges have been neutralized
Myosin Net Charge vs pH
-500
0
500
1000
30 40 50 60 70 80 90 100
pH
Ne
t C
ha
rge
of
My
os
in
Beef Pork Rabbit
Model 1
Figure 14 Net charge of myosin versus pH in the presence of added NaCl ndash Model 1
Table A9 lists the total hydration for beef myosin with 400 moles of added NaCl
mole of myosin I assumed that all of the salt-ion-screened (neutralized) side groups would have the bind the same number of water molecules per side group
as the corresponding unionized side groups For example I assumed that an
ionized aspartate group screened by a Na+ ion would bind the same amount of water as an uncharged aspartic acid group ie 2 molecules of water per group
Steven Brandon 30 June 2004
27
in this case Since the many of the side groups hole less water when unionized (or effectively neutralized by an oppositely charged salt ion) the total hydration
of myosin is lower than was calculated in the absence of added NaCl This is
illustrated in Figure 15 below which shows the calculated total hydration of myosin versus pH in the presence of added NaCl
Myosin Hydration vs pH
6000
7000
8000
9000
10000
11000
12000
30 40 50 60 70 80 90 100
pH
Hy
dra
tio
n
mo
les H
2O
mo
le o
f M
yo
sin
Beef Pork Rabbit
Model 1
Figure 15 Total hydration of myosin versus pH in the presence of added NaCl - Model 1
This analysis is unsatisfactory in that it predicts no change in isoelectric point
with added salt and in that it predicts a reduction in hydration of myosin with added salt These two predictions disagree with the reported observations that
adding low concentrations of salt lowers pI and increases hydration (at pH gt pI) Back to the drawing board
Model 2 Only anions interact with cationic side groups
The WHC of a meat system is greatly affected by the addition of salt To fully
understand this effect one must consider the action of both the cation and the
anion which result from the ionization of salt These ions must be absorbed by
the protein to affect WHC The effect of salt can be explained by the fact that the chloride anion being larger would be less hydrated than the sodium cation The
less hydrated ions are drawn closer to the charged protein group due to their
smaller radii The chloride ion should therefore have more of an effect on
screening of oppositely charged groups at pH above the pI than sodium resulting
in a net increase in negative charges and a shift of the pI of muscle to lower pH values An increase in negative charges results in repulsion of the protein groups
and an enlargement of the space available for absorption within the muscle37
This assertion that chloride ions being larger are less hydrated than sodium ions does not agree with the information I found elsewhere (see Table 7)28
Steven Brandon 30 June 2004
28
which states that both ions are hydrated by about six water molecules in solution However if one considers the counterion atmosphere surrounding a
catonic macroion (see Figure 4) such as myosin below its isoelectric point it is
not unreasonable to imagine that the anionic Cl- ions are held closely to the protein molecule while the cationic Na+ ions tend to remain at a greater distance
from the protein where they can have relatively little influence on the charge
and therefore the hydration behavior of the myosin molecule Figure 16 illustrates this concept
Figure 16 Illustration of the chloride screening effect assumed in Model 2
I have repeated my analysis using the assumption that only the Cl- ions are able
to interact with (and effectively neutralize) the cationic side groups while the Na+ ions do not interact with the myosin molecule at all
Table A10 lists the net charge of beef myosin versus pH as calculated using Model
2 As indicated in this table the isoelectric point is predicted by Model 2 to shift from about pH 52 (see Table 3) to lt pH 4 Figure 17 below shows that
isoelectic points of pork and rabbit myosin have shifted to lower pH This results
from the overall reduction in net charge resulting from neutralization of a large portion of the cationic side groups by charge interactions with chloride anions
+ + + + + +
+ + ++ + + + + + + + + +
+ + + +
Na+
Cl-
Steven Brandon 30 June 2004
29
Myosin Net Charge vs pH
-1000
-500
0
500
30 40 50 60 70 80 90 100
pH
Ne
t C
ha
rge
of
My
os
in
Beef Pork Rabbit
Model 2
Figure 17 Net charge of myosin versus pH in the presence of added NaCl ndash Model 2
Table A11 lists the total hydration of beef myosin versus pH as calculated using
Model 2 Figure 17 below shows the hydration curves for beef pork and rabbit myosin calculated using Model 2
Myosin Hydration vs pH
6000
7000
8000
9000
10000
11000
12000
30 40 50 60 70 80 90 100
pH
Hy
dra
tio
n
mo
les H
2O
mo
le o
f M
yo
sin
Beef Pork Rabbit
Model 2
Figure 18 Total hydration of myosin versus pH in the presence of added NaCl - Model 2
Contrary to expectations Model 2 predicts no change in the total hydration of
beef myosin in the presence of added salt This results from the fact that the
chloride ldquoscreenedrdquo cationic side groups are assumed to hold the same number of
water molecules per side group as the ldquounscreenedrdquo cationic groups in the
Steven Brandon 30 June 2004
30
absence of salt If this model has any validity it indicates that the observed changes in hydration in the presence of added salt are the consequence of
phenomena other than salt ion ndash charged side group interactions
Comparing the total number of charged groups present in the myosin molecule at
pI in the absence of added salt about pH 52 (see Table A6) to number of
charged groups at the pI of myosin in the presence of added salt (using Model 2) about pH 39 (see Table A10) reveals a substantial reduction in the total numbers
of charged groups at pI with added salt Table 8 below lists the total numbers of
charged groups at pI with and without added salt These numbers were obtained from Tables A6 and A10 for the no salt and added salt cases respectively (I
had to interpolate between data for pH 36 and pH 40 in Table A10 to obtain the
numbers of charged groups at pI = 387 for the added salt case)
Table 8 Inventory of Anionic amp Cationic Groups with and without added salt
No Added NaCl Added NaCl
pI pH 520 pH 387 Total Anionic Groups 725 265
Total Cationic Groups 725 265
The lower numbers of charged groups in the added salt case results from the effective screening of some of these groups by salt ions This overall reduction in
the number of charged groups in myosin reduces the repulsion between
neighboring myosin molecules allowing the proteins to draw more closely
together leaving less volume available for capillary entrapped water This is supported by Wilding et al (1986) who report that Rabbit longissimus dorsi
fibers were found to swell in hypertonic salt solutions such as 025 M KI or 06 M KCl to two to three times their original diameter Swelling occurs by a
combination of an increase in the myofilament lattice spacing and a loss of myofilament order However at pH below the isoelectric point of the myofibrillar proteins hypertonic salt solutions induce fiber shrinkage 38
Steven Brandon 30 June 2004
31
Appendix Table A1 Amino Acids39
Steven Brandon 30 June 2004
32
Table A2 Myosin Amino Acid Composition
Myosin aa aa aa Residuesmole aa Residue WtmoleResidues 10
5 g Symbol gmole Residues mole My Residue g mole My
Beef Pork Rabbit Beef Pork Rabbit
Aspartate D 11308
Aspartic acid 74 68 72 D 11408 333 306 325
Glutamate E 12711
Glutamic acid 97 100 103 E 12811 438 450 465
de-protonated Histidine H 13716
Histidine 14 15 15 H 13816 63 68 68
de-protonated Lysine K 12819
Lysine 107 105 85 K 12919 482 473 383
de-protonated Arginine R 15620
Arginine 42 46 41 R 15720 189 207 185
de-protonated Cysteine C 10215
Cysteine 0 0 9 C 10315 0 0 41
de-protonated Tyrosine Y 16212
Tyrosine 16 16 18 Y 16312 72 72 81
Asparagine 13 12 13 N 11410 59 54 57
Glutamine 49 50 52 Q 12814 219 225 233
Proline 26 20 22 P 9713 117 90 99
Serine 34 37 41 S 8709 153 167 185
Threonine 43 47 41 T 10112 194 212 185
Tryptophan 0 0 4 W 18623 0 0 18
Alanine 73 65 78 A 7109 329 293 351
Glycine 38 39 39 G 5707 171 176 176
Isoleucine 40 41 42 I 11318 180 185 189
Leucine 86 86 79 L 11318 387 387 356
Methionine 20 21 22 M 13121 90 95 99
Phenylalanine 27 28 27 F 14719 122 126 122
Valine 37 39 42 V 9915 167 176 189
(NH3) 106 120 86 170 477 540 387
Total residues (text) 836 837 845
Total residues (calc) 836 835 845 2318 2322 2322
Use 450000 kDa = 450000 gmole
Steven Brandon 30 June 2004
33
Table A3 Amino Acid Properties40
Abbrev Full Name Side chain
type Mass pI
pK1
(alpha -
COOH)
pK2
(alpha -+NH3)
pKr
(R) Remarks
A Ala Alanine hydrophobic 8909 611 235 987
C Cys Cysteine hydrophilic 12116 505 192 1070 837
Two cysteines can
form a disulfide
bond This enforces
tertiary structure
and such proteins as
insulin have disulfide
bonds
D Asp Aspartic acid acidic 13310 285 199 990 390
E Glu Glutamic acid acidic 14713 315 210 947 407
F Phe Phenylalanine hydrophobic 16519 549 220 931
G Gly Glycine hydrophilic 7507 606 235 978
Because of the two
hydrogen atoms at
the α carbon glycine
is not optically
active
H His Histidine basic 15516 760 180 933 604
I Ile Isoleucine hydrophobic 13117 605 232 976
K Lys Lysine basic 14619 960 216 906 1054
L Leu Leucine hydrophobic 13117 601 233 974
M Met Methionine hydrophobic 14921 574 213 928
Always the first
amino acid to be
incorporated into a
protein sometimes
removed after
translation
N Asn Asparagine hydrophilic 13212 541 214 872
P Pro Proline hydrophobic 11513 630 195 1064
Can disrupt protein
folding structures
like α helix or β
sheet
Q Gln Glutamine hydrophilic 14615 565 217 913
R Arg Arginine basic 17420 1076 182 899 1248
S Ser Serine hydrophilic 10509 568 219 921
T Thr Threonine hydrophilic 11912 560 209 910
V Val Valine hydrophobic 11715 600 239 974
W Trp Tryptophan hydrophobic 20423 589 246 941
Y Tyr Tyrosine hydrophilic 18119 564 220 921 1046
Steven Brandon 30 June 2004
34
Table A4 Fraction of Dissociated Amino Acid R-Groups by pH
Fraction of dissociated R-groups
[A-]([HA]+[A
-])
aa Dissociating Group pH pH pH pH pH pH pH pH pH pH pH pH pH pH pH pH pH
Class HA A- pKR 32 36 40 44 48 52 56 60 64 68 72 76 80 84 88 92 96
Asp-
A --COO- 390 017 033 056 076 089 095 098 099 100 100 100 100 100 100 100 100 100 Asp
-
Asp A --COOH 083 067 044 024 011 005 002 001 000 000 000 000 000 000 000 000 000 Asp
Glu-
A --COO- 407 012 025 046 068 084 093 097 099 100 100 100 100 100 100 100 100 100 Glu
-
Glu A --COOH 088 075 054 032 016 007 003 001 000 000 000 000 000 000 000 000 000 Glu
His B -N 604 000 000 001 002 005 013 027 048 070 085 094 097 099 100 100 100 100 His
His+
B -NH+ 100 100 099 098 095 087 073 052 030 015 006 003 001 000 000 000 000 His
+
Lys B -NH2 1079 000 000 000 000 000 000 000 000 000 000 000 000 000 000 001 003 006 Lys
Lys+
B -NH2H+ 100 100 100 100 100 100 100 100 100 100 100 100 100 100 099 097 094 Lys
+
Arg B -NH 1248 000 000 000 000 000 000 000 000 000 000 000 000 000 000 000 000 000 Arg
Arg+
B -NHH+ 100 100 100 100 100 100 100 100 100 100 100 100 100 100 100 100 100 Arg
+
Cys-
P --S- 835 000 000 000 000 000 000 000 000 001 003 007 015 031 053 074 088 095 Cys
-
Cys P --SH 100 100 100 100 100 100 100 100 099 097 093 085 069 047 026 012 005 Cys
Tyr-
NP --O- 1013 000 000 000 000 000 000 000 000 000 000 000 000 001 002 004 011 023 Tyr
-
Tyr NP --OH 100 100 100 100 100 100 100 100 100 100 100 100 099 098 096 089 077 Tyr
Steven Brandon 30 June 2004
35
Table A5 Beef Myosin Amino Acid Composition by pH
Myosin
Amino Acid Residues mole of Myosin
Beef Pork
pH 32 pH 36 pH 40 pH 44 pH 48 pH 52 pH 56 pH 60 pH 64 pH 68 pH 72 pH 76 pH 80 pH 84 pH 88 pH 92 pH 96
Asp-
55 111 185 253 296 317 326 330 332 332 333 333 333 333 333 333 333
Asp 277 222 147 80 37 16 7 3 1 0 0 0 0 0 0 0 0
Glu-
52 111 201 298 369 408 425 433 436 437 438 438 438 438 438 438 438
Glu 386 327 237 140 69 30 13 5 2 1 0 0 0 0 0 0 0
His 0 0 1 1 3 8 17 30 44 54 59 61 62 63 63 63 63
His+
63 63 62 62 60 55 46 33 19 9 4 2 1 0 0 0 0
Lys 0 0 0 0 0 0 0 0 0 0 0 0 1 2 5 12 29
Lys+
481 481 481 481 481 481 481 481 481 481 481 481 481 480 477 469 452
Arg 0 0 0 0 0 0 0 0 0 0 0 0 0 0 0 0 0
Arg+
189 189 189 189 189 189 189 189 189 189 189 189 189 189 189 189 189
Cys-
0 0 0 0 0 0 0 0 0 0 0 0 0 0 0 0 0
Cys 0 0 0 0 0 0 0 0 0 0 0 0 0 0 0 0 0
Tyr-
0 0 0 0 0 0 0 0 0 0 0 0 1 1 3 8 16
Tyr 72 72 72 72 72 72 72 72 72 72 72 72 71 71 69 64 56
Asn 59 59 59 59 59 59 59 59 59 59 59 59 59 59 59 59 59
Gln 219 219 219 219 219 219 219 219 219 219 219 219 219 219 219 219 219
Pro 117 117 117 117 117 117 117 117 117 117 117 117 117 117 117 117 117
Ser 153 153 153 153 153 153 153 153 153 153 153 153 153 153 153 153 153
Thr 194 194 194 194 194 194 194 194 194 194 194 194 194 194 194 194 194
Trp 0 0 0 0 0 0 0 0 0 0 0 0 0 0 0 0 0
Ala 329 329 329 329 329 329 329 329 329 329 329 329 329 329 329 329 329
Gly 171 171 171 171 171 171 171 171 171 171 171 171 171 171 171 171 171
Ile 180 180 180 180 180 180 180 180 180 180 180 180 180 180 180 180 180
Leu 387 387 387 387 387 387 387 387 387 387 387 387 387 387 387 387 387
Met 90 90 90 90 90 90 90 90 90 90 90 90 90 90 90 90 90
Phe 122 122 122 122 122 122 122 122 122 122 122 122 122 122 122 122 122
Val 167 167 167 167 167 167 167 167 167 167 167 167 167 167 167 167 167
(NH3) 477 477 477 477 477 477 477 477 477 477 477 477 477 477 477 477 477
Total residues (calc) 3762 3762 3762 3762 3762 3762 3762 3762 3762 3762 3762 3762 3762 3762 3762 3762 3762
Steven Brandon 30 June 2004
36
Table A6 Charge Inventory of Beef Myosin by pH
Myosin
Residue Charge Charge Inventory
Beef Pork
pH 32 pH 36 pH 40 pH 44 pH 48 pH 52 pH 56 pH 60 pH 64 pH 68 pH 72 pH 76 pH 80 pH 84 pH 88 pH 92 pH 96
-1 Asp-
-55 -111 -185 -253 -296 -317 -326 -330 -332 -332 -333 -333 -333 -333 -333 -333 -333
0 Asp 0 0 0 0 0 0 0 0 0 0 0 0 0 0 0 0 0
-1 Glu-
-52 -111 -201 -298 -369 -408 -425 -433 -436 -437 -438 -438 -438 -438 -438 -438 -438
0 Glu 0 0 0 0 0 0 0 0 0 0 0 0 0 0 0 0 0
0 His 0 0 0 0 0 0 0 0 0 0 0 0 0 0 0 0 0
1 His+
63 63 62 62 60 55 46 33 19 9 4 2 1 0 0 0 0
0 Lys 0 0 0 0 0 0 0 0 0 0 0 0 0 0 0 0 0
1 Lys+
481 481 481 481 481 481 481 481 481 481 481 481 481 480 477 469 452
0 Arg 0 0 0 0 0 0 0 0 0 0 0 0 0 0 0 0 0
1 Arg+
189 189 189 189 189 189 189 189 189 189 189 189 189 189 189 189 189
-1 Cys-
0 0 0 0 0 0 0 0 0 0 0 0 0 0 0 0 0
0 Cys 0 0 0 0 0 0 0 0 0 0 0 0 0 0 0 0 0
-1 Tyr-
0 0 0 0 0 0 0 0 0 0 0 0 -1 -1 -3 -8 -16
0 Tyr 0 0 0 0 0 0 0 0 0 0 0 0 0 0 0 0 0
0 Asn 0 0 0 0 0 0 0 0 0 0 0 0 0 0 0 0 0
0 Gln 0 0 0 0 0 0 0 0 0 0 0 0 0 0 0 0 0
0 Pro 0 0 0 0 0 0 0 0 0 0 0 0 0 0 0 0 0
0 Ser 0 0 0 0 0 0 0 0 0 0 0 0 0 0 0 0 0
0 The 0 0 0 0 0 0 0 0 0 0 0 0 0 0 0 0 0
0 Trp 0 0 0 0 0 0 0 0 0 0 0 0 0 0 0 0 0
0 Ala 0 0 0 0 0 0 0 0 0 0 0 0 0 0 0 0 0
0 Gly 0 0 0 0 0 0 0 0 0 0 0 0 0 0 0 0 0
0 Ile 0 0 0 0 0 0 0 0 0 0 0 0 0 0 0 0 0
0 Leu 0 0 0 0 0 0 0 0 0 0 0 0 0 0 0 0 0
0 Met 0 0 0 0 0 0 0 0 0 0 0 0 0 0 0 0 0
0 Phe 0 0 0 0 0 0 0 0 0 0 0 0 0 0 0 0 0
0 Val 0 0 0 0 0 0 0 0 0 0 0 0 0 0 0 0 0
0 (NH3) 0 0 0 0 0 0 0 0 0 0 0 0 0 0 0 0 0
TOTAL 626 511 346 181 65 1 -35 -60 -78 -90 -96 -99 -101 -103 -108 -120 -146
Steven Brandon 30 June 2004
37
Table A7 Beef Myosin Hydration by pH
Source Myosin
Hydration moles of H2O mole of Myosin
moles H2OMole of Residue Beef Pork
pH 32 pH 36 pH 40 pH 44 pH 48 pH 52 pH 56 pH 60 pH 64 pH 68 pH 72 pH 76 pH 80 pH 84 pH 88 pH 92 pH 96
60 Kuntz Asp-
332 667 1113 1517 1773 1901 1958 1981 1990 1994 1996 1996 1996 1997 1997 1997 1997
20 Kuntz Asp 555 443 295 160 74 32 13 5 2 1 0 0 0 0 0 0 0
75 Kuntz Glu-
390 831 1510 2238 2769 3058 3191 3247 3270 3279 3283 3284 3285 3285 3285 3285 3285
20 Kuntz Glu 772 654 473 279 138 60 25 10 4 2 1 0 0 0 0 0 0
40 best guess His 0 1 2 6 14 32 67 120 175 215 236 245 249 251 252 252 252
40 Kuntz His+
252 251 250 246 238 220 185 132 77 37 16 7 3 1 0 0 0
45 Kuntz Lys 0 0 0 0 0 0 0 0 0 0 1 1 4 9 22 54 131
45 Kuntz Lys+
2167 2167 2167 2167 2167 2167 2167 2167 2167 2167 2166 2165 2163 2158 2145 2112 2035
30 Kuntz Arg 0 0 0 0 0 0 0 0 0 0 0 0 0 0 0 0 1
30 Kuntz Arg+
567 567 567 567 567 567 567 567 567 567 567 567 567 567 567 567 566
20 best guess Cys-
0 0 0 0 0 0 0 0 0 0 0 0 0 0 0 0 0
10 Kuntz Cys 0 0 0 0 0 0 0 0 0 0 0 0 0 0 0 0 0
75 Kuntz Tyr-
0 0 0 0 0 0 0 0 0 0 1 2 4 10 24 57 123
30 Kuntz Tyr 216 216 216 216 216 216 216 216 216 216 216 215 214 212 206 193 167
20 Kuntz Asn 117 117 117 117 117 117 117 117 117 117 117 117 117 117 117 117 117
20 Kuntz Gln 438 438 438 438 438 438 438 438 438 438 438 438 438 438 438 438 438
30 Kuntz Pro 351 351 351 351 351 351 351 351 351 351 351 351 351 351 351 351 351
20 Kuntz Ser 306 306 306 306 306 306 306 306 306 306 306 306 306 306 306 306 306
20 Kuntz The 387 387 387 387 387 387 387 387 387 387 387 387 387 387 387 387 387
20 Kuntz Trp 0 0 0 0 0 0 0 0 0 0 0 0 0 0 0 0 0
15 Kuntz Ala 493 493 493 493 493 493 493 493 493 493 493 493 493 493 493 493 493
10 Kuntz Gly 171 171 171 171 171 171 171 171 171 171 171 171 171 171 171 171 171
10 Kuntz Ile 180 180 180 180 180 180 180 180 180 180 180 180 180 180 180 180 180
10 Kuntz Leu 387 387 387 387 387 387 387 387 387 387 387 387 387 387 387 387 387
10 Kuntz Met 90 90 90 90 90 90 90 90 90 90 90 90 90 90 90 90 90
00 Kuntz Phe 0 0 0 0 0 0 0 0 0 0 0 0 0 0 0 0 0
10 Kuntz Val 167 167 167 167 167 167 167 167 167 167 167 167 167 167 167 167 167
(NH3) 0 0 0 0 0 0 0 0 0 0 0 0 0 0 0 0 0
TOTAL 8338 8884 9679 10483 11043 11340 11475 11532 11555 11564 11568 11570 11572 11576 11585 11604 11644
Steven Brandon 30 June 2004
38
Table A8 Charge Inventory of Beef Myosin by pH with 400 moles of NaCl mole of myosin ndash Model 1 Myosin
Residue Charge Charge Inventory
Beef Pork
pH 32 pH 36 pH 40 pH 44 pH 48 pH 52 pH 56 pH 60 pH 64 pH 68 pH 72 pH 76 pH 80 pH 84 pH 88 pH 92 pH 96
0 Na Asp 0 0 0 0 0 0 0 0 0 0 0 0 0 0 0 0 0
-1 Asp-
0 0 0 -69 -118 -142 -153 -157 -159 -160 -160 -160 -160 -160 -161 -162 -164
0 Asp 0 0 0 0 0 0 0 0 0 0 0 0 0 0 0 0 0
0 Na Glu 0 0 0 0 0 0 0 0 0 0 0 0 0 0 0 0 0
-1 Glu-
0 0 0 -82 -147 -183 -199 -206 -209 -210 -210 -211 -211 -211 -212 -213 -215
0 Glu 0 0 0 0 0 0 0 0 0 0 0 0 0 0 0 0 0
0 His Cl 0 0 0 0 0 0 0 0 0 0 0 0 0 0 0 0 0
0 His 0 0 0 0 0 0 0 0 0 0 0 0 0 0 0 0 0
1 His+
29 29 28 28 27 25 20 14 8 4 2 1 0 0 0 0 0
0 Lys Cl 0 0 0 0 0 0 0 0 0 0 0 0 0 0 0 0 0
0 Lys 0 0 0 0 0 0 0 0 0 0 0 0 0 0 0 0 0
1 Lys+
219 219 219 218 218 216 213 208 202 198 196 195 194 193 190 184 170
0 Arg Cl 0 0 0 0 0 0 0 0 0 0 0 0 0 0 0 0 0
0 Arg 0 0 0 0 0 0 0 0 0 0 0 0 0 0 0 0 0
1 Arg+
86 86 86 86 85 85 84 82 79 78 77 76 76 76 75 74 71
0 Na Cys 0 0 0 0 0 0 0 0 0 0 0 0 0 0 0 0 0
-1 Cys-
0 0 0 0 0 0 0 0 0 0 0 0 0 0 0 0 0
0 Cys 0 0 0 0 0 0 0 0 0 0 0 0 0 0 0 0 0
0 Na Tyr 0 0 0 0 0 0 0 0 0 0 0 0 0 0 0 0 0
-1 Tyr-
0 0 0 0 0 0 0 0 0 0 0 0 0 -1 -2 -4 -8
0 Tyr 0 0 0 0 0 0 0 0 0 0 0 0 0 0 0 0 0
0 Asn 0 0 0 0 0 0 0 0 0 0 0 0 0 0 0 0 0
0 Gln 0 0 0 0 0 0 0 0 0 0 0 0 0 0 0 0 0
0 Pro 0 0 0 0 0 0 0 0 0 0 0 0 0 0 0 0 0
0 Ser 0 0 0 0 0 0 0 0 0 0 0 0 0 0 0 0 0
0 Thr 0 0 0 0 0 0 0 0 0 0 0 0 0 0 0 0 0
0 Trp 0 0 0 0 0 0 0 0 0 0 0 0 0 0 0 0 0
0 Ala 0 0 0 0 0 0 0 0 0 0 0 0 0 0 0 0 0
0 Gly 0 0 0 0 0 0 0 0 0 0 0 0 0 0 0 0 0
0 Ile 0 0 0 0 0 0 0 0 0 0 0 0 0 0 0 0 0
0 Leu 0 0 0 0 0 0 0 0 0 0 0 0 0 0 0 0 0
0 Met 0 0 0 0 0 0 0 0 0 0 0 0 0 0 0 0 0
0 Phe 0 0 0 0 0 0 0 0 0 0 0 0 0 0 0 0 0
0 Val 0 0 0 0 0 0 0 0 0 0 0 0 0 0 0 0 0
0 (NH3) 0 0 0 0 0 0 0 0 0 0 0 0 0 0 0 0 0
TOTAL 333 333 333 181 65 1 -35 -60 -78 -90 -96 -99 -101 -103 -108 -120 -146
Steven Brandon 30 June 2004
39
Table A9 Beef Myosin Hydration by pH with 400 moles of NaCl mole of myosin ndash Model 1
Myosin
Hydration moles of H2O mole of Myosin
moles H2OMole of Residue Beef Pork
pH 32 pH 36 pH 40 pH 44 pH 48 pH 52 pH 56 pH 60 pH 64 pH 68 pH 72 pH 76 pH 80 pH 84 pH 88 pH 92 pH 96
2 best guess Na Asp 111 222 371 367 356 350 347 346 346 345 345 345 345 345 344 342 338
6 Kuntz Asp-
0 0 0 416 706 852 916 943 953 958 959 960 961 962 965 971 982
2 Kuntz Asp 555 443 295 160 74 32 13 5 2 1 0 0 0 0 0 0 0
2 best guess Na Glu 104 222 403 433 444 450 453 454 454 454 455 454 454 454 453 450 445
75 Kuntz Glu-
0 0 0 614 1103 1370 1493 1545 1566 1575 1578 1580 1581 1583 1587 1597 1616
2 Kuntz Glu 772 654 473 279 138 60 25 10 4 2 1 0 0 0 0 0 0
4 best guess His Cl 137 137 136 135 131 121 103 75 44 22 10 4 2 1 0 0 0
4 best guess His 0 1 2 6 14 32 67 120 175 215 236 245 249 251 252 252 252
4 Kuntz His+
114 114 113 112 108 99 82 57 32 15 7 3 1 0 0 0 0
45 best guess Lys Cl 1182 1182 1183 1184 1187 1195 1209 1232 1257 1275 1285 1289 1291 1291 1289 1283 1270
45 Kuntz Lys 0 0 0 0 0 0 0 0 0 0 1 1 4 9 22 54 131
45 Kuntz Lys+
985 985 984 983 980 972 957 935 910 892 881 876 873 867 856 829 765
3 best guess Arg Cl 309 309 309 310 311 313 316 322 329 334 336 338 338 339 341 344 353
3 Kuntz Arg 0 0 0 0 0 0 0 0 0 0 0 0 0 0 0 0 1
3 Kuntz Arg+
258 258 258 257 256 254 251 245 238 233 231 229 229 228 226 222 213
1 best guess Na Cys 0 0 0 0 0 0 0 0 0 0 0 0 0 0 0 0 0
2 best guess Cys-
0 0 0 0 0 0 0 0 0 0 0 0 0 0 0 0 0
1 Kuntz Cys 0 0 0 0 0 0 0 0 0 0 0 0 0 0 0 0 0
3 Kuntz Na Tyr 0 0 0 0 0 0 0 0 0 0 0 0 1 2 5 12 25
75 Kuntz Tyr-
0 0 0 0 0 0 0 0 0 0 0 1 2 5 12 28 61
3 Kuntz Tyr 216 216 216 216 216 216 216 216 216 216 216 215 214 212 206 193 167
2 Kuntz Asn 117 117 117 117 117 117 117 117 117 117 117 117 117 117 117 117 117
2 Kuntz Gln 438 438 438 438 438 438 438 438 438 438 438 438 438 438 438 438 438
3 Kuntz Pro 351 351 351 351 351 351 351 351 351 351 351 351 351 351 351 351 351
2 Kuntz Ser 306 306 306 306 306 306 306 306 306 306 306 306 306 306 306 306 306
2 Kuntz Thr 387 387 387 387 387 387 387 387 387 387 387 387 387 387 387 387 387
2 Kuntz Trp 0 0 0 0 0 0 0 0 0 0 0 0 0 0 0 0 0
15 Kuntz Ala 493 493 493 493 493 493 493 493 493 493 493 493 493 493 493 493 493
1 Kuntz Gly 171 171 171 171 171 171 171 171 171 171 171 171 171 171 171 171 171
1 Kuntz Ile 180 180 180 180 180 180 180 180 180 180 180 180 180 180 180 180 180
1 Kuntz Leu 387 387 387 387 387 387 387 387 387 387 387 387 387 387 387 387 387
1 Kuntz Met 90 90 90 90 90 90 90 90 90 90 90 90 90 90 90 90 90
0 Kuntz Phe 0 0 0 0 0 0 0 0 0 0 0 0 0 0 0 0 0
1 Kuntz Val 167 167 167 167 167 167 167 167 167 167 167 167 167 167 167 167 167
(NH3) 0 0 0 0 0 0 0 0 0 0 0 0 0 0 0 0 0
TOTAL 7830 7830 7830 8558 9110 9403 9535 9591 9614 9623 9627 9629 9631 9635 9644 9665 9706
Steven Brandon 30 June 2004
40
Table A10 Charge Inventory of Beef Myosin by pH with 400 moles of NaCl mole of myosin ndash Model 2
Myosin
Residue Charge Charge Inventory
Beef Pork
pH 32 pH 36 pH 40 pH 44 pH 48 pH 52 pH 56 pH 60 pH 64 pH 68 pH 72 pH 76 pH 80 pH 84 pH 88 pH 92 pH 96
-1 Asp-
-55 -111 -185 -253 -296 -317 -326 -330 -332 -332 -333 -333 -333 -333 -333 -333 -333
0 Asp 0 0 0 0 0 0 0 0 0 0 0 0 0 0 0 0 0
-1 Glu-
-52 -111 -201 -298 -369 -408 -425 -433 -436 -437 -438 -438 -438 -438 -438 -438 -438
0 Glu 0 0 0 0 0 0 0 0 0 0 0 0 0 0 0 0 0
0 His Cl 0 0 0 0 0 0 0 0 0 0 0 0 0 0 0 0 0
0 His 0 0 0 0 0 0 0 0 0 0 0 0 0 0 0 0 0
1 His+
29 29 28 28 27 25 20 14 8 4 2 1 0 0 0 0 0
0 Lys Cl 0 0 0 0 0 0 0 0 0 0 0 0 0 0 0 0 0
0 Lys 0 0 0 0 0 0 0 0 0 0 0 0 0 0 0 0 0
1 Lys+
219 219 219 218 218 216 213 208 202 198 196 195 194 193 190 184 170
0 Arg Cl 0 0 0 0 0 0 0 0 0 0 0 0 0 0 0 0 0
0 Arg 0 0 0 0 0 0 0 0 0 0 0 0 0 0 0 0 0
1 Arg+
86 86 86 86 85 85 84 82 79 78 77 76 76 76 75 74 71
-1 Cys-
0 0 0 0 0 0 0 0 0 0 0 0 0 0 0 0 0
0 Cys 0 0 0 0 0 0 0 0 0 0 0 0 0 0 0 0 0
-1 Tyr-
0 0 0 0 0 0 0 0 0 0 0 0 -1 -1 -3 -8 -16
0 Tyr 0 0 0 0 0 0 0 0 0 0 0 0 0 0 0 0 0
0 Asn 0 0 0 0 0 0 0 0 0 0 0 0 0 0 0 0 0
0 Gln 0 0 0 0 0 0 0 0 0 0 0 0 0 0 0 0 0
0 Pro 0 0 0 0 0 0 0 0 0 0 0 0 0 0 0 0 0
0 Ser 0 0 0 0 0 0 0 0 0 0 0 0 0 0 0 0 0
0 Thr 0 0 0 0 0 0 0 0 0 0 0 0 0 0 0 0 0
0 Trp 0 0 0 0 0 0 0 0 0 0 0 0 0 0 0 0 0
0 Ala 0 0 0 0 0 0 0 0 0 0 0 0 0 0 0 0 0
0 Gly 0 0 0 0 0 0 0 0 0 0 0 0 0 0 0 0 0
0 Ile 0 0 0 0 0 0 0 0 0 0 0 0 0 0 0 0 0
0 Leu 0 0 0 0 0 0 0 0 0 0 0 0 0 0 0 0 0
0 Met 0 0 0 0 0 0 0 0 0 0 0 0 0 0 0 0 0
0 Phe 0 0 0 0 0 0 0 0 0 0 0 0 0 0 0 0 0
0 Val 0 0 0 0 0 0 0 0 0 0 0 0 0 0 0 0 0
0 (NH3) 0 0 0 0 0 0 0 0 0 0 0 0 0 0 0 0 0
TOTAL 226 111 -54 -219 -335 -399 -435 -460 -478 -490 -496 -499 -501 -503 -508 -520 -546
Steven Brandon 30 June 2004
41
Table A11 Beef Myosin Hydration by pH with 400 moles of NaCl mole of myosin ndash Model 2
Myosin
Hydration moles of H2O mole of Myosin
moles H2OMole of Residue Beef Pork
pH 32 pH 36 pH 40 pH 44 pH 48 pH 52 pH 56 pH 60 pH 64 pH 68 pH 72 pH 76 pH 80 pH 84 pH 88 pH 92 pH 96
6 Kuntz Asp-
332 667 1113 1517 1773 1901 1958 1981 1990 1994 1996 1996 1996 1997 1997 1997 1997
2 Kuntz Asp 555 443 295 160 74 32 13 5 2 1 0 0 0 0 0 0 0
75 Kuntz Glu-
390 831 1510 2238 2769 3058 3191 3247 3270 3279 3283 3284 3285 3285 3285 3285 3285
2 Kuntz Glu 772 654 473 279 138 60 25 10 4 2 1 0 0 0 0 0 0
4 best guess His Cl 137 137 136 135 131 121 103 75 44 22 10 4 2 1 0 0 0
4 best guess His 0 1 2 6 14 32 67 120 175 215 236 245 249 251 252 252 252
4 Kuntz His+
114 114 113 112 108 99 82 57 32 15 7 3 1 0 0 0 0
45 best guess Lys Cl 1182 1182 1183 1184 1187 1195 1209 1232 1257 1275 1285 1289 1291 1291 1289 1283 1270
45 Kuntz Lys 0 0 0 0 0 0 0 0 0 0 1 1 4 9 22 54 131
45 Kuntz Lys+
985 985 984 983 980 972 957 935 910 892 881 876 873 867 856 829 765
3 best guess Arg Cl 309 309 309 310 311 313 316 322 329 334 336 338 338 339 341 344 353
3 Kuntz Arg 0 0 0 0 0 0 0 0 0 0 0 0 0 0 0 0 1
3 Kuntz Arg+
258 258 258 257 256 254 251 245 238 233 231 229 229 228 226 222 213
2 best guess Cys-
0 0 0 0 0 0 0 0 0 0 0 0 0 0 0 0 0
1 Kuntz Cys 0 0 0 0 0 0 0 0 0 0 0 0 0 0 0 0 0
75 Kuntz Tyr-
0 0 0 0 0 0 0 0 0 0 1 2 4 10 24 57 123
3 Kuntz Tyr 216 216 216 216 216 216 216 216 216 216 216 215 214 212 206 193 167
2 Kuntz Asn 117 117 117 117 117 117 117 117 117 117 117 117 117 117 117 117 117
2 Kuntz Gln 438 438 438 438 438 438 438 438 438 438 438 438 438 438 438 438 438
3 Kuntz Pro 351 351 351 351 351 351 351 351 351 351 351 351 351 351 351 351 351
2 Kuntz Ser 306 306 306 306 306 306 306 306 306 306 306 306 306 306 306 306 306
2 Kuntz Thr 387 387 387 387 387 387 387 387 387 387 387 387 387 387 387 387 387
2 Kuntz Trp 0 0 0 0 0 0 0 0 0 0 0 0 0 0 0 0 0
15 Kuntz Ala 493 493 493 493 493 493 493 493 493 493 493 493 493 493 493 493 493
1 Kuntz Gly 171 171 171 171 171 171 171 171 171 171 171 171 171 171 171 171 171
1 Kuntz Ile 180 180 180 180 180 180 180 180 180 180 180 180 180 180 180 180 180
1 Kuntz Leu 387 387 387 387 387 387 387 387 387 387 387 387 387 387 387 387 387
1 Kuntz Met 90 90 90 90 90 90 90 90 90 90 90 90 90 90 90 90 90
0 Kuntz Phe 0 0 0 0 0 0 0 0 0 0 0 0 0 0 0 0 0
1 Kuntz Val 167 167 167 167 167 167 167 167 167 167 167 167 167 167 167 167 167
(NH3) 0 0 0 0 0 0 0 0 0 0 0 0 0 0 0 0 0
TOTAL 8338 8884 9679 10483 11043 11340 11475 11532 11555 11564 11568 11570 11572 11576 11585 11604 11644
Steven Brandon 30 June 2004
42
Table A12 References sited by Puolanne Ruusunen and Vainionpaumlauml (2001)
Hamm R 1962 Uumlber das Wasserbindungsvermoumlgen des Saumlugetiersmuskels XII part Uumlber
das Unterschiedliche nicht auf pH-Differenzen beruhende Wasserbindungsvermoumlgen des Rindermuskels Z Lebensmittel-Untersuch und Forsch 117 p 415
Hamm R 1972 Kolloidchemie des Fleisches Paul Parey Co Berlin
Ishioroshi M Samejima K and Yasui T 1979 Heat induced gelation of myosin factors
of pH and salt concentrations Journal of Food Science 44 pp 741ndash744
Kivikari R (1996) Buffering capacity of meat Thesis University of Helsinki EKT -series 1048
Offer G and Knight P 1983 The structural basis of water-holding in meat Part 1
General principles and water uptake in meat processing In Lawrie RA Editor 1983 Developments in meat science Elsevier Applied Science London
Puolanne E and Ruusunen M 1983 Einfluss des Salzzusatzes auf das
Wasserbindungsvermoumlgen der verschiedener Fleischsortimente in Bruumlhwurst Fleischwirtschaft 62 pp 238ndash239
Warriss PD 1982 The relationship between pH45 and drip in pig muscle Journal of Food
Technology 17 pp 573ndash578
Steven Brandon 30 June 2004
43
References
1 Food The Chemistry of Its Components 2nd ed T P Coultate The Royal Society of
Chemistry London 1989 p 106 2 httpwwwaw-bccommathewsch02frameshtm 3 httpwwwaw-bccommathewsch02frameshtm 4 httpwwwneurowustleduneuromuscularmothermyosinhtm 5 httpwwwmrc-lmbcamacukmyosintreesmclasseshtml 6 Private Communication Dr J C Acton Clemson University June 3 2004 7 httpwwwaw-bccommathewsch02frameshtm 8 CHEMISTRY OF MEAT PROCESSING Animal Sciences 550 Lynn Knipe Associate
Professor Animal Sciences Food Science amp Technology The Ohio State University
September 29 2000 9 Pre-rigor injection using glycolytic inhibitors in low-quality beef muscles N C Jerez C R
Calkins and J Velazco J Anim Sci 2003 81 pp 997-1003 10 CHEMISTRY OF MEAT PROCESSING Animal Sciences 550 Lynn Knipe Associate
Professor Animal Sciences Food Science amp Technology The Ohio State University
September 29 2000 11 MAKING MEAT FROM MUSCLES httpwwwcluesabdnacuk8080mirrorsgrowthch90html 12 httpwwwsunysbedubiochemcourseslectures929bmo520html 13 Biochemistry Christopher K Mathews KE van Holde 2nd ed Menlo Park CA Benjamin
Cummings Pub Co Inc 1996 p 52 14 Biochemistry Christopher K Mathews KE van Holde 2nd ed Menlo Park CA Benjamin
Cummings Pub Co Inc 1996 p 52
Introduction to Protein Chemistry S Fox J S Foster Wiley 1957 p242 httpwwwmcukyedubiochemistryCoursesbch612powerpoint2001lecture3Lecture3_filesframehtm
16 The Science of Meat and Meat Products J F Price B S Schweigert 2nd ed Food amp
Nutrition Press Inc Westport Connecticut 1978 p106 17 Private Communication Dr J C Acton Clemson University May 31 2004 18 httpwwwmcukyedubiochemistryCoursesbch612powerpoint2001lecture3Lecture3_filesframehtm 19 The effect of net charge on the solubility activity and stability of ribonuclease Sa Kevin
L Shaw Gerald R Grimsley Gennady I Yakovlev Alexander A Makarov and C Nick Pace Protein Science (2001) 10 pp 1206-1215
20 Proteins Masterpieces of Polymer Chemistry Robert A Copeland Todayrsquos Chemist at
Work June 1992 pp 33-37 21 Food Chemistry 3rd ed Owen R Fennema Marcel-Dekker Inc New York 1996 p367 22 Water Relations of Foods R B Duckworth Academic Press New York 1975 pp 104 -
105 23 Hydration of Macromolecules III Hydration of Polypeptides ID Kuntz Journal of the
American Chemical Society Vol 93 No 2 January 27 1971 pp 514-516 24 Isoelectric Precipitation httpwwwrpiedudeptchem-engBiotech-EnvironPRECIPprecpphhtml 25 ATOMIC and IONIC RADIUS httpwwwchemguidecoukatomspropertiesatradiushtml 26 A Field Guide and Introduction to the Geology and Chemistry of Rocks and Minerals
Charles A Sorrell Golden Press Western Publishing Co Inc Racine WI 1973 p 23 27 httpwwwwouedulasphyscich412hydrolysishtm 28 httpvischemcadrecomauhtmlcdatomshtml 29 httpwwwmcukyedubiochemistryCoursesbch612powerpoint2001lecture3Lecture3_filesframehtm 30 Proteins Amino Acids and Peptides as Ions and Dipolar Ions EJ Cohn JT Edsall
Rheinhold New York NY 1942 httpwwwmcukyedubiochemistryCoursesbch612powerpoint2001lecture3Lecture3_filesframehtm
31 Biochemistry 601 Protein Solubility Purification and Analysis Last modified 82399 Dr Landry Tulane University landrymailhosttcstulaneedu httpwwwtulaneedu~biochemmedpurehtm
32 TECHNICAL BULLETIN - COOKED CURED HAM httpwwwsoloseasaltcomTechnicalTech5htm
Steven Brandon 30 June 2004
44
33 On the mechanism of water holding in meat The swelling and shrinking of myofibrils
Gerald Offer and John Trinick Meat Science Volume 8 Issue 4 1983 pp 245-281 34 Solubility of salmon myosin as affected by conformational changes at various ionic
strengths and pH Tein M Lin Jae W Park Journal of Food Science March-April 1998 v63 i2 p 215
35 Combined effects of NaCl and raw meat pH on water-holding in cooked sausage with
and without added phosphate Eero J Puolanne Marita H Ruusunen and Jukka I Vainionpaumlauml Meat Science Volume 58 Issue 1 May 2001 pp 1-7
36 Salt Effects on Ionization Equilibria of Histidines in Myoglobin Yung-Hsiang Kao Carolyn A Fitch Shibani Bhattacharya Christopher J Sarkisian Juliette T J Lecomte and
Bertrand Garciacutea-Moreno E Biophys J September 2000 Vol 79 No 3 pp 1637-1654 37 MEAT EMULSIONS C Lynn Knipe Meat Export Research Center Iowa State University
httpwwwagohio-stateedu~meatsciarchiveMEATEMULSIONShtm 38 Salt-induced swelling of meat The effect of storage time pH ion-type and
concentration Peter Wilding Nicholas Hedges and Peter J Lillford Meat Science Volume
18 Issue 1 1986 pp 55-75 39 httpenwikipediaorgwikiAmino_acidStructures 40 httpenwikipediaorgwikiAmino_acidChemical_properties

Steven Brandon 30 June 2004
2
Actin
Under physiological conditions actin exists as a long helical polymer (fibrous
actin or F-actin) of a globular protein monomer G-actin (see Figure 2 below) The structure of the G-actin monomer is a two-domain molecule with a mass of
42 kDa The binding of ATP by a G-actin monomer leads to polymerization ie the formation of F-actin The ATP is subsequently hydrolyzed but the ADP is
retained in the actin filament Within F-actin filaments the G-actin monomers are
arranged in a two-strand helix Because the subunits are asymmetric each F-
actin filament has two distinguishable ends called the plus end and the minus end The polymerization reaction exhibits a preferred direction-the plus end
grows much more rapidly than the minus end Actin filaments carry sites on each
subunit that can bind to myosin
Figure 2 G-actin3 and F-actin4
Myosin
There are many types of myosin found in nature5 The functional myosin
molecule Figure 3 is composed of six polypeptide chains two identical heavy
chains (230 kDa) and two each of two kinds of light chains (20 kDa) which together they form a complex of molecular weight 540 kDa (For my analysis I used a molecular weight of 450 kDa6) The heavy chains have long α-helical tails
and globular head domains The α-helical tails are interwound into a two-strand coiled coil and the light chains are bound to the globular head domains Between
each head domain and tail domain is a flexible stalk
Steven Brandon 30 June 2004
3
Figure 3 The myosin molecule7
Myosin exhibits aspects of both fibrous and globular proteins and its functional domains play quite different roles The tail domains have a pronounced tendency
to aggregate causing myosin molecules to form thick bipolar filaments The head domains with their attached light chains are often called headpieces they have
a strong tendency to bind to actin
The following additional information about myosin is from Knipe 20008
Myosin is the most functional of all animal proteins in the production of cooked
meat products However the best way to extract myosin from meat is to remove the meat from carcasses prior to the development of rigor mortis and
mix the meat with salt immediately to prevent the development of the
contracted form of actomyosin While actomyosin is the protein form that is
most often used in the meat industry and relatively easily extracted and relatively good at binding water and fat it is not as functional as myosin which is
not bound to actin Once actin and myosin have contracted to form actomyosin
it is much more difficult to extract myosin from meat
In addition to the formation of actomyosin during rigor mortis there is a
reduction in muscle pH from 70 (living muscle) to about 56-58 (post-mortem)
This pH decline is due to the accumulation of lactic acid in the muscle which in
the living animal would normally be shunted to the liver through the blood
stream Glycogen during postmortem glycolysis converts to lactic acid which ultimately reduces the pH of the muscle
Steven Brandon 30 June 2004
4
The inhibition of glycolysis prevents lactic acid formation consequently
maintaining a high pH which may increase tenderness and water-holding
capacity9
Water-Holding Capacity
This information on Water holding capacity is from Knipe 200010
Water-holding capacity is the ability of meat to retain moisture during cutting grinding cooking pressing etc Sometimes water-binding capacity is used
particularly with the ability to bind (rather than hold) moisture during cooking
Chemically moisture is held by proteins to different degrees and the differences
in these types of moisture are referred to as bound water immobilized water and
free water Bound water is the most tightly bound and is not affected by the addition of salt or changes in pH However bound water is reduced as muscle
goes into rigor mortis and when cooked
The net charge effect of proteins is a major cause of changes in WHC of muscle during the rigor process Proteins have both negative and positive charges on
their side chains but at the time of death the charges on muscle proteins are predominately negative This predominance of negative charges causes the proteins to naturally repel one another much like two negative poles on a
magnet
As the pH of muscle drops during the rigor process due to the accumulation of
lactic acid the positive charges from the acid cancel out the negative charges of the muscle Therefore as muscle approaches the post-rigor state there is a
nearly equal number of positive and negative charges on the proteins The isoelectric point is the pH of muscle in which the number of positive charges
equals the negative charges on proteins In meat the isoelectric point is
approximately pH 51 to 53
The final postmortem pH of meat is in the range of 55 to 60 which is near the
isoelectric point The point of concern is that equal numbers of positive and
negative charges cause the protein side chains to be attracted to one another
which physically causes moisture to be forced out from between the protein chains and therefore reduces WHC
The formation of actomyosin physically reduces the space between protein chains and the potential binding sites for binding water which also reduces WHC
I found more useful information about protein water binding at another source11
Steven Brandon 30 June 2004
5
Water binding capacity is modified by pH and drops from a high around pH 10 to a low at the isoelectric point of meat proteins between pH 50 and 51 At its
isoelectric point a protein bears no net charge and its solubility is minimal Below
pH 5 a value only attained if the pH of a processed meat product is deliberately lowered water binding capacity starts to increase again Water absorption
follows water binding capacity in this regard Thus as the pH of pork declines
post mortem its water binding capacity decreases and much of the water associated with muscle proteins is free to leave the muscle fiber
Towards their isoelectric point thick and thin filaments in myofibrils move closer together and reduce the water space between them Thus as the pH declines
post mortem filaments move closer together myofibrils shrink and the volume
of sarcoplasm increases Eventually muscle fibers depleted all their ATP their
membranes no longer confine the cell water and fluid is lost from the muscle fiber and may contribute to exudate lost from the meat
Water escapes from the spaces between muscle fiber bundles when they are cut and the drip loss from PSE (pale soft exudative) pork is increased to about 170 from a normal value of about 077 of trimmed carcass weight In sliced
pork drip losses increase with storage from 9 after 1 day to 123 after 6 days This creates a serious weight loss from the carcass In the USA the
estimated incidence of PSE carcasses (18) and their typical extra shrink loss (5 to 6) causes a total national loss of about 95 million dollars Obviously this is
only a rough guess but it serves to emphasize the commercial importance of pH
in pork The excess weight loss from PSE pork during transport storage and
processing could exceed one million kilograms per annum in the USA
Protein Solubility Solubility of proteins depends on ionic strength and pH If the pH approaches the
pI of a given protein the net charge on that protein will go to zero and in the absence of electrostatic repulsion weak electrostatic attractive forces may lead
to aggregation and precipitation this tendency to interact can be promoted by
reducing the ionic strength12
By way of example Mathews amp van Holde give a good description of the behavior
of β-lactoglobulin solubility The effects of ionic strength of the medium on the interaction between charged macroions can be summarized as follows At very
low ionic strength the counterion atmosphere is highly expanded and diffuse
and screening is ineffective Like-charged particles repel strongly unlike charged
particles attract one another strongly As the ionic strength increases the counterion atmosphere shrinks and becomes concentrated about the macroion
Screening becomes effective 13
This is explained by the Debye-Huckel Theory Polyampholytes like proteins or polyelectrolytes like DNA are called macroions because they are large and
Steven Brandon 30 June 2004
6
because depending on the solution pH they may carry a substantial net charge As shown in Figure 4 below each macroion collects about it a counterion
atmosphere of oppositely charged mall ions These small ions such as Na+ and
Cl- are called counterions and they interact with macroions by charge-charge interactions The counterion atmosphere shields macroions from each other thus
diminishing their ability to interact on the basis of charge2
Figure 4 The influence of small ions on macroion interactions2
The thickness of the counterion atmosphere depends on the concentration of
counterions present in the solution The greater the concentration of counterions the thicker the counterion atmosphere and the more effective is the electrostatic
screening between individual macroions The amount of counterions in solution
is measured as the ionic strength I
2
12
1ii
i
n
ZMI
where i represents each of the n different counterions in the solution Mi is the
molarity of each counterion ldquoirdquo and Zi is the charge of each counterion ldquoirdquo
The Debye-Huckel Theory attempts to measure the radius across which
macroions can interact with each other
Steven Brandon 30 June 2004
7
21
I
Kr
where K is a constant and ldquorrdquo is the distance over which the two macroions can
affect each other As the ionic strength (concentration) increases the radius
with which macroions can influence each other decreases Another way to say
this is that as ldquorrdquo gets smaller macroions must be closer together before they can interact with each other due to the shielding or shell of the counterions2
The effects of charge and ionic strength on the solubility of polyampholytes such
as proteins can be explained in terms of these electrostatic interactions Consider
the behavior of the common milk protein β-lactoglobulin The isoelectric point of
this polyampholyte is about 53 Above or below this pH the molecules all have either negative or positive charges and repel one another so the protein is very soluble at either acidic or basic pH At the isoelectric point the net charge is zero but each molecule still carries surface patches of both positive charge and
negative charge The ionic interactions between them together with other kinds of intermolecular interactions such as van der Waals forces make the molecules
tend to clump together and precipitate Therefore solubility is minimal at the isoelectric point If the ionic strength is increased however the counterion
atmosphere shrinks about the charged regions and the attractive interactions between positive and negative groups are effectively screened Hence solubility
increases even at the isoelectric point This effect of putting proteins into
solution by increasing the salt concentration is called ldquosalting in 14
The behavior of β-lactoglobulin is illustrated by the Figure 5 below It is interesting to note that this plot indicates a shift in the pH of minimal solubility to
higher pH with decreasing NaCl concentration This behavior may be a consequence of the amino acid composition of β-lactoglobulin
Steven Brandon 30 June 2004
8
Figure 5 Solubility of β-Lactoglobulin vs pH at several NaCl concentrations15
It is interesting to note that according to the plot shown in Figure 5 above
increasing salt content appears to slightly reduce the pI of β-lactoglobulin but not to decrease the minimum solubility of the protein in water
Amino Acid Composition
The functionality of a protein is determined by the side chains of its component
amino acids Theoretically side chains determine the structure of proteins based upon hydrogen ionic and disulfide bonds as well as hydrophobic and
hydrophilic interactions between amino acids8 The amino acids are shown in
Table A1 in the Appendix The amino acid composition for beef pork and rabbit
myosin are presented by Price and Schweigert (see Table 1 below) 16
Steven Brandon 30 June 2004
9
Table 1 Myosin amino acid composition
This table lists the residues of each amino acid per 105 grams of myosin In
Price and Schweigertrsquos table (Table 1 above) the total number of amino acid residues in pork myosin is listed as 837 residues The actual sum of amino acid
residues listed in this table for pork myosin is 835 residues
As stated previously I assumed a molecular weight of 450 kDa for myosin6
With this molecular weight I determined the number of residues of each amino
acid per mole of myosin as shown in Table A2 in the Appendix
Steven Brandon 30 June 2004
10
In Price and Schweigertrsquos table asparagine and glutamine quantities are combined with the listed aspartic acid and glutamic acid quantities respectively
I assumed that asparagine accounts for 13 of the aspartic acid reported and that
glutamine accounts for 15 of the glutamic acid reported17
Henderson-Hasselbalch Equation Some amino acid residues in proteins (aspartic acid glutamic acid cysteine
tyrosine histidine lysine and arginine see Table 2) have dissociable R-groups
Table 2 Ionized Forms of Amino Acids18
It should be noted that the actual pKs of amino acid groups in proteins may differ somewhat from those measured for the side groups of free amino acids
In general acidic proteins have their pIs overestimated and basic proteins have
their pIs underestimated when calculated using pKs from model compound
studies This is expected For Asp side chains a pK = 41 is observed with
uncharged model compounds but a pK = 34 is the average value observed in proteins This results mainly because proteins have a net positive charge in the
region where Asp and Glu carboxyls titrate and this will tend to lower their pKs
relative to those measured in uncharged model The converse will be true for
Steven Brandon 30 June 2004
11
basic proteins where the proteins will have a net negative charge above the pI
that will tend to raise the pKs of the ionizable groups In addition to net charge
other environmental effects can change pKs Thus it is always best to measure
rather than estimate the pI of a protein unless the measured pKs of the ionizable
groups are available19
The Henderson-Hasselbalch equation describes the proportion of dissociated
groups as a function of pH With the Henderson-Hasselbalch equation
HA
A
apKpH
log
where [HA] is the concentration of the undissociated weak acid and [A-] is the
concentration of the conjugate base of [HA]2 one can calculate the ratio of
dissociated groups to undissociated groups [A-][HA] at different pHs with the
pKa of each amino acid R-group which are listed in Table A3 in the Appendix
With the Henderson-Hasselbalch equation I used Excel to calculate the
proportion of each amino acid residue with dissociable groups at 04-pH intervals from pH 32 to pH 96 This range exceeds the pH range of meat products (pH
52 to 60) but I was curious to see how the amino acid proportions varied over a wider pH range For my analysis I used pKa values for each amino acid R-group from a different source20 than that of Table A3 These values are
however very close to those reported in the Table A3
Since all but one the α-carboxyl group and all but one α-amino group are
involved in peptide bonds between amino acid residues forming the myosin protein molecule there can be very little contribution of these two terminal groups to the behavior of myosin which contains several thousand amino acid
residues For that reason I have chosen to exclude these two groups from my analysis Additionally the peptide bond groups forming the back bone of the protein polypeptide chain can attract some water by polar attraction but this
should be considerably less than that contributed by the side groups especially
those that are ionized So I have also not included the hydration due to the peptide groups in my calculations
The results of my calculations using the Henderson-Hasselbalch equation are
presented in Table A4 in the Appendix This table shows the fraction of
dissociated amino acid R-Groups as a function of pH Of particular interest in the pH range typical of meat products is the increasing proportion of anionic
aspartate and glutamate groups formed as the aspartic acid and glutamic acid R-
groups are deprotonated as the pH increases from around pH 4 (the approximate pKa of these two acidic R-groups where half the each type is deprotonated) to pH
6 (where about 99 of these acidic R-groups are deprotonated) Over the same
pH range the histidine R-groups are transition from about 99 cationic
Steven Brandon 30 June 2004
12
protonated groups at pH 4 to about 50 uncharged at pH 6 (near the pKa of histidine)
The calculated fractions of dissociated R-groups allowed me to determine the complete amino acid composition of beef pork and rabbit myosin The complete
amino acid composition for beef myosin is shown in Table A5 in the Appendix
Calculated Net Charge vs pH amp pI Armed with the complete amino acid composition of myosin at each pH it is possible to calculate the net charge of the myosin molecule To do this I
assumed a charge of -1 for de-protonated aspartic acid (aspartate) glutamic acid
(glutmate) cysteine and tyrosine groups and +1 for protonated histidine lysine and arginine groups The resulting charge inventory for beef myosin is given in
Table A6 in the Appendix The plot shown in Figure 6 below shows how the net
charge of beef pork and rabbit myosin vary with pH
Myosin Net Charge vs pH
-500
0
500
1000
30 40 50 60 70 80 90 100
pH
Ne
t C
ha
rge
of
My
os
in
Beef Pork Rabbit
Figure 6 Calculated Net Charge of Myosin versus pH
The pH at which the net charge is zero is the isoelectric point pI of the protein
From this analysis this occurs at different pH values for these myosin proteins
from three different animals as shown in Table 3 below
Table 3 Calculated Isoelectric Points of Beef Pork and Rabbit Myosin
Myosin Calculated pI
Beef pH 520
Steven Brandon 30 June 2004
13
Pork pH 555 Rabbit pH 463
The major cause of the lower pI for rabbit myosin appears to be the substantially
lower lysine content reported by Price and Schweigert compared that of beef and
pork myosin They report 85 lysine residues per 105 grams of rabbit myosin
compared to 107 and 105 lysine residues per 105 grams of beef and pork myosin
respectively
Calculated Hydration vs pH Water molecules bind to several groups in proteins These include charged groups (ion-dipole interactions) backbone peptide peptide groups the amide
groups of asparagines and glutamine hydroxyl groups of serine threoine and
tyrosine residues (all dipole-dipole interactions) and nonpolar residues (dipole-induced dipole interactions hydrophobic hydration)21 The following is extracted
from Duckworth 197522
Examination of proteins indicated that the amount of bound water is about 03 ndash
04 gg of protein The spread is values is reproducible and depends largely on
amino acid composition It can be represented by the approximate formula
NPC fffA 2040
where A is the amount of bound water in grams of water per gram of protein fC
is the fraction of charged side chains fP is the fraction of polar side chains and fN is the fraction of non-polar side chains This simple equation does make some
useful predictions [The equation is derived from measurements on
homopolypeptides (Kuntz 1971)]
The approximate range of protein hydration should be 02 ndash 10 g of water per gram of protein depending on the amino acid composition of the protein The
equation overestimates the amount of water slightly since all side chains are
counted but some (mostly non-polar ones) are ldquoburiedrdquo in the native protein This
leads us to predict that hydration will increase slightly upon denaturation and
decrease slightly on hydrophobic aggregation Lowering the pH below 4 should be strongly dehydrating since the number of carboxylate groups decreases sharply
Note that the equation counts carboxylate and cationic side chains equally This
errs in two ways First the carboxylate groups appear to be somewhat more
hydrated than lysine or arginine Second neutralization of the nitrogen charge at
high pH does not cause dehydration Thus the equation will make a moderate
under estimate (10-15) above pH 10 or if the basicacidic side chain ratio is much different from 1 Protein-protein interactions that are strongly ionic in
nature would be expected to cause marked dehydration on aggregation The
general philosophy behind this equation works reasonably well when extended to
other polymeric systems each cationic site holds about four water molecules
each anionic site holds about six each polar site (N or O atoms) holds about one
Steven Brandon 30 June 2004
14
Table 4 below shows the total numbers of anionic cationic polar and non-polar side groups in beef myosin at a range of pH values from 32 to 96 The numbers
of anionic cationic and polar change with pH as the various ionizable groups
become increasingly de-protonated with increasing pH
Table 4 Breakdown of Beef Myosin Amino Acid Groups by Type
pH 32 pH 36 pH 40 pH 44 pH 48 pH 52 pH 56 pH 60 pH 64 pH 68 pH 72 pH 76 pH 80 pH 84 pH 88 pH 92 pH 96
Anionic Total 107 222 387 551 665 725 752 763 768 770 770 771 771 772 774 778 787
Cationic Total 733 733 733 732 730 726 717 703 690 680 674 672 670 669 666 658 641
Polar Total 1477 1362 1198 1034 923 867 849 851 860 868 873 875 876 877 878 881 889
Non-Polar Total 1445 1445 1445 1445 1445 1445 1445 1445 1445 1445 1445 1445 1445 1445 1445 1445 1445
Since the simple equation presented by Duckworth above errs in treating
cationic and anionic side groups equally I have again used an Excel spreadsheet
approach similar to that used to determine net charge to calculate the amount of water bound to various myosin amino acid residues This technique requires
that I first obtain hydration data for each type of amino acid residue in myosin
Table 5 below was scanned from Fennema 1996
Table 5 Amino Acid Hydrations ndash Fennema
Steven Brandon 30 June 2004
15
Table 6 is scanned from the source reference for the table from Fennemarsquos text
Kuntz 197123
Table 6 Amino Acid Hydrations ndash Kuntz
These two sources agree however since Fennema has rounded off the numbers
in his table to one significant figure I have used the values presented by Kuntz in my analysis However neither source lists hydration capacities for uncharged
histidine or for de-protonated (charged) cysteine (Fennemarsquos table omits
cysteine entirely) I have used 4 moles of water per mole of residue for uncharged histidine (since uncharged lysine and arginine hold the same amount
Steven Brandon 30 June 2004
16
of water as charged lysine and arginine respectively) and 2 moles of water per mole of residue for de-protonated cysteine (since it is reasonable to guess that
the charged form might attract water more than uncharged cysteine which holds
1 mole of water per mole of residue) Multiplying the hydration capacities for each amino acid residue by the number of each type of amino acid residue per
myosin molecule gives the total hydration capacity of myosin at each pH Table
A7 in the Appendix shows the results of these calculations for beef myosin Figure 7 below shows how the total hydration of beef pork and rabbit myosin
vary with p based on these calculations
Myosin Hydration vs pH
6000
7000
8000
9000
10000
11000
12000
30 40 50 60 70 80 90 100
pH
Hy
dra
tio
n
mo
les H
2O
mo
le o
f M
yo
sin
Beef Pork Rabbit
Figure 7 Calculated Hydration of Myosin versus pH
It is obvious from this plot that this approach does not accurately predict the
observed increase in hydration at pH below the isoelectric point of meat proteins
Note that this analysis does not predict increasing hydration below the isoelectric
point of the protein as expected from the solubility behavior of proteins (see Figure 5) Since water is dipolar it has both positive (electron-poor) and
negative (electron-rich) regions as shown in Figure 8 below
Steven Brandon 30 June 2004
17
Figure 8 Dipolar structure of water2
This dipolar structure of water is responsible for the formation of hydrogen bonds between water molecules and between water and other and other polar or
charged species including both anionic and cationic amino acid R groups as well as dissolved salt ions such as sodium and chloride At pH above its isoelectric
point myosin has a net negative charge This results from the increasing number
of anionic (de-protonated) carboxyl groups on the aspartic and glutamic acid
residues of the protein molecule with increasing pH These charged groups (aspartate and glutamate) strongly attract water binding 6 to 75 water
molecules per residue in contrast to the uncharged aspartic and glutamic acid
residues which hold only 2 water molecules per residue (by polar attraction) As the pH is lowered to the isoelectric point as occurs naturally in meat by
formation of lactic acid via glycolysis there are fewer of de-protonated anionic
groups as the pH approaches the pKa values of aspartic and glutamic acid (near pH 4)
This trend continues as the pH is lowered below the isoelectric point of myosin (which would generally require the introduction of acid to the meat product) as
fewer and fewer of the aspartic and glutamic acid residues are charged The
basic R groups lysine and arginine are protonated (and cationic) across the essentially fully range of pH included in my analysis (pH 32 to 96) These
Steven Brandon 30 June 2004
18
cationic groups also bind water but to a lesser extent than the anionic groups holding only roughly half the number of water molecules compared to the anionic
groups (3 or 4 vs 6 or 7) Histidine (pKa = 604) becomes increasingly
protonated as the pH is lowered through the isoelectric point of myosin (around pH 5) gaining a positive charge Although neither Fennema nor Kuntz list
hydration data for uncharged histidine it is reasonable to assume that its water
holding capacity (WHC) behavior is similar to that of both arginine and lysine whose WHC does not change depending on whether the group is charged For
this reason the WHC due to all three basic amino acid groups remains constant
across the pH range included in my analysis
So even though the net charge of the myosin molecule is zero at the isoelectric
point (by definition) positive above the isoelectric point and negative below the
isoelectric point the total WHC of myosin as calculated from the hydration values of the individual amino acid residues comprising the myosin molecule does not show a minimum near the isoelectric point
However that does not mean that the actual WHC of myosin behaves as predicted based on an analysis of the WHC of the constituent amino acid
residues That is because this analysis ignores the effects of interactions between myosin molecules whether retained in their relative positions in the
muscle tissue structure or not (as in meat batter) Protein-protein interactions can affect WHC in two ways Firstly interactions between oppositely charged
residues of different protein molecules can effectively neutralize the net charge of
the effected groups thereby reducing WHC of both groups This effect is likely to
be minimal since the charged groups being part of the larger myosin polypeptide molecule are not free to move into position to form such
interactions Secondly and probably more significantly near the isoelectric point where the net charge of the protein is minimized the repulsion of protein
molecules due to like-charged groups is also minimized This means that near the isoelectric point the protein molecules are able to draw more closely together
thereby displacing water that is trapped by capillary action between the molecules This does not effect water that is bound to the protein by polar or
charge attraction Since the amount of water trapped between protein molecules
can be large in comparison to that chemically bound to the protein the spacing of protein molecules (due to net charge) can be expected to have a much greater
effect to the overall WHC of a meat product regardless of whether it retains the
structure of muscle tissue or not
The pH dependence on the solubility of β-lactoglobulin in water is also due to the
variation of net charge with pH (see Figure 9 below)
Steven Brandon 30 June 2004
19
Figure 9 Dependence of protein solubility on pH2
Above or below pI the molecules all have either negative or positive charges and
repel one another Protein is therefore very soluble at either acidic or basic pH At pI the net charge is zero but each molecule still carries surface patches of both
positive and negative charge The charge-charge interactions together with other
kinds of intermolecular interactions such as van der Waals forces make the molecules tend to clump together and precipitate Therefore β-lactoglobulin like
many other proteins has minimum solubility at its isoelectric point2
At low pHs proteins have a net positive charge At high pHs they have a net
negative charge due to the carboxyl on the protein backbone losing its proton
At their pI value a protein has no net charge This leads to reduced solubility because the protein is unable to interact with the medium and will then fall out of
solution24
Steven Brandon 30 June 2004
20
Effect of added NaCl
Background information on NaCl in solution
Ions arent the same size as the atoms they come from Figure 10 compares the
sizes of sodium and chloride ions with the sizes of sodium and chlorine atoms
Figure 10 Relative sizes of Na and Cl ions and atoms
Positive ions are smaller than the atoms they come from Sodium is 281 Na+ is
28 Youve lost a whole layer of electrons and the remaining 10 electrons are
pulled in by the full force of 11 protons Negative ions are bigger than the atoms they come from Chlorine is 287 Cl- is 288 Although the electrons are
still all in the 3-level the extra repulsion produced by the incoming electron causes the atom to expand There are still only 17 protons but they hold 18
electrons25 The diameter of the Na+ ion is 095 Aring which is about half that of the Cl- ion with a diameter of 181 Aring26
When sodium chloride dissolves in water the sodium and chloride ions and the
polar water molecules are strongly attracted to one another by ion-dipole
interactions The solvent molecules (water in this case) surround the ions removing them from the crystal and forming the solution As the dissolving
process proceeds the individual ions are removed from the solid surface becoming completely separate hydrated species in the solution27 Table 7 illustrates these salt ions in aqueous solution
Table 7 Hydration of chloride and sodium ions28
Hydrated
Chloride Ion
Cl-(aq)
Each ion in aqueous solution is surrounded by about six water
molecules in the inner hydration sphere These molecules exchange
rapidly with other solvent molecules
Hydrated
Sodium Ion
Na+(aq)
Each ion in aqueous solution is surrounded by about six water
molecules in the inner hydration sphere These molecules exchange
rapidly with other solvent molecules
Steven Brandon 30 June 2004
21
Salt interaction with protein
At high ionic strength protein solubility generally decreases with increasing salt
concentration due to reducing the activity of water and neutralization of surface charge This phenomenon is called ldquosalting outrdquo Each protein has a distinct
solubility profile as a function of salt concentration defined by Log S (mgmL) = β ndash KS (I2) where S is solubility I is ionic strength and KS and β are constants
Different types of salts affect the solubility of proteins to different extents (see
Figure 11 below) 29
Figure 11 Protein Solubility versus ionic strength 30
Solubility at low ionic strength increases with salt concentration This ldquosalting inrdquo
effect is explained as pairing of salt ions with charged groups of the protein
shields intramolecular repulsion Protein solubility is at a minimum near the isoelectric point (pI) of the protein 31
Salt along with phosphates improves water retention by enhancing protein
hydration NaCl increases the net charges on the protein structure helping to unfold and expose the protein surface by binding water Salt shifts the isoelectric
point to a pH of near 40 increasing the net negative charge at higher meat pH
attracting more water and thus increasing water holding capacity An optimal salt level of 25 - 28 is required to obtain maximum yield juiciness and flavor
quality32
Steven Brandon 30 June 2004
22
Clminus ions bind to the filaments and increase the electrostatic repulsive force between them A crucial factor in swelling is likely to be the removal at a critical
salt concentration of one or more transverse structural constraints in the
myofibril (probably crossbridges the M-line or the Z-line) allowing the filament lattice to expand33
Adding salt moves the pH of the isoelectric point of myosin and exposes
hydrophobic and sulfhydryl groups to the protein surface leading to loss of
helical structure according to research into the relationship between solubility and conformational changes of salmon (Oncorhynchus tshawytscha) myofibrillar
proteins These conformational changes form more surface for protein
solubilization therefore boosting its solubility34
Puolanne Ruusunen and Vainionpaumlauml (2001) of University of Helsinki gave a good review of the effects of added salt to WHC of meat The following information is
extracted from this paper35 References sited in these extracts are listed in Table A12 in the Appendix
Salt (NaCl) is added to meat products to improve their binding and water-holding
properties Chloride ions tend to penetrate into the myofilaments causing them to swell (Hamm 1972) and the sodium ions form an ion cloud around the filaments
(Offer amp Knight 1983) This results in local concentration differences which lead to
an increased osmotic pressure within the myofibrils which causes the filament lattice
to swell Simultaneously the enlargement of negative net charge within the myosin
filaments loosens the filaments and finally causes the disintegration of the filament at
an ionic strength of 08 (without added phosphate) or in 04 (with added phosphate) In sausages without added phosphate water-holding increases rather linearly to the
salt content of ca 4 (Hamm 1972) With added phosphate there is a marked
increase in water-holding in the range of 10ndash15 NaCl (Puolanne amp Ruusunen
1983) This is due to the cleavage of actomyosin bonds by phosphates thus
facilitating the swelling of the filament lattice (Offer amp Knight 1983)
Similar phenomena take place when pH increases The negative net charge of
filaments increases causing an uneven distribution of charges within the filaments Without added salt the water-holding increases as the pH rises from 50 to 90
According to Hamm (1972) there is however not a marked correlation between the
ultimate pH value and water-holding in pH values below 57 (pork) or 58 (beef)
when the same muscles of different animals are compared Animal-to-animal
differences are larger in pH values above the isoelectric point than below (Hamm 1962) Warriss (1982) however found a marked decrease in water-holding in pork
in the pH-range of 51ndash58
When salt is added the binding of chloride ions decreases with increasing pH but the
binding of sodium ions increases (Hamm 1972) As a result the maximum in water-
holding is reached by about pH 60 in meat (Hamm) or in myosin gel (Ishioroshi
Samejima amp Yasui 1979)
Steven Brandon 30 June 2004
23
Offer and Knight (1988) stress that NaCl depolymerizes the thick filament shafts by
weakening interactions between the tails presumably by favoring the exposure of
previously buried charged or andor hydrophilic groups According to Kivikari (1996)
this changes the amount and nature of titratable groups accessible to the solvent probably revealing new groups having pKa values in the pH range 60ndash69
The increase of NaCl content causes a minor shift to lower pH values but this is not
relevant in the narrow range of 05ndash25 NaCl (ca 01ndash04 M) and low pH values of
this study NaCl alone seems not to have had a statistically significant overall effect on batter pH at concentration levels of NaCl in this study On the other hand WHC
and sausage pH were clearly affected by added NaCl alone as well as in the
interaction with meat pH
All cooked sausage variables had a maximum in water-holding by 25 added NaCl The water-holding of the sausages increases with increasing pH-value up to pH 61
and a further increase causes only a minor increase This study shows that water-
holding is strongly affected by the pH of raw materials in combination with NaCl
which renders it important to keep the pH high enough to ensure a sufficiently high
level of water-holding when aiming at lowered salt additions35
The plots shown below in Figure 10 are from the paper by Puolanne Ruusunen and Vainionpaumlauml35
Figure 10 The effect of pH amp NaCl on WHC in cooked sausage WOP without WP with
added phosphate 35
Steven Brandon 30 June 2004
24
I have re-plotted their data for beef and pork without added phosphate to see
how WHC varies with pH at a range of salt contents for both beef and pork (see
Figures 11 amp 12 below) These plots show that WHC for both beef and pork increases steadily without added NaCl as the pH is raised from 55 to 60 but
shows little additional increase at pH gt 60 This observation agrees in general
with the shape of the calculated hydration curve (See Figure 7)
Water Holding Capacity of Pork
0
20
40
60
80
100
54 56 58 60 62 64 66
pH
WH
C
g H
2O
g m
eat
00 NaCl 05 NaCl 10 NaCl
15 NaCl 20 NaCl 25 NaCl
Figure 11 WHC vs pH for Pork without added phosphates
Water Holding Capacity of Beef
0
20
40
60
80
100
54 56 58 60 62 64 66
pH
WH
C
g H
2O
g m
eat
00 NaCl 05 NaCl 10 NaCl
15 NaCl 20 NaCl 25 NaCl
Figure 12 WHC vs pH for Beef without added phosphates
Steven Brandon 30 June 2004
25
Figures 11 and 12 also show that WHC increases substantially with increasing salt content at least up to 25 NaCl
Kao et al (2000) offer the following comments on the way salt affects protein hydration and other properties Proteins are surrounded by an ionic double
layer the structure and properties of which are determined by the balance
between disorganizing thermal forces and the organizing effects of electrostatic interactions and hydration at the protein-solvent interface The properties of the
double layer are influenced by the density of charged and polar groups on the
surface of a protein Therefore salt and pH effects are thermodynamically coupled Strong interactions between proteins and partially dehydrated site-
bound ions are not observed frequently The effects of salt on the stability of
proteins are frequently interpreted in terms of screening of electrostatic
interactions by the ionic strength This concept was inherited from Linderstroslashm-Lang who applied the solution of the linearized Poisson-Boltzmann equation achieved by Debye and Huumlckel less than a year after their original publication in
1923 to understand the ionization properties of proteins The understanding of the physical nature of interactions between proteins and ions continues to advance However at present there is no unifying theoretical framework based
on simple physical principles capable of accounting quantitatively and structurally for all of the different types of salt effects that have been observed in proteins36
Analysis of NaCl effects on charge and WHC of myosin
Model 1 All salt ions interact with charged side groups
I have attempted to model the screening of myosinrsquos charged surface groups by salt ions by recalculating the myosin charge inventory and total hydration as a
function of pH by assuming that the salt ions effectively neutralize the charge of oppositely charged sites Figure 13 below is an illustration of the amino acid
composition of beef myosin at pH 44 where each circle represents one amino acid residue which may be acidic basic polar or non-polar For simplicity I
have divided the total number of amino acid residues by 100 to produce this representative illustration
Acidic
Basic
Polar
Non-Polar
Figure 13 Representative illustration of myosin amino acid composition
The sodium cations (+) and chloride anions (-) are also shown in Figure 13
Here these salt ions are shown screening the charge of oppositely charged amino
acid groups in the myosin molecule
Steven Brandon 30 June 2004
26
For my analysis I selected a salt concentration of 400 moles of NaCl mole of myosin I chose this salt concentration as one sufficient to significantly affect the
behavior of myosin based on the model described above) The results of this
analysis (for beef myosin) are shown in Tables A8 and A9 in the appendix Table A8 lists the charge inventory for beef myosin with 400 moles of added NaCl
mole of myosin As described above this table assumes that the available Na+
and Cl- ions combine with oppositely charged side groups effectively neutralizing them Below pH 40 not all of the free Na+ ions are consumed in interactions
with side groups because there are too few available anionic side groups
(aspartate and glutamate) In reality these free Na+ ions would tend to compete with the cationic side groups to attract Cl- ions but I have not
attempted to account for this in my model
Figure 14 below shows the net charge of myosin versus pH in the presence of
added NaCl This analysis indicates no change in net charge pH gt 40 is the
same as was calculated without added NaCl This is because above pH 40 where all of the available salt ions are employed in interactions with myosin side groups an equal number of positive and negative charges have been neutralized
Myosin Net Charge vs pH
-500
0
500
1000
30 40 50 60 70 80 90 100
pH
Ne
t C
ha
rge
of
My
os
in
Beef Pork Rabbit
Model 1
Figure 14 Net charge of myosin versus pH in the presence of added NaCl ndash Model 1
Table A9 lists the total hydration for beef myosin with 400 moles of added NaCl
mole of myosin I assumed that all of the salt-ion-screened (neutralized) side groups would have the bind the same number of water molecules per side group
as the corresponding unionized side groups For example I assumed that an
ionized aspartate group screened by a Na+ ion would bind the same amount of water as an uncharged aspartic acid group ie 2 molecules of water per group
Steven Brandon 30 June 2004
27
in this case Since the many of the side groups hole less water when unionized (or effectively neutralized by an oppositely charged salt ion) the total hydration
of myosin is lower than was calculated in the absence of added NaCl This is
illustrated in Figure 15 below which shows the calculated total hydration of myosin versus pH in the presence of added NaCl
Myosin Hydration vs pH
6000
7000
8000
9000
10000
11000
12000
30 40 50 60 70 80 90 100
pH
Hy
dra
tio
n
mo
les H
2O
mo
le o
f M
yo
sin
Beef Pork Rabbit
Model 1
Figure 15 Total hydration of myosin versus pH in the presence of added NaCl - Model 1
This analysis is unsatisfactory in that it predicts no change in isoelectric point
with added salt and in that it predicts a reduction in hydration of myosin with added salt These two predictions disagree with the reported observations that
adding low concentrations of salt lowers pI and increases hydration (at pH gt pI) Back to the drawing board
Model 2 Only anions interact with cationic side groups
The WHC of a meat system is greatly affected by the addition of salt To fully
understand this effect one must consider the action of both the cation and the
anion which result from the ionization of salt These ions must be absorbed by
the protein to affect WHC The effect of salt can be explained by the fact that the chloride anion being larger would be less hydrated than the sodium cation The
less hydrated ions are drawn closer to the charged protein group due to their
smaller radii The chloride ion should therefore have more of an effect on
screening of oppositely charged groups at pH above the pI than sodium resulting
in a net increase in negative charges and a shift of the pI of muscle to lower pH values An increase in negative charges results in repulsion of the protein groups
and an enlargement of the space available for absorption within the muscle37
This assertion that chloride ions being larger are less hydrated than sodium ions does not agree with the information I found elsewhere (see Table 7)28
Steven Brandon 30 June 2004
28
which states that both ions are hydrated by about six water molecules in solution However if one considers the counterion atmosphere surrounding a
catonic macroion (see Figure 4) such as myosin below its isoelectric point it is
not unreasonable to imagine that the anionic Cl- ions are held closely to the protein molecule while the cationic Na+ ions tend to remain at a greater distance
from the protein where they can have relatively little influence on the charge
and therefore the hydration behavior of the myosin molecule Figure 16 illustrates this concept
Figure 16 Illustration of the chloride screening effect assumed in Model 2
I have repeated my analysis using the assumption that only the Cl- ions are able
to interact with (and effectively neutralize) the cationic side groups while the Na+ ions do not interact with the myosin molecule at all
Table A10 lists the net charge of beef myosin versus pH as calculated using Model
2 As indicated in this table the isoelectric point is predicted by Model 2 to shift from about pH 52 (see Table 3) to lt pH 4 Figure 17 below shows that
isoelectic points of pork and rabbit myosin have shifted to lower pH This results
from the overall reduction in net charge resulting from neutralization of a large portion of the cationic side groups by charge interactions with chloride anions
+ + + + + +
+ + ++ + + + + + + + + +
+ + + +
Na+
Cl-
Steven Brandon 30 June 2004
29
Myosin Net Charge vs pH
-1000
-500
0
500
30 40 50 60 70 80 90 100
pH
Ne
t C
ha
rge
of
My
os
in
Beef Pork Rabbit
Model 2
Figure 17 Net charge of myosin versus pH in the presence of added NaCl ndash Model 2
Table A11 lists the total hydration of beef myosin versus pH as calculated using
Model 2 Figure 17 below shows the hydration curves for beef pork and rabbit myosin calculated using Model 2
Myosin Hydration vs pH
6000
7000
8000
9000
10000
11000
12000
30 40 50 60 70 80 90 100
pH
Hy
dra
tio
n
mo
les H
2O
mo
le o
f M
yo
sin
Beef Pork Rabbit
Model 2
Figure 18 Total hydration of myosin versus pH in the presence of added NaCl - Model 2
Contrary to expectations Model 2 predicts no change in the total hydration of
beef myosin in the presence of added salt This results from the fact that the
chloride ldquoscreenedrdquo cationic side groups are assumed to hold the same number of
water molecules per side group as the ldquounscreenedrdquo cationic groups in the
Steven Brandon 30 June 2004
30
absence of salt If this model has any validity it indicates that the observed changes in hydration in the presence of added salt are the consequence of
phenomena other than salt ion ndash charged side group interactions
Comparing the total number of charged groups present in the myosin molecule at
pI in the absence of added salt about pH 52 (see Table A6) to number of
charged groups at the pI of myosin in the presence of added salt (using Model 2) about pH 39 (see Table A10) reveals a substantial reduction in the total numbers
of charged groups at pI with added salt Table 8 below lists the total numbers of
charged groups at pI with and without added salt These numbers were obtained from Tables A6 and A10 for the no salt and added salt cases respectively (I
had to interpolate between data for pH 36 and pH 40 in Table A10 to obtain the
numbers of charged groups at pI = 387 for the added salt case)
Table 8 Inventory of Anionic amp Cationic Groups with and without added salt
No Added NaCl Added NaCl
pI pH 520 pH 387 Total Anionic Groups 725 265
Total Cationic Groups 725 265
The lower numbers of charged groups in the added salt case results from the effective screening of some of these groups by salt ions This overall reduction in
the number of charged groups in myosin reduces the repulsion between
neighboring myosin molecules allowing the proteins to draw more closely
together leaving less volume available for capillary entrapped water This is supported by Wilding et al (1986) who report that Rabbit longissimus dorsi
fibers were found to swell in hypertonic salt solutions such as 025 M KI or 06 M KCl to two to three times their original diameter Swelling occurs by a
combination of an increase in the myofilament lattice spacing and a loss of myofilament order However at pH below the isoelectric point of the myofibrillar proteins hypertonic salt solutions induce fiber shrinkage 38
Steven Brandon 30 June 2004
31
Appendix Table A1 Amino Acids39
Steven Brandon 30 June 2004
32
Table A2 Myosin Amino Acid Composition
Myosin aa aa aa Residuesmole aa Residue WtmoleResidues 10
5 g Symbol gmole Residues mole My Residue g mole My
Beef Pork Rabbit Beef Pork Rabbit
Aspartate D 11308
Aspartic acid 74 68 72 D 11408 333 306 325
Glutamate E 12711
Glutamic acid 97 100 103 E 12811 438 450 465
de-protonated Histidine H 13716
Histidine 14 15 15 H 13816 63 68 68
de-protonated Lysine K 12819
Lysine 107 105 85 K 12919 482 473 383
de-protonated Arginine R 15620
Arginine 42 46 41 R 15720 189 207 185
de-protonated Cysteine C 10215
Cysteine 0 0 9 C 10315 0 0 41
de-protonated Tyrosine Y 16212
Tyrosine 16 16 18 Y 16312 72 72 81
Asparagine 13 12 13 N 11410 59 54 57
Glutamine 49 50 52 Q 12814 219 225 233
Proline 26 20 22 P 9713 117 90 99
Serine 34 37 41 S 8709 153 167 185
Threonine 43 47 41 T 10112 194 212 185
Tryptophan 0 0 4 W 18623 0 0 18
Alanine 73 65 78 A 7109 329 293 351
Glycine 38 39 39 G 5707 171 176 176
Isoleucine 40 41 42 I 11318 180 185 189
Leucine 86 86 79 L 11318 387 387 356
Methionine 20 21 22 M 13121 90 95 99
Phenylalanine 27 28 27 F 14719 122 126 122
Valine 37 39 42 V 9915 167 176 189
(NH3) 106 120 86 170 477 540 387
Total residues (text) 836 837 845
Total residues (calc) 836 835 845 2318 2322 2322
Use 450000 kDa = 450000 gmole
Steven Brandon 30 June 2004
33
Table A3 Amino Acid Properties40
Abbrev Full Name Side chain
type Mass pI
pK1
(alpha -
COOH)
pK2
(alpha -+NH3)
pKr
(R) Remarks
A Ala Alanine hydrophobic 8909 611 235 987
C Cys Cysteine hydrophilic 12116 505 192 1070 837
Two cysteines can
form a disulfide
bond This enforces
tertiary structure
and such proteins as
insulin have disulfide
bonds
D Asp Aspartic acid acidic 13310 285 199 990 390
E Glu Glutamic acid acidic 14713 315 210 947 407
F Phe Phenylalanine hydrophobic 16519 549 220 931
G Gly Glycine hydrophilic 7507 606 235 978
Because of the two
hydrogen atoms at
the α carbon glycine
is not optically
active
H His Histidine basic 15516 760 180 933 604
I Ile Isoleucine hydrophobic 13117 605 232 976
K Lys Lysine basic 14619 960 216 906 1054
L Leu Leucine hydrophobic 13117 601 233 974
M Met Methionine hydrophobic 14921 574 213 928
Always the first
amino acid to be
incorporated into a
protein sometimes
removed after
translation
N Asn Asparagine hydrophilic 13212 541 214 872
P Pro Proline hydrophobic 11513 630 195 1064
Can disrupt protein
folding structures
like α helix or β
sheet
Q Gln Glutamine hydrophilic 14615 565 217 913
R Arg Arginine basic 17420 1076 182 899 1248
S Ser Serine hydrophilic 10509 568 219 921
T Thr Threonine hydrophilic 11912 560 209 910
V Val Valine hydrophobic 11715 600 239 974
W Trp Tryptophan hydrophobic 20423 589 246 941
Y Tyr Tyrosine hydrophilic 18119 564 220 921 1046
Steven Brandon 30 June 2004
34
Table A4 Fraction of Dissociated Amino Acid R-Groups by pH
Fraction of dissociated R-groups
[A-]([HA]+[A
-])
aa Dissociating Group pH pH pH pH pH pH pH pH pH pH pH pH pH pH pH pH pH
Class HA A- pKR 32 36 40 44 48 52 56 60 64 68 72 76 80 84 88 92 96
Asp-
A --COO- 390 017 033 056 076 089 095 098 099 100 100 100 100 100 100 100 100 100 Asp
-
Asp A --COOH 083 067 044 024 011 005 002 001 000 000 000 000 000 000 000 000 000 Asp
Glu-
A --COO- 407 012 025 046 068 084 093 097 099 100 100 100 100 100 100 100 100 100 Glu
-
Glu A --COOH 088 075 054 032 016 007 003 001 000 000 000 000 000 000 000 000 000 Glu
His B -N 604 000 000 001 002 005 013 027 048 070 085 094 097 099 100 100 100 100 His
His+
B -NH+ 100 100 099 098 095 087 073 052 030 015 006 003 001 000 000 000 000 His
+
Lys B -NH2 1079 000 000 000 000 000 000 000 000 000 000 000 000 000 000 001 003 006 Lys
Lys+
B -NH2H+ 100 100 100 100 100 100 100 100 100 100 100 100 100 100 099 097 094 Lys
+
Arg B -NH 1248 000 000 000 000 000 000 000 000 000 000 000 000 000 000 000 000 000 Arg
Arg+
B -NHH+ 100 100 100 100 100 100 100 100 100 100 100 100 100 100 100 100 100 Arg
+
Cys-
P --S- 835 000 000 000 000 000 000 000 000 001 003 007 015 031 053 074 088 095 Cys
-
Cys P --SH 100 100 100 100 100 100 100 100 099 097 093 085 069 047 026 012 005 Cys
Tyr-
NP --O- 1013 000 000 000 000 000 000 000 000 000 000 000 000 001 002 004 011 023 Tyr
-
Tyr NP --OH 100 100 100 100 100 100 100 100 100 100 100 100 099 098 096 089 077 Tyr
Steven Brandon 30 June 2004
35
Table A5 Beef Myosin Amino Acid Composition by pH
Myosin
Amino Acid Residues mole of Myosin
Beef Pork
pH 32 pH 36 pH 40 pH 44 pH 48 pH 52 pH 56 pH 60 pH 64 pH 68 pH 72 pH 76 pH 80 pH 84 pH 88 pH 92 pH 96
Asp-
55 111 185 253 296 317 326 330 332 332 333 333 333 333 333 333 333
Asp 277 222 147 80 37 16 7 3 1 0 0 0 0 0 0 0 0
Glu-
52 111 201 298 369 408 425 433 436 437 438 438 438 438 438 438 438
Glu 386 327 237 140 69 30 13 5 2 1 0 0 0 0 0 0 0
His 0 0 1 1 3 8 17 30 44 54 59 61 62 63 63 63 63
His+
63 63 62 62 60 55 46 33 19 9 4 2 1 0 0 0 0
Lys 0 0 0 0 0 0 0 0 0 0 0 0 1 2 5 12 29
Lys+
481 481 481 481 481 481 481 481 481 481 481 481 481 480 477 469 452
Arg 0 0 0 0 0 0 0 0 0 0 0 0 0 0 0 0 0
Arg+
189 189 189 189 189 189 189 189 189 189 189 189 189 189 189 189 189
Cys-
0 0 0 0 0 0 0 0 0 0 0 0 0 0 0 0 0
Cys 0 0 0 0 0 0 0 0 0 0 0 0 0 0 0 0 0
Tyr-
0 0 0 0 0 0 0 0 0 0 0 0 1 1 3 8 16
Tyr 72 72 72 72 72 72 72 72 72 72 72 72 71 71 69 64 56
Asn 59 59 59 59 59 59 59 59 59 59 59 59 59 59 59 59 59
Gln 219 219 219 219 219 219 219 219 219 219 219 219 219 219 219 219 219
Pro 117 117 117 117 117 117 117 117 117 117 117 117 117 117 117 117 117
Ser 153 153 153 153 153 153 153 153 153 153 153 153 153 153 153 153 153
Thr 194 194 194 194 194 194 194 194 194 194 194 194 194 194 194 194 194
Trp 0 0 0 0 0 0 0 0 0 0 0 0 0 0 0 0 0
Ala 329 329 329 329 329 329 329 329 329 329 329 329 329 329 329 329 329
Gly 171 171 171 171 171 171 171 171 171 171 171 171 171 171 171 171 171
Ile 180 180 180 180 180 180 180 180 180 180 180 180 180 180 180 180 180
Leu 387 387 387 387 387 387 387 387 387 387 387 387 387 387 387 387 387
Met 90 90 90 90 90 90 90 90 90 90 90 90 90 90 90 90 90
Phe 122 122 122 122 122 122 122 122 122 122 122 122 122 122 122 122 122
Val 167 167 167 167 167 167 167 167 167 167 167 167 167 167 167 167 167
(NH3) 477 477 477 477 477 477 477 477 477 477 477 477 477 477 477 477 477
Total residues (calc) 3762 3762 3762 3762 3762 3762 3762 3762 3762 3762 3762 3762 3762 3762 3762 3762 3762
Steven Brandon 30 June 2004
36
Table A6 Charge Inventory of Beef Myosin by pH
Myosin
Residue Charge Charge Inventory
Beef Pork
pH 32 pH 36 pH 40 pH 44 pH 48 pH 52 pH 56 pH 60 pH 64 pH 68 pH 72 pH 76 pH 80 pH 84 pH 88 pH 92 pH 96
-1 Asp-
-55 -111 -185 -253 -296 -317 -326 -330 -332 -332 -333 -333 -333 -333 -333 -333 -333
0 Asp 0 0 0 0 0 0 0 0 0 0 0 0 0 0 0 0 0
-1 Glu-
-52 -111 -201 -298 -369 -408 -425 -433 -436 -437 -438 -438 -438 -438 -438 -438 -438
0 Glu 0 0 0 0 0 0 0 0 0 0 0 0 0 0 0 0 0
0 His 0 0 0 0 0 0 0 0 0 0 0 0 0 0 0 0 0
1 His+
63 63 62 62 60 55 46 33 19 9 4 2 1 0 0 0 0
0 Lys 0 0 0 0 0 0 0 0 0 0 0 0 0 0 0 0 0
1 Lys+
481 481 481 481 481 481 481 481 481 481 481 481 481 480 477 469 452
0 Arg 0 0 0 0 0 0 0 0 0 0 0 0 0 0 0 0 0
1 Arg+
189 189 189 189 189 189 189 189 189 189 189 189 189 189 189 189 189
-1 Cys-
0 0 0 0 0 0 0 0 0 0 0 0 0 0 0 0 0
0 Cys 0 0 0 0 0 0 0 0 0 0 0 0 0 0 0 0 0
-1 Tyr-
0 0 0 0 0 0 0 0 0 0 0 0 -1 -1 -3 -8 -16
0 Tyr 0 0 0 0 0 0 0 0 0 0 0 0 0 0 0 0 0
0 Asn 0 0 0 0 0 0 0 0 0 0 0 0 0 0 0 0 0
0 Gln 0 0 0 0 0 0 0 0 0 0 0 0 0 0 0 0 0
0 Pro 0 0 0 0 0 0 0 0 0 0 0 0 0 0 0 0 0
0 Ser 0 0 0 0 0 0 0 0 0 0 0 0 0 0 0 0 0
0 The 0 0 0 0 0 0 0 0 0 0 0 0 0 0 0 0 0
0 Trp 0 0 0 0 0 0 0 0 0 0 0 0 0 0 0 0 0
0 Ala 0 0 0 0 0 0 0 0 0 0 0 0 0 0 0 0 0
0 Gly 0 0 0 0 0 0 0 0 0 0 0 0 0 0 0 0 0
0 Ile 0 0 0 0 0 0 0 0 0 0 0 0 0 0 0 0 0
0 Leu 0 0 0 0 0 0 0 0 0 0 0 0 0 0 0 0 0
0 Met 0 0 0 0 0 0 0 0 0 0 0 0 0 0 0 0 0
0 Phe 0 0 0 0 0 0 0 0 0 0 0 0 0 0 0 0 0
0 Val 0 0 0 0 0 0 0 0 0 0 0 0 0 0 0 0 0
0 (NH3) 0 0 0 0 0 0 0 0 0 0 0 0 0 0 0 0 0
TOTAL 626 511 346 181 65 1 -35 -60 -78 -90 -96 -99 -101 -103 -108 -120 -146
Steven Brandon 30 June 2004
37
Table A7 Beef Myosin Hydration by pH
Source Myosin
Hydration moles of H2O mole of Myosin
moles H2OMole of Residue Beef Pork
pH 32 pH 36 pH 40 pH 44 pH 48 pH 52 pH 56 pH 60 pH 64 pH 68 pH 72 pH 76 pH 80 pH 84 pH 88 pH 92 pH 96
60 Kuntz Asp-
332 667 1113 1517 1773 1901 1958 1981 1990 1994 1996 1996 1996 1997 1997 1997 1997
20 Kuntz Asp 555 443 295 160 74 32 13 5 2 1 0 0 0 0 0 0 0
75 Kuntz Glu-
390 831 1510 2238 2769 3058 3191 3247 3270 3279 3283 3284 3285 3285 3285 3285 3285
20 Kuntz Glu 772 654 473 279 138 60 25 10 4 2 1 0 0 0 0 0 0
40 best guess His 0 1 2 6 14 32 67 120 175 215 236 245 249 251 252 252 252
40 Kuntz His+
252 251 250 246 238 220 185 132 77 37 16 7 3 1 0 0 0
45 Kuntz Lys 0 0 0 0 0 0 0 0 0 0 1 1 4 9 22 54 131
45 Kuntz Lys+
2167 2167 2167 2167 2167 2167 2167 2167 2167 2167 2166 2165 2163 2158 2145 2112 2035
30 Kuntz Arg 0 0 0 0 0 0 0 0 0 0 0 0 0 0 0 0 1
30 Kuntz Arg+
567 567 567 567 567 567 567 567 567 567 567 567 567 567 567 567 566
20 best guess Cys-
0 0 0 0 0 0 0 0 0 0 0 0 0 0 0 0 0
10 Kuntz Cys 0 0 0 0 0 0 0 0 0 0 0 0 0 0 0 0 0
75 Kuntz Tyr-
0 0 0 0 0 0 0 0 0 0 1 2 4 10 24 57 123
30 Kuntz Tyr 216 216 216 216 216 216 216 216 216 216 216 215 214 212 206 193 167
20 Kuntz Asn 117 117 117 117 117 117 117 117 117 117 117 117 117 117 117 117 117
20 Kuntz Gln 438 438 438 438 438 438 438 438 438 438 438 438 438 438 438 438 438
30 Kuntz Pro 351 351 351 351 351 351 351 351 351 351 351 351 351 351 351 351 351
20 Kuntz Ser 306 306 306 306 306 306 306 306 306 306 306 306 306 306 306 306 306
20 Kuntz The 387 387 387 387 387 387 387 387 387 387 387 387 387 387 387 387 387
20 Kuntz Trp 0 0 0 0 0 0 0 0 0 0 0 0 0 0 0 0 0
15 Kuntz Ala 493 493 493 493 493 493 493 493 493 493 493 493 493 493 493 493 493
10 Kuntz Gly 171 171 171 171 171 171 171 171 171 171 171 171 171 171 171 171 171
10 Kuntz Ile 180 180 180 180 180 180 180 180 180 180 180 180 180 180 180 180 180
10 Kuntz Leu 387 387 387 387 387 387 387 387 387 387 387 387 387 387 387 387 387
10 Kuntz Met 90 90 90 90 90 90 90 90 90 90 90 90 90 90 90 90 90
00 Kuntz Phe 0 0 0 0 0 0 0 0 0 0 0 0 0 0 0 0 0
10 Kuntz Val 167 167 167 167 167 167 167 167 167 167 167 167 167 167 167 167 167
(NH3) 0 0 0 0 0 0 0 0 0 0 0 0 0 0 0 0 0
TOTAL 8338 8884 9679 10483 11043 11340 11475 11532 11555 11564 11568 11570 11572 11576 11585 11604 11644
Steven Brandon 30 June 2004
38
Table A8 Charge Inventory of Beef Myosin by pH with 400 moles of NaCl mole of myosin ndash Model 1 Myosin
Residue Charge Charge Inventory
Beef Pork
pH 32 pH 36 pH 40 pH 44 pH 48 pH 52 pH 56 pH 60 pH 64 pH 68 pH 72 pH 76 pH 80 pH 84 pH 88 pH 92 pH 96
0 Na Asp 0 0 0 0 0 0 0 0 0 0 0 0 0 0 0 0 0
-1 Asp-
0 0 0 -69 -118 -142 -153 -157 -159 -160 -160 -160 -160 -160 -161 -162 -164
0 Asp 0 0 0 0 0 0 0 0 0 0 0 0 0 0 0 0 0
0 Na Glu 0 0 0 0 0 0 0 0 0 0 0 0 0 0 0 0 0
-1 Glu-
0 0 0 -82 -147 -183 -199 -206 -209 -210 -210 -211 -211 -211 -212 -213 -215
0 Glu 0 0 0 0 0 0 0 0 0 0 0 0 0 0 0 0 0
0 His Cl 0 0 0 0 0 0 0 0 0 0 0 0 0 0 0 0 0
0 His 0 0 0 0 0 0 0 0 0 0 0 0 0 0 0 0 0
1 His+
29 29 28 28 27 25 20 14 8 4 2 1 0 0 0 0 0
0 Lys Cl 0 0 0 0 0 0 0 0 0 0 0 0 0 0 0 0 0
0 Lys 0 0 0 0 0 0 0 0 0 0 0 0 0 0 0 0 0
1 Lys+
219 219 219 218 218 216 213 208 202 198 196 195 194 193 190 184 170
0 Arg Cl 0 0 0 0 0 0 0 0 0 0 0 0 0 0 0 0 0
0 Arg 0 0 0 0 0 0 0 0 0 0 0 0 0 0 0 0 0
1 Arg+
86 86 86 86 85 85 84 82 79 78 77 76 76 76 75 74 71
0 Na Cys 0 0 0 0 0 0 0 0 0 0 0 0 0 0 0 0 0
-1 Cys-
0 0 0 0 0 0 0 0 0 0 0 0 0 0 0 0 0
0 Cys 0 0 0 0 0 0 0 0 0 0 0 0 0 0 0 0 0
0 Na Tyr 0 0 0 0 0 0 0 0 0 0 0 0 0 0 0 0 0
-1 Tyr-
0 0 0 0 0 0 0 0 0 0 0 0 0 -1 -2 -4 -8
0 Tyr 0 0 0 0 0 0 0 0 0 0 0 0 0 0 0 0 0
0 Asn 0 0 0 0 0 0 0 0 0 0 0 0 0 0 0 0 0
0 Gln 0 0 0 0 0 0 0 0 0 0 0 0 0 0 0 0 0
0 Pro 0 0 0 0 0 0 0 0 0 0 0 0 0 0 0 0 0
0 Ser 0 0 0 0 0 0 0 0 0 0 0 0 0 0 0 0 0
0 Thr 0 0 0 0 0 0 0 0 0 0 0 0 0 0 0 0 0
0 Trp 0 0 0 0 0 0 0 0 0 0 0 0 0 0 0 0 0
0 Ala 0 0 0 0 0 0 0 0 0 0 0 0 0 0 0 0 0
0 Gly 0 0 0 0 0 0 0 0 0 0 0 0 0 0 0 0 0
0 Ile 0 0 0 0 0 0 0 0 0 0 0 0 0 0 0 0 0
0 Leu 0 0 0 0 0 0 0 0 0 0 0 0 0 0 0 0 0
0 Met 0 0 0 0 0 0 0 0 0 0 0 0 0 0 0 0 0
0 Phe 0 0 0 0 0 0 0 0 0 0 0 0 0 0 0 0 0
0 Val 0 0 0 0 0 0 0 0 0 0 0 0 0 0 0 0 0
0 (NH3) 0 0 0 0 0 0 0 0 0 0 0 0 0 0 0 0 0
TOTAL 333 333 333 181 65 1 -35 -60 -78 -90 -96 -99 -101 -103 -108 -120 -146
Steven Brandon 30 June 2004
39
Table A9 Beef Myosin Hydration by pH with 400 moles of NaCl mole of myosin ndash Model 1
Myosin
Hydration moles of H2O mole of Myosin
moles H2OMole of Residue Beef Pork
pH 32 pH 36 pH 40 pH 44 pH 48 pH 52 pH 56 pH 60 pH 64 pH 68 pH 72 pH 76 pH 80 pH 84 pH 88 pH 92 pH 96
2 best guess Na Asp 111 222 371 367 356 350 347 346 346 345 345 345 345 345 344 342 338
6 Kuntz Asp-
0 0 0 416 706 852 916 943 953 958 959 960 961 962 965 971 982
2 Kuntz Asp 555 443 295 160 74 32 13 5 2 1 0 0 0 0 0 0 0
2 best guess Na Glu 104 222 403 433 444 450 453 454 454 454 455 454 454 454 453 450 445
75 Kuntz Glu-
0 0 0 614 1103 1370 1493 1545 1566 1575 1578 1580 1581 1583 1587 1597 1616
2 Kuntz Glu 772 654 473 279 138 60 25 10 4 2 1 0 0 0 0 0 0
4 best guess His Cl 137 137 136 135 131 121 103 75 44 22 10 4 2 1 0 0 0
4 best guess His 0 1 2 6 14 32 67 120 175 215 236 245 249 251 252 252 252
4 Kuntz His+
114 114 113 112 108 99 82 57 32 15 7 3 1 0 0 0 0
45 best guess Lys Cl 1182 1182 1183 1184 1187 1195 1209 1232 1257 1275 1285 1289 1291 1291 1289 1283 1270
45 Kuntz Lys 0 0 0 0 0 0 0 0 0 0 1 1 4 9 22 54 131
45 Kuntz Lys+
985 985 984 983 980 972 957 935 910 892 881 876 873 867 856 829 765
3 best guess Arg Cl 309 309 309 310 311 313 316 322 329 334 336 338 338 339 341 344 353
3 Kuntz Arg 0 0 0 0 0 0 0 0 0 0 0 0 0 0 0 0 1
3 Kuntz Arg+
258 258 258 257 256 254 251 245 238 233 231 229 229 228 226 222 213
1 best guess Na Cys 0 0 0 0 0 0 0 0 0 0 0 0 0 0 0 0 0
2 best guess Cys-
0 0 0 0 0 0 0 0 0 0 0 0 0 0 0 0 0
1 Kuntz Cys 0 0 0 0 0 0 0 0 0 0 0 0 0 0 0 0 0
3 Kuntz Na Tyr 0 0 0 0 0 0 0 0 0 0 0 0 1 2 5 12 25
75 Kuntz Tyr-
0 0 0 0 0 0 0 0 0 0 0 1 2 5 12 28 61
3 Kuntz Tyr 216 216 216 216 216 216 216 216 216 216 216 215 214 212 206 193 167
2 Kuntz Asn 117 117 117 117 117 117 117 117 117 117 117 117 117 117 117 117 117
2 Kuntz Gln 438 438 438 438 438 438 438 438 438 438 438 438 438 438 438 438 438
3 Kuntz Pro 351 351 351 351 351 351 351 351 351 351 351 351 351 351 351 351 351
2 Kuntz Ser 306 306 306 306 306 306 306 306 306 306 306 306 306 306 306 306 306
2 Kuntz Thr 387 387 387 387 387 387 387 387 387 387 387 387 387 387 387 387 387
2 Kuntz Trp 0 0 0 0 0 0 0 0 0 0 0 0 0 0 0 0 0
15 Kuntz Ala 493 493 493 493 493 493 493 493 493 493 493 493 493 493 493 493 493
1 Kuntz Gly 171 171 171 171 171 171 171 171 171 171 171 171 171 171 171 171 171
1 Kuntz Ile 180 180 180 180 180 180 180 180 180 180 180 180 180 180 180 180 180
1 Kuntz Leu 387 387 387 387 387 387 387 387 387 387 387 387 387 387 387 387 387
1 Kuntz Met 90 90 90 90 90 90 90 90 90 90 90 90 90 90 90 90 90
0 Kuntz Phe 0 0 0 0 0 0 0 0 0 0 0 0 0 0 0 0 0
1 Kuntz Val 167 167 167 167 167 167 167 167 167 167 167 167 167 167 167 167 167
(NH3) 0 0 0 0 0 0 0 0 0 0 0 0 0 0 0 0 0
TOTAL 7830 7830 7830 8558 9110 9403 9535 9591 9614 9623 9627 9629 9631 9635 9644 9665 9706
Steven Brandon 30 June 2004
40
Table A10 Charge Inventory of Beef Myosin by pH with 400 moles of NaCl mole of myosin ndash Model 2
Myosin
Residue Charge Charge Inventory
Beef Pork
pH 32 pH 36 pH 40 pH 44 pH 48 pH 52 pH 56 pH 60 pH 64 pH 68 pH 72 pH 76 pH 80 pH 84 pH 88 pH 92 pH 96
-1 Asp-
-55 -111 -185 -253 -296 -317 -326 -330 -332 -332 -333 -333 -333 -333 -333 -333 -333
0 Asp 0 0 0 0 0 0 0 0 0 0 0 0 0 0 0 0 0
-1 Glu-
-52 -111 -201 -298 -369 -408 -425 -433 -436 -437 -438 -438 -438 -438 -438 -438 -438
0 Glu 0 0 0 0 0 0 0 0 0 0 0 0 0 0 0 0 0
0 His Cl 0 0 0 0 0 0 0 0 0 0 0 0 0 0 0 0 0
0 His 0 0 0 0 0 0 0 0 0 0 0 0 0 0 0 0 0
1 His+
29 29 28 28 27 25 20 14 8 4 2 1 0 0 0 0 0
0 Lys Cl 0 0 0 0 0 0 0 0 0 0 0 0 0 0 0 0 0
0 Lys 0 0 0 0 0 0 0 0 0 0 0 0 0 0 0 0 0
1 Lys+
219 219 219 218 218 216 213 208 202 198 196 195 194 193 190 184 170
0 Arg Cl 0 0 0 0 0 0 0 0 0 0 0 0 0 0 0 0 0
0 Arg 0 0 0 0 0 0 0 0 0 0 0 0 0 0 0 0 0
1 Arg+
86 86 86 86 85 85 84 82 79 78 77 76 76 76 75 74 71
-1 Cys-
0 0 0 0 0 0 0 0 0 0 0 0 0 0 0 0 0
0 Cys 0 0 0 0 0 0 0 0 0 0 0 0 0 0 0 0 0
-1 Tyr-
0 0 0 0 0 0 0 0 0 0 0 0 -1 -1 -3 -8 -16
0 Tyr 0 0 0 0 0 0 0 0 0 0 0 0 0 0 0 0 0
0 Asn 0 0 0 0 0 0 0 0 0 0 0 0 0 0 0 0 0
0 Gln 0 0 0 0 0 0 0 0 0 0 0 0 0 0 0 0 0
0 Pro 0 0 0 0 0 0 0 0 0 0 0 0 0 0 0 0 0
0 Ser 0 0 0 0 0 0 0 0 0 0 0 0 0 0 0 0 0
0 Thr 0 0 0 0 0 0 0 0 0 0 0 0 0 0 0 0 0
0 Trp 0 0 0 0 0 0 0 0 0 0 0 0 0 0 0 0 0
0 Ala 0 0 0 0 0 0 0 0 0 0 0 0 0 0 0 0 0
0 Gly 0 0 0 0 0 0 0 0 0 0 0 0 0 0 0 0 0
0 Ile 0 0 0 0 0 0 0 0 0 0 0 0 0 0 0 0 0
0 Leu 0 0 0 0 0 0 0 0 0 0 0 0 0 0 0 0 0
0 Met 0 0 0 0 0 0 0 0 0 0 0 0 0 0 0 0 0
0 Phe 0 0 0 0 0 0 0 0 0 0 0 0 0 0 0 0 0
0 Val 0 0 0 0 0 0 0 0 0 0 0 0 0 0 0 0 0
0 (NH3) 0 0 0 0 0 0 0 0 0 0 0 0 0 0 0 0 0
TOTAL 226 111 -54 -219 -335 -399 -435 -460 -478 -490 -496 -499 -501 -503 -508 -520 -546
Steven Brandon 30 June 2004
41
Table A11 Beef Myosin Hydration by pH with 400 moles of NaCl mole of myosin ndash Model 2
Myosin
Hydration moles of H2O mole of Myosin
moles H2OMole of Residue Beef Pork
pH 32 pH 36 pH 40 pH 44 pH 48 pH 52 pH 56 pH 60 pH 64 pH 68 pH 72 pH 76 pH 80 pH 84 pH 88 pH 92 pH 96
6 Kuntz Asp-
332 667 1113 1517 1773 1901 1958 1981 1990 1994 1996 1996 1996 1997 1997 1997 1997
2 Kuntz Asp 555 443 295 160 74 32 13 5 2 1 0 0 0 0 0 0 0
75 Kuntz Glu-
390 831 1510 2238 2769 3058 3191 3247 3270 3279 3283 3284 3285 3285 3285 3285 3285
2 Kuntz Glu 772 654 473 279 138 60 25 10 4 2 1 0 0 0 0 0 0
4 best guess His Cl 137 137 136 135 131 121 103 75 44 22 10 4 2 1 0 0 0
4 best guess His 0 1 2 6 14 32 67 120 175 215 236 245 249 251 252 252 252
4 Kuntz His+
114 114 113 112 108 99 82 57 32 15 7 3 1 0 0 0 0
45 best guess Lys Cl 1182 1182 1183 1184 1187 1195 1209 1232 1257 1275 1285 1289 1291 1291 1289 1283 1270
45 Kuntz Lys 0 0 0 0 0 0 0 0 0 0 1 1 4 9 22 54 131
45 Kuntz Lys+
985 985 984 983 980 972 957 935 910 892 881 876 873 867 856 829 765
3 best guess Arg Cl 309 309 309 310 311 313 316 322 329 334 336 338 338 339 341 344 353
3 Kuntz Arg 0 0 0 0 0 0 0 0 0 0 0 0 0 0 0 0 1
3 Kuntz Arg+
258 258 258 257 256 254 251 245 238 233 231 229 229 228 226 222 213
2 best guess Cys-
0 0 0 0 0 0 0 0 0 0 0 0 0 0 0 0 0
1 Kuntz Cys 0 0 0 0 0 0 0 0 0 0 0 0 0 0 0 0 0
75 Kuntz Tyr-
0 0 0 0 0 0 0 0 0 0 1 2 4 10 24 57 123
3 Kuntz Tyr 216 216 216 216 216 216 216 216 216 216 216 215 214 212 206 193 167
2 Kuntz Asn 117 117 117 117 117 117 117 117 117 117 117 117 117 117 117 117 117
2 Kuntz Gln 438 438 438 438 438 438 438 438 438 438 438 438 438 438 438 438 438
3 Kuntz Pro 351 351 351 351 351 351 351 351 351 351 351 351 351 351 351 351 351
2 Kuntz Ser 306 306 306 306 306 306 306 306 306 306 306 306 306 306 306 306 306
2 Kuntz Thr 387 387 387 387 387 387 387 387 387 387 387 387 387 387 387 387 387
2 Kuntz Trp 0 0 0 0 0 0 0 0 0 0 0 0 0 0 0 0 0
15 Kuntz Ala 493 493 493 493 493 493 493 493 493 493 493 493 493 493 493 493 493
1 Kuntz Gly 171 171 171 171 171 171 171 171 171 171 171 171 171 171 171 171 171
1 Kuntz Ile 180 180 180 180 180 180 180 180 180 180 180 180 180 180 180 180 180
1 Kuntz Leu 387 387 387 387 387 387 387 387 387 387 387 387 387 387 387 387 387
1 Kuntz Met 90 90 90 90 90 90 90 90 90 90 90 90 90 90 90 90 90
0 Kuntz Phe 0 0 0 0 0 0 0 0 0 0 0 0 0 0 0 0 0
1 Kuntz Val 167 167 167 167 167 167 167 167 167 167 167 167 167 167 167 167 167
(NH3) 0 0 0 0 0 0 0 0 0 0 0 0 0 0 0 0 0
TOTAL 8338 8884 9679 10483 11043 11340 11475 11532 11555 11564 11568 11570 11572 11576 11585 11604 11644
Steven Brandon 30 June 2004
42
Table A12 References sited by Puolanne Ruusunen and Vainionpaumlauml (2001)
Hamm R 1962 Uumlber das Wasserbindungsvermoumlgen des Saumlugetiersmuskels XII part Uumlber
das Unterschiedliche nicht auf pH-Differenzen beruhende Wasserbindungsvermoumlgen des Rindermuskels Z Lebensmittel-Untersuch und Forsch 117 p 415
Hamm R 1972 Kolloidchemie des Fleisches Paul Parey Co Berlin
Ishioroshi M Samejima K and Yasui T 1979 Heat induced gelation of myosin factors
of pH and salt concentrations Journal of Food Science 44 pp 741ndash744
Kivikari R (1996) Buffering capacity of meat Thesis University of Helsinki EKT -series 1048
Offer G and Knight P 1983 The structural basis of water-holding in meat Part 1
General principles and water uptake in meat processing In Lawrie RA Editor 1983 Developments in meat science Elsevier Applied Science London
Puolanne E and Ruusunen M 1983 Einfluss des Salzzusatzes auf das
Wasserbindungsvermoumlgen der verschiedener Fleischsortimente in Bruumlhwurst Fleischwirtschaft 62 pp 238ndash239
Warriss PD 1982 The relationship between pH45 and drip in pig muscle Journal of Food
Technology 17 pp 573ndash578
Steven Brandon 30 June 2004
43
References
1 Food The Chemistry of Its Components 2nd ed T P Coultate The Royal Society of
Chemistry London 1989 p 106 2 httpwwwaw-bccommathewsch02frameshtm 3 httpwwwaw-bccommathewsch02frameshtm 4 httpwwwneurowustleduneuromuscularmothermyosinhtm 5 httpwwwmrc-lmbcamacukmyosintreesmclasseshtml 6 Private Communication Dr J C Acton Clemson University June 3 2004 7 httpwwwaw-bccommathewsch02frameshtm 8 CHEMISTRY OF MEAT PROCESSING Animal Sciences 550 Lynn Knipe Associate
Professor Animal Sciences Food Science amp Technology The Ohio State University
September 29 2000 9 Pre-rigor injection using glycolytic inhibitors in low-quality beef muscles N C Jerez C R
Calkins and J Velazco J Anim Sci 2003 81 pp 997-1003 10 CHEMISTRY OF MEAT PROCESSING Animal Sciences 550 Lynn Knipe Associate
Professor Animal Sciences Food Science amp Technology The Ohio State University
September 29 2000 11 MAKING MEAT FROM MUSCLES httpwwwcluesabdnacuk8080mirrorsgrowthch90html 12 httpwwwsunysbedubiochemcourseslectures929bmo520html 13 Biochemistry Christopher K Mathews KE van Holde 2nd ed Menlo Park CA Benjamin
Cummings Pub Co Inc 1996 p 52 14 Biochemistry Christopher K Mathews KE van Holde 2nd ed Menlo Park CA Benjamin
Cummings Pub Co Inc 1996 p 52
Introduction to Protein Chemistry S Fox J S Foster Wiley 1957 p242 httpwwwmcukyedubiochemistryCoursesbch612powerpoint2001lecture3Lecture3_filesframehtm
16 The Science of Meat and Meat Products J F Price B S Schweigert 2nd ed Food amp
Nutrition Press Inc Westport Connecticut 1978 p106 17 Private Communication Dr J C Acton Clemson University May 31 2004 18 httpwwwmcukyedubiochemistryCoursesbch612powerpoint2001lecture3Lecture3_filesframehtm 19 The effect of net charge on the solubility activity and stability of ribonuclease Sa Kevin
L Shaw Gerald R Grimsley Gennady I Yakovlev Alexander A Makarov and C Nick Pace Protein Science (2001) 10 pp 1206-1215
20 Proteins Masterpieces of Polymer Chemistry Robert A Copeland Todayrsquos Chemist at
Work June 1992 pp 33-37 21 Food Chemistry 3rd ed Owen R Fennema Marcel-Dekker Inc New York 1996 p367 22 Water Relations of Foods R B Duckworth Academic Press New York 1975 pp 104 -
105 23 Hydration of Macromolecules III Hydration of Polypeptides ID Kuntz Journal of the
American Chemical Society Vol 93 No 2 January 27 1971 pp 514-516 24 Isoelectric Precipitation httpwwwrpiedudeptchem-engBiotech-EnvironPRECIPprecpphhtml 25 ATOMIC and IONIC RADIUS httpwwwchemguidecoukatomspropertiesatradiushtml 26 A Field Guide and Introduction to the Geology and Chemistry of Rocks and Minerals
Charles A Sorrell Golden Press Western Publishing Co Inc Racine WI 1973 p 23 27 httpwwwwouedulasphyscich412hydrolysishtm 28 httpvischemcadrecomauhtmlcdatomshtml 29 httpwwwmcukyedubiochemistryCoursesbch612powerpoint2001lecture3Lecture3_filesframehtm 30 Proteins Amino Acids and Peptides as Ions and Dipolar Ions EJ Cohn JT Edsall
Rheinhold New York NY 1942 httpwwwmcukyedubiochemistryCoursesbch612powerpoint2001lecture3Lecture3_filesframehtm
31 Biochemistry 601 Protein Solubility Purification and Analysis Last modified 82399 Dr Landry Tulane University landrymailhosttcstulaneedu httpwwwtulaneedu~biochemmedpurehtm
32 TECHNICAL BULLETIN - COOKED CURED HAM httpwwwsoloseasaltcomTechnicalTech5htm
Steven Brandon 30 June 2004
44
33 On the mechanism of water holding in meat The swelling and shrinking of myofibrils
Gerald Offer and John Trinick Meat Science Volume 8 Issue 4 1983 pp 245-281 34 Solubility of salmon myosin as affected by conformational changes at various ionic
strengths and pH Tein M Lin Jae W Park Journal of Food Science March-April 1998 v63 i2 p 215
35 Combined effects of NaCl and raw meat pH on water-holding in cooked sausage with
and without added phosphate Eero J Puolanne Marita H Ruusunen and Jukka I Vainionpaumlauml Meat Science Volume 58 Issue 1 May 2001 pp 1-7
36 Salt Effects on Ionization Equilibria of Histidines in Myoglobin Yung-Hsiang Kao Carolyn A Fitch Shibani Bhattacharya Christopher J Sarkisian Juliette T J Lecomte and
Bertrand Garciacutea-Moreno E Biophys J September 2000 Vol 79 No 3 pp 1637-1654 37 MEAT EMULSIONS C Lynn Knipe Meat Export Research Center Iowa State University
httpwwwagohio-stateedu~meatsciarchiveMEATEMULSIONShtm 38 Salt-induced swelling of meat The effect of storage time pH ion-type and
concentration Peter Wilding Nicholas Hedges and Peter J Lillford Meat Science Volume
18 Issue 1 1986 pp 55-75 39 httpenwikipediaorgwikiAmino_acidStructures 40 httpenwikipediaorgwikiAmino_acidChemical_properties

Steven Brandon 30 June 2004
5
Water binding capacity is modified by pH and drops from a high around pH 10 to a low at the isoelectric point of meat proteins between pH 50 and 51 At its
isoelectric point a protein bears no net charge and its solubility is minimal Below
pH 5 a value only attained if the pH of a processed meat product is deliberately lowered water binding capacity starts to increase again Water absorption
follows water binding capacity in this regard Thus as the pH of pork declines
post mortem its water binding capacity decreases and much of the water associated with muscle proteins is free to leave the muscle fiber
Towards their isoelectric point thick and thin filaments in myofibrils move closer together and reduce the water space between them Thus as the pH declines
post mortem filaments move closer together myofibrils shrink and the volume
of sarcoplasm increases Eventually muscle fibers depleted all their ATP their
membranes no longer confine the cell water and fluid is lost from the muscle fiber and may contribute to exudate lost from the meat
Water escapes from the spaces between muscle fiber bundles when they are cut and the drip loss from PSE (pale soft exudative) pork is increased to about 170 from a normal value of about 077 of trimmed carcass weight In sliced
pork drip losses increase with storage from 9 after 1 day to 123 after 6 days This creates a serious weight loss from the carcass In the USA the
estimated incidence of PSE carcasses (18) and their typical extra shrink loss (5 to 6) causes a total national loss of about 95 million dollars Obviously this is
only a rough guess but it serves to emphasize the commercial importance of pH
in pork The excess weight loss from PSE pork during transport storage and
processing could exceed one million kilograms per annum in the USA
Protein Solubility Solubility of proteins depends on ionic strength and pH If the pH approaches the
pI of a given protein the net charge on that protein will go to zero and in the absence of electrostatic repulsion weak electrostatic attractive forces may lead
to aggregation and precipitation this tendency to interact can be promoted by
reducing the ionic strength12
By way of example Mathews amp van Holde give a good description of the behavior
of β-lactoglobulin solubility The effects of ionic strength of the medium on the interaction between charged macroions can be summarized as follows At very
low ionic strength the counterion atmosphere is highly expanded and diffuse
and screening is ineffective Like-charged particles repel strongly unlike charged
particles attract one another strongly As the ionic strength increases the counterion atmosphere shrinks and becomes concentrated about the macroion
Screening becomes effective 13
This is explained by the Debye-Huckel Theory Polyampholytes like proteins or polyelectrolytes like DNA are called macroions because they are large and
Steven Brandon 30 June 2004
6
because depending on the solution pH they may carry a substantial net charge As shown in Figure 4 below each macroion collects about it a counterion
atmosphere of oppositely charged mall ions These small ions such as Na+ and
Cl- are called counterions and they interact with macroions by charge-charge interactions The counterion atmosphere shields macroions from each other thus
diminishing their ability to interact on the basis of charge2
Figure 4 The influence of small ions on macroion interactions2
The thickness of the counterion atmosphere depends on the concentration of
counterions present in the solution The greater the concentration of counterions the thicker the counterion atmosphere and the more effective is the electrostatic
screening between individual macroions The amount of counterions in solution
is measured as the ionic strength I
2
12
1ii
i
n
ZMI
where i represents each of the n different counterions in the solution Mi is the
molarity of each counterion ldquoirdquo and Zi is the charge of each counterion ldquoirdquo
The Debye-Huckel Theory attempts to measure the radius across which
macroions can interact with each other
Steven Brandon 30 June 2004
7
21
I
Kr
where K is a constant and ldquorrdquo is the distance over which the two macroions can
affect each other As the ionic strength (concentration) increases the radius
with which macroions can influence each other decreases Another way to say
this is that as ldquorrdquo gets smaller macroions must be closer together before they can interact with each other due to the shielding or shell of the counterions2
The effects of charge and ionic strength on the solubility of polyampholytes such
as proteins can be explained in terms of these electrostatic interactions Consider
the behavior of the common milk protein β-lactoglobulin The isoelectric point of
this polyampholyte is about 53 Above or below this pH the molecules all have either negative or positive charges and repel one another so the protein is very soluble at either acidic or basic pH At the isoelectric point the net charge is zero but each molecule still carries surface patches of both positive charge and
negative charge The ionic interactions between them together with other kinds of intermolecular interactions such as van der Waals forces make the molecules
tend to clump together and precipitate Therefore solubility is minimal at the isoelectric point If the ionic strength is increased however the counterion
atmosphere shrinks about the charged regions and the attractive interactions between positive and negative groups are effectively screened Hence solubility
increases even at the isoelectric point This effect of putting proteins into
solution by increasing the salt concentration is called ldquosalting in 14
The behavior of β-lactoglobulin is illustrated by the Figure 5 below It is interesting to note that this plot indicates a shift in the pH of minimal solubility to
higher pH with decreasing NaCl concentration This behavior may be a consequence of the amino acid composition of β-lactoglobulin
Steven Brandon 30 June 2004
8
Figure 5 Solubility of β-Lactoglobulin vs pH at several NaCl concentrations15
It is interesting to note that according to the plot shown in Figure 5 above
increasing salt content appears to slightly reduce the pI of β-lactoglobulin but not to decrease the minimum solubility of the protein in water
Amino Acid Composition
The functionality of a protein is determined by the side chains of its component
amino acids Theoretically side chains determine the structure of proteins based upon hydrogen ionic and disulfide bonds as well as hydrophobic and
hydrophilic interactions between amino acids8 The amino acids are shown in
Table A1 in the Appendix The amino acid composition for beef pork and rabbit
myosin are presented by Price and Schweigert (see Table 1 below) 16
Steven Brandon 30 June 2004
9
Table 1 Myosin amino acid composition
This table lists the residues of each amino acid per 105 grams of myosin In
Price and Schweigertrsquos table (Table 1 above) the total number of amino acid residues in pork myosin is listed as 837 residues The actual sum of amino acid
residues listed in this table for pork myosin is 835 residues
As stated previously I assumed a molecular weight of 450 kDa for myosin6
With this molecular weight I determined the number of residues of each amino
acid per mole of myosin as shown in Table A2 in the Appendix
Steven Brandon 30 June 2004
10
In Price and Schweigertrsquos table asparagine and glutamine quantities are combined with the listed aspartic acid and glutamic acid quantities respectively
I assumed that asparagine accounts for 13 of the aspartic acid reported and that
glutamine accounts for 15 of the glutamic acid reported17
Henderson-Hasselbalch Equation Some amino acid residues in proteins (aspartic acid glutamic acid cysteine
tyrosine histidine lysine and arginine see Table 2) have dissociable R-groups
Table 2 Ionized Forms of Amino Acids18
It should be noted that the actual pKs of amino acid groups in proteins may differ somewhat from those measured for the side groups of free amino acids
In general acidic proteins have their pIs overestimated and basic proteins have
their pIs underestimated when calculated using pKs from model compound
studies This is expected For Asp side chains a pK = 41 is observed with
uncharged model compounds but a pK = 34 is the average value observed in proteins This results mainly because proteins have a net positive charge in the
region where Asp and Glu carboxyls titrate and this will tend to lower their pKs
relative to those measured in uncharged model The converse will be true for
Steven Brandon 30 June 2004
11
basic proteins where the proteins will have a net negative charge above the pI
that will tend to raise the pKs of the ionizable groups In addition to net charge
other environmental effects can change pKs Thus it is always best to measure
rather than estimate the pI of a protein unless the measured pKs of the ionizable
groups are available19
The Henderson-Hasselbalch equation describes the proportion of dissociated
groups as a function of pH With the Henderson-Hasselbalch equation
HA
A
apKpH
log
where [HA] is the concentration of the undissociated weak acid and [A-] is the
concentration of the conjugate base of [HA]2 one can calculate the ratio of
dissociated groups to undissociated groups [A-][HA] at different pHs with the
pKa of each amino acid R-group which are listed in Table A3 in the Appendix
With the Henderson-Hasselbalch equation I used Excel to calculate the
proportion of each amino acid residue with dissociable groups at 04-pH intervals from pH 32 to pH 96 This range exceeds the pH range of meat products (pH
52 to 60) but I was curious to see how the amino acid proportions varied over a wider pH range For my analysis I used pKa values for each amino acid R-group from a different source20 than that of Table A3 These values are
however very close to those reported in the Table A3
Since all but one the α-carboxyl group and all but one α-amino group are
involved in peptide bonds between amino acid residues forming the myosin protein molecule there can be very little contribution of these two terminal groups to the behavior of myosin which contains several thousand amino acid
residues For that reason I have chosen to exclude these two groups from my analysis Additionally the peptide bond groups forming the back bone of the protein polypeptide chain can attract some water by polar attraction but this
should be considerably less than that contributed by the side groups especially
those that are ionized So I have also not included the hydration due to the peptide groups in my calculations
The results of my calculations using the Henderson-Hasselbalch equation are
presented in Table A4 in the Appendix This table shows the fraction of
dissociated amino acid R-Groups as a function of pH Of particular interest in the pH range typical of meat products is the increasing proportion of anionic
aspartate and glutamate groups formed as the aspartic acid and glutamic acid R-
groups are deprotonated as the pH increases from around pH 4 (the approximate pKa of these two acidic R-groups where half the each type is deprotonated) to pH
6 (where about 99 of these acidic R-groups are deprotonated) Over the same
pH range the histidine R-groups are transition from about 99 cationic
Steven Brandon 30 June 2004
12
protonated groups at pH 4 to about 50 uncharged at pH 6 (near the pKa of histidine)
The calculated fractions of dissociated R-groups allowed me to determine the complete amino acid composition of beef pork and rabbit myosin The complete
amino acid composition for beef myosin is shown in Table A5 in the Appendix
Calculated Net Charge vs pH amp pI Armed with the complete amino acid composition of myosin at each pH it is possible to calculate the net charge of the myosin molecule To do this I
assumed a charge of -1 for de-protonated aspartic acid (aspartate) glutamic acid
(glutmate) cysteine and tyrosine groups and +1 for protonated histidine lysine and arginine groups The resulting charge inventory for beef myosin is given in
Table A6 in the Appendix The plot shown in Figure 6 below shows how the net
charge of beef pork and rabbit myosin vary with pH
Myosin Net Charge vs pH
-500
0
500
1000
30 40 50 60 70 80 90 100
pH
Ne
t C
ha
rge
of
My
os
in
Beef Pork Rabbit
Figure 6 Calculated Net Charge of Myosin versus pH
The pH at which the net charge is zero is the isoelectric point pI of the protein
From this analysis this occurs at different pH values for these myosin proteins
from three different animals as shown in Table 3 below
Table 3 Calculated Isoelectric Points of Beef Pork and Rabbit Myosin
Myosin Calculated pI
Beef pH 520
Steven Brandon 30 June 2004
13
Pork pH 555 Rabbit pH 463
The major cause of the lower pI for rabbit myosin appears to be the substantially
lower lysine content reported by Price and Schweigert compared that of beef and
pork myosin They report 85 lysine residues per 105 grams of rabbit myosin
compared to 107 and 105 lysine residues per 105 grams of beef and pork myosin
respectively
Calculated Hydration vs pH Water molecules bind to several groups in proteins These include charged groups (ion-dipole interactions) backbone peptide peptide groups the amide
groups of asparagines and glutamine hydroxyl groups of serine threoine and
tyrosine residues (all dipole-dipole interactions) and nonpolar residues (dipole-induced dipole interactions hydrophobic hydration)21 The following is extracted
from Duckworth 197522
Examination of proteins indicated that the amount of bound water is about 03 ndash
04 gg of protein The spread is values is reproducible and depends largely on
amino acid composition It can be represented by the approximate formula
NPC fffA 2040
where A is the amount of bound water in grams of water per gram of protein fC
is the fraction of charged side chains fP is the fraction of polar side chains and fN is the fraction of non-polar side chains This simple equation does make some
useful predictions [The equation is derived from measurements on
homopolypeptides (Kuntz 1971)]
The approximate range of protein hydration should be 02 ndash 10 g of water per gram of protein depending on the amino acid composition of the protein The
equation overestimates the amount of water slightly since all side chains are
counted but some (mostly non-polar ones) are ldquoburiedrdquo in the native protein This
leads us to predict that hydration will increase slightly upon denaturation and
decrease slightly on hydrophobic aggregation Lowering the pH below 4 should be strongly dehydrating since the number of carboxylate groups decreases sharply
Note that the equation counts carboxylate and cationic side chains equally This
errs in two ways First the carboxylate groups appear to be somewhat more
hydrated than lysine or arginine Second neutralization of the nitrogen charge at
high pH does not cause dehydration Thus the equation will make a moderate
under estimate (10-15) above pH 10 or if the basicacidic side chain ratio is much different from 1 Protein-protein interactions that are strongly ionic in
nature would be expected to cause marked dehydration on aggregation The
general philosophy behind this equation works reasonably well when extended to
other polymeric systems each cationic site holds about four water molecules
each anionic site holds about six each polar site (N or O atoms) holds about one
Steven Brandon 30 June 2004
14
Table 4 below shows the total numbers of anionic cationic polar and non-polar side groups in beef myosin at a range of pH values from 32 to 96 The numbers
of anionic cationic and polar change with pH as the various ionizable groups
become increasingly de-protonated with increasing pH
Table 4 Breakdown of Beef Myosin Amino Acid Groups by Type
pH 32 pH 36 pH 40 pH 44 pH 48 pH 52 pH 56 pH 60 pH 64 pH 68 pH 72 pH 76 pH 80 pH 84 pH 88 pH 92 pH 96
Anionic Total 107 222 387 551 665 725 752 763 768 770 770 771 771 772 774 778 787
Cationic Total 733 733 733 732 730 726 717 703 690 680 674 672 670 669 666 658 641
Polar Total 1477 1362 1198 1034 923 867 849 851 860 868 873 875 876 877 878 881 889
Non-Polar Total 1445 1445 1445 1445 1445 1445 1445 1445 1445 1445 1445 1445 1445 1445 1445 1445 1445
Since the simple equation presented by Duckworth above errs in treating
cationic and anionic side groups equally I have again used an Excel spreadsheet
approach similar to that used to determine net charge to calculate the amount of water bound to various myosin amino acid residues This technique requires
that I first obtain hydration data for each type of amino acid residue in myosin
Table 5 below was scanned from Fennema 1996
Table 5 Amino Acid Hydrations ndash Fennema
Steven Brandon 30 June 2004
15
Table 6 is scanned from the source reference for the table from Fennemarsquos text
Kuntz 197123
Table 6 Amino Acid Hydrations ndash Kuntz
These two sources agree however since Fennema has rounded off the numbers
in his table to one significant figure I have used the values presented by Kuntz in my analysis However neither source lists hydration capacities for uncharged
histidine or for de-protonated (charged) cysteine (Fennemarsquos table omits
cysteine entirely) I have used 4 moles of water per mole of residue for uncharged histidine (since uncharged lysine and arginine hold the same amount
Steven Brandon 30 June 2004
16
of water as charged lysine and arginine respectively) and 2 moles of water per mole of residue for de-protonated cysteine (since it is reasonable to guess that
the charged form might attract water more than uncharged cysteine which holds
1 mole of water per mole of residue) Multiplying the hydration capacities for each amino acid residue by the number of each type of amino acid residue per
myosin molecule gives the total hydration capacity of myosin at each pH Table
A7 in the Appendix shows the results of these calculations for beef myosin Figure 7 below shows how the total hydration of beef pork and rabbit myosin
vary with p based on these calculations
Myosin Hydration vs pH
6000
7000
8000
9000
10000
11000
12000
30 40 50 60 70 80 90 100
pH
Hy
dra
tio
n
mo
les H
2O
mo
le o
f M
yo
sin
Beef Pork Rabbit
Figure 7 Calculated Hydration of Myosin versus pH
It is obvious from this plot that this approach does not accurately predict the
observed increase in hydration at pH below the isoelectric point of meat proteins
Note that this analysis does not predict increasing hydration below the isoelectric
point of the protein as expected from the solubility behavior of proteins (see Figure 5) Since water is dipolar it has both positive (electron-poor) and
negative (electron-rich) regions as shown in Figure 8 below
Steven Brandon 30 June 2004
17
Figure 8 Dipolar structure of water2
This dipolar structure of water is responsible for the formation of hydrogen bonds between water molecules and between water and other and other polar or
charged species including both anionic and cationic amino acid R groups as well as dissolved salt ions such as sodium and chloride At pH above its isoelectric
point myosin has a net negative charge This results from the increasing number
of anionic (de-protonated) carboxyl groups on the aspartic and glutamic acid
residues of the protein molecule with increasing pH These charged groups (aspartate and glutamate) strongly attract water binding 6 to 75 water
molecules per residue in contrast to the uncharged aspartic and glutamic acid
residues which hold only 2 water molecules per residue (by polar attraction) As the pH is lowered to the isoelectric point as occurs naturally in meat by
formation of lactic acid via glycolysis there are fewer of de-protonated anionic
groups as the pH approaches the pKa values of aspartic and glutamic acid (near pH 4)
This trend continues as the pH is lowered below the isoelectric point of myosin (which would generally require the introduction of acid to the meat product) as
fewer and fewer of the aspartic and glutamic acid residues are charged The
basic R groups lysine and arginine are protonated (and cationic) across the essentially fully range of pH included in my analysis (pH 32 to 96) These
Steven Brandon 30 June 2004
18
cationic groups also bind water but to a lesser extent than the anionic groups holding only roughly half the number of water molecules compared to the anionic
groups (3 or 4 vs 6 or 7) Histidine (pKa = 604) becomes increasingly
protonated as the pH is lowered through the isoelectric point of myosin (around pH 5) gaining a positive charge Although neither Fennema nor Kuntz list
hydration data for uncharged histidine it is reasonable to assume that its water
holding capacity (WHC) behavior is similar to that of both arginine and lysine whose WHC does not change depending on whether the group is charged For
this reason the WHC due to all three basic amino acid groups remains constant
across the pH range included in my analysis
So even though the net charge of the myosin molecule is zero at the isoelectric
point (by definition) positive above the isoelectric point and negative below the
isoelectric point the total WHC of myosin as calculated from the hydration values of the individual amino acid residues comprising the myosin molecule does not show a minimum near the isoelectric point
However that does not mean that the actual WHC of myosin behaves as predicted based on an analysis of the WHC of the constituent amino acid
residues That is because this analysis ignores the effects of interactions between myosin molecules whether retained in their relative positions in the
muscle tissue structure or not (as in meat batter) Protein-protein interactions can affect WHC in two ways Firstly interactions between oppositely charged
residues of different protein molecules can effectively neutralize the net charge of
the effected groups thereby reducing WHC of both groups This effect is likely to
be minimal since the charged groups being part of the larger myosin polypeptide molecule are not free to move into position to form such
interactions Secondly and probably more significantly near the isoelectric point where the net charge of the protein is minimized the repulsion of protein
molecules due to like-charged groups is also minimized This means that near the isoelectric point the protein molecules are able to draw more closely together
thereby displacing water that is trapped by capillary action between the molecules This does not effect water that is bound to the protein by polar or
charge attraction Since the amount of water trapped between protein molecules
can be large in comparison to that chemically bound to the protein the spacing of protein molecules (due to net charge) can be expected to have a much greater
effect to the overall WHC of a meat product regardless of whether it retains the
structure of muscle tissue or not
The pH dependence on the solubility of β-lactoglobulin in water is also due to the
variation of net charge with pH (see Figure 9 below)
Steven Brandon 30 June 2004
19
Figure 9 Dependence of protein solubility on pH2
Above or below pI the molecules all have either negative or positive charges and
repel one another Protein is therefore very soluble at either acidic or basic pH At pI the net charge is zero but each molecule still carries surface patches of both
positive and negative charge The charge-charge interactions together with other
kinds of intermolecular interactions such as van der Waals forces make the molecules tend to clump together and precipitate Therefore β-lactoglobulin like
many other proteins has minimum solubility at its isoelectric point2
At low pHs proteins have a net positive charge At high pHs they have a net
negative charge due to the carboxyl on the protein backbone losing its proton
At their pI value a protein has no net charge This leads to reduced solubility because the protein is unable to interact with the medium and will then fall out of
solution24
Steven Brandon 30 June 2004
20
Effect of added NaCl
Background information on NaCl in solution
Ions arent the same size as the atoms they come from Figure 10 compares the
sizes of sodium and chloride ions with the sizes of sodium and chlorine atoms
Figure 10 Relative sizes of Na and Cl ions and atoms
Positive ions are smaller than the atoms they come from Sodium is 281 Na+ is
28 Youve lost a whole layer of electrons and the remaining 10 electrons are
pulled in by the full force of 11 protons Negative ions are bigger than the atoms they come from Chlorine is 287 Cl- is 288 Although the electrons are
still all in the 3-level the extra repulsion produced by the incoming electron causes the atom to expand There are still only 17 protons but they hold 18
electrons25 The diameter of the Na+ ion is 095 Aring which is about half that of the Cl- ion with a diameter of 181 Aring26
When sodium chloride dissolves in water the sodium and chloride ions and the
polar water molecules are strongly attracted to one another by ion-dipole
interactions The solvent molecules (water in this case) surround the ions removing them from the crystal and forming the solution As the dissolving
process proceeds the individual ions are removed from the solid surface becoming completely separate hydrated species in the solution27 Table 7 illustrates these salt ions in aqueous solution
Table 7 Hydration of chloride and sodium ions28
Hydrated
Chloride Ion
Cl-(aq)
Each ion in aqueous solution is surrounded by about six water
molecules in the inner hydration sphere These molecules exchange
rapidly with other solvent molecules
Hydrated
Sodium Ion
Na+(aq)
Each ion in aqueous solution is surrounded by about six water
molecules in the inner hydration sphere These molecules exchange
rapidly with other solvent molecules
Steven Brandon 30 June 2004
21
Salt interaction with protein
At high ionic strength protein solubility generally decreases with increasing salt
concentration due to reducing the activity of water and neutralization of surface charge This phenomenon is called ldquosalting outrdquo Each protein has a distinct
solubility profile as a function of salt concentration defined by Log S (mgmL) = β ndash KS (I2) where S is solubility I is ionic strength and KS and β are constants
Different types of salts affect the solubility of proteins to different extents (see
Figure 11 below) 29
Figure 11 Protein Solubility versus ionic strength 30
Solubility at low ionic strength increases with salt concentration This ldquosalting inrdquo
effect is explained as pairing of salt ions with charged groups of the protein
shields intramolecular repulsion Protein solubility is at a minimum near the isoelectric point (pI) of the protein 31
Salt along with phosphates improves water retention by enhancing protein
hydration NaCl increases the net charges on the protein structure helping to unfold and expose the protein surface by binding water Salt shifts the isoelectric
point to a pH of near 40 increasing the net negative charge at higher meat pH
attracting more water and thus increasing water holding capacity An optimal salt level of 25 - 28 is required to obtain maximum yield juiciness and flavor
quality32
Steven Brandon 30 June 2004
22
Clminus ions bind to the filaments and increase the electrostatic repulsive force between them A crucial factor in swelling is likely to be the removal at a critical
salt concentration of one or more transverse structural constraints in the
myofibril (probably crossbridges the M-line or the Z-line) allowing the filament lattice to expand33
Adding salt moves the pH of the isoelectric point of myosin and exposes
hydrophobic and sulfhydryl groups to the protein surface leading to loss of
helical structure according to research into the relationship between solubility and conformational changes of salmon (Oncorhynchus tshawytscha) myofibrillar
proteins These conformational changes form more surface for protein
solubilization therefore boosting its solubility34
Puolanne Ruusunen and Vainionpaumlauml (2001) of University of Helsinki gave a good review of the effects of added salt to WHC of meat The following information is
extracted from this paper35 References sited in these extracts are listed in Table A12 in the Appendix
Salt (NaCl) is added to meat products to improve their binding and water-holding
properties Chloride ions tend to penetrate into the myofilaments causing them to swell (Hamm 1972) and the sodium ions form an ion cloud around the filaments
(Offer amp Knight 1983) This results in local concentration differences which lead to
an increased osmotic pressure within the myofibrils which causes the filament lattice
to swell Simultaneously the enlargement of negative net charge within the myosin
filaments loosens the filaments and finally causes the disintegration of the filament at
an ionic strength of 08 (without added phosphate) or in 04 (with added phosphate) In sausages without added phosphate water-holding increases rather linearly to the
salt content of ca 4 (Hamm 1972) With added phosphate there is a marked
increase in water-holding in the range of 10ndash15 NaCl (Puolanne amp Ruusunen
1983) This is due to the cleavage of actomyosin bonds by phosphates thus
facilitating the swelling of the filament lattice (Offer amp Knight 1983)
Similar phenomena take place when pH increases The negative net charge of
filaments increases causing an uneven distribution of charges within the filaments Without added salt the water-holding increases as the pH rises from 50 to 90
According to Hamm (1972) there is however not a marked correlation between the
ultimate pH value and water-holding in pH values below 57 (pork) or 58 (beef)
when the same muscles of different animals are compared Animal-to-animal
differences are larger in pH values above the isoelectric point than below (Hamm 1962) Warriss (1982) however found a marked decrease in water-holding in pork
in the pH-range of 51ndash58
When salt is added the binding of chloride ions decreases with increasing pH but the
binding of sodium ions increases (Hamm 1972) As a result the maximum in water-
holding is reached by about pH 60 in meat (Hamm) or in myosin gel (Ishioroshi
Samejima amp Yasui 1979)
Steven Brandon 30 June 2004
23
Offer and Knight (1988) stress that NaCl depolymerizes the thick filament shafts by
weakening interactions between the tails presumably by favoring the exposure of
previously buried charged or andor hydrophilic groups According to Kivikari (1996)
this changes the amount and nature of titratable groups accessible to the solvent probably revealing new groups having pKa values in the pH range 60ndash69
The increase of NaCl content causes a minor shift to lower pH values but this is not
relevant in the narrow range of 05ndash25 NaCl (ca 01ndash04 M) and low pH values of
this study NaCl alone seems not to have had a statistically significant overall effect on batter pH at concentration levels of NaCl in this study On the other hand WHC
and sausage pH were clearly affected by added NaCl alone as well as in the
interaction with meat pH
All cooked sausage variables had a maximum in water-holding by 25 added NaCl The water-holding of the sausages increases with increasing pH-value up to pH 61
and a further increase causes only a minor increase This study shows that water-
holding is strongly affected by the pH of raw materials in combination with NaCl
which renders it important to keep the pH high enough to ensure a sufficiently high
level of water-holding when aiming at lowered salt additions35
The plots shown below in Figure 10 are from the paper by Puolanne Ruusunen and Vainionpaumlauml35
Figure 10 The effect of pH amp NaCl on WHC in cooked sausage WOP without WP with
added phosphate 35
Steven Brandon 30 June 2004
24
I have re-plotted their data for beef and pork without added phosphate to see
how WHC varies with pH at a range of salt contents for both beef and pork (see
Figures 11 amp 12 below) These plots show that WHC for both beef and pork increases steadily without added NaCl as the pH is raised from 55 to 60 but
shows little additional increase at pH gt 60 This observation agrees in general
with the shape of the calculated hydration curve (See Figure 7)
Water Holding Capacity of Pork
0
20
40
60
80
100
54 56 58 60 62 64 66
pH
WH
C
g H
2O
g m
eat
00 NaCl 05 NaCl 10 NaCl
15 NaCl 20 NaCl 25 NaCl
Figure 11 WHC vs pH for Pork without added phosphates
Water Holding Capacity of Beef
0
20
40
60
80
100
54 56 58 60 62 64 66
pH
WH
C
g H
2O
g m
eat
00 NaCl 05 NaCl 10 NaCl
15 NaCl 20 NaCl 25 NaCl
Figure 12 WHC vs pH for Beef without added phosphates
Steven Brandon 30 June 2004
25
Figures 11 and 12 also show that WHC increases substantially with increasing salt content at least up to 25 NaCl
Kao et al (2000) offer the following comments on the way salt affects protein hydration and other properties Proteins are surrounded by an ionic double
layer the structure and properties of which are determined by the balance
between disorganizing thermal forces and the organizing effects of electrostatic interactions and hydration at the protein-solvent interface The properties of the
double layer are influenced by the density of charged and polar groups on the
surface of a protein Therefore salt and pH effects are thermodynamically coupled Strong interactions between proteins and partially dehydrated site-
bound ions are not observed frequently The effects of salt on the stability of
proteins are frequently interpreted in terms of screening of electrostatic
interactions by the ionic strength This concept was inherited from Linderstroslashm-Lang who applied the solution of the linearized Poisson-Boltzmann equation achieved by Debye and Huumlckel less than a year after their original publication in
1923 to understand the ionization properties of proteins The understanding of the physical nature of interactions between proteins and ions continues to advance However at present there is no unifying theoretical framework based
on simple physical principles capable of accounting quantitatively and structurally for all of the different types of salt effects that have been observed in proteins36
Analysis of NaCl effects on charge and WHC of myosin
Model 1 All salt ions interact with charged side groups
I have attempted to model the screening of myosinrsquos charged surface groups by salt ions by recalculating the myosin charge inventory and total hydration as a
function of pH by assuming that the salt ions effectively neutralize the charge of oppositely charged sites Figure 13 below is an illustration of the amino acid
composition of beef myosin at pH 44 where each circle represents one amino acid residue which may be acidic basic polar or non-polar For simplicity I
have divided the total number of amino acid residues by 100 to produce this representative illustration
Acidic
Basic
Polar
Non-Polar
Figure 13 Representative illustration of myosin amino acid composition
The sodium cations (+) and chloride anions (-) are also shown in Figure 13
Here these salt ions are shown screening the charge of oppositely charged amino
acid groups in the myosin molecule
Steven Brandon 30 June 2004
26
For my analysis I selected a salt concentration of 400 moles of NaCl mole of myosin I chose this salt concentration as one sufficient to significantly affect the
behavior of myosin based on the model described above) The results of this
analysis (for beef myosin) are shown in Tables A8 and A9 in the appendix Table A8 lists the charge inventory for beef myosin with 400 moles of added NaCl
mole of myosin As described above this table assumes that the available Na+
and Cl- ions combine with oppositely charged side groups effectively neutralizing them Below pH 40 not all of the free Na+ ions are consumed in interactions
with side groups because there are too few available anionic side groups
(aspartate and glutamate) In reality these free Na+ ions would tend to compete with the cationic side groups to attract Cl- ions but I have not
attempted to account for this in my model
Figure 14 below shows the net charge of myosin versus pH in the presence of
added NaCl This analysis indicates no change in net charge pH gt 40 is the
same as was calculated without added NaCl This is because above pH 40 where all of the available salt ions are employed in interactions with myosin side groups an equal number of positive and negative charges have been neutralized
Myosin Net Charge vs pH
-500
0
500
1000
30 40 50 60 70 80 90 100
pH
Ne
t C
ha
rge
of
My
os
in
Beef Pork Rabbit
Model 1
Figure 14 Net charge of myosin versus pH in the presence of added NaCl ndash Model 1
Table A9 lists the total hydration for beef myosin with 400 moles of added NaCl
mole of myosin I assumed that all of the salt-ion-screened (neutralized) side groups would have the bind the same number of water molecules per side group
as the corresponding unionized side groups For example I assumed that an
ionized aspartate group screened by a Na+ ion would bind the same amount of water as an uncharged aspartic acid group ie 2 molecules of water per group
Steven Brandon 30 June 2004
27
in this case Since the many of the side groups hole less water when unionized (or effectively neutralized by an oppositely charged salt ion) the total hydration
of myosin is lower than was calculated in the absence of added NaCl This is
illustrated in Figure 15 below which shows the calculated total hydration of myosin versus pH in the presence of added NaCl
Myosin Hydration vs pH
6000
7000
8000
9000
10000
11000
12000
30 40 50 60 70 80 90 100
pH
Hy
dra
tio
n
mo
les H
2O
mo
le o
f M
yo
sin
Beef Pork Rabbit
Model 1
Figure 15 Total hydration of myosin versus pH in the presence of added NaCl - Model 1
This analysis is unsatisfactory in that it predicts no change in isoelectric point
with added salt and in that it predicts a reduction in hydration of myosin with added salt These two predictions disagree with the reported observations that
adding low concentrations of salt lowers pI and increases hydration (at pH gt pI) Back to the drawing board
Model 2 Only anions interact with cationic side groups
The WHC of a meat system is greatly affected by the addition of salt To fully
understand this effect one must consider the action of both the cation and the
anion which result from the ionization of salt These ions must be absorbed by
the protein to affect WHC The effect of salt can be explained by the fact that the chloride anion being larger would be less hydrated than the sodium cation The
less hydrated ions are drawn closer to the charged protein group due to their
smaller radii The chloride ion should therefore have more of an effect on
screening of oppositely charged groups at pH above the pI than sodium resulting
in a net increase in negative charges and a shift of the pI of muscle to lower pH values An increase in negative charges results in repulsion of the protein groups
and an enlargement of the space available for absorption within the muscle37
This assertion that chloride ions being larger are less hydrated than sodium ions does not agree with the information I found elsewhere (see Table 7)28
Steven Brandon 30 June 2004
28
which states that both ions are hydrated by about six water molecules in solution However if one considers the counterion atmosphere surrounding a
catonic macroion (see Figure 4) such as myosin below its isoelectric point it is
not unreasonable to imagine that the anionic Cl- ions are held closely to the protein molecule while the cationic Na+ ions tend to remain at a greater distance
from the protein where they can have relatively little influence on the charge
and therefore the hydration behavior of the myosin molecule Figure 16 illustrates this concept
Figure 16 Illustration of the chloride screening effect assumed in Model 2
I have repeated my analysis using the assumption that only the Cl- ions are able
to interact with (and effectively neutralize) the cationic side groups while the Na+ ions do not interact with the myosin molecule at all
Table A10 lists the net charge of beef myosin versus pH as calculated using Model
2 As indicated in this table the isoelectric point is predicted by Model 2 to shift from about pH 52 (see Table 3) to lt pH 4 Figure 17 below shows that
isoelectic points of pork and rabbit myosin have shifted to lower pH This results
from the overall reduction in net charge resulting from neutralization of a large portion of the cationic side groups by charge interactions with chloride anions
+ + + + + +
+ + ++ + + + + + + + + +
+ + + +
Na+
Cl-
Steven Brandon 30 June 2004
29
Myosin Net Charge vs pH
-1000
-500
0
500
30 40 50 60 70 80 90 100
pH
Ne
t C
ha
rge
of
My
os
in
Beef Pork Rabbit
Model 2
Figure 17 Net charge of myosin versus pH in the presence of added NaCl ndash Model 2
Table A11 lists the total hydration of beef myosin versus pH as calculated using
Model 2 Figure 17 below shows the hydration curves for beef pork and rabbit myosin calculated using Model 2
Myosin Hydration vs pH
6000
7000
8000
9000
10000
11000
12000
30 40 50 60 70 80 90 100
pH
Hy
dra
tio
n
mo
les H
2O
mo
le o
f M
yo
sin
Beef Pork Rabbit
Model 2
Figure 18 Total hydration of myosin versus pH in the presence of added NaCl - Model 2
Contrary to expectations Model 2 predicts no change in the total hydration of
beef myosin in the presence of added salt This results from the fact that the
chloride ldquoscreenedrdquo cationic side groups are assumed to hold the same number of
water molecules per side group as the ldquounscreenedrdquo cationic groups in the
Steven Brandon 30 June 2004
30
absence of salt If this model has any validity it indicates that the observed changes in hydration in the presence of added salt are the consequence of
phenomena other than salt ion ndash charged side group interactions
Comparing the total number of charged groups present in the myosin molecule at
pI in the absence of added salt about pH 52 (see Table A6) to number of
charged groups at the pI of myosin in the presence of added salt (using Model 2) about pH 39 (see Table A10) reveals a substantial reduction in the total numbers
of charged groups at pI with added salt Table 8 below lists the total numbers of
charged groups at pI with and without added salt These numbers were obtained from Tables A6 and A10 for the no salt and added salt cases respectively (I
had to interpolate between data for pH 36 and pH 40 in Table A10 to obtain the
numbers of charged groups at pI = 387 for the added salt case)
Table 8 Inventory of Anionic amp Cationic Groups with and without added salt
No Added NaCl Added NaCl
pI pH 520 pH 387 Total Anionic Groups 725 265
Total Cationic Groups 725 265
The lower numbers of charged groups in the added salt case results from the effective screening of some of these groups by salt ions This overall reduction in
the number of charged groups in myosin reduces the repulsion between
neighboring myosin molecules allowing the proteins to draw more closely
together leaving less volume available for capillary entrapped water This is supported by Wilding et al (1986) who report that Rabbit longissimus dorsi
fibers were found to swell in hypertonic salt solutions such as 025 M KI or 06 M KCl to two to three times their original diameter Swelling occurs by a
combination of an increase in the myofilament lattice spacing and a loss of myofilament order However at pH below the isoelectric point of the myofibrillar proteins hypertonic salt solutions induce fiber shrinkage 38
Steven Brandon 30 June 2004
31
Appendix Table A1 Amino Acids39
Steven Brandon 30 June 2004
32
Table A2 Myosin Amino Acid Composition
Myosin aa aa aa Residuesmole aa Residue WtmoleResidues 10
5 g Symbol gmole Residues mole My Residue g mole My
Beef Pork Rabbit Beef Pork Rabbit
Aspartate D 11308
Aspartic acid 74 68 72 D 11408 333 306 325
Glutamate E 12711
Glutamic acid 97 100 103 E 12811 438 450 465
de-protonated Histidine H 13716
Histidine 14 15 15 H 13816 63 68 68
de-protonated Lysine K 12819
Lysine 107 105 85 K 12919 482 473 383
de-protonated Arginine R 15620
Arginine 42 46 41 R 15720 189 207 185
de-protonated Cysteine C 10215
Cysteine 0 0 9 C 10315 0 0 41
de-protonated Tyrosine Y 16212
Tyrosine 16 16 18 Y 16312 72 72 81
Asparagine 13 12 13 N 11410 59 54 57
Glutamine 49 50 52 Q 12814 219 225 233
Proline 26 20 22 P 9713 117 90 99
Serine 34 37 41 S 8709 153 167 185
Threonine 43 47 41 T 10112 194 212 185
Tryptophan 0 0 4 W 18623 0 0 18
Alanine 73 65 78 A 7109 329 293 351
Glycine 38 39 39 G 5707 171 176 176
Isoleucine 40 41 42 I 11318 180 185 189
Leucine 86 86 79 L 11318 387 387 356
Methionine 20 21 22 M 13121 90 95 99
Phenylalanine 27 28 27 F 14719 122 126 122
Valine 37 39 42 V 9915 167 176 189
(NH3) 106 120 86 170 477 540 387
Total residues (text) 836 837 845
Total residues (calc) 836 835 845 2318 2322 2322
Use 450000 kDa = 450000 gmole
Steven Brandon 30 June 2004
33
Table A3 Amino Acid Properties40
Abbrev Full Name Side chain
type Mass pI
pK1
(alpha -
COOH)
pK2
(alpha -+NH3)
pKr
(R) Remarks
A Ala Alanine hydrophobic 8909 611 235 987
C Cys Cysteine hydrophilic 12116 505 192 1070 837
Two cysteines can
form a disulfide
bond This enforces
tertiary structure
and such proteins as
insulin have disulfide
bonds
D Asp Aspartic acid acidic 13310 285 199 990 390
E Glu Glutamic acid acidic 14713 315 210 947 407
F Phe Phenylalanine hydrophobic 16519 549 220 931
G Gly Glycine hydrophilic 7507 606 235 978
Because of the two
hydrogen atoms at
the α carbon glycine
is not optically
active
H His Histidine basic 15516 760 180 933 604
I Ile Isoleucine hydrophobic 13117 605 232 976
K Lys Lysine basic 14619 960 216 906 1054
L Leu Leucine hydrophobic 13117 601 233 974
M Met Methionine hydrophobic 14921 574 213 928
Always the first
amino acid to be
incorporated into a
protein sometimes
removed after
translation
N Asn Asparagine hydrophilic 13212 541 214 872
P Pro Proline hydrophobic 11513 630 195 1064
Can disrupt protein
folding structures
like α helix or β
sheet
Q Gln Glutamine hydrophilic 14615 565 217 913
R Arg Arginine basic 17420 1076 182 899 1248
S Ser Serine hydrophilic 10509 568 219 921
T Thr Threonine hydrophilic 11912 560 209 910
V Val Valine hydrophobic 11715 600 239 974
W Trp Tryptophan hydrophobic 20423 589 246 941
Y Tyr Tyrosine hydrophilic 18119 564 220 921 1046
Steven Brandon 30 June 2004
34
Table A4 Fraction of Dissociated Amino Acid R-Groups by pH
Fraction of dissociated R-groups
[A-]([HA]+[A
-])
aa Dissociating Group pH pH pH pH pH pH pH pH pH pH pH pH pH pH pH pH pH
Class HA A- pKR 32 36 40 44 48 52 56 60 64 68 72 76 80 84 88 92 96
Asp-
A --COO- 390 017 033 056 076 089 095 098 099 100 100 100 100 100 100 100 100 100 Asp
-
Asp A --COOH 083 067 044 024 011 005 002 001 000 000 000 000 000 000 000 000 000 Asp
Glu-
A --COO- 407 012 025 046 068 084 093 097 099 100 100 100 100 100 100 100 100 100 Glu
-
Glu A --COOH 088 075 054 032 016 007 003 001 000 000 000 000 000 000 000 000 000 Glu
His B -N 604 000 000 001 002 005 013 027 048 070 085 094 097 099 100 100 100 100 His
His+
B -NH+ 100 100 099 098 095 087 073 052 030 015 006 003 001 000 000 000 000 His
+
Lys B -NH2 1079 000 000 000 000 000 000 000 000 000 000 000 000 000 000 001 003 006 Lys
Lys+
B -NH2H+ 100 100 100 100 100 100 100 100 100 100 100 100 100 100 099 097 094 Lys
+
Arg B -NH 1248 000 000 000 000 000 000 000 000 000 000 000 000 000 000 000 000 000 Arg
Arg+
B -NHH+ 100 100 100 100 100 100 100 100 100 100 100 100 100 100 100 100 100 Arg
+
Cys-
P --S- 835 000 000 000 000 000 000 000 000 001 003 007 015 031 053 074 088 095 Cys
-
Cys P --SH 100 100 100 100 100 100 100 100 099 097 093 085 069 047 026 012 005 Cys
Tyr-
NP --O- 1013 000 000 000 000 000 000 000 000 000 000 000 000 001 002 004 011 023 Tyr
-
Tyr NP --OH 100 100 100 100 100 100 100 100 100 100 100 100 099 098 096 089 077 Tyr
Steven Brandon 30 June 2004
35
Table A5 Beef Myosin Amino Acid Composition by pH
Myosin
Amino Acid Residues mole of Myosin
Beef Pork
pH 32 pH 36 pH 40 pH 44 pH 48 pH 52 pH 56 pH 60 pH 64 pH 68 pH 72 pH 76 pH 80 pH 84 pH 88 pH 92 pH 96
Asp-
55 111 185 253 296 317 326 330 332 332 333 333 333 333 333 333 333
Asp 277 222 147 80 37 16 7 3 1 0 0 0 0 0 0 0 0
Glu-
52 111 201 298 369 408 425 433 436 437 438 438 438 438 438 438 438
Glu 386 327 237 140 69 30 13 5 2 1 0 0 0 0 0 0 0
His 0 0 1 1 3 8 17 30 44 54 59 61 62 63 63 63 63
His+
63 63 62 62 60 55 46 33 19 9 4 2 1 0 0 0 0
Lys 0 0 0 0 0 0 0 0 0 0 0 0 1 2 5 12 29
Lys+
481 481 481 481 481 481 481 481 481 481 481 481 481 480 477 469 452
Arg 0 0 0 0 0 0 0 0 0 0 0 0 0 0 0 0 0
Arg+
189 189 189 189 189 189 189 189 189 189 189 189 189 189 189 189 189
Cys-
0 0 0 0 0 0 0 0 0 0 0 0 0 0 0 0 0
Cys 0 0 0 0 0 0 0 0 0 0 0 0 0 0 0 0 0
Tyr-
0 0 0 0 0 0 0 0 0 0 0 0 1 1 3 8 16
Tyr 72 72 72 72 72 72 72 72 72 72 72 72 71 71 69 64 56
Asn 59 59 59 59 59 59 59 59 59 59 59 59 59 59 59 59 59
Gln 219 219 219 219 219 219 219 219 219 219 219 219 219 219 219 219 219
Pro 117 117 117 117 117 117 117 117 117 117 117 117 117 117 117 117 117
Ser 153 153 153 153 153 153 153 153 153 153 153 153 153 153 153 153 153
Thr 194 194 194 194 194 194 194 194 194 194 194 194 194 194 194 194 194
Trp 0 0 0 0 0 0 0 0 0 0 0 0 0 0 0 0 0
Ala 329 329 329 329 329 329 329 329 329 329 329 329 329 329 329 329 329
Gly 171 171 171 171 171 171 171 171 171 171 171 171 171 171 171 171 171
Ile 180 180 180 180 180 180 180 180 180 180 180 180 180 180 180 180 180
Leu 387 387 387 387 387 387 387 387 387 387 387 387 387 387 387 387 387
Met 90 90 90 90 90 90 90 90 90 90 90 90 90 90 90 90 90
Phe 122 122 122 122 122 122 122 122 122 122 122 122 122 122 122 122 122
Val 167 167 167 167 167 167 167 167 167 167 167 167 167 167 167 167 167
(NH3) 477 477 477 477 477 477 477 477 477 477 477 477 477 477 477 477 477
Total residues (calc) 3762 3762 3762 3762 3762 3762 3762 3762 3762 3762 3762 3762 3762 3762 3762 3762 3762
Steven Brandon 30 June 2004
36
Table A6 Charge Inventory of Beef Myosin by pH
Myosin
Residue Charge Charge Inventory
Beef Pork
pH 32 pH 36 pH 40 pH 44 pH 48 pH 52 pH 56 pH 60 pH 64 pH 68 pH 72 pH 76 pH 80 pH 84 pH 88 pH 92 pH 96
-1 Asp-
-55 -111 -185 -253 -296 -317 -326 -330 -332 -332 -333 -333 -333 -333 -333 -333 -333
0 Asp 0 0 0 0 0 0 0 0 0 0 0 0 0 0 0 0 0
-1 Glu-
-52 -111 -201 -298 -369 -408 -425 -433 -436 -437 -438 -438 -438 -438 -438 -438 -438
0 Glu 0 0 0 0 0 0 0 0 0 0 0 0 0 0 0 0 0
0 His 0 0 0 0 0 0 0 0 0 0 0 0 0 0 0 0 0
1 His+
63 63 62 62 60 55 46 33 19 9 4 2 1 0 0 0 0
0 Lys 0 0 0 0 0 0 0 0 0 0 0 0 0 0 0 0 0
1 Lys+
481 481 481 481 481 481 481 481 481 481 481 481 481 480 477 469 452
0 Arg 0 0 0 0 0 0 0 0 0 0 0 0 0 0 0 0 0
1 Arg+
189 189 189 189 189 189 189 189 189 189 189 189 189 189 189 189 189
-1 Cys-
0 0 0 0 0 0 0 0 0 0 0 0 0 0 0 0 0
0 Cys 0 0 0 0 0 0 0 0 0 0 0 0 0 0 0 0 0
-1 Tyr-
0 0 0 0 0 0 0 0 0 0 0 0 -1 -1 -3 -8 -16
0 Tyr 0 0 0 0 0 0 0 0 0 0 0 0 0 0 0 0 0
0 Asn 0 0 0 0 0 0 0 0 0 0 0 0 0 0 0 0 0
0 Gln 0 0 0 0 0 0 0 0 0 0 0 0 0 0 0 0 0
0 Pro 0 0 0 0 0 0 0 0 0 0 0 0 0 0 0 0 0
0 Ser 0 0 0 0 0 0 0 0 0 0 0 0 0 0 0 0 0
0 The 0 0 0 0 0 0 0 0 0 0 0 0 0 0 0 0 0
0 Trp 0 0 0 0 0 0 0 0 0 0 0 0 0 0 0 0 0
0 Ala 0 0 0 0 0 0 0 0 0 0 0 0 0 0 0 0 0
0 Gly 0 0 0 0 0 0 0 0 0 0 0 0 0 0 0 0 0
0 Ile 0 0 0 0 0 0 0 0 0 0 0 0 0 0 0 0 0
0 Leu 0 0 0 0 0 0 0 0 0 0 0 0 0 0 0 0 0
0 Met 0 0 0 0 0 0 0 0 0 0 0 0 0 0 0 0 0
0 Phe 0 0 0 0 0 0 0 0 0 0 0 0 0 0 0 0 0
0 Val 0 0 0 0 0 0 0 0 0 0 0 0 0 0 0 0 0
0 (NH3) 0 0 0 0 0 0 0 0 0 0 0 0 0 0 0 0 0
TOTAL 626 511 346 181 65 1 -35 -60 -78 -90 -96 -99 -101 -103 -108 -120 -146
Steven Brandon 30 June 2004
37
Table A7 Beef Myosin Hydration by pH
Source Myosin
Hydration moles of H2O mole of Myosin
moles H2OMole of Residue Beef Pork
pH 32 pH 36 pH 40 pH 44 pH 48 pH 52 pH 56 pH 60 pH 64 pH 68 pH 72 pH 76 pH 80 pH 84 pH 88 pH 92 pH 96
60 Kuntz Asp-
332 667 1113 1517 1773 1901 1958 1981 1990 1994 1996 1996 1996 1997 1997 1997 1997
20 Kuntz Asp 555 443 295 160 74 32 13 5 2 1 0 0 0 0 0 0 0
75 Kuntz Glu-
390 831 1510 2238 2769 3058 3191 3247 3270 3279 3283 3284 3285 3285 3285 3285 3285
20 Kuntz Glu 772 654 473 279 138 60 25 10 4 2 1 0 0 0 0 0 0
40 best guess His 0 1 2 6 14 32 67 120 175 215 236 245 249 251 252 252 252
40 Kuntz His+
252 251 250 246 238 220 185 132 77 37 16 7 3 1 0 0 0
45 Kuntz Lys 0 0 0 0 0 0 0 0 0 0 1 1 4 9 22 54 131
45 Kuntz Lys+
2167 2167 2167 2167 2167 2167 2167 2167 2167 2167 2166 2165 2163 2158 2145 2112 2035
30 Kuntz Arg 0 0 0 0 0 0 0 0 0 0 0 0 0 0 0 0 1
30 Kuntz Arg+
567 567 567 567 567 567 567 567 567 567 567 567 567 567 567 567 566
20 best guess Cys-
0 0 0 0 0 0 0 0 0 0 0 0 0 0 0 0 0
10 Kuntz Cys 0 0 0 0 0 0 0 0 0 0 0 0 0 0 0 0 0
75 Kuntz Tyr-
0 0 0 0 0 0 0 0 0 0 1 2 4 10 24 57 123
30 Kuntz Tyr 216 216 216 216 216 216 216 216 216 216 216 215 214 212 206 193 167
20 Kuntz Asn 117 117 117 117 117 117 117 117 117 117 117 117 117 117 117 117 117
20 Kuntz Gln 438 438 438 438 438 438 438 438 438 438 438 438 438 438 438 438 438
30 Kuntz Pro 351 351 351 351 351 351 351 351 351 351 351 351 351 351 351 351 351
20 Kuntz Ser 306 306 306 306 306 306 306 306 306 306 306 306 306 306 306 306 306
20 Kuntz The 387 387 387 387 387 387 387 387 387 387 387 387 387 387 387 387 387
20 Kuntz Trp 0 0 0 0 0 0 0 0 0 0 0 0 0 0 0 0 0
15 Kuntz Ala 493 493 493 493 493 493 493 493 493 493 493 493 493 493 493 493 493
10 Kuntz Gly 171 171 171 171 171 171 171 171 171 171 171 171 171 171 171 171 171
10 Kuntz Ile 180 180 180 180 180 180 180 180 180 180 180 180 180 180 180 180 180
10 Kuntz Leu 387 387 387 387 387 387 387 387 387 387 387 387 387 387 387 387 387
10 Kuntz Met 90 90 90 90 90 90 90 90 90 90 90 90 90 90 90 90 90
00 Kuntz Phe 0 0 0 0 0 0 0 0 0 0 0 0 0 0 0 0 0
10 Kuntz Val 167 167 167 167 167 167 167 167 167 167 167 167 167 167 167 167 167
(NH3) 0 0 0 0 0 0 0 0 0 0 0 0 0 0 0 0 0
TOTAL 8338 8884 9679 10483 11043 11340 11475 11532 11555 11564 11568 11570 11572 11576 11585 11604 11644
Steven Brandon 30 June 2004
38
Table A8 Charge Inventory of Beef Myosin by pH with 400 moles of NaCl mole of myosin ndash Model 1 Myosin
Residue Charge Charge Inventory
Beef Pork
pH 32 pH 36 pH 40 pH 44 pH 48 pH 52 pH 56 pH 60 pH 64 pH 68 pH 72 pH 76 pH 80 pH 84 pH 88 pH 92 pH 96
0 Na Asp 0 0 0 0 0 0 0 0 0 0 0 0 0 0 0 0 0
-1 Asp-
0 0 0 -69 -118 -142 -153 -157 -159 -160 -160 -160 -160 -160 -161 -162 -164
0 Asp 0 0 0 0 0 0 0 0 0 0 0 0 0 0 0 0 0
0 Na Glu 0 0 0 0 0 0 0 0 0 0 0 0 0 0 0 0 0
-1 Glu-
0 0 0 -82 -147 -183 -199 -206 -209 -210 -210 -211 -211 -211 -212 -213 -215
0 Glu 0 0 0 0 0 0 0 0 0 0 0 0 0 0 0 0 0
0 His Cl 0 0 0 0 0 0 0 0 0 0 0 0 0 0 0 0 0
0 His 0 0 0 0 0 0 0 0 0 0 0 0 0 0 0 0 0
1 His+
29 29 28 28 27 25 20 14 8 4 2 1 0 0 0 0 0
0 Lys Cl 0 0 0 0 0 0 0 0 0 0 0 0 0 0 0 0 0
0 Lys 0 0 0 0 0 0 0 0 0 0 0 0 0 0 0 0 0
1 Lys+
219 219 219 218 218 216 213 208 202 198 196 195 194 193 190 184 170
0 Arg Cl 0 0 0 0 0 0 0 0 0 0 0 0 0 0 0 0 0
0 Arg 0 0 0 0 0 0 0 0 0 0 0 0 0 0 0 0 0
1 Arg+
86 86 86 86 85 85 84 82 79 78 77 76 76 76 75 74 71
0 Na Cys 0 0 0 0 0 0 0 0 0 0 0 0 0 0 0 0 0
-1 Cys-
0 0 0 0 0 0 0 0 0 0 0 0 0 0 0 0 0
0 Cys 0 0 0 0 0 0 0 0 0 0 0 0 0 0 0 0 0
0 Na Tyr 0 0 0 0 0 0 0 0 0 0 0 0 0 0 0 0 0
-1 Tyr-
0 0 0 0 0 0 0 0 0 0 0 0 0 -1 -2 -4 -8
0 Tyr 0 0 0 0 0 0 0 0 0 0 0 0 0 0 0 0 0
0 Asn 0 0 0 0 0 0 0 0 0 0 0 0 0 0 0 0 0
0 Gln 0 0 0 0 0 0 0 0 0 0 0 0 0 0 0 0 0
0 Pro 0 0 0 0 0 0 0 0 0 0 0 0 0 0 0 0 0
0 Ser 0 0 0 0 0 0 0 0 0 0 0 0 0 0 0 0 0
0 Thr 0 0 0 0 0 0 0 0 0 0 0 0 0 0 0 0 0
0 Trp 0 0 0 0 0 0 0 0 0 0 0 0 0 0 0 0 0
0 Ala 0 0 0 0 0 0 0 0 0 0 0 0 0 0 0 0 0
0 Gly 0 0 0 0 0 0 0 0 0 0 0 0 0 0 0 0 0
0 Ile 0 0 0 0 0 0 0 0 0 0 0 0 0 0 0 0 0
0 Leu 0 0 0 0 0 0 0 0 0 0 0 0 0 0 0 0 0
0 Met 0 0 0 0 0 0 0 0 0 0 0 0 0 0 0 0 0
0 Phe 0 0 0 0 0 0 0 0 0 0 0 0 0 0 0 0 0
0 Val 0 0 0 0 0 0 0 0 0 0 0 0 0 0 0 0 0
0 (NH3) 0 0 0 0 0 0 0 0 0 0 0 0 0 0 0 0 0
TOTAL 333 333 333 181 65 1 -35 -60 -78 -90 -96 -99 -101 -103 -108 -120 -146
Steven Brandon 30 June 2004
39
Table A9 Beef Myosin Hydration by pH with 400 moles of NaCl mole of myosin ndash Model 1
Myosin
Hydration moles of H2O mole of Myosin
moles H2OMole of Residue Beef Pork
pH 32 pH 36 pH 40 pH 44 pH 48 pH 52 pH 56 pH 60 pH 64 pH 68 pH 72 pH 76 pH 80 pH 84 pH 88 pH 92 pH 96
2 best guess Na Asp 111 222 371 367 356 350 347 346 346 345 345 345 345 345 344 342 338
6 Kuntz Asp-
0 0 0 416 706 852 916 943 953 958 959 960 961 962 965 971 982
2 Kuntz Asp 555 443 295 160 74 32 13 5 2 1 0 0 0 0 0 0 0
2 best guess Na Glu 104 222 403 433 444 450 453 454 454 454 455 454 454 454 453 450 445
75 Kuntz Glu-
0 0 0 614 1103 1370 1493 1545 1566 1575 1578 1580 1581 1583 1587 1597 1616
2 Kuntz Glu 772 654 473 279 138 60 25 10 4 2 1 0 0 0 0 0 0
4 best guess His Cl 137 137 136 135 131 121 103 75 44 22 10 4 2 1 0 0 0
4 best guess His 0 1 2 6 14 32 67 120 175 215 236 245 249 251 252 252 252
4 Kuntz His+
114 114 113 112 108 99 82 57 32 15 7 3 1 0 0 0 0
45 best guess Lys Cl 1182 1182 1183 1184 1187 1195 1209 1232 1257 1275 1285 1289 1291 1291 1289 1283 1270
45 Kuntz Lys 0 0 0 0 0 0 0 0 0 0 1 1 4 9 22 54 131
45 Kuntz Lys+
985 985 984 983 980 972 957 935 910 892 881 876 873 867 856 829 765
3 best guess Arg Cl 309 309 309 310 311 313 316 322 329 334 336 338 338 339 341 344 353
3 Kuntz Arg 0 0 0 0 0 0 0 0 0 0 0 0 0 0 0 0 1
3 Kuntz Arg+
258 258 258 257 256 254 251 245 238 233 231 229 229 228 226 222 213
1 best guess Na Cys 0 0 0 0 0 0 0 0 0 0 0 0 0 0 0 0 0
2 best guess Cys-
0 0 0 0 0 0 0 0 0 0 0 0 0 0 0 0 0
1 Kuntz Cys 0 0 0 0 0 0 0 0 0 0 0 0 0 0 0 0 0
3 Kuntz Na Tyr 0 0 0 0 0 0 0 0 0 0 0 0 1 2 5 12 25
75 Kuntz Tyr-
0 0 0 0 0 0 0 0 0 0 0 1 2 5 12 28 61
3 Kuntz Tyr 216 216 216 216 216 216 216 216 216 216 216 215 214 212 206 193 167
2 Kuntz Asn 117 117 117 117 117 117 117 117 117 117 117 117 117 117 117 117 117
2 Kuntz Gln 438 438 438 438 438 438 438 438 438 438 438 438 438 438 438 438 438
3 Kuntz Pro 351 351 351 351 351 351 351 351 351 351 351 351 351 351 351 351 351
2 Kuntz Ser 306 306 306 306 306 306 306 306 306 306 306 306 306 306 306 306 306
2 Kuntz Thr 387 387 387 387 387 387 387 387 387 387 387 387 387 387 387 387 387
2 Kuntz Trp 0 0 0 0 0 0 0 0 0 0 0 0 0 0 0 0 0
15 Kuntz Ala 493 493 493 493 493 493 493 493 493 493 493 493 493 493 493 493 493
1 Kuntz Gly 171 171 171 171 171 171 171 171 171 171 171 171 171 171 171 171 171
1 Kuntz Ile 180 180 180 180 180 180 180 180 180 180 180 180 180 180 180 180 180
1 Kuntz Leu 387 387 387 387 387 387 387 387 387 387 387 387 387 387 387 387 387
1 Kuntz Met 90 90 90 90 90 90 90 90 90 90 90 90 90 90 90 90 90
0 Kuntz Phe 0 0 0 0 0 0 0 0 0 0 0 0 0 0 0 0 0
1 Kuntz Val 167 167 167 167 167 167 167 167 167 167 167 167 167 167 167 167 167
(NH3) 0 0 0 0 0 0 0 0 0 0 0 0 0 0 0 0 0
TOTAL 7830 7830 7830 8558 9110 9403 9535 9591 9614 9623 9627 9629 9631 9635 9644 9665 9706
Steven Brandon 30 June 2004
40
Table A10 Charge Inventory of Beef Myosin by pH with 400 moles of NaCl mole of myosin ndash Model 2
Myosin
Residue Charge Charge Inventory
Beef Pork
pH 32 pH 36 pH 40 pH 44 pH 48 pH 52 pH 56 pH 60 pH 64 pH 68 pH 72 pH 76 pH 80 pH 84 pH 88 pH 92 pH 96
-1 Asp-
-55 -111 -185 -253 -296 -317 -326 -330 -332 -332 -333 -333 -333 -333 -333 -333 -333
0 Asp 0 0 0 0 0 0 0 0 0 0 0 0 0 0 0 0 0
-1 Glu-
-52 -111 -201 -298 -369 -408 -425 -433 -436 -437 -438 -438 -438 -438 -438 -438 -438
0 Glu 0 0 0 0 0 0 0 0 0 0 0 0 0 0 0 0 0
0 His Cl 0 0 0 0 0 0 0 0 0 0 0 0 0 0 0 0 0
0 His 0 0 0 0 0 0 0 0 0 0 0 0 0 0 0 0 0
1 His+
29 29 28 28 27 25 20 14 8 4 2 1 0 0 0 0 0
0 Lys Cl 0 0 0 0 0 0 0 0 0 0 0 0 0 0 0 0 0
0 Lys 0 0 0 0 0 0 0 0 0 0 0 0 0 0 0 0 0
1 Lys+
219 219 219 218 218 216 213 208 202 198 196 195 194 193 190 184 170
0 Arg Cl 0 0 0 0 0 0 0 0 0 0 0 0 0 0 0 0 0
0 Arg 0 0 0 0 0 0 0 0 0 0 0 0 0 0 0 0 0
1 Arg+
86 86 86 86 85 85 84 82 79 78 77 76 76 76 75 74 71
-1 Cys-
0 0 0 0 0 0 0 0 0 0 0 0 0 0 0 0 0
0 Cys 0 0 0 0 0 0 0 0 0 0 0 0 0 0 0 0 0
-1 Tyr-
0 0 0 0 0 0 0 0 0 0 0 0 -1 -1 -3 -8 -16
0 Tyr 0 0 0 0 0 0 0 0 0 0 0 0 0 0 0 0 0
0 Asn 0 0 0 0 0 0 0 0 0 0 0 0 0 0 0 0 0
0 Gln 0 0 0 0 0 0 0 0 0 0 0 0 0 0 0 0 0
0 Pro 0 0 0 0 0 0 0 0 0 0 0 0 0 0 0 0 0
0 Ser 0 0 0 0 0 0 0 0 0 0 0 0 0 0 0 0 0
0 Thr 0 0 0 0 0 0 0 0 0 0 0 0 0 0 0 0 0
0 Trp 0 0 0 0 0 0 0 0 0 0 0 0 0 0 0 0 0
0 Ala 0 0 0 0 0 0 0 0 0 0 0 0 0 0 0 0 0
0 Gly 0 0 0 0 0 0 0 0 0 0 0 0 0 0 0 0 0
0 Ile 0 0 0 0 0 0 0 0 0 0 0 0 0 0 0 0 0
0 Leu 0 0 0 0 0 0 0 0 0 0 0 0 0 0 0 0 0
0 Met 0 0 0 0 0 0 0 0 0 0 0 0 0 0 0 0 0
0 Phe 0 0 0 0 0 0 0 0 0 0 0 0 0 0 0 0 0
0 Val 0 0 0 0 0 0 0 0 0 0 0 0 0 0 0 0 0
0 (NH3) 0 0 0 0 0 0 0 0 0 0 0 0 0 0 0 0 0
TOTAL 226 111 -54 -219 -335 -399 -435 -460 -478 -490 -496 -499 -501 -503 -508 -520 -546
Steven Brandon 30 June 2004
41
Table A11 Beef Myosin Hydration by pH with 400 moles of NaCl mole of myosin ndash Model 2
Myosin
Hydration moles of H2O mole of Myosin
moles H2OMole of Residue Beef Pork
pH 32 pH 36 pH 40 pH 44 pH 48 pH 52 pH 56 pH 60 pH 64 pH 68 pH 72 pH 76 pH 80 pH 84 pH 88 pH 92 pH 96
6 Kuntz Asp-
332 667 1113 1517 1773 1901 1958 1981 1990 1994 1996 1996 1996 1997 1997 1997 1997
2 Kuntz Asp 555 443 295 160 74 32 13 5 2 1 0 0 0 0 0 0 0
75 Kuntz Glu-
390 831 1510 2238 2769 3058 3191 3247 3270 3279 3283 3284 3285 3285 3285 3285 3285
2 Kuntz Glu 772 654 473 279 138 60 25 10 4 2 1 0 0 0 0 0 0
4 best guess His Cl 137 137 136 135 131 121 103 75 44 22 10 4 2 1 0 0 0
4 best guess His 0 1 2 6 14 32 67 120 175 215 236 245 249 251 252 252 252
4 Kuntz His+
114 114 113 112 108 99 82 57 32 15 7 3 1 0 0 0 0
45 best guess Lys Cl 1182 1182 1183 1184 1187 1195 1209 1232 1257 1275 1285 1289 1291 1291 1289 1283 1270
45 Kuntz Lys 0 0 0 0 0 0 0 0 0 0 1 1 4 9 22 54 131
45 Kuntz Lys+
985 985 984 983 980 972 957 935 910 892 881 876 873 867 856 829 765
3 best guess Arg Cl 309 309 309 310 311 313 316 322 329 334 336 338 338 339 341 344 353
3 Kuntz Arg 0 0 0 0 0 0 0 0 0 0 0 0 0 0 0 0 1
3 Kuntz Arg+
258 258 258 257 256 254 251 245 238 233 231 229 229 228 226 222 213
2 best guess Cys-
0 0 0 0 0 0 0 0 0 0 0 0 0 0 0 0 0
1 Kuntz Cys 0 0 0 0 0 0 0 0 0 0 0 0 0 0 0 0 0
75 Kuntz Tyr-
0 0 0 0 0 0 0 0 0 0 1 2 4 10 24 57 123
3 Kuntz Tyr 216 216 216 216 216 216 216 216 216 216 216 215 214 212 206 193 167
2 Kuntz Asn 117 117 117 117 117 117 117 117 117 117 117 117 117 117 117 117 117
2 Kuntz Gln 438 438 438 438 438 438 438 438 438 438 438 438 438 438 438 438 438
3 Kuntz Pro 351 351 351 351 351 351 351 351 351 351 351 351 351 351 351 351 351
2 Kuntz Ser 306 306 306 306 306 306 306 306 306 306 306 306 306 306 306 306 306
2 Kuntz Thr 387 387 387 387 387 387 387 387 387 387 387 387 387 387 387 387 387
2 Kuntz Trp 0 0 0 0 0 0 0 0 0 0 0 0 0 0 0 0 0
15 Kuntz Ala 493 493 493 493 493 493 493 493 493 493 493 493 493 493 493 493 493
1 Kuntz Gly 171 171 171 171 171 171 171 171 171 171 171 171 171 171 171 171 171
1 Kuntz Ile 180 180 180 180 180 180 180 180 180 180 180 180 180 180 180 180 180
1 Kuntz Leu 387 387 387 387 387 387 387 387 387 387 387 387 387 387 387 387 387
1 Kuntz Met 90 90 90 90 90 90 90 90 90 90 90 90 90 90 90 90 90
0 Kuntz Phe 0 0 0 0 0 0 0 0 0 0 0 0 0 0 0 0 0
1 Kuntz Val 167 167 167 167 167 167 167 167 167 167 167 167 167 167 167 167 167
(NH3) 0 0 0 0 0 0 0 0 0 0 0 0 0 0 0 0 0
TOTAL 8338 8884 9679 10483 11043 11340 11475 11532 11555 11564 11568 11570 11572 11576 11585 11604 11644
Steven Brandon 30 June 2004
42
Table A12 References sited by Puolanne Ruusunen and Vainionpaumlauml (2001)
Hamm R 1962 Uumlber das Wasserbindungsvermoumlgen des Saumlugetiersmuskels XII part Uumlber
das Unterschiedliche nicht auf pH-Differenzen beruhende Wasserbindungsvermoumlgen des Rindermuskels Z Lebensmittel-Untersuch und Forsch 117 p 415
Hamm R 1972 Kolloidchemie des Fleisches Paul Parey Co Berlin
Ishioroshi M Samejima K and Yasui T 1979 Heat induced gelation of myosin factors
of pH and salt concentrations Journal of Food Science 44 pp 741ndash744
Kivikari R (1996) Buffering capacity of meat Thesis University of Helsinki EKT -series 1048
Offer G and Knight P 1983 The structural basis of water-holding in meat Part 1
General principles and water uptake in meat processing In Lawrie RA Editor 1983 Developments in meat science Elsevier Applied Science London
Puolanne E and Ruusunen M 1983 Einfluss des Salzzusatzes auf das
Wasserbindungsvermoumlgen der verschiedener Fleischsortimente in Bruumlhwurst Fleischwirtschaft 62 pp 238ndash239
Warriss PD 1982 The relationship between pH45 and drip in pig muscle Journal of Food
Technology 17 pp 573ndash578
Steven Brandon 30 June 2004
43
References
1 Food The Chemistry of Its Components 2nd ed T P Coultate The Royal Society of
Chemistry London 1989 p 106 2 httpwwwaw-bccommathewsch02frameshtm 3 httpwwwaw-bccommathewsch02frameshtm 4 httpwwwneurowustleduneuromuscularmothermyosinhtm 5 httpwwwmrc-lmbcamacukmyosintreesmclasseshtml 6 Private Communication Dr J C Acton Clemson University June 3 2004 7 httpwwwaw-bccommathewsch02frameshtm 8 CHEMISTRY OF MEAT PROCESSING Animal Sciences 550 Lynn Knipe Associate
Professor Animal Sciences Food Science amp Technology The Ohio State University
September 29 2000 9 Pre-rigor injection using glycolytic inhibitors in low-quality beef muscles N C Jerez C R
Calkins and J Velazco J Anim Sci 2003 81 pp 997-1003 10 CHEMISTRY OF MEAT PROCESSING Animal Sciences 550 Lynn Knipe Associate
Professor Animal Sciences Food Science amp Technology The Ohio State University
September 29 2000 11 MAKING MEAT FROM MUSCLES httpwwwcluesabdnacuk8080mirrorsgrowthch90html 12 httpwwwsunysbedubiochemcourseslectures929bmo520html 13 Biochemistry Christopher K Mathews KE van Holde 2nd ed Menlo Park CA Benjamin
Cummings Pub Co Inc 1996 p 52 14 Biochemistry Christopher K Mathews KE van Holde 2nd ed Menlo Park CA Benjamin
Cummings Pub Co Inc 1996 p 52
Introduction to Protein Chemistry S Fox J S Foster Wiley 1957 p242 httpwwwmcukyedubiochemistryCoursesbch612powerpoint2001lecture3Lecture3_filesframehtm
16 The Science of Meat and Meat Products J F Price B S Schweigert 2nd ed Food amp
Nutrition Press Inc Westport Connecticut 1978 p106 17 Private Communication Dr J C Acton Clemson University May 31 2004 18 httpwwwmcukyedubiochemistryCoursesbch612powerpoint2001lecture3Lecture3_filesframehtm 19 The effect of net charge on the solubility activity and stability of ribonuclease Sa Kevin
L Shaw Gerald R Grimsley Gennady I Yakovlev Alexander A Makarov and C Nick Pace Protein Science (2001) 10 pp 1206-1215
20 Proteins Masterpieces of Polymer Chemistry Robert A Copeland Todayrsquos Chemist at
Work June 1992 pp 33-37 21 Food Chemistry 3rd ed Owen R Fennema Marcel-Dekker Inc New York 1996 p367 22 Water Relations of Foods R B Duckworth Academic Press New York 1975 pp 104 -
105 23 Hydration of Macromolecules III Hydration of Polypeptides ID Kuntz Journal of the
American Chemical Society Vol 93 No 2 January 27 1971 pp 514-516 24 Isoelectric Precipitation httpwwwrpiedudeptchem-engBiotech-EnvironPRECIPprecpphhtml 25 ATOMIC and IONIC RADIUS httpwwwchemguidecoukatomspropertiesatradiushtml 26 A Field Guide and Introduction to the Geology and Chemistry of Rocks and Minerals
Charles A Sorrell Golden Press Western Publishing Co Inc Racine WI 1973 p 23 27 httpwwwwouedulasphyscich412hydrolysishtm 28 httpvischemcadrecomauhtmlcdatomshtml 29 httpwwwmcukyedubiochemistryCoursesbch612powerpoint2001lecture3Lecture3_filesframehtm 30 Proteins Amino Acids and Peptides as Ions and Dipolar Ions EJ Cohn JT Edsall
Rheinhold New York NY 1942 httpwwwmcukyedubiochemistryCoursesbch612powerpoint2001lecture3Lecture3_filesframehtm
31 Biochemistry 601 Protein Solubility Purification and Analysis Last modified 82399 Dr Landry Tulane University landrymailhosttcstulaneedu httpwwwtulaneedu~biochemmedpurehtm
32 TECHNICAL BULLETIN - COOKED CURED HAM httpwwwsoloseasaltcomTechnicalTech5htm
Steven Brandon 30 June 2004
44
33 On the mechanism of water holding in meat The swelling and shrinking of myofibrils
Gerald Offer and John Trinick Meat Science Volume 8 Issue 4 1983 pp 245-281 34 Solubility of salmon myosin as affected by conformational changes at various ionic
strengths and pH Tein M Lin Jae W Park Journal of Food Science March-April 1998 v63 i2 p 215
35 Combined effects of NaCl and raw meat pH on water-holding in cooked sausage with
and without added phosphate Eero J Puolanne Marita H Ruusunen and Jukka I Vainionpaumlauml Meat Science Volume 58 Issue 1 May 2001 pp 1-7
36 Salt Effects on Ionization Equilibria of Histidines in Myoglobin Yung-Hsiang Kao Carolyn A Fitch Shibani Bhattacharya Christopher J Sarkisian Juliette T J Lecomte and
Bertrand Garciacutea-Moreno E Biophys J September 2000 Vol 79 No 3 pp 1637-1654 37 MEAT EMULSIONS C Lynn Knipe Meat Export Research Center Iowa State University
httpwwwagohio-stateedu~meatsciarchiveMEATEMULSIONShtm 38 Salt-induced swelling of meat The effect of storage time pH ion-type and
concentration Peter Wilding Nicholas Hedges and Peter J Lillford Meat Science Volume
18 Issue 1 1986 pp 55-75 39 httpenwikipediaorgwikiAmino_acidStructures 40 httpenwikipediaorgwikiAmino_acidChemical_properties
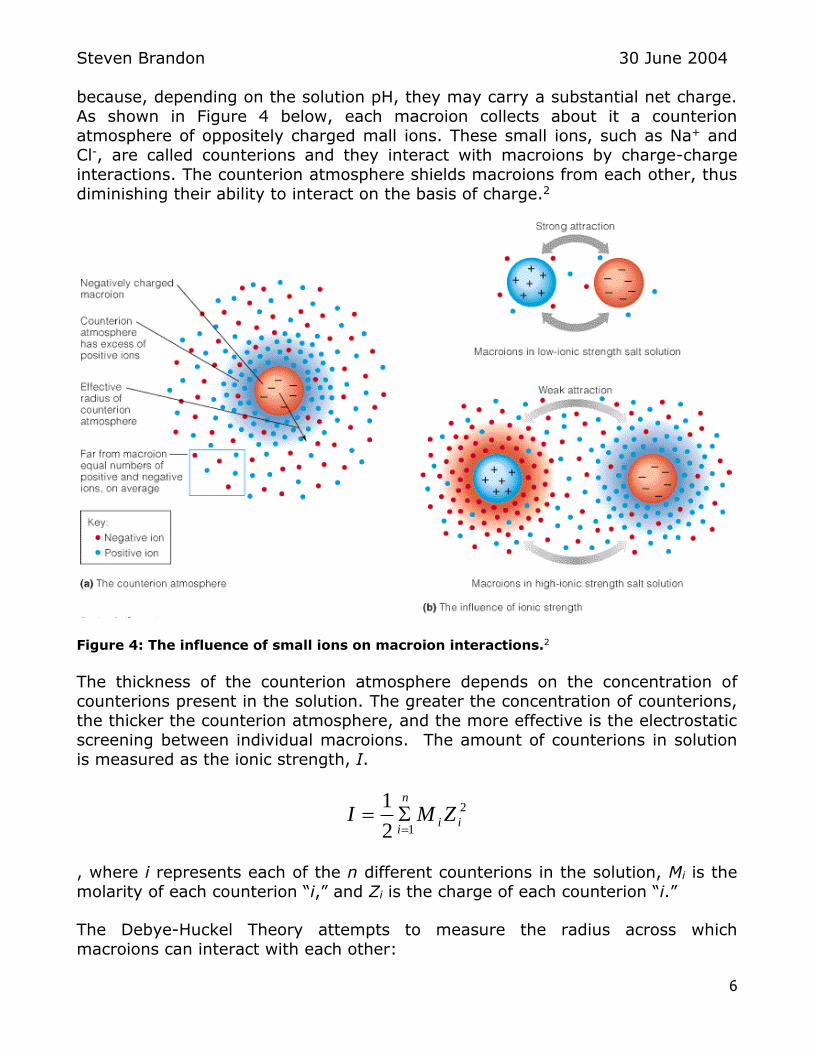
Steven Brandon 30 June 2004
18
cationic groups also bind water but to a lesser extent than the anionic groups holding only roughly half the number of water molecules compared to the anionic
groups (3 or 4 vs 6 or 7) Histidine (pKa = 604) becomes increasingly
protonated as the pH is lowered through the isoelectric point of myosin (around pH 5) gaining a positive charge Although neither Fennema nor Kuntz list
hydration data for uncharged histidine it is reasonable to assume that its water
holding capacity (WHC) behavior is similar to that of both arginine and lysine whose WHC does not change depending on whether the group is charged For
this reason the WHC due to all three basic amino acid groups remains constant
across the pH range included in my analysis
So even though the net charge of the myosin molecule is zero at the isoelectric
point (by definition) positive above the isoelectric point and negative below the
isoelectric point the total WHC of myosin as calculated from the hydration values of the individual amino acid residues comprising the myosin molecule does not show a minimum near the isoelectric point
However that does not mean that the actual WHC of myosin behaves as predicted based on an analysis of the WHC of the constituent amino acid
residues That is because this analysis ignores the effects of interactions between myosin molecules whether retained in their relative positions in the
muscle tissue structure or not (as in meat batter) Protein-protein interactions can affect WHC in two ways Firstly interactions between oppositely charged
residues of different protein molecules can effectively neutralize the net charge of
the effected groups thereby reducing WHC of both groups This effect is likely to
be minimal since the charged groups being part of the larger myosin polypeptide molecule are not free to move into position to form such
interactions Secondly and probably more significantly near the isoelectric point where the net charge of the protein is minimized the repulsion of protein
molecules due to like-charged groups is also minimized This means that near the isoelectric point the protein molecules are able to draw more closely together
thereby displacing water that is trapped by capillary action between the molecules This does not effect water that is bound to the protein by polar or
charge attraction Since the amount of water trapped between protein molecules
can be large in comparison to that chemically bound to the protein the spacing of protein molecules (due to net charge) can be expected to have a much greater
effect to the overall WHC of a meat product regardless of whether it retains the
structure of muscle tissue or not
The pH dependence on the solubility of β-lactoglobulin in water is also due to the
variation of net charge with pH (see Figure 9 below)
Steven Brandon 30 June 2004
19
Figure 9 Dependence of protein solubility on pH2
Above or below pI the molecules all have either negative or positive charges and
repel one another Protein is therefore very soluble at either acidic or basic pH At pI the net charge is zero but each molecule still carries surface patches of both
positive and negative charge The charge-charge interactions together with other
kinds of intermolecular interactions such as van der Waals forces make the molecules tend to clump together and precipitate Therefore β-lactoglobulin like
many other proteins has minimum solubility at its isoelectric point2
At low pHs proteins have a net positive charge At high pHs they have a net
negative charge due to the carboxyl on the protein backbone losing its proton
At their pI value a protein has no net charge This leads to reduced solubility because the protein is unable to interact with the medium and will then fall out of
solution24
Steven Brandon 30 June 2004
20
Effect of added NaCl
Background information on NaCl in solution
Ions arent the same size as the atoms they come from Figure 10 compares the
sizes of sodium and chloride ions with the sizes of sodium and chlorine atoms
Figure 10 Relative sizes of Na and Cl ions and atoms
Positive ions are smaller than the atoms they come from Sodium is 281 Na+ is
28 Youve lost a whole layer of electrons and the remaining 10 electrons are
pulled in by the full force of 11 protons Negative ions are bigger than the atoms they come from Chlorine is 287 Cl- is 288 Although the electrons are
still all in the 3-level the extra repulsion produced by the incoming electron causes the atom to expand There are still only 17 protons but they hold 18
electrons25 The diameter of the Na+ ion is 095 Aring which is about half that of the Cl- ion with a diameter of 181 Aring26
When sodium chloride dissolves in water the sodium and chloride ions and the
polar water molecules are strongly attracted to one another by ion-dipole
interactions The solvent molecules (water in this case) surround the ions removing them from the crystal and forming the solution As the dissolving
process proceeds the individual ions are removed from the solid surface becoming completely separate hydrated species in the solution27 Table 7 illustrates these salt ions in aqueous solution
Table 7 Hydration of chloride and sodium ions28
Hydrated
Chloride Ion
Cl-(aq)
Each ion in aqueous solution is surrounded by about six water
molecules in the inner hydration sphere These molecules exchange
rapidly with other solvent molecules
Hydrated
Sodium Ion
Na+(aq)
Each ion in aqueous solution is surrounded by about six water
molecules in the inner hydration sphere These molecules exchange
rapidly with other solvent molecules
Steven Brandon 30 June 2004
21
Salt interaction with protein
At high ionic strength protein solubility generally decreases with increasing salt
concentration due to reducing the activity of water and neutralization of surface charge This phenomenon is called ldquosalting outrdquo Each protein has a distinct
solubility profile as a function of salt concentration defined by Log S (mgmL) = β ndash KS (I2) where S is solubility I is ionic strength and KS and β are constants
Different types of salts affect the solubility of proteins to different extents (see
Figure 11 below) 29
Figure 11 Protein Solubility versus ionic strength 30
Solubility at low ionic strength increases with salt concentration This ldquosalting inrdquo
effect is explained as pairing of salt ions with charged groups of the protein
shields intramolecular repulsion Protein solubility is at a minimum near the isoelectric point (pI) of the protein 31
Salt along with phosphates improves water retention by enhancing protein
hydration NaCl increases the net charges on the protein structure helping to unfold and expose the protein surface by binding water Salt shifts the isoelectric
point to a pH of near 40 increasing the net negative charge at higher meat pH
attracting more water and thus increasing water holding capacity An optimal salt level of 25 - 28 is required to obtain maximum yield juiciness and flavor
quality32
Steven Brandon 30 June 2004
22
Clminus ions bind to the filaments and increase the electrostatic repulsive force between them A crucial factor in swelling is likely to be the removal at a critical
salt concentration of one or more transverse structural constraints in the
myofibril (probably crossbridges the M-line or the Z-line) allowing the filament lattice to expand33
Adding salt moves the pH of the isoelectric point of myosin and exposes
hydrophobic and sulfhydryl groups to the protein surface leading to loss of
helical structure according to research into the relationship between solubility and conformational changes of salmon (Oncorhynchus tshawytscha) myofibrillar
proteins These conformational changes form more surface for protein
solubilization therefore boosting its solubility34
Puolanne Ruusunen and Vainionpaumlauml (2001) of University of Helsinki gave a good review of the effects of added salt to WHC of meat The following information is
extracted from this paper35 References sited in these extracts are listed in Table A12 in the Appendix
Salt (NaCl) is added to meat products to improve their binding and water-holding
properties Chloride ions tend to penetrate into the myofilaments causing them to swell (Hamm 1972) and the sodium ions form an ion cloud around the filaments
(Offer amp Knight 1983) This results in local concentration differences which lead to
an increased osmotic pressure within the myofibrils which causes the filament lattice
to swell Simultaneously the enlargement of negative net charge within the myosin
filaments loosens the filaments and finally causes the disintegration of the filament at
an ionic strength of 08 (without added phosphate) or in 04 (with added phosphate) In sausages without added phosphate water-holding increases rather linearly to the
salt content of ca 4 (Hamm 1972) With added phosphate there is a marked
increase in water-holding in the range of 10ndash15 NaCl (Puolanne amp Ruusunen
1983) This is due to the cleavage of actomyosin bonds by phosphates thus
facilitating the swelling of the filament lattice (Offer amp Knight 1983)
Similar phenomena take place when pH increases The negative net charge of
filaments increases causing an uneven distribution of charges within the filaments Without added salt the water-holding increases as the pH rises from 50 to 90
According to Hamm (1972) there is however not a marked correlation between the
ultimate pH value and water-holding in pH values below 57 (pork) or 58 (beef)
when the same muscles of different animals are compared Animal-to-animal
differences are larger in pH values above the isoelectric point than below (Hamm 1962) Warriss (1982) however found a marked decrease in water-holding in pork
in the pH-range of 51ndash58
When salt is added the binding of chloride ions decreases with increasing pH but the
binding of sodium ions increases (Hamm 1972) As a result the maximum in water-
holding is reached by about pH 60 in meat (Hamm) or in myosin gel (Ishioroshi
Samejima amp Yasui 1979)
Steven Brandon 30 June 2004
23
Offer and Knight (1988) stress that NaCl depolymerizes the thick filament shafts by
weakening interactions between the tails presumably by favoring the exposure of
previously buried charged or andor hydrophilic groups According to Kivikari (1996)
this changes the amount and nature of titratable groups accessible to the solvent probably revealing new groups having pKa values in the pH range 60ndash69
The increase of NaCl content causes a minor shift to lower pH values but this is not
relevant in the narrow range of 05ndash25 NaCl (ca 01ndash04 M) and low pH values of
this study NaCl alone seems not to have had a statistically significant overall effect on batter pH at concentration levels of NaCl in this study On the other hand WHC
and sausage pH were clearly affected by added NaCl alone as well as in the
interaction with meat pH
All cooked sausage variables had a maximum in water-holding by 25 added NaCl The water-holding of the sausages increases with increasing pH-value up to pH 61
and a further increase causes only a minor increase This study shows that water-
holding is strongly affected by the pH of raw materials in combination with NaCl
which renders it important to keep the pH high enough to ensure a sufficiently high
level of water-holding when aiming at lowered salt additions35
The plots shown below in Figure 10 are from the paper by Puolanne Ruusunen and Vainionpaumlauml35
Figure 10 The effect of pH amp NaCl on WHC in cooked sausage WOP without WP with
added phosphate 35
Steven Brandon 30 June 2004
24
I have re-plotted their data for beef and pork without added phosphate to see
how WHC varies with pH at a range of salt contents for both beef and pork (see
Figures 11 amp 12 below) These plots show that WHC for both beef and pork increases steadily without added NaCl as the pH is raised from 55 to 60 but
shows little additional increase at pH gt 60 This observation agrees in general
with the shape of the calculated hydration curve (See Figure 7)
Water Holding Capacity of Pork
0
20
40
60
80
100
54 56 58 60 62 64 66
pH
WH
C
g H
2O
g m
eat
00 NaCl 05 NaCl 10 NaCl
15 NaCl 20 NaCl 25 NaCl
Figure 11 WHC vs pH for Pork without added phosphates
Water Holding Capacity of Beef
0
20
40
60
80
100
54 56 58 60 62 64 66
pH
WH
C
g H
2O
g m
eat
00 NaCl 05 NaCl 10 NaCl
15 NaCl 20 NaCl 25 NaCl
Figure 12 WHC vs pH for Beef without added phosphates
Steven Brandon 30 June 2004
25
Figures 11 and 12 also show that WHC increases substantially with increasing salt content at least up to 25 NaCl
Kao et al (2000) offer the following comments on the way salt affects protein hydration and other properties Proteins are surrounded by an ionic double
layer the structure and properties of which are determined by the balance
between disorganizing thermal forces and the organizing effects of electrostatic interactions and hydration at the protein-solvent interface The properties of the
double layer are influenced by the density of charged and polar groups on the
surface of a protein Therefore salt and pH effects are thermodynamically coupled Strong interactions between proteins and partially dehydrated site-
bound ions are not observed frequently The effects of salt on the stability of
proteins are frequently interpreted in terms of screening of electrostatic
interactions by the ionic strength This concept was inherited from Linderstroslashm-Lang who applied the solution of the linearized Poisson-Boltzmann equation achieved by Debye and Huumlckel less than a year after their original publication in
1923 to understand the ionization properties of proteins The understanding of the physical nature of interactions between proteins and ions continues to advance However at present there is no unifying theoretical framework based
on simple physical principles capable of accounting quantitatively and structurally for all of the different types of salt effects that have been observed in proteins36
Analysis of NaCl effects on charge and WHC of myosin
Model 1 All salt ions interact with charged side groups
I have attempted to model the screening of myosinrsquos charged surface groups by salt ions by recalculating the myosin charge inventory and total hydration as a
function of pH by assuming that the salt ions effectively neutralize the charge of oppositely charged sites Figure 13 below is an illustration of the amino acid
composition of beef myosin at pH 44 where each circle represents one amino acid residue which may be acidic basic polar or non-polar For simplicity I
have divided the total number of amino acid residues by 100 to produce this representative illustration
Acidic
Basic
Polar
Non-Polar
Figure 13 Representative illustration of myosin amino acid composition
The sodium cations (+) and chloride anions (-) are also shown in Figure 13
Here these salt ions are shown screening the charge of oppositely charged amino
acid groups in the myosin molecule
Steven Brandon 30 June 2004
26
For my analysis I selected a salt concentration of 400 moles of NaCl mole of myosin I chose this salt concentration as one sufficient to significantly affect the
behavior of myosin based on the model described above) The results of this
analysis (for beef myosin) are shown in Tables A8 and A9 in the appendix Table A8 lists the charge inventory for beef myosin with 400 moles of added NaCl
mole of myosin As described above this table assumes that the available Na+
and Cl- ions combine with oppositely charged side groups effectively neutralizing them Below pH 40 not all of the free Na+ ions are consumed in interactions
with side groups because there are too few available anionic side groups
(aspartate and glutamate) In reality these free Na+ ions would tend to compete with the cationic side groups to attract Cl- ions but I have not
attempted to account for this in my model
Figure 14 below shows the net charge of myosin versus pH in the presence of
added NaCl This analysis indicates no change in net charge pH gt 40 is the
same as was calculated without added NaCl This is because above pH 40 where all of the available salt ions are employed in interactions with myosin side groups an equal number of positive and negative charges have been neutralized
Myosin Net Charge vs pH
-500
0
500
1000
30 40 50 60 70 80 90 100
pH
Ne
t C
ha
rge
of
My
os
in
Beef Pork Rabbit
Model 1
Figure 14 Net charge of myosin versus pH in the presence of added NaCl ndash Model 1
Table A9 lists the total hydration for beef myosin with 400 moles of added NaCl
mole of myosin I assumed that all of the salt-ion-screened (neutralized) side groups would have the bind the same number of water molecules per side group
as the corresponding unionized side groups For example I assumed that an
ionized aspartate group screened by a Na+ ion would bind the same amount of water as an uncharged aspartic acid group ie 2 molecules of water per group
Steven Brandon 30 June 2004
27
in this case Since the many of the side groups hole less water when unionized (or effectively neutralized by an oppositely charged salt ion) the total hydration
of myosin is lower than was calculated in the absence of added NaCl This is
illustrated in Figure 15 below which shows the calculated total hydration of myosin versus pH in the presence of added NaCl
Myosin Hydration vs pH
6000
7000
8000
9000
10000
11000
12000
30 40 50 60 70 80 90 100
pH
Hy
dra
tio
n
mo
les H
2O
mo
le o
f M
yo
sin
Beef Pork Rabbit
Model 1
Figure 15 Total hydration of myosin versus pH in the presence of added NaCl - Model 1
This analysis is unsatisfactory in that it predicts no change in isoelectric point
with added salt and in that it predicts a reduction in hydration of myosin with added salt These two predictions disagree with the reported observations that
adding low concentrations of salt lowers pI and increases hydration (at pH gt pI) Back to the drawing board
Model 2 Only anions interact with cationic side groups
The WHC of a meat system is greatly affected by the addition of salt To fully
understand this effect one must consider the action of both the cation and the
anion which result from the ionization of salt These ions must be absorbed by
the protein to affect WHC The effect of salt can be explained by the fact that the chloride anion being larger would be less hydrated than the sodium cation The
less hydrated ions are drawn closer to the charged protein group due to their
smaller radii The chloride ion should therefore have more of an effect on
screening of oppositely charged groups at pH above the pI than sodium resulting
in a net increase in negative charges and a shift of the pI of muscle to lower pH values An increase in negative charges results in repulsion of the protein groups
and an enlargement of the space available for absorption within the muscle37
This assertion that chloride ions being larger are less hydrated than sodium ions does not agree with the information I found elsewhere (see Table 7)28
Steven Brandon 30 June 2004
28
which states that both ions are hydrated by about six water molecules in solution However if one considers the counterion atmosphere surrounding a
catonic macroion (see Figure 4) such as myosin below its isoelectric point it is
not unreasonable to imagine that the anionic Cl- ions are held closely to the protein molecule while the cationic Na+ ions tend to remain at a greater distance
from the protein where they can have relatively little influence on the charge
and therefore the hydration behavior of the myosin molecule Figure 16 illustrates this concept
Figure 16 Illustration of the chloride screening effect assumed in Model 2
I have repeated my analysis using the assumption that only the Cl- ions are able
to interact with (and effectively neutralize) the cationic side groups while the Na+ ions do not interact with the myosin molecule at all
Table A10 lists the net charge of beef myosin versus pH as calculated using Model
2 As indicated in this table the isoelectric point is predicted by Model 2 to shift from about pH 52 (see Table 3) to lt pH 4 Figure 17 below shows that
isoelectic points of pork and rabbit myosin have shifted to lower pH This results
from the overall reduction in net charge resulting from neutralization of a large portion of the cationic side groups by charge interactions with chloride anions
+ + + + + +
+ + ++ + + + + + + + + +
+ + + +
Na+
Cl-
Steven Brandon 30 June 2004
29
Myosin Net Charge vs pH
-1000
-500
0
500
30 40 50 60 70 80 90 100
pH
Ne
t C
ha
rge
of
My
os
in
Beef Pork Rabbit
Model 2
Figure 17 Net charge of myosin versus pH in the presence of added NaCl ndash Model 2
Table A11 lists the total hydration of beef myosin versus pH as calculated using
Model 2 Figure 17 below shows the hydration curves for beef pork and rabbit myosin calculated using Model 2
Myosin Hydration vs pH
6000
7000
8000
9000
10000
11000
12000
30 40 50 60 70 80 90 100
pH
Hy
dra
tio
n
mo
les H
2O
mo
le o
f M
yo
sin
Beef Pork Rabbit
Model 2
Figure 18 Total hydration of myosin versus pH in the presence of added NaCl - Model 2
Contrary to expectations Model 2 predicts no change in the total hydration of
beef myosin in the presence of added salt This results from the fact that the
chloride ldquoscreenedrdquo cationic side groups are assumed to hold the same number of
water molecules per side group as the ldquounscreenedrdquo cationic groups in the
Steven Brandon 30 June 2004
30
absence of salt If this model has any validity it indicates that the observed changes in hydration in the presence of added salt are the consequence of
phenomena other than salt ion ndash charged side group interactions
Comparing the total number of charged groups present in the myosin molecule at
pI in the absence of added salt about pH 52 (see Table A6) to number of
charged groups at the pI of myosin in the presence of added salt (using Model 2) about pH 39 (see Table A10) reveals a substantial reduction in the total numbers
of charged groups at pI with added salt Table 8 below lists the total numbers of
charged groups at pI with and without added salt These numbers were obtained from Tables A6 and A10 for the no salt and added salt cases respectively (I
had to interpolate between data for pH 36 and pH 40 in Table A10 to obtain the
numbers of charged groups at pI = 387 for the added salt case)
Table 8 Inventory of Anionic amp Cationic Groups with and without added salt
No Added NaCl Added NaCl
pI pH 520 pH 387 Total Anionic Groups 725 265
Total Cationic Groups 725 265
The lower numbers of charged groups in the added salt case results from the effective screening of some of these groups by salt ions This overall reduction in
the number of charged groups in myosin reduces the repulsion between
neighboring myosin molecules allowing the proteins to draw more closely
together leaving less volume available for capillary entrapped water This is supported by Wilding et al (1986) who report that Rabbit longissimus dorsi
fibers were found to swell in hypertonic salt solutions such as 025 M KI or 06 M KCl to two to three times their original diameter Swelling occurs by a
combination of an increase in the myofilament lattice spacing and a loss of myofilament order However at pH below the isoelectric point of the myofibrillar proteins hypertonic salt solutions induce fiber shrinkage 38
Steven Brandon 30 June 2004
31
Appendix Table A1 Amino Acids39
Steven Brandon 30 June 2004
32
Table A2 Myosin Amino Acid Composition
Myosin aa aa aa Residuesmole aa Residue WtmoleResidues 10
5 g Symbol gmole Residues mole My Residue g mole My
Beef Pork Rabbit Beef Pork Rabbit
Aspartate D 11308
Aspartic acid 74 68 72 D 11408 333 306 325
Glutamate E 12711
Glutamic acid 97 100 103 E 12811 438 450 465
de-protonated Histidine H 13716
Histidine 14 15 15 H 13816 63 68 68
de-protonated Lysine K 12819
Lysine 107 105 85 K 12919 482 473 383
de-protonated Arginine R 15620
Arginine 42 46 41 R 15720 189 207 185
de-protonated Cysteine C 10215
Cysteine 0 0 9 C 10315 0 0 41
de-protonated Tyrosine Y 16212
Tyrosine 16 16 18 Y 16312 72 72 81
Asparagine 13 12 13 N 11410 59 54 57
Glutamine 49 50 52 Q 12814 219 225 233
Proline 26 20 22 P 9713 117 90 99
Serine 34 37 41 S 8709 153 167 185
Threonine 43 47 41 T 10112 194 212 185
Tryptophan 0 0 4 W 18623 0 0 18
Alanine 73 65 78 A 7109 329 293 351
Glycine 38 39 39 G 5707 171 176 176
Isoleucine 40 41 42 I 11318 180 185 189
Leucine 86 86 79 L 11318 387 387 356
Methionine 20 21 22 M 13121 90 95 99
Phenylalanine 27 28 27 F 14719 122 126 122
Valine 37 39 42 V 9915 167 176 189
(NH3) 106 120 86 170 477 540 387
Total residues (text) 836 837 845
Total residues (calc) 836 835 845 2318 2322 2322
Use 450000 kDa = 450000 gmole
Steven Brandon 30 June 2004
33
Table A3 Amino Acid Properties40
Abbrev Full Name Side chain
type Mass pI
pK1
(alpha -
COOH)
pK2
(alpha -+NH3)
pKr
(R) Remarks
A Ala Alanine hydrophobic 8909 611 235 987
C Cys Cysteine hydrophilic 12116 505 192 1070 837
Two cysteines can
form a disulfide
bond This enforces
tertiary structure
and such proteins as
insulin have disulfide
bonds
D Asp Aspartic acid acidic 13310 285 199 990 390
E Glu Glutamic acid acidic 14713 315 210 947 407
F Phe Phenylalanine hydrophobic 16519 549 220 931
G Gly Glycine hydrophilic 7507 606 235 978
Because of the two
hydrogen atoms at
the α carbon glycine
is not optically
active
H His Histidine basic 15516 760 180 933 604
I Ile Isoleucine hydrophobic 13117 605 232 976
K Lys Lysine basic 14619 960 216 906 1054
L Leu Leucine hydrophobic 13117 601 233 974
M Met Methionine hydrophobic 14921 574 213 928
Always the first
amino acid to be
incorporated into a
protein sometimes
removed after
translation
N Asn Asparagine hydrophilic 13212 541 214 872
P Pro Proline hydrophobic 11513 630 195 1064
Can disrupt protein
folding structures
like α helix or β
sheet
Q Gln Glutamine hydrophilic 14615 565 217 913
R Arg Arginine basic 17420 1076 182 899 1248
S Ser Serine hydrophilic 10509 568 219 921
T Thr Threonine hydrophilic 11912 560 209 910
V Val Valine hydrophobic 11715 600 239 974
W Trp Tryptophan hydrophobic 20423 589 246 941
Y Tyr Tyrosine hydrophilic 18119 564 220 921 1046
Steven Brandon 30 June 2004
34
Table A4 Fraction of Dissociated Amino Acid R-Groups by pH
Fraction of dissociated R-groups
[A-]([HA]+[A
-])
aa Dissociating Group pH pH pH pH pH pH pH pH pH pH pH pH pH pH pH pH pH
Class HA A- pKR 32 36 40 44 48 52 56 60 64 68 72 76 80 84 88 92 96
Asp-
A --COO- 390 017 033 056 076 089 095 098 099 100 100 100 100 100 100 100 100 100 Asp
-
Asp A --COOH 083 067 044 024 011 005 002 001 000 000 000 000 000 000 000 000 000 Asp
Glu-
A --COO- 407 012 025 046 068 084 093 097 099 100 100 100 100 100 100 100 100 100 Glu
-
Glu A --COOH 088 075 054 032 016 007 003 001 000 000 000 000 000 000 000 000 000 Glu
His B -N 604 000 000 001 002 005 013 027 048 070 085 094 097 099 100 100 100 100 His
His+
B -NH+ 100 100 099 098 095 087 073 052 030 015 006 003 001 000 000 000 000 His
+
Lys B -NH2 1079 000 000 000 000 000 000 000 000 000 000 000 000 000 000 001 003 006 Lys
Lys+
B -NH2H+ 100 100 100 100 100 100 100 100 100 100 100 100 100 100 099 097 094 Lys
+
Arg B -NH 1248 000 000 000 000 000 000 000 000 000 000 000 000 000 000 000 000 000 Arg
Arg+
B -NHH+ 100 100 100 100 100 100 100 100 100 100 100 100 100 100 100 100 100 Arg
+
Cys-
P --S- 835 000 000 000 000 000 000 000 000 001 003 007 015 031 053 074 088 095 Cys
-
Cys P --SH 100 100 100 100 100 100 100 100 099 097 093 085 069 047 026 012 005 Cys
Tyr-
NP --O- 1013 000 000 000 000 000 000 000 000 000 000 000 000 001 002 004 011 023 Tyr
-
Tyr NP --OH 100 100 100 100 100 100 100 100 100 100 100 100 099 098 096 089 077 Tyr
Steven Brandon 30 June 2004
35
Table A5 Beef Myosin Amino Acid Composition by pH
Myosin
Amino Acid Residues mole of Myosin
Beef Pork
pH 32 pH 36 pH 40 pH 44 pH 48 pH 52 pH 56 pH 60 pH 64 pH 68 pH 72 pH 76 pH 80 pH 84 pH 88 pH 92 pH 96
Asp-
55 111 185 253 296 317 326 330 332 332 333 333 333 333 333 333 333
Asp 277 222 147 80 37 16 7 3 1 0 0 0 0 0 0 0 0
Glu-
52 111 201 298 369 408 425 433 436 437 438 438 438 438 438 438 438
Glu 386 327 237 140 69 30 13 5 2 1 0 0 0 0 0 0 0
His 0 0 1 1 3 8 17 30 44 54 59 61 62 63 63 63 63
His+
63 63 62 62 60 55 46 33 19 9 4 2 1 0 0 0 0
Lys 0 0 0 0 0 0 0 0 0 0 0 0 1 2 5 12 29
Lys+
481 481 481 481 481 481 481 481 481 481 481 481 481 480 477 469 452
Arg 0 0 0 0 0 0 0 0 0 0 0 0 0 0 0 0 0
Arg+
189 189 189 189 189 189 189 189 189 189 189 189 189 189 189 189 189
Cys-
0 0 0 0 0 0 0 0 0 0 0 0 0 0 0 0 0
Cys 0 0 0 0 0 0 0 0 0 0 0 0 0 0 0 0 0
Tyr-
0 0 0 0 0 0 0 0 0 0 0 0 1 1 3 8 16
Tyr 72 72 72 72 72 72 72 72 72 72 72 72 71 71 69 64 56
Asn 59 59 59 59 59 59 59 59 59 59 59 59 59 59 59 59 59
Gln 219 219 219 219 219 219 219 219 219 219 219 219 219 219 219 219 219
Pro 117 117 117 117 117 117 117 117 117 117 117 117 117 117 117 117 117
Ser 153 153 153 153 153 153 153 153 153 153 153 153 153 153 153 153 153
Thr 194 194 194 194 194 194 194 194 194 194 194 194 194 194 194 194 194
Trp 0 0 0 0 0 0 0 0 0 0 0 0 0 0 0 0 0
Ala 329 329 329 329 329 329 329 329 329 329 329 329 329 329 329 329 329
Gly 171 171 171 171 171 171 171 171 171 171 171 171 171 171 171 171 171
Ile 180 180 180 180 180 180 180 180 180 180 180 180 180 180 180 180 180
Leu 387 387 387 387 387 387 387 387 387 387 387 387 387 387 387 387 387
Met 90 90 90 90 90 90 90 90 90 90 90 90 90 90 90 90 90
Phe 122 122 122 122 122 122 122 122 122 122 122 122 122 122 122 122 122
Val 167 167 167 167 167 167 167 167 167 167 167 167 167 167 167 167 167
(NH3) 477 477 477 477 477 477 477 477 477 477 477 477 477 477 477 477 477
Total residues (calc) 3762 3762 3762 3762 3762 3762 3762 3762 3762 3762 3762 3762 3762 3762 3762 3762 3762
Steven Brandon 30 June 2004
36
Table A6 Charge Inventory of Beef Myosin by pH
Myosin
Residue Charge Charge Inventory
Beef Pork
pH 32 pH 36 pH 40 pH 44 pH 48 pH 52 pH 56 pH 60 pH 64 pH 68 pH 72 pH 76 pH 80 pH 84 pH 88 pH 92 pH 96
-1 Asp-
-55 -111 -185 -253 -296 -317 -326 -330 -332 -332 -333 -333 -333 -333 -333 -333 -333
0 Asp 0 0 0 0 0 0 0 0 0 0 0 0 0 0 0 0 0
-1 Glu-
-52 -111 -201 -298 -369 -408 -425 -433 -436 -437 -438 -438 -438 -438 -438 -438 -438
0 Glu 0 0 0 0 0 0 0 0 0 0 0 0 0 0 0 0 0
0 His 0 0 0 0 0 0 0 0 0 0 0 0 0 0 0 0 0
1 His+
63 63 62 62 60 55 46 33 19 9 4 2 1 0 0 0 0
0 Lys 0 0 0 0 0 0 0 0 0 0 0 0 0 0 0 0 0
1 Lys+
481 481 481 481 481 481 481 481 481 481 481 481 481 480 477 469 452
0 Arg 0 0 0 0 0 0 0 0 0 0 0 0 0 0 0 0 0
1 Arg+
189 189 189 189 189 189 189 189 189 189 189 189 189 189 189 189 189
-1 Cys-
0 0 0 0 0 0 0 0 0 0 0 0 0 0 0 0 0
0 Cys 0 0 0 0 0 0 0 0 0 0 0 0 0 0 0 0 0
-1 Tyr-
0 0 0 0 0 0 0 0 0 0 0 0 -1 -1 -3 -8 -16
0 Tyr 0 0 0 0 0 0 0 0 0 0 0 0 0 0 0 0 0
0 Asn 0 0 0 0 0 0 0 0 0 0 0 0 0 0 0 0 0
0 Gln 0 0 0 0 0 0 0 0 0 0 0 0 0 0 0 0 0
0 Pro 0 0 0 0 0 0 0 0 0 0 0 0 0 0 0 0 0
0 Ser 0 0 0 0 0 0 0 0 0 0 0 0 0 0 0 0 0
0 The 0 0 0 0 0 0 0 0 0 0 0 0 0 0 0 0 0
0 Trp 0 0 0 0 0 0 0 0 0 0 0 0 0 0 0 0 0
0 Ala 0 0 0 0 0 0 0 0 0 0 0 0 0 0 0 0 0
0 Gly 0 0 0 0 0 0 0 0 0 0 0 0 0 0 0 0 0
0 Ile 0 0 0 0 0 0 0 0 0 0 0 0 0 0 0 0 0
0 Leu 0 0 0 0 0 0 0 0 0 0 0 0 0 0 0 0 0
0 Met 0 0 0 0 0 0 0 0 0 0 0 0 0 0 0 0 0
0 Phe 0 0 0 0 0 0 0 0 0 0 0 0 0 0 0 0 0
0 Val 0 0 0 0 0 0 0 0 0 0 0 0 0 0 0 0 0
0 (NH3) 0 0 0 0 0 0 0 0 0 0 0 0 0 0 0 0 0
TOTAL 626 511 346 181 65 1 -35 -60 -78 -90 -96 -99 -101 -103 -108 -120 -146
Steven Brandon 30 June 2004
37
Table A7 Beef Myosin Hydration by pH
Source Myosin
Hydration moles of H2O mole of Myosin
moles H2OMole of Residue Beef Pork
pH 32 pH 36 pH 40 pH 44 pH 48 pH 52 pH 56 pH 60 pH 64 pH 68 pH 72 pH 76 pH 80 pH 84 pH 88 pH 92 pH 96
60 Kuntz Asp-
332 667 1113 1517 1773 1901 1958 1981 1990 1994 1996 1996 1996 1997 1997 1997 1997
20 Kuntz Asp 555 443 295 160 74 32 13 5 2 1 0 0 0 0 0 0 0
75 Kuntz Glu-
390 831 1510 2238 2769 3058 3191 3247 3270 3279 3283 3284 3285 3285 3285 3285 3285
20 Kuntz Glu 772 654 473 279 138 60 25 10 4 2 1 0 0 0 0 0 0
40 best guess His 0 1 2 6 14 32 67 120 175 215 236 245 249 251 252 252 252
40 Kuntz His+
252 251 250 246 238 220 185 132 77 37 16 7 3 1 0 0 0
45 Kuntz Lys 0 0 0 0 0 0 0 0 0 0 1 1 4 9 22 54 131
45 Kuntz Lys+
2167 2167 2167 2167 2167 2167 2167 2167 2167 2167 2166 2165 2163 2158 2145 2112 2035
30 Kuntz Arg 0 0 0 0 0 0 0 0 0 0 0 0 0 0 0 0 1
30 Kuntz Arg+
567 567 567 567 567 567 567 567 567 567 567 567 567 567 567 567 566
20 best guess Cys-
0 0 0 0 0 0 0 0 0 0 0 0 0 0 0 0 0
10 Kuntz Cys 0 0 0 0 0 0 0 0 0 0 0 0 0 0 0 0 0
75 Kuntz Tyr-
0 0 0 0 0 0 0 0 0 0 1 2 4 10 24 57 123
30 Kuntz Tyr 216 216 216 216 216 216 216 216 216 216 216 215 214 212 206 193 167
20 Kuntz Asn 117 117 117 117 117 117 117 117 117 117 117 117 117 117 117 117 117
20 Kuntz Gln 438 438 438 438 438 438 438 438 438 438 438 438 438 438 438 438 438
30 Kuntz Pro 351 351 351 351 351 351 351 351 351 351 351 351 351 351 351 351 351
20 Kuntz Ser 306 306 306 306 306 306 306 306 306 306 306 306 306 306 306 306 306
20 Kuntz The 387 387 387 387 387 387 387 387 387 387 387 387 387 387 387 387 387
20 Kuntz Trp 0 0 0 0 0 0 0 0 0 0 0 0 0 0 0 0 0
15 Kuntz Ala 493 493 493 493 493 493 493 493 493 493 493 493 493 493 493 493 493
10 Kuntz Gly 171 171 171 171 171 171 171 171 171 171 171 171 171 171 171 171 171
10 Kuntz Ile 180 180 180 180 180 180 180 180 180 180 180 180 180 180 180 180 180
10 Kuntz Leu 387 387 387 387 387 387 387 387 387 387 387 387 387 387 387 387 387
10 Kuntz Met 90 90 90 90 90 90 90 90 90 90 90 90 90 90 90 90 90
00 Kuntz Phe 0 0 0 0 0 0 0 0 0 0 0 0 0 0 0 0 0
10 Kuntz Val 167 167 167 167 167 167 167 167 167 167 167 167 167 167 167 167 167
(NH3) 0 0 0 0 0 0 0 0 0 0 0 0 0 0 0 0 0
TOTAL 8338 8884 9679 10483 11043 11340 11475 11532 11555 11564 11568 11570 11572 11576 11585 11604 11644
Steven Brandon 30 June 2004
38
Table A8 Charge Inventory of Beef Myosin by pH with 400 moles of NaCl mole of myosin ndash Model 1 Myosin
Residue Charge Charge Inventory
Beef Pork
pH 32 pH 36 pH 40 pH 44 pH 48 pH 52 pH 56 pH 60 pH 64 pH 68 pH 72 pH 76 pH 80 pH 84 pH 88 pH 92 pH 96
0 Na Asp 0 0 0 0 0 0 0 0 0 0 0 0 0 0 0 0 0
-1 Asp-
0 0 0 -69 -118 -142 -153 -157 -159 -160 -160 -160 -160 -160 -161 -162 -164
0 Asp 0 0 0 0 0 0 0 0 0 0 0 0 0 0 0 0 0
0 Na Glu 0 0 0 0 0 0 0 0 0 0 0 0 0 0 0 0 0
-1 Glu-
0 0 0 -82 -147 -183 -199 -206 -209 -210 -210 -211 -211 -211 -212 -213 -215
0 Glu 0 0 0 0 0 0 0 0 0 0 0 0 0 0 0 0 0
0 His Cl 0 0 0 0 0 0 0 0 0 0 0 0 0 0 0 0 0
0 His 0 0 0 0 0 0 0 0 0 0 0 0 0 0 0 0 0
1 His+
29 29 28 28 27 25 20 14 8 4 2 1 0 0 0 0 0
0 Lys Cl 0 0 0 0 0 0 0 0 0 0 0 0 0 0 0 0 0
0 Lys 0 0 0 0 0 0 0 0 0 0 0 0 0 0 0 0 0
1 Lys+
219 219 219 218 218 216 213 208 202 198 196 195 194 193 190 184 170
0 Arg Cl 0 0 0 0 0 0 0 0 0 0 0 0 0 0 0 0 0
0 Arg 0 0 0 0 0 0 0 0 0 0 0 0 0 0 0 0 0
1 Arg+
86 86 86 86 85 85 84 82 79 78 77 76 76 76 75 74 71
0 Na Cys 0 0 0 0 0 0 0 0 0 0 0 0 0 0 0 0 0
-1 Cys-
0 0 0 0 0 0 0 0 0 0 0 0 0 0 0 0 0
0 Cys 0 0 0 0 0 0 0 0 0 0 0 0 0 0 0 0 0
0 Na Tyr 0 0 0 0 0 0 0 0 0 0 0 0 0 0 0 0 0
-1 Tyr-
0 0 0 0 0 0 0 0 0 0 0 0 0 -1 -2 -4 -8
0 Tyr 0 0 0 0 0 0 0 0 0 0 0 0 0 0 0 0 0
0 Asn 0 0 0 0 0 0 0 0 0 0 0 0 0 0 0 0 0
0 Gln 0 0 0 0 0 0 0 0 0 0 0 0 0 0 0 0 0
0 Pro 0 0 0 0 0 0 0 0 0 0 0 0 0 0 0 0 0
0 Ser 0 0 0 0 0 0 0 0 0 0 0 0 0 0 0 0 0
0 Thr 0 0 0 0 0 0 0 0 0 0 0 0 0 0 0 0 0
0 Trp 0 0 0 0 0 0 0 0 0 0 0 0 0 0 0 0 0
0 Ala 0 0 0 0 0 0 0 0 0 0 0 0 0 0 0 0 0
0 Gly 0 0 0 0 0 0 0 0 0 0 0 0 0 0 0 0 0
0 Ile 0 0 0 0 0 0 0 0 0 0 0 0 0 0 0 0 0
0 Leu 0 0 0 0 0 0 0 0 0 0 0 0 0 0 0 0 0
0 Met 0 0 0 0 0 0 0 0 0 0 0 0 0 0 0 0 0
0 Phe 0 0 0 0 0 0 0 0 0 0 0 0 0 0 0 0 0
0 Val 0 0 0 0 0 0 0 0 0 0 0 0 0 0 0 0 0
0 (NH3) 0 0 0 0 0 0 0 0 0 0 0 0 0 0 0 0 0
TOTAL 333 333 333 181 65 1 -35 -60 -78 -90 -96 -99 -101 -103 -108 -120 -146
Steven Brandon 30 June 2004
39
Table A9 Beef Myosin Hydration by pH with 400 moles of NaCl mole of myosin ndash Model 1
Myosin
Hydration moles of H2O mole of Myosin
moles H2OMole of Residue Beef Pork
pH 32 pH 36 pH 40 pH 44 pH 48 pH 52 pH 56 pH 60 pH 64 pH 68 pH 72 pH 76 pH 80 pH 84 pH 88 pH 92 pH 96
2 best guess Na Asp 111 222 371 367 356 350 347 346 346 345 345 345 345 345 344 342 338
6 Kuntz Asp-
0 0 0 416 706 852 916 943 953 958 959 960 961 962 965 971 982
2 Kuntz Asp 555 443 295 160 74 32 13 5 2 1 0 0 0 0 0 0 0
2 best guess Na Glu 104 222 403 433 444 450 453 454 454 454 455 454 454 454 453 450 445
75 Kuntz Glu-
0 0 0 614 1103 1370 1493 1545 1566 1575 1578 1580 1581 1583 1587 1597 1616
2 Kuntz Glu 772 654 473 279 138 60 25 10 4 2 1 0 0 0 0 0 0
4 best guess His Cl 137 137 136 135 131 121 103 75 44 22 10 4 2 1 0 0 0
4 best guess His 0 1 2 6 14 32 67 120 175 215 236 245 249 251 252 252 252
4 Kuntz His+
114 114 113 112 108 99 82 57 32 15 7 3 1 0 0 0 0
45 best guess Lys Cl 1182 1182 1183 1184 1187 1195 1209 1232 1257 1275 1285 1289 1291 1291 1289 1283 1270
45 Kuntz Lys 0 0 0 0 0 0 0 0 0 0 1 1 4 9 22 54 131
45 Kuntz Lys+
985 985 984 983 980 972 957 935 910 892 881 876 873 867 856 829 765
3 best guess Arg Cl 309 309 309 310 311 313 316 322 329 334 336 338 338 339 341 344 353
3 Kuntz Arg 0 0 0 0 0 0 0 0 0 0 0 0 0 0 0 0 1
3 Kuntz Arg+
258 258 258 257 256 254 251 245 238 233 231 229 229 228 226 222 213
1 best guess Na Cys 0 0 0 0 0 0 0 0 0 0 0 0 0 0 0 0 0
2 best guess Cys-
0 0 0 0 0 0 0 0 0 0 0 0 0 0 0 0 0
1 Kuntz Cys 0 0 0 0 0 0 0 0 0 0 0 0 0 0 0 0 0
3 Kuntz Na Tyr 0 0 0 0 0 0 0 0 0 0 0 0 1 2 5 12 25
75 Kuntz Tyr-
0 0 0 0 0 0 0 0 0 0 0 1 2 5 12 28 61
3 Kuntz Tyr 216 216 216 216 216 216 216 216 216 216 216 215 214 212 206 193 167
2 Kuntz Asn 117 117 117 117 117 117 117 117 117 117 117 117 117 117 117 117 117
2 Kuntz Gln 438 438 438 438 438 438 438 438 438 438 438 438 438 438 438 438 438
3 Kuntz Pro 351 351 351 351 351 351 351 351 351 351 351 351 351 351 351 351 351
2 Kuntz Ser 306 306 306 306 306 306 306 306 306 306 306 306 306 306 306 306 306
2 Kuntz Thr 387 387 387 387 387 387 387 387 387 387 387 387 387 387 387 387 387
2 Kuntz Trp 0 0 0 0 0 0 0 0 0 0 0 0 0 0 0 0 0
15 Kuntz Ala 493 493 493 493 493 493 493 493 493 493 493 493 493 493 493 493 493
1 Kuntz Gly 171 171 171 171 171 171 171 171 171 171 171 171 171 171 171 171 171
1 Kuntz Ile 180 180 180 180 180 180 180 180 180 180 180 180 180 180 180 180 180
1 Kuntz Leu 387 387 387 387 387 387 387 387 387 387 387 387 387 387 387 387 387
1 Kuntz Met 90 90 90 90 90 90 90 90 90 90 90 90 90 90 90 90 90
0 Kuntz Phe 0 0 0 0 0 0 0 0 0 0 0 0 0 0 0 0 0
1 Kuntz Val 167 167 167 167 167 167 167 167 167 167 167 167 167 167 167 167 167
(NH3) 0 0 0 0 0 0 0 0 0 0 0 0 0 0 0 0 0
TOTAL 7830 7830 7830 8558 9110 9403 9535 9591 9614 9623 9627 9629 9631 9635 9644 9665 9706
Steven Brandon 30 June 2004
40
Table A10 Charge Inventory of Beef Myosin by pH with 400 moles of NaCl mole of myosin ndash Model 2
Myosin
Residue Charge Charge Inventory
Beef Pork
pH 32 pH 36 pH 40 pH 44 pH 48 pH 52 pH 56 pH 60 pH 64 pH 68 pH 72 pH 76 pH 80 pH 84 pH 88 pH 92 pH 96
-1 Asp-
-55 -111 -185 -253 -296 -317 -326 -330 -332 -332 -333 -333 -333 -333 -333 -333 -333
0 Asp 0 0 0 0 0 0 0 0 0 0 0 0 0 0 0 0 0
-1 Glu-
-52 -111 -201 -298 -369 -408 -425 -433 -436 -437 -438 -438 -438 -438 -438 -438 -438
0 Glu 0 0 0 0 0 0 0 0 0 0 0 0 0 0 0 0 0
0 His Cl 0 0 0 0 0 0 0 0 0 0 0 0 0 0 0 0 0
0 His 0 0 0 0 0 0 0 0 0 0 0 0 0 0 0 0 0
1 His+
29 29 28 28 27 25 20 14 8 4 2 1 0 0 0 0 0
0 Lys Cl 0 0 0 0 0 0 0 0 0 0 0 0 0 0 0 0 0
0 Lys 0 0 0 0 0 0 0 0 0 0 0 0 0 0 0 0 0
1 Lys+
219 219 219 218 218 216 213 208 202 198 196 195 194 193 190 184 170
0 Arg Cl 0 0 0 0 0 0 0 0 0 0 0 0 0 0 0 0 0
0 Arg 0 0 0 0 0 0 0 0 0 0 0 0 0 0 0 0 0
1 Arg+
86 86 86 86 85 85 84 82 79 78 77 76 76 76 75 74 71
-1 Cys-
0 0 0 0 0 0 0 0 0 0 0 0 0 0 0 0 0
0 Cys 0 0 0 0 0 0 0 0 0 0 0 0 0 0 0 0 0
-1 Tyr-
0 0 0 0 0 0 0 0 0 0 0 0 -1 -1 -3 -8 -16
0 Tyr 0 0 0 0 0 0 0 0 0 0 0 0 0 0 0 0 0
0 Asn 0 0 0 0 0 0 0 0 0 0 0 0 0 0 0 0 0
0 Gln 0 0 0 0 0 0 0 0 0 0 0 0 0 0 0 0 0
0 Pro 0 0 0 0 0 0 0 0 0 0 0 0 0 0 0 0 0
0 Ser 0 0 0 0 0 0 0 0 0 0 0 0 0 0 0 0 0
0 Thr 0 0 0 0 0 0 0 0 0 0 0 0 0 0 0 0 0
0 Trp 0 0 0 0 0 0 0 0 0 0 0 0 0 0 0 0 0
0 Ala 0 0 0 0 0 0 0 0 0 0 0 0 0 0 0 0 0
0 Gly 0 0 0 0 0 0 0 0 0 0 0 0 0 0 0 0 0
0 Ile 0 0 0 0 0 0 0 0 0 0 0 0 0 0 0 0 0
0 Leu 0 0 0 0 0 0 0 0 0 0 0 0 0 0 0 0 0
0 Met 0 0 0 0 0 0 0 0 0 0 0 0 0 0 0 0 0
0 Phe 0 0 0 0 0 0 0 0 0 0 0 0 0 0 0 0 0
0 Val 0 0 0 0 0 0 0 0 0 0 0 0 0 0 0 0 0
0 (NH3) 0 0 0 0 0 0 0 0 0 0 0 0 0 0 0 0 0
TOTAL 226 111 -54 -219 -335 -399 -435 -460 -478 -490 -496 -499 -501 -503 -508 -520 -546
Steven Brandon 30 June 2004
41
Table A11 Beef Myosin Hydration by pH with 400 moles of NaCl mole of myosin ndash Model 2
Myosin
Hydration moles of H2O mole of Myosin
moles H2OMole of Residue Beef Pork
pH 32 pH 36 pH 40 pH 44 pH 48 pH 52 pH 56 pH 60 pH 64 pH 68 pH 72 pH 76 pH 80 pH 84 pH 88 pH 92 pH 96
6 Kuntz Asp-
332 667 1113 1517 1773 1901 1958 1981 1990 1994 1996 1996 1996 1997 1997 1997 1997
2 Kuntz Asp 555 443 295 160 74 32 13 5 2 1 0 0 0 0 0 0 0
75 Kuntz Glu-
390 831 1510 2238 2769 3058 3191 3247 3270 3279 3283 3284 3285 3285 3285 3285 3285
2 Kuntz Glu 772 654 473 279 138 60 25 10 4 2 1 0 0 0 0 0 0
4 best guess His Cl 137 137 136 135 131 121 103 75 44 22 10 4 2 1 0 0 0
4 best guess His 0 1 2 6 14 32 67 120 175 215 236 245 249 251 252 252 252
4 Kuntz His+
114 114 113 112 108 99 82 57 32 15 7 3 1 0 0 0 0
45 best guess Lys Cl 1182 1182 1183 1184 1187 1195 1209 1232 1257 1275 1285 1289 1291 1291 1289 1283 1270
45 Kuntz Lys 0 0 0 0 0 0 0 0 0 0 1 1 4 9 22 54 131
45 Kuntz Lys+
985 985 984 983 980 972 957 935 910 892 881 876 873 867 856 829 765
3 best guess Arg Cl 309 309 309 310 311 313 316 322 329 334 336 338 338 339 341 344 353
3 Kuntz Arg 0 0 0 0 0 0 0 0 0 0 0 0 0 0 0 0 1
3 Kuntz Arg+
258 258 258 257 256 254 251 245 238 233 231 229 229 228 226 222 213
2 best guess Cys-
0 0 0 0 0 0 0 0 0 0 0 0 0 0 0 0 0
1 Kuntz Cys 0 0 0 0 0 0 0 0 0 0 0 0 0 0 0 0 0
75 Kuntz Tyr-
0 0 0 0 0 0 0 0 0 0 1 2 4 10 24 57 123
3 Kuntz Tyr 216 216 216 216 216 216 216 216 216 216 216 215 214 212 206 193 167
2 Kuntz Asn 117 117 117 117 117 117 117 117 117 117 117 117 117 117 117 117 117
2 Kuntz Gln 438 438 438 438 438 438 438 438 438 438 438 438 438 438 438 438 438
3 Kuntz Pro 351 351 351 351 351 351 351 351 351 351 351 351 351 351 351 351 351
2 Kuntz Ser 306 306 306 306 306 306 306 306 306 306 306 306 306 306 306 306 306
2 Kuntz Thr 387 387 387 387 387 387 387 387 387 387 387 387 387 387 387 387 387
2 Kuntz Trp 0 0 0 0 0 0 0 0 0 0 0 0 0 0 0 0 0
15 Kuntz Ala 493 493 493 493 493 493 493 493 493 493 493 493 493 493 493 493 493
1 Kuntz Gly 171 171 171 171 171 171 171 171 171 171 171 171 171 171 171 171 171
1 Kuntz Ile 180 180 180 180 180 180 180 180 180 180 180 180 180 180 180 180 180
1 Kuntz Leu 387 387 387 387 387 387 387 387 387 387 387 387 387 387 387 387 387
1 Kuntz Met 90 90 90 90 90 90 90 90 90 90 90 90 90 90 90 90 90
0 Kuntz Phe 0 0 0 0 0 0 0 0 0 0 0 0 0 0 0 0 0
1 Kuntz Val 167 167 167 167 167 167 167 167 167 167 167 167 167 167 167 167 167
(NH3) 0 0 0 0 0 0 0 0 0 0 0 0 0 0 0 0 0
TOTAL 8338 8884 9679 10483 11043 11340 11475 11532 11555 11564 11568 11570 11572 11576 11585 11604 11644
Steven Brandon 30 June 2004
42
Table A12 References sited by Puolanne Ruusunen and Vainionpaumlauml (2001)
Hamm R 1962 Uumlber das Wasserbindungsvermoumlgen des Saumlugetiersmuskels XII part Uumlber
das Unterschiedliche nicht auf pH-Differenzen beruhende Wasserbindungsvermoumlgen des Rindermuskels Z Lebensmittel-Untersuch und Forsch 117 p 415
Hamm R 1972 Kolloidchemie des Fleisches Paul Parey Co Berlin
Ishioroshi M Samejima K and Yasui T 1979 Heat induced gelation of myosin factors
of pH and salt concentrations Journal of Food Science 44 pp 741ndash744
Kivikari R (1996) Buffering capacity of meat Thesis University of Helsinki EKT -series 1048
Offer G and Knight P 1983 The structural basis of water-holding in meat Part 1
General principles and water uptake in meat processing In Lawrie RA Editor 1983 Developments in meat science Elsevier Applied Science London
Puolanne E and Ruusunen M 1983 Einfluss des Salzzusatzes auf das
Wasserbindungsvermoumlgen der verschiedener Fleischsortimente in Bruumlhwurst Fleischwirtschaft 62 pp 238ndash239
Warriss PD 1982 The relationship between pH45 and drip in pig muscle Journal of Food
Technology 17 pp 573ndash578
Steven Brandon 30 June 2004
43
References
1 Food The Chemistry of Its Components 2nd ed T P Coultate The Royal Society of
Chemistry London 1989 p 106 2 httpwwwaw-bccommathewsch02frameshtm 3 httpwwwaw-bccommathewsch02frameshtm 4 httpwwwneurowustleduneuromuscularmothermyosinhtm 5 httpwwwmrc-lmbcamacukmyosintreesmclasseshtml 6 Private Communication Dr J C Acton Clemson University June 3 2004 7 httpwwwaw-bccommathewsch02frameshtm 8 CHEMISTRY OF MEAT PROCESSING Animal Sciences 550 Lynn Knipe Associate
Professor Animal Sciences Food Science amp Technology The Ohio State University
September 29 2000 9 Pre-rigor injection using glycolytic inhibitors in low-quality beef muscles N C Jerez C R
Calkins and J Velazco J Anim Sci 2003 81 pp 997-1003 10 CHEMISTRY OF MEAT PROCESSING Animal Sciences 550 Lynn Knipe Associate
Professor Animal Sciences Food Science amp Technology The Ohio State University
September 29 2000 11 MAKING MEAT FROM MUSCLES httpwwwcluesabdnacuk8080mirrorsgrowthch90html 12 httpwwwsunysbedubiochemcourseslectures929bmo520html 13 Biochemistry Christopher K Mathews KE van Holde 2nd ed Menlo Park CA Benjamin
Cummings Pub Co Inc 1996 p 52 14 Biochemistry Christopher K Mathews KE van Holde 2nd ed Menlo Park CA Benjamin
Cummings Pub Co Inc 1996 p 52
Introduction to Protein Chemistry S Fox J S Foster Wiley 1957 p242 httpwwwmcukyedubiochemistryCoursesbch612powerpoint2001lecture3Lecture3_filesframehtm
16 The Science of Meat and Meat Products J F Price B S Schweigert 2nd ed Food amp
Nutrition Press Inc Westport Connecticut 1978 p106 17 Private Communication Dr J C Acton Clemson University May 31 2004 18 httpwwwmcukyedubiochemistryCoursesbch612powerpoint2001lecture3Lecture3_filesframehtm 19 The effect of net charge on the solubility activity and stability of ribonuclease Sa Kevin
L Shaw Gerald R Grimsley Gennady I Yakovlev Alexander A Makarov and C Nick Pace Protein Science (2001) 10 pp 1206-1215
20 Proteins Masterpieces of Polymer Chemistry Robert A Copeland Todayrsquos Chemist at
Work June 1992 pp 33-37 21 Food Chemistry 3rd ed Owen R Fennema Marcel-Dekker Inc New York 1996 p367 22 Water Relations of Foods R B Duckworth Academic Press New York 1975 pp 104 -
105 23 Hydration of Macromolecules III Hydration of Polypeptides ID Kuntz Journal of the
American Chemical Society Vol 93 No 2 January 27 1971 pp 514-516 24 Isoelectric Precipitation httpwwwrpiedudeptchem-engBiotech-EnvironPRECIPprecpphhtml 25 ATOMIC and IONIC RADIUS httpwwwchemguidecoukatomspropertiesatradiushtml 26 A Field Guide and Introduction to the Geology and Chemistry of Rocks and Minerals
Charles A Sorrell Golden Press Western Publishing Co Inc Racine WI 1973 p 23 27 httpwwwwouedulasphyscich412hydrolysishtm 28 httpvischemcadrecomauhtmlcdatomshtml 29 httpwwwmcukyedubiochemistryCoursesbch612powerpoint2001lecture3Lecture3_filesframehtm 30 Proteins Amino Acids and Peptides as Ions and Dipolar Ions EJ Cohn JT Edsall
Rheinhold New York NY 1942 httpwwwmcukyedubiochemistryCoursesbch612powerpoint2001lecture3Lecture3_filesframehtm
31 Biochemistry 601 Protein Solubility Purification and Analysis Last modified 82399 Dr Landry Tulane University landrymailhosttcstulaneedu httpwwwtulaneedu~biochemmedpurehtm
32 TECHNICAL BULLETIN - COOKED CURED HAM httpwwwsoloseasaltcomTechnicalTech5htm
Steven Brandon 30 June 2004
44
33 On the mechanism of water holding in meat The swelling and shrinking of myofibrils
Gerald Offer and John Trinick Meat Science Volume 8 Issue 4 1983 pp 245-281 34 Solubility of salmon myosin as affected by conformational changes at various ionic
strengths and pH Tein M Lin Jae W Park Journal of Food Science March-April 1998 v63 i2 p 215
35 Combined effects of NaCl and raw meat pH on water-holding in cooked sausage with
and without added phosphate Eero J Puolanne Marita H Ruusunen and Jukka I Vainionpaumlauml Meat Science Volume 58 Issue 1 May 2001 pp 1-7
36 Salt Effects on Ionization Equilibria of Histidines in Myoglobin Yung-Hsiang Kao Carolyn A Fitch Shibani Bhattacharya Christopher J Sarkisian Juliette T J Lecomte and
Bertrand Garciacutea-Moreno E Biophys J September 2000 Vol 79 No 3 pp 1637-1654 37 MEAT EMULSIONS C Lynn Knipe Meat Export Research Center Iowa State University
httpwwwagohio-stateedu~meatsciarchiveMEATEMULSIONShtm 38 Salt-induced swelling of meat The effect of storage time pH ion-type and
concentration Peter Wilding Nicholas Hedges and Peter J Lillford Meat Science Volume
18 Issue 1 1986 pp 55-75 39 httpenwikipediaorgwikiAmino_acidStructures 40 httpenwikipediaorgwikiAmino_acidChemical_properties
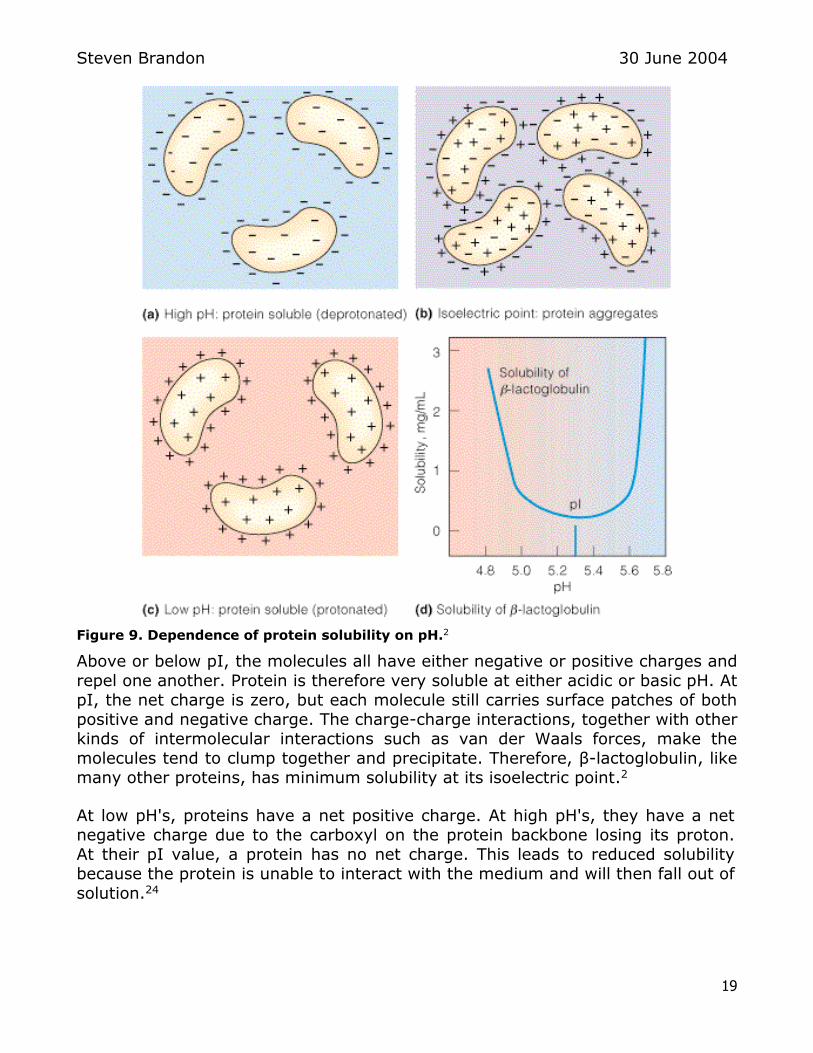
Steven Brandon 30 June 2004
20
Effect of added NaCl
Background information on NaCl in solution
Ions arent the same size as the atoms they come from Figure 10 compares the
sizes of sodium and chloride ions with the sizes of sodium and chlorine atoms
Figure 10 Relative sizes of Na and Cl ions and atoms
Positive ions are smaller than the atoms they come from Sodium is 281 Na+ is
28 Youve lost a whole layer of electrons and the remaining 10 electrons are
pulled in by the full force of 11 protons Negative ions are bigger than the atoms they come from Chlorine is 287 Cl- is 288 Although the electrons are
still all in the 3-level the extra repulsion produced by the incoming electron causes the atom to expand There are still only 17 protons but they hold 18
electrons25 The diameter of the Na+ ion is 095 Aring which is about half that of the Cl- ion with a diameter of 181 Aring26
When sodium chloride dissolves in water the sodium and chloride ions and the
polar water molecules are strongly attracted to one another by ion-dipole
interactions The solvent molecules (water in this case) surround the ions removing them from the crystal and forming the solution As the dissolving
process proceeds the individual ions are removed from the solid surface becoming completely separate hydrated species in the solution27 Table 7 illustrates these salt ions in aqueous solution
Table 7 Hydration of chloride and sodium ions28
Hydrated
Chloride Ion
Cl-(aq)
Each ion in aqueous solution is surrounded by about six water
molecules in the inner hydration sphere These molecules exchange
rapidly with other solvent molecules
Hydrated
Sodium Ion
Na+(aq)
Each ion in aqueous solution is surrounded by about six water
molecules in the inner hydration sphere These molecules exchange
rapidly with other solvent molecules
Steven Brandon 30 June 2004
21
Salt interaction with protein
At high ionic strength protein solubility generally decreases with increasing salt
concentration due to reducing the activity of water and neutralization of surface charge This phenomenon is called ldquosalting outrdquo Each protein has a distinct
solubility profile as a function of salt concentration defined by Log S (mgmL) = β ndash KS (I2) where S is solubility I is ionic strength and KS and β are constants
Different types of salts affect the solubility of proteins to different extents (see
Figure 11 below) 29
Figure 11 Protein Solubility versus ionic strength 30
Solubility at low ionic strength increases with salt concentration This ldquosalting inrdquo
effect is explained as pairing of salt ions with charged groups of the protein
shields intramolecular repulsion Protein solubility is at a minimum near the isoelectric point (pI) of the protein 31
Salt along with phosphates improves water retention by enhancing protein
hydration NaCl increases the net charges on the protein structure helping to unfold and expose the protein surface by binding water Salt shifts the isoelectric
point to a pH of near 40 increasing the net negative charge at higher meat pH
attracting more water and thus increasing water holding capacity An optimal salt level of 25 - 28 is required to obtain maximum yield juiciness and flavor
quality32
Steven Brandon 30 June 2004
22
Clminus ions bind to the filaments and increase the electrostatic repulsive force between them A crucial factor in swelling is likely to be the removal at a critical
salt concentration of one or more transverse structural constraints in the
myofibril (probably crossbridges the M-line or the Z-line) allowing the filament lattice to expand33
Adding salt moves the pH of the isoelectric point of myosin and exposes
hydrophobic and sulfhydryl groups to the protein surface leading to loss of
helical structure according to research into the relationship between solubility and conformational changes of salmon (Oncorhynchus tshawytscha) myofibrillar
proteins These conformational changes form more surface for protein
solubilization therefore boosting its solubility34
Puolanne Ruusunen and Vainionpaumlauml (2001) of University of Helsinki gave a good review of the effects of added salt to WHC of meat The following information is
extracted from this paper35 References sited in these extracts are listed in Table A12 in the Appendix
Salt (NaCl) is added to meat products to improve their binding and water-holding
properties Chloride ions tend to penetrate into the myofilaments causing them to swell (Hamm 1972) and the sodium ions form an ion cloud around the filaments
(Offer amp Knight 1983) This results in local concentration differences which lead to
an increased osmotic pressure within the myofibrils which causes the filament lattice
to swell Simultaneously the enlargement of negative net charge within the myosin
filaments loosens the filaments and finally causes the disintegration of the filament at
an ionic strength of 08 (without added phosphate) or in 04 (with added phosphate) In sausages without added phosphate water-holding increases rather linearly to the
salt content of ca 4 (Hamm 1972) With added phosphate there is a marked
increase in water-holding in the range of 10ndash15 NaCl (Puolanne amp Ruusunen
1983) This is due to the cleavage of actomyosin bonds by phosphates thus
facilitating the swelling of the filament lattice (Offer amp Knight 1983)
Similar phenomena take place when pH increases The negative net charge of
filaments increases causing an uneven distribution of charges within the filaments Without added salt the water-holding increases as the pH rises from 50 to 90
According to Hamm (1972) there is however not a marked correlation between the
ultimate pH value and water-holding in pH values below 57 (pork) or 58 (beef)
when the same muscles of different animals are compared Animal-to-animal
differences are larger in pH values above the isoelectric point than below (Hamm 1962) Warriss (1982) however found a marked decrease in water-holding in pork
in the pH-range of 51ndash58
When salt is added the binding of chloride ions decreases with increasing pH but the
binding of sodium ions increases (Hamm 1972) As a result the maximum in water-
holding is reached by about pH 60 in meat (Hamm) or in myosin gel (Ishioroshi
Samejima amp Yasui 1979)
Steven Brandon 30 June 2004
23
Offer and Knight (1988) stress that NaCl depolymerizes the thick filament shafts by
weakening interactions between the tails presumably by favoring the exposure of
previously buried charged or andor hydrophilic groups According to Kivikari (1996)
this changes the amount and nature of titratable groups accessible to the solvent probably revealing new groups having pKa values in the pH range 60ndash69
The increase of NaCl content causes a minor shift to lower pH values but this is not
relevant in the narrow range of 05ndash25 NaCl (ca 01ndash04 M) and low pH values of
this study NaCl alone seems not to have had a statistically significant overall effect on batter pH at concentration levels of NaCl in this study On the other hand WHC
and sausage pH were clearly affected by added NaCl alone as well as in the
interaction with meat pH
All cooked sausage variables had a maximum in water-holding by 25 added NaCl The water-holding of the sausages increases with increasing pH-value up to pH 61
and a further increase causes only a minor increase This study shows that water-
holding is strongly affected by the pH of raw materials in combination with NaCl
which renders it important to keep the pH high enough to ensure a sufficiently high
level of water-holding when aiming at lowered salt additions35
The plots shown below in Figure 10 are from the paper by Puolanne Ruusunen and Vainionpaumlauml35
Figure 10 The effect of pH amp NaCl on WHC in cooked sausage WOP without WP with
added phosphate 35
Steven Brandon 30 June 2004
24
I have re-plotted their data for beef and pork without added phosphate to see
how WHC varies with pH at a range of salt contents for both beef and pork (see
Figures 11 amp 12 below) These plots show that WHC for both beef and pork increases steadily without added NaCl as the pH is raised from 55 to 60 but
shows little additional increase at pH gt 60 This observation agrees in general
with the shape of the calculated hydration curve (See Figure 7)
Water Holding Capacity of Pork
0
20
40
60
80
100
54 56 58 60 62 64 66
pH
WH
C
g H
2O
g m
eat
00 NaCl 05 NaCl 10 NaCl
15 NaCl 20 NaCl 25 NaCl
Figure 11 WHC vs pH for Pork without added phosphates
Water Holding Capacity of Beef
0
20
40
60
80
100
54 56 58 60 62 64 66
pH
WH
C
g H
2O
g m
eat
00 NaCl 05 NaCl 10 NaCl
15 NaCl 20 NaCl 25 NaCl
Figure 12 WHC vs pH for Beef without added phosphates
Steven Brandon 30 June 2004
25
Figures 11 and 12 also show that WHC increases substantially with increasing salt content at least up to 25 NaCl
Kao et al (2000) offer the following comments on the way salt affects protein hydration and other properties Proteins are surrounded by an ionic double
layer the structure and properties of which are determined by the balance
between disorganizing thermal forces and the organizing effects of electrostatic interactions and hydration at the protein-solvent interface The properties of the
double layer are influenced by the density of charged and polar groups on the
surface of a protein Therefore salt and pH effects are thermodynamically coupled Strong interactions between proteins and partially dehydrated site-
bound ions are not observed frequently The effects of salt on the stability of
proteins are frequently interpreted in terms of screening of electrostatic
interactions by the ionic strength This concept was inherited from Linderstroslashm-Lang who applied the solution of the linearized Poisson-Boltzmann equation achieved by Debye and Huumlckel less than a year after their original publication in
1923 to understand the ionization properties of proteins The understanding of the physical nature of interactions between proteins and ions continues to advance However at present there is no unifying theoretical framework based
on simple physical principles capable of accounting quantitatively and structurally for all of the different types of salt effects that have been observed in proteins36
Analysis of NaCl effects on charge and WHC of myosin
Model 1 All salt ions interact with charged side groups
I have attempted to model the screening of myosinrsquos charged surface groups by salt ions by recalculating the myosin charge inventory and total hydration as a
function of pH by assuming that the salt ions effectively neutralize the charge of oppositely charged sites Figure 13 below is an illustration of the amino acid
composition of beef myosin at pH 44 where each circle represents one amino acid residue which may be acidic basic polar or non-polar For simplicity I
have divided the total number of amino acid residues by 100 to produce this representative illustration
Acidic
Basic
Polar
Non-Polar
Figure 13 Representative illustration of myosin amino acid composition
The sodium cations (+) and chloride anions (-) are also shown in Figure 13
Here these salt ions are shown screening the charge of oppositely charged amino
acid groups in the myosin molecule
Steven Brandon 30 June 2004
26
For my analysis I selected a salt concentration of 400 moles of NaCl mole of myosin I chose this salt concentration as one sufficient to significantly affect the
behavior of myosin based on the model described above) The results of this
analysis (for beef myosin) are shown in Tables A8 and A9 in the appendix Table A8 lists the charge inventory for beef myosin with 400 moles of added NaCl
mole of myosin As described above this table assumes that the available Na+
and Cl- ions combine with oppositely charged side groups effectively neutralizing them Below pH 40 not all of the free Na+ ions are consumed in interactions
with side groups because there are too few available anionic side groups
(aspartate and glutamate) In reality these free Na+ ions would tend to compete with the cationic side groups to attract Cl- ions but I have not
attempted to account for this in my model
Figure 14 below shows the net charge of myosin versus pH in the presence of
added NaCl This analysis indicates no change in net charge pH gt 40 is the
same as was calculated without added NaCl This is because above pH 40 where all of the available salt ions are employed in interactions with myosin side groups an equal number of positive and negative charges have been neutralized
Myosin Net Charge vs pH
-500
0
500
1000
30 40 50 60 70 80 90 100
pH
Ne
t C
ha
rge
of
My
os
in
Beef Pork Rabbit
Model 1
Figure 14 Net charge of myosin versus pH in the presence of added NaCl ndash Model 1
Table A9 lists the total hydration for beef myosin with 400 moles of added NaCl
mole of myosin I assumed that all of the salt-ion-screened (neutralized) side groups would have the bind the same number of water molecules per side group
as the corresponding unionized side groups For example I assumed that an
ionized aspartate group screened by a Na+ ion would bind the same amount of water as an uncharged aspartic acid group ie 2 molecules of water per group
Steven Brandon 30 June 2004
27
in this case Since the many of the side groups hole less water when unionized (or effectively neutralized by an oppositely charged salt ion) the total hydration
of myosin is lower than was calculated in the absence of added NaCl This is
illustrated in Figure 15 below which shows the calculated total hydration of myosin versus pH in the presence of added NaCl
Myosin Hydration vs pH
6000
7000
8000
9000
10000
11000
12000
30 40 50 60 70 80 90 100
pH
Hy
dra
tio
n
mo
les H
2O
mo
le o
f M
yo
sin
Beef Pork Rabbit
Model 1
Figure 15 Total hydration of myosin versus pH in the presence of added NaCl - Model 1
This analysis is unsatisfactory in that it predicts no change in isoelectric point
with added salt and in that it predicts a reduction in hydration of myosin with added salt These two predictions disagree with the reported observations that
adding low concentrations of salt lowers pI and increases hydration (at pH gt pI) Back to the drawing board
Model 2 Only anions interact with cationic side groups
The WHC of a meat system is greatly affected by the addition of salt To fully
understand this effect one must consider the action of both the cation and the
anion which result from the ionization of salt These ions must be absorbed by
the protein to affect WHC The effect of salt can be explained by the fact that the chloride anion being larger would be less hydrated than the sodium cation The
less hydrated ions are drawn closer to the charged protein group due to their
smaller radii The chloride ion should therefore have more of an effect on
screening of oppositely charged groups at pH above the pI than sodium resulting
in a net increase in negative charges and a shift of the pI of muscle to lower pH values An increase in negative charges results in repulsion of the protein groups
and an enlargement of the space available for absorption within the muscle37
This assertion that chloride ions being larger are less hydrated than sodium ions does not agree with the information I found elsewhere (see Table 7)28
Steven Brandon 30 June 2004
28
which states that both ions are hydrated by about six water molecules in solution However if one considers the counterion atmosphere surrounding a
catonic macroion (see Figure 4) such as myosin below its isoelectric point it is
not unreasonable to imagine that the anionic Cl- ions are held closely to the protein molecule while the cationic Na+ ions tend to remain at a greater distance
from the protein where they can have relatively little influence on the charge
and therefore the hydration behavior of the myosin molecule Figure 16 illustrates this concept
Figure 16 Illustration of the chloride screening effect assumed in Model 2
I have repeated my analysis using the assumption that only the Cl- ions are able
to interact with (and effectively neutralize) the cationic side groups while the Na+ ions do not interact with the myosin molecule at all
Table A10 lists the net charge of beef myosin versus pH as calculated using Model
2 As indicated in this table the isoelectric point is predicted by Model 2 to shift from about pH 52 (see Table 3) to lt pH 4 Figure 17 below shows that
isoelectic points of pork and rabbit myosin have shifted to lower pH This results
from the overall reduction in net charge resulting from neutralization of a large portion of the cationic side groups by charge interactions with chloride anions
+ + + + + +
+ + ++ + + + + + + + + +
+ + + +
Na+
Cl-
Steven Brandon 30 June 2004
29
Myosin Net Charge vs pH
-1000
-500
0
500
30 40 50 60 70 80 90 100
pH
Ne
t C
ha
rge
of
My
os
in
Beef Pork Rabbit
Model 2
Figure 17 Net charge of myosin versus pH in the presence of added NaCl ndash Model 2
Table A11 lists the total hydration of beef myosin versus pH as calculated using
Model 2 Figure 17 below shows the hydration curves for beef pork and rabbit myosin calculated using Model 2
Myosin Hydration vs pH
6000
7000
8000
9000
10000
11000
12000
30 40 50 60 70 80 90 100
pH
Hy
dra
tio
n
mo
les H
2O
mo
le o
f M
yo
sin
Beef Pork Rabbit
Model 2
Figure 18 Total hydration of myosin versus pH in the presence of added NaCl - Model 2
Contrary to expectations Model 2 predicts no change in the total hydration of
beef myosin in the presence of added salt This results from the fact that the
chloride ldquoscreenedrdquo cationic side groups are assumed to hold the same number of
water molecules per side group as the ldquounscreenedrdquo cationic groups in the
Steven Brandon 30 June 2004
30
absence of salt If this model has any validity it indicates that the observed changes in hydration in the presence of added salt are the consequence of
phenomena other than salt ion ndash charged side group interactions
Comparing the total number of charged groups present in the myosin molecule at
pI in the absence of added salt about pH 52 (see Table A6) to number of
charged groups at the pI of myosin in the presence of added salt (using Model 2) about pH 39 (see Table A10) reveals a substantial reduction in the total numbers
of charged groups at pI with added salt Table 8 below lists the total numbers of
charged groups at pI with and without added salt These numbers were obtained from Tables A6 and A10 for the no salt and added salt cases respectively (I
had to interpolate between data for pH 36 and pH 40 in Table A10 to obtain the
numbers of charged groups at pI = 387 for the added salt case)
Table 8 Inventory of Anionic amp Cationic Groups with and without added salt
No Added NaCl Added NaCl
pI pH 520 pH 387 Total Anionic Groups 725 265
Total Cationic Groups 725 265
The lower numbers of charged groups in the added salt case results from the effective screening of some of these groups by salt ions This overall reduction in
the number of charged groups in myosin reduces the repulsion between
neighboring myosin molecules allowing the proteins to draw more closely
together leaving less volume available for capillary entrapped water This is supported by Wilding et al (1986) who report that Rabbit longissimus dorsi
fibers were found to swell in hypertonic salt solutions such as 025 M KI or 06 M KCl to two to three times their original diameter Swelling occurs by a
combination of an increase in the myofilament lattice spacing and a loss of myofilament order However at pH below the isoelectric point of the myofibrillar proteins hypertonic salt solutions induce fiber shrinkage 38
Steven Brandon 30 June 2004
31
Appendix Table A1 Amino Acids39
Steven Brandon 30 June 2004
32
Table A2 Myosin Amino Acid Composition
Myosin aa aa aa Residuesmole aa Residue WtmoleResidues 10
5 g Symbol gmole Residues mole My Residue g mole My
Beef Pork Rabbit Beef Pork Rabbit
Aspartate D 11308
Aspartic acid 74 68 72 D 11408 333 306 325
Glutamate E 12711
Glutamic acid 97 100 103 E 12811 438 450 465
de-protonated Histidine H 13716
Histidine 14 15 15 H 13816 63 68 68
de-protonated Lysine K 12819
Lysine 107 105 85 K 12919 482 473 383
de-protonated Arginine R 15620
Arginine 42 46 41 R 15720 189 207 185
de-protonated Cysteine C 10215
Cysteine 0 0 9 C 10315 0 0 41
de-protonated Tyrosine Y 16212
Tyrosine 16 16 18 Y 16312 72 72 81
Asparagine 13 12 13 N 11410 59 54 57
Glutamine 49 50 52 Q 12814 219 225 233
Proline 26 20 22 P 9713 117 90 99
Serine 34 37 41 S 8709 153 167 185
Threonine 43 47 41 T 10112 194 212 185
Tryptophan 0 0 4 W 18623 0 0 18
Alanine 73 65 78 A 7109 329 293 351
Glycine 38 39 39 G 5707 171 176 176
Isoleucine 40 41 42 I 11318 180 185 189
Leucine 86 86 79 L 11318 387 387 356
Methionine 20 21 22 M 13121 90 95 99
Phenylalanine 27 28 27 F 14719 122 126 122
Valine 37 39 42 V 9915 167 176 189
(NH3) 106 120 86 170 477 540 387
Total residues (text) 836 837 845
Total residues (calc) 836 835 845 2318 2322 2322
Use 450000 kDa = 450000 gmole
Steven Brandon 30 June 2004
33
Table A3 Amino Acid Properties40
Abbrev Full Name Side chain
type Mass pI
pK1
(alpha -
COOH)
pK2
(alpha -+NH3)
pKr
(R) Remarks
A Ala Alanine hydrophobic 8909 611 235 987
C Cys Cysteine hydrophilic 12116 505 192 1070 837
Two cysteines can
form a disulfide
bond This enforces
tertiary structure
and such proteins as
insulin have disulfide
bonds
D Asp Aspartic acid acidic 13310 285 199 990 390
E Glu Glutamic acid acidic 14713 315 210 947 407
F Phe Phenylalanine hydrophobic 16519 549 220 931
G Gly Glycine hydrophilic 7507 606 235 978
Because of the two
hydrogen atoms at
the α carbon glycine
is not optically
active
H His Histidine basic 15516 760 180 933 604
I Ile Isoleucine hydrophobic 13117 605 232 976
K Lys Lysine basic 14619 960 216 906 1054
L Leu Leucine hydrophobic 13117 601 233 974
M Met Methionine hydrophobic 14921 574 213 928
Always the first
amino acid to be
incorporated into a
protein sometimes
removed after
translation
N Asn Asparagine hydrophilic 13212 541 214 872
P Pro Proline hydrophobic 11513 630 195 1064
Can disrupt protein
folding structures
like α helix or β
sheet
Q Gln Glutamine hydrophilic 14615 565 217 913
R Arg Arginine basic 17420 1076 182 899 1248
S Ser Serine hydrophilic 10509 568 219 921
T Thr Threonine hydrophilic 11912 560 209 910
V Val Valine hydrophobic 11715 600 239 974
W Trp Tryptophan hydrophobic 20423 589 246 941
Y Tyr Tyrosine hydrophilic 18119 564 220 921 1046
Steven Brandon 30 June 2004
34
Table A4 Fraction of Dissociated Amino Acid R-Groups by pH
Fraction of dissociated R-groups
[A-]([HA]+[A
-])
aa Dissociating Group pH pH pH pH pH pH pH pH pH pH pH pH pH pH pH pH pH
Class HA A- pKR 32 36 40 44 48 52 56 60 64 68 72 76 80 84 88 92 96
Asp-
A --COO- 390 017 033 056 076 089 095 098 099 100 100 100 100 100 100 100 100 100 Asp
-
Asp A --COOH 083 067 044 024 011 005 002 001 000 000 000 000 000 000 000 000 000 Asp
Glu-
A --COO- 407 012 025 046 068 084 093 097 099 100 100 100 100 100 100 100 100 100 Glu
-
Glu A --COOH 088 075 054 032 016 007 003 001 000 000 000 000 000 000 000 000 000 Glu
His B -N 604 000 000 001 002 005 013 027 048 070 085 094 097 099 100 100 100 100 His
His+
B -NH+ 100 100 099 098 095 087 073 052 030 015 006 003 001 000 000 000 000 His
+
Lys B -NH2 1079 000 000 000 000 000 000 000 000 000 000 000 000 000 000 001 003 006 Lys
Lys+
B -NH2H+ 100 100 100 100 100 100 100 100 100 100 100 100 100 100 099 097 094 Lys
+
Arg B -NH 1248 000 000 000 000 000 000 000 000 000 000 000 000 000 000 000 000 000 Arg
Arg+
B -NHH+ 100 100 100 100 100 100 100 100 100 100 100 100 100 100 100 100 100 Arg
+
Cys-
P --S- 835 000 000 000 000 000 000 000 000 001 003 007 015 031 053 074 088 095 Cys
-
Cys P --SH 100 100 100 100 100 100 100 100 099 097 093 085 069 047 026 012 005 Cys
Tyr-
NP --O- 1013 000 000 000 000 000 000 000 000 000 000 000 000 001 002 004 011 023 Tyr
-
Tyr NP --OH 100 100 100 100 100 100 100 100 100 100 100 100 099 098 096 089 077 Tyr
Steven Brandon 30 June 2004
35
Table A5 Beef Myosin Amino Acid Composition by pH
Myosin
Amino Acid Residues mole of Myosin
Beef Pork
pH 32 pH 36 pH 40 pH 44 pH 48 pH 52 pH 56 pH 60 pH 64 pH 68 pH 72 pH 76 pH 80 pH 84 pH 88 pH 92 pH 96
Asp-
55 111 185 253 296 317 326 330 332 332 333 333 333 333 333 333 333
Asp 277 222 147 80 37 16 7 3 1 0 0 0 0 0 0 0 0
Glu-
52 111 201 298 369 408 425 433 436 437 438 438 438 438 438 438 438
Glu 386 327 237 140 69 30 13 5 2 1 0 0 0 0 0 0 0
His 0 0 1 1 3 8 17 30 44 54 59 61 62 63 63 63 63
His+
63 63 62 62 60 55 46 33 19 9 4 2 1 0 0 0 0
Lys 0 0 0 0 0 0 0 0 0 0 0 0 1 2 5 12 29
Lys+
481 481 481 481 481 481 481 481 481 481 481 481 481 480 477 469 452
Arg 0 0 0 0 0 0 0 0 0 0 0 0 0 0 0 0 0
Arg+
189 189 189 189 189 189 189 189 189 189 189 189 189 189 189 189 189
Cys-
0 0 0 0 0 0 0 0 0 0 0 0 0 0 0 0 0
Cys 0 0 0 0 0 0 0 0 0 0 0 0 0 0 0 0 0
Tyr-
0 0 0 0 0 0 0 0 0 0 0 0 1 1 3 8 16
Tyr 72 72 72 72 72 72 72 72 72 72 72 72 71 71 69 64 56
Asn 59 59 59 59 59 59 59 59 59 59 59 59 59 59 59 59 59
Gln 219 219 219 219 219 219 219 219 219 219 219 219 219 219 219 219 219
Pro 117 117 117 117 117 117 117 117 117 117 117 117 117 117 117 117 117
Ser 153 153 153 153 153 153 153 153 153 153 153 153 153 153 153 153 153
Thr 194 194 194 194 194 194 194 194 194 194 194 194 194 194 194 194 194
Trp 0 0 0 0 0 0 0 0 0 0 0 0 0 0 0 0 0
Ala 329 329 329 329 329 329 329 329 329 329 329 329 329 329 329 329 329
Gly 171 171 171 171 171 171 171 171 171 171 171 171 171 171 171 171 171
Ile 180 180 180 180 180 180 180 180 180 180 180 180 180 180 180 180 180
Leu 387 387 387 387 387 387 387 387 387 387 387 387 387 387 387 387 387
Met 90 90 90 90 90 90 90 90 90 90 90 90 90 90 90 90 90
Phe 122 122 122 122 122 122 122 122 122 122 122 122 122 122 122 122 122
Val 167 167 167 167 167 167 167 167 167 167 167 167 167 167 167 167 167
(NH3) 477 477 477 477 477 477 477 477 477 477 477 477 477 477 477 477 477
Total residues (calc) 3762 3762 3762 3762 3762 3762 3762 3762 3762 3762 3762 3762 3762 3762 3762 3762 3762
Steven Brandon 30 June 2004
36
Table A6 Charge Inventory of Beef Myosin by pH
Myosin
Residue Charge Charge Inventory
Beef Pork
pH 32 pH 36 pH 40 pH 44 pH 48 pH 52 pH 56 pH 60 pH 64 pH 68 pH 72 pH 76 pH 80 pH 84 pH 88 pH 92 pH 96
-1 Asp-
-55 -111 -185 -253 -296 -317 -326 -330 -332 -332 -333 -333 -333 -333 -333 -333 -333
0 Asp 0 0 0 0 0 0 0 0 0 0 0 0 0 0 0 0 0
-1 Glu-
-52 -111 -201 -298 -369 -408 -425 -433 -436 -437 -438 -438 -438 -438 -438 -438 -438
0 Glu 0 0 0 0 0 0 0 0 0 0 0 0 0 0 0 0 0
0 His 0 0 0 0 0 0 0 0 0 0 0 0 0 0 0 0 0
1 His+
63 63 62 62 60 55 46 33 19 9 4 2 1 0 0 0 0
0 Lys 0 0 0 0 0 0 0 0 0 0 0 0 0 0 0 0 0
1 Lys+
481 481 481 481 481 481 481 481 481 481 481 481 481 480 477 469 452
0 Arg 0 0 0 0 0 0 0 0 0 0 0 0 0 0 0 0 0
1 Arg+
189 189 189 189 189 189 189 189 189 189 189 189 189 189 189 189 189
-1 Cys-
0 0 0 0 0 0 0 0 0 0 0 0 0 0 0 0 0
0 Cys 0 0 0 0 0 0 0 0 0 0 0 0 0 0 0 0 0
-1 Tyr-
0 0 0 0 0 0 0 0 0 0 0 0 -1 -1 -3 -8 -16
0 Tyr 0 0 0 0 0 0 0 0 0 0 0 0 0 0 0 0 0
0 Asn 0 0 0 0 0 0 0 0 0 0 0 0 0 0 0 0 0
0 Gln 0 0 0 0 0 0 0 0 0 0 0 0 0 0 0 0 0
0 Pro 0 0 0 0 0 0 0 0 0 0 0 0 0 0 0 0 0
0 Ser 0 0 0 0 0 0 0 0 0 0 0 0 0 0 0 0 0
0 The 0 0 0 0 0 0 0 0 0 0 0 0 0 0 0 0 0
0 Trp 0 0 0 0 0 0 0 0 0 0 0 0 0 0 0 0 0
0 Ala 0 0 0 0 0 0 0 0 0 0 0 0 0 0 0 0 0
0 Gly 0 0 0 0 0 0 0 0 0 0 0 0 0 0 0 0 0
0 Ile 0 0 0 0 0 0 0 0 0 0 0 0 0 0 0 0 0
0 Leu 0 0 0 0 0 0 0 0 0 0 0 0 0 0 0 0 0
0 Met 0 0 0 0 0 0 0 0 0 0 0 0 0 0 0 0 0
0 Phe 0 0 0 0 0 0 0 0 0 0 0 0 0 0 0 0 0
0 Val 0 0 0 0 0 0 0 0 0 0 0 0 0 0 0 0 0
0 (NH3) 0 0 0 0 0 0 0 0 0 0 0 0 0 0 0 0 0
TOTAL 626 511 346 181 65 1 -35 -60 -78 -90 -96 -99 -101 -103 -108 -120 -146
Steven Brandon 30 June 2004
37
Table A7 Beef Myosin Hydration by pH
Source Myosin
Hydration moles of H2O mole of Myosin
moles H2OMole of Residue Beef Pork
pH 32 pH 36 pH 40 pH 44 pH 48 pH 52 pH 56 pH 60 pH 64 pH 68 pH 72 pH 76 pH 80 pH 84 pH 88 pH 92 pH 96
60 Kuntz Asp-
332 667 1113 1517 1773 1901 1958 1981 1990 1994 1996 1996 1996 1997 1997 1997 1997
20 Kuntz Asp 555 443 295 160 74 32 13 5 2 1 0 0 0 0 0 0 0
75 Kuntz Glu-
390 831 1510 2238 2769 3058 3191 3247 3270 3279 3283 3284 3285 3285 3285 3285 3285
20 Kuntz Glu 772 654 473 279 138 60 25 10 4 2 1 0 0 0 0 0 0
40 best guess His 0 1 2 6 14 32 67 120 175 215 236 245 249 251 252 252 252
40 Kuntz His+
252 251 250 246 238 220 185 132 77 37 16 7 3 1 0 0 0
45 Kuntz Lys 0 0 0 0 0 0 0 0 0 0 1 1 4 9 22 54 131
45 Kuntz Lys+
2167 2167 2167 2167 2167 2167 2167 2167 2167 2167 2166 2165 2163 2158 2145 2112 2035
30 Kuntz Arg 0 0 0 0 0 0 0 0 0 0 0 0 0 0 0 0 1
30 Kuntz Arg+
567 567 567 567 567 567 567 567 567 567 567 567 567 567 567 567 566
20 best guess Cys-
0 0 0 0 0 0 0 0 0 0 0 0 0 0 0 0 0
10 Kuntz Cys 0 0 0 0 0 0 0 0 0 0 0 0 0 0 0 0 0
75 Kuntz Tyr-
0 0 0 0 0 0 0 0 0 0 1 2 4 10 24 57 123
30 Kuntz Tyr 216 216 216 216 216 216 216 216 216 216 216 215 214 212 206 193 167
20 Kuntz Asn 117 117 117 117 117 117 117 117 117 117 117 117 117 117 117 117 117
20 Kuntz Gln 438 438 438 438 438 438 438 438 438 438 438 438 438 438 438 438 438
30 Kuntz Pro 351 351 351 351 351 351 351 351 351 351 351 351 351 351 351 351 351
20 Kuntz Ser 306 306 306 306 306 306 306 306 306 306 306 306 306 306 306 306 306
20 Kuntz The 387 387 387 387 387 387 387 387 387 387 387 387 387 387 387 387 387
20 Kuntz Trp 0 0 0 0 0 0 0 0 0 0 0 0 0 0 0 0 0
15 Kuntz Ala 493 493 493 493 493 493 493 493 493 493 493 493 493 493 493 493 493
10 Kuntz Gly 171 171 171 171 171 171 171 171 171 171 171 171 171 171 171 171 171
10 Kuntz Ile 180 180 180 180 180 180 180 180 180 180 180 180 180 180 180 180 180
10 Kuntz Leu 387 387 387 387 387 387 387 387 387 387 387 387 387 387 387 387 387
10 Kuntz Met 90 90 90 90 90 90 90 90 90 90 90 90 90 90 90 90 90
00 Kuntz Phe 0 0 0 0 0 0 0 0 0 0 0 0 0 0 0 0 0
10 Kuntz Val 167 167 167 167 167 167 167 167 167 167 167 167 167 167 167 167 167
(NH3) 0 0 0 0 0 0 0 0 0 0 0 0 0 0 0 0 0
TOTAL 8338 8884 9679 10483 11043 11340 11475 11532 11555 11564 11568 11570 11572 11576 11585 11604 11644
Steven Brandon 30 June 2004
38
Table A8 Charge Inventory of Beef Myosin by pH with 400 moles of NaCl mole of myosin ndash Model 1 Myosin
Residue Charge Charge Inventory
Beef Pork
pH 32 pH 36 pH 40 pH 44 pH 48 pH 52 pH 56 pH 60 pH 64 pH 68 pH 72 pH 76 pH 80 pH 84 pH 88 pH 92 pH 96
0 Na Asp 0 0 0 0 0 0 0 0 0 0 0 0 0 0 0 0 0
-1 Asp-
0 0 0 -69 -118 -142 -153 -157 -159 -160 -160 -160 -160 -160 -161 -162 -164
0 Asp 0 0 0 0 0 0 0 0 0 0 0 0 0 0 0 0 0
0 Na Glu 0 0 0 0 0 0 0 0 0 0 0 0 0 0 0 0 0
-1 Glu-
0 0 0 -82 -147 -183 -199 -206 -209 -210 -210 -211 -211 -211 -212 -213 -215
0 Glu 0 0 0 0 0 0 0 0 0 0 0 0 0 0 0 0 0
0 His Cl 0 0 0 0 0 0 0 0 0 0 0 0 0 0 0 0 0
0 His 0 0 0 0 0 0 0 0 0 0 0 0 0 0 0 0 0
1 His+
29 29 28 28 27 25 20 14 8 4 2 1 0 0 0 0 0
0 Lys Cl 0 0 0 0 0 0 0 0 0 0 0 0 0 0 0 0 0
0 Lys 0 0 0 0 0 0 0 0 0 0 0 0 0 0 0 0 0
1 Lys+
219 219 219 218 218 216 213 208 202 198 196 195 194 193 190 184 170
0 Arg Cl 0 0 0 0 0 0 0 0 0 0 0 0 0 0 0 0 0
0 Arg 0 0 0 0 0 0 0 0 0 0 0 0 0 0 0 0 0
1 Arg+
86 86 86 86 85 85 84 82 79 78 77 76 76 76 75 74 71
0 Na Cys 0 0 0 0 0 0 0 0 0 0 0 0 0 0 0 0 0
-1 Cys-
0 0 0 0 0 0 0 0 0 0 0 0 0 0 0 0 0
0 Cys 0 0 0 0 0 0 0 0 0 0 0 0 0 0 0 0 0
0 Na Tyr 0 0 0 0 0 0 0 0 0 0 0 0 0 0 0 0 0
-1 Tyr-
0 0 0 0 0 0 0 0 0 0 0 0 0 -1 -2 -4 -8
0 Tyr 0 0 0 0 0 0 0 0 0 0 0 0 0 0 0 0 0
0 Asn 0 0 0 0 0 0 0 0 0 0 0 0 0 0 0 0 0
0 Gln 0 0 0 0 0 0 0 0 0 0 0 0 0 0 0 0 0
0 Pro 0 0 0 0 0 0 0 0 0 0 0 0 0 0 0 0 0
0 Ser 0 0 0 0 0 0 0 0 0 0 0 0 0 0 0 0 0
0 Thr 0 0 0 0 0 0 0 0 0 0 0 0 0 0 0 0 0
0 Trp 0 0 0 0 0 0 0 0 0 0 0 0 0 0 0 0 0
0 Ala 0 0 0 0 0 0 0 0 0 0 0 0 0 0 0 0 0
0 Gly 0 0 0 0 0 0 0 0 0 0 0 0 0 0 0 0 0
0 Ile 0 0 0 0 0 0 0 0 0 0 0 0 0 0 0 0 0
0 Leu 0 0 0 0 0 0 0 0 0 0 0 0 0 0 0 0 0
0 Met 0 0 0 0 0 0 0 0 0 0 0 0 0 0 0 0 0
0 Phe 0 0 0 0 0 0 0 0 0 0 0 0 0 0 0 0 0
0 Val 0 0 0 0 0 0 0 0 0 0 0 0 0 0 0 0 0
0 (NH3) 0 0 0 0 0 0 0 0 0 0 0 0 0 0 0 0 0
TOTAL 333 333 333 181 65 1 -35 -60 -78 -90 -96 -99 -101 -103 -108 -120 -146
Steven Brandon 30 June 2004
39
Table A9 Beef Myosin Hydration by pH with 400 moles of NaCl mole of myosin ndash Model 1
Myosin
Hydration moles of H2O mole of Myosin
moles H2OMole of Residue Beef Pork
pH 32 pH 36 pH 40 pH 44 pH 48 pH 52 pH 56 pH 60 pH 64 pH 68 pH 72 pH 76 pH 80 pH 84 pH 88 pH 92 pH 96
2 best guess Na Asp 111 222 371 367 356 350 347 346 346 345 345 345 345 345 344 342 338
6 Kuntz Asp-
0 0 0 416 706 852 916 943 953 958 959 960 961 962 965 971 982
2 Kuntz Asp 555 443 295 160 74 32 13 5 2 1 0 0 0 0 0 0 0
2 best guess Na Glu 104 222 403 433 444 450 453 454 454 454 455 454 454 454 453 450 445
75 Kuntz Glu-
0 0 0 614 1103 1370 1493 1545 1566 1575 1578 1580 1581 1583 1587 1597 1616
2 Kuntz Glu 772 654 473 279 138 60 25 10 4 2 1 0 0 0 0 0 0
4 best guess His Cl 137 137 136 135 131 121 103 75 44 22 10 4 2 1 0 0 0
4 best guess His 0 1 2 6 14 32 67 120 175 215 236 245 249 251 252 252 252
4 Kuntz His+
114 114 113 112 108 99 82 57 32 15 7 3 1 0 0 0 0
45 best guess Lys Cl 1182 1182 1183 1184 1187 1195 1209 1232 1257 1275 1285 1289 1291 1291 1289 1283 1270
45 Kuntz Lys 0 0 0 0 0 0 0 0 0 0 1 1 4 9 22 54 131
45 Kuntz Lys+
985 985 984 983 980 972 957 935 910 892 881 876 873 867 856 829 765
3 best guess Arg Cl 309 309 309 310 311 313 316 322 329 334 336 338 338 339 341 344 353
3 Kuntz Arg 0 0 0 0 0 0 0 0 0 0 0 0 0 0 0 0 1
3 Kuntz Arg+
258 258 258 257 256 254 251 245 238 233 231 229 229 228 226 222 213
1 best guess Na Cys 0 0 0 0 0 0 0 0 0 0 0 0 0 0 0 0 0
2 best guess Cys-
0 0 0 0 0 0 0 0 0 0 0 0 0 0 0 0 0
1 Kuntz Cys 0 0 0 0 0 0 0 0 0 0 0 0 0 0 0 0 0
3 Kuntz Na Tyr 0 0 0 0 0 0 0 0 0 0 0 0 1 2 5 12 25
75 Kuntz Tyr-
0 0 0 0 0 0 0 0 0 0 0 1 2 5 12 28 61
3 Kuntz Tyr 216 216 216 216 216 216 216 216 216 216 216 215 214 212 206 193 167
2 Kuntz Asn 117 117 117 117 117 117 117 117 117 117 117 117 117 117 117 117 117
2 Kuntz Gln 438 438 438 438 438 438 438 438 438 438 438 438 438 438 438 438 438
3 Kuntz Pro 351 351 351 351 351 351 351 351 351 351 351 351 351 351 351 351 351
2 Kuntz Ser 306 306 306 306 306 306 306 306 306 306 306 306 306 306 306 306 306
2 Kuntz Thr 387 387 387 387 387 387 387 387 387 387 387 387 387 387 387 387 387
2 Kuntz Trp 0 0 0 0 0 0 0 0 0 0 0 0 0 0 0 0 0
15 Kuntz Ala 493 493 493 493 493 493 493 493 493 493 493 493 493 493 493 493 493
1 Kuntz Gly 171 171 171 171 171 171 171 171 171 171 171 171 171 171 171 171 171
1 Kuntz Ile 180 180 180 180 180 180 180 180 180 180 180 180 180 180 180 180 180
1 Kuntz Leu 387 387 387 387 387 387 387 387 387 387 387 387 387 387 387 387 387
1 Kuntz Met 90 90 90 90 90 90 90 90 90 90 90 90 90 90 90 90 90
0 Kuntz Phe 0 0 0 0 0 0 0 0 0 0 0 0 0 0 0 0 0
1 Kuntz Val 167 167 167 167 167 167 167 167 167 167 167 167 167 167 167 167 167
(NH3) 0 0 0 0 0 0 0 0 0 0 0 0 0 0 0 0 0
TOTAL 7830 7830 7830 8558 9110 9403 9535 9591 9614 9623 9627 9629 9631 9635 9644 9665 9706
Steven Brandon 30 June 2004
40
Table A10 Charge Inventory of Beef Myosin by pH with 400 moles of NaCl mole of myosin ndash Model 2
Myosin
Residue Charge Charge Inventory
Beef Pork
pH 32 pH 36 pH 40 pH 44 pH 48 pH 52 pH 56 pH 60 pH 64 pH 68 pH 72 pH 76 pH 80 pH 84 pH 88 pH 92 pH 96
-1 Asp-
-55 -111 -185 -253 -296 -317 -326 -330 -332 -332 -333 -333 -333 -333 -333 -333 -333
0 Asp 0 0 0 0 0 0 0 0 0 0 0 0 0 0 0 0 0
-1 Glu-
-52 -111 -201 -298 -369 -408 -425 -433 -436 -437 -438 -438 -438 -438 -438 -438 -438
0 Glu 0 0 0 0 0 0 0 0 0 0 0 0 0 0 0 0 0
0 His Cl 0 0 0 0 0 0 0 0 0 0 0 0 0 0 0 0 0
0 His 0 0 0 0 0 0 0 0 0 0 0 0 0 0 0 0 0
1 His+
29 29 28 28 27 25 20 14 8 4 2 1 0 0 0 0 0
0 Lys Cl 0 0 0 0 0 0 0 0 0 0 0 0 0 0 0 0 0
0 Lys 0 0 0 0 0 0 0 0 0 0 0 0 0 0 0 0 0
1 Lys+
219 219 219 218 218 216 213 208 202 198 196 195 194 193 190 184 170
0 Arg Cl 0 0 0 0 0 0 0 0 0 0 0 0 0 0 0 0 0
0 Arg 0 0 0 0 0 0 0 0 0 0 0 0 0 0 0 0 0
1 Arg+
86 86 86 86 85 85 84 82 79 78 77 76 76 76 75 74 71
-1 Cys-
0 0 0 0 0 0 0 0 0 0 0 0 0 0 0 0 0
0 Cys 0 0 0 0 0 0 0 0 0 0 0 0 0 0 0 0 0
-1 Tyr-
0 0 0 0 0 0 0 0 0 0 0 0 -1 -1 -3 -8 -16
0 Tyr 0 0 0 0 0 0 0 0 0 0 0 0 0 0 0 0 0
0 Asn 0 0 0 0 0 0 0 0 0 0 0 0 0 0 0 0 0
0 Gln 0 0 0 0 0 0 0 0 0 0 0 0 0 0 0 0 0
0 Pro 0 0 0 0 0 0 0 0 0 0 0 0 0 0 0 0 0
0 Ser 0 0 0 0 0 0 0 0 0 0 0 0 0 0 0 0 0
0 Thr 0 0 0 0 0 0 0 0 0 0 0 0 0 0 0 0 0
0 Trp 0 0 0 0 0 0 0 0 0 0 0 0 0 0 0 0 0
0 Ala 0 0 0 0 0 0 0 0 0 0 0 0 0 0 0 0 0
0 Gly 0 0 0 0 0 0 0 0 0 0 0 0 0 0 0 0 0
0 Ile 0 0 0 0 0 0 0 0 0 0 0 0 0 0 0 0 0
0 Leu 0 0 0 0 0 0 0 0 0 0 0 0 0 0 0 0 0
0 Met 0 0 0 0 0 0 0 0 0 0 0 0 0 0 0 0 0
0 Phe 0 0 0 0 0 0 0 0 0 0 0 0 0 0 0 0 0
0 Val 0 0 0 0 0 0 0 0 0 0 0 0 0 0 0 0 0
0 (NH3) 0 0 0 0 0 0 0 0 0 0 0 0 0 0 0 0 0
TOTAL 226 111 -54 -219 -335 -399 -435 -460 -478 -490 -496 -499 -501 -503 -508 -520 -546
Steven Brandon 30 June 2004
41
Table A11 Beef Myosin Hydration by pH with 400 moles of NaCl mole of myosin ndash Model 2
Myosin
Hydration moles of H2O mole of Myosin
moles H2OMole of Residue Beef Pork
pH 32 pH 36 pH 40 pH 44 pH 48 pH 52 pH 56 pH 60 pH 64 pH 68 pH 72 pH 76 pH 80 pH 84 pH 88 pH 92 pH 96
6 Kuntz Asp-
332 667 1113 1517 1773 1901 1958 1981 1990 1994 1996 1996 1996 1997 1997 1997 1997
2 Kuntz Asp 555 443 295 160 74 32 13 5 2 1 0 0 0 0 0 0 0
75 Kuntz Glu-
390 831 1510 2238 2769 3058 3191 3247 3270 3279 3283 3284 3285 3285 3285 3285 3285
2 Kuntz Glu 772 654 473 279 138 60 25 10 4 2 1 0 0 0 0 0 0
4 best guess His Cl 137 137 136 135 131 121 103 75 44 22 10 4 2 1 0 0 0
4 best guess His 0 1 2 6 14 32 67 120 175 215 236 245 249 251 252 252 252
4 Kuntz His+
114 114 113 112 108 99 82 57 32 15 7 3 1 0 0 0 0
45 best guess Lys Cl 1182 1182 1183 1184 1187 1195 1209 1232 1257 1275 1285 1289 1291 1291 1289 1283 1270
45 Kuntz Lys 0 0 0 0 0 0 0 0 0 0 1 1 4 9 22 54 131
45 Kuntz Lys+
985 985 984 983 980 972 957 935 910 892 881 876 873 867 856 829 765
3 best guess Arg Cl 309 309 309 310 311 313 316 322 329 334 336 338 338 339 341 344 353
3 Kuntz Arg 0 0 0 0 0 0 0 0 0 0 0 0 0 0 0 0 1
3 Kuntz Arg+
258 258 258 257 256 254 251 245 238 233 231 229 229 228 226 222 213
2 best guess Cys-
0 0 0 0 0 0 0 0 0 0 0 0 0 0 0 0 0
1 Kuntz Cys 0 0 0 0 0 0 0 0 0 0 0 0 0 0 0 0 0
75 Kuntz Tyr-
0 0 0 0 0 0 0 0 0 0 1 2 4 10 24 57 123
3 Kuntz Tyr 216 216 216 216 216 216 216 216 216 216 216 215 214 212 206 193 167
2 Kuntz Asn 117 117 117 117 117 117 117 117 117 117 117 117 117 117 117 117 117
2 Kuntz Gln 438 438 438 438 438 438 438 438 438 438 438 438 438 438 438 438 438
3 Kuntz Pro 351 351 351 351 351 351 351 351 351 351 351 351 351 351 351 351 351
2 Kuntz Ser 306 306 306 306 306 306 306 306 306 306 306 306 306 306 306 306 306
2 Kuntz Thr 387 387 387 387 387 387 387 387 387 387 387 387 387 387 387 387 387
2 Kuntz Trp 0 0 0 0 0 0 0 0 0 0 0 0 0 0 0 0 0
15 Kuntz Ala 493 493 493 493 493 493 493 493 493 493 493 493 493 493 493 493 493
1 Kuntz Gly 171 171 171 171 171 171 171 171 171 171 171 171 171 171 171 171 171
1 Kuntz Ile 180 180 180 180 180 180 180 180 180 180 180 180 180 180 180 180 180
1 Kuntz Leu 387 387 387 387 387 387 387 387 387 387 387 387 387 387 387 387 387
1 Kuntz Met 90 90 90 90 90 90 90 90 90 90 90 90 90 90 90 90 90
0 Kuntz Phe 0 0 0 0 0 0 0 0 0 0 0 0 0 0 0 0 0
1 Kuntz Val 167 167 167 167 167 167 167 167 167 167 167 167 167 167 167 167 167
(NH3) 0 0 0 0 0 0 0 0 0 0 0 0 0 0 0 0 0
TOTAL 8338 8884 9679 10483 11043 11340 11475 11532 11555 11564 11568 11570 11572 11576 11585 11604 11644
Steven Brandon 30 June 2004
42
Table A12 References sited by Puolanne Ruusunen and Vainionpaumlauml (2001)
Hamm R 1962 Uumlber das Wasserbindungsvermoumlgen des Saumlugetiersmuskels XII part Uumlber
das Unterschiedliche nicht auf pH-Differenzen beruhende Wasserbindungsvermoumlgen des Rindermuskels Z Lebensmittel-Untersuch und Forsch 117 p 415
Hamm R 1972 Kolloidchemie des Fleisches Paul Parey Co Berlin
Ishioroshi M Samejima K and Yasui T 1979 Heat induced gelation of myosin factors
of pH and salt concentrations Journal of Food Science 44 pp 741ndash744
Kivikari R (1996) Buffering capacity of meat Thesis University of Helsinki EKT -series 1048
Offer G and Knight P 1983 The structural basis of water-holding in meat Part 1
General principles and water uptake in meat processing In Lawrie RA Editor 1983 Developments in meat science Elsevier Applied Science London
Puolanne E and Ruusunen M 1983 Einfluss des Salzzusatzes auf das
Wasserbindungsvermoumlgen der verschiedener Fleischsortimente in Bruumlhwurst Fleischwirtschaft 62 pp 238ndash239
Warriss PD 1982 The relationship between pH45 and drip in pig muscle Journal of Food
Technology 17 pp 573ndash578
Steven Brandon 30 June 2004
43
References
1 Food The Chemistry of Its Components 2nd ed T P Coultate The Royal Society of
Chemistry London 1989 p 106 2 httpwwwaw-bccommathewsch02frameshtm 3 httpwwwaw-bccommathewsch02frameshtm 4 httpwwwneurowustleduneuromuscularmothermyosinhtm 5 httpwwwmrc-lmbcamacukmyosintreesmclasseshtml 6 Private Communication Dr J C Acton Clemson University June 3 2004 7 httpwwwaw-bccommathewsch02frameshtm 8 CHEMISTRY OF MEAT PROCESSING Animal Sciences 550 Lynn Knipe Associate
Professor Animal Sciences Food Science amp Technology The Ohio State University
September 29 2000 9 Pre-rigor injection using glycolytic inhibitors in low-quality beef muscles N C Jerez C R
Calkins and J Velazco J Anim Sci 2003 81 pp 997-1003 10 CHEMISTRY OF MEAT PROCESSING Animal Sciences 550 Lynn Knipe Associate
Professor Animal Sciences Food Science amp Technology The Ohio State University
September 29 2000 11 MAKING MEAT FROM MUSCLES httpwwwcluesabdnacuk8080mirrorsgrowthch90html 12 httpwwwsunysbedubiochemcourseslectures929bmo520html 13 Biochemistry Christopher K Mathews KE van Holde 2nd ed Menlo Park CA Benjamin
Cummings Pub Co Inc 1996 p 52 14 Biochemistry Christopher K Mathews KE van Holde 2nd ed Menlo Park CA Benjamin
Cummings Pub Co Inc 1996 p 52
Introduction to Protein Chemistry S Fox J S Foster Wiley 1957 p242 httpwwwmcukyedubiochemistryCoursesbch612powerpoint2001lecture3Lecture3_filesframehtm
16 The Science of Meat and Meat Products J F Price B S Schweigert 2nd ed Food amp
Nutrition Press Inc Westport Connecticut 1978 p106 17 Private Communication Dr J C Acton Clemson University May 31 2004 18 httpwwwmcukyedubiochemistryCoursesbch612powerpoint2001lecture3Lecture3_filesframehtm 19 The effect of net charge on the solubility activity and stability of ribonuclease Sa Kevin
L Shaw Gerald R Grimsley Gennady I Yakovlev Alexander A Makarov and C Nick Pace Protein Science (2001) 10 pp 1206-1215
20 Proteins Masterpieces of Polymer Chemistry Robert A Copeland Todayrsquos Chemist at
Work June 1992 pp 33-37 21 Food Chemistry 3rd ed Owen R Fennema Marcel-Dekker Inc New York 1996 p367 22 Water Relations of Foods R B Duckworth Academic Press New York 1975 pp 104 -
105 23 Hydration of Macromolecules III Hydration of Polypeptides ID Kuntz Journal of the
American Chemical Society Vol 93 No 2 January 27 1971 pp 514-516 24 Isoelectric Precipitation httpwwwrpiedudeptchem-engBiotech-EnvironPRECIPprecpphhtml 25 ATOMIC and IONIC RADIUS httpwwwchemguidecoukatomspropertiesatradiushtml 26 A Field Guide and Introduction to the Geology and Chemistry of Rocks and Minerals
Charles A Sorrell Golden Press Western Publishing Co Inc Racine WI 1973 p 23 27 httpwwwwouedulasphyscich412hydrolysishtm 28 httpvischemcadrecomauhtmlcdatomshtml 29 httpwwwmcukyedubiochemistryCoursesbch612powerpoint2001lecture3Lecture3_filesframehtm 30 Proteins Amino Acids and Peptides as Ions and Dipolar Ions EJ Cohn JT Edsall
Rheinhold New York NY 1942 httpwwwmcukyedubiochemistryCoursesbch612powerpoint2001lecture3Lecture3_filesframehtm
31 Biochemistry 601 Protein Solubility Purification and Analysis Last modified 82399 Dr Landry Tulane University landrymailhosttcstulaneedu httpwwwtulaneedu~biochemmedpurehtm
32 TECHNICAL BULLETIN - COOKED CURED HAM httpwwwsoloseasaltcomTechnicalTech5htm
Steven Brandon 30 June 2004
44
33 On the mechanism of water holding in meat The swelling and shrinking of myofibrils
Gerald Offer and John Trinick Meat Science Volume 8 Issue 4 1983 pp 245-281 34 Solubility of salmon myosin as affected by conformational changes at various ionic
strengths and pH Tein M Lin Jae W Park Journal of Food Science March-April 1998 v63 i2 p 215
35 Combined effects of NaCl and raw meat pH on water-holding in cooked sausage with
and without added phosphate Eero J Puolanne Marita H Ruusunen and Jukka I Vainionpaumlauml Meat Science Volume 58 Issue 1 May 2001 pp 1-7
36 Salt Effects on Ionization Equilibria of Histidines in Myoglobin Yung-Hsiang Kao Carolyn A Fitch Shibani Bhattacharya Christopher J Sarkisian Juliette T J Lecomte and
Bertrand Garciacutea-Moreno E Biophys J September 2000 Vol 79 No 3 pp 1637-1654 37 MEAT EMULSIONS C Lynn Knipe Meat Export Research Center Iowa State University
httpwwwagohio-stateedu~meatsciarchiveMEATEMULSIONShtm 38 Salt-induced swelling of meat The effect of storage time pH ion-type and
concentration Peter Wilding Nicholas Hedges and Peter J Lillford Meat Science Volume
18 Issue 1 1986 pp 55-75 39 httpenwikipediaorgwikiAmino_acidStructures 40 httpenwikipediaorgwikiAmino_acidChemical_properties

Steven Brandon 30 June 2004
21
Salt interaction with protein
At high ionic strength protein solubility generally decreases with increasing salt
concentration due to reducing the activity of water and neutralization of surface charge This phenomenon is called ldquosalting outrdquo Each protein has a distinct
solubility profile as a function of salt concentration defined by Log S (mgmL) = β ndash KS (I2) where S is solubility I is ionic strength and KS and β are constants
Different types of salts affect the solubility of proteins to different extents (see
Figure 11 below) 29
Figure 11 Protein Solubility versus ionic strength 30
Solubility at low ionic strength increases with salt concentration This ldquosalting inrdquo
effect is explained as pairing of salt ions with charged groups of the protein
shields intramolecular repulsion Protein solubility is at a minimum near the isoelectric point (pI) of the protein 31
Salt along with phosphates improves water retention by enhancing protein
hydration NaCl increases the net charges on the protein structure helping to unfold and expose the protein surface by binding water Salt shifts the isoelectric
point to a pH of near 40 increasing the net negative charge at higher meat pH
attracting more water and thus increasing water holding capacity An optimal salt level of 25 - 28 is required to obtain maximum yield juiciness and flavor
quality32
Steven Brandon 30 June 2004
22
Clminus ions bind to the filaments and increase the electrostatic repulsive force between them A crucial factor in swelling is likely to be the removal at a critical
salt concentration of one or more transverse structural constraints in the
myofibril (probably crossbridges the M-line or the Z-line) allowing the filament lattice to expand33
Adding salt moves the pH of the isoelectric point of myosin and exposes
hydrophobic and sulfhydryl groups to the protein surface leading to loss of
helical structure according to research into the relationship between solubility and conformational changes of salmon (Oncorhynchus tshawytscha) myofibrillar
proteins These conformational changes form more surface for protein
solubilization therefore boosting its solubility34
Puolanne Ruusunen and Vainionpaumlauml (2001) of University of Helsinki gave a good review of the effects of added salt to WHC of meat The following information is
extracted from this paper35 References sited in these extracts are listed in Table A12 in the Appendix
Salt (NaCl) is added to meat products to improve their binding and water-holding
properties Chloride ions tend to penetrate into the myofilaments causing them to swell (Hamm 1972) and the sodium ions form an ion cloud around the filaments
(Offer amp Knight 1983) This results in local concentration differences which lead to
an increased osmotic pressure within the myofibrils which causes the filament lattice
to swell Simultaneously the enlargement of negative net charge within the myosin
filaments loosens the filaments and finally causes the disintegration of the filament at
an ionic strength of 08 (without added phosphate) or in 04 (with added phosphate) In sausages without added phosphate water-holding increases rather linearly to the
salt content of ca 4 (Hamm 1972) With added phosphate there is a marked
increase in water-holding in the range of 10ndash15 NaCl (Puolanne amp Ruusunen
1983) This is due to the cleavage of actomyosin bonds by phosphates thus
facilitating the swelling of the filament lattice (Offer amp Knight 1983)
Similar phenomena take place when pH increases The negative net charge of
filaments increases causing an uneven distribution of charges within the filaments Without added salt the water-holding increases as the pH rises from 50 to 90
According to Hamm (1972) there is however not a marked correlation between the
ultimate pH value and water-holding in pH values below 57 (pork) or 58 (beef)
when the same muscles of different animals are compared Animal-to-animal
differences are larger in pH values above the isoelectric point than below (Hamm 1962) Warriss (1982) however found a marked decrease in water-holding in pork
in the pH-range of 51ndash58
When salt is added the binding of chloride ions decreases with increasing pH but the
binding of sodium ions increases (Hamm 1972) As a result the maximum in water-
holding is reached by about pH 60 in meat (Hamm) or in myosin gel (Ishioroshi
Samejima amp Yasui 1979)
Steven Brandon 30 June 2004
23
Offer and Knight (1988) stress that NaCl depolymerizes the thick filament shafts by
weakening interactions between the tails presumably by favoring the exposure of
previously buried charged or andor hydrophilic groups According to Kivikari (1996)
this changes the amount and nature of titratable groups accessible to the solvent probably revealing new groups having pKa values in the pH range 60ndash69
The increase of NaCl content causes a minor shift to lower pH values but this is not
relevant in the narrow range of 05ndash25 NaCl (ca 01ndash04 M) and low pH values of
this study NaCl alone seems not to have had a statistically significant overall effect on batter pH at concentration levels of NaCl in this study On the other hand WHC
and sausage pH were clearly affected by added NaCl alone as well as in the
interaction with meat pH
All cooked sausage variables had a maximum in water-holding by 25 added NaCl The water-holding of the sausages increases with increasing pH-value up to pH 61
and a further increase causes only a minor increase This study shows that water-
holding is strongly affected by the pH of raw materials in combination with NaCl
which renders it important to keep the pH high enough to ensure a sufficiently high
level of water-holding when aiming at lowered salt additions35
The plots shown below in Figure 10 are from the paper by Puolanne Ruusunen and Vainionpaumlauml35
Figure 10 The effect of pH amp NaCl on WHC in cooked sausage WOP without WP with
added phosphate 35
Steven Brandon 30 June 2004
24
I have re-plotted their data for beef and pork without added phosphate to see
how WHC varies with pH at a range of salt contents for both beef and pork (see
Figures 11 amp 12 below) These plots show that WHC for both beef and pork increases steadily without added NaCl as the pH is raised from 55 to 60 but
shows little additional increase at pH gt 60 This observation agrees in general
with the shape of the calculated hydration curve (See Figure 7)
Water Holding Capacity of Pork
0
20
40
60
80
100
54 56 58 60 62 64 66
pH
WH
C
g H
2O
g m
eat
00 NaCl 05 NaCl 10 NaCl
15 NaCl 20 NaCl 25 NaCl
Figure 11 WHC vs pH for Pork without added phosphates
Water Holding Capacity of Beef
0
20
40
60
80
100
54 56 58 60 62 64 66
pH
WH
C
g H
2O
g m
eat
00 NaCl 05 NaCl 10 NaCl
15 NaCl 20 NaCl 25 NaCl
Figure 12 WHC vs pH for Beef without added phosphates
Steven Brandon 30 June 2004
25
Figures 11 and 12 also show that WHC increases substantially with increasing salt content at least up to 25 NaCl
Kao et al (2000) offer the following comments on the way salt affects protein hydration and other properties Proteins are surrounded by an ionic double
layer the structure and properties of which are determined by the balance
between disorganizing thermal forces and the organizing effects of electrostatic interactions and hydration at the protein-solvent interface The properties of the
double layer are influenced by the density of charged and polar groups on the
surface of a protein Therefore salt and pH effects are thermodynamically coupled Strong interactions between proteins and partially dehydrated site-
bound ions are not observed frequently The effects of salt on the stability of
proteins are frequently interpreted in terms of screening of electrostatic
interactions by the ionic strength This concept was inherited from Linderstroslashm-Lang who applied the solution of the linearized Poisson-Boltzmann equation achieved by Debye and Huumlckel less than a year after their original publication in
1923 to understand the ionization properties of proteins The understanding of the physical nature of interactions between proteins and ions continues to advance However at present there is no unifying theoretical framework based
on simple physical principles capable of accounting quantitatively and structurally for all of the different types of salt effects that have been observed in proteins36
Analysis of NaCl effects on charge and WHC of myosin
Model 1 All salt ions interact with charged side groups
I have attempted to model the screening of myosinrsquos charged surface groups by salt ions by recalculating the myosin charge inventory and total hydration as a
function of pH by assuming that the salt ions effectively neutralize the charge of oppositely charged sites Figure 13 below is an illustration of the amino acid
composition of beef myosin at pH 44 where each circle represents one amino acid residue which may be acidic basic polar or non-polar For simplicity I
have divided the total number of amino acid residues by 100 to produce this representative illustration
Acidic
Basic
Polar
Non-Polar
Figure 13 Representative illustration of myosin amino acid composition
The sodium cations (+) and chloride anions (-) are also shown in Figure 13
Here these salt ions are shown screening the charge of oppositely charged amino
acid groups in the myosin molecule
Steven Brandon 30 June 2004
26
For my analysis I selected a salt concentration of 400 moles of NaCl mole of myosin I chose this salt concentration as one sufficient to significantly affect the
behavior of myosin based on the model described above) The results of this
analysis (for beef myosin) are shown in Tables A8 and A9 in the appendix Table A8 lists the charge inventory for beef myosin with 400 moles of added NaCl
mole of myosin As described above this table assumes that the available Na+
and Cl- ions combine with oppositely charged side groups effectively neutralizing them Below pH 40 not all of the free Na+ ions are consumed in interactions
with side groups because there are too few available anionic side groups
(aspartate and glutamate) In reality these free Na+ ions would tend to compete with the cationic side groups to attract Cl- ions but I have not
attempted to account for this in my model
Figure 14 below shows the net charge of myosin versus pH in the presence of
added NaCl This analysis indicates no change in net charge pH gt 40 is the
same as was calculated without added NaCl This is because above pH 40 where all of the available salt ions are employed in interactions with myosin side groups an equal number of positive and negative charges have been neutralized
Myosin Net Charge vs pH
-500
0
500
1000
30 40 50 60 70 80 90 100
pH
Ne
t C
ha
rge
of
My
os
in
Beef Pork Rabbit
Model 1
Figure 14 Net charge of myosin versus pH in the presence of added NaCl ndash Model 1
Table A9 lists the total hydration for beef myosin with 400 moles of added NaCl
mole of myosin I assumed that all of the salt-ion-screened (neutralized) side groups would have the bind the same number of water molecules per side group
as the corresponding unionized side groups For example I assumed that an
ionized aspartate group screened by a Na+ ion would bind the same amount of water as an uncharged aspartic acid group ie 2 molecules of water per group
Steven Brandon 30 June 2004
27
in this case Since the many of the side groups hole less water when unionized (or effectively neutralized by an oppositely charged salt ion) the total hydration
of myosin is lower than was calculated in the absence of added NaCl This is
illustrated in Figure 15 below which shows the calculated total hydration of myosin versus pH in the presence of added NaCl
Myosin Hydration vs pH
6000
7000
8000
9000
10000
11000
12000
30 40 50 60 70 80 90 100
pH
Hy
dra
tio
n
mo
les H
2O
mo
le o
f M
yo
sin
Beef Pork Rabbit
Model 1
Figure 15 Total hydration of myosin versus pH in the presence of added NaCl - Model 1
This analysis is unsatisfactory in that it predicts no change in isoelectric point
with added salt and in that it predicts a reduction in hydration of myosin with added salt These two predictions disagree with the reported observations that
adding low concentrations of salt lowers pI and increases hydration (at pH gt pI) Back to the drawing board
Model 2 Only anions interact with cationic side groups
The WHC of a meat system is greatly affected by the addition of salt To fully
understand this effect one must consider the action of both the cation and the
anion which result from the ionization of salt These ions must be absorbed by
the protein to affect WHC The effect of salt can be explained by the fact that the chloride anion being larger would be less hydrated than the sodium cation The
less hydrated ions are drawn closer to the charged protein group due to their
smaller radii The chloride ion should therefore have more of an effect on
screening of oppositely charged groups at pH above the pI than sodium resulting
in a net increase in negative charges and a shift of the pI of muscle to lower pH values An increase in negative charges results in repulsion of the protein groups
and an enlargement of the space available for absorption within the muscle37
This assertion that chloride ions being larger are less hydrated than sodium ions does not agree with the information I found elsewhere (see Table 7)28
Steven Brandon 30 June 2004
28
which states that both ions are hydrated by about six water molecules in solution However if one considers the counterion atmosphere surrounding a
catonic macroion (see Figure 4) such as myosin below its isoelectric point it is
not unreasonable to imagine that the anionic Cl- ions are held closely to the protein molecule while the cationic Na+ ions tend to remain at a greater distance
from the protein where they can have relatively little influence on the charge
and therefore the hydration behavior of the myosin molecule Figure 16 illustrates this concept
Figure 16 Illustration of the chloride screening effect assumed in Model 2
I have repeated my analysis using the assumption that only the Cl- ions are able
to interact with (and effectively neutralize) the cationic side groups while the Na+ ions do not interact with the myosin molecule at all
Table A10 lists the net charge of beef myosin versus pH as calculated using Model
2 As indicated in this table the isoelectric point is predicted by Model 2 to shift from about pH 52 (see Table 3) to lt pH 4 Figure 17 below shows that
isoelectic points of pork and rabbit myosin have shifted to lower pH This results
from the overall reduction in net charge resulting from neutralization of a large portion of the cationic side groups by charge interactions with chloride anions
+ + + + + +
+ + ++ + + + + + + + + +
+ + + +
Na+
Cl-
Steven Brandon 30 June 2004
29
Myosin Net Charge vs pH
-1000
-500
0
500
30 40 50 60 70 80 90 100
pH
Ne
t C
ha
rge
of
My
os
in
Beef Pork Rabbit
Model 2
Figure 17 Net charge of myosin versus pH in the presence of added NaCl ndash Model 2
Table A11 lists the total hydration of beef myosin versus pH as calculated using
Model 2 Figure 17 below shows the hydration curves for beef pork and rabbit myosin calculated using Model 2
Myosin Hydration vs pH
6000
7000
8000
9000
10000
11000
12000
30 40 50 60 70 80 90 100
pH
Hy
dra
tio
n
mo
les H
2O
mo
le o
f M
yo
sin
Beef Pork Rabbit
Model 2
Figure 18 Total hydration of myosin versus pH in the presence of added NaCl - Model 2
Contrary to expectations Model 2 predicts no change in the total hydration of
beef myosin in the presence of added salt This results from the fact that the
chloride ldquoscreenedrdquo cationic side groups are assumed to hold the same number of
water molecules per side group as the ldquounscreenedrdquo cationic groups in the
Steven Brandon 30 June 2004
30
absence of salt If this model has any validity it indicates that the observed changes in hydration in the presence of added salt are the consequence of
phenomena other than salt ion ndash charged side group interactions
Comparing the total number of charged groups present in the myosin molecule at
pI in the absence of added salt about pH 52 (see Table A6) to number of
charged groups at the pI of myosin in the presence of added salt (using Model 2) about pH 39 (see Table A10) reveals a substantial reduction in the total numbers
of charged groups at pI with added salt Table 8 below lists the total numbers of
charged groups at pI with and without added salt These numbers were obtained from Tables A6 and A10 for the no salt and added salt cases respectively (I
had to interpolate between data for pH 36 and pH 40 in Table A10 to obtain the
numbers of charged groups at pI = 387 for the added salt case)
Table 8 Inventory of Anionic amp Cationic Groups with and without added salt
No Added NaCl Added NaCl
pI pH 520 pH 387 Total Anionic Groups 725 265
Total Cationic Groups 725 265
The lower numbers of charged groups in the added salt case results from the effective screening of some of these groups by salt ions This overall reduction in
the number of charged groups in myosin reduces the repulsion between
neighboring myosin molecules allowing the proteins to draw more closely
together leaving less volume available for capillary entrapped water This is supported by Wilding et al (1986) who report that Rabbit longissimus dorsi
fibers were found to swell in hypertonic salt solutions such as 025 M KI or 06 M KCl to two to three times their original diameter Swelling occurs by a
combination of an increase in the myofilament lattice spacing and a loss of myofilament order However at pH below the isoelectric point of the myofibrillar proteins hypertonic salt solutions induce fiber shrinkage 38
Steven Brandon 30 June 2004
31
Appendix Table A1 Amino Acids39
Steven Brandon 30 June 2004
32
Table A2 Myosin Amino Acid Composition
Myosin aa aa aa Residuesmole aa Residue WtmoleResidues 10
5 g Symbol gmole Residues mole My Residue g mole My
Beef Pork Rabbit Beef Pork Rabbit
Aspartate D 11308
Aspartic acid 74 68 72 D 11408 333 306 325
Glutamate E 12711
Glutamic acid 97 100 103 E 12811 438 450 465
de-protonated Histidine H 13716
Histidine 14 15 15 H 13816 63 68 68
de-protonated Lysine K 12819
Lysine 107 105 85 K 12919 482 473 383
de-protonated Arginine R 15620
Arginine 42 46 41 R 15720 189 207 185
de-protonated Cysteine C 10215
Cysteine 0 0 9 C 10315 0 0 41
de-protonated Tyrosine Y 16212
Tyrosine 16 16 18 Y 16312 72 72 81
Asparagine 13 12 13 N 11410 59 54 57
Glutamine 49 50 52 Q 12814 219 225 233
Proline 26 20 22 P 9713 117 90 99
Serine 34 37 41 S 8709 153 167 185
Threonine 43 47 41 T 10112 194 212 185
Tryptophan 0 0 4 W 18623 0 0 18
Alanine 73 65 78 A 7109 329 293 351
Glycine 38 39 39 G 5707 171 176 176
Isoleucine 40 41 42 I 11318 180 185 189
Leucine 86 86 79 L 11318 387 387 356
Methionine 20 21 22 M 13121 90 95 99
Phenylalanine 27 28 27 F 14719 122 126 122
Valine 37 39 42 V 9915 167 176 189
(NH3) 106 120 86 170 477 540 387
Total residues (text) 836 837 845
Total residues (calc) 836 835 845 2318 2322 2322
Use 450000 kDa = 450000 gmole
Steven Brandon 30 June 2004
33
Table A3 Amino Acid Properties40
Abbrev Full Name Side chain
type Mass pI
pK1
(alpha -
COOH)
pK2
(alpha -+NH3)
pKr
(R) Remarks
A Ala Alanine hydrophobic 8909 611 235 987
C Cys Cysteine hydrophilic 12116 505 192 1070 837
Two cysteines can
form a disulfide
bond This enforces
tertiary structure
and such proteins as
insulin have disulfide
bonds
D Asp Aspartic acid acidic 13310 285 199 990 390
E Glu Glutamic acid acidic 14713 315 210 947 407
F Phe Phenylalanine hydrophobic 16519 549 220 931
G Gly Glycine hydrophilic 7507 606 235 978
Because of the two
hydrogen atoms at
the α carbon glycine
is not optically
active
H His Histidine basic 15516 760 180 933 604
I Ile Isoleucine hydrophobic 13117 605 232 976
K Lys Lysine basic 14619 960 216 906 1054
L Leu Leucine hydrophobic 13117 601 233 974
M Met Methionine hydrophobic 14921 574 213 928
Always the first
amino acid to be
incorporated into a
protein sometimes
removed after
translation
N Asn Asparagine hydrophilic 13212 541 214 872
P Pro Proline hydrophobic 11513 630 195 1064
Can disrupt protein
folding structures
like α helix or β
sheet
Q Gln Glutamine hydrophilic 14615 565 217 913
R Arg Arginine basic 17420 1076 182 899 1248
S Ser Serine hydrophilic 10509 568 219 921
T Thr Threonine hydrophilic 11912 560 209 910
V Val Valine hydrophobic 11715 600 239 974
W Trp Tryptophan hydrophobic 20423 589 246 941
Y Tyr Tyrosine hydrophilic 18119 564 220 921 1046
Steven Brandon 30 June 2004
34
Table A4 Fraction of Dissociated Amino Acid R-Groups by pH
Fraction of dissociated R-groups
[A-]([HA]+[A
-])
aa Dissociating Group pH pH pH pH pH pH pH pH pH pH pH pH pH pH pH pH pH
Class HA A- pKR 32 36 40 44 48 52 56 60 64 68 72 76 80 84 88 92 96
Asp-
A --COO- 390 017 033 056 076 089 095 098 099 100 100 100 100 100 100 100 100 100 Asp
-
Asp A --COOH 083 067 044 024 011 005 002 001 000 000 000 000 000 000 000 000 000 Asp
Glu-
A --COO- 407 012 025 046 068 084 093 097 099 100 100 100 100 100 100 100 100 100 Glu
-
Glu A --COOH 088 075 054 032 016 007 003 001 000 000 000 000 000 000 000 000 000 Glu
His B -N 604 000 000 001 002 005 013 027 048 070 085 094 097 099 100 100 100 100 His
His+
B -NH+ 100 100 099 098 095 087 073 052 030 015 006 003 001 000 000 000 000 His
+
Lys B -NH2 1079 000 000 000 000 000 000 000 000 000 000 000 000 000 000 001 003 006 Lys
Lys+
B -NH2H+ 100 100 100 100 100 100 100 100 100 100 100 100 100 100 099 097 094 Lys
+
Arg B -NH 1248 000 000 000 000 000 000 000 000 000 000 000 000 000 000 000 000 000 Arg
Arg+
B -NHH+ 100 100 100 100 100 100 100 100 100 100 100 100 100 100 100 100 100 Arg
+
Cys-
P --S- 835 000 000 000 000 000 000 000 000 001 003 007 015 031 053 074 088 095 Cys
-
Cys P --SH 100 100 100 100 100 100 100 100 099 097 093 085 069 047 026 012 005 Cys
Tyr-
NP --O- 1013 000 000 000 000 000 000 000 000 000 000 000 000 001 002 004 011 023 Tyr
-
Tyr NP --OH 100 100 100 100 100 100 100 100 100 100 100 100 099 098 096 089 077 Tyr
Steven Brandon 30 June 2004
35
Table A5 Beef Myosin Amino Acid Composition by pH
Myosin
Amino Acid Residues mole of Myosin
Beef Pork
pH 32 pH 36 pH 40 pH 44 pH 48 pH 52 pH 56 pH 60 pH 64 pH 68 pH 72 pH 76 pH 80 pH 84 pH 88 pH 92 pH 96
Asp-
55 111 185 253 296 317 326 330 332 332 333 333 333 333 333 333 333
Asp 277 222 147 80 37 16 7 3 1 0 0 0 0 0 0 0 0
Glu-
52 111 201 298 369 408 425 433 436 437 438 438 438 438 438 438 438
Glu 386 327 237 140 69 30 13 5 2 1 0 0 0 0 0 0 0
His 0 0 1 1 3 8 17 30 44 54 59 61 62 63 63 63 63
His+
63 63 62 62 60 55 46 33 19 9 4 2 1 0 0 0 0
Lys 0 0 0 0 0 0 0 0 0 0 0 0 1 2 5 12 29
Lys+
481 481 481 481 481 481 481 481 481 481 481 481 481 480 477 469 452
Arg 0 0 0 0 0 0 0 0 0 0 0 0 0 0 0 0 0
Arg+
189 189 189 189 189 189 189 189 189 189 189 189 189 189 189 189 189
Cys-
0 0 0 0 0 0 0 0 0 0 0 0 0 0 0 0 0
Cys 0 0 0 0 0 0 0 0 0 0 0 0 0 0 0 0 0
Tyr-
0 0 0 0 0 0 0 0 0 0 0 0 1 1 3 8 16
Tyr 72 72 72 72 72 72 72 72 72 72 72 72 71 71 69 64 56
Asn 59 59 59 59 59 59 59 59 59 59 59 59 59 59 59 59 59
Gln 219 219 219 219 219 219 219 219 219 219 219 219 219 219 219 219 219
Pro 117 117 117 117 117 117 117 117 117 117 117 117 117 117 117 117 117
Ser 153 153 153 153 153 153 153 153 153 153 153 153 153 153 153 153 153
Thr 194 194 194 194 194 194 194 194 194 194 194 194 194 194 194 194 194
Trp 0 0 0 0 0 0 0 0 0 0 0 0 0 0 0 0 0
Ala 329 329 329 329 329 329 329 329 329 329 329 329 329 329 329 329 329
Gly 171 171 171 171 171 171 171 171 171 171 171 171 171 171 171 171 171
Ile 180 180 180 180 180 180 180 180 180 180 180 180 180 180 180 180 180
Leu 387 387 387 387 387 387 387 387 387 387 387 387 387 387 387 387 387
Met 90 90 90 90 90 90 90 90 90 90 90 90 90 90 90 90 90
Phe 122 122 122 122 122 122 122 122 122 122 122 122 122 122 122 122 122
Val 167 167 167 167 167 167 167 167 167 167 167 167 167 167 167 167 167
(NH3) 477 477 477 477 477 477 477 477 477 477 477 477 477 477 477 477 477
Total residues (calc) 3762 3762 3762 3762 3762 3762 3762 3762 3762 3762 3762 3762 3762 3762 3762 3762 3762
Steven Brandon 30 June 2004
36
Table A6 Charge Inventory of Beef Myosin by pH
Myosin
Residue Charge Charge Inventory
Beef Pork
pH 32 pH 36 pH 40 pH 44 pH 48 pH 52 pH 56 pH 60 pH 64 pH 68 pH 72 pH 76 pH 80 pH 84 pH 88 pH 92 pH 96
-1 Asp-
-55 -111 -185 -253 -296 -317 -326 -330 -332 -332 -333 -333 -333 -333 -333 -333 -333
0 Asp 0 0 0 0 0 0 0 0 0 0 0 0 0 0 0 0 0
-1 Glu-
-52 -111 -201 -298 -369 -408 -425 -433 -436 -437 -438 -438 -438 -438 -438 -438 -438
0 Glu 0 0 0 0 0 0 0 0 0 0 0 0 0 0 0 0 0
0 His 0 0 0 0 0 0 0 0 0 0 0 0 0 0 0 0 0
1 His+
63 63 62 62 60 55 46 33 19 9 4 2 1 0 0 0 0
0 Lys 0 0 0 0 0 0 0 0 0 0 0 0 0 0 0 0 0
1 Lys+
481 481 481 481 481 481 481 481 481 481 481 481 481 480 477 469 452
0 Arg 0 0 0 0 0 0 0 0 0 0 0 0 0 0 0 0 0
1 Arg+
189 189 189 189 189 189 189 189 189 189 189 189 189 189 189 189 189
-1 Cys-
0 0 0 0 0 0 0 0 0 0 0 0 0 0 0 0 0
0 Cys 0 0 0 0 0 0 0 0 0 0 0 0 0 0 0 0 0
-1 Tyr-
0 0 0 0 0 0 0 0 0 0 0 0 -1 -1 -3 -8 -16
0 Tyr 0 0 0 0 0 0 0 0 0 0 0 0 0 0 0 0 0
0 Asn 0 0 0 0 0 0 0 0 0 0 0 0 0 0 0 0 0
0 Gln 0 0 0 0 0 0 0 0 0 0 0 0 0 0 0 0 0
0 Pro 0 0 0 0 0 0 0 0 0 0 0 0 0 0 0 0 0
0 Ser 0 0 0 0 0 0 0 0 0 0 0 0 0 0 0 0 0
0 The 0 0 0 0 0 0 0 0 0 0 0 0 0 0 0 0 0
0 Trp 0 0 0 0 0 0 0 0 0 0 0 0 0 0 0 0 0
0 Ala 0 0 0 0 0 0 0 0 0 0 0 0 0 0 0 0 0
0 Gly 0 0 0 0 0 0 0 0 0 0 0 0 0 0 0 0 0
0 Ile 0 0 0 0 0 0 0 0 0 0 0 0 0 0 0 0 0
0 Leu 0 0 0 0 0 0 0 0 0 0 0 0 0 0 0 0 0
0 Met 0 0 0 0 0 0 0 0 0 0 0 0 0 0 0 0 0
0 Phe 0 0 0 0 0 0 0 0 0 0 0 0 0 0 0 0 0
0 Val 0 0 0 0 0 0 0 0 0 0 0 0 0 0 0 0 0
0 (NH3) 0 0 0 0 0 0 0 0 0 0 0 0 0 0 0 0 0
TOTAL 626 511 346 181 65 1 -35 -60 -78 -90 -96 -99 -101 -103 -108 -120 -146
Steven Brandon 30 June 2004
37
Table A7 Beef Myosin Hydration by pH
Source Myosin
Hydration moles of H2O mole of Myosin
moles H2OMole of Residue Beef Pork
pH 32 pH 36 pH 40 pH 44 pH 48 pH 52 pH 56 pH 60 pH 64 pH 68 pH 72 pH 76 pH 80 pH 84 pH 88 pH 92 pH 96
60 Kuntz Asp-
332 667 1113 1517 1773 1901 1958 1981 1990 1994 1996 1996 1996 1997 1997 1997 1997
20 Kuntz Asp 555 443 295 160 74 32 13 5 2 1 0 0 0 0 0 0 0
75 Kuntz Glu-
390 831 1510 2238 2769 3058 3191 3247 3270 3279 3283 3284 3285 3285 3285 3285 3285
20 Kuntz Glu 772 654 473 279 138 60 25 10 4 2 1 0 0 0 0 0 0
40 best guess His 0 1 2 6 14 32 67 120 175 215 236 245 249 251 252 252 252
40 Kuntz His+
252 251 250 246 238 220 185 132 77 37 16 7 3 1 0 0 0
45 Kuntz Lys 0 0 0 0 0 0 0 0 0 0 1 1 4 9 22 54 131
45 Kuntz Lys+
2167 2167 2167 2167 2167 2167 2167 2167 2167 2167 2166 2165 2163 2158 2145 2112 2035
30 Kuntz Arg 0 0 0 0 0 0 0 0 0 0 0 0 0 0 0 0 1
30 Kuntz Arg+
567 567 567 567 567 567 567 567 567 567 567 567 567 567 567 567 566
20 best guess Cys-
0 0 0 0 0 0 0 0 0 0 0 0 0 0 0 0 0
10 Kuntz Cys 0 0 0 0 0 0 0 0 0 0 0 0 0 0 0 0 0
75 Kuntz Tyr-
0 0 0 0 0 0 0 0 0 0 1 2 4 10 24 57 123
30 Kuntz Tyr 216 216 216 216 216 216 216 216 216 216 216 215 214 212 206 193 167
20 Kuntz Asn 117 117 117 117 117 117 117 117 117 117 117 117 117 117 117 117 117
20 Kuntz Gln 438 438 438 438 438 438 438 438 438 438 438 438 438 438 438 438 438
30 Kuntz Pro 351 351 351 351 351 351 351 351 351 351 351 351 351 351 351 351 351
20 Kuntz Ser 306 306 306 306 306 306 306 306 306 306 306 306 306 306 306 306 306
20 Kuntz The 387 387 387 387 387 387 387 387 387 387 387 387 387 387 387 387 387
20 Kuntz Trp 0 0 0 0 0 0 0 0 0 0 0 0 0 0 0 0 0
15 Kuntz Ala 493 493 493 493 493 493 493 493 493 493 493 493 493 493 493 493 493
10 Kuntz Gly 171 171 171 171 171 171 171 171 171 171 171 171 171 171 171 171 171
10 Kuntz Ile 180 180 180 180 180 180 180 180 180 180 180 180 180 180 180 180 180
10 Kuntz Leu 387 387 387 387 387 387 387 387 387 387 387 387 387 387 387 387 387
10 Kuntz Met 90 90 90 90 90 90 90 90 90 90 90 90 90 90 90 90 90
00 Kuntz Phe 0 0 0 0 0 0 0 0 0 0 0 0 0 0 0 0 0
10 Kuntz Val 167 167 167 167 167 167 167 167 167 167 167 167 167 167 167 167 167
(NH3) 0 0 0 0 0 0 0 0 0 0 0 0 0 0 0 0 0
TOTAL 8338 8884 9679 10483 11043 11340 11475 11532 11555 11564 11568 11570 11572 11576 11585 11604 11644
Steven Brandon 30 June 2004
38
Table A8 Charge Inventory of Beef Myosin by pH with 400 moles of NaCl mole of myosin ndash Model 1 Myosin
Residue Charge Charge Inventory
Beef Pork
pH 32 pH 36 pH 40 pH 44 pH 48 pH 52 pH 56 pH 60 pH 64 pH 68 pH 72 pH 76 pH 80 pH 84 pH 88 pH 92 pH 96
0 Na Asp 0 0 0 0 0 0 0 0 0 0 0 0 0 0 0 0 0
-1 Asp-
0 0 0 -69 -118 -142 -153 -157 -159 -160 -160 -160 -160 -160 -161 -162 -164
0 Asp 0 0 0 0 0 0 0 0 0 0 0 0 0 0 0 0 0
0 Na Glu 0 0 0 0 0 0 0 0 0 0 0 0 0 0 0 0 0
-1 Glu-
0 0 0 -82 -147 -183 -199 -206 -209 -210 -210 -211 -211 -211 -212 -213 -215
0 Glu 0 0 0 0 0 0 0 0 0 0 0 0 0 0 0 0 0
0 His Cl 0 0 0 0 0 0 0 0 0 0 0 0 0 0 0 0 0
0 His 0 0 0 0 0 0 0 0 0 0 0 0 0 0 0 0 0
1 His+
29 29 28 28 27 25 20 14 8 4 2 1 0 0 0 0 0
0 Lys Cl 0 0 0 0 0 0 0 0 0 0 0 0 0 0 0 0 0
0 Lys 0 0 0 0 0 0 0 0 0 0 0 0 0 0 0 0 0
1 Lys+
219 219 219 218 218 216 213 208 202 198 196 195 194 193 190 184 170
0 Arg Cl 0 0 0 0 0 0 0 0 0 0 0 0 0 0 0 0 0
0 Arg 0 0 0 0 0 0 0 0 0 0 0 0 0 0 0 0 0
1 Arg+
86 86 86 86 85 85 84 82 79 78 77 76 76 76 75 74 71
0 Na Cys 0 0 0 0 0 0 0 0 0 0 0 0 0 0 0 0 0
-1 Cys-
0 0 0 0 0 0 0 0 0 0 0 0 0 0 0 0 0
0 Cys 0 0 0 0 0 0 0 0 0 0 0 0 0 0 0 0 0
0 Na Tyr 0 0 0 0 0 0 0 0 0 0 0 0 0 0 0 0 0
-1 Tyr-
0 0 0 0 0 0 0 0 0 0 0 0 0 -1 -2 -4 -8
0 Tyr 0 0 0 0 0 0 0 0 0 0 0 0 0 0 0 0 0
0 Asn 0 0 0 0 0 0 0 0 0 0 0 0 0 0 0 0 0
0 Gln 0 0 0 0 0 0 0 0 0 0 0 0 0 0 0 0 0
0 Pro 0 0 0 0 0 0 0 0 0 0 0 0 0 0 0 0 0
0 Ser 0 0 0 0 0 0 0 0 0 0 0 0 0 0 0 0 0
0 Thr 0 0 0 0 0 0 0 0 0 0 0 0 0 0 0 0 0
0 Trp 0 0 0 0 0 0 0 0 0 0 0 0 0 0 0 0 0
0 Ala 0 0 0 0 0 0 0 0 0 0 0 0 0 0 0 0 0
0 Gly 0 0 0 0 0 0 0 0 0 0 0 0 0 0 0 0 0
0 Ile 0 0 0 0 0 0 0 0 0 0 0 0 0 0 0 0 0
0 Leu 0 0 0 0 0 0 0 0 0 0 0 0 0 0 0 0 0
0 Met 0 0 0 0 0 0 0 0 0 0 0 0 0 0 0 0 0
0 Phe 0 0 0 0 0 0 0 0 0 0 0 0 0 0 0 0 0
0 Val 0 0 0 0 0 0 0 0 0 0 0 0 0 0 0 0 0
0 (NH3) 0 0 0 0 0 0 0 0 0 0 0 0 0 0 0 0 0
TOTAL 333 333 333 181 65 1 -35 -60 -78 -90 -96 -99 -101 -103 -108 -120 -146
Steven Brandon 30 June 2004
39
Table A9 Beef Myosin Hydration by pH with 400 moles of NaCl mole of myosin ndash Model 1
Myosin
Hydration moles of H2O mole of Myosin
moles H2OMole of Residue Beef Pork
pH 32 pH 36 pH 40 pH 44 pH 48 pH 52 pH 56 pH 60 pH 64 pH 68 pH 72 pH 76 pH 80 pH 84 pH 88 pH 92 pH 96
2 best guess Na Asp 111 222 371 367 356 350 347 346 346 345 345 345 345 345 344 342 338
6 Kuntz Asp-
0 0 0 416 706 852 916 943 953 958 959 960 961 962 965 971 982
2 Kuntz Asp 555 443 295 160 74 32 13 5 2 1 0 0 0 0 0 0 0
2 best guess Na Glu 104 222 403 433 444 450 453 454 454 454 455 454 454 454 453 450 445
75 Kuntz Glu-
0 0 0 614 1103 1370 1493 1545 1566 1575 1578 1580 1581 1583 1587 1597 1616
2 Kuntz Glu 772 654 473 279 138 60 25 10 4 2 1 0 0 0 0 0 0
4 best guess His Cl 137 137 136 135 131 121 103 75 44 22 10 4 2 1 0 0 0
4 best guess His 0 1 2 6 14 32 67 120 175 215 236 245 249 251 252 252 252
4 Kuntz His+
114 114 113 112 108 99 82 57 32 15 7 3 1 0 0 0 0
45 best guess Lys Cl 1182 1182 1183 1184 1187 1195 1209 1232 1257 1275 1285 1289 1291 1291 1289 1283 1270
45 Kuntz Lys 0 0 0 0 0 0 0 0 0 0 1 1 4 9 22 54 131
45 Kuntz Lys+
985 985 984 983 980 972 957 935 910 892 881 876 873 867 856 829 765
3 best guess Arg Cl 309 309 309 310 311 313 316 322 329 334 336 338 338 339 341 344 353
3 Kuntz Arg 0 0 0 0 0 0 0 0 0 0 0 0 0 0 0 0 1
3 Kuntz Arg+
258 258 258 257 256 254 251 245 238 233 231 229 229 228 226 222 213
1 best guess Na Cys 0 0 0 0 0 0 0 0 0 0 0 0 0 0 0 0 0
2 best guess Cys-
0 0 0 0 0 0 0 0 0 0 0 0 0 0 0 0 0
1 Kuntz Cys 0 0 0 0 0 0 0 0 0 0 0 0 0 0 0 0 0
3 Kuntz Na Tyr 0 0 0 0 0 0 0 0 0 0 0 0 1 2 5 12 25
75 Kuntz Tyr-
0 0 0 0 0 0 0 0 0 0 0 1 2 5 12 28 61
3 Kuntz Tyr 216 216 216 216 216 216 216 216 216 216 216 215 214 212 206 193 167
2 Kuntz Asn 117 117 117 117 117 117 117 117 117 117 117 117 117 117 117 117 117
2 Kuntz Gln 438 438 438 438 438 438 438 438 438 438 438 438 438 438 438 438 438
3 Kuntz Pro 351 351 351 351 351 351 351 351 351 351 351 351 351 351 351 351 351
2 Kuntz Ser 306 306 306 306 306 306 306 306 306 306 306 306 306 306 306 306 306
2 Kuntz Thr 387 387 387 387 387 387 387 387 387 387 387 387 387 387 387 387 387
2 Kuntz Trp 0 0 0 0 0 0 0 0 0 0 0 0 0 0 0 0 0
15 Kuntz Ala 493 493 493 493 493 493 493 493 493 493 493 493 493 493 493 493 493
1 Kuntz Gly 171 171 171 171 171 171 171 171 171 171 171 171 171 171 171 171 171
1 Kuntz Ile 180 180 180 180 180 180 180 180 180 180 180 180 180 180 180 180 180
1 Kuntz Leu 387 387 387 387 387 387 387 387 387 387 387 387 387 387 387 387 387
1 Kuntz Met 90 90 90 90 90 90 90 90 90 90 90 90 90 90 90 90 90
0 Kuntz Phe 0 0 0 0 0 0 0 0 0 0 0 0 0 0 0 0 0
1 Kuntz Val 167 167 167 167 167 167 167 167 167 167 167 167 167 167 167 167 167
(NH3) 0 0 0 0 0 0 0 0 0 0 0 0 0 0 0 0 0
TOTAL 7830 7830 7830 8558 9110 9403 9535 9591 9614 9623 9627 9629 9631 9635 9644 9665 9706
Steven Brandon 30 June 2004
40
Table A10 Charge Inventory of Beef Myosin by pH with 400 moles of NaCl mole of myosin ndash Model 2
Myosin
Residue Charge Charge Inventory
Beef Pork
pH 32 pH 36 pH 40 pH 44 pH 48 pH 52 pH 56 pH 60 pH 64 pH 68 pH 72 pH 76 pH 80 pH 84 pH 88 pH 92 pH 96
-1 Asp-
-55 -111 -185 -253 -296 -317 -326 -330 -332 -332 -333 -333 -333 -333 -333 -333 -333
0 Asp 0 0 0 0 0 0 0 0 0 0 0 0 0 0 0 0 0
-1 Glu-
-52 -111 -201 -298 -369 -408 -425 -433 -436 -437 -438 -438 -438 -438 -438 -438 -438
0 Glu 0 0 0 0 0 0 0 0 0 0 0 0 0 0 0 0 0
0 His Cl 0 0 0 0 0 0 0 0 0 0 0 0 0 0 0 0 0
0 His 0 0 0 0 0 0 0 0 0 0 0 0 0 0 0 0 0
1 His+
29 29 28 28 27 25 20 14 8 4 2 1 0 0 0 0 0
0 Lys Cl 0 0 0 0 0 0 0 0 0 0 0 0 0 0 0 0 0
0 Lys 0 0 0 0 0 0 0 0 0 0 0 0 0 0 0 0 0
1 Lys+
219 219 219 218 218 216 213 208 202 198 196 195 194 193 190 184 170
0 Arg Cl 0 0 0 0 0 0 0 0 0 0 0 0 0 0 0 0 0
0 Arg 0 0 0 0 0 0 0 0 0 0 0 0 0 0 0 0 0
1 Arg+
86 86 86 86 85 85 84 82 79 78 77 76 76 76 75 74 71
-1 Cys-
0 0 0 0 0 0 0 0 0 0 0 0 0 0 0 0 0
0 Cys 0 0 0 0 0 0 0 0 0 0 0 0 0 0 0 0 0
-1 Tyr-
0 0 0 0 0 0 0 0 0 0 0 0 -1 -1 -3 -8 -16
0 Tyr 0 0 0 0 0 0 0 0 0 0 0 0 0 0 0 0 0
0 Asn 0 0 0 0 0 0 0 0 0 0 0 0 0 0 0 0 0
0 Gln 0 0 0 0 0 0 0 0 0 0 0 0 0 0 0 0 0
0 Pro 0 0 0 0 0 0 0 0 0 0 0 0 0 0 0 0 0
0 Ser 0 0 0 0 0 0 0 0 0 0 0 0 0 0 0 0 0
0 Thr 0 0 0 0 0 0 0 0 0 0 0 0 0 0 0 0 0
0 Trp 0 0 0 0 0 0 0 0 0 0 0 0 0 0 0 0 0
0 Ala 0 0 0 0 0 0 0 0 0 0 0 0 0 0 0 0 0
0 Gly 0 0 0 0 0 0 0 0 0 0 0 0 0 0 0 0 0
0 Ile 0 0 0 0 0 0 0 0 0 0 0 0 0 0 0 0 0
0 Leu 0 0 0 0 0 0 0 0 0 0 0 0 0 0 0 0 0
0 Met 0 0 0 0 0 0 0 0 0 0 0 0 0 0 0 0 0
0 Phe 0 0 0 0 0 0 0 0 0 0 0 0 0 0 0 0 0
0 Val 0 0 0 0 0 0 0 0 0 0 0 0 0 0 0 0 0
0 (NH3) 0 0 0 0 0 0 0 0 0 0 0 0 0 0 0 0 0
TOTAL 226 111 -54 -219 -335 -399 -435 -460 -478 -490 -496 -499 -501 -503 -508 -520 -546
Steven Brandon 30 June 2004
41
Table A11 Beef Myosin Hydration by pH with 400 moles of NaCl mole of myosin ndash Model 2
Myosin
Hydration moles of H2O mole of Myosin
moles H2OMole of Residue Beef Pork
pH 32 pH 36 pH 40 pH 44 pH 48 pH 52 pH 56 pH 60 pH 64 pH 68 pH 72 pH 76 pH 80 pH 84 pH 88 pH 92 pH 96
6 Kuntz Asp-
332 667 1113 1517 1773 1901 1958 1981 1990 1994 1996 1996 1996 1997 1997 1997 1997
2 Kuntz Asp 555 443 295 160 74 32 13 5 2 1 0 0 0 0 0 0 0
75 Kuntz Glu-
390 831 1510 2238 2769 3058 3191 3247 3270 3279 3283 3284 3285 3285 3285 3285 3285
2 Kuntz Glu 772 654 473 279 138 60 25 10 4 2 1 0 0 0 0 0 0
4 best guess His Cl 137 137 136 135 131 121 103 75 44 22 10 4 2 1 0 0 0
4 best guess His 0 1 2 6 14 32 67 120 175 215 236 245 249 251 252 252 252
4 Kuntz His+
114 114 113 112 108 99 82 57 32 15 7 3 1 0 0 0 0
45 best guess Lys Cl 1182 1182 1183 1184 1187 1195 1209 1232 1257 1275 1285 1289 1291 1291 1289 1283 1270
45 Kuntz Lys 0 0 0 0 0 0 0 0 0 0 1 1 4 9 22 54 131
45 Kuntz Lys+
985 985 984 983 980 972 957 935 910 892 881 876 873 867 856 829 765
3 best guess Arg Cl 309 309 309 310 311 313 316 322 329 334 336 338 338 339 341 344 353
3 Kuntz Arg 0 0 0 0 0 0 0 0 0 0 0 0 0 0 0 0 1
3 Kuntz Arg+
258 258 258 257 256 254 251 245 238 233 231 229 229 228 226 222 213
2 best guess Cys-
0 0 0 0 0 0 0 0 0 0 0 0 0 0 0 0 0
1 Kuntz Cys 0 0 0 0 0 0 0 0 0 0 0 0 0 0 0 0 0
75 Kuntz Tyr-
0 0 0 0 0 0 0 0 0 0 1 2 4 10 24 57 123
3 Kuntz Tyr 216 216 216 216 216 216 216 216 216 216 216 215 214 212 206 193 167
2 Kuntz Asn 117 117 117 117 117 117 117 117 117 117 117 117 117 117 117 117 117
2 Kuntz Gln 438 438 438 438 438 438 438 438 438 438 438 438 438 438 438 438 438
3 Kuntz Pro 351 351 351 351 351 351 351 351 351 351 351 351 351 351 351 351 351
2 Kuntz Ser 306 306 306 306 306 306 306 306 306 306 306 306 306 306 306 306 306
2 Kuntz Thr 387 387 387 387 387 387 387 387 387 387 387 387 387 387 387 387 387
2 Kuntz Trp 0 0 0 0 0 0 0 0 0 0 0 0 0 0 0 0 0
15 Kuntz Ala 493 493 493 493 493 493 493 493 493 493 493 493 493 493 493 493 493
1 Kuntz Gly 171 171 171 171 171 171 171 171 171 171 171 171 171 171 171 171 171
1 Kuntz Ile 180 180 180 180 180 180 180 180 180 180 180 180 180 180 180 180 180
1 Kuntz Leu 387 387 387 387 387 387 387 387 387 387 387 387 387 387 387 387 387
1 Kuntz Met 90 90 90 90 90 90 90 90 90 90 90 90 90 90 90 90 90
0 Kuntz Phe 0 0 0 0 0 0 0 0 0 0 0 0 0 0 0 0 0
1 Kuntz Val 167 167 167 167 167 167 167 167 167 167 167 167 167 167 167 167 167
(NH3) 0 0 0 0 0 0 0 0 0 0 0 0 0 0 0 0 0
TOTAL 8338 8884 9679 10483 11043 11340 11475 11532 11555 11564 11568 11570 11572 11576 11585 11604 11644
Steven Brandon 30 June 2004
42
Table A12 References sited by Puolanne Ruusunen and Vainionpaumlauml (2001)
Hamm R 1962 Uumlber das Wasserbindungsvermoumlgen des Saumlugetiersmuskels XII part Uumlber
das Unterschiedliche nicht auf pH-Differenzen beruhende Wasserbindungsvermoumlgen des Rindermuskels Z Lebensmittel-Untersuch und Forsch 117 p 415
Hamm R 1972 Kolloidchemie des Fleisches Paul Parey Co Berlin
Ishioroshi M Samejima K and Yasui T 1979 Heat induced gelation of myosin factors
of pH and salt concentrations Journal of Food Science 44 pp 741ndash744
Kivikari R (1996) Buffering capacity of meat Thesis University of Helsinki EKT -series 1048
Offer G and Knight P 1983 The structural basis of water-holding in meat Part 1
General principles and water uptake in meat processing In Lawrie RA Editor 1983 Developments in meat science Elsevier Applied Science London
Puolanne E and Ruusunen M 1983 Einfluss des Salzzusatzes auf das
Wasserbindungsvermoumlgen der verschiedener Fleischsortimente in Bruumlhwurst Fleischwirtschaft 62 pp 238ndash239
Warriss PD 1982 The relationship between pH45 and drip in pig muscle Journal of Food
Technology 17 pp 573ndash578
Steven Brandon 30 June 2004
43
References
1 Food The Chemistry of Its Components 2nd ed T P Coultate The Royal Society of
Chemistry London 1989 p 106 2 httpwwwaw-bccommathewsch02frameshtm 3 httpwwwaw-bccommathewsch02frameshtm 4 httpwwwneurowustleduneuromuscularmothermyosinhtm 5 httpwwwmrc-lmbcamacukmyosintreesmclasseshtml 6 Private Communication Dr J C Acton Clemson University June 3 2004 7 httpwwwaw-bccommathewsch02frameshtm 8 CHEMISTRY OF MEAT PROCESSING Animal Sciences 550 Lynn Knipe Associate
Professor Animal Sciences Food Science amp Technology The Ohio State University
September 29 2000 9 Pre-rigor injection using glycolytic inhibitors in low-quality beef muscles N C Jerez C R
Calkins and J Velazco J Anim Sci 2003 81 pp 997-1003 10 CHEMISTRY OF MEAT PROCESSING Animal Sciences 550 Lynn Knipe Associate
Professor Animal Sciences Food Science amp Technology The Ohio State University
September 29 2000 11 MAKING MEAT FROM MUSCLES httpwwwcluesabdnacuk8080mirrorsgrowthch90html 12 httpwwwsunysbedubiochemcourseslectures929bmo520html 13 Biochemistry Christopher K Mathews KE van Holde 2nd ed Menlo Park CA Benjamin
Cummings Pub Co Inc 1996 p 52 14 Biochemistry Christopher K Mathews KE van Holde 2nd ed Menlo Park CA Benjamin
Cummings Pub Co Inc 1996 p 52
Introduction to Protein Chemistry S Fox J S Foster Wiley 1957 p242 httpwwwmcukyedubiochemistryCoursesbch612powerpoint2001lecture3Lecture3_filesframehtm
16 The Science of Meat and Meat Products J F Price B S Schweigert 2nd ed Food amp
Nutrition Press Inc Westport Connecticut 1978 p106 17 Private Communication Dr J C Acton Clemson University May 31 2004 18 httpwwwmcukyedubiochemistryCoursesbch612powerpoint2001lecture3Lecture3_filesframehtm 19 The effect of net charge on the solubility activity and stability of ribonuclease Sa Kevin
L Shaw Gerald R Grimsley Gennady I Yakovlev Alexander A Makarov and C Nick Pace Protein Science (2001) 10 pp 1206-1215
20 Proteins Masterpieces of Polymer Chemistry Robert A Copeland Todayrsquos Chemist at
Work June 1992 pp 33-37 21 Food Chemistry 3rd ed Owen R Fennema Marcel-Dekker Inc New York 1996 p367 22 Water Relations of Foods R B Duckworth Academic Press New York 1975 pp 104 -
105 23 Hydration of Macromolecules III Hydration of Polypeptides ID Kuntz Journal of the
American Chemical Society Vol 93 No 2 January 27 1971 pp 514-516 24 Isoelectric Precipitation httpwwwrpiedudeptchem-engBiotech-EnvironPRECIPprecpphhtml 25 ATOMIC and IONIC RADIUS httpwwwchemguidecoukatomspropertiesatradiushtml 26 A Field Guide and Introduction to the Geology and Chemistry of Rocks and Minerals
Charles A Sorrell Golden Press Western Publishing Co Inc Racine WI 1973 p 23 27 httpwwwwouedulasphyscich412hydrolysishtm 28 httpvischemcadrecomauhtmlcdatomshtml 29 httpwwwmcukyedubiochemistryCoursesbch612powerpoint2001lecture3Lecture3_filesframehtm 30 Proteins Amino Acids and Peptides as Ions and Dipolar Ions EJ Cohn JT Edsall
Rheinhold New York NY 1942 httpwwwmcukyedubiochemistryCoursesbch612powerpoint2001lecture3Lecture3_filesframehtm
31 Biochemistry 601 Protein Solubility Purification and Analysis Last modified 82399 Dr Landry Tulane University landrymailhosttcstulaneedu httpwwwtulaneedu~biochemmedpurehtm
32 TECHNICAL BULLETIN - COOKED CURED HAM httpwwwsoloseasaltcomTechnicalTech5htm
Steven Brandon 30 June 2004
44
33 On the mechanism of water holding in meat The swelling and shrinking of myofibrils
Gerald Offer and John Trinick Meat Science Volume 8 Issue 4 1983 pp 245-281 34 Solubility of salmon myosin as affected by conformational changes at various ionic
strengths and pH Tein M Lin Jae W Park Journal of Food Science March-April 1998 v63 i2 p 215
35 Combined effects of NaCl and raw meat pH on water-holding in cooked sausage with
and without added phosphate Eero J Puolanne Marita H Ruusunen and Jukka I Vainionpaumlauml Meat Science Volume 58 Issue 1 May 2001 pp 1-7
36 Salt Effects on Ionization Equilibria of Histidines in Myoglobin Yung-Hsiang Kao Carolyn A Fitch Shibani Bhattacharya Christopher J Sarkisian Juliette T J Lecomte and
Bertrand Garciacutea-Moreno E Biophys J September 2000 Vol 79 No 3 pp 1637-1654 37 MEAT EMULSIONS C Lynn Knipe Meat Export Research Center Iowa State University
httpwwwagohio-stateedu~meatsciarchiveMEATEMULSIONShtm 38 Salt-induced swelling of meat The effect of storage time pH ion-type and
concentration Peter Wilding Nicholas Hedges and Peter J Lillford Meat Science Volume
18 Issue 1 1986 pp 55-75 39 httpenwikipediaorgwikiAmino_acidStructures 40 httpenwikipediaorgwikiAmino_acidChemical_properties
Steven Brandon 30 June 2004
22
Clminus ions bind to the filaments and increase the electrostatic repulsive force between them A crucial factor in swelling is likely to be the removal at a critical
salt concentration of one or more transverse structural constraints in the
myofibril (probably crossbridges the M-line or the Z-line) allowing the filament lattice to expand33
Adding salt moves the pH of the isoelectric point of myosin and exposes
hydrophobic and sulfhydryl groups to the protein surface leading to loss of
helical structure according to research into the relationship between solubility and conformational changes of salmon (Oncorhynchus tshawytscha) myofibrillar
proteins These conformational changes form more surface for protein
solubilization therefore boosting its solubility34
Puolanne Ruusunen and Vainionpaumlauml (2001) of University of Helsinki gave a good review of the effects of added salt to WHC of meat The following information is
extracted from this paper35 References sited in these extracts are listed in Table A12 in the Appendix
Salt (NaCl) is added to meat products to improve their binding and water-holding
properties Chloride ions tend to penetrate into the myofilaments causing them to swell (Hamm 1972) and the sodium ions form an ion cloud around the filaments
(Offer amp Knight 1983) This results in local concentration differences which lead to
an increased osmotic pressure within the myofibrils which causes the filament lattice
to swell Simultaneously the enlargement of negative net charge within the myosin
filaments loosens the filaments and finally causes the disintegration of the filament at
an ionic strength of 08 (without added phosphate) or in 04 (with added phosphate) In sausages without added phosphate water-holding increases rather linearly to the
salt content of ca 4 (Hamm 1972) With added phosphate there is a marked
increase in water-holding in the range of 10ndash15 NaCl (Puolanne amp Ruusunen
1983) This is due to the cleavage of actomyosin bonds by phosphates thus
facilitating the swelling of the filament lattice (Offer amp Knight 1983)
Similar phenomena take place when pH increases The negative net charge of
filaments increases causing an uneven distribution of charges within the filaments Without added salt the water-holding increases as the pH rises from 50 to 90
According to Hamm (1972) there is however not a marked correlation between the
ultimate pH value and water-holding in pH values below 57 (pork) or 58 (beef)
when the same muscles of different animals are compared Animal-to-animal
differences are larger in pH values above the isoelectric point than below (Hamm 1962) Warriss (1982) however found a marked decrease in water-holding in pork
in the pH-range of 51ndash58
When salt is added the binding of chloride ions decreases with increasing pH but the
binding of sodium ions increases (Hamm 1972) As a result the maximum in water-
holding is reached by about pH 60 in meat (Hamm) or in myosin gel (Ishioroshi
Samejima amp Yasui 1979)
Steven Brandon 30 June 2004
23
Offer and Knight (1988) stress that NaCl depolymerizes the thick filament shafts by
weakening interactions between the tails presumably by favoring the exposure of
previously buried charged or andor hydrophilic groups According to Kivikari (1996)
this changes the amount and nature of titratable groups accessible to the solvent probably revealing new groups having pKa values in the pH range 60ndash69
The increase of NaCl content causes a minor shift to lower pH values but this is not
relevant in the narrow range of 05ndash25 NaCl (ca 01ndash04 M) and low pH values of
this study NaCl alone seems not to have had a statistically significant overall effect on batter pH at concentration levels of NaCl in this study On the other hand WHC
and sausage pH were clearly affected by added NaCl alone as well as in the
interaction with meat pH
All cooked sausage variables had a maximum in water-holding by 25 added NaCl The water-holding of the sausages increases with increasing pH-value up to pH 61
and a further increase causes only a minor increase This study shows that water-
holding is strongly affected by the pH of raw materials in combination with NaCl
which renders it important to keep the pH high enough to ensure a sufficiently high
level of water-holding when aiming at lowered salt additions35
The plots shown below in Figure 10 are from the paper by Puolanne Ruusunen and Vainionpaumlauml35
Figure 10 The effect of pH amp NaCl on WHC in cooked sausage WOP without WP with
added phosphate 35
Steven Brandon 30 June 2004
24
I have re-plotted their data for beef and pork without added phosphate to see
how WHC varies with pH at a range of salt contents for both beef and pork (see
Figures 11 amp 12 below) These plots show that WHC for both beef and pork increases steadily without added NaCl as the pH is raised from 55 to 60 but
shows little additional increase at pH gt 60 This observation agrees in general
with the shape of the calculated hydration curve (See Figure 7)
Water Holding Capacity of Pork
0
20
40
60
80
100
54 56 58 60 62 64 66
pH
WH
C
g H
2O
g m
eat
00 NaCl 05 NaCl 10 NaCl
15 NaCl 20 NaCl 25 NaCl
Figure 11 WHC vs pH for Pork without added phosphates
Water Holding Capacity of Beef
0
20
40
60
80
100
54 56 58 60 62 64 66
pH
WH
C
g H
2O
g m
eat
00 NaCl 05 NaCl 10 NaCl
15 NaCl 20 NaCl 25 NaCl
Figure 12 WHC vs pH for Beef without added phosphates
Steven Brandon 30 June 2004
25
Figures 11 and 12 also show that WHC increases substantially with increasing salt content at least up to 25 NaCl
Kao et al (2000) offer the following comments on the way salt affects protein hydration and other properties Proteins are surrounded by an ionic double
layer the structure and properties of which are determined by the balance
between disorganizing thermal forces and the organizing effects of electrostatic interactions and hydration at the protein-solvent interface The properties of the
double layer are influenced by the density of charged and polar groups on the
surface of a protein Therefore salt and pH effects are thermodynamically coupled Strong interactions between proteins and partially dehydrated site-
bound ions are not observed frequently The effects of salt on the stability of
proteins are frequently interpreted in terms of screening of electrostatic
interactions by the ionic strength This concept was inherited from Linderstroslashm-Lang who applied the solution of the linearized Poisson-Boltzmann equation achieved by Debye and Huumlckel less than a year after their original publication in
1923 to understand the ionization properties of proteins The understanding of the physical nature of interactions between proteins and ions continues to advance However at present there is no unifying theoretical framework based
on simple physical principles capable of accounting quantitatively and structurally for all of the different types of salt effects that have been observed in proteins36
Analysis of NaCl effects on charge and WHC of myosin
Model 1 All salt ions interact with charged side groups
I have attempted to model the screening of myosinrsquos charged surface groups by salt ions by recalculating the myosin charge inventory and total hydration as a
function of pH by assuming that the salt ions effectively neutralize the charge of oppositely charged sites Figure 13 below is an illustration of the amino acid
composition of beef myosin at pH 44 where each circle represents one amino acid residue which may be acidic basic polar or non-polar For simplicity I
have divided the total number of amino acid residues by 100 to produce this representative illustration
Acidic
Basic
Polar
Non-Polar
Figure 13 Representative illustration of myosin amino acid composition
The sodium cations (+) and chloride anions (-) are also shown in Figure 13
Here these salt ions are shown screening the charge of oppositely charged amino
acid groups in the myosin molecule
Steven Brandon 30 June 2004
26
For my analysis I selected a salt concentration of 400 moles of NaCl mole of myosin I chose this salt concentration as one sufficient to significantly affect the
behavior of myosin based on the model described above) The results of this
analysis (for beef myosin) are shown in Tables A8 and A9 in the appendix Table A8 lists the charge inventory for beef myosin with 400 moles of added NaCl
mole of myosin As described above this table assumes that the available Na+
and Cl- ions combine with oppositely charged side groups effectively neutralizing them Below pH 40 not all of the free Na+ ions are consumed in interactions
with side groups because there are too few available anionic side groups
(aspartate and glutamate) In reality these free Na+ ions would tend to compete with the cationic side groups to attract Cl- ions but I have not
attempted to account for this in my model
Figure 14 below shows the net charge of myosin versus pH in the presence of
added NaCl This analysis indicates no change in net charge pH gt 40 is the
same as was calculated without added NaCl This is because above pH 40 where all of the available salt ions are employed in interactions with myosin side groups an equal number of positive and negative charges have been neutralized
Myosin Net Charge vs pH
-500
0
500
1000
30 40 50 60 70 80 90 100
pH
Ne
t C
ha
rge
of
My
os
in
Beef Pork Rabbit
Model 1
Figure 14 Net charge of myosin versus pH in the presence of added NaCl ndash Model 1
Table A9 lists the total hydration for beef myosin with 400 moles of added NaCl
mole of myosin I assumed that all of the salt-ion-screened (neutralized) side groups would have the bind the same number of water molecules per side group
as the corresponding unionized side groups For example I assumed that an
ionized aspartate group screened by a Na+ ion would bind the same amount of water as an uncharged aspartic acid group ie 2 molecules of water per group
Steven Brandon 30 June 2004
27
in this case Since the many of the side groups hole less water when unionized (or effectively neutralized by an oppositely charged salt ion) the total hydration
of myosin is lower than was calculated in the absence of added NaCl This is
illustrated in Figure 15 below which shows the calculated total hydration of myosin versus pH in the presence of added NaCl
Myosin Hydration vs pH
6000
7000
8000
9000
10000
11000
12000
30 40 50 60 70 80 90 100
pH
Hy
dra
tio
n
mo
les H
2O
mo
le o
f M
yo
sin
Beef Pork Rabbit
Model 1
Figure 15 Total hydration of myosin versus pH in the presence of added NaCl - Model 1
This analysis is unsatisfactory in that it predicts no change in isoelectric point
with added salt and in that it predicts a reduction in hydration of myosin with added salt These two predictions disagree with the reported observations that
adding low concentrations of salt lowers pI and increases hydration (at pH gt pI) Back to the drawing board
Model 2 Only anions interact with cationic side groups
The WHC of a meat system is greatly affected by the addition of salt To fully
understand this effect one must consider the action of both the cation and the
anion which result from the ionization of salt These ions must be absorbed by
the protein to affect WHC The effect of salt can be explained by the fact that the chloride anion being larger would be less hydrated than the sodium cation The
less hydrated ions are drawn closer to the charged protein group due to their
smaller radii The chloride ion should therefore have more of an effect on
screening of oppositely charged groups at pH above the pI than sodium resulting
in a net increase in negative charges and a shift of the pI of muscle to lower pH values An increase in negative charges results in repulsion of the protein groups
and an enlargement of the space available for absorption within the muscle37
This assertion that chloride ions being larger are less hydrated than sodium ions does not agree with the information I found elsewhere (see Table 7)28
Steven Brandon 30 June 2004
28
which states that both ions are hydrated by about six water molecules in solution However if one considers the counterion atmosphere surrounding a
catonic macroion (see Figure 4) such as myosin below its isoelectric point it is
not unreasonable to imagine that the anionic Cl- ions are held closely to the protein molecule while the cationic Na+ ions tend to remain at a greater distance
from the protein where they can have relatively little influence on the charge
and therefore the hydration behavior of the myosin molecule Figure 16 illustrates this concept
Figure 16 Illustration of the chloride screening effect assumed in Model 2
I have repeated my analysis using the assumption that only the Cl- ions are able
to interact with (and effectively neutralize) the cationic side groups while the Na+ ions do not interact with the myosin molecule at all
Table A10 lists the net charge of beef myosin versus pH as calculated using Model
2 As indicated in this table the isoelectric point is predicted by Model 2 to shift from about pH 52 (see Table 3) to lt pH 4 Figure 17 below shows that
isoelectic points of pork and rabbit myosin have shifted to lower pH This results
from the overall reduction in net charge resulting from neutralization of a large portion of the cationic side groups by charge interactions with chloride anions
+ + + + + +
+ + ++ + + + + + + + + +
+ + + +
Na+
Cl-
Steven Brandon 30 June 2004
29
Myosin Net Charge vs pH
-1000
-500
0
500
30 40 50 60 70 80 90 100
pH
Ne
t C
ha
rge
of
My
os
in
Beef Pork Rabbit
Model 2
Figure 17 Net charge of myosin versus pH in the presence of added NaCl ndash Model 2
Table A11 lists the total hydration of beef myosin versus pH as calculated using
Model 2 Figure 17 below shows the hydration curves for beef pork and rabbit myosin calculated using Model 2
Myosin Hydration vs pH
6000
7000
8000
9000
10000
11000
12000
30 40 50 60 70 80 90 100
pH
Hy
dra
tio
n
mo
les H
2O
mo
le o
f M
yo
sin
Beef Pork Rabbit
Model 2
Figure 18 Total hydration of myosin versus pH in the presence of added NaCl - Model 2
Contrary to expectations Model 2 predicts no change in the total hydration of
beef myosin in the presence of added salt This results from the fact that the
chloride ldquoscreenedrdquo cationic side groups are assumed to hold the same number of
water molecules per side group as the ldquounscreenedrdquo cationic groups in the
Steven Brandon 30 June 2004
30
absence of salt If this model has any validity it indicates that the observed changes in hydration in the presence of added salt are the consequence of
phenomena other than salt ion ndash charged side group interactions
Comparing the total number of charged groups present in the myosin molecule at
pI in the absence of added salt about pH 52 (see Table A6) to number of
charged groups at the pI of myosin in the presence of added salt (using Model 2) about pH 39 (see Table A10) reveals a substantial reduction in the total numbers
of charged groups at pI with added salt Table 8 below lists the total numbers of
charged groups at pI with and without added salt These numbers were obtained from Tables A6 and A10 for the no salt and added salt cases respectively (I
had to interpolate between data for pH 36 and pH 40 in Table A10 to obtain the
numbers of charged groups at pI = 387 for the added salt case)
Table 8 Inventory of Anionic amp Cationic Groups with and without added salt
No Added NaCl Added NaCl
pI pH 520 pH 387 Total Anionic Groups 725 265
Total Cationic Groups 725 265
The lower numbers of charged groups in the added salt case results from the effective screening of some of these groups by salt ions This overall reduction in
the number of charged groups in myosin reduces the repulsion between
neighboring myosin molecules allowing the proteins to draw more closely
together leaving less volume available for capillary entrapped water This is supported by Wilding et al (1986) who report that Rabbit longissimus dorsi
fibers were found to swell in hypertonic salt solutions such as 025 M KI or 06 M KCl to two to three times their original diameter Swelling occurs by a
combination of an increase in the myofilament lattice spacing and a loss of myofilament order However at pH below the isoelectric point of the myofibrillar proteins hypertonic salt solutions induce fiber shrinkage 38
Steven Brandon 30 June 2004
31
Appendix Table A1 Amino Acids39
Steven Brandon 30 June 2004
32
Table A2 Myosin Amino Acid Composition
Myosin aa aa aa Residuesmole aa Residue WtmoleResidues 10
5 g Symbol gmole Residues mole My Residue g mole My
Beef Pork Rabbit Beef Pork Rabbit
Aspartate D 11308
Aspartic acid 74 68 72 D 11408 333 306 325
Glutamate E 12711
Glutamic acid 97 100 103 E 12811 438 450 465
de-protonated Histidine H 13716
Histidine 14 15 15 H 13816 63 68 68
de-protonated Lysine K 12819
Lysine 107 105 85 K 12919 482 473 383
de-protonated Arginine R 15620
Arginine 42 46 41 R 15720 189 207 185
de-protonated Cysteine C 10215
Cysteine 0 0 9 C 10315 0 0 41
de-protonated Tyrosine Y 16212
Tyrosine 16 16 18 Y 16312 72 72 81
Asparagine 13 12 13 N 11410 59 54 57
Glutamine 49 50 52 Q 12814 219 225 233
Proline 26 20 22 P 9713 117 90 99
Serine 34 37 41 S 8709 153 167 185
Threonine 43 47 41 T 10112 194 212 185
Tryptophan 0 0 4 W 18623 0 0 18
Alanine 73 65 78 A 7109 329 293 351
Glycine 38 39 39 G 5707 171 176 176
Isoleucine 40 41 42 I 11318 180 185 189
Leucine 86 86 79 L 11318 387 387 356
Methionine 20 21 22 M 13121 90 95 99
Phenylalanine 27 28 27 F 14719 122 126 122
Valine 37 39 42 V 9915 167 176 189
(NH3) 106 120 86 170 477 540 387
Total residues (text) 836 837 845
Total residues (calc) 836 835 845 2318 2322 2322
Use 450000 kDa = 450000 gmole
Steven Brandon 30 June 2004
33
Table A3 Amino Acid Properties40
Abbrev Full Name Side chain
type Mass pI
pK1
(alpha -
COOH)
pK2
(alpha -+NH3)
pKr
(R) Remarks
A Ala Alanine hydrophobic 8909 611 235 987
C Cys Cysteine hydrophilic 12116 505 192 1070 837
Two cysteines can
form a disulfide
bond This enforces
tertiary structure
and such proteins as
insulin have disulfide
bonds
D Asp Aspartic acid acidic 13310 285 199 990 390
E Glu Glutamic acid acidic 14713 315 210 947 407
F Phe Phenylalanine hydrophobic 16519 549 220 931
G Gly Glycine hydrophilic 7507 606 235 978
Because of the two
hydrogen atoms at
the α carbon glycine
is not optically
active
H His Histidine basic 15516 760 180 933 604
I Ile Isoleucine hydrophobic 13117 605 232 976
K Lys Lysine basic 14619 960 216 906 1054
L Leu Leucine hydrophobic 13117 601 233 974
M Met Methionine hydrophobic 14921 574 213 928
Always the first
amino acid to be
incorporated into a
protein sometimes
removed after
translation
N Asn Asparagine hydrophilic 13212 541 214 872
P Pro Proline hydrophobic 11513 630 195 1064
Can disrupt protein
folding structures
like α helix or β
sheet
Q Gln Glutamine hydrophilic 14615 565 217 913
R Arg Arginine basic 17420 1076 182 899 1248
S Ser Serine hydrophilic 10509 568 219 921
T Thr Threonine hydrophilic 11912 560 209 910
V Val Valine hydrophobic 11715 600 239 974
W Trp Tryptophan hydrophobic 20423 589 246 941
Y Tyr Tyrosine hydrophilic 18119 564 220 921 1046
Steven Brandon 30 June 2004
34
Table A4 Fraction of Dissociated Amino Acid R-Groups by pH
Fraction of dissociated R-groups
[A-]([HA]+[A
-])
aa Dissociating Group pH pH pH pH pH pH pH pH pH pH pH pH pH pH pH pH pH
Class HA A- pKR 32 36 40 44 48 52 56 60 64 68 72 76 80 84 88 92 96
Asp-
A --COO- 390 017 033 056 076 089 095 098 099 100 100 100 100 100 100 100 100 100 Asp
-
Asp A --COOH 083 067 044 024 011 005 002 001 000 000 000 000 000 000 000 000 000 Asp
Glu-
A --COO- 407 012 025 046 068 084 093 097 099 100 100 100 100 100 100 100 100 100 Glu
-
Glu A --COOH 088 075 054 032 016 007 003 001 000 000 000 000 000 000 000 000 000 Glu
His B -N 604 000 000 001 002 005 013 027 048 070 085 094 097 099 100 100 100 100 His
His+
B -NH+ 100 100 099 098 095 087 073 052 030 015 006 003 001 000 000 000 000 His
+
Lys B -NH2 1079 000 000 000 000 000 000 000 000 000 000 000 000 000 000 001 003 006 Lys
Lys+
B -NH2H+ 100 100 100 100 100 100 100 100 100 100 100 100 100 100 099 097 094 Lys
+
Arg B -NH 1248 000 000 000 000 000 000 000 000 000 000 000 000 000 000 000 000 000 Arg
Arg+
B -NHH+ 100 100 100 100 100 100 100 100 100 100 100 100 100 100 100 100 100 Arg
+
Cys-
P --S- 835 000 000 000 000 000 000 000 000 001 003 007 015 031 053 074 088 095 Cys
-
Cys P --SH 100 100 100 100 100 100 100 100 099 097 093 085 069 047 026 012 005 Cys
Tyr-
NP --O- 1013 000 000 000 000 000 000 000 000 000 000 000 000 001 002 004 011 023 Tyr
-
Tyr NP --OH 100 100 100 100 100 100 100 100 100 100 100 100 099 098 096 089 077 Tyr
Steven Brandon 30 June 2004
35
Table A5 Beef Myosin Amino Acid Composition by pH
Myosin
Amino Acid Residues mole of Myosin
Beef Pork
pH 32 pH 36 pH 40 pH 44 pH 48 pH 52 pH 56 pH 60 pH 64 pH 68 pH 72 pH 76 pH 80 pH 84 pH 88 pH 92 pH 96
Asp-
55 111 185 253 296 317 326 330 332 332 333 333 333 333 333 333 333
Asp 277 222 147 80 37 16 7 3 1 0 0 0 0 0 0 0 0
Glu-
52 111 201 298 369 408 425 433 436 437 438 438 438 438 438 438 438
Glu 386 327 237 140 69 30 13 5 2 1 0 0 0 0 0 0 0
His 0 0 1 1 3 8 17 30 44 54 59 61 62 63 63 63 63
His+
63 63 62 62 60 55 46 33 19 9 4 2 1 0 0 0 0
Lys 0 0 0 0 0 0 0 0 0 0 0 0 1 2 5 12 29
Lys+
481 481 481 481 481 481 481 481 481 481 481 481 481 480 477 469 452
Arg 0 0 0 0 0 0 0 0 0 0 0 0 0 0 0 0 0
Arg+
189 189 189 189 189 189 189 189 189 189 189 189 189 189 189 189 189
Cys-
0 0 0 0 0 0 0 0 0 0 0 0 0 0 0 0 0
Cys 0 0 0 0 0 0 0 0 0 0 0 0 0 0 0 0 0
Tyr-
0 0 0 0 0 0 0 0 0 0 0 0 1 1 3 8 16
Tyr 72 72 72 72 72 72 72 72 72 72 72 72 71 71 69 64 56
Asn 59 59 59 59 59 59 59 59 59 59 59 59 59 59 59 59 59
Gln 219 219 219 219 219 219 219 219 219 219 219 219 219 219 219 219 219
Pro 117 117 117 117 117 117 117 117 117 117 117 117 117 117 117 117 117
Ser 153 153 153 153 153 153 153 153 153 153 153 153 153 153 153 153 153
Thr 194 194 194 194 194 194 194 194 194 194 194 194 194 194 194 194 194
Trp 0 0 0 0 0 0 0 0 0 0 0 0 0 0 0 0 0
Ala 329 329 329 329 329 329 329 329 329 329 329 329 329 329 329 329 329
Gly 171 171 171 171 171 171 171 171 171 171 171 171 171 171 171 171 171
Ile 180 180 180 180 180 180 180 180 180 180 180 180 180 180 180 180 180
Leu 387 387 387 387 387 387 387 387 387 387 387 387 387 387 387 387 387
Met 90 90 90 90 90 90 90 90 90 90 90 90 90 90 90 90 90
Phe 122 122 122 122 122 122 122 122 122 122 122 122 122 122 122 122 122
Val 167 167 167 167 167 167 167 167 167 167 167 167 167 167 167 167 167
(NH3) 477 477 477 477 477 477 477 477 477 477 477 477 477 477 477 477 477
Total residues (calc) 3762 3762 3762 3762 3762 3762 3762 3762 3762 3762 3762 3762 3762 3762 3762 3762 3762
Steven Brandon 30 June 2004
36
Table A6 Charge Inventory of Beef Myosin by pH
Myosin
Residue Charge Charge Inventory
Beef Pork
pH 32 pH 36 pH 40 pH 44 pH 48 pH 52 pH 56 pH 60 pH 64 pH 68 pH 72 pH 76 pH 80 pH 84 pH 88 pH 92 pH 96
-1 Asp-
-55 -111 -185 -253 -296 -317 -326 -330 -332 -332 -333 -333 -333 -333 -333 -333 -333
0 Asp 0 0 0 0 0 0 0 0 0 0 0 0 0 0 0 0 0
-1 Glu-
-52 -111 -201 -298 -369 -408 -425 -433 -436 -437 -438 -438 -438 -438 -438 -438 -438
0 Glu 0 0 0 0 0 0 0 0 0 0 0 0 0 0 0 0 0
0 His 0 0 0 0 0 0 0 0 0 0 0 0 0 0 0 0 0
1 His+
63 63 62 62 60 55 46 33 19 9 4 2 1 0 0 0 0
0 Lys 0 0 0 0 0 0 0 0 0 0 0 0 0 0 0 0 0
1 Lys+
481 481 481 481 481 481 481 481 481 481 481 481 481 480 477 469 452
0 Arg 0 0 0 0 0 0 0 0 0 0 0 0 0 0 0 0 0
1 Arg+
189 189 189 189 189 189 189 189 189 189 189 189 189 189 189 189 189
-1 Cys-
0 0 0 0 0 0 0 0 0 0 0 0 0 0 0 0 0
0 Cys 0 0 0 0 0 0 0 0 0 0 0 0 0 0 0 0 0
-1 Tyr-
0 0 0 0 0 0 0 0 0 0 0 0 -1 -1 -3 -8 -16
0 Tyr 0 0 0 0 0 0 0 0 0 0 0 0 0 0 0 0 0
0 Asn 0 0 0 0 0 0 0 0 0 0 0 0 0 0 0 0 0
0 Gln 0 0 0 0 0 0 0 0 0 0 0 0 0 0 0 0 0
0 Pro 0 0 0 0 0 0 0 0 0 0 0 0 0 0 0 0 0
0 Ser 0 0 0 0 0 0 0 0 0 0 0 0 0 0 0 0 0
0 The 0 0 0 0 0 0 0 0 0 0 0 0 0 0 0 0 0
0 Trp 0 0 0 0 0 0 0 0 0 0 0 0 0 0 0 0 0
0 Ala 0 0 0 0 0 0 0 0 0 0 0 0 0 0 0 0 0
0 Gly 0 0 0 0 0 0 0 0 0 0 0 0 0 0 0 0 0
0 Ile 0 0 0 0 0 0 0 0 0 0 0 0 0 0 0 0 0
0 Leu 0 0 0 0 0 0 0 0 0 0 0 0 0 0 0 0 0
0 Met 0 0 0 0 0 0 0 0 0 0 0 0 0 0 0 0 0
0 Phe 0 0 0 0 0 0 0 0 0 0 0 0 0 0 0 0 0
0 Val 0 0 0 0 0 0 0 0 0 0 0 0 0 0 0 0 0
0 (NH3) 0 0 0 0 0 0 0 0 0 0 0 0 0 0 0 0 0
TOTAL 626 511 346 181 65 1 -35 -60 -78 -90 -96 -99 -101 -103 -108 -120 -146
Steven Brandon 30 June 2004
37
Table A7 Beef Myosin Hydration by pH
Source Myosin
Hydration moles of H2O mole of Myosin
moles H2OMole of Residue Beef Pork
pH 32 pH 36 pH 40 pH 44 pH 48 pH 52 pH 56 pH 60 pH 64 pH 68 pH 72 pH 76 pH 80 pH 84 pH 88 pH 92 pH 96
60 Kuntz Asp-
332 667 1113 1517 1773 1901 1958 1981 1990 1994 1996 1996 1996 1997 1997 1997 1997
20 Kuntz Asp 555 443 295 160 74 32 13 5 2 1 0 0 0 0 0 0 0
75 Kuntz Glu-
390 831 1510 2238 2769 3058 3191 3247 3270 3279 3283 3284 3285 3285 3285 3285 3285
20 Kuntz Glu 772 654 473 279 138 60 25 10 4 2 1 0 0 0 0 0 0
40 best guess His 0 1 2 6 14 32 67 120 175 215 236 245 249 251 252 252 252
40 Kuntz His+
252 251 250 246 238 220 185 132 77 37 16 7 3 1 0 0 0
45 Kuntz Lys 0 0 0 0 0 0 0 0 0 0 1 1 4 9 22 54 131
45 Kuntz Lys+
2167 2167 2167 2167 2167 2167 2167 2167 2167 2167 2166 2165 2163 2158 2145 2112 2035
30 Kuntz Arg 0 0 0 0 0 0 0 0 0 0 0 0 0 0 0 0 1
30 Kuntz Arg+
567 567 567 567 567 567 567 567 567 567 567 567 567 567 567 567 566
20 best guess Cys-
0 0 0 0 0 0 0 0 0 0 0 0 0 0 0 0 0
10 Kuntz Cys 0 0 0 0 0 0 0 0 0 0 0 0 0 0 0 0 0
75 Kuntz Tyr-
0 0 0 0 0 0 0 0 0 0 1 2 4 10 24 57 123
30 Kuntz Tyr 216 216 216 216 216 216 216 216 216 216 216 215 214 212 206 193 167
20 Kuntz Asn 117 117 117 117 117 117 117 117 117 117 117 117 117 117 117 117 117
20 Kuntz Gln 438 438 438 438 438 438 438 438 438 438 438 438 438 438 438 438 438
30 Kuntz Pro 351 351 351 351 351 351 351 351 351 351 351 351 351 351 351 351 351
20 Kuntz Ser 306 306 306 306 306 306 306 306 306 306 306 306 306 306 306 306 306
20 Kuntz The 387 387 387 387 387 387 387 387 387 387 387 387 387 387 387 387 387
20 Kuntz Trp 0 0 0 0 0 0 0 0 0 0 0 0 0 0 0 0 0
15 Kuntz Ala 493 493 493 493 493 493 493 493 493 493 493 493 493 493 493 493 493
10 Kuntz Gly 171 171 171 171 171 171 171 171 171 171 171 171 171 171 171 171 171
10 Kuntz Ile 180 180 180 180 180 180 180 180 180 180 180 180 180 180 180 180 180
10 Kuntz Leu 387 387 387 387 387 387 387 387 387 387 387 387 387 387 387 387 387
10 Kuntz Met 90 90 90 90 90 90 90 90 90 90 90 90 90 90 90 90 90
00 Kuntz Phe 0 0 0 0 0 0 0 0 0 0 0 0 0 0 0 0 0
10 Kuntz Val 167 167 167 167 167 167 167 167 167 167 167 167 167 167 167 167 167
(NH3) 0 0 0 0 0 0 0 0 0 0 0 0 0 0 0 0 0
TOTAL 8338 8884 9679 10483 11043 11340 11475 11532 11555 11564 11568 11570 11572 11576 11585 11604 11644
Steven Brandon 30 June 2004
38
Table A8 Charge Inventory of Beef Myosin by pH with 400 moles of NaCl mole of myosin ndash Model 1 Myosin
Residue Charge Charge Inventory
Beef Pork
pH 32 pH 36 pH 40 pH 44 pH 48 pH 52 pH 56 pH 60 pH 64 pH 68 pH 72 pH 76 pH 80 pH 84 pH 88 pH 92 pH 96
0 Na Asp 0 0 0 0 0 0 0 0 0 0 0 0 0 0 0 0 0
-1 Asp-
0 0 0 -69 -118 -142 -153 -157 -159 -160 -160 -160 -160 -160 -161 -162 -164
0 Asp 0 0 0 0 0 0 0 0 0 0 0 0 0 0 0 0 0
0 Na Glu 0 0 0 0 0 0 0 0 0 0 0 0 0 0 0 0 0
-1 Glu-
0 0 0 -82 -147 -183 -199 -206 -209 -210 -210 -211 -211 -211 -212 -213 -215
0 Glu 0 0 0 0 0 0 0 0 0 0 0 0 0 0 0 0 0
0 His Cl 0 0 0 0 0 0 0 0 0 0 0 0 0 0 0 0 0
0 His 0 0 0 0 0 0 0 0 0 0 0 0 0 0 0 0 0
1 His+
29 29 28 28 27 25 20 14 8 4 2 1 0 0 0 0 0
0 Lys Cl 0 0 0 0 0 0 0 0 0 0 0 0 0 0 0 0 0
0 Lys 0 0 0 0 0 0 0 0 0 0 0 0 0 0 0 0 0
1 Lys+
219 219 219 218 218 216 213 208 202 198 196 195 194 193 190 184 170
0 Arg Cl 0 0 0 0 0 0 0 0 0 0 0 0 0 0 0 0 0
0 Arg 0 0 0 0 0 0 0 0 0 0 0 0 0 0 0 0 0
1 Arg+
86 86 86 86 85 85 84 82 79 78 77 76 76 76 75 74 71
0 Na Cys 0 0 0 0 0 0 0 0 0 0 0 0 0 0 0 0 0
-1 Cys-
0 0 0 0 0 0 0 0 0 0 0 0 0 0 0 0 0
0 Cys 0 0 0 0 0 0 0 0 0 0 0 0 0 0 0 0 0
0 Na Tyr 0 0 0 0 0 0 0 0 0 0 0 0 0 0 0 0 0
-1 Tyr-
0 0 0 0 0 0 0 0 0 0 0 0 0 -1 -2 -4 -8
0 Tyr 0 0 0 0 0 0 0 0 0 0 0 0 0 0 0 0 0
0 Asn 0 0 0 0 0 0 0 0 0 0 0 0 0 0 0 0 0
0 Gln 0 0 0 0 0 0 0 0 0 0 0 0 0 0 0 0 0
0 Pro 0 0 0 0 0 0 0 0 0 0 0 0 0 0 0 0 0
0 Ser 0 0 0 0 0 0 0 0 0 0 0 0 0 0 0 0 0
0 Thr 0 0 0 0 0 0 0 0 0 0 0 0 0 0 0 0 0
0 Trp 0 0 0 0 0 0 0 0 0 0 0 0 0 0 0 0 0
0 Ala 0 0 0 0 0 0 0 0 0 0 0 0 0 0 0 0 0
0 Gly 0 0 0 0 0 0 0 0 0 0 0 0 0 0 0 0 0
0 Ile 0 0 0 0 0 0 0 0 0 0 0 0 0 0 0 0 0
0 Leu 0 0 0 0 0 0 0 0 0 0 0 0 0 0 0 0 0
0 Met 0 0 0 0 0 0 0 0 0 0 0 0 0 0 0 0 0
0 Phe 0 0 0 0 0 0 0 0 0 0 0 0 0 0 0 0 0
0 Val 0 0 0 0 0 0 0 0 0 0 0 0 0 0 0 0 0
0 (NH3) 0 0 0 0 0 0 0 0 0 0 0 0 0 0 0 0 0
TOTAL 333 333 333 181 65 1 -35 -60 -78 -90 -96 -99 -101 -103 -108 -120 -146
Steven Brandon 30 June 2004
39
Table A9 Beef Myosin Hydration by pH with 400 moles of NaCl mole of myosin ndash Model 1
Myosin
Hydration moles of H2O mole of Myosin
moles H2OMole of Residue Beef Pork
pH 32 pH 36 pH 40 pH 44 pH 48 pH 52 pH 56 pH 60 pH 64 pH 68 pH 72 pH 76 pH 80 pH 84 pH 88 pH 92 pH 96
2 best guess Na Asp 111 222 371 367 356 350 347 346 346 345 345 345 345 345 344 342 338
6 Kuntz Asp-
0 0 0 416 706 852 916 943 953 958 959 960 961 962 965 971 982
2 Kuntz Asp 555 443 295 160 74 32 13 5 2 1 0 0 0 0 0 0 0
2 best guess Na Glu 104 222 403 433 444 450 453 454 454 454 455 454 454 454 453 450 445
75 Kuntz Glu-
0 0 0 614 1103 1370 1493 1545 1566 1575 1578 1580 1581 1583 1587 1597 1616
2 Kuntz Glu 772 654 473 279 138 60 25 10 4 2 1 0 0 0 0 0 0
4 best guess His Cl 137 137 136 135 131 121 103 75 44 22 10 4 2 1 0 0 0
4 best guess His 0 1 2 6 14 32 67 120 175 215 236 245 249 251 252 252 252
4 Kuntz His+
114 114 113 112 108 99 82 57 32 15 7 3 1 0 0 0 0
45 best guess Lys Cl 1182 1182 1183 1184 1187 1195 1209 1232 1257 1275 1285 1289 1291 1291 1289 1283 1270
45 Kuntz Lys 0 0 0 0 0 0 0 0 0 0 1 1 4 9 22 54 131
45 Kuntz Lys+
985 985 984 983 980 972 957 935 910 892 881 876 873 867 856 829 765
3 best guess Arg Cl 309 309 309 310 311 313 316 322 329 334 336 338 338 339 341 344 353
3 Kuntz Arg 0 0 0 0 0 0 0 0 0 0 0 0 0 0 0 0 1
3 Kuntz Arg+
258 258 258 257 256 254 251 245 238 233 231 229 229 228 226 222 213
1 best guess Na Cys 0 0 0 0 0 0 0 0 0 0 0 0 0 0 0 0 0
2 best guess Cys-
0 0 0 0 0 0 0 0 0 0 0 0 0 0 0 0 0
1 Kuntz Cys 0 0 0 0 0 0 0 0 0 0 0 0 0 0 0 0 0
3 Kuntz Na Tyr 0 0 0 0 0 0 0 0 0 0 0 0 1 2 5 12 25
75 Kuntz Tyr-
0 0 0 0 0 0 0 0 0 0 0 1 2 5 12 28 61
3 Kuntz Tyr 216 216 216 216 216 216 216 216 216 216 216 215 214 212 206 193 167
2 Kuntz Asn 117 117 117 117 117 117 117 117 117 117 117 117 117 117 117 117 117
2 Kuntz Gln 438 438 438 438 438 438 438 438 438 438 438 438 438 438 438 438 438
3 Kuntz Pro 351 351 351 351 351 351 351 351 351 351 351 351 351 351 351 351 351
2 Kuntz Ser 306 306 306 306 306 306 306 306 306 306 306 306 306 306 306 306 306
2 Kuntz Thr 387 387 387 387 387 387 387 387 387 387 387 387 387 387 387 387 387
2 Kuntz Trp 0 0 0 0 0 0 0 0 0 0 0 0 0 0 0 0 0
15 Kuntz Ala 493 493 493 493 493 493 493 493 493 493 493 493 493 493 493 493 493
1 Kuntz Gly 171 171 171 171 171 171 171 171 171 171 171 171 171 171 171 171 171
1 Kuntz Ile 180 180 180 180 180 180 180 180 180 180 180 180 180 180 180 180 180
1 Kuntz Leu 387 387 387 387 387 387 387 387 387 387 387 387 387 387 387 387 387
1 Kuntz Met 90 90 90 90 90 90 90 90 90 90 90 90 90 90 90 90 90
0 Kuntz Phe 0 0 0 0 0 0 0 0 0 0 0 0 0 0 0 0 0
1 Kuntz Val 167 167 167 167 167 167 167 167 167 167 167 167 167 167 167 167 167
(NH3) 0 0 0 0 0 0 0 0 0 0 0 0 0 0 0 0 0
TOTAL 7830 7830 7830 8558 9110 9403 9535 9591 9614 9623 9627 9629 9631 9635 9644 9665 9706
Steven Brandon 30 June 2004
40
Table A10 Charge Inventory of Beef Myosin by pH with 400 moles of NaCl mole of myosin ndash Model 2
Myosin
Residue Charge Charge Inventory
Beef Pork
pH 32 pH 36 pH 40 pH 44 pH 48 pH 52 pH 56 pH 60 pH 64 pH 68 pH 72 pH 76 pH 80 pH 84 pH 88 pH 92 pH 96
-1 Asp-
-55 -111 -185 -253 -296 -317 -326 -330 -332 -332 -333 -333 -333 -333 -333 -333 -333
0 Asp 0 0 0 0 0 0 0 0 0 0 0 0 0 0 0 0 0
-1 Glu-
-52 -111 -201 -298 -369 -408 -425 -433 -436 -437 -438 -438 -438 -438 -438 -438 -438
0 Glu 0 0 0 0 0 0 0 0 0 0 0 0 0 0 0 0 0
0 His Cl 0 0 0 0 0 0 0 0 0 0 0 0 0 0 0 0 0
0 His 0 0 0 0 0 0 0 0 0 0 0 0 0 0 0 0 0
1 His+
29 29 28 28 27 25 20 14 8 4 2 1 0 0 0 0 0
0 Lys Cl 0 0 0 0 0 0 0 0 0 0 0 0 0 0 0 0 0
0 Lys 0 0 0 0 0 0 0 0 0 0 0 0 0 0 0 0 0
1 Lys+
219 219 219 218 218 216 213 208 202 198 196 195 194 193 190 184 170
0 Arg Cl 0 0 0 0 0 0 0 0 0 0 0 0 0 0 0 0 0
0 Arg 0 0 0 0 0 0 0 0 0 0 0 0 0 0 0 0 0
1 Arg+
86 86 86 86 85 85 84 82 79 78 77 76 76 76 75 74 71
-1 Cys-
0 0 0 0 0 0 0 0 0 0 0 0 0 0 0 0 0
0 Cys 0 0 0 0 0 0 0 0 0 0 0 0 0 0 0 0 0
-1 Tyr-
0 0 0 0 0 0 0 0 0 0 0 0 -1 -1 -3 -8 -16
0 Tyr 0 0 0 0 0 0 0 0 0 0 0 0 0 0 0 0 0
0 Asn 0 0 0 0 0 0 0 0 0 0 0 0 0 0 0 0 0
0 Gln 0 0 0 0 0 0 0 0 0 0 0 0 0 0 0 0 0
0 Pro 0 0 0 0 0 0 0 0 0 0 0 0 0 0 0 0 0
0 Ser 0 0 0 0 0 0 0 0 0 0 0 0 0 0 0 0 0
0 Thr 0 0 0 0 0 0 0 0 0 0 0 0 0 0 0 0 0
0 Trp 0 0 0 0 0 0 0 0 0 0 0 0 0 0 0 0 0
0 Ala 0 0 0 0 0 0 0 0 0 0 0 0 0 0 0 0 0
0 Gly 0 0 0 0 0 0 0 0 0 0 0 0 0 0 0 0 0
0 Ile 0 0 0 0 0 0 0 0 0 0 0 0 0 0 0 0 0
0 Leu 0 0 0 0 0 0 0 0 0 0 0 0 0 0 0 0 0
0 Met 0 0 0 0 0 0 0 0 0 0 0 0 0 0 0 0 0
0 Phe 0 0 0 0 0 0 0 0 0 0 0 0 0 0 0 0 0
0 Val 0 0 0 0 0 0 0 0 0 0 0 0 0 0 0 0 0
0 (NH3) 0 0 0 0 0 0 0 0 0 0 0 0 0 0 0 0 0
TOTAL 226 111 -54 -219 -335 -399 -435 -460 -478 -490 -496 -499 -501 -503 -508 -520 -546
Steven Brandon 30 June 2004
41
Table A11 Beef Myosin Hydration by pH with 400 moles of NaCl mole of myosin ndash Model 2
Myosin
Hydration moles of H2O mole of Myosin
moles H2OMole of Residue Beef Pork
pH 32 pH 36 pH 40 pH 44 pH 48 pH 52 pH 56 pH 60 pH 64 pH 68 pH 72 pH 76 pH 80 pH 84 pH 88 pH 92 pH 96
6 Kuntz Asp-
332 667 1113 1517 1773 1901 1958 1981 1990 1994 1996 1996 1996 1997 1997 1997 1997
2 Kuntz Asp 555 443 295 160 74 32 13 5 2 1 0 0 0 0 0 0 0
75 Kuntz Glu-
390 831 1510 2238 2769 3058 3191 3247 3270 3279 3283 3284 3285 3285 3285 3285 3285
2 Kuntz Glu 772 654 473 279 138 60 25 10 4 2 1 0 0 0 0 0 0
4 best guess His Cl 137 137 136 135 131 121 103 75 44 22 10 4 2 1 0 0 0
4 best guess His 0 1 2 6 14 32 67 120 175 215 236 245 249 251 252 252 252
4 Kuntz His+
114 114 113 112 108 99 82 57 32 15 7 3 1 0 0 0 0
45 best guess Lys Cl 1182 1182 1183 1184 1187 1195 1209 1232 1257 1275 1285 1289 1291 1291 1289 1283 1270
45 Kuntz Lys 0 0 0 0 0 0 0 0 0 0 1 1 4 9 22 54 131
45 Kuntz Lys+
985 985 984 983 980 972 957 935 910 892 881 876 873 867 856 829 765
3 best guess Arg Cl 309 309 309 310 311 313 316 322 329 334 336 338 338 339 341 344 353
3 Kuntz Arg 0 0 0 0 0 0 0 0 0 0 0 0 0 0 0 0 1
3 Kuntz Arg+
258 258 258 257 256 254 251 245 238 233 231 229 229 228 226 222 213
2 best guess Cys-
0 0 0 0 0 0 0 0 0 0 0 0 0 0 0 0 0
1 Kuntz Cys 0 0 0 0 0 0 0 0 0 0 0 0 0 0 0 0 0
75 Kuntz Tyr-
0 0 0 0 0 0 0 0 0 0 1 2 4 10 24 57 123
3 Kuntz Tyr 216 216 216 216 216 216 216 216 216 216 216 215 214 212 206 193 167
2 Kuntz Asn 117 117 117 117 117 117 117 117 117 117 117 117 117 117 117 117 117
2 Kuntz Gln 438 438 438 438 438 438 438 438 438 438 438 438 438 438 438 438 438
3 Kuntz Pro 351 351 351 351 351 351 351 351 351 351 351 351 351 351 351 351 351
2 Kuntz Ser 306 306 306 306 306 306 306 306 306 306 306 306 306 306 306 306 306
2 Kuntz Thr 387 387 387 387 387 387 387 387 387 387 387 387 387 387 387 387 387
2 Kuntz Trp 0 0 0 0 0 0 0 0 0 0 0 0 0 0 0 0 0
15 Kuntz Ala 493 493 493 493 493 493 493 493 493 493 493 493 493 493 493 493 493
1 Kuntz Gly 171 171 171 171 171 171 171 171 171 171 171 171 171 171 171 171 171
1 Kuntz Ile 180 180 180 180 180 180 180 180 180 180 180 180 180 180 180 180 180
1 Kuntz Leu 387 387 387 387 387 387 387 387 387 387 387 387 387 387 387 387 387
1 Kuntz Met 90 90 90 90 90 90 90 90 90 90 90 90 90 90 90 90 90
0 Kuntz Phe 0 0 0 0 0 0 0 0 0 0 0 0 0 0 0 0 0
1 Kuntz Val 167 167 167 167 167 167 167 167 167 167 167 167 167 167 167 167 167
(NH3) 0 0 0 0 0 0 0 0 0 0 0 0 0 0 0 0 0
TOTAL 8338 8884 9679 10483 11043 11340 11475 11532 11555 11564 11568 11570 11572 11576 11585 11604 11644
Steven Brandon 30 June 2004
42
Table A12 References sited by Puolanne Ruusunen and Vainionpaumlauml (2001)
Hamm R 1962 Uumlber das Wasserbindungsvermoumlgen des Saumlugetiersmuskels XII part Uumlber
das Unterschiedliche nicht auf pH-Differenzen beruhende Wasserbindungsvermoumlgen des Rindermuskels Z Lebensmittel-Untersuch und Forsch 117 p 415
Hamm R 1972 Kolloidchemie des Fleisches Paul Parey Co Berlin
Ishioroshi M Samejima K and Yasui T 1979 Heat induced gelation of myosin factors
of pH and salt concentrations Journal of Food Science 44 pp 741ndash744
Kivikari R (1996) Buffering capacity of meat Thesis University of Helsinki EKT -series 1048
Offer G and Knight P 1983 The structural basis of water-holding in meat Part 1
General principles and water uptake in meat processing In Lawrie RA Editor 1983 Developments in meat science Elsevier Applied Science London
Puolanne E and Ruusunen M 1983 Einfluss des Salzzusatzes auf das
Wasserbindungsvermoumlgen der verschiedener Fleischsortimente in Bruumlhwurst Fleischwirtschaft 62 pp 238ndash239
Warriss PD 1982 The relationship between pH45 and drip in pig muscle Journal of Food
Technology 17 pp 573ndash578
Steven Brandon 30 June 2004
43
References
1 Food The Chemistry of Its Components 2nd ed T P Coultate The Royal Society of
Chemistry London 1989 p 106 2 httpwwwaw-bccommathewsch02frameshtm 3 httpwwwaw-bccommathewsch02frameshtm 4 httpwwwneurowustleduneuromuscularmothermyosinhtm 5 httpwwwmrc-lmbcamacukmyosintreesmclasseshtml 6 Private Communication Dr J C Acton Clemson University June 3 2004 7 httpwwwaw-bccommathewsch02frameshtm 8 CHEMISTRY OF MEAT PROCESSING Animal Sciences 550 Lynn Knipe Associate
Professor Animal Sciences Food Science amp Technology The Ohio State University
September 29 2000 9 Pre-rigor injection using glycolytic inhibitors in low-quality beef muscles N C Jerez C R
Calkins and J Velazco J Anim Sci 2003 81 pp 997-1003 10 CHEMISTRY OF MEAT PROCESSING Animal Sciences 550 Lynn Knipe Associate
Professor Animal Sciences Food Science amp Technology The Ohio State University
September 29 2000 11 MAKING MEAT FROM MUSCLES httpwwwcluesabdnacuk8080mirrorsgrowthch90html 12 httpwwwsunysbedubiochemcourseslectures929bmo520html 13 Biochemistry Christopher K Mathews KE van Holde 2nd ed Menlo Park CA Benjamin
Cummings Pub Co Inc 1996 p 52 14 Biochemistry Christopher K Mathews KE van Holde 2nd ed Menlo Park CA Benjamin
Cummings Pub Co Inc 1996 p 52
Introduction to Protein Chemistry S Fox J S Foster Wiley 1957 p242 httpwwwmcukyedubiochemistryCoursesbch612powerpoint2001lecture3Lecture3_filesframehtm
16 The Science of Meat and Meat Products J F Price B S Schweigert 2nd ed Food amp
Nutrition Press Inc Westport Connecticut 1978 p106 17 Private Communication Dr J C Acton Clemson University May 31 2004 18 httpwwwmcukyedubiochemistryCoursesbch612powerpoint2001lecture3Lecture3_filesframehtm 19 The effect of net charge on the solubility activity and stability of ribonuclease Sa Kevin
L Shaw Gerald R Grimsley Gennady I Yakovlev Alexander A Makarov and C Nick Pace Protein Science (2001) 10 pp 1206-1215
20 Proteins Masterpieces of Polymer Chemistry Robert A Copeland Todayrsquos Chemist at
Work June 1992 pp 33-37 21 Food Chemistry 3rd ed Owen R Fennema Marcel-Dekker Inc New York 1996 p367 22 Water Relations of Foods R B Duckworth Academic Press New York 1975 pp 104 -
105 23 Hydration of Macromolecules III Hydration of Polypeptides ID Kuntz Journal of the
American Chemical Society Vol 93 No 2 January 27 1971 pp 514-516 24 Isoelectric Precipitation httpwwwrpiedudeptchem-engBiotech-EnvironPRECIPprecpphhtml 25 ATOMIC and IONIC RADIUS httpwwwchemguidecoukatomspropertiesatradiushtml 26 A Field Guide and Introduction to the Geology and Chemistry of Rocks and Minerals
Charles A Sorrell Golden Press Western Publishing Co Inc Racine WI 1973 p 23 27 httpwwwwouedulasphyscich412hydrolysishtm 28 httpvischemcadrecomauhtmlcdatomshtml 29 httpwwwmcukyedubiochemistryCoursesbch612powerpoint2001lecture3Lecture3_filesframehtm 30 Proteins Amino Acids and Peptides as Ions and Dipolar Ions EJ Cohn JT Edsall
Rheinhold New York NY 1942 httpwwwmcukyedubiochemistryCoursesbch612powerpoint2001lecture3Lecture3_filesframehtm
31 Biochemistry 601 Protein Solubility Purification and Analysis Last modified 82399 Dr Landry Tulane University landrymailhosttcstulaneedu httpwwwtulaneedu~biochemmedpurehtm
32 TECHNICAL BULLETIN - COOKED CURED HAM httpwwwsoloseasaltcomTechnicalTech5htm
Steven Brandon 30 June 2004
44
33 On the mechanism of water holding in meat The swelling and shrinking of myofibrils
Gerald Offer and John Trinick Meat Science Volume 8 Issue 4 1983 pp 245-281 34 Solubility of salmon myosin as affected by conformational changes at various ionic
strengths and pH Tein M Lin Jae W Park Journal of Food Science March-April 1998 v63 i2 p 215
35 Combined effects of NaCl and raw meat pH on water-holding in cooked sausage with
and without added phosphate Eero J Puolanne Marita H Ruusunen and Jukka I Vainionpaumlauml Meat Science Volume 58 Issue 1 May 2001 pp 1-7
36 Salt Effects on Ionization Equilibria of Histidines in Myoglobin Yung-Hsiang Kao Carolyn A Fitch Shibani Bhattacharya Christopher J Sarkisian Juliette T J Lecomte and
Bertrand Garciacutea-Moreno E Biophys J September 2000 Vol 79 No 3 pp 1637-1654 37 MEAT EMULSIONS C Lynn Knipe Meat Export Research Center Iowa State University
httpwwwagohio-stateedu~meatsciarchiveMEATEMULSIONShtm 38 Salt-induced swelling of meat The effect of storage time pH ion-type and
concentration Peter Wilding Nicholas Hedges and Peter J Lillford Meat Science Volume
18 Issue 1 1986 pp 55-75 39 httpenwikipediaorgwikiAmino_acidStructures 40 httpenwikipediaorgwikiAmino_acidChemical_properties

Steven Brandon 30 June 2004
30
absence of salt If this model has any validity it indicates that the observed changes in hydration in the presence of added salt are the consequence of
phenomena other than salt ion ndash charged side group interactions
Comparing the total number of charged groups present in the myosin molecule at
pI in the absence of added salt about pH 52 (see Table A6) to number of
charged groups at the pI of myosin in the presence of added salt (using Model 2) about pH 39 (see Table A10) reveals a substantial reduction in the total numbers
of charged groups at pI with added salt Table 8 below lists the total numbers of
charged groups at pI with and without added salt These numbers were obtained from Tables A6 and A10 for the no salt and added salt cases respectively (I
had to interpolate between data for pH 36 and pH 40 in Table A10 to obtain the
numbers of charged groups at pI = 387 for the added salt case)
Table 8 Inventory of Anionic amp Cationic Groups with and without added salt
No Added NaCl Added NaCl
pI pH 520 pH 387 Total Anionic Groups 725 265
Total Cationic Groups 725 265
The lower numbers of charged groups in the added salt case results from the effective screening of some of these groups by salt ions This overall reduction in
the number of charged groups in myosin reduces the repulsion between
neighboring myosin molecules allowing the proteins to draw more closely
together leaving less volume available for capillary entrapped water This is supported by Wilding et al (1986) who report that Rabbit longissimus dorsi
fibers were found to swell in hypertonic salt solutions such as 025 M KI or 06 M KCl to two to three times their original diameter Swelling occurs by a
combination of an increase in the myofilament lattice spacing and a loss of myofilament order However at pH below the isoelectric point of the myofibrillar proteins hypertonic salt solutions induce fiber shrinkage 38
Steven Brandon 30 June 2004
31
Appendix Table A1 Amino Acids39
Steven Brandon 30 June 2004
32
Table A2 Myosin Amino Acid Composition
Myosin aa aa aa Residuesmole aa Residue WtmoleResidues 10
5 g Symbol gmole Residues mole My Residue g mole My
Beef Pork Rabbit Beef Pork Rabbit
Aspartate D 11308
Aspartic acid 74 68 72 D 11408 333 306 325
Glutamate E 12711
Glutamic acid 97 100 103 E 12811 438 450 465
de-protonated Histidine H 13716
Histidine 14 15 15 H 13816 63 68 68
de-protonated Lysine K 12819
Lysine 107 105 85 K 12919 482 473 383
de-protonated Arginine R 15620
Arginine 42 46 41 R 15720 189 207 185
de-protonated Cysteine C 10215
Cysteine 0 0 9 C 10315 0 0 41
de-protonated Tyrosine Y 16212
Tyrosine 16 16 18 Y 16312 72 72 81
Asparagine 13 12 13 N 11410 59 54 57
Glutamine 49 50 52 Q 12814 219 225 233
Proline 26 20 22 P 9713 117 90 99
Serine 34 37 41 S 8709 153 167 185
Threonine 43 47 41 T 10112 194 212 185
Tryptophan 0 0 4 W 18623 0 0 18
Alanine 73 65 78 A 7109 329 293 351
Glycine 38 39 39 G 5707 171 176 176
Isoleucine 40 41 42 I 11318 180 185 189
Leucine 86 86 79 L 11318 387 387 356
Methionine 20 21 22 M 13121 90 95 99
Phenylalanine 27 28 27 F 14719 122 126 122
Valine 37 39 42 V 9915 167 176 189
(NH3) 106 120 86 170 477 540 387
Total residues (text) 836 837 845
Total residues (calc) 836 835 845 2318 2322 2322
Use 450000 kDa = 450000 gmole
Steven Brandon 30 June 2004
33
Table A3 Amino Acid Properties40
Abbrev Full Name Side chain
type Mass pI
pK1
(alpha -
COOH)
pK2
(alpha -+NH3)
pKr
(R) Remarks
A Ala Alanine hydrophobic 8909 611 235 987
C Cys Cysteine hydrophilic 12116 505 192 1070 837
Two cysteines can
form a disulfide
bond This enforces
tertiary structure
and such proteins as
insulin have disulfide
bonds
D Asp Aspartic acid acidic 13310 285 199 990 390
E Glu Glutamic acid acidic 14713 315 210 947 407
F Phe Phenylalanine hydrophobic 16519 549 220 931
G Gly Glycine hydrophilic 7507 606 235 978
Because of the two
hydrogen atoms at
the α carbon glycine
is not optically
active
H His Histidine basic 15516 760 180 933 604
I Ile Isoleucine hydrophobic 13117 605 232 976
K Lys Lysine basic 14619 960 216 906 1054
L Leu Leucine hydrophobic 13117 601 233 974
M Met Methionine hydrophobic 14921 574 213 928
Always the first
amino acid to be
incorporated into a
protein sometimes
removed after
translation
N Asn Asparagine hydrophilic 13212 541 214 872
P Pro Proline hydrophobic 11513 630 195 1064
Can disrupt protein
folding structures
like α helix or β
sheet
Q Gln Glutamine hydrophilic 14615 565 217 913
R Arg Arginine basic 17420 1076 182 899 1248
S Ser Serine hydrophilic 10509 568 219 921
T Thr Threonine hydrophilic 11912 560 209 910
V Val Valine hydrophobic 11715 600 239 974
W Trp Tryptophan hydrophobic 20423 589 246 941
Y Tyr Tyrosine hydrophilic 18119 564 220 921 1046
Steven Brandon 30 June 2004
34
Table A4 Fraction of Dissociated Amino Acid R-Groups by pH
Fraction of dissociated R-groups
[A-]([HA]+[A
-])
aa Dissociating Group pH pH pH pH pH pH pH pH pH pH pH pH pH pH pH pH pH
Class HA A- pKR 32 36 40 44 48 52 56 60 64 68 72 76 80 84 88 92 96
Asp-
A --COO- 390 017 033 056 076 089 095 098 099 100 100 100 100 100 100 100 100 100 Asp
-
Asp A --COOH 083 067 044 024 011 005 002 001 000 000 000 000 000 000 000 000 000 Asp
Glu-
A --COO- 407 012 025 046 068 084 093 097 099 100 100 100 100 100 100 100 100 100 Glu
-
Glu A --COOH 088 075 054 032 016 007 003 001 000 000 000 000 000 000 000 000 000 Glu
His B -N 604 000 000 001 002 005 013 027 048 070 085 094 097 099 100 100 100 100 His
His+
B -NH+ 100 100 099 098 095 087 073 052 030 015 006 003 001 000 000 000 000 His
+
Lys B -NH2 1079 000 000 000 000 000 000 000 000 000 000 000 000 000 000 001 003 006 Lys
Lys+
B -NH2H+ 100 100 100 100 100 100 100 100 100 100 100 100 100 100 099 097 094 Lys
+
Arg B -NH 1248 000 000 000 000 000 000 000 000 000 000 000 000 000 000 000 000 000 Arg
Arg+
B -NHH+ 100 100 100 100 100 100 100 100 100 100 100 100 100 100 100 100 100 Arg
+
Cys-
P --S- 835 000 000 000 000 000 000 000 000 001 003 007 015 031 053 074 088 095 Cys
-
Cys P --SH 100 100 100 100 100 100 100 100 099 097 093 085 069 047 026 012 005 Cys
Tyr-
NP --O- 1013 000 000 000 000 000 000 000 000 000 000 000 000 001 002 004 011 023 Tyr
-
Tyr NP --OH 100 100 100 100 100 100 100 100 100 100 100 100 099 098 096 089 077 Tyr
Steven Brandon 30 June 2004
35
Table A5 Beef Myosin Amino Acid Composition by pH
Myosin
Amino Acid Residues mole of Myosin
Beef Pork
pH 32 pH 36 pH 40 pH 44 pH 48 pH 52 pH 56 pH 60 pH 64 pH 68 pH 72 pH 76 pH 80 pH 84 pH 88 pH 92 pH 96
Asp-
55 111 185 253 296 317 326 330 332 332 333 333 333 333 333 333 333
Asp 277 222 147 80 37 16 7 3 1 0 0 0 0 0 0 0 0
Glu-
52 111 201 298 369 408 425 433 436 437 438 438 438 438 438 438 438
Glu 386 327 237 140 69 30 13 5 2 1 0 0 0 0 0 0 0
His 0 0 1 1 3 8 17 30 44 54 59 61 62 63 63 63 63
His+
63 63 62 62 60 55 46 33 19 9 4 2 1 0 0 0 0
Lys 0 0 0 0 0 0 0 0 0 0 0 0 1 2 5 12 29
Lys+
481 481 481 481 481 481 481 481 481 481 481 481 481 480 477 469 452
Arg 0 0 0 0 0 0 0 0 0 0 0 0 0 0 0 0 0
Arg+
189 189 189 189 189 189 189 189 189 189 189 189 189 189 189 189 189
Cys-
0 0 0 0 0 0 0 0 0 0 0 0 0 0 0 0 0
Cys 0 0 0 0 0 0 0 0 0 0 0 0 0 0 0 0 0
Tyr-
0 0 0 0 0 0 0 0 0 0 0 0 1 1 3 8 16
Tyr 72 72 72 72 72 72 72 72 72 72 72 72 71 71 69 64 56
Asn 59 59 59 59 59 59 59 59 59 59 59 59 59 59 59 59 59
Gln 219 219 219 219 219 219 219 219 219 219 219 219 219 219 219 219 219
Pro 117 117 117 117 117 117 117 117 117 117 117 117 117 117 117 117 117
Ser 153 153 153 153 153 153 153 153 153 153 153 153 153 153 153 153 153
Thr 194 194 194 194 194 194 194 194 194 194 194 194 194 194 194 194 194
Trp 0 0 0 0 0 0 0 0 0 0 0 0 0 0 0 0 0
Ala 329 329 329 329 329 329 329 329 329 329 329 329 329 329 329 329 329
Gly 171 171 171 171 171 171 171 171 171 171 171 171 171 171 171 171 171
Ile 180 180 180 180 180 180 180 180 180 180 180 180 180 180 180 180 180
Leu 387 387 387 387 387 387 387 387 387 387 387 387 387 387 387 387 387
Met 90 90 90 90 90 90 90 90 90 90 90 90 90 90 90 90 90
Phe 122 122 122 122 122 122 122 122 122 122 122 122 122 122 122 122 122
Val 167 167 167 167 167 167 167 167 167 167 167 167 167 167 167 167 167
(NH3) 477 477 477 477 477 477 477 477 477 477 477 477 477 477 477 477 477
Total residues (calc) 3762 3762 3762 3762 3762 3762 3762 3762 3762 3762 3762 3762 3762 3762 3762 3762 3762
Steven Brandon 30 June 2004
36
Table A6 Charge Inventory of Beef Myosin by pH
Myosin
Residue Charge Charge Inventory
Beef Pork
pH 32 pH 36 pH 40 pH 44 pH 48 pH 52 pH 56 pH 60 pH 64 pH 68 pH 72 pH 76 pH 80 pH 84 pH 88 pH 92 pH 96
-1 Asp-
-55 -111 -185 -253 -296 -317 -326 -330 -332 -332 -333 -333 -333 -333 -333 -333 -333
0 Asp 0 0 0 0 0 0 0 0 0 0 0 0 0 0 0 0 0
-1 Glu-
-52 -111 -201 -298 -369 -408 -425 -433 -436 -437 -438 -438 -438 -438 -438 -438 -438
0 Glu 0 0 0 0 0 0 0 0 0 0 0 0 0 0 0 0 0
0 His 0 0 0 0 0 0 0 0 0 0 0 0 0 0 0 0 0
1 His+
63 63 62 62 60 55 46 33 19 9 4 2 1 0 0 0 0
0 Lys 0 0 0 0 0 0 0 0 0 0 0 0 0 0 0 0 0
1 Lys+
481 481 481 481 481 481 481 481 481 481 481 481 481 480 477 469 452
0 Arg 0 0 0 0 0 0 0 0 0 0 0 0 0 0 0 0 0
1 Arg+
189 189 189 189 189 189 189 189 189 189 189 189 189 189 189 189 189
-1 Cys-
0 0 0 0 0 0 0 0 0 0 0 0 0 0 0 0 0
0 Cys 0 0 0 0 0 0 0 0 0 0 0 0 0 0 0 0 0
-1 Tyr-
0 0 0 0 0 0 0 0 0 0 0 0 -1 -1 -3 -8 -16
0 Tyr 0 0 0 0 0 0 0 0 0 0 0 0 0 0 0 0 0
0 Asn 0 0 0 0 0 0 0 0 0 0 0 0 0 0 0 0 0
0 Gln 0 0 0 0 0 0 0 0 0 0 0 0 0 0 0 0 0
0 Pro 0 0 0 0 0 0 0 0 0 0 0 0 0 0 0 0 0
0 Ser 0 0 0 0 0 0 0 0 0 0 0 0 0 0 0 0 0
0 The 0 0 0 0 0 0 0 0 0 0 0 0 0 0 0 0 0
0 Trp 0 0 0 0 0 0 0 0 0 0 0 0 0 0 0 0 0
0 Ala 0 0 0 0 0 0 0 0 0 0 0 0 0 0 0 0 0
0 Gly 0 0 0 0 0 0 0 0 0 0 0 0 0 0 0 0 0
0 Ile 0 0 0 0 0 0 0 0 0 0 0 0 0 0 0 0 0
0 Leu 0 0 0 0 0 0 0 0 0 0 0 0 0 0 0 0 0
0 Met 0 0 0 0 0 0 0 0 0 0 0 0 0 0 0 0 0
0 Phe 0 0 0 0 0 0 0 0 0 0 0 0 0 0 0 0 0
0 Val 0 0 0 0 0 0 0 0 0 0 0 0 0 0 0 0 0
0 (NH3) 0 0 0 0 0 0 0 0 0 0 0 0 0 0 0 0 0
TOTAL 626 511 346 181 65 1 -35 -60 -78 -90 -96 -99 -101 -103 -108 -120 -146
Steven Brandon 30 June 2004
37
Table A7 Beef Myosin Hydration by pH
Source Myosin
Hydration moles of H2O mole of Myosin
moles H2OMole of Residue Beef Pork
pH 32 pH 36 pH 40 pH 44 pH 48 pH 52 pH 56 pH 60 pH 64 pH 68 pH 72 pH 76 pH 80 pH 84 pH 88 pH 92 pH 96
60 Kuntz Asp-
332 667 1113 1517 1773 1901 1958 1981 1990 1994 1996 1996 1996 1997 1997 1997 1997
20 Kuntz Asp 555 443 295 160 74 32 13 5 2 1 0 0 0 0 0 0 0
75 Kuntz Glu-
390 831 1510 2238 2769 3058 3191 3247 3270 3279 3283 3284 3285 3285 3285 3285 3285
20 Kuntz Glu 772 654 473 279 138 60 25 10 4 2 1 0 0 0 0 0 0
40 best guess His 0 1 2 6 14 32 67 120 175 215 236 245 249 251 252 252 252
40 Kuntz His+
252 251 250 246 238 220 185 132 77 37 16 7 3 1 0 0 0
45 Kuntz Lys 0 0 0 0 0 0 0 0 0 0 1 1 4 9 22 54 131
45 Kuntz Lys+
2167 2167 2167 2167 2167 2167 2167 2167 2167 2167 2166 2165 2163 2158 2145 2112 2035
30 Kuntz Arg 0 0 0 0 0 0 0 0 0 0 0 0 0 0 0 0 1
30 Kuntz Arg+
567 567 567 567 567 567 567 567 567 567 567 567 567 567 567 567 566
20 best guess Cys-
0 0 0 0 0 0 0 0 0 0 0 0 0 0 0 0 0
10 Kuntz Cys 0 0 0 0 0 0 0 0 0 0 0 0 0 0 0 0 0
75 Kuntz Tyr-
0 0 0 0 0 0 0 0 0 0 1 2 4 10 24 57 123
30 Kuntz Tyr 216 216 216 216 216 216 216 216 216 216 216 215 214 212 206 193 167
20 Kuntz Asn 117 117 117 117 117 117 117 117 117 117 117 117 117 117 117 117 117
20 Kuntz Gln 438 438 438 438 438 438 438 438 438 438 438 438 438 438 438 438 438
30 Kuntz Pro 351 351 351 351 351 351 351 351 351 351 351 351 351 351 351 351 351
20 Kuntz Ser 306 306 306 306 306 306 306 306 306 306 306 306 306 306 306 306 306
20 Kuntz The 387 387 387 387 387 387 387 387 387 387 387 387 387 387 387 387 387
20 Kuntz Trp 0 0 0 0 0 0 0 0 0 0 0 0 0 0 0 0 0
15 Kuntz Ala 493 493 493 493 493 493 493 493 493 493 493 493 493 493 493 493 493
10 Kuntz Gly 171 171 171 171 171 171 171 171 171 171 171 171 171 171 171 171 171
10 Kuntz Ile 180 180 180 180 180 180 180 180 180 180 180 180 180 180 180 180 180
10 Kuntz Leu 387 387 387 387 387 387 387 387 387 387 387 387 387 387 387 387 387
10 Kuntz Met 90 90 90 90 90 90 90 90 90 90 90 90 90 90 90 90 90
00 Kuntz Phe 0 0 0 0 0 0 0 0 0 0 0 0 0 0 0 0 0
10 Kuntz Val 167 167 167 167 167 167 167 167 167 167 167 167 167 167 167 167 167
(NH3) 0 0 0 0 0 0 0 0 0 0 0 0 0 0 0 0 0
TOTAL 8338 8884 9679 10483 11043 11340 11475 11532 11555 11564 11568 11570 11572 11576 11585 11604 11644
Steven Brandon 30 June 2004
38
Table A8 Charge Inventory of Beef Myosin by pH with 400 moles of NaCl mole of myosin ndash Model 1 Myosin
Residue Charge Charge Inventory
Beef Pork
pH 32 pH 36 pH 40 pH 44 pH 48 pH 52 pH 56 pH 60 pH 64 pH 68 pH 72 pH 76 pH 80 pH 84 pH 88 pH 92 pH 96
0 Na Asp 0 0 0 0 0 0 0 0 0 0 0 0 0 0 0 0 0
-1 Asp-
0 0 0 -69 -118 -142 -153 -157 -159 -160 -160 -160 -160 -160 -161 -162 -164
0 Asp 0 0 0 0 0 0 0 0 0 0 0 0 0 0 0 0 0
0 Na Glu 0 0 0 0 0 0 0 0 0 0 0 0 0 0 0 0 0
-1 Glu-
0 0 0 -82 -147 -183 -199 -206 -209 -210 -210 -211 -211 -211 -212 -213 -215
0 Glu 0 0 0 0 0 0 0 0 0 0 0 0 0 0 0 0 0
0 His Cl 0 0 0 0 0 0 0 0 0 0 0 0 0 0 0 0 0
0 His 0 0 0 0 0 0 0 0 0 0 0 0 0 0 0 0 0
1 His+
29 29 28 28 27 25 20 14 8 4 2 1 0 0 0 0 0
0 Lys Cl 0 0 0 0 0 0 0 0 0 0 0 0 0 0 0 0 0
0 Lys 0 0 0 0 0 0 0 0 0 0 0 0 0 0 0 0 0
1 Lys+
219 219 219 218 218 216 213 208 202 198 196 195 194 193 190 184 170
0 Arg Cl 0 0 0 0 0 0 0 0 0 0 0 0 0 0 0 0 0
0 Arg 0 0 0 0 0 0 0 0 0 0 0 0 0 0 0 0 0
1 Arg+
86 86 86 86 85 85 84 82 79 78 77 76 76 76 75 74 71
0 Na Cys 0 0 0 0 0 0 0 0 0 0 0 0 0 0 0 0 0
-1 Cys-
0 0 0 0 0 0 0 0 0 0 0 0 0 0 0 0 0
0 Cys 0 0 0 0 0 0 0 0 0 0 0 0 0 0 0 0 0
0 Na Tyr 0 0 0 0 0 0 0 0 0 0 0 0 0 0 0 0 0
-1 Tyr-
0 0 0 0 0 0 0 0 0 0 0 0 0 -1 -2 -4 -8
0 Tyr 0 0 0 0 0 0 0 0 0 0 0 0 0 0 0 0 0
0 Asn 0 0 0 0 0 0 0 0 0 0 0 0 0 0 0 0 0
0 Gln 0 0 0 0 0 0 0 0 0 0 0 0 0 0 0 0 0
0 Pro 0 0 0 0 0 0 0 0 0 0 0 0 0 0 0 0 0
0 Ser 0 0 0 0 0 0 0 0 0 0 0 0 0 0 0 0 0
0 Thr 0 0 0 0 0 0 0 0 0 0 0 0 0 0 0 0 0
0 Trp 0 0 0 0 0 0 0 0 0 0 0 0 0 0 0 0 0
0 Ala 0 0 0 0 0 0 0 0 0 0 0 0 0 0 0 0 0
0 Gly 0 0 0 0 0 0 0 0 0 0 0 0 0 0 0 0 0
0 Ile 0 0 0 0 0 0 0 0 0 0 0 0 0 0 0 0 0
0 Leu 0 0 0 0 0 0 0 0 0 0 0 0 0 0 0 0 0
0 Met 0 0 0 0 0 0 0 0 0 0 0 0 0 0 0 0 0
0 Phe 0 0 0 0 0 0 0 0 0 0 0 0 0 0 0 0 0
0 Val 0 0 0 0 0 0 0 0 0 0 0 0 0 0 0 0 0
0 (NH3) 0 0 0 0 0 0 0 0 0 0 0 0 0 0 0 0 0
TOTAL 333 333 333 181 65 1 -35 -60 -78 -90 -96 -99 -101 -103 -108 -120 -146
Steven Brandon 30 June 2004
39
Table A9 Beef Myosin Hydration by pH with 400 moles of NaCl mole of myosin ndash Model 1
Myosin
Hydration moles of H2O mole of Myosin
moles H2OMole of Residue Beef Pork
pH 32 pH 36 pH 40 pH 44 pH 48 pH 52 pH 56 pH 60 pH 64 pH 68 pH 72 pH 76 pH 80 pH 84 pH 88 pH 92 pH 96
2 best guess Na Asp 111 222 371 367 356 350 347 346 346 345 345 345 345 345 344 342 338
6 Kuntz Asp-
0 0 0 416 706 852 916 943 953 958 959 960 961 962 965 971 982
2 Kuntz Asp 555 443 295 160 74 32 13 5 2 1 0 0 0 0 0 0 0
2 best guess Na Glu 104 222 403 433 444 450 453 454 454 454 455 454 454 454 453 450 445
75 Kuntz Glu-
0 0 0 614 1103 1370 1493 1545 1566 1575 1578 1580 1581 1583 1587 1597 1616
2 Kuntz Glu 772 654 473 279 138 60 25 10 4 2 1 0 0 0 0 0 0
4 best guess His Cl 137 137 136 135 131 121 103 75 44 22 10 4 2 1 0 0 0
4 best guess His 0 1 2 6 14 32 67 120 175 215 236 245 249 251 252 252 252
4 Kuntz His+
114 114 113 112 108 99 82 57 32 15 7 3 1 0 0 0 0
45 best guess Lys Cl 1182 1182 1183 1184 1187 1195 1209 1232 1257 1275 1285 1289 1291 1291 1289 1283 1270
45 Kuntz Lys 0 0 0 0 0 0 0 0 0 0 1 1 4 9 22 54 131
45 Kuntz Lys+
985 985 984 983 980 972 957 935 910 892 881 876 873 867 856 829 765
3 best guess Arg Cl 309 309 309 310 311 313 316 322 329 334 336 338 338 339 341 344 353
3 Kuntz Arg 0 0 0 0 0 0 0 0 0 0 0 0 0 0 0 0 1
3 Kuntz Arg+
258 258 258 257 256 254 251 245 238 233 231 229 229 228 226 222 213
1 best guess Na Cys 0 0 0 0 0 0 0 0 0 0 0 0 0 0 0 0 0
2 best guess Cys-
0 0 0 0 0 0 0 0 0 0 0 0 0 0 0 0 0
1 Kuntz Cys 0 0 0 0 0 0 0 0 0 0 0 0 0 0 0 0 0
3 Kuntz Na Tyr 0 0 0 0 0 0 0 0 0 0 0 0 1 2 5 12 25
75 Kuntz Tyr-
0 0 0 0 0 0 0 0 0 0 0 1 2 5 12 28 61
3 Kuntz Tyr 216 216 216 216 216 216 216 216 216 216 216 215 214 212 206 193 167
2 Kuntz Asn 117 117 117 117 117 117 117 117 117 117 117 117 117 117 117 117 117
2 Kuntz Gln 438 438 438 438 438 438 438 438 438 438 438 438 438 438 438 438 438
3 Kuntz Pro 351 351 351 351 351 351 351 351 351 351 351 351 351 351 351 351 351
2 Kuntz Ser 306 306 306 306 306 306 306 306 306 306 306 306 306 306 306 306 306
2 Kuntz Thr 387 387 387 387 387 387 387 387 387 387 387 387 387 387 387 387 387
2 Kuntz Trp 0 0 0 0 0 0 0 0 0 0 0 0 0 0 0 0 0
15 Kuntz Ala 493 493 493 493 493 493 493 493 493 493 493 493 493 493 493 493 493
1 Kuntz Gly 171 171 171 171 171 171 171 171 171 171 171 171 171 171 171 171 171
1 Kuntz Ile 180 180 180 180 180 180 180 180 180 180 180 180 180 180 180 180 180
1 Kuntz Leu 387 387 387 387 387 387 387 387 387 387 387 387 387 387 387 387 387
1 Kuntz Met 90 90 90 90 90 90 90 90 90 90 90 90 90 90 90 90 90
0 Kuntz Phe 0 0 0 0 0 0 0 0 0 0 0 0 0 0 0 0 0
1 Kuntz Val 167 167 167 167 167 167 167 167 167 167 167 167 167 167 167 167 167
(NH3) 0 0 0 0 0 0 0 0 0 0 0 0 0 0 0 0 0
TOTAL 7830 7830 7830 8558 9110 9403 9535 9591 9614 9623 9627 9629 9631 9635 9644 9665 9706
Steven Brandon 30 June 2004
40
Table A10 Charge Inventory of Beef Myosin by pH with 400 moles of NaCl mole of myosin ndash Model 2
Myosin
Residue Charge Charge Inventory
Beef Pork
pH 32 pH 36 pH 40 pH 44 pH 48 pH 52 pH 56 pH 60 pH 64 pH 68 pH 72 pH 76 pH 80 pH 84 pH 88 pH 92 pH 96
-1 Asp-
-55 -111 -185 -253 -296 -317 -326 -330 -332 -332 -333 -333 -333 -333 -333 -333 -333
0 Asp 0 0 0 0 0 0 0 0 0 0 0 0 0 0 0 0 0
-1 Glu-
-52 -111 -201 -298 -369 -408 -425 -433 -436 -437 -438 -438 -438 -438 -438 -438 -438
0 Glu 0 0 0 0 0 0 0 0 0 0 0 0 0 0 0 0 0
0 His Cl 0 0 0 0 0 0 0 0 0 0 0 0 0 0 0 0 0
0 His 0 0 0 0 0 0 0 0 0 0 0 0 0 0 0 0 0
1 His+
29 29 28 28 27 25 20 14 8 4 2 1 0 0 0 0 0
0 Lys Cl 0 0 0 0 0 0 0 0 0 0 0 0 0 0 0 0 0
0 Lys 0 0 0 0 0 0 0 0 0 0 0 0 0 0 0 0 0
1 Lys+
219 219 219 218 218 216 213 208 202 198 196 195 194 193 190 184 170
0 Arg Cl 0 0 0 0 0 0 0 0 0 0 0 0 0 0 0 0 0
0 Arg 0 0 0 0 0 0 0 0 0 0 0 0 0 0 0 0 0
1 Arg+
86 86 86 86 85 85 84 82 79 78 77 76 76 76 75 74 71
-1 Cys-
0 0 0 0 0 0 0 0 0 0 0 0 0 0 0 0 0
0 Cys 0 0 0 0 0 0 0 0 0 0 0 0 0 0 0 0 0
-1 Tyr-
0 0 0 0 0 0 0 0 0 0 0 0 -1 -1 -3 -8 -16
0 Tyr 0 0 0 0 0 0 0 0 0 0 0 0 0 0 0 0 0
0 Asn 0 0 0 0 0 0 0 0 0 0 0 0 0 0 0 0 0
0 Gln 0 0 0 0 0 0 0 0 0 0 0 0 0 0 0 0 0
0 Pro 0 0 0 0 0 0 0 0 0 0 0 0 0 0 0 0 0
0 Ser 0 0 0 0 0 0 0 0 0 0 0 0 0 0 0 0 0
0 Thr 0 0 0 0 0 0 0 0 0 0 0 0 0 0 0 0 0
0 Trp 0 0 0 0 0 0 0 0 0 0 0 0 0 0 0 0 0
0 Ala 0 0 0 0 0 0 0 0 0 0 0 0 0 0 0 0 0
0 Gly 0 0 0 0 0 0 0 0 0 0 0 0 0 0 0 0 0
0 Ile 0 0 0 0 0 0 0 0 0 0 0 0 0 0 0 0 0
0 Leu 0 0 0 0 0 0 0 0 0 0 0 0 0 0 0 0 0
0 Met 0 0 0 0 0 0 0 0 0 0 0 0 0 0 0 0 0
0 Phe 0 0 0 0 0 0 0 0 0 0 0 0 0 0 0 0 0
0 Val 0 0 0 0 0 0 0 0 0 0 0 0 0 0 0 0 0
0 (NH3) 0 0 0 0 0 0 0 0 0 0 0 0 0 0 0 0 0
TOTAL 226 111 -54 -219 -335 -399 -435 -460 -478 -490 -496 -499 -501 -503 -508 -520 -546
Steven Brandon 30 June 2004
41
Table A11 Beef Myosin Hydration by pH with 400 moles of NaCl mole of myosin ndash Model 2
Myosin
Hydration moles of H2O mole of Myosin
moles H2OMole of Residue Beef Pork
pH 32 pH 36 pH 40 pH 44 pH 48 pH 52 pH 56 pH 60 pH 64 pH 68 pH 72 pH 76 pH 80 pH 84 pH 88 pH 92 pH 96
6 Kuntz Asp-
332 667 1113 1517 1773 1901 1958 1981 1990 1994 1996 1996 1996 1997 1997 1997 1997
2 Kuntz Asp 555 443 295 160 74 32 13 5 2 1 0 0 0 0 0 0 0
75 Kuntz Glu-
390 831 1510 2238 2769 3058 3191 3247 3270 3279 3283 3284 3285 3285 3285 3285 3285
2 Kuntz Glu 772 654 473 279 138 60 25 10 4 2 1 0 0 0 0 0 0
4 best guess His Cl 137 137 136 135 131 121 103 75 44 22 10 4 2 1 0 0 0
4 best guess His 0 1 2 6 14 32 67 120 175 215 236 245 249 251 252 252 252
4 Kuntz His+
114 114 113 112 108 99 82 57 32 15 7 3 1 0 0 0 0
45 best guess Lys Cl 1182 1182 1183 1184 1187 1195 1209 1232 1257 1275 1285 1289 1291 1291 1289 1283 1270
45 Kuntz Lys 0 0 0 0 0 0 0 0 0 0 1 1 4 9 22 54 131
45 Kuntz Lys+
985 985 984 983 980 972 957 935 910 892 881 876 873 867 856 829 765
3 best guess Arg Cl 309 309 309 310 311 313 316 322 329 334 336 338 338 339 341 344 353
3 Kuntz Arg 0 0 0 0 0 0 0 0 0 0 0 0 0 0 0 0 1
3 Kuntz Arg+
258 258 258 257 256 254 251 245 238 233 231 229 229 228 226 222 213
2 best guess Cys-
0 0 0 0 0 0 0 0 0 0 0 0 0 0 0 0 0
1 Kuntz Cys 0 0 0 0 0 0 0 0 0 0 0 0 0 0 0 0 0
75 Kuntz Tyr-
0 0 0 0 0 0 0 0 0 0 1 2 4 10 24 57 123
3 Kuntz Tyr 216 216 216 216 216 216 216 216 216 216 216 215 214 212 206 193 167
2 Kuntz Asn 117 117 117 117 117 117 117 117 117 117 117 117 117 117 117 117 117
2 Kuntz Gln 438 438 438 438 438 438 438 438 438 438 438 438 438 438 438 438 438
3 Kuntz Pro 351 351 351 351 351 351 351 351 351 351 351 351 351 351 351 351 351
2 Kuntz Ser 306 306 306 306 306 306 306 306 306 306 306 306 306 306 306 306 306
2 Kuntz Thr 387 387 387 387 387 387 387 387 387 387 387 387 387 387 387 387 387
2 Kuntz Trp 0 0 0 0 0 0 0 0 0 0 0 0 0 0 0 0 0
15 Kuntz Ala 493 493 493 493 493 493 493 493 493 493 493 493 493 493 493 493 493
1 Kuntz Gly 171 171 171 171 171 171 171 171 171 171 171 171 171 171 171 171 171
1 Kuntz Ile 180 180 180 180 180 180 180 180 180 180 180 180 180 180 180 180 180
1 Kuntz Leu 387 387 387 387 387 387 387 387 387 387 387 387 387 387 387 387 387
1 Kuntz Met 90 90 90 90 90 90 90 90 90 90 90 90 90 90 90 90 90
0 Kuntz Phe 0 0 0 0 0 0 0 0 0 0 0 0 0 0 0 0 0
1 Kuntz Val 167 167 167 167 167 167 167 167 167 167 167 167 167 167 167 167 167
(NH3) 0 0 0 0 0 0 0 0 0 0 0 0 0 0 0 0 0
TOTAL 8338 8884 9679 10483 11043 11340 11475 11532 11555 11564 11568 11570 11572 11576 11585 11604 11644
Steven Brandon 30 June 2004
42
Table A12 References sited by Puolanne Ruusunen and Vainionpaumlauml (2001)
Hamm R 1962 Uumlber das Wasserbindungsvermoumlgen des Saumlugetiersmuskels XII part Uumlber
das Unterschiedliche nicht auf pH-Differenzen beruhende Wasserbindungsvermoumlgen des Rindermuskels Z Lebensmittel-Untersuch und Forsch 117 p 415
Hamm R 1972 Kolloidchemie des Fleisches Paul Parey Co Berlin
Ishioroshi M Samejima K and Yasui T 1979 Heat induced gelation of myosin factors
of pH and salt concentrations Journal of Food Science 44 pp 741ndash744
Kivikari R (1996) Buffering capacity of meat Thesis University of Helsinki EKT -series 1048
Offer G and Knight P 1983 The structural basis of water-holding in meat Part 1
General principles and water uptake in meat processing In Lawrie RA Editor 1983 Developments in meat science Elsevier Applied Science London
Puolanne E and Ruusunen M 1983 Einfluss des Salzzusatzes auf das
Wasserbindungsvermoumlgen der verschiedener Fleischsortimente in Bruumlhwurst Fleischwirtschaft 62 pp 238ndash239
Warriss PD 1982 The relationship between pH45 and drip in pig muscle Journal of Food
Technology 17 pp 573ndash578
Steven Brandon 30 June 2004
43
References
1 Food The Chemistry of Its Components 2nd ed T P Coultate The Royal Society of
Chemistry London 1989 p 106 2 httpwwwaw-bccommathewsch02frameshtm 3 httpwwwaw-bccommathewsch02frameshtm 4 httpwwwneurowustleduneuromuscularmothermyosinhtm 5 httpwwwmrc-lmbcamacukmyosintreesmclasseshtml 6 Private Communication Dr J C Acton Clemson University June 3 2004 7 httpwwwaw-bccommathewsch02frameshtm 8 CHEMISTRY OF MEAT PROCESSING Animal Sciences 550 Lynn Knipe Associate
Professor Animal Sciences Food Science amp Technology The Ohio State University
September 29 2000 9 Pre-rigor injection using glycolytic inhibitors in low-quality beef muscles N C Jerez C R
Calkins and J Velazco J Anim Sci 2003 81 pp 997-1003 10 CHEMISTRY OF MEAT PROCESSING Animal Sciences 550 Lynn Knipe Associate
Professor Animal Sciences Food Science amp Technology The Ohio State University
September 29 2000 11 MAKING MEAT FROM MUSCLES httpwwwcluesabdnacuk8080mirrorsgrowthch90html 12 httpwwwsunysbedubiochemcourseslectures929bmo520html 13 Biochemistry Christopher K Mathews KE van Holde 2nd ed Menlo Park CA Benjamin
Cummings Pub Co Inc 1996 p 52 14 Biochemistry Christopher K Mathews KE van Holde 2nd ed Menlo Park CA Benjamin
Cummings Pub Co Inc 1996 p 52
Introduction to Protein Chemistry S Fox J S Foster Wiley 1957 p242 httpwwwmcukyedubiochemistryCoursesbch612powerpoint2001lecture3Lecture3_filesframehtm
16 The Science of Meat and Meat Products J F Price B S Schweigert 2nd ed Food amp
Nutrition Press Inc Westport Connecticut 1978 p106 17 Private Communication Dr J C Acton Clemson University May 31 2004 18 httpwwwmcukyedubiochemistryCoursesbch612powerpoint2001lecture3Lecture3_filesframehtm 19 The effect of net charge on the solubility activity and stability of ribonuclease Sa Kevin
L Shaw Gerald R Grimsley Gennady I Yakovlev Alexander A Makarov and C Nick Pace Protein Science (2001) 10 pp 1206-1215
20 Proteins Masterpieces of Polymer Chemistry Robert A Copeland Todayrsquos Chemist at
Work June 1992 pp 33-37 21 Food Chemistry 3rd ed Owen R Fennema Marcel-Dekker Inc New York 1996 p367 22 Water Relations of Foods R B Duckworth Academic Press New York 1975 pp 104 -
105 23 Hydration of Macromolecules III Hydration of Polypeptides ID Kuntz Journal of the
American Chemical Society Vol 93 No 2 January 27 1971 pp 514-516 24 Isoelectric Precipitation httpwwwrpiedudeptchem-engBiotech-EnvironPRECIPprecpphhtml 25 ATOMIC and IONIC RADIUS httpwwwchemguidecoukatomspropertiesatradiushtml 26 A Field Guide and Introduction to the Geology and Chemistry of Rocks and Minerals
Charles A Sorrell Golden Press Western Publishing Co Inc Racine WI 1973 p 23 27 httpwwwwouedulasphyscich412hydrolysishtm 28 httpvischemcadrecomauhtmlcdatomshtml 29 httpwwwmcukyedubiochemistryCoursesbch612powerpoint2001lecture3Lecture3_filesframehtm 30 Proteins Amino Acids and Peptides as Ions and Dipolar Ions EJ Cohn JT Edsall
Rheinhold New York NY 1942 httpwwwmcukyedubiochemistryCoursesbch612powerpoint2001lecture3Lecture3_filesframehtm
31 Biochemistry 601 Protein Solubility Purification and Analysis Last modified 82399 Dr Landry Tulane University landrymailhosttcstulaneedu httpwwwtulaneedu~biochemmedpurehtm
32 TECHNICAL BULLETIN - COOKED CURED HAM httpwwwsoloseasaltcomTechnicalTech5htm
Steven Brandon 30 June 2004
44
33 On the mechanism of water holding in meat The swelling and shrinking of myofibrils
Gerald Offer and John Trinick Meat Science Volume 8 Issue 4 1983 pp 245-281 34 Solubility of salmon myosin as affected by conformational changes at various ionic
strengths and pH Tein M Lin Jae W Park Journal of Food Science March-April 1998 v63 i2 p 215
35 Combined effects of NaCl and raw meat pH on water-holding in cooked sausage with
and without added phosphate Eero J Puolanne Marita H Ruusunen and Jukka I Vainionpaumlauml Meat Science Volume 58 Issue 1 May 2001 pp 1-7
36 Salt Effects on Ionization Equilibria of Histidines in Myoglobin Yung-Hsiang Kao Carolyn A Fitch Shibani Bhattacharya Christopher J Sarkisian Juliette T J Lecomte and
Bertrand Garciacutea-Moreno E Biophys J September 2000 Vol 79 No 3 pp 1637-1654 37 MEAT EMULSIONS C Lynn Knipe Meat Export Research Center Iowa State University
httpwwwagohio-stateedu~meatsciarchiveMEATEMULSIONShtm 38 Salt-induced swelling of meat The effect of storage time pH ion-type and
concentration Peter Wilding Nicholas Hedges and Peter J Lillford Meat Science Volume
18 Issue 1 1986 pp 55-75 39 httpenwikipediaorgwikiAmino_acidStructures 40 httpenwikipediaorgwikiAmino_acidChemical_properties
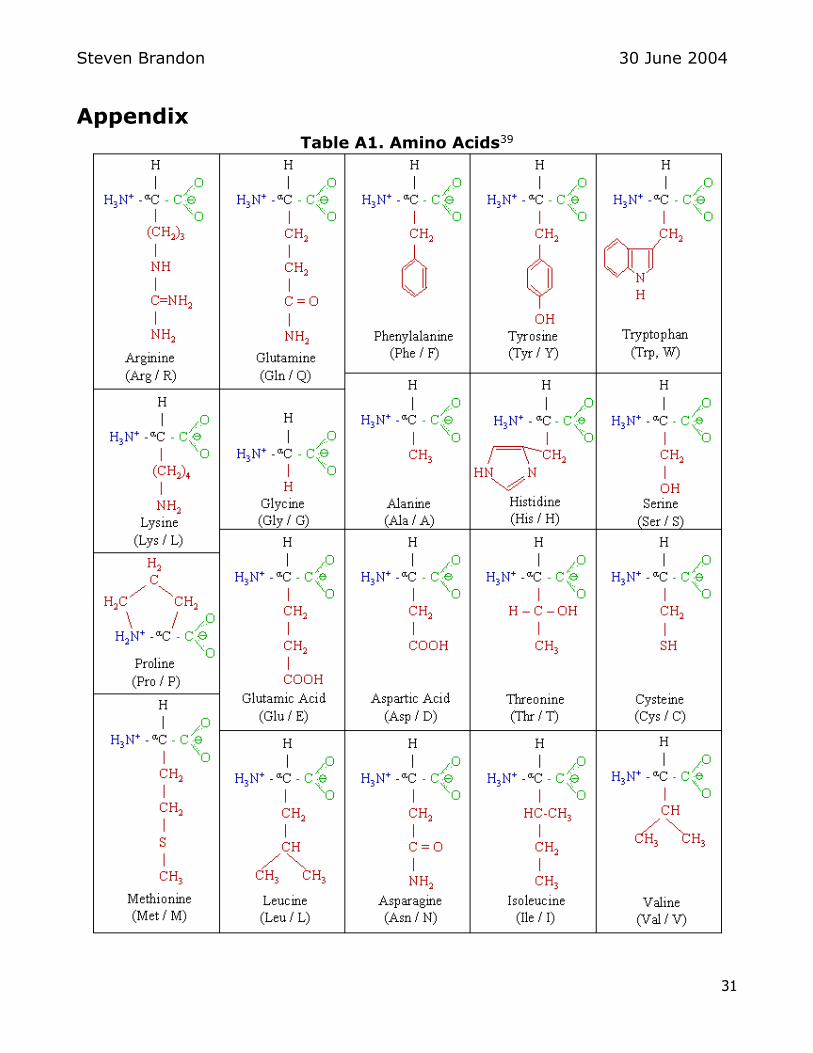
Steven Brandon 30 June 2004
31
Appendix Table A1 Amino Acids39
Steven Brandon 30 June 2004
32
Table A2 Myosin Amino Acid Composition
Myosin aa aa aa Residuesmole aa Residue WtmoleResidues 10
5 g Symbol gmole Residues mole My Residue g mole My
Beef Pork Rabbit Beef Pork Rabbit
Aspartate D 11308
Aspartic acid 74 68 72 D 11408 333 306 325
Glutamate E 12711
Glutamic acid 97 100 103 E 12811 438 450 465
de-protonated Histidine H 13716
Histidine 14 15 15 H 13816 63 68 68
de-protonated Lysine K 12819
Lysine 107 105 85 K 12919 482 473 383
de-protonated Arginine R 15620
Arginine 42 46 41 R 15720 189 207 185
de-protonated Cysteine C 10215
Cysteine 0 0 9 C 10315 0 0 41
de-protonated Tyrosine Y 16212
Tyrosine 16 16 18 Y 16312 72 72 81
Asparagine 13 12 13 N 11410 59 54 57
Glutamine 49 50 52 Q 12814 219 225 233
Proline 26 20 22 P 9713 117 90 99
Serine 34 37 41 S 8709 153 167 185
Threonine 43 47 41 T 10112 194 212 185
Tryptophan 0 0 4 W 18623 0 0 18
Alanine 73 65 78 A 7109 329 293 351
Glycine 38 39 39 G 5707 171 176 176
Isoleucine 40 41 42 I 11318 180 185 189
Leucine 86 86 79 L 11318 387 387 356
Methionine 20 21 22 M 13121 90 95 99
Phenylalanine 27 28 27 F 14719 122 126 122
Valine 37 39 42 V 9915 167 176 189
(NH3) 106 120 86 170 477 540 387
Total residues (text) 836 837 845
Total residues (calc) 836 835 845 2318 2322 2322
Use 450000 kDa = 450000 gmole
Steven Brandon 30 June 2004
33
Table A3 Amino Acid Properties40
Abbrev Full Name Side chain
type Mass pI
pK1
(alpha -
COOH)
pK2
(alpha -+NH3)
pKr
(R) Remarks
A Ala Alanine hydrophobic 8909 611 235 987
C Cys Cysteine hydrophilic 12116 505 192 1070 837
Two cysteines can
form a disulfide
bond This enforces
tertiary structure
and such proteins as
insulin have disulfide
bonds
D Asp Aspartic acid acidic 13310 285 199 990 390
E Glu Glutamic acid acidic 14713 315 210 947 407
F Phe Phenylalanine hydrophobic 16519 549 220 931
G Gly Glycine hydrophilic 7507 606 235 978
Because of the two
hydrogen atoms at
the α carbon glycine
is not optically
active
H His Histidine basic 15516 760 180 933 604
I Ile Isoleucine hydrophobic 13117 605 232 976
K Lys Lysine basic 14619 960 216 906 1054
L Leu Leucine hydrophobic 13117 601 233 974
M Met Methionine hydrophobic 14921 574 213 928
Always the first
amino acid to be
incorporated into a
protein sometimes
removed after
translation
N Asn Asparagine hydrophilic 13212 541 214 872
P Pro Proline hydrophobic 11513 630 195 1064
Can disrupt protein
folding structures
like α helix or β
sheet
Q Gln Glutamine hydrophilic 14615 565 217 913
R Arg Arginine basic 17420 1076 182 899 1248
S Ser Serine hydrophilic 10509 568 219 921
T Thr Threonine hydrophilic 11912 560 209 910
V Val Valine hydrophobic 11715 600 239 974
W Trp Tryptophan hydrophobic 20423 589 246 941
Y Tyr Tyrosine hydrophilic 18119 564 220 921 1046
Steven Brandon 30 June 2004
34
Table A4 Fraction of Dissociated Amino Acid R-Groups by pH
Fraction of dissociated R-groups
[A-]([HA]+[A
-])
aa Dissociating Group pH pH pH pH pH pH pH pH pH pH pH pH pH pH pH pH pH
Class HA A- pKR 32 36 40 44 48 52 56 60 64 68 72 76 80 84 88 92 96
Asp-
A --COO- 390 017 033 056 076 089 095 098 099 100 100 100 100 100 100 100 100 100 Asp
-
Asp A --COOH 083 067 044 024 011 005 002 001 000 000 000 000 000 000 000 000 000 Asp
Glu-
A --COO- 407 012 025 046 068 084 093 097 099 100 100 100 100 100 100 100 100 100 Glu
-
Glu A --COOH 088 075 054 032 016 007 003 001 000 000 000 000 000 000 000 000 000 Glu
His B -N 604 000 000 001 002 005 013 027 048 070 085 094 097 099 100 100 100 100 His
His+
B -NH+ 100 100 099 098 095 087 073 052 030 015 006 003 001 000 000 000 000 His
+
Lys B -NH2 1079 000 000 000 000 000 000 000 000 000 000 000 000 000 000 001 003 006 Lys
Lys+
B -NH2H+ 100 100 100 100 100 100 100 100 100 100 100 100 100 100 099 097 094 Lys
+
Arg B -NH 1248 000 000 000 000 000 000 000 000 000 000 000 000 000 000 000 000 000 Arg
Arg+
B -NHH+ 100 100 100 100 100 100 100 100 100 100 100 100 100 100 100 100 100 Arg
+
Cys-
P --S- 835 000 000 000 000 000 000 000 000 001 003 007 015 031 053 074 088 095 Cys
-
Cys P --SH 100 100 100 100 100 100 100 100 099 097 093 085 069 047 026 012 005 Cys
Tyr-
NP --O- 1013 000 000 000 000 000 000 000 000 000 000 000 000 001 002 004 011 023 Tyr
-
Tyr NP --OH 100 100 100 100 100 100 100 100 100 100 100 100 099 098 096 089 077 Tyr
Steven Brandon 30 June 2004
35
Table A5 Beef Myosin Amino Acid Composition by pH
Myosin
Amino Acid Residues mole of Myosin
Beef Pork
pH 32 pH 36 pH 40 pH 44 pH 48 pH 52 pH 56 pH 60 pH 64 pH 68 pH 72 pH 76 pH 80 pH 84 pH 88 pH 92 pH 96
Asp-
55 111 185 253 296 317 326 330 332 332 333 333 333 333 333 333 333
Asp 277 222 147 80 37 16 7 3 1 0 0 0 0 0 0 0 0
Glu-
52 111 201 298 369 408 425 433 436 437 438 438 438 438 438 438 438
Glu 386 327 237 140 69 30 13 5 2 1 0 0 0 0 0 0 0
His 0 0 1 1 3 8 17 30 44 54 59 61 62 63 63 63 63
His+
63 63 62 62 60 55 46 33 19 9 4 2 1 0 0 0 0
Lys 0 0 0 0 0 0 0 0 0 0 0 0 1 2 5 12 29
Lys+
481 481 481 481 481 481 481 481 481 481 481 481 481 480 477 469 452
Arg 0 0 0 0 0 0 0 0 0 0 0 0 0 0 0 0 0
Arg+
189 189 189 189 189 189 189 189 189 189 189 189 189 189 189 189 189
Cys-
0 0 0 0 0 0 0 0 0 0 0 0 0 0 0 0 0
Cys 0 0 0 0 0 0 0 0 0 0 0 0 0 0 0 0 0
Tyr-
0 0 0 0 0 0 0 0 0 0 0 0 1 1 3 8 16
Tyr 72 72 72 72 72 72 72 72 72 72 72 72 71 71 69 64 56
Asn 59 59 59 59 59 59 59 59 59 59 59 59 59 59 59 59 59
Gln 219 219 219 219 219 219 219 219 219 219 219 219 219 219 219 219 219
Pro 117 117 117 117 117 117 117 117 117 117 117 117 117 117 117 117 117
Ser 153 153 153 153 153 153 153 153 153 153 153 153 153 153 153 153 153
Thr 194 194 194 194 194 194 194 194 194 194 194 194 194 194 194 194 194
Trp 0 0 0 0 0 0 0 0 0 0 0 0 0 0 0 0 0
Ala 329 329 329 329 329 329 329 329 329 329 329 329 329 329 329 329 329
Gly 171 171 171 171 171 171 171 171 171 171 171 171 171 171 171 171 171
Ile 180 180 180 180 180 180 180 180 180 180 180 180 180 180 180 180 180
Leu 387 387 387 387 387 387 387 387 387 387 387 387 387 387 387 387 387
Met 90 90 90 90 90 90 90 90 90 90 90 90 90 90 90 90 90
Phe 122 122 122 122 122 122 122 122 122 122 122 122 122 122 122 122 122
Val 167 167 167 167 167 167 167 167 167 167 167 167 167 167 167 167 167
(NH3) 477 477 477 477 477 477 477 477 477 477 477 477 477 477 477 477 477
Total residues (calc) 3762 3762 3762 3762 3762 3762 3762 3762 3762 3762 3762 3762 3762 3762 3762 3762 3762
Steven Brandon 30 June 2004
36
Table A6 Charge Inventory of Beef Myosin by pH
Myosin
Residue Charge Charge Inventory
Beef Pork
pH 32 pH 36 pH 40 pH 44 pH 48 pH 52 pH 56 pH 60 pH 64 pH 68 pH 72 pH 76 pH 80 pH 84 pH 88 pH 92 pH 96
-1 Asp-
-55 -111 -185 -253 -296 -317 -326 -330 -332 -332 -333 -333 -333 -333 -333 -333 -333
0 Asp 0 0 0 0 0 0 0 0 0 0 0 0 0 0 0 0 0
-1 Glu-
-52 -111 -201 -298 -369 -408 -425 -433 -436 -437 -438 -438 -438 -438 -438 -438 -438
0 Glu 0 0 0 0 0 0 0 0 0 0 0 0 0 0 0 0 0
0 His 0 0 0 0 0 0 0 0 0 0 0 0 0 0 0 0 0
1 His+
63 63 62 62 60 55 46 33 19 9 4 2 1 0 0 0 0
0 Lys 0 0 0 0 0 0 0 0 0 0 0 0 0 0 0 0 0
1 Lys+
481 481 481 481 481 481 481 481 481 481 481 481 481 480 477 469 452
0 Arg 0 0 0 0 0 0 0 0 0 0 0 0 0 0 0 0 0
1 Arg+
189 189 189 189 189 189 189 189 189 189 189 189 189 189 189 189 189
-1 Cys-
0 0 0 0 0 0 0 0 0 0 0 0 0 0 0 0 0
0 Cys 0 0 0 0 0 0 0 0 0 0 0 0 0 0 0 0 0
-1 Tyr-
0 0 0 0 0 0 0 0 0 0 0 0 -1 -1 -3 -8 -16
0 Tyr 0 0 0 0 0 0 0 0 0 0 0 0 0 0 0 0 0
0 Asn 0 0 0 0 0 0 0 0 0 0 0 0 0 0 0 0 0
0 Gln 0 0 0 0 0 0 0 0 0 0 0 0 0 0 0 0 0
0 Pro 0 0 0 0 0 0 0 0 0 0 0 0 0 0 0 0 0
0 Ser 0 0 0 0 0 0 0 0 0 0 0 0 0 0 0 0 0
0 The 0 0 0 0 0 0 0 0 0 0 0 0 0 0 0 0 0
0 Trp 0 0 0 0 0 0 0 0 0 0 0 0 0 0 0 0 0
0 Ala 0 0 0 0 0 0 0 0 0 0 0 0 0 0 0 0 0
0 Gly 0 0 0 0 0 0 0 0 0 0 0 0 0 0 0 0 0
0 Ile 0 0 0 0 0 0 0 0 0 0 0 0 0 0 0 0 0
0 Leu 0 0 0 0 0 0 0 0 0 0 0 0 0 0 0 0 0
0 Met 0 0 0 0 0 0 0 0 0 0 0 0 0 0 0 0 0
0 Phe 0 0 0 0 0 0 0 0 0 0 0 0 0 0 0 0 0
0 Val 0 0 0 0 0 0 0 0 0 0 0 0 0 0 0 0 0
0 (NH3) 0 0 0 0 0 0 0 0 0 0 0 0 0 0 0 0 0
TOTAL 626 511 346 181 65 1 -35 -60 -78 -90 -96 -99 -101 -103 -108 -120 -146
Steven Brandon 30 June 2004
37
Table A7 Beef Myosin Hydration by pH
Source Myosin
Hydration moles of H2O mole of Myosin
moles H2OMole of Residue Beef Pork
pH 32 pH 36 pH 40 pH 44 pH 48 pH 52 pH 56 pH 60 pH 64 pH 68 pH 72 pH 76 pH 80 pH 84 pH 88 pH 92 pH 96
60 Kuntz Asp-
332 667 1113 1517 1773 1901 1958 1981 1990 1994 1996 1996 1996 1997 1997 1997 1997
20 Kuntz Asp 555 443 295 160 74 32 13 5 2 1 0 0 0 0 0 0 0
75 Kuntz Glu-
390 831 1510 2238 2769 3058 3191 3247 3270 3279 3283 3284 3285 3285 3285 3285 3285
20 Kuntz Glu 772 654 473 279 138 60 25 10 4 2 1 0 0 0 0 0 0
40 best guess His 0 1 2 6 14 32 67 120 175 215 236 245 249 251 252 252 252
40 Kuntz His+
252 251 250 246 238 220 185 132 77 37 16 7 3 1 0 0 0
45 Kuntz Lys 0 0 0 0 0 0 0 0 0 0 1 1 4 9 22 54 131
45 Kuntz Lys+
2167 2167 2167 2167 2167 2167 2167 2167 2167 2167 2166 2165 2163 2158 2145 2112 2035
30 Kuntz Arg 0 0 0 0 0 0 0 0 0 0 0 0 0 0 0 0 1
30 Kuntz Arg+
567 567 567 567 567 567 567 567 567 567 567 567 567 567 567 567 566
20 best guess Cys-
0 0 0 0 0 0 0 0 0 0 0 0 0 0 0 0 0
10 Kuntz Cys 0 0 0 0 0 0 0 0 0 0 0 0 0 0 0 0 0
75 Kuntz Tyr-
0 0 0 0 0 0 0 0 0 0 1 2 4 10 24 57 123
30 Kuntz Tyr 216 216 216 216 216 216 216 216 216 216 216 215 214 212 206 193 167
20 Kuntz Asn 117 117 117 117 117 117 117 117 117 117 117 117 117 117 117 117 117
20 Kuntz Gln 438 438 438 438 438 438 438 438 438 438 438 438 438 438 438 438 438
30 Kuntz Pro 351 351 351 351 351 351 351 351 351 351 351 351 351 351 351 351 351
20 Kuntz Ser 306 306 306 306 306 306 306 306 306 306 306 306 306 306 306 306 306
20 Kuntz The 387 387 387 387 387 387 387 387 387 387 387 387 387 387 387 387 387
20 Kuntz Trp 0 0 0 0 0 0 0 0 0 0 0 0 0 0 0 0 0
15 Kuntz Ala 493 493 493 493 493 493 493 493 493 493 493 493 493 493 493 493 493
10 Kuntz Gly 171 171 171 171 171 171 171 171 171 171 171 171 171 171 171 171 171
10 Kuntz Ile 180 180 180 180 180 180 180 180 180 180 180 180 180 180 180 180 180
10 Kuntz Leu 387 387 387 387 387 387 387 387 387 387 387 387 387 387 387 387 387
10 Kuntz Met 90 90 90 90 90 90 90 90 90 90 90 90 90 90 90 90 90
00 Kuntz Phe 0 0 0 0 0 0 0 0 0 0 0 0 0 0 0 0 0
10 Kuntz Val 167 167 167 167 167 167 167 167 167 167 167 167 167 167 167 167 167
(NH3) 0 0 0 0 0 0 0 0 0 0 0 0 0 0 0 0 0
TOTAL 8338 8884 9679 10483 11043 11340 11475 11532 11555 11564 11568 11570 11572 11576 11585 11604 11644
Steven Brandon 30 June 2004
38
Table A8 Charge Inventory of Beef Myosin by pH with 400 moles of NaCl mole of myosin ndash Model 1 Myosin
Residue Charge Charge Inventory
Beef Pork
pH 32 pH 36 pH 40 pH 44 pH 48 pH 52 pH 56 pH 60 pH 64 pH 68 pH 72 pH 76 pH 80 pH 84 pH 88 pH 92 pH 96
0 Na Asp 0 0 0 0 0 0 0 0 0 0 0 0 0 0 0 0 0
-1 Asp-
0 0 0 -69 -118 -142 -153 -157 -159 -160 -160 -160 -160 -160 -161 -162 -164
0 Asp 0 0 0 0 0 0 0 0 0 0 0 0 0 0 0 0 0
0 Na Glu 0 0 0 0 0 0 0 0 0 0 0 0 0 0 0 0 0
-1 Glu-
0 0 0 -82 -147 -183 -199 -206 -209 -210 -210 -211 -211 -211 -212 -213 -215
0 Glu 0 0 0 0 0 0 0 0 0 0 0 0 0 0 0 0 0
0 His Cl 0 0 0 0 0 0 0 0 0 0 0 0 0 0 0 0 0
0 His 0 0 0 0 0 0 0 0 0 0 0 0 0 0 0 0 0
1 His+
29 29 28 28 27 25 20 14 8 4 2 1 0 0 0 0 0
0 Lys Cl 0 0 0 0 0 0 0 0 0 0 0 0 0 0 0 0 0
0 Lys 0 0 0 0 0 0 0 0 0 0 0 0 0 0 0 0 0
1 Lys+
219 219 219 218 218 216 213 208 202 198 196 195 194 193 190 184 170
0 Arg Cl 0 0 0 0 0 0 0 0 0 0 0 0 0 0 0 0 0
0 Arg 0 0 0 0 0 0 0 0 0 0 0 0 0 0 0 0 0
1 Arg+
86 86 86 86 85 85 84 82 79 78 77 76 76 76 75 74 71
0 Na Cys 0 0 0 0 0 0 0 0 0 0 0 0 0 0 0 0 0
-1 Cys-
0 0 0 0 0 0 0 0 0 0 0 0 0 0 0 0 0
0 Cys 0 0 0 0 0 0 0 0 0 0 0 0 0 0 0 0 0
0 Na Tyr 0 0 0 0 0 0 0 0 0 0 0 0 0 0 0 0 0
-1 Tyr-
0 0 0 0 0 0 0 0 0 0 0 0 0 -1 -2 -4 -8
0 Tyr 0 0 0 0 0 0 0 0 0 0 0 0 0 0 0 0 0
0 Asn 0 0 0 0 0 0 0 0 0 0 0 0 0 0 0 0 0
0 Gln 0 0 0 0 0 0 0 0 0 0 0 0 0 0 0 0 0
0 Pro 0 0 0 0 0 0 0 0 0 0 0 0 0 0 0 0 0
0 Ser 0 0 0 0 0 0 0 0 0 0 0 0 0 0 0 0 0
0 Thr 0 0 0 0 0 0 0 0 0 0 0 0 0 0 0 0 0
0 Trp 0 0 0 0 0 0 0 0 0 0 0 0 0 0 0 0 0
0 Ala 0 0 0 0 0 0 0 0 0 0 0 0 0 0 0 0 0
0 Gly 0 0 0 0 0 0 0 0 0 0 0 0 0 0 0 0 0
0 Ile 0 0 0 0 0 0 0 0 0 0 0 0 0 0 0 0 0
0 Leu 0 0 0 0 0 0 0 0 0 0 0 0 0 0 0 0 0
0 Met 0 0 0 0 0 0 0 0 0 0 0 0 0 0 0 0 0
0 Phe 0 0 0 0 0 0 0 0 0 0 0 0 0 0 0 0 0
0 Val 0 0 0 0 0 0 0 0 0 0 0 0 0 0 0 0 0
0 (NH3) 0 0 0 0 0 0 0 0 0 0 0 0 0 0 0 0 0
TOTAL 333 333 333 181 65 1 -35 -60 -78 -90 -96 -99 -101 -103 -108 -120 -146
Steven Brandon 30 June 2004
39
Table A9 Beef Myosin Hydration by pH with 400 moles of NaCl mole of myosin ndash Model 1
Myosin
Hydration moles of H2O mole of Myosin
moles H2OMole of Residue Beef Pork
pH 32 pH 36 pH 40 pH 44 pH 48 pH 52 pH 56 pH 60 pH 64 pH 68 pH 72 pH 76 pH 80 pH 84 pH 88 pH 92 pH 96
2 best guess Na Asp 111 222 371 367 356 350 347 346 346 345 345 345 345 345 344 342 338
6 Kuntz Asp-
0 0 0 416 706 852 916 943 953 958 959 960 961 962 965 971 982
2 Kuntz Asp 555 443 295 160 74 32 13 5 2 1 0 0 0 0 0 0 0
2 best guess Na Glu 104 222 403 433 444 450 453 454 454 454 455 454 454 454 453 450 445
75 Kuntz Glu-
0 0 0 614 1103 1370 1493 1545 1566 1575 1578 1580 1581 1583 1587 1597 1616
2 Kuntz Glu 772 654 473 279 138 60 25 10 4 2 1 0 0 0 0 0 0
4 best guess His Cl 137 137 136 135 131 121 103 75 44 22 10 4 2 1 0 0 0
4 best guess His 0 1 2 6 14 32 67 120 175 215 236 245 249 251 252 252 252
4 Kuntz His+
114 114 113 112 108 99 82 57 32 15 7 3 1 0 0 0 0
45 best guess Lys Cl 1182 1182 1183 1184 1187 1195 1209 1232 1257 1275 1285 1289 1291 1291 1289 1283 1270
45 Kuntz Lys 0 0 0 0 0 0 0 0 0 0 1 1 4 9 22 54 131
45 Kuntz Lys+
985 985 984 983 980 972 957 935 910 892 881 876 873 867 856 829 765
3 best guess Arg Cl 309 309 309 310 311 313 316 322 329 334 336 338 338 339 341 344 353
3 Kuntz Arg 0 0 0 0 0 0 0 0 0 0 0 0 0 0 0 0 1
3 Kuntz Arg+
258 258 258 257 256 254 251 245 238 233 231 229 229 228 226 222 213
1 best guess Na Cys 0 0 0 0 0 0 0 0 0 0 0 0 0 0 0 0 0
2 best guess Cys-
0 0 0 0 0 0 0 0 0 0 0 0 0 0 0 0 0
1 Kuntz Cys 0 0 0 0 0 0 0 0 0 0 0 0 0 0 0 0 0
3 Kuntz Na Tyr 0 0 0 0 0 0 0 0 0 0 0 0 1 2 5 12 25
75 Kuntz Tyr-
0 0 0 0 0 0 0 0 0 0 0 1 2 5 12 28 61
3 Kuntz Tyr 216 216 216 216 216 216 216 216 216 216 216 215 214 212 206 193 167
2 Kuntz Asn 117 117 117 117 117 117 117 117 117 117 117 117 117 117 117 117 117
2 Kuntz Gln 438 438 438 438 438 438 438 438 438 438 438 438 438 438 438 438 438
3 Kuntz Pro 351 351 351 351 351 351 351 351 351 351 351 351 351 351 351 351 351
2 Kuntz Ser 306 306 306 306 306 306 306 306 306 306 306 306 306 306 306 306 306
2 Kuntz Thr 387 387 387 387 387 387 387 387 387 387 387 387 387 387 387 387 387
2 Kuntz Trp 0 0 0 0 0 0 0 0 0 0 0 0 0 0 0 0 0
15 Kuntz Ala 493 493 493 493 493 493 493 493 493 493 493 493 493 493 493 493 493
1 Kuntz Gly 171 171 171 171 171 171 171 171 171 171 171 171 171 171 171 171 171
1 Kuntz Ile 180 180 180 180 180 180 180 180 180 180 180 180 180 180 180 180 180
1 Kuntz Leu 387 387 387 387 387 387 387 387 387 387 387 387 387 387 387 387 387
1 Kuntz Met 90 90 90 90 90 90 90 90 90 90 90 90 90 90 90 90 90
0 Kuntz Phe 0 0 0 0 0 0 0 0 0 0 0 0 0 0 0 0 0
1 Kuntz Val 167 167 167 167 167 167 167 167 167 167 167 167 167 167 167 167 167
(NH3) 0 0 0 0 0 0 0 0 0 0 0 0 0 0 0 0 0
TOTAL 7830 7830 7830 8558 9110 9403 9535 9591 9614 9623 9627 9629 9631 9635 9644 9665 9706
Steven Brandon 30 June 2004
40
Table A10 Charge Inventory of Beef Myosin by pH with 400 moles of NaCl mole of myosin ndash Model 2
Myosin
Residue Charge Charge Inventory
Beef Pork
pH 32 pH 36 pH 40 pH 44 pH 48 pH 52 pH 56 pH 60 pH 64 pH 68 pH 72 pH 76 pH 80 pH 84 pH 88 pH 92 pH 96
-1 Asp-
-55 -111 -185 -253 -296 -317 -326 -330 -332 -332 -333 -333 -333 -333 -333 -333 -333
0 Asp 0 0 0 0 0 0 0 0 0 0 0 0 0 0 0 0 0
-1 Glu-
-52 -111 -201 -298 -369 -408 -425 -433 -436 -437 -438 -438 -438 -438 -438 -438 -438
0 Glu 0 0 0 0 0 0 0 0 0 0 0 0 0 0 0 0 0
0 His Cl 0 0 0 0 0 0 0 0 0 0 0 0 0 0 0 0 0
0 His 0 0 0 0 0 0 0 0 0 0 0 0 0 0 0 0 0
1 His+
29 29 28 28 27 25 20 14 8 4 2 1 0 0 0 0 0
0 Lys Cl 0 0 0 0 0 0 0 0 0 0 0 0 0 0 0 0 0
0 Lys 0 0 0 0 0 0 0 0 0 0 0 0 0 0 0 0 0
1 Lys+
219 219 219 218 218 216 213 208 202 198 196 195 194 193 190 184 170
0 Arg Cl 0 0 0 0 0 0 0 0 0 0 0 0 0 0 0 0 0
0 Arg 0 0 0 0 0 0 0 0 0 0 0 0 0 0 0 0 0
1 Arg+
86 86 86 86 85 85 84 82 79 78 77 76 76 76 75 74 71
-1 Cys-
0 0 0 0 0 0 0 0 0 0 0 0 0 0 0 0 0
0 Cys 0 0 0 0 0 0 0 0 0 0 0 0 0 0 0 0 0
-1 Tyr-
0 0 0 0 0 0 0 0 0 0 0 0 -1 -1 -3 -8 -16
0 Tyr 0 0 0 0 0 0 0 0 0 0 0 0 0 0 0 0 0
0 Asn 0 0 0 0 0 0 0 0 0 0 0 0 0 0 0 0 0
0 Gln 0 0 0 0 0 0 0 0 0 0 0 0 0 0 0 0 0
0 Pro 0 0 0 0 0 0 0 0 0 0 0 0 0 0 0 0 0
0 Ser 0 0 0 0 0 0 0 0 0 0 0 0 0 0 0 0 0
0 Thr 0 0 0 0 0 0 0 0 0 0 0 0 0 0 0 0 0
0 Trp 0 0 0 0 0 0 0 0 0 0 0 0 0 0 0 0 0
0 Ala 0 0 0 0 0 0 0 0 0 0 0 0 0 0 0 0 0
0 Gly 0 0 0 0 0 0 0 0 0 0 0 0 0 0 0 0 0
0 Ile 0 0 0 0 0 0 0 0 0 0 0 0 0 0 0 0 0
0 Leu 0 0 0 0 0 0 0 0 0 0 0 0 0 0 0 0 0
0 Met 0 0 0 0 0 0 0 0 0 0 0 0 0 0 0 0 0
0 Phe 0 0 0 0 0 0 0 0 0 0 0 0 0 0 0 0 0
0 Val 0 0 0 0 0 0 0 0 0 0 0 0 0 0 0 0 0
0 (NH3) 0 0 0 0 0 0 0 0 0 0 0 0 0 0 0 0 0
TOTAL 226 111 -54 -219 -335 -399 -435 -460 -478 -490 -496 -499 -501 -503 -508 -520 -546
Steven Brandon 30 June 2004
41
Table A11 Beef Myosin Hydration by pH with 400 moles of NaCl mole of myosin ndash Model 2
Myosin
Hydration moles of H2O mole of Myosin
moles H2OMole of Residue Beef Pork
pH 32 pH 36 pH 40 pH 44 pH 48 pH 52 pH 56 pH 60 pH 64 pH 68 pH 72 pH 76 pH 80 pH 84 pH 88 pH 92 pH 96
6 Kuntz Asp-
332 667 1113 1517 1773 1901 1958 1981 1990 1994 1996 1996 1996 1997 1997 1997 1997
2 Kuntz Asp 555 443 295 160 74 32 13 5 2 1 0 0 0 0 0 0 0
75 Kuntz Glu-
390 831 1510 2238 2769 3058 3191 3247 3270 3279 3283 3284 3285 3285 3285 3285 3285
2 Kuntz Glu 772 654 473 279 138 60 25 10 4 2 1 0 0 0 0 0 0
4 best guess His Cl 137 137 136 135 131 121 103 75 44 22 10 4 2 1 0 0 0
4 best guess His 0 1 2 6 14 32 67 120 175 215 236 245 249 251 252 252 252
4 Kuntz His+
114 114 113 112 108 99 82 57 32 15 7 3 1 0 0 0 0
45 best guess Lys Cl 1182 1182 1183 1184 1187 1195 1209 1232 1257 1275 1285 1289 1291 1291 1289 1283 1270
45 Kuntz Lys 0 0 0 0 0 0 0 0 0 0 1 1 4 9 22 54 131
45 Kuntz Lys+
985 985 984 983 980 972 957 935 910 892 881 876 873 867 856 829 765
3 best guess Arg Cl 309 309 309 310 311 313 316 322 329 334 336 338 338 339 341 344 353
3 Kuntz Arg 0 0 0 0 0 0 0 0 0 0 0 0 0 0 0 0 1
3 Kuntz Arg+
258 258 258 257 256 254 251 245 238 233 231 229 229 228 226 222 213
2 best guess Cys-
0 0 0 0 0 0 0 0 0 0 0 0 0 0 0 0 0
1 Kuntz Cys 0 0 0 0 0 0 0 0 0 0 0 0 0 0 0 0 0
75 Kuntz Tyr-
0 0 0 0 0 0 0 0 0 0 1 2 4 10 24 57 123
3 Kuntz Tyr 216 216 216 216 216 216 216 216 216 216 216 215 214 212 206 193 167
2 Kuntz Asn 117 117 117 117 117 117 117 117 117 117 117 117 117 117 117 117 117
2 Kuntz Gln 438 438 438 438 438 438 438 438 438 438 438 438 438 438 438 438 438
3 Kuntz Pro 351 351 351 351 351 351 351 351 351 351 351 351 351 351 351 351 351
2 Kuntz Ser 306 306 306 306 306 306 306 306 306 306 306 306 306 306 306 306 306
2 Kuntz Thr 387 387 387 387 387 387 387 387 387 387 387 387 387 387 387 387 387
2 Kuntz Trp 0 0 0 0 0 0 0 0 0 0 0 0 0 0 0 0 0
15 Kuntz Ala 493 493 493 493 493 493 493 493 493 493 493 493 493 493 493 493 493
1 Kuntz Gly 171 171 171 171 171 171 171 171 171 171 171 171 171 171 171 171 171
1 Kuntz Ile 180 180 180 180 180 180 180 180 180 180 180 180 180 180 180 180 180
1 Kuntz Leu 387 387 387 387 387 387 387 387 387 387 387 387 387 387 387 387 387
1 Kuntz Met 90 90 90 90 90 90 90 90 90 90 90 90 90 90 90 90 90
0 Kuntz Phe 0 0 0 0 0 0 0 0 0 0 0 0 0 0 0 0 0
1 Kuntz Val 167 167 167 167 167 167 167 167 167 167 167 167 167 167 167 167 167
(NH3) 0 0 0 0 0 0 0 0 0 0 0 0 0 0 0 0 0
TOTAL 8338 8884 9679 10483 11043 11340 11475 11532 11555 11564 11568 11570 11572 11576 11585 11604 11644
Steven Brandon 30 June 2004
42
Table A12 References sited by Puolanne Ruusunen and Vainionpaumlauml (2001)
Hamm R 1962 Uumlber das Wasserbindungsvermoumlgen des Saumlugetiersmuskels XII part Uumlber
das Unterschiedliche nicht auf pH-Differenzen beruhende Wasserbindungsvermoumlgen des Rindermuskels Z Lebensmittel-Untersuch und Forsch 117 p 415
Hamm R 1972 Kolloidchemie des Fleisches Paul Parey Co Berlin
Ishioroshi M Samejima K and Yasui T 1979 Heat induced gelation of myosin factors
of pH and salt concentrations Journal of Food Science 44 pp 741ndash744
Kivikari R (1996) Buffering capacity of meat Thesis University of Helsinki EKT -series 1048
Offer G and Knight P 1983 The structural basis of water-holding in meat Part 1
General principles and water uptake in meat processing In Lawrie RA Editor 1983 Developments in meat science Elsevier Applied Science London
Puolanne E and Ruusunen M 1983 Einfluss des Salzzusatzes auf das
Wasserbindungsvermoumlgen der verschiedener Fleischsortimente in Bruumlhwurst Fleischwirtschaft 62 pp 238ndash239
Warriss PD 1982 The relationship between pH45 and drip in pig muscle Journal of Food
Technology 17 pp 573ndash578
Steven Brandon 30 June 2004
43
References
1 Food The Chemistry of Its Components 2nd ed T P Coultate The Royal Society of
Chemistry London 1989 p 106 2 httpwwwaw-bccommathewsch02frameshtm 3 httpwwwaw-bccommathewsch02frameshtm 4 httpwwwneurowustleduneuromuscularmothermyosinhtm 5 httpwwwmrc-lmbcamacukmyosintreesmclasseshtml 6 Private Communication Dr J C Acton Clemson University June 3 2004 7 httpwwwaw-bccommathewsch02frameshtm 8 CHEMISTRY OF MEAT PROCESSING Animal Sciences 550 Lynn Knipe Associate
Professor Animal Sciences Food Science amp Technology The Ohio State University
September 29 2000 9 Pre-rigor injection using glycolytic inhibitors in low-quality beef muscles N C Jerez C R
Calkins and J Velazco J Anim Sci 2003 81 pp 997-1003 10 CHEMISTRY OF MEAT PROCESSING Animal Sciences 550 Lynn Knipe Associate
Professor Animal Sciences Food Science amp Technology The Ohio State University
September 29 2000 11 MAKING MEAT FROM MUSCLES httpwwwcluesabdnacuk8080mirrorsgrowthch90html 12 httpwwwsunysbedubiochemcourseslectures929bmo520html 13 Biochemistry Christopher K Mathews KE van Holde 2nd ed Menlo Park CA Benjamin
Cummings Pub Co Inc 1996 p 52 14 Biochemistry Christopher K Mathews KE van Holde 2nd ed Menlo Park CA Benjamin
Cummings Pub Co Inc 1996 p 52
Introduction to Protein Chemistry S Fox J S Foster Wiley 1957 p242 httpwwwmcukyedubiochemistryCoursesbch612powerpoint2001lecture3Lecture3_filesframehtm
16 The Science of Meat and Meat Products J F Price B S Schweigert 2nd ed Food amp
Nutrition Press Inc Westport Connecticut 1978 p106 17 Private Communication Dr J C Acton Clemson University May 31 2004 18 httpwwwmcukyedubiochemistryCoursesbch612powerpoint2001lecture3Lecture3_filesframehtm 19 The effect of net charge on the solubility activity and stability of ribonuclease Sa Kevin
L Shaw Gerald R Grimsley Gennady I Yakovlev Alexander A Makarov and C Nick Pace Protein Science (2001) 10 pp 1206-1215
20 Proteins Masterpieces of Polymer Chemistry Robert A Copeland Todayrsquos Chemist at
Work June 1992 pp 33-37 21 Food Chemistry 3rd ed Owen R Fennema Marcel-Dekker Inc New York 1996 p367 22 Water Relations of Foods R B Duckworth Academic Press New York 1975 pp 104 -
105 23 Hydration of Macromolecules III Hydration of Polypeptides ID Kuntz Journal of the
American Chemical Society Vol 93 No 2 January 27 1971 pp 514-516 24 Isoelectric Precipitation httpwwwrpiedudeptchem-engBiotech-EnvironPRECIPprecpphhtml 25 ATOMIC and IONIC RADIUS httpwwwchemguidecoukatomspropertiesatradiushtml 26 A Field Guide and Introduction to the Geology and Chemistry of Rocks and Minerals
Charles A Sorrell Golden Press Western Publishing Co Inc Racine WI 1973 p 23 27 httpwwwwouedulasphyscich412hydrolysishtm 28 httpvischemcadrecomauhtmlcdatomshtml 29 httpwwwmcukyedubiochemistryCoursesbch612powerpoint2001lecture3Lecture3_filesframehtm 30 Proteins Amino Acids and Peptides as Ions and Dipolar Ions EJ Cohn JT Edsall
Rheinhold New York NY 1942 httpwwwmcukyedubiochemistryCoursesbch612powerpoint2001lecture3Lecture3_filesframehtm
31 Biochemistry 601 Protein Solubility Purification and Analysis Last modified 82399 Dr Landry Tulane University landrymailhosttcstulaneedu httpwwwtulaneedu~biochemmedpurehtm
32 TECHNICAL BULLETIN - COOKED CURED HAM httpwwwsoloseasaltcomTechnicalTech5htm
Steven Brandon 30 June 2004
44
33 On the mechanism of water holding in meat The swelling and shrinking of myofibrils
Gerald Offer and John Trinick Meat Science Volume 8 Issue 4 1983 pp 245-281 34 Solubility of salmon myosin as affected by conformational changes at various ionic
strengths and pH Tein M Lin Jae W Park Journal of Food Science March-April 1998 v63 i2 p 215
35 Combined effects of NaCl and raw meat pH on water-holding in cooked sausage with
and without added phosphate Eero J Puolanne Marita H Ruusunen and Jukka I Vainionpaumlauml Meat Science Volume 58 Issue 1 May 2001 pp 1-7
36 Salt Effects on Ionization Equilibria of Histidines in Myoglobin Yung-Hsiang Kao Carolyn A Fitch Shibani Bhattacharya Christopher J Sarkisian Juliette T J Lecomte and
Bertrand Garciacutea-Moreno E Biophys J September 2000 Vol 79 No 3 pp 1637-1654 37 MEAT EMULSIONS C Lynn Knipe Meat Export Research Center Iowa State University
httpwwwagohio-stateedu~meatsciarchiveMEATEMULSIONShtm 38 Salt-induced swelling of meat The effect of storage time pH ion-type and
concentration Peter Wilding Nicholas Hedges and Peter J Lillford Meat Science Volume
18 Issue 1 1986 pp 55-75 39 httpenwikipediaorgwikiAmino_acidStructures 40 httpenwikipediaorgwikiAmino_acidChemical_properties
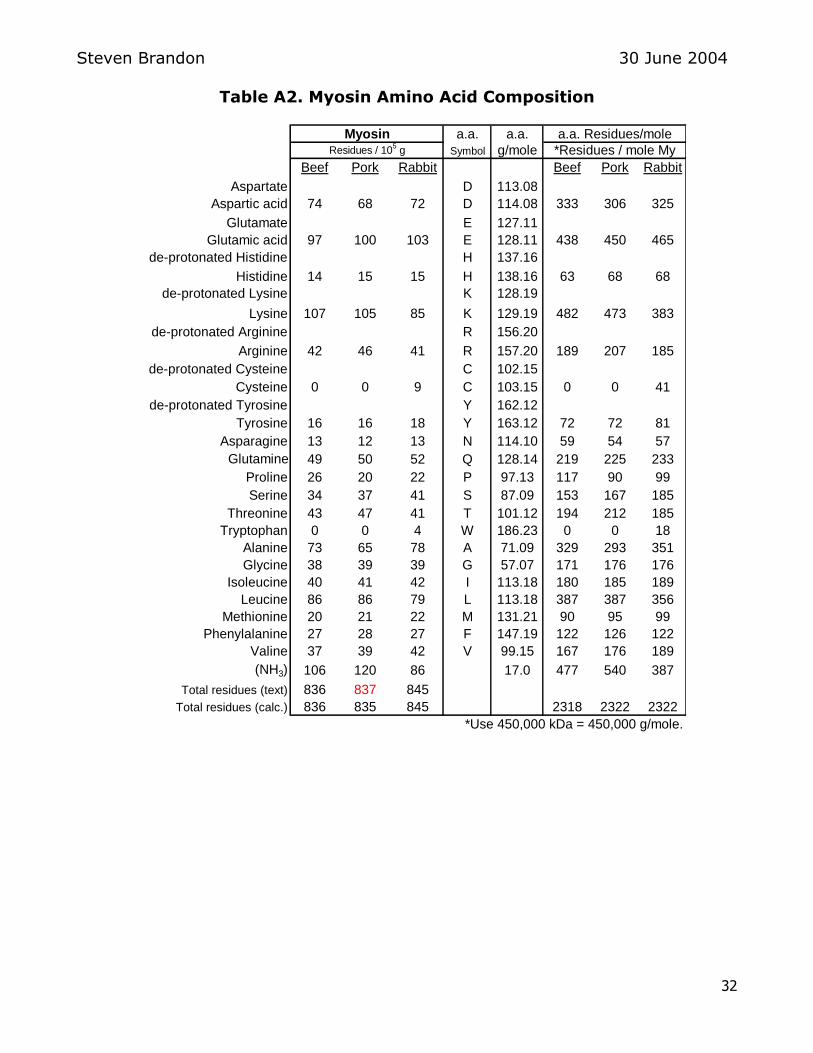
Steven Brandon 30 June 2004
33
Table A3 Amino Acid Properties40
Abbrev Full Name Side chain
type Mass pI
pK1
(alpha -
COOH)
pK2
(alpha -+NH3)
pKr
(R) Remarks
A Ala Alanine hydrophobic 8909 611 235 987
C Cys Cysteine hydrophilic 12116 505 192 1070 837
Two cysteines can
form a disulfide
bond This enforces
tertiary structure
and such proteins as
insulin have disulfide
bonds
D Asp Aspartic acid acidic 13310 285 199 990 390
E Glu Glutamic acid acidic 14713 315 210 947 407
F Phe Phenylalanine hydrophobic 16519 549 220 931
G Gly Glycine hydrophilic 7507 606 235 978
Because of the two
hydrogen atoms at
the α carbon glycine
is not optically
active
H His Histidine basic 15516 760 180 933 604
I Ile Isoleucine hydrophobic 13117 605 232 976
K Lys Lysine basic 14619 960 216 906 1054
L Leu Leucine hydrophobic 13117 601 233 974
M Met Methionine hydrophobic 14921 574 213 928
Always the first
amino acid to be
incorporated into a
protein sometimes
removed after
translation
N Asn Asparagine hydrophilic 13212 541 214 872
P Pro Proline hydrophobic 11513 630 195 1064
Can disrupt protein
folding structures
like α helix or β
sheet
Q Gln Glutamine hydrophilic 14615 565 217 913
R Arg Arginine basic 17420 1076 182 899 1248
S Ser Serine hydrophilic 10509 568 219 921
T Thr Threonine hydrophilic 11912 560 209 910
V Val Valine hydrophobic 11715 600 239 974
W Trp Tryptophan hydrophobic 20423 589 246 941
Y Tyr Tyrosine hydrophilic 18119 564 220 921 1046
Steven Brandon 30 June 2004
34
Table A4 Fraction of Dissociated Amino Acid R-Groups by pH
Fraction of dissociated R-groups
[A-]([HA]+[A
-])
aa Dissociating Group pH pH pH pH pH pH pH pH pH pH pH pH pH pH pH pH pH
Class HA A- pKR 32 36 40 44 48 52 56 60 64 68 72 76 80 84 88 92 96
Asp-
A --COO- 390 017 033 056 076 089 095 098 099 100 100 100 100 100 100 100 100 100 Asp
-
Asp A --COOH 083 067 044 024 011 005 002 001 000 000 000 000 000 000 000 000 000 Asp
Glu-
A --COO- 407 012 025 046 068 084 093 097 099 100 100 100 100 100 100 100 100 100 Glu
-
Glu A --COOH 088 075 054 032 016 007 003 001 000 000 000 000 000 000 000 000 000 Glu
His B -N 604 000 000 001 002 005 013 027 048 070 085 094 097 099 100 100 100 100 His
His+
B -NH+ 100 100 099 098 095 087 073 052 030 015 006 003 001 000 000 000 000 His
+
Lys B -NH2 1079 000 000 000 000 000 000 000 000 000 000 000 000 000 000 001 003 006 Lys
Lys+
B -NH2H+ 100 100 100 100 100 100 100 100 100 100 100 100 100 100 099 097 094 Lys
+
Arg B -NH 1248 000 000 000 000 000 000 000 000 000 000 000 000 000 000 000 000 000 Arg
Arg+
B -NHH+ 100 100 100 100 100 100 100 100 100 100 100 100 100 100 100 100 100 Arg
+
Cys-
P --S- 835 000 000 000 000 000 000 000 000 001 003 007 015 031 053 074 088 095 Cys
-
Cys P --SH 100 100 100 100 100 100 100 100 099 097 093 085 069 047 026 012 005 Cys
Tyr-
NP --O- 1013 000 000 000 000 000 000 000 000 000 000 000 000 001 002 004 011 023 Tyr
-
Tyr NP --OH 100 100 100 100 100 100 100 100 100 100 100 100 099 098 096 089 077 Tyr
Steven Brandon 30 June 2004
35
Table A5 Beef Myosin Amino Acid Composition by pH
Myosin
Amino Acid Residues mole of Myosin
Beef Pork
pH 32 pH 36 pH 40 pH 44 pH 48 pH 52 pH 56 pH 60 pH 64 pH 68 pH 72 pH 76 pH 80 pH 84 pH 88 pH 92 pH 96
Asp-
55 111 185 253 296 317 326 330 332 332 333 333 333 333 333 333 333
Asp 277 222 147 80 37 16 7 3 1 0 0 0 0 0 0 0 0
Glu-
52 111 201 298 369 408 425 433 436 437 438 438 438 438 438 438 438
Glu 386 327 237 140 69 30 13 5 2 1 0 0 0 0 0 0 0
His 0 0 1 1 3 8 17 30 44 54 59 61 62 63 63 63 63
His+
63 63 62 62 60 55 46 33 19 9 4 2 1 0 0 0 0
Lys 0 0 0 0 0 0 0 0 0 0 0 0 1 2 5 12 29
Lys+
481 481 481 481 481 481 481 481 481 481 481 481 481 480 477 469 452
Arg 0 0 0 0 0 0 0 0 0 0 0 0 0 0 0 0 0
Arg+
189 189 189 189 189 189 189 189 189 189 189 189 189 189 189 189 189
Cys-
0 0 0 0 0 0 0 0 0 0 0 0 0 0 0 0 0
Cys 0 0 0 0 0 0 0 0 0 0 0 0 0 0 0 0 0
Tyr-
0 0 0 0 0 0 0 0 0 0 0 0 1 1 3 8 16
Tyr 72 72 72 72 72 72 72 72 72 72 72 72 71 71 69 64 56
Asn 59 59 59 59 59 59 59 59 59 59 59 59 59 59 59 59 59
Gln 219 219 219 219 219 219 219 219 219 219 219 219 219 219 219 219 219
Pro 117 117 117 117 117 117 117 117 117 117 117 117 117 117 117 117 117
Ser 153 153 153 153 153 153 153 153 153 153 153 153 153 153 153 153 153
Thr 194 194 194 194 194 194 194 194 194 194 194 194 194 194 194 194 194
Trp 0 0 0 0 0 0 0 0 0 0 0 0 0 0 0 0 0
Ala 329 329 329 329 329 329 329 329 329 329 329 329 329 329 329 329 329
Gly 171 171 171 171 171 171 171 171 171 171 171 171 171 171 171 171 171
Ile 180 180 180 180 180 180 180 180 180 180 180 180 180 180 180 180 180
Leu 387 387 387 387 387 387 387 387 387 387 387 387 387 387 387 387 387
Met 90 90 90 90 90 90 90 90 90 90 90 90 90 90 90 90 90
Phe 122 122 122 122 122 122 122 122 122 122 122 122 122 122 122 122 122
Val 167 167 167 167 167 167 167 167 167 167 167 167 167 167 167 167 167
(NH3) 477 477 477 477 477 477 477 477 477 477 477 477 477 477 477 477 477
Total residues (calc) 3762 3762 3762 3762 3762 3762 3762 3762 3762 3762 3762 3762 3762 3762 3762 3762 3762
Steven Brandon 30 June 2004
36
Table A6 Charge Inventory of Beef Myosin by pH
Myosin
Residue Charge Charge Inventory
Beef Pork
pH 32 pH 36 pH 40 pH 44 pH 48 pH 52 pH 56 pH 60 pH 64 pH 68 pH 72 pH 76 pH 80 pH 84 pH 88 pH 92 pH 96
-1 Asp-
-55 -111 -185 -253 -296 -317 -326 -330 -332 -332 -333 -333 -333 -333 -333 -333 -333
0 Asp 0 0 0 0 0 0 0 0 0 0 0 0 0 0 0 0 0
-1 Glu-
-52 -111 -201 -298 -369 -408 -425 -433 -436 -437 -438 -438 -438 -438 -438 -438 -438
0 Glu 0 0 0 0 0 0 0 0 0 0 0 0 0 0 0 0 0
0 His 0 0 0 0 0 0 0 0 0 0 0 0 0 0 0 0 0
1 His+
63 63 62 62 60 55 46 33 19 9 4 2 1 0 0 0 0
0 Lys 0 0 0 0 0 0 0 0 0 0 0 0 0 0 0 0 0
1 Lys+
481 481 481 481 481 481 481 481 481 481 481 481 481 480 477 469 452
0 Arg 0 0 0 0 0 0 0 0 0 0 0 0 0 0 0 0 0
1 Arg+
189 189 189 189 189 189 189 189 189 189 189 189 189 189 189 189 189
-1 Cys-
0 0 0 0 0 0 0 0 0 0 0 0 0 0 0 0 0
0 Cys 0 0 0 0 0 0 0 0 0 0 0 0 0 0 0 0 0
-1 Tyr-
0 0 0 0 0 0 0 0 0 0 0 0 -1 -1 -3 -8 -16
0 Tyr 0 0 0 0 0 0 0 0 0 0 0 0 0 0 0 0 0
0 Asn 0 0 0 0 0 0 0 0 0 0 0 0 0 0 0 0 0
0 Gln 0 0 0 0 0 0 0 0 0 0 0 0 0 0 0 0 0
0 Pro 0 0 0 0 0 0 0 0 0 0 0 0 0 0 0 0 0
0 Ser 0 0 0 0 0 0 0 0 0 0 0 0 0 0 0 0 0
0 The 0 0 0 0 0 0 0 0 0 0 0 0 0 0 0 0 0
0 Trp 0 0 0 0 0 0 0 0 0 0 0 0 0 0 0 0 0
0 Ala 0 0 0 0 0 0 0 0 0 0 0 0 0 0 0 0 0
0 Gly 0 0 0 0 0 0 0 0 0 0 0 0 0 0 0 0 0
0 Ile 0 0 0 0 0 0 0 0 0 0 0 0 0 0 0 0 0
0 Leu 0 0 0 0 0 0 0 0 0 0 0 0 0 0 0 0 0
0 Met 0 0 0 0 0 0 0 0 0 0 0 0 0 0 0 0 0
0 Phe 0 0 0 0 0 0 0 0 0 0 0 0 0 0 0 0 0
0 Val 0 0 0 0 0 0 0 0 0 0 0 0 0 0 0 0 0
0 (NH3) 0 0 0 0 0 0 0 0 0 0 0 0 0 0 0 0 0
TOTAL 626 511 346 181 65 1 -35 -60 -78 -90 -96 -99 -101 -103 -108 -120 -146
Steven Brandon 30 June 2004
37
Table A7 Beef Myosin Hydration by pH
Source Myosin
Hydration moles of H2O mole of Myosin
moles H2OMole of Residue Beef Pork
pH 32 pH 36 pH 40 pH 44 pH 48 pH 52 pH 56 pH 60 pH 64 pH 68 pH 72 pH 76 pH 80 pH 84 pH 88 pH 92 pH 96
60 Kuntz Asp-
332 667 1113 1517 1773 1901 1958 1981 1990 1994 1996 1996 1996 1997 1997 1997 1997
20 Kuntz Asp 555 443 295 160 74 32 13 5 2 1 0 0 0 0 0 0 0
75 Kuntz Glu-
390 831 1510 2238 2769 3058 3191 3247 3270 3279 3283 3284 3285 3285 3285 3285 3285
20 Kuntz Glu 772 654 473 279 138 60 25 10 4 2 1 0 0 0 0 0 0
40 best guess His 0 1 2 6 14 32 67 120 175 215 236 245 249 251 252 252 252
40 Kuntz His+
252 251 250 246 238 220 185 132 77 37 16 7 3 1 0 0 0
45 Kuntz Lys 0 0 0 0 0 0 0 0 0 0 1 1 4 9 22 54 131
45 Kuntz Lys+
2167 2167 2167 2167 2167 2167 2167 2167 2167 2167 2166 2165 2163 2158 2145 2112 2035
30 Kuntz Arg 0 0 0 0 0 0 0 0 0 0 0 0 0 0 0 0 1
30 Kuntz Arg+
567 567 567 567 567 567 567 567 567 567 567 567 567 567 567 567 566
20 best guess Cys-
0 0 0 0 0 0 0 0 0 0 0 0 0 0 0 0 0
10 Kuntz Cys 0 0 0 0 0 0 0 0 0 0 0 0 0 0 0 0 0
75 Kuntz Tyr-
0 0 0 0 0 0 0 0 0 0 1 2 4 10 24 57 123
30 Kuntz Tyr 216 216 216 216 216 216 216 216 216 216 216 215 214 212 206 193 167
20 Kuntz Asn 117 117 117 117 117 117 117 117 117 117 117 117 117 117 117 117 117
20 Kuntz Gln 438 438 438 438 438 438 438 438 438 438 438 438 438 438 438 438 438
30 Kuntz Pro 351 351 351 351 351 351 351 351 351 351 351 351 351 351 351 351 351
20 Kuntz Ser 306 306 306 306 306 306 306 306 306 306 306 306 306 306 306 306 306
20 Kuntz The 387 387 387 387 387 387 387 387 387 387 387 387 387 387 387 387 387
20 Kuntz Trp 0 0 0 0 0 0 0 0 0 0 0 0 0 0 0 0 0
15 Kuntz Ala 493 493 493 493 493 493 493 493 493 493 493 493 493 493 493 493 493
10 Kuntz Gly 171 171 171 171 171 171 171 171 171 171 171 171 171 171 171 171 171
10 Kuntz Ile 180 180 180 180 180 180 180 180 180 180 180 180 180 180 180 180 180
10 Kuntz Leu 387 387 387 387 387 387 387 387 387 387 387 387 387 387 387 387 387
10 Kuntz Met 90 90 90 90 90 90 90 90 90 90 90 90 90 90 90 90 90
00 Kuntz Phe 0 0 0 0 0 0 0 0 0 0 0 0 0 0 0 0 0
10 Kuntz Val 167 167 167 167 167 167 167 167 167 167 167 167 167 167 167 167 167
(NH3) 0 0 0 0 0 0 0 0 0 0 0 0 0 0 0 0 0
TOTAL 8338 8884 9679 10483 11043 11340 11475 11532 11555 11564 11568 11570 11572 11576 11585 11604 11644
Steven Brandon 30 June 2004
38
Table A8 Charge Inventory of Beef Myosin by pH with 400 moles of NaCl mole of myosin ndash Model 1 Myosin
Residue Charge Charge Inventory
Beef Pork
pH 32 pH 36 pH 40 pH 44 pH 48 pH 52 pH 56 pH 60 pH 64 pH 68 pH 72 pH 76 pH 80 pH 84 pH 88 pH 92 pH 96
0 Na Asp 0 0 0 0 0 0 0 0 0 0 0 0 0 0 0 0 0
-1 Asp-
0 0 0 -69 -118 -142 -153 -157 -159 -160 -160 -160 -160 -160 -161 -162 -164
0 Asp 0 0 0 0 0 0 0 0 0 0 0 0 0 0 0 0 0
0 Na Glu 0 0 0 0 0 0 0 0 0 0 0 0 0 0 0 0 0
-1 Glu-
0 0 0 -82 -147 -183 -199 -206 -209 -210 -210 -211 -211 -211 -212 -213 -215
0 Glu 0 0 0 0 0 0 0 0 0 0 0 0 0 0 0 0 0
0 His Cl 0 0 0 0 0 0 0 0 0 0 0 0 0 0 0 0 0
0 His 0 0 0 0 0 0 0 0 0 0 0 0 0 0 0 0 0
1 His+
29 29 28 28 27 25 20 14 8 4 2 1 0 0 0 0 0
0 Lys Cl 0 0 0 0 0 0 0 0 0 0 0 0 0 0 0 0 0
0 Lys 0 0 0 0 0 0 0 0 0 0 0 0 0 0 0 0 0
1 Lys+
219 219 219 218 218 216 213 208 202 198 196 195 194 193 190 184 170
0 Arg Cl 0 0 0 0 0 0 0 0 0 0 0 0 0 0 0 0 0
0 Arg 0 0 0 0 0 0 0 0 0 0 0 0 0 0 0 0 0
1 Arg+
86 86 86 86 85 85 84 82 79 78 77 76 76 76 75 74 71
0 Na Cys 0 0 0 0 0 0 0 0 0 0 0 0 0 0 0 0 0
-1 Cys-
0 0 0 0 0 0 0 0 0 0 0 0 0 0 0 0 0
0 Cys 0 0 0 0 0 0 0 0 0 0 0 0 0 0 0 0 0
0 Na Tyr 0 0 0 0 0 0 0 0 0 0 0 0 0 0 0 0 0
-1 Tyr-
0 0 0 0 0 0 0 0 0 0 0 0 0 -1 -2 -4 -8
0 Tyr 0 0 0 0 0 0 0 0 0 0 0 0 0 0 0 0 0
0 Asn 0 0 0 0 0 0 0 0 0 0 0 0 0 0 0 0 0
0 Gln 0 0 0 0 0 0 0 0 0 0 0 0 0 0 0 0 0
0 Pro 0 0 0 0 0 0 0 0 0 0 0 0 0 0 0 0 0
0 Ser 0 0 0 0 0 0 0 0 0 0 0 0 0 0 0 0 0
0 Thr 0 0 0 0 0 0 0 0 0 0 0 0 0 0 0 0 0
0 Trp 0 0 0 0 0 0 0 0 0 0 0 0 0 0 0 0 0
0 Ala 0 0 0 0 0 0 0 0 0 0 0 0 0 0 0 0 0
0 Gly 0 0 0 0 0 0 0 0 0 0 0 0 0 0 0 0 0
0 Ile 0 0 0 0 0 0 0 0 0 0 0 0 0 0 0 0 0
0 Leu 0 0 0 0 0 0 0 0 0 0 0 0 0 0 0 0 0
0 Met 0 0 0 0 0 0 0 0 0 0 0 0 0 0 0 0 0
0 Phe 0 0 0 0 0 0 0 0 0 0 0 0 0 0 0 0 0
0 Val 0 0 0 0 0 0 0 0 0 0 0 0 0 0 0 0 0
0 (NH3) 0 0 0 0 0 0 0 0 0 0 0 0 0 0 0 0 0
TOTAL 333 333 333 181 65 1 -35 -60 -78 -90 -96 -99 -101 -103 -108 -120 -146
Steven Brandon 30 June 2004
39
Table A9 Beef Myosin Hydration by pH with 400 moles of NaCl mole of myosin ndash Model 1
Myosin
Hydration moles of H2O mole of Myosin
moles H2OMole of Residue Beef Pork
pH 32 pH 36 pH 40 pH 44 pH 48 pH 52 pH 56 pH 60 pH 64 pH 68 pH 72 pH 76 pH 80 pH 84 pH 88 pH 92 pH 96
2 best guess Na Asp 111 222 371 367 356 350 347 346 346 345 345 345 345 345 344 342 338
6 Kuntz Asp-
0 0 0 416 706 852 916 943 953 958 959 960 961 962 965 971 982
2 Kuntz Asp 555 443 295 160 74 32 13 5 2 1 0 0 0 0 0 0 0
2 best guess Na Glu 104 222 403 433 444 450 453 454 454 454 455 454 454 454 453 450 445
75 Kuntz Glu-
0 0 0 614 1103 1370 1493 1545 1566 1575 1578 1580 1581 1583 1587 1597 1616
2 Kuntz Glu 772 654 473 279 138 60 25 10 4 2 1 0 0 0 0 0 0
4 best guess His Cl 137 137 136 135 131 121 103 75 44 22 10 4 2 1 0 0 0
4 best guess His 0 1 2 6 14 32 67 120 175 215 236 245 249 251 252 252 252
4 Kuntz His+
114 114 113 112 108 99 82 57 32 15 7 3 1 0 0 0 0
45 best guess Lys Cl 1182 1182 1183 1184 1187 1195 1209 1232 1257 1275 1285 1289 1291 1291 1289 1283 1270
45 Kuntz Lys 0 0 0 0 0 0 0 0 0 0 1 1 4 9 22 54 131
45 Kuntz Lys+
985 985 984 983 980 972 957 935 910 892 881 876 873 867 856 829 765
3 best guess Arg Cl 309 309 309 310 311 313 316 322 329 334 336 338 338 339 341 344 353
3 Kuntz Arg 0 0 0 0 0 0 0 0 0 0 0 0 0 0 0 0 1
3 Kuntz Arg+
258 258 258 257 256 254 251 245 238 233 231 229 229 228 226 222 213
1 best guess Na Cys 0 0 0 0 0 0 0 0 0 0 0 0 0 0 0 0 0
2 best guess Cys-
0 0 0 0 0 0 0 0 0 0 0 0 0 0 0 0 0
1 Kuntz Cys 0 0 0 0 0 0 0 0 0 0 0 0 0 0 0 0 0
3 Kuntz Na Tyr 0 0 0 0 0 0 0 0 0 0 0 0 1 2 5 12 25
75 Kuntz Tyr-
0 0 0 0 0 0 0 0 0 0 0 1 2 5 12 28 61
3 Kuntz Tyr 216 216 216 216 216 216 216 216 216 216 216 215 214 212 206 193 167
2 Kuntz Asn 117 117 117 117 117 117 117 117 117 117 117 117 117 117 117 117 117
2 Kuntz Gln 438 438 438 438 438 438 438 438 438 438 438 438 438 438 438 438 438
3 Kuntz Pro 351 351 351 351 351 351 351 351 351 351 351 351 351 351 351 351 351
2 Kuntz Ser 306 306 306 306 306 306 306 306 306 306 306 306 306 306 306 306 306
2 Kuntz Thr 387 387 387 387 387 387 387 387 387 387 387 387 387 387 387 387 387
2 Kuntz Trp 0 0 0 0 0 0 0 0 0 0 0 0 0 0 0 0 0
15 Kuntz Ala 493 493 493 493 493 493 493 493 493 493 493 493 493 493 493 493 493
1 Kuntz Gly 171 171 171 171 171 171 171 171 171 171 171 171 171 171 171 171 171
1 Kuntz Ile 180 180 180 180 180 180 180 180 180 180 180 180 180 180 180 180 180
1 Kuntz Leu 387 387 387 387 387 387 387 387 387 387 387 387 387 387 387 387 387
1 Kuntz Met 90 90 90 90 90 90 90 90 90 90 90 90 90 90 90 90 90
0 Kuntz Phe 0 0 0 0 0 0 0 0 0 0 0 0 0 0 0 0 0
1 Kuntz Val 167 167 167 167 167 167 167 167 167 167 167 167 167 167 167 167 167
(NH3) 0 0 0 0 0 0 0 0 0 0 0 0 0 0 0 0 0
TOTAL 7830 7830 7830 8558 9110 9403 9535 9591 9614 9623 9627 9629 9631 9635 9644 9665 9706
Steven Brandon 30 June 2004
40
Table A10 Charge Inventory of Beef Myosin by pH with 400 moles of NaCl mole of myosin ndash Model 2
Myosin
Residue Charge Charge Inventory
Beef Pork
pH 32 pH 36 pH 40 pH 44 pH 48 pH 52 pH 56 pH 60 pH 64 pH 68 pH 72 pH 76 pH 80 pH 84 pH 88 pH 92 pH 96
-1 Asp-
-55 -111 -185 -253 -296 -317 -326 -330 -332 -332 -333 -333 -333 -333 -333 -333 -333
0 Asp 0 0 0 0 0 0 0 0 0 0 0 0 0 0 0 0 0
-1 Glu-
-52 -111 -201 -298 -369 -408 -425 -433 -436 -437 -438 -438 -438 -438 -438 -438 -438
0 Glu 0 0 0 0 0 0 0 0 0 0 0 0 0 0 0 0 0
0 His Cl 0 0 0 0 0 0 0 0 0 0 0 0 0 0 0 0 0
0 His 0 0 0 0 0 0 0 0 0 0 0 0 0 0 0 0 0
1 His+
29 29 28 28 27 25 20 14 8 4 2 1 0 0 0 0 0
0 Lys Cl 0 0 0 0 0 0 0 0 0 0 0 0 0 0 0 0 0
0 Lys 0 0 0 0 0 0 0 0 0 0 0 0 0 0 0 0 0
1 Lys+
219 219 219 218 218 216 213 208 202 198 196 195 194 193 190 184 170
0 Arg Cl 0 0 0 0 0 0 0 0 0 0 0 0 0 0 0 0 0
0 Arg 0 0 0 0 0 0 0 0 0 0 0 0 0 0 0 0 0
1 Arg+
86 86 86 86 85 85 84 82 79 78 77 76 76 76 75 74 71
-1 Cys-
0 0 0 0 0 0 0 0 0 0 0 0 0 0 0 0 0
0 Cys 0 0 0 0 0 0 0 0 0 0 0 0 0 0 0 0 0
-1 Tyr-
0 0 0 0 0 0 0 0 0 0 0 0 -1 -1 -3 -8 -16
0 Tyr 0 0 0 0 0 0 0 0 0 0 0 0 0 0 0 0 0
0 Asn 0 0 0 0 0 0 0 0 0 0 0 0 0 0 0 0 0
0 Gln 0 0 0 0 0 0 0 0 0 0 0 0 0 0 0 0 0
0 Pro 0 0 0 0 0 0 0 0 0 0 0 0 0 0 0 0 0
0 Ser 0 0 0 0 0 0 0 0 0 0 0 0 0 0 0 0 0
0 Thr 0 0 0 0 0 0 0 0 0 0 0 0 0 0 0 0 0
0 Trp 0 0 0 0 0 0 0 0 0 0 0 0 0 0 0 0 0
0 Ala 0 0 0 0 0 0 0 0 0 0 0 0 0 0 0 0 0
0 Gly 0 0 0 0 0 0 0 0 0 0 0 0 0 0 0 0 0
0 Ile 0 0 0 0 0 0 0 0 0 0 0 0 0 0 0 0 0
0 Leu 0 0 0 0 0 0 0 0 0 0 0 0 0 0 0 0 0
0 Met 0 0 0 0 0 0 0 0 0 0 0 0 0 0 0 0 0
0 Phe 0 0 0 0 0 0 0 0 0 0 0 0 0 0 0 0 0
0 Val 0 0 0 0 0 0 0 0 0 0 0 0 0 0 0 0 0
0 (NH3) 0 0 0 0 0 0 0 0 0 0 0 0 0 0 0 0 0
TOTAL 226 111 -54 -219 -335 -399 -435 -460 -478 -490 -496 -499 -501 -503 -508 -520 -546
Steven Brandon 30 June 2004
41
Table A11 Beef Myosin Hydration by pH with 400 moles of NaCl mole of myosin ndash Model 2
Myosin
Hydration moles of H2O mole of Myosin
moles H2OMole of Residue Beef Pork
pH 32 pH 36 pH 40 pH 44 pH 48 pH 52 pH 56 pH 60 pH 64 pH 68 pH 72 pH 76 pH 80 pH 84 pH 88 pH 92 pH 96
6 Kuntz Asp-
332 667 1113 1517 1773 1901 1958 1981 1990 1994 1996 1996 1996 1997 1997 1997 1997
2 Kuntz Asp 555 443 295 160 74 32 13 5 2 1 0 0 0 0 0 0 0
75 Kuntz Glu-
390 831 1510 2238 2769 3058 3191 3247 3270 3279 3283 3284 3285 3285 3285 3285 3285
2 Kuntz Glu 772 654 473 279 138 60 25 10 4 2 1 0 0 0 0 0 0
4 best guess His Cl 137 137 136 135 131 121 103 75 44 22 10 4 2 1 0 0 0
4 best guess His 0 1 2 6 14 32 67 120 175 215 236 245 249 251 252 252 252
4 Kuntz His+
114 114 113 112 108 99 82 57 32 15 7 3 1 0 0 0 0
45 best guess Lys Cl 1182 1182 1183 1184 1187 1195 1209 1232 1257 1275 1285 1289 1291 1291 1289 1283 1270
45 Kuntz Lys 0 0 0 0 0 0 0 0 0 0 1 1 4 9 22 54 131
45 Kuntz Lys+
985 985 984 983 980 972 957 935 910 892 881 876 873 867 856 829 765
3 best guess Arg Cl 309 309 309 310 311 313 316 322 329 334 336 338 338 339 341 344 353
3 Kuntz Arg 0 0 0 0 0 0 0 0 0 0 0 0 0 0 0 0 1
3 Kuntz Arg+
258 258 258 257 256 254 251 245 238 233 231 229 229 228 226 222 213
2 best guess Cys-
0 0 0 0 0 0 0 0 0 0 0 0 0 0 0 0 0
1 Kuntz Cys 0 0 0 0 0 0 0 0 0 0 0 0 0 0 0 0 0
75 Kuntz Tyr-
0 0 0 0 0 0 0 0 0 0 1 2 4 10 24 57 123
3 Kuntz Tyr 216 216 216 216 216 216 216 216 216 216 216 215 214 212 206 193 167
2 Kuntz Asn 117 117 117 117 117 117 117 117 117 117 117 117 117 117 117 117 117
2 Kuntz Gln 438 438 438 438 438 438 438 438 438 438 438 438 438 438 438 438 438
3 Kuntz Pro 351 351 351 351 351 351 351 351 351 351 351 351 351 351 351 351 351
2 Kuntz Ser 306 306 306 306 306 306 306 306 306 306 306 306 306 306 306 306 306
2 Kuntz Thr 387 387 387 387 387 387 387 387 387 387 387 387 387 387 387 387 387
2 Kuntz Trp 0 0 0 0 0 0 0 0 0 0 0 0 0 0 0 0 0
15 Kuntz Ala 493 493 493 493 493 493 493 493 493 493 493 493 493 493 493 493 493
1 Kuntz Gly 171 171 171 171 171 171 171 171 171 171 171 171 171 171 171 171 171
1 Kuntz Ile 180 180 180 180 180 180 180 180 180 180 180 180 180 180 180 180 180
1 Kuntz Leu 387 387 387 387 387 387 387 387 387 387 387 387 387 387 387 387 387
1 Kuntz Met 90 90 90 90 90 90 90 90 90 90 90 90 90 90 90 90 90
0 Kuntz Phe 0 0 0 0 0 0 0 0 0 0 0 0 0 0 0 0 0
1 Kuntz Val 167 167 167 167 167 167 167 167 167 167 167 167 167 167 167 167 167
(NH3) 0 0 0 0 0 0 0 0 0 0 0 0 0 0 0 0 0
TOTAL 8338 8884 9679 10483 11043 11340 11475 11532 11555 11564 11568 11570 11572 11576 11585 11604 11644
Steven Brandon 30 June 2004
42
Table A12 References sited by Puolanne Ruusunen and Vainionpaumlauml (2001)
Hamm R 1962 Uumlber das Wasserbindungsvermoumlgen des Saumlugetiersmuskels XII part Uumlber
das Unterschiedliche nicht auf pH-Differenzen beruhende Wasserbindungsvermoumlgen des Rindermuskels Z Lebensmittel-Untersuch und Forsch 117 p 415
Hamm R 1972 Kolloidchemie des Fleisches Paul Parey Co Berlin
Ishioroshi M Samejima K and Yasui T 1979 Heat induced gelation of myosin factors
of pH and salt concentrations Journal of Food Science 44 pp 741ndash744
Kivikari R (1996) Buffering capacity of meat Thesis University of Helsinki EKT -series 1048
Offer G and Knight P 1983 The structural basis of water-holding in meat Part 1
General principles and water uptake in meat processing In Lawrie RA Editor 1983 Developments in meat science Elsevier Applied Science London
Puolanne E and Ruusunen M 1983 Einfluss des Salzzusatzes auf das
Wasserbindungsvermoumlgen der verschiedener Fleischsortimente in Bruumlhwurst Fleischwirtschaft 62 pp 238ndash239
Warriss PD 1982 The relationship between pH45 and drip in pig muscle Journal of Food
Technology 17 pp 573ndash578
Steven Brandon 30 June 2004
43
References
1 Food The Chemistry of Its Components 2nd ed T P Coultate The Royal Society of
Chemistry London 1989 p 106 2 httpwwwaw-bccommathewsch02frameshtm 3 httpwwwaw-bccommathewsch02frameshtm 4 httpwwwneurowustleduneuromuscularmothermyosinhtm 5 httpwwwmrc-lmbcamacukmyosintreesmclasseshtml 6 Private Communication Dr J C Acton Clemson University June 3 2004 7 httpwwwaw-bccommathewsch02frameshtm 8 CHEMISTRY OF MEAT PROCESSING Animal Sciences 550 Lynn Knipe Associate
Professor Animal Sciences Food Science amp Technology The Ohio State University
September 29 2000 9 Pre-rigor injection using glycolytic inhibitors in low-quality beef muscles N C Jerez C R
Calkins and J Velazco J Anim Sci 2003 81 pp 997-1003 10 CHEMISTRY OF MEAT PROCESSING Animal Sciences 550 Lynn Knipe Associate
Professor Animal Sciences Food Science amp Technology The Ohio State University
September 29 2000 11 MAKING MEAT FROM MUSCLES httpwwwcluesabdnacuk8080mirrorsgrowthch90html 12 httpwwwsunysbedubiochemcourseslectures929bmo520html 13 Biochemistry Christopher K Mathews KE van Holde 2nd ed Menlo Park CA Benjamin
Cummings Pub Co Inc 1996 p 52 14 Biochemistry Christopher K Mathews KE van Holde 2nd ed Menlo Park CA Benjamin
Cummings Pub Co Inc 1996 p 52
Introduction to Protein Chemistry S Fox J S Foster Wiley 1957 p242 httpwwwmcukyedubiochemistryCoursesbch612powerpoint2001lecture3Lecture3_filesframehtm
16 The Science of Meat and Meat Products J F Price B S Schweigert 2nd ed Food amp
Nutrition Press Inc Westport Connecticut 1978 p106 17 Private Communication Dr J C Acton Clemson University May 31 2004 18 httpwwwmcukyedubiochemistryCoursesbch612powerpoint2001lecture3Lecture3_filesframehtm 19 The effect of net charge on the solubility activity and stability of ribonuclease Sa Kevin
L Shaw Gerald R Grimsley Gennady I Yakovlev Alexander A Makarov and C Nick Pace Protein Science (2001) 10 pp 1206-1215
20 Proteins Masterpieces of Polymer Chemistry Robert A Copeland Todayrsquos Chemist at
Work June 1992 pp 33-37 21 Food Chemistry 3rd ed Owen R Fennema Marcel-Dekker Inc New York 1996 p367 22 Water Relations of Foods R B Duckworth Academic Press New York 1975 pp 104 -
105 23 Hydration of Macromolecules III Hydration of Polypeptides ID Kuntz Journal of the
American Chemical Society Vol 93 No 2 January 27 1971 pp 514-516 24 Isoelectric Precipitation httpwwwrpiedudeptchem-engBiotech-EnvironPRECIPprecpphhtml 25 ATOMIC and IONIC RADIUS httpwwwchemguidecoukatomspropertiesatradiushtml 26 A Field Guide and Introduction to the Geology and Chemistry of Rocks and Minerals
Charles A Sorrell Golden Press Western Publishing Co Inc Racine WI 1973 p 23 27 httpwwwwouedulasphyscich412hydrolysishtm 28 httpvischemcadrecomauhtmlcdatomshtml 29 httpwwwmcukyedubiochemistryCoursesbch612powerpoint2001lecture3Lecture3_filesframehtm 30 Proteins Amino Acids and Peptides as Ions and Dipolar Ions EJ Cohn JT Edsall
Rheinhold New York NY 1942 httpwwwmcukyedubiochemistryCoursesbch612powerpoint2001lecture3Lecture3_filesframehtm
31 Biochemistry 601 Protein Solubility Purification and Analysis Last modified 82399 Dr Landry Tulane University landrymailhosttcstulaneedu httpwwwtulaneedu~biochemmedpurehtm
32 TECHNICAL BULLETIN - COOKED CURED HAM httpwwwsoloseasaltcomTechnicalTech5htm
Steven Brandon 30 June 2004
44
33 On the mechanism of water holding in meat The swelling and shrinking of myofibrils
Gerald Offer and John Trinick Meat Science Volume 8 Issue 4 1983 pp 245-281 34 Solubility of salmon myosin as affected by conformational changes at various ionic
strengths and pH Tein M Lin Jae W Park Journal of Food Science March-April 1998 v63 i2 p 215
35 Combined effects of NaCl and raw meat pH on water-holding in cooked sausage with
and without added phosphate Eero J Puolanne Marita H Ruusunen and Jukka I Vainionpaumlauml Meat Science Volume 58 Issue 1 May 2001 pp 1-7
36 Salt Effects on Ionization Equilibria of Histidines in Myoglobin Yung-Hsiang Kao Carolyn A Fitch Shibani Bhattacharya Christopher J Sarkisian Juliette T J Lecomte and
Bertrand Garciacutea-Moreno E Biophys J September 2000 Vol 79 No 3 pp 1637-1654 37 MEAT EMULSIONS C Lynn Knipe Meat Export Research Center Iowa State University
httpwwwagohio-stateedu~meatsciarchiveMEATEMULSIONShtm 38 Salt-induced swelling of meat The effect of storage time pH ion-type and
concentration Peter Wilding Nicholas Hedges and Peter J Lillford Meat Science Volume
18 Issue 1 1986 pp 55-75 39 httpenwikipediaorgwikiAmino_acidStructures 40 httpenwikipediaorgwikiAmino_acidChemical_properties
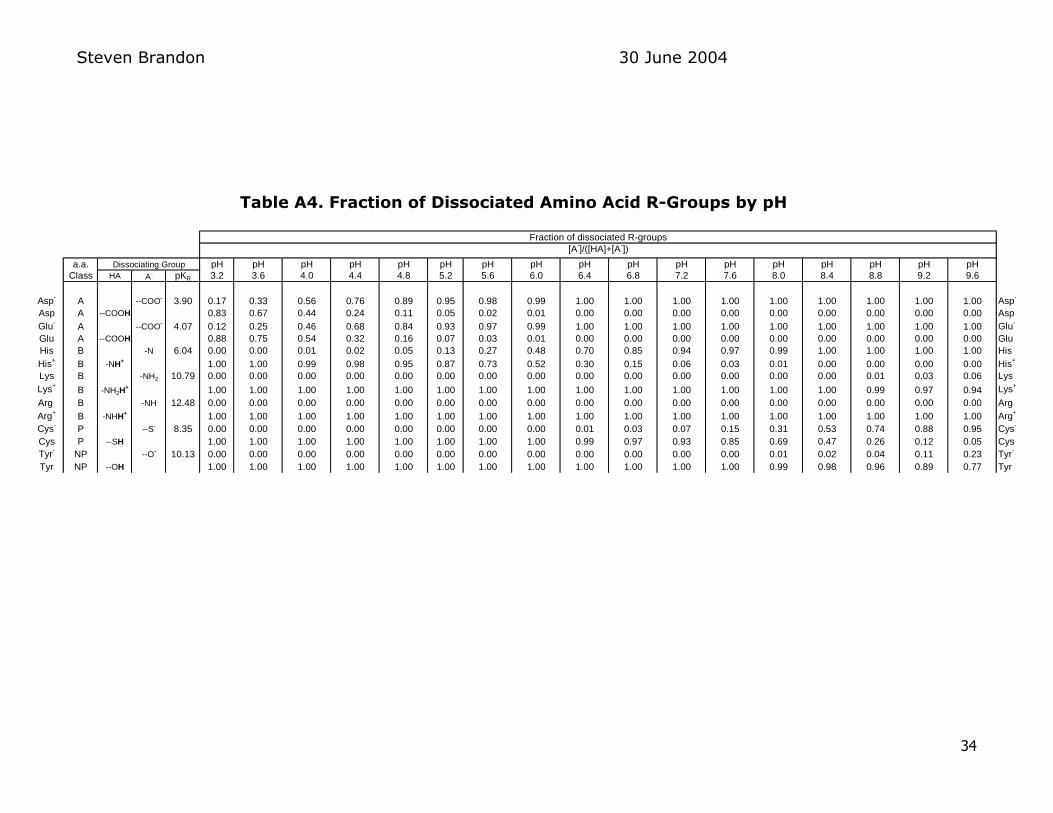
Steven Brandon 30 June 2004
36
Table A6 Charge Inventory of Beef Myosin by pH
Myosin
Residue Charge Charge Inventory
Beef Pork
pH 32 pH 36 pH 40 pH 44 pH 48 pH 52 pH 56 pH 60 pH 64 pH 68 pH 72 pH 76 pH 80 pH 84 pH 88 pH 92 pH 96
-1 Asp-
-55 -111 -185 -253 -296 -317 -326 -330 -332 -332 -333 -333 -333 -333 -333 -333 -333
0 Asp 0 0 0 0 0 0 0 0 0 0 0 0 0 0 0 0 0
-1 Glu-
-52 -111 -201 -298 -369 -408 -425 -433 -436 -437 -438 -438 -438 -438 -438 -438 -438
0 Glu 0 0 0 0 0 0 0 0 0 0 0 0 0 0 0 0 0
0 His 0 0 0 0 0 0 0 0 0 0 0 0 0 0 0 0 0
1 His+
63 63 62 62 60 55 46 33 19 9 4 2 1 0 0 0 0
0 Lys 0 0 0 0 0 0 0 0 0 0 0 0 0 0 0 0 0
1 Lys+
481 481 481 481 481 481 481 481 481 481 481 481 481 480 477 469 452
0 Arg 0 0 0 0 0 0 0 0 0 0 0 0 0 0 0 0 0
1 Arg+
189 189 189 189 189 189 189 189 189 189 189 189 189 189 189 189 189
-1 Cys-
0 0 0 0 0 0 0 0 0 0 0 0 0 0 0 0 0
0 Cys 0 0 0 0 0 0 0 0 0 0 0 0 0 0 0 0 0
-1 Tyr-
0 0 0 0 0 0 0 0 0 0 0 0 -1 -1 -3 -8 -16
0 Tyr 0 0 0 0 0 0 0 0 0 0 0 0 0 0 0 0 0
0 Asn 0 0 0 0 0 0 0 0 0 0 0 0 0 0 0 0 0
0 Gln 0 0 0 0 0 0 0 0 0 0 0 0 0 0 0 0 0
0 Pro 0 0 0 0 0 0 0 0 0 0 0 0 0 0 0 0 0
0 Ser 0 0 0 0 0 0 0 0 0 0 0 0 0 0 0 0 0
0 The 0 0 0 0 0 0 0 0 0 0 0 0 0 0 0 0 0
0 Trp 0 0 0 0 0 0 0 0 0 0 0 0 0 0 0 0 0
0 Ala 0 0 0 0 0 0 0 0 0 0 0 0 0 0 0 0 0
0 Gly 0 0 0 0 0 0 0 0 0 0 0 0 0 0 0 0 0
0 Ile 0 0 0 0 0 0 0 0 0 0 0 0 0 0 0 0 0
0 Leu 0 0 0 0 0 0 0 0 0 0 0 0 0 0 0 0 0
0 Met 0 0 0 0 0 0 0 0 0 0 0 0 0 0 0 0 0
0 Phe 0 0 0 0 0 0 0 0 0 0 0 0 0 0 0 0 0
0 Val 0 0 0 0 0 0 0 0 0 0 0 0 0 0 0 0 0
0 (NH3) 0 0 0 0 0 0 0 0 0 0 0 0 0 0 0 0 0
TOTAL 626 511 346 181 65 1 -35 -60 -78 -90 -96 -99 -101 -103 -108 -120 -146
Steven Brandon 30 June 2004
37
Table A7 Beef Myosin Hydration by pH
Source Myosin
Hydration moles of H2O mole of Myosin
moles H2OMole of Residue Beef Pork
pH 32 pH 36 pH 40 pH 44 pH 48 pH 52 pH 56 pH 60 pH 64 pH 68 pH 72 pH 76 pH 80 pH 84 pH 88 pH 92 pH 96
60 Kuntz Asp-
332 667 1113 1517 1773 1901 1958 1981 1990 1994 1996 1996 1996 1997 1997 1997 1997
20 Kuntz Asp 555 443 295 160 74 32 13 5 2 1 0 0 0 0 0 0 0
75 Kuntz Glu-
390 831 1510 2238 2769 3058 3191 3247 3270 3279 3283 3284 3285 3285 3285 3285 3285
20 Kuntz Glu 772 654 473 279 138 60 25 10 4 2 1 0 0 0 0 0 0
40 best guess His 0 1 2 6 14 32 67 120 175 215 236 245 249 251 252 252 252
40 Kuntz His+
252 251 250 246 238 220 185 132 77 37 16 7 3 1 0 0 0
45 Kuntz Lys 0 0 0 0 0 0 0 0 0 0 1 1 4 9 22 54 131
45 Kuntz Lys+
2167 2167 2167 2167 2167 2167 2167 2167 2167 2167 2166 2165 2163 2158 2145 2112 2035
30 Kuntz Arg 0 0 0 0 0 0 0 0 0 0 0 0 0 0 0 0 1
30 Kuntz Arg+
567 567 567 567 567 567 567 567 567 567 567 567 567 567 567 567 566
20 best guess Cys-
0 0 0 0 0 0 0 0 0 0 0 0 0 0 0 0 0
10 Kuntz Cys 0 0 0 0 0 0 0 0 0 0 0 0 0 0 0 0 0
75 Kuntz Tyr-
0 0 0 0 0 0 0 0 0 0 1 2 4 10 24 57 123
30 Kuntz Tyr 216 216 216 216 216 216 216 216 216 216 216 215 214 212 206 193 167
20 Kuntz Asn 117 117 117 117 117 117 117 117 117 117 117 117 117 117 117 117 117
20 Kuntz Gln 438 438 438 438 438 438 438 438 438 438 438 438 438 438 438 438 438
30 Kuntz Pro 351 351 351 351 351 351 351 351 351 351 351 351 351 351 351 351 351
20 Kuntz Ser 306 306 306 306 306 306 306 306 306 306 306 306 306 306 306 306 306
20 Kuntz The 387 387 387 387 387 387 387 387 387 387 387 387 387 387 387 387 387
20 Kuntz Trp 0 0 0 0 0 0 0 0 0 0 0 0 0 0 0 0 0
15 Kuntz Ala 493 493 493 493 493 493 493 493 493 493 493 493 493 493 493 493 493
10 Kuntz Gly 171 171 171 171 171 171 171 171 171 171 171 171 171 171 171 171 171
10 Kuntz Ile 180 180 180 180 180 180 180 180 180 180 180 180 180 180 180 180 180
10 Kuntz Leu 387 387 387 387 387 387 387 387 387 387 387 387 387 387 387 387 387
10 Kuntz Met 90 90 90 90 90 90 90 90 90 90 90 90 90 90 90 90 90
00 Kuntz Phe 0 0 0 0 0 0 0 0 0 0 0 0 0 0 0 0 0
10 Kuntz Val 167 167 167 167 167 167 167 167 167 167 167 167 167 167 167 167 167
(NH3) 0 0 0 0 0 0 0 0 0 0 0 0 0 0 0 0 0
TOTAL 8338 8884 9679 10483 11043 11340 11475 11532 11555 11564 11568 11570 11572 11576 11585 11604 11644
Steven Brandon 30 June 2004
38
Table A8 Charge Inventory of Beef Myosin by pH with 400 moles of NaCl mole of myosin ndash Model 1 Myosin
Residue Charge Charge Inventory
Beef Pork
pH 32 pH 36 pH 40 pH 44 pH 48 pH 52 pH 56 pH 60 pH 64 pH 68 pH 72 pH 76 pH 80 pH 84 pH 88 pH 92 pH 96
0 Na Asp 0 0 0 0 0 0 0 0 0 0 0 0 0 0 0 0 0
-1 Asp-
0 0 0 -69 -118 -142 -153 -157 -159 -160 -160 -160 -160 -160 -161 -162 -164
0 Asp 0 0 0 0 0 0 0 0 0 0 0 0 0 0 0 0 0
0 Na Glu 0 0 0 0 0 0 0 0 0 0 0 0 0 0 0 0 0
-1 Glu-
0 0 0 -82 -147 -183 -199 -206 -209 -210 -210 -211 -211 -211 -212 -213 -215
0 Glu 0 0 0 0 0 0 0 0 0 0 0 0 0 0 0 0 0
0 His Cl 0 0 0 0 0 0 0 0 0 0 0 0 0 0 0 0 0
0 His 0 0 0 0 0 0 0 0 0 0 0 0 0 0 0 0 0
1 His+
29 29 28 28 27 25 20 14 8 4 2 1 0 0 0 0 0
0 Lys Cl 0 0 0 0 0 0 0 0 0 0 0 0 0 0 0 0 0
0 Lys 0 0 0 0 0 0 0 0 0 0 0 0 0 0 0 0 0
1 Lys+
219 219 219 218 218 216 213 208 202 198 196 195 194 193 190 184 170
0 Arg Cl 0 0 0 0 0 0 0 0 0 0 0 0 0 0 0 0 0
0 Arg 0 0 0 0 0 0 0 0 0 0 0 0 0 0 0 0 0
1 Arg+
86 86 86 86 85 85 84 82 79 78 77 76 76 76 75 74 71
0 Na Cys 0 0 0 0 0 0 0 0 0 0 0 0 0 0 0 0 0
-1 Cys-
0 0 0 0 0 0 0 0 0 0 0 0 0 0 0 0 0
0 Cys 0 0 0 0 0 0 0 0 0 0 0 0 0 0 0 0 0
0 Na Tyr 0 0 0 0 0 0 0 0 0 0 0 0 0 0 0 0 0
-1 Tyr-
0 0 0 0 0 0 0 0 0 0 0 0 0 -1 -2 -4 -8
0 Tyr 0 0 0 0 0 0 0 0 0 0 0 0 0 0 0 0 0
0 Asn 0 0 0 0 0 0 0 0 0 0 0 0 0 0 0 0 0
0 Gln 0 0 0 0 0 0 0 0 0 0 0 0 0 0 0 0 0
0 Pro 0 0 0 0 0 0 0 0 0 0 0 0 0 0 0 0 0
0 Ser 0 0 0 0 0 0 0 0 0 0 0 0 0 0 0 0 0
0 Thr 0 0 0 0 0 0 0 0 0 0 0 0 0 0 0 0 0
0 Trp 0 0 0 0 0 0 0 0 0 0 0 0 0 0 0 0 0
0 Ala 0 0 0 0 0 0 0 0 0 0 0 0 0 0 0 0 0
0 Gly 0 0 0 0 0 0 0 0 0 0 0 0 0 0 0 0 0
0 Ile 0 0 0 0 0 0 0 0 0 0 0 0 0 0 0 0 0
0 Leu 0 0 0 0 0 0 0 0 0 0 0 0 0 0 0 0 0
0 Met 0 0 0 0 0 0 0 0 0 0 0 0 0 0 0 0 0
0 Phe 0 0 0 0 0 0 0 0 0 0 0 0 0 0 0 0 0
0 Val 0 0 0 0 0 0 0 0 0 0 0 0 0 0 0 0 0
0 (NH3) 0 0 0 0 0 0 0 0 0 0 0 0 0 0 0 0 0
TOTAL 333 333 333 181 65 1 -35 -60 -78 -90 -96 -99 -101 -103 -108 -120 -146
Steven Brandon 30 June 2004
39
Table A9 Beef Myosin Hydration by pH with 400 moles of NaCl mole of myosin ndash Model 1
Myosin
Hydration moles of H2O mole of Myosin
moles H2OMole of Residue Beef Pork
pH 32 pH 36 pH 40 pH 44 pH 48 pH 52 pH 56 pH 60 pH 64 pH 68 pH 72 pH 76 pH 80 pH 84 pH 88 pH 92 pH 96
2 best guess Na Asp 111 222 371 367 356 350 347 346 346 345 345 345 345 345 344 342 338
6 Kuntz Asp-
0 0 0 416 706 852 916 943 953 958 959 960 961 962 965 971 982
2 Kuntz Asp 555 443 295 160 74 32 13 5 2 1 0 0 0 0 0 0 0
2 best guess Na Glu 104 222 403 433 444 450 453 454 454 454 455 454 454 454 453 450 445
75 Kuntz Glu-
0 0 0 614 1103 1370 1493 1545 1566 1575 1578 1580 1581 1583 1587 1597 1616
2 Kuntz Glu 772 654 473 279 138 60 25 10 4 2 1 0 0 0 0 0 0
4 best guess His Cl 137 137 136 135 131 121 103 75 44 22 10 4 2 1 0 0 0
4 best guess His 0 1 2 6 14 32 67 120 175 215 236 245 249 251 252 252 252
4 Kuntz His+
114 114 113 112 108 99 82 57 32 15 7 3 1 0 0 0 0
45 best guess Lys Cl 1182 1182 1183 1184 1187 1195 1209 1232 1257 1275 1285 1289 1291 1291 1289 1283 1270
45 Kuntz Lys 0 0 0 0 0 0 0 0 0 0 1 1 4 9 22 54 131
45 Kuntz Lys+
985 985 984 983 980 972 957 935 910 892 881 876 873 867 856 829 765
3 best guess Arg Cl 309 309 309 310 311 313 316 322 329 334 336 338 338 339 341 344 353
3 Kuntz Arg 0 0 0 0 0 0 0 0 0 0 0 0 0 0 0 0 1
3 Kuntz Arg+
258 258 258 257 256 254 251 245 238 233 231 229 229 228 226 222 213
1 best guess Na Cys 0 0 0 0 0 0 0 0 0 0 0 0 0 0 0 0 0
2 best guess Cys-
0 0 0 0 0 0 0 0 0 0 0 0 0 0 0 0 0
1 Kuntz Cys 0 0 0 0 0 0 0 0 0 0 0 0 0 0 0 0 0
3 Kuntz Na Tyr 0 0 0 0 0 0 0 0 0 0 0 0 1 2 5 12 25
75 Kuntz Tyr-
0 0 0 0 0 0 0 0 0 0 0 1 2 5 12 28 61
3 Kuntz Tyr 216 216 216 216 216 216 216 216 216 216 216 215 214 212 206 193 167
2 Kuntz Asn 117 117 117 117 117 117 117 117 117 117 117 117 117 117 117 117 117
2 Kuntz Gln 438 438 438 438 438 438 438 438 438 438 438 438 438 438 438 438 438
3 Kuntz Pro 351 351 351 351 351 351 351 351 351 351 351 351 351 351 351 351 351
2 Kuntz Ser 306 306 306 306 306 306 306 306 306 306 306 306 306 306 306 306 306
2 Kuntz Thr 387 387 387 387 387 387 387 387 387 387 387 387 387 387 387 387 387
2 Kuntz Trp 0 0 0 0 0 0 0 0 0 0 0 0 0 0 0 0 0
15 Kuntz Ala 493 493 493 493 493 493 493 493 493 493 493 493 493 493 493 493 493
1 Kuntz Gly 171 171 171 171 171 171 171 171 171 171 171 171 171 171 171 171 171
1 Kuntz Ile 180 180 180 180 180 180 180 180 180 180 180 180 180 180 180 180 180
1 Kuntz Leu 387 387 387 387 387 387 387 387 387 387 387 387 387 387 387 387 387
1 Kuntz Met 90 90 90 90 90 90 90 90 90 90 90 90 90 90 90 90 90
0 Kuntz Phe 0 0 0 0 0 0 0 0 0 0 0 0 0 0 0 0 0
1 Kuntz Val 167 167 167 167 167 167 167 167 167 167 167 167 167 167 167 167 167
(NH3) 0 0 0 0 0 0 0 0 0 0 0 0 0 0 0 0 0
TOTAL 7830 7830 7830 8558 9110 9403 9535 9591 9614 9623 9627 9629 9631 9635 9644 9665 9706
Steven Brandon 30 June 2004
40
Table A10 Charge Inventory of Beef Myosin by pH with 400 moles of NaCl mole of myosin ndash Model 2
Myosin
Residue Charge Charge Inventory
Beef Pork
pH 32 pH 36 pH 40 pH 44 pH 48 pH 52 pH 56 pH 60 pH 64 pH 68 pH 72 pH 76 pH 80 pH 84 pH 88 pH 92 pH 96
-1 Asp-
-55 -111 -185 -253 -296 -317 -326 -330 -332 -332 -333 -333 -333 -333 -333 -333 -333
0 Asp 0 0 0 0 0 0 0 0 0 0 0 0 0 0 0 0 0
-1 Glu-
-52 -111 -201 -298 -369 -408 -425 -433 -436 -437 -438 -438 -438 -438 -438 -438 -438
0 Glu 0 0 0 0 0 0 0 0 0 0 0 0 0 0 0 0 0
0 His Cl 0 0 0 0 0 0 0 0 0 0 0 0 0 0 0 0 0
0 His 0 0 0 0 0 0 0 0 0 0 0 0 0 0 0 0 0
1 His+
29 29 28 28 27 25 20 14 8 4 2 1 0 0 0 0 0
0 Lys Cl 0 0 0 0 0 0 0 0 0 0 0 0 0 0 0 0 0
0 Lys 0 0 0 0 0 0 0 0 0 0 0 0 0 0 0 0 0
1 Lys+
219 219 219 218 218 216 213 208 202 198 196 195 194 193 190 184 170
0 Arg Cl 0 0 0 0 0 0 0 0 0 0 0 0 0 0 0 0 0
0 Arg 0 0 0 0 0 0 0 0 0 0 0 0 0 0 0 0 0
1 Arg+
86 86 86 86 85 85 84 82 79 78 77 76 76 76 75 74 71
-1 Cys-
0 0 0 0 0 0 0 0 0 0 0 0 0 0 0 0 0
0 Cys 0 0 0 0 0 0 0 0 0 0 0 0 0 0 0 0 0
-1 Tyr-
0 0 0 0 0 0 0 0 0 0 0 0 -1 -1 -3 -8 -16
0 Tyr 0 0 0 0 0 0 0 0 0 0 0 0 0 0 0 0 0
0 Asn 0 0 0 0 0 0 0 0 0 0 0 0 0 0 0 0 0
0 Gln 0 0 0 0 0 0 0 0 0 0 0 0 0 0 0 0 0
0 Pro 0 0 0 0 0 0 0 0 0 0 0 0 0 0 0 0 0
0 Ser 0 0 0 0 0 0 0 0 0 0 0 0 0 0 0 0 0
0 Thr 0 0 0 0 0 0 0 0 0 0 0 0 0 0 0 0 0
0 Trp 0 0 0 0 0 0 0 0 0 0 0 0 0 0 0 0 0
0 Ala 0 0 0 0 0 0 0 0 0 0 0 0 0 0 0 0 0
0 Gly 0 0 0 0 0 0 0 0 0 0 0 0 0 0 0 0 0
0 Ile 0 0 0 0 0 0 0 0 0 0 0 0 0 0 0 0 0
0 Leu 0 0 0 0 0 0 0 0 0 0 0 0 0 0 0 0 0
0 Met 0 0 0 0 0 0 0 0 0 0 0 0 0 0 0 0 0
0 Phe 0 0 0 0 0 0 0 0 0 0 0 0 0 0 0 0 0
0 Val 0 0 0 0 0 0 0 0 0 0 0 0 0 0 0 0 0
0 (NH3) 0 0 0 0 0 0 0 0 0 0 0 0 0 0 0 0 0
TOTAL 226 111 -54 -219 -335 -399 -435 -460 -478 -490 -496 -499 -501 -503 -508 -520 -546
Steven Brandon 30 June 2004
41
Table A11 Beef Myosin Hydration by pH with 400 moles of NaCl mole of myosin ndash Model 2
Myosin
Hydration moles of H2O mole of Myosin
moles H2OMole of Residue Beef Pork
pH 32 pH 36 pH 40 pH 44 pH 48 pH 52 pH 56 pH 60 pH 64 pH 68 pH 72 pH 76 pH 80 pH 84 pH 88 pH 92 pH 96
6 Kuntz Asp-
332 667 1113 1517 1773 1901 1958 1981 1990 1994 1996 1996 1996 1997 1997 1997 1997
2 Kuntz Asp 555 443 295 160 74 32 13 5 2 1 0 0 0 0 0 0 0
75 Kuntz Glu-
390 831 1510 2238 2769 3058 3191 3247 3270 3279 3283 3284 3285 3285 3285 3285 3285
2 Kuntz Glu 772 654 473 279 138 60 25 10 4 2 1 0 0 0 0 0 0
4 best guess His Cl 137 137 136 135 131 121 103 75 44 22 10 4 2 1 0 0 0
4 best guess His 0 1 2 6 14 32 67 120 175 215 236 245 249 251 252 252 252
4 Kuntz His+
114 114 113 112 108 99 82 57 32 15 7 3 1 0 0 0 0
45 best guess Lys Cl 1182 1182 1183 1184 1187 1195 1209 1232 1257 1275 1285 1289 1291 1291 1289 1283 1270
45 Kuntz Lys 0 0 0 0 0 0 0 0 0 0 1 1 4 9 22 54 131
45 Kuntz Lys+
985 985 984 983 980 972 957 935 910 892 881 876 873 867 856 829 765
3 best guess Arg Cl 309 309 309 310 311 313 316 322 329 334 336 338 338 339 341 344 353
3 Kuntz Arg 0 0 0 0 0 0 0 0 0 0 0 0 0 0 0 0 1
3 Kuntz Arg+
258 258 258 257 256 254 251 245 238 233 231 229 229 228 226 222 213
2 best guess Cys-
0 0 0 0 0 0 0 0 0 0 0 0 0 0 0 0 0
1 Kuntz Cys 0 0 0 0 0 0 0 0 0 0 0 0 0 0 0 0 0
75 Kuntz Tyr-
0 0 0 0 0 0 0 0 0 0 1 2 4 10 24 57 123
3 Kuntz Tyr 216 216 216 216 216 216 216 216 216 216 216 215 214 212 206 193 167
2 Kuntz Asn 117 117 117 117 117 117 117 117 117 117 117 117 117 117 117 117 117
2 Kuntz Gln 438 438 438 438 438 438 438 438 438 438 438 438 438 438 438 438 438
3 Kuntz Pro 351 351 351 351 351 351 351 351 351 351 351 351 351 351 351 351 351
2 Kuntz Ser 306 306 306 306 306 306 306 306 306 306 306 306 306 306 306 306 306
2 Kuntz Thr 387 387 387 387 387 387 387 387 387 387 387 387 387 387 387 387 387
2 Kuntz Trp 0 0 0 0 0 0 0 0 0 0 0 0 0 0 0 0 0
15 Kuntz Ala 493 493 493 493 493 493 493 493 493 493 493 493 493 493 493 493 493
1 Kuntz Gly 171 171 171 171 171 171 171 171 171 171 171 171 171 171 171 171 171
1 Kuntz Ile 180 180 180 180 180 180 180 180 180 180 180 180 180 180 180 180 180
1 Kuntz Leu 387 387 387 387 387 387 387 387 387 387 387 387 387 387 387 387 387
1 Kuntz Met 90 90 90 90 90 90 90 90 90 90 90 90 90 90 90 90 90
0 Kuntz Phe 0 0 0 0 0 0 0 0 0 0 0 0 0 0 0 0 0
1 Kuntz Val 167 167 167 167 167 167 167 167 167 167 167 167 167 167 167 167 167
(NH3) 0 0 0 0 0 0 0 0 0 0 0 0 0 0 0 0 0
TOTAL 8338 8884 9679 10483 11043 11340 11475 11532 11555 11564 11568 11570 11572 11576 11585 11604 11644
Steven Brandon 30 June 2004
42
Table A12 References sited by Puolanne Ruusunen and Vainionpaumlauml (2001)
Hamm R 1962 Uumlber das Wasserbindungsvermoumlgen des Saumlugetiersmuskels XII part Uumlber
das Unterschiedliche nicht auf pH-Differenzen beruhende Wasserbindungsvermoumlgen des Rindermuskels Z Lebensmittel-Untersuch und Forsch 117 p 415
Hamm R 1972 Kolloidchemie des Fleisches Paul Parey Co Berlin
Ishioroshi M Samejima K and Yasui T 1979 Heat induced gelation of myosin factors
of pH and salt concentrations Journal of Food Science 44 pp 741ndash744
Kivikari R (1996) Buffering capacity of meat Thesis University of Helsinki EKT -series 1048
Offer G and Knight P 1983 The structural basis of water-holding in meat Part 1
General principles and water uptake in meat processing In Lawrie RA Editor 1983 Developments in meat science Elsevier Applied Science London
Puolanne E and Ruusunen M 1983 Einfluss des Salzzusatzes auf das
Wasserbindungsvermoumlgen der verschiedener Fleischsortimente in Bruumlhwurst Fleischwirtschaft 62 pp 238ndash239
Warriss PD 1982 The relationship between pH45 and drip in pig muscle Journal of Food
Technology 17 pp 573ndash578
Steven Brandon 30 June 2004
43
References
1 Food The Chemistry of Its Components 2nd ed T P Coultate The Royal Society of
Chemistry London 1989 p 106 2 httpwwwaw-bccommathewsch02frameshtm 3 httpwwwaw-bccommathewsch02frameshtm 4 httpwwwneurowustleduneuromuscularmothermyosinhtm 5 httpwwwmrc-lmbcamacukmyosintreesmclasseshtml 6 Private Communication Dr J C Acton Clemson University June 3 2004 7 httpwwwaw-bccommathewsch02frameshtm 8 CHEMISTRY OF MEAT PROCESSING Animal Sciences 550 Lynn Knipe Associate
Professor Animal Sciences Food Science amp Technology The Ohio State University
September 29 2000 9 Pre-rigor injection using glycolytic inhibitors in low-quality beef muscles N C Jerez C R
Calkins and J Velazco J Anim Sci 2003 81 pp 997-1003 10 CHEMISTRY OF MEAT PROCESSING Animal Sciences 550 Lynn Knipe Associate
Professor Animal Sciences Food Science amp Technology The Ohio State University
September 29 2000 11 MAKING MEAT FROM MUSCLES httpwwwcluesabdnacuk8080mirrorsgrowthch90html 12 httpwwwsunysbedubiochemcourseslectures929bmo520html 13 Biochemistry Christopher K Mathews KE van Holde 2nd ed Menlo Park CA Benjamin
Cummings Pub Co Inc 1996 p 52 14 Biochemistry Christopher K Mathews KE van Holde 2nd ed Menlo Park CA Benjamin
Cummings Pub Co Inc 1996 p 52
Introduction to Protein Chemistry S Fox J S Foster Wiley 1957 p242 httpwwwmcukyedubiochemistryCoursesbch612powerpoint2001lecture3Lecture3_filesframehtm
16 The Science of Meat and Meat Products J F Price B S Schweigert 2nd ed Food amp
Nutrition Press Inc Westport Connecticut 1978 p106 17 Private Communication Dr J C Acton Clemson University May 31 2004 18 httpwwwmcukyedubiochemistryCoursesbch612powerpoint2001lecture3Lecture3_filesframehtm 19 The effect of net charge on the solubility activity and stability of ribonuclease Sa Kevin
L Shaw Gerald R Grimsley Gennady I Yakovlev Alexander A Makarov and C Nick Pace Protein Science (2001) 10 pp 1206-1215
20 Proteins Masterpieces of Polymer Chemistry Robert A Copeland Todayrsquos Chemist at
Work June 1992 pp 33-37 21 Food Chemistry 3rd ed Owen R Fennema Marcel-Dekker Inc New York 1996 p367 22 Water Relations of Foods R B Duckworth Academic Press New York 1975 pp 104 -
105 23 Hydration of Macromolecules III Hydration of Polypeptides ID Kuntz Journal of the
American Chemical Society Vol 93 No 2 January 27 1971 pp 514-516 24 Isoelectric Precipitation httpwwwrpiedudeptchem-engBiotech-EnvironPRECIPprecpphhtml 25 ATOMIC and IONIC RADIUS httpwwwchemguidecoukatomspropertiesatradiushtml 26 A Field Guide and Introduction to the Geology and Chemistry of Rocks and Minerals
Charles A Sorrell Golden Press Western Publishing Co Inc Racine WI 1973 p 23 27 httpwwwwouedulasphyscich412hydrolysishtm 28 httpvischemcadrecomauhtmlcdatomshtml 29 httpwwwmcukyedubiochemistryCoursesbch612powerpoint2001lecture3Lecture3_filesframehtm 30 Proteins Amino Acids and Peptides as Ions and Dipolar Ions EJ Cohn JT Edsall
Rheinhold New York NY 1942 httpwwwmcukyedubiochemistryCoursesbch612powerpoint2001lecture3Lecture3_filesframehtm
31 Biochemistry 601 Protein Solubility Purification and Analysis Last modified 82399 Dr Landry Tulane University landrymailhosttcstulaneedu httpwwwtulaneedu~biochemmedpurehtm
32 TECHNICAL BULLETIN - COOKED CURED HAM httpwwwsoloseasaltcomTechnicalTech5htm
Steven Brandon 30 June 2004
44
33 On the mechanism of water holding in meat The swelling and shrinking of myofibrils
Gerald Offer and John Trinick Meat Science Volume 8 Issue 4 1983 pp 245-281 34 Solubility of salmon myosin as affected by conformational changes at various ionic
strengths and pH Tein M Lin Jae W Park Journal of Food Science March-April 1998 v63 i2 p 215
35 Combined effects of NaCl and raw meat pH on water-holding in cooked sausage with
and without added phosphate Eero J Puolanne Marita H Ruusunen and Jukka I Vainionpaumlauml Meat Science Volume 58 Issue 1 May 2001 pp 1-7
36 Salt Effects on Ionization Equilibria of Histidines in Myoglobin Yung-Hsiang Kao Carolyn A Fitch Shibani Bhattacharya Christopher J Sarkisian Juliette T J Lecomte and
Bertrand Garciacutea-Moreno E Biophys J September 2000 Vol 79 No 3 pp 1637-1654 37 MEAT EMULSIONS C Lynn Knipe Meat Export Research Center Iowa State University
httpwwwagohio-stateedu~meatsciarchiveMEATEMULSIONShtm 38 Salt-induced swelling of meat The effect of storage time pH ion-type and
concentration Peter Wilding Nicholas Hedges and Peter J Lillford Meat Science Volume
18 Issue 1 1986 pp 55-75 39 httpenwikipediaorgwikiAmino_acidStructures 40 httpenwikipediaorgwikiAmino_acidChemical_properties
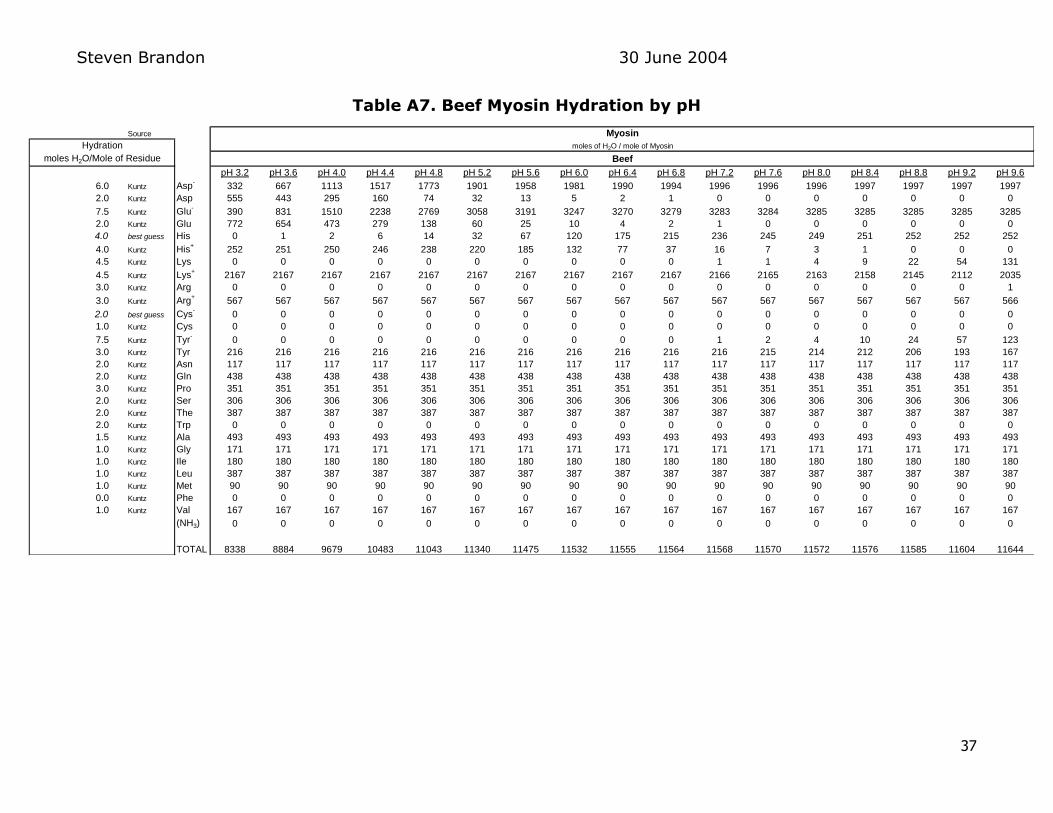
Steven Brandon 30 June 2004
44
33 On the mechanism of water holding in meat The swelling and shrinking of myofibrils
Gerald Offer and John Trinick Meat Science Volume 8 Issue 4 1983 pp 245-281 34 Solubility of salmon myosin as affected by conformational changes at various ionic
strengths and pH Tein M Lin Jae W Park Journal of Food Science March-April 1998 v63 i2 p 215
35 Combined effects of NaCl and raw meat pH on water-holding in cooked sausage with
and without added phosphate Eero J Puolanne Marita H Ruusunen and Jukka I Vainionpaumlauml Meat Science Volume 58 Issue 1 May 2001 pp 1-7
36 Salt Effects on Ionization Equilibria of Histidines in Myoglobin Yung-Hsiang Kao Carolyn A Fitch Shibani Bhattacharya Christopher J Sarkisian Juliette T J Lecomte and
Bertrand Garciacutea-Moreno E Biophys J September 2000 Vol 79 No 3 pp 1637-1654 37 MEAT EMULSIONS C Lynn Knipe Meat Export Research Center Iowa State University
httpwwwagohio-stateedu~meatsciarchiveMEATEMULSIONShtm 38 Salt-induced swelling of meat The effect of storage time pH ion-type and
concentration Peter Wilding Nicholas Hedges and Peter J Lillford Meat Science Volume
18 Issue 1 1986 pp 55-75 39 httpenwikipediaorgwikiAmino_acidStructures 40 httpenwikipediaorgwikiAmino_acidChemical_properties