water evaluation and planning system gediz basin - turkey · water evaluation and planning system...
TRANSCRIPT
Water Evaluation and Planning System
Gediz basin - Turkey
WatManSup project
WatManSup report no 5

Costerweg 1G ● 6702 AA Wageningen ● the Netherlands ● Tel: 0031 317-460050 E-mail: [email protected] ● Website: www.futurewater.nl
Costerweg 1G ● 6702 AA Wageningen ● the Netherlands ● Tel: 0031 317-460050 E-mail: [email protected] ● Website: www.futurewater.nl
Water Evaluation and Planning System Gediz basin - Turkey
WatManSup project
WatManSup report no 5
Authors: A. van Loon (FutureWater)
H. Mathijssen (FutureWater) P. Droogers (FutureWater)

WatManSup report no. 5 March 2007
4/44
WatManSup report no. 5 March 2007
5/44
Preface This report is written in the context of the WatManSup project (Integrated Water Management Support Methodologies). The project is executed in two countries: Kenya and Turkey. Financial support is provided by Partners for Water. For more information on the WatManSup project see the project website: http://www.futurewater.nl/watmansup. The Dutch consortium: FutureWater (Wageningen) Institute for Environmental Studies (Amsterdam) Water Board Hunze en Aa's (Veendam) Foreign clients: SASOL Foundation (Kitui, Kenya) Soil and Water Resources Research Institutes of the Turkish Ministry of Agricultural and Rural Affairs (Menemen, Turkey) SUMER (Izmir, Turkey) Additional technical support: the University of Nairobi (Kenya) EA-TEK (Izmir, Turkey) Reports so far: Report No.1: Water Management Support Methodologies: State of the Art Report No.2: Water Evaluation and Planning System, Kitui – Kenya Report No.3: Soil and Water Assessment Tool, Kitui - Kenya Report No.4: Multi-criteria analysis, Kitui - Kenya Report No.5: Water Evaluation and Planning System, Gediz Basin - Turkey

WatManSup report no. 5 March 2007
6/44
WatManSup report no. 5 March 2007
7/44
Contents
1 INTRODUCTION 9
2 BACKGROUND 11 2.1 The WEAP model 11 2.2 Gediz basin Turkey 12
2.2.1 Regional setting 12 2.2.2 Geography and climate 13 2.2.3 Socio-economical data 13 2.2.4 Water management and institutional aspects 13
3 WEAP GEDIZ BASIN 15 3.1 Schematic setup 15 3.2 Current accounts 16
3.2.1 Demand sites and catchments 16 3.2.2 Supply and resources 19 3.2.3 Key assumptions 21
3.3 Reference scenario 22 3.4 Other scenarios 22
3.4.1 Scenario: No losses 23 3.4.2 Scenario: Increased irrigation area 23 3.4.3 Scenario: Decreased volume Demirköprü 23
4 RESULTS 25 4.1 Reference Scenario 25
4.1.1 Water availability 25 4.1.2 Demand and demand coverage 27 4.1.3 Reservoirs 28
4.2 Scenario: No losses 29 4.3 Scenario: Decreased volume Demirköprü 30 4.4 Scenario: Increased irrigation area 33
5 CONCLUSION AND RECOMMENDATIONS 35
REFERENCES 37

WatManSup report no. 5 March 2007
8/44
WatManSup report no. 5 March 2007
9/44
1 Introduction The challenge to manage our water resources in a sustainable and appropriate manner is growing. Water
related disasters are not accepted anymore and societies expect more and more that water is always
available at the right moment and at the desired quantity and quality. Current water management practices
are still focused on reacting to events occurred in the past: the re-active approach. At many international
high level ministerial and scientific meetings a call for more strategic oriented water management, the pro-
active approach has been advocated. Despite these calls such a pro-active approach is hardly adopted by
water managers and policy makers (Droogers, 2006).
Water managers and decisions makers are aware of the necessity of this paradigm shift: from a re-active
towards a pro-active approach, but are confronted with the lack of appropriate methodologies. To be
prepared for the paradigm shift Integrated Water Management Support Methodologies (IWMSM) are needed
that go beyond the traditional operational support tools. Note that these IWMSM are more than only tools,
but include conceptual issues, theories, combining technical and socio-economic aspects. To demonstrate
and promote this new way of thinking the WatManSup (Water Management Support Tools) has been
initiated. The IWMSM approach comprises three different components: a water allocation component, a
physical based component and a decision support component. This report describes the water allocation
component for one of the study areas included in the project: Gediz basin in Turkey.
Turkey’s economy is growing fast and the demand for water is vastly growing along. Industrial areas expand
and so does the water demand. Agricultural land is still the highest water user. All agricultural lands in
Turkey are irrigated, mainly through surface irrigation and the area of agricultural irrigation systems is still
growing. The dry years from 1989-1994 show that Gediz basin is vulnerable. Water supply is not unlimited
and the agricultural sector suffered from severe economic losses. With future plans for expansion of the
agricultural area and the industrial sector growing rapidly, it is clear that the water delivery in Gediz basin
needs a closer look. Smart water allocation is important to maintain all deliveries to all sectors (Kite et al.
2001, Droogers and Torabi, 2002).
The overall objective of this report is to demonstrate opportunities offered by the water allocation
component of IWMSM, the WEAP tool, to support water managers and policy makers responsible for basin
scale water supply, in dry regions with large irrigation schemes and reservoirs.

WatManSup report no. 5 March 2007
10/44
WatManSup report no. 5 March 2007
11/44
2 Background
2.1 The WEAP model
Water managers and policy makers are in need to have tools at their disposal that will support them in their
decision-making. The WEAP tool is one of the components of IWMSM that can be implemented relatively
easy to evaluate scenarios on different water allocation strategies in a user-friendly environment.
WEAP is short for Water Evaluation and Planning System and is originally developed by the Stockholm
Environment Institute at Boston, USA (SEI, 2005a). WEAP is distinguished by its integrated approach to
simulating water systems and by its policy orientation. WEAP places the demand site of the equation – water
use patterns, equipment efficiencies, re-use, prices and allocation – on an equal footing with the supply site
– streamflow, groundwater, reservoirs and water transfers. WEAP is a laboratory for examining alternative
water development and management strategies (SEI, 2005a).
WEAP represents the system in terms of its various supply sources (e.g. rivers, creeks, groundwater, and
reservoirs); withdrawal, transmission and wastewater treatment facilities; ecosystem requirements, water
demands and pollution generation. The data structure and level of detail may be easily customized to meet
the requirements of a particular analysis, and to reflect the limits imposed by restricted data.
WEAP applications generally include several steps. The study definition sets up the time frame, spatial
boundary, system components and configuration of the problem. The Current Accounts, which can be
viewed as a calibration step in the development of an application, provide a snapshot of the actual water
demand, pollution loads, resources and supplies for the system. Key assumptions may be built into the
Current Accounts to represent policies, costs and factors that affect demand, pollution, supply and
hydrology. Scenarios build on the Current Accounts and allow one to explore the impact of alternative
assumptions or policies on future water availability and use. Finally, the scenarios are evaluated with regard
to water sufficiency, costs and benefits, compatibility with environmental targets, and sensitivity to
uncertainty in key variables (SEI, 2005a).
WEAP, in contrast to many other tools, is not optimization oriented in the sense that the optimal water
allocation will be presented. The entire approach is based on scenarios (alternatives) to ensure that
stakeholders, water managers and policy makers are actively involved in the entire process of planning in
order to guarantee the ownership feeling of the final decisions taken.
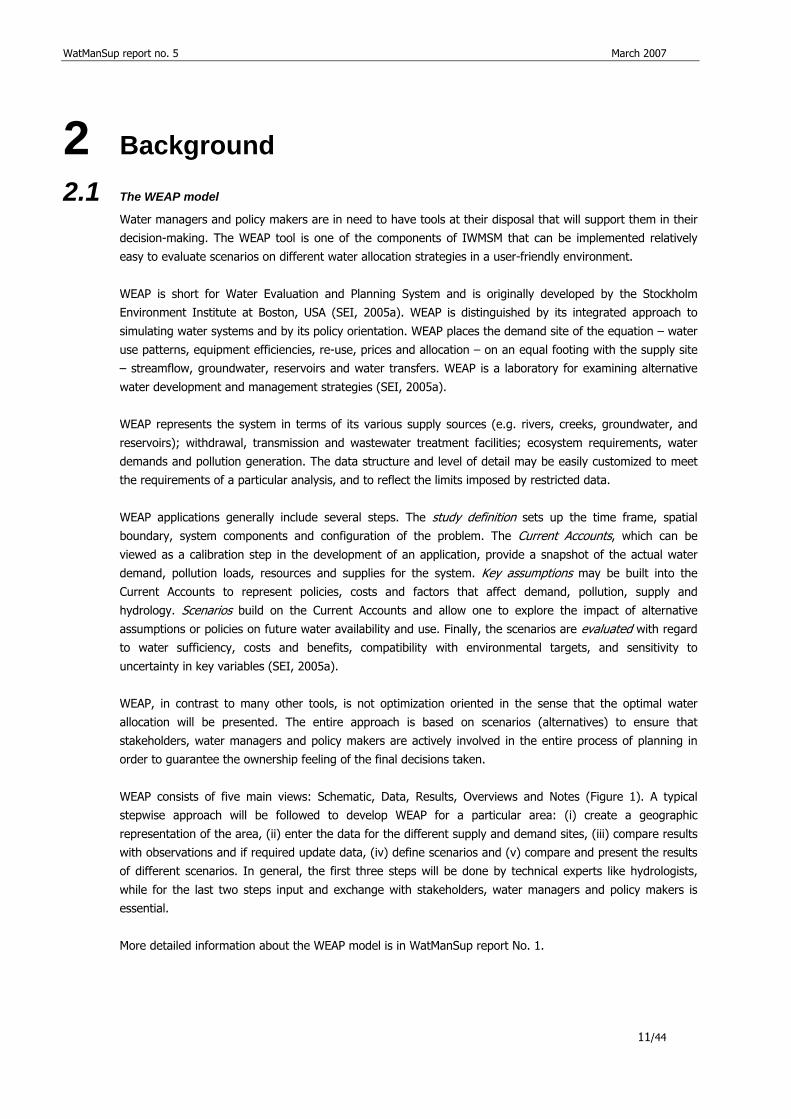
WEAP consists of five main views: Schematic, Data, Results, Overviews and Notes (Figure 1). A typical
stepwise approach will be followed to develop WEAP for a particular area: (i) create a geographic
representation of the area, (ii) enter the data for the different supply and demand sites, (iii) compare results
with observations and if required update data, (iv) define scenarios and (v) compare and present the results
of different scenarios. In general, the first three steps will be done by technical experts like hydrologists,
while for the last two steps input and exchange with stakeholders, water managers and policy makers is
essential.
More detailed information about the WEAP model is in WatManSup report No. 1.
WatManSup report no. 5 March 2007
Figure 1: User interfaces of WEAP with on the left the five main views.
2.2 Gediz basin Turkey
2.2.1 Regional setting
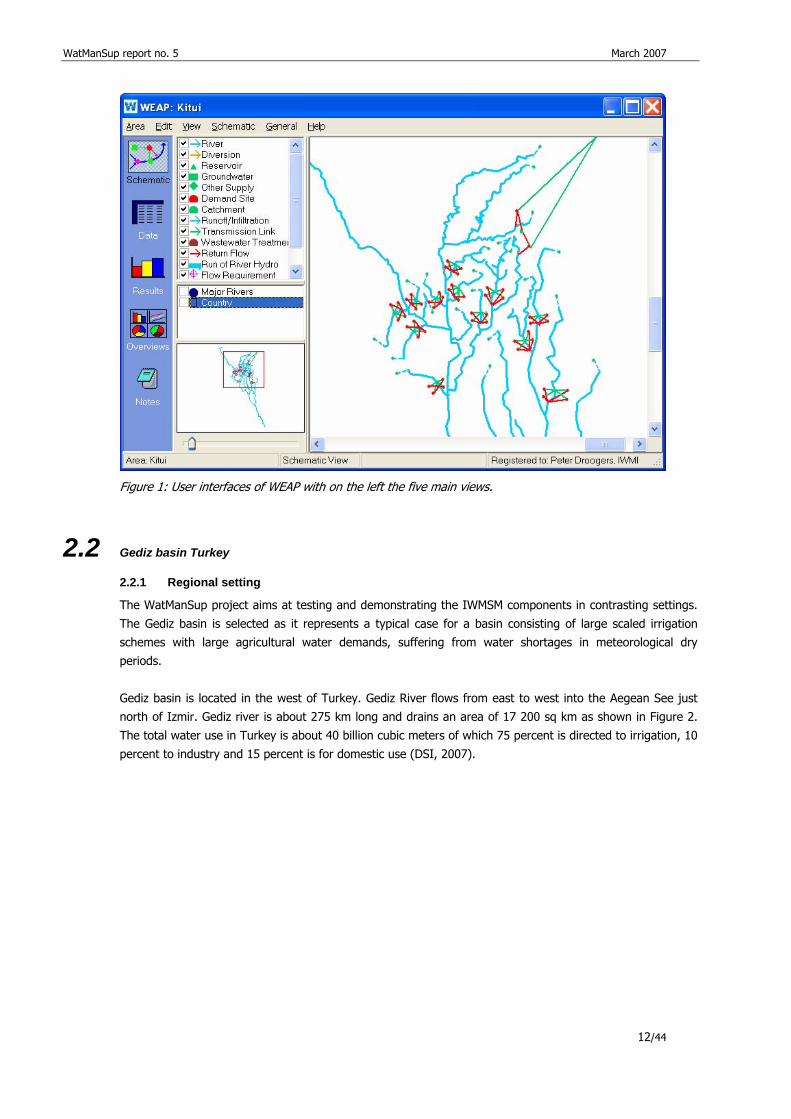
The WatManSup project aims at testing and demonstrating the IWMSM components in contrasting settings.
The Gediz basin is selected as it represents a typical case for a basin consisting of large scaled irrigation
schemes with large agricultural water demands, suffering from water shortages in meteorological dry
periods.
Gediz basin is located in the west of Turkey. Gediz River flows from east to west into the Aegean See just
north of Izmir. Gediz river is about 275 km long and drains an area of 17 200 sq km as shown in Figure 2.
The total water use in Turkey is about 40 billion cubic meters of which 75 percent is directed to irrigation, 10
percent to industry and 15 percent is for domestic use (DSI, 2007).
12/44
WatManSup report no. 5 March 2007
Figure 2: Overview of Gediz basin.
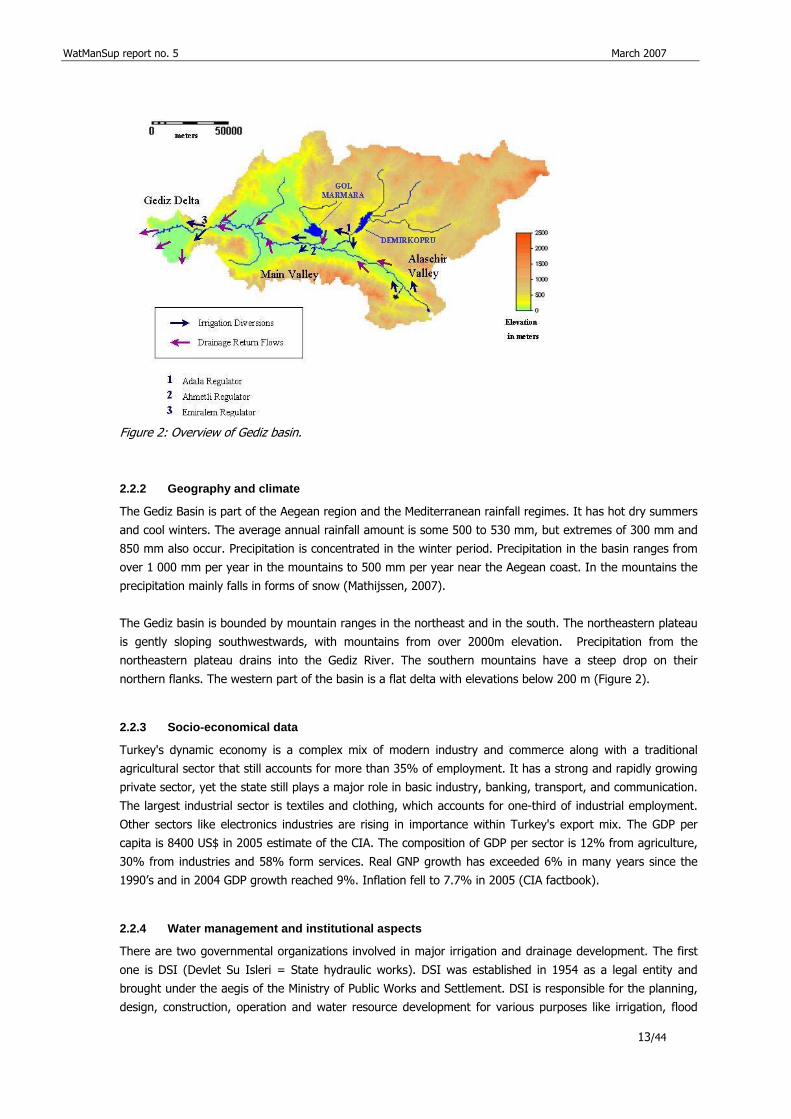
2.2.2 Geography and climate
The Gediz Basin is part of the Aegean region and the Mediterranean rainfall regimes. It has hot dry summers
and cool winters. The average annual rainfall amount is some 500 to 530 mm, but extremes of 300 mm and
850 mm also occur. Precipitation is concentrated in the winter period. Precipitation in the basin ranges from
over 1 000 mm per year in the mountains to 500 mm per year near the Aegean coast. In the mountains the
precipitation mainly falls in forms of snow (Mathijssen, 2007).
The Gediz basin is bounded by mountain ranges in the northeast and in the south. The northeastern plateau
is gently sloping southwestwards, with mountains from over 2000m elevation. Precipitation from the
northeastern plateau drains into the Gediz River. The southern mountains have a steep drop on their
northern flanks. The western part of the basin is a flat delta with elevations below 200 m (Figure 2).
2.2.3 Socio-economical data
Turkey's dynamic economy is a complex mix of modern industry and commerce along with a traditional
agricultural sector that still accounts for more than 35% of employment. It has a strong and rapidly growing
private sector, yet the state still plays a major role in basic industry, banking, transport, and communication.
The largest industrial sector is textiles and clothing, which accounts for one-third of industrial employment.
Other sectors like electronics industries are rising in importance within Turkey's export mix. The GDP per
capita is 8400 US$ in 2005 estimate of the CIA. The composition of GDP per sector is 12% from agriculture,
30% from industries and 58% form services. Real GNP growth has exceeded 6% in many years since the
1990’s and in 2004 GDP growth reached 9%. Inflation fell to 7.7% in 2005 (CIA factbook).
2.2.4 Water management and institutional aspects
There are two governmental organizations involved in major irrigation and drainage development. The first
one is DSI (Devlet Su Isleri = State hydraulic works). DSI was established in 1954 as a legal entity and
brought under the aegis of the Ministry of Public Works and Settlement. DSI is responsible for the planning,
design, construction, operation and water resource development for various purposes like irrigation, flood 13/44
WatManSup report no. 5 March 2007
control, swamp reclamation, hydropower development, navigation and water supply to cities with over
100 000 inhabitants (FAO, Aquastat 2004). Until 1995 DSI was responsible for the operation and
maintenance of the large irrigation schemes. In 1995 the management was transferred to the newly formed
Water Users Associations (WUA’s). WUA’s are small scaled governmental bodies that are only responsible for
the operation and maintenance of an irrigation area (Murray-Rust et al., 2006).
The second governmental organization is General Directorate of Rural Services (GDRS) which was
established in 1984 by incorporating the soil conservation and irrigation organization, the rural settlement
organization and the rural roads, water and electricity organization into one organization. GDRS is
responsible for the development of small-scale irrigation schemes and small reservoirs, rural roads and water
supply to rural areas. It is also responsible for land consolidation and the on-farm development of all
irrigation projects, including the projects developed by DSI. It was formerly under the Ministry of Agriculture
and Rural Affairs, but now falls under the Prime Minister's Office (FAO, Aquastat 2004).
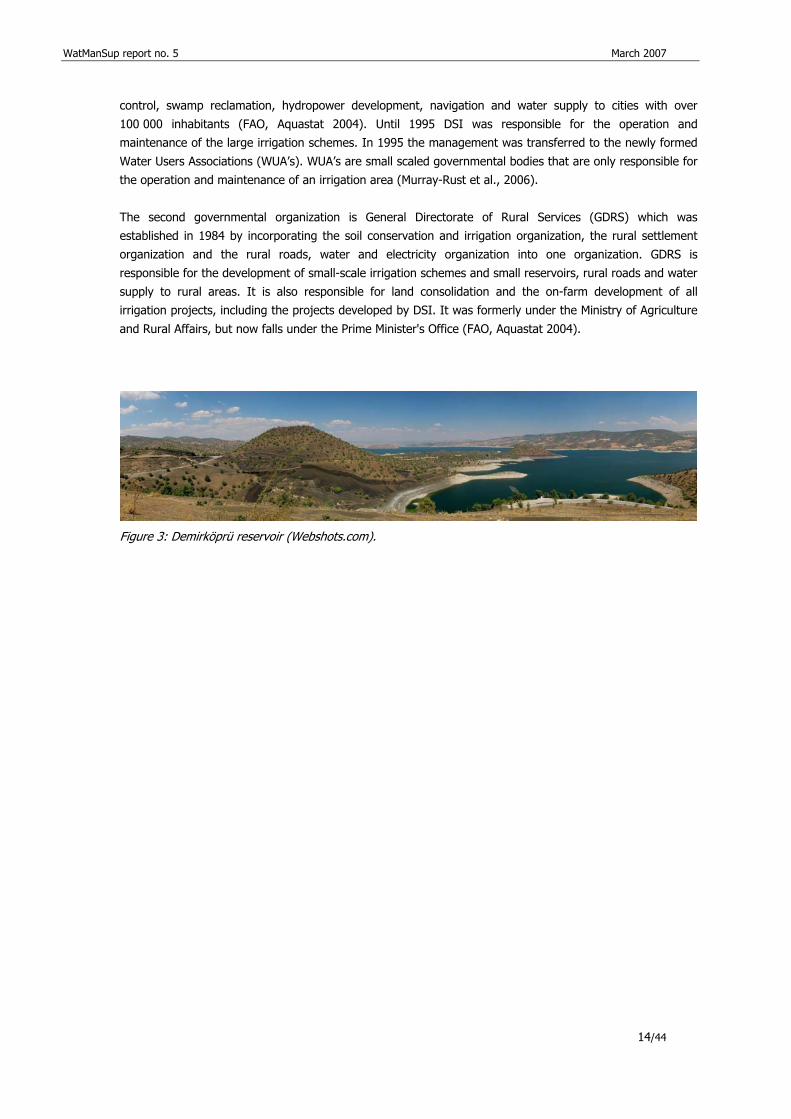
Figure 3: Demirköprü reservoir (Webshots.com).
14/44
WatManSup report no. 5 March 2007
3 WEAP Gediz basin
WEAP is an integrated water management tool that allows basin evaluations including all water related
activities in a specific area. Focus of WEAP is balancing water supply and water demand in a swift and
transparent way. The aim of this report is to show the usefulness of WEAP for the Gediz basin, rather than
to provide a complete and rigorous analysis of basin issues. Neither was the objective to provide direct
solutions to water related issues in the Gediz basin.
In this chapter the overall set-up of the model is explained. The WEAP model includes several steps of
explanation which are: Schematic Setup, Current Accounts, Reference Scenario and Other Scenarios.
Schematic Setup builds the basic structure of the model on which the calculations will be based. The Current
Accounts is the dataset from which the scenarios are built. The Current Accounts is a one year basis. The
Reference Scenario carries forward the Current Accounts data into the entire project period specified and
serves as a point of comparison. The Reference Scenario is the default scenario. Other Scenarios explore
possible changes to the system on future years after the Current Accounts year. For the Other Scenarios
changes are made to the system data from the default scenario (SEI, 2005a).
3.1 Schematic setup
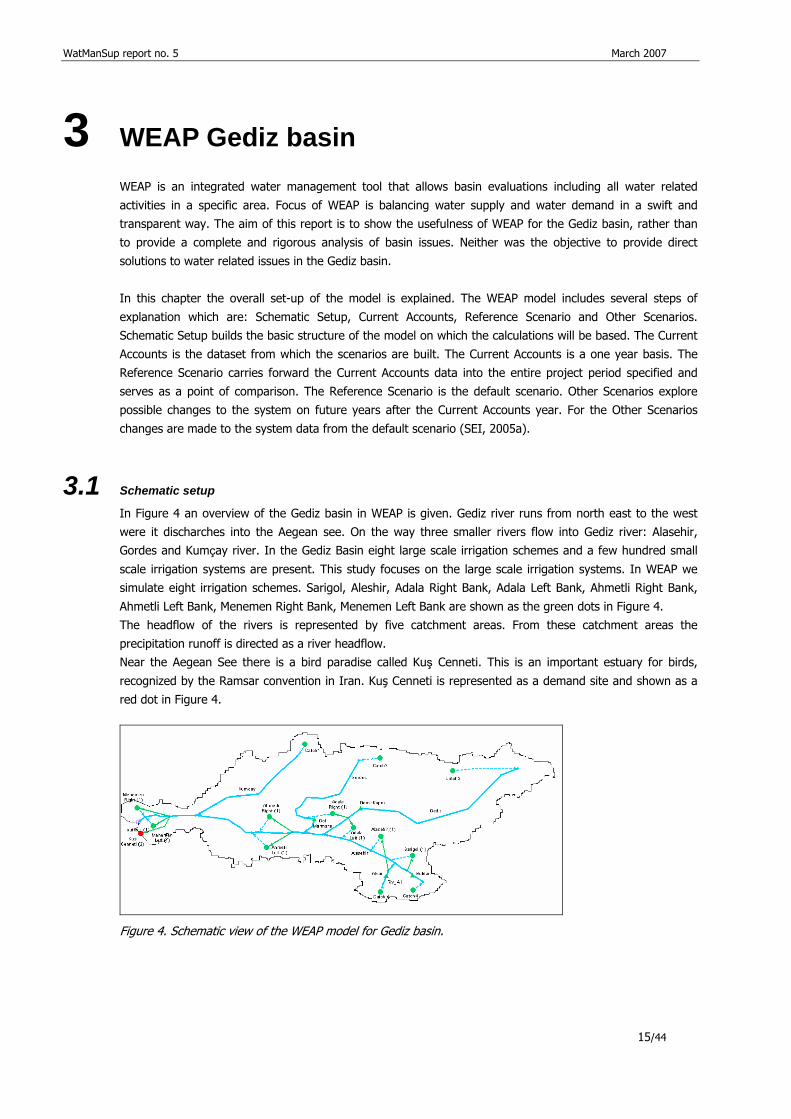
In Figure 4 an overview of the Gediz basin in WEAP is given. Gediz river runs from north east to the west
were it discharches into the Aegean see. On the way three smaller rivers flow into Gediz river: Alasehir, Gordes and Kumçay river. In the Gediz Basin eight large scale irrigation schemes and a few hundred small
scale irrigation systems are present. This study focuses on the large scale irrigation systems. In WEAP we
simulate eight irrigation schemes. Sarigol, Aleshir, Adala Right Bank, Adala Left Bank, Ahmetli Right Bank,
Ahmetli Left Bank, Menemen Right Bank, Menemen Left Bank are shown as the green dots in Figure 4.
The headflow of the rivers is represented by five catchment areas. From these catchment areas the
precipitation runoff is directed as a river headflow. Near the Aegean See there is a bird paradise called Kuş Cenneti. This is an important estuary for birds,
recognized by the Ramsar convention in Iran. Kuş Cenneti is represented as a demand site and shown as a
red dot in Figure 4.
Figure 4. Schematic view of the WEAP model for Gediz basin.
15/44
WatManSup report no. 5 March 2007
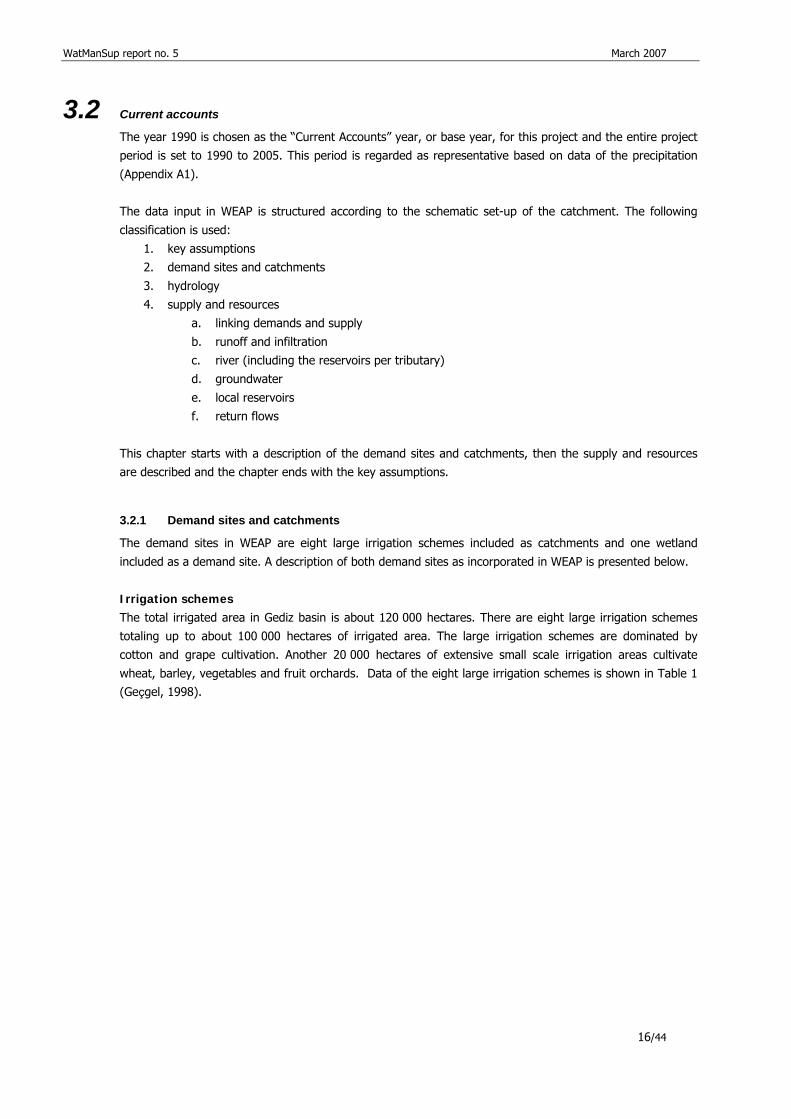
3.2 Current accounts
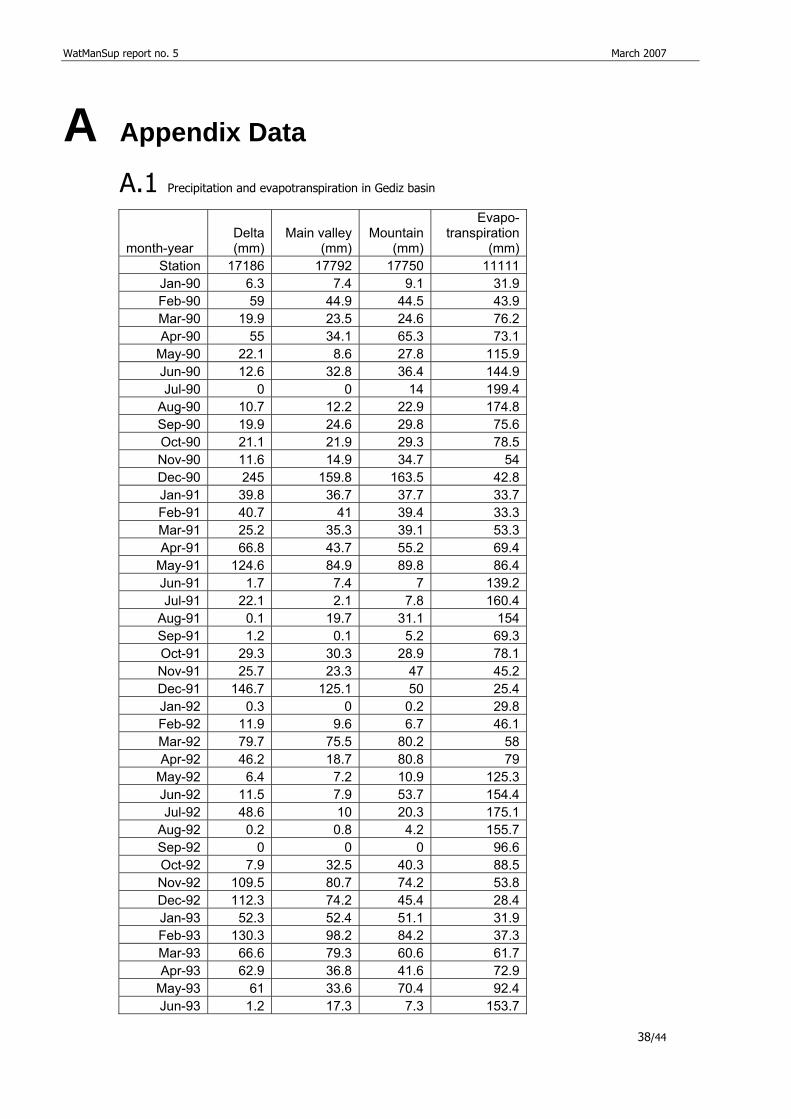
The year 1990 is chosen as the “Current Accounts” year, or base year, for this project and the entire project
period is set to 1990 to 2005. This period is regarded as representative based on data of the precipitation
(Appendix A1).
The data input in WEAP is structured according to the schematic set-up of the catchment. The following
classification is used:
1. key assumptions
2. demand sites and catchments
3. hydrology
4. supply and resources
a. linking demands and supply
b. runoff and infiltration
c. river (including the reservoirs per tributary)
d. groundwater
e. local reservoirs
f. return flows
This chapter starts with a description of the demand sites and catchments, then the supply and resources
are described and the chapter ends with the key assumptions.
3.2.1 Demand sites and catchments
The demand sites in WEAP are eight large irrigation schemes included as catchments and one wetland
included as a demand site. A description of both demand sites as incorporated in WEAP is presented below.
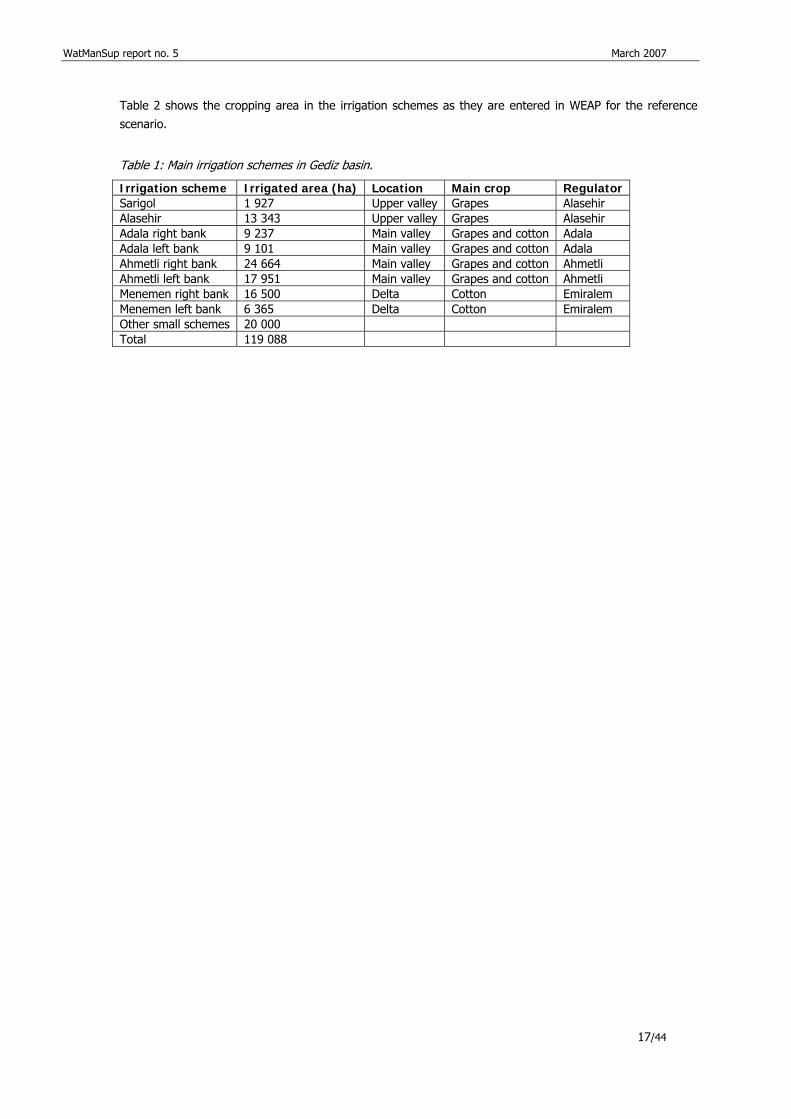
Irrigation schemes The total irrigated area in Gediz basin is about 120 000 hectares. There are eight large irrigation schemes
totaling up to about 100 000 hectares of irrigated area. The large irrigation schemes are dominated by
cotton and grape cultivation. Another 20 000 hectares of extensive small scale irrigation areas cultivate
wheat, barley, vegetables and fruit orchards. Data of the eight large irrigation schemes is shown in Table 1 (Geçgel, 1998).
16/44
WatManSup report no. 5 March 2007
17/44
Table 2 shows the cropping area in the irrigation schemes as they are entered in WEAP for the reference
scenario.
Table 1: Main irrigation schemes in Gediz basin.
Irrigation scheme Irrigated area (ha) Location Main crop Regulator Sarigol 1 927 Upper valley Grapes Alasehir Alasehir 13 343 Upper valley Grapes Alasehir Adala right bank 9 237 Main valley Grapes and cotton Adala Adala left bank 9 101 Main valley Grapes and cotton Adala Ahmetli right bank 24 664 Main valley Grapes and cotton Ahmetli Ahmetli left bank 17 951 Main valley Grapes and cotton Ahmetli Menemen right bank 16 500 Delta Cotton Emiralem Menemen left bank 6 365 Delta Cotton Emiralem Other small schemes 20 000 Total 119 088
WatManSup report no. 5 March 2007
Table 2: Cropping pattern in the irrigation schemes.
Cotton (%) Grapes (%) Others (%)
Menemen Left bank 50 9 41
Menemen Right bank 73 22 5
Ahmetli Left bank 30 62 8
Ahmetli Right bank 30 62 8
Adala Left bank 40 48 12
Adala Right bank 50 33 17
Alasehir 30 50 20
Sarigol 0 80 20
In a catchment site the FAO rainfall runoff method is used to calculate the water demand. For the
calculations with this method the land use and climate of a catchment site need to be defined. Land use is
composed of the parameters area, crop coefficient and effective precipitation, while climate is defined by the
precipitation and reference evapotranspiration. The climatic data and the crop coefficient are incorporated as
key assumptions and will be described in detail later in this chapter.
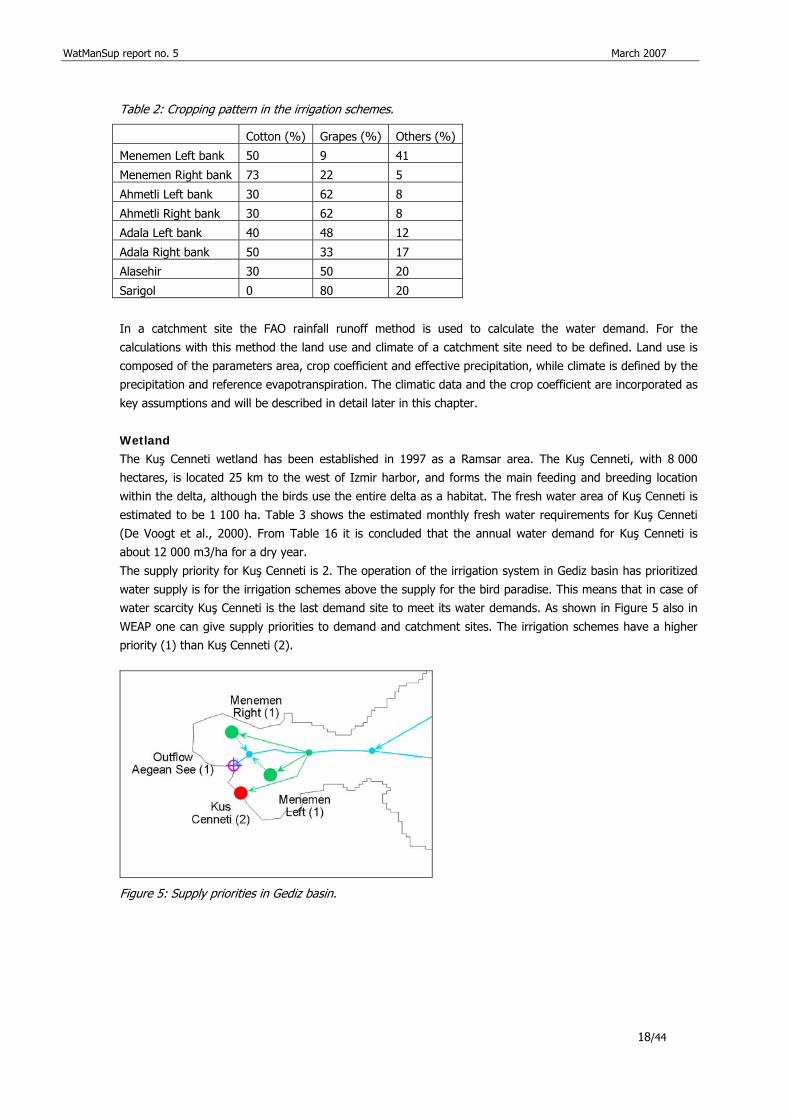
Wetland The Kuş Cenneti wetland has been established in 1997 as a Ramsar area. The Kuş Cenneti, with 8 000
hectares, is located 25 km to the west of Izmir harbor, and forms the main feeding and breeding location
within the delta, although the birds use the entire delta as a habitat. The fresh water area of Kuş Cenneti is
estimated to be 1 100 ha. Table 3 shows the estimated monthly fresh water requirements for Kuş Cenneti
(De Voogt et al., 2000). From Table 16 it is concluded that the annual water demand for Kuş Cenneti is
about 12 000 m3/ha for a dry year.
The supply priority for Kuş Cenneti is 2. The operation of the irrigation system in Gediz basin has prioritized
water supply is for the irrigation schemes above the supply for the bird paradise. This means that in case of
water scarcity Kuş Cenneti is the last demand site to meet its water demands. As shown in Figure 5 also in
WEAP one can give supply priorities to demand and catchment sites. The irrigation schemes have a higher
priority (1) than Kuş Cenneti (2).
Figure 5: Supply priorities in Gediz basin.
18/44
WatManSup report no. 5 March 2007
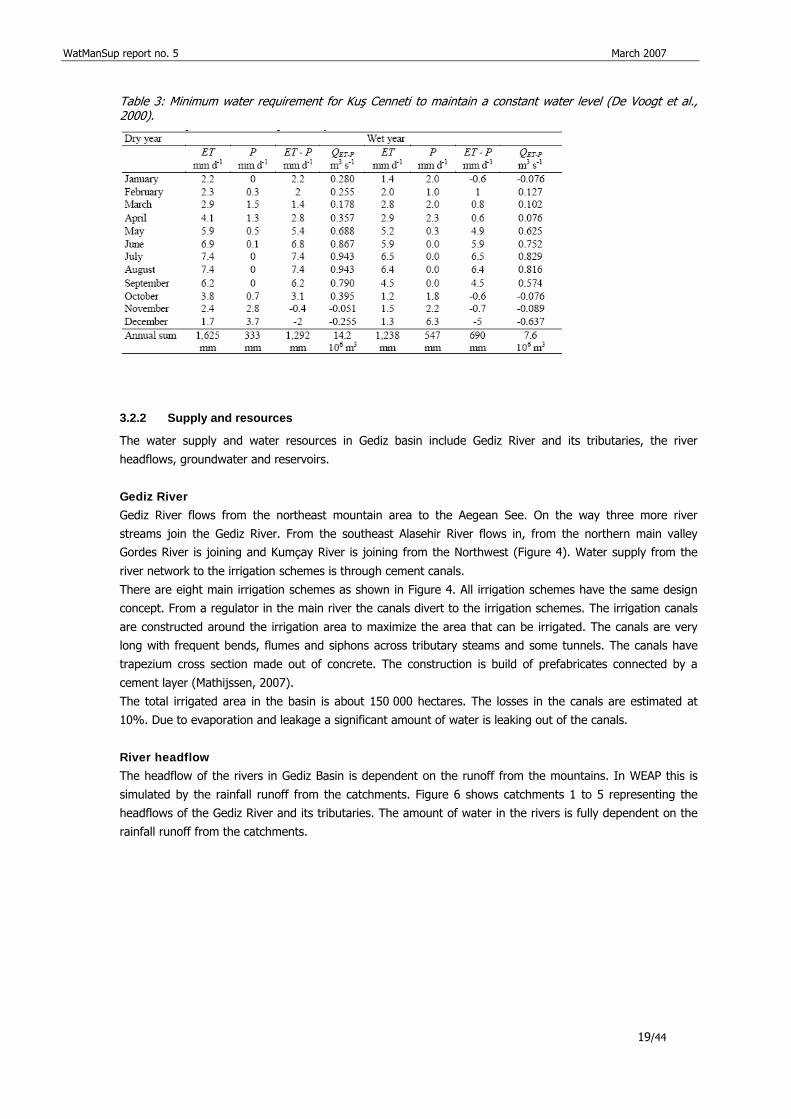
Table 3: Minimum water requirement for Kuş Cenneti to maintain a constant water level (De Voogt et al., 2000).
3.2.2 Supply and resources
The water supply and water resources in Gediz basin include Gediz River and its tributaries, the river
headflows, groundwater and reservoirs.
Gediz River Gediz River flows from the northeast mountain area to the Aegean See. On the way three more river
streams join the Gediz River. From the southeast Alasehir River flows in, from the northern main valley Gordes River is joining and Kumçay River is joining from the Northwest (Figure 4). Water supply from the
river network to the irrigation schemes is through cement canals.
There are eight main irrigation schemes as shown in Figure 4. All irrigation schemes have the same design
concept. From a regulator in the main river the canals divert to the irrigation schemes. The irrigation canals
are constructed around the irrigation area to maximize the area that can be irrigated. The canals are very
long with frequent bends, flumes and siphons across tributary steams and some tunnels. The canals have
trapezium cross section made out of concrete. The construction is build of prefabricates connected by a
cement layer (Mathijssen, 2007).
The total irrigated area in the basin is about 150 000 hectares. The losses in the canals are estimated at
10%. Due to evaporation and leakage a significant amount of water is leaking out of the canals.
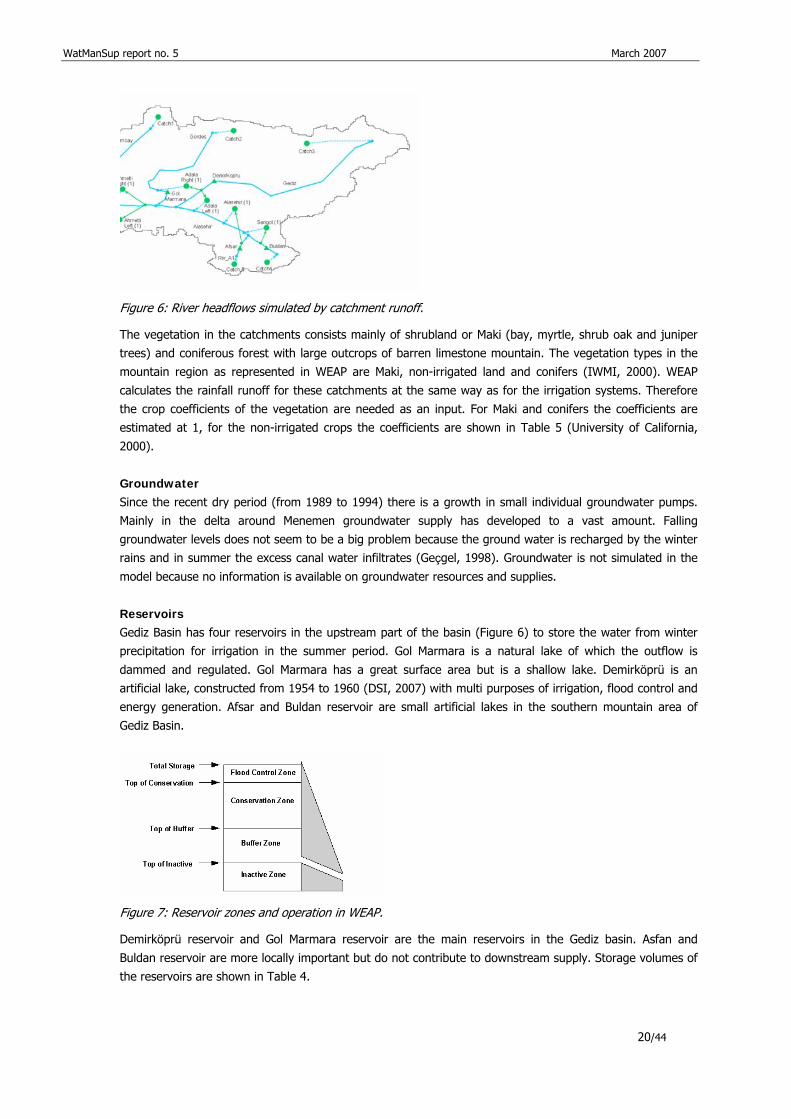
River headflow The headflow of the rivers in Gediz Basin is dependent on the runoff from the mountains. In WEAP this is
simulated by the rainfall runoff from the catchments. Figure 6 shows catchments 1 to 5 representing the
headflows of the Gediz River and its tributaries. The amount of water in the rivers is fully dependent on the
rainfall runoff from the catchments.
19/44
WatManSup report no. 5 March 2007
Figure 6: River headflows simulated by catchment runoff.
The vegetation in the catchments consists mainly of shrubland or Maki (bay, myrtle, shrub oak and juniper
trees) and coniferous forest with large outcrops of barren limestone mountain. The vegetation types in the
mountain region as represented in WEAP are Maki, non-irrigated land and conifers (IWMI, 2000). WEAP
calculates the rainfall runoff for these catchments at the same way as for the irrigation systems. Therefore
the crop coefficients of the vegetation are needed as an input. For Maki and conifers the coefficients are
estimated at 1, for the non-irrigated crops the coefficients are shown in Table 5 (University of California,
2000).
Groundwater Since the recent dry period (from 1989 to 1994) there is a growth in small individual groundwater pumps.
Mainly in the delta around Menemen groundwater supply has developed to a vast amount. Falling
groundwater levels does not seem to be a big problem because the ground water is recharged by the winter rains and in summer the excess canal water infiltrates (Geçgel, 1998). Groundwater is not simulated in the
model because no information is available on groundwater resources and supplies.
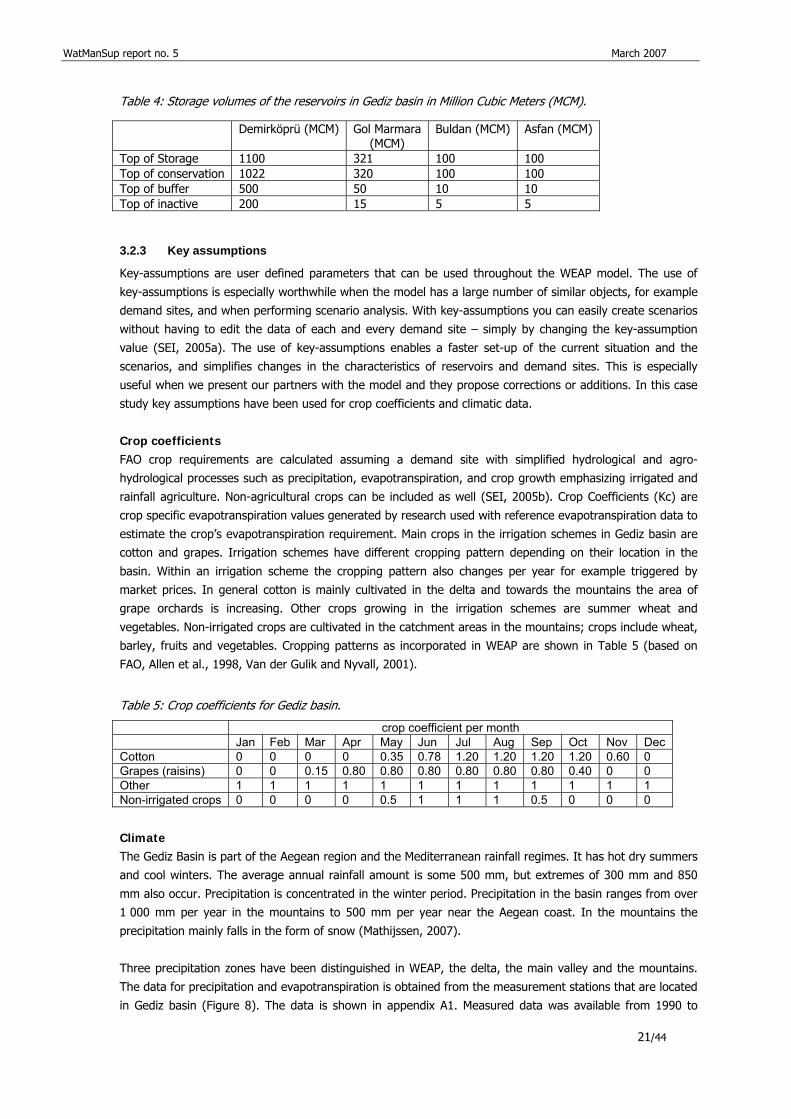
Reservoirs Gediz Basin has four reservoirs in the upstream part of the basin (Figure 6) to store the water from winter
precipitation for irrigation in the summer period. Gol Marmara is a natural lake of which the outflow is
dammed and regulated. Gol Marmara has a great surface area but is a shallow lake. Demirköprü is an
artificial lake, constructed from 1954 to 1960 (DSI, 2007) with multi purposes of irrigation, flood control and
energy generation. Afsar and Buldan reservoir are small artificial lakes in the southern mountain area of
Gediz Basin.
Figure 7: Reservoir zones and operation in WEAP.
Demirköprü reservoir and Gol Marmara reservoir are the main reservoirs in the Gediz basin. Asfan and
Buldan reservoir are more locally important but do not contribute to downstream supply. Storage volumes of
the reservoirs are shown in Table 4.
20/44
WatManSup report no. 5 March 2007
Table 4: Storage volumes of the reservoirs in Gediz basin in Million Cubic Meters (MCM).
Demirköprü (MCM) Gol Marmara (MCM)
Buldan (MCM) Asfan (MCM)
Top of Storage 1100 321 100 100 Top of conservation 1022 320 100 100
Top of buffer 500 50 10 10 Top of inactive 200 15 5 5
3.2.3 Key assumptions
Key-assumptions are user defined parameters that can be used throughout the WEAP model. The use of
key-assumptions is especially worthwhile when the model has a large number of similar objects, for example
demand sites, and when performing scenario analysis. With key-assumptions you can easily create scenarios
without having to edit the data of each and every demand site – simply by changing the key-assumption
value (SEI, 2005a). The use of key-assumptions enables a faster set-up of the current situation and the
scenarios, and simplifies changes in the characteristics of reservoirs and demand sites. This is especially
useful when we present our partners with the model and they propose corrections or additions. In this case
study key assumptions have been used for crop coefficients and climatic data.
Crop coefficients FAO crop requirements are calculated assuming a demand site with simplified hydrological and agro-
hydrological processes such as precipitation, evapotranspiration, and crop growth emphasizing irrigated and
rainfall agriculture. Non-agricultural crops can be included as well (SEI, 2005b). Crop Coefficients (Kc) are
crop specific evapotranspiration values generated by research used with reference evapotranspiration data to
estimate the crop’s evapotranspiration requirement. Main crops in the irrigation schemes in Gediz basin are
cotton and grapes. Irrigation schemes have different cropping pattern depending on their location in the
basin. Within an irrigation scheme the cropping pattern also changes per year for example triggered by
market prices. In general cotton is mainly cultivated in the delta and towards the mountains the area of
grape orchards is increasing. Other crops growing in the irrigation schemes are summer wheat and
vegetables. Non-irrigated crops are cultivated in the catchment areas in the mountains; crops include wheat,
barley, fruits and vegetables. Cropping patterns as incorporated in WEAP are shown in Table 5 (based on
FAO, Allen et al., 1998, Van der Gulik and Nyvall, 2001).
Table 5: Crop coefficients for Gediz basin.
crop coefficient per month Jan Feb Mar Apr May Jun Jul Aug Sep Oct Nov Dec Cotton 0 0 0 0 0.35 0.78 1.20 1.20 1.20 1.20 0.60 0 Grapes (raisins) 0 0 0.15 0.80 0.80 0.80 0.80 0.80 0.80 0.40 0 0 Other 1 1 1 1 1 1 1 1 1 1 1 1 Non-irrigated crops 0 0 0 0 0.5 1 1 1 0.5 0 0 0
Climate The Gediz Basin is part of the Aegean region and the Mediterranean rainfall regimes. It has hot dry summers
and cool winters. The average annual rainfall amount is some 500 mm, but extremes of 300 mm and 850
mm also occur. Precipitation is concentrated in the winter period. Precipitation in the basin ranges from over
1 000 mm per year in the mountains to 500 mm per year near the Aegean coast. In the mountains the
precipitation mainly falls in the form of snow (Mathijssen, 2007).
Three precipitation zones have been distinguished in WEAP, the delta, the main valley and the mountains.
The data for precipitation and evapotranspiration is obtained from the measurement stations that are located
in Gediz basin (Figure 8). The data is shown in appendix A1. Measured data was available from 1990 to 21/44
WatManSup report no. 5 March 2007
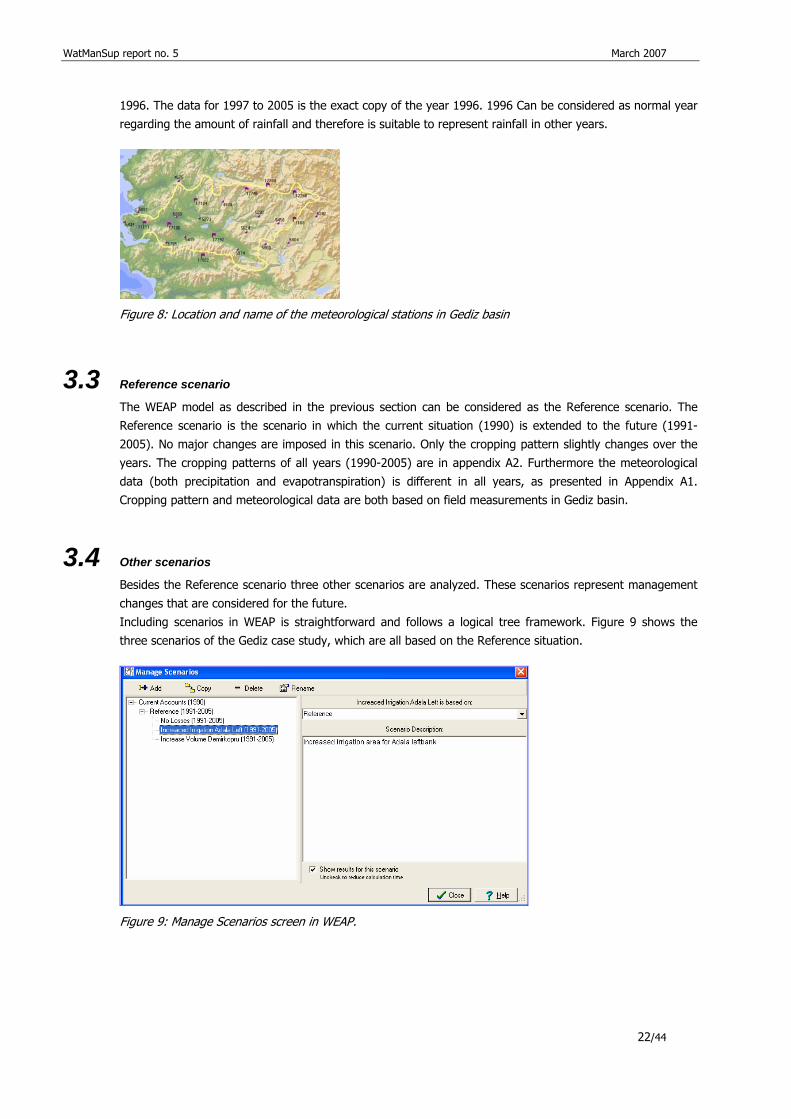
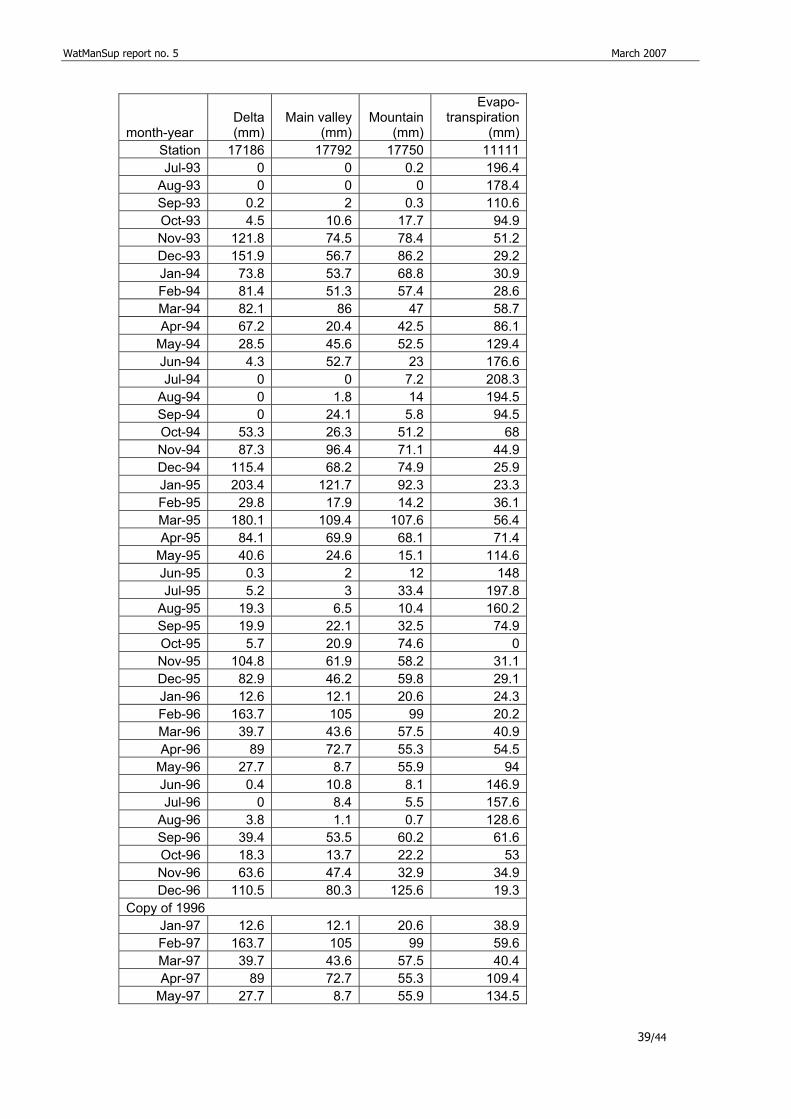
1996. The data for 1997 to 2005 is the exact copy of the year 1996. 1996 Can be considered as normal year
regarding the amount of rainfall and therefore is suitable to represent rainfall in other years.
Figure 8: Location and name of the meteorological stations in Gediz basin
3.3 Reference scenario
The WEAP model as described in the previous section can be considered as the Reference scenario. The
Reference scenario is the scenario in which the current situation (1990) is extended to the future (1991-
2005). No major changes are imposed in this scenario. Only the cropping pattern slightly changes over the
years. The cropping patterns of all years (1990-2005) are in appendix A2. Furthermore the meteorological
data (both precipitation and evapotranspiration) is different in all years, as presented in Appendix A1.
Cropping pattern and meteorological data are both based on field measurements in Gediz basin.
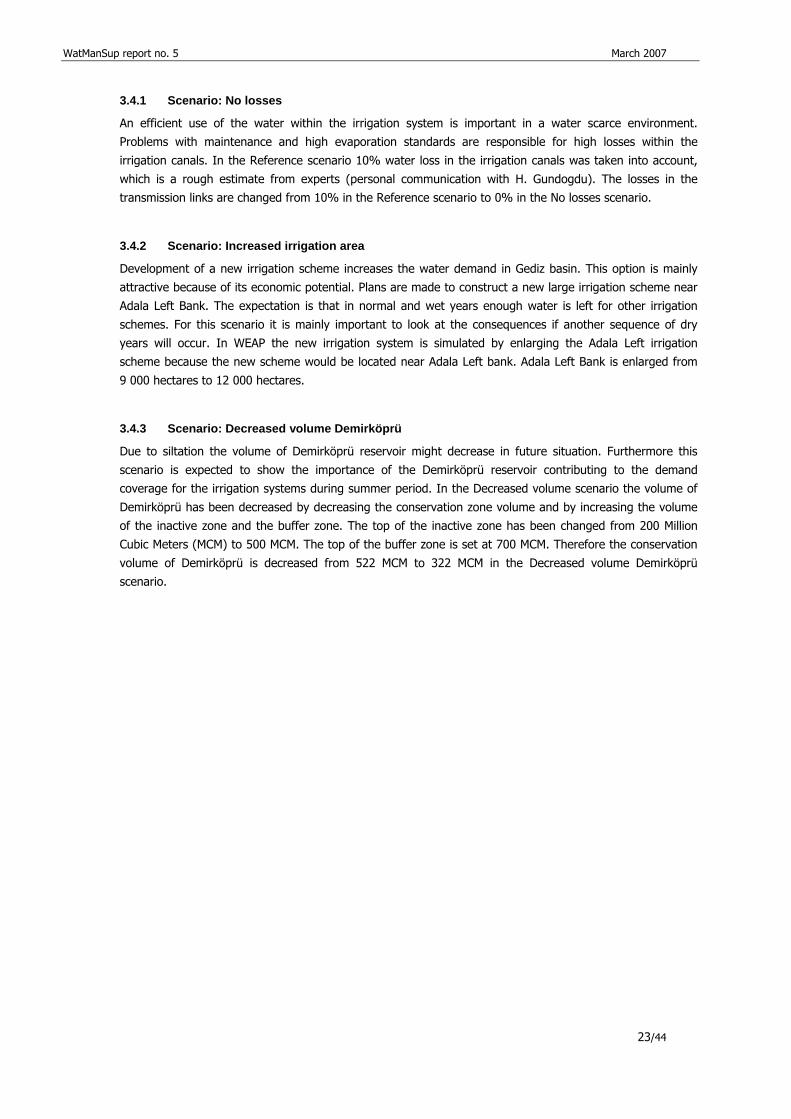
3.4 Other scenarios
Besides the Reference scenario three other scenarios are analyzed. These scenarios represent management
changes that are considered for the future.
Including scenarios in WEAP is straightforward and follows a logical tree framework. Figure 9 shows the
three scenarios of the Gediz case study, which are all based on the Reference situation.
Figure 9: Manage Scenarios screen in WEAP.
22/44
WatManSup report no. 5 March 2007
23/44
3.4.1 Scenario: No losses
An efficient use of the water within the irrigation system is important in a water scarce environment.
Problems with maintenance and high evaporation standards are responsible for high losses within the
irrigation canals. In the Reference scenario 10% water loss in the irrigation canals was taken into account,
which is a rough estimate from experts (personal communication with H. Gundogdu). The losses in the
transmission links are changed from 10% in the Reference scenario to 0% in the No losses scenario.
3.4.2 Scenario: Increased irrigation area
Development of a new irrigation scheme increases the water demand in Gediz basin. This option is mainly
attractive because of its economic potential. Plans are made to construct a new large irrigation scheme near
Adala Left Bank. The expectation is that in normal and wet years enough water is left for other irrigation
schemes. For this scenario it is mainly important to look at the consequences if another sequence of dry
years will occur. In WEAP the new irrigation system is simulated by enlarging the Adala Left irrigation
scheme because the new scheme would be located near Adala Left bank. Adala Left Bank is enlarged from
9 000 hectares to 12 000 hectares.
3.4.3 Scenario: Decreased volume Demirköprü
Due to siltation the volume of Demirköprü reservoir might decrease in future situation. Furthermore this
scenario is expected to show the importance of the Demirköprü reservoir contributing to the demand
coverage for the irrigation systems during summer period. In the Decreased volume scenario the volume of
Demirköprü has been decreased by decreasing the conservation zone volume and by increasing the volume
of the inactive zone and the buffer zone. The top of the inactive zone has been changed from 200 Million
Cubic Meters (MCM) to 500 MCM. The top of the buffer zone is set at 700 MCM. Therefore the conservation
volume of Demirköprü is decreased from 522 MCM to 322 MCM in the Decreased volume Demirköprü
scenario.

WatManSup report no. 5 March 2007
24/44
WatManSup report no. 5 March 2007
4 Results One of the strong components of WEAP is the way results can be presented and combined in graphs, tables
or maps. Many options exist to aggregate data in time, space or per hydrological component. Moreover
different scenarios can be compared easily. Additionally, data can be exported to Excel for further analysis.
The most important features to display output will be presented in this chapter. Focus will be on results for
the Reference scenario the comparison with the other scenarios.
4.1 Reference Scenario
The Reference scenario (1990 to 2005) contains the same data and structure as the Current accounts year
(1990). Only the cropping pattern and the meteorological data are different for all the years. Results for the
Reference scenario are presented on: (i) availability of water, (ii) demand and demand coverage, and (iii)
streamflow. Focus in this chapter will be on the options WEAP offers to present results.
4.1.1 Water availability
The first output to focus on is the amount of water available for further use. As explained before, WEAP
deals with water allocation and not so much with high detail hydrological processes. In earlier versions of
WEAP water supply could be included only as a fixed amount flowing into the study area as so-called
headflows. However, the WEAP version used for this study has a new node component called Catchments,
which considers simplified rainfall-runoff processes.
Processes in Catchment nodes include precipitation as input, and losses by evapotranspiration that are based
on the potential evaporation the crop coefficients of the vegetation and the water availability. The difference
between precipitation and actual evapotranspiration is than the available water that can be used
downstream.
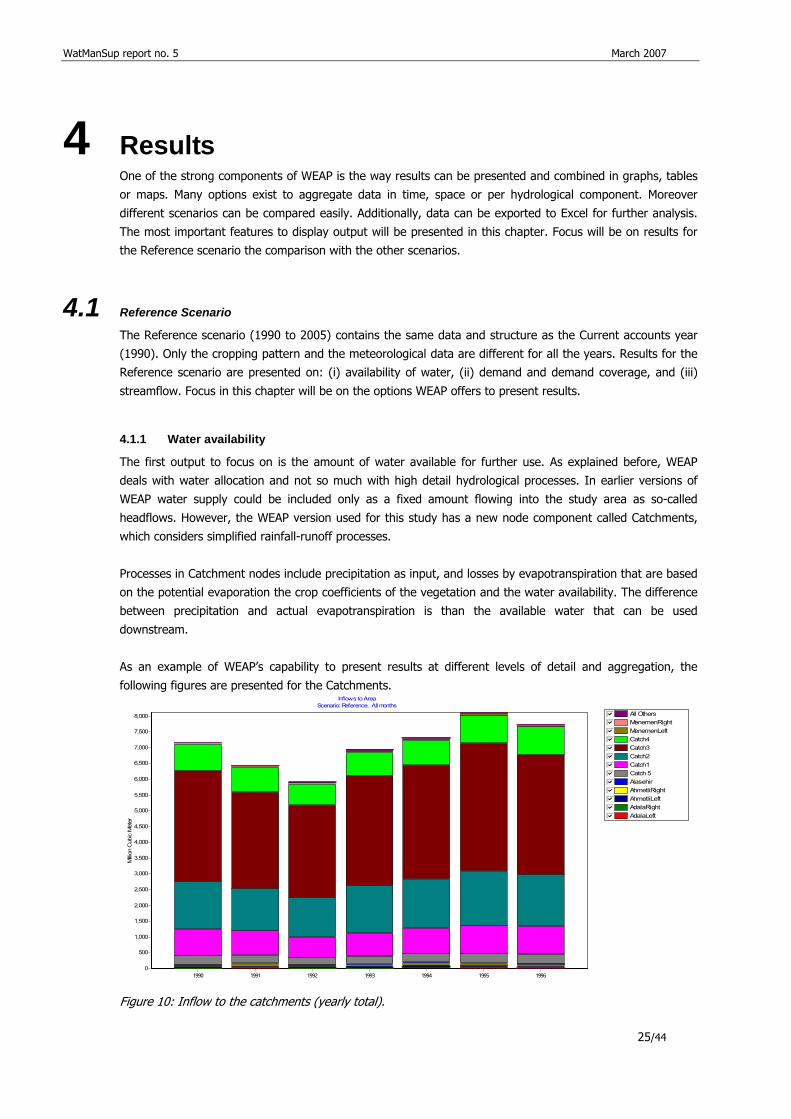
As an example of WEAP’s capability to present results at different levels of detail and aggregation, the
following figures are presented for the Catchments.
All Others gfedcbMenemenRight gfedcbMenemenLeft gfedcbCatch4 gfedcbCatch3 gfedcbCatch2 gfedcbCatch1 gfedcbCatch 5 gfedcbAlasehir gfedcbAhmetliRight gfedcbAhmetliLeft gfedcbAdalaRight gfedcbAdalaLeft gfedcb
Inflows to AreaScenario: Reference, All months
1990 1991 1992 1993 1994 1995 1996
Milli
on C
ubic
Met
er
8,000
7,500
7,000
6,500
6,000
5,500
5,000
4,500
4,000
3,500
3,000
2,500
2,000
1,500
1,000
500
0
Figure 10: Inflow to the catchments (yearly total).
25/44
WatManSup report no. 5 March 2007
Figure 10 shows the water entering the system in the years 1990-1996. For the Gediz basin the water
entering the system is limited to the precipitation in the catchment areas. But other possible river inflows in
WEAP are river headflows, surface water inflows to reaches, groundwater discharge, local reservoir inflows
and local supply inflows. Figure 10 shows that the water availability roughly fluctuates between 5000 MCM
for a dry year and 8000 MCM for a wet year. The results for the years 1997-2005 are the same as for 1996
because precipitation and evapotranspiration data were copied from 1996. The results after 1996 show no
fluctuation and are therefore not presented in the graph. Furthermore Figure 10 shows that catchment 3 has
the largest contribution to the water inflow in the system. This is due to its large surface area because the
precipitation data is the same for the catchments.
All Others gfedcbMenemenRight gfedcbMenemenLeft gfedcbCatch4 gfedcbCatch3 gfedcbCatch2 gfedcbCatch1 gfedcbCatch 5 gfedcbAlasehir gfedcbAhmetliRight gfedcbAhmetliLeft gfedcbAdalaRight gfedcbAdalaLeft gfedcb
Runoff from PrecipitationScenario: Reference, All months
January February March April May June July August September October November December
Milli
on C
ubic
Met
er
1,050
1,000
950
900
850
800
750
700
650
600
550
500
450
400
350
300
250
200
150
100
50
0
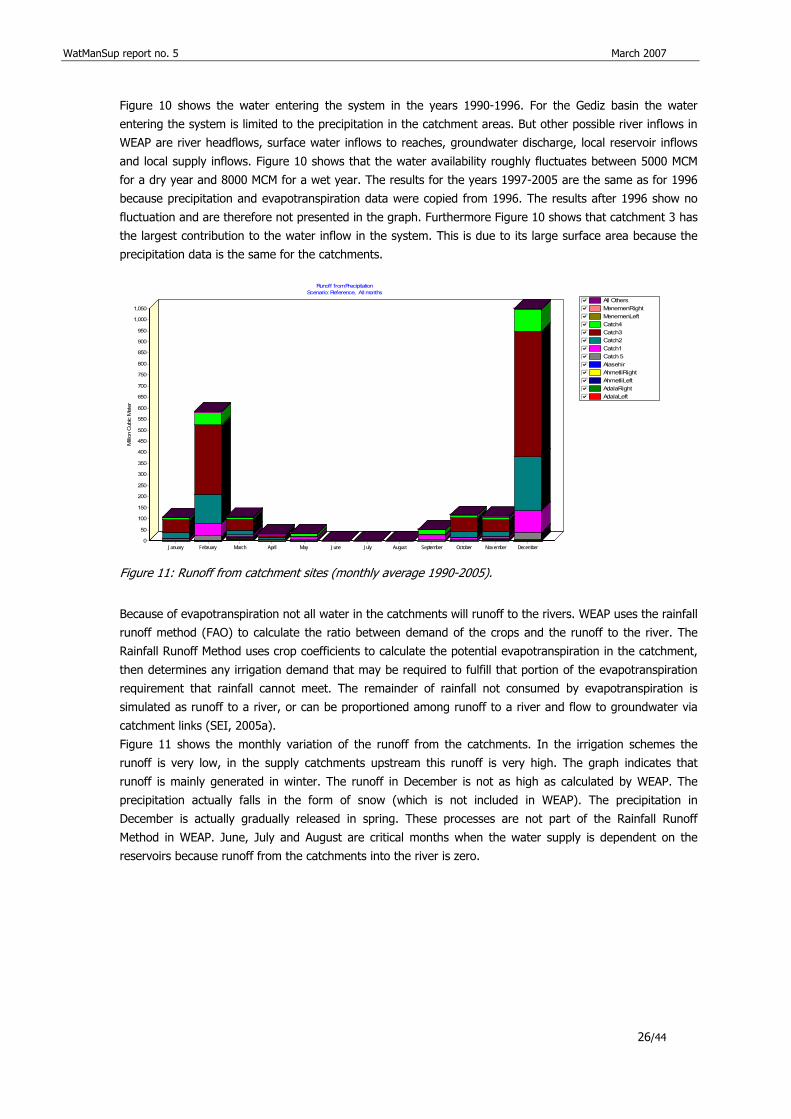
Figure 11: Runoff from catchment sites (monthly average 1990-2005).
Because of evapotranspiration not all water in the catchments will runoff to the rivers. WEAP uses the rainfall
runoff method (FAO) to calculate the ratio between demand of the crops and the runoff to the river. The
Rainfall Runoff Method uses crop coefficients to calculate the potential evapotranspiration in the catchment,
then determines any irrigation demand that may be required to fulfill that portion of the evapotranspiration
requirement that rainfall cannot meet. The remainder of rainfall not consumed by evapotranspiration is
simulated as runoff to a river, or can be proportioned among runoff to a river and flow to groundwater via
catchment links (SEI, 2005a).
Figure 11 shows the monthly variation of the runoff from the catchments. In the irrigation schemes the
runoff is very low, in the supply catchments upstream this runoff is very high. The graph indicates that
runoff is mainly generated in winter. The runoff in December is not as high as calculated by WEAP. The
precipitation actually falls in the form of snow (which is not included in WEAP). The precipitation in
December is actually gradually released in spring. These processes are not part of the Rainfall Runoff
Method in WEAP. June, July and August are critical months when the water supply is dependent on the
reservoirs because runoff from the catchments into the river is zero.
26/44
WatManSup report no. 5 March 2007
#
#
#
$
$
#
#
#
#
#
#
#
#
#
#
#
#
#
#
#
#
#
#
#
#
#
#
#
#
#
#
$$
#
#
#
#
#
#
#
ð
$
$#
#
#
# #
##
#
#
#
#
$ $
#
#
ð#
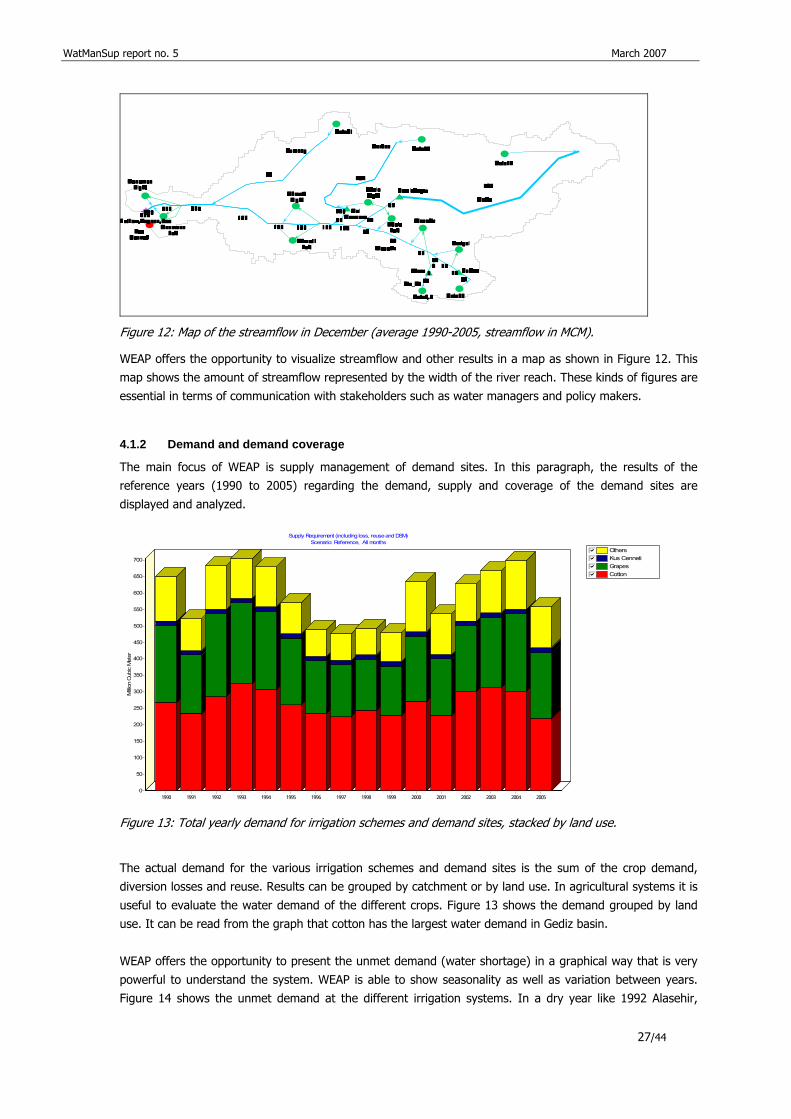
Figure 12: Map of the streamflow in December (average 1990-2005, streamflow in MCM).
WEAP offers the opportunity to visualize streamflow and other results in a map as shown in Figure 12. This
map shows the amount of streamflow represented by the width of the river reach. These kinds of figures are
essential in terms of communication with stakeholders such as water managers and policy makers.
4.1.2 Demand and demand coverage
The main focus of WEAP is supply management of demand sites. In this paragraph, the results of the
reference years (1990 to 2005) regarding the demand, supply and coverage of the demand sites are
displayed and analyzed.
Others gfedcbKus Cenneti gfedcbGrapes gfedcbCotton gfedcb
Supply Requirement (including loss, reuse and DSM)Scenario: Reference, All months
1990 1991 1992 1993 1994 1995 1996 1997 1998 1999 2000 2001 2002 2003 2004 2005
Milli
on C
ubic
Met
er
700
650
600
550
500
450
400
350
300
250
200
150
100
50
0
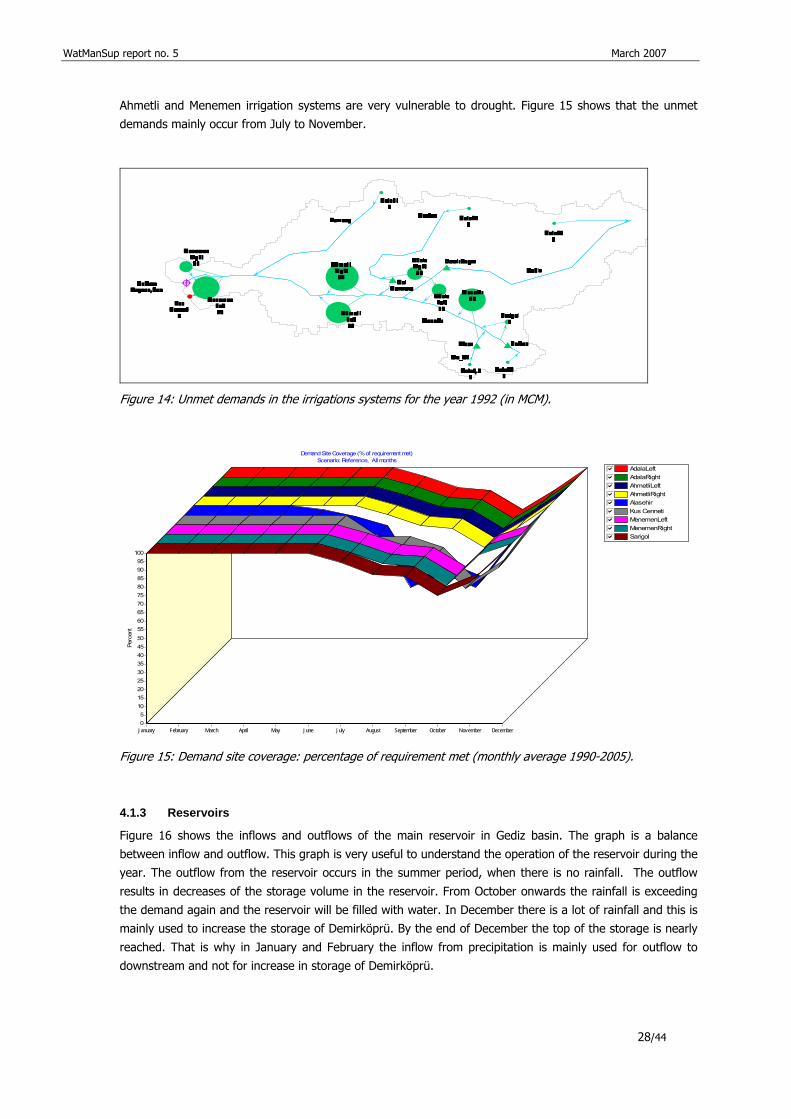
Figure 13: Total yearly demand for irrigation schemes and demand sites, stacked by land use.
The actual demand for the various irrigation schemes and demand sites is the sum of the crop demand,
diversion losses and reuse. Results can be grouped by catchment or by land use. In agricultural systems it is
useful to evaluate the water demand of the different crops. Figure 13 shows the demand grouped by land
use. It can be read from the graph that cotton has the largest water demand in Gediz basin.
WEAP offers the opportunity to present the unmet demand (water shortage) in a graphical way that is very
powerful to understand the system. WEAP is able to show seasonality as well as variation between years.
Figure 14 shows the unmet demand at the different irrigation systems. In a dry year like 1992 Alasehir,
27/44
WatManSup report no. 5 March 2007
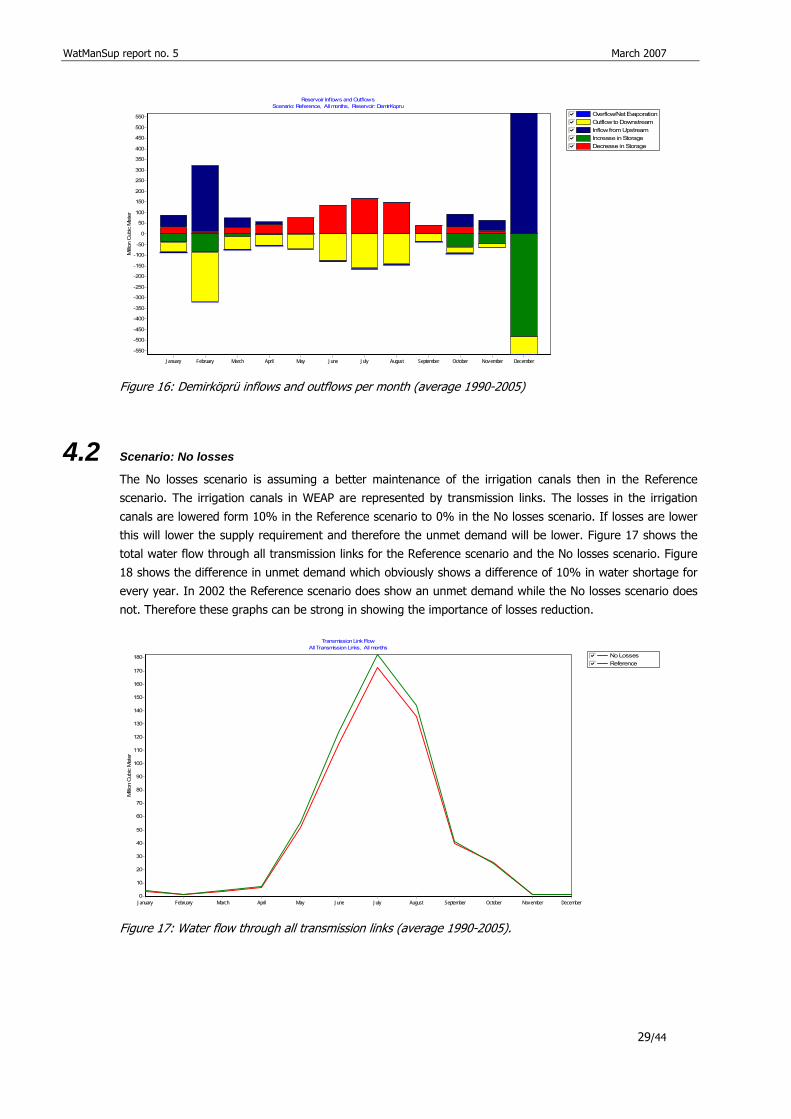
Ahmetli and Menemen irrigation systems are very vulnerable to drought. Figure 15 shows that the unmet
demands mainly occur from July to November.
#
#
#
$
$
#
#
#
#
#
#
#
#
#
#
#
#
#
#
#
#
#
#
#
#
#
#
#
#
#
#
$$
#
#
#
#
#
#
#
ð
$
$##
## #
# #
#
#
#
#
$ $
#
#
ð#
Figure 14: Unmet demands in the irrigations systems for the year 1992 (in MCM).
AdalaLeft gfedcbAdalaRight gfedcbAhmetliLeft gfedcbAhmetliRight gfedcbAlasehir gfedcbKus Cenneti gfedcbMenemenLeft gfedcbMenemenRight gfedcbSarigol gfedcb
Demand Site Coverage (% of requirement met)Scenario: Reference, All months
January February March April May June July August September October November December
Perc
ent
10095908580757065605550454035302520151050
Figure 15: Demand site coverage: percentage of requirement met (monthly average 1990-2005).
4.1.3 Reservoirs
Figure 16 shows the inflows and outflows of the main reservoir in Gediz basin. The graph is a balance
between inflow and outflow. This graph is very useful to understand the operation of the reservoir during the
year. The outflow from the reservoir occurs in the summer period, when there is no rainfall. The outflow
results in decreases of the storage volume in the reservoir. From October onwards the rainfall is exceeding
the demand again and the reservoir will be filled with water. In December there is a lot of rainfall and this is
mainly used to increase the storage of Demirköprü. By the end of December the top of the storage is nearly
reached. That is why in January and February the inflow from precipitation is mainly used for outflow to
downstream and not for increase in storage of Demirköprü.
28/44
WatManSup report no. 5 March 2007
Overflow/Net EvaporationgfedcbOutflow to Downstream gfedcbInflow from Upstream gfedcbIncrease in Storage gfedcbDecrease in Storage gfedcb
Reservoir Inflows and OutflowsScenario: Reference, All months, Reservoir: DemirKopru
January February March April May June July August September October November December
Milli
on C
ubic
Met
er
550
500
450
400
350
300
250
200
150
100
50
0
-50
-100
-150
-200
-250
-300
-350
-400
-450
-500
-550
Figure 16: Demirköprü inflows and outflows per month (average 1990-2005)
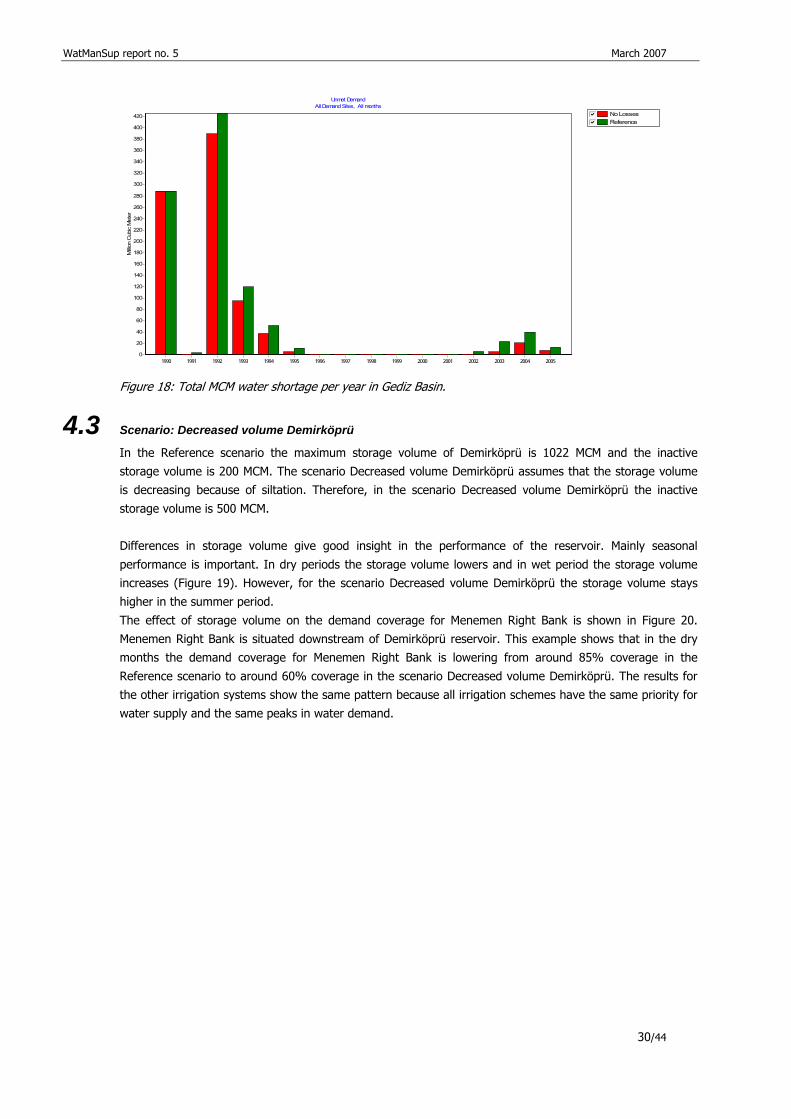
4.2 Scenario: No losses
The No losses scenario is assuming a better maintenance of the irrigation canals then in the Reference
scenario. The irrigation canals in WEAP are represented by transmission links. The losses in the irrigation
canals are lowered form 10% in the Reference scenario to 0% in the No losses scenario. If losses are lower
this will lower the supply requirement and therefore the unmet demand will be lower. Figure 17 shows the
total water flow through all transmission links for the Reference scenario and the No losses scenario. Figure
18 shows the difference in unmet demand which obviously shows a difference of 10% in water shortage for
every year. In 2002 the Reference scenario does show an unmet demand while the No losses scenario does
not. Therefore these graphs can be strong in showing the importance of losses reduction.
No Losses gfedcbReference gfedcb
Transmission Link FlowAll Transmission Links, All months
January February March April May June July August September October November December
Milli
on C
ubic
Met
er
180
170
160
150
140
130
120
110
100
90
80
70
60
50
40
30
20
10
0
Figure 17: Water flow through all transmission links (average 1990-2005).
29/44
WatManSup report no. 5 March 2007
No Losses gfedcbReference gfedcb
Unmet DemandAll Demand Sites, All months
1990 1991 1992 1993 1994 1995 1996 1997 1998 1999 2000 2001 2002 2003 2004 2005
Milli
on C
ubic
Met
er
420
400
380
360
340
320
300
280
260
240
220
200
180
160
140
120
100
80
60
40
20
0
Figure 18: Total MCM water shortage per year in Gediz Basin.
4.3 Scenario: Decreased volume Demirköprü
In the Reference scenario the maximum storage volume of Demirköprü is 1022 MCM and the inactive
storage volume is 200 MCM. The scenario Decreased volume Demirköprü assumes that the storage volume
is decreasing because of siltation. Therefore, in the scenario Decreased volume Demirköprü the inactive
storage volume is 500 MCM.
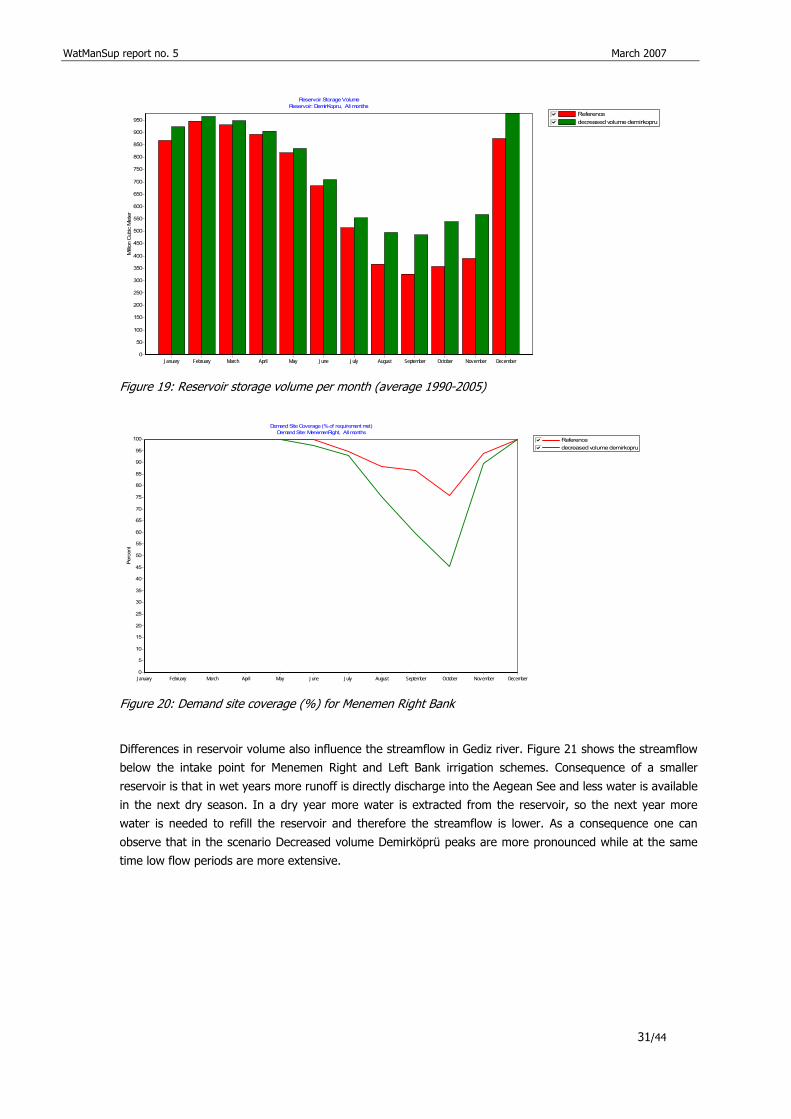
Differences in storage volume give good insight in the performance of the reservoir. Mainly seasonal
performance is important. In dry periods the storage volume lowers and in wet period the storage volume
increases (Figure 19). However, for the scenario Decreased volume Demirköprü the storage volume stays
higher in the summer period.
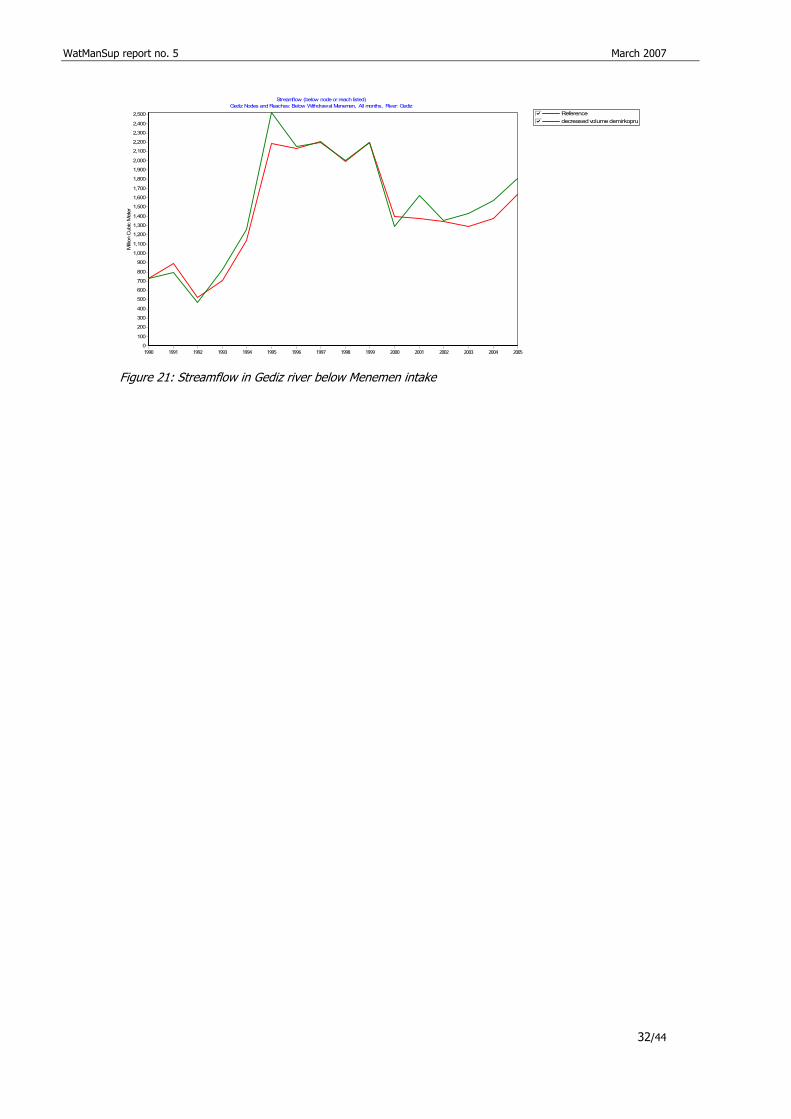
The effect of storage volume on the demand coverage for Menemen Right Bank is shown in Figure 20.
Menemen Right Bank is situated downstream of Demirköprü reservoir. This example shows that in the dry
months the demand coverage for Menemen Right Bank is lowering from around 85% coverage in the
Reference scenario to around 60% coverage in the scenario Decreased volume Demirköprü. The results for
the other irrigation systems show the same pattern because all irrigation schemes have the same priority for
water supply and the same peaks in water demand.
30/44
WatManSup report no. 5 March 2007
Reference gfedcbdecreased volume demirkoprugfedcb
Reservoir Storage VolumeReservoir: DemirKopru, All months
January February March April May June July August September October November December
Milli
on C
ubic
Met
er950
900
850
800
750
700
650
600
550
500
450
400
350
300
250
200
150
100
50
0
Figure 19: Reservoir storage volume per month (average 1990-2005)
Reference gfedcbdecreased volume demirkoprugfedcb
Demand Site Coverage (% of requirement met)Demand Site: MenemenRight, All months
January February March April May June July August September October November December
Perc
ent
100
95
90
85
80
75
70
65
60
55
50
45
40
35
30
25
20
15
10
5
0
Figure 20: Demand site coverage (%) for Menemen Right Bank
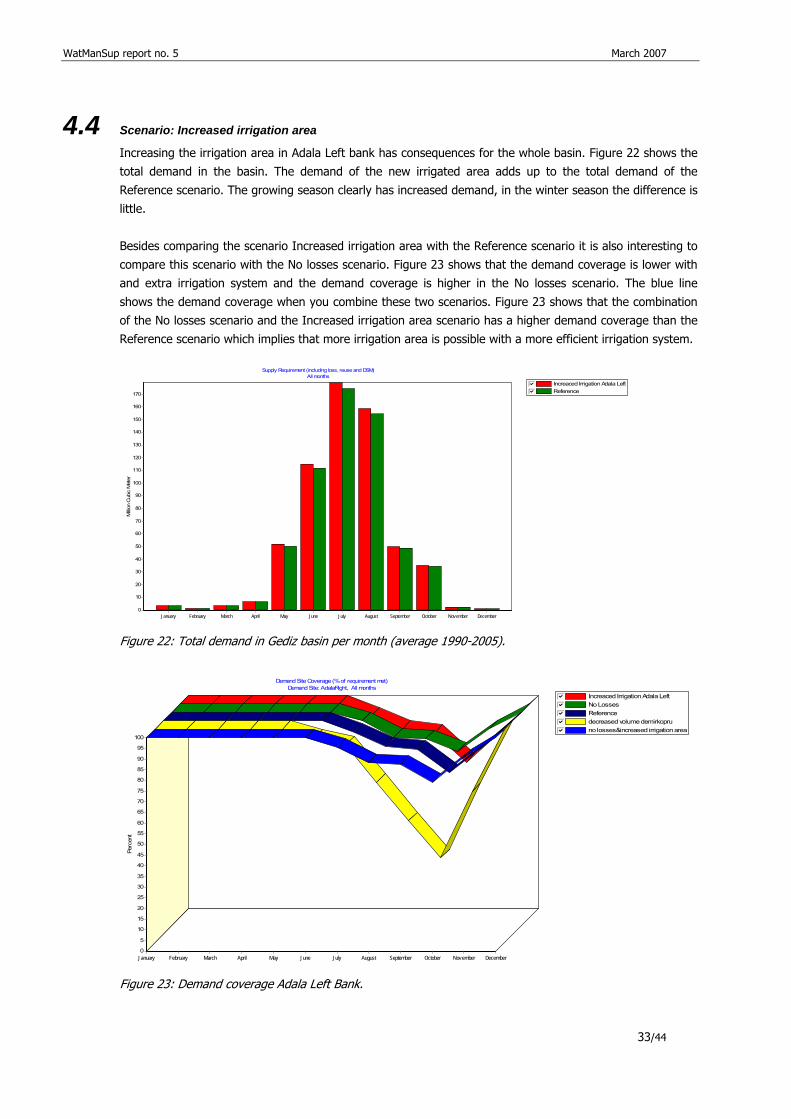
Differences in reservoir volume also influence the streamflow in Gediz river. Figure 21 shows the streamflow
below the intake point for Menemen Right and Left Bank irrigation schemes. Consequence of a smaller
reservoir is that in wet years more runoff is directly discharge into the Aegean See and less water is available
in the next dry season. In a dry year more water is extracted from the reservoir, so the next year more
water is needed to refill the reservoir and therefore the streamflow is lower. As a consequence one can
observe that in the scenario Decreased volume Demirköprü peaks are more pronounced while at the same
time low flow periods are more extensive.
31/44
WatManSup report no. 5 March 2007
Reference gfedcbdecreased volume demirkoprugfedcb
Streamflow (below node or reach listed)Gediz Nodes and Reaches: Below Withdrawal Menemen, All months, River: Gediz
1990 1991 1992 1993 1994 1995 1996 1997 1998 1999 2000 2001 2002 2003 2004 2005
Milli
on C
ubic
Met
er
2,500
2,400
2,300
2,200
2,100
2,000
1,900
1,800
1,700
1,600
1,500
1,400
1,300
1,200
1,100
1,000
900
800
700
600
500
400
300
200
100
0
Figure 21: Streamflow in Gediz river below Menemen intake
32/44
WatManSup report no. 5 March 2007
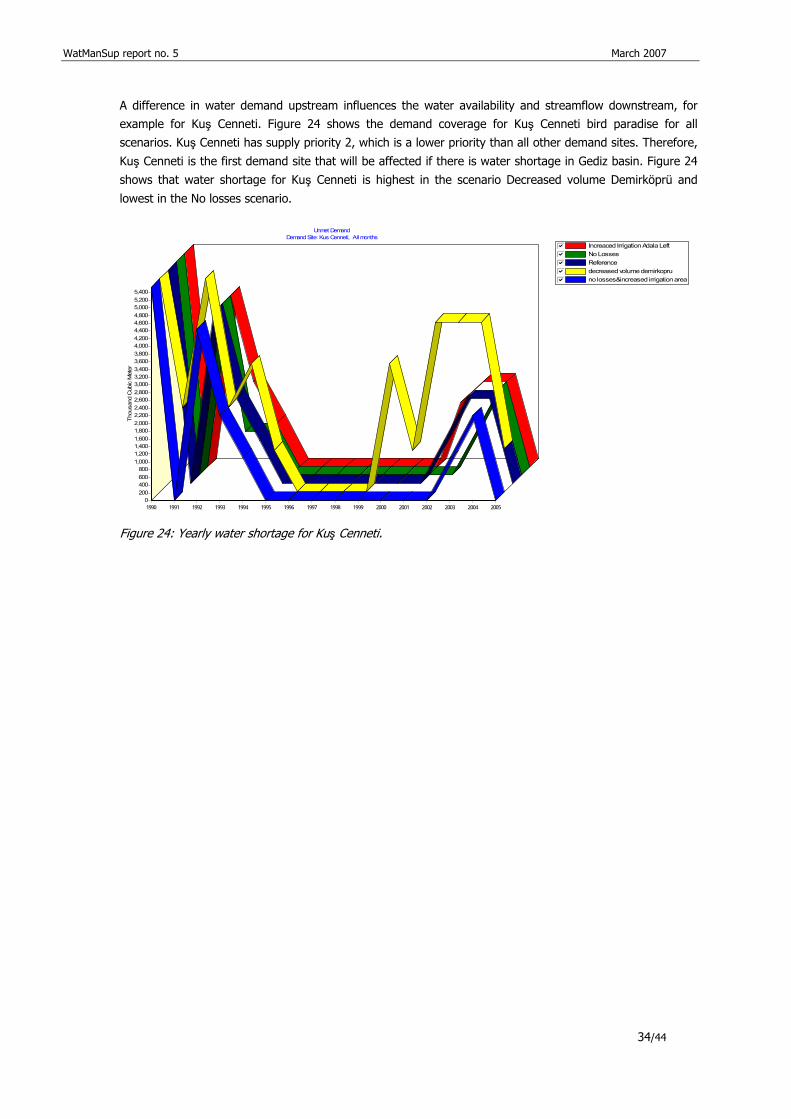
4.4 Scenario: Increased irrigation area
Increasing the irrigation area in Adala Left bank has consequences for the whole basin. Figure 22 shows the
total demand in the basin. The demand of the new irrigated area adds up to the total demand of the
Reference scenario. The growing season clearly has increased demand, in the winter season the difference is
little.
Besides comparing the scenario Increased irrigation area with the Reference scenario it is also interesting to
compare this scenario with the No losses scenario. Figure 23 shows that the demand coverage is lower with
and extra irrigation system and the demand coverage is higher in the No losses scenario. The blue line
shows the demand coverage when you combine these two scenarios. Figure 23 shows that the combination
of the No losses scenario and the Increased irrigation area scenario has a higher demand coverage than the
Reference scenario which implies that more irrigation area is possible with a more efficient irrigation system.
Increaced Irrigation Adala LeftgfedcbReference gfedcb
Supply Requirement (including loss, reuse and DSM)All months
January February March April May June July August September October November December
Milli
on C
ubic
Met
er
170
160
150
140
130
120
110
100
90
80
70
60
50
40
30
20
10
0
Figure 22: Total demand in Gediz basin per month (average 1990-2005).
Increaced Irrigation Adala LeftgfedcbNo Losses gfedcbReference gfedcbdecreased volume demirkoprugfedcbno losses&increased irrigation areagfedcb
Demand Site Coverage (% of requirement met)Demand Site: AdalaRight, All months
January February March April May June July August September October November December
Perc
ent
100
95
90
85
80
75
70
65
60
55
50
45
40
35
30
25
20
15
10
5
0
Figure 23: Demand coverage Adala Left Bank.
33/44
WatManSup report no. 5 March 2007
A difference in water demand upstream influences the water availability and streamflow downstream, for example for Kuş Cenneti. Figure 24 shows the demand coverage for Kuş Cenneti bird paradise for all
scenarios. Kuş Cenneti has supply priority 2, which is a lower priority than all other demand sites. Therefore,
Kuş Cenneti is the first demand site that will be affected if there is water shortage in Gediz basin. Figure 24
shows that water shortage for Kuş Cenneti is highest in the scenario Decreased volume Demirköprü and
lowest in the No losses scenario.
Increaced Irrigation Adala LeftgfedcbNo Losses gfedcbReference gfedcbdecreased volume demirkoprugfedcbno losses&increased irrigation areagfedcb
Unmet DemandDemand Site: Kus Cenneti, All months
1990 1991 1992 1993 1994 1995 1996 1997 1998 1999 2000 2001 2002 2003 2004 2005
Thou
sand
Cub
ic M
eter
5,4005,2005,0004,8004,6004,4004,2004,0003,8003,6003,4003,2003,0002,8002,6002,4002,2002,0001,8001,6001,4001,2001,000
800600400200
0
Figure 24: Yearly water shortage for Kuş Cenneti.
34/44
WatManSup report no. 5 March 2007
35/44
5 Conclusion and Recommendations The overall objective of the project was to show the strength and weaknesses of the WEAP model in a
setting with a Mediterranean climate and intensive irrigated agriculture. WEAP was setup in a relatively short
time frame and was mainly based on information in the public domain and reports from earlier studies.
Chapter 4 presented the results of the WEAP model revealing some of the strong points WEAP offers to be
used to support water managers. First of al is WEAP able to evaluate all aspects of the water system
including water demand, water supply, streamflow, runoff and rainfall. Second, WEAP presents results of the
analysis on many spatial and temporal levels: results can be shown for yearly means, monthly means, one
year or one demand site. Furthermore WEAP is able to show results in many formats such as graphs, maps,
and tables.
Another strong point resulting from the Gediz case study is the spatial scale of the model and the similarity
between model results and the information needed by the decision makers. WEAP evaluates water resources
topics on a relatively large spatial scale. Such a large spatial scale is an advantage for basin scaled planning
because it clearly gives an overview of the effects for the whole basin, which is needed in a basin with
spatial water delivery problems. Scale of the model and scale of the drought related management options
suit each other very well in the Gediz case study. Scenarios are relevant and many policy scenarios can be
modeled in this case study.
Figure 11 showed that the Rainfall Runoff method as included in WEAP does not take into account the all the
complex processes in generating runoff from rainfall such as: snow-melt, groundwater vs. surface water
runoff, channel flow etc. It is therefore that a more physical based model like SWAT should be included if
rainfall-runoff processes are critical aspects of future projects.
This first version of Gediz basin was based on the so-called Water Year Method. To evaluate impact of
climate change this method is less suitable and it is advisable to include the ReadFromFile function if climate
change scenarios have to be evaluated.
The Gediz case study showed the importance of working together with the decision makers. Flexibility in
adding scenarios and changing input data is a great advantage of the WEAP model. The Read From File
function and the possibility to add Key Assumptions are of great help in supporting the flexibility of WEAP.
Decision makers can influence the input in the model directly and these changes can be analyzed directly.
This has contributed to a great confidence of the decision makers in the WEAP model.
WEAP can generate many management scenarios in a short time. This was demonstrated in the Gediz case
study with three scenarios: (i) expansion of the irrigation area, (ii) reducing losses in irrigation canals, and
(iii) modeling climate change. Furthermore WEAP has the option to incorporate an economic evaluation and
a water quality evaluation.
Another advantage of the WEAP model worth mentioning is the ssupport of the model in terms of manuals,
training and support of developers, that is excellent.
Overall it can be concluded from this first swift analysis that WEAP is able to support water managers and
policy makers in their decision making process but that more refinement of the model is required to be
applicable in Gediz basin.

WatManSup report no. 5 March 2007
36/44
WatManSup report no. 5 March 2007
37/44
References
Literature
Allen, R.G., L.S. Pereiro, D. Raes, and M. Smith. 1998. Crop evapotranspiration: Guidelines for computing crop requirements. Irrigation and Drainage paper No. 56. FAO, Rome De Voogt K., G. Kite, P. Droogers, H. Murray-Rust. (2000). Modeling water allocation between wetlands and irrigated agriculture: Case study of the Gediz basin, Turkey. Colombo, Sri Lanka: International Water Management Institute. Droogers P. and M. Torabi. 2002. Field scale scenarios for water and salinity management by simulation modeling. IAERI-IWMI Research Report 12. Geçgel G., A. Girgin, M. Beyazgül, C. de Fraiture, H. Murray-Rust. 1998. Performance assessment of Gediz basin using secondary data. (from http://www.toprak.org.tr/isd/isd_15.htm), visited on 21/11/2006. IWMI and General Directorate of Rural Services Turkey. 2000. Irrigation in the basin context: The Gediz study. Colombo, Sri Lanka: International Water Management Institute (IWMI) xvii. 124p. Kite, G., P. Droogers, H. Murray-Rust, and K. de Voogt. 2001. Modelling scenarios for water allocation in the Gediz basin, Turkey. Research Report 50. Colombo, Sri Lanka: International Water Management Institute. Mathijssen, H. 2007. Evaluating the usefulness of the WEAP model, a case study in Iran and Turkey, FutureWater report. SEI. 2005a. WEAP water evaluation and planning system, Tutorial, Stockholm Environmental Institute, Boston Center, Tellus Institute. University of California Cooperative Extension and California Department of Water Resources. 2000. A Guide to Estimating Irrigation Water Needs of Landscape Plantings in California. Van der Gulik T. and J. Nyvall. 2001. Waterconservation factsheet, crop coefficients for use in irrigation schedules, Ministry of agriculture, food and fisheries, British Columbia, Canada, Resource management branch.
Internet sources
DSI, Devlet Su İşleri, http://www.dsi.gov.tr/, visited on 06/04/2007 FAO, Aquastat 2004 http://www.fao.org/ag/agl/aglw/aquastat/countries/turkey/index.stm, visited on 16/10/2006. CIA, The world fact book, https://www.cia.gov/cia/publications/factbook/geos/ir.html, visited on 9/19/2006 Murray-Rust, H., N. Alpaslan, N. Harmancioglu and M. Svendsen, Growth of water conflicts in the Gediz basin, Turkey. (from http://afeid.montpellier.cemagref.fr/Mpl2003/Conf/MurrayRust.pdf, visited on 04/12/2006)
Other references
Droogers P., 2006, project meeting WATMANSUP, FutureWater, Wageningen. SEI, 2005b, Help for Weap.
Personal communications (pers.comm.)
Personal communication with Gundogduh, Huseyin, 2007, DSI, Izmir.
WatManSup report no. 5 March 2007
A Appendix Data
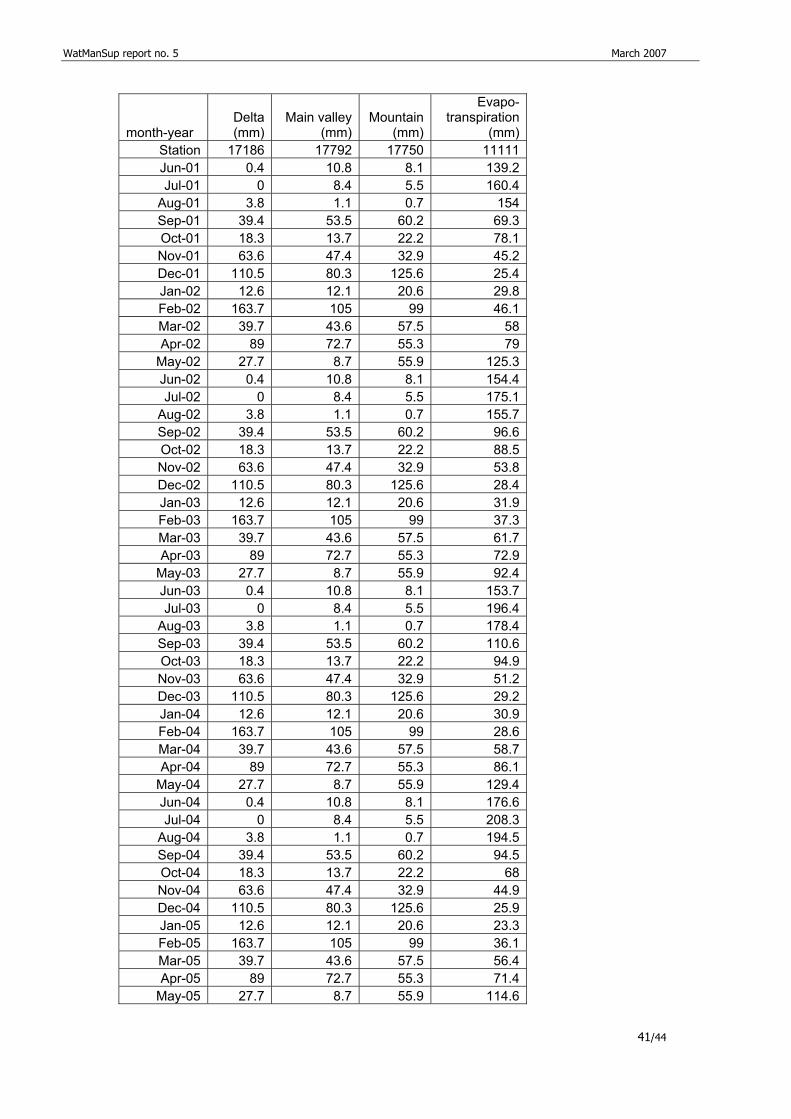
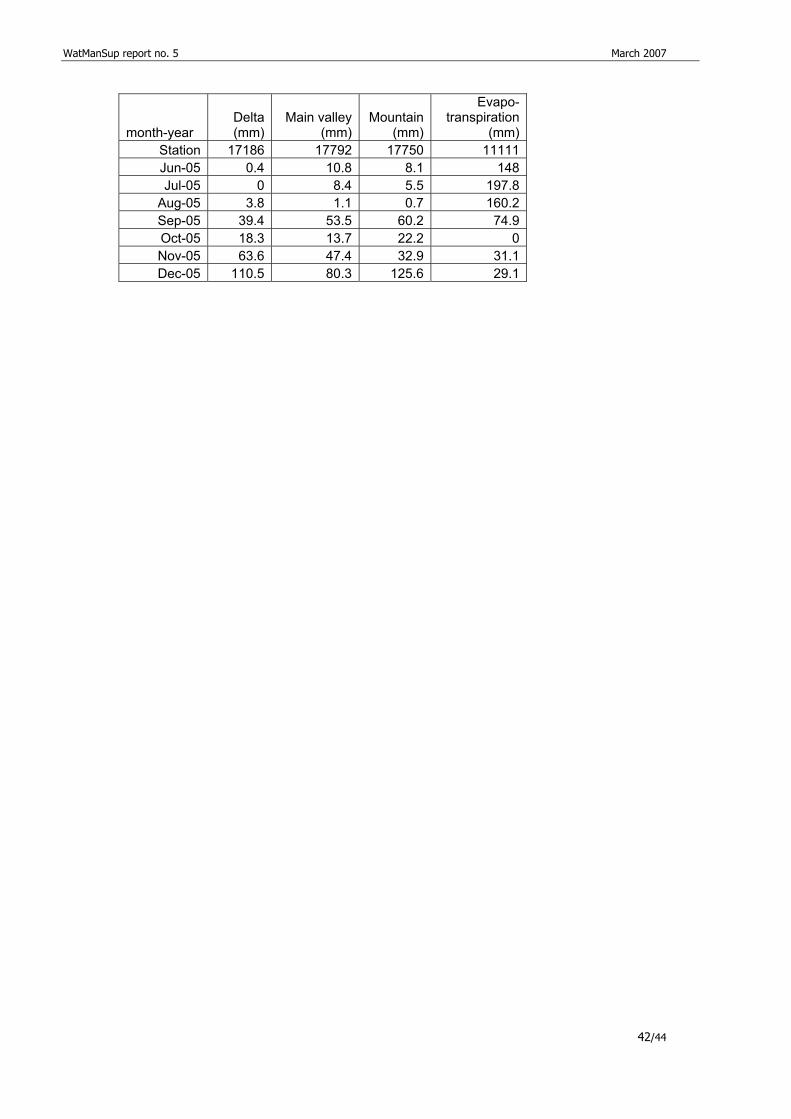
A.1 Precipitation and evapotranspiration in Gediz basin
month-year Delta (mm)
Main valley (mm)
Mountain (mm)
Evapo-transpiration
(mm)Station 17186 17792 17750 11111Jan-90 6.3 7.4 9.1 31.9Feb-90 59 44.9 44.5 43.9Mar-90 19.9 23.5 24.6 76.2Apr-90 55 34.1 65.3 73.1
May-90 22.1 8.6 27.8 115.9Jun-90 12.6 32.8 36.4 144.9Jul-90 0 0 14 199.4
Aug-90 10.7 12.2 22.9 174.8Sep-90 19.9 24.6 29.8 75.6Oct-90 21.1 21.9 29.3 78.5Nov-90 11.6 14.9 34.7 54Dec-90 245 159.8 163.5 42.8Jan-91 39.8 36.7 37.7 33.7Feb-91 40.7 41 39.4 33.3Mar-91 25.2 35.3 39.1 53.3Apr-91 66.8 43.7 55.2 69.4
May-91 124.6 84.9 89.8 86.4Jun-91 1.7 7.4 7 139.2Jul-91 22.1 2.1 7.8 160.4
Aug-91 0.1 19.7 31.1 154Sep-91 1.2 0.1 5.2 69.3Oct-91 29.3 30.3 28.9 78.1Nov-91 25.7 23.3 47 45.2Dec-91 146.7 125.1 50 25.4Jan-92 0.3 0 0.2 29.8Feb-92 11.9 9.6 6.7 46.1Mar-92 79.7 75.5 80.2 58Apr-92 46.2 18.7 80.8 79
May-92 6.4 7.2 10.9 125.3Jun-92 11.5 7.9 53.7 154.4Jul-92 48.6 10 20.3 175.1
Aug-92 0.2 0.8 4.2 155.7Sep-92 0 0 0 96.6Oct-92 7.9 32.5 40.3 88.5Nov-92 109.5 80.7 74.2 53.8Dec-92 112.3 74.2 45.4 28.4Jan-93 52.3 52.4 51.1 31.9Feb-93 130.3 98.2 84.2 37.3Mar-93 66.6 79.3 60.6 61.7Apr-93 62.9 36.8 41.6 72.9
May-93 61 33.6 70.4 92.4Jun-93 1.2 17.3 7.3 153.7
38/44
WatManSup report no. 5 March 2007
39/44
month-year Delta (mm)
Main valley (mm)
Mountain (mm)
Evapo-transpiration
(mm)Station 17186 17792 17750 11111Jul-93 0 0 0.2 196.4
Aug-93 0 0 0 178.4Sep-93 0.2 2 0.3 110.6Oct-93 4.5 10.6 17.7 94.9Nov-93 121.8 74.5 78.4 51.2Dec-93 151.9 56.7 86.2 29.2Jan-94 73.8 53.7 68.8 30.9Feb-94 81.4 51.3 57.4 28.6Mar-94 82.1 86 47 58.7Apr-94 67.2 20.4 42.5 86.1
May-94 28.5 45.6 52.5 129.4Jun-94 4.3 52.7 23 176.6Jul-94 0 0 7.2 208.3
Aug-94 0 1.8 14 194.5Sep-94 0 24.1 5.8 94.5Oct-94 53.3 26.3 51.2 68Nov-94 87.3 96.4 71.1 44.9Dec-94 115.4 68.2 74.9 25.9Jan-95 203.4 121.7 92.3 23.3Feb-95 29.8 17.9 14.2 36.1Mar-95 180.1 109.4 107.6 56.4Apr-95 84.1 69.9 68.1 71.4
May-95 40.6 24.6 15.1 114.6Jun-95 0.3 2 12 148Jul-95 5.2 3 33.4 197.8
Aug-95 19.3 6.5 10.4 160.2Sep-95 19.9 22.1 32.5 74.9Oct-95 5.7 20.9 74.6 0Nov-95 104.8 61.9 58.2 31.1Dec-95 82.9 46.2 59.8 29.1Jan-96 12.6 12.1 20.6 24.3Feb-96 163.7 105 99 20.2Mar-96 39.7 43.6 57.5 40.9Apr-96 89 72.7 55.3 54.5
May-96 27.7 8.7 55.9 94Jun-96 0.4 10.8 8.1 146.9Jul-96 0 8.4 5.5 157.6
Aug-96 3.8 1.1 0.7 128.6Sep-96 39.4 53.5 60.2 61.6Oct-96 18.3 13.7 22.2 53Nov-96 63.6 47.4 32.9 34.9Dec-96 110.5 80.3 125.6 19.3
Copy of 1996 Jan-97 12.6 12.1 20.6 38.9Feb-97 163.7 105 99 59.6Mar-97 39.7 43.6 57.5 40.4Apr-97 89 72.7 55.3 109.4
May-97 27.7 8.7 55.9 134.5

WatManSup report no. 5 March 2007
month-year Delta (mm)
Main valley (mm)
Mountain (mm)
Evapo-transpiration
(mm)Station 17186 17792 17750 11111Jun-97 0.4 10.8 8.1 153.6Jul-97 0 8.4 5.5 122.6
Aug-97 3.8 1.1 0.7 86.8Sep-97 39.4 53.5 60.2 0Oct-97 18.3 13.7 22.2 25.3Nov-97 63.6 47.4 32.9 18Dec-97 110.5 80.3 125.6 29.1Jan-98 12.6 12.1 20.6 31.2Feb-98 163.7 105 99 42.6Mar-98 39.7 43.6 57.5 69.2Apr-98 89 72.7 55.3 94
May-98 27.7 8.7 55.9 146.9Jun-98 0.4 10.8 8.1 157.6Jul-98 0 8.4 5.5 128.6
Aug-98 3.8 1.1 0.7 61.6Sep-98 39.4 53.5 60.2 53Oct-98 18.3 13.7 22.2 34.9Nov-98 63.6 47.4 32.9 19.3Dec-98 110.5 80.3 125.6 34.4Jan-99 12.6 12.1 20.6 38.9Feb-99 163.7 105 99 59.6Mar-99 39.7 43.6 57.5 40.4Apr-99 89 72.7 55.3 109.4
May-99 27.7 8.7 55.9 134.5Jun-99 0.4 10.8 8.1 153.6Jul-99 0 8.4 5.5 122.6
Aug-99 3.8 1.1 0.7 86.8Sep-99 39.4 53.5 60.2 0Oct-99 18.3 13.7 22.2 25.3Nov-99 63.6 47.4 32.9 18Dec-99 110.5 80.3 125.6 -1995Jan-00 12.6 12.1 20.6 31.9Feb-00 163.7 105 99 43.9Mar-00 39.7 43.6 57.5 76.2Apr-00 89 72.7 55.3 73.1
May-00 27.7 8.7 55.9 115.9Jun-00 0.4 10.8 8.1 144.9Jul-00 0 8.4 5.5 199.4
Aug-00 3.8 1.1 0.7 174.8Sep-00 39.4 53.5 60.2 75.6Oct-00 18.3 13.7 22.2 78.5Nov-00 63.6 47.4 32.9 54Dec-00 110.5 80.3 125.6 42.8Jan-01 12.6 12.1 20.6 33.7Feb-01 163.7 105 99 33.3Mar-01 39.7 43.6 57.5 53.3Apr-01 89 72.7 55.3 69.4
May-01 27.7 8.7 55.9 86.4
40/44
WatManSup report no. 5 March 2007
41/44
month-year Delta (mm)
Main valley (mm)
Mountain (mm)
Evapo-transpiration
(mm)Station 17186 17792 17750 11111Jun-01 0.4 10.8 8.1 139.2Jul-01 0 8.4 5.5 160.4
Aug-01 3.8 1.1 0.7 154Sep-01 39.4 53.5 60.2 69.3Oct-01 18.3 13.7 22.2 78.1Nov-01 63.6 47.4 32.9 45.2Dec-01 110.5 80.3 125.6 25.4Jan-02 12.6 12.1 20.6 29.8Feb-02 163.7 105 99 46.1Mar-02 39.7 43.6 57.5 58Apr-02 89 72.7 55.3 79
May-02 27.7 8.7 55.9 125.3Jun-02 0.4 10.8 8.1 154.4Jul-02 0 8.4 5.5 175.1
Aug-02 3.8 1.1 0.7 155.7Sep-02 39.4 53.5 60.2 96.6Oct-02 18.3 13.7 22.2 88.5Nov-02 63.6 47.4 32.9 53.8Dec-02 110.5 80.3 125.6 28.4Jan-03 12.6 12.1 20.6 31.9Feb-03 163.7 105 99 37.3Mar-03 39.7 43.6 57.5 61.7Apr-03 89 72.7 55.3 72.9
May-03 27.7 8.7 55.9 92.4Jun-03 0.4 10.8 8.1 153.7Jul-03 0 8.4 5.5 196.4
Aug-03 3.8 1.1 0.7 178.4Sep-03 39.4 53.5 60.2 110.6Oct-03 18.3 13.7 22.2 94.9Nov-03 63.6 47.4 32.9 51.2Dec-03 110.5 80.3 125.6 29.2Jan-04 12.6 12.1 20.6 30.9Feb-04 163.7 105 99 28.6Mar-04 39.7 43.6 57.5 58.7Apr-04 89 72.7 55.3 86.1
May-04 27.7 8.7 55.9 129.4Jun-04 0.4 10.8 8.1 176.6Jul-04 0 8.4 5.5 208.3
Aug-04 3.8 1.1 0.7 194.5Sep-04 39.4 53.5 60.2 94.5Oct-04 18.3 13.7 22.2 68Nov-04 63.6 47.4 32.9 44.9Dec-04 110.5 80.3 125.6 25.9Jan-05 12.6 12.1 20.6 23.3Feb-05 163.7 105 99 36.1Mar-05 39.7 43.6 57.5 56.4Apr-05 89 72.7 55.3 71.4
May-05 27.7 8.7 55.9 114.6
WatManSup report no. 5 March 2007
month-year Delta (mm)
Main valley (mm)
Mountain (mm)
Evapo-transpiration
(mm)Station 17186 17792 17750 11111Jun-05 0.4 10.8 8.1 148Jul-05 0 8.4 5.5 197.8
Aug-05 3.8 1.1 0.7 160.2Sep-05 39.4 53.5 60.2 74.9Oct-05 18.3 13.7 22.2 0Nov-05 63.6 47.4 32.9 31.1Dec-05 110.5 80.3 125.6 29.1
42/44
WatManSup report no. 5 March 2007
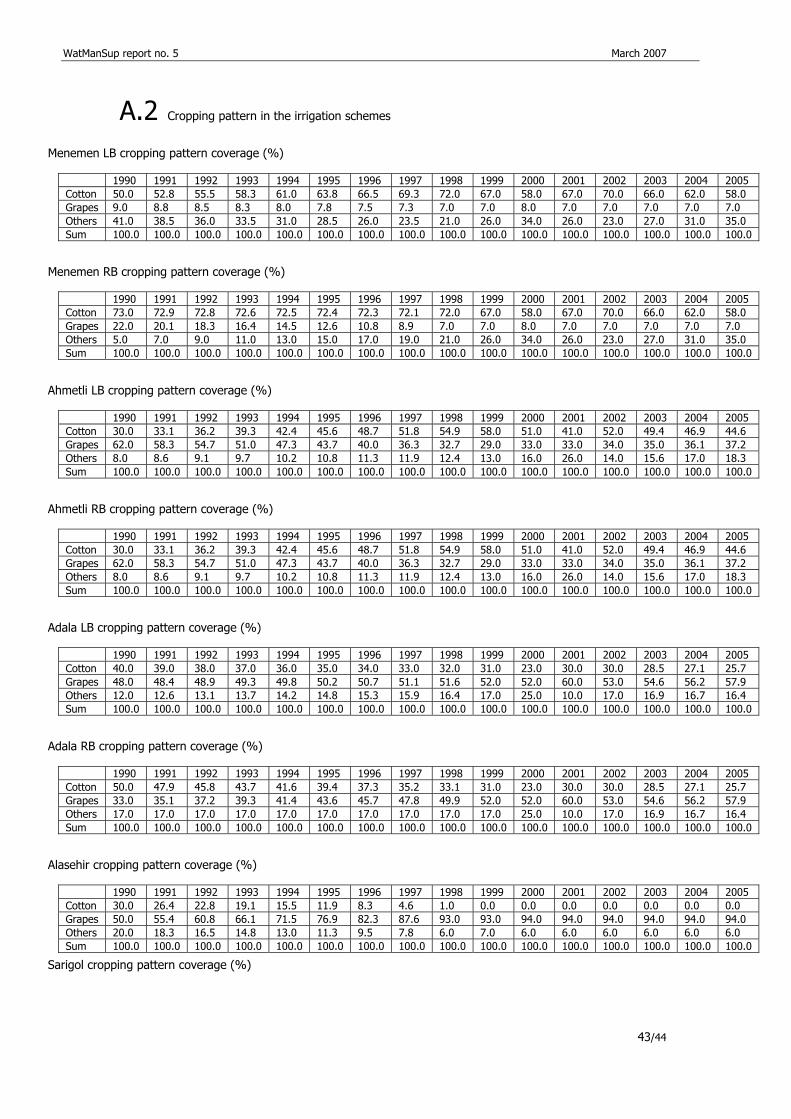
A.2 Cropping pattern in the irrigation schemes
Menemen LB cropping pattern coverage (%)
1990 1991 1992 1993 1994 1995 1996 1997 1998 1999 2000 2001 2002 2003 2004 2005 Cotton 50.0 52.8 55.5 58.3 61.0 63.8 66.5 69.3 72.0 67.0 58.0 67.0 70.0 66.0 62.0 58.0 Grapes 9.0 8.8 8.5 8.3 8.0 7.8 7.5 7.3 7.0 7.0 8.0 7.0 7.0 7.0 7.0 7.0 Others 41.0 38.5 36.0 33.5 31.0 28.5 26.0 23.5 21.0 26.0 34.0 26.0 23.0 27.0 31.0 35.0 Sum 100.0 100.0 100.0 100.0 100.0 100.0 100.0 100.0 100.0 100.0 100.0 100.0 100.0 100.0 100.0 100.0
Menemen RB cropping pattern coverage (%)
1990 1991 1992 1993 1994 1995 1996 1997 1998 1999 2000 2001 2002 2003 2004 2005 Cotton 73.0 72.9 72.8 72.6 72.5 72.4 72.3 72.1 72.0 67.0 58.0 67.0 70.0 66.0 62.0 58.0 Grapes 22.0 20.1 18.3 16.4 14.5 12.6 10.8 8.9 7.0 7.0 8.0 7.0 7.0 7.0 7.0 7.0 Others 5.0 7.0 9.0 11.0 13.0 15.0 17.0 19.0 21.0 26.0 34.0 26.0 23.0 27.0 31.0 35.0 Sum 100.0 100.0 100.0 100.0 100.0 100.0 100.0 100.0 100.0 100.0 100.0 100.0 100.0 100.0 100.0 100.0
Ahmetli LB cropping pattern coverage (%)
1990 1991 1992 1993 1994 1995 1996 1997 1998 1999 2000 2001 2002 2003 2004 2005 Cotton 30.0 33.1 36.2 39.3 42.4 45.6 48.7 51.8 54.9 58.0 51.0 41.0 52.0 49.4 46.9 44.6 Grapes 62.0 58.3 54.7 51.0 47.3 43.7 40.0 36.3 32.7 29.0 33.0 33.0 34.0 35.0 36.1 37.2 Others 8.0 8.6 9.1 9.7 10.2 10.8 11.3 11.9 12.4 13.0 16.0 26.0 14.0 15.6 17.0 18.3 Sum 100.0 100.0 100.0 100.0 100.0 100.0 100.0 100.0 100.0 100.0 100.0 100.0 100.0 100.0 100.0 100.0
Ahmetli RB cropping pattern coverage (%)
1990 1991 1992 1993 1994 1995 1996 1997 1998 1999 2000 2001 2002 2003 2004 2005 Cotton 30.0 33.1 36.2 39.3 42.4 45.6 48.7 51.8 54.9 58.0 51.0 41.0 52.0 49.4 46.9 44.6 Grapes 62.0 58.3 54.7 51.0 47.3 43.7 40.0 36.3 32.7 29.0 33.0 33.0 34.0 35.0 36.1 37.2 Others 8.0 8.6 9.1 9.7 10.2 10.8 11.3 11.9 12.4 13.0 16.0 26.0 14.0 15.6 17.0 18.3 Sum 100.0 100.0 100.0 100.0 100.0 100.0 100.0 100.0 100.0 100.0 100.0 100.0 100.0 100.0 100.0 100.0
Adala LB cropping pattern coverage (%)
1990 1991 1992 1993 1994 1995 1996 1997 1998 1999 2000 2001 2002 2003 2004 2005 Cotton 40.0 39.0 38.0 37.0 36.0 35.0 34.0 33.0 32.0 31.0 23.0 30.0 30.0 28.5 27.1 25.7 Grapes 48.0 48.4 48.9 49.3 49.8 50.2 50.7 51.1 51.6 52.0 52.0 60.0 53.0 54.6 56.2 57.9 Others 12.0 12.6 13.1 13.7 14.2 14.8 15.3 15.9 16.4 17.0 25.0 10.0 17.0 16.9 16.7 16.4 Sum 100.0 100.0 100.0 100.0 100.0 100.0 100.0 100.0 100.0 100.0 100.0 100.0 100.0 100.0 100.0 100.0
Adala RB cropping pattern coverage (%)
1990 1991 1992 1993 1994 1995 1996 1997 1998 1999 2000 2001 2002 2003 2004 2005 Cotton 50.0 47.9 45.8 43.7 41.6 39.4 37.3 35.2 33.1 31.0 23.0 30.0 30.0 28.5 27.1 25.7 Grapes 33.0 35.1 37.2 39.3 41.4 43.6 45.7 47.8 49.9 52.0 52.0 60.0 53.0 54.6 56.2 57.9 Others 17.0 17.0 17.0 17.0 17.0 17.0 17.0 17.0 17.0 17.0 25.0 10.0 17.0 16.9 16.7 16.4 Sum 100.0 100.0 100.0 100.0 100.0 100.0 100.0 100.0 100.0 100.0 100.0 100.0 100.0 100.0 100.0 100.0
Alasehir cropping pattern coverage (%)
1990 1991 1992 1993 1994 1995 1996 1997 1998 1999 2000 2001 2002 2003 2004 2005 Cotton 30.0 26.4 22.8 19.1 15.5 11.9 8.3 4.6 1.0 0.0 0.0 0.0 0.0 0.0 0.0 0.0 Grapes 50.0 55.4 60.8 66.1 71.5 76.9 82.3 87.6 93.0 93.0 94.0 94.0 94.0 94.0 94.0 94.0 Others 20.0 18.3 16.5 14.8 13.0 11.3 9.5 7.8 6.0 7.0 6.0 6.0 6.0 6.0 6.0 6.0 Sum 100.0 100.0 100.0 100.0 100.0 100.0 100.0 100.0 100.0 100.0 100.0 100.0 100.0 100.0 100.0 100.0
Sarigol cropping pattern coverage (%)
43/44

WatManSup report no. 5 March 2007
1990 1991 1992 1993 1994 1995 1996 1997 1998 1999 2000 2001 2002 2003 2004 2005 Cotton 0.0 0.0 0.0 0.0 0.0 0.0 0.0 0.0 0.0 0.0 0.0 0.0 0.0 0.0 0.0 0.0 Grapes 80.0 80.0 80.0 80.0 80.0 80.0 80.0 80.0 80.0 85.0 80.0 80.0 95.0 95.0 95.0 95.0 Others 20.0 20.0 20.0 20.0 20.0 20.0 20.0 20.0 20.0 15.0 20.0 20.0 5.0 5.0 5.0 5.0 Sum 100.0 100.0 100.0 100.0 100.0 100.0 100.0 100.0 100.0 100.0 100.0 100.0 100.0 100.0 100.0 100.0
44/44