water for texas
TRANSCRIPT

2022State Water Plan
WATERFOR TEXAS
DRAFT
DRAFT 2022 State Water Plan
Water
for
Texas
Texas Water Development Board Members
Peter M. Lake, Chairman
Kathleen Jackson, Member
Brooke T. Paup, Member
www.twdb.texas.gov
www.twdb.texas.gov/waterplanning/swp/2022/index.asp

P.O. Box 13231, 1700 N. Congress Ave. Austin, TX 78711-3231, www.twdb.texas.gov Phone (512) 463-7847, Fax (512) 475-2053
Our Mission
Leading the state’s efforts in ensuring a secure water future for Texas and its citizens
.
.
.
.
.
.
.
.
.
.
.
.
.
Board Members
Peter M. Lake, Chairman │ Kathleen Jackson, Board Member │Brooke T. Paup, Board Member
Jeff Walker, Executive Administrator
Dear Fellow Texans:
On behalf of my fellow Board members, Kathleen Jackson and Brooke Paup, and the dedicated staff of
the Texas Water Development Board (TWDB), I am honored to deliver the 2022 State Water Plan.
Texas utilizes a unique model that integrates science, planning, and financing to ensure the water supply
it needs for the growth and prosperity its future holds. Built on science, developed by local and regional
stakeholders, and implemented by the State Water Implementation Fund for Texas (SWIFT), the state
water plan is the keystone of this model. We do not, in other words, plan for the sake of planning.
Through the vision of state leadership and an extraordinary commitment of resources by the citizens of
Texas, we are currently building the water supply of tomorrow.
Since establishing the SWIFT funding program in 2015, the TWDB has committed almost $9 billion
dollars of financing to implement more than 50 state water plan projects that will provide about 1.5
million acre-feet per year of additional water supply. Among those 50 projects are one of the largest
water treatment plants in the world, the state’s first large-scale seawater desalination project, and the
first new major reservoir built in Texas in more than a quarter century.
The state water plan is an ever-evolving document that is updated every five years. The 2022 State
Water Plan includes improved methodologies, better coordination between surface and groundwater,
and a stronger emphasis on conservation. The desire to continuously improve ensures the state water
plan is a living document of the highest standard that government and business leaders at the local,
regional, and state levels can depend on.
Our agency works diligently to continually improve data collection, water science, and other tools to
constantly enhance planning capabilities, but ultimately this plan is driven by the more than 480 local
leaders who dedicate their time, contribute their expertise, and make the hard decisions on which
projects to include in the plan. We are immensely grateful for all their efforts and look forward to the
continuing success of this partnership.
Texas works on water—the TWDB makes Texas water work!
Peter M. Lake, Chairman

DRAFT 2022 State Water Plan | Texas Water Development Board i
Acknowledgments

DRAFT 2022 State Water Plan | Texas Water Development Board ii
The 2022 State Water Plan would not have been possible without the time, dedication, guidance, and
expertise of numerous people and organizations throughout Texas. The Texas Water Development
Board (TWDB) would like to extend its sincere gratitude and appreciation to everyone who
participated in developing the 16 regional water plans and this state water plan: the more than 480
regional water planning group voting members (listed below), their consultants, and their administrative
agents (also listed below); staff of the TWDB, Texas Parks and Wildlife Department, Texas Department
of Agriculture, Texas Commission on Environmental Quality, Texas State Soil and Water Conservation
Board, and other state and federal agencies; and the individuals and organizations that provided public
input throughout the planning process.
The TWDB would also like to thank the leadership of the State of Texas for their continued support of
the state’s water planning process.
Regional Water Planning Group Voting Members
(Region – Member) *planning group chairs at the time the 2021 regional water plans were adopted
A - Allred, Don
A - Autrey, Emmett
A - Auvermann, Ph.D, Brent
A - Baumgardner, Joe
A - Clark, Nolan
A - Cook, Vernon
A - Cooke, Dean
A - Derington, Jim
A - Gibson, Rick
A - Gilmore, Rusty
A - Green, Glen
A - Guthrie, Janet
A - Hallerberg, William
A - Hartman, Floyd
A - Kidd, Bobbie
A - Kleuskens, Tonya
A - Krienke, Danny
A - Landis, David
A - Messer, Roy (Hank)
A - Pool, Dillon
A - Raef Kizziar, Donna
A - Satterwhite, Kent
A - Smith, Lynn
A - Stephens, Beverly
A - Sweeten, John M.
A - Tregellas, Janet
A - Walthour, Steve
A - Weinheimer, Ben
A - Williams, C.E.*
B - Armstrong, Tamela
B - Banks, Jimmy
B - Brite, J.K. Rooter
B - Campbell, Curtis
B - Campsey, Jack B - Christopher, Mark
B - Deweber, N.E.
B - Dodge, Rebecca L
B - Dodson, Carrie
B - Holub, Tommy
B - Hughes, Dale
B - Jackson, Randy
B - Jarosek, Joe
B - Kennon, Darell
B - Kidd, Bobby
B - Lewis, Steve
B - Liggett, Kenneth
B - McGuire, Mike
B - McMahon, Monte
B - Mesler, Tracy
B - Miller, Kyle
B - Myers, Dean
B - Ownbey, Heath
B - Payne, Jerry
B - Scaling, Wilson
B - Schreiber, Russell*
B - Simpson, Gayle
B - Thomas, Todd
B - Whiteman, Randy
C - Bailey, David
C - Banks, Kenneth
C - Barksdale, Jay
C - Boyd, Chris
C - Carman, John
C - Ceverha, Bill
C - Darling, Grace
C - Dineen III, John Paul
C - Douglas, Gary
C - Fisher, Tim
C - Harder, P.E., Christopher
C - Hotopp, James
C - Kula, Tom
C - Latham, Harold
C - Laughlin, Russell
C - Lingenfelder, John
C - Maenius, G.K.
C - Martin, Howard C - McCarter, Jim
C - Mundt, Steve
C - Puckett, Jo "Jody"
C - Rickman, Mike
C - Riley, Bob
C - Satterwhite, Drew
C - Shaffer, Rick
C - Spicer, Gary
C - Standridge, Connie
C - Stevens, Jack
C - Wagner, P.E., Richard
C - Ward, Kevin*
C - Woodward, Tom
D - Acker, Russell
D - Bartley, Wade
D - Beeler, Allen
D - Belcher, Brandon
D - Bradley, Bruce
D - Bradley, Johnny Mack
D - Brooks, John
D - Bumgarner, Joe
D - Calvin, Larry
D - Carter, Greg
D - Coats, Joe
D - Conner, Doug
D - Duffee, Donnie
D - Dumon, JoAnn
D - Evans, Danny
D - Fierro, Nicolas
D - Frost, George
D - Gaskill, Jerry
D - Glidewell, Brice
D - Gwinn, Cindy
D - Hilliard, Dennis
D - King, Conrad
D - Kirby, Bill
D - LeTourneau, Richard
D - McCoy, Janet
D - McCoy, Mike
D - McPhee, Rolin
D - Milton, Fred
D - Muse, Ned D - Nabors, David
D - Nabors, Sharron
D - Parker, Lloyd
D - Speight, Jr., Robert
D - Staton, Bob
D - Stuart, Cheri
D - Taylor, Harlton
D - Thompson, Jim*
E - Adams, Janet
E - Allen, Ann
E - Barker, Randy
E - Beard, Tom
E - Bennett, Jeff
E - Borunda Firth, Sylvia
E - Brewster, Rebecca L.
E - Butcher, Sterry
E - Chacon, Roger
E - Christianson, Jessica
E - Davidson, Michael
E - Dunlap, Dan
E - Etzold, David
E - Hall, Dave
E - Leary, Tim
E - Livingston, Mike
E - Marquez, Michelle
E - Miller, Albert
E - Miller, Jim Ed
E - Mitchell, Scott
E - Newton, Brad
E - Palacios, Arlina
E - Perez, Vincent
E - Reinert, Scott
E - Reyes, Jesus "Chuy"*
E - Sanchez, Mike
E - Tate, Rick
E - Todd, Teresa
E - Waggoner, Paige
E - Webb, Summer
F - Arsuffi, Tom
F - Bearden, Jerry
F - Brown, Chuck
F - Brown, Stephen F - Carlile, Jimmy
F - Daniel, Don
F - Deishler, Ben
F - Dickson, Ricky
F - Dierschke, Kenneth
F - Edwards, Ty
F - Ervin, Tommy
F - Gerke, Ava

DRAFT 2022 State Water Plan | Texas Water Development Board iii
F - Gist, Richard
F - Grant, John*
F - Guelker, Michelle
F - Hagood, Charles
F - Halfmann, Kim
F - Holland, Scott
F - McWilliams, Scott
F - Moody, Wendell
F - Rodriguez, Raul
F - Runge, Caroline
F - Shepard, John
F - Straub, Jr, Raymond
F - Strube, Allison
F - Taylor, Merle
F - Van Deventer, Gilbert
F - Warren, Tim
F - Weatherby, Paul
F - Wilde, Doug
F - Wilson, Len
F - Yanez, Rhetta G - Aaron, Dirk
G - Adams, Dale
G - Beseda, Charles
G - Blackburn, David
G - Briggs, Jim
G - Brown, Tim
G - Collinsworth, David
G - Cooper, Joe
G - Cox, Alva
G - Dunn, Luci
G - Felton, Scott
G - Floyd, Travis
G - Ford, Phil
G - Holland, Zach
G - Kinard, Kelly
G - McGuire, Mike
G - Myers, Gary
G - Newman, Gary
G - O'Brien, Tommy
G - Parker, Judy
G - Peek, Gail
G - Spicer, Gary
G - Spurgin, Dale
G - Stem, Wiley
G - Sutherland, Mike
G - Tomacek, Terrill
G - Wagner, Kevin
G - Weldon, Kenny
G - Westbrook, Gary
G - Wilson, Wayne*
H - Ashmore, Gary
H - Bailey, David
H - Bartos, John R.
H - Blount, John
H - Bruner, Robert
H - Brunett, Brad
H - Chang, Jun
H - Collinsworth, David
H - Comin, James
H - Evans, Mark* H - Fisseler, Gene
H - Forrest, Yvonne W.
H - Hebert, Bob
H - Henson, Art
H - Houston, Jace
H - Howard, John
H - Istre, Robert
H - Jones, Kathy Turner
H - Langford, Ivan
H - Lord, Glenn
H - Marcell, Marvin
H - Masterson, Carl
H - Morrison, James
H - Neighbors, Ron J.
H - Schindewolf, Jimmie
H - Stultz, Ruth
H - Teer, William (Bill)
H - Turco, Michael
H - Ward, Kevin
H - Willcox, Pudge
I - Adams, Leah
I - Alders, David I - Branick, Jeff
I - Brock, David
I - David, Josh Wilson
I - Davis, Chris
I - Dunn, Mark
I - Fussell, Roger
I - Gelwicks, Steven
I - Gorsich, David
I - Hall, Scott
I - Harbordt, Dr. C. Michael
I - Heugel, William
I - Holcomb, Joe
I - Holcomb, Kelley*
I - Isles, Don
I - Jackson, Fred
I - Kimbrough, Bill
I - Maloukis, Amanda
I - Martin, John
I - McBroom, Matthew, Dr.
I - McFarland, John
I - Montagne, David
I - Morgan, Gregory
I - Peddy, Dale
I - Shank, Monty
I - Smith, Darla
I - Stanton, Randy
I - Stelly, Terry
I - Whitehead, Worth
I - Young, Ph.D., J. Leon
J - Barron, Stuart
J - Buck, Ray
J - Davis, Zack
J - Dickinson, Dell
J - Flatten, Charlie
J - Gonzalez, Otila
J - Heffley, Jerry
J - Hobbs, Genell
J - Jeffery, David
J - Letz, Jonathan*
J - Lomas, Mitch J - Loveland, Scott
J - Martin, Max
J - Mauk, David
J - McDaniel, Joseph
J - Pigg, Joel
J - Qualia, Thomas M.
J - Robinson, Wes
J - Shahan, Tully
J - Simpton, Jerry
J - Stevens, Jr., Homer T.
J - Sweeten, Lee
J - Trees, Roland
J - Villareal, Rene
J - Wiedenfeld, Charles (Charlie)
J - Williams, Gene
J - Wilson, William F. (Feather)
K - Bachelor, Brent
K - Barho, Jim
K - Berglund, Daniel
K - Brasher, Jim
K - Burke, John E.*
K - Caldwell, David K - Dockery, Jo Don
K - Dupnik, John T.
K - Fieseler, Ronald G.
K - Gary, Robin
K - Gertson, Ronald
K - Gillam, Lauri
K - Haschke, Karen
K - Hoffman, John
K - Johnson, Barbara
K - Klaeger, Donna
K - Lewis, Brenton
K - Lindsay, David
K - Ludwig, Jason
K - Luedecke, Bill
K - Lutes, Teresa
K - Luther, Jim
K - McElroy, Ann
K - Olfers, Charles
K - Powell, Doug
K - Reagor, Mike
K - Reinmund-Martinez, Alicia
K - Roeder, W.A. (Billy)
K - Ruggiero, Rob
K - Shell, Charlie
K - Simon, Haskell
K - Sliva, Paul
K - Sodek, Mitchell
K - Sultemeier, James
K - Theodosis, Byron
K - Totten, Jim
K - Van Dresar, David
K - Walker, Jennifer
K - Wheelock, David
K - Wilson, William F.
L - Andruss, Tim
L - Balin, Donna
L - Byrum, John
L - Calhoun, Pat
L - Camargo, Gene
L - Campbell, Curt L - Chavez, Rey
L - Cockerell, Alan
L - Conley, Will
L - Dietzmann, Don
L - Dohmann, Art
L - Fitzsimons, Blair
L - Flatten, Charlie
L - Hilderbran, Vic
L - Janak, Kevin
L - Jungman, Tom
L - Kight, John
L - Labus, Russell
L - Lord, Glenn
L - McGookey, Doug
L - Meyer, Daniel
L - Middleton, Gary
L - Mims, Con
L - Patteson, Kevin
L - Pena, Illiana
L - Puente, Robert
L - Ramos, Humberto
L - Ramsey, Steve L - Riggs, Weldon
L - Roberts, David
L - Ruiz, Roland
L - Savage, Diane
L - Scott, Suzanne B.*
L - Sengelmann, Greg
L - Sowards, Mitchell
L - Sumpter, Heather
L - Taggart, Tom
L - Taylor, Ian
L - Wassenich, Diane
L - West, Bill
L - Yablonski, Adam
M - Barrera, Jorge
M - Benavides, Nick
M - Bruciak, John
M - Darling, James (Jim)
M - Flores, Jaime
M - Flores, Jorge
M - Fuentes, David
M - Fulbright, Robert E.
M - Garza, Carlos
M - Goldsberry, Dennis
M - Gonzalez, Humberto
M - Hinojosa, Sonny
M - Jarvis, Glenn
M - Lambert, Sonia
M - McGhee, Donald K.
M - McLemore, Tom
M - Mia, Riazul
M - Murden, Dale
M - Pena, Jr., Robert
M - Rathmell, Joe
M - Rodriguez, Jr., Tomas*
M - Schuster, Frank
M - Vela, Armando
M - Wilkins, Neal
N - Almaraz, Joe
N - Bledsoe, III, Scott*
N - Burns, Chuck N - Burris, John
N - Carillo, Teresa

DRAFT 2022 State Water Plan | Texas Water Development Board iv
N - Crull, Carl
N - Dove, Bill
N - Durham, Lavoyger
N - Eddins, Gary
N - Garza, Andy
N - Hennings, Bill
N - Hubert, Pancho
N - Koenig, Lindsey
N - Kunkel, Robert
N - Ornelas, Martin
N - Reaves, Barbara
N - Reding, Jr., Thomas
N - Ring, Charles
N - Rosson, Donna
N - Scott, Mark
N - Serrato, Carola*
N - Stewart, Lonnie
N - Stockton, William (Bill)
N - Sugarek, Mark
N - Tunnell, Jace
O - Barnes, Melanie
O - Campsey, Jack
O - Coleman, Jason
O - DeWit, Harry
O - Dodson, Carrie
O - Ellison, Jr., Delmon
O - Everheart, Harvey
O - Freeman, Andrew
O - Grotegut, DMV, Chris
O - Hardbin, Bill
O - Hardin, Joey
O - Hopper, Ronnie
O - Hutcheson, Doug
O - Jones, Shane
O - Kirkpatrick, Mark
O - McClendon, Mike
O - McElroy, Don
O - McMinn, Shane
O - Monroe, Alan
O - Morris, Charlie
O - Rainwater, Ken
O - Sammon, Jeff
O - Satterwhite, Kent
O - Simons, Tom
O - Snyder, Jeffrey
O - Spear, Aubrey*
O - Steiert, Jim
O - Taylor, John
O - Wedel, Jimmy
O - Weinheimer, Sr., Ben
O - Yeary, Bret
P - Brzozowski, Patrick
P - Butschek, John
P - Chandler, Tom
P - Clark, Gerald
P - Coleman, Jim
P - Cooper, Steve
P - Day, Marie
P - Hafernick, Lee
P - Hudgins, Neil
P - Little, Lester
P - Maloney, Jack
P - Martin, Robert
P - McBeth, Bart
P - Ottis, Richard
P - Pustka, Edward
P - Raun, L.G.
P - Shoemate, Robert
P - Simons, Dennis
P - Skalicky, Gary
P - Skalicky, Michael
P - Sklar, Jill
P - Spenrath, Phillip*
P - Stafford, II, Harrison
P - Wagner, David
P - Weinheimer, Ed
Administrative Agents
A – Panhandle Regional Planning Commission
B – Red River Authority of Texas
C – Trinity River Authority
D – Northeast Texas Municipal Water District
E – Rio Grande Council of Governments
F – Colorado River Municipal Water District
G – Brazos River Authority
H – San Jacinto River Authority
I – City of Nacogdoches
J – Upper Guadalupe River Authority
K – Lower Colorado River Authority
L – San Antonio River Authority M – Lower Rio Grande Valley Development Council
N – Nueces River Authority
O – South Plains Association of Governments and High Plains Underground Water
Conservation District No. 1
P – Lavaca-Navidad River Authority

DRAFT 2022 State Water Plan | Texas Water Development Board 1
Table of contents

DRAFT 2022 State Water Plan | Texas Water Development Board 2
Contents
Acknowledgments .............................................................................................................. i
Executive summary ........................................................................................................... 1
1 Introduction .................................................................................................................. 16
1.1 Regional water planning overview ...................................................................................................... 18
1.1.1 Regional water planning groups ........................................................................................................ 19
1.1.2 Program requirements ....................................................................................................................... 20
1.1.3 Development of the regional water plans ...................................................................................... 20
1.1.4 Development of the state water plan ............................................................................................. 21
1.2 The interactive state water plan .......................................................................................................... 21
1.3 New to the 2022 State Water Plan .................................................................................................... 23
1.3.1 Legislative changes since the 2017 State Water Plan .................................................................. 23
1.3.2 New developments and process improvements .......................................................................... 24
1.4 Advent of regional flood planning and the first state flood plan .................................................. 25
1.5 Organization of the plan ........................................................................................................................ 25
2 Policy recommendations ............................................................................................. 27
3 Drought and drought response in Texas ................................................................... 34
3.1 Measuring drought status and severity .............................................................................................. 35
3.2 Historical and potential new droughts of record ............................................................................ 35
3.2.1 Historical droughts .............................................................................................................................. 35
3.2.2 Confirmed and potential new droughts of record ....................................................................... 36
3.3 Drought planning and response ........................................................................................................... 38
3.3.1. Statewide drought planning and response .................................................................................... 38
3.3.2 Regional drought planning and response ........................................................................................ 39
3.3.3 Local drought planning and response .............................................................................................. 42
3.4 Regional drought recommendations .................................................................................................. 42
3.5 Uncertainty of drought .......................................................................................................................... 42
4 Future population and water demand ....................................................................... 45
4.1 Population projections ........................................................................................................................... 46
4.1.1 Population projections methodology .............................................................................................. 51
4.1.2 Utility-based planning .......................................................................................................................... 52

DRAFT 2022 State Water Plan | Texas Water Development Board 3
4.2 Water demand projections .................................................................................................................. 53
4.2.1 Projected water demand by region ................................................................................................. 54
4.2.2 Water demand methodology ............................................................................................................ 56
4.2.3 Irrigation water demand..................................................................................................................... 57
4.2.4 Livestock water demand .................................................................................................................... 57
4.2.5 Municipal water demand .................................................................................................................... 58
4.2.6 Manufacturing water demand............................................................................................................ 59
4.2.7 Mining water demand ......................................................................................................................... 60
4.2.8 Steam-electric power water demand .............................................................................................. 60
4.3 Comparison to the 2017 State Water Plan ...................................................................................... 61
4.4 Uncertainty of population and water demands ................................................................................ 62
5 Water availability and existing supplies ..................................................................... 64
5.1 Evaluating water resources for planning ............................................................................................ 65
5.2 Surface water availability within river basins .................................................................................... 66
5.3 Future surface water availability .......................................................................................................... 69
5.4 Groundwater availability of aquifers ................................................................................................... 70
5.5 Future groundwater availability ........................................................................................................... 75
5.6 Availability of other sources ................................................................................................................. 75
5.7 Existing supplies ....................................................................................................................................... 76
5.8 Comparison to the 2017 State Water Plan ...................................................................................... 79
5.9 Uncertainty of our future water supply ............................................................................................. 81
6 Water supply needs ...................................................................................................... 83
6.1 Identification of water needs ................................................................................................................ 85
6.2 Municipal needs ....................................................................................................................................... 87
6.3 Non-municipal needs ............................................................................................................................. 89
6.4 Major water provider needs ................................................................................................................. 89
6.5 Impacts of not meeting identified water needs ................................................................................ 90
6.6 Water needs not met by implementing the plan ............................................................................. 92
6.7 Comparison to the 2017 State Water Plan ...................................................................................... 95
6.8 Uncertainty of future water needs...................................................................................................... 96
7 Water management strategies and projects ............................................................ 97
7.1 Selecting water management strategies ............................................................................................. 98

DRAFT 2022 State Water Plan | Texas Water Development Board 4
7.2 Water resources for recommended strategies ............................................................................. 101
7.3 Strategy types......................................................................................................................................... 103
7.3.1 Conservation ...................................................................................................................................... 105
7.3.2 Drought management ....................................................................................................................... 105
7.3.3 Reuse .................................................................................................................................................... 106
7.3.4 Conjunctive use.................................................................................................................................. 106
7.3.5 Aquifer storage and recovery ......................................................................................................... 106
7.3.6 New major reservoirs ...................................................................................................................... 107
7.3.7 Other surface water ......................................................................................................................... 109
7.3.8 Groundwater wells and other ........................................................................................................ 110
7.3.9 Desalination of groundwater and seawater ................................................................................. 110
7.3.10 Other strategies ............................................................................................................................... 110
7.4 Assignment of strategy and project supply volumes ..................................................................... 111
7.5 Costs of recommended strategies .................................................................................................... 112
7.6 Strategies benefitting multiple regions ............................................................................................. 115
7.7 Impacts of recommended strategies ................................................................................................. 115
7.7.1 Potential impacts on water quality ................................................................................................ 116
7.7.2 Protecting the state’s water, agricultural, and natural resources ........................................... 116
7.8 Needs met by recommended strategies .......................................................................................... 117
7.9 Comparison to the 2017 State Water Plan .................................................................................... 119
7.10 Uncertainty of future strategies ...................................................................................................... 120
8 Conservation ............................................................................................................... 121
8.1 Agency program and legislated conservation initiatives ............................................................... 122
8.2 Conservation’s role in the state water planning process ............................................................ 124
8.3 Establishing regional conservation goals .......................................................................................... 125
8.4 Conservation water management strategies and projects .......................................................... 126
8.4.1 Municipal conservation ..................................................................................................................... 126
8.4.2 Agricultural conservation ................................................................................................................. 128
8.4.3 Industrial conservation ..................................................................................................................... 129
8.5 Conservation implementation ............................................................................................................ 130
8.6 Conservation policy recommendations from the regional water planning groups ................ 132
9 Financing needs ........................................................................................................... 134

DRAFT 2022 State Water Plan | Texas Water Development Board 5
9.1 Costs of implementing the state water plan ................................................................................... 135
9.2 Funding assistance required to implement the state water plan ................................................ 137
9.3 Financing the state water plan and other water-related projects .............................................. 138
9.3.1 TWDB financial assistance ............................................................................................................... 139
9.3.2 State Water Implementation Fund for Texas ............................................................................. 139
9.3.3 Other TWDB state-funded programs .......................................................................................... 140
9.3.4 TWDB federally funded programs ................................................................................................ 141
10 Implementation and funding of the 2017 State Water Plan ............................... 142
10.1 Implementation of the 2017 State Water Plan ............................................................................ 143
10.2 Impediments to implementation of the 2017 State Water Plan .............................................. 146
10.3 Funding of the 2017 State Water Plan ........................................................................................... 147
Glossary .......................................................................................................................... 153
Appendices ..................................................................................................................... 158
Appendix A Background on Texas’ water planning history, institutions, and laws 159
A.1 Texas water planning, 1904–1957 .................................................................................................... 159
A.2 State water planning, 1957–1997...................................................................................................... 161
A.3 Regional and state water planning, 1997–present ........................................................................ 161
A.4 State and federal water supply institutions .................................................................................... 162
A.5 Management of water in Texas ......................................................................................................... 165
A.6 Key water planning statute and administrative rules ................................................................... 169
Appendix B Water availability and existing supplies ................................................. 170
B.1 Surface water ......................................................................................................................................... 170
B.2 Groundwater ......................................................................................................................................... 174
Appendix C Annual water needs by region and water use category (acre-feet) ... 179
Appendix D Socioeconomic impact regional summary and dashboards ................ 182
Figures
Figure ES-1. Regional water planning areas ................................................................................................. 4
Figure ES-2. Historical and projected population growth in Texas (1850–2070) .............................. 5
Figure ES-3. Projected total annual water demand and existing water supply for all sectors in
Texas (millions of acre-feet) ........................................................................................................................... 6
Figure ES-4. Annual water needs by water use category (acre-feet) .................................................... 7
Figure ES-5. Annual volume of recommended water management strategies (millions of acre-
feet) ...................................................................................................................................................................... 8
Figure ES-6. Share of recommended water management strategies by water resource in 2070
(percent) ............................................................................................................................................................. 9

DRAFT 2022 State Water Plan | Texas Water Development Board 6
Figure ES-7. Share of recommended water management strategies by strategy type in 2070
(percent) .......................................................................................................................................................... 10
Figure ES-8. Annual water supply needs and needs met by the plan by region in 2070 (acre-feet)
........................................................................................................................................................................... 11
Figure ES-9. Annual water supply needs and needs met by the plan by water use category in
2070 (acre-feet) .............................................................................................................................................. 12
Figure ES-10. Municipal water needs for statewide population in 2020 and 2070 ......................... 13
Figure 1-1. Regional water planning areas ................................................................................................ 18
Figure 1-2. View of interactive state water plan site ............................................................................. 22
Figure 2-1. Unique stream segments previously designated by the Texas Legislature and
additional recommended segments ........................................................................................................... 30
Figure 2-2. Unique reservoir sites previously designated by the Texas Legislature ....................... 32
Figure 2-3. Reservoir sites recommended for designation as unique ................................................ 33
Figure 3-1. Statewide average Palmer Drought Severity Index (NOAA, 2020) .............................. 37
Figure 4-1. Historical and projected population growth in Texas (1850–2070) ............................. 47 Figure 4-2. Historical population change by county (2010–2018) ...................................................... 48
Figure 4-3. Projected population growth by region (2020–2070) ...................................................... 50
Figure 4-4. Projected population growth (2020–2070) ......................................................................... 51
Figure 4-5. Projected annual water demand by water use category in 2020 and 2070 (acre-feet)
........................................................................................................................................................................... 54
Figure 4-6. Projected annual water demand by region and category in 2040 .................................. 56
Figure 4-7. Projected annual irrigation water demand by region in 2020 and 2070 (acre-feet) .. 57
Figure 4-8. Projected annual municipal demand by region in 2020 and 2070 (acre-feet) ............. 59
Figure 4-9. Projected annual manufacturing demand by region in 2020 and 2070 (acre-feet) ..... 60
Figure 4-10. Comparison of water demand projections between 2017 and 2022 state water
plans (millions of acre-feet) ......................................................................................................................... 61
Figure 5-1. Water availability as relates to existing supply................................................................... 66
Figure 5-2. Major river and coastal basins and major surface water supply reservoir locations . 67
Figure 5-3. Texas’ annual surface water availability and existing surface water supply (acre-feet)
........................................................................................................................................................................... 68
Figure 5-4. Annual surface water availability and existing surface water supplies by river and
coastal basin in 2020 (acre-feet) ................................................................................................................. 69
Figure 5-5. Major aquifers of Texas ........................................................................................................... 70
Figure 5-6. Minor aquifers of Texas ........................................................................................................... 71
Figure 5-7. Locations of groundwater conservation districts or subsidence districts and 16
groundwater management areas ................................................................................................................ 72
Figure 5-8. Texas’ annual groundwater availability and existing groundwater supplies (acre-feet)
........................................................................................................................................................................... 74
Figure 5-9. Annual groundwater availability greater than 50,000 acre-feet and existing
groundwater supplies by aquifer in 2020 (acre-feet) ............................................................................. 74
Figure 5-10. Annual groundwater availability less than 50,000 acre-feet and existing
groundwater supplies by aquifer in 2020 (acre-feet) ............................................................................. 75
Figure 5-11. Shares of total, statewide existing municipal, steam electric, manufacturing, and
mining supply by water source in 2020 (percent) .................................................................................. 76
Figure 5-12. Shares of existing irrigation and livestock supply by water source in 2020 (percent) ........................................................................................................................................................................... 77

DRAFT 2022 State Water Plan | Texas Water Development Board 7
Figure 5-13. Texas’ projected annual existing water supply (acre-feet)* .......................................... 78
Figure 5-14. Changes from the 2017 State Water Plan in annual surface water availability in
2020 .................................................................................................................................................................. 80
Figure 5-15. Changes from the 2017 State Water Plan in annual groundwater availability in 2020
........................................................................................................................................................................... 81
Figure 6-1. Projected annual water needs by water use category (acre-feet) ................................. 86
Figure 6-2. Projected municipal water needs by county in 2070 ........................................................ 88
Figure 6-3. Projected statewide population impacted by municipal water needs in 2020 and
2070 .................................................................................................................................................................. 89
Figure 6-4. Estimated relative percent share, by sector statewide, of water needs and potential
income losses in 2070 ................................................................................................................................... 91
Figure 7-1. Share of recommended water management strategy volume by water resource in
2070 (percent) .............................................................................................................................................. 102
Figure 7-2. Annual volume of recommended water management strategies by region and water
resource in 2070 (thousands of acre-feet)............................................................................................. 103
Figure 7-3. Share of total recommended water management strategies volume by strategy type
in 2070 (percent) ......................................................................................................................................... 104
Figure 7-4. Recommended new major reservoirs .............................................................................. 108
Figure 7-5. Online decade count and cumulative yield of recommended new major reservoirs
......................................................................................................................................................................... 109
Figure 7-6. Annual water supply needs and needs met by the plan by region in 2070 (acre-feet) ......................................................................................................................................................................... 118
Figure 7-7. Annual water supply needs and needs met by the plan by water use category in 2070
(acre-feet) ...................................................................................................................................................... 119
Figure 8-1. Share of statewide recommended conservation water management strategies by use
sector in 2070 (percent) ............................................................................................................................ 129
Figure 8-2. Historical statewide average municipal gallons per capita per day (2000–2018) ..... 131
Figure 8-3. Statewide historical, median gallons per capita per day (GPCD) and 5- and 10-year
goals for total water use, residential water use, and water loss ....................................................... 132
Figure 9-1. Total capital costs, by required online decade, of all recommended water
management strategy projects (in billions) ............................................................................................ 136
Figure 9-2. Total capital costs of all recommended water management strategy projects by
wholesale water providers and water user group sponsor type (in billions) ................................ 137
Figure 9-3. Reported state financial assistance needs by decade (in billions) ................................ 138
Figure 10-1. Reported implementation of recommended water management strategies not
associated with a project from the 2017 State Water Plan by share of total number of strategies
not associated with a project .................................................................................................................... 145
Figure 10-2. Reported implementation of all recommended water management strategy
projects from the 2017 State Water Plan by share of total number of projects .......................... 146
Figure 10-3. Locations of 2017 State Water Plan projects funded by the TWDB, by project
sponsor* ........................................................................................................................................................ 152
Figure A-1. Texas water planning timeline ............................................................................................. 160
Figure A-2. Locations of river authorities and regional water planning area boundaries ........... 164
Figure D-1. Interactive dashboards .......................................................................................................... 185

DRAFT 2022 State Water Plan | Texas Water Development Board 8
Tables
Table ES-1. Statewide annual water supply needs that are unmet by the plan (acre-feet) ........... 12
Table 4-1. Projected population by region (2020–2070) ...................................................................... 49
Table 4-2. Projected water demand by water use category (acre-feet) ........................................... 53
Table 4-3. Projected annual water demand by region (acre-feet) ...................................................... 55
Table 5-1. Texas’ annual existing water supply (acre-feet) .................................................................. 78
Table 6-1. Projected annual water needs by water use category (acre-feet) .................................. 85
Table 6-2. Projected annual water needs by region (acre-feet) .......................................................... 86
Table 6-3. Projected statewide annual socioeconomic impacts from not meeting water needs 91
Table 6-4. Statewide projected annual water needs that are unmet by the plan (acre-feet) ....... 93
Table 6-5. Projected annual unmet water needs by region and water use category (acre-feet) 94
Table 7-1. Annual volume of recommended water management strategies by region (acre-feet)
......................................................................................................................................................................... 100
Table 7-2. Capital costs, by required online decade, of all recommended water management
strategy projects by region (million dollars) .......................................................................................... 101
Table 7-3. Annual volume of recommended water management strategies by online decade and
strategy type (acre-feet) ............................................................................................................................. 104
Table 7-4. Number of water user groups relying on different types of water management strategies by region* ................................................................................................................................... 105
Table 7-5. Weight-averaged unit costs (dollars per acre-foot)* of strategy water supplies by
region and strategy type in 2070 .............................................................................................................. 113
Table 7-6. Statewide weight-averaged unit costs (dollars per acre-foot)* of strategy water
supplies by strategy type 2020–2070 ...................................................................................................... 115
Table 8-1. Anticipated (passive and strategy) municipal conservation water volumes in 2020 and
2070 (acre-feet) ............................................................................................................................................ 124
Table 8-2. Annual volume of all recommended conservation strategies by use category in 2020
and 2070 (acre-feet) .................................................................................................................................... 127
Table 10-1. 2017 State Water Plan projects funded by the TWDB by project sponsor ............ 148
Table B-1. Summary of safe yield hydrologic variances used in the 2022 State Water Plan ...... 171
Table B-2. Annual surface water availability by river and coastal basin (acre-feet) ...................... 172
Table B-3. Annual surface water existing supplies by river and coastal basin (acre-feet) ........... 173
Table B-4. Annual groundwater availability by aquifer (acre-feet) .................................................... 175
Table B-5. Annual groundwater existing supplies by aquifer (acre-feet) ........................................ 177

DRAFT 2022 State Water Plan | Texas Water Development Board D-1
Executive summary

DRAFT 2022 State Water Plan | Texas Water Development Board D-2
Quick facts
Texas’ state water plans are based on future conditions in the event of a recurrence of the worst recorded
drought in Texas’ history—known as the “drought of record”—a time when, generally, water supplies are lowest
and water demands are highest.
Texas’ population is anticipated to increase 73 percent between 2020 and 2070, from 29.7 million to 51.5
million, with approximately half of this growth occurring in Regions C and H. Water demands are projected to
increase less significantly, by approximately 9 percent between 2020 and 2070, from 17.7 million to 19.2 million
acre-feet per year.
Texas’ existing water supplies—those that can already be relied on in the event of drought—are projected to
decline by approximately 18 percent between 2020 and 2070, from 16.8 million to 13.8 million acre-feet per
year primarily due to reservoir sedimentation and depletion of aquifers.
Water user groups face a potential water shortage of 3.1 million acre-feet per year in 2020 and 6.9 million acre-
feet per year in 2070 in drought of record conditions.
Approximately 5,800 water management strategies recommended in this plan would provide 1.7 million acre-
feet per year in additional water supplies to water user groups in 2020 and 7.7 million acre-feet per year in
2070.
Conservation strategies represent approximately 29 percent, or 2.2 million acre-feet per year, of all
recommended water management strategy volumes in 2070 and were recommended for more than half of the
water user groups in the plan.
The estimated capital cost to design, construct, and implement the more than 2,400 recommended water
management strategy projects by 2070 is $80 billion.
If strategies are not implemented, approximately one-quarter of Texas’ population in 2070 would have less than
half the municipal water supplies they will require during a drought of record.
If Texas does not implement the state water plan, estimated annual economic losses resulting from water
shortages range from approximately $110 billion in 2020 to $153 billion in 2070.
Through SWIFT and other financial assistance programs, the TWDB has closed on approximately $6.5 billion in
financial assistance for 61 state water plan projects recommended in the 2017 State Water Plan.
Since inception, the SWIFT program has committed almost $9 billion to state water plan projects of which
almost $8.2 billion is toward recommended projects in this state water plan.
Why do we plan?
Planning is necessary to responsibly manage and develop the state’s water resources for the benefit of
future generations. Reliable water supply is essential to supporting Texas’ robust economy, its
agricultural and natural resources, and one of the fastest growing populations in the country. By 2070,
51.5 million people are anticipated to live in the state, all requiring water to work and thrive.
The goal of the state’s water planning process is to ensure adequate water supplies for all Texans in
times of drought. Texas has a long history of drought, and there is no indication of that pattern changing;
in fact, recent droughts remind us that more severe drought conditions are likely to continue to occur
at some point in the future. Although the drought of the 1950s is considered the statewide “drought of
record” for Texas—and remains the statewide benchmark for the water planning process—there are
much more recent regional droughts of record, the new 2007–2016 Colorado Basin drought of record
being a recently documented example. As they continue to occur, each of those new regional droughts
DRAFT 2022 State Water Plan | Texas Water Development Board D-3
of record must be incorporated directly into the regional and state water plans to reflect the new
regional planning benchmark.
Because the state water plan is based on providing water supplies under benchmark drought conditions
when water demands are usually highest and supplies are lowest, its implementation will also generally
support most of the same water demands under average or wetter hydrologic conditions. Significant
portions of identified water needs in this state water plan, particularly certain irrigation needs, are not,
however, entirely attributable to an onset of drought conditions. Even under average hydrologic
conditions, irrigated agriculture requires significant water supplies to support it, and sizable portions of
those irrigation demands will likely be unmet even under average hydrologic periods, due largely to the
managed and unmanaged depletion of aquifers.
Ensuring adequate and affordable water supplies for all Texans to withstand future droughts requires
both advance planning and implementation prior to the onset of drought. The Texas Water
Development Board (TWDB) is the state’s lead water planning and infrastructure financing agency and is
statutorily responsible for administering the regional water planning process and preparing and adopting
the state water plan every five years. Each new state water plan, which considers a 50-year horizon,
must reflect and respond to changes in population, water supplies, technological improvements,
economic shifts, project viability, and state policy. The Texas Legislature has long recognized that water
is critical to the future of Texas and, in 1997, created a strong state and regional framework for
responsibly planning to address both the short- and long-term water needs of the state. However,
providing sufficient water supplies at reasonable costs continues to present new challenges with each
planning cycle. Among those challenges are the continued increase in the estimated cost of developing
water supply projects that often require many years to implement and adequately preparing in the face
of continued uncertainty of future droughts that may be worse than the drought of record.
How do we plan?
Since 1997, water planning in Texas has been based on local involvement focused at the regional level.
The state is divided into 16 regional water planning areas (Figure ES-1). Each planning area is
represented by a planning group that, on average, consists of approximately 22 members representing at
least 12 statutorily required interests: the public, counties, municipalities, industries, agriculture,
environment, small businesses, electric-generating utilities, river authorities, water districts, water
utilities, and groundwater management areas where applicable.
During each five-year planning cycle, regional water planning groups evaluate population projections,
water demand projections, and existing water supplies. Each planning group then identifies potential
water shortages under drought of record conditions (water needs) and recommends water management
strategies (with cost estimates) to address those potential shortages. This bottom-up approach allows
the planning groups to assess specific risks and uncertainties in their own regions and evaluate potential
impacts of water management strategies on their region as well as on the state’s water, agricultural, and
natural resources. Importantly, Texas’ planning framework directly involves the entities—regional water
providers, cities, or water utilities—that will actually be responsible for developing and delivering those
future water supplies.
Once the planning groups adopt their regional water plans, the plans are sent to the TWDB for review
and approval. The TWDB then prepares the state water plan based on the regional water plans. The
state water plan also serves as a guide for state water policy and includes the TWDB’s policy
recommendations to the Texas Legislature. Each step of the water planning process is open to the
public and provides numerous opportunities for public input.

DRAFT 2022 State Water Plan | Texas Water Development Board D-4
Figure ES-1. Regional water planning areas
How many Texans will there be?
The population in Texas is projected to increase 73 percent between 2020 and 2070, from 29.71 million
to 51.5 million people (Figure ES-2). Growth rates vary considerably throughout the state. For example,
31 counties are projected to at least double their population by 2070; the rest are projected to remain
the same, decline, or experience modest growth. Approximately half of the statewide population growth
between 2020 and 2070 is projected to occur within Regions C (which includes the Dallas-Fort Worth
metropolitan area) and H (which includes the Houston metropolitan area).
1 Planning numbers presented throughout this plan have been rounded.

DRAFT 2022 State Water Plan | Texas Water Development Board D-5
Figure ES-2. Historical and projected population growth in Texas (1850–2070)
How much water will we require?
While population is projected to increase 73 percent over the next 50 years, total water demand for all
sectors in Texas is projected to increase by only 9 percent, from about 17.7 million acre-feet per year in
2020 to about 19.2 million in 2070 (Figure ES-3). Municipal demand is projected to increase in greater
proportion and total volume over the next 50 years than any other water use category, from 5.2 million
acre-feet per year in 2020 to 8.5 million in 2070. Agricultural irrigation demand is projected to decrease,
from 9.4 million acre-feet per year in 2020 to about 7.6 million in 2070, due to more efficient irrigation
systems, reduced groundwater availability, and the transfer of surface water rights from agricultural to
municipal users. Manufacturing and livestock demands are projected to increase, while mining demand is
projected to decline. Water demand for steam-electric power generation is projected to remain
constant over the next 50 years primarily due to increasingly efficient water use.

DRAFT 2022 State Water Plan | Texas Water Development Board D-6
Figure ES-3. Projected total annual water demand and existing water supply for all sectors in
Texas (millions of acre-feet)
How much water do we have now?
Existing water supply—categorized as surface water, groundwater, and reuse water—is projected to
decrease approximately 18 percent, from 16.8 million acre-feet per year in 2020 to about 13.8 million in
2070. For planning purposes, existing supply represents water supplies that are physically and legally
available to be produced and delivered with current permits, current contracts, and existing
infrastructure immediately in the event of an onset of drought of record conditions.
Existing surface water supplies are projected to decrease by about 2 percent, from 7.2 million acre-feet
per year in 2020 to 7.1 million in 2070 due to sedimentation and changes in water contracts.
Groundwater supplies are projected to decrease 32 percent, from 8.9 million acre-feet per year in 2020
to 6 million in 2070. This decrease is primarily due to reduced groundwater availability from the Ogallala
Aquifer (as a result of its managed depletion over time) and the Gulf Coast Aquifer (due to mandatory
reductions in pumping to prevent land surface subsidence). Additionally, groundwater conservation
districts made policy decisions through the groundwater management area joint planning process that
also resulted in changes to groundwater availability.
Total annual reuse supply makes up nearly 4 percent of total supplies in 2020, with approximately half of
this supply occurring in Region C. Reuse supplies are estimated to increase statewide about 15 percent
from 2020 to 2070.

DRAFT 2022 State Water Plan | Texas Water Development Board D-7
Do we have enough water for the future?
Because the existing water supply is not enough to meet the future demand for water during times of
drought, Texas would need 6.9 million acre-feet of additional water supplies, including in the form of
water savings through conservation, to meet the demand for water in 2070. If a recurrence of the
drought of record had occurred in 2020, the state would have faced an immediate need for 3.1 million
acre-feet per year in additional water supplies (Figure ES-4). Of that, 7 percent (215,000 acre-feet)
would have been required for municipal water users, who face the largest water demand increase over
the next 50 years. Total water needs (potential shortages) are projected to increase by 120 percent
between 2020 and 2070, from 3.1 million to 6.9 million acre-feet per year. In 2070, 3.1 million acre-feet
per year, or 46 percent of the total projected needs, is associated with municipal users.
Figure ES-4. Annual water needs by water use category (acre-feet)
* Water use categories are presented in the order listed in the legend.
What can we do to get more water?
When projected demand for water exceeds existing supply, planning groups recommend water
management strategies—specific plans and associated projects—to address the gap either by providing
additional water supply or by reducing water demand. Water management strategies include reduction
in water use through conservation or additional water supply from new reservoirs, groundwater wells,
water reuse, seawater and groundwater desalination plants, and more.
In the 2022 State Water Plan, planning groups recommended approximately 5,800 water management
strategies and more than 2,400 specific water management strategy projects to increase water supply.
Strategies may or may not require new water infrastructure—referred to as water management strategy
projects—to be developed. If implemented, these strategies would provide 7.7 million acre-feet per year
in additional water supplies to water user groups by 2070 (Figure ES-5).
The full capacity of all recommended projects and strategies that are included in the approved regional
water plans, including any associated capacities or volumes of water that may not be immediately
assigned to a specific water user group, is also considered to be part of the state water plan.

DRAFT 2022 State Water Plan | Texas Water Development Board D-8
Figure ES-5. Annual volume of recommended water management strategies (millions of acre-
feet)
By 2070, about 31 percent of the total volume of these strategies would be in the form of demand
management. Demand management refers to measures that reduce the need for additional water, such
as long-term conservation and short-term drought management measures. Drought management
includes activities that temporarily restrict water use for certain types of activities and businesses.
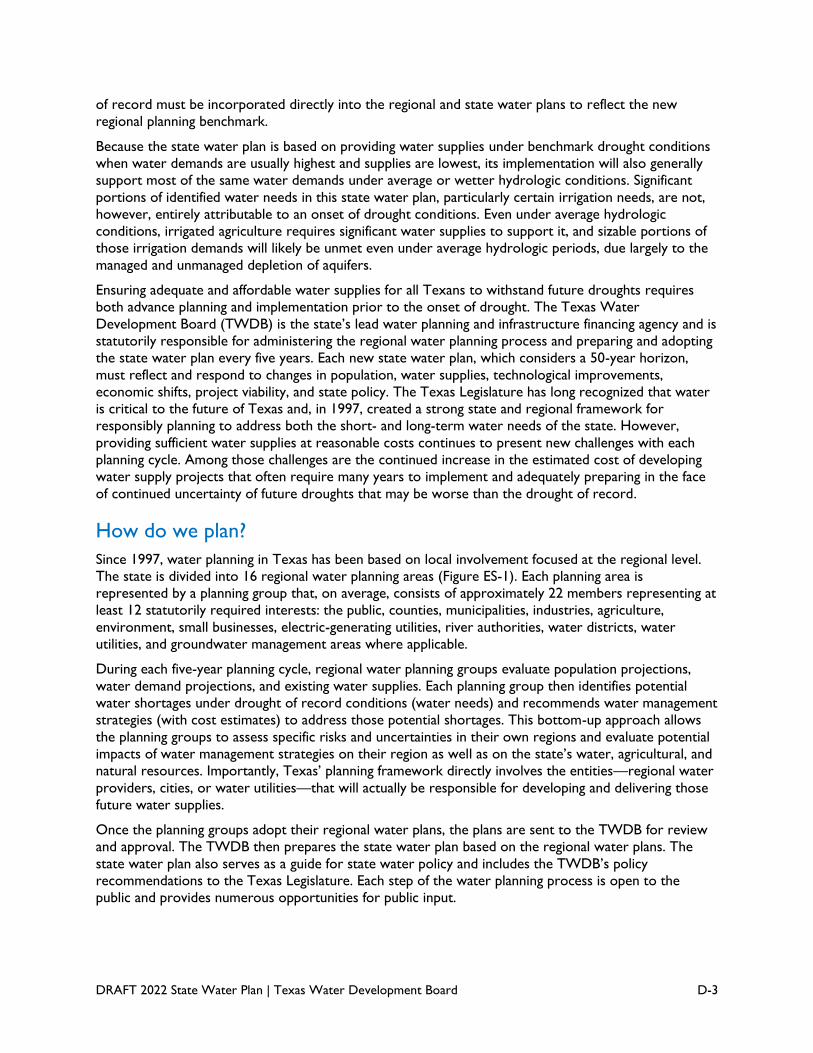
Surface water resources, including new reservoirs, compose the greatest portion of the recommended
water management strategy supplies in 2070 at approximately 37 percent. Reuse is expected to provide
approximately 15 percent, groundwater resources approximately 12 percent, aquifer storage and
recovery resources approximately 3 percent, and seawater desalination about 3 percent of additional
supplies to water user groups (Figure ES-6).
DRAFT 2022 State Water Plan | Texas Water Development Board D-9
Figure ES-6. Share of recommended water management strategies by water resource in 2070
(percent)
Planning groups recommended a wide variety of water management strategies, each of which relies on a
specific combination of water source(s), infrastructure, and technology (Figure ES-7). The types and
mixture of strategies recommended by each regional planning group were shaped by the regional
geography, availability of water resources, and water needs.

DRAFT 2022 State Water Plan | Texas Water Development Board D-10
Figure ES-7. Share of recommended water management strategies by strategy type in 2070
(percent)
Some planning groups recommended strategies that, if implemented, would provide more water than
may be required to meet their region’s water needs under drought of record conditions. This additional
supply addresses risks and uncertainties that are inherent to the planning process and the operation and
management of water systems, including
• higher population growth and/or water demands than projected;
• the occurrence of a drought worse than the drought of record;
• unanticipated reduction in existing water supplies;
• water system operation, treatment losses, and operational safety factors; and
• potential difficulties in financing and implementing water supply projects.
Are all the water supply needs met?
Two planning groups (Regions N and P) were able to recommend water management strategies that, if
implemented, can fully meet the needs for all their water user groups. The remaining 14 planning groups
were unable to identify sufficient feasible strategies that could meet both Texas’ planning requirements
and all the projected needs in their regions (Figure ES-8).

DRAFT 2022 State Water Plan | Texas Water Development Board D-11
Figure ES-8. Annual water supply needs and needs met by the plan by region in 2070 (acre-feet)
Statewide, the vast majority of projected water needs associated with municipal, manufacturing,
livestock, and mining water user groups are met by the plan through 2070 (Figure ES-9). However,
approximately 2.2 million acre-feet of water supply needs remain unmet by this plan in 2020, increasing
to approximately 2.5 million acre-feet in 2070 (Table ES-1). Irrigation represents the vast majority
(ranging from 86 percent to 94 percent) of these unmet needs in all decades. At least some volume of
unmet water supply needs occur for all categories of water user groups in the plan. Often these unmet
needs comprise a relatively small share of an entity’s total water demands meaning that they could be
addressed through a drought contingency plan. The inability to meet a water user group’s need in the
plan is usually due to the lack of an economically feasible water management strategy, but this does not
prevent an entity from pursuing additional water supplies.

DRAFT 2022 State Water Plan | Texas Water Development Board D-12
Figure ES-9. Annual water supply needs and needs met by the plan by water use category in 2070
(acre-feet)
Table ES-1. Statewide annual water supply needs that are unmet by the plan (acre-feet)
Water use
category 2020 2030 2040 2050 2060 2070
Irrigation 1,917,000 2,724,000 2,512,000 2,421,000 2,377,000 2,336,000
Steam-electric 122,000 94,000 94,000 94,000 95,000 95,000
Manufacturing 110,000 1,000 1,000 1,000 1,000 1,000
Mining 52,000 46,000 41,000 35,000 29,000 32,000
Municipal 18,000 1,000 2,000 3,000 4,000 6,000
Livestock 9,000 2,000 3,000 4,000 5,000 7,000
Total 2,228,000 2,868,000 2,653,000 2,558,000 2,511,000 2,477,000
How much will it cost?
The estimated total capital cost of the 2022 State Water Plan, which represents the capital costs of all
recommended water management strategies and projects in the 2021 regional water plans, is $80 billion.
These costs include the funds needed to permit and design projects, acquire water rights and land, and
construct projects necessary to implement the recommended strategies. The vast majority of the cost,
approximately $77.1 billion, is associated with projects sponsored by municipal water user groups and
wholesale water providers that provide water to municipal water users.
DRAFT 2022 State Water Plan | Texas Water Development Board D-13
What if we do nothing?
Texas would suffer significant economic losses should the recommended water management strategies
not be implemented and another drought of record, or worse, occur. Economic modeling indicates that
Texas businesses and workers could have lost approximately $110 billion in income annually in 2020 and
could lose $153 billion annually in 2070. Job losses could have totaled approximately 615,000 in 2020
and could total 1.4 million in 2070. This estimate is likely conservative and does not include additional
drought impacts such as those to dry land farming and other activities not associated directly with water
needs identified by the plan, nor does it attempt to quantify the potential for greater impacts that would
result from a drought that is worse than the drought of record.
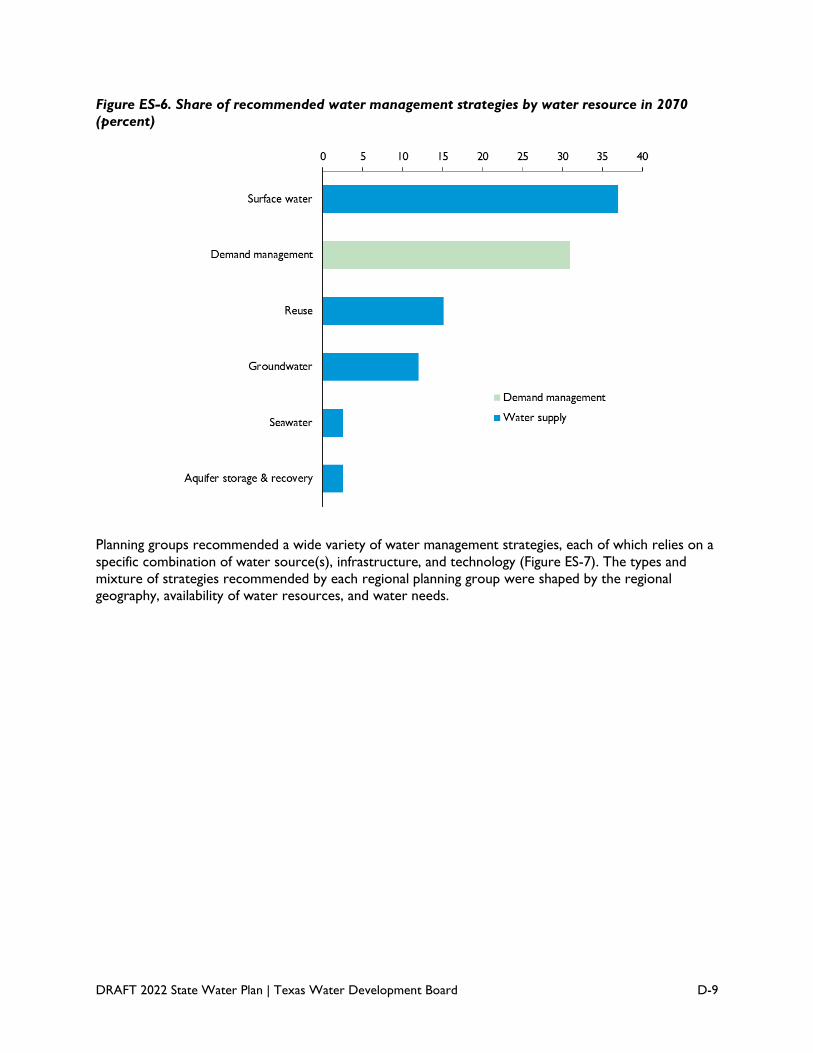
If we do nothing, approximately four out of five Texans would face at least a 10 percent water shortage
in their cities and residences in 2070, and approximately a quarter of all Texas’ municipal water users
would have less than half of the water supplies that they require to live and work by 2070 (Figure ES-
10).
Figure ES-10. Projected statewide population impacted by municipal water needs in 2020 and
2070
How are strategies in the state water plan funded?
Strategy sponsors, such as cities or wholesale water providers, must take action, including obtaining
financing, to develop water projects and conservation measures, many of which may require financial
assistance. Water providers surveyed during the planning process reported an anticipated need of $47
billion in state financial assistance to implement strategies in their regions. Of this amount,
approximately $46.6 billion is for strategies associated with municipal water suppliers or wholesale
water providers. Cities, communities, and individuals can ask their water providers to apply for state
financing for water projects.

DRAFT 2022 State Water Plan | Texas Water Development Board D-14
In 2013, the Texas Legislature created the State Water Implementation Fund for Texas (SWIFT) and
State Water Implementation Revenue Fund for Texas (SWIRFT) to provide affordable, ongoing state
financial assistance for projects in the state water plan. Passed by the legislature and approved by Texas
voters through a constitutional amendment, the SWIFT2 program assists communities in developing and
optimizing water supply projects at cost-effective rates. The program provides low-interest loans,
extended repayment terms, deferral of loan repayments, and incremental repurchase terms for projects
with state ownership aspects. To be eligible for the SWIFT program, a project and its associated capital
costs must be included in the state water plan. In addition to SWIFT, the TWDB has several state and
federally funded financial assistance programs that may be utilized to fund projects in the state water
plan.
What has the TWDB done to implement water management strategies
in the previous, 2017 State Water Plan?
Since adopting the 2017 State Water Plan, the TWDB has closed3 on more than $6.5 billion, including in
SWIFT financing, for implementation of 61 projects recommended in the 2017 State Water Plan. Many
of these water management strategy projects continue to be recommended strategies in this new plan
and are in various stages of implementation across the state.
What were impediments to implementing the previous plan?
Planning groups listed several impediments to implementation, with access to funding and the permitting
process being the most common impediments mentioned. Other impediments included lack of a project
sponsor, land acquisition, and water availability constraints. However, the impediments reported do not
necessarily indicate that a project will not be implemented; rather, it usually appears to indicate that it
may take longer or more effort to implement. During each planning cycle, planning groups update their
water management strategies and reflect any changes to when the projects are anticipated to be needed
and/or fully operational.
What has the TWDB done already to implement water management
strategies in this new plan?
The TWDB has already committed almost $8.2 billion in SWIFT financing toward projects that are
recommended in this 2022 State Water Plan. The projects include groundwater wells, conservation,
brackish groundwater and seawater desalination, and reservoir projects.
What more can we do?
Planning groups made a variety of regulatory, administrative, and legislative recommendations that they
believe are needed to better manage Texas’ water resources and to prepare for and respond to
droughts. Having considered their recommendations and other potential policy considerations, the
TWDB recommends the following:
2 The SWIFT program includes two funds, the State Water Implementation Fund for Texas (SWIFT) and the State
Water Implementation Revenue Fund for Texas (SWIRFT). Revenue bonds for the program are issued through
SWIRFT.
3 The TWDB first approves a commitment for financial assistance. After all appropriate reviews and requirements
are met, funds are released at closing.

DRAFT 2022 State Water Plan | Texas Water Development Board D-15
Legislative recommendation 1: Unique stream segment designation
The legislature should designate the five river or stream segments of unique ecological value recommended by
the 2021 regional water plans (Alamito Creek, Black Cypress Bayou, Black Cypress Creek, Pecan Bayou, and
Terlingua Creek) for protection under Texas Water Code §16.051(f).
Legislative recommendation 2: Unique reservoir site designation
The legislature should designate for protection under Texas Water Code §16.051(g) three sites of unique value
for constructing reservoirs as recommended in the 2021 regional water plans: Coryell County Off-Channel
Reservoir, Millers Creek Off-Channel Reservoir, and Parkhouse II (North).

DRAFT 2022 State Water Plan | Texas Water Development Board D-16
1 Introduction

DRAFT 2022 State Water Plan | Texas Water Development Board D-17
Quick facts
• Texas’ state water plans are based on future conditions that would exist in the event of a recurrence of
the worst recorded drought in Texas’ history—known as the “drought of record”—a time when,
generally, water supplies are lowest and water demands are highest.
• Details from the regional and state water plans, including summaries by region, county, and water user
group, can be explored through the interactive state water plan at www.2022.texasstatewaterplan.org.
• Historical water use and projected water demand data can be further explored through interactive data
dashboards at www.twdb.texas.gov/waterplanning/data/index.asp.
Water is the lifeblood of Texas. It sustains the state’s booming cities and rural communities, farms and
ranches, diverse economy, and natural environment. Indeed, the availability of water has always
influenced patterns of settlement and economic opportunity in Texas. Due in large part to significant
investments in water supply infrastructure in the mid-20th century, including many reservoirs, Texas
now has dependable water supplies during most years. However, the Texas climate is famously
unpredictable from one year to the next, often oscillating between extended periods of insufficient
rainfall and extreme, short-lived precipitation events and flooding. The statewide drought during the
1950s is cemented in Texan legend, resulting in 244 of the state’s 254 counties being declared disaster
areas and long-term demographic changes with many rural residents abandoning their farms and ranches
to live in cities (NPR, 2012). This drought was punctuated by damaging floods in the spring of 1957 in
every river basin in the state (Texas Board of Water Engineers, 1957). Texas’ most recent severe
drought from 2010 to 2014 reminded Texans of the importance of water planning and conservation, as
water supplies around the state declined significantly and 2011 took its place as the single driest and
second hottest year in Texas’ modern meteorological record.
In response to the drought of the 1950s and in recognition of the need to better plan for the future, the
55th Texas Legislature created the TWDB in 1957 to prepare plans and provide funding to address the
state’s future water needs. In 1997, as a result of a brief but intense drought and recognition of
increasing population pressure on water resources, the 75th Texas Legislature established a new,
bottom-up, stakeholder-driven regional water planning process and formed 16 regional water planning
areas (Figure 1-1). In this process, local stakeholders representing cities, farmers, ranchers, industries,
river authorities, the environment, and other interests work together to create long-range plans to
ensure Texas will have reliable water supplies during times of drought.
The 2022 State Water Plan is the fifth plan completed under the regional water planning process and the
state’s 11th water plan overall. It is the culmination of the fifth cycle of regional water planning,
comprising the hard work and dedication of more than 480 volunteer planning group members across
Texas’ 16 regional water planning groups. With each state plan, the TWDB compiles new and updated
information and recommendations from the 16 adopted regional water plans into one document to
serve as a guide to state water policy. With each five-year cycle, the TWDB creates a comprehensive
state plan that is more substantive, data driven, forward looking, transparent, and user friendly than
previous plans. This is exemplified by the development of the interactive state water plan website and
various online data dashboards, which are continuously enhanced for policy makers, local officials, and
citizens to better engage with the water planning information that affects them.
The TWDB’s experience and commitment to continually improving the process keep Texas at the
forefront of state water planning in the United States. Indeed, no other fast-growing state has produced
a water plan that more clearly demonstrates how its local water suppliers can provide long-term,

DRAFT 2022 State Water Plan | Texas Water Development Board D-18
Figure 1-1. Regional water planning areas
affordable water supplies to its residents. Sustained investments by the Texas Legislature have developed
surface water and groundwater availability models that have provided constraint-based and actionable
data as a basis of the planning process. Although the terms “update” or “revision” are sometimes—
rightfully—used in discussing water plans, each regional and state water plan is, in fact, a standalone plan
based on a renewed look at water demands, potential shortages, and potentially feasible strategies. At
the same time, the recurring nature of five-year planning cycles allows the process to respond to
legislative policy changes, stakeholder input, and new methodological approaches, while remaining
updated and relevant.
1.1 Regional water planning overview
Senate Bill 1, passed by the Texas Legislature in 1997, outlined an entirely new process in which local
and regional stakeholders were tasked with developing consensus-driven regional plans for how to meet
water needs during times of drought. The TWDB was charged with implementing the program, which
meant developing rules and guidelines as well as establishing the planning regions. Senate Bill 1 stipulated
that the TWDB could only provide financial assistance for water supply projects and the Texas
Commission on Environmental Quality could only grant new surface water rights if they were consistent
with the regional and state water plans. These incentives were important to encourage water project
sponsors to actively participate in the planning process.

DRAFT 2022 State Water Plan | Texas Water Development Board D-19
The 16 regional water planning areas were designated by considering river basin and aquifer
delineations, political subdivision boundaries, socioeconomic characteristics, public comments, and other
factors. The TWDB is required to review and update the planning area boundaries at least once every
five years. These boundaries were last reviewed in October 2020, and no changes have been made since
their initial establishment.
1.1.1 Regional water planning groups
Each of the 16 regional water planning areas has an associated planning group composed of local
stakeholders who volunteer their time for this process. Every five years, the planning groups are
responsible for developing regional water plans that are funded primarily through legislative
appropriations, administered by the TWDB, and guided by statute, rules, contracts, and input from
planning group members and the general public. In accordance with the Texas Open Meetings Act, all
planning groups and their committees conduct their business in meetings that are open to the public and
that give the public advance notice of the time, date, location, and subject matter of the meetings.
Each planning group is required to maintain at least one representative of each of the following 12
interests:
1) The general public
2) Counties
3) Municipalities
4) Industry
5) Agriculture
6) Environment
7) Small business
8) Electric-generating utilities (also called steam-electric)
9) River authorities
10) Water districts
11) Water utilities
12) Groundwater management areas that fall within the planning area (where applicable)
Planning groups must have at least one voting representative from each required interest and may
designate representatives for additional interests that are important to the planning area. Currently,
each planning group has more than 12 voting members, with the largest having over 30. More than 480
voting members participated in the development of the 2021 regional water plans (see
Acknowledgments). Planning group members serve in a volunteer capacity and are not compensated by
the planning groups for their time. Planning groups also include non-voting members from the TWDB,
the Texas Department of Agriculture, the Texas Parks and Wildlife Department, and the Texas State
Soil and Water Conservation Board, as well as liaisons from adjacent planning groups and
representatives of any additional interest categories deemed appropriate by the planning group, such as
the Texas Commission on Environmental Quality.
The enduring success of Texas’ regional water planning process rests with the service of planning group
members who dedicate many hours to ensuring the long-term viability of Texas’ water supplies. Strong
leadership from planning group chairs and other long-time members, as well as the ability to attract new
members who bring fresh ideas to the table, ensure the dynamic continuity of the planning process.

DRAFT 2022 State Water Plan | Texas Water Development Board D-20
1.1.2 Program requirements
A regional water plan must meet all statutory, administrative rule, and contract requirements. During
each five-year planning cycle, each planning group must
• maintain its membership and governing bylaws;
• designate a political subdivision of the state, such as a municipality, river authority, or council of
governments, to serve as its administrator for the purpose of arranging meetings, managing
grant-funded contracts, and providing public notices (the political subdivision provides staff
resources, at its region’s expense, to perform these administrative services);
• apply to the TWDB for regional water planning grant funding through its political subdivision;
• select a technical consultant(s) to serve at the direction of the planning group and to collect
information, perform analyses, and prepare the regional water plan document;
• direct the development of its water plan, including making decisions about which water
management strategies will be recommended;
• solicit and consider public input, conduct open meetings, and, together with its political
subdivision, provide required public notices, including for public hearings on the initially
prepared (draft) regional water plan;
• submit its initially prepared plan and standardized data to the TWDB for review; and
• adopt a final regional water plan and submit it to the TWDB for approval.
To facilitate the development of the regional water plans, each planning group is supported by an
assigned TWDB regional water planner who serves as a project manager and non-voting planning group
member that attends every planning group meeting and manages the associated grant contract. The
planners also provide technical and administrative assistance during meetings and throughout the
development of the regional water plans to help ensure the planning groups meet their deadlines and all
planning requirements.
1.1.3 Development of the regional water plans
Every five years, each of the 16 planning groups is tasked with producing long-range regional water plans
that ensure water needs will be met during times of drought for the next 50 years. These plans generally
follow a standard format across the regions based upon statute, administrative rules, and an established
scope of work for each planning cycle.
Regional water planning is based on several fundamental parameters that guide the entire process, the
most important of which is anticipating a repeat of drought of record conditions when, generally, water
supplies are lowest and water demands are highest. Planning groups conduct evaluations of future water
demands, existing supplies, potential water shortages, and feasible water management strategies for
wholesale water providers and approximately 3,000 water user groups in six categories (municipal,
manufacturing, steam-electric power generation, mining, irrigation, and livestock). Planning groups
report the associated data by decade over a 50-year planning period (in this cycle from 2020 to 2070) by
water user group, county, river basin, and regional water planning area. The regional plans also include
drought response information, policy recommendations, information on project implementation, and a
comparison to previous plans. Planning groups must also separately submit their region’s prioritized list
of all recommended water management strategy projects to the TWDB in support of the State Water
Implementation Fund for Texas (SWIFT) prioritization process. The prioritization at the planning group
level is based on uniform standards developed by a stakeholder committee composed of the planning
group chairs and approved by the TWDB.
The 16 regional water plans are the product of hundreds of meetings; the effort and many hours of hard
work by the planning groups, consultants, and stakeholders; and the large amount of information that

DRAFT 2022 State Water Plan | Texas Water Development Board D-21
the planning groups develop along the way. Each regional plan presents information in 11 chapters with
much of the underlying information entered directly into the TWDB’s state water planning database.
1.1.4 Development of the state water plan
After planning groups adopt their regional water plans, they submit them to the TWDB for approval. As
required by statute, the TWDB develops the state water plan based on those plans. The state water
plan compiles key information from the regional water plans and serves as a guide to state water policy.
It explains planning methodology, presents data for the state as a whole, identifies statewide trends, and
provides recommendations to the Texas Legislature. Prior to adopting the final state water plan, the
TWDB releases a draft for public comment, publishes its intent to adopt the state water plan in the
Texas Register, and holds, at a minimum, one public hearing.
1.2 The interactive state water plan
The 2022 State Water Plan is supported by an interactive website (www.2022.texasstatewaterplan.org)
that is part of the TWDB’s approved and adopted plan. The interactive plan allows water users to take
an up-close look at data thematically and at discrete levels not found in the electronic and bound
versions of the plan. Data is presented in geographical and tabular forms with clickable links to help
users navigate and download data (Figure 1-2). The site allows users to view water sources that a
particular water user group relies on today for its existing water supplies and find out what
recommended strategies and water sources it will depend on in the future.
This approach to the delivery of water planning data to the public provides views at a variety of scales,
from a snapshot for a single utility to the big picture outlook for the entire state. Users can view the
interactive state water plan in numerous ways and from various perspectives:
• At varying geographic scales—utility, county, region, or state
• By specific planning decades—spanning the 50-year planning horizon (2020–2070)
• By water use categories—irrigation, livestock, manufacturing, mining, municipal, and steam-
electric power
• By water source—specific aquifers, reservoirs, reuse, and other supplies
• By category of planning information—projected water demands, existing water supplies, water
needs, and recommended water management strategies and projects
• By type of water management strategy—to see projects by categories such as aquifer storage
and recovery, direct potable reuse, or seawater desalination
• By water user—to see geographically all the water sources a user relies upon

DRAFT 2022 State Water Plan | Texas Water Development Board D-22
Figure 1-2. View of interactive state water plan site
The TWDB administers the state water planning database that facilitates the interactive state water plan.
Planning groups directly populate a unique online database for each planning cycle. Planning groups rely
on this database to produce portions of their regional water plans, including calculating water needs for
each water user group, and to help avoid over-allocating water sources. Some of the planning data, such
as water demand projections and modeled available groundwater volumes, are developed and entered
directly by the TWDB. The state water planning database greatly accelerates our ability to review and
approve the final regional plans and develop the draft state water plan.
The interactive website increases transparency, promotes awareness about water issues to the general
public, and makes this critical information more accessible to a new generation of water users. During
the review period for the draft 2021 regional water plans, it allowed the regions to visually present the
draft regional plan data during their 18 public hearings. The interactive state water plan is also viewable
on most mobile devices, and users can download data into a spreadsheet for further use. Overall, the
interactive plan gives Texans the opportunity to access and understand more information and put that
information into context based on their specific needs.

DRAFT 2022 State Water Plan | Texas Water Development Board D-23
1.3 New to the 2022 State Water Plan
During the fifth cycle of regional water planning, state legislators, water planning stakeholders, and
TWDB staff continued to refine the process to produce more realistic, data-driven plans to guide water
resources management in Texas.
1.3.1 Legislative changes since the 2017 State Water Plan
Every two years, the Texas Legislature convenes and has an opportunity to refine the iterative regional
water planning process. Several bills that passed during recent legislative sessions resulted in modest
changes to the fifth cycle of planning. In 2017, the 85th Texas Legislature passed three bills relevant to
the planning process. The widest ranging was Senate Bill 1511, which included several provisions to
the process:
• It allowed planning groups to pursue a simplified version of the planning process every other
five-year planning cycle if they determine there has been no significant changes to water
availability, existing supplies, or demands since the last adopted plan (the 2021 planning cycle
was the first time planning groups had this option and it was not utilized, suggesting that the
regions had meaningful changes to their plans).
• It required planning groups to consider the impediments to successfully implementing projects in
the region (summarized in Chapter 10).
• It added one new non-voting member representing the Texas State Soil and Water
Conservation Board to each planning group.
• It required certain planning group meetings be held in a central location readily accessible to the
public within the planning area.
• It required further assessment of the feasibility of projects, and will require removing infeasible
projects by amendment in the 2026 Regional Water Plans.
• It directed the TWDB to report on the implementation and impediments to the development of
projects funded through SWIFT in the state water plan (see Chapter 10 for this information).
Because Senate Bill 1511, 85th Texas Legislature, now requires planning groups to actually amend their
regional water plans if recommended water management strategies or projects become infeasible prior
to the next plan adoption, including ‘infeasible in time,4’ the need to ensure realistic reservoir
development timelines, for example, was emphasized by the TWDB in the contract guidance and at
planning group meetings. Partly in response to this feasibility review, online decades for six
recommended new major reservoir strategies were shifted from 2020 in the draft regional plans to 2030
in the final, adopted regional water plans.
The 85th Texas Legislature also passed Senate Bill 347, which stipulates that, in addition to planning
groups, any committees or subcommittees designated by the groups are also subject to the Texas Open
Meetings Act and the Public Information Act (Chapters 551 and 552, Texas Government Code). House
Bill 2215 synchronizes the schedules of the state water plan and the joint groundwater planning and
regional water planning cycles. This change, which was a TWDB recommendation in the 2017 State
Water Plan, shifted the proposal and adoption dates for desired future conditions so modeled available
groundwater values would become available earlier each planning cycle.
4 Although all projects recommended in the plan are considered technically feasible, a project may become
infeasible ‘temporally’ meaning that obstacles and related delays to implementation might make it impractical to
build the project quickly enough to meet water needs intended to be met in an early decade, and the project
would need to be shown as meeting needs later on.
DRAFT 2022 State Water Plan | Texas Water Development Board D-24
In 2019, the 86th Texas Legislature passed several additional bills relevant to the regional water planning
process and state water plan development. House Bill 807 called for the TWDB to appoint an
interregional planning council composed of members of each planning group that must meet at least
once during each five-year planning cycle. The inaugural meeting was held April 29, 2020. As part of its
work, the council produced a report, submitted October 16, 2020, which included recommendations
for the TWDB (Interregional Planning Council, 2020). The bill also added several specific new
requirements to the regional water plans:
• Identify any counterproductive drought response strategies (summarized in Chapter 3)
• Provide a specific assessment regarding the potential for aquifer storage and recovery projects
to meet significant identified water needs in the planning area (summarized in Chapter 7)
• Set specific per capita per day water use goals for each municipal water user group for each
planning decade (highlighted in Chapter 8)
• Assess the progress in encouraging cooperation among water user groups to develop strategies
that achieve economies of scale and benefit the entire region (summarized in Chapter 10)
• Encourage planning groups to provide feedback to the state regarding water planning process
improvements (these policy recommendations are summarized in an ancillary document on the
state water plan website, www.twdb.texas.gov/waterplanning/swp/2022/index.asp)
House Bill 721 requires the TWDB to assess aquifer storage and recovery projects and aquifer
recharge projects in the state water plan or identified by other stakeholders and conduct a statewide
survey to broadly identify the relative suitability of various major and minor aquifers for use in aquifer
storage and recovery projects or aquifer recharge projects. The TWDB delivered this survey to state
leadership in December 2020, and the results will inform the next planning cycle. House Bill 723
requires the Texas Commission on Environmental Quality to obtain or develop updated water
availability models for the Brazos, Neches, Red, and Rio Grande river basins by December 2022. These
new model updates are important and will be utilized to develop the 2026 regional water plans and 2027
State Water Plan.
1.3.2 New developments and process improvements
With each cycle of regional water planning, the TWDB strives to make the process more accessible,
coherent, and informative for stakeholders and the public. During the fifth planning cycle, the TWDB
increased opportunities for stakeholder input, including holding two work sessions with planning group
chairs. However, the most significant change during this cycle was the shift to utility-based planning. In
previous plans, municipal water user groups were defined mostly by political boundaries, such as city
limits, rather than water utility service areas. Utility-based planning provides many benefits and allows
planning groups to plan for the entities responsible for maintaining infrastructure, planning for future
growth, and sponsoring the projects that are recommended in the plans. It also better aligns the
planning process in a more one-to-one manner with data the TWDB collects through Water Use
Surveys, Water Loss Audits, and Water Conservation Plans. Additionally, the rule changes that
accompanied this shift to utility-based planning lowered the threshold for how much water entities need
to provide to be classified as discrete water user groups, increasing the number of small communities
identified in the plans. More information on utility-based planning as the basis for the municipal water
demand projections can be found in Chapter 4.
The TWDB implemented several other significant process improvements during the fifth cycle of
planning. The TWDB launched the Texas Water Service Boundary Viewer
(www3.twdb.texas.gov/apps/waterserviceboundaries), an online mapping application to house the active
water service boundaries for all retail water suppliers in the state and serve as a hub for related water
utility information. The Viewer operates in conjunction with the TWDB’s annual Water Use Survey,
which allows utility managers to review and propose modifications to boundaries every year via a

DRAFT 2022 State Water Plan | Texas Water Development Board D-25
mapping platform. This results in more accurate estimates of per capita water use. The TWDB also
accelerated the development of the socioeconomic impact analyses prepared for the planning groups so
these analyses could be included in the draft plans and subject to greater public review. Based upon
results from the socioeconomic impacts analyses, the TWDB developed a drought management strategy
costing tool to assist planning groups in their strategy evaluations and decision making.
The TWDB also placed a greater emphasis on visualizing planning data and making it more accessible
throughout the planning process by
• launching an online planning data dashboard where users can compare population and water
demand projections from previous water plans and compare adopted projections to historical
water use estimates in each category;
• developing a regional data visualization map for the planning groups to reference as they
developed their plans. The dynamic map displayed water needs and surpluses to identify and
inform potential regionalization of projects;
• developing a data dashboard to facilitate understanding of the socioeconomic impact analyses
developed for the planning groups; and
• making available the interactive state water plan platform with draft regional plan data for
planning groups to utilize while reviewing their initially prepared (draft) plans and when
presenting at public hearings. This improved the transparency and understanding of plan content
during the public comment period of the initially prepared plans.
1.4 Advent of regional flood planning and the first state flood plan
Following the widespread devastation from flooding caused by Hurricane Harvey as well as other recent
tragic flood events around the state, the 86th Texas Legislature passed landmark legislation to address
the persistent threats of flooding in Texas. In addition to providing new funding mechanisms for flood
mitigation projects (the Flood Infrastructure Fund and the Texas Infrastructure Resiliency Fund), the
legislation mandated that the TWDB establish and administer a statewide flood planning process, with
the first state flood plan due to state leadership in 2024. The TWDB established 15 flood planning
regions, appointed initial members to each group, and held initial meetings of the planning groups in
October and November 2020. It is truly a testament to the success of regional water planning that the
legislature chose to emulate the process to address flood risks in Texas.
There are several fundamental differences between water supply planning and flood mitigation planning,
though, that necessitate a different focus of attention. Water supply planning is generally about
addressing long time periods of low water supplies that unfold somewhat slowly and have their greatest
impact on the economy, with potential risks to health and safety, whereas flood mitigation planning is
about coping with very intense rainfall events over short time periods that quickly take lives, destroy
public and private property, and disrupt the economy. In addition, flood planning groups are organized
by river basin, and the underlying science, data, and methodologies are very different between these
efforts. For instance, reservoir storage must be treated entirely differently. Reservoir storage for water
supply aims to keep sources as full as possible to provide water supply during times of drought, whereas
reservoir storage for flood control must be kept at lower levels in preparation for the next flood event.
Although water planning and flood planning are separate programs, there will be data sharing and
opportunities for collaboration, such as when flood mitigation projects can provide water supply
benefits.
1.5 Organization of the plan
The next chapter summarizes the TWDB’s policy recommendations to the Texas Legislature, and
Chapter 3 describes Texas droughts and provides drought response information and recommendations.

DRAFT 2022 State Water Plan | Texas Water Development Board D-26
Chapters 4 through 7 summarize the steps to develop the regional water plans, including the population
and water demand projections, existing water supply analysis, needs identification, and recommended
water management strategies and projects that are the fundamental building blocks of each state water
plan. Chapter 8 highlights conservation planning, programs, and implementation. Chapter 9 presents the
financing needs required to implement strategies and projects recommended in the 2022 State Water
Plan, based on surveys compiled by the regional water planning groups. Chapter 10 provides information
on the implementation of the 2017 State Water Plan, including projects funded through SWIFT as well
as a discussion of impediments to implementing projects.
Each regional water plan must be consistent with all laws, rules, and regulations applicable to water use
in the planning area. Appendix A provides additional information on water quality, drinking water,
interstate waters, how surface water and groundwater are managed in Texas, and a brief history of
water planning in Texas. Appendix B provides more detailed information on the processes of
determining surface water and groundwater availability in the regional water plans. It also presents
tabular reports summarizing annual water availability and annual existing supplies for surface water and
groundwater. Appendix C summarizes annual water needs by region and water use category, and
Appendix D presents information on regional socioeconomic impacts. As noted above, the adopted plan
includes the online interactive state water plan, and the plan is also supported by a webpage that
includes additional reference information and ancillary analyses.
References
Interregional Planning Council, 2020, Interregional Planning Council: Report to the Texas Water
Development Board, 252 p.,
http://www.twdb.texas.gov/waterplanning/rwp/ipc/docs/09302020mtg/IPC_FinalReport-Apps_091620.pdf
(NPR) National Public Radio, 2012, How one drought changed Texas agriculture forever,
www.npr.org/2012/07/07/155995881/how-one-drought-changed-texas-agriculture-forever#mainContent
State Board of Water Engineers, 1957, Texas floods, 126 p.,
http://www.twdb.texas.gov/publications/reports/historic_groundwater_reports/doc/M278.pdf

DRAFT 2022 State Water Plan | Texas Water Development Board D-27
2 Policy recommendations

DRAFT 2022 State Water Plan | Texas Water Development Board D-28
The state water plan, as formally adopted by the Board, serves as a guide to state water policy and
includes legislative recommendations and may include policy statements on various issues related to
water planning and implementation.
By statute, the Board must consider making recommendations that it believes are needed and desirable
to facilitate voluntary water transfers and to identify river and stream segments of unique ecological
value and sites of unique value for reservoir construction. No recommendation regarding voluntary
water transfers are included in this plan.
The TWDB based the recommendations for this plan largely on recommendations contained in the
2021 regional water plans.
Regional water planning groups made several regulatory, administrative, and legislative
recommendations5 in the adopted regional water plans to
• facilitate the orderly development, management, and conservation of water resources;
• facilitate preparation for and response to drought conditions so that sufficient water will be
available at a reasonable cost to ensure public health, safety, and welfare;
• further economic development; and
• protect the agricultural and natural resources of the state and regional water planning areas.
Along with general policy and statutory recommendations, planning groups also made recommendations
in the 2021 regional water plans for designating river and stream segments of unique ecological value
and unique sites for reservoir construction; however, the Texas Legislature is responsible for making the
official designations of these sites.
Planning groups may recommend designating all or parts of river and stream segments of unique
ecological value located within their planning areas. These recommendations are based upon several
criteria:
• biological function
• hydrologic function
• riparian conservation areas
• high water quality
• exceptional aquatic life
• high aesthetic value
• threatened or endangered species/unique communities
The recommendations include physical descriptions of the stream segments, maps, and other supporting
documentation. The planning groups coordinate each recommendation with the Texas Parks and
Wildlife Department and include, when available, the Department’s evaluation of the river or stream
segment in their final plans.
A planning group may also recommend a site as unique for reservoir construction based upon several
criteria:
• site-specific reservoir development is recommended as a specific water management strategy or
in an alternative long-term scenario in an adopted regional water plan
• location; hydrology; geology; topography; water availability; water quality; environmental,
cultural, and current development characteristics; or other pertinent factors make the site
uniquely suited for: (a) reservoir development to provide water supply for the current planning
period; or (b) to meet needs beyond the 50-year planning period
5 Available at www.twdb.texas.gov/waterplanning/rwp/plans/2021/index.asp

DRAFT 2022 State Water Plan | Texas Water Development Board D-29
Based on planning groups’ recommendations and other policy considerations, the TWDB makes the
following recommendations.
Legislative Recommendation 1: Unique stream segment designation
The legislature should designate the five river or stream segments of unique ecological value recommended by
the 2021 regional water plans (Alamito Creek, Black Cypress Bayou, Black Cypress Creek, Pecan Bayou, and
Terlingua Creek) for protection under Texas Water Code § 16.051(f).
Summary of the recommendation
Pursuant to Texas Water Code § 16.051(e) and § 16.053(e)(6), state and regional water plans shall
identify river and stream segments of unique ecological value that they recommend for protection. By
statute, this designation solely means that a state agency or political subdivision of the state may not
finance the construction of a reservoir in a specific river or stream segment that the legislature has
designated as having unique ecological value (§ 16.051(f)). It is up to the legislature to make such
designations.
The recommendation is for the following five stream segments:
• Alamito Creek in Presidio County solely within the boundary of the 1,061-acre Trans Pecos
Water Trust—approximately a 3.5-mile stream segment.
• Black Cypress Bayou in Marion and Cass counties from the confluence with Big Cypress
Bayou in south central Marion County upstream to the confluence of Black Cypress Creek east
of Avinger in southern Cass County.
• Black Cypress Creek in Cass and Morris counties from the confluence with Black Cypress
Bayou east of Avinger in southern Cass County upstream to its headwaters located 4 miles
northeast of Daingerfield in the eastern part of Morris County.
• Pecan Bayou in Red River County from 2 miles south of Woodland in northwestern Red
River County east to the Red River, approximately 1mile west of the eastern Bowie County
line.
• Terlingua Creek in Brewster County solely within the boundary of Big Bend National Park—
approximately a 5-mile stream segment. The reach of Terlingua Creek recommended as an
ecologically unique stream segment is only that portion of the creek located within Big Bend
National Park. This proposed unique segment is approximately 5 miles in length. Terlingua
Creek transects Big Bend National Park from the confluence with the Rio Grande to the Big
Bend National Park boundary located about 5 miles north of the river.
Senate Bill 3, passed by the 80th Texas Legislature, designated 19 stream segments recommended in the
2007 State Water Plan, and the 84th Texas Legislature designated an additional five segments from the
2012 State Water Plan with passage of House Bill 1016. Some of these designated stream segments
included multiple, separate reaches of the same stream (Figure 2-1).

DRAFT 2022 State Water Plan | Texas Water Development Board D-30
Figure 2-1. Unique stream segments previously designated by the Texas Legislature and
additional recommended segments
Legislative Recommendation 2: Unique reservoir site designation
The legislature should designate for protection under Texas Water Code § 16.051(g) three sites of unique value
for constructing reservoirs as recommended in the 2021 regional water plans: Coryell County Off-Channel
Reservoir, Millers Creek Off-Channel Reservoir, and Parkhouse II (North).
Summary of the recommendation
Pursuant to Texas Water Code § 16.051(e) and § 16.053(e)(6), the state and regional water plans shall
identify sites of unique value for reservoir construction. This authority also relates to the state’s general
interest in reservoir development as codified in the Texas Constitution:
“It is hereby declared to be the policy of the State of Texas to encourage the optimum
development of the limited number of feasible sites available for the construction or
enlargement of dams and reservoirs for conservation of the public waters of the state, which
waters are held in trust for the use and benefit of the public, and to encourage the optimum
regional development of systems built for the filtration, treatment, and transmission of water
and wastewater.” – Article 3, Section 49-d(a)
DRAFT 2022 State Water Plan | Texas Water Development Board D-31
Texas Water Code § 16.051(g) gives the legislature authority to designate a site of unique value for
constructing a reservoir. By statute, once a reservoir site is designated for protection, a state agency or
political subdivision of the state may not obtain a fee title or an easement that would significantly
prevent the construction of a reservoir. Without such designation, actions by state or local government
entities could compromise the viability of these sites for future reservoir development.
Not all regions of Texas have access to the same types of water resources or in similar proportion. For
many water users, development of reservoirs is an important means for providing large volumes of
renewable, affordable water supply. As evidenced in the 2021 regional water plans and this state water
plan, surface water resources, including the development of additional major reservoirs, will continue to
play an essential role in Texas’ water plans throughout and beyond the current planning horizon.
Approximately 37 percent of all recommended water management strategy supplies in 2070 are
associated with surface water, the majority of which is associated with existing and future reservoirs.
Meeting a significant share of Texas’ future water needs by developing the most promising reservoir
sites requires a stable, long-term commitment.
Designation of sites of unique value for reservoir construction by the Texas Legislature provides an
important measure of protection for these sites for future development. While the legislature’s
designation of unique sites does prevent some actions that could threaten the development of a
reservoir, it does not guarantee protection of the sites, for example, against federal actions.
Prior to the 80th Texas Legislature, three unique reservoir sites had been previously designated by the
legislature: the 76th Texas Legislature designated Allens Creek Reservoir with the passage of Senate Bill
1593; the 77th Texas Legislature designated Post Reservoir in 2001 with House Bill 3096; and the 78th
Texas Legislature designated Lake Columbia in 2003 with the passage of Senate Bill 1362 (Figure 2-2).
With the passage of Senate Bill 3 in 2007, the 80th Texas Legislature designated an additional 19
reservoir sites with a provision whereby the designations would expire on September 1, 2015, “unless
there is an affirmative vote by a proposed project sponsor to make expenditures necessary in order to
construct or file applications for permits required in connection with the construction of the reservoir
under federal or state law” (Texas Water Code § 16.051[g-1]). With the passage of House Bill 1042 in
2015, the 84th Texas Legislature re-designated the Lake Ringgold reservoir site as unique.

DRAFT 2022 State Water Plan | Texas Water Development Board D-32
Figure 2-2. Unique reservoir sites previously designated by the Texas Legislature
The Texas Legislature should consider designating the following three additional reservoir sites for
protection: Coryell County Off-Channel Reservoir, Millers Creek Off-Channel Reservoir, and Parkhouse
II (North) (Figure 2-3). These reservoir sites were recommended for designation in the 2021 regional
water plans and have never been previously designated by the legislature as having unique value for the
construction of reservoirs. Another site, Turkey Peak Reservoir, is recommended for designation in the
2021 Region G Regional Water Plan; however, it is not recommended in the 2022 State Water Plan
because the sponsor, Palo Pinto County Municipal Water District No. 1, requested that it not be
recommended for designation due to the project already being in the development stage.

DRAFT 2022 State Water Plan | Texas Water Development Board D-33
Figure 2-3. Reservoir sites recommended for designation as unique
DRAFT 2022 State Water Plan | Texas Water Development Board D-34
3 Drought and drought response
in Texas

DRAFT 2022 State Water Plan | Texas Water Development Board D-35
Quick facts
Though the drought of the 1950s remains the most significant statewide drought observed in Texas’ history, new
droughts of record have since been confirmed on sub-basin scales in six river basins.
Since the 2010‒2014 drought, during which 100 percent of the state was affected by drought for many weeks,
most of the state has experienced milder drought conditions:
• As of January 2021, the area of the state impacted by drought, had not risen above 84 percent
(National Drought Mitigation Center, 2020).
• On average, drought impacted approximately 20 percent of the area of the state, considerably less than
the average of 70 percent that occurred during the 2010–2014 drought (NDMC, 2020).
Texas has recorded periods of drought dating to the 1800s (TBWE, 1959), and persistent drought
conditions have driven the evolution of the state’s water laws and financial programs, as well as
conservation and drought management programs administered at local levels. Texas uses the 1950s
drought, known as the drought of record, as a fundamental benchmark for statewide water planning, with
the intention that preparing for severe drought conditions that have already occurred will help the state
better respond to future droughts. That said, more severe, regional, or basin-specific droughts of record
are also considered by regional water planning groups as updated hydrologic and water use information
is incorporated into both the relevant datasets and surface water availability models.
3.1 Measuring drought status and severity
Measuring drought is complex. Not only is it difficult to identify the beginning and end of a drought, the
impacts vary greatly by location and type. Droughts are described as meteorological, agricultural,
hydrologic, and socioeconomic6—all of which address the multitude of impacts. Likewise, severity is
assessed via multiple drought indices7, each based on different parameters. Hydrologic drought is the
focus of regional water planning since it impacts water supplies.
The U.S. Drought Monitor assesses weekly drought conditions and is commonly relied upon to
determine drought status in the state. Established in 1999, it is jointly produced by the National Oceanic
and Atmospheric Administration, the U.S. Department of Agriculture, and the National Drought
Mitigation Center. The U.S. Drought Monitor uses a composite index incorporating measurements of
climatic, hydrologic, and soil conditions, as well as reported impacts and observations from contributors
throughout the country.
3.2 Historical and potential new droughts of record
3.2.1 Historical droughts
History demonstrates that extended droughts are natural phenomena in Texas, often punctuated by
times of flood. The drought of the 1950s is the most significant drought recorded in Texas’ history
(dating back to 1895) in terms of geographic extent, duration, and intensity. As measured by the Palmer
6 During the 2011 drought, agricultural losses reached a record $7.62 billion, making 2011 the costliest drought
year in history (Fannin, 2012).
7 In addition to the U.S. Drought Monitor, other indices used by the Texas Drought Preparedness Council to
assess drought severity in Texas include the Crop Moisture Index, Keetch-Byram Drought Index, Palmer Drought
Severity Index, Reservoir Storage Index, Streamflow Index, and Standardized Precipitation Index (TDEM, 2016).

DRAFT 2022 State Water Plan | Texas Water Development Board D-36
Drought Severity Index, the drought of record lasted 77 months, from October 1950 to February 1957
(NOAA, 2020). Based on the same index, the 2010‒2014 drought ranks as the second worst and the
second-longest statewide drought, lasting 51 months, from August 2010 to October 2014.
3.2.2 Confirmed and potential new droughts of record
Occurring within the 2010–2014 drought, 2011 ranks as the worst one-year drought on record. A
record low measurement of the Palmer Drought Severity Index occurred in September 2011, having
followed the driest 12-month period of statewide precipitation on record. Conditions in that year were
so severe that they continued to be utilized in this state water plan as the representative “dry-year” for
the majority of the water demand projections discussed in Chapter 4.
Since 2014, above-normal moisture conditions have generally prevailed statewide, but drought disaster
declarations continue to be issued at a local scale. The Palmer Drought Severity Index has alternated
between extended periods of above-normal moisture and periods of drought. The highest index (wet
conditions) occurred in August 2016 and the lowest (dry conditions) in July 2018 (Figure 3-1). This
pattern represents the volatility in hydrologic conditions that should be anticipated and, most
importantly, prepared for. Such fluctuations between drought and flood stress communities, water
providers, and emergency responders in the near term (less than 10 years). Planning for the near-term
timescale will allow a measure of flexibility in how water supply sources are managed (for example,
variable flood pools in surface water reservoirs). Near-term planning could allow Texans to harness
some of the supply side benefits of excess water during periods of higher precipitation for use later in
drier times.

DRAFT 2022 State Water Plan | Texas Water Development Board D-37
Figure 3-1. Statewide average Palmer Drought Severity Index (NOAA, 2020)
* An index value of zero indicates normal conditions, while negative numbers indicate drought, and positive numbers indicate above
normal moisture.
While the statewide drought of the 1950s is considered the benchmark drought for state water
planning, regional droughts of record may occur by sub-basin or water source. For planning purposes, a
drought of record for an individual reservoir is generally determined by the water availability models
developed by the Texas Commission on Environmental Quality. These models are based on historical
naturalized flows—flows without human influence—for time periods, varying by river basin, between the
1930s or 1940s to the 1980s or 1990s for most of the models they maintain. Recent drought years such
as 2006, 2009, and 2011, therefore, are not included in the naturalized flow record of most water
availability models. However, House Bill 723 (86th Texas Legislature, 2019) provides for official updates
to the Brazos, Neches, Red, and Rio Grande water availability models by December 1, 2022. As these
models are updated to reflect recent hydrologic conditions, either officially by the Texas Commission on
Environmental Quality or via TWDB-approved hydrologic variances for the planning groups, potential
new droughts of record can be confirmed.
In the 2017 State Water Plan, several planning groups (Regions A, B, C, F, G, and K) identified potential
new droughts of record for some reservoirs or sub-basins that occurred after the historical period
covered by the water availability models. These and other new droughts of record in Regions L and N
have since been confirmed through updated modeling results for the following river basins and planning
regions:
• Canadian River Basin (Region A)
• Colorado River Basin (Regions F and K)

DRAFT 2022 State Water Plan | Texas Water Development Board D-38
• Nueces River Basin (Regions L and N)
• Red River Basin (Regions A and B)
• Sulphur River Basin (Region C)
• Upper portions of the Brazos River Basin (Region G)
In its 2021 Regional Water Plan, Region M reported a potential new drought of record for the Rio
Grande Basin. This potential new drought of record is based on the Palmer Drought Severity Index and
has not been confirmed through updated water availability modeling.
The 2017 State Water Plan also reported the 2011drought as a new drought of record for run-of-river
supplies in Regions A and F (with the exception of the Llano River), based on minimum annual
streamflow data. For the 2022 State Water Plan, Region G reported a new drought of record for run-
of-river supplies, based on cumulative and annual streamflow data and an evaluation of low- and zero-
flow months during periods of drought. These observations are supported by recent studies on future
trends and drought projections in the state by the Texas State Climatologist (Harwell and others, 2020;
Nielsen-Gammon and others, 2019 and 2020).
Regions A and F reported drought of record information for groundwater resources based on
assessments of annual precipitation and Palmer Drought Severity Index data. Both regions determined
that the 2011 drought was comparable to that of the 1950s based upon precipitation data, and the
1950s remains the drought of record for groundwater sources in Region F.
3.3 Drought planning and response
Drought planning and response in Texas is a multi-faceted realm. Planning and preparations occur at the
local level via drought contingency plans, required of utilities of a certain size; the regional level via
regional water plans; and the state level through the state water plan and the state emergency
management plan (which includes the state drought preparedness plan).
3.3.1. Statewide drought planning and response
Texas Water Code lays the foundation for the state’s drought response plan. It designates the chief of
the Texas Department of Emergency Management as the state drought manager, responsible for
managing and coordinating the drought response component of the state water plan. The chief is also
the designated chair of the Drought Preparedness Council, which is composed of at least 14
representatives from state entities as well as governor-appointed members. The information compiled in
the regional water plans and summarized in this chapter serves as the drought response component of
the state water plan.
Section 16.055 of the Texas Water Code assigns the Drought Preparedness Council the following
responsibilities:
• Assessing and reporting on drought monitoring and water supply conditions
• Advising the governor on significant drought conditions
• Recommending that specific provisions for state response to drought-related disasters be
included in the state emergency management plan and state water plan
• Advising regional water planning groups on drought-related issues in the regional water plans
• Ensuring effective coordination among state, local, and federal agencies in drought response
planning
• Reporting biennially to the Texas Legislature on significant drought conditions in the state
The TWDB, a member of the Drought Preparedness Council and the Emergency Drinking Water Task
Force, also chairs two Council sub-committees: 1) Drought Monitoring and Water Supply and 2)

DRAFT 2022 State Water Plan | Texas Water Development Board D-39
Drought Technical Assistance and Technology. In these roles, the TWDB provides a variety of
resources to assist Texans with drought response and preparedness:
• Interactive Drought Dashboard – provides weekly drought data and monthly rainfall and
temperature data at the county and Hydrologic Unit Code 08 watershed level on
waterdatafortexas.org/drought
• Weekly Water Conditions update – summarizes drought conditions across the state
• Drought Conditions report to the Drought Preparedness Council – monthly or quarterly
(depending on the intensity and extent of drought) updates
• Texas Water Conditions report – monthly report documenting storage in state reservoirs and
groundwater levels in aquifers
• Outreach – technical assistance, educational materials, and literature
The state also provides financial assistance with special consideration to entities experiencing drought.
The Texas Department of Agriculture administers disaster relief grants related to drought. To be
eligible, communities must have declared that their water supplies have less than 180 days left, in
addition to other program requirements. The TWDB funds urgent need projects through the Drinking
Water State Revolving Fund. These projects address unforeseen situations that require immediate
attention to protect public health and safety and may be eligible for loan forgiveness up to $500,000.
Urgent need situations include prolonged drought-related water supply reductions resulting in a loss of
supply within 180 days, catastrophic events resulting in a 20 percent loss in connections or water
provided, or other situations as established by the TWDB.
3.3.2 Regional drought planning and response
Regional water planning groups compile information about current drought planning and planned
response activities and develop recommendations for their respective regions. Recommendations may
include water management strategies for drought management, which are measures for temporarily
reducing water use during drought conditions.
All drought-related content is consolidated into a single chapter in each regional water plan and includes
• details on current drought response triggers,
• plans for water supplier responses to drought,
• identification of potential alternative sources of municipal supply for small entities with only a
single source of supply,
• development of region-specific model drought contingency plans, and
• recommendations to the Drought Preparedness Council.
New to these plans is a requirement to assess variations in drought response strategies within the
region that may impede drought response efforts overall.
Response to potential loss of supply for small entities
In accordance with planning rules, all planning groups evaluated potential emergency responses to local
drought conditions or loss of existing supply for two groups: 1) entities with a population of 7,500 or
less that rely on a sole source of water supply (for example, a single reservoir or aquifer) and 2) all
county-other (small, rural water systems) water user groups. The evaluation assumed that each entity
had only 180 days or less of supply remaining and alternative sources had to be found. This high-level
screening served as a guide for identifying potentially vulnerable water user groups and suitable
emergency response options.
The most common response options deemed feasible among the planning groups for providing
emergency supply include

DRAFT 2022 State Water Plan | Texas Water Development Board D-40
• trucked in water;
• local groundwater wells;
• existing or potential emergency interconnects;
• brackish groundwater development (limited treatment or desalination);
• releases from upstream reservoirs;
• curtailment of water rights, which may or may not be feasible; and
• voluntary redistributions from other entities, including irrigation users.
This exercise also provided an opportunity for planning groups to evaluate and update their drought
contingency plans. Some added triggers and responses to their plans, while others identified new or
potential water system interconnects.
Existing and potential emergency interconnects
Planning groups assessed water infrastructure facilities within the region to identify existing emergency
interconnects between water systems and potential new emergency interconnects. The number of
existing emergency connections and potential new emergency connections reported by planning groups
has increased since the previous state water plan. The 2021 regional water plans identified
approximately 1,060 existing emergency connections and 610 potential new emergency connections.
The 2016 regional water plans reported 570 existing emergency connections and 430 potential new
emergency connections. Detailed information on existing and potential emergency interconnects was
collected and submitted confidentially to the TWDB as required by statute and via review of publicly
available information from the Texas Commission on Environmental Quality.
Variations in drought response strategies that may impede drought response efforts
House Bill 807 (86th Texas Legislature, 2019) required planning groups to identify “unnecessary or
counterproductive variations in specific drought response strategies, including outdoor watering
restrictions, among user groups in the regional water planning area that may confuse the public or
otherwise impede drought response efforts.”
Six planning groups (Regions B, C, G, H, I, and M) identified that confusion among the public occurs as a
result of variation in water supply sources within the same region, requiring different drought responses
and timing. Additionally, variations in drought stage definitions, the variety of drought triggers in use, and
the variety of responses implemented across the region are contributing factors. Not only can these
factors create confusion among the public, they represent challenges to consider when crafting
solutions. Although local entities are best suited to develop responses tailored to manage local
conditions, they must ensure that awareness and coordination occur among water providers and that
corresponding communications match local drought contingency plans. Public outreach targeted at
educating customers on their source of water supply can be an important method for utilities in
preventing confusion.
Drought management recommendations by planning groups
Drought management strategies are temporary measures that reduce water use by restricting normal
economic or domestic activities, such as car washing and lawn watering. Planning groups, as in past
planning cycles, generally deferred to local water providers to implement drought management
strategies as part of local drought contingency plans. However, planning groups J, K, L, M, and P
recommended specific, quantified municipal drought management strategies:
• Region J – included demand reductions of 20 percent for specific wells within the Bandera
County-Other water user group
• Region K – included demand reductions ranging from 5 to 30 percent for most municipal water
user groups, regardless of needs. Reductions depend on a water user group’s gallons per capita

DRAFT 2022 State Water Plan | Texas Water Development Board D-41
per day consumption, drought contingency plan triggers, and presence of severe water
restrictions during 2011
• Region L – included a water management strategy whereby all municipal water user groups with
identified water needs in 2020 reduce the equivalent of their 2020 demands by 5 percent during
drought. The San Antonio Water System requested a demand reduction strategy with varying
demand reductions from 2020 to 2070
• Region M – included demand reductions of 5 percent for all municipal water user groups with
water needs
• Region P – included varying demand reductions for all municipal water user groups in the region,
even though no water needs exist for these entities. Reductions were based on drought
contingency plan triggers and responses and the frequency at which a trigger might be reached
During a drought of record, these collective recommended demand management strategies could
temporarily reduce water use by approximately 87,000 acre-feet per year in 2020 and 158,000 acre-feet
per year in 2070 (see Chapter 7).
In some cases, drought management was recommended only as a near-term, stop-gap strategy to be
displaced in later planning decades by projects that actually provide additional water supply to avoid
drought restrictions on water use. Planning groups did not, in general, consider it prudent, sustainable,
reliable, and/or economically feasible to adopt a regional plan that would intentionally require
restrictions on normal economic and domestic activities, especially when there were feasible
alternatives. Most planning groups chose to leave aside the potential volume of water savings from
drought management measures as a back-up or last resort response to address uncertainty, such as in
the event of a drought worse than the benchmark drought of record (BBC Research & Consulting,
2009).
The effectiveness and sustainability of drought measures vary between utilities and sometimes were not
considered predictable or reliable enough to quantify for inclusion as a recommended water
management strategy. The TWDB has evaluated reported water use for systems under restrictions and
noted that results were variable due to the lack of consistent reporting, which made it difficult to
determine the duration of the water restriction and its resulting impact to water use. The TWDB will
continue this annual analysis and provide it to the planning groups for their consideration in future
regional plan development.
Region-specific model drought contingency plans
As recommended by the Drought Preparedness Council, most planning groups developed region-
specific model drought contingency plans for all water use categories that account for more than 10
percent of water demands in any decade over the 50-year planning horizon. These include wholesale
water providers, retail public water suppliers, municipal providers, irrigation users, manufacturing users,
and steam-electric water users. Most of these contingency plans are based upon model plans provided
by the Texas Commission on Environmental Quality, modified to specific regional conditions. These
plans address requirements including drought stages, triggers and responses, conservation, and
emergency response stages. They are intended to assist water users seeking guidance in developing plans
with meaningful, applicable triggers and responses for water sources within the region. In some
instances, regions did not prepare such plans and provided the following reasoning:
• Drought conditions vary significantly across the region, and a region-specific model drought
contingency plan cannot provide recommended actions that are applicable across the planning
area.
• The water user group in question is a private industry and not subject to enforcement by the
Texas Commission on Environmental Quality.

DRAFT 2022 State Water Plan | Texas Water Development Board D-42
3.3.3 Local drought planning and response
Drought contingency plans are implemented at the local level and focus on potential issues related to
retail distribution system capacity rather than the total supply volume to which the entity has access.
The plans contain triggers, which are typically based on supply or demand levels to initiate and terminate
each stage, and responses associated with the triggers. They also include descriptions of drought
indicators and notification and enforcement procedures. Within five days of implementing any
mandatory drought contingency measures, wholesale and retail public water suppliers must notify the
Texas Commission on Environmental Quality.
If a state of disaster proclamation is issued due to drought conditions, counties included in the disaster
proclamation must provide general notice, including to the chair of each planning group in which the
county is located and to each entity in the county required to develop a water conservation plan or
drought contingency plan. After receiving such notice, the entities are required to implement their
water conservation and drought contingency plans. Additionally, retail public utilities and entities from
which those utilities obtain wholesale water service are required to report to the Texas Commission on
Environmental Quality when they are reasonably certain their water supply will be available for less than
180 days.
3.4 Regional drought recommendations
To support the development and implementation of meaningful drought contingency plans and drought
management strategies, various planning groups developed the following drought recommendations:
• Regularly monitor state and local drought conditions through the TWDB, Texas Commission on
Environmental Quality, Drought Preparedness Council, or the U.S. Drought Monitor.
• Actively maintain or monitor infrastructure to minimize catastrophic failures.
• Regularly review and update management strategies and drought contingency plans.
• Effectively coordinate with wholesale providers and communicate with customers, especially
during times of decreased supply.
• Develop uniformly consistent drought stage definitions among users of the same source of
water.
Various planning groups made general recommendations regarding implementation of drought
contingency plans, coordination among local providers during drought, and protection of supply for
municipal users. Planning groups also made recommendations to the Drought Preparedness Council
• to increase coordination with local providers regarding drought conditions and potential
implementation of drought stages, particularly during times of limited precipitation;
• to provide the Council’s recommendations to planning groups early in the planning process; and
• to attend planning group meetings in future planning cycles.
3.5 Uncertainty of drought
Warmer temperatures, increased evaporation, and increasingly variable precipitation, as experienced in
recent years, enhance the risk of extreme drought in Texas (Nielsen-Gammon and others, 2019). Tree
ring records extending back to 1500 indicate the occurrence of droughts longer and more severe than
the benchmark drought of record presently used in planning (Cleaveland and others, 2011). Given this
context, it is clear that climate will remain a notable factor affecting the availability and reliability of the
state’s water resources.
Although the state’s planning process does not prevent regions from planning for conditions worse than
the drought of record, there is no established state framework by which to do so. Scenario planning has

DRAFT 2022 State Water Plan | Texas Water Development Board D-43
been suggested in the literature (Banner and others, 2010; Nielsen-Gammon and others, 2020), and the
Interregional Planning Council, established by House Bill 807 (86th Texas Legislature, 2019), developed
recommendations for the TWDB to consider regarding potential enhancements to the regional and
state planning framework. One of those suggestions is to conduct additional, high-level planning for a
drought event that is worse than the drought of record. However, implementing a formal change to
how the TWDB considers drought risks will likely require additional financial resources and
development of a coherent and accepted approach.
Certain planning groups address drought uncertainty within the existing planning framework by utilizing
conservative water source yields or a management supply factor to assess project needs. Some of the
larger water providers across the state have conducted scenario planning for their individual long-range
plans, but smaller entities do not have the resources or technical expertise to develop similar analyses
for managing their systems. The TWDB anticipates that further research and ongoing stakeholder input
during the next planning cycle will inform future enhancements to the regional and state planning
process, which, for now, will remain benchmarked to a recurrence of the 1950s drought of record.
Meanwhile, the TWDB continues to develop datasets, analytical tools, and information to monitor and
prepare for future drought conditions and impacts to water resources. These include the following:
• Improving and expanding estimates of reservoir evaporation monitoring (currently available
through (waterdatafortexas.org/lake-evaporation-rainfall)
• Monitoring soil moisture through the TexMesonet network (www.Texmesonet.org)
• Assessing temperature effects on reservoir evaporation
• Exploring the application of forecast-informed reservoir operations
(www.twdb.texas.gov/publications/reports/other_reports/doc/TWDB_UTA_NIDIS_forecasts_
workshop_report.pdf)
• Providing May‒July rainfall forecasts (waterdatafortexas.org/drought/rainfall-forecasts) to inform
the implementation of drought contingency triggers in surface water reservoirs
• Providing drought monitoring data products such as fine resolution (4 km x 4 km) drought
indices (such as the Keetch-Byram Drought Index, QuickDRI, Standardized Precipitation Index,
and Palmer Drought Severity Index)
• Providing fine resolution (4 km x 4 km) monthly rainfall anomalies and historical data from 1981
to the present aggregated by counties and Hydrologic Unit Code (HUC) 08 watersheds and
monthly streamflow condition data by HUC08 watersheds.
The TWDB has also begun exploring ways to quantify the drought risk to water supplies that already
exist. Regardless of long-term change in hydrologic or climatological trends, the natural variation in
rainfall under current conditions is enough to create more severe drought events than anticipated. The
TWDB seeks to better understand this fact and create tools for assessing the reliability of reservoir
yields currently used to plan for existing and future water supplies.
The 2010–2014 drought, which became the new, worst drought of record for several parts of the state,
demonstrated the need for water planning efforts to better account for the potential magnitude,
likelihood, and impact of droughts more severe than the current drought of record. The known but
unquantified uncertainty associated with hydrologic variability and persistence should be considered in
the water planning process. The TWDB is actively exploring ways to better prepare the state to
respond to the next drought, including identifying both the likelihood and associated severity of
potential future supply shortages.

DRAFT 2022 State Water Plan | Texas Water Development Board D-44
References
Banner, J.L, Jackson, C.S, Yang, Z.L., Hayhoe, K., Woodhouse, C.A., Gulden, L.E., et al, 2010, Climate
change impacts on Texas water—A white paper assessment of the past, present and future and
recommendations for action: Texas Water Journal, v. 1, no. 1, p 1–19.
BBC Research & Consulting, 2009, Drought management in the Texas regional and state water planning
process: Prepared for the Texas Water Development Board, 96 p.
http://www.twdb.texas.gov/publications/reports/contracted_reports/doc/0804830819_DroughtMgmt.pdf
Cleaveland, M.K., Votteler, T.H., Stahle, D.K., Casteel, R.C., and Banner, J.L., 2011, Extended chronology
of drought in south central, southeastern and west Texas: Texas Water Journal, v. 2, no. 1, p 54–96.
Fannin, B., 2012, Updated 2011 Texas agricultural drought losses total $7.62 billion, Texas AgriLife
Extension Service Economist, https://agrilifetoday.tamu.edu/2012/03/21/updated-2011-texas-agricultural-
drought-losses-total-7-62-billion/, accessed October 2020.
Harwell, G.R., McDowell, J., Gunn-Rosas, C., and Garrett, B., 2020, Precipitation, temperature,
groundwater-level elevation, streamflow, and potential flood storage trends within the Brazos,
Colorado, Big Cypress, Guadalupe, Neches, Sulphur, and Trinity River basins in Texas through 2017:
U.S. Geological Survey, Scientific Investigations Report 2019-5137, 110 p.
NDMC (National Drought Mitigation Center), 2020, U.S. Drought Monitor,
https://droughtmonitor.unl.edu/, accessed December 2020.
NOAA (National Oceanic and Atmospheric Administration), 2020, Climate at a glance–Global mapping,
https://www.ncdc.noaa.gov/cag/, accessed December 2020.
Nielsen-Gammon, J.W., Escobedo, J., Ott, C., Dedrick, J., and Van Fleet, A., 2019, Assessment of historic
and future trends of extreme weather in Texas, 1900–2036: Texas A&M University, 39 p.
Nielsen-Gammon, J.W., Banner, J.L, Cook, B.I., Tremaine, D.M., Wong, C.I., Mace, R.E., Gao, H., Yang,
Z.L., Gonzalez, M.F., Hoffpauir, R., Gooch, T., and Kloesel, K., 2020. Unprecedented drought challenges
for Texas water resources in a changing climate—What do researchers and stakeholders need to know:
Earth’s Future, v. 8, p. 1–20.
TBWE (Texas Board of Water Engineers), 1959, A study of droughts in Texas, Bulletin 5914, 76 p.
TDEM (Texas Division of Emergency Management), 2016, Drought annex: State of Texas emergency
management plan, p. 8–12.

DRAFT 2022 State Water Plan | Texas Water Development Board D-45
4 Future population and water
demand

DRAFT 2022 State Water Plan | Texas Water Development Board D-46
Quick facts
Texas’ population is projected to increase by more than 70 percent during the planning horizon, from 29.7
million in 2020 to nearly 51.5 million in 2070.
Over 60 percent of all the statewide population growth between 2020 and 2070 is projected to occur within
Regions C, H, and L.
Statewide water demand is projected to increase by approximately 9 percent, from 17.7 million acre-feet per
year in 2020 to 19.2 million acre-feet per year in 2070. This is a smaller magnitude increase as compared to
the 2017 State Water Plan primarily due to revised methodologies for the irrigation, manufacturing, and steam-
electric power generation sectors of water use.
Irrigation is the largest water demand category in each planning decade through 2050, but municipal demand is
projected to surpass irrigation demand by 2060.
Population and water demand projections by region, county, and water user group can be explored through the
dashboard at www.twdb.texas.gov/waterplanning/data/dashboard/index.asp.
The first major milestone in the five-year regional water planning process is the development of
population and water demand projections to determine how much water will be needed during a repeat
of drought of record conditions over the 50-year planning horizon. Developing the most likely set of
projections for a long-term plan is challenging and is accomplished through a collaborative process based
on best available data and designed to develop consensus between state agencies, regional water
planning groups, and local stakeholders.
The TWDB developed and distributed draft population and water demand projections using statewide,
uniform methodologies for all 16 regional water planning groups. The Texas Commission on
Environmental Quality, the Texas Department of Agriculture, the Texas Parks and Wildlife Department,
representatives from the planning groups, and members of the public then helped determine the final
projections by providing local data and information. This often involves determining the most likely
locations where anticipated populations will reside geographically rather than adjusting the anticipated
population growth within an entire planning region. The TWDB established water demand projections
for municipal water users as well as five non-municipal water demand categories: irrigation, livestock,
manufacturing, mining, and steam-electric power. This chapter delves into each of these categories,
summarizing methodologies and analyzing the major trends and current outlook for water demands
across the state.
4.1 Population projections
Texas has the second largest population in the United States and has gained more residents than any
other state since 2000 (U.S. Census Bureau, 2011), as its booming economy and metropolitan areas
continue to draw more people from across the country and around the world. Indeed, Texas has
experienced robust population growth since it joined the United States, with growth outpacing the
national average in each decade since the 1850s (Murdock and Cline, 2018). This trend is expected to
continue, with Texas’ population projected to increase by more than 70 percent during the planning
horizon, from 29.7 million in 2020 to more than 51.5 million in 2070 (Figure 4-1).

DRAFT 2022 State Water Plan | Texas Water Development Board D-47
Figure 4-1. Historical and projected population growth in Texas (1850–2070)
According to 2018 U.S. Census Bureau population estimates, Texas has four of the top 10 counties in
the country with the largest annual numeric growth since 2010: Bexar, Dallas, Harris, and Tarrant. At
the same time, Texas has 96 rural counties that experienced negative population growth between 2010
and 2018 (Figure 4-2).

DRAFT 2022 State Water Plan | Texas Water Development Board D-48
Figure 4-2. Historical population change by county (2010–2018)
While Texas is projected to remain one of the fastest growing states in the nation, not all regions will
experience this growth equally (Table 4-1). Growth is projected to be concentrated around the state’s
major metropolitan areas, especially Austin, Dallas-Fort Worth, Houston, San Antonio, and the Rio
Grande Valley. Regions C and H (which include the Dallas-Fort Worth metropolitan area and Houston,
respectively) are projected to capture more than 50 percent of the state’s growth over the next 50
years (Figure 4-3). Significant growth is not projected to occur in many rural areas of the state, reflecting
the increasingly urban character of Texas and the nation. Even in West Texas, most population growth
is projected to occur within regional urban hubs, such as Amarillo, Lubbock, Midland, and Odessa.
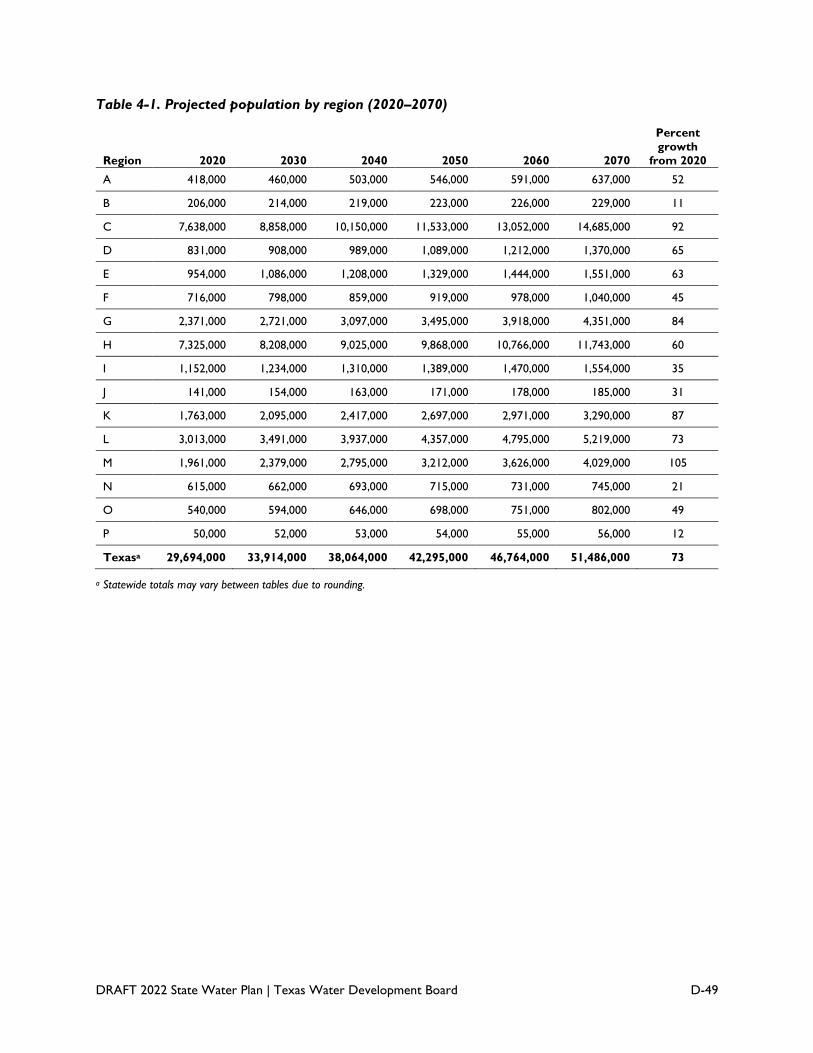
DRAFT 2022 State Water Plan | Texas Water Development Board D-49
Table 4-1. Projected population by region (2020–2070)
Region 2020 2030 2040 2050 2060 2070
Percent
growth
from 2020
A 418,000 460,000 503,000 546,000 591,000 637,000 52
B 206,000 214,000 219,000 223,000 226,000 229,000 11
C 7,638,000 8,858,000 10,150,000 11,533,000 13,052,000 14,685,000 92
D 831,000 908,000 989,000 1,089,000 1,212,000 1,370,000 65
E 954,000 1,086,000 1,208,000 1,329,000 1,444,000 1,551,000 63
F 716,000 798,000 859,000 919,000 978,000 1,040,000 45
G 2,371,000 2,721,000 3,097,000 3,495,000 3,918,000 4,351,000 84
H 7,325,000 8,208,000 9,025,000 9,868,000 10,766,000 11,743,000 60
I 1,152,000 1,234,000 1,310,000 1,389,000 1,470,000 1,554,000 35
J 141,000 154,000 163,000 171,000 178,000 185,000 31
K 1,763,000 2,095,000 2,417,000 2,697,000 2,971,000 3,290,000 87
L 3,013,000 3,491,000 3,937,000 4,357,000 4,795,000 5,219,000 73
M 1,961,000 2,379,000 2,795,000 3,212,000 3,626,000 4,029,000 105
N 615,000 662,000 693,000 715,000 731,000 745,000 21
O 540,000 594,000 646,000 698,000 751,000 802,000 49
P 50,000 52,000 53,000 54,000 55,000 56,000 12
Texasa 29,694,000 33,914,000 38,064,000 42,295,000 46,764,000 51,486,000 73
a Statewide totals may vary between tables due to rounding.

DRAFT 2022 State Water Plan | Texas Water Development Board D-50
Figure 4-3. Projected population growth by region (2020–2070)
At a county level, 29 Texas counties are projected to double or more in population between 2020 and
2070 (Figure 4-4). These highest-growth counties are predominantly suburban areas surrounding the
state’s major metropolitan areas. On the other end of the spectrum, 22 predominantly rural counties
around the state are projected to experience zero population growth across the planning horizon.

DRAFT 2022 State Water Plan | Texas Water Development Board D-51
Figure 4-4. Projected population growth (2020–2070)
In addition to its highly variable climate, Texas’ sustained population growth is a fundamental reason
why the state has been at the forefront of long-range water supply planning since the 1960s.
Additional growth over the planning horizon will put increasing pressure on existing water
supplies, as there will simply be many more Texans needing water, even alongside the significant
advances in municipal conservation in recent years. This plan projects population growth from
2020 to 2070 for nearly 1,900 municipal water user groups across Texas’ 254 counties. The
next section provides detailed information on the methodology for determining population
projections for this planning cycle.
4.1.1 Population projections methodology
Developing population projections involved two steps: first, projecting population at the county level
and, then, projecting population at the municipal water user group level, including water utilities and
rural areas. The state demographer at the Texas Demographic Center (Texas State Demographer,

DRAFT 2022 State Water Plan | Texas Water Development Board D-52
2014) developed population projections for counties by using a standard demographic methodology
known as a cohort-component model. This procedure uses separate cohorts (combinations of age,
gender, and racial-ethnic groups) and components of cohort change (birth, survival, and migration rates)
to estimate future populations by county. These provided the TWDB with initial, 30-year projections by
county. The TWDB then extrapolated the 30-year projections to the state water plan’s 50-year planning
horizon and distributed them beyond the county level to individual water user groups. Because there
was no new decennial census data available for use during this planning cycle, population projections
from the 2017 State Water Plan were carried forward and used as the starting point for the county-level
draft projections for this 2022 State Water Plan.
Of the three components of cohort change, the migration rate, which calculates how many people move
in and out of counties, is the most critical assumption. While birth and survival rates tend to closely
follow historical trends, the state of the economy heavily influences migration rates, reflecting
movement that results from economic opportunity. Other unforeseen events, such as catastrophic
weather, can also influence migration. Although the Coronavirus Disease 2019 (COVID-19) pandemic
occurred late in this planning cycle, the TWDB reviewed available, related population data and
determined that, as of this drafting, there is not likely a significant enough impact or sufficient data to
make any meaningful changes to these long-term population or water demand projections. If there are
any resulting population shifts or anticipated persistent shifts in water demands resulting from human or
economic impacts from the pandemic, these will be reflected in the population projections developed
for the next planning cycle.
During the previous cycle of regional water planning and development of the 2017 State Water Plan, the
TWDB and the planning groups together evaluated three sets of projections to determine the most
appropriate migration patterns to utilize in each region:
• Zero migration
• One-half of the migration rates from 2000 to 2010
• 2000–2010 migration rates
The one-half migration scenario was used for most counties, based on historical precedence and the
state demographer’s recommendations for long-range projections. Alternative migration scenarios other
than one-half were used for 39 counties where 1) a comparison of the 2012 State Water Plan
projections, the actual 2010 Census population, and the Texas Demographic Center’s half-migration
scenario 2020–2050 population projections indicated the half-migration scenario growth rates were
under-projected, and 2) recent population estimates showed that a county has been continuing to grow
at a much higher rate than that from 2000 to 2010.
4.1.2 Utility-based planning
Prior to this state water plan, regional and state water planning data were organized largely around
political boundaries, such as city limits, rather than by water providers. One of the major process
improvements of this planning cycle has been the transition to utility-based planning (away from political
boundaries), which redefines municipal water user groups based on water utility service boundaries.
Utility-based planning delivers a more transparent and efficient planning process by planning directly for
the entities in charge of providing water to Texans now and in the future. It also allows for better one-
to-one continuity of data and responsibilities regarding water demand, water supply, implementation of
water management strategies, and water project sponsors in the water plans. This provides a more
direct, “cradle-to-grave” alignment of strategies and projects from the planning process to financing and
implementation through the TWDB’s state and federal financial assistance programs.
Additionally, at the request of the water planning community, the TWDB reduced the volumetric
threshold required to designate individual water user groups from 280 acre-feet per year to 100 acre-
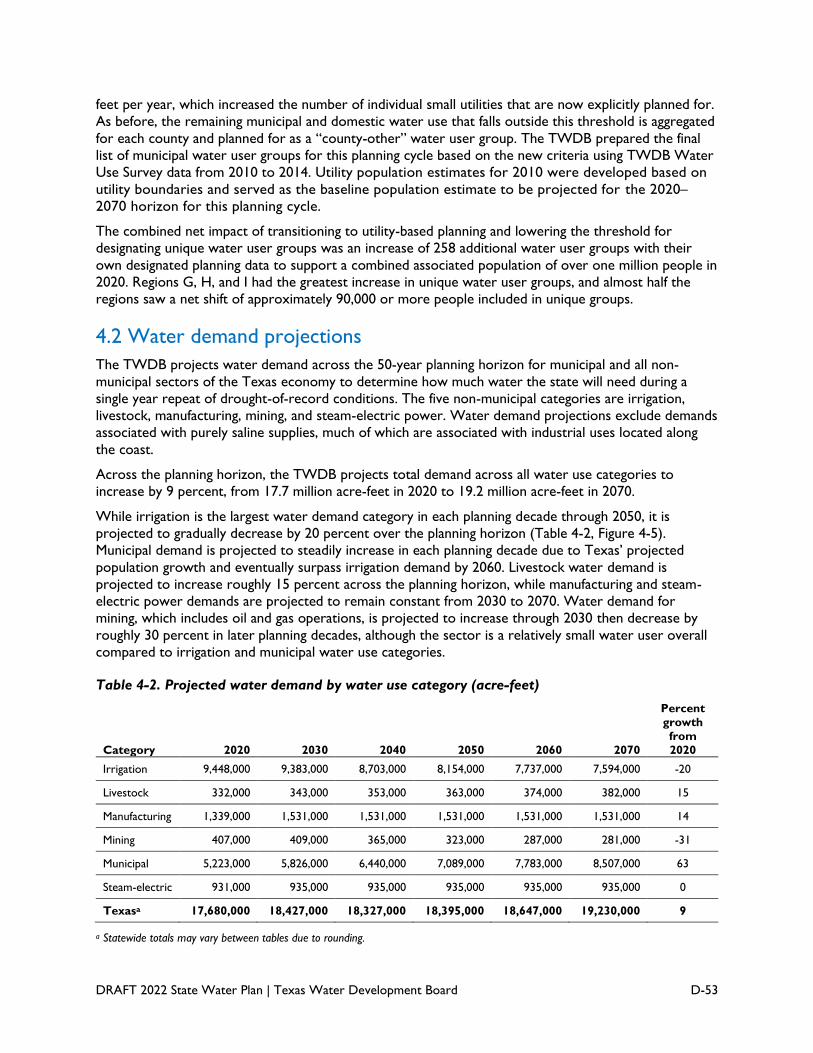
DRAFT 2022 State Water Plan | Texas Water Development Board D-53
feet per year, which increased the number of individual small utilities that are now explicitly planned for.
As before, the remaining municipal and domestic water use that falls outside this threshold is aggregated
for each county and planned for as a “county-other” water user group. The TWDB prepared the final
list of municipal water user groups for this planning cycle based on the new criteria using TWDB Water
Use Survey data from 2010 to 2014. Utility population estimates for 2010 were developed based on
utility boundaries and served as the baseline population estimate to be projected for the 2020–
2070 horizon for this planning cycle.
The combined net impact of transitioning to utility-based planning and lowering the threshold for
designating unique water user groups was an increase of 258 additional water user groups with their
own designated planning data to support a combined associated population of over one million people in
2020. Regions G, H, and I had the greatest increase in unique water user groups, and almost half the
regions saw a net shift of approximately 90,000 or more people included in unique groups.
4.2 Water demand projections
The TWDB projects water demand across the 50-year planning horizon for municipal and all non-
municipal sectors of the Texas economy to determine how much water the state will need during a
single year repeat of drought-of-record conditions. The five non-municipal categories are irrigation,
livestock, manufacturing, mining, and steam-electric power. Water demand projections exclude demands
associated with purely saline supplies, much of which are associated with industrial uses located along
the coast.
Across the planning horizon, the TWDB projects total demand across all water use categories to
increase by 9 percent, from 17.7 million acre-feet in 2020 to 19.2 million acre-feet in 2070.
While irrigation is the largest water demand category in each planning decade through 2050, it is
projected to gradually decrease by 20 percent over the planning horizon (Table 4-2, Figure 4-5).
Municipal demand is projected to steadily increase in each planning decade due to Texas’ projected
population growth and eventually surpass irrigation demand by 2060. Livestock water demand is
projected to increase roughly 15 percent across the planning horizon, while manufacturing and steam-
electric power demands are projected to remain constant from 2030 to 2070. Water demand for
mining, which includes oil and gas operations, is projected to increase through 2030 then decrease by
roughly 30 percent in later planning decades, although the sector is a relatively small water user overall
compared to irrigation and municipal water use categories.
Table 4-2. Projected water demand by water use category (acre-feet)
Category 2020 2030 2040 2050 2060 2070
Percent
growth
from
2020
Irrigation 9,448,000 9,383,000 8,703,000 8,154,000 7,737,000 7,594,000 -20
Livestock 332,000 343,000 353,000 363,000 374,000 382,000 15
Manufacturing 1,339,000 1,531,000 1,531,000 1,531,000 1,531,000 1,531,000 14
Mining 407,000 409,000 365,000 323,000 287,000 281,000 -31
Municipal 5,223,000 5,826,000 6,440,000 7,089,000 7,783,000 8,507,000 63
Steam-electric 931,000 935,000 935,000 935,000 935,000 935,000 0
Texasa 17,680,000 18,427,000 18,327,000 18,395,000 18,647,000 19,230,000 9
a Statewide totals may vary between tables due to rounding.

DRAFT 2022 State Water Plan | Texas Water Development Board D-54
Figure 4-5. Projected annual water demand by water use category (acre-feet)
* Water use categories are presented in the order listed in the legend.
4.2.1 Projected water demand by region
As with population projections, total water demand projections vary significantly by regional water
planning area (Table 4-3 and Figure 4-6). Water demand in Region C is projected to increase by 67
percent over the planning period, by far the most of any planning area, largely driven by the increase in
municipal water demands due to projected population growth in the area. Significant water demand
increases are also projected for Regions G, H, and L, where water demand is projected to increase by
more than 25 percent between 2020 and 2070, also largely driven by projected population growth.
Regions A and O in the Texas Panhandle are the only planning areas projected to show significant
declines in total water demand due to anticipated long-term groundwater drawdowns associated with
irrigated agriculture between 2020 and 2070.

DRAFT 2022 State Water Plan | Texas Water Development Board D-55
Table 4-3. Projected annual water demand by region (acre-feet)
Region 2020 2030 2040 2050 2060 2070
Percent
growth
from 2020
A 2,131,000 2,138,000 1,995,000 1,789,000 1,586,000 1,598,000 -25
B 156,000 156,000 155,000 154,000 154,000 155,000 -1
C 1,734,000 1,937,000 2,152,000 2,391,000 2,641,000 2,899,000 67
D 401,000 415,000 425,000 438,000 456,000 479,000 19
E 480,000 498,000 513,000 528,000 544,000 560,000 17
F 765,000 780,000 770,000 755,000 745,000 744,000 -3
G 1,121,000 1,178,000 1,220,000 1,279,000 1,350,000 1,422,000 27
H 2,337,000 2,561,000 2,675,000 2,796,000 2,931,000 3,077,000 32
I 738,000 793,000 799,000 811,000 826,000 840,000 14
J 37,000 39,000 40,000 41,000 42,000 43,000 16
K 1,117,000 1,163,000 1,204,000 1,237,000 1,265,000 1,308,000 17
L 1,051,000 1,115,000 1,164,000 1,211,000 1,264,000 1,320,000 26
M 1,784,000 1,797,000 1,809,000 1,822,000 1,837,000 1,853,000 4
N 253,000 270,000 273,000 273,000 275,000 276,000 9
O 3,368,000 3,382,000 2,928,000 2,663,000 2,527,000 2,453,000 -27
P 206,000 206,000 205,000 205,000 204,000 204,000 -1
Texasa 17,679,000 18,428,000 18,327,000 18,393,000 18,647,000 19,231,000 9
a Statewide totals may vary between tables due to rounding.
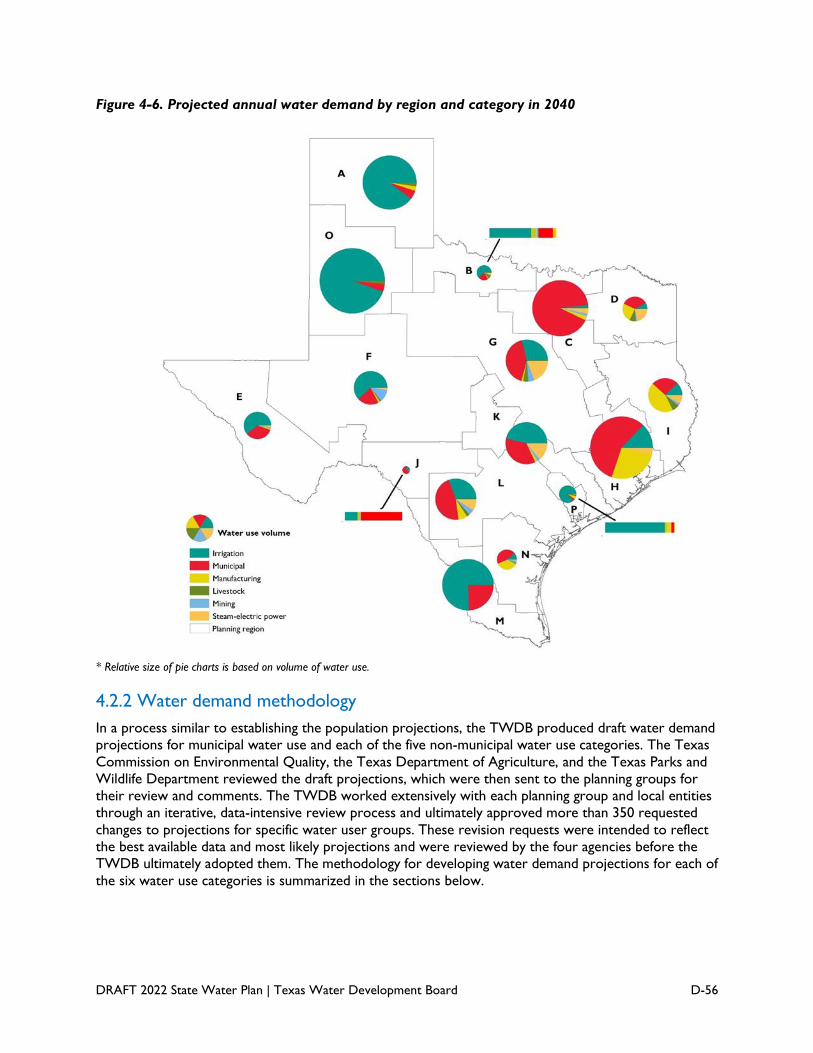
DRAFT 2022 State Water Plan | Texas Water Development Board D-56
Figure 4-6. Projected annual water demand by region and category in 2040
* Relative size of pie charts is based on volume of water use.
4.2.2 Water demand methodology
In a process similar to establishing the population projections, the TWDB produced draft water demand
projections for municipal water use and each of the five non-municipal water use categories. The Texas
Commission on Environmental Quality, the Texas Department of Agriculture, and the Texas Parks and
Wildlife Department reviewed the draft projections, which were then sent to the planning groups for
their review and comments. The TWDB worked extensively with each planning group and local entities
through an iterative, data-intensive review process and ultimately approved more than 350 requested
changes to projections for specific water user groups. These revision requests were intended to reflect
the best available data and most likely projections and were reviewed by the four agencies before the
TWDB ultimately adopted them. The methodology for developing water demand projections for each of
the six water use categories is summarized in the sections below.

DRAFT 2022 State Water Plan | Texas Water Development Board D-57
4.2.3 Irrigation water demand
Irrigation water demand includes water used for irrigated field crops, vineyards, orchards, and self-
supplied golf courses. The baseline methodology for irrigation water demand projections was to average
the most recent five years (2010–2014) of water use estimates and then hold this value constant
between 2020 and 2070. However, in certain counties, the total groundwater availability over the
planning period was projected to be less than the groundwater portion of the baseline water demand
projections. Where this occurs, the demand projections decline in later decades roughly commensurate
with the groundwater availability but at a delayed rate to recognize the fact that water demands will
likely remain higher than water availability even as they both predictably decline. This projection
methodology was supported by a study (CDM Smith, 2016) funded by the TWDB. The goal of the study
was to find the best projection method for this sector that the TWDB can update regularly and which
transparently and more directly considers foreseeable declines in water availability than previous
methods. The planning groups reviewed and provided input on drafts of both this new methodology and
the resulting projections. This approach to groundwater-constrained areas was utilized in 36 counties.
Overall irrigation demand is projected to decline as a result of more efficient irrigation systems, reduced
groundwater supplies, the economic difficulty of pumping water from increasingly greater depths, and
the transfer of water rights from agricultural to municipal uses, in addition to limited available
groundwater. In total, irrigation accounts for 53 percent of Texas’ water demand in 2020, declining to
39 percent of demand by 2070. Regions A, M, and O account for over 60 percent of statewide irrigation
water demand in 2070 (Figure 4-7).
Figure 4-7. Projected annual irrigation water demand by region in 2020 and 2070 (acre-feet)
4.2.4 Livestock water demand
Livestock water demand includes water used in the production of various types of livestock, including
cattle (beef and dairy), poultry, hogs, horses, sheep, and goats. The 2020 water demand projections for
each county were based on the average of the most recent five years (2010–2014) of water use
estimates. Water use estimates were calculated by applying a water use coefficient for each livestock
category to county-level inventory estimates from the Texas Agricultural Statistics Service. The rate of
change for projections in each planning area was carried forward from the 2017 State Water Plan and
applied to the new baseline estimate. Livestock accounts for roughly 2 percent of Texas’ total water

DRAFT 2022 State Water Plan | Texas Water Development Board D-58
demand across the planning horizon. Livestock water demand occurs throughout Texas but is highest in
Regions A, G, I, and O, due in part to the concentration of confined animal feeding operations in these
areas.
4.2.5 Municipal water demand
Municipal water demand includes water used by a variety of consumers in Texas communities, ranging
from single and multi-family residences to nonresidential establishments (commercial, institutional, and
light industrial). Residential, nonresidential, and even many commercial consumers use water for similar
purposes, such as drinking, cooking, sanitation, cooling, and landscape watering. Water-intensive
industrial customers, such as large manufacturing plants, steam-electric power generation facilities, and
mining operations, are not included in municipal water demand, despite their presence within
municipalities. Instead they are included in their associated non-municipal demand categories.
To project total annual municipal water demand, the TWDB multiplied the populations for each
municipal water user group by the associated projected per capita water use (also referred to as gallons
per capita daily or GPCD) during a historical dry year. The per capita water use was based on annual
Water Use Survey data for each water user group. Per capita water use values exclude sales to other
retail water utilities and large manufacturing, mining, or steam-electric power generating customers that
are captured elsewhere to avoid double counting. For most municipal water user groups, the 2011 per
capita dry-year water use was used in estimating demand because of the severity of the 2011 drought.
Based on local circumstances, some water user groups used per capita use during drought conditions in
a year other than 2011 when that was more representative of dry-year conditions. Counterintuitively,
the dry-year water use usually reflects the highest per capita water use.
In all regions, the municipal water demand projections incorporated certain anticipated future water
savings from the installation of more efficient toilets, shower heads, dishwashers, and clothes washers
that are already required by state and federal laws determining water use efficiency in fixtures and
appliances. These savings are projected to be 297,000 acre-feet per year in 2020, increasing to 889,000
acre-feet per year in 2070. Water savings due to existing legal requirements are embedded in the
municipal water demand projections because they can be expected to occur and should require no
additional action on the part of cities and water utilities.
Planning groups estimated and incorporated additional future water savings from municipal conservation
programs as recommended water management strategies in the regional plans to be implemented by
water providers (see Chapter 7). These strategy volumes represent voluntary water conservation
savings that would not otherwise occur if not for additional, proactive actions and investments by water
providers and customers.
Regions C, G, H, K, L, and M account for over 80 percent of statewide municipal demand in 2070
(Figure 4-8).

DRAFT 2022 State Water Plan | Texas Water Development Board D-59
Figure 4-8. Projected annual municipal demand by region in 2020 and 2070 (acre-feet)
4.2.6 Manufacturing water demand
Manufacturing water demand consists of the water necessary for large facilities, including those that
process chemicals, oil and gas, food, paper, and other materials. The 2020 water demand projections for
each county were based on the highest county-aggregated manufacturing water use in the most recent
five years of survey data between 2010 and 2014. Then the most recent 10-year projections for
employment growth from the Texas Workforce Commission was used as a proxy for projected growth
in each manufacturing sector between 2020 and 2030. In cases where employment was projected to
decrease for a specific sector, the water demand projections were held constant for that sector. After
2030, the manufacturing water demand was held constant through 2070.
This projection methodology was supported by a study (CDM Smith, 2016) funded by the TWDB. The
goal of the study was to find the best projection method for this sector that the TWDB can update
regularly. It was also partially influenced by the fact that, historically, the TWDB has seen the
manufacturing sector continue to become more efficient in its water use while increasing its economic
output. This resulted in the most significant relative change (reduction) in water demand projections and
intentionally reflects the encouraging fact that declining water use can be experienced even in the midst
of increasing economic production (Hoffman, 2016).
Overall, manufacturing accounts for approximately 8 percent of Texas’ water demand across the
planning horizon. The majority of Texas manufacturing occurs along the Gulf Coast, with Regions H and
I accounting for nearly 70 percent of all manufacturing demand in 2070 (Figure 4-9).

DRAFT 2022 State Water Plan | Texas Water Development Board D-60
Figure 4-9. Projected annual manufacturing demand by region in 2020 and 2070 (acre-feet)
4.2.7 Mining water demand
Mining water demand consists of water used in exploring, developing, and extracting oil, gas, coal,
aggregates, and other minerals. Initial draft mining water demand projections were carried forward from
the 2017 State Water Plan and were based upon two TWDB-contracted studies with the University of
Texas at Austin’s Bureau of Economic Geology (BEG, 2011, 2012). The TWDB estimated and projected
historical mining water use across the planning horizon using data collected from trade organizations,
government agencies, and other industry representatives. Mining demand is projected to increase
through 2030 and then decline in later planning decades based on the oil and gas industry outlook. More
than half of all mining water demand in Texas is projected to occur in Regions F, G, and L in 2030.
Region F requested to increase mining demands due to recent increases in non-conventional oil and gas
activities in the Permian Basin, which is predominately located in that region. Across the planning
horizon, mining accounts for roughly 2 percent of total water demand statewide.
4.2.8 Steam-electric power water demand
Steam-electric water demand consists of water used for the purpose of generating power. A generation
facility typically diverts surface water, uses it for cooling purposes, and then returns a large portion to a
body of water. Landfill gas, wood waste biomass, and battery power plants, as well as any power
generating facilities using renewable energy sources, were not included in the water demand projections.
Water demand projections for 2020 were based on the highest county-aggregated historical steam-
electric power water use in the most recent five years of survey data (2010–2014). The anticipated
water use for future power generation facilities listed in state and federal reports was added to the
demand projections from the anticipated operation date through 2070, while projected water demands
from facilities scheduled for retirement were subtracted. Subsequent demand projections after 2020
were held constant throughout the planning period to reflect increasing trends in using renewable
energy and more water-efficient technology.
Based on data reported to the U.S. Energy Information Administration (EIA, 2018), more than 60
percent of all capacity of proposed electricity generators in Texas will come from renewable sources,
mainly wind and solar, which use far less water than conventional fossil fuel sources to generate power.

DRAFT 2022 State Water Plan | Texas Water Development Board D-61
This projection methodology was based on a study (CDM Smith, 2016) funded by the TWDB. The
study’s goal was to find the best projection method for this sector that the TWDB can update regularly
and that better reflects overall, historic patterns of water demand in this sector.
Steam-electric power accounts for roughly 5 percent of Texas’ total water demand across the planning
horizon. Regions G and K (occupying the Brazos and Lower Colorado basins) account for over 40
percent of statewide steam-electric power water demand.
4.3 Comparison to the 2017 State Water Plan
Overall, population projections in the new plan increased by less than one percent within each planning
decade largely due to adjustments requested by five planning groups and based on more recent
population estimates from the U.S. Census Bureau. The most significant changes occurred in Region C,
which expects more than 330,000 additional residents by 2070 than were included in the previous plan.
These are rather small changes in the big picture: where the 2017 plan projected 51 million Texans by
2070, the new plan projects that there will be 51.5 million.
Total water demand projections across all six categories decreased considerably this planning cycle,
primarily due to methodological revisions grounded in reported historical use. Statewide, this plan
projects water demand to be about 727,000 acre-feet per year lower in 2020 (a 4 percent decrease) and
more than 2.3 million acre-feet per year lower by 2070 (an 11 percent decrease), (Figure 4-10). This can
be attributed mainly to significant declines in long-range projections for manufacturing and steam-electric
power water demand due to revisions to TWDB methodologies in these categories. Substantial
decreases in irrigation demand projections in some regions were mostly offset by increases in other
regions. Mirroring the small increases to population projections, total municipal water demand increased
in the new plan by less than one percent in each planning decade.
Figure 4-10. Comparison of water demand projections between 2017 and 2022 state water plans
(millions of acre-feet)
* Historical water use and projected demand can be further explored through TWDB’s state water plan comparison tool
www.twdb.texas.gov/waterplanning/data/dashboard/index.asp

DRAFT 2022 State Water Plan | Texas Water Development Board D-62
4.4 Uncertainty of population and water demands
The population and water demand projections used to develop the regional and state water plans are
re-evaluated each five-year planning cycle because they are products of many complex and dynamic real-
world forces and data-driven calculations. The baseline for population projections is adjusted every
other planning cycle when new decadal data from the U.S. Census Bureau is released. In each planning
cycle, the TWDB relies on input from the planning groups to adjust draft projections based on local data
and information from a diverse range of stakeholders, including the U.S. Census Bureau and the state
demographer. Many of the underlying factors that influence water use are difficult to accurately predict,
especially at the micro level and over the long term, resulting in the inherent uncertainty of water
demand projections. The uncertainty of these types of projections tends to decline as you increase their
geographic extent by aggregating more entities, whereas uncertainty increases as you focus more locally
on smaller numbers. In other words, there is a high level of confidence in the approximate total number
of Texans to expect by 2070 even if the individual zip codes are unpredictable.
For example, a wide range of factors can influence the long-range outlook for municipal and non-
municipal water demand through 2070. Population growth and distribution depend on economic and
social factors including individual preferences. Municipal water demand depends on population growth
and distribution and how much water residents are using. Per capita water use depends on individual
preferences, culture and habits, the weather, local conservation ordinances, and the adoption of more
water-efficient appliances.
Irrigation and livestock demands are strongly influenced by the economy and the weather. Historically,
irrigation has been the category of greatest water use in Texas. Irrigation demand is contingent upon
many variables such as the number of acres of each crop, the water needs of each crop type, and the
weather. Economic factors also contribute to irrigation demand, including prices of agricultural
commodities and agricultural production inputs like fuel and fertilizer. Complex government policies
such as farm subsidies and disaster assistance can also be influential. The TWDB is currently working
toward developing remote sensing expertise and capabilities through collaborative efforts with the
OpenET project team to assist in better refining irrigation water use estimates and projected demands
for future state water plans.
Manufacturing, mining, and steam-electric power demands are influenced by numerous economic factors
such as price levels of their inputs and outputs, the resources needed for production, technology, and
markets, as well as government regulation. Because most industrial processes are energy intensive, the
prices of energy sources such as gasoline, natural gas, coal, and renewable sources are also of particular
importance.
Rather than attempting to predict this complex array of future economic conditions and government
policies and trying to translate those often contradictory factors into water demand projections, the
TWDB grounds its projections in the reported data of its historic annual water use estimates and strives
to adhere to relatively straightforward, highly credible, and fully transparent projection methodologies
that can be revisited each five-year cycle. This allows each state water plan to be adaptive to changes
and incorporate the most recent and best available information.

DRAFT 2022 State Water Plan | Texas Water Development Board D-63
References
BEG (Bureau of Economic Geology), 2011, Current and projected water use in the Texas mining and oil
and gas industry: Prepared for the Texas Water Development Board, 381 p.,
www.twdb.texas.gov/publications/reports/contracted_reports/doc/0904830939_MiningWaterUse.pdf
BEG (Bureau of Economic Geology), 2012, Oil and gas water use in Texas—Update to the 2011 mining
water use report: Prepared for the Texas Water Development Board, 117 p.,
www.twdb.texas.gov/publications/reports/contracted_reports/doc/0904830939_2012Update_MiningWa
terUse.pdf
CDM Smith, 2016, Evaluation of water demand projection methodologies & options for agency
consideration: Prepared for the Texas Water Development Board, 57 p.,
www.twdb.texas.gov/publications/reports/contracted_reports/doc/1600011921_CDM.pdf
EIA (Energy Information Administration), 2018, Monthly electric generator inventory data,
www.eia.gov/electricity/data/eia860M/
Hoffman, H.W., 2016, Manufacturing and electric power water use in Texas, 17 p.,
savetexaswater.org/resources/doc/Hoffman_Manufacturing_2016.pdf
Murdock, Steve, and Cline, Mike, 2018, Texas population: still growing and becoming increasingly
diverse, in Texas almanac, www.texasalmanac.com/topics/population/texas-population-still-growing
Texas State Demographer, 2014, The Office of the State Demographer and the Texas State Data
Center, Projections of the population of Texas and counties in Texas by age, sex and race/ethnicity for
2010–2050, 33 p.
U.S. Census Bureau, 2011, Population distribution and change—2000 to 2010: 2010 Census Briefs,
www.census.gov/prod/cen2010/briefs/c2010br-01.pdf
U.S. Census Bureau, 2018, Population and housing unit estimates, www.census.gov/programs-
surveys/popest.html
DRAFT 2022 State Water Plan | Texas Water Development Board D-64
5 Water availability and existing
supplies

DRAFT 2022 State Water Plan | Texas Water Development Board D-65
Quick facts
Total surface water availability is approximately 3 percent higher in both 2020 and 2070 than in the 2017
State Water Plan, primarily due to new systems operations and surface water availability model updates.
However, total surface water availability declines by 3 percent over the planning horizon.
Total groundwater availability is approximately 1.9 million acre-feet, or 15 percent, higher in 2020 and 857,000
acre-feet, or 9 percent, higher in 2070 than in the 2017 State Water Plan, primarily due to changes in
groundwater management policy. However, total groundwater availability declines by 25 percent over the
planning horizon.
The existing water supplies—water already being provided in a drought from sources including surface water,
groundwater, and reuse—are expected to decline approximately 18 percent between 2020 and 2070.
In 2020, more than one-third of irrigation and livestock water supplies is from the Ogallala/Edwards-Trinity (High
Plains) Aquifer, while more than one-fifth of all non-agricultural-related water supply in Texas is from the Trinity
River Basin.
The state water plan is mandated to prepare for and respond to drought conditions. Essential to this
process is estimating how much water Texans will have to meet their water demands during drought
conditions, without over-allocating any water sources. To do that, the planning groups must determine
how much total water is available and how much of that is already in use.
5.1 Evaluating water resources for planning
During development of the regional plans, each water planning group must identify all water sources
within their planning area and their associated annual availability volumes. Water availability refers to the
maximum volume of raw water that can be withdrawn annually from each source (such as a reservoir or
aquifer) during a repeat of the drought of record. Availability does not account for whether the supply is
connected to or legally authorized for use. Availability is analyzed from the perspective of the water
source and answers the question: How much water from this source could be delivered to water users during
a repeat of the drought of record, as either existing water supply or as part of a future water management
strategy? Determining water availability is the first step in assessing potential water supply volumes
(Figure 5-1).
Next, planning groups quantify the subset of that total water availability volume that is already
connected to water user groups. This subset is defined as the existing supply. Existing water supplies are
determined by legal access to the water as well as existing infrastructure (such as pipelines and
treatment plant capacity) to treat and deliver the water to the “doorstep” of a water user group.
Existing supply is analyzed from the perspective of water users and answers the question: How much
water supply could each water user group already rely on should there be a repeat of the drought of record?
For example, the firm yield of a surface water reservoir may be 100,000 acre-feet per year. Of that
available 100,000 acre-feet, the current pipeline to that source only conveys 60,000 acre-feet per year to
users; 60,000 acre-feet is the existing supply. There remains an additional 40,000 acre-feet per year of
available water that can serve as the basis for a future water management strategy.
As another example, there may be within a county a modeled available groundwater volume of 50,000
acre-feet per year, but because current permits and pumping facilities are only able to pump 20,000
acre-feet per year for existing supplies, there remains 30,000 acre-feet per year in available groundwater
that can support a future water management strategy.
Because existing supplies are a subset of the availability of water sources, existing supplies cannot
exceed availability without the risk of running short of water in a drought of record. If existing supplies

DRAFT 2022 State Water Plan | Texas Water Development Board D-66
exceed availability it is an over-allocation. To ensure that planning groups do not assign more water
supply to a water source than the source can provide in a drought, the TWDB performs a detailed,
statewide accounting of all assigned existing water supply volumes and notifies planning groups of over-
allocations. Planning groups then adjust their plans accordingly.
Figure 5-1. Water availability as relates to existing supply
5.2 Surface water availability within river basins
Surface water supplies in Texas come from Texas’ 15 major river basins and 8 coastal basins via 187
major reservoirs and numerous river diversions, known as run-of-river supplies (Figure 5-2). Surface
water availability is determined using the Texas Commission on Environmental Quality’s surface water
availability models (WAMs), which estimate the monthly and annual water volumes that can be diverted
each year in drought of record conditions, all of which assume a repeat of the historic hydrologic
record. The default model for planning purposes, known as WAM Run 3, conservatively assumes that all
existing water rights are fully used without returning any flows to the river, unless a permit requires
such returns, and is adjusted to consider the impacts due to sedimentation on reservoir yields.
However, planning groups are allowed and encouraged to modify the default model to reflect
appropriate conditions not included in WAM Run 3 when evaluating existing water supplies for planning
purposes.
Justifiable modifications to the water availability models, which are expected to better reflect conditions
encountered during a drought, include correcting known model errors; reflecting increased
sedimentation or current river system operations; updating reservoir inflows to reflect recent drought
conditions, including return flows; or utilizing a reservoir safe yield instead of firm yield. Safe yield is a
reduced annual water volume that continues to be available from a reservoir for periods longer than a
drought of record, which may provide a buffer against uncertainty for water supply purposes.
All regional water planning groups requested and received approval to modify their surface water
availability analysis for the purpose of evaluating existing water supplies. Select modifications utilized in
the development of the surface water availability models are summarized in Appendix B. Of note is that
House Bill 723, enacted by the 86th Texas Legislature (2019), directed the Texas Commission on
Environmental Quality to update the Brazos, Neches, Red, and Rio Grande water availability models by
December 1, 2022. These updated models will be available and utilized in the next state water plan.

DRAFT 2022 State Water Plan | Texas Water Development Board D-67
Figure 5-2. Major river and coastal basins and major surface water supply reservoir locations
Surface water availability for future water management strategies (Chapter 7) was evaluated using WAM
Run 3 unless an alternative model produced more conservative yields or the water management strategy
itself was based on departing from the default model parameters. For example, if a senior water right is
to be “subordinated” to a junior water right to increase the reliability of the junior water right, the
alternative model would be used.
Overall surface water availability in Texas, represented as the sum of all reservoir firm yields, approved
safe yields, and run-of-river availabilities as determined by the planning groups, is anticipated to decline
by approximately 3 percent from 2020 to 2070 (Figure 5-3). The decline is primarily due to
sedimentation, which reduces reservoir storage. Other factors not presently accounted for in the
methodology for assessing surface water availability, but which may impact it, include changes over time
to reservoir inflows and evaporative loss from reservoirs. More than half of the annual statewide surface
water availability of 12.7 million acre-feet in 2020 occurs within the Trinity, Neches, and Sabine river
basins (Figure 5-4, Appendix B).
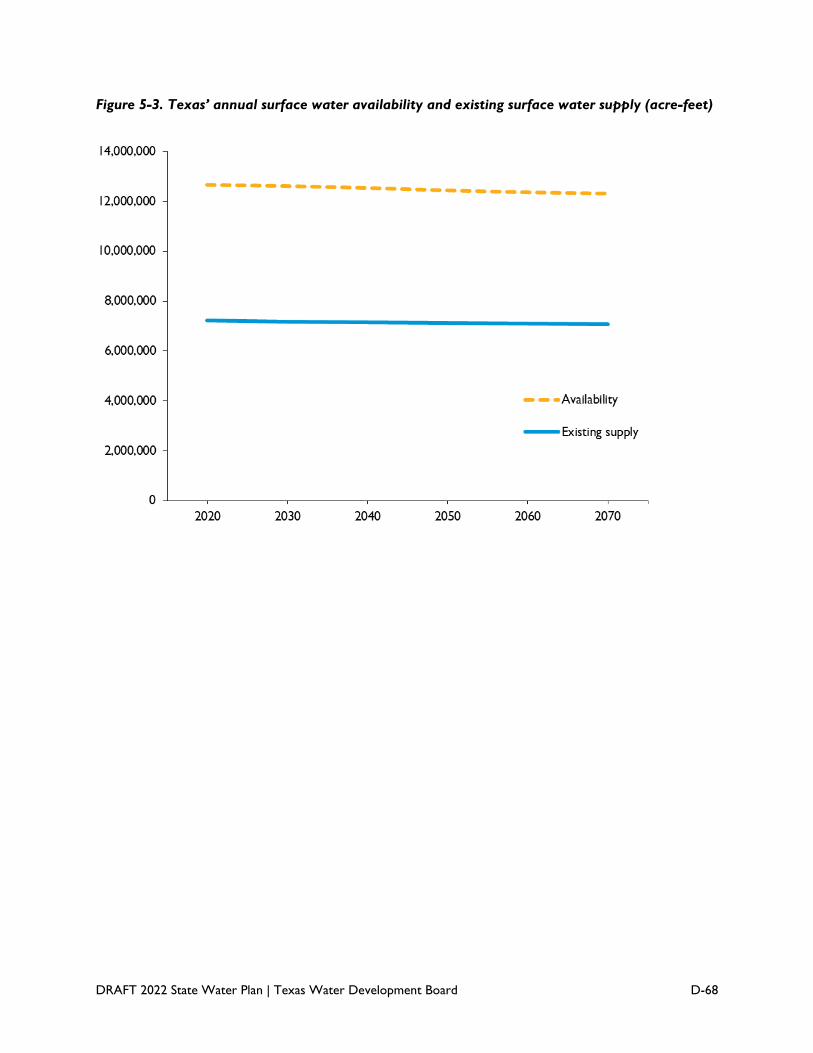
DRAFT 2022 State Water Plan | Texas Water Development Board D-68
Figure 5-3. Texas’ annual surface water availability and existing surface water supply (acre-feet)

DRAFT 2022 State Water Plan | Texas Water Development Board D-69
Figure 5-4. Annual surface water availability and existing surface water supplies by river and
coastal basin in 2020 (acre-feet)
5.3 Future surface water availability
Surface water availability may actually be increased by implementing certain types of water management
strategies. By capturing and storing streamflows, for example, the construction of a new reservoir can
increase the reliable volume of permitted water available for annual diversion. However, future surface
water availability may also be limited to address environmental needs, such as environmental flow
standards placed on permits and reflected in water availability modeling.
In cases where no environmental flow standards were adopted by the Texas Commission on
Environmental Quality, planning groups were required to model diversions based on the Consensus
Criteria for Environmental Flow Needs developed through a stakeholder process by the TWDB, the
Texas Parks and Wildlife Department, and the Texas Commission on Environmental Quality.
Alternatively, planning groups may utilize more detailed site-specific studies when available. Many
recommended water management strategies remain subject to permitting requirements administered by
the Texas Commission on Environmental Quality, regardless of the approach taken to estimate project
yields or to consider environmental flow needs during the planning process.
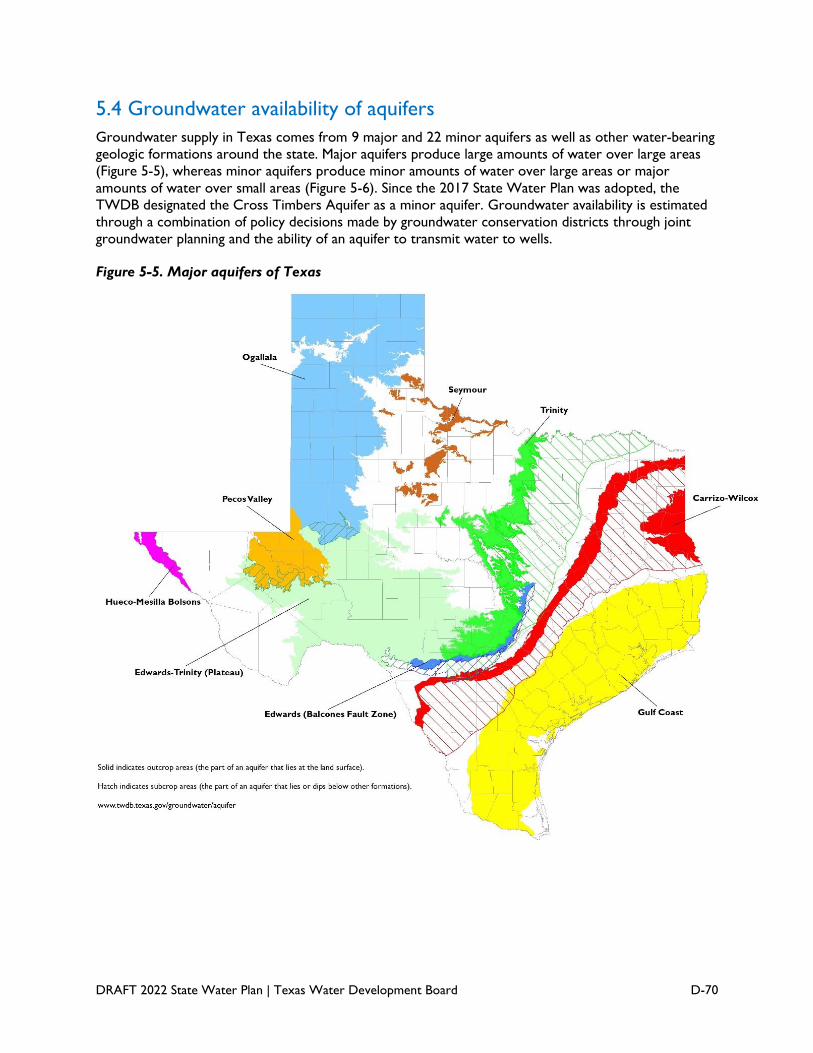
DRAFT 2022 State Water Plan | Texas Water Development Board D-70
5.4 Groundwater availability of aquifers
Groundwater supply in Texas comes from 9 major and 22 minor aquifers as well as other water-bearing
geologic formations around the state. Major aquifers produce large amounts of water over large areas
(Figure 5-5), whereas minor aquifers produce minor amounts of water over large areas or major
amounts of water over small areas (Figure 5-6). Since the 2017 State Water Plan was adopted, the
TWDB designated the Cross Timbers Aquifer as a minor aquifer. Groundwater availability is estimated
through a combination of policy decisions made by groundwater conservation districts through joint
groundwater planning and the ability of an aquifer to transmit water to wells.
Figure 5-5. Major aquifers of Texas

DRAFT 2022 State Water Plan | Texas Water Development Board D-71
Figure 5-6. Minor aquifers of Texas
Groundwater is governed by the rule of capture, which may be modified where groundwater
conservation districts and subsidence districts exist (Figure 5-7). Districts may issue permits that
regulate pumping of groundwater and spacing of wells within their jurisdictions. Groundwater
conservation districts within the state’s groundwater management areas work together to determine
groundwater management policies (desired future conditions of relevant aquifers) within that area.
These policies inform the groundwater availability utilized in the state’s water planning process.
Desired future conditions are the desired, quantified conditions of groundwater resources (such as
water levels, water quality, spring flows, or storage volumes) at one or more specified future times. The
desired future conditions are defined by participating groundwater conservation districts within a
groundwater management area as part of the joint planning process. The TWDB uses desired future
conditions to determine a modeled available groundwater value for an aquifer or part of an aquifer in
the groundwater management area. A modeled available groundwater value is the volume of
groundwater production, on an average annual basis, that will achieve a desired future condition. These
values are independent of existing pumping permits and may, depending on the aquifer characteristics
and how the desired future conditions are defined, include a variety of water quality types, including

DRAFT 2022 State Water Plan | Texas Water Development Board D-72
brackish groundwater. Depending on the aquifer and location, the amount of brackish groundwater in
modeled available groundwater values may require local and regional supply evaluations.
Figure 5-7. Locations of groundwater conservation districts or subsidence districts and 16
groundwater management areas
Modeled available groundwater volumes account for most of the groundwater availability considered in
this plan. In response to concerns that most of these volumes were developed using groundwater
availability models calibrated for long-term average conditions rather than drought of record, the
TWDB revised its planning rules after the 2017 State Water Plan to allow for use of a modeled
available groundwater peak factor.
A peak factor allows regional water planning groups to develop plans, where appropriate, that reflect
more realistic groundwater availability in drought conditions. The modeled available groundwater peak
factor accommodates short-term pumping above the modeled available groundwater value as long as it
can be shown that the desired future conditions will still be met. It can accommodate anticipated
fluctuations in pumping between wet and dry periods or account for other shifts in the timing of
DRAFT 2022 State Water Plan | Texas Water Development Board D-73
pumping while remaining consistent with desired future conditions. This approach reflects additional
potential groundwater that could be available for pumping over limited periods of time in drought and is
utilized for regional water planning purposes only—not permitting. The peak factor is not intended as a
limit to permits or as guaranteed approval or pre-approval of any future permit application.
Subject to many variables, some examples of when the modeled available groundwater peak factor might
be considered, while still achieving the desired future conditions, are the following:
• Actual pumping in wetter years is expected to fall below the modeled available groundwater,
thereby allowing intermittent pumping of volumes greater than the modeled available
groundwater during drought.
• Groundwater pumping in early decades is expected to consistently remain well below the
modeled available groundwater, thereby accommodating pumping volumes somewhat higher
than the modeled available groundwater in later decades.
The use of modeled available groundwater peak factors requires review and approval by relevant
groundwater conservation districts, groundwater management areas, regional water planning groups,
and the TWDB executive administrator. The peak factor is optional for planning groups, and two
planning groups (Regions G and H) utilized the approach in this round of planning.
For aquifers and portions of aquifers that did not have modeled available groundwater values, planning
groups determined availability in consultation with the TWDB. An exception to this is Texas Water
Code Section 16.053(e)(2-a) that allows a regional water planning group to define all groundwater
availability within its region as long as there are no groundwater conservation districts within the
regional water planning area. This was added through Senate Bill 1101 from the 84th Legislative Session,
and this is the first state water plan in which this provision applies. It is only applicable to the Northeast
Texas Regional Planning Group, or Region D. The groundwater availability values estimated by Region D
were reviewed by the TWDB to ensure physical compatibility with desired future conditions in
groundwater conservation districts within co-located groundwater management areas.
The TWDB has been charged by the legislature to identify and designate brackish groundwater
production zones in the state for certain aquifers by December 1, 2032. The TWDB’s Brackish
Resources Aquifer Characterization System, or BRACS, program has completed 12 studies and has four
ongoing studies. As of publication of the 2022 State Water Plan, the TWDB has designated a total of 31
brackish groundwater production zones in the following aquifers: Carrizo-Wilcox, Gulf Coast, Rustler,
Blossom, Nacatoch, and Northern Trinity Aquifers. Since the last state water plan, there has been a net
increase in the 2020 brackish groundwater availability of approximately 138,000 acre-feet per year and
approximately 182,000 acre-feet per year in 2070. The BRACS program continues to study the aquifers
of the state, which will enable the identification of additional possible brackish groundwater sources for
planning purposes.
On a statewide basis, total groundwater availability is projected to decline by approximately 25 percent
from 2020 to 2070 (Figure 5-8). This decrease is primarily due to reductions in groundwater availability
in the Ogallala/Edwards-Trinity (High Plains), Ogallala/Rita Blanca, and Ogallala aquifers and revised
desired future conditions since the 2017 State Water Plan (Appendix B).

DRAFT 2022 State Water Plan | Texas Water Development Board D-74
Figure 5-8. Texas’ annual groundwater availability and existing groundwater supplies (acre-feet)
Annual statewide groundwater availability in 2020 is estimated to be 14.2 million acre-feet. Just over half
of that comes from the Ogallala/Edwards-Trinity (High Plains), Ogallala, and Gulf Coast aquifers (Figures
5-9 and 5-10, Appendix B).
Figure 5-9. Annual groundwater availability greater than 50,000 acre-feet and existing
groundwater supplies by aquifer in 2020 (acre-feet)
* The Ogallala/Edwards-Trinity (High Plains); Ogallala/Rita Blanca; Edwards-Trinity (Plateau)/Pecos Valley/Trinity; and the Edwards-Trinity
(Plateau)/Pecos Valley are aquifer combinations that reflect specific groundwater management policy decisions based on aquifer
properties. In these cases, the modeled available groundwater and existing supply values have likewise been developed to honor these
aquifer combinations.

DRAFT 2022 State Water Plan | Texas Water Development Board D-75
Figure 5-10. Annual groundwater availability less than 50,000 acre-feet and existing groundwater
supplies by aquifer in 2020 (acre-feet)
5.5 Future groundwater availability
For planning purposes, future groundwater availability cannot be increased by implementing water
management strategies other than aquifer recharge-type projects. These are different from aquifer
storage and recovery projects, which generally provide underground storage of water from another
source and are not a mechanism to actually increase an aquifer’s groundwater availability. Changes in
groundwater availability between state water plans is largely attributed to changes in groundwater
management policies as revised through the state’s groundwater joint planning process. Additionally,
updates or revisions to groundwater availability models or newly developed local studies bring new data
to the process and may result in different availability estimates from previous plans. More details on
differences across the groundwater joint planning process cycles are included in Appendix B.
5.6 Availability of other sources
The vast majority of Texas’ water supply comes from river basins and aquifers, but seawater and
reclaimed wastewater for reuse represent other widely available sources of water. Seawater availability
is generally limited only by the ability to legally access it along the coast. The availability of reclaimed

DRAFT 2022 State Water Plan | Texas Water Development Board D-76
wastewater for reuse, on the other hand, changes over time and is limited by the amount of wastewater
generated by water users at any given time unless a water use permit or agreement states otherwise.
5.7 Existing supplies
The share of available surface and groundwater that can be legally produced and delivered to water user
groups based on existing infrastructure—the existing supply— during a repeat of the drought of record
is influenced by many factors. For example, a reservoir may have a large volume of available water, but
existing water supplies that can be delivered to users may be limited by pipeline infrastructure,
treatment plant capacity, or legal permits to divert water. Based on the volume of available water at
each source, planning groups evaluated the share of supplies that can be relied upon to meet water
demands in the event of drought. The planning group analyses considered both legal and physical
limitations of the supplies for each water user group.
Relying on and combining water sources for each water user group varies greatly by group and location.
Statewide, surface water makes up almost two-thirds of the total existing water supply (8.9 million acre-
feet per year) for municipal, manufacturing, steam-electric, and mining users (Figure 5-11). However,
irrigation and livestock users rely on groundwater for 80 percent of their total existing water supply (7.9
million acre-feet per year) (Figure 5-12). Overall, reuse contributes 4 percent to total existing supplies,
primarily in the municipal, irrigation, and manufacturing sectors.
In 2020, Texas’ existing water supply of approximately 16.8 million acre-feet consists roughly of half
surface water and half groundwater, with reuse contributing 4 percent. By 2070, existing water supply is
projected to decline 18 percent, to approximately 13.8 million acre-feet per year (Table 5-1, Figure 5-
13), although changes in supply to water user groups vary significantly by location.
Figure 5-11. Shares of total, statewide existing municipal, steam electric, manufacturing, and
mining supply by water source in 2020 (percent)
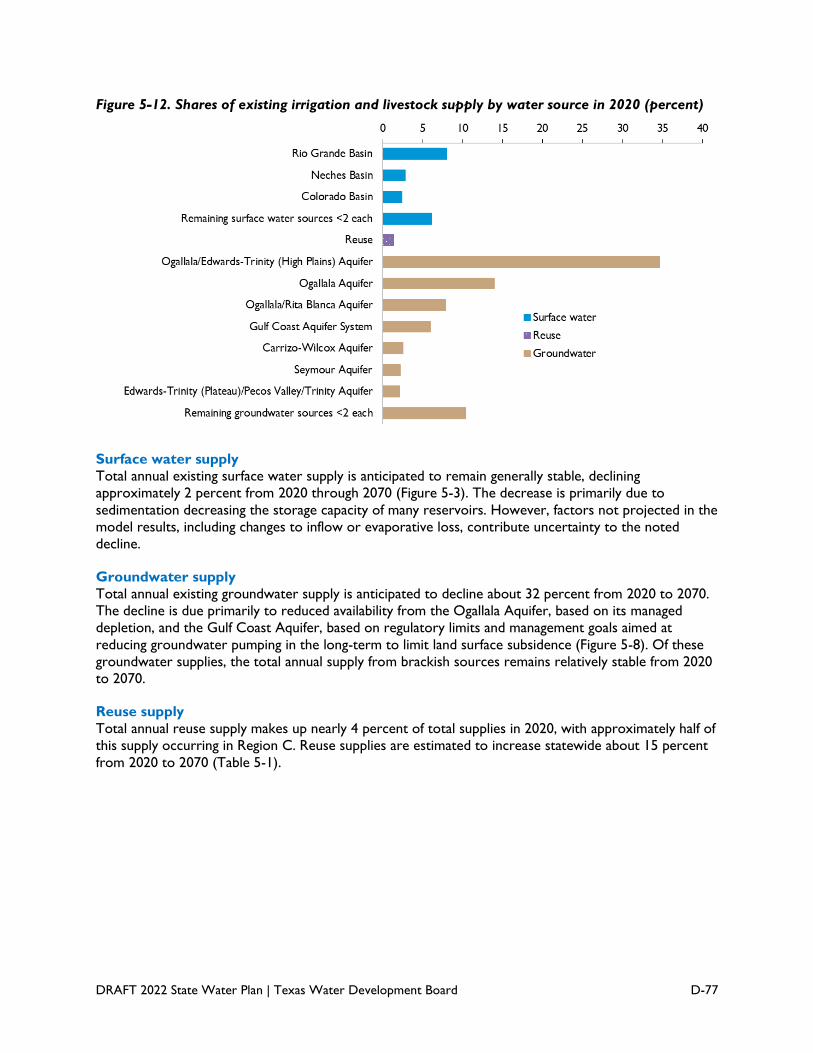
DRAFT 2022 State Water Plan | Texas Water Development Board D-77
Figure 5-12. Shares of existing irrigation and livestock supply by water source in 2020 (percent)
Surface water supply
Total annual existing surface water supply is anticipated to remain generally stable, declining
approximately 2 percent from 2020 through 2070 (Figure 5-3). The decrease is primarily due to
sedimentation decreasing the storage capacity of many reservoirs. However, factors not projected in the
model results, including changes to inflow or evaporative loss, contribute uncertainty to the noted
decline.
Groundwater supply
Total annual existing groundwater supply is anticipated to decline about 32 percent from 2020 to 2070.
The decline is due primarily to reduced availability from the Ogallala Aquifer, based on its managed
depletion, and the Gulf Coast Aquifer, based on regulatory limits and management goals aimed at
reducing groundwater pumping in the long-term to limit land surface subsidence (Figure 5-8). Of these
groundwater supplies, the total annual supply from brackish sources remains relatively stable from 2020
to 2070.
Reuse supply
Total annual reuse supply makes up nearly 4 percent of total supplies in 2020, with approximately half of
this supply occurring in Region C. Reuse supplies are estimated to increase statewide about 15 percent
from 2020 to 2070 (Table 5-1).

DRAFT 2022 State Water Plan | Texas Water Development Board D-78
Table 5-1. Texas’ annual existing water supply (acre-feet)
Source 2020 2030 2040 2050 2060 2070
Percent
change
Surface water
7,232,000
7,184,000
7,153,000
7,126,000
7,107,000
7,080,000 -2
Groundwater
8,912,000
7,638,000
6,869,000
6,407,000
6,092,000
6,023,000 -32
Reuse
620,000
640,000
661,000
676,000
704,000
714,000 15
Texasa
16,764,000
15,462,000
14,683,000
14,209,000
13,903,000
13,817,000 -18
a Does not reflect some portions of existing supplies that are associated with purely saline water sources such as untreated seawater.
Figure 5-13. Texas’ projected annual existing water supply (acre-feet)*
* Does not reflect some portions of existing supplies that are associated with purely saline water sources such as untreated seawater.
Source availability for future development
The share of available water that remains to be developed for water supply varies by water source. In
the Trinity River Basin, three-fourths of the available water is committed as existing surface water
supplies, but only about one-third of the Sabine and one-fifth of the Neches basins’ availability are
similarly connected as supply (Figure 5-4). In the Ogallala/Edwards-Trinity (High Plains), Edwards
(Balcones Fault Zone), Seymour, and several other, smaller aquifers, more than 80 percent of the
available water is connected as existing supply, whereas less than 20 percent of the Dockum and Queen
City aquifers is connected as existing supply (Figure 5-9). Any remaining available water beyond that
already connected as existing supply can, in concept, be the water source to support a recommended
water management strategy, subject to many feasibility factors including its proximity to identified water
needs and costs. However, there are factors unrelated to water source availability that can also reduce
the existing supply of specific water users, including declines in groundwater levels relative to a well
DRAFT 2022 State Water Plan | Texas Water Development Board D-79
pump intake, reduced reservoir surface levels relative to an intake elevation, groundwater quality
degradation, and expiring water supply contracts.
5.8 Comparison to the 2017 State Water Plan
Many factors have affected estimates of water availability and existing water supplies since adopting the
2017 State Water Plan, including policy decisions, modeling assumptions, accumulated historical
streamflow data, additional information regarding physical and legal constraints to supplies, and
implementation of water supply projects during the intervening years. When comparing the planning
decades of 2020 through 2070 statewide, changes range greatly by water source location and user.
Surface water
Statewide, there is more surface water availability but less existing supply as compared to the last plan,
although this varies significantly by location (Figure 5-14). The greatest relative change is an approximate
186 percent increase in existing surface water supplies in 2020 in the Canadian Basin due to revised
modeling assumptions.
Groundwater
Both groundwater availability and supply increased as compared to the 2017 State Water Plan.
Statewide, availability increased, though there was considerable variation by county, including relatively
more decreases in western and southern counties (Figure 5-15). The greatest relative change in
statewide availability occurred for the planning decade 2020, with an approximate 15 percent increase
primarily due to policy decisions made as part of the groundwater management area joint planning
process, although updated groundwater availability models may have contributed to noted differences.
Statewide, existing supply increased in all decades as compared to the 2017 State Water Plan.
Reuse
Existing reuse supply is slightly higher in the decades from 2020 to 2050 but decreases slightly in the
2060 and 2070 decades as compared to the 2017 State Water Plan. The greatest relative change was an
approximate 10 percent increase in 2020, attributed to the implementation of direct and indirect reuse
projects primarily in Regions B, C, and H.

DRAFT 2022 State Water Plan | Texas Water Development Board D-80
Figure 5-14. Changes from the 2017 State Water Plan in annual surface water availability in
2020

DRAFT 2022 State Water Plan | Texas Water Development Board D-81
Figure 5-15. Changes from the 2017 State Water Plan in annual groundwater availability in 2020
5.9 Uncertainty of our future water supply
Because hydrology—the study of water in the natural environment—is highly complex, there will always
be significant uncertainty over the future timing and quantity of available water resources. Precipitation,
temperature, evaporation, wind, and soil moisture conditions all play roles in determining how much
water moves in and through Texas’ streams, reservoirs, and aquifers. Further, the interrelated nature of
these variables makes it difficult to quantify and predict when, where, or to what degree hydrologic
events will impact water supply. In some cases, snowfall in southern Colorado and rainfall in northern
Mexico impact Texas’ water availability. Additionally, non-climate related variables, such as the
introduction and spread of invasive species, can also impact the use of certain water sources.
Texas’ water plans are based on benchmark drought of record conditions using historical hydrologic
data. While the TWDB recognizes that the full sequence of historical hydrologic events will never be
repeated exactly, the droughts have been of such severity that it is reasonable to use them for the
purpose of planning. However, uncertainty about the likelihood or severity of worse future droughts
limits the ability to predict future water availability. Some planning groups have begun to address
drought uncertainty by utilizing conservative (safe) yields or a management supply factor, a pre-

DRAFT 2022 State Water Plan | Texas Water Development Board D-82
determined or other ratio to which existing and future supplies will exceed demands, to assess project
needs. Some larger water providers across the state have conducted drought scenario planning that
considers the possibility of worse droughts for their individual long-range plans, but smaller entities may
not have the resources or technical expertise to develop similar analyses for managing their systems.
These types of assessments are integral to identifying the likelihood and severity of potential future
water supply shortages.
Quantifying surface water availability for state water planning purposes relies largely on deriving a single
firm yield or safe yield value that has been generated under the assumption that future hydrology—the
pattern of precipitation, evaporation, and streamflow—will exactly correspond to a repeat of the
historical hydrology as used to model water availability. The implicit assumption that any firm yield is
100 percent reliable is a weak assumption and an inherent uncertainty. A single, specific water supply
firm yield estimated using a specific hydrologic time-series has a singular probability of occurring.
Likewise, it has a risk (the inverse probability) of not occurring, which is not generally acknowledged or
mitigated against in the current planning process. Similarly, quantifying groundwater availability involves
inherent uncertainty related to the complexity of aquifer systems, the overlay of evolving state laws, and
the dynamic nature of legal cases that may affect groundwater policy and management.
Although there are currently no forecasting tools capable of providing quantitative certainty about
future water resources in Texas at the resolution needed for water planning, efforts to improve
technical capabilities and address uncertainty are in progress. To provide the best available, actionable
science, grounded in observed data and trends, the TWDB continues to collect data, provide technical
services, improve water availability models, and support studies for consideration in developing the next
state water plan. Further, TWDB will continue to expand its understanding of the interactive
relationship between the rivers and aquifers of Texas to improve planning and better inform future
water management and policy decisions.

DRAFT 2022 State Water Plan | Texas Water Development Board D-83
6 Water supply needs

DRAFT 2022 State Water Plan | Texas Water Development Board D-84
Quick facts
If no additional water supplies are developed or water management strategies such as conservation are
implemented, water users face a potential water shortage of 3.1 million acre-feet per year in 2020 and 6.9
million acre-feet per year in 2070 in the event of the repeat of the drought of record.
Without additional supplies being developed through the recommended strategies and projects, approximately
one-quarter of Texas’ population would have less than half of the municipal water supplies they will require in
2070.
In aggregate, population growth leads to Texas’ municipal water users potentially facing water shortages almost
15 times larger in 2070 (approximately 3.1 million acre-feet) than in 2020 (approximately 215,000 acre-feet)
unless recommended strategies and projects are implemented.
Without additional water supplies, the annual economic losses resulting from drought of record water shortages
are estimated to range from approximately $110 billion in 2020 to $153 billion in 2070.
There are significant irrigation water needs that would remain unmet under drought even if the plan is fully
implemented, largely due to managed depletion of aquifers and a lack of economically feasible alternatives.
When existing water supplies—water that is already anticipated to be legally and physically available
during a drought of record—are less than the projected water demands required to support regular
economic and domestic activities, potential water shortages exist. These potential water shortages are
referred to as identified water supply needs. The identified water needs discussion in this chapter
focuses on aggregated, total needs that, for the purpose of clarity, assume none of the water
management strategies are implemented.
Water shortages pose enormous risks to the Texas economy and public health and safety. Economically,
a perceived lack of water in a region can bias decision makers against starting a new business or
expanding their existing enterprise in Texas. More fundamentally, public health and safety depend on
adequate water supplies for drinking water, sanitation, and hygiene. Water shortages resulting from
inadequate planning and implementation can also strain water resources that have already been
developed as water supplies.
To determine if existing water supply is adequate to support the demands of Texas’ rapidly growing
population, expanding economy, and vital natural resources, the regional water planning groups
compared projected water demand to existing water supplies. More than 17,000 comparisons over the
50-year planning horizon revealed foreseeable water supply surpluses and potential shortages in a repeat
of the drought of record based on existing supplies.
Once planning groups have identified potential shortages, they evaluate and recommend water
management strategies to meet those water supply needs. Strategies for meeting or reducing potential
shortages include conservation, groundwater wells, new reservoirs, and desalination plants, all of which
are discussed in Chapter 7.
Planning groups reported the economic and socioeconomic impacts of not implementing water
management strategies and summarized the specific subset of total water needs that, unfortunately,
could not feasibly be met by the plan during drought of record conditions. These unmet needs constitute
a small portion of the total identified needs and are not anticipated to negatively impact public health or
safety.
Because the state water plan is based on providing water supplies under drought conditions when water
demands are usually highest and supplies are lowest, its implementation will also generally support most
of the same water demands under average or wetter hydrologic conditions. Significant portions of
identified water needs in this state water plan, particularly certain irrigation needs, are not, however,

DRAFT 2022 State Water Plan | Texas Water Development Board D-85
entirely attributable to an onset of drought conditions. Instead, those needs are associated largely with
1) either declining groundwater supplies combined with a lack of economically feasible strategies to
replace that irrigation supply or 2) increases in future demand in high-growth urban areas. Even under
average hydrologic conditions, irrigated agriculture requires significant water supplies to support it, and
although strategies are recommended to address needs to the extent economically feasible, sizable
portions of those irrigation demands will likely be unmet even under average hydrologic periods, due
largely to the managed and unmanaged depletion of aquifers.
When considering potential water shortages, it is also important to keep in mind that the significance of
an identified water need is best judged not in terms of the magnitude of its nominal volume, but rather
in comparison to the entire water demand of that entity with the need. For example, a water need
(potential shortage) of 10,000 acre-feet that represents only 5 percent of one entity’s entire demand is
actually much less concerning to that entity than a nominally, much smaller, 10 acre-foot shortage that
comprises 50 percent of the total demand of a different entity.
6.1 Identification of water needs
For the purposes of this state planning perspective, the TWDB aggregates data provided by the planning
groups and identifies water needs for each water use category and water user group for each decade
over the next 50 years. In some instances, these aggregated existing water supplies over a combined
geographic area may appear sufficient to meet all the water needs within that area, but in fact are not
distributed user by user in a manner that would meet all needs. Therefore, for many geographic areas
that as a whole may appear to have sufficient supplies, individual entities may experience shortages and
others may have surpluses. In these situations, water needs might be met by implementing water
management strategies such as the transfer or simple reallocation of surplus water supplies from one
water provider to another.
In 2020, Texas faces a near-term potential water shortage of slightly more than 3.1 million acre-feet in a
drought of record. By 2070, the potential shortage more than doubles to nearly 6.9 million acre-feet
(Table 6-1). These needs vary considerably by water use category (Figure 6-1). Although all 16 regions
face water needs in all planning decades, the magnitude of needs varies significantly between regional
water planning areas (Table 6-2). Region C faces the greatest combined overall increase in water needs
from 2020 to 2070, with water needs increasing to more than 1.2 million acre-feet in 2070, while Region
P does not anticipate an increase in its water needs over the same period. This is primarily driven by the
differences in population growth.
Table 6-1. Projected annual water needs by water use category (acre-feet)
Category 2020 2030 2040 2050 2060 2070
Percent
change
Irrigation 2,396,000 3,319,000 3,280,000 3,188,000 3,094,000 3,046,000 27
Municipal 215,000 802,000 1,371,000 1,912,000 2,502,000 3,144,000 1,362
Steam-electric 187,000 192,000 196,000 199,000 201,000 203,000 9
Manufacturing 159,000 264,000 275,000 286,000 295,000 301,000 89
Mining 119,000 123,000 111,000 102,000 96,000 101,000 -15
Livestock 40,000 44,000 48,000 54,000 60,000 63,000 58
Texasa 3,116,000 4,744,000 5,281,000 5,741,000 6,248,000 6,858,000 120
a Statewide totals may vary between tables due to rounding.

DRAFT 2022 State Water Plan | Texas Water Development Board D-86
Figure 6-1. Projected annual water needs by water use category (acre-feet)
* Water use categories are presented in the order listed in the legend.
Table 6-2. Projected annual water needs by region (acre-feet)
Region 2020 2030 2040 2050 2060 2070
A 148,000 394,000 411,000 394,000 369,000 378,000
B 25,000 26,000 30,000 32,000 36,000 41,000
C 66,000 307,000 530,000 769,000 1,016,000 1,278,000
D 81,000 87,000 91,000 98,000 106,000 117,000
E 61,000 66,000 76,000 89,000 104,000 119,000
F 63,000 72,000 75,000 81,000 91,000 103,000
G 211,000 255,000 291,000 345,000 404,000 478,000
H 145,000 405,000 578,000 667,000 769,000 883,000
I 139,000 182,000 183,000 190,000 199,000 206,000
J 6,000 6,000 7,000 8,000 8,000 9,000
K 283,000 281,000 289,000 291,000 297,000 319,000
L 204,000 232,000 268,000 305,000 350,000 401,000
M 937,000 924,000 926,000 937,000 953,000 970,000
N 15,000 31,000 36,000 40,000 45,000 49,000
O 726,000 1,467,000 1,483,000 1,485,000 1,493,000 1,500,000
P 8,000 8,000 8,000 8,000 8,000 8,000
Texasa 3,118,000 4,743,000 5,282,000 5,739,000 6,248,000 6,859,000
a Statewide totals may vary between tables due to rounding.

DRAFT 2022 State Water Plan | Texas Water Development Board D-87
6.2 Municipal needs
Municipal water users face the greatest overall increase as a relative share of all state water needs over
the planning horizon, from 7 percent of all state water needs in 2020 to 46 percent in 2070 (Table 6-1).
Except for Region P, each region faces at least some potential municipal water shortages over the next
50 years unless strategies are implemented. Municipal water needs are projected to become the highest
water use category by 2070, after remaining second only to irrigation needs through the year 2060.
For each decade of the planning period, Region C has the largest annual municipal needs, increasing from
approximately 43,000 acre-feet in 2020 to more than 1.2 million acre-feet in 2070 (Appendix C). In
2070, municipal needs would vary widely across the state, with 10 counties facing municipal water needs
of more than 100,000 acre-feet (Figure 6-2).
Texas’ growing population faces highly variable degrees of potential municipal water shortages over the
next 50 years, with the severity of shortages ranging significantly among individual water users.
Shortages that constitute a larger percentage of an entity’s total demand indicate a more severe
potential shortage (Figure 6-3) that would likely cause economic harm. The ability to absorb modest
shortages through temporary measures such as drought management will depend in large part on the
amount of demand hardening that has already occurred within the service area of an entity. In other
words, areas that have already implemented significant conservation measures will, by the nature of their
lower and more efficient water use, have less room to maneuver to lower water use during a drought
without economic harm.
If no recommended municipal water management strategies are implemented by the onset of another
drought of record,
• approximately 78 percent (40.4 million) of all Texans in 2070 would face at least a 10 percent
water shortage in their cities and residences;
• approximately 26 percent (13.3 million) of all Texans in 2070 would have less than half of the
municipal water supplies they require; and
• the estimated population who might have less than 10 percent of the water supplies they
require increases from 166,000 in 2020 to nearly 550,000 in 2070.

DRAFT 2022 State Water Plan | Texas Water Development Board D-88
Figure 6-2. Projected municipal water needs by county in 2070

DRAFT 2022 State Water Plan | Texas Water Development Board D-89
Figure 6-3. Projected statewide population impacted by municipal water needs in 2020 and 2070
6.3 Non-municipal needs
From 2020 to 2070, of the non-municipal water use categories, irrigation has the highest volume of
water needs statewide, while livestock has the lowest (Table 6-1). A breakdown of annual water needs
by region and water use category is included in Appendix C.
Irrigation water needs are projected to peak in 2030 at approximately 3.3 million acre-feet per year and
then gradually decline to just over 3 million acre-feet in 2070. Region M has the greatest volume of
irrigation water needs in 2020, but Region O has the greatest volume of needs from 2030 to 2070.
Manufacturing water needs are greatest in Region I. Total statewide manufacturing water needs nearly
double over the planning period, increasing from 159,000 acre-feet per year in 2020 to 301,000 acre-
feet in 2070.
Steam-electric water needs are greatest in Region G and reach a statewide maximum of 203,000 acre-
feet per year in 2070.
Mining water needs are greatest in Region G. Mining needs increase slightly in the near term, peaking at
123,000 acre-feet in 2030, and are relatively constant for the remainder of the planning horizon.
Livestock water needs are greatest in Region I. The statewide total increases from 2020 to 2070 but
remains no more than 63,000 acre-feet per year.
6.4 Major water provider needs
The major water provider classification was modified by rule prior to this state water plan to provide the
regions more flexibility in addressing the intentionally subjective term major as appropriate in each
region. By and large, this category includes mostly the same entities that have been planned for as major
water providers in previous state water plans. Major water providers are water user groups or
wholesale water providers identified by regional water planning groups to be of particular significance to
a region’s water supply.

DRAFT 2022 State Water Plan | Texas Water Development Board D-90
A single entity such as Dallas Water Utilities may be considered a water user group, wholesale water
provider, and also a major water provider. Major water providers include public or private entities, such
as river authorities, water districts, municipal utility districts, or water supply corporations that deliver
and sell large volumes of untreated and treated water for municipal, manufacturing, irrigation, and
steam-electric use on a wholesale or retail basis. The identified water needs of major water providers
are based on aggregating the water needs of their customer water user groups and are used for
developing major provider water management strategies. To avoid double counting water user needs in
the plans, the needs of major water providers are not included in the total water needs presented in the
regional or state water plans. Instead, only the potential shortages are presented for individual water
user groups to calculate needs.
In 2020, 103 out of a total of 219 major water providers identified by the planning groups face
shortages, with annual total statewide shortages of approximately 1.1 million acre-feet, increasing to 4.7
million acre-feet in 2070.
6.5 Impacts of not meeting identified water needs
Insufficient water supplies would negatively affect existing businesses and industry, future economic
development efforts, and public health and safety in Texas. Because of water’s importance to the state,
planning groups are required to include the economic and social impacts of not mitigating future water
needs in their water plans. At the request of the planning groups, the TWDB assisted with this
requirement by assessing the socioeconomic impacts of not meeting water needs and providing that
information to each region.
The economic impact portion of the analysis measures potential impacts of unmet water needs,
including effects of economic losses to regions from reduced economic output for agricultural,
industrial, and commercial water uses. The TWDB performed the analysis using a static economic
impact modeling software package, IMPLAN (Impact for Planning Analysis), as well as other economic
analysis techniques. This analysis represents a snapshot estimate of statewide socioeconomic impacts in
the event of a single year repeat of the drought of record, with the fundamental assumption that no
water management strategies are implemented to reduce the identified water needs.
The social impact portion of the analysis focuses on potential demographic effects, including changes in
population and school enrollment, by incorporating results from potential job losses due to unmet
water needs. The analysis estimates how changes in a region’s economy could affect patterns of
migration from a region. This relied partially on a simplified ratio of job and net population losses
calculated for the state as a whole, based on a recent study of how job layoffs impact the labor market
population (Foote and others, 2015).
Because statewide water needs more than double during the planning horizon, from 3.1 to 6.9 million
acre-feet (Table 6-1), the associated economic and social impacts also rise significantly over the 50 years
(Table 6-3). The estimated statewide impacts of not meeting the identified water needs in Texas would
result in an annual combined lost income of $110 billion in 2020, increasing to $153 billion by 2070. Lost
jobs would increase from 615,000 in 2020 to almost 1.4 million in 2070. To put these impact estimates
in perspective, the projected annual lost income estimates for 2020 account for approximately 6 percent
of the 2018 annual gross domestic product, which was approximately $1.8 trillion (BEA, 2020).

DRAFT 2022 State Water Plan | Texas Water Development Board D-91
Table 6-3. Projected statewide annual socioeconomic impacts from not meeting water needs8
Impact measure 2020 2030 2040 2050 2060 2070
Income loss (billions of dollars)* $110 $128 $128 $132 $140 $153
Job loss 615,000 785,000 883,000 1,019,000 1,179,000 1,371,000
Population loss 113,000 144,000 162,000 187,000 217,000 252,000
* Year 2018 dollars, rounded.
Projected impacts vary with the magnitude of needs over time as well as with the changes in estimated
lost income per acre-foot of water needs, which range greatly between economic sectors as shown in
Figure 6-4.
Figure 6-4. Estimated relative percent share, by sector statewide, of water needs and potential
income losses in 2070
* Water use sectors are presented in the order listed in the legend.
8 These impacts vary from the impact results presented in the regional water plans (Appendix D) and online
dashboards. This is primarily due to a difference in the quantity of water needs used to estimate the impacts. The
results included in the regional water plans and online dashboards were from an analysis conducted in September
2019 to allow for public comment in the draft regional plans. Final regional water plans included updated water
needs estimates, and the TWDB performed the impact estimates in this chapter based upon the final needs data in
November 2020.

DRAFT 2022 State Water Plan | Texas Water Development Board D-92
In attempting to estimate a wide range of socioeconomic impacts over a large geographic area for 50
years, the impact model requires making many assumptions and acknowledging the model’s uncertainty
and limitations. Those include a lack of reliable water use data for significant portions of the economy,
coupled with limited knowledge concerning how a given economic sector might respond to a long-term
drought.
Because of data and methodological limitations, the model cannot capture all economic impacts. As a
result, the actual economic impacts are likely significantly larger than those that resulted from this
analysis.
Analysis of this type is better at predicting relative percent differences brought about by a shock to a
complex system (such as a water shortage imposed upon a regional economy) than the precise size of
an impact. It is the general and relative magnitudes of impacts as well as the changes of these impacts
over time that should be the focus rather than the absolute numbers. Key assumptions and limitations
behind the analysis include the following:
• Changes in the future structure of the Texas economy are not considered.
• All estimated socioeconomic impacts are snapshots of a one-year repeat of the drought of
record. These independent and distinct what if scenarios for each planning region for each
particular year with water shortages are assumed to be temporary events, thereby
underestimating the total impacts of a longer term drought event.
• The analysis focuses only on the water-intensive economic sectors for which the TWDB has
adequate water use estimates. Other water use sectors contribute to the value of production in
the state economy, but the TWDB does not have sufficient data to include them. For example,
data limitations for many of the commercial sectors within municipal use precluded an estimate
of the adverse impacts of water shortages in those sectors.
• Lost income within forwardly linked sectors of the economy is not considered. Traditional
input-output analysis using IMPLAN or similar models cannot determine the adverse impacts on
downstream sectors within the economy.
• The significant economic spillover impacts (indirect and induced) on adjoining regions are not
accounted for.
• The analysis does not attempt to estimate the possible impacts of lost growth opportunities
over time due to chronic water shortages. Possible building moratoriums and similar longer
term impacts were not examined.
• The analysis does not attempt to estimate or include many other significant impacts that a
drought of record would have, such as to dryland farming, because these activities are not
directly associated with water needs identified in the regional plans.
Additional detail on the methodologies and the impact estimate results for each planning group and
county, along with the final regional impact reports, are available on the TWDB website at
www.twdb.texas.gov/waterplanning/data/analysis.
6.6 Water needs not met by implementing the plan
An unmet water need is the portion of an identified water need that would not be met even after
implementing all the recommended water management strategies. This generally occurs when a planning
group cannot identify a feasible water management strategy to address the potential shortage. Most
unmet needs are within the irrigation water use category (Tables 6-4 and 6-5). For many irrigation water
users, the returns on investments are likely insufficient for the water supply projects that would be
required to maintain or increase irrigation water supplies under drought of record conditions.
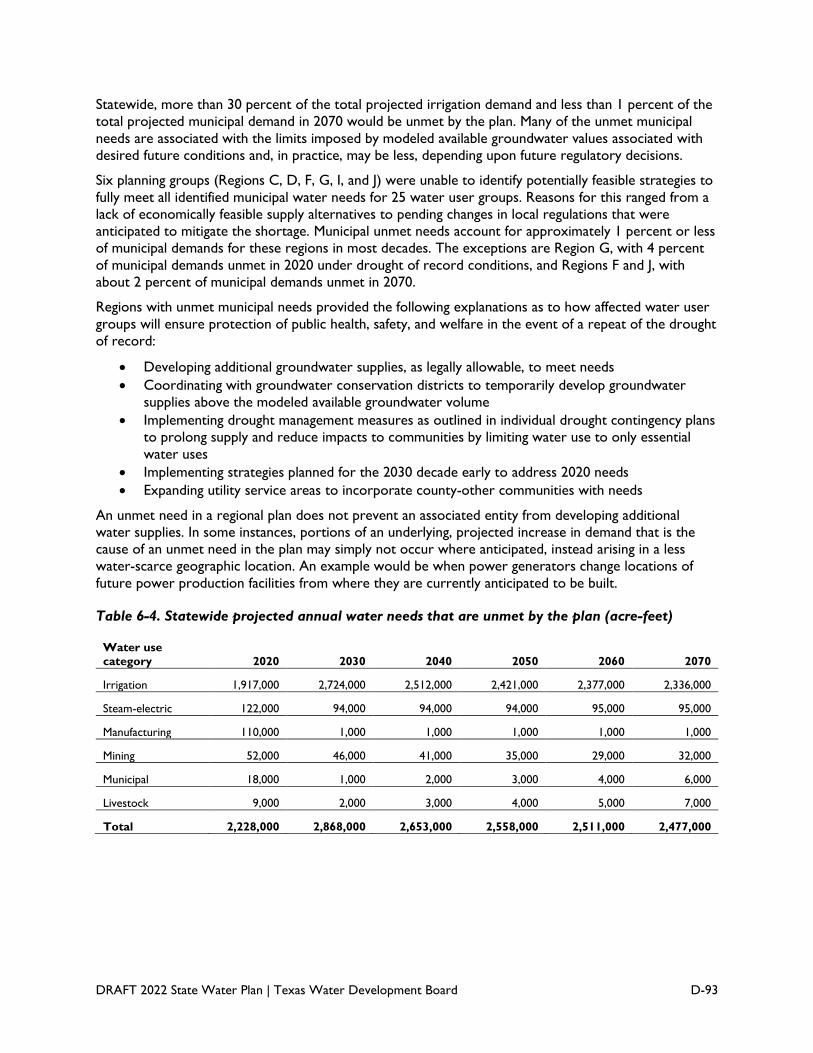
DRAFT 2022 State Water Plan | Texas Water Development Board D-93
Statewide, more than 30 percent of the total projected irrigation demand and less than 1 percent of the
total projected municipal demand in 2070 would be unmet by the plan. Many of the unmet municipal
needs are associated with the limits imposed by modeled available groundwater values associated with
desired future conditions and, in practice, may be less, depending upon future regulatory decisions.
Six planning groups (Regions C, D, F, G, I, and J) were unable to identify potentially feasible strategies to
fully meet all identified municipal water needs for 25 water user groups. Reasons for this ranged from a
lack of economically feasible supply alternatives to pending changes in local regulations that were
anticipated to mitigate the shortage. Municipal unmet needs account for approximately 1 percent or less
of municipal demands for these regions in most decades. The exceptions are Region G, with 4 percent
of municipal demands unmet in 2020 under drought of record conditions, and Regions F and J, with
about 2 percent of municipal demands unmet in 2070.
Regions with unmet municipal needs provided the following explanations as to how affected water user
groups will ensure protection of public health, safety, and welfare in the event of a repeat of the drought
of record:
• Developing additional groundwater supplies, as legally allowable, to meet needs • Coordinating with groundwater conservation districts to temporarily develop groundwater
supplies above the modeled available groundwater volume
• Implementing drought management measures as outlined in individual drought contingency plans
to prolong supply and reduce impacts to communities by limiting water use to only essential
water uses
• Implementing strategies planned for the 2030 decade early to address 2020 needs
• Expanding utility service areas to incorporate county-other communities with needs
An unmet need in a regional plan does not prevent an associated entity from developing additional
water supplies. In some instances, portions of an underlying, projected increase in demand that is the
cause of an unmet need in the plan may simply not occur where anticipated, instead arising in a less
water-scarce geographic location. An example would be when power generators change locations of
future power production facilities from where they are currently anticipated to be built.
Table 6-4. Statewide projected annual water needs that are unmet by the plan (acre-feet)
Water use
category 2020 2030 2040 2050 2060 2070
Irrigation 1,917,000 2,724,000 2,512,000 2,421,000 2,377,000 2,336,000
Steam-electric 122,000 94,000 94,000 94,000 95,000 95,000
Manufacturing 110,000 1,000 1,000 1,000 1,000 1,000
Mining 52,000 46,000 41,000 35,000 29,000 32,000
Municipal 18,000 1,000 2,000 3,000 4,000 6,000
Livestock 9,000 2,000 3,000 4,000 5,000 7,000
Total 2,228,000 2,868,000 2,653,000 2,558,000 2,511,000 2,477,000

DRAFT 2022 State Water Plan | Texas Water Development Board D-94
Table 6-5. Projected annual unmet water needs by region and water use category (acre-feet)
Region Water use category 2020 2030 2040 2050 2060 2070
A Irrigation 81,000 260,000 123,000 66,000 48,000 42,000
B Irrigation 15,000 15,000 16,000 14,000 14,000 13,000
B Mining 1,000 0 0 0 0 0
B Steam-electric 2,000 0 0 0 0 0
C Irrigation 3,000 3,000 3,000 3,000 3,000 3,000
C Mining 5,000 5,000 5,000 5,000 5,000 6,000
C Municipal 0 0 0 0 0 0
C Steam-electric 7,000 7,000 7,000 7,000 7,000 7,000
D Irrigation 0 0 0 0 0 0
D Manufacturing 1,000 0 0 0 0 0
D Municipal 0 0 0 1,000 1,000 2,000
E Irrigation 13,000 10,000 15,000 15,000 15,000 15,000
E Mining 0 1,000 1,000 0 1,000 1,000
F Irrigation 11,000 13,000 17,000 19,000 22,000 25,000
F Livestock 0 0 0 0 0 0
F Manufacturing 0 0 0 0 0 0
F Mining 6,000 6,000 3,000 2,000 1,000 1,000
F Municipal 0 1,000 1,000 1,000 2,000 3,000
F Steam-electric 11,000 11,000 11,000 11,000 11,000 11,000
G Irrigation 61,000 61,000 52,000 51,000 51,000 54,000
G Manufacturing 0 0 0 0 0 0
G Mining 16,000 16,000 16,000 16,000 17,000 19,000
G Municipal 17,000 0 0 0 0 0
G Steam-electric 72,000 71,000 71,000 71,000 71,000 72,000
H Irrigation 47,000 47,000 47,000 47,000 47,000 47,000
H Livestock 1,000 1,000 1,000 1,000 1,000 1,000
I Irrigation 1,000 0 0 0 0 0
I Livestock 8,000 0 0 0 0 0
I Manufacturing 101,000 0 0 0 0 0
I Mining 8,000 0 0 0 0 0
I Municipal 0 0 0 0 0 0
I Steam-electric 3,000 0 0 0 0 0
J Livestock 0 0 0 0 0 0
J Municipal 0 0 0 0 0 1,000

DRAFT 2022 State Water Plan | Texas Water Development Board D-95
Region Water use category 2020 2030 2040 2050 2060 2070
K Irrigation 76,000 84,000 70,000 63,000 54,000 44,000
K Mining 0 4,000 5,000 3,000 0 0
K Steam-electric 5,000 5,000 5,000 5,000 5,000 5,000
L Irrigation 137,000 138,000 140,000 142,000 151,000 155,000
L Manufacturing 8,000 0 0 0 0 0
L Mining 10,000 10,000 8,000 5,000 2,000 0
L Steam-electric 19,000 0 0 0 0 0
M Irrigation 839,000 791,000 761,000 723,000 682,000 644,000
M Manufacturing 0 1,000 1,000 1,000 1,000 1,000
M Mining 5,000 4,000 4,000 4,000 4,000 5,000
M Steam-electric 3,000 0 0 0 0 0
O Irrigation 634,000 1,302,000 1,268,000 1,279,000 1,288,000 1,293,000
O Livestock 0 0 1,000 2,000 4,000 5,000
Texasa All 2,227,000 2,867,000 2,652,000 2,557,000 2,508,000 2,475,000
a Statewide totals may vary between tables due to rounding.
6.7 Comparison to the 2017 State Water Plan
This water plan estimates annual statewide water needs of 3.1 million acre-feet in 2020 and 6.9 million
acre-feet in 2070. These amounts are less than the 2017 State Water Plan estimates of 4.8 million acre-
feet and 8.9 million acre-feet for the same decades. The differences are primarily due to revised
methodologies for estimating manufacturing, irrigation, and steam-electric power generation water
demands, resulting in more credible and often lower projections.
When the planning data is aggregated at the state level, it masks the variable geographic and categorical
mismatches between water needs and sources that can be significant at the local level. Many factors can
affect the water need calculations, making it difficult to draw broad conclusions about why there are
changes from the previous state water plan. Notable changes to the projected water needs from the
2017 State Water Plan are summarized below:
• Statewide unmet needs are approximately 24 percent lower in 2020 and 19 percent lower in
2070 than the 2017 plan. The net change in unmet needs is due to a variety of interrelated
factors that vary geographically and can have both positive and negative effects, including lower-
than-anticipated water supplies due to more severe drought conditions, changes in demand
projections, and changes in groundwater management policies.
• Statewide, annual municipal water needs in 2020 are projected to be almost 300,000 acre-feet
less than those from the previous plan, primarily due to lower water demand projections.
Municipal needs in Region N, however, are significantly higher for each decade of the 50-year
planning period. Municipal needs in Regions I and J are also significantly higher in several decades
in the planning period. In general, these changes are due to a varying mix of increased demands
driven by population growth and a reduced volume of water supplies available during drought.

DRAFT 2022 State Water Plan | Texas Water Development Board D-96
• Comparisons with the 2017 plan show that manufacturing needs decreased by more than half
for each decade of the planning horizon due to revising the manufacturing demand methodology
that ties projections of demands more closely to reported historical use.
• The projected socioeconomic impacts of not meeting water needs are higher than the previous
plan. This is due to many factors, including inflation, updates of the relevant water use volumes
and economic output values, refinements to socioeconomic impact assessment methodology,
and underlying changes in the economy.
• A variety of conservation and other projects have been implemented since 2017, which results
in increasing the existing volume of water on the existing supply side of the planning equation,
thereby reducing the resulting water need calculation.
6.8 Uncertainty of future water needs
Water needs during drought of record conditions are difficult to predict due to the uncertainties that
already affect both water demand (Section 4.4) and water supply (Section 5.9). For example, higher-
than-projected per capita water demand combined with lower-than-anticipated water supply could
result in a much greater water need than either factor could have caused independently.
Ultimately, future water need projections will continue to be updated as a result of numerous
unpredictable forces including shifts in social values, legal changes, climate variability, economic trends,
improvements in water use efficiency, energy costs, and advances in technology. In an attempt to
address shifts behind Texas’ overall water needs over time, the regional and state water planning
process incorporates the emerging impacts of all these complex changes as a whole into the regional
and state water plans during each five-year planning cycle through historic data and other newly available
information.
References
BEA (Bureau of Economic Analysis), 2020, Gross domestic product by state,
https://apps.bea.gov/itable/iTable.cfm?ReqID=70&step=1&acrdn=1, accessed January 2021.
Foote, A., Grosz, M., and Stevens, A., 2015, Locate your nearest exit—Mass layoffs and local labor
market response, University of California, Davis, 44 p. http://paa2015.princeton.edu/papers/150194

DRAFT 2022 State Water Plan | Texas Water Development Board D-97
7 Water management strategies
and projects

DRAFT 2022 State Water Plan | Texas Water Development Board D-98
Quick facts
More than 5,800 recommended water management strategies would provide about 7.7 million acre-feet per
year in additional water supplies to water user groups in 2070.
The cost of implementing the more than 2,400 recommended water management strategy projects by 2070 is
$80 billion.
Conservation strategies represent approximately 29 percent, or 2.2 million acre-feet per year, of all
recommended water management strategy volumes in 2070 and were recommended for more than half of the
water user groups in the plan.
Planning groups recommended 22 new major reservoirs that, if implemented, would provide 866,000 acre-feet
per year in additional supplies by 2070.
Approximately 37 percent of the recommended new water supplies in 2070 are based on surface water, 15
percent on reuse, and 12 percent on groundwater.
A water management strategy is a plan to meet a water need (potential shortage) of a water user group.
After identifying water surpluses and potential water shortages for water user groups in their regions,
regional water planning groups identify, evaluate, and recommend water management strategies to avoid
potential shortages including to be protective of public health, safety and welfare during a repeat of the
drought of record over the next 50 years.
Water management strategies allocate water supply (in acre-feet per year) to specific water user groups,
often through an intermediate regional or wholesale water provider. In the same manner that projected
water demands, existing water supplies, and water needs in this plan are associated with water user
groups, recommended water management strategy water volumes are also generally associated directly
with water user groups.
Strategies may or may not require new water infrastructure—referred to as “water management
strategy projects.” Construction of most new water infrastructure projects requires long-term financing
of the capital costs. The TWDB may provide financial assistance to support the implementation of water
supply projects only if the needs to be addressed by the project are consistent with the regional water
plans and the state water plan. This same provision applies to the Texas Commission on Environmental
Quality’s granting of water right permits, although the governing bodies of these agencies may grant
waivers to the consistency requirement. The TWDB financial program that specifically targets
implementation of state water plan projects, the State Water Implementation Fund for Texas (SWIFT)
program, further requires that projects, including their capital costs, must be recommended water
management strategy projects in the most recently adopted state water plan to be eligible for that
financial assistance.
7.1 Selecting water management strategies
Each planning group identifies and evaluates feasible water management strategies for consideration to
be included as a recommended final set of strategies. In selecting strategies, planning groups are required
to consider certain factors, including
• quantity of supply provided by a strategy;
• reliability of the supply under drought of record conditions;
• cost of the supply (including borrowing and mitigation costs); and
• impacts of the strategy on water quality and on water, agricultural, and natural resources.
DRAFT 2022 State Water Plan | Texas Water Development Board D-99
Evaluations of water management strategies are based on drought of record conditions and must honor
all existing water rights, which are the same benchmark conditions used in the water demand and water
supply evaluations. Planning groups are also required to consider conservation and drought management
strategies for all water user groups that have identified water needs.
The types of strategies recommended depend upon the size and nature of identified water needs,
geographic location, available water resources, associated strategy impacts, and costs of implementation.
Some water management strategies do not require infrastructure projects with capital costs to
implement while others may require significant capital investments, including various combinations of
pipelines, wells, pump stations, river diversion facilities, or water treatment plants. For example, certain
types of conservation may be supported by annual program budgets, and many water purchase
strategies will rely on existing infrastructure capacity to convey increased water deliveries. Other
strategies, such as new reservoirs and seawater desalination plants, require significant upfront
investment in infrastructure to implement. However, the significance of any infrastructure investment is
relative and varies by community and entity. For example, installing a single new groundwater well can
be a more major investment for a small community than a large city.
The complexity of recommended strategies and the projects supporting them varies greatly. Some
strategies, such as a new groundwater well, may serve and be implemented by a single water provider
from a single water source. Other large regional projects, such as conveyances from reservoirs, may
encompass a mixture of water sources from one or more wholesale water providers; may require a
variety of infrastructure including intakes, major pipelines, and pump stations; and ultimately serve
numerous retail water providers.
Just over 5,800 water management strategies were recommended by the 16 regional planning groups. If
all were implemented, they would provide almost 1.7 million acre-feet per year, including in the form of
conservation savings, to water user groups in 2020 and nearly 7.7 million acre-feet per year in 2070
(Table 7-1). The total capital cost of the approximately 2,400 recommended water management strategy
projects associated with these 5,800 strategies is $80 billion (Table 7-2). Detailed lists of the
recommended water management strategies, including projects, may be found on the 2022 State Water
Plan webpage at http://www.twdb.texas.gov/waterplanning/swp/2022/index.asp and the interactive state
water plan website at www.2022.texasstatewaterplan.org.

DRAFT 2022 State Water Plan | Texas Water Development Board D-100
Table 7-1. Annual volume of recommended water management strategies by region (acre-feet)
Region 2020 2030 2040 2050 2060 2070
A 155,000 295,000 529,000 616,000 618,000 658,000
B 10,000 14,000 38,000 43,000 45,000 49,000
C 129,000 361,000 588,000 830,000 1,075,000 1,336,000
D 83,000 149,000 161,000 175,000 192,000 221,000
E 82,000 118,000 130,000 146,000 150,000 156,000
F 79,000 141,000 166,000 171,000 176,000 182,000
G 119,000 291,000 353,000 396,000 443,000 492,000
H 251,000 978,000 1,412,000 1,725,000 1,845,000 1,942,000
I 24,000 251,000 272,000 285,000 295,000 279,000
J 13,000 26,000 26,000 26,000 26,000 26,000
K 251,000 297,000 373,000 418,000 476,000 565,000
L 199,000 429,000 551,000 596,000 692,000 737,000
M 141,000 219,000 296,000 372,000 440,000 508,000
N 24,000 255,000 266,000 271,000 278,000 282,000
O 119,000 199,000 249,000 236,000 239,000 242,000
P 16,000 17,000 17,000 17,000 17,000 17,000
Texasa 1,695,000 4,040,000 5,427,000 6,323,000 7,007,000 7,692,000
a Statewide totals may vary between tables due to rounding.
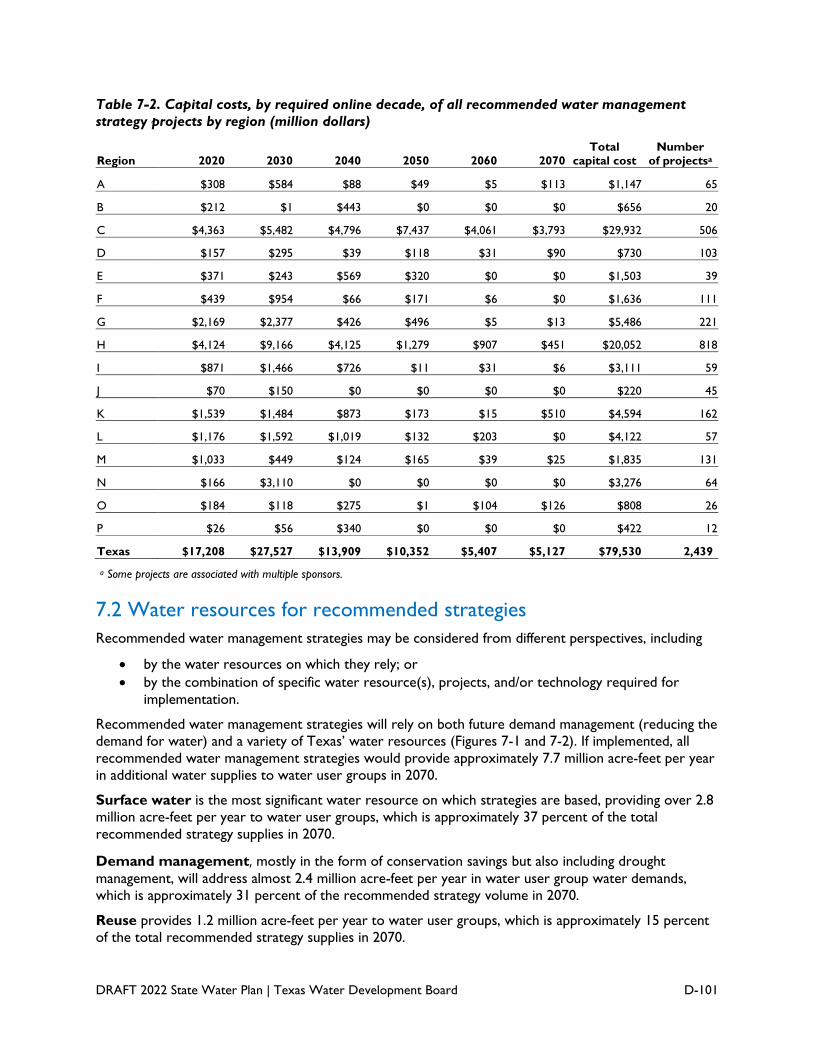
DRAFT 2022 State Water Plan | Texas Water Development Board D-101
Table 7-2. Capital costs, by required online decade, of all recommended water management
strategy projects by region (million dollars)
Region 2020 2030 2040 2050 2060 2070
Total
capital cost
Number
of projectsa
A $308 $584 $88 $49 $5 $113 $1,147 65
B $212 $1 $443 $0 $0 $0 $656 20
C $4,363 $5,482 $4,796 $7,437 $4,061 $3,793 $29,932 506
D $157 $295 $39 $118 $31 $90 $730 103
E $371 $243 $569 $320 $0 $0 $1,503 39
F $439 $954 $66 $171 $6 $0 $1,636 111
G $2,169 $2,377 $426 $496 $5 $13 $5,486 221
H $4,124 $9,166 $4,125 $1,279 $907 $451 $20,052 818
I $871 $1,466 $726 $11 $31 $6 $3,111 59
J $70 $150 $0 $0 $0 $0 $220 45
K $1,539 $1,484 $873 $173 $15 $510 $4,594 162
L $1,176 $1,592 $1,019 $132 $203 $0 $4,122 57
M $1,033 $449 $124 $165 $39 $25 $1,835 131
N $166 $3,110 $0 $0 $0 $0 $3,276 64
O $184 $118 $275 $1 $104 $126 $808 26
P $26 $56 $340 $0 $0 $0 $422 12
Texas $17,208 $27,527 $13,909 $10,352 $5,407 $5,127 $79,530 2,439
a Some projects are associated with multiple sponsors.
7.2 Water resources for recommended strategies
Recommended water management strategies may be considered from different perspectives, including
• by the water resources on which they rely; or
• by the combination of specific water resource(s), projects, and/or technology required for
implementation.
Recommended water management strategies will rely on both future demand management (reducing the
demand for water) and a variety of Texas’ water resources (Figures 7-1 and 7-2). If implemented, all
recommended water management strategies would provide approximately 7.7 million acre-feet per year
in additional water supplies to water user groups in 2070.
Surface water is the most significant water resource on which strategies are based, providing over 2.8
million acre-feet per year to water user groups, which is approximately 37 percent of the total
recommended strategy supplies in 2070.
Demand management, mostly in the form of conservation savings but also including drought
management, will address almost 2.4 million acre-feet per year in water user group water demands,
which is approximately 31 percent of the recommended strategy volume in 2070.
Reuse provides 1.2 million acre-feet per year to water user groups, which is approximately 15 percent
of the total recommended strategy supplies in 2070.

DRAFT 2022 State Water Plan | Texas Water Development Board D-102
Groundwater resources provide just over 920,000 acre-feet per year to water user groups, which is
approximately 12 percent of the total recommended strategy supplies in 2070.
Seawater provides nearly 190,000 acre-feet per year to water user groups, which is approximately 3
percent of the total recommended strategy supplies in 2070.
Aquifer storage and recovery, which can use a variety of water source types that are then stored
underground, provides over 190,000 acre-feet per year to water user groups, or approximately 3
percent of the total recommended strategy supplies in 2070.
Figure 7-1. Share of recommended water management strategy volume by water resource in
2070 (percent)

DRAFT 2022 State Water Plan | Texas Water Development Board D-103
Figure 7-2. Annual volume of recommended water management strategies by region and water
resource in 2070 (thousands of acre-feet)
* Strategy types are presented left to right in the order listed in the legend.
7.3 Strategy types
Planning groups recommended a wide variety of water management strategies to serve water user
groups, each of which relies on a specific combination of water source(s), infrastructure, and technology
(Figure 7-3, Table 7-3).

DRAFT 2022 State Water Plan | Texas Water Development Board D-104
Figure 7-3. Share of total recommended water management strategies volume by strategy type
in 2070 (percent)
Table 7-3. Annual volume of recommended water management strategies by online decade and
strategy type (acre-feet)
Water management strategy type 2020 2030 2040 2050 2060 2070
Agricultural conservation 535,000 757,000 1,066,000 1,142,000 1,151,000 1,197,000
Aquifer storage & recovery 19,000 132,000 155,000 162,000 180,000 193,000
Conjunctive use 5,000 57,000 65,000 64,000 64,000 67,000
Direct potable reuse 12,000 34,000 44,000 57,000 61,000 62,000
Drought management 87,000 110,000 129,000 140,000 149,000 158,000
Groundwater desalination 19,000 97,000 123,000 124,000 154,000 157,000
Groundwater wells & other 255,000 418,000 543,000 604,000 665,000 705,000
Indirect reuse 58,000 209,000 510,000 560,000 648,000 739,000
Industrial conservation 23,000 32,000 35,000 37,000 39,000 44,000
Municipal conservation 220,000 395,000 530,000 675,000 822,000 977,000
New major reservoir 60,000 324,000 468,000 658,000 793,000 866,000
Other direct reuse 51,000 179,000 202,000 232,000 265,000 305,000
Other strategies 8,000 44,000 52,000 57,000 67,000 78,000
Other surface water 345,000 1,071,000 1,314,000 1,620,000 1,757,000 1,951,000
Seawater desalination 0 179,000 190,000 192,000 192,000 192,000
Texasa 1,697,000 4,038,000 5,426,000 6,324,000 7,007,000 7,691,000
a Statewide totals may vary between tables due to rounding.

DRAFT 2022 State Water Plan | Texas Water Development Board D-105
7.3.1 Conservation
Conservation includes a variety of activities that either reduce everyday water consumption or increase
water use efficiency, allowing more to be done with the same amount of water. Conservation occurs
throughout both wet and dry weather and maintains all normal economic and domestic activities.
Conservation strategies are divided into several types, including municipal; agricultural, which includes
strategies predominantly for irrigation and some livestock water users; and industrial, which includes
conservation strategies for steam-electric, manufacturing, and mining water users.
Conservation is a recommended strategy in all 16 regional water plans and is associated with over 1,500
water user groups (Table 7-4). About 778,000 acre-feet per year in conservation strategy volume is
recommended in 2020, and 2.2 million acre-feet per year is recommended in 2070. Additional
information on conservation strategies, planning, and programs is provided in Chapter 8.
Table 7-4. Number of water user groups relying on different types of water management
strategies by region*
Water management strategy type A B C D E F G H I J K L M N O P Texas
Agricultural conservation 21 3 4 0 2 30 20 8 0 3 6 0 8 5 18 1 129
Aquifer storage & recovery 2 0 111 1 1 0 20 1 0 3 7 9 0 1 5 0 161
Conjunctive use 0 0 0 0 1 0 30 95 0 0 0 0 0 0 0 0 126
Direct potable reuse 1 0 0 0 0 1 1 0 0 1 4 1 9 0 0 0 18
Drought management 0 0 0 0 0 0 0 0 0 1 118 39 40 1 0 8 207
Groundwater desalination 0 0 0 0 4 1 2 1 0 1 1 5 11 3 0 0 29
Groundwater wells & other 32 8 150 49 13 19 77 28 23 17 31 64 11 24 26 0 572
Indirect reuse 0 5 240 10 0 7 11 9 5 0 7 0 0 0 0 0 294
Industrial conservation 0 12 2 3 0 32 40 0 0 0 5 0 17 13 12 3 139
Municipal conservation 40 23 283 9 10 68 114 345 58 9 70 106 58 23 38 6 1260
New major reservoir 0 18 246 9 0 0 30 10 15 0 18 4 0 0 1 0 351
Other direct reuse 0 0 10 0 2 2 18 18 0 2 14 11 5 2 2 0 86
Other strategies 0 0 36 0 1 11 0 1 0 1 8 0 7 0 0 0 65
Other surface water 0 5 277 40 2 41 91 132 28 2 11 5 47 4 1 0 686
Seawater desalination 0 0 0 0 0 0 0 1 0 0 0 0 1 3 0 0 5
* Water user groups associated with more than one planning region may be counted more than once with different region and strategy
type combinations.
7.3.2 Drought management
Drought management reduces water use during times of drought by temporarily restricting certain
economic and domestic activities such as car washing and landscape irrigation. These measures vary and
are generally implemented by local water providers. Planning groups recommended drought
management strategies for certain water user groups and in limited instances, to address, for example
near-term shortages that will eventually be met in future decades from other water supply strategies. It
is important to recognize that in the absence of sufficient water, restricting water use through drought

DRAFT 2022 State Water Plan | Texas Water Development Board D-106
management is likely the primary, and often the only, means by which water providers will be able to
successfully navigate their way through a severe drought. About 87,000 acre-feet per year in drought
management strategies is recommended in 2020, and 158,000 acre-feet per year is recommended in
2070.
7.3.3 Reuse
Reuse takes many forms and is broadly categorized as either direct or indirect. Either type of reuse may
be used for potable or non-potable purposes.
Direct potable reuse involves further treating of wastewater effluent at an advanced water treatment
plant and then either introducing it ahead of the water treatment plant or directly into the potable
water distribution system. About 12,000 acre-feet per year in direct potable reuse strategies is
recommended in 2020, and 62,000 acre-feet per year is recommended in 2070.
Other direct reuse strategies generally convey treated wastewater directly from a treatment plant to
non-potable uses such as landscape irrigation or industrial processes. About 51,000 acre-feet per year in
other direct reuse (as opposed to direct potable reuse) strategies is recommended in 2020, and 305,000
acre-feet per year is recommended in 2070.
Indirect reuse generally involves discharging wastewater into a natural water body and diverting that
water for subsequent potable or non-potable use. About 58,000 acre-feet per year in indirect reuse
strategies is recommended in 2020, and 739,000 acre-feet per year is recommended in 2070.
7.3.4 Conjunctive use
Conjunctive use strategies combine multiple water sources, usually surface water and groundwater, to
optimize the beneficial characteristics of each source, yielding additional firm water supplies. For
example, a strategy may be to rely intermittently on groundwater to supplement surface water supplies
that are not fully available under drought of record conditions. About 5,000 acre-feet per year in
conjunctive use strategies is recommended in 2020, and 67,000 acre-feet per year is recommended in
2070.
7.3.5 Aquifer storage and recovery
Aquifer storage and recovery refers to the practice of injecting water, when available, into an aquifer
where it is stored for later use. This strategy is feasible only in certain geologic formations and in areas
where only the project sponsor may retrieve the stored water. About 19,000 acre-feet per year in
aquifer storage and recovery strategies is recommended in 2020, and 193,000 acre-feet per year is
recommended in 2070.
Aquifer storage and recovery strategies can be associated with a variety of water source types that are
stored underground. Recommended aquifer storage and recovery strategies are categorized under their
own water resource type in this plan (Figure 7-1) but may be associated with one or a combination of
initial surface water, groundwater, and reuse sources. Approximately 60 percent of 2070 aquifer storage
and recovery strategy supplies are associated with stored surface water sources, while 30 percent are
associated with a combination of groundwater and surface water sources. The remaining 10 percent are
associated with groundwater or a combination of surface water and reuse or groundwater and reuse
supplies.
As planning groups considered and evaluated water management strategies, House Bill 807 from the
86th Legislative Session required that they also provide a specific assessment of the potential for aquifer
storage and recovery projects to meet any identified significant water needs. Each planning group
defined their own threshold of significant water need, with thresholds ranging from needs by any non-
DRAFT 2022 State Water Plan | Texas Water Development Board D-107
irrigation water user group (Region O) to any needs greater than 25,000 acre-feet in any decade (Region
H). Assessments therefore varied by region but generally considered available water sources, suitable
geology, and interested project sponsors.
Ten regions recommended aquifer storage and recovery strategies. Regions not recommending aquifer
storage and recovery strategies (Regions B, D, F, I, M, and P) cited reasons such as the lack of suitable
geology in proximity to needs, cost constraints, or a lack of interested project sponsors. Although
Region D does not have project sponsors recommending aquifer storage and recovery, there are
beneficiaries within Region D of an aquifer storage and recovery project sponsored in Region C. This
information is reflected in Tables 7-4 and 7-5.
7.3.6 New major reservoirs
A major reservoir has a storage capacity of 5,000 acre-feet or more. Regional planning groups
recommended 23 new major reservoirs during this planning cycle (Figure 7-4). About 60,000 acre-feet
per year from new major reservoir strategies, including some that rely on indirect reuse, is
recommended in 2020, and 866,000 acre-feet per year is recommended in 2070. Several of these
reservoir sites are off-channel, meaning they would not be built on the main stem of the river, although
they might rely on the main stem flows.
Because Senate Bill 1511, 85th Texas Legislature, now requires planning groups to amend their regional
water plans if recommended water management strategies or projects become infeasible prior to
adopting the next plan, including “infeasible in time,”9 the TWDB emphasized in contract guidance and at
planning group meetings the need to ensure realistic reservoir development timelines. Fourteen of the
recommended new major reservoirs in this plan are anticipated to be online and providing water supply
by 2030 (Figure 7-5). An additional eight new major reservoirs are planned to be online by 2050.
Planning groups with new major reservoir strategies recommended for the 2020 decade were required
to provide the specific basis on which the planning group anticipates that it is feasible for these major
strategies to be online and providing water supply by January 5, 2023. Partly in response to this
feasibility review, online decades for six recommended new major reservoir strategies were shifted from
2020 in the draft regional plans to 2030 in the final, adopted regional water plans.
9 Although all projects recommended in the plan are considered technically feasible, a project may become
infeasible on its projected timeline, meaning that obstacles and related delays to implementation might make it
impractical to build the project quickly enough to meet water needs intended to be met in an early decade. Thus,
the project would need to be shown as meeting needs later on.

DRAFT 2022 State Water Plan | Texas Water Development Board D-108
Figure 7-4. Recommended new major reservoirs

DRAFT 2022 State Water Plan | Texas Water Development Board D-109
Figure 7-5. Online decade count and cumulative yield of recommended new major reservoirs
* Reservoirs shown as online in 2020 are anticipated to have construction completed by January 2023.
7.3.7 Other surface water
Other surface water supplies include strategies that are not associated with new major reservoirs,
surface water desalination, conjunctive use, or aquifer storage and recovery. The other surface water
category includes minor reservoirs (less than 5,000 acre-feet of storage) and the subordination of
surface water rights as well as a wide variety of other strategies that convey, treat, reassign, or
otherwise make accessible additional surface water supplies to users—with or without additional
infrastructure.
Some of these strategies are based on building pipelines to convey previously developed surface water
supplies over long distances to either wholesale or retail water providers, for example, from an existing
reservoir. These strategies generally do not require further development of surface water resources and
new water right permits but simply convey previously developed and permitted surface water to users.
In addition to pipelines, the types of projects associated with these strategies may include, but are not
limited to, constructing pump stations, adding water treatment capacity, or lowering the elevation of a
reservoir intake to allow a water provider to continue to draw water when lake levels are low.
Another portion of these strategies is based on reassigning existing surplus water supplies or more fully
utilizing the capacity of existing infrastructure to deliver additional surface water to wholesale and/or
retail water providers. Many of these strategies are based on transactions (such as sales, contracts, or
purchases) between wholesale and/or retail water providers involving previously developed supplies.
These transactions may include voluntary reallocations of existing supplies, for example, to support an
emergency connection between water providers. Delivery and treatment of these additional water
supplies may or may not require new or expanded water infrastructure.
The remaining other surface water strategies increase supplies simply by removing infrastructure
bottlenecks, which limit the volume of supplies that could otherwise be delivered. Expanding the
DRAFT 2022 State Water Plan | Texas Water Development Board D-110
capacity of a water treatment plant to better align with the larger capacity of a conveyance pipeline that
already delivers water to the plant is an example of this type of strategy.
About 345,000 acre-feet of water supply per year from other surface water strategies is recommended
in 2020, and almost 2 million acre-feet per year is recommended in 2070.
7.3.8 Groundwater wells and other
All but one of the planning groups recommended the development of at least some additional
groundwater. This includes single wells or multiple wells, which may be part of the development of new
well fields or expansions of existing well fields. New wells are often the only economically feasible
strategy to meet the water needs of rural municipal water users.
Other groundwater strategies do not involve installing new wells but instead convey, reassign, or
otherwise make accessible previously developed groundwater supplies to users with or without
additional conveyance and/or treatment infrastructure. These strategies may include, for example,
maximizing the use of existing facilities by increasing production from existing groundwater wells and
conveying groundwater supplies from one provider to another through a purchase.
About 255,000 acre-feet per year of supply from groundwater development strategies (not associated
with groundwater desalination, conjunctive use, or aquifer storage and recovery strategies) is
recommended in 2020, and 705,000 acre-feet per year is recommended in 2070.
7.3.9 Desalination of groundwater and seawater
Desalination is the process of removing dissolved solids from seawater or brackish groundwater, often
by forcing the source water through membranes under high pressure. The specific process used to
desalinate water varies depending upon the amount of total dissolved solids, temperature, and other
physical characteristics of the source water but always requires disposal of concentrate that has a higher
total dissolved content than the source water. Disposal may take the form of an injection well,
evaporation ponds, discharge to surface water, or an ocean outfall diffuser.
About 19,000 acre-feet per year of supply from groundwater desalination strategies is recommended in
2020, and 157,000 acre-feet per year is recommended in 2070. For seawater desalination strategies, no
additional supply is recommended by 2020; however, 179,000 acre-feet per year of supply is
recommended to be online by 2030, and 192,000 acre-feet per year is recommended in 2070.
Nine planning groups recommended groundwater desalination strategies and three recommended
seawater desalination strategies. Planning groups cited the cost of desalination treatment and
infrastructure, a lack of interested project sponsors, and the existing availability of non-brackish water
sources as reasons for not recommending groundwater desalination strategies. Finding qualified
operators in rural areas to operate these sophisticated systems is an implementation issue that has been
raised on these projects. The primary reason for not recommending seawater desalination strategies
was based on cost, particularly as related to the distance supplies would have to be conveyed from the
Gulf of Mexico.
7.3.10 Other strategies
Four remaining strategy types complete the portfolio of recommended water management strategies.
Each individually provides approximately 1 percent of the total recommended strategy supplies in 2070.
For two of these, weather modification and brush control, it is difficult to quantify the reliable supplies
they are capable of providing under extended drought of record conditions when there is less cloud
cover, precipitation, runoff, and infiltration of precipitation into the soil. For this reason, they are not
often recommended as strategies to meet needs.
DRAFT 2022 State Water Plan | Texas Water Development Board D-111
Surface water desalination is the process of removing dissolved solids from brackish surface water,
often by forcing the source water through membranes under high pressure. About 63,000 acre-feet per
year of supply from surface water desalination strategies is recommended in 2070.
Weather modification, sometimes referred to as cloud seeding, is the application of technology to
enhance precipitation from clouds. About 5,000 acre-feet per year of supply from weather modification
strategies is recommended in 2070 to address needs for select irrigation water users that also have
recommended irrigation conservation strategies.
Brush control is a land stewardship technique that involves removal of species, such as ashe juniper,
that may reduce runoff to streams and rivers and recharge to aquifers. About 5,000 acre-feet per year of
supply from brush control strategies is recommended in 2070 to address needs for select non-municipal
water users that also have other recommended strategies.
Rainwater harvesting involves capturing, diverting, and storing rainwater for landscape irrigation,
drinking and domestic use, aquifer recharge, and stormwater abatement. Rainwater harvesting can
reduce municipal outdoor irrigation demand on potable systems. Building-scale level of rainwater
harvesting, as was generally considered by planning groups and which meets planning rules, requires
active management by each system owner to economically develop it to a scale that is large and
productive enough to ensure a meaningful supply sustainable through a drought of record. About 5,000
acre-feet per year of supply from rainwater harvesting strategies is recommended in 2070 to address
needs for select water users that have multiple additional recommended strategies.
7.4 Assignment of strategy and project supply volumes
The volume of water associated with all recommended water management strategy projects may, in
some cases, be greater than an identified need or what was actually assigned to specific water user
groups. Differences in water volumes may occur between the yield developed by certain projects at the
source and the volume that would actually be conveyed to wholesalers or water user groups, the
volume assigned to wholesale water providers and retail water providers, and/or the identified water
user needs and strategy volume assigned to a specific water user. Depending on the project and
provider, these differences in water volumes generally represent
• anticipated water losses in conveyance and/or treatment;
• a management supply or safety factor to address uncertainties such as whether recommended
projects will be implemented, unanticipated water supply reductions, or greater-than-anticipated
water demand for wholesale and retail water system operations;
• a planning buffer against a future drought worse than the drought of record;
• water supply available to a wholesale provider that could eventually be distributed to meet the
needs of its customer water user groups; and/or
• a portion of the capacity of larger, optimally sized regional projects, such as major reservoirs,
that come online later in the planning decades and that may not be fully connected to or utilized
by water user groups, for example, until after 2070.
In some cases, additional water may be developed at the source only, while in other instances the water
may be delivered to a wholesale provider but may not have been assigned to any specific water user
group in a particular decade. Future delivery of unassigned water volumes may require additional water
infrastructure that may not be included in this plan.
The full capacities of all recommended projects and strategies that are included in the approved regional
water plans, including any of their associated capacities or volumes of water that may not be assigned to
specific water user groups, are also considered to be part of the state water plan. There are 22
recommended projects that are associated with only unassigned strategy supplies, meaning the supplies

DRAFT 2022 State Water Plan | Texas Water Development Board D-112
from these projects have not yet been allocated to a specific water user group. Approximately 210,000
acre-feet per year of unassigned strategy supply are recommended in 2020, and 1.1 million acre-feet per
year is included in the recommended strategies in 2070. Unassigned strategy supplies account for 11
percent of the total supply share in 2020 and 13 percent in 2070.
7.5 Costs of recommended strategies
Planning groups estimated the costs of their recommended water management strategy projects using
common cost elements and methodologies. This is the second cycle of regional plans in which planning
groups utilized a cost estimation tool that was developed under a TWDB-funded research study and the
first in which a cost estimation tool for drought management strategies was made available.10 Extensive
use of the spreadsheet-based tool introduced greater consistency in the cost estimates and helped
planning groups ensure that all required cost considerations were included in the estimates.
In accordance with planning rules and guidance, this state water plan is intended to include only those
recommended projects and costs necessary to conserve, develop, deliver, or treat additional water
supply volumes. It specifically excludes the cost for maintaining or replacing existing infrastructure as
well as retail distribution projects, such as expanding internal distribution infrastructure to serve a new
subdivision, other than those directly associated with recommended conservation strategies.
The total capital cost required to implement all recommended water management strategy projects is
$80 billion. This includes approximately 2,400 projects that would be built and completed at various
times over the next five planning decades.
The estimated unit cost of water (dollars per acre-foot of water delivered to water user groups in each
year) varies greatly depending on the type of strategy, location, water source, and infrastructure
required to convey and treat the water. Statewide, based on a weighted average cost,11 the least
expensive recommended water management strategy type in the year 2070 is drought management
followed by irrigation conservation. The most expensive is direct potable reuse followed by seawater
desalination (Table 7-5). There can be a substantial range in unit cost even within a single type of
strategy depending on the source water quality, geographic distances, and whether the unit cost includes
debt service in the later decades; this is true between regions as well. For example, if a seawater
desalination strategy requires a 100-mile pipeline inland, the costs of that strategy will likely be
substantially greater than a seawater desalination plant built to serve an entity located on the coast.
10 The costing of drought management strategies is a significantly different cost concept (economic cost) than the
explicit capital cost of implementing other strategy types. Additional detail on lost consumer surplus appears in the
user guide for the Drought Management Tool at
www.twdb.texas.gov/waterplanning/rwp/planningdocu/2021/doc/current_docs/project_docs/TWDB_Drought_Man
agement_Costing_Tool_User_Manual_2019.pdf
11 The weighted average is the average of values scaled by the relative volume of each strategy.

DRAFT 2022 State Water Plan | Texas Water Development Board D-113
Table 7-5. Weight-averaged unit costs (dollars per acre-foot)* of strategy water supplies by
region and strategy type in 2070
Water management
strategy type A B C D E F G H I
Agricultural conservation $66 $83 $307 na $39 $0 $1,330 $132 na
Aquifer storage & recovery $391 na $99 $99 $212 na $418 $3,256 na
Conjunctive use na na na na $251 na $235 $1,060 na
Direct potable reuse $1,228 na na na na $2,443 $606 na na
Drought management** na na na na na na na na na
Groundwater desalination na na na na $818 $403 $1,540 $4,927 na
Groundwater wells & other $355 $396 $408 $383 $710 $340 $407 $481 $173
Indirect reuse na $698 $273 $1,032 na $269 $275 $326 $435
Industrial conservation na $385 $147 $0 na $0 $0 na na
Municipal conservation $779 $356 $103 $679 $92 $663 $546 $584 $398
New major reservoir na $384 $625 $540 na na $659 $411 $281
Other direct reuse na na $278 na $479 $201 $384 $525 na
Other strategies na na $899 na $307 $10 na $1,560 na
Other surface water na $828 $527 $199 $290 $80 $521 $273 $475
Seawater desalination na na na na na na na $1,293 na
* Unit costs include a mixture of projects, some of which will be beyond their debt service period by 2070.
** Unit costs for drought management strategies represent possible costs to municipal water users from foregone consumer surplus of
imposed reduced water use rather than capital expended to produce water supply.
na = not applicable or not available.
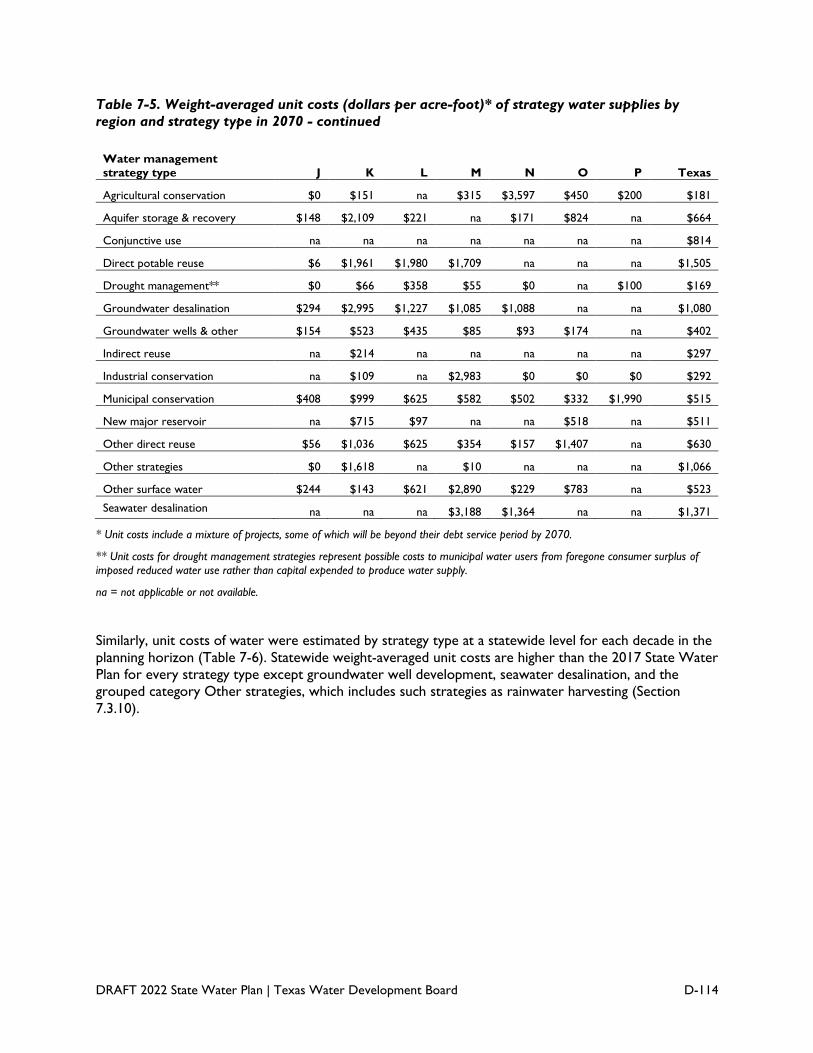
DRAFT 2022 State Water Plan | Texas Water Development Board D-114
Table 7-5. Weight-averaged unit costs (dollars per acre-foot)* of strategy water supplies by
region and strategy type in 2070 - continued
Water management
strategy type J K L M N O P Texas
Agricultural conservation $0 $151 na $315 $3,597 $450 $200 $181
Aquifer storage & recovery $148 $2,109 $221 na $171 $824 na $664
Conjunctive use na na na na na na na $814
Direct potable reuse $6 $1,961 $1,980 $1,709 na na na $1,505
Drought management** $0 $66 $358 $55 $0 na $100 $169
Groundwater desalination $294 $2,995 $1,227 $1,085 $1,088 na na $1,080
Groundwater wells & other $154 $523 $435 $85 $93 $174 na $402
Indirect reuse na $214 na na na na na $297
Industrial conservation na $109 na $2,983 $0 $0 $0 $292
Municipal conservation $408 $999 $625 $582 $502 $332 $1,990 $515
New major reservoir na $715 $97 na na $518 na $511
Other direct reuse $56 $1,036 $625 $354 $157 $1,407 na $630
Other strategies $0 $1,618 na $10 na na na $1,066
Other surface water $244 $143 $621 $2,890 $229 $783 na $523
Seawater desalination na na na $3,188 $1,364 na na $1,371
* Unit costs include a mixture of projects, some of which will be beyond their debt service period by 2070.
** Unit costs for drought management strategies represent possible costs to municipal water users from foregone consumer surplus of
imposed reduced water use rather than capital expended to produce water supply.
na = not applicable or not available.
Similarly, unit costs of water were estimated by strategy type at a statewide level for each decade in the
planning horizon (Table 7-6). Statewide weight-averaged unit costs are higher than the 2017 State Water
Plan for every strategy type except groundwater well development, seawater desalination, and the
grouped category Other strategies, which includes such strategies as rainwater harvesting (Section
7.3.10).

DRAFT 2022 State Water Plan | Texas Water Development Board D-115
Table 7-6. Statewide weight-averaged unit costs (dollars per acre-foot)* of strategy water
supplies by strategy type 2020–2070
Water management
strategy type 2020 2030 2040 2050 2060 2070
Agricultural conservation $284 $273 $202 $188 $186 $181
Aquifer storage & recovery $437 $666 $904 $609 $509 $664
Conjunctive use $1,724 $1,729 $1,986 $1,147 $903 $814
Direct potable reuse $1,321 $1,456 $1,402 $1,587 $1,590 $1,504
Drought management** $70 $119 $168 $168 $169 $169
Groundwater desalination $920 $1,618 $1,430 $899 $994 $1,080
Groundwater wells & other $599 $659 $592 $523 $439 $402
Indirect reuse $391 $697 $541 $391 $266 $297
Industrial conservation $680 $597 $513 $339 $311 $292
Municipal conservation $675 $607 $503 $498 $519 $515
New major reservoir $114 $598 $818 $678 $521 $511
Other direct reuse $962 $892 $865 $483 $559 $630
Other strategies $10 $2,128 $2,016 $1,073 $1,055 $1,066
Other surface water $744 $1,037 $986 $581 $550 $523
Seawater desalination na $2,402 $2,394 $1,440 $1,383 $1,371
* Unit costs include a mixture of projects, some of which will be beyond their debt service period by 2070.
** Unit costs for drought management strategies represent possible costs to municipal water users from foregone consumer surplus of
imposed reduced water use rather than capital expended to produce water supply.
na = not applicable or not available.
7.6 Strategies benefitting multiple regions
Several wholesale and major water providers in this plan serve customers in multiple planning regions.
Additionally, regional water planning groups coordinate with each other throughout each cycle to
identify and consider potential regionalized projects during the development of their plans. In this plan,
35 recommended strategies recommended by 7 planning groups benefit water user groups in more than
those 7 primary regions. This regionalization provides shared water supplies to 10 of the 16 regions
across the state. The volume of water from these regionalized strategies represents 13 percent of the
total recommended strategy water supply volume in 2070 that include groundwater development,
transfers of existing water supplies, development of new major reservoirs, direct and indirect reuse, and
aquifer storage and recovery projects. Planning groups also assessed progress towards regionalization, a
new requirement in this plan from House Bill 807, 86th Legislative Session. This discussion is included
with other implementation results in Chapter 10.
7.7 Impacts of recommended strategies
The process of developing regional water plans requires that planning groups describe the major impacts
on key water quality parameters and how the plans are consistent with the long-term protection of
water, agricultural, and natural resources.

DRAFT 2022 State Water Plan | Texas Water Development Board D-116
7.7.1 Potential impacts on water quality
To assess how water management strategies could potentially affect water quality, planning groups
identified key water quality parameters within their regions. These parameters were generally based on
surface and groundwater quality standards, the list of impaired waters developed by the Texas
Commission on Environmental Quality, and input from local and regional water management entities
and the public.
Planning groups presented high-level assessments of how implementing strategies could potentially affect
the water quality of surface water and groundwater sources. Regions used different approaches,
including categorical assessments (such as low, moderate, high) or numerical impact classifications (such
as 1, 2, 3, 4, 5).
To evaluate the potential impacts of the recommended water management strategies on surface water
quality, the planning groups commonly used the Texas Surface Water Quality Standards, which include
the following:
• Total dissolved solids (salinity): For most purposes, total dissolved solids is a direct measure
of salinity. Salinity concentration determines whether water is acceptable for drinking water,
livestock, or irrigation.
• Nutrients: Nutrients are chemical constituents, most commonly as a form of nitrogen or
phosphorus, that can occur in high concentrations, contributing to the overgrowth of aquatic
vegetation and impacting water uses.
• Dissolved oxygen: Dissolved oxygen concentrations must be sufficient to support existing,
designated, presumed, and attainable aquatic life uses in classified water body segments.
• Bacteria: Some bacteria, although not generally harmful themselves, indicate potential
contamination by feces of warm-blooded animals.
• Toxicity: Toxicity is the occurrence of adverse effects to living organisms due to exposure to a
wide range of toxic materials.
The water quality indicators that planning groups commonly used to evaluate groundwater quality
impacts of the recommended water management strategies include the following:
• Total dissolved solids (salinity): As noted above, total dissolved solids is a measure of the
salinity of water and represents the amount of minerals dissolved in water.
• Nitrates: Although nitrates are naturally occurring nutrients, elevated levels generally result
from human activities, such as overuse of fertilizer and improper disposal of human and animal
waste.
• Arsenic: Although arsenic can occur both naturally and through human contamination, most
arsenic in Texas groundwater is naturally occurring.
• Radionuclides: A radionuclide is an atom with an unstable nucleus that emits radiation; this
occurs naturally in several Texas aquifers.
Water management strategies for water supply are subject to the Texas Commission on Environmental
Quality’s Public Drinking Water and Water Quality standards, permitting, monitoring, assessment,
treatment, sampling, and other requirements or methods used by that agency to address water quality
problems related to water supply.
7.7.2 Protecting the state’s water, agricultural, and natural resources
In developing the regional plans, planning groups honored all existing water rights and contracts and
considered conservation strategies based on identified best management practices for all water user
groups with a water supply need or that relied on an interbasin transfer. Planning groups also accounted

DRAFT 2022 State Water Plan | Texas Water Development Board D-117
for environmental flow standards adopted by the Texas Commission on Environmental Quality,
Consensus Criteria for Environmental Flow Needs, or, when available, site-specific studies. Regional
plans do not include any recommended strategies incompatible with the desired future conditions of
aquifers or that divert greater-than-permitted surface water volumes.
Planning groups quantified and considered the impacts of water management strategies to agricultural
resources. In developing the plans, planning groups were also required to consider and, when feasible,
recommend water management strategies to meet the water supply needs of irrigated agriculture and
livestock production. Recommended strategies involving conversion or transfer of water associated with
existing water right permits either being used for agricultural purposes or from rural areas were based
on future voluntary transactions between willing buyers and willing sellers.
In considering the protection of natural resources, planning groups included estimated costs of
anticipated mitigation requirements for project construction and quantified the potential impacts of
water management strategies related to environmental factors. These factors were quantified and
summarized primarily based on existing data and the potential to avoid or mitigate impacts. Some
categorized assessments as “high,” “moderate,” or “low” based on underlying quantified impacts or
quantified ranges of impacts. For example, a “low” impact rating indicated that impacts could generally
be avoided or mitigated relatively easily. In contrast, an impact rated as “high” generally indicated that
impacts would be significant with the potential for substantial mitigation requirements.
In their environmental reviews, planning groups also considered a variety of factors, including the
volume of discharge a strategy would produce, the number of acres of habitat potentially affected,
changes to streamflows, and changes to bay and estuary inflow patterns. The groups also relied on
identifying the number of endangered or threatened species or cultural sites occurring within the vicinity
of the recommended projects.
The emphasis of these evaluations varied by region based on the type of project under consideration
and the relevant resources affected. Evaluations included project-by-project evaluations as well as
cumulative, region-wide impact analyses. In general, most planning groups relied on existing information
and data generated as part of the technical evaluations of strategies, such as flow frequency data, land
cover, and habitat maps, to evaluate the impacts of water management strategies on agricultural and
natural resources.
7.8 Needs met by recommended strategies
Planning groups were required to consider all identified water needs (potential shortages) and identify
possible strategies to meet them, when feasible. Two planning groups (Regions N and P) were able to
recommend water management strategies that, if implemented, can meet the needs for all their water
user groups. The remaining 14 planning groups were unable to identify sufficient feasible strategies that
could meet both Texas’ planning requirements and all the needs in their regions (Figure 7-6).

DRAFT 2022 State Water Plan | Texas Water Development Board D-118
Figure 7-6. Annual water supply needs and needs met by the plan by region in 2070 (acre-feet)
Statewide, most water needs associated with municipal, manufacturing, livestock, and mining water user
groups are met by the plan in 2070 (Figure 7-7). However, at least some unmet water supply needs
occur for all categories of water user groups, with irrigation water user groups accounting for the
majority of unmet water needs. The inability to meet a water user group’s need in the plan is usually due
to the lack of an economically feasible water management strategy, but this does not prevent an entity
from pursuing the development of additional water supplies at any time.

DRAFT 2022 State Water Plan | Texas Water Development Board D-119
Figure 7-7. Annual water supply needs and needs met by the plan by water use category in 2070
(acre-feet)
7.9 Comparison to the 2017 State Water Plan
The volumes and relative mix of recommended water management strategies change between each state
water plan for a variety of reasons. Some strategies recommended in the previous plan will have been
implemented by the adoption of the next water plan, at which time those “new” supplies are then
accounted for as existing water supplies (Chapter 5) and thereby reduce the resulting water needs.
Counts of recommended strategies in this plan vary from the 2017 State Water Plan partly due to both
the transition to utility-based planning and a shift by some planning regions toward grouping strategies
under project sponsors. Such strategy grouping by sponsors has occurred as projects get further defined
over time, serving multiple customers with interrelated needs, such as meeting groundwater reduction
requirements by regional water authorities around the Houston area. There are approximately 5,800
recommended strategies described in this plan that represent the total number of recommended
strategies assigned to water user groups and account for individual and grouped strategies. This
represents a net increase of approximately 500 in the count of recommended strategies over the count
in the 2017 plan, some of which is the result of the transition to utility-based planning.
As is the case with this plan, the 2017 State Water Plan also included a varying mixture of water supply
volumes not directly associated with water user groups. However, the associated volumes and project
sponsors differ, which makes comparisons between plans difficult. The recommended water
management supplies, as presented here, are those supply volumes that planning groups associated with
specific water user groups. In addition to the shift in timing of several major reservoirs previously
discussed, notable changes from the 2017 State Water Plan include the following:

DRAFT 2022 State Water Plan | Texas Water Development Board D-120
• The anticipated total strategy supplies directly associated with water user groups in the 2070
decade decreased from 8.5 million acre-feet per year in the 2017 State Water Plan to 7.7 million
acre-feet per year in this plan, primarily due to a lower volume of needs to address in 2070 than
in the 2017 State Water Plan.
• The total capital costs of all recommended strategies increased significantly from $63 billion in
the previous plan to $80 billion, due to many factors but largely because of increased
construction costs, refinement of projects through the planning phases, increased engagement of
water providers and communities in the planning process, and a more comprehensive effort to
include all projects that will conserve water or increase treated water supply volumes.
• The number of water user groups benefiting from recommended aquifer storage and recovery
strategies increased significantly from the previous plan.
• Capital-intensive conservation strategies increased to $7.4 billion—$2.7 billion more than in the
previous plan.
• The volume of recommended municipal conservation savings of 977,000 acre-feet per year in
2070 is greater than the 811,000 acre-feet per year recommended in the 2017 plan.
• The volume of recommended direct potable reuse strategies in 2070 decreased from
approximately 87,000 acre-feet per year in the 2017 plan to 62,000 acre-feet per year.
• The volume of recommended desalination strategies in 2070 nearly doubled, from
approximately 229,000 acre-feet per year in the 2017 plan to almost 412,000 acre-feet per year.
• The volume of recommended aquifer storage and recovery strategies in 2070 increased from
approximately 123,000 acre-feet per year in the 2017 plan to 193,000 acre-feet per year.
7.10 Uncertainty of future strategies
Implementation of any given recommended water management strategy or project is not a certainty.
Many of the more significant projects will require obtaining a surface water right or groundwater permit
from a regulatory entity. Some projects, such as large reservoirs, will require extensive and time-
intensive studies, including additional environmental permitting from the U.S. Army Corps of Engineers
and the National Environmental Policy Act process, which involves wide-ranging information collection,
study, and public input.
Implementing all water supply projects also remains subject to political and financial processes associated
with project sponsors and communities. Eventually, some recommended projects may become politically
or financially infeasible and, therefore, will be shelved or abandoned.
To account for uncertainties, including the possibility of projects being downsized or not being
implemented at all, planning groups sometimes recommended a combination of water management
strategies that, if implemented, would provide more water supplies than are required to meet needs.
Planning groups also included alternative water management strategies, which are fully evaluated
strategies that can be substituted at a future date if a recommended strategy becomes infeasible. The
farther into the 50-year planning horizon, the greater the uncertainty of implementing any given strategy.
Regulations may change or technological advances may make some strategies more affordable. Water
planning in Texas is an adaptive process in which regional and state water plans are developed every five
years to reflect these and many other changes.

DRAFT 2022 State Water Plan | Texas Water Development Board D-121
8 Conservation
DRAFT 2022 State Water Plan | Texas Water Development Board D-122
Quick facts
This is the first state water plan in which planning groups were required to set a per capita water use goal for
municipal water users. About half of the planning groups selected 140 gallons per capita per day, a goal first
established by the state’s Water Conservation Implementation Task Force report to the legislature (WCITF,
2004).
About 977,000 acre-feet in municipal conservation strategies is recommended in 2070, of which 320,000 acre-
feet is associated with water loss reduction activities at a capital cost of approximately $3.8 billion.
Although measuring and tracking conservation implementation can be challenging, statewide average municipal
per capita use has generally declined over the past decades, partly due to conservation implementation funded
through multiple state financing programs.
Conservation will continue to play an essential role in meeting the future water demands of Texas’
rapidly growing population. Significant strides in both indoor and outdoor water use efficiency have been
made over the past decade. Within the regional and state water planning process, those strides are
reflected in water conservation measures that include practices, techniques, programs, and technologies
that will protect water resources; reduce water consumption, loss, or waste; or improve the efficiency
of water use.
Conservation is one of the measures water user groups can choose to help address their water needs.
As a result, conservation is a water management strategy that can make a water supply available for
future or alternative uses,12 without restricting desired economic or other activities.
This new chapter of the state water plan aggregates conservation information similarly to that of the
regional water plans, which are required to provide conservation information in Chapter 5 of each of
the plans. More detail may be found in each regional water plan, including consolidated conservation-
related recommendations and model water conservation plans.
8.1 Agency program and legislated conservation initiatives
Various TWDB conservation programs provided information used to develop the regional water plans.
Water conservation activities and water loss information provided to the regions included data from the
agency’s collection of water conservation plans (approximately 650 are submitted every five years);
conservation plan annual implementation reports (approximately 650 are submitted annually); and water
loss audits (approximately 4,000 utilities submit every five years and 750 submit annually).13 Information
from the conservation plan annual reports and water loss audits is also posted on the TWDB website.14
In addition, the TWDB has undertaken numerous legislatively directed initiatives over this recent
planning cycle. These include developing a statewide water conservation quantification project, creating
a municipal water conservation planning tool, and the continued issuing of grant funds to support
agricultural water conservation programs. The background of these initiatives is summarized below.
These initiatives and the tools and other resources that they have produced, as well as an ongoing water
12 Texas Water Code Section 11.002 generally defines conservation as the development of water resources. For
regional planning purposes, water conservation measures do not include reservoirs, aquifer storage and recovery,
or other types of projects that develop new water supplies. Additionally, for planning purposes water reuse is
considered a unique strategy type separate from conservation.
13 www.twdb.texas.gov/conservation/municipal/index.asp
14 www.twdb.texas.gov/conservation/municipal/waterloss/historical-annual-report.asp

DRAFT 2022 State Water Plan | Texas Water Development Board D-123
loss audit validation study anticipated to be completed in 2021, will support the development of the next
regional and state water plans.
To address the requirements of state budget Rider 26 from the 84th Legislative Session, the TWDB
contracted a statewide water conservation quantification study15 (Averitt, 2017). The study collected
water conservation activity information from 170 water utilities across the state and estimated the
water and water loss reduction savings from the various programs. Those estimates were then
compared to the projected conservation savings from each utility’s recommended conservation water
management strategies in the 2017 State Water Plan. The study’s estimated collective savings to date
were projected to exceed the collective 2020 water conservation strategy supply volumes but fall short
of the 2030–2070 strategy supply volumes reported in the 2017 State Water Plan. The TWDB provided
these findings to planning groups for their consideration in developing conservation strategies for the
2021 regional water plans. Many planning groups acknowledged the difficulty of quantifying conservation
savings with the results of this study. At least one planning group utilized the information to estimate
demand reduction since 2011, the base year of the municipal water demands, and refine the costs of
demand reduction.
To fulfill the requirements under Rider 24 of the 85th Legislative Session, the TWDB contracted for the
development of a municipal water conservation planning tool16, which built upon the previous water
conservation quantification study results. The planning tool was primarily developed to assist water
utilities with their own water conservation planning and reporting, though planning groups were given
the option to use the tool to estimate the volumes of recommended conservation water management
strategies in their plans. This tool provides an accounting framework for estimating future conservation
program costs and water savings as well as estimating the water savings from implementing previous
conservation measures.
House Bill 1648 from the 85th Legislative Session requires certain retail public water utilities to
designate a water conservation coordinator to implement conservation plans, a named position that
must be included in the conservation plan annual report for each utility. House Bill 3339 from the 86th
Legislative Session consolidates all water conservation plan requirements for financial applicants to the
TWDB and requires the TWDB to provide educational and technical assistance to develop such plans.
House Bill 1573 from the 85th Legislative Session requires individuals submitting a water loss audit to
have received TWDB training regarding these audits, and the agency provides this training online or
through in-person workshops. This initiative contributes to improving the quality of water loss data
reported and considered in developing the state water plan.
The TWDB has also contracted for a water loss audit validation study to be completed by summer
2021. This study will meet the requirements of Rider 22 from the 86th Legislative Session by furthering
water conservation through quantification and measurement. The project is intended to provide insight
into certain aspects of conducting water loss audit validations in Texas. The study will validate water loss
data for at least 10 volunteer utilities of various sizes across the state. Improved data will allow the
utilities to make better decisions regarding improving the efficiency of their systems and will assist
regional planning groups in identifying those entities that might benefit most from water management
strategies such as water loss mitigation through meter testing and replacement, rapid leak repair, and
pipe replacement.
The TWDB’s Agricultural Water Conservation Grants Program offers grants to state agencies, political
subdivisions, and universities to demonstrate agricultural water conservation best management practices
and support the implementation of agricultural irrigation conservation strategies in alignment with the
15 www.twdb.texas.gov/conservation/doc/StatewideWaterConservationQuantificationProject.pdf
16 www.twdb.texas.gov/conservation/municipal/plans/doc/TWDB_MWCPT_v1.xlsm

DRAFT 2022 State Water Plan | Texas Water Development Board D-124
state water plan. Each year, applications are solicited to address topics related to agricultural water
conservation. Some examples of previously awarded grants include technical assistance, demonstration
projects, technology transfer, equipment cost share, and research and education. The TWDB also
provides low-interest, fixed-rate loans to political subdivisions that are used to pass through funds to
individual producers, enabling them to upgrade irrigation equipment and improve irrigation efficiency.
Through Fiscal Year 2020, the TWDB has awarded approximately $113.1 million from these programs.
In 2020 alone, the TWDB awarded nearly $1.2 million in grants to five recipients and a $725,000 loan to
one recipient for their projects.
8.2 Conservation’s role in the state water planning process
Every five years, the TWDB develops water demand projections for the regional planning groups’
review and use in their regional plans (Chapter 4). The municipal water demands incorporate anticipated
water savings (passive conservation savings) from federal and state water-efficiency standards for
plumbing fixtures and appliances, because these passive water savings won’t require any additional action
on the part of water utilities to realize the savings. Importantly, the per capita per day water use in these
municipal projections already reflect previous and often significant conservation savings already achieved. That
includes, for example, benefits from conservation best management practices that water providers may
have been following for years. Past conservation achievements necessarily limit the future capacity for
achieving additional conservation, especially in areas with limited growth.17
Under efficiency standards in place at the time of this plan’s development, the additional, combined
savings of water-efficient showerheads, toilets, clothes washers, and dishwashers are anticipated to
reduce the future municipal water demands of the state by approximately 5.4 percent in 2020 and 9.5
percent in 2070 (Chapter 4). Passive saving volumes and recommended municipal conservation
strategies will together amount to about 517,000 acre-feet of water in 2020 and approximately 1.9
million acre-feet in 2070 (Table 8-1).
Table 8-1. Anticipated (passive and strategy) municipal conservation water volumes in 2020 and
2070 (acre-feet)
2020 2070
Pro
jecti
on
s
Passive water savings by fixtures/appliances
Showerheads 40,000 175,000
Clothes washers 134,000 284,000
Toilets 75,000 334,000
Dishwashers 48,000 96,000
Subtotal 297,000 889,000
Str
ate
gie
s
Subtotal recommended
municipal conservation
strategy supplies 220,000 977,000
Total 517,000 1,866,000
17 This tendency for past conservation to increase the difficulty and cost of additional future conservation is called
“demand hardening.”

DRAFT 2022 State Water Plan | Texas Water Development Board D-125
Once water supply needs are identified, each planning group is required to first consider water
conservation strategies to address those needs. As planning groups identify and evaluate water
management strategies, they must also consider utility water conservation plans and data from water
loss audits submitted by water providers in the region. If a planning group determines that
recommending a conservation strategy for an identified water need is not feasible, it must document the
reason in its plan.
Each plan must also include region-specific model water conservation plans as a resource for entities to
reference when developing their own water conservation plans. In doing so, planning groups have
generally chosen to reference the Texas Commission on Environmental Quality’s requirements for
compulsory conservation plans from certain entities every five years. These include such factors as a
utility profile that describes the entity, water system, and water use data; quantified 5-year and 10-year
water savings goals; and documentation of coordination with the regional water planning group.
For water users dependent upon water management strategies involving interbasin transfers, planning
groups are required to include the highest practicable level of water conservation for those entities. To
help each planning group evaluate whether they are meeting those associated conservation expectations,
the TWDB uses the state water planning database to provide summaries of each region’s conservation
strategy savings associated with water users who depend on interbasin transfers.
8.3 Establishing regional conservation goals
New to this round of planning was a requirement from House Bill 807, 86th Legislative Session, that
directs planning groups to set one or more specific goals for municipal water use in gallons per capita
per day in each decade of the period covered by the plan. These goals are not necessarily the same as
goals set by utilities as part of their water conservation plans, which are often based on multi-year
averages and use total gallons per capita per day. Some, but not all, planning groups set per capita goals
specifically intended as goals for dry-year use, which is consistent with the underlying benchmark of the
regional and state water plans, and generally correspond to higher per capita water use rates than the
goals shown in water conservation plans.
Approximately half of the planning groups set a per capita water use goal of 140 gallons per capita per
day for municipal water users, a goal largely informed by a similar goal for average conditions that was in
the state’s Water Conservation Implementation Task Force report to the legislature (WCITF, 2004).
These planning group goals were generally established considering dry-year projected demands and
potential future savings from recommended conservation strategies. Other regions determined
individual goals for municipal water users based on calculating the expected per capita use after
incorporating anticipated efficiency savings and recommended conservation strategy savings. One region
used a combination of both methods for setting their municipal water use goals.
The TWDB provided historical water use estimates and other reported information from conservation
annual reports to support planning groups’ establishment of goals. A gallons per capita per day figure is
calculated for each utility water user as part of the state’s water planning process and in the annual
conservation reports. These methodologies are documented18 in the Guidance and Methodology for
Reporting on Water Conservation and Water Use (TWDB and others, 2012) and are summarized below.
Specific water use goals can be found in Chapter 5 or the associated appendix of each regional water
plan.
Regional water planning gallons per capita per day – The value reported in the regional
water planning process. It is the total volume of water intake minus wholesale volumes to other
18 www.twdb.texas.gov/waterplanning/waterusesurvey/estimates/GPCD_definitions_051120.pdf

DRAFT 2022 State Water Plan | Texas Water Development Board D-126
municipal water users and large industrial facilities and retail volumes to large industrial facilities divided
by 365 and then divided by the permanent population of the municipal water user.
Total gallons per capita per day – The value reported in the conservation plans and annual
reports. It is the total system input volume of water treated for potable use minus wholesale volumes
to other water systems divided by 365 and then divided by the permanent population of the water
system. Retail volumes sold to large industrial facilities are included in total gallons per capita per day.
Residential gallons per capita per day – The value reported in the conservation annual
reports19. Residential gallons per capita per day is calculated as the volume of water metered to single-
family and multi-family connections, divided by the total residential population served, divided by 365.
Residential water use is collected through the annual water use survey.
8.4 Conservation water management strategies and projects
The types of recommended conservation water management strategies vary between the 16 regions but
were generally based on an analysis of a variety of best management practices for various types of water
users. These practices either reduce everyday water consumption or increase water use efficiency,
allowing more to be done with the same amount of water and resulting in additional available water
supplies. Conservation requires a continuous effort, occurs throughout both wet and dry weather
cycles, and maintains all normal economic and domestic activities. Best management practices are
defined as conservation measures that are useful, proven, cost-effective, and generally accepted among
conservation experts. These practices are further described in the water conservation best management
practices guides developed by the state’s Water Conservation Advisory Council and available at
www.twdb.texas.gov/conservation/BMPs/index.asp.
8.4.1 Municipal conservation
In a report to the Texas Legislature, the TWDB determined that many utilities do not describe their
conservation activities in terms of formalized best management practices (TWDB, 2019). Therefore,
many municipal conservation water management strategies in the state water plan are essentially a menu
of potential best practices that may be implemented to achieve a specific, estimated amount of water
savings. The same report to the legislature also determined that all utilities reviewed included at a
minimum the following three best management practices:
• metering of all new connections and retrofit of existing connections
• system water audit and water loss control
• public information
The recommended municipal conservation strategies in this state water plan include all of these and
other common best practices, as well as infrastructure-based projects that will address water loss and
metering. Municipal conservation was a recommended strategy in every regional water plan and is
associated with over 1,200 municipal water user groups statewide (Table 7-4).
Municipal conservation strategies include a variety of activities, such as incentivized installation of water-
efficient plumbing fixtures (for example, through rebates); stronger water conservation pricing
structures that discourage waste; education programs: and year-round landscape irrigation restrictions
that continue to allow for maintenance of healthy landscapes. Regional water planning groups
recommended about 218,000 acre-feet per year in municipal conservation strategies for 2020 and
977,000 acre-feet per year by 2070 (Table 8-2). These savings are in addition to the estimated volume of
additional future passive conservation savings expected to occur as a result of existing plumbing codes
19 www3.twdb.texas.gov/apps/wcreps/wcreports.aspx

DRAFT 2022 State Water Plan | Texas Water Development Board D-127
and water-efficiency standards discussed earlier in this section (297,000 acre-feet per year in 2020 and
889,000 acre-feet per year in 2070). For municipal water user groups with identified needs,
approximately 26 percent of 2020 identified needs and 25 percent of needs in 2070 are addressed by
recommended water conservation strategies alone.
Municipal conservation strategies also include activities to detect, measure, and reduce water loss.
Planning groups are required to present water loss audit data in Chapter 1 of their plans and to consider
this data when developing their plans. Upon considering the information, five planning groups (Regions
A, E, F, H, and I) determined thresholds for recommending water loss audits and leak repair strategies in
their plans for entities with significant water loss, and four planning groups established targets for
voluntary action. However, the planning groups that did not establish such thresholds or targets still
recommended water loss reduction strategies. Examples of projects specifically recommended to
address water loss that involve capital expenditures include replacing leaking lines and installing advanced
metering infrastructure. About 74,000 acre-feet per year in savings associated specifically with water loss
projects is recommended in 2020, and 320,000 acre-feet per year in savings is recommended in 2070.
The total capital cost associated with these projects is $3.8 billion.
Table 8-2. Annual volume of all recommended conservation strategies by use category in 2020
and 2070 (acre-feet)
Category Decade A B C D E F G H I
Irrigation 2020 141,000 7,000 <500 0 34,000 23,000 8,000 94,000 0
Irrigation 2070 565,000 17,000 <500 0 34,000 60,000 19,000 94,000 0
Municipal 2020 5,000 <500 94,000 4,000 5,000 3,000 1,000 40,000 7,000
Municipal 2070 8,000 2,000 192,000 10,000 19,000 4,000 108,000 187,000 22,000
Mining 2020 0 1,000 6,000 0 0 5,000 1,000 0 0
Mining 2070 0 <500 10,000 0 0 1,000 3,000 0 0
Manufacturing 2020 0 0 0 <500 0 0 <500 0 0
Manufacturing 2070 0 0 0 1,000 0 0 1,000 0 0
Steam-electric 2020 0 <500 0 0 0 0 0 0 0
Steam-electric 2070 0 5,000 0 0 0 0 0 0 0
Livestock 2020 0 0 0 0 0 0 0 0 0
Livestock 2070 0 0 0 0 0 0 0 0 0

DRAFT 2022 State Water Plan | Texas Water Development Board D-128
Table 8-2. Annual volume of all recommended conservation strategies by use category in 2020
and 2070 (acre-feet) – continued
Category Decade J K L M N O P Texasa
Irrigation 2020 <500 51,000 0 67,000 1,000 95,000 15,000 536,000
Irrigation 2070 <500 119,000 0 118,000 3,000 153,000 15,000 1,197,000
Municipal 2020 <500 13,000 29,000 15,000 0 2,000 0 218,000
Municipal 2070 <500 82,000 167,000 155,000 19,000 1,000 1,000 977,000
Mining 2020 0 1,000 0 2,000 <500 <500 0 16,000
Mining 2070 0 2,000 0 1,000 <500 <500 0 17,000
Manufacturing 2020 0 0 0 <500 2,000 <500 0 2,000
Manufacturing 2070 0 0 0 1,000 15,000 <500 1,000 19,000
Steam-electric 2020 0 1,000 0 2,000 0 0 0 3,000
Steam-electric 2070 0 1,000 0 2,000 0 0 0 8,000
Livestock 2020 <500 0 0 0 0 0 0 <500
Livestock 2070 <500 0 0 0 0 0 0 <500
a Statewide totals may vary between tables due to rounding.
8.4.2 Agricultural conservation
Irrigation for agricultural production is the largest water demand sector in the state for most of the
planning horizon and is projected to account for 40 percent of annual statewide water use in 2070.
Identified water supply needs for this sector account for 44 percent of total statewide needs in 2070.
Irrigation conservation strategies include changes to irrigation methods, equipment, and crops. For
example, conversion to Low Energy Precision Application systems and irrigation scheduling, as well as
other activities associated with irrigation best management practices, can help producers reduce their
water use. Like municipal conservation, irrigation conservation strategies tend to be an aggregate of
multiple best management practices, any one of or several of which could be implemented to achieve
the estimated water savings of the strategy. About 536,000 acre-feet per year in irrigation conservation
strategies is recommended in 2020, and 1.2 million acre-feet per year is recommended in 2070 (Table 8-
2).
Implementing all recommended irrigation conservation strategies will cost approximately $1.1 billion, or
slightly more than 1 percent of the total capital costs of all recommended water management strategy
projects in the plan. Conservation is the primary strategy recommended to address identified irrigation
needs in most regions and has an estimated statewide average implementation cost of about $181 per
acre-foot in 2070. Irrigation conservation is consistently the largest statewide relative share of
recommended conservation and remains so in 2070, even as volumes of municipal needs addressed by
conservation increase across the planning horizon (Figure 8-1).
In addition to irrigation water use for agricultural production, livestock water use is another water need
identified within the state. However, compared to irrigation water use, livestock accounts for a less
significant amount of water use throughout the state. Conservation strategies are also recommended for
a small number of livestock water users in Region J, roughly less than 500 acre-feet per year in 2020 and
2070.

DRAFT 2022 State Water Plan | Texas Water Development Board D-129
Figure 8-1. Share of statewide recommended conservation water management strategies by use
sector in 2070 (percent)
8.4.3 Industrial conservation
Conservation is also a recommended strategy for numerous steam-electric, manufacturing, and mining
water users. Recommended conservation measures for these users, to be implemented mostly by
private interests, are generally based on best management practices appropriate for each facility, which
may include evaluating more efficient cooling and process water practices, water audits, or submetering.
Although presented individually in this subchapter, these sectors of use are collectively presented as
industrial conservation elsewhere in this state water plan. In 2020, 21,000 acre-feet per year in industrial
conservation strategies is recommended, and about 44,000 acre-feet per year is recommended in 2070
(Table 8-2).
Three regions (Regions B, K, and M) recommend conservation strategies for steam-electric water users.
Approximately 3,000 acre-feet per year in steam-electric conservation strategies is recommended in
2020, and 8,000 acre-feet per year is recommended in 2070.
Seven regions (Regions C, D, G, M, N, O, and P) recommend conservation strategies for manufacturing
water users. Region N recommends the most manufacturing conservation strategy supplies, accounting
for 70 percent of statewide manufacturing conservation strategy supplies in 2020 and more than 80
percent in 2070. Total supplies from recommended manufacturing conservation strategies increase
significantly over the planning horizon from about 2,000 acre-feet per year in 2020 to 19,000 acre-feet
per year in 2070.
Eight regions (Regions B, C, F, G, K, M, N, and O) recommend conservation strategies for mining water
users. Total mining conservation strategy supplies fluctuate slightly but are relatively stable over the

DRAFT 2022 State Water Plan | Texas Water Development Board D-130
planning period. Approximately 16,000 acre-feet per year in mining conservation strategies is
recommended in 2020, and 17,000 acre-feet per year is recommended in 2070. More than 65 percent of
the 2020 mining conservation supplies are recommended for mining water users in Regions C and F. By
2070, Region C accounts for over half of the recommended mining conservation strategy supplies.
8.5 Conservation implementation
Measuring and tracking conservation implementation can be challenging due to limitations in utilities’
data across water use sectors and the large number of factors that can impact water use, such as
weather (BBC, 2012; WCAC, 2020; TWDB, 2021). Historical implementation of statewide municipal
conservation can be observed in the generally declining trend of the statewide average municipal gallons
per capita per day as reported through the TWDB’s annual water use survey (Figure 8-2).20 The 2006
and 2011 peaks in reported use correspond to drought conditions experienced across the state.
20 www.twdb.texas.gov/waterplanning/waterusesurvey/estimates/index.asp

DRAFT 2022 State Water Plan | Texas Water Development Board D-131
Figure 8-2. Historical statewide average municipal gallons per capita per day (2000–2018)
GPCD=gallons per capita per day
Each regional water plan is required to report on the implementation status of all strategies that they
recommended in their previous plan. Gathering the required information is generally accomplished
through surveys of entities in the regional water planning area. The surveys differentiated conservation
strategies from conservation projects. Strategies do not require infrastructure or capital costs, whereas
projects do.
Based on survey respondents and as reported by the regional water planning groups, implementation
data indicates that of the conservation strategies with reported information (55 percent of all
recommended conservation strategies in the 2017 State Water Plan), 81 percent of respondents
reported implementation, and 5 percent reported progress towards implementation. Of the
conservation projects with reported information (56 percent of all recommended conservation projects in
the 2017 State Water Plan), 61 percent of respondents reported implementation, and 24 percent
reported progress towards implementation.
The TWDB financial programs have supported implementation of certain conservation projects
statewide, whether recommended in the state water plan or not. Additionally, since the passage of
House Bill 3605 in 2013, all retail water utilities applying for financial assistance for a water supply
project from the TWDB must be below water loss thresholds established by the agency, thus
encouraging conservation. If the water loss of the applicant is above the thresholds, a portion of the
financial assistance project must include water loss mitigation activities. However, if the applicant has
water loss above the threshold and is addressing that water loss independently of the project that it is
seeking to fund, the utility can apply for a waiver from the TWDB.

DRAFT 2022 State Water Plan | Texas Water Development Board D-132
Ultimately, each utility is best suited to track its own progress on implementing its programs. However,
data that is reported to the TWDB for water conservation plans and annual reports provides insight
into the implementation of these conservation programs across the state. Data collected through annual
conservation reports indicates an overall reduction in water use (Figure 8-3). Utilities are required to
establish 5- and 10-year goals for total water use, residential water use, and water loss, expressed in
gallons per capita per day in their water conservation plans.
Figure 8-3. Statewide historical, median gallons per capita per day (GPCD) and 5- and 10-year
goals for total water use, residential water use, and water loss
Implementing irrigation conservation strategies is the focus of the Agricultural Water Conservation
Grants and Loan programs. Collectively, grant recipients reported more than 537,000 acre-feet of water
savings over the past 10 years. Over the same 10-year period, the Agricultural Loans Program saved an
estimated additional 85,000 acre-feet. The Loans Program generally funds large-scale equipment cost-
share lending programs that encourage producers to implement more efficient irrigation systems and
technologies, such as center-pivot irrigation devices.
8.6 Conservation policy recommendations from the regional water
planning groups
Each regional water plan contains policy recommendations developed by the planning groups for
consideration by the legislature and various state agencies, including the TWDB. Every planning group
included at least one policy recommendation related to either conservation planning, gallons per capita
per day goals and calculations, project funding, program support, or data collection. Five planning groups
recommended continued support of the state’s Water Conservation Advisory Council and its
recommendations. Several planning groups recommended funding additional data collection to support
the understanding of conservation implementation in various sectors of water use and to better inform
the development of future conservation measures and recommended strategies. A majority of the

DRAFT 2022 State Water Plan | Texas Water Development Board D-133
planning groups recommended that the legislature continue funding conservation initiatives and project
development through the TWDB and other state agencies, including infrastructure projects, educational
programs, and demonstration projects.
References
Averitt and Associates Inc., August 2017, Statewide water conservation quantification project: Prepared
for the Texas Water Development Board, 3,267 p.
BBC Research and Consulting, February 2012, Water conservation savings quantification study:
Prepared for the Texas Water Development Board, 121 p.
TWDB (Texas Water Development Board), Texas Commission on Environmental Quality, and Texas
Water Conservation Advisory Council, December 2012, Guidance and methodology for reporting on
water conservation and water use, 62 p.
TWDB (Texas Water Development Board), January 2019, Evaluation of best management practices in
certain water conservation plans, 24 p.
TWDB (Texas Water Development Board), 2021, Water use of Texas water utilities, 25 p.
WCAC (Water Conservation Advisory Council), December 2020, Progress made in water
conservation: Report and recommendations to the 87th Texas legislature, 43 p.
WCITF (Water Conservation Implementation Task Force), November 2004, Water conservation
implementation task force report to the 79th legislature, 78 p.

DRAFT 2022 State Water Plan | Texas Water Development Board D-134
9 Financing needs

DRAFT 2022 State Water Plan | Texas Water Development Board D-135
Quick facts
Of the $80 billion in capital costs required to implement the state water plan over the next 50 years,
approximately $47 billion, or 59 percent, was reported as requiring state financial assistance.
The reported state financial assistance need in the 2022 State Water Plan for municipal water management
strategies is approximately $10 billion greater than the 2017 State Water Plan.
The State Water Implementation Fund for Texas (SWIFT) program, created specifically to fund state water plan
projects, has already committed almost $8.2 billion toward projects in this state water plan.21
Regional water planning groups estimated the costs of water management strategies such as
conservation, groundwater development, desalination, and new reservoirs. In the event of a recurrence
of a drought of record, these strategies would need to be implemented to meet the water needs of
their regions for the next 50 years. Implementing many of these strategies will require financing to
support project phases such as planning, permitting, design, and construction.
The TWDB serves as a source of financial assistance for municipalities and rural areas across Texas. It
administers loans and grants through several cost-effective state and federal programs to finance water
supply development. These programs provide for the planning, design, and construction of water-related
infrastructure and other water quality improvements. Through December 2020, the TWDB has
committed more than $30.5 billion for water and wastewater projects in Texas via the agency’s financial
assistance programs.
9.1 Costs of implementing the state water plan
The estimated total capital costs of the water management strategy projects recommended by the 16
regional water planning groups in this plan is $80 billion. The total capital costs of all recommended
strategies increased by $17 billion, or over a quarter, from $63 billion in the previous plan to $80 billion
due to many factors, but primarily due to increased costs of construction in general22, refinement of
projects through the planning phases, increased engagement of water providers and communities in the
regional planning process, and a more comprehensive effort by the regional water planning groups to
incorporate more projects that will conserve water or increase treated water supply volumes.
The projects in this plan include conservation programs; groundwater development; treating water; and
developing additional water sources, new reservoirs, aquifer storage and recovery systems, and
desalination projects that would meet the drought needs of their regions during the next 50 years. Many
of these projects vary in stages of implementation and are anticipated to be completed at various points
in time throughout the next 50 years (Figure 9-1). All strategies and projects identify the decade year by
which they are projected to be online.
The planning groups estimated the total capital costs of projects and the annual unit costs for each
water user group. Direct and indirect capital costs include, but are not limited to
• engineering and feasibility studies, including those for permitting and mitigation;
• construction;
• professional services related to legal assistance and financing costs;
• land and easement acquisition; and
21 To be updated prior to adoption of the final 2022 State Water Plan.
22 Over a 5-year period between regional water planning cycles, the Engineering News Record Construction Cost
Index increased by approximately 17 percent.

DRAFT 2022 State Water Plan | Texas Water Development Board D-136
• purchases of water rights.
Unit costs of water supply (dollars per acre-foot supplied in each year) are calculated based on total
annual costs divided by the associated water volume and include annual debt service associated with the
capital costs as well as operation and maintenance costs. Operation and maintenance costs, including
power costs, are based on the quantity of water supplied and include all related expenses.
The estimated costs above do not include the additional costs associated with maintaining or expanding
retail water system distribution facilities or the costs of replacing aging infrastructure, with the specific
exception of conservation strategies that reduce water loss through replacement of internal distribution
system lines. The TWDB has other financing options that are available to finance rehabilitation and
replacement costs, which are summarized at the end of this chapter.
Figure 9-1. Cumulative total capital costs of all recommended water management strategy
projects by decade (in billions)
Approximately 97 percent ($77.1 billion) of the $80 billion in anticipated capital costs is associated with
recommended water management strategy projects that are sponsored by municipal water user groups
and wholesale water providers (Figure 9-2). Region C ($29.9 billion), Region H ($20.1 billion), and
Region G ($5.5 billion) have the highest estimated capital costs required to implement the
recommended strategy projects in their 2021 regional water plans (Table 7-2). The costs associated
with these three planning areas account for approximately 70 percent of the total capital costs in the
2022 State Water Plan. These regions represent approximately 60 percent of the state’s projected
population in 2070 (Table 4-1) and more than two-thirds of the total projected municipal water needs
for the state by 2070 (Appendix C).

DRAFT 2022 State Water Plan | Texas Water Development Board D-137
Figure 9-2. Total capital costs of all recommended water management strategy projects by
wholesale water providers and water user group sponsor type (in billions)
9.2 Funding assistance required to implement the state water plan
The 16 regional water planning groups administer a survey toward the end of each planning cycle to
estimate the amount of state financial assistance that local and regional water providers will require to
implement the water management strategy projects. The surveys attempt to collect accurate funding
needs for projects that may qualify for state funding programs. Survey responses were received for
approximately 24 percent of the sponsors associated with recommended projects in the 2022 State
Water Plan, capturing 59 percent of the recommended project costs.
As of November 2020, water providers reported an anticipated need of over $47 billion from state
financial assistance programs. Of this, $10.4 billion, or approximately 22 percent, was associated with
planning, design, permitting, and acquisition activities, with the remaining $36.7 billion, or approximately
78 percent, associated directly with construction activities (Figure 9-3).

DRAFT 2022 State Water Plan | Texas Water Development Board D-138
Figure 9-3. Reported state financial assistance needs by decade* (in billions)
* State financial assistance may be needed prior to a project’s online decade. Reported financial assistance needs for 2020–2029
includes costs, including permitting and acquisition, for projects with online decades ranging from 2020 to 2070.
Of the total required state financial assistance
• approximately $18.3 billion is expected to be required prior to 2030,
• approximately $46.6 billion is required to assist in implementing recommended strategies
sponsored by municipal water providers or wholesale water providers, and
• approximately $3.9 billion is required by sponsors seeking state assistance through state
ownership of excess capacity of their larger projects.
9.3 Financing the state water plan and other water-related projects
Recognizing the need for affordable financial assistance, the Texas Legislature entrusted the TWDB with
a set of financing tools to help public utilities achieve their water infrastructure goals. Due to the high
costs of water projects, many water providers seek financial assistance from the state or federal
government, which may provide attractive financing and subsidies.
In Texas, political subdivisions have traditionally provided a majority of the financing for water-related
infrastructure projects through municipal debt on the open bond market or, less frequently, with cash
or private equity sources such as banks.
The federal government has also historically implemented water projects, and earlier state water plans
relied heavily on the federal government for financial assistance. Federal agencies such as the U.S.

DRAFT 2022 State Water Plan | Texas Water Development Board D-139
Natural Resources Conservation Service (formerly the Soil Conservation Service), the U.S. Bureau of
Reclamation, and the U.S. Army Corps of Engineers constructed a number of surface water reservoirs in
Texas. These reservoirs were built for the primary purpose of flood control but also provide a large
portion of the state’s current water supply.
However, the pace of federal spending on reservoir construction has declined considerably since the
1950s and 1960s, when most of the major federal reservoirs in the state were constructed. Federal
policy has recognized a declining federal interest in the long-term management of water supplies and
assigns the financial burden of developing water supplies to local users (USACE, 1999).
9.3.1 TWDB financial assistance
To accomplish the goals of planning for the state’s water resources, the TWDB offers a variety of cost-
effective loan and grant programs that provide for the development and implementation of water supply
projects. Programs range from addressing the immediate needs of a community in meeting regulatory
requirements to providing long-term water supply solutions. The TWDB administers multiple financial
programs to provide financial assistance to political subdivisions. These programs include providing
financial assistance through the issuance of general obligation as well as revenue bonds. General
obligation bonds, secured by the full faith and credit of the State of Texas, may be issued for all
components of water supply, wastewater conveyance and treatment, flood control projects, and water
projects that involve conversion from a groundwater supply source to a surface water supply. Revenue
bonds, which are secured by repayments from program participants, may be issued to facilitate the
provision of wastewater treatment projects through the State Water Pollution Control (Clean Water)
Revolving Fund and for the provision of facilities for the treatment of drinking water through the State
Safe Drinking Water Revolving Fund, or for the purpose of implementing the State Water Fund through
issuance under the State Water Implementation Revenue Fund for Texas (SWIRFT) Fund. With strong
credit ratings, the TWDB can offer lower interest rates than many water providers would be able to
obtain through traditional financing means.
The TWDB’s authority to issue general obligation bonds was first approved by the Texas Legislature and
voters in 1957 through a constitutional amendment. It authorized the agency to issue $200 million in
general obligation bonds for financial programs for constructing dams, reservoirs, and other water
storage projects. Since 1957, the Legislature and the voters of the state have approved several
constitutional amendments increasing the issuance authority and authorized funding purposes.
9.3.2 State Water Implementation Fund for Texas
SWIFT was established by the Texas Legislature in 2013 to provide affordable, ongoing state financial
assistance for recommended projects in the state water plan. The program helps communities develop
cost-effective water supplies by providing low-interest loans, extended repayment terms, deferral of
loan repayments, and incremental repurchase terms through the Board Participation program that
includes financing terms similar to the State Participation program. Since inception, the SWIFT program
has committed almost $9 billion to state water plan projects of which almost $8.2 billion is toward
projects included in this state water plan.23
Before SWIFT was created, there were limited funding opportunities to finance the sizable costs of all
the projects in the state water plan. The Water Infrastructure Fund, created by the legislature in
2007, was the predecessor program to SWIFT to provide financial incentives for the implementation of
strategies recommended in the state water plan. The program has effectively been replaced by SWIFT,
which is generally based on the Water Infrastructure Fund’s program structure.
23 To be updated prior to adoption of the final 2022 State Water Plan.

DRAFT 2022 State Water Plan | Texas Water Development Board D-140
The 83rd Texas Legislature decided to change that by establishing SWIFT and its associated funding
mechanism, SWIRFT (State Water Implementation Revenue Fund for Texas). Passed by the legislature
and approved by Texas voters through a constitutional amendment, SWIFT was enacted to develop and
optimize water supply projects in the state water plan. Accordingly, to be eligible for SWIFT funding, a
project and its associated capital costs must be included in the state water plan.
The legislature also put in place a process for prioritizing recommended projects at both the regional
and state level. At the regional level, the 16 planning groups prioritize all recommended water
management strategy projects in their regional water plans every five-year cycle using uniform standards
developed by the stakeholder committee composed of the planning group chairs.
At the state level, the TWDB’s administrative rules include a prioritization system for projects applying
for SWIFT funding. This system includes factors required by the SWIFT legislation and the associated
weighting of criteria, such as how many people will be served by the project, whether the project will
serve a diverse urban and rural population, and the project ranking by the planning group. Other criteria
include the local financial contribution, emergency needs for water, and the project’s impact on
conservation. Typically, the TWDB solicits SWIFT abridged applications once a year, and the projects
proposed in each application are prioritized using this system.
9.3.3 Other TWDB state-funded programs
In addition to SWIFT, the TWDB offers other financial assistance programs to fund projects in the state
water plan as well as projects not included in, but consistent with, the state water plan. These low
interest rate programs encourage municipalities to break ground on projects to ensure an adequate
water supply for future generations.
The Texas Water Development Fund was created in 1957 with the passage of the agency’s first
constitutional amendment and is the oldest of the TWDB’s programs. The program is a streamlined
state loan program that provides financing for various types of infrastructure projects. This program
enables the TWDB to fund projects with multiple purposes, like water and wastewater or flood control,
in one loan.
The State Participation Program allows for the “right sizing” of projects in consideration of future
water needs. The program encourages the optimum development of regional projects by funding excess
capacity for future use. The TWDB assumes a temporary ownership interest, and the local sponsor
repurchases the TWDB’s interest as growth is realized and additional customers connect to the system.
Projects can include reservoirs, well fields, water rights, wastewater, and flood control. The 86th Texas
Legislature passed House Bill 1052 in 2019, which expanded the program’s scope to encourage
interregional water supply projects and the development of desalination and aquifer storage and
recovery facilities.
The Rural Water Assistance Fund provides small, rural water utilities with low-cost, long-term
financing for water and wastewater projects. The program is designed to offer tax-exempt equivalent
financing to water supply corporations or projects ineligible for tax-exempt financing. Eligible applicants
are rural political subdivisions and nonprofit water supply corporations serving a population of 10,000 or
less, or counties in which no urban area has a population exceeding 50,000.
The Agricultural Water Conservation Program provides financial assistance in the form of loans
and grants for agricultural water conservation projects in Texas. The program supports the
implementation of strategies and practices that improve agricultural irrigation water use efficiency. Some
of the projects funded by the program include irrigation equipment upgrades, metering devices, and
construction projects that improve infrastructure, equipment, and efficiency of irrigation delivery.

DRAFT 2022 State Water Plan | Texas Water Development Board D-141
The Economically Distressed Areas Program provides financial assistance in the form of grants
and loans for water and wastewater projects in economically distressed areas where service is
unavailable or inadequate to meet state standards. Funded projects must be located in counties that are
enforcing adopted Model Subdivision Rules. The 86th Texas Legislature passed Senate Bill 2452 making
some changes to the program, including requiring a prioritization process for future funding cycles.
Another change, which was approved by Texas voters in November 2019, allows the TWDB to issue
bonds on a continuing basis not to exceed $200 million outstanding for water supply and wastewater
services in economically distressed areas. As of January 2021, future funding requires additional
legislative action.
The newly established Flood Infrastructure Fund became available in 2020 to provide grants and
low-cost loans for drainage, flood mitigation, and flood control projects, some of which may have a
water supply component. This fund was created during the 86th Texas Legislative Session through the
passage of Senate Bill 7 and the accompanying $793 million contained in Senate Bill 500. Texas voters
approved a supporting constitutional amendment on November 5, 2019, that directs the TWDB to
administer a new statewide flood mitigation plan by 2024.
9.3.4 TWDB federally funded programs
In addition to the state-funded programs, the TWDB is the primary state agency through which two
federal revolving fund programs are administered.
The Clean Water State Revolving Fund (CWSRF) was authorized by the Clean Water Act to
provide low-cost financial assistance for planning, acquisition, design, and construction of wastewater,
reuse, and stormwater infrastructure. Recent streamlining of the program provides year-round funding
as projects are included in the CWSRF Intended Use Plan. This funding addresses water quality needs by
building on state partnerships with the U.S. Environmental Protection Agency. Currently, all 50 states
and Puerto Rico operate CWSRF programs. The program is funded by annual capitalization grants from
the U.S. Congress through the Environmental Protection Agency, a required 20 percent state funding
match, loan repayments, and revenue bonds.
The Drinking Water State Revolving Fund (DWSRF) was authorized by the Safe Drinking Water
Act to assist communities by providing low-cost financing for a wide range of water projects that
facilitate compliance with drinking water standards. Below market interest rate loans are offered for
planning, acquisition, design, and construction of water infrastructure projects such as water treatment
facilities, system upgrades, source water protection, and flood resiliency projects. Like the CWSRF,
recent streamlining of the program provides year-round funding as projects are included in the DWSRF
Intended Use Plan. The program is funded by annual capitalization grants made by the U.S. Congress
through the U.S. Environmental Protection Agency, a required 20 percent state funding match, loan
repayments, and revenue bonds.
References
USACE (U.S. Army Corps of Engineers), 1999, Water resources policies and authorities, Digest of
Water Resources Policies and Authorities: U.S. Army Corps of Engineers Publication Number 1165-2-1,
381 p., www.publications.usace.army.mil/Portals/76/Publications/EngineerPamphlets/EP_1165-2-1.pdf

DRAFT 2022 State Water Plan | Texas Water Development Board D-142
10 Implementation and funding of
the 2017 State Water Plan
DRAFT 2022 State Water Plan | Texas Water Development Board D-143
Quick facts
Regional water planning groups reported that 477, or 43 percent, of the water management strategies
recommended in the 2017 State Water Plan that do not require a capital project were either partially or fully
implemented.
Planning groups reported that 979 projects in the 2017 State Water Plan were either partially or fully
implemented. This represents nearly 39 percent of the approximately 2,500 recommended projects.
Of the total estimated $63 billion in project costs in the 2017 State Water Plan, approximately $6.5 billion was
funded through the TWDB’s financial assistance programs and is associated with 61 projects.
Regional water planning groups assist in evaluating the state’s progress in meeting future water needs by
assessing the previously recommended water management strategies implemented during the five-year
planning cycle. The state water plan also includes information on state water plan projects funded since
adoption of the previous state water plan. In 2017, the Texas Legislature passed Senate Bill 1511
requiring an assessment of the extent to which projects were implemented in the decade in which they
were needed and an analysis of any impediments that resulted in any projects not being implemented on
time. This requirement applies to projects in the previous state water plan that the TWDB prioritized
for SWIFT funding. The 2022 State Water Plan is the first plan required to incorporate information on
implementation impediments.
10.1 Implementation of the 2017 State Water Plan
Water management strategies in the state water plan may or may not require new infrastructure—
referred to as water management strategy projects—to be developed. The 2017 State Water Plan was
the first to clearly differentiate between strategies and infrastructure projects. Not every strategy
requires a project, but every project is tied to an associated strategy. Planning groups reported on the
implementation of water management strategies and projects from the 2017 State Water Plan in their
2021 regional water plans. To do this, the planning groups surveyed the project sponsors and reported
on the extent to which water infrastructure projects had progressed toward planning, design, or
construction phases. They also gathered information on strategies that do not require new
infrastructure development. Examples include demand reduction strategies (conservation and drought
management) and other supply development strategies, such as utilization of unallocated supplies,
contract purchases, and voluntary redistributions or transfers that use existing infrastructure. Because
water management strategies, particularly those involving infrastructure projects, can require several
years to fully implement, strategy (and project) progress was categorized in two ways:
1. Implemented: when a strategy is fully capable of meeting water needs in the manner planned
2. Progress toward implementation: includes any type of implementation step (including start of
project construction or pre-implementation activity such as negotiating contracts, applying for and
securing financing or state and federal permits, or conducting preliminary engineering studies) or
achieving a portion of the total anticipated conservation savings from a strategy

DRAFT 2022 State Water Plan | Texas Water Development Board D-144
Statewide implementation progress is presented below as
• the relative count of strategies not associated with a project compared to the total number of
recommended strategies not associated with a project (approximately 1,100) in the 2017 State
Water Plan24 (Figure 10-1); and
• the relative count of projects compared to the total number of recommended projects
(approximately 2,500) in the 2017 State Water Plan (Figure 10-2).
The planning groups reported implementation survey information regarding 624 strategies not
associated with a project. Of these, about 71 percent were fully implemented and another 5 percent
reported some form of implementation progress. Strategies reported as fully implemented represent
about 40 percent of the total number of recommended water management strategies without an
associated project in the 2017 State Water Plan. The water supplies associated with these fully
implemented strategies now appear as existing supply on the supply side of the planning equation in this
current water plan. Strategies reported as only partially implemented represent almost 3 percent of the
total number of strategies without associated projects in the 2017 State Water Plan.
Planning groups also reported, separately from strategies, implementation status information for the
approximately 1,500 projects in the 2017 State Water Plan. Of the approximately 40 percent of projects
that were reported on, about half of those were reported as being fully implemented with the other half
of those reporting some degree of implementation progress. Fully implemented projects, as reported,
represent $3.8 billion, or 6 percent, of the $63 billion in total capital costs associated with the 2017
State Water Plan; the partially implemented projects, as reported, represent $36.6 billion, or 58
percent, of the total capital costs.
New to this round of planning was a requirement from House Bill 807, 86th Legislative Session, directing
the regional planning groups to assess their progress in encouraging cooperation between water user
groups to develop strategies that achieve economies of scale and benefit the entire region. This
assessment is included in Chapter 11 of the 2021 regional water plans. To meet this requirement, some
planning groups highlighted the roles of regional water providers, provided examples of water
management strategies and projects that involve multiple sponsors or benefit multiple water user
groups, or described how the regional water planning process has encouraged cooperation in the
region. Several planning groups noted that regional scale projects are not necessarily practical in areas
where needs are already being met or in sparsely populated areas where the costs of transmission may
outweigh the cost savings from economies of scale. Planning groups reported that 29 projects
recommended in the 2017 State Water Plan to serve multiple water user groups have been fully
implemented.
24 The count of water management strategies and the capital cost of projects associated with the 2017 State Water
Plan include amendments to the plan.

DRAFT 2022 State Water Plan | Texas Water Development Board D-145
Figure 10-1. Reported implementation of recommended water management strategies not
associated with a project from the 2017 State Water Plan by share of total number of strategies
not associated with a project

DRAFT 2022 State Water Plan | Texas Water Development Board D-146
Figure 10-2. Reported implementation of all recommended water management strategy projects
from the 2017 State Water Plan by share of total number of projects
10.2 Impediments to implementation of the 2017 State Water Plan
Because the project evaluations in each five-year planning cycle are expected to consider current,
updated conditions and reflect changed circumstances since the previous plan, they are inherently
adaptive in reflecting the associated project implementation timelines. In addition to being survey based,
which results in limited responses, tracking implementation of all projects across multiple planning cycles
is difficult, especially for phased projects. However, certain larger and clearly and consistently defined
projects, such as the construction of new reservoirs, that have longer development timelines and more
reliable survey responses are easier to consistently track across water plans and are, therefore, more
easily assessed over time.
To better understand why some water management strategy projects are not implemented in the
decade in which they are needed, the planning groups are required to collect information regarding
impediments to implementation and do so via surveys sent to the project sponsors. This is the first time
the planning groups have had to address this legislative requirement to identify impediments; the 2020
decade is the only decade for which definitive passage of an identified online decade would have
occurred.
DRAFT 2022 State Water Plan | Texas Water Development Board D-147
Planning groups mentioned several categories of impediments to implementation, including access to
funding, the anticipated online date of the project is further in the future, and the permitting process
being the most common. Other identified impediments included lack of a project sponsor, land
acquisition, and water availability constraints. Because even technically and economically feasible
projects, especially large ones, require significant effort to implement, the impediments reported by
planning groups do not necessarily indicate a project will not be implemented. Rather, the identified
impediments indicate that implementation will take longer than previously anticipated and potentially
delay the online date. Right-of-way acquisition is a good example of a process that can create significant
delays, even for relatively straightforward projects that simply require conveyance pipelines.
The TWDB is limited in its ability to provide one-to-one assessments of the extent to which projects in
the previous plan were not implemented in the decade in which they are needed, especially for decades
beyond the first in the planning cycle. During each planning cycle, the planning groups update their water
management strategies, including the names, configuration, beneficiaries, capacity, and when the projects
are anticipated to be needed and fully operational. Due to these changes, including schedule updates, the
regional and state water plans will rarely reflect a project not being implemented in time for the
recommended decade and would only measurably apply to projects due to be online in 2020 but that
were not online then. Planning groups reported the implementation status of nearly 1,600 of the
approximately 2,700 water management strategies and projects in the 2017 State Water Plan that were
due to be online in 2020. Of these, about 55 percent were reported as fully implemented, just over 21
percent as partially implemented, 20 percent as not implemented, and almost 4 percent as no longer
recommended.
Of the 2017 State Water Plan projects prioritized for funding through the SWIFT program, no
impediments were noted in their implementation. Approximately 53 percent of the projects funded
through SWIFT indicated 2020 as the decade of need and received funding for project phases including
construction. The remaining 47 percent of the projects received funding prior to their decades of need
as reported in the 2017 State Water Plan, with the vast majority having an online decade of 2030.
10.3 Funding of the 2017 State Water Plan
Since adopting the 2017 State Water Plan, the TWDB has closed25 on approximately $8.8 billion in
additional financial assistance and delivered to project sponsors more than $6.5 billion toward the
implementation of state water plan projects (Table 10-1). In addition to the SWIFT program, the TWDB
also funded recommended water management strategies through several other funding programs
including the Board Participation Program, Texas Water Development Fund, Economically Distressed
Areas Program, and the Clean and Drinking Water State Revolving Funds.
A wide variety of water management strategies have received commitments for TWDB funding since
the adoption of the 2017 State Water Plan, including seawater desalination, transmission line expansions,
new water meters, acquisition of water rights, new groundwater wells, and aquifer storage and recovery
projects. Funding commitments, which may be larger than the estimated costs of those projects in the
state water plan, were associated with several different project sponsors throughout Texas, including
cities and regional water providers (Figure 10-3).
25 The TWDB first approves a commitment for financial assistance. After all appropriate reviews and requirements
are met, funds are released at closing.

DRAFT 2022 State Water Plan | Texas Water Development Board D-148
Table 10-1. 2017 State Water Plan projects funded by the TWDB, by project sponsor
Financial assistance
features
Map
re
feren
ce
Re
gio
n
Projecta Entity
State
wate
r p
lan
fun
din
g
Bo
ard
partic
ipatio
n
Oth
er s
tate
an
d f
ed
eral
fun
din
g p
ro
gram
s
Clo
se
d f
un
din
g a
mo
un
t
Asso
cia
te
d a
nn
ual
wate
r s
up
ply
(acre
-fe
et p
er y
ear)b
1
C
Main Street Water Line Replacement Azle x $1,350,000 1
2 Conservation, Water Loss Control - Boyd Boyd x $720,000 332
3 Conservation, Water Loss Control - Dallas Dallas x $132,000,000 5,500
4 Conservation, Water Loss Control - Everman Everman x $3,000,000 1
5 Krum New Wells in Trinity Aquifer Greater Texoma Utility Authority
x $1,225,000 202
6 Gunter New Well in Trinity Aquifer (2020) Greater Texoma Utility Authority
x $3,415,000 320
7 Conservation, Water Loss Control - Lake Kiowa Special Utility District
Greater Texoma Utility Authority
x $2,125,000 4
8 Grayson County Water Supply Project - Additional Texoma Supply from Greater Texoma Utility Authority
Greater Texoma Utility Authority
x $7,155,000 97
9 Enhanced Water Loss Control and Conservation Program
Justin x $4,800,000 35
10 Keller Enhanced Water Loss Control and Conservation Program
Keller x $8,120,000 514
11 Conservation, Water Loss Control - Ladonia Ladonia x $3,110,000 1
12 Conservation, Water Loss Control - Grayson County
Lake Texoma VFW Post 7873
x $200,000 15
13 Lower Bois d'Arc Creek Reservoir and Drinking Water Treatment Plant
North Texas Municipal Water District
x $1,476,980,000 120,665
14 Conservation, Water Loss Control - River Oaks
River Oaks x $8,000,000 750
15 Springtown New Wells in Trinity Aquifer Springtown x $1,390,000 81
16 Increase Delivery Infrastructure from Fort Worth
Trophy Club Municipal Utility District No. 1
x $4,635,000 7,398
17 Lake Ralph Hall Reservoir Upper Trinity Regional Water District
x x $209,680,000 33,604
18 Parallel Pipeline Taylor Regional Water Treatment Plant to Stonehill Pump Station
Upper Trinity Regional Water District
x $42,070,000 49,846
19 Increase Delivery Infrastructure from Fort Worth
Westlake x $2,100,000 6,497
20 D Riverbend Strategy (Texarkana) Annona x $300,000 94

DRAFT 2022 State Water Plan | Texas Water Development Board D-149
Financial assistance
features
Map
re
feren
ce
Re
gio
n
Projecta Entity
State
wate
r p
lan
fun
din
g
Bo
ard
partic
ipatio
n
Oth
er s
tate
an
d f
ed
eral
fun
din
g p
ro
gram
s
Clo
se
d f
un
din
g a
mo
un
t
Asso
cia
te
d a
nn
ual
wate
r s
up
ply
(acre
-fe
et p
er y
ear)b
21 Riverbend Strategy (Texarkana) Riverbend Water Resources District
x $18,000,000 67,209
22
E
Town of Anthony - Arsenic Treatment System
Anthony x $980,000 435
23 Bone Spring - Victorio Peak Aquifer Land and Water Rights Acquisition
El Paso Public Service Board
x $200,000,000 20,000
24
F
Voluntary Transfer from Clyde - Fort Phantom Hill Supplies
Ballinger x $3,393,435 1,250
25 Advanced Groundwater Treatment - Brady Brady x $28,905,000 3,500
26 Additional Treatment - Mason Mason x $2,659,200 2,242
27 Hickory Well Field Expansion in McCulloch County - San Angelo
San Angelo x $56,075,000 3,000
28
G
Brushy Creek Regional Utility Authority Water Treatment and Distribution Project
Brushy Creek Regional Utility Authority
x $32,735,000 14,562
29 Aquifer Storage and Recovery (Carrizo-Wilcox)
Bryan x $2,345,000 11,900
30 Reuse - Cleburne Cleburne x $42,000,000 4,480
31 East Williamson County Water Project Lone Star Regional Water Authority
x $1,500,000 11,762
32 Water Conservation Waco x $12,000,000 1,462
33
H
Central Harris County Regional Water
Authority Transmission and Distribution Expansion
Central Harris County
Regional Water Authority
x $12,585,000 5,470
34 Houston - Northeast Water Purification Plant Expansion
Central Harris County Regional Water Authority
x $35,140,000
358,447
Houston x $294,455,000
North Fort Bend Water Authority
x $350,780,000
North Harris County
Regional Water Authority
x $727,060,000
West Harris County Regional Water Authority
x $395,810,000
35 Houston - Second Source Phase I
Central Harris County Regional Water Authority
x $12,365,000 189,396
Houston x $192,825,000
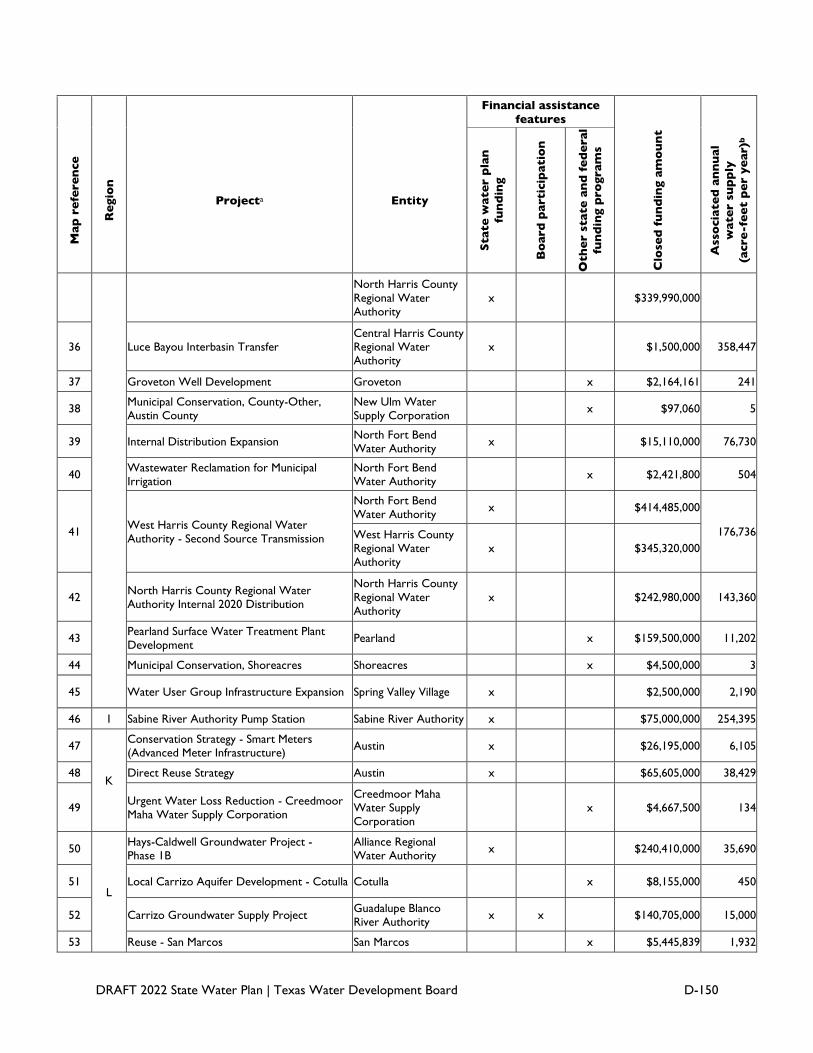
DRAFT 2022 State Water Plan | Texas Water Development Board D-150
Financial assistance
features
Map
re
feren
ce
Re
gio
n
Projecta Entity
State
wate
r p
lan
fun
din
g
Bo
ard
partic
ipatio
n
Oth
er s
tate
an
d f
ed
eral
fun
din
g p
ro
gram
s
Clo
se
d f
un
din
g a
mo
un
t
Asso
cia
te
d a
nn
ual
wate
r s
up
ply
(acre
-fe
et p
er y
ear)b
North Harris County
Regional Water Authority
x $339,990,000
36 Luce Bayou Interbasin Transfer Central Harris County Regional Water Authority
x $1,500,000 358,447
37 Groveton Well Development Groveton x $2,164,161 241
38 Municipal Conservation, County-Other, Austin County
New Ulm Water Supply Corporation
x $97,060 5
39 Internal Distribution Expansion North Fort Bend Water Authority
x $15,110,000 76,730
40 Wastewater Reclamation for Municipal Irrigation
North Fort Bend Water Authority
x $2,421,800 504
41 West Harris County Regional Water Authority - Second Source Transmission
North Fort Bend Water Authority
x $414,485,000
176,736 West Harris County Regional Water Authority
x $345,320,000
42 North Harris County Regional Water Authority Internal 2020 Distribution
North Harris County
Regional Water Authority
x $242,980,000 143,360
43 Pearland Surface Water Treatment Plant Development
Pearland x $159,500,000 11,202
44 Municipal Conservation, Shoreacres Shoreacres x $4,500,000 3
45 Water User Group Infrastructure Expansion Spring Valley Village x $2,500,000 2,190
46 I Sabine River Authority Pump Station Sabine River Authority x $75,000,000 254,395
47
K
Conservation Strategy - Smart Meters (Advanced Meter Infrastructure)
Austin x $26,195,000 6,105
48 Direct Reuse Strategy Austin x $65,605,000 38,429
49 Urgent Water Loss Reduction - Creedmoor Maha Water Supply Corporation
Creedmoor Maha Water Supply Corporation
x $4,667,500 134
50
L
Hays-Caldwell Groundwater Project - Phase 1B
Alliance Regional Water Authority
x $240,410,000 35,690
51 Local Carrizo Aquifer Development - Cotulla Cotulla x $8,155,000 450
52 Carrizo Groundwater Supply Project Guadalupe Blanco River Authority
x x $140,705,000 15,000
53 Reuse - San Marcos San Marcos x $5,445,839 1,932

DRAFT 2022 State Water Plan | Texas Water Development Board D-151
Financial assistance
features
Map
re
feren
ce
Re
gio
n
Projecta Entity
State
wate
r p
lan
fun
din
g
Bo
ard
partic
ipatio
n
Oth
er s
tate
an
d f
ed
eral
fun
din
g p
ro
gram
s
Clo
se
d f
un
din
g a
mo
un
t
Asso
cia
te
d a
nn
ual
wate
r s
up
ply
(acre
-fe
et p
er y
ear)b
54 Expanded Carrizo for Schertz-Seguin Local Government Corporation
Schertz Seguin Local
Government Corporation
x x $66,500,000 6,500
55
M
Advanced Municipal Conservation - Eagle Pass
Eagle Pass x $26,975,000 208
56 Water Rights Acquisition McAllen x $6,900,000 3,000
57 Delta Area Reverse Osmosis Water Treatment Plant Expansion
North Alamo Water Supply Company
x $6,976,373 1,410
58 Off-Channel Storage Facility United Irrigation District
x $8,100,000 2,000
59
N
Brackish Groundwater Development - Alice Alice x $5,499,000 1,120
60 Chase Field Project Beeville x $4,500,000 1,491
61 Seawater Desalination Corpus Christi x $14,175,000 22,420
a Project name may vary from 2017 State Water Plan project name. b Water volumes may also be associated with other projects.
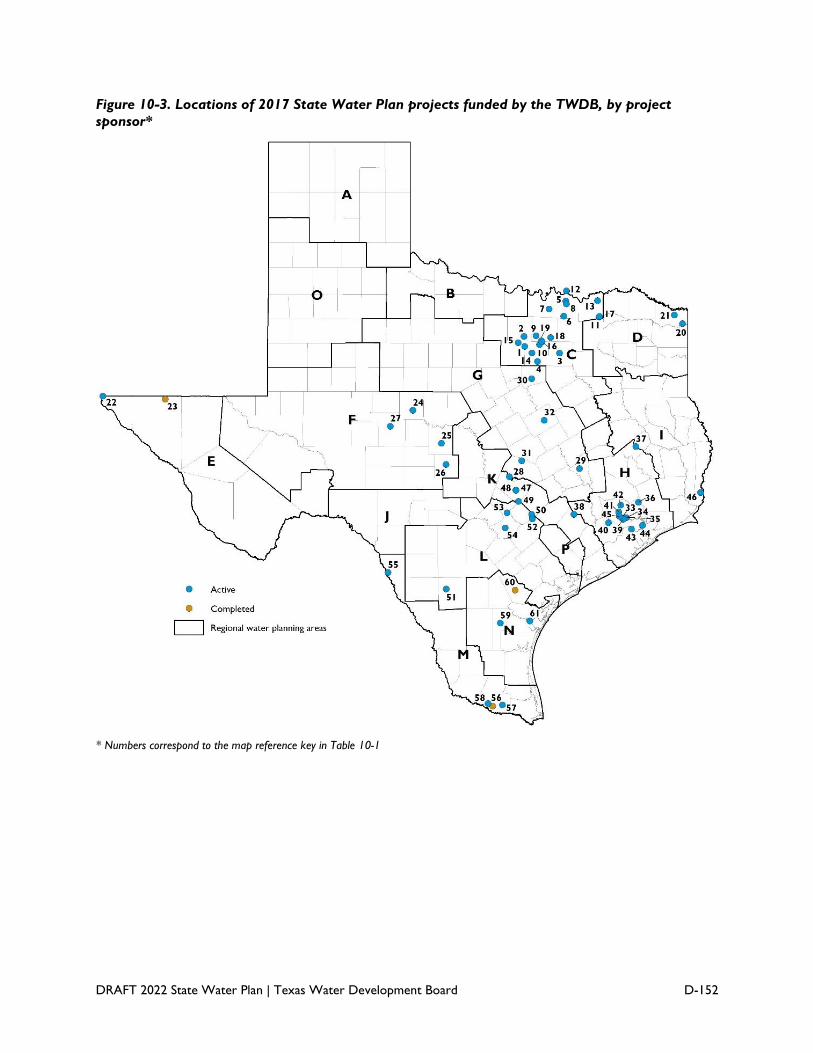
DRAFT 2022 State Water Plan | Texas Water Development Board D-152
Figure 10-3. Locations of 2017 State Water Plan projects funded by the TWDB, by project
sponsor*
* Numbers correspond to the map reference key in Table 10-1

DRAFT 2022 State Water Plan | Texas Water Development Board D-153
Glossary

DRAFT 2022 State Water Plan | Texas Water Development Board D-154
Acre-foot
Volume of water needed to cover one acre to a depth of one foot. It equals 325,851 gallons.
Aquifer
Geologic formation that contains sufficient saturated permeable material to yield significant quantities of
water to wells and springs. The formation could be sand, gravel, limestone, sandstone, or fractured
igneous rocks.
Availability
Maximum amount of raw water available from a source during the drought of record, regardless of
whether the supply is physically or legally available to water user groups.
Brackish water
Water containing total dissolved solids between 1,000 and 10,000 milligrams per liter.
Capital cost
Portion of the estimated cost of a water management strategy that includes both the direct costs of
constructing facilities, such as materials, labor, and equipment, and the indirect costs associated with
construction activities, such as engineering studies, legal counsel, land acquisition, contingencies,
environmental mitigation, interest during construction, and permitting.
Conjunctive use
Combined use of surface water, groundwater, and/or reuse sources that optimizes the beneficial
characteristics of each source.
County-other
Aggregation of utilities that provide less than an average of 100 acre-feet per year, as well as rural areas
not served by a water utility in a given county.
Desalination
Process of removing salt and other dissolved solids from seawater or brackish water.
Desired future condition
Desired, quantified condition of groundwater resources (such as water levels, spring flows, or volumes)
within a management area at one or more specified future times as defined by participating groundwater
conservation districts within a groundwater management area as part of the joint planning process.
Drought
Generally applied to periods of less than average precipitation over a certain period of time. Associated
definitions include meteorological drought (abnormally dry weather), agricultural drought (adverse
impact on crop or range production), and hydrologic drought (below-average water content in aquifers
and/or reservoirs).
Drought of record
The period of time when historical records indicate that natural hydrological conditions provided the
least amount of water supply.
Environmental flows
Amount of water that should remain in a stream or river for the benefit of the environment of the river,
bay, and estuary, while balancing human needs.

DRAFT 2022 State Water Plan | Texas Water Development Board D-155
Estuary
Bay or inlet, often at the mouth of a river and may be bounded by barrier islands, where freshwater and
seawater mix providing for economically and ecologically important habitats and species and that also
yields essential ecosystem services.
Existing water supply
Maximum amount of water that is physically and legally accessible from existing sources for immediate
use by a water user group under a repeat of drought of record conditions.
Firm yield
Maximum water volume a reservoir can provide each year under a repeat of the drought of record
using anticipated sedimentation rates and assuming that all senior water rights will be totally utilized and
all applicable permit conditions met.
Groundwater availability model
Regional groundwater flow model approved by the TWDB executive administrator.
Groundwater management area
Geographical region of Texas designated and delineated by the TWDB as an area suitable for
management of groundwater resources.
Industrial conservation
An aggregate presentation of anticipated water savings from conservation activities in the manufacturing,
mining, and electric power generation sectors of water use.
Infrastructure
Physical means for meeting water and wastewater needs, such as dams, wells, conveyance systems, and
water treatment plants.
Instream flow
Water flow and water quality regime adequate to maintain an ecologically sound environment in streams
and rivers.
Interactive state water plan
TWDB website that lets water users statewide take an up-close look at data in the 2022 State Water
Plan. Users can see how water needs change over time by showing projected water demands, existing
water supplies, relative severity and projected water needs (potential shortages), water management
strategies recommended to address potential shortages, and recommended capital projects and their
sponsors. www.2022.texasstatewaterplan.org
Interbasin transfer of surface water
Defined and governed in Texas Water Code § 11.085 (relating to interbasin transfers) as the diverting of
any state water from a river basin and transfer of that water to any other river basin.
Major reservoir
Reservoir having a storage capacity of 5,000 acre-feet or more.
Major water provider
Water user group or wholesale water provider of particular significance to the region’s water supply as
determined by the regional water planning group. This may include public or private entities that provide
water for any water use category.

DRAFT 2022 State Water Plan | Texas Water Development Board D-156
Modeled available groundwater
Amount of water the TWDB executive administrator determines may be produced on an average
annual basis to achieve a desired future condition.
Modeled available groundwater peak factor
A percentage that is applied to a modeled available groundwater value reflecting the annual groundwater
availability that, for planning purposes, is considered temporarily available for pumping consistent with
desired future conditions. The modeled available groundwater peak factor is not intended as a limit to
permits or as guaranteed approval or pre-approval of any future permit application.
Needs
Projected water demands in excess of existing water supplies for a water user group or a wholesale
water provider.
Regional water planning group
Group designated pursuant to Texas Water Code § 16.053. There are 16 water planning groups in
Texas responsible for developing regional water plans that are guided by statute, rules, contracts,
members of the planning groups, and the general public. Each group has diverse members with various
economic, social, and environmental interests in their areas.
Recharge
Water that infiltrates to the water table of an aquifer.
Relevant aquifer
Aquifers or parts of aquifers for which groundwater conservation districts have defined desired future
conditions.
Reuse
Use of surface water that has already been beneficially used under a water right or the use of
groundwater that has already been used (for example, using municipal reclaimed water to irrigate golf
courses).
Run-of-river diversion
Water right permit that allows the permit holder to divert water directly out of a stream or river.
Safe yield
Identified annual volume of water held in reserve to account for droughts worse than the drought of
record.
Sedimentation
Action or process of depositing sediment in a reservoir, usually silts, sands, or gravel.
Storage
Natural or artificial impoundment and accumulation of water in surface or underground reservoirs,
usually for later withdrawal or release.
Unmet needs
Amount of water demand that will still exceed the water supply after applying all recommended water
management strategies in a regional water plan.

DRAFT 2022 State Water Plan | Texas Water Development Board D-157
Water availability model
Numerical computer program used to determine the availability of surface water within each river basin
for permitting in the state.
Water management strategy
Plan by a discrete water user group to meet a need for additional water, which can mean increasing the
total water supply or maximizing an existing supply, including through reducing demands.
Water Service Boundary Viewer
Statewide public water system service area mapping application used to collect accurate retail water
service boundaries to better estimate and project utility population for the regional water plans and the
state water plan. The Viewer also helps in estimating rural population not served by a system and strives
to provide the most up-to-date and best data available on the service areas for all community public
water systems within Texas. www3.twdb.texas.gov/apps/waterserviceboundaries
Water user group
Identified user or group of users for which water demands and existing water supplies have been
identified and analyzed and plans have been developed to meet water needs. These include: privately-
owned utilities that provide an average of more than 100 acre-feet per year for municipal use for all
owned water systems; water systems serving institutions or facilities owned by the state or federal
government that provide more than 100 acre-feet per year for municipal use; all other retail public
utilities that provide more than 100 acre-feet per year for municipal use; collective reporting units or
groups of retail public utilities that have a common association and are requested for inclusion by the
regional water planning group; municipal and domestic water use, referred to as county-other; and non-
municipal water use including manufacturing, irrigation, steam-electric power generation, mining, and
livestock watering for each county or portion of a county in a regional water planning area.
Wholesale water provider
Person or entity, including river authorities and irrigation districts, that delivers or sells water wholesale
(treated or raw) to water user groups or other wholesale water providers or that the regional water
planning group expects or recommends to deliver or sell water wholesale to water user groups or
other wholesale water providers during the period covered by the plan. The regional water planning
groups identify the wholesale water providers within each region to be evaluated for plan development.

DRAFT 2022 State Water Plan | Texas Water Development Board D-158
Appendices

DRAFT 2022 State Water Plan | Texas Water Development Board D-159
Appendix A Background on Texas’ water planning history, institutions,
and laws
A.1 Texas water planning, 1904–1957
While formal statewide water planning did not begin until the 1950s, the Texas Legislature began
assigning responsibility for managing and developing the state’s water resources in the early 20th
century. A series of devastating droughts and floods in the early 1900s magnified the need for water
management. In 1904, a constitutional amendment was adopted authorizing the first public development
of water resources (Figure A-1). The legislature authorized the creation of drainage districts in 1905; the
Texas Board of Water Engineers in 1913; conservation and reclamation districts (later known as river
authorities) in 1917; freshwater supply districts in 1919; and water control and improvement districts in
1925.
The creation of the Texas Board of Water Engineers, a predecessor agency to both the Texas Water
Development Board and the Texas Commission on Environmental Quality, played a significant role in
the early history of water management in the state. The major duties of the Board of Water Engineers
were to approve plans for developing irrigation and water supply districts, issue water right permits for
storing and diverting water, and plan for storing and using floodwater. Later, the legislature authorized
the agency to define and designate groundwater aquifers; establish underground water conservation
districts; conduct groundwater and surface water studies; and approve federal projects, including those
constructed by the U.S. Army Corps of Engineers.
In 1949, Lyndon Johnson, then a U.S. Senator, wrote to the U.S. Secretary of the Interior requesting
federal assistance to help guide Texas in achieving “a comprehensive water program that will take into
account the needs of the people of my state.” The U.S. Bureau of Reclamation responded by publishing
“Water Supply and the Texas Economy: An Appraisal of the Texas Water Problem” (USBR, 1953). The
report divided the state into four planning regions and evaluated existing and projected municipal and
industrial water requirements up to the year 2000. The study recommended that Texas consider
forming a permanent water planning agency to guide state water policy going forward.
In the 1950s, Texas experienced its worst drought in recorded history. The drought began in 1950 and
by the end of 1956, all but one of Texas’ 254 counties were classified as disaster areas. The drought
ended in 1957 with massive rains that resulted in the flooding of every major river and tributary in the
state. This drought represents the driest seven-year period in the state’s recorded history and is still
considered the statewide “drought of record” upon which state and regional water supply planning in
Texas is based.
The drought of the 1950s was unique in that most Texans felt the impacts of water scarcity at some
point. Small and large cities alike faced dire situations. By the fall of 1952, the City of Dallas faced a
severe water shortage and prohibited all but necessary household use of water. In 1953, 28
municipalities were forced to use emergency sources of water supply, 77 were rationing water, and 8
resorted to hauling in water from neighboring towns or rural wells. The development of additional
water infrastructure during the drought reduced the number of communities with shortages during later
years of the drought, but many municipalities continued to be forced to haul in water before it was over
(TBWE, 1959). The drought also had significant impacts to agriculture and livestock production and led
tens of thousands of Texans to resettle from farms to cities. All told, the drought of the 1950s cost the
state hundreds of millions of dollars and was followed by floods that caused an additional $120 million in
damages (TBWE, 1958).

DRAFT 2022 State Water Plan | Texas Water Development Board D-160
Figure A-1. Texas water planning timeline

DRAFT 2022 State Water Plan | Texas Water Development Board D-161
A.2 State water planning, 1957–1997
The Texas Legislature responded to the drought of record by establishing the Texas Water Resources
Committee in 1953 to survey the state’s water problems (UT Institute of Public Affairs, 1955). As a
result of the committee’s recommendations, the legislature passed a resolution authorizing $200 million
in state bonds to fund water supply projects and created the Texas Water Development Board
(TWDB) to administer funds from the bond sale. In a special legislative session called by Governor Price
Daniel, the legislature passed the Water Planning Act of 1957, which created the Texas Water
Resources Planning Division of the Board of Water Engineers and assigned it the responsibility of
statewide water supply planning. Texas voters subsequently approved a constitutional amendment
authorizing the TWDB to administer a $200 million water development fund to help communities
develop water supplies.
In June of 1960, Governor Daniel called a meeting in Austin to request that the Board of Water
Engineers prepare a planning report with recommended projects to meet the projected municipal and
industrial water requirements of the state in 1980. Work quickly began on statewide studies to develop
the first state water plan. The first plan, A Plan for Meeting the 1980 Water Requirements of Texas, was
published in 1961. The plan described historical and present uses of surface water and groundwater by
municipalities, industries, and irrigated agriculture; summarized the development of reservoirs; projected
the 1980 municipal and industrial requirements of each area of the state; provided a plan for how to
meet those requirements by river basin; and discussed how the plan could be implemented. The 1961
plan recommended 45 new reservoirs. During this era, reservoirs reigned supreme in water resource
management, providing water supply, flood control, and electricity, as well as recreational opportunities.
In 1962, the Board of Water Engineers was reorganized, renamed the Texas Water Commission, and
given specific responsibilities for water planning by the 57th Texas Legislature. The Texas Legislature
again restructured the state water agencies in 1965 and transferred water resource planning functions
to the TWDB and renamed the Texas Water Commission to the Texas Water Rights Commission.
Later plans were developed by the state and adopted in 1968, 1984, 1990, 1992, and 1997. Each of these
plans recognized the state’s steady population growth and the need to develop additional water supplies.
Earlier plans placed more reliance on the federal government, while later plans developed at the state
level increasingly emphasized the importance of conservation and natural resource protection. For
example, the 1968 State Water Plan recommended the federal government continue to fund feasibility
studies on importing surplus water from the Mississippi River (a later study determined that this
proposed idea was not economically feasible). Less than 20 years later, the 1984 State Water Plan was
the first to address water quality, water conservation, water use efficiency, and environmental water
needs.
The first three plans were organized by river basin, but the 1990 State Water Plan projected water
demand, supply, and facility needs for eight regions in the state. The 1997 State Water Plan—developed
by the TWDB in coordination with the Texas Parks and Wildlife Department and the Texas
Commission on Environmental Quality—was the first to organize the state into 16 water planning
regions.
A.3 Regional and state water planning, 1997–present
Drought conditions in the mid-1990s spurred action in Texas water planning efforts, just as in the 1950s.
In 1996, Texas suffered an intense 10-month drought. Reservoirs and aquifer levels declined sharply, and
farmers suffered widespread crop failure, with estimated economic losses in the billions of dollars. Some
cities had to ration water for several months, and others ran out of water entirely.
The drought of 1996 was short-lived, but its consequences were severe enough to remind Texans of the
importance of water planning to ensure dependable water supplies. When the legislature convened in
DRAFT 2022 State Water Plan | Texas Water Development Board D-162
1997, Lieutenant Governor Bob Bullock declared water the primary issue for the 75th Legislative
Session. After lengthy debate and numerous amendments, the Texas Legislature passed Senate Bill 1 to
improve the development and management of water resources in the state. Among other provisions
relating to water supplies, financial assistance, data collection and dissemination, the bill established the
regional water planning process, which directed state water planning to begin at the local (regional)
level.
Senate Bill 1 outlined a new planning process in which every five years, local and regional stakeholders
would develop consensus-driven regional plans for how to meet their water needs during times of
drought. The TWDB would then develop a comprehensive state plan based on the regional water plans.
The legislation also specified that the TWDB could only provide financial assistance for water supply
projects if they were consistent with the regional water plans and the state water plan. The same
provision also applied to the Texas Commission on Environmental Quality’s granting of water right
permits. The 2022 State Water Plan is the fifth plan completed under the Senate Bill 1 planning process
and comprises the 16 regional water plans due to the TWDB January 5, 2021.
A.4 State and federal water supply institutions
Although the TWDB is the state’s designated water planning agency, several state and federal agencies in
Texas are responsible for managing water resources and participate in the regional planning process.
The Texas Parks and Wildlife Department, Texas Department of Agriculture, and Texas State Soil and
Water Conservation Board all have non-voting representatives on each regional water planning group.
The Texas Parks and Wildlife Department, Texas Department of Agriculture, and Texas Commission on
Environmental Quality are also directly involved in developing population and water demand projections
and are consulted in developing and amending rules governing the planning process. The water-related
responsibilities of these agencies, along with other state and federal entities that indirectly participate in
the regional water planning process, are described in the following sections.
State entities
The TWDB is the state’s primary water science, planning, and financing agency and is led by three
appointed Board members. It supports the development of the 16 regional water plans and is
responsible for developing a state water plan every five years. The TWDB provides financial assistance
to local governments for projects that support water supply, wastewater treatment, flood mitigation,
and agricultural water conservation. The TWDB also collects data annually through the Water Use
Survey, Water Loss Audit, and Water Conservation Plan Annual Reports. The TWDB provides scientific
information on state water resources by collecting data, developing models, and conducting studies of
surface water and groundwater availability and quality, all of which undergirds the state water planning
process. The TWDB uses and shares this information through a variety of avenues, including overseeing
the joint planning process carried out by groundwater management areas and providing technical
support to both the environmental flows process and the regional water planning process. The TWDB
also participates in many committees and serves as a member of the Water Conservation Advisory
Council, Drought Preparedness Council, and the Emergency Drinking Water Task Force, to name a few.
The TWDB houses the Texas Natural Resources Information System (TNRIS), which provides
high quality historic and current geospatial data products. The Deputy Executive Administrator of
TNRIS acts as the state’s Geographic Information Officer.
The State Parks Board, originally created in 1923, was later merged with other state entities and
renamed the Texas Parks and Wildlife Department. Today the agency, led by nine commissioners
appointed by the governor, is primarily responsible for conserving, protecting, and enhancing the state’s
fish and wildlife resources. It maintains a system of public lands, including state parks, historic sites, fish
hatcheries, and wildlife management areas; regulates and enforces commercial and recreational fishing,

DRAFT 2022 State Water Plan | Texas Water Development Board D-163
hunting, boating, and nongame laws; and monitors, conserves, and enhances aquatic and wildlife habitats.
It reviews and makes recommendations to minimize or avoid impacts on fish and wildlife resources
resulting from water projects. Additionally, the Texas Parks and Wildlife Department works with
stakeholders participating in regional water planning and the environmental flows process as well as with
regulatory agencies to protect and enhance water quality and to ensure adequate environmental flows
for rivers and estuaries.
In 1992, to make natural resource protection more efficient, the legislature consolidated several
programs into one large environmental agency now known as the Texas Commission on
Environmental Quality. The Texas Commission on Environmental Quality, led by three
commissioners appointed by the governor, is the environmental regulatory agency for the state.
Focusing on water quality and quantity through various state and federal programs, the Commission
issues permits for the treatment and discharge of industrial and domestic wastewater and stormwater;
reviews plans and specifications for public water systems; and conducts assessments of surface water
and groundwater quality. The Texas Commission on Environmental Quality regulates retail water and
sewer utilities and administers a portion of the Nonpoint Source Management Program. In addition, it
administers the surface water rights permitting program and maintains the water availability modeling
programs that are the basis for the state’s water rights permitting and water supply planning efforts (see
Section A.5). It also administers a dam safety program, delineates and designates priority groundwater
management areas, creates some groundwater conservation districts, and enforces the requirements of
groundwater management planning. It regulates public drinking water systems, is the primary agency for
enforcing the federal Safe Drinking Water Act, provides support to the environmental flows process,
and adopts rules for environmental flow standards.
The Texas Department of Agriculture, established by the Texas Legislature in 1907, is led by the
Texas Commissioner of Agriculture, an elected official of the state. It supports protection of agricultural
crops and livestock from harmful pests and diseases; facilitates trade and market development for
agricultural commodities; provides financial assistance to farmers and ranchers; and administers
consumer protection, economic development, infrastructure grants to rural communities, and healthy
living programs.
The Public Utility Commission of Texas, established in 1975, is led by three commissioners
appointed by the governor and regulates the state’s electric, telecommunication, and water and sewer
utilities. In 2013, the Texas Legislature transferred the economic regulation of water and sewer utilities
from the Texas Commission on Environmental Quality to the Public Utility Commission. The agency
regulates water and sewer rates and services, Certificates of Convenience and Necessity, and sales,
transfers, and mergers.
Created in 1939, the Texas State Soil and Water Conservation Board, led by seven board
members composed of two governor appointees and five elected officials, administers Texas’ soil and
water conservation laws and coordinates conservation and nonpoint source pollution abatement
programs. It also administers water quality and water supply enhancement programs and maintains flood
control structures across the state.
First authorized by the legislature in 1917, river authorities are assigned the conservation and
reclamation of the state’s natural resources, including the development and management of water. They
generally operate on utility revenues generated from supplying energy, water, wastewater, and other
community services. There are 16 river authorities in Texas (Figure A-2), along with similar special law
districts authorized by the legislature.

DRAFT 2022 State Water Plan | Texas Water Development Board D-164
Figure A-2. Locations of river authorities and regional water planning area boundaries
The formation of groundwater conservation districts was first authorized by the legislature in 1949
to manage and protect groundwater at the local level. Groundwater conservation districts are governed
by a local board of directors, which develops a management plan for the district with technical support
from the TWDB, the Texas Commission on Environmental Quality, and other state agencies. Because
most groundwater conservation districts are based on county lines and do not manage an entire aquifer,
one aquifer may be managed by several groundwater districts. Each district must plan with the other
districts within their common groundwater management areas to determine the desired future
conditions of the relevant aquifers within the groundwater management areas. As of 2020, there are 98
confirmed groundwater conservation districts (excluding the two subsidence districts and the Edwards
Aquifer Authority) located partially or fully within 176 of 254 Texas counties. A map of these districts
may be found on the TWDB website.
Other entities at the regional and local levels of government construct, operate, and maintain water
supply and wastewater infrastructure. These include municipalities; water supply, irrigation, and
DRAFT 2022 State Water Plan | Texas Water Development Board D-165
municipal utility districts; flood and drainage districts; subsidence districts; and nonprofit water supply
and sewer service corporations.
Federal agencies Federal civil works projects played a major role in the early development of the state’s water resources
(TBWE, 1958). Historically, Texas relied heavily on federal funds to finance water development projects,
with local commitments used to repay a portion of the costs. Federal agencies such as the Soil
Conservation Service, the U.S. Bureau of Reclamation, and the U.S. Army Corps of
Engineers constructed several surface water reservoirs in Texas. These reservoirs were built for the
primary purpose of flood control but provide a large portion of the state’s current water supply. The
pace of federal spending on reservoir construction has declined considerably since the 1960s, and
current federal policy recognizes a declining federal interest in the long-term management of water
supplies.
Several federal agencies are responsible for managing the nation’s water resources. The U.S. Army
Corps of Engineers investigates, develops, and maintains the nation’s water and related environmental
resources. Historically, the U.S. Army Corps of Engineers has been responsible for flood protection,
dam safety, and the planning and construction of water projects, including reservoirs. Pursuant to the
Clean Water Act and the Rivers and Harbors Act, the U.S. Army Corps of Engineers operates a
program that regulates construction and other work in the nation’s waterways.
Within the U.S. Department of the Interior, the U.S. Geological Survey conducts natural
resources studies and collects water-related data, and the U.S. Bureau of Reclamation conducts
water resource planning studies and manages water resources primarily in the western United States.
The U.S. Fish and Wildlife Service, also part of the Department of the Interior, protects fish and
wildlife resources through various programs and carries out provisions of the Endangered Species Act.
The Natural Resources Conservation Service, part of the U.S. Department of Agriculture and
successor to the Soil Conservation Service, implements soil conservation programs and works at the
local level through conservation planning and assistance programs. The U.S. Environmental
Protection Agency regulates and funds federal water quality, solid waste, drinking water, and other
programs pursuant to the Clean Water Act, Safe Drinking Water Act, and other federal laws and
regulations. The International Boundary and Water Commission manages the waters of the Rio
Grande between the United States and Mexico.
A.5 Management of water in Texas
Texas water law divides water into several categories for the purpose of regulation. Different rules
apply to surface water and groundwater, determining who is entitled to use the water, in what amount,
and for what purpose. This system stems from Spanish and English common laws, the laws of other
western states, and state and federal case law and legislation. The following sections briefly describe
how the state manages surface water and groundwater resources, water quality, drinking water, and
interstate waters, all important considerations when planning for drought.
Surface water
In Texas, all surface water is held in trust by the state, which grants permission to use the water to
different groups and individuals. Texas recognizes two basic doctrines of surface water rights: the
riparian doctrine and the prior appropriation doctrine. Under the riparian doctrine, landowners whose
property is adjacent to a river or stream have the right to make reasonable use of the water. The
riparian doctrine was introduced in Texas more than 200 years ago with the first Spanish settlers. In
1840, the state adopted the common law of England, which included a somewhat different version of the
riparian doctrine (Templer, 2011). In response to the scarcity of water in the western United States,

DRAFT 2022 State Water Plan | Texas Water Development Board D-166
Texas began to recognize the need for a prior appropriation system (Kaiser, n.d.). The prior
appropriation system, first adopted by Texas in 1895, has evolved into the modern system used today.
Landowners who live on many of the water bodies in the state are allowed to divert and use water for
domestic and livestock purposes, but these are some of the last riparian rights still in place.
In 1913, the legislature extended the prior appropriation system to the entire state. It also established
the Texas Board of Water Engineers, the agency that had original jurisdiction over all applications for
appropriated water. Because different laws governed the use of surface waters at different times in
Texas history, claims to water rights often conflicted with one another. In 1967, as a result of these
historic conflicts, the state began to resolve claims for water rights. A “certificate of adjudication” was
issued for each approved claim, limiting riparian and other unrecorded rights to a specific quantity of
water. The certificate also assigned a priority date to each claim, with some dates going back to the time
of the first Spanish settlements (TCEQ, 2009).
The adjudication of surface water rights gave the state the potential for more efficient management of
surface waters (Templer, 2011). With only a few exceptions, surface water users today need a permit in
the form of an appropriated water right from the Texas Commission on Environmental Quality. The
prior appropriation system recognizes the “priority doctrine,” which gives superior rights to those who
first used the water, often known as “first in time, first in right.” In most of the state, water rights are
prioritized only by the date assigned to them and not by the purpose for which the water will be used.
Only water stored in Falcon and Amistad reservoirs in the middle and lower Rio Grande Basin is
prioritized by the purpose of its use, with municipal and industrial rights having priority over irrigation
rights during times of drought.
When issuing a new water right, the Texas Commission on Environmental Quality assigns a priority
date, specifies the volume of water that can be used each year, and may allow users to divert or
impound the water. Water rights do not guarantee that water will be available, but they are considered
property interests that may be bought, sold, or leased. The agency also grants term permits and
temporary permits, which do not have priority dates and are not considered property rights. The water
rights system works hand-in-hand with the regional water planning process; the Texas Commission on
Environmental Quality may not issue a new water right unless it addresses a water supply need that is
consistent with the regional water plans and the state water plan.
Texas relies on the honor system in most parts of the state to protect water rights during times of
drought. But in some areas, the Texas Commission on Environmental Quality has appointed a
watermaster to oversee and continuously monitor streamflows, reservoir levels, and water use. There
are three watermasters in Texas: the Rio Grande Watermaster, who coordinates releases from the
Amistad and Falcon reservoir system; the Brazos Watermaster, who serves the middle and lower
portions of the Brazos River Basin; and the South Texas Watermaster, who serves the Nueces, San
Antonio, Guadalupe, and Lavaca river and coastal basins. The South Texas Watermaster also serves as
the Concho Watermaster, overseeing the Concho River and its tributaries in the Colorado River Basin.
Groundwater
Groundwater in Texas is managed differently than surface water. Historically, Texas has followed the
English common law rule that landowners have the right to capture or remove all the water that can be
captured from beneath their land. In part, the rule was adopted because the science of quantifying and
tracking the movement of groundwater was so poorly developed at the time that it would have been
practically impossible to administer any set of legal rules to govern its use. The 1904 case and later court
rulings established that landowners, with few exceptions, may pump as much water as they choose
without liability. Today, Texas is the only western state that continues to follow the rule of capture.
In 1949, in an attempt to balance landowner interests with limited groundwater resources, the
legislature authorized the creation of groundwater conservation districts to manage groundwater locally.

DRAFT 2022 State Water Plan | Texas Water Development Board D-167
Although the science of groundwater is much better developed (the TWDB has groundwater availability
models for all the major aquifers and most of the minor aquifers in the state), groundwater is still
governed by the rule of capture, unless under the authority of a groundwater conservation district.
Senate Bill 1 in 1997 reaffirmed state policy that groundwater conservation districts are the state’s
preferred method of groundwater management.
Groundwater conservation districts can be created by four possible methods: (1) action of the Texas
Legislature, (2) petition by property owners, (3) initiation by the Texas Commission on Environmental
Quality, or (4) addition of territory to an existing district. Districts may regulate both the location and
production of wells, with certain voluntary and mandatory exemptions. They are also required to adopt
management plans that include goals to provide the most efficient use of groundwater. The goals must
also address drought, other natural resource issues, and adopted desired future conditions. The
management plan must include estimates of modeled available groundwater based on desired future
conditions and must address water supply needs and water management strategies in the state water
plan.
Texas groundwater law continues to evolve through recent court cases and ongoing litigation. It is
unclear exactly how these recent cases will affect the broad scope of groundwater law as appeals are
decided and new litigation is brought.
The TWDB and the Texas Commission on Environmental Quality are the primary state agencies
involved in supporting groundwater conservation districts to implement groundwater management plan
requirements. Along with determining values for modeled available groundwater based on desired future
conditions of the aquifer, the TWDB provides technical and financial support to districts, reviews and
administratively approves management plans, performs groundwater availability and water-use studies,
and is responsible for the delineation and designation of groundwater management areas.
In 2015, the 84th Texas Legislature passed House Bill 30 directing the TWDB to conduct studies to
identify and designate local or regional brackish groundwater production zones in areas of the state with
moderate to high availability and productivity of brackish groundwater. To date, the TWDB has
designated a total of 31 such brackish groundwater production zones that meet statutory criteria. In
2019, the 86th Texas Legislature passed House Bill 722 creating a framework for groundwater
conservation districts to establish permitting rules for producing brackish groundwater from the
TWDB-designated brackish groundwater production zones for municipal drinking water projects or
electric generation projects. The statute further directed the TWDB to conduct technical reviews of
operating permit applications submitted to groundwater conservation districts and, when requested by a
district, investigate the impacts of brackish groundwater production as described in the annual reports
of the permitted production.
The Texas Commission on Environmental Quality provides technical assistance to districts and is
responsible for enforcing the adoption, approval, and implementation of management plans. The agency
also evaluates designated priority groundwater management areas—areas that are experiencing or are
expected to experience critical groundwater problems within 50 years, including shortages of surface
water or groundwater, land subsidence resulting from groundwater withdrawal, and contamination of
groundwater supplies.
Seawater (Gulf of Mexico)
The diversion, treatment, and use of marine seawater, as well as the discharge of the treated water and
associated waste, is permitted by the Texas Commission on Environmental Quality. State-sponsored
studies for seawater desalination plants were initiated in the 2000s, and in 2015 the 84th Texas
Legislature passed House Bill 2031, directing the development of seawater desalination permitting
rules in Chapter 18 of the Texas Water Code. The overall goal of the bill was to streamline and
expedite the regulatory and permitting processes associated with seawater desalination. In addition, the
DRAFT 2022 State Water Plan | Texas Water Development Board D-168
Texas Parks and Wildlife Department and General Land Office have identified zones for both the
diversion of marine seawater and discharge of the desalination waste, which are only applicable when
using the Texas Commission on Environmental Quality expedited permitting process for seawater
desalination. No zones are located within the state’s bays and estuaries. The map of zones is available at
the General Land Office Coastal Resource Management Viewer
(https://cgis.glo.texas.gov/rmc/index.html).
Surface water quality
The Texas Commission on Environmental Quality is charged with managing the quality of the state’s
surface water. Guided by the federal Clean Water Act and state law and regulations, the agency
classifies water bodies and sets water quality standards. Water quality standards consist of two parts:
the purposes for which surface water will be used (aquatic life, contact recreation, water supply, or fish
consumption) and criteria to determine if the use is being supported. Water quality data is gathered
regularly to monitor the condition of the state’s surface waters and to determine if standards are being
met. Through the Texas Clean Rivers Program, the Texas Commission on Environmental Quality works
in partnership with state, regional, and federal entities to coordinate water quality monitoring,
assessment, and stakeholder participation to improve the quality of surface water within each river
basin.
Every two years, Texas submits a report to the U.S. Environmental Protection Agency that lists the
status of all the waters in the state and identifies those not meeting water quality standards. When
water bodies do not meet standards, the Texas Commission on Environmental Quality may develop a
restoration plan, evaluate the appropriateness of the standard, or collect more data and information.
For water bodies with significant impairments, the agency must develop a scientific allocation called a
“total maximum daily load” to determine the maximum amount of a pollutant that a water body can
receive from all sources, including point and nonpoint sources, and still maintain water quality standards
set for its use.
Drinking water The Texas Commission on Environmental Quality is also responsible for protecting the quality and
safety of drinking water through primary and secondary standards. In accordance with the federal Safe
Drinking Water Act and state law and regulations, primary drinking water standards protect public
health by limiting the levels of certain contaminants, and secondary drinking water quality standards
address taste, color, and odor. Public drinking water systems must comply with certain construction and
operational standards, and they must continually monitor water quality and file regular reports with the
Texas Commission on Environmental Quality.
Interstate waters Texas is a member of five interstate river compacts with neighboring states to manage the Rio Grande,
Pecos, Canadian, Sabine, and Red rivers. The compacts, as ratified by the legislature of each participating
state and the U.S. Congress, represent agreements that establish how water should be allocated. Each
compact is administered by a commission of state representatives and, in some cases, a representative
of the federal government appointed by the president. Compact commissions protect states’ rights and
work to prevent and resolve any disputes over water. The compact commissions are authorized to plan
for river operations, monitor activities affecting water quantity and quality, and engage in water
accounting and rulemaking. To administer the five compacts in Texas, the Texas Commission on
Environmental Quality provides administrative and technical support to each commission and maintains
databases of river flows, diversions, and other information.
DRAFT 2022 State Water Plan | Texas Water Development Board D-169
A.6 Key water planning statute and administrative rules
Texas Water Code §§ 16.012, 16.051, 16.052, 16.053, 16.054, and 16.055.
31 Texas Administrative Code Chapters 355, 356, 357, and 358.
References
Kaiser, R.A., n.d., Handbook of Texas water law—Problems and needs: Texas Water Resources
Institute, Texas A&M University, 46 p. http://texaswater.tamu.edu/resources/2002-037_waterlaw.pdf
TBWE (Texas Board of Water Engineers), 1958, Texas water resources planning at the end of the year
1958—A progress report to the fifty-sixth legislature: Texas Board of Water Engineers, 113 p.
TBWE (Texas Board of Water Engineers), 1959, A study of droughts in Texas: Texas Board of Water
Engineers Bulletin 5914, 76 p.
Templer, O.W., 2011, Water law in Handbook of Texas Online: Texas State Historical Association,
https://tshaonline.org/handbook/online/articles/gyw01
TCEQ (Texas Commission on Environmental Quality), 2009, Rights to surface water in Texas: Texas
Commission on Environmental Quality Publication Number GI-228, 19 p.
USBR (United States Bureau of Reclamation), 1953, Water supply and the Texas economy—An
appraisal of the Texas water problem: United States Bureau of Reclamation, 91 p.
UT (University of Texas) Institute of Public Affairs, 1955, The fifty-fourth Texas legislature—A review of
its work: The University of Texas, 34 p.
http://www.lrl.state.tx.us/scanned/sessionOverviews/review/54th.pdf
DRAFT 2022 State Water Plan | Texas Water Development Board D-170
Appendix B Water availability and existing supplies
B.1 Surface water
As discussed in Chapter 5, hydrologic variances from the use of firm yield determined by the default
water availability model (WAM Run 3) may be justified for drought planning purposes. For example, in
regions where droughts are more frequent, it is reasonable to plan with a more conservative measure of
reliability, such as a one- to two-year safe yield, because some reservoirs in more arid regions of the
state have extended periods between filling.
Of the 16 planning regions, six requested and were authorized to use safe yield for the surface water
availability analysis in their plan development. Authorization was granted based upon assurances and
evidence that the resulting estimates of alternative water availability are reasonable for drought planning
purposes and will reflect conditions expected in the event of near-term, actual drought conditions.
Additionally, planning groups must also report the standard firm yield value. These authorizations are
summarized in Table B-1. For presentation purposes, only approved safe yield hydrologic variance
assumptions for reservoir sources are summarized. Run-of-river sources also have hydrologic variance
assumptions approved, and the specifics may be reviewed (along with reservoir variance assumptions) in
Chapter 3 or the associated appendix in each regional water plan.
Beyond the use of safe yield, other surface water variances authorized included
• extension of the hydrology beyond the water availability model period of record (Regions A, B,
C, F, G, H, K, N, and O);
• modifications to water availability models to more accurately reflect operational or contract
agreements, subordination agreements, correct known errors in the models, or remove
canceled water rights (all regions); and
• modifications to a water availability model to utilize return flows (Regions C, D, G, H, J, K, M,
and O).
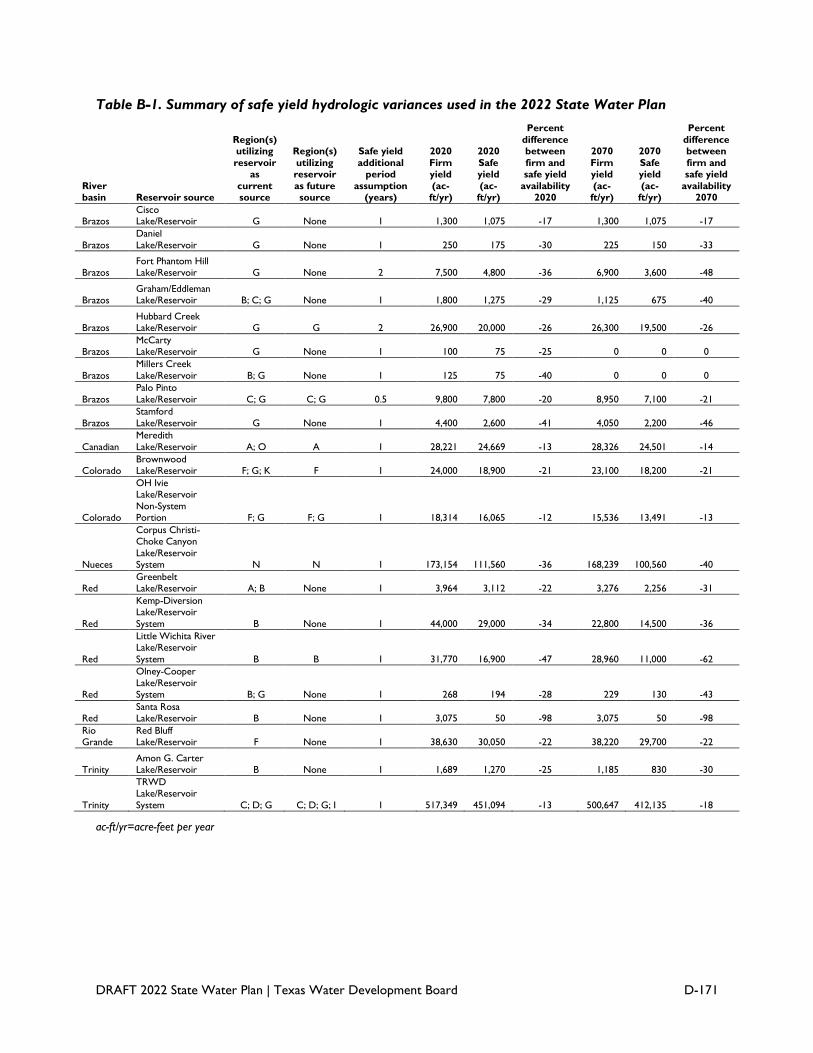
DRAFT 2022 State Water Plan | Texas Water Development Board D-171
Table B-1. Summary of safe yield hydrologic variances used in the 2022 State Water Plan
River basin Reservoir source
Region(s) utilizing
reservoir as
current source
Region(s)
utilizing reservoir
as future source
Safe yield
additional period
assumption (years)
2020
Firm yield
(ac-ft/yr)
2020
Safe yield
(ac-ft/yr)
Percent
difference between
firm and safe yield
availability 2020
2070
Firm yield
(ac-ft/yr)
2070
Safe yield
(ac-ft/yr)
Percent
difference between
firm and safe yield
availability 2070
Brazos Cisco Lake/Reservoir G None 1 1,300 1,075 -17 1,300 1,075 -17
Brazos
Daniel
Lake/Reservoir G None 1 250 175 -30 225 150 -33
Brazos Fort Phantom Hill Lake/Reservoir G None 2 7,500 4,800 -36 6,900 3,600 -48
Brazos Graham/Eddleman Lake/Reservoir B; C; G None 1 1,800 1,275 -29 1,125 675 -40
Brazos Hubbard Creek Lake/Reservoir G G 2 26,900 20,000 -26 26,300 19,500 -26
Brazos McCarty Lake/Reservoir G None 1 100 75 -25 0 0 0
Brazos
Millers Creek
Lake/Reservoir B; G None 1 125 75 -40 0 0 0
Brazos
Palo Pinto
Lake/Reservoir C; G C; G 0.5 9,800 7,800 -20 8,950 7,100 -21
Brazos
Stamford
Lake/Reservoir G None 1 4,400 2,600 -41 4,050 2,200 -46
Canadian
Meredith
Lake/Reservoir A; O A 1 28,221 24,669 -13 28,326 24,501 -14
Colorado Brownwood Lake/Reservoir F; G; K F 1 24,000 18,900 -21 23,100 18,200 -21
Colorado
OH Ivie Lake/Reservoir
Non-System Portion F; G F; G 1 18,314 16,065 -12 15,536 13,491 -13
Nueces
Corpus Christi-Choke Canyon
Lake/Reservoir System N N 1 173,154 111,560 -36 168,239 100,560 -40
Red Greenbelt Lake/Reservoir A; B None 1 3,964 3,112 -22 3,276 2,256 -31
Red
Kemp-Diversion Lake/Reservoir
System B None 1 44,000 29,000 -34 22,800 14,500 -36
Red
Little Wichita River Lake/Reservoir
System B B 1 31,770 16,900 -47 28,960 11,000 -62
Red
Olney-Cooper
Lake/Reservoir System B; G None 1 268 194 -28 229 130 -43
Red Santa Rosa Lake/Reservoir B None 1 3,075 50 -98 3,075 50 -98
Rio Grande
Red Bluff Lake/Reservoir F None 1 38,630 30,050 -22 38,220 29,700 -22
Trinity Amon G. Carter Lake/Reservoir B None 1 1,689 1,270 -25 1,185 830 -30
Trinity
TRWD Lake/Reservoir
System C; D; G C; D; G; I 1 517,349 451,094 -13 500,647 412,135 -18
ac-ft/yr=acre-feet per year

DRAFT 2022 State Water Plan | Texas Water Development Board D-172
Table B-2. Annual surface water availability by river and coastal basin (acre-feet)
Surface water basin 2020 2030 2040 2050 2060 2070
Percent
change
Brazos 1,457,019 1,452,479 1,447,935 1,443,413 1,438,849 1,433,608 -2
Brazos-Colorado 21,299 21,299 21,299 21,299 21,299 21,299 0
Canadian 41,802 41,726 41,651 41,576 41,500 41,425 -1
Colorado 956,710 954,837 952,913 951,091 949,178 947,235 -1
Colorado-Lavaca 4,852 4,852 4,852 4,852 4,852 4,852 0
Cypress 294,482 293,908 289,372 286,966 283,557 280,417 -5
Guadalupe 179,887 179,743 179,599 179,454 179,310 179,166 0
Lavaca 79,710 79,710 79,710 79,710 79,710 79,710 0
Lavaca-Guadalupe 297 297 297 297 297 297 0
Neches 2,342,466 2,340,310 2,338,353 2,336,570 2,334,215 2,330,521 -1
Neches-Trinity 90,555 90,555 90,555 90,555 90,555 90,555 0
Nueces 121,519 119,619 117,419 115,219 113,019 110,519 -9
Nueces-Rio Grande 8,807 8,807 8,807 8,807 8,807 8,807 0
Red 314,001 309,737 306,050 302,376 298,705 292,707 -7
Rio Grande 1,235,141 1,234,865 1,234,588 1,234,312 1,234,035 1,233,759 0
Sabine 2,013,544 2,009,131 2,003,908 1,999,215 1,994,420 1,989,632 -1
Sabine-Louisiana 343 343 343 343 343 343 0
San Antonio 52,984 52,984 52,984 52,984 52,984 52,984 0
San Antonio-Nueces 993 993 993 993 993 993 0
San Jacinto 269,297 265,297 261,497 257,597 252,997 244,997 -9
San Jacinto-Brazos 38,827 38,827 38,827 38,827 38,827 38,827 0
Sulphur 463,523 450,321 436,374 422,875 409,425 395,669 -15
Trinity 2,674,184 2,648,707 2,634,977 2,563,513 2,543,176 2,521,365 -6
Trinity-San Jacinto 5,537 5,537 5,537 5,537 5,537 5,537 0
Texas 12,667,779 12,604,884 12,548,840 12,438,381 12,376,590 12,305,224 -3

DRAFT 2022 State Water Plan | Texas Water Development Board D-173
Table B-3. Annual surface water existing supplies by river and coastal basin (acre-feet)
Surface water basin 2020 2030 2040 2050 2060 2070
Percent
change
Brazos 1,028,398 1,027,522 1,027,471 1,024,880 1,021,226 1,016,537 -1
Brazos-Colorado 18,146 18,146 18,146 18,146 18,146 18,146 0
Canadian 37,884 37,851 37,818 37,784 37,750 37,716 0
Colorado 850,792 849,674 848,806 846,861 847,167 845,952 -1
Colorado-Lavaca 4,289 4,289 4,289 4,289 4,289 4,289 0
Cypress 188,035 183,161 182,029 181,321 180,470 179,575 -5
Guadalupe 172,627 169,329 166,256 166,874 169,350 169,365 -2
Lavaca 78,055 78,136 78,136 78,136 78,136 78,136 0
Lavaca-Guadalupe 297 297 297 297 297 297 0
Neches 495,915 500,538 503,810 506,896 510,377 514,747 4
Neches-Trinity 88,962 88,962 88,962 88,962 88,962 88,962 0
Nueces 118,408 116,486 114,285 112,076 109,878 107,379 -9
Nueces-Rio Grande 926 926 926 926 926 926 0
Red 170,041 166,889 164,581 162,546 160,859 154,978 -9
Rio Grande 943,633 944,086 941,201 941,050 941,819 941,943 0
Sabine 591,377 573,717 573,540 573,113 572,665 576,570 -3
Sabine-Louisiana 343 343 343 343 343 343 0
San Antonio 52,444 52,445 52,445 52,446 52,455 52,455 0
San Antonio-Nueces 444 444 444 444 444 444 0
San Jacinto 187,038 187,816 188,218 187,201 187,441 187,646 0
San Jacinto-Brazos 35,989 35,989 35,989 35,989 35,989 35,989 0
Sulphur 121,575 121,149 121,323 121,616 121,803 121,938 0
Trinity 2,041,046 2,019,985 1,998,152 1,978,278 1,960,409 1,940,465 -5
Trinity-San Jacinto 5,537 5,537 5,537 5,537 5,537 5,537 0
Texasa 7,232,201 7,183,717 7,153,004 7,126,011 7,106,738 7,080,335 -2
a Does not reflect some portions of existing supplies that are associated with purely saline water sources such as untreated seawater.

DRAFT 2022 State Water Plan | Texas Water Development Board D-174
B.2 Groundwater
As discussed in Chapter 5, the joint groundwater planning process is the basis for most groundwater
availability in this plan. Desired future conditions for this plan were adopted by March 2018; however,
the majority were adopted in 2016 and 2017. Desired future conditions by groundwater management
area are available on the TWDB website: www.twdb.texas.gov/groundwater/dfc/2016jointplanning.asp.
The modeled available groundwater peak factor option discussed in Chapter 5 was utilized for this state
water plan by Regions G and H. A modest modeled available groundwater reallocation was also
approved for use by Region F, which allowed for the reallocation of modeled available groundwater
values across river basins within a county.
During development of this state water plan, the reasonableness of the desired future condition adopted
in 2016 for the Gulf Coast Aquifer in the Lone Star Groundwater Conservation District was challenged
and determined to be no longer reasonable. Due to this decision, the modeled available groundwater
volume used in this plan for Montgomery County is based on the desired future condition adopted in
2010.
Based on a policy recommendation in the 2017 State Water Plan, the timing of adopting desired future
conditions was revised by House Bill 2215 from the 85th Legislative Session to set a statutory deadline
for adopting desired future conditions and to better synchronize the joint planning and regional water
planning cycles. For the 2026 regional water plans and 2027 State Water Plan, modeled available
groundwater values will be based on desired future conditions in effect as of January 5, 2022. Where
available during development of the 2027 State Water Plan, modeled available groundwater values will
be utilized in developing draft irrigation demand projections in counties in which the total groundwater
availability over the planning period is projected to be less than the groundwater portion of the baseline
water demand projections (see Chapter 4 for methodological details). Steps in the groundwater joint
planning process are outlined on the following flowchart:
www.twdb.texas.gov/groundwater/docs/DFCFlowchart_May2020.pdf.

DRAFT 2022 State Water Plan | Texas Water Development Board D-175
Table B-4. Annual groundwater availability by aquifer (acre-feet)
Aquifer 2020 2030 2040 2050 2060 2070
Percent
change
Austin Chalk 5,704 5,704 5,704 5,704 5,704 5,704 0
Blaine 85,832 82,524 82,719 82,524 82,719 82,524 -4
Blossom 2,273 2,273 2,273 2,273 2,273 2,273 0
Bone Spring-
Victorio Peak 101,400 101,400 101,400 101,400 101,400 101,400 0
Brazos River
Alluvium 283,054 278,495 277,929 277,731 277,625 277,558 -2
Buda Limestone 758 758 758 758 758 758 0
Capitan Reef
Complex 44,410 44,410 44,410 44,410 44,410 44,410 0
Carrizo-Wilcox 1,214,959 1,185,373 1,189,014 1,207,269 1,205,152 1,204,940 -1
Cross Timbers 13,127 13,127 13,127 13,127 13,127 13,127 0
Dockum 342,240 346,708 337,468 325,948 312,528 312,427 -9
Edwards
(Balcones Fault Zone) 320,285 320,285 320,285 320,285 320,285 320,285 0
Edwards-Trinity
(Plateau)/Pecos
Valleya 420,915 420,915 420,915 420,915 420,915 420,915 0
Edwards-Trinity
(Plateau) 7,390 7,390 7,390 7,390 7,390 7,390 0
Edwards-Trinity
(Plateau)/Pecos
Valley/Trinitya 479,060 479,060 479,060 479,060 479,060 479,060 0
Ellenburger-San
Saba 41,141 41,095 41,141 41,095 41,141 41,095 0
Frio River
Alluvium 2,145 2,145 2,145 2,145 2,145 2,145 0
Gulf Coast 1,998,403 1,880,722 1,826,411 1,874,886 1,919,628 1,947,314 -3
Hickory 56,572 56,554 56,572 56,554 56,572 56,554 0
Hueco-Mesilla
Bolsons 480,000 480,000 480,000 480,000 480,000 480,000 0
Igneous 11,713 11,713 11,712 11,709 11,709 11,708 0
Leona Gravel 31,402 31,402 31,402 31,402 31,402 31,402 0
Lipan 46,539 46,539 46,539 46,539 46,539 46,539 0
Marathon 7,327 7,327 7,327 7,327 7,327 7,327 0
Marble Falls 10,443 10,415 10,443 10,415 10,443 10,415 0
Nacatoch 15,652 15,651 15,672 16,027 16,506 17,211 10
Navasota River
Alluvium 2,216 2,216 2,216 2,216 2,216 2,216 0
Nueces River
Alluvium 3,574 3,574 3,574 3,574 3,574 3,574 0
Ogallala/Edwards-
Trinity (High
Plains)a 3,115,814 2,086,599 1,534,371 1,246,995 1,092,489 1,002,728 -68
Ogallala/Rita
Blancaa 804,584 576,367 452,421 332,470 221,287 221,287 -73

DRAFT 2022 State Water Plan | Texas Water Development Board D-176
Aquifer 2020 2030 2040 2050 2060 2070
Percent
change
Ogallala 2,804,827 2,717,750 2,529,481 2,322,725 2,118,890 2,118,657 -25
Other 258,668 258,668 258,668 258,668 258,668 258,668 0
Pecos Valley 150 150 150 150 150 150 0
Queen City 276,339 273,543 272,856 272,408 271,562 270,669 -2
Rustler 11,183 11,183 11,183 11,183 11,183 11,183 0
San Bernard River
Alluvium 520 520 520 520 520 520 0
San Jacinto River
Alluvium 1,450 1,450 1,450 1,450 1,450 1,450 0
San Marcos River
Alluvium 271 271 271 271 271 271 0
Seymour 219,785 196,032 199,985 203,240 205,495 211,223 -4
Sparta 30,710 33,049 35,487 37,505 37,426 37,348 22
Trinity 385,697 384,923 385,302 384,288 384,924 384,243 0
Trinity River
Alluvium 3,913 3,913 3,913 3,913 3,913 3,913 0
West Texas
Bolsons 80,603 80,402 80,111 79,907 79,661 79,424 -2
Woodbine 30,656 30,575 30,656 30,575 30,656 30,575 0
Yegua-Jackson 113,891 111,921 111,909 111,823 111,287 111,287 -2
Texas 14,167,595 12,645,091 11,726,340 11,170,774 10,732,380 10,673,867 -25
a Noted aquifer combinations reflect specific groundwater management policy decisions based on aquifer properties. In these cases, the
modeled available groundwater and existing supply values have likewise been developed to honor these aquifer combinations.

DRAFT 2022 State Water Plan | Texas Water Development Board D-177
Table B-5. Annual groundwater existing supplies by aquifer (acre-feet)
Aquifer 2020 2030 2040 2050 2060 2070
Percent
change
Austin Chalk 3,618 3,618 3,618 3,618 3,618 3,618 0
Blaine 30,692 30,793 30,807 30,831 30,873 30,931 1
Blossom 723 723 722 722 722 722 0
Bone Spring-
Victorio Peak 68,642 68,642 68,642 68,642 68,642 68,642 0
Brazos River
Alluvium 148,920 145,718 145,392 145,303 145,262 145,239 -3
Buda Limestone 50 50 114 168 229 289 478
Capitan Reef
Complex 13,629 13,629 8,104 8,104 8,104 8,104 -41
Carrizo-Wilcox 672,841 681,209 687,886 693,615 694,922 694,693 3
Cross Timbers 9,184 9,348 8,201 7,808 7,812 7,820 -15
Dockum 67,779 67,183 66,880 66,805 66,873 66,816 -1
Edwards
(Balcones Fault Zone) 265,040 265,281 265,854 266,261 266,442 266,618 1
Edwards-Trinity
(Plateau)/Pecos
Valleya 175,622 168,286 172,014 170,072 167,656 164,760 -6
Edwards-Trinity
(Plateau) 3,857 3,857 3,857 3,857 3,857 3,857 0
Edwards-Trinity
(Plateau)/Pecos
Valley/Trinitya 227,299 228,437 221,056 211,168 205,130 204,366 -10
Ellenburger-San
Saba 21,386 21,349 20,476 19,938 19,492 19,175 -10
Frio River
Alluvium 609 609 609 609 609 609 0
Gulf Coast 1,395,614 1,251,219 1,179,114 1,202,922 1,227,311 1,252,253 -10
Hickory 28,708 28,164 27,070 26,421 25,917 25,508 -11
Hueco-Mesilla
Bolsons 167,028 167,028 167,028 167,028 167,028 167,028 0
Igneous 8,756 8,756 8,756 8,756 8,756 8,756 0
Leona Gravel 9,854 10,086 10,236 10,412 10,634 10,877 10
Lipan 45,696 45,703 45,702 45,702 45,701 45,701 0
Marathon 566 566 566 566 566 566 0
Marble Falls 1,826 1,826 1,826 1,826 1,826 1,826 0
Nacatoch 6,637 6,670 6,661 6,580 6,501 6,485 -2
Navasota River
Alluvium 58 58 58 58 58 58 0
Nueces River
Alluvium 13 13 13 13 13 13 0
Ogallala/Edwards-
Trinity (High
Plains)a 2,877,633 1,995,757 1,466,426 1,180,748 1,025,520 933,924 -68
Ogallala/Rita
Blancaa 626,332 432,477 337,860 252,457 176,937 177,993 -72

DRAFT 2022 State Water Plan | Texas Water Development Board D-178
Aquifer 2020 2030 2040 2050 2060 2070
Percent
change
Ogallala 1,266,282 1,223,996 1,156,231 1,047,358 943,288 945,346 -25
Other 178,613 178,741 178,389 177,794 177,362 177,139 -1
Pecos Valley 150 150 150 150 150 150 0
Queen City 29,053 29,758 30,181 30,350 30,422 30,551 5
Rustler 4,719 4,719 4,719 4,719 4,719 4,719 0
San Bernard
River Alluvium - - - - - - na
San Jacinto River
Alluvium - - - - - - na
San Marcos River
Alluvium - - - - - - na
Seymour 179,391 170,041 170,638 172,210 173,061 170,176 -5
Sparta 19,058 20,218 20,414 20,527 20,655 20,806 9
Trinity 266,544 264,284 263,868 264,586 266,517 268,473 1
Trinity River
Alluvium - - - - - - na
West Texas
Bolsons 43,620 43,620 43,620 43,620 43,620 43,620 0
Woodbine 21,740 21,221 21,224 21,206 21,210 21,202 -3
Yegua-Jackson 23,862 23,898 23,865 23,883 23,560 23,619 -1
Texas 8,911,644 7,637,701 6,868,847 6,407,413 6,091,575 6,023,048 -32
a Noted aquifer combinations reflect specific groundwater management policy decisions based on aquifer properties. In these cases, the
modeled available groundwater and existing supply values have likewise been developed to honor these aquifer combinations.
na = not applicable

DRAFT 2022 State Water Plan | Texas Water Development Board D-179
Appendix C Annual water needs by region and water use category
(acre-feet)
Region
Water use
category 2020 2030 2040 2050 2060 2070
A
Irrigation 146,064 381,557 385,041 351,667 309,784 310,602
Manufacturing 1,008 2,585 4,015 6,932 9,372 9,684
Municipal 1,387 9,961 21,873 35,686 49,380 58,136
A Total 148,459 394,103 410,929 394,285 368,536 378,422
B
Irrigation 21,165 22,979 24,793 26,606 28,419 30,233
Manufacturing 0 0 0 0 13 145
Mining 1,616 678 556 201 137 137
Municipal 263 532 1,298 2,135 3,149 6,028
Steam-electric 1,701 2,303 2,905 3,506 4,109 4,713
B Total 24,745 26,492 29,552 32,448 35,827 41,256
C
Irrigation 4,584 4,654 4,712 4,757 5,042 5,395
Livestock 478 478 478 478 478 478
Manufacturing 402 5,350 9,072 12,148 14,601 17,532
Mining 11,005 11,350 12,545 14,852 17,334 21,425
Municipal 42,659 274,237 489,855 723,029 963,130 1,217,573
Steam-electric 6,824 10,569 12,957 14,233 15,195 16,023
C Total 65,952 306,638 529,619 769,497 1,015,780 1,278,426
D
Irrigation 13,188 13,206 13,208 13,209 13,211 13,213
Livestock 14,542 14,552 14,540 14,455 14,477 14,491
Manufacturing 2,914 5,578 5,455 5,465 5,735 5,865
Mining 2,390 2,278 1,916 1,534 1,224 1,039
Municipal 17,488 20,418 24,510 30,368 38,414 49,331
Steam-electric 30,066 30,866 31,766 32,566 32,814 33,083
D Total 80,588 86,898 91,395 97,597 105,875 117,022
E
Irrigation 46,737 46,737 52,262 52,262 52,262 52,262
Manufacturing 0 860 860 860 860 860
Mining 2,530 3,223 3,840 4,407 5,038 5,796
Municipal 4,102 8,061 11,815 24,605 38,953 52,666
Steam-electric 7,260 7,260 7,260 7,260 7,260 7,260
E Total 60,629 66,141 76,037 89,394 104,373 118,844
F
Irrigation 13,529 17,957 19,544 21,240 24,585 27,060
Livestock 9 17 25 39 50 60
Manufacturing 951 1,065 1,108 1,327 1,527 1,710
Mining 21,261 21,357 17,834 12,088 7,677 5,407
Municipal 14,048 18,792 23,899 33,706 44,212 55,512

DRAFT 2022 State Water Plan | Texas Water Development Board D-180
Region
Water use
category 2020 2030 2040 2050 2060 2070
Steam-electric 12,794 12,678 12,678 12,800 12,923 13,039
F Total 62,592 71,866 75,088 81,200 90,974 102,788
G
Irrigation 75,658 81,687 76,700 75,374 76,180 78,660
Manufacturing 1,024 3,458 3,088 2,718 2,379 1,916
Mining 30,305 31,798 28,925 29,692 30,753 33,008
Municipal 31,099 65,413 109,496 163,766 221,873 290,966
Steam-electric 72,721 72,816 72,912 73,008 73,104 73,200
G Total 210,807 255,172 291,121 344,558 404,289 477,750
H
Irrigation 84,455 84,455 84,455 84,455 84,455 84,538
Livestock 1,259 1,642 1,898 1,898 1,898 1,906
Manufacturing 32,615 63,357 64,445 65,239 64,442 63,506
Mining 3,293 4,193 4,004 4,024 4,228 4,565
Municipal 18,532 246,828 418,544 506,533 609,134 723,653
Steam-electric 4,968 4,968 4,968 4,968 4,968 4,968
H Total 145,122 405,443 578,314 667,117 769,125 883,136
I
Irrigation 526 526 526 526 556 576
Livestock 23,708 26,613 30,128 34,381 39,483 40,666
Manufacturing 102,587 145,222 145,206 145,188 145,171 145,155
Mining 8,413 5,281 903 468 308 207
Municipal 501 877 2,551 5,832 10,120 15,540
Steam-electric 3,494 3,494 3,494 3,494 3,494 3,494
I Total 139,229 182,013 182,808 189,889 199,132 205,638
J
Irrigation 75 75 75 75 75 75
Livestock 357 357 357 357 357 357
Mining 221 281 294 259 229 210
Municipal 5,082 5,735 6,366 7,016 7,641 8,607
J Total 5,735 6,448 7,092 7,707 8,302 9,249
K
Irrigation 254,364 239,922 225,869 212,193 198,886 185,938
Manufacturing 0 40 40 40 40 40
Mining 2,677 6,937 8,264 7,708 5,472 6,860
Municipal 4,927 13,378 34,037 50,170 72,550 105,401
Steam-electric 20,546 20,546 20,546 20,546 20,546 20,546
K Total 282,514 280,823 288,756 290,657 297,494 318,785
L
Irrigation 131,184 131,915 134,104 136,099 137,596 140,812
Manufacturing 10,427 12,940 13,041 13,073 13,073 13,073
Mining 15,921 16,809 15,105 12,334 10,454 9,180
Municipal 24,468 48,817 83,667 121,804 167,216 216,255
Steam-electric 21,707 21,707 21,707 21,707 21,707 21,707
L Total 203,707 232,188 267,624 305,017 350,046 401,027

DRAFT 2022 State Water Plan | Texas Water Development Board D-181
Region
Water use
category 2020 2030 2040 2050 2060 2070
M
Irrigation 888,896 843,532 798,075 753,082 707,399 662,060
Manufacturing 632 851 851 851 851 851
Mining 6,662 6,007 4,834 4,386 4,566 5,318
Municipal 35,487 69,080 117,113 174,131 235,515 296,472
Steam-electric 5,217 5,028 4,928 4,928 4,928 4,928
M Total 936,894 924,498 925,801 937,378 953,259 969,629
N
Irrigation 1,283 1,474 1,474 1,474 1,474 1,474
Manufacturing 1,479 16,617 21,509 25,741 30,222 34,441
Mining 2,203 2,430 2,327 2,185 2,158 2,216
Municipal 10,235 10,571 10,769 10,931 11,107 11,233
N Total 15,200 31,092 36,079 40,331 44,961 49,364
O
Irrigation 705,992 1,440,091 1,450,917 1,446,461 1,445,719 1,445,026
Livestock 112 122 844 2,041 3,689 5,442
Manufacturing 5,454 6,482 6,482 6,482 6,482 6,482
Mining 10,118 10,503 9,517 8,145 6,908 6,016
Municipal 4,345 9,345 15,418 21,861 30,062 36,931
O Total 726,021 1,466,543 1,483,178 1,484,990 1,492,860 1,499,897
P Irrigation 8,067 8,067 8,067 8,067 8,067 8,067
P Total 8,067 8,067 8,067 8,067 8,067 8,067
Texas 3,116,261 4,744,425 5,281,460 5,740,132 6,248,900 6,859,300

DRAFT 2022 State Water Plan | Texas Water Development Board D-182
Appendix D Socioeconomic impact regional summary and dashboards
The TWDB assists the regional water planning groups in evaluating the social and economic impacts of
not meeting identified water needs for a single year drought of record. The TWDB calculated all
estimates using a variety of data sources and tools, including the use of a region-specific Impact for
Planning Analysis model. This appendix presents regional summaries of socioeconomic impact reports
for all regions.
The regional water plan impact estimates presented in this table and the online dashboards vary from
the results included in Chapter 6. This is primarily due to a difference in the quantity of water needs
used to estimate the impacts. The results included in the regional water plans and online dashboards
were from the analysis conducted in September 2019 to allow for public comment in the draft regional
plans. Final regional water plans included updated water need estimates, and the impact estimates
included in this appendix were performed based upon the final needs data in November 2020.
Full socioeconomic impact reports for all 16 planning regions are available on the TWDB website.
www.twdb.texas.gov/waterplanning/data/analysis/index.asp
Socioeconomic impact regional summary
Region Impact measures 2020 2030 2040 2050 2060 2070
A Income losses ($millions)* $80 $432 $867 $2,262 $3,225 $3,511
A Job losses 770 4,380 9,535 23,417 33,968 37,964
A
Tax losses on production and
imports ($millions)* $4 $23 $58 $171 $249 $272
A Population losses 141 804 1,751 4,299 6,236 6,970
B Income losses ($millions)* $1,423 $505 $460 $320 $284 $339
B Job losses 5,249 1,703 1,460 863 699 1,316
B
Tax losses on production and
imports ($millions)* $164 $51 $43 $23 $16 $19
B Population losses 964 313 268 158 128 242
C Income losses ($millions)* $3,505 $8,361 $16,791 $27,127 $37,499 $48,071
C Job losses 20,437 73,315 158,102 260,573 366,762 472,979
C
Tax losses on production and
imports ($millions)* $279 $582 $1,123 $1,777 $2,461 $3,221
C Population losses 3,752 13,461 29,027 47,841 67,338 86,839
D Income losses ($millions)* $5,868 $7,000 $6,602 $6,211 $6,068 $6,148
D Job losses 46,069 57,405 55,266 54,160 56,434 59,710
D
Tax losses on production and
imports ($millions)* $445 $548 $500 $454 $440 $450
D Population losses 8,458 10,540 10,147 9,944 10,361 10,963
E Income losses ($millions)* $883 $1,143 $1,287 $1,386 $1,538 $1,753
E Job losses 3,635 5,443 6,606 7,592 9,422 11,989

DRAFT 2022 State Water Plan | Texas Water Development Board D-183
Region Impact measures 2020 2030 2040 2050 2060 2070
E
Tax losses on production and
imports ($millions)* $58 $80 $93 $103 $118 $139
E Population losses 667 999 1,213 1,394 1,730 2,201
F Income losses ($millions)* $19,624 $19,720 $17,058 $13,443 $7,750 $6,356
F Job losses 98,208 100,186 88,685 71,444 43,995 38,833
F
Tax losses on production and
imports ($millions)* $2,644 $2,647 $2,266 $1,749 $937 $725
F Population losses 18,031 18,394 16,283 13,117 8,078 7,130
G Income losses ($millions)* $13,299 $15,465 $13,353 $12,695 $12,154 $12,080
G Job losses 65,131 86,060 80,693 86,373 91,113 98,141
G
Tax losses on production and
imports ($millions)* $967 $1,152 $932 $836 $749 $712
G Population losses 11,958 15,801 14,815 15,858 16,728 18,019
H Income losses ($millions)* $4,600 $8,521 $10,313 $11,301 $12,437 $13,784
H Job losses 28,805 66,183 95,862 110,604 127,869 148,164
H
Tax losses on production and
imports ($millions)* $507 $815 $944 $1,021 $1,115 $1,226
H Population losses 5,289 12,151 17,600 20,307 23,477 27,203
I Income losses ($millions)* $9,314 $6,786 $3,515 $3,651 $3,892 $3,920
I Job losses 68,468 57,221 42,058 45,480 50,164 51,585
I
Tax losses on production and
imports ($millions)* $1,061 $704 $248 $242 $243 $239
I Population losses 12,571 10,506 7,722 8,350 9,210 9,471
J Income losses ($millions)* $233 $298 $316 $289 $268 $257
J Job losses 2,272 2,597 2,780 2,850 2,935 3,064
J
Tax losses on production and
imports ($millions)* $26 $33 $35 $32 $29 $28
J Population losses 417 477 510 523 539 563
K Income losses ($millions)* $1,282 $1,363 $1,702 $1,986 $2,168 $2,609
K Job losses 5,018 6,859 12,154 16,898 21,398 27,413
K
Tax losses on production and
imports ($millions)* $73 $49 $67 $93 $117 $151
K Population losses 921 1,259 2,231 3,102 3,929 5,033
L Income losses ($millions)* $16,571 $17,246 $14,600 $11,679 $9,674 $9,384
L Job losses 100,514 107,453 96,710 86,976 85,393 94,978
L
Tax losses on production and
imports ($millions)* $1,775 $1,794 $1,433 $1,032 $740 $663

DRAFT 2022 State Water Plan | Texas Water Development Board D-184
Region Impact measures 2020 2030 2040 2050 2060 2070
L Population losses 18,454 19,728 17,756 15,969 15,678 17,438
M Income losses ($millions)* $8,004 $7,273 $6,468 $6,523 $6,581 $7,355
M Job losses 56,165 61,242 66,154 76,308 87,917 104,162
M
Tax losses on production and
imports ($millions)* $771 $650 $538 $531 $522 $600
M Population losses 10,312 11,244 12,146 14,010 16,142 19,124
N Income losses ($millions)* $732 $1,930 $3,178 $4,662 $5,998 $6,914
N Job losses 5,955 13,686 22,208 32,324 41,429 47,613
N
Tax losses on production and
imports ($millions)* $80 $170 $259 $366 $462 $529
N Population losses 1,093 2,513 4,077 5,935 7,606 8,742
O Income losses ($millions)* $12,745 $15,091 $14,621 $14,075 $13,806 $13,596
O Job losses 91,473 112,867 112,166 112,158 114,484 115,546
O
Tax losses on production and
imports ($millions)* $1,076 $1,221 $1,171 $1,109 $1,076 $1,051
O Population losses 16,794 20,722 20,594 20,592 21,019 21,214
P Income losses ($millions)* $2 $2 $2 $2 $2 $1
P Job losses 39 37 35 33 32 30
P
Tax losses on production and
imports ($millions)* $0 $0 $0 $0 $0 $0
P Population losses 7 7 6 6 6 5
* Year 2018 dollars, rounded.
Interactive dashboards
The detailed socioeconomic impact data behind the summaries included in Chapter 6 are provided at
the region and county level and can be explored via the TWDB’s new, interactive dashboards (Figure D-
1) at www.twdb.texas.gov/waterplanning/data/analysis/index.asp. The dashboards display water demands
and needs, as well as potential social and economic impacts of not meeting water needs in the 2021
regional water plans.

DRAFT 2022 State Water Plan | Texas Water Development Board D-185
Figure D-1. Interactive dashboards