water option contracts for reducing water supply risks: an
TRANSCRIPT

Water option contracts for reducing water supply risks: an application to the Tagus-Segura
Transfer
TESIS DOCTORAL
Dolores Rey Vicario Ingeniera Agrónoma
DIRECTORES
Alberto Garrido Colmenero Dr. Ingeniero Agrónomo
Universidad Politécnica de Madrid
Javier Calatrava Leyva Dr. Ingeniero Agrónomo
Universidad Politécnica de Cartagena
Madrid, 2014


Tribunal nombrado por el Sr. Rector Magfco. de la Universidad Politécnica de Madrid, el día ……… de …………………. de 201…
Presidente: ………………………………………………………………………… Vocal: ……………………………………………………………………………… Vocal: ……………………………………………………………………………… Vocal: ……………………………………………………………………………… Secretario: ………………………………………………………………………… Suplente:………………………………………………………………………… Suplente: …………………………………………………………………………
Realizado el acto de defensa y lectura de la Tesis el día …… de …………. de 201… en la E.T.S.I./Facultad ……………………….
Calificación ………………………………………….
EL PRESIDENTE LOS VOCALES
EL SECRETARIO


i
AGRADECIMIENTOS Son muchas las personas que me han ayudado, de formas muy distintas, a terminar esta tesis. Me gustaría aprovechar esta oportunidad para agradecérselo.
Quisiera expresar mi agradecimiento a mis dos tutores, Alberto Garrido y Javier Calatrava. Los dos han hecho un equipo perfecto guiándome en mi trabajo y ayudándome a crecer como investigadora. Gracias, Alberto, por haber confiado en mí desde hace muchos años, por todo lo que he aprendido a tu lado y por tu ayuda constante durante todo este tiempo. Gracias, Javier, por todo lo que has aportado a esta tesis, por repasar cada documento que te he enviado palabra por palabra, y por estar siempre dispuesto a ayudarme en lo que sea.
También quiero agradecer a la UPM y a los proyectos “MINUNIMAD-CC” y “Water Cap & Trade” por la financiación durante todos estos años para poder realizar mi tesis doctoral. Gracias a Inés Mínguez y Margarita Ruiz-Ramos por su gran ayuda durante mis primeros años. También me gustaría agradecer a todos los compañeros del proyecto “Water Cap & Trade” lo que he aprendido con ellos, las reuniones tan interesantes que hemos tenido y la experiencia de colaborar con gente de diferentes universidades.
Gracias al Departamento de Economía y Ciencias Sociales Agrarias por todo lo aprendido durante estos años, especialmente a la directora Isabel Bardají, a Ana Iglesias, Consuelo Varela y Eva Iglesias.
Gracias al CEIGRAM por acogerme desde el primer momento. He estado muy a gusto durante los casi 5 años que llevo trabajando aquí. Gracias a Katerina, Begoña y Esperanza, por vuestra ayuda y por facilitarnos las cosas.
Muchísimas gracias a todos mis compañeros del CEIGRAM: Elena, Marina G., Paula, Paloma, Dani, Gloria, Jorge, Teresa, Bárbara W., Bárbara S., Berta, Axel, Ana, Sol, Marina M., Insa, Cristian, Ruth, Jhenny… Hacer esta tesis hubiera sido muchísimo más duro sin vuestros ánimos, consejos y sin las conversaciones durante las comidas y las risas. Quería agradecer especialmente la ayuda de Paloma con todas mis dudas sobre los trámites de la tesis.
Muchas gracias a todas mis amigas y amigos, por animarme durante todo el proceso y apoyarme siempre en todo.

ii
En especial, quiero agradecer a mi familia toda su ayuda, no solo en la tesis, sino con todo lo que he hecho. Y a Charlie, que ha sido el que ha vivido más de cerca la recta final, y me ha ayudado y animado en todo momento, haciendo que todo fuera más fácil.
¡GRACIAS!

iii
RESUMEN El agua es un recurso cada vez más escaso y valioso. Por ello, los recursos hídricos
disponibles deben asignarse de una forma eficiente entre los diferentes usos. El
cambio climático aumentará la frecuencia y severidad de los eventos extremos, y
podría incrementar la demanda de agua de los cultivos. El empleo de mecanismos
flexibles de asignación de agua puede ser imprescindible para hacer frente a este
aumento en la variabilidad del balance hídrico y para asegurar que los riesgos de
suministro, y no solo los recursos, son compartidos de manera eficiente entre los
usuarios. Los mercados de agua permiten la reasignación de los recursos hídricos,
favoreciendo su transferencia desde los usos de menor a los de mayor valor.
Diferentes tipos de mercados de agua se han establecido en diferentes partes del
mundo, ayudando a los participantes a afrontar los problemas de escasez de agua
en esas zonas.
En España, los intercambios de agua están permitidos desde 1999, aunque la
participación de los usuarios en el mercado ha sido limitada. Hay varios aspectos
de los mercados de agua en España que deben mejorarse. Esta tesis, además de
proponer una serie de cambios en el marco regulatorio, propone la introducción de
contratos de opción de agua como una posible mejora. La principal ventaja de este
tipo de contratos es la estabilidad legal e institucional que éstos proporcionan tanto
a compradores como vendedores. Para apoyar esta propuesta, se han llevado a
cabo diferentes análisis que muestran el potencial de los contratos de opción como
herramienta de reducción del riesgo asociado a una oferta de agua inestable. La
Cuenca del Segura (Sureste de España), la Cuenca del Tajo y el Acueducto Tajo-
Segura han sido seleccionados como casos de estudio. Tres análisis distintos
aplicados a dicha región se presentan en esta tesis: a) una evaluación de los
contratos de opción como mecanismo para reducir los riesgos de disponibilidad de
agua sufridos por los regantes en la Cuenca del Segura; b) un marco teórico para

iv
analizar las preferencias de los regantes por diferentes mecanismos de gestión del
riesgo de disponibilidad de agua, su disposición a pagar por ellos y los precios
aproximados de estos instrumentos (seguro de sequía y contratos de opción de
agua); y c) una evaluación del papel de los contratos de opción en las decisiones de
aprovisionamiento de agua de una comunidad de regantes ante una oferta de agua
incierta. Los resultados muestran el potencial de reducción del riesgo de los
contratos de opción para regantes en España, pero pueden ser extrapolados a otros
sectores o regiones.
Las principales conclusiones de esta tesis son: a) la agricultura será uno de los
sectores más afectados por el cambio climático. Si los precios del agua aumentan, la
rentabilidad de los cultivos puede caer hasta niveles negativos, lo que podría dar
lugar al abandono de cultivos de regadío en algunas zonas de España. Las políticas
de cambio climático y de agua deben estar estrechamente coordinadas para
asegurar un uso de agua eficiente y la rentabilidad de la agricultura; b) aunque los
mercados de agua han ayudado a algunos usuarios a afrontar problemas de
disponibilidad del recurso en momentos de escasez, hay varios aspectos que deben
mejorarse; c) es necesario desarrollar mercados de agua más flexibles y estables
para garantizar una asignación eficiente de los recursos entre los usuarios de agua;
d) los resultados muestran los beneficios derivados del establecimiento de un
contrato de opción entre usuarios de agua del Tajo y del Segura para reducir el
riesgo de disponibilidad de agua en la cuenca receptora; e) la disposición a pagar
de los regantes por un contrato de opción de agua o un seguro de sequía
hidrológica, que representa el valor que tienen estos mecanismos para aquellos
usuarios de agua que se enfrentan a riesgos relacionados con la disponibilidad del
recurso, es consistente con los resultados obtenidos en estudios previos y superior
al precio de mercado de estos instrumentos, lo que favorece la viabilidad de estos
mecanismos de gestión del riesgo ; y f) los contratos de opción podrían ayudar a
optimizar las decisiones de aprovisionamiento de agua bajo incertidumbre,

v
proporcionando más estabilidad y flexibilidad que los mercados temporales de
agua.
Palabras clave: contrato de opción, Cuenca del Segura, incertidumbre, mercados
de agua, riesgos de disponibilidad de agua, Trasvase Tajo-Segura.

vi

vii
SUMMARY Water is becoming increasingly scarce and valuable. Thus, existing water resources
need to be efficiently allocated among users. Climate change is expected to
increase the frequency and severity of extreme events, and it may also increase
irrigated crops' water demand. The implementation of flexible allocation
mechanisms could be essential to cope with this increased variability of the water
balance and ensure that supply risks, and not only water resources, are also
efficiently shared and managed. Water markets allow for the reallocation of water
resources from low to high value uses. Different water trading mechanisms have
been created in different parts of the world and have helped users to alleviate
water scarcity problems in those areas.
In Spain, water trading is allowed since 1999, although market activity has been
limited. There are several issues in the Spanish water market that should be
improved. This thesis, besides proposing several changes in the legislative
framework, proposes the introduction of water option contracts as a potential
improvement. The main advantage for both buyer and seller derived from an
option contract is the institutional and legal stability it provides. To support this
proposal, different analyses have been carried out that show the potential of option
contracts as a risk reduction tool to manage water supply instability. The Segura
Basin (Southeast Spain), the Tagus Basin and the Tagus-Segura inter-basin Transfer
have been selected as the case study. Three different analyses applied to this region
are presented in this thesis: a) an evaluation of option contracts as a mechanisms to
reduce water supply availability risks in the Segura Basin; b) a theoretical
framework for analyzing farmer’s preferences for different water supply risk
management tools and farmers’ willingness to pay for them, together with the
assessment of the prices of these mechanisms (drought insurance and water option
contracts); and c) an evaluation of the role of option contracts in water
procurement decisions under uncertainty. Results show the risk-reduction

viii
potential of option contracts for the agricultural sector in Spain, but these results
can be extrapolated to other sectors or regions.
The main conclusions of the thesis are: a) agriculture would be one of the most
affected sectors by climate change. With higher water tariffs, crop’s profitability
can drop to negative levels, which may result in the abandoning of the crop in
many areas. Climate change and water policies must be closely coordinated to
ensure efficient water use and crops’ profitability; b) although Spanish water
markets have alleviated water availability problems for some users during water
scarcity periods, there are several issues that should be improved; c) more flexible
and stable water market mechanisms are needed to allocate water resources and
water supply risks among competing users; d) results show the benefits derived
from the establishment of an inter-basin option contract between water users in the
Tagus and the Segura basins for reducing water supply availability risks in the
recipient area; e) irrigators’ willingness to pay for option contracts or drought
insurance, that represent the value that this kind of trading mechanisms has for
water users facing water supply reliability problems, are consistent with results
obtained in previous works and higher than the prices of this risk management
tools, which shows the feasibility of these mechanisms; and f) option contracts
would help to optimize water procurement decisions under uncertainty, providing
more flexibility and stability than the spot market.
Keywords: option contracts, Segura Basin, Spain, Tagus-Segura Transfer,
uncertainty, water markets, water supply risk.

TABLE OF CONTENTS
AGRADECIMIENTOS ....................................................................................................... i
RESUMEN ..........................................................................................................................iii
SUMMARY ....................................................................................................................... vii
1. INTRODUCTION ....................................................................................................... 1
1.1. Water resources, climate change and the role of water markets............................. 1
1.2. Aims and scope ................................................................................................................ 4
1.3. Outline ............................................................................................................................... 5
1.4. Research context and publications ............................................................................... 8
2. WATER MARKETS .................................................................................................. 13
2.1. Water markets definition ............................................................................................. 13
2.2. Why water allocation mechanisms? ........................................................................... 14
2.3. Advantages and disadvantages of water markets as allocation mechanisms .... 18
2.4. Types of water markets ................................................................................................ 21
2.5. Water markets around the world ................................................................................ 23
2.6. Option contracts for water ........................................................................................... 27
3. WATER MARKETS IN SPAIN .............................................................................. 31
3.1. Legislation ...................................................................................................................... 31
3.2. Past trading experiences: overview and evaluation ................................................ 36
3.2.1. Water exchange centers ......................................................................................... 37
3.2.2. Formal lease contracts under the 1999 Reformed Water Law’s provision ..... 40
3.2.3. Inter-basin exchanges under Royal Decree 15/2005 ......................................... 41
3.2.4. The Canary Islands ................................................................................................. 44
3.2.5. Informal water exchanges ..................................................................................... 45
3.3. Economic issues ............................................................................................................ 46
3.4. Reasons behind the limited success of water markets in Spain .......................... 49
3.5. Present and future: Possible reforms ......................................................................... 53
4. AN INNOVATIVE OPTION CONTRACT FOR ALLOCATING WATER IN INTER-BASIN TRANSFERS: THE CASE OF THE TAGUS-SEGURA TRANSFER IN SPAIN .................................................................................................... 57
4.1. Introduction .................................................................................................................... 58
4.1.1. Case study: The Segura Basin and the Tagus-Segura Transfer........................ 60
4.2. Description of scenarios ............................................................................................... 68
4.2.1. Tagus-Segura Transfer management rules ......................................................... 69
4.2.2. Water market scenarios: spot market and option contract ............................... 70
4.3. Empirical analysis ......................................................................................................... 72
4.3.1. Water availability for irrigators in the Segura Basin ......................................... 72
4.3.2. Resulting water availability in the Tagus Basin ................................................. 79
4.3.3. Economic valuation ................................................................................................ 80
4.4. Data sources .................................................................................................................... 82
4.5. Results and discussion ................................................................................................. 83
4.5.1. Comparison of water availability under the different scenarios ..................... 83
4.5.2. Remaining water stock in E-B reservoir .............................................................. 86
4.5.3. Economic analysis .................................................................................................. 88
4.6. Conclusions .................................................................................................................... 90
5. COMPARISON OF DIFFERENT WATER SUPPLY RISK MANAGEMENT TOOLS FOR IRRIGATORS: OPTION CONTRACTS AND INSURANCE ........ 93
5.1. Introduction .................................................................................................................... 93
5.2. Theoretical framework ................................................................................................. 95
5.2.1. Expected utility function without a water supply risk management tool ..... 98
5.2.2. Expected utility function with a water supply risk management tool ........... 99
5.2.3. Analysis of the supply side of the instruments ................................................ 103
5.3. Comparison between instruments ........................................................................... 104
5.3.1. Comparison between option contract (b) and insurance ................................ 104
5.3.2. Comparison between option contract (a) and insurance ................................ 108
5.4. Application to an irrigation district in Spain ......................................................... 109
5.4.1. Willingness to pay for the different instruments ............................................. 112
5.4.2. Option contract and drought insurance prices ................................................ 118
5.5. Discussion ..................................................................................................................... 120

5.6. Conclusions .................................................................................................................. 124
6. OPTIMIZATION OF WATER PROCUREMENT DECISIONS IN AN IRRIGATION DISTRICT: THE ROLE OF OPTION CONTRACTS ................... 127
6.1. Introduction .................................................................................................................. 127
6.2. Case study and data collection: The Lorca irrigation district.............................. 129
6.3. Proposed water option contract ................................................................................ 135
6.4. Optimization model .................................................................................................... 137
6.4.1. First-stage stochastic decision model ................................................................ 138
6.4.2. Second-stage deterministic decision model ...................................................... 140
6.4.3. Baseline model (without the option contract) .................................................. 140
6.4.4. Parameterization of the option contract ............................................................ 141
6.5. Results ........................................................................................................................... 143
6.5.1. First-stage decision results .................................................................................. 144
6.5.2. Second-stage decision results ............................................................................. 148
6.6. Conclusions .................................................................................................................. 155
7. CONCLUSIONS ...................................................................................................... 157
7.1. General conclusions .................................................................................................... 157
7.2. Spanish water markets ............................................................................................... 159
7.3. Option contracts for water ......................................................................................... 161
7.3.1. Inter-basin option contracts ................................................................................ 162
7.3.2. Farmer’s preferences for different water supply risk management tools (option contracts and drought insurance) ........................................................................ 164
7.3.3. Finding irrigation district’s optimal water procurement decisions: the role of option contracts .................................................................................................................... 165
7.4. Limitations and further research .............................................................................. 166
REFERENCES .................................................................................................................. 169
APPENDIX 1 .................................................................................................................... 191
APPENDIX 2 .................................................................................................................... 197


LIST OF FIGURES
Figure 1. Thesis outline ....................................................................................................... 6
Figure 2. Spanish River Basins (left), including the Canary Islands (right) .............. 34
Figure 3. Formal and informal water trading in Spain. ............................................... 37
Figure 4. Tagus and Segura Basins’ location in the Iberian Peninsula and the Tagus-
Segura Aqueduct ............................................................................................................... 61
Figure 5. Monthly stored volume (million m3) in Entrepeñas-Buendía .................... 62
Figure 6. Transferred water volume (million m3) for irrigators and urban suppliers
through the Tagus-Segura Transfer, 1978-2010 ............................................................. 64
Figure 7. Different management rules for the Tagus-Segura Transfer ...................... 75
Figure 8. Suggested values of the coefficient H ............................................................ 78
Figure 9. Cumulative probability curves representing the water availability
(million m3) for irrigators in the Segura Basin. ............................................................. 84
Figure 10. Cumulative ascending curves of the PDFs of the remaining stock (St) in
E-B ........................................................................................................................................ 86
Figure 11. Cumulative ascending curves of PDFs of the net benefit derived from
the Tagus-Segura water transfers .................................................................................... 89
Figure 12. Farmer’s ordered preferences for the risk management tools (according
to the obtained risk premium for each case) ................................................................ 109
Figure 13. PDF of farmer’s water availability (m3) per hectare in the Campo de
Cartagena irrigation district. .......................................................................................... 113
Figure 14. Farmers’ willingness to pay for each instrument, by water availability
variation coefficient values. ............................................................................................ 114
Figure 15. Farmers’ willingness to pay for these instruments under different risk
aversion levels .................................................................................................................. 115
Figure 16. Farmer’s willingness to pay (€/ha) for each instrument considering
different probabilities of exercising the option/getting the indemnity (γ). Absolute
risk aversion level = 0.0005 and 0.001 ........................................................................... 116

Figure 17. Farmer’s willingness to pay for each instrument considering different
exercise prices ................................................................................................................... 117
Figure 18. Prices (€/ha) for option contract and drought insurance, and WTP for
these instruments for different guarantee levels (wg) ................................................ 119
Figure 19. Location of the Lorca irrigation district ..................................................... 130
Figure 20. Characterization of Lorca irrigation district’s current water availability
from each source (hm3) under each possible state of the nature .............................. 134
Figure 21. Water prices for the different water sources. For the option contract, all
the parameterizations (€/m3) of the premium (OP) and the exercise price (P) are
taken into account ............................................................................................................ 143
Figure 22. Average probability of signing the option contract for each parameter’s
value .................................................................................................................................. 148
Figure 23. Option contract decision tree (all the values of the parameters are taking
into account to calculate the probabilities of each step) ............................................ 149
Figure 24. Cumulative ascending probability distribution of total water volume
(hm3) and costs (€/m3) in the irrigation district for three scenarios (a and b, with
option contract; c without option contract) ................................................................. 151
Figure 25. Water volumes from different sources, for each parameterization of the
option contract (only those cases when the option is signed are shown in the
graph). Volumes represent the mean of the purchased volumes in the 19 states of
nature (X axis, unitary costs of the option contract (€/m3) and optioned volume
below (hm3)) ..................................................................................................................... 153
LIST OF TABLES
Table 1. Advantages and disadvantages of water trading mechanisms to ensure
efficient, equitable and sustainable water allocation .................................................... 18
Table 2. Main characteristics of water markets in Australia, Chile and USA ........... 25
Table 3. Main differences between the National Law and the Andalusian Law
related to water markets ................................................................................................... 35
Table 4. Description of the water exchange centers in the Guadiana, Júcar and
Segura Basins ...................................................................................................................... 38
Table 5. Potential improvements for Spanish water markets ..................................... 54
Table 6. Criteria and risk valuation for evaluating a water exchange ....................... 55
Table 7. Tagus-Segura Transfer’s statutory management rules .................................. 63
Table 8. Minimum stored volumes in the Entrepeñas-Buendía reservoirs below
which the decisions for transfer correspond to the Council of Ministers (hm3)....... 63
Table 9. Water transaction experiences between users in the Segura (buyer) and the
Tagus (seller) basins .......................................................................................................... 65
Table 10. Average values for irrigation in the Tagus Basin and the Segura Basin
(areas served from the Tagus-Segura Aqueduct) (€/m3) ............................................ 68
Table 11. Scenarios ............................................................................................................. 69
Table 12. Estimated regression model for the variable “annual transferred volume
to irrigators” (Vt1) .............................................................................................................. 73
Table 13. Positive and negative factors affecting the Tagus Basin for each scenario
.............................................................................................................................................. 81
Table 14. Considered values of the economic factors affecting each basin. .............. 83
Table 15. Percentiles’ value of the transferred volume (million m3) for the different
scenarios .............................................................................................................................. 85
Table 16. Percentiles’ value of the remaining stock in the E-B reservoir (million m3)
for the different scenarios. ................................................................................................ 87

Table 17. Percentiles’ value of the net benefit derived from the transferred water
volume (€ million). ............................................................................................................ 90
Table 18. Current water supply sources for the Lorca irrigation district ................ 132
Table 19. Current water prices for each water source paid by the irrigation district
(€/m3; distribution costs not included) ........................................................................ 135
Table 20. Parameterization of the option contract conditions (number of cases
5x5x5x3=375) .................................................................................................................... 142
Table 21. Decision of signing the option contract, depending on the parameters’
values ................................................................................................................................. 145
Table 22. Logistic regression results for the contract decision (Q) ............................ 146
Table 23. Comparison of water procurement costs and total water volume for the
Lorca irrigation district, with and without the option contract (average values for
all possible states of nature) ........................................................................................... 150

ABBREVIATIONS
CARA: Constant Absolute Risk Aversion.
CV: Coefficient of Variation.
DARA: Decreasing Absolute Risk Aversion.
E-B: Entrepeñas-Buendía reservoir.
ID: Irrigation District.
MGF: Moment Generating Function.
PDF: Probability Distribution Function.
RBA: River Basin Agency.
TST: Tagus-Segura Transfer.
WFD: Water Framework Directive.
WTA: Willingness To Accept.
WTP: Willingness To Pay.
WUA: Water Users Association.


1. INTRODUCTION
1
1. INTRODUCTION
1.1. Water resources, climate change and the role of water markets
Many countries around the world face water scarcity problems. Population and
income growth, its concentration in urban areas, the change in eating habits and
climate change are some factors, among others, which will exacerbate problems
related to water availability in the future (IPCC, 2007, 2014). Besides, the
recognition that ecosystem services are essential for supporting the human life and
the wildlife presents a challenge, especially in basins and regions already
experiencing water stress (Garrik et al., 2009).
In semiarid climates, where inter-annual water availability variations are
extreme, large infrastructures may prove insufficient to mitigate the economic
effects of water scarcity in an unstable and environmentally limiting context
(Calatrava & Garrido, 2005a). To address current and future water availability
problems, there is a need for effective and flexible institutional arrangements and
allocation mechanisms to mitigate and manage water scarcity (Adler, 2009; Grafton
et al., 2010; United Nations, 2010; De Stefano & Llamas, 2012).
Globally, many freshwater ecosystems are suffering from significant
overexploitation (Bates et al., 2008; Bogardi et al., 2012; European Commission,
2012). When all available water resources in a basin are already allocated to
different users (irrigators, urban suppliers, industries, environment) and water
demand increases, the only way to meet this new demand is through the
reallocation of the existing water resources among competing needs. Inter-sectoral
reallocation is seen as one pillar of water demand management, as opposed to
supply augmentation mechanisms (Molle & Berkoff, 2006); and it can be achieved
through either decentralized or other reallocation mechanisms.

2
Currently, water trading activity is helping to alleviate water scarcity
problems in many regions worldwide (Griffin et al., 2013). Market mechanisms to
manage water resources are encouraged by many experts and organizations.
Easter et al. (1998) assert that voluntary exchanges of water among users are a
good instrument to reduce users’ risk exposure. The European Environment
Agency (2012) considers that water pricing and market-based instruments are
essential for sustainable water management and efficient water allocation. IPCC
considers that water markets may play an important role in reducing water supply
vulnerabilities (IPCC, 2007; Bates et al., 2008). According to Ranjan (2010), market
mechanisms are an essential tool for achieving water policy goals, and they offer
the best opportunity for adapting to climate change and its impacts on water
resources (Adler, 2009). Future water availability may depend on how fast regions
pursue policies to improve water management (Dosi & Easter, 2000).
Water availability in the Mediterranean region is expected to diminish
because of climate change, and extreme events such as drought and floods will be
more frequent (Giannakopoulos et al., 2005; Iglesias et al., 2007; Bates et al., 2008;
Iglesias & Quiroga, 2009; Dono & Mazzapicchio, 2010; Kolokytha, 2010; OECD,
2013). According to CEDEX (2011), in the period 2010-2040, precipitation will
decrease between 7-14% in Spain, depending on the emission scenario considered;
and for the period 2071-2100 this decrease could be close to 9-17% (OECD, 2013). In
semiarid areas, reductions in available water resources may be equivalent to 50%
of the potential resources of the region (Iglesias et al., 2005; Moreno, 2005; Garrido
et al., 2012a).
Agriculture is the main water user in Spain, accounting for nearly 70% of all
water uses. Existing irrigated areas are threatened by increasing water scarcity and
supply instability. Besides, this sector will be one of the most affected by climate
change due to its dependence on climatic conditions. Future crops’ net margin will

1. INTRODUCTION
3
be affected by climate change impacts on crops’ water needs, their water use
efficiency, yield and water pricing, among other factors (Rey et al., 2011).
The role of water markets to provide irrigators with the needed water
resources can be crucial to cope with cyclical periods of water scarcity by the
irrigated agriculture in many Spanish regions. On the other hand, in those areas
were irrigated crops would become less profitable, farmers can sell their unused
water volumes in the market. Governments and public agencies still have
significant administrative power to suspend, curtail or modify farmers’ water
rights with no statutory obligation to offer compensation in return. However,
governments are usually more inclined to combine administrative measures with
potentially less-conflictive demand-management and market instruments.
According to the results obtained from the author’s work (Rey et al., 2011), climate
change could increase the water use efficiency of some crops in the Iberian
Peninsula, creating new opportunities to reallocate water to other uses through the
water market or any other allocation mechanism.
It is known that Spain, as many other regions of the world, is a drought-
prone area (Iglesias et al., 2009). Droughts are recurrent phenomena, rather than
something sporadic and isolated. This is one of the reasons why we should focus
less on emergency tools and solutions applied once the problem arises, and more
on stable and reliable management solutions to cope with water scarcity and
drought.
A comprehensive analysis of all these issues raises a number of questions
that provide the motivation of this thesis:
• With these underlying processes and phenomena related to water resources,
how can water markets contribute to improve the efficiency of sustainable
water use and allocation?
4
• Is there potential to upgrade and improve water exchanging mechanisms to
introduce optioning rights as a means to cope efficiently with water supply
instability?
• Would water users be interested in using option contracts as water supply
risk management tools? Would they instead prefer insurance mechanisms?
• How do option and spot water markets interact, substitute or complement
with other water sources for irrigation in water-scarce areas?
1.2. Aims and scope
The main objective of this research is to assess the risk-reduction potential of water
option contracts for users facing water reliability problems. The benefits of this
trading mechanism, the water users’ willingness to pay for them, and the role that
option contracts could play in improving water supply reliability are studied in
this thesis, focusing on a Spanish water scarce region.
Within this general research program, the specific goals of this work are:
a) To provide a wide description of Spanish water markets: legislation, past
trading experiences, barriers to trade and potential improvements (chapter
3).
b) To design useful risk management tools for users facing water reliability
problems (chapter 4).
c) To assess water users’ willingness to pay for different water supply risk
management tools and the prices of these instruments, with a view to rank
and discuss them towards defining practical applications in Southeast Spain
(chapter 5).
d) To find optimal water procurement decisions of an irrigation districts under
uncertainty, and evaluate the complementarity and substitutability of

1. INTRODUCTION
5
different supply sources, including spot markets, options, regular surface
and groundwater sources and non-conventional water sources (chapter 6).
The areas of study considered in this thesis are the irrigated areas in the
Segura Basin (Southeast Spain) served with water resources originating from the
Tagus Basin through the Tagus-Segura Transfer. The water volumes received from
the Tagus Basin each year are highly variable, and depend on the water stock
jointly stored in the interconnected Entrepeñas and Buendía reservoirs in the Upper
Tagus Basin, which in turn depend on runoff upstream and precipitation. The
water supply instability could be exacerbated by climate change, affecting the
profitability and continuity of agriculture in one of the most productive regions in
the world. For instance, and focusing on a typical summer crop in Spain, the
adaptation of maize to new climatic conditions could reduce climate change
impact on maize’s net margin in some sites in the Iberian Peninsula, but in others
the effect could be the opposite. If water prices remain low, adaptation can be
positive for maize’s net margin. But if water prices are high in the future period,
adaptation can reduce net margin in some sites of Spain (Rey et al., 2011).
The high water supply instability faced by irrigators in the Segura Basin and
their participation in previous market experiences makes this region a suitable case
study for this thesis. Irrigators in the Segura Basin have in fact been the most active
buyers of water in the spot market, mainly during drought episodes, when they
participated in inter-basin trading buying water resources from irrigation districts
in the Tagus Basin.
1.3. Outline
This thesis is structured in 7 different chapters. The first chapter contains a general
introduction, setting the research context, the objectives and the issues that are

6
going to be addressed in this work. Chapters 2 to 7 represent the core of the thesis
(see Figure 1).
Figure 1. Thesis outline
Source: own elaboration.
The thesis document is organized as follows: chapter 2 provides a
discussion on the need for water allocation mechanisms to manage scarce water
resources, a general description of water markets and the main related experiences
around the world. Chapter 3 focuses on the Spanish case. The chapter begins with
a description of the Spanish water market legislation, and continues with an
evaluation of past experiences based on published literature and the author’s own

1. INTRODUCTION
7
standpoints. This evaluation leads to suggest the reasons behind the limited
success of water markets in Spain, and the potential improvements for the future.
Chapters 4, 5 and 6 contain the main original and empirical contributions of
the thesis. Because each one has its own objectives, scope and methods, they are
structured canonically with an introduction and subsequent sections containing
the methodology, results, discussion and conclusions respectively. Chapter 4
proposes an innovative water option contract between the Tagus and Segura
basins aimed to reduce the potential impacts of a change of the Tagus-Segura
Transfer’s management rules. In chapter 5, I develop an original theoretical
analysis of irrigators’ preferences for two different water supply risk management
tools: drought insurance and water supply option contracts. An application of this
theoretical approach to an irrigation district in the Segura Basin is also presented.
In addition, the tentative prices and costs of these water supply risk reduction
mechanisms are calculated. Chapter 6 puts the option and spot water market
within the context of another complex irrigation district in the Segura Basin, which
has up to nine different water sources, each with its own cost and reliability. The
chapter presents an optimization model for minimizing irrigation district’s water
procurement costs, which is used to investigate, among other issues, the
complementarity and substitutability of the analyzed sources of water. The
decisions regarding the signing and exercising of the option contract are carefully
analyzed within a much broader context than in chapters 4 and 5.
Lastly, chapter 7 contains the main conclusions derived from the above-
mentioned analyses. At the end of the document, there are some appendixes with
additional results from chapters 5 and 6.

8
1.4. Research context and publications
During my predoctoral and training activies at CEIGRAM (Research Centre for the
Management of Agricultural and Environmental Risks, a Joint Research Centre of
the Technical University of Madrid), I have been involved in two research projects.
First, I worked in the project “Minimising uncertainties in the analyses of
climate change impact and adaptation in the agricultural systems of the Iberian
Peninsula. Tool for Scientific Support to Policies”(MINUNIMAD-CC AGL2008-
00385/AGR), 2009-2012, coordinated by Prof. M.I. Mínguez. The project’s main
objective was to assess the potential impacts of climate change on different aspects
of Spanish agriculture: crop yields, crop water requirements, crop insurance and
crop profitability under different water prices. We worked with climate projections
of 10 different Regional Climate Models, and we evaluated the impact of rainfall
and temperature changes on Spanish crops. Also, an adaptation strategy for maize
in the Iberian Peninsula was assessed. Besides, we evaluated the uncertainty
derived from climate projections obtained from this ensemble of Regional Climate
Models. Apart from my Master degree thesis, two peer-reviewed journal papers
and two book chapters were derived from this project:
• Garrido A., Willaarts B., López-Gunn E. and Rey D. (2012). Considerations
on climate variability and change in Spain. In: De Stefano L. and Llamas
M.R. (eds.), Water, Agriculture and the Environment in Spain: can we square the
circle? Botín Foundation, CRC Press, pp. 191-202.
• Garrido A., Bielza M., Rey D., Mínguez M.I and Ruiz-Ramos, M. (2012).
Insurance as an Adaptation to Climate Variability in Agriculture. In:
Mendelsohn R. and Dinar A. (eds.), Handbook on Climate Change and
Agriculture. Edward Elgar, pp. 420-445.

1. INTRODUCTION
9
• Rey D., Garrido A., Mínguez M.I. and Ruiz-Ramos M. (2011). Impacts of
climate change on maize´s water needs and yield and its profitability under
various water prices in Spain. Spanish Journal of Agricultural Research, 9(4):
1047:1058.
• Garrido A., Rey D., Ruiz-Ramos M. and Mínguez M.I. (2011). Climate
change impact and adaptation of crops in Spain: Consistency of Regional
Climate Models. Climate Research, 49(3): 211-227.
In the second and most important part of my research timetable, I worked in
a European research project entitled “Water market scenarios for southern Europe:
new solutions for coping with water scarcity and drought risk? – Water Cap &
Trade” (P100220C-631), 2010-2013, coordinated by Dr. Jean-Daniel Rinaudo
(BRGM, France) and by Prof. Alberto Garrido (UPM team). This research project
aimed at evaluating the best suited water market scenarios for European
Mediterranean countries, the economic potential of these market mechanisms and
the acceptability issues affecting the implementation of water markets in those
countries.
Six partners from Italy, France and Spain participated in this project from
January 2011 to December 2013. Both the Italian and the French teams studied the
potential for the implementation of water markets in their respective countries,
where they do not currently exist. The two Spanish teams (Technical University of
Madrid (UPM), with the collaboration of the Technical University of Cartagena
(UPCT), and University of Córdoba (UCO)) evaluated the water trading system in
our country and investigated its weaknesses in order to obtain some
recommendations of the modifications that should be accomplished to improve the
functioning of Spanish water markets.
As a part of the Project’s work programme, the UPM team held several
meetings with Spanish water market stakeholders, related institutions’

10
representatives and researchers. From those meetings, some conclusions regarding
the role of water markets in our country have been obtained, and they are included
in this work.
From my participation in the Project, I wrote the following papers and book
chapters co-authored with my thesis supervisors:
• Rey D., Garrido A. and Calatrava J. Assessment of irrigators’ preferences for
different water supply risk management tools: option contract and
insurance. Environment & Resources Economics (2nd round).
• Rey D., Calatrava J. and Garrido A. Optimization of water procurement
decisions in an irrigation district: the role of option contracts. Australian
Journal of Agricultural and Resource Economics (submitted).
• Rey D., Garrido A. and Calatrava J. (2014). The Water Markets in Spain:
moving towards 21st century mechanisms and approaches with 20th century
regulations. In: Water Markets for the 21st. Century: What Have We Learned?
Easter W. and Huang Q. (Eds.). Springer. In press.
• Garrido A., Calatrava J. and Rey D. (2013). La flexibilización del régimen de
concesiones y el mercado de aguas en los usos de regadío (The flexibilization
of the water consession regime and the water market for irrigation). In: Embid A.
(ed.), Usos del Agua (Concesiones, Autorizaciones y Mercados de Agua.
Universidad de Zaragoza and Confederación Hidrográfica del Ebro.
Thomson Reuters, pp. 177-197.
• Garrido A., Rey D., Calatrava J. (2012). Water trading in Spain. In: De
Stefano L. and Llamas M.R. (eds.), Water, Agriculture and the Environment in
Spain: can we square the circle? Botín Foundation, CRC Press, pp. 205-216.

1. INTRODUCTION
11
• Rey D., Garrido A. and Calatrava J. (in preparation). Option contracts for
allocating water in inter-basin transfers: the case of the Tagus-Segura
Transfer in Spain.
Besides, part of the results has been presented in two conferences:
• Rey D., Garrido A. and Calatrava J. (2014). Option contracts for allocating
water in inter-basin transfers: the case of the Tagus-Segura Transfer in
Spain. Poster presented at the European Geosciences Union General
Assembly. Vienna, Austria, 27th April – 2nd May 2014.
• Rey D., Garrido A. and Calatrava J. (2013). Comparison of different water
supply risk management tools for irrigators: option contracts and insurance.
IX Spanish National Congress of Agricultural Economics, Castelldefels, 3-
5th September 2013.
In 2012, I spent three months as a visiting scholar at the Agricultural and
Resource Economics Department, University of California at Berkeley, hosted by
Professor David L. Sunding. During my stay, I had the opportunity to learn about
the main features of water markets in this State and to meet other colleagues
working on water trading issues at the University of California. This stay was
funded by a programme for short-term research periods abroad of the UPM
targeted to PhD students.


2. WATER MARKETS
13
2. WATER MARKETS
2.1. Water markets definition
According to Brown (2006), the term ‘‘water market’’ does not have a
precise definition. The National Research Council of the USA defined a water
transfer as any change in the point of, in the type or in the location of use (National
Research Council, 1992). Sumpsi et al. (1998; p. 73) defined a water market as “an
institutional framework which allows water right holders, under certain
established rules, to transfer their water rights to other economic agents or water
users, receiving an economic compensation in exchange”. Water markets “permit
the temporary, long-term, or permanent transfer of water from the existing rights-
holders to other water users in exchange for payment” (Hanak, 2003 p. 2).
Water markets reveal the opportunity cost of water, allowing for a more
efficient use of the available resources through the transfer of water from low to
high value uses (Molle & Berkoff, 2006; Maestu et al., 2008; Adler, 2009; Möller-
Gulland, 2010). According to Molle & Berkoff (2006) and Ranjan (2010), water
trading has been mainly proposed as a flexible mean for mitigating water-supply
shortages to non-agricultural users, by transferring water resources from
agriculture to other sectors, and reducing the negative economic impacts of such
shortages. Water trading takes place if there is a difference, after transaction,
transport, and risk costs have been accounted for, between buyer’s willingness to
pay and a seller’s willingness to accept payment for not having that water
available (Calatrava & Garrido, 2005a).
Similarly to other allocation mechanism, water markets have some
advantages and disadvantages that should be taken into account. Section 2.3
addresses this issue.

14
2.2. Why water allocation mechanisms?
Freshwater is a scarce resource and essential for all its users. Traditionally,
priority was given to economic uses, disregarding aquatic ecosystems' services and
the sustainability of water bodies. In the last decades, environmental concerns
have increased and governments have started to rethink the way water is shared
among the competing users, changing from a supply management approach to a
demand management perspective. Managing demand involves implementing
water conservation measures, providing economic incentives and reforming water
pricing schemes, using existing infrastructures more wisely, and reallocating water
rights (Getches, 2004). Integrated water resources management aims at allocating
water attributes (quantity, quality and accessibility) under economic and social
efficiency criteria, and protecting the environment (Maestu et al., 2008).
Competition for water has always existed, and conflicts will be more
frequent in the future due to climate change, population and economic growth,
and increasing environmental concerns. According to Bogardi et al. (2012), the lack
of legislation or its limited implementation could increase the potential for conflicts
among water users at all scales during water scarcity periods.
As long as the resource is plentiful, there is little pressure to define or
enforce water rights. When water becomes scarcer, and competition for it
increases, property rights can clarify expectations and reduce conflicts (Bruns &
Meinzen-Dick, 2005). A major problem is that, currently, around the world water is
often allocated based on institutions established when water was not considered to
be a scarce resource (Frederick, 2001).
In order to avoid conflicts and to allocate public water resources among
users, different property rights regimes have been implemented in different parts

2. WATER MARKETS
15
of the world: water use rights, private rights or quotas. Property rights regimes can
be classified as public (State holds water rights), private (individuals), and
common property (rights are held by a group of people) (Bruns & Meinzen-Dick,
2005). In many countries, increasing attention is being paid to the need to improve
and clarify water rights.
Water rights are the heart of any allocation system, and essential for a
successful reallocation (Meinzen-Dick & Bakker, 2000). Once water rights are
clearly defined, water markets can be established to allow for the reallocation of
water among users. “The great virtue of creating property rights in water is that it
can be bought and sold” (Getches, 2004 p.12). The European Commission, in its
Blueprint to Safeguard Europe’s water resources, considers water markets as a tool that
could help to improve water use efficiency and overcome water stress, if a cap for
water use is implemented (European Commission, 2012). However, there are
institutional, physical and social barriers that impede or hamper the
implementation of a market for water (Möller-Gulland, 2010).
In the absence of price or market signals, governments are left with
statutory or arbitrary rules to ration water among potential users (Garrido, 2000;
Riesgo & Gómez-Limón, 2001). There is a growing consensus that greater reliance
on economic principles in managing and allocating water is critical for more
efficient and sustainable use. For instance, an important innovation of the
European WFD (Water Framework Directive) is the central role of economics in
water management (Berbel et al., 2009). Markets and water prices have been used
to manage demand, allocate water resources, and provide incentives to conserve
and invest in new supplies and incentivize environmentally positive externalities
(Frederick, 2001; Garrido et al., 2014). Specifically, water markets have been created
in different parts of the world, mainly in those areas with water scarcity problems.
In most cases, the establishment of water markets has resulted in effective water

16
conservation, rising awareness of its real value, and investment in water saving
and water reuse technologies (Rico & Gómez-Limón, 2005). In section 2.5, a
description of the most developed water markets systems (Australia, Chile, USA)
is presented.
The Water Cap & Trade Project aimed at assessing the potential of water
markets as a solution to cope with water scarcity and drought in European
countries. The main general conclusions from this project are summarized here
(Water Cap & Trade, 2014):
a) Water markets have been operating for more than three decades in western
States of the USA, in Australia and in Chile. They were established under
natural, economic and institutional conditions which significantly differ
from those prevailing in most European countries: (i) much higher water
scarcity; (ii) clearly defined water property rights; (iii) cultural, ideological
and legal context favourable to trading mechanisms.
b) In all countries where water markets have been established, trading activity
remains relatively limited (typically 1-5% of allocated volumes). Water
markets provide some flexibility, but their potential has been limited.
c) In Europe, only Spain has a market for water and enabling legislation to
facilitate water trading. This is due to: (i) high water scarcity level
associated to a high level of water productivity comparable to Western US
and Australia; (ii) the existence of a vast interconnected water
infrastructure (dams, canals, inter-basin transfers); and (iii) the historical
existence of water markets (auctions) in some regions of Spain.

2. WATER MARKETS
17
d) In France, in basins characterized with increasing tensions over water use,
resource augmentation options (inter-basin transfers, small scale reservoirs)
often remain affordable solutions in the medium term. This situation will
last as long as resource augmentation will continue to be subsidized. The
global “cap” is still contested, in particular in groundwater basins where
insufficient scientific knowledge underpins its calculation. Potential market
participants would thus prefer investing in lobbying activities aiming at
increasing the cap rather than engaging into water trading. Individual
water quotas are not properly defined and enforced. In addition, the “use it
or lose it” rule represents an important barrier to trade. In basins where
demand outweighs available resources, yearly water allocation is highly
uncertain (inter-annual and intra-annual variability), which reduces the
potential for trading.
e) In Italy, the socio-political context in which water markets are discussed is
generally opposing the establishment of water markets. Due to recent
drought events, stakeholders closer to the agricultural sector are exploring
all the possible institutional arrangements for water management,
including water markets. The conditions needed to establish water markets
are not in place in the Italian context. From a legal perspective, water is
publicly owned. Water use rights are requested and granted through
concessions. Water market would require a substantial change in the
concessions’ definition. Moreover, one of the preconditions for water
markets is the establishment of a “cap” on water uses. Currently, most of
the concessions are not monitored, so there is no legal definition of the cap
(though in many areas there exist a de facto cap in the irrigation season).
f) In France and Italy, a majority of stakeholders opposes to water trading on
ethical or ideological grounds. Water trading is often assimilated to

18
privatization. This triggers strong opposition since water has a legal status
of public trust in both countries. The opposition is particularly strong in the
agricultural sector where farmers fear that increased competition for water
would weaken agricultural solidarity and cooperative behaviours and lead
to the concentration of water rights. This opposition undermines the
acceptability of market instruments. The situation is much different in
Spain although a similar opposition has been reported after water trading
was officially allowed 15 years ago (Iglesias et al., 1996).
2.3. Advantages and disadvantages of water markets as allocation
mechanisms
Designing efficient market institutions to replace traditional water allocation rules
is a daunting task (Garrido, 2007): establishing market rules to make it efficient and
at the same time to protect other water users and to enhance the conservation of
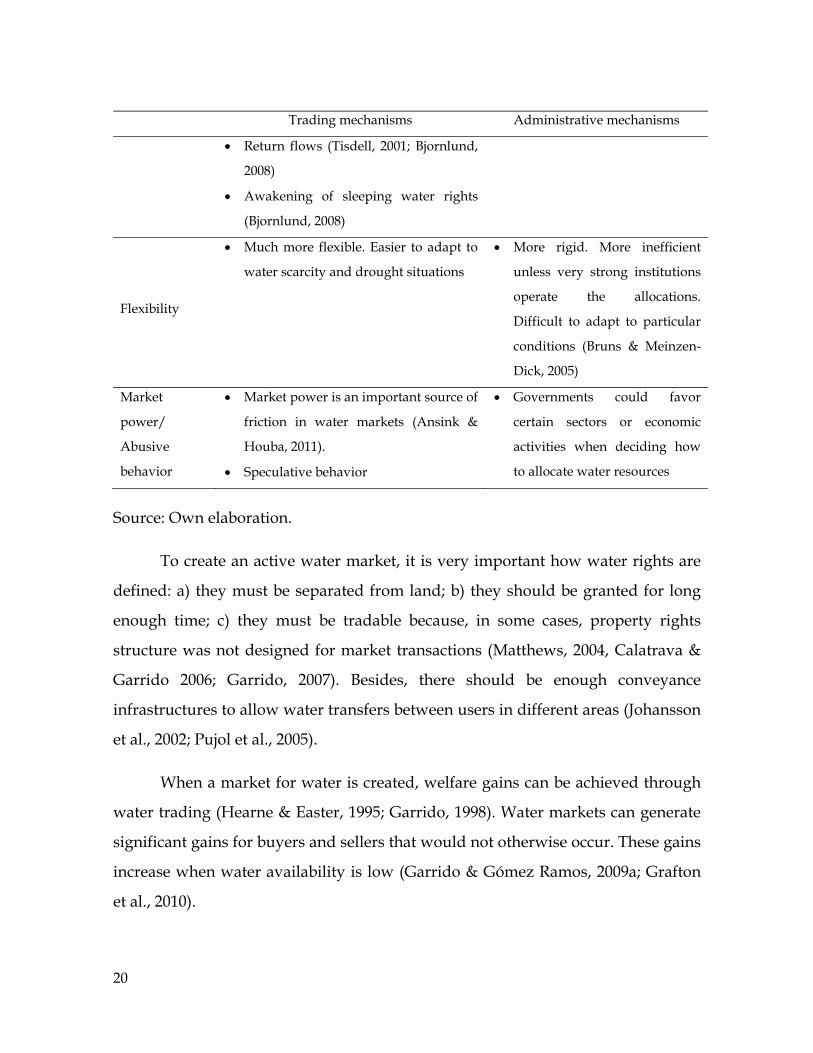
the resource is not easy. Table 1 shows the advantages and disadvantages of water
trading mechanisms in comparison with administrative allocation mechanisms.
Table 1. Advantages and disadvantages of water trading mechanisms to ensure
efficient, equitable and sustainable water allocation
Trading mechanisms Administrative mechanisms
Economic
efficiency
• Net benefit of water use increases
(WWF, 2007)
• Water markets are expected to lead to
socially optimal and efficient allocation
(Möller-Gulland, 2010).
• Facilitation of water reallocation from
low to high value uses (Maestu et al.,
2008; Stickney, 2008)
• Efficient under low transaction costs
• Less efficient allocation

2. WATER MARKETS
19
Trading mechanisms Administrative mechanisms
(Pujol et al., 2005; Freebairn & Quiggin,
2006; Musole, 2009; Slaughter, 2009)
• Excessive regulatory control and
subsides may result in inefficient
markets (Möller-Gulland, 2010)
Water use
efficiency
• Most likely in the long term (if markets
are sustained and reliable). Water
efficiency measures stimulated by the
market may make additional water
available for the environment without
reducing overall economic activity
(WWF, 2007)
• Should be secure to provide users
incentives to invest in water
conservation practices (Dosi & Easter,
2000)
• Weak incentives unless water is
scarce
Equity
• Equitable if properly regulated and if
the distribution of rights is fair (may
work against equity in some cases)
(Grafton et al., 2010)
• In agriculture, water markets may lead
to the concentration of water in more
efficient and intensive farms (Pujol et
al., 2005)
• They can generate third-party effects or
externalities if not properly regulated
(Maestu et al., 2008; Janmaat, 2011)
• They can generate unjustified
(undeserved) profits on sellers
• More equitable
Environmental
effects
• Third party externalities (Riesgo &
Gómez-Limón, 2001; Hanak, 2003;
Heaney et al., 2006 )
• More easily controlled
20
Trading mechanisms Administrative mechanisms
• Return flows (Tisdell, 2001; Bjornlund,
2008)
• Awakening of sleeping water rights
(Bjornlund, 2008)
Flexibility
• Much more flexible. Easier to adapt to
water scarcity and drought situations
• More rigid. More inefficient
unless very strong institutions
operate the allocations.
Difficult to adapt to particular
conditions (Bruns & Meinzen-
Dick, 2005)
Market
power/
Abusive
behavior
• Market power is an important source of
friction in water markets (Ansink &
Houba, 2011).
• Speculative behavior
• Governments could favor
certain sectors or economic
activities when deciding how
to allocate water resources
Source: Own elaboration.
To create an active water market, it is very important how water rights are
defined: a) they must be separated from land; b) they should be granted for long
enough time; c) they must be tradable because, in some cases, property rights
structure was not designed for market transactions (Matthews, 2004, Calatrava &
Garrido 2006; Garrido, 2007). Besides, there should be enough conveyance
infrastructures to allow water transfers between users in different areas (Johansson
et al., 2002; Pujol et al., 2005).
When a market for water is created, welfare gains can be achieved through
water trading (Hearne & Easter, 1995; Garrido, 1998). Water markets can generate
significant gains for buyers and sellers that would not otherwise occur. These gains
increase when water availability is low (Garrido & Gómez Ramos, 2009a; Grafton
et al., 2010).

2. WATER MARKETS
21
Water is not like other commodities because of the importance that this
resource has for every aspect of our lives. That is one of the main reasons of
opposition to make water tradable through water markets (Briscoe, 1997; Bauer,
1998; Savenije & Van der Zaag, 2002; Water Cap & Trade, 2014). Besides, in most
countries water is a public good, and it is the State who gives users the right to use
water for free (Thobani, 1997). Thus, some stakeholders stand against the
possibility of selling a water right for a monetary compensation.
Economic criticisms of water markets are based on the argument that
transactions costs may be higher than those derived from other water allocation
mechanisms (Pujol et al., 2005), and that they can generate third-party effects or
externalities, exceeding in some cases the social benefits derived from the exchange
(Rosegrant & Binswanger, 1994). Each step in water trading entails a cost on
participants, either directly through government fees and brokerage charges, or
indirectly through the cost of time associated with undertaking the transactions
(The Allen Consulting Group, 2006). Coase (1960) demonstrated that, in absence of
transactions costs, the initial distribution of rights between parties would not
matter in terms of the final market allocation efficiency. In the real world,
transaction costs exist and are crucial for the feasibility of trading. If transactions
costs are greater than gains from trade, the transactions will not be profitable and
will not take place (Beare et al., 2003; Martin et al., 2008; Lefebvre, 2011).
Transaction costs are real resource costs that act as barriers to efficiency-improving
trading. So, they must be quantified and included in the economic analysis of
market exchanges (McCann & Easter, 2004; Freebairn & Quiggin, 2006).
2.4. Types of water markets
We can distinguish three main types of water trading mechanisms: spot or lease
agreements, permanent transfers and water banks. Spot markets are temporary
22
water exchanges, which mainly occur during a period of drought. The seller gives
the buyer the right to use the water for a short period of time (e.g., one season).
Temporary water markets allow for a more efficient distribution of risk than
permanent transfers (Maestu et al., 2008).
Permanent transfers involve the transfer of ownership of the water right, so
the buyer can use this water allotment until the water right expires. In these
exchanges, transaction costs are very high due to the difficulties of getting an
agreement between the involved parties. Permanent transfers are more common in
developed countries because they need complex institutional settings (Bjornlund,
2006).
A water bank is a highly regulated institutional mechanism that facilitates
water exchanges among different right holders (Yoskowitz, 2001; Dourojeanni,
2009). The water bank connects buyers and sellers, provides information and
facilitates the regulatory requirements of the trading activity, reducing transaction
costs and encouraging water exchanges (Yoskowitz, 2001; Clifford et al., 2004;
Watson & Scarborough, 2005). In practice, most water banks do not function only
as an intermediary between buyers and sellers, but also as water trader that
centralizes selling bids and purchase offers (Clifford et al., 2004). Water banks exist
in many countries around the world, like USA, Chile, Canada and Australia
(Dourojeanni, 2009). A pioneering experience is the California Drought Water Bank
established in 1991. It was an emergency water bank with the aim of enabling
water transfers from agricultural users in the north of California to urban users in
the south. This bank generated direct benefits for the State. However, it also had
negative economic impacts on the local economy in the areas-of-origin of the water
(Carter et al., 1994; Graham, 1998). Next chapter reviews the experience of Spanish
water banks (water exchange centers, section 3.2.1).

2. WATER MARKETS
23
Normally, the trading activity is concentrated in the spot market.
Agriculture is the main water seller, as it is the sector with higher consumption in
most countries (Molle & Berkoff, 2006; Calzadilla et al., 2010). When the market
price for annual crops is going to be presumably low, or when rotation of perennial
crops is necessary or timely, a farmer may choose to fallow his lands and sell his
water allotment (Singletary, 2005). In general, exchanges take place between
farmers (intra-sector) or between farmers and urban water suppliers (inter-sector).
2.5. Water markets around the world1
Establishing water markets is an alternative mean for improving water economic
efficiency. However, very few countries have established formal water markets.
Besides, in countries where water markets are regulated and authorized,
exchanges are not quantitatively that important (Garrido et al., 2012b).
Water markets have been created in different parts of the world, mainly in
those areas with water scarcity problems or with an irregular distribution of water
resources among seasons, users or regions. In countries like India and Pakistan,
informal water markets have evolved, being characterized by the lack of official
government administration (Stickney, 2008). In many developing countries, with
limited social and institutional capacities, the adoption of markets for permanent
water rights has been hesitant; while informal markets for temporary transfers
have been more widely adopted, since no change of ownership takes place
(Bjornlund, 2003). In USA, Australia, Chile, Mexico and Spain, formal water
markets operate under very different formats and rules. In Chile and Australia, the
management of these markets is more decentralized. In this latter country, water
markets are probably the most developed in the world, and in some basins
1 Most of the information in this section is part of a deliverable of the Water Cap & Trade project: Rey D., Calatrava J. and Garrido A. (2011). Water markets in Australia, Chile and the USA.

24
exchanges can be ordered, managed and monitored electronically and web
supported.
Australia, Chile and USA have long-active water markets of very different
nature and with particular institutional settings and different degrees of market
intervention (Grafton et al., 2009). Despite this, there are similarities related to the
problems in the definition and registration of water rights and their supply
reliability, the predominant role of agriculture as the main water seller, the
prevalence of temporary exchanges of water, the prices dispersion and, in some
cases, the increasing concern for the environmental impacts (see Table 2).
The system of water rights in Chile presents private rights with different
levels of reliability and thus a priority access to water resources exists depending
on the attributes of the right hold by a user. In the case of Australia, one of the
major problems is the over-allocation of water entitlements and the low reliability
of a significant proportion of them, what causes that in very dry years the water
allocated by entitlement is notably reduced. As in the other two countries, there is
a wide variety of water rights in the USA (prior allocation, appropriative, riparian,
groundwater, Federal Reserve rights), what results in an uneven access to water
among right-holders and in a notable price dispersion because of the different
characteristics of the traded rights.
Even though there are not specific provisions for environmental protection
from water trading in the USA, environmental uses are a major “purchaser”,
especially in temporary markets. Apart from these, other relevant restrictions to
water trading are the lack of information regarding the existing amount of rights in
many areas of Chile and the USA, the thinness and resulting price dispersion of
many markets in these two countries and the slower procedures for the
authorization and registration of transactions in the USA when compared with
Australia.

2. WATER MARKETS
25
Table 2. Main characteristics of water markets in Australia, Chile and USA
Country Description Trading activity Restrictions Sources
Australia
• 3 types of water exchanges2: trade of water access entitlements (permanent markets), trade of seasonal water allocation (spot markets), and environmental water buybacks by the Government
• Each State and Territory is responsible for the legislative and administrative arrangements for water rights and water trading
• One of the strengths of the Australian water market is the availability of information related to water prices and exchanged volumes. This transparency encourages the participation of water users in the market
• Trading of seasonal allocations predominates over trading of water rights because of the existing fees and restrictions to trade
• Trade of entitlements is becoming significant (7 % of entitlements in 2009-2010)
• Water scarcity is the dominant driver of allocation trading activity. In 2007 accounted for about half of all the water diverted in 2007-2008
• Interstate trade represents less than 1% of all permanent water trades
• Agriculture is the main water seller
• Inter-basin water trading is forbidden
• Restrictions on water entitlements trading (trade in permanent entitlements out of irrigation areas is currently capped at 4% of total water entitlements in one year)
• Restrictions to limit trading of water entitlements from agriculture to other sectors
Grafton et al. (2009, 2011); Hughes & Goesch (2009); NWC (2010); Bjornlund et al. (2013)
Chile
• Free market orientation, subject to forces of supply and demand
• Water rights are initially allocated free of charge, with no expiration date on them
• There is an uneven spread of pricing information in the market that particularly disadvantages market participants with fewer
• Despite its free-market orientation for water trading, market activity in Chile is quite reduced
• Agricultural sector dominates water markets
• Inter-sectoral trading has transferred water to growing urban areas in some basins,
• No provisions are made to restrict water trading based on its environmental impacts or on potential third-party effects.
Bauer (2003); Hearne & Donoso (2005); FAO (2006); Grafton et al. (2010, 2011); Oficinas de Estudios y
2 http://www.nationalwatermarket.gov.au/about/

26
Country Description Trading activity Restrictions Sources resources and also increases transaction costs
which accounted for 76% of the rights traded.
• Existing infrastructure made difficult significant movements of resources. The geography of this country hampers from effecting movements of water from a basin to another at reasonable costs
Políticas Agrarias (2010); Donoso et al. (2012); Garrido et al. (2014)
USA
• Many types of water markets can be found in the USA (permanent, one-year leases, leases for longer periods, water banks, option markets), although the most active ones are still the temporary or spot markets
• Market activity is not significant in relative terms but it is steadily increasing. It is concentrated in the Western States, being California and Colorado the most active markets
• Municipalities are the major buyers and irrigators the major sellers. Agriculture- to- urban transfers are the most frequent in most States. Most permanent transfers involve municipalities purchasing water from irrigators
• Some States do not restrict exchanges among users or even basins, although in others there are very strict provisions to restrict the spatial extent of the trading activity.
Libecap (2010); Thompson (2010); Hanak & Stryjewski (2012)
Source: Own elaboration.

2. WATER MARKETS
27
2.6. Option contracts for water
A water right can be associated to a bundle of rights. Among these stand the
following: access, quality, location, reliability, use of returns, price, seniority,
duration. A water market can be established to facilitate the transfer of all or
part of these attributes within the bundle (Gómez-Ramos, 2004).
Spot water markets facilitate the efficient allocation of this resource and
have some supply risk reduction properties but do not provide efficient risk
allocation mechanisms per se, which exploit differences in risk tolerance and
exposure (Calatrava & Garrido, 2006). Most of the risk is borne by the buyer
due to the thin market characteristics of such transactions. In the case of a
permanent market, the rights seller needs to evaluate his rights’ value given
current and expected future demands. Options markets can help lower these
risks.
Options are one type of derivative contract that give the holder the right
(not the obligation) to buy or sell the underlying asset (Williamson et al., 2008;
Cui & Schreider, 2009; Cheng et al., 2011). Water option contracts do not imply
the transfer of ownership and therefore, the right-holders retain control of the
water allotment should the option not be exercised (Gómez-Ramos & Garrido,
2004; Hafi et al., 2005; Leroux & Crase, 2007). Options contracts can be classified
into puts and calls. Option contracts for water have been generally proposed of
the “call” type. A call gives the holder the right (not the obligation) to purchase
the optioned volume, while the holder of a put option has the right (not the
obligation) to sell the optioned water volume (Cui & Schreider, 2009).
The interaction between buyer and seller in an option contract takes
place in two steps. First, the buyer and the seller establish all the contract terms:
the premium, the exercise price and the optioned volume. Both the buyer’s
demand and the spot market price for water are uncertain at this point.
Normally, the buyer pays the option premium at the beginning of the

28
hydrological year for the right to purchase water from the seller at the maturity
date if needed and as a compensation for the seller to relinquish a part of his
water allotment. In the second period, when the uncertainties of demand
disappear, the buyer announces the quantity of options to exercise (Tomkins &
Weber, 2010). The option will be exercised if the holder of the option needs
additional water resources to satisfy his requirements and if some pre-
established conditions (trigger) are met.
Most examples of optioning water rights are subject to a condition or
trigger. The trigger is an external condition that should be met to exercise the
option. The rationale of using a trigger that enables the holder of a call option to
exercise the option when there is less water available is to ensure that the other
party of the contract uses the water in normal or abundant conditions (Gómez-
Ramos & Garrido, 2004; Hafi et al., 2005; Leroux & Crase, 2007).
The premium represents the value of the flexibility gained by the buyer
from postponing the decision to purchase water (Hansen et al., 2006). Michelsen
& Young (1993) define the option exercise cost as the minimum amount that
must be paid to the farmer to maintain the same income level if the option is
exercised and to compensate him for the additional risk imposed by the
contract (Gómez-Ramos & Garrido, 2004). From the point of view of the seller,
usually a farmer, the price of the option is the opportunity cost of forgoing the
use of the water for agriculture (Heaney & Hafi, 2005). For option holders, no
matter how adverse the water price movement might be, their loss is limited to
the amount they paid for the option (Cui & Schreider, 2009).
The required conditions to establish a water supply option contract were
defined by Michelsen & Young (1993): i) water supply must be reliable enough
to provide sufficient water for the option holder in drought years and plentiful
enough in average years to supply the lower valued use; ii) water rights must
be well-defined and tradable; iii) agricultural activity must be capable of being
temporarily suspended; iv) both parties must know water use values and
alternative water supply costs; v) the probability and severity of drought must

2. WATER MARKETS
29
be calculable; vi) the option contract costs must be lower than the costs of the
cheapest water supply alternative.
Option contracts in water markets have been implemented in different
countries. In the USA, options have been developed in Colorado, California and
Texas. In these markets, options are generally contracted by urban water
agencies to increase water supplies during periods of drought (Hafi et al., 2005).
Although option contracts between urban and agricultural users have received
limited attention in Australia (Leroux & Crase, 2007), environmental water
option contracts have been seriously considered in this country (Hafi et al.,
2005). In the Spanish water market, option contracts are not a common type of
exchange but there has been one experience of a multi-annual contract that
resembles an option contract. In Spain, option mechanisms have been suggested
by Gómez-Ramos & Garrido (2004) and Cubillo (2010).
After reviewing the existing literature, we can classify the main benefits
derived from option contracts in water markets in three groups: risk-reduction
benefits, economic benefits, and institutional/regulatory benefits:
a) Risk-reduction benefits
• Option markets can help lower the risks arising from water supply
reliability and price uncertainties to both parties providing maximum
flexibility in responding to uncertain conditions (Howitt, 1998;
Hollinshead & Lund, 2006; Brown & Carriquiry, 2007; Hui et al., 2007;
Ranjan, 2010).
• Because the buyer has the right to decide whether to exercise the option
or not, this contract provides flexibility associated with the use of the
contracted commodity (water) and increases the reliability of obtaining
it.

30
b) Economic benefits
• Water remains productive in different uses during normal water supply
situations, but changes to the highest values in drought years (Michelsen
& Young, 1993; Gómez-Ramos & Garrido, 2004).
• Gains from trade are on average higher when options themselves can be
traded, by 46% in competitive markets and by 63% in dominant buyer
markets (Hansen et al., 2008).
• Option agreements may act as a substitute of more expensive water
sources (Hansen et al., 2006). Options provide secure urban drought
water supplies at a lower cost than water rights purchases while
maintaining agricultural production (Michelsen & Young, 1993). For an
urban water supply agency, the ability to access additional water
resources in drought years may be a cost minimizing strategy for
managing water supply variability (Michelsen & Young, 1993; Gómez-
Ramos & Garrido, 2004; Brown & Carriquiry, 2007).
• Right holders have more choices on trading water allocation, as they can
participate in both physical and option markets (Cui & Schreider, 2009).
c) Institutional/regulatory benefits
• Options often require less regulatory oversight than permanent transfers
(Hansen et al., 2008). Unlike permanent transfers, they never result in
irreversible water transfers.
• Once the contract has been negotiated and signed, transaction costs
associated to the water transfers will be lower than those associated to
other types of exchanges (Garrido & Gómez-Ramos, 2009b)
• In the case of environmental water options, there is no need for the
environmental manager to own a permanent water entitlement (Hafi et
al., 2005; Heaney & Hafi, 2005).

3. WATER MARKETS IN SPAIN
31
3. WATER MARKETS IN SPAIN3
3.1. Legislation
Water rights issued by the Spanish Water Authorities4 are made available
through publicly built infrastructures (dams or water transfers) or privately
built with permission of the state (hydroelectricity). Accordingly with the 1985
Water Act, rights can also be granted to pump groundwater or divert resources
directly from surface water bodies. A competitive process (public tender for
licenses) for potentially interested agents at the time of issuance is used only for
hydropower applicants. Irrigators and urban suppliers must go through a
technical and administrative process, which includes also public information
and aims at establishing the socio-economic interest of the request and its
technical and environmental feasibility.
Water use rights are defined detailing the point of withdrawal, type of
use, calendar, engineering setup, plots and crops to be irrigated and irrigation
technologies, usable volume or flow and return flows. The type of use, location,
3 This chapter is the result of three book chapters written by the author and the co-directors of this thesis:
Garrido A., Rey D. and Calatrava J. (2012b). Water trading in Spain. In: De Stefano, L. and Llamas, M. R. (eds), Water, Agriculture and the Environment in Spain: can we square the circle? CRC Press, Botín Foundation, pp. 205-216.
Garrido A., Calatrava J. and Rey D. (2013). La flexibilización del régimen de concesiones y el mercado de aguas en los usos en regadío. In: Embid A. (ed.), Usos del Agua (Concesiones, Autorizaciones y Mercados de Agua). Universidad de Zaragoza and Confederación Hidrográfica del Ebro. Thomson Reuters, pp 177-197.
Rey D., Garrido A. and Calatrava J. (2014). The Water Markets in Spain: moving towards 21st century mechanisms and approaches with 20th century regulations. In: Water Markets for the 21st. Century: What Have We Learned? Easter W. and Huang Q. (eds.). Springer. In press.
4 By Water Authorities in Spain, we refer to the River Basin Agencies, or in basins entirely contained in a single Autonomous Community, to the regional water agency. See Garrido and Llamas (2009) for a detailed description of the institutional framework in Spain.

32
withdrawal or return points cannot be changed without an explicit approval by
the corresponding River Basin Agency (RBA). Rights differ in the priority of
their access to water depending on the type of use (domestic, environmental,
agricultural, hydropower or industrial).
With the approval of the 1985 Water Act, water became a good belonging
to the public domain. Nonetheless, holders of private rights over groundwater
(mostly farmers and private companies) were given the choice of keeping them
as a private right or else converting them into temporal water concessions5. A
vast majority (more than 80% of right holders according to Llamas et al., 2001)
opted for the first option. Any new right over groundwater granted after 1985
would exclusively be a concession of use of a public good - water.
The drought episode that took place in Spain in 1992-1995 had vast
consequences, both because of its intensity and a poor management of it
(Giansante et al., 2002). After that, the need for a more flexible water rights
regime in the country became urgent. The 1999 reform of the Water Act
introduced the legal possibility of voluntary exchanges of public water rights
(concessions), but with many restrictions. It only allows the temporary
exchanges of public water use rights: the public nature of water is upheld, and
the concession to use it is leased for a limited period of time (Albiac et al., 2006).
Before the 1999 reform only private rights could be formally traded; water flows
pumped from private wells could be leased, auctioned or sold.
5 The differences between water rights and public rights are the following: public rights are use permits granted by the State for a duration of 30 years; they can be revoked, transformed, amended or interrupted by the Basin Agencies if conditions advised those decisions; their legal foundation stems from the 1985 Water Act, which declared all water resources as part of the public domain; they are registered in a separate section of the section of private rights. These, in contrast, have a longer maturity, existed before the entering into force of the 1985 Water Act, are considered private property, can be sold, leased and form part of a company or cooperative assets. Maintaining the status of water rights requires that the technical conditions of use (depth and location of wells, power of pumps, pumped volume) not be altered.

3. WATER MARKETS IN SPAIN
33
The 1999 Water Law reform explicitly identified only two ways to
exchange public water use rights. The first one involves two right-holders that
voluntarily agree on specific terms of trade and jointly file a request in the
Agency to exchange their water rights, or leased-out for a number of years the
water to which right-holders are entitled. The second way for exchanging water
rights involves publicly run and administered water banks (or water exchange
centers, as they are called in the Water Law). Users of private groundwater
rights, individually or as firms or cooperatives, can sell, lease or rent pumped
water, although such trading is subject to specific restrictions.
Water banks are supposed to be administered by the RBAs and operate
in exceptional situations of drought or overexploitation of aquifers (WWF,
2005). Water banks are set up as public tenders for potentially interested right-
holders who would be willing to relinquish their water rights temporally or for
the remaining maturity period. The bank’s water supply operation involves
procuring water flows and volumes from voluntary sellers, and making them
available for other users, including environmental restoration purposes. Bank's
operations may also acquire permanent water rights. A variant of the water
exchange centers involves a similar procedure to that of regular water banks,
but instead of purchasing or leasing out the offered water rights, it purchases
the land to which the water is appurtenant. In practice, these water exchange
centers have only functioned as buyers of water or water rights. Water has not
been sold to other users. Instead, purchased water has been made available to
other users in the form of new water concessions or devoted to maintaining
environmental flows.
At the national level, the last Reform of the Spanish Water Law of May
2012 highlights the need to simplify and accelerate the administrative
procedures, and to add more flexibility and efficiency to the water management
system. The reform focuses mainly on groundwater resources. It proposed
several measures to deal with water availability problems, including the
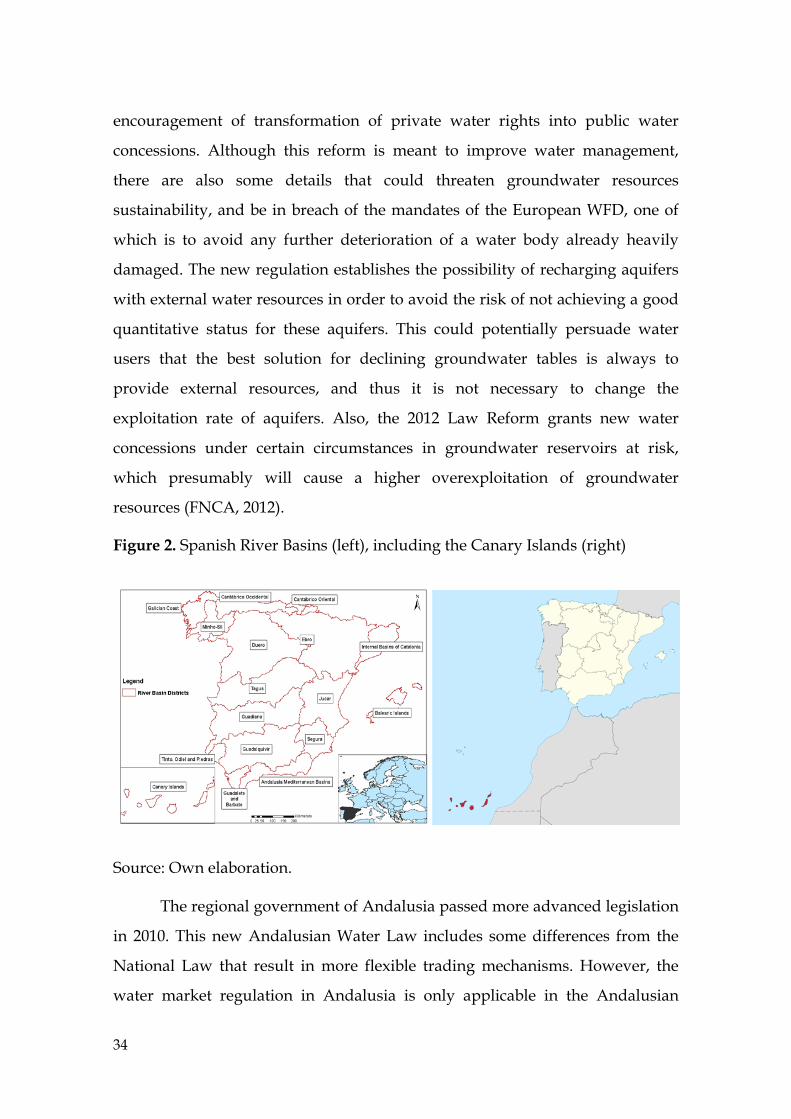
34
encouragement of transformation of private water rights into public water
concessions. Although this reform is meant to improve water management,
there are also some details that could threaten groundwater resources
sustainability, and be in breach of the mandates of the European WFD, one of
which is to avoid any further deterioration of a water body already heavily
damaged. The new regulation establishes the possibility of recharging aquifers
with external water resources in order to avoid the risk of not achieving a good
quantitative status for these aquifers. This could potentially persuade water
users that the best solution for declining groundwater tables is always to
provide external resources, and thus it is not necessary to change the
exploitation rate of aquifers. Also, the 2012 Law Reform grants new water
concessions under certain circumstances in groundwater reservoirs at risk,
which presumably will cause a higher overexploitation of groundwater
resources (FNCA, 2012).
Figure 2. Spanish River Basins (left), including the Canary Islands (right)
Source: Own elaboration.
The regional government of Andalusia passed more advanced legislation
in 2010. This new Andalusian Water Law includes some differences from the
National Law that result in more flexible trading mechanisms. However, the
water market regulation in Andalusia is only applicable in the Andalusian

3. WATER MARKETS IN SPAIN
35
Mediterranean Basins (see Figure 2). This approach could hopefully serve as a
precedent for future amendments to the market regulation in the rest of Spain.
The main innovations introduced by this reform are summarized in Table 36.
Table 3. Main differences between the National Law and the Andalusian Law
related to water markets
Andalusian Law* National Law
Agriculture, industry and tourism are
considered at the same level in the water uses
priority range
Agriculture is in a higher level, so farmers
cannot sell their water rights for industrial or
touristic activities
Water Banks are conceived as a mechanism to
trade water under every circumstance
Water Banks are conceived as a mechanism
to trade water only during drought periods
For acquiring water through a water bank,
there is no need to be a water user with formal
rights
Only users with formal water rights have
access to the Water Bank or to purchase from
other user
* The Andalusian Water Law take precedent over the National Law only in the basins that are contained
entirely within Andalusia’s borders as its regional government has jurisdiction over all water management
in these basins.
Source: Rey et al. (2014).
The differences in the Andalusian Law from the National Law provide
flexibility for the water market system, allowing farmers (the main water rights
holders) to sell water to industries, renewable energy plants (thermo-solar
installations) or to the tourist sector. The most relevant criteria to determine the
priority among these uses are: the impact on sustainability of the resource,
maintenance of territorial cohesion and the higher added value in terms of job
and wealth creation for the region. As in the National legislation, the
Andalusian Law always guarantees the primary water requirements for the
6 BOJA num. 155. Law 9/2010, July 30th. Andalusian Water Law.

36
urban sector, and also for environmental purposes in order to achieve a good
ecological status for all water bodies.
Water banks are considered an important tool not only for solving
drought or environmental problems in Andalusia, but also to create a water
stock for future purposes, to sell water use rights to users for a given price, and
to avoid imbalances in the distribution of water resources. Through water
exchange centers the regional government can make offers for public purchase
of rights, and expropriate or revise water concessions. The possibility of
purchasing water through the water bank without previously being a right
holder allows users facing new emerging water demands to obtain water.
Currently there is an initiative to establish three water exchange centers in three
different basins in Andalusia.
3.2. Past trading experiences: overview and evaluation
Since the approval of the 1999 Reform of the Water Act, several water rights
exchanges have taken place in the Spanish territory, involving different water
users, water resources and basins. Below is a description of the most important
water exchange experiences that could help the reader to better understand the
functioning of Spanish water markets.

3. WATER MARKETS IN SPAIN
37
Figure 3. Formal and informal water trading in Spain.
Source: Rey et al. (2014).
3.2.1. Water exchange centers
Three water banks, or water exchange centers, have been established in
different Spanish river basins (Guadiana, Júcar and Segura), with the main
objective of solving an environmental problem. Table 4 shows the objectives,
budget, prices, volumes and other features of each of them.

38
Table 4. Description of the water exchange centers in the Guadiana, Júcar and
Segura Basins
Guadiana Basin Júcar Basin Segura Basin
Objective
“Special plan of the Upper Guadiana” approved in 2008 to solve environmental problems affecting the remarkable wetlands in the Tablas de Daimiel National Park (Martínez-Santos et al., 2008; Llamas et al., 2010) by reducing pumping rates in 250 hm3 by 2027
To increase the upstream water table levels to ensure that the river did not dry out during the dry spell of 2005-2008, as it had occurred in the 1990s. The purchases aimed at reducing extractions by 100 hm3 in the Upper Júcar aquifer to enhance flows to the lower part of the basin
To improve water availability, as this is the most water scarce basin in Spain
Public offers
Three public offers (October, 2006; March, 2007; September, 2007) targeted to irrigators, but the means required to acquire land rights with appurtenant water rights, to prevent further irrigation consumption in these lands. The idea was to purchase water rights to be reallocated to other farmers (30%) and to the environment (70%) (López-Gunn et al., 2012)
Several offers in the 2006-2007 and 2007-2008 irrigation seasons
Two public offers (2007 and 2008)
Potential
sellers
Irrigators. Right-holders located in areas closer to river banks or protected areas were prioritized. It included the purchase of irrigated land, not only of pumping rights
Farmers were given the option to lease-out their rights for one year in return for an economic compensation
Targeted to rice farmers in the Upper part of the basin who were willing to temporary lease their surface water
Budget
2010: 84.5 € mill (only 66 €mill were spent to acquire 6,900 hectares)
12 million € in 2006-2007 (only 5.5 million € were spent). Similar budget in 2007-2008 (12.7 million € were spent) (CHJ, 2010)
700,000 € each year (495,040 € were spent in 2007; very similar in 2008) (Calatrava & Gómez-Ramos, 2009)

3. WATER MARKETS IN SPAIN
39
Prices
Maximum: 10,000 €/ha (land without permanent crops) or 6,000 €/ha (land with permanent crops). Minimum: 3,000 €/ha
0.13 to 0.19 €/m3, depending on the distance of the seller’s location to the associated wetlands or to the river alluvial plain
0.168 €/m3 in 2007; very similar in 2008 (Maximum: 0.18 €/m3)
Volumes
29 hm3 of registered groundwater rights (13.6 hm3 were transferred to the Regional Government of Castilla-La Mancha that allocated them in the form of public concessions to other farmers)a. According to WWF (2012), only 1.1 hm3 have been purchased at a cost of around 6 € million in public funds
27.3 hm3 in 2006-2007; 50.6 hm3 in 2007-2008
2007: 2.93 hm3 (41 contracts were signed with small individual farmers, 371.5 has.)
Results
While farmers entering the program must surrender their private rights, those that gain access to them will be granted 30-year ‘concession’ rights (which is more attenuated property than the others). So the RBA will have more users with ‘concessions’ than with private rights (Garrido & Calatrava, 2009). The public offerings were planned to continue in 2008 and following years with a budget of 810 € million for 2008-2027, but the effects of the global economic crisis brought the Special Plan for the Upper Guadiana to a sudden stop
The Júcar exchange center did not meet its purchase objectives, as there were not enough bidders to cover the entire budget and target volume
Purchased volumes were intended for maintaining environmental flows in the Segura and Mundo River in the Albacete province (Castilla-La Mancha) but only once the domestic demands were satisfied. In practice, all the purchased volumes were for maintaining environmental flows
a The remaining 15.4 mill m3 correspond to the difference between the nominal water allotment of the
purchased water rights (4500 m3/ha) and the effective amount of water available to farmers because of the
existing pumping restrictions in the aquifer (about 2200 m3/ha).
Source: Own elaboration based on Garrido et al. (2012b).

40
The major difference between the Júcar and Guadiana experiences is that
the former aimed at reducing the environmental consequences of a drought
period by temporarily purchasing water from farmers, whereas the latter was
trying to solve a structural aquifer overdraft problem by permanent purchases
of land and its associated water rights.
The experience in the Upper Guadiana Basin should be judged against
the complex institutional and environmental setting prevailing in the basin
since the late 1980s. A number of authors have analyzed the remarkable
continuity and importance of aquifers’ use without appropriate permits or
rights (Molina et al., 2009); the long‐evolving and relentless trend of
groundwater use (Garrido et al., 2006); the succession of failed attempts to
curtail extraction rates (Martínez-Santos et al., 2008); the need to transfer from
the Tagus Basin to ensure the conservation of the Tablas de Daimiel Wetland in
the Guadiana Basin, without which it may have lost its UNESCO’s qualification
and all its flooded area (López-Gunn et al., 2012).
3.2.2. Formal lease contracts under the 1999 Reformed Water
Law’s provision
The number of formal lease contracts was expected to increase significantly
upon the approval of the 1999 Reform, especially within each river basin, but in
practice they declined significantly. Irrigation districts have been the main
water sellers; and other districts, urban suppliers and thermo-solar plants being
the main purchasers. In general, prices have been high because most exchanges
have occurred during drought periods, when water supply is low and demand
is high.
There are only a few documented experiences of formal lease contracts.
One of the most important experiences in terms of traded volume was in the
Tagus Basin in 2002, between a large urban retailer (Mancomunidad de Canales del
Sorbe, buyer), and the irrigation district of Canal de Henares (seller). 20 hm3 were

3. WATER MARKETS IN SPAIN
41
transferred, at a fixed cost of 38,000 €/year, plus a volumetric charge of 0.04
€/m3 for the first 4 hm3, and 0.02 €/m3 for the remaining 16 hm3. In the Segura
basin, 35 formal lease contracts were authorized between 2000 and 2005, for a
total volume of 10.1 hm3, less than 1% of total annual water consumption in the
basin (Calatrava & Gómez-Ramos, 2009). In the Guadalquivir Basin, several
exchanges were approved that included just one right-holder permuting his
rights from the lower basin (with higher salinity concentration) with his rights
in the upper basin. As a result, more water is used in the upper sections of the
basin, affecting water users downstream.
3.2.3. Inter-basin exchanges under Royal Decree 15/2005
According to the 1999 Reformed Water Law, exchanges involving right-holders
located in different river basins (jurisdictions) require the explicit approval of
the Ministry of Environment. In 2005-2008, Spain suffered a drought that
prompted the Spanish Government to permit water inter-basin exchanges using
previously existing infrastructures (Royal Decree 15/2005). In Spain, there are
two important inter-basin aqueducts that would enable water rights exchange
across basins (the Tagus-Segura Transfer and the Negratín-Almanzora Transfer,
the latter between the Lower Guadalquivir Basin and the Almanzora Basin, in
Almería). There are others operating in the country, but no exchange request
has yet been filed.
Inter-basin exchanges were contracted in 2006 (six in number, totaling
75.5 hm3), 2007 (17 in number, representing 102 hm3), and 2008 (two, with 68
hm3). In all of them, farmers in the area-of-origin (Tagus and Upper
Guadalquivir basins) leased out their water rights to farmers and urban users in
the Segura Basin (Sindicato Central de Regantes del Acueducto Tajo‐Segura and
Mancomunidad de los Canales del Taibilla) and the Andalusian Mediterrananean
Basins (Aguas del Almanzora, which mainly services irrigators) respectively.

42
In the Tagus Basin, the sellers were the over‐supplied irrigation districts
of Canal de Estremera and Canal de las Aves, where farmers received a payment
equivalent to 2,400 €/ha for fallowing their irrigated land, which is more than
the value of the crops (maize) they would have grown under normal
conditions.
The volumes bought by users in the Segura Basin from users in the Tagus
Basin only in 2006 largely surpassed those of all the exchanges approved among
users in the Segura Basin between 1999 and 2005. The Mancomunidad de Canales
del Taibilla, the major urban water supplier in the Segura Basin, signed an
agreement in 2006 with farmers in the Upper Tagus Basin (Comunidad de
Regantes del Canal de las Aves) to buy up to 40 hm3 at a price of 0.28 €/m3. In
2007, 36.9 hm3 were bought at a price of 0.23 €/m3. The price in 2006 was
greater because when the agreement was reached the selling farmers had
already incurred in some cultivation costs (Calatrava & Gómez‐Ramos, 2009).
The contract between the Canal de Estremera irrigation district and the Sindicato
Central de Regantes del Acueducto Tajo‐Segura (SCRATS) has been active during 4
years. SCRATS paid 6 million €/year for 31 hm3/year. The price was 0.19 €/m3
in 2006 and increased up to 0.22 €/m3 in 2008 (Calatrava & Gómez‐Ramos,
2009).
In 2007 and 2008, due to the prolonged drought in the Tagus Basin
almost no water could be transferred to the Almanzora Valley through the
Tagus‐ Segura aqueduct, farmers in Almanzora looked for alternative resources
(25 hm3 each year) and established two type of agreements: 1) They acquired
1,400 ha of irrigated land in the Marshes of Guadalquivir; and 2) established
formal lease contracts with different irrigation districts in the Middle
Guadalquivir (Bembézar and Guadalmellato irrigation districts) and the Genil
(Corominas, 2011). This author calculates the profit obtained by the sellers in
the Guadalquivir entering the latter mentioned lease contracts as the difference
between the income losses due to lower use of water and the received

3. WATER MARKETS IN SPAIN
43
compensation. This profit was 220 €/ha (Guadalquivir) and 280 €/ha (Genil).
Corominas (2011) stated that for prices of 0.15 €/m3, both buyers and sellers
could obtain gains from the exchanges in the Guadalquivir River Basin (in
practice, the price was 0.18 €/m3).
The exchanging system in the former case, which enabled transfers of
water from the Upper Guadalquivir to the Andalusian Mediterranean River
Basins, involved water purchasers in the recipient basin (the company Aguas del
Almanzora, S.A.) purchasing or leasing irrigated land with appurtenant water
rights in the lower Guadalquivir, and transferring the water rights to irrigate
more land in the Andalusian Mediterranean Basins. Note that there are three
geographical sites involved in the arrangement: (1) water‐rights linked to land
in the lower Guadalquivir basin were transferred to the, (2) Andalusian
Mediterranean Basins using the (3) Aqueduct Negratín‐Almanzora, whose
abstraction point is in the Upper Guadalquivir. However, there was only one
agent, i.e. company Aguas del Almanzora, which is buyer and seller at the same
time. Since this aqueduct’s abstraction point is in the Upper Guadalquivir
Basin, the transfer effectively involved water taken 350 km upstream the
location it would have been used under normal conditions. To reduce the
environmental and third‐party impacts of the reduced flows from the
Aqueduct’s headwaters to the lower Guadalquivir, a volumetric tax of 50% was
enacted ( the contractor was given permission to transfer only 50% of the water
rights attached to the purchased land). Since the exchange involved only one
partner, there was no price or economic compensation. The average price paid
for land purchase was 24,000 €/ha and approximately 40 hm3 of water were
transferred using the Negratín‐Almanzora transfer (Garrido & Calatrava, 2009).
Aguas del Almanzora has also established five‐year water lease
agreements with farmers in the Middle Almanzora Valley (Comunidad de
Regantes del Pago de la Vega del Serón) with concessions from the Negratín
reservoir (Guadalquivir Basin) at prices in the range of 0.15‐0.18 €/m3.

44
A common element in both across‐basins exchanges is the fact that the
MARM (Spanish Ministry of Environment) decided to exempt the exchanging
parties from paying the fees7 applicable to all regular aqueduct’s beneficiaries,
on the grounds that there was an extreme drought situation in which these
trading took place.
3.2.4. The Canary Islands
A very emblematic case of Spanish water markets can be found in the Canary
Islands. Some of hese markets have been active for a very long time, mainly for
groundwater resources, and it is seen as an example of efficiency. Despite this,
Canaries’ water trading system has some problems and abuses: water is
concentrated in a few hands (which determine the price and the conditions of
the exchanges); there is a lack of transparency and information; water quality is
not guaranteed by pipe owners and the owners are not responsible for water
losses (Aguilera-Klink & Sánchez-García, 2005; Custodio & Cabrera, 2012).
Some buyers prefer to purchase public water rather than private water,
even when the price is higher than the price of private water in the market,
mainly because it is more reliable, water quality is higher, and there are no
charges for conveyance losses (Custodio, 2011). Prices paid for irrigation water
during high-demand periods can reach or exceed the price of desalination; so
only very competitive water users can afford to purchase it (Custodio &
Cabrera, 2012). However, the water market plays an important role for some
agricultural areas and cities when there is no other available water source and it
encourages economic and social development in the islands (Custodio, 2011).
7 In the case of the Tagus‐Segura Aqueduct the fees range from 0.09 €/m3 for irrigators to 0.12 €/m3 for water agencies supplying municipalities in the recipient region.

3. WATER MARKETS IN SPAIN
45
3.2.5. Informal water exchanges
The combination of water scarcity, intensive agricultural production and urban
expansion has provided the ideal context for “informal” water exchanges.
Hernández-Mora & De Stefano (2013, p. 377) define informal water markets as
“exchanges that take place apart from the legislation and, in some cases, beyond
the control and overseeing of the Administration”.
Before and after 1999, informal water exchanges at the local level have
taken place frequently in many Spanish basins, primarily in East and Southeast
Mediterranean areas (Segura, Júcar and Mediterranean Andalusian Basins; see
Figure 2). Transactions normally occur when water scarcity problems arise and
water users need a rapid solution in order to obtain enough water to irrigate
tree crops or to supply other critical water uses. Water volumes exchanged in
these informal markets usually comes from groundwater sources and mostly
from private groundwater rights.
Price is quite high compared to formal lease contracts and public
purchases, and it is often of a speculative nature. The prices also vary by
location, water quality, alternative supply sources and, to a larger extent, the
scarcity level. Prices have been documented to reach 0.7 €/m3, although in
general there will always be a ceiling marked by the charges for desalinized
water, plus the transportation costs (0.33 €/m3 in coastal areas, and 0.39 €/m3 in
inland areas, with a total of 0.45-0.47 €/m3 at the point of use), in those coastal
areas where those resources are available. Quality graded waters fetch different
market prices with growers combining different sources to raise water quality
to levels crops can tolerate. In addition, in some areas farmers or water
companies desalinize deep saline groundwater, which is sometimes traded8. In
some cases, water sold comes from illegal pumping.
8 A distinction has to be made between desalination of brackish waters and desalination of sea water. In some coastal areas of Southeast Spain, individual farmers (commonly larger ones) use small desalination of deep brackish water, about which hardly any reliable documentation can

46
It has been documented that even municipalities have participated in
informal exchanges with farmers, mainly to meet the water demand derived
from the tourist activity. That was the case of Benidorm (Alicante), with a
seasonal population of 400,000 inhabitants and a regular one of 70,000. The
resulting agreement was to swap fresh sources originally owned by
horticulturalists for treated urban waste water (Martí, 2005). In some cases,
informal exchanges eventually become legalized or exchanged rights
adjudicated by the Water Agency.
3.3. Economic issues
Regarding the economics of Spanish water markets, three aspects are analyzed
in the following pages: price of water exchanges, the price setting mechanism,
and the economic efficiency of the exchanges.
In general, water prices in the markets have been closer to the
willingness to pay (WTP) of the buyer than to the opportunity cost of the seller,
especially in inter-basin transfers (Garrido et al., 2013). Exchange prices have
been advantageous for the involved parties, and they have shown that the
water scarcity value in Spain is 0.18-0.30 €/m3 in moderate drought situations,
net of costs (lost, transportation and distribution costs) and in a very wide area
(Tagus Basin and all the river basins in South Spain). Water buyers consider
that they are paying high prices for water in the market, as the selling part is in
a dominant situation and it takes advantage of it.
No author has set out to evaluate the actual impact of water markets in
Spain, although a number of studies obtained hypothetical evaluations of
welfare gains under various market scenarios (Arriaza et al., 2002; Calatrava &
be found. Eventually, in drought periods, some of these volumes are sold in informal markets, mostly to smaller farmers that have shalower wells and no desalinization facilities. There are also water companies that sell desalinized/brackish water. We only know of one irrigation district desalinizing brackish water, as districts in Southeast areas more commonly rely on desalinized sea water, when available, of which some information exists about cost, contracts, and used volumes.

3. WATER MARKETS IN SPAIN
47
Garrido, 2005a; Albiac et al., 2006; Gómez-Limón & Martínez, 2006; Pujol et al.,
2006; Blanco et al., 2010; Blanco & Viladrich, 2013). As mentioned earlier, the
bulk of traded volumes involved inter-basin transfers. Therefore, the net benefit
of an exchanged cubic meter would result from deducting from its use value
the transportation cost and the opportunity, resource and environmental costs
in the area-of-origin.
Due to the heterogeneity of water productivity values, the different
environmental status of water bodies, the different parties involved in water
exchanges (inter-sectoral or intra-sectoral; inter-basin or intra-basin), and the
need for conveyance infrastructures, it is difficult to obtain a single assessment
of the economic value of Spanish water markets. What follows is a discussion
about the most important trading activity in the country, and the factors that
should be considered to obtain a solid conclusion about the impact of water
markets on the areas involved.
In inter-basin water exchanges, the impacts may be larger than those
derived from intra-basin exchanges. Corominas (2011) analyses the inter-basin
trading activity through the Negratín-Almanzora Transfer (Andalusia). Buyers
were farmers (growing citrus and horticultural crops) in the Almanzora Basin.
Sellers were farmers in the Guadalquivir Basin growing annual crops including
rice. The considerable difference in average water productivity of these two
regions (0.25 €/m3 in the selling area, 1.6 €/m3 in the buying area) facilitated
the agreement. In 2007 and 2008, 25 hm3 were transferred at a price of 0.18
€/m3. According to Corominas (2011), the water price range that would afford
benefits for both water buyers and sellers in the Andalusian region would be,
approximately, 0.15-0.35 €/m3. However, in some cases, 0.15 €/m3 may not be
enough to compensate sellers for their income losses derived from the water
exchange. For a complete assessment of the impact of such water exchanges,
some other factors should be taken into account, such as the environmental cost
due to the transfer of water to another basin (0.005-0.0244 €/m3 based on

48
previous studies in different Spanish regions (Elorrieta et al., 2003; Ramajo-
Hernández & del Saz-Salazar, 2012)). In some cases the multiplier effect of any
displaced agricultural activity in the area-of-origin of the water should also be
included.
The other important inter-basin water exchanges in Spain took place
through the Tagus-Segura Aqueduct during the drought period 2005-2009. The
agreed prices for the exchanges were 0.19-0.22 €/m3 for irrigators. The marginal
value of irrigation water in the Segura Basin was 0.52 €/m3 (Calatrava &
Martínez-Granados, 2012), whereas in the Tagus Basin it was around 0.07 €/m3.
So, there is enough room for increasing the price paid by sellers in order to
compensate for any negative effects in the Tagus Basin (area-of-origin of the
water): environmental effects related to the transfer of water (see the above
estimates), foregone value of unused and transferred water and hydropower
opportunity costs (0.09 €/m3 according to Hardy & Garrido (2010)).
In the case of the water exchange centers in the Júcar, Segura and
Guadiana, the buyer was the River Basin Authority. The prices vary across
basins, depending on the water productivity in each region (see Table 4).
Although the environmental flow value estimations are relatively low, the
Administration is willing to pay the irrigators’ willingness to accept with the
aim of reaching a good ecological status for reservoirs and guaranteeing
minimum environmental flows.
For bilateral agreements between water users within the same basin,
such as the lease contracts that took place in the Tagus Basin and in the
Guadalquivir Basin, the differences in the value of water are smaller than
between different basins. Those gains from trade are expected to be smaller,
which explains the relatively reduced market activity within most basins. Still,
transportation costs and environmental impacts are also expected to be smaller
but will depend on the location of sellers and buyers in each basin.

3. WATER MARKETS IN SPAIN
49
Another important economic benefit from water trading, especially
between users in different basins, relates to the potential improvement in
supply reliability. For example, in the Guadalquivir Basin, several studies show
that farmers are interested in increasing their water supply reliability.
According to Mesa-Jurado et al. (2012) olive trees irrigators in the Guadalbullon
sub-basin (Guadalquivir Basin) are willing to increase by 10-20% the
community annual payment and also to reduce average water supply by 30% of
the water concession to increase their water supply guarantee. Their study
shows a WTP for improving water supply reliability of 0.034-0.074 €/m3. The
opportunity costs related to the reduction of water allocation from 1,500 to 1,000
m3/ha is 0.39 €/m3. Besides, water users in this basin are willing to pay 0.01-
0.015 €/m3 for improving water quality (Martín-Ortega et al., 2009). In the
Segura Basin, Rigby et al. (2010) estimates the WTP of horticultural farmers in
the coastal Campo de Cartagena irrigation district for an increase in the water
supply reliability to range from 0.22 to 0.5 €/m3.
The results derived from all these studies show that potential buyers are
willing to pay considerable amounts of money to increase their water
availability and to improve water supply reliability, but not that much to
improve the water quality of the rivers. The government, in contrast, is willing
to devote public funds to recover resources for the environment (or at least was
before the current economic crisis). Through the water market, buyers can
achieve the desired water supply reliability, sellers can be well-compensated for
transferring their water, and the environmental status of the water bodies can
be improved thanks to water exchange centers.
3.4. Reasons behind the limited success of water markets in
Spain
Several reasons can explain the limited development of water markets in Spain.
First, there are a number of restrictions and pre-requisites before a water

50
exchange is approved that certainly add transaction costs and red tape (Garrido
& Calatrava, 2009). These restrictions are meant to avoid speculation and water
rights hoarding, and to protect third-parties from negative effects, but result in
low market activity.
There are a number of regulatory elements, identified by Ariño & Sastre
(2009, pp. 100–101), that can restrict the functioning of water markets,
including: i) rights to consumptive uses cannot be sold to holders of non-
consumptive use rights (hydropower) and vice versa; ii) restrictions on
potential water buyers, such as rights can only be leased out to other rights
holders of an equivalent or higher category in the order of preference. It was
decided that the market should only be available for pre-existing and fully
legally supported users; iii) limits to the spatial extent of trading: licenses for
the use of public infrastructure connecting different river basin areas may only
be authorized if they come under the National Hydrological Plan or other
specific laws; iv) limits on prices; regulations may determine maximum prices
for water licenses. Competitive pricing can be superseded by administrative
intervention. Unlike the Australian differentiation of entitlements and use
rights, in Spain only a formal right, in the sense of entitlement, is defined.
Second, environmental limits are those enforced by public agencies
responsible for the stewardship of the ecological quality of rivers and water
bodies. In general, these limits, such as minimum environmental river flows,
are based on modeling evidence, and are seldom contested. Occasionally, an
“environmental tax” is imposed as a proportion of the volume/flow to which
the traded right is entitled and which should be left in the natural source.
Third, most water in Spain is currently allocated through public water
concessions, rather than private water rights, which still exist because their
holders had rights before 1985. Water markets do not always work efficiently
because concessions were not designed for market transactions. Law specialists
differ in interpreting whether the rights definition necessarily hamper the
market (Ariño & Sastre, 2009) or simply enforce the very Water Act tenets

3. WATER MARKETS IN SPAIN
51
(Embid, 2010). Consider the situation of a drought. One would expect that
shortages would trigger more market activity, but in fact water authorities
effectively reduce the volumes accessible to the right-holders in areas facing
scarcity, thereby reducing any incentive to purchase a water right. In a sense,
the RBA still has a major role in allocating water under scarcity conditions. But
decisions are agreed upon by all represented stakeholders, in meetings of
formal committees with executive power. So the market is not deeply ingrained
in Spanish water culture, and more collective responses to drought are common
and widely accepted. This is not the case in Australia, Western US or in Chile.
Moreover, there is also a problem of poorly defined water rights in some areas.
It is not a coincidence that most of water trading in Spain has been inter-basin
trading because scarcity situations have been different across basins and buyers
and sellers have been able to trade different percentages of the volume or flow
established in their formal right.
Fourth, with some exceptions, the potential for water trading between
users in the same basin are limited, as differences in WTP/WTA are usually not
significant. In addition, inter-basin water trading has only been allowed in
drought periods as an emergency relief tool. The largest exchanges of water in
the 2005-2008-drought period took place among users in different basins.
Fifth, a significant proportion of agricultural users are grouped in Water
Users Associations (WUAs) that in Spain usually take the form of communal
entities. If their users agree, the WUA can become the right-holder of all the
resources assigned to them individually, but this implies the termination of the
individual water rights. Under this case, WUAs rather than individual farmers
are the ones participating in water trading, and they are less likely to participate
as sellers in a water market. Furthermore, decisions to buy or sell are taken in
Assembly or Commissions, rather than individually. According to Giannocaro
et al. (2013), managers of WUA are interested in selling water, but seasonally.

52
Sixth, inter‐sectoral barriers occur when representatives of one sector
fights collectively exchanges that go against its political standing within the
hierarchy of water rights and political priorities. This is generally the case of
irrigators. A huge literature (see Easter et al., 1998) exists that show farmers
being initially reluctant to sell water out of the sector. As a recent example,
irrigators in the Ebro Basin made their water rights available to the city of
Barcelona during the severe water supply crisis during the 2005‐2008 drought,
but they would not accept any monetary payment for transferring their
resources. There are long‐term strategic reasons for combating out‐of‐sector
water sales; chief among them the fear that the economic forces go against them
and eventually their tradable rights will be questioned and perhaps irrigators
will be deprived of them (Howitt, 1994; Albiac et al., 2006).
Finally, in spite of the functioning of formal water markets for more than
a decade in Spain, there are still uncertainties. Criteria for approving or denying
applications for water exchanges are not clear. Consequently market
participants rely more on previous experience than on a clear public definition
of the circumstances under which trading is allowed (origin of water, area of
destination, tradable volumes, fees to be paid, environmental restrictions, etc.).
Similarly, the potential for inter-basin markets was hampered by the
uncertainty about whether or not the Spanish Government will allow
exchanges. The tedious administrative process and the needed time to obtain an
answer from the Administration discourage water users to participate in water
markets. Access to water rights, existing infrastructure, and legal and
administrative aspects are important factors influencing the acceptability of
water trading in Southern Spain (Giannocaro et al., 2013).
These and other barriers to trade result in other markets taking the role
of water markets. The market for agricultural land (lease or purchase) and
informal water markets substitute, to some extent, for formal water trading
with a significantly higher cost. Consider the real case of a thermo-solar power
plant, which needs water for cooling and replenishing vapor losses. If its

3. WATER MARKETS IN SPAIN
53
owners do not hold water rights, the only way he can obtain water is by
purchasing irrigated land and its attached water rights, and then request a
change of use from the water authority. Furthermore, technologies and
management practices, both on-farm, on site and at the district levels, have had
a significant impact on reducing water application rates in Spain and deterring
consumption. The energy cost component in many areas with abundant surface
water supplies, on top of the financial and operating costs of recently
modernized districts, have increased irrigation cost by 400% (Hardy et al.,
2012).
As Qureshi et al. (2009) assessed for the Australian case, the costs derived
from water market barriers (institutional and administrative constraints,
financial disincentives and spatial restrictions) are considerably high.
3.5. Present and future: Possible reforms
There are a number of shortcomings in Spanish water markets as well as in
other countries: high transaction costs, slow administrative procedures,
difficulties in finding buyers/sellers, high prices, rigid legislation, etc. (Garrido
et al., 2012b). However, markets in Australia, US and Chile are much more
active and deeper. As mentioned before, traded volumes in the Spanish water
market have never represented more than 1% of all annual consumptive uses.
Furthermore water markets are mainly used during drought periods, except for
a few water banks. Table 5 contains some insights and ideas that would
improve the functioning of water markets in Spain.
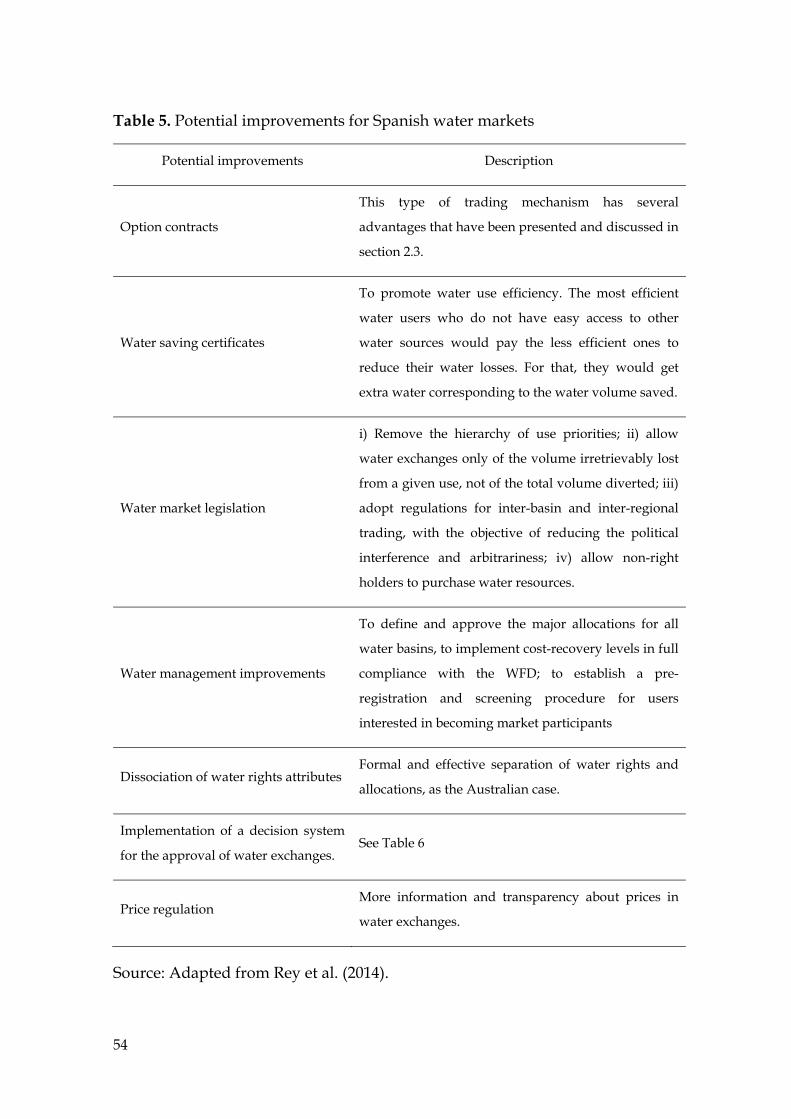
54
Table 5. Potential improvements for Spanish water markets
Potential improvements Description
Option contracts
This type of trading mechanism has several
advantages that have been presented and discussed in
section 2.3.
Water saving certificates
To promote water use efficiency. The most efficient
water users who do not have easy access to other
water sources would pay the less efficient ones to
reduce their water losses. For that, they would get
extra water corresponding to the water volume saved.
Water market legislation
i) Remove the hierarchy of use priorities; ii) allow
water exchanges only of the volume irretrievably lost
from a given use, not of the total volume diverted; iii)
adopt regulations for inter-basin and inter-regional
trading, with the objective of reducing the political
interference and arbitrariness; iv) allow non-right
holders to purchase water resources.
Water management improvements
To define and approve the major allocations for all
water basins, to implement cost-recovery levels in full
compliance with the WFD; to establish a pre-
registration and screening procedure for users
interested in becoming market participants
Dissociation of water rights attributes Formal and effective separation of water rights and
allocations, as the Australian case.
Implementation of a decision system
for the approval of water exchanges. See Table 6
Price regulation More information and transparency about prices in
water exchanges.
Source: Adapted from Rey et al. (2014).

3. WATER MARKETS IN SPAIN
55
Table 6. Criteria and risk valuation for evaluating a water exchange
Criteria Categories Risk level*
Exchanged volume
Less than 50.000 m3
50.000 m3 and 500.000 m3
>500.000 m3
1
2
3
Knowledge about the seller’s water consumption
Direct measurement
Estimated measurement
1
3
Distance between buyer and seller
<5km
5-20 km
>20 km
1
2
3
Seller is downstream from the buyer
No
Yes
1
3
Inter-basin transfer No
Yes
1
3
Water use change
To urban uses
To industrial or energy uses
To irrigation
1
2
3
Likely impacts on water flow returns
No
Yes
1
3
Groundwater exchange No
Yes
1
3
A new use essentially different from the seller
No
Yes
1
3
* 1: low risk; 2: medium risk; 3: high risk.
Source: own elaboration.
Among all these possible reforms, this work is focused on water option
contracts. In the following chapters, option contracts are analyzed from
different points of view in order to assess the potential benefits derived from
the implementation of this mechanism in the Spanish water market.


4. AN INNOVATIVE OPTION CONTRACT FOR
ALLOCATING WATER IN INTER BASIN TRANSFERS
57
4. AN INNOVATIVE OPTION CONTRACT FOR ALLOCATING WATER IN INTER-BASIN TRANSFERS: THE CASE OF THE TAGUS-SEGURA TRANSFER IN SPAIN
Abstract
Users in the Mediterranean region face significant water supply risks. Water
markets can provide flexibility to water systems run in tight situations. The
largest water infrastructure in the Iberian Peninsula connects the Tagus and
Segura Basins. Water volumes are annually transferred to the Segura Basin to
alleviate water scarcity problems in this region. The need to increase the
statutory minimum environmental flow in the middle Tagus and to meet new
urban demands has lead to the revision of the Transfer’s management rules,
which will cause a reduction of transferable volumes to the Segura Basin. We
evaluate the consequences of this change in the whole Tagus-Segura system,
regarding the available water volume for irrigators in the Segura Basin, the
resulting impact on environmental flows in the Tagus Basin, and the economic
impacts on both basins. To minimise the consequences of such change on
irrigators in the Segura Basin who depend on the transferred volumes, we
propose a water option contract between both basins that represents an
institutional innovation with respect to previous inter-basin spot market
experiences. Based on the draft of the new Tagus Basin Plan, we propose both a
modification of the Transfer’s management rule and an innovative two-tranche
option contract. The main goal is to define this contract and evaluate it with
respect to spot and non-market scenarios. Our results show that the proposed
option contract would reduce the impact of a change in the transfer’s
management rule and the supply risks in the recipient area.ç

58
4.1. Introduction
Water users’ reliability is subject to the variability of precipitation, deep
infiltration and runoff. One of the main objectives of water management is to
offer the required levels of supply reliability and mitigate the social, economic
and environmental consequences of droughts and floods. Water infrastructure
and allocation rules mitigate climatic cycles but do not completely eliminate
supply risks. Spot water markets facilitate the efficient allocation of this
resource and have some supply risk reduction properties, but do not provide
efficient risk allocation mechanisms per se, which exploit differences in risk
tolerance and exposure (Calatrava & Garrido, 2006).
Formal water markets in Spain have been functioning since 2006,
although the legal basis was approved in 1999. Trading experiences have been
limited and the existing market system presents important problems that
demand several reforms and innovative mechanisms in order to reduce water
users’ risks due to the low reliability of water supply from year to year (Garrido
et al., 2012b; Hernández-Mora & De Stefano, 2013). Thus, in this chapter a novel
water option contract between water users in the Tagus and the Segura Basins
is proposed and evaluated with respect to previous spot market experiences.
As water will become scarcer in the future and Mediterranean rain-fed
regimes will become more unstable, option contracts between different water
users associations or river basins could add flexibility and security to their
operations. A fundamental prerequisite for these exchanges to be successful is a
situation with considerably high water productivity difference between the
buying and the selling areas, a circumstance that is commonly found in areas
connected through inter-basin aqueducts.
Climate change projections over the next decades show an important
decrease in runoff and recharge in all Spanish River basins, mainly in the
southeast of the Iberian Peninsula. In the Tagus Basin, for the period 2010-2040

4. AN INNOVATIVE OPTION CONTRACT FOR
ALLOCATING WATER IN INTER BASIN TRANSFERS
59
this reduction of runoff is projected to be between 8% and 11%, under A2 and
B2 emission scenarios (CEDEX, 2011). According to Maestre-Valero et al. (2013),
water availability in the Segura Basin could be reduced by up to 40 %, with an
economic impact in the 32–36 % range.
Because water scarcity in the Tagus Basin is becoming a serious concern,
a change in the Tagus-Segura Transfer management rule has already been
agreed upon (CHT, 2013), in the sense of making it more restrictive in the
provision of water resources to the Segura Basin during dry periods. Ensuring
greater minimum environmental flows downstream the city of Madrid would
reduce the resources available for the Tagus-Segura system.
The proposed option contract aims to: a) minimise the negative impact
that the change in the management rules governing the Transfer would have on
water availability for irrigators in the Segura Basin; and b) reduce risk, increase
stability and security in inter-basin water exchanges for both buyers and sellers
with respect to past spot trading experiences. Based on the draft of the Tagus
Basin Plan9, we propose an amendment transfer management rule. Also, an
innovative two-tranche option contract seeks to provide an improved market
regime.
In the Spanish water market, option contracts are not a common type of
exchange but there has been one experience of a multi-annual contract that
resembles an option contract. In Spain, option mechanisms have been suggested
by Gómez-Ramos & Garrido (2004) and Cubillo (2010). Also, in several
meetings with Spanish water market stakeholders and experts, they have
shown interest in the implementation of this kind of trading mechanisms in this
country.
After recent legislation changes in 2013, inter-basin water trading is
going to be allowed in every circumstance, and not only during drought
9 http://www.chtajo.es/Informacion%20Ciudadano/PlanificacionHidrologica/Planif_2009-2015/Paginas/PropProyPHC_2009-2015.aspx [Available since March 2013].

60
periods and with the permission of the Ministry of Environment. This change is
going to have important consequences for inter-basin water trading activity due
to the huge potential of these exchanges.
The chapter is organised as follows: first, we describe the main
characteristics of the Tagus-Segura Transfer, and present the water supply
reliability problems in the recipient area. Second, we define the main features of
the proposed option contract and present the other considered scenarios (spot
market and no market). The third section describes the modelling framework
and data used to perform the analyses. Fourth, the results showing the impact
of different exchange scenarios on the water availability to irrigators in the
Segura Basin and on environmental flows in the middle Tagus Basin are
presented, together with an economic analysis of the different exchange
mechanisms. Lastly, conclusions are drawn based on the preceding analyses.
4.1.1. Case study: The Segura Basin and the Tagus-Segura
Transfer
4.1.1.1. Tagus-Segura Transfer
The Segura Basin is the most water scarce basin in Spain with a structural water
deficit of 370 million m3/year (CHS, 2007). Usually, this is covered by non-
renewable groundwater pumping and deficit water application to crops, which
in many cases are subject to water stress conditions, increasing water supply
costs (Calatrava & Martínez-Granados, 2012). In the 1970s, the Tagus-Segura
Transfer (TST) was projected with the aim of reducing this water deficit by
transferring water resources from the Upper Tagus Basin to irrigation districts
and urban water suppliers in the Segura Basin (Figure 4). In order to avoid
misunderstandings throughout the chapter, it is important to clarify that the
Tagus-Segura Transfer was approved by law in 1979 to enable water transfers
from the Tagus to the Segura Basin, but it is not a water market.

4. AN INNOVATIVE OPTION CONTRACT FOR
ALLOCATING WATER IN INTER BASIN TRANSFERS
61
Since the beginning, representatives from the area-of-origin of the water
have contested the TST operations. The argument was that there is no water
surplus in the Tagus Basin, so water should remain in the basin for the different
economic activities, to meet urban demands and to maintain a good ecological
status of the Tagus River. Opposition to transfers grows stronger during
drought periods when the Tagus River flow becomes significantly reduced.
Figure 4. Tagus and Segura Basins’ location in the Iberian Peninsula and the
Tagus-Segura Aqueduct
Source: Adapted from www.iagua.es.
The annual transferred volume to the Segura Basin depends on the water
stock jointly stored in the interconnected Entrepeñas and Buendía reservoirs (E-B)
in the Upper Tagus Basin, which have a total storage capacity of 2,443 million
m3. The stored water in the E-B reservoirs has exhibited a downward trend
since 1980. Prior to 1980 (when the TST was projected), the stock was above
1,500 million m3 for 70% of the months of the year (CHT, 2011). After 1980, the
stored volume has experienced a sharp drop and the total volume hardly ever
surpassed 1,500 million m3 (See Figure 5). The two last severe drought episodes

62
(starting in 1992 and 2005, respectively) are easily identifiable, when stored
volumes fell below 500 million m3.
Figure 5. Monthly stored volume (million m3) in Entrepeñas-Buendía
Vertical line marks the beginning of the inter-basin transfer operation
Source: (CHT, 2011).
Fluctuations in the stored volume cause great uncertainty, which
translates to uncertainty in the water volume that will be transferred each year
to the recipients in the Segura Basin. Water from the Tagus Basin is delivered to
users in the Segura Basin based on certain transfer management rules. These
rules require that the Tagus Basin’s demands should always be met without
limitation. Twice a year, the Ministry of Environment announces the maximum
volume that can be transferred to the Segura Basin during the following
semester. This decision is based on the total volume stored in the E-B reservoirs
(Table 7). Then, water will be delivered based on the fortnightly water demand
of the Tagus-Segura Transfer’s beneficiaries. In any case, the maximum annual
transferable volume is 600 million m3, an amount that has rarely been reached
since the Aqueduct was built, with a capacity of 1000 million m3and covering a
distance of more than 300 km.
0
500
1000
1500
2000
2500
1958
1960
1961
1963
1965
1966
1968
1969
1971
1973
1974
1976
1977
1979
1980
1982
1984
1985
1987
1988
1990
1992
1993
1995
1996
1998
1999
2001
2003
2004
2006
2007
2009
2011

4. AN INNOVATIVE OPTION CONTRACT FOR
ALLOCATING WATER IN INTER BASIN TRANSFERS
63
Table 7. Tagus-Segura Transfer’s statutory management rules
LEVEL RESERVOIR STATUS
MONTHLY MAXIMUM
TRANSFERABLE VOLUME
(million m3)
Level 1
Accumulated water inflows during the last 12
months higher than 1000 million m3, or total
stored volume above 1500 million m3.
68
Level 2
Accumulated inflows during the last 12 months
smaller than 1000 million m3, or total stored
volume below 1500 million m3.
38
Level 3 (Exceptional
hydrological situation)
Total stored water volume lower than the
volumes in Table 8 23
Level 4a (No water
surplus) Total stored volume below 240 million m3. 0
a The new Tagus-Segura management rule is more restrictive. It considers there is no water surplus in the Tagus Basin (Level 4) when the total stored volume is below 400 million m3, rather than 240.
Source: CHT (2008).
When the total water stock in E-B is below the minimum monthly
volumes shown in Table 8, the decision over the water volume that could be
transferred to the Segura Basin is made by the Council of Ministers, instead of
by the Tagus’s Basin Agency. This means that there is some discretionary
political power presiding over the inter-basin operations.
Table 8. Minimum stored volumes in the Entrepeñas-Buendía reservoirs below
which the decisions for transfer correspond to the Council of Ministers (hm3)
OCT NOV DEC JAN FEB MAR APR MAY JUN JUL AUG SEP
456 467 476 493 495 496 504 541 564 554 514 472
Source: CHT (2003).

64
4.1.1.2. Water availability risk in the Segura Basin
Irrigation districts in the Segura Basin, which receive water from the Tagus
Basin, face important risks regarding the planning of crops due to water supply
variability. In addition, when this transferred volume is low, urban uses have
priority over irrigation, and therefore irrigators’ water volumes are the most
affected (see Figure 6). In the last 10 years, the maximum volume transferred
from the Tagus Basin to irrigators in the Segura Basin was 337.57 million m3
and the minimum was 33.10 million m3 in 2005-2006, which was a year of
drought.
Figure 6. Transferred water volume (million m3) for irrigators and urban
suppliers through the Tagus-Segura Transfer, 1979-2011
Source: San Martín (2011).
4.1.1.3. Previous water trading activity between users in the Tagus and the Segura Basins through the inter-basin transfer10
In the case of inter-basin market exchanges, where the scope for water trading is
greatest and the largest lease contracts have been signed, the approval of the
Ministry of Environment was required, which constituted a relevant restriction 10 For a complete description of Spanish water markets, see chapter 3.
0
100
200
300
400
500
600
1979
-198
019
80-1
981
1981
-198
219
82-1
983
1983
-198
419
84-1
985
1985
-198
619
86-1
987
1987
-198
819
88-1
989
1989
-199
019
90-1
991
1991
-199
219
92-1
993
1993
-199
419
94-1
995
1995
-199
619
96-1
997
1997
-199
819
98-1
999
1999
-200
020
00-2
001
2001
-200
220
02-2
003
2003
-200
420
04-2
005
2005
-200
620
06-2
007
2007
-200
820
08-2
009
2009
-201
020
10-2
011
Urban Irrigation

4. AN INNOVATIVE OPTION CONTRACT FOR
ALLOCATING WATER IN INTER BASIN TRANSFERS
65
to this type of agreements. Some spot water purchases have been arranged
during drought periods to buy water from the Tagus Basin for agricultural and
urban users in the Segura Basin using the Tagus-Segura Aqueduct.
After 1999, due to the reductions in the transferred water volumes from
the Tagus Basin during drought periods, water users in the Segura Basin
resorted to the water market to obtain the needed water volume for their
activity. Since 2005, there have been several market exchanges between
irrigation districts in the Tagus Basin (sellers) and irrigation districts or urban
water suppliers in the Segura Basin (buyers, all of them beneficiaries of the TST)
(Garrido et al., 2012b). In all cases, the stock level in E-B was below the
threshold that determines that the decision of the transferred volume should be
taken by the Council of Ministers.
Table 9. Water transaction experiences between users in the Segura (buyer) and
the Tagus (seller) basins
SEASON BUYER11
(Segura Basin)
SELLER
(Tagus Basin)
VOLUME
(million m3) STOCK12
2005/2006 SCRATS Canal de Estremera 31.05 320.4
2006/2007 MCT
SCRATS
Canal de Las Aves
Canal de Estremera
46.5
31.05
349.9
349.9
2007/2008 SCRATS
MCT
Canal de Estremera
Canal Las Aves
31.05
36.9
332.3
393.3
2008/2009 SCRATS Canal de Estremera 31.05 553.9
Source: Own elaboration.
11 SCRATS (Central Association of the Irrigators’ of the Tagus-Segura Aqueduct, Sindicato Central de Regantes del Acueducto Tajo-Segura,); Canal de Estremera (irrigation district in the Tagus Basin); MCT (Taibilla’s Canals Commonwealth, Mancomunidad de Canales del Taibilla); Canal de las Aves (irrigation district in the Tagus Basin). 12 Stock in the Entrepeñas-Buendía reservoirs at the moment of the transaction (million m3).

66
Counting on the Ministry’s approval, the volume of water purchased in
2006 by users in the Segura Basin from irrigation districts of the Tagus Basin
largely surpassed those of all the intra-basin exchanges approved among users
in the Segura Basin between 1999 and 2005 (Garrido et al., 2012b). The MCT
(Taibilla’s Canals Commonwealth, Mancomunidad de Canales del Taibilla), the
major urban water supplier in the Segura Basin, signed an agreement in 2006
with farmers in the Canal de las Aves irrigation district at a price of 0.28 €/m3. In
2007, the negotiated price was 0.23 €/m3. The price in 2006 was greater because
when the agreement was reached the selling farmers had already incurred some
cultivation costs (Calatrava & Gómez-Ramos, 2009).
The contract between the Canal de Estremera irrigation district and
SCRATS (Central Association of the Irrigators’ of the Tagus-Segura Aqueduct,
Sindicato Central de Regantes del Acueducto Tajo-Segura) was annually renewed
during four years. SCRATS paid 6 € million/year to irrigators in the Tagus
Basin for 31.05 million m3/year. The price was 0.19 €/m3 in 2006 and increased
to 0.22 €/m3 in 2008 (Calatrava & Gómez-Ramos, 2009).
As these parties had already arranged some water exchanges in
consecutive years, we conjecture that they might be interested in signing a
water option contract due to the stability it provides for both buyers and sellers.
The above mentioned spot market activity took place during a drought period,
when water users in the Segura Basin were in an emergency situation. Under
these conditions, it may be difficult for buyers to easily find potential sellers
and get the water in a short period of time to irrigate the crops. A more stable
and reliable system could reduce water supply uncertainty for Segura’s water
users, and could provide stability to the area-of-origin water sellers as well.
Water markets have allowed agricultural water users in Southeast Spain
to cope with periods of severe water scarcity and to avoid significant economic
losses in their intensive export-oriented horticulture. Despite this, these types of

4. AN INNOVATIVE OPTION CONTRACT FOR
ALLOCATING WATER IN INTER BASIN TRANSFERS
67
contracts have been limited in duration and exchanged volumes, and still
present significant uncertainties for the buyers.
4.1.1.4. Water productivity values for the considered river basins
For a water market to exist there is a need for considerable differences between
water productivity in the selling and the buying areas. The difference should be
large enough to cover the transaction, transportation and environmental costs.
Water productivity is very different in the two considered regions in this work.
For instance, in Madrid (Tagus Basin) the irrigation water apparent
productivity is 0.6 €/m3. In Murcia (Segura Basin) the productivity is 3.4 €/m3
according to Gil et al. (2009). The high water productivity in irrigated areas
receiving water from the Tagus Basin is, in part, due to the concentration of
horticultural crops and greenhouses, and also to the modernization of the
irrigation systems (Calatrava & Martínez-Granados, 2012). This difference
favours the arrangements of water exchanges between users in these Spanish
basins. Table 10 shows some relevant economic data of water productivity
values in each area, and of the water exchanges that took place between water
users in both basins.
According to PricewaterhouseCoopers (2013), the agricultural sector in
the Segura Basin that depends on the transferred volumes from the Tagus Basin
generates 1268 € million to the GDP of the region. The cancellation of the water
transfers to the Segura Basin would lead to a reduction of the GDP of the
Murcia region close to 7.1% (Sancho, 2008).

68
Table 10. Average values for irrigation in the Tagus Basin and the Segura Basin
(areas served from the Tagus-Segura Aqueduct) (€/m3)
Tagus Basin Segura Basin
Marginal Value of water (net of water price) 0.06 0.69
Average value of water (net of water price) 0.29 0.95
Average water price paid by farmers served from the
Transfer -- 0.19
Price (water market)a -- 0.18-0.28
Economic values measured at average levels of water supply availability. a Prices paid by irrigators in the Segura Basin for water from irrigators in the Tagus Basin during the
drought period 2005-2008.
Source: Own elaboration based on Calatrava (2007) and Calatrava & Martínez-
Granados (2012).
4.2. Description of scenarios
The aim of this work is to evaluate the impacts derived from a change in the
Tagus-Segura management rules, and the potential of inter-basin trading as a
mechanism to reduce these impacts on the Segura Basin, in terms of water
availability and economic risks.
Our main objective is to define an option contract that would be
potentially interesting for both parties (Segura and Tagus Basins). For both
buyers and sellers, a multi-annual option contract would create an
institutionally stable and secure means to trade water resources, according to
rules with strong legal support and lesser political/administrative discretionary
power. It could be a multiannual agreement but the decision to acquire the
water should be annual if the predefined conditions prevail. The decision date
is set at the end of May, as this is the beginning of the dry season in the Iberian
Peninsula and the period of highest demand for crops.

4. AN INNOVATIVE OPTION CONTRACT FOR
ALLOCATING WATER IN INTER BASIN TRANSFERS
69
Our proposal includes the following elements: an alternative Transfer’s
management rule, which has been formulated based on the draft of the new
Tagus Basin Plan13; the parametric definition of the option contract; and the
economic analysis of the different scenarios.
Table 11. Scenarios
Scenario Transfer management rule Water market
1a Current rule No market
2a New rule No market
2b New rule Spot purchases in drought periods
2c New rule Option contract (different parameterizations)
Source: Own elaboration.
4.2.1. Tagus-Segura Transfer management rules
Based on the records of the Tagus-Segura water transfer, we can elicit the
current management rule, denoted by . , conceptually defined by:
(1)
where (measured in million m3) is the transferred volume to the Segura Basin
in one year and is a stochastic function of the water storage on January 1st in
E-B. Function . is statistically fitted with actual records of the previous three
decades of transfer operations.
We also define an alternative management rule, , which is
similarly shaped to . but with different parameters that result in different
probability density functions for and . This change of the management
rule has implications for both the recipient basin (Segura irrigators) and the
13 For this analysis, we assume here that the transferred volume to the cities in the Segura Basin will remain unchanged, as they have priority over irrigation uses. So, all the burden of the change in the transfer management rule would have to be borne by Segura Basin’s irrigators.

70
area-of-origin (Tagus environmental flows), and is a mathematical
representation of the agreement reached in 2013.
4.2.2. Water market scenarios: spot market and option contract
We define two different water exchange scenarios: a spot market, similar to the
inter-basin trading activity that took place between 2005 and 2008 (Table 9); and
the water option contract. The exchanged water volume through the spot
market is modelled as follows:
(2)
where is the stochastic purchased volume in the spot market if the
hydrological conditions prevailing during the 2005-2008 drought period are
met14, which occurs with probability p; is a binomial distribution (0,1) and
is equivalent to 31.05 million m3 (as this was the annual purchased volume by
irrigators in the Segura Basin from irrigation districts in the Tagus Basin during
the 2005-2008 drought period). Although there is not sufficient data and
observations to fit a binomial distribution, we make the assumption that if spot
market sales were under some circumstances in the past they will also occur in
the future under the same conditions.
The other market scenario considered is the water option contract, which
represents an innovation with respect to previous exchanges in the spot market.
It is modelled as follows:
31.05 1 ∆ (3)
where is the obtained volume through the option contract; is a
binomial variable (0,1); ∆ is the stochastic accumulated inflows during the
first five months of the year in the E-B reservoir; and . is a function that
yields the proportion of this increase that can be purchased under this scheme. 14 Water stock in the E-B reservoir < 550 million m3.

4. AN INNOVATIVE OPTION CONTRACT FOR
ALLOCATING WATER IN INTER BASIN TRANSFERS
71
The proposed option contract has two different components with
different purposes. The first tranche is intended to protect Segura’s irrigators in
those years when the stock level in E-B is very low and thus the probability of
receiving water through the TST based on the institutional management rule is
low. The second tranche of the scheme would allow irrigators in the Segura
Basin to have access to a higher water volume in those years when the stock
level in the reservoir is high, as a compensation for the change in the Transfer’s
management rules.
The first one (when is 1) represents a contract between an irrigation
district in the Segura Basin (buyer) and an irrigation district in the Tagus Basin
(seller). The trigger for obtaining the associated water volume to this part of the
option contract would be a minimum stock level in the E-B reservoirs.
Therefore, when the stock level in E-B is below this limit, the irrigators in the
Segura Basin can purchase the corresponding water volume just as it happened
in years 2006, 2007 and 2008. The water resources subject to this part of the
option contract would be the allocated volume to an irrigation district in the
Tagus Basin. Based on previous spot market exchanges between these parties, it
has been established that the maximum volume that they would have access to
with this part of the agreement is 31.05 million m3. The buyer will pay a
premium at the beginning of the year to the seller as compensation. This part of
the option contract intends to integrate past spot market experiences between
these two agents in a more reliable and secure system.
The second part (when = 0) represents an agreement between irrigators
in the Segura Basin (buyer) and the Tagus Basin Agency (seller). This part of the
option contract could only be accessed when the water stock in E-B is higher
than the established minimum, allowing the buyer to purchase a proportion
of the accumulated water inflows in the reservoir between January and May.

72
4.3. Empirical analysis
Three different issues have been analyzed for the considered scenarios: i) water
availability for irrigators in the Segura Basin; ii) remaining stock in the E-B
reservoir (Tagus Basin); and iii) economic impacts in the whole Tagus-Segura
system.
Monte-Carlo simulations were performed in order to obtain the
probability distribution functions (PDFs), for each scenario, of water availability
both for irrigators in the Segura Basin (referring only to water resources from
the Tagus Basin) and for the Tagus' headwaters reserves. We also obtained
simulation results of the net benefit of the inter-basin operations. By comparing
these PDFs, we can compare the impacts of different water trading mechanisms
and transfer management rules on irrigators’ water availability and on the
economic performance of the whole system.
4.3.1. Water availability for irrigators in the Segura Basin
4.3.1.1. Water availability under the current management rule (1) and alternative management rule (2)
For the definition of water availability under the current rule (previously
introduced in section 4.2.1), a regression model describing the annual
transferred volume has been fitted. This variable cannot be treated as
stochastic, due to the existence of the TST’s management rule. Because of this
rule (described in Table 7), the transferred volume depends on the water stock
in E-B and the accumulated inflows in this reservoir. A regression has been
performed following this expression:
(4)
: Annual transferred volume to the Segura Basin under the current
management rule (million m3).

4. AN INNOVATIVE OPTION CONTRACT FOR
ALLOCATING WATER IN INTER BASIN TRANSFERS
73
: Water stock at the beginning of the year in E-B reservoir (million m3).
: Dummy variable that takes the value 0 when the stock in January is below
1000 million m3 and 1 otherwise.
: Number of the year in the database (1,...,20).
: Error term ( ~ 0, ).
We have added a time variable ( ) in both linear and quadratic terms
because in previous and simpler specifications of the fitted model we observed
that the error terms followed a quadratic pattern over time.
Table 12. Estimated regression model for the variable “annual transferred
volume to irrigators” ( )
Coefficient Standard
error t value p value
(intercept) -150.414 60.9494 -2.47 0.025
(Stock) 0.549 0.0592 9.27 0.000
D (Stock > 1000) -245.014 46.7163 -5.24 0.000
(Year) 26.729 10.5895 2.52 0.023
Year^2) -0.919 0.3766 -2.44 0.027
Number of obs. 20 (1991-2010)
F (4,16) 40.08
Prob > F 0.000
R2 0.909
Adj. R2 0.887
Source: Own elaboration.
Currently, the minimum environmental flow in Talavera de la Reina
(downstream of Madrid) is set by law at 6 m3/s. The proposed Tagus Authority
figure was set at 10 m3/s (CHT, 2013). To achieve this, a higher stock level
(‘remaining stock’) in E-B would be required. We model such an increased
environmental flow scenario by simulating a change from management rule (1),

74
. , to management rule (2), . ; a change that would allow maintaining of a
higher water stock in the E-B reservoirs. Once we have the values of the
coefficients from the function . representing the current management rule
(Table 12), another function with different curvature and parameters . is
proposed, which is more restrictive in terms of the stock level needed in the E-B
reservoirs to transfer a certain amount of water.
Tentatively, management rule (2) is proposed as follows:
462 0.000483 1.210 1.661 47.131 (5)
In Figure 7, the “Rule (1)” curve represents the current management rule
and the “Rule (2)” curve represents the new management rule ( ). Neither
the new nor the current rules permit transferred volumes greater than 600
million m3 (400 million m3 for irrigation, 140 million m3 for urban uses. The
remaining 60 million m3 are conveyance losses). Figure 7 shows that for the
same stock level in the reservoir in January ( ) (X axis), the transferred volume
with the new management rule would be lower than with the current rule for
stock levels below 400 million m3. As defined in this work, for water storage
levels in E-B in January between 400 and 1000 million m3, the new rule permits
greater volumes to be transferred. In short, this new rule would deliver more
water to the Segura Basin when the status of the E-B storage is high and would
reserve larger volumes when the stock levels are low15.
15 This is only an alternative of what could be the new Tagus-Segura Transfer management rule, proposed by the authors.

4. AN INNOVATIVE OPTION CONTRACT FOR
ALLOCATING WATER IN INTER BASIN TRANSFERS
75
Figure 7. Different management rules for the Tagus-Segura Transfer
Source: Own elaboration.
For farmers in the Segura Basin, this scenario (without water market
activity) implies the following available volume:
, 400 or , 400 (6)
depending on whether the current or the proposed alternative management
rule prevails. and cannot be higher than 400 million m3, as this is the
maximum established volume that could be transferred to the Segura Basin for
irrigation purposes.
4.3.1.2. Water availability with spot purchases
The pattern of annual spot purchases during 2005 and 2008 has also been
included in the analysis. This is based on the water trading activity in the
previous drought period between water users in the Segura Basin and irrigation
districts in the Tagus Basin (see section 4.1.1.3). The results of this scenario in
terms of probability distribution functions will be compared with the other two
(no market, option contract).
, 400 (7)
0
100
200
300
400
500
600
700
0 200 400 600 800 1000 1200 1400
Tran
sfer
red
volu
me
(hm
3 )
Stock in E-B in January (St) (hm3)
Rule (1)
Rule (2)
76
where represents the total water availability for irrigators in the Segura
Basin in this case (taking into account only water resources from the Tagus
Basin); is the water transferred through the Tagus-Segura Transfer under the
new management rule; is a binomial variable that takes the value 0 when the
stock in E-B is higher than 550 million m3 and 1 otherwise. is the purchased
volume (always 31.05 million m3).
4.3.1.3. Water availability with the option contract
With this option contract, irrigators in the Segura Basin would have the chance
to obtain extra water volumes from the Tagus Basin:
31.05 1 ∆ , 400 (8)
where is the transferred volume that irrigators would receive every year
based on the new Transfer management rule (described above); is a binomial
variable that takes the value 1 when the stock level in the reservoir is below 550
million m3, so that the buyer would be able to purchase 31.05 million m3 from
an irrigation district in the Tagus Basin; and zero otherwise. . is the
transformation function that defines the proportion of the increase of water
inflows in the E-B reservoirs ∆ between January and May16, which will be
the volume that the buyer has access to, only when the stock in E-B is higher
than 550 million m3. is the total water volume from the Tagus Basin in this
case.
The reason for dividing the option contract into these two parts is the
following: This scheme is defined with the aim of protecting irrigators’ water
availability in the Segura Basin from the impacts of a change in the Tagus-
Segura Transfer management rules. As this change in the Transfer’s
management rules would attempt to improve the ecological status of the Tagus
River, the option contract should not reduce the available water for the
16 The inflows during these months are taken into account for the option contract model as the buyer has to decide whether to purchase the water or not at the end of May.
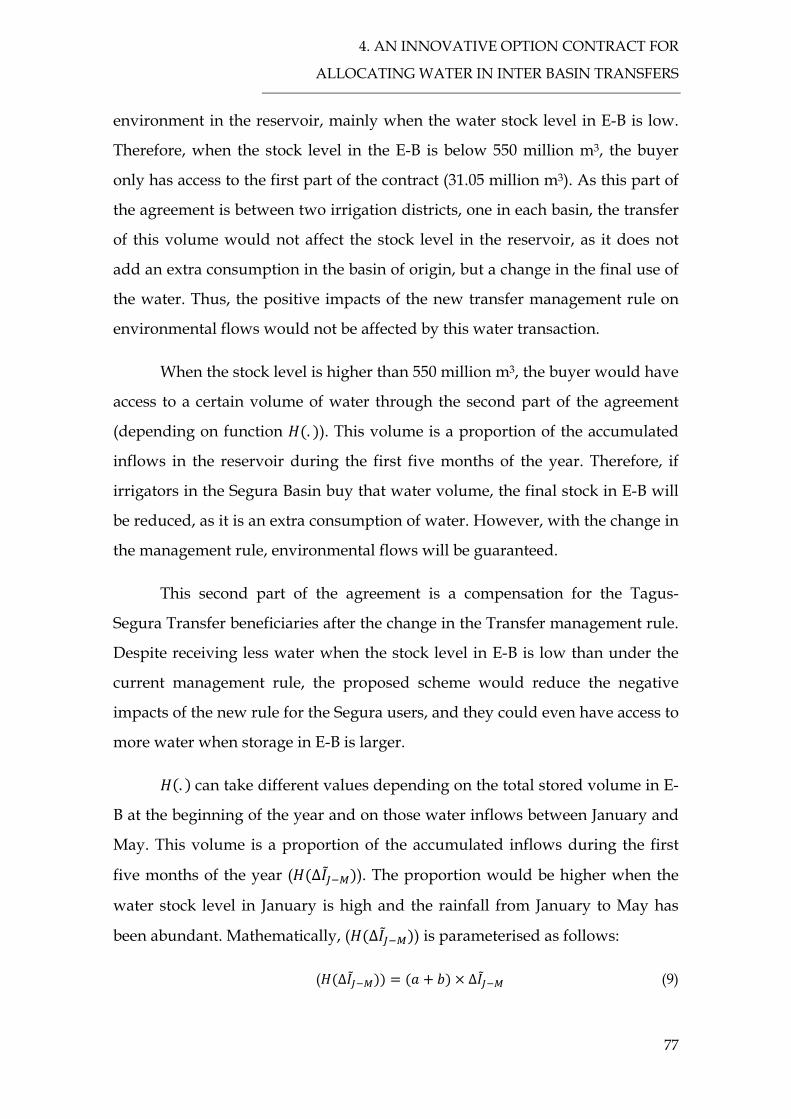
4. AN INNOVATIVE OPTION CONTRACT FOR
ALLOCATING WATER IN INTER BASIN TRANSFERS
77
environment in the reservoir, mainly when the water stock level in E-B is low.
Therefore, when the stock level in the E-B is below 550 million m3, the buyer
only has access to the first part of the contract (31.05 million m3). As this part of
the agreement is between two irrigation districts, one in each basin, the transfer
of this volume would not affect the stock level in the reservoir, as it does not
add an extra consumption in the basin of origin, but a change in the final use of
the water. Thus, the positive impacts of the new transfer management rule on
environmental flows would not be affected by this water transaction.
When the stock level is higher than 550 million m3, the buyer would have
access to a certain volume of water through the second part of the agreement
(depending on function . ). This volume is a proportion of the accumulated
inflows in the reservoir during the first five months of the year. Therefore, if
irrigators in the Segura Basin buy that water volume, the final stock in E-B will
be reduced, as it is an extra consumption of water. However, with the change in
the management rule, environmental flows will be guaranteed.
This second part of the agreement is a compensation for the Tagus-
Segura Transfer beneficiaries after the change in the Transfer management rule.
Despite receiving less water when the stock level in E-B is low than under the
current management rule, the proposed scheme would reduce the negative
impacts of the new rule for the Segura users, and they could even have access to
more water when storage in E-B is larger.
. can take different values depending on the total stored volume in E-
B at the beginning of the year and on those water inflows between January and
May. This volume is a proportion of the accumulated inflows during the first
five months of the year ( ∆ ). The proportion would be higher when the
water stock level in January is high and the rainfall from January to May has
been abundant. Mathematically, ( ∆ ) is parameterised as follows:
( ∆ ∆ (9)

78
With a and b being defined as follows:
0 5500.02 550 8000.03 800 900
0.04 900
and
0 5500.01 ∆ 300
0.02 300 ∆ 6000.03 ∆ 600
In the following figure, the values of this coefficient are shown.
Figure 8. Suggested values of the coefficient H
Source: Own elaboration.
The values of the parameters and have been chosen by the authors in
order to obtain some numerical results. In the model simulations, . could be
redefined, considering different versions of this option contract. Some will be
more restrictive in the proportion of the water inflows that the buyer could
purchase depending on the level of stock and the total inflows in the reservoir.
Different types of this scheme could be proposed and analysed simply by
changing these proportions. Higher proportions would benefit the recipient of

4. AN INNOVATIVE OPTION CONTRACT FOR
ALLOCATING WATER IN INTER BASIN TRANSFERS
79
the transferred volumes, but would reduce storage levels and could be harmful
for the environment in critical areas of the Tagus River.
To assess the impact of the option contract on irrigators’ water supply
risk in the Segura Basin, we have formulated a model of Monte-Carlo
simulations. The results show how the level of risk faced by Segura water users
will change with a modification of the transfer management rule and with the
different market scenarios. In parallel, we have also evaluated the resulting
probability distribution function of the water stock available for meeting the
Tagus’ environmental needs.
4.3.2. Resulting water availability in the Tagus Basin
Stored volumes in E-B are released to ensure that water demands and
environmental flows in the middle Tagus are met. The remaining stock in the E-
B reservoirs, after delivering the statutorily defined volumes by the Transfer’s
management rule function ( . or . ) to the Segura Basin, is also a
determinant factor of the current and proposed schemes. The following
expression could help us understand the effect of each scenario on the stock
level in the reservoir and therefore, the water volume that would determine the
water flow in the middle Tagus.
∆ (10)
is the stock in the reservoir on December 31st; is the stock at the
beginning of the year17; ∆ represents the total water inflows during the
year18; is the transferred volume for irrigators in the Segura Basin for each
case (subscript could be (a) referring to the case ‘no market’; (b) ‘with spot
water purchases’ and (c) ‘with the option contract’); is the annual transferred
17 : Discrete function fitted using historical data (1991-2010). 18 ∆ : Follows an Inverse Gauss pdf (p value: 0.6444). Distribution function fitted using historical data (1991-2010)
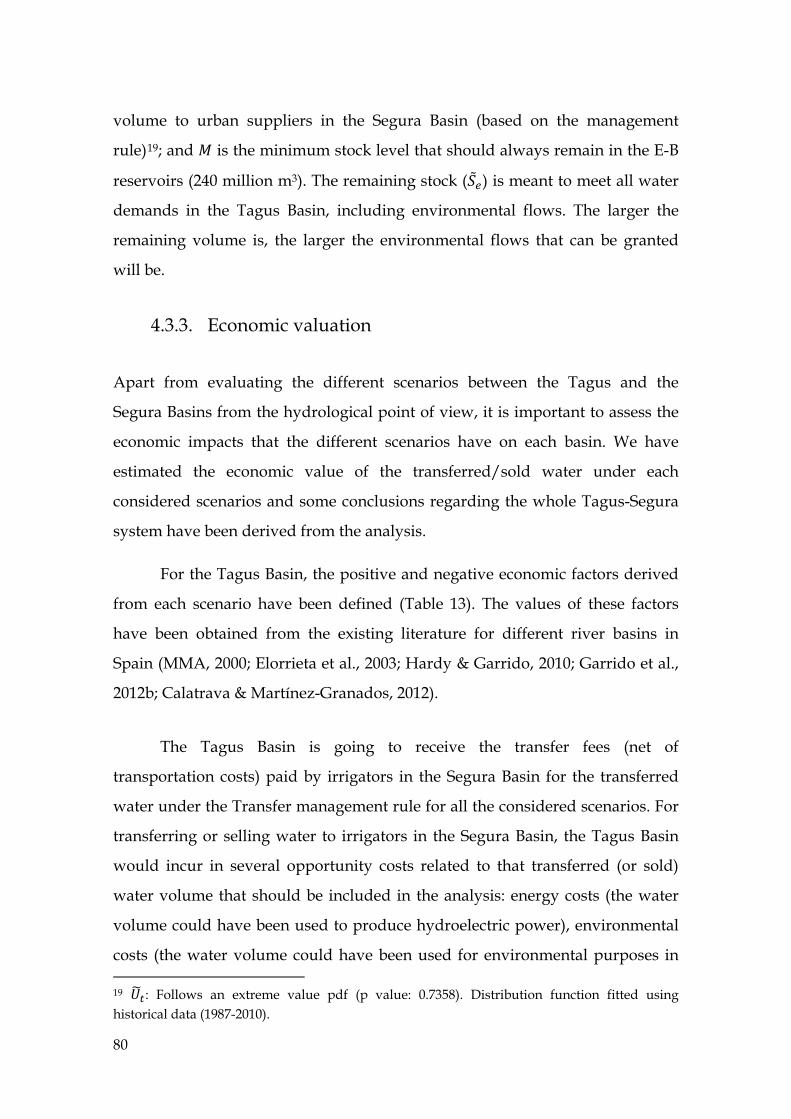
80
volume to urban suppliers in the Segura Basin (based on the management
rule)19; and is the minimum stock level that should always remain in the E-B
reservoirs (240 million m3). The remaining stock ( ) is meant to meet all water
demands in the Tagus Basin, including environmental flows. The larger the
remaining volume is, the larger the environmental flows that can be granted
will be.
4.3.3. Economic valuation
Apart from evaluating the different scenarios between the Tagus and the
Segura Basins from the hydrological point of view, it is important to assess the
economic impacts that the different scenarios have on each basin. We have
estimated the economic value of the transferred/sold water under each
considered scenarios and some conclusions regarding the whole Tagus-Segura
system have been derived from the analysis.
For the Tagus Basin, the positive and negative economic factors derived
from each scenario have been defined (Table 13). The values of these factors
have been obtained from the existing literature for different river basins in
Spain (MMA, 2000; Elorrieta et al., 2003; Hardy & Garrido, 2010; Garrido et al.,
2012b; Calatrava & Martínez-Granados, 2012).
The Tagus Basin is going to receive the transfer fees (net of
transportation costs) paid by irrigators in the Segura Basin for the transferred
water under the Transfer management rule for all the considered scenarios. For
transferring or selling water to irrigators in the Segura Basin, the Tagus Basin
would incur in several opportunity costs related to that transferred (or sold)
water volume that should be included in the analysis: energy costs (the water
volume could have been used to produce hydroelectric power), environmental
costs (the water volume could have been used for environmental purposes in 19 : Follows an extreme value pdf (p value: 0.7358). Distribution function fitted using historical data (1987-2010).

4. AN INNOVATIVE OPTION CONTRACT FOR
ALLOCATING WATER IN INTER BASIN TRANSFERS
81
the Tagus Basin), and economic costs (when the sold water comes from the
water allotment of irrigators in the Tagus Basin, this volume could have been
used for irrigation in the basin). This last cost, which results from a reduction of
agricultural production in the Tagus Basin, has an associated multiplier effect
that should be also taken into account. It is important to highlight that only
those transferred water volumes that come from an irrigation district water
allotment (as it is the case of the spot purchases and the first tranche of the
option contract) result in an economic loss for the Tagus Basin, as this
transferred water would have been used for irrigation in the area-of-origin of
the water.
Table 13. Positive and negative factors affecting the Tagus Basin for each
scenario
Scenario Positive factor Negative factor
1. Current transfer rule (no market)
• Transfer fees • Opportunity costs (hydropower) • Opportunity costs (environment)
2. New transfer rule (no market)
• Transfer fees • Opportunity costs (hydropower) • Opportunity costs (environment)
3. New transfer rule (spot market in dry periods)
• Transfer fees • Spot price
• Opportunity costs (hydropower) • Opportunity costs (environment) • Opportunity costs (economic) • Multiplier effect
4. New transfer rule (option contract)
• Transfer fees • Option premium • Exercised price
• Opportunity costs (hydropower) • Opportunity costs (environment) • Opportunity costs (economic) • Multiplier effect
Source: Own elaboration.
In the recipient area, the transferred water volume would allow Segura’s
farmers to secure their activity and maintain their agricultural production,
having a positive impact on this basin, including a multiplier effect on its
economy. But for receiving this water, they have to pay the agreed price for
each water source.

82
For the Tagus Basin, the economic opportunity cost for each scenario has
been calculated using water value curves obtained from a non-linear
mathematical programming model, developed by Calatrava for the Tagus Basin
River Authority (Calatrava, 2007), that simulates the economic use of irrigation
water in the Tagus Basin. The economic value that the received water volume
from the Tagus Basin has in the Segura Basin under the different scenarios is
computed using a non-linear mathematical programming model that simulates
the economic use of water in the irrigated agriculture of the Segura Basin. For
detailed descriptions of the model used see Martínez-Granados et al. (2011) and
Calatrava & Martínez-Granados (2012).
For each scenario, the net benefit derived from the transferred water
volumes in the whole Tagus-Segura system is obtained, taking into account all
the above mentioned positive and negative factors in each basin.
(11)
being the benefits derived from the transferred volume, the total costs, is
the transferred/sold water volume from the Tagus Basin to irrigators in the
Segura Basin under the scenario . Obviously, a transfer of water to another
basin has a negative impact on the area-of-origin of the water. However, if the
positive impact of this water transfer on the recipient area is higher than that
negative impact, the overall welfare will be improved.
4.4. Data sources
For the analysis of irrigators’ water availability in the Segura Basin (taking into
account only water resources from the Tagus Basin), the following data have
been collected: monthly water inflows and stored volumes in E-B reservoirs
(1958-2011, in million m3), monthly transferred volume from the Tagus to the
Segura Basin (1987-2011) and monthly water consumption from the TST by
irrigators and municipalities (2000-2010).

4. AN INNOVATIVE OPTION CONTRACT FOR
ALLOCATING WATER IN INTER BASIN TRANSFERS
83
For the economic assessment of the different scenarios in the Tagus
Basin, some economic data found in the literature from previous studies for the
Iberian Peninsula has been collected (Table 14).
Table 14. Considered values of the economic factors affecting each basin.
Basin Concept Value Source
Tagus
Transfer fees 0.030 €/m3 (Calatrava & Martinez-Granados, 2012)
Spot price 0.090 €/m3 (Garrido et al., 2012b)
Option contract fee 0.060 €/m3 --
Economic multiplier effect 0.315 €/€ of product (MMA, 2000)
Environmental opportunity cost 0.0244 €/m3 (Elorrieta et al., 2003)
Energy opportunity cost 0.0930 €/ m3 (Hardy & Garrido, 2010)
Seguraa
Transfer fees 0.1250 €/ m3 (Garrido et al., 2012b)
Spot price 0.2100 €/ m3 (Garrido et al., 2012b)
Option contract fee 0.2100 €/ m3 --
Economic multiplier effect 1.206 €/€ of product (PwC, 2013) a The difference between the price that irrigators in the Segura basin pay for the water that comes from
the Tagus Basin and the money that the Tagus Basin receives represents the conveyance costs of the
Tagus-Segura Aqueduct
Source: Own elaboration.
4.5. Results and discussion
4.5.1. Comparison of water availability under the different
scenarios
If the new TST management rule is implemented ( , with parameters
shown in Eq.5), the assigned water volume for irrigators in the Segura Basin
would be reduced, especially when the stock in E-B is low (see Figure 9). The
84
proposed option contract would represent a mechanism for offsetting this
negative impact on water availability for irrigators.
Figure 9. Cumulative probability curves representing the water availability
(million m3) for irrigators in the Segura Basin.
1: current management rule; 2: new management rule; a: no market; b: with water purchases; c: with the
option contract.
Source: Own elaboration.
Figure 9 shows the reduction in the water supply from the Tagus Basin
for irrigators in the Segura Basin if the management rule changes to a more
restrictive one (from the red line, 1a; to the blue line, 2a). With the first part of
the scheme, which entitles them to 31.05 million m3 when the stock in E-B is
low, this reduction is compensated. With the second part, based on ∆ ,
there are further gains as E-B stock grows. Depending on the proportion of the
accumulated inflows that irrigators in the Segura Basin have access to (H, 0.5H,
2H), the impact of the change of the TST management rule would be reduced in
a different proportion. The scenario 2 would represent an improvement with
0.0
0.2
0.4
0.6
0.8
1.0
0 50 100 150 200 250 300 350 400
1a 2a 2b 2c (0.5H) 2c (H) 2c (2H)
hm3

4. AN INNOVATIVE OPTION CONTRACT FOR
ALLOCATING WATER IN INTER BASIN TRANSFERS
85
respect to the water availability under the current rule, increasing the
probability of obtaining 400 million m3 from the Tagus Basin from 4% to 12%.
Both and 2 represent an improvement in the mean volume of transferred
water to the Segura Basin (Table 15).
Table 15. Percentiles’ value of the water availability (million m3) for the
different scenarios
P1 P5 P10 P25 P50 P65 P75 P95
1a 0.00 7.49 35.12 105.32 222.44 275.67 311.21 393.05
2a 0.00 0.00 0.00 59.90 217.76 273.86 305.63 387.61
2c (0.5H) 31.05* 31.05* 31.05* 83.64 225.59 285.00 316.45 398.54
2c (H) 31.05* 31.05* 31.05* 88.92 237.23 297.31 328.60 400.00
2c (2H) 31.05* 31.05* 31.05* 98.18 259.25 319.95 351.65 400.00
1a: current rule (no market); 2a: new rule (no maket); 2b: new rule (spot purchases); 2c: new rule (option
contract).
* These volumes are obtained from the first tranche of the proposed option contract.
Source: Own elaboration.
The probability of not receiving any water from the Tagus Basin would
be higher under the new management rule, as more stock in E-B is required to
transfer a certain amount of water. Therefore, with this new rule, irrigators in
the Segura Basin would receive less water when the stock level in E-B is low,
allowing for a better and faster recovery of the water stock in the Upper Tagus
Basin. In these years, they could have access to the first part of the option
contract and obtain a certain water volume from an irrigation district in the
Tagus Basin, thereby not causing any extra consumption from the reservoir
because the first part is obtained from resources already allocated to irrigators
in the Tagus Basin.
When the stock in E-B is low, the irrigators in the Segura Basin would
have access to the same water volume (31.05 million m3) both with water

86
purchases and with the option contract, which is why the values of p5 and p10
are similar for both cases.
4.5.2. Remaining water stock in E-B reservoir
Another important aspect of the proposed contract is its effect on the remaining
water stock in E-B, which is shown in Figure 10, and consequently on the
environmental flows in the Tagus River. These curves represent the remaining
water stock in the reservoir (defined in Eq. 10) after meeting the Segura Basin’s
demands and subtracting the minimum established water stock that should be
stored in the reservoir. With the new management rule, as the transferred water
volumes to the Segura Basin would be lower, the available stock in E-B would
be higher, allowing the maintenance of higher environmental flows in the
middle Tagus. Note, however, that the three cases do not differ significantly.
Figure 10. Cumulative ascending curves of the PDFs of the remaining stock (St)
in E-B
Current management rule (1a); and under a new management rule with (2c) and without (2a) an
option contract
Source: Own elaboration.
0.0
0.2
0.4
0.6
0.8
1.0
0 200 400 600 800 1000 1200 1400 1600 1800 2000
1a 2a 2c (H)
hm3

4. AN INNOVATIVE OPTION CONTRACT FOR
ALLOCATING WATER IN INTER BASIN TRANSFERS
87
Table 16 shows that the remaining stock in dry years (lower percentiles’
values) is higher under the new rule with the option contract (even with 2 )
than under the current management rule. For higher percentiles (wet years), the
stock differences are very small in relative terms.
Table 16. Percentiles’ value of the remaining stock in the E-B reservoir (million
m3) for the different scenarios.
P1 P5 P10 P25 P50 P65 P75 P95
1a 330.91 448.58 518.56 670.57 900.40 1054.27 1166.84 1534.51
2a 374.33 480.68 554.90 705.33 919.83 1062.20 1166.00 1522.09
2c (0.5H) 372.22 475.02 548.85 696.04 911.32 1054.91 1156.06 1510.97
2c (H) 368.76 469.79 542.27 689.34 901.97 1045.17 1147.57 1501.64
2c (2H) 355.32 458.47 528.86 675.25 884.11 1028.43 1134.77 1487.90
1a: current rule (no market); 2a: new rule (no market); 2b: new rule (spot purchases); 2c: new rule (option
contract).
Source: Own elaboration.
This option contract is a means to allow transfer beneficiaries in the
Segura Basin to take advantage of a high water level in the reservoir in good
years at the expense of reductions in drought conditions caused by the change
in the TST management rules. With a new management rule and the option
contract, the left tail of the PDF of the stock in E-B is higher (40 million m3 more
in percentile 1%), improving the hydrological status of the reservoir in critical
years and allowing the maintenance of environmental flows in those years.
However, with the proposed scheme, in years when the stock in E-B is high, the
holder could benefit from this situation, having access to a greater water
volume.

88
4.5.3. Economic analysis
In addition to presenting the differences in water availability in the Segura
Basin and in the remaining stock in the Tagus Basin among the considered
scenarios, it is important to address the economic aspects of the proposed
option contract.
After identifying potential economic factors of the water transfer
affecting each basin under the considered scenarios (see section 4.3.3), the
economic value of these impacts has been obtained for the Tagus-Segura whole
system.
Taken into account the transferred water volumes to irrigators in the
Segura Basin under each considered scenario, the economic value of the water
deliveries from the Tagus to the Segura Basin has been obtained (only water for
irrigation in the Segura Basin is considered). The following figure shows the
PDFs of the economic value (in billion €) for the whole system (considering
both basins).

4. AN INNOVATIVE OPTION CONTRACT FOR
ALLOCATING WATER IN INTER BASIN TRANSFERS
89
Figure 11. Cumulative ascending curves of PDFs of the net benefit derived from
the Tagus-Segura water transfers
1a: current rule (no market); 2a: new rule (no market); 2b: new rule (spot purchases); 2c: new rule
(option contract).
Source: Own elaboration.
As shown in Figure 11, the Tagus-Segura Transfer has a very important
net economic benefit. This is mainly due to high-productive agriculture of the
recipient area (Segura Basin). A change in the transfer management rules will
lead to a negative impact in this Tagus-Segura system, which has been
estimated on average at nearly 75 € million. Both the spot purchases scenario
and the option contract scenario reduce this negative impact. Moreover, results
clearly show that the proposed option contract would be more beneficial for the
Tagus-Segura system than a spot water market such as the currently existing
one (see Table 17).
Comparing the spot purchases scenario and the option contract scenario,
results clearly show that the proposed option contract would be more beneficial
0
0.2
0.4
0.6
0.8
1
0
0.2
0.4
0.6
0.8 1
1.2
1.4
1.6
1.8 2
Values in € billionsSCENARIO 1a / TOTAL SCENARIO 2a / TOTALSCENARIO 2b / TOTAL SCENARIO 2c / TOTAL

90
for the Tagus-Segura system than a spot water market such as the currently
existing one (see Table 17).
Table 17. Percentiles’ value of the net benefit derived from the transferred
water volume (€ million).
P1 P5 P10 P25 P50 P65 P75 P95
1a 6.00 47.41 179.40 531.54 1053.17 1290.89 1445.31 1799.61
2a 3.00 3.00 3.00 299.74 1034.21 1290.57 1431.19 1787.81
2b 138.27 140.15 140.15 365.43 1033.09 1289.28 1430.26 1788.72
2c 137.12 139.01 139.01 413.92 1138.91 1395.76 1533.26 1840.85
1a: current rule (no market); 2a: new rule (no market); 2b: new rule (spot purchases); 2c: new rule (option
contract).
Source: Own elaboration.
For P50 and higher percentiles, the net benefit values derived from the
option contract under the new management rule are the highest in comparison
with the rest of the considered scenarios.
4.6. Conclusions
Water users in Mediterranean regions suffer considerable water supply risks.
The Spanish Tagus-Segura Transfer has alleviated water scarcity in the Segura
Basin, but its water deliveries have economic and environmental effects in both
the recipient basin and the area-of-origin. It operates under a management rule
that depends on stochastic hydrological variables, but also under some political
discretionary rule.
Either because of the need to increase the minimum environmental flows
in the Middle Tagus or because of reduced run-off caused by climate change, or
both, a redefinition of the management rules governing the Tagus-Segura, the
largest water transfer operating in Spain, is going to be implemented. A change
in the TST management rule, such as the one simulated in this chapter, would
imply a reduction in the transferable volumes, especially in dry periods.

4. AN INNOVATIVE OPTION CONTRACT FOR
ALLOCATING WATER IN INTER BASIN TRANSFERS
91
However, a water option contract similar to the one proposed here would
reduce the negative impacts of a change in the management rule on both the
water availability and the risk exposure of the transfer’s beneficiaries. When the
stock level in E-B is high, the scheme would allow irrigators in the Segura Basin
to benefit from this situation, having access to even more water than with the
current rule.
Under the new transfer management rule, in those years when the
transferred volume to the Segura Basin is very low, users in the Segura could
rely on the first tranche of the option contract and on other more costly but also
more secure water sources, such as desalination. In fact, a serious breakdown in
one section of the Tagus-Segura Transfer tunnel in July 2012, which interrupted
the service for several months, has been partially made up by desalination
plants.
A change in the management rule would increase the currently low
environmental flows in the Tagus Basin and meet the increasing demands of
local and regional representatives and environmental groups. With the
proposed option contract both objectives could be met, striking a more balanced
equilibrium between environmental and irrigators’ interests. Parameters in
function . , that determine the proportion of the water inflows that the buyer
has access to, should be carefully chosen in order to meet these goals. They
should allow the beneficiaries to obtain more water when the stock in E-B is
high and the rest of uses (including the environmental ones) are fully met. In
this paper, we have modelled three different levels somewhat arbitrarily set to
meet the general option contract requirement: acceptability by both sellers and
buyers and by the Tagus Basin’s stakeholders.
According to a recent report by PricewaterhouseCoopers (2013), a 10%
reduction in the released water volume to the Segura Basin could cause an
impact on the Segura’s agricultural production of 1% in the short term, and 4%
in the long term. The Tagus-Segura Transfer has an enormous importance for

92
the economy in the recipient area, one of the most agricultural productive
regions in Spain. As our results show, a change in the transfer management rule
would have considerable consequences for the Tagus-Segura system, causing
an important impact on the benefits derived from this water transfer. This
economic information should be taken into account when deciding the future of
the most important water transfer in the Iberian Peninsula.
As urban uses have priority over irrigation, the risk that urban suppliers
in the Segura Basin have to face is smaller. However, as they also depend on the
resources from the Tagus Basin, they are affected when the transferred water is
not sufficient to cover the cities’ demands. Therefore, a water option contract
similar to the one proposed here could be useful for them.
Traditionally, spot markets have been the used mechanisms for water
exchanges between users in the Tagus (sellers) and in the Segura (buyers)
basins. The restriction of inter-basin trading activity only in times of drought
did not encourage the development of more stable and sophisticated trading
mechanisms. Under the new legislation, in which the inter-basin market is
allowed in all circumstances, option contracts could provide stability to both
parties.

5. COMPARISON OF DIFFERENT WATER SUPPLY RISK
MANAGEMENT TOOLS FOR IRRIGATORS
93
5. COMPARISON OF DIFFERENT WATER SUPPLY RISK
MANAGEMENT TOOLS FOR IRRIGATORS: OPTION
CONTRACTS AND INSURANCE
Abstract
Irrigators must cope with the risk of not having enough water to meet crops’
demands. There are different tools to manage this risk, including water markets
and insurance. Given the choice, a farmer will use any of them when the
expected utility change derived from the tool is positive. This chapter presents
a theoretical assessment of a farmer’s expected utility for two different water
option contracts and a drought insurance policy. The conditions that determine
farmer’s preference for these instruments are analyzed and a numerical
application to a water-stressed Spanish region is performed. Results show that
farmer’s willingness to pay for the considered risk management tools are
greater than the preliminarily estimated costs of the instruments. This suggests
that option contracts and insurance may help farmers manage water supply
availability risks.
5.1. Introduction
Irrigators face the risk of not having enough water to meet crops’ demands.
There are a number of strategies to cope with this risk. Farmers can apply on-
farm strategies to reduce vulnerability, share the risk with an external agent
(Cummins & Thompson, 2002; FAO, 2003; Hardaker et al., 2004; Sivakumar &
Motha, 2007; Garrido & Gómez-Ramos, 2009b), or find combination of internal
and external instruments. Among all the existing tools that could help
irrigators manage this risk, this chapter focuses on water supply option
contracts and drought insurance.

94
The possibility of trading water rights may lead to a reduction in the
water availability risk faced by farmers (Calatrava & Garrido, 2005a, 2005b;
Bjornlund, 2006; Lefebvre, 2011). Option contracts are one type of derivative
contract that gives the holder the right (not the obligation) to buy or sell the
underlying asset (Williamson et al., 2008; Cui & Schreider, 2009; Cheng et al.,
2011). Water option contracts help the option holder to protect himself from the
risk of not having enough water for his activity (irrigating in the case of
farmers).
Insurance provides compensation for losses that occur with relatively
low frequency and whose probability and actual damage can be evaluated
(Garrido et al., 2012c). Index insurance has been proposed to deal with water
scarcity in several contexts, including Mexico (Zeuli & Skeest, 2005; Leiva &
Skees, 2008) and New South Wales (Australia) (Brown & Carriquiry, 2007). In
this chapter, the proposed insurance will provide a monetary compensation
when the volume of irrigation water to which a farmer is entitled is reduced
and falls short to meet the crops' average water demand. Unlike option
contracts, an insurance policy transfers the water supply risk outside the water
and agricultural markets.
While both instruments (water option contracts and drought insurance)
aim at protecting irrigators from water supply availability risks, they have
different features and prerequisites. Among the available alternatives, farmers
will choose the risk management tools that are perceived to improve their
utility. The literature on agricultural water supply risks has not theoretically
analyzed different mechanisms and compared them to one another. This is one
of the main objectives of this work.
I develop a theoretical framework to evaluate farmers’ willingness to
pay (WTP) for different water supply risk management instruments, and to
obtain agents’ hypothetical ordered preferences for them. Using the expected
utility theory approach, drought insurance and option contracts are compared

5. COMPARISON OF DIFFERENT WATER SUPPLY RISK
MANAGEMENT TOOLS FOR IRRIGATORS
95
to draw some conclusions about the designing parameters that may make one
mechanism more attractive than the other. Three different situations are
considered: no water supply risk management tool, a water option contract
(two different types), and a drought insurance; and provide preliminary
evaluations of the instruments’ costs and farmers’ potential willingness to pay
for them.
Both drought insurance and option contracts are being considered or
have been actually designed and structured, though not yet used in Spain. The
developed theoretical framework is applied to an irrigation district in Southeast
Spain to obtain some numerical results that show farmer’s potential WTP for
the proposed instruments. These results are compared to others obtained in
previous works on different water supply risk management tools also applied
to Spain (Tobarra, 2008; Rigby et al., 2010; Mesa-Jurado et al., 2012; Pérez-
Blanco & Gómez 2012, 2013).
The chapter is organized as follows: section 5.2 presents the theoretical
framework, where the farmer’s expected utility, the risk premium and the cost
of each instrument are calculated; section 5.3 includes an analysis of the
farmers’ preferences for the proposed instruments; section 5.4 presents the
application of the theoretical model to irrigators in one of the most arid and
most efficient agricultural areas in Spain; in section 5.5 a discussion of the
obtained results is provided; and finally, in section 5.6 some conclusions from
this analysis are presented, highlighting the importance of these risk
management tools for agriculture. Most of the mathematical derivations are
presented in Appendix 1 at the end of the document with the aim of facilitating
the reading of this chapter.
5.2. Theoretical framework
According to the Expected Utility Theory a decision maker chooses between
risky or uncertain prospects by comparing their expected utility values

96
(Mongin, 1997). Between different alternatives, an agent will choose the one
with higher expected utility.
We assume that the Expected Utility ( ) of a farmer depends on his
uncertain profit ( ). As an irrigator, his profit is going to be a function of his
seasonal water availability ( ), which follows a probability distribution
function, .
(1)
A farmer would choose to use one instrument, i, if his expected utility is
higher than the one without this instrument ( ):
0 (2)
Even acknowledging that the expected utility framework has been
consistently discredited by empirical work (Kahneman & Tversky, 1979; Just &
Peterson, 2010), it still provides a valid approach for discriminating among risk
management instruments whose outcomes are not extremely different both in
their second and third moments, such as the ones considered in this chapter.
Some assumptions are made to ease the mathematical complexity of the
theoretical analysis and to facilitate the comparison between the considered
risk management tools. First, although several studies have shown that farmers
mainly exhibit Decreasing Absolute Risk Aversion (DARA) (Hardaker, 2000;
Gómez-Limón et al., 2002; OECD, 2009), we assume a Constant Absolute Risk
Aversion (CARA), in particular an exponential utility function ( 1
). Assuming a DARA utility function, such as the Logarithmic or the Power
function, leads to integrals that have no analytical solution for the most
common asymmetric probability density functions suitable to model
(Gamma, Lognormal, Beta, Weibull), except for the Exponential function.
However, this last function has very rigid properties (mean, variance, kurtosis)
that are not adequate for this analysis. For the purpose of comparing different
risk management instruments, we ponder the analytical convenience of using a

5. COMPARISON OF DIFFERENT WATER SUPPLY RISK
MANAGEMENT TOOLS FOR IRRIGATORS
97
CARA utility function, taking into account that the range of outcomes of
considered is not very wide (see Calatrava & Garrido, 2005b; Garrido, 2007),
and that farmers’ wealth (land and capital values) is invariant to the choice of
instrument. Several authors have used the same assumption before (Cerdá &
Quiroga, 2008; Garrido & Zilberman, 2008; Quiroga et al., 2011). In the
numerical section of the paper we performed a comparison of results obtained
with DARA and CARA.
Second, we assume a linear restricted profit function (dependent on ).
This assumption is acceptable in cases where water is used in Leontief
production functions, each activity has fixed proportion of inputs, and farmers
in the short run change activities (crops) instead of searching for new
production methods. Actually, that is the case in many irrigated areas, where
water rather than irrigable land is the limiting input, water applications to
crops are finely controlled, and changes of water availability result in changes
in crop patterns and irrigated area instead of changes in water applications.
Lastly, we shall assume that farmer’s water availability follows a gamma
distribution function. This function has a simple Moment Generating
Function20 (MGF) that facilitates calculation and together with the previous
assumptions provides a convenient analytical approach (Collender &
Zilberman, 1985; Garrido & Zilberman, 2008). The gamma is bounded on the
left, but unbounded on the right. We assume a truncation on the right tail (at
), leaving out this tail of the distribution for representing unlimited and
unneeded water availability levels.
Based on these assumptions and applying the expected utility theory, we
have obtained the mathematical expressions of farmers’ expected utility and
risk premium for the different cases.
20 A MGF of a random variable is a specification of its probability distribution, which gives us a convenient way of collecting together all the moments of a random variable into a single power series.

98
5.2.1. Expected utility function without a water supply risk
management tool
In this case, farmer's total water availability would be his water allotment ( ).
A very simplified farmer’s linear restricted profit function is used ( ). We
are not taking into account the costs associated with the farming activity
neither the income21.
(3)
where a is the net benefit of agriculture, independent of water availability; b is
the marginal value or marginal profit of water (net of price)22. The CARA
exponential utility function for this case is:
1 1 (4)
is farmer’s absolute risk aversion coefficient. The farmer’s expected utility can
be expressed as (see Appendix 1, section A for the entire calculation):
π 1 1
(5)
is the maximum water availability for the farmer, being zero the
minimum. is the Moment Generating Function of the variable of
order . As explained before, we assume that variable follows a gamma
distribution, which has a considerably simple MGF:
1 (6)
and are parameters of the Gamma function; with mean / and variance
/ . From equation (5) it is clear that is the disutility resulting from
21 Our assessment only takes into account the changes in the farmer’s expected utility caused by different water availability (due to an option contract or an insurance). 22 ; is the marginal profit of water use and the water tariff.

5. COMPARISON OF DIFFERENT WATER SUPPLY RISK
MANAGEMENT TOOLS FOR IRRIGATORS
99
unstable profit ( ). It decreases with the marginal productivity of water
( 0) and increases with water supply variance keeping average
water supply constant ( 0).
5.2.2. Expected utility function with a water supply risk
management tool
In this work, three different water supply risk management tools for irrigators
are considered (two different option contracts and drought insurance). To ease
the presentation, only the theoretical model for an option contract is presented
in detail. Based on this mathematical calculation, the risk premium for the other
two considered tools is briefly presented. In Appendix 1 (sections B through E),
the entire mathematical analyses for these instruments are presented.
5.2.2.1. Option contract (a)
This option contract allows the farmer (option holder), when his yearly water
allotment ( ) is below a given threshold or guaranteed level ( ) and when an
external condition (trigger) is also met, to exercise the option and obtain the
remaining water volume to reach the guaranteed level ( ), paying the
exercise price to the seller.
A farmer that decides to sign an option contract has to pay a premium
( ) to the seller for having the right to purchase the optioned water volume at
the maturity date if needed. The premium represents the value of the flexibility
gained by the buyer from postponing the decision to purchase water (Hansen
et al., 2006); and it must compensate the seller for giving away a part of his
water allotment.
The farmer would only be able to exercise the option and acquire the
optioned volume when two different trigger conditions are met: his water
availability is lower than and the water stock ( ) in the reservoir which

100
stores the seller’s water allotment is higher than a pre-established limit 22F
23. As
both conditions are related to water availability, we assume they are
stochastically dependent. Thus, the probability of exercising the option can be
modeled as a joint probability distribution. For the rest of the chapter, this
probability is going to be denoted by . When one of these two conditions is not
met, the option contract cannot be exercised ( 1 ).
The farmer’s profit function in this case depends on whether the
conditions related to the option contract are met:
w 1
(7)
is the option premium. is a binomial variable (0,1), with a probability
of being 1, so the option is exercised. is the exercise price or strike price24.
The farmer’s expected utility function with this option contract is (see
Appendix 1, section B.1):
1
(8)
23 This is the case of farmers relying on inter-basin transfers where, because of area-of-origin preferences, no volume is transferred unless minimum water volumes are stored in the region where the transfer is derived from. Any other condition can be established as a trigger for the option contract instead of the proposed one.
24 A farmer exercising the water supply option contract will pay P plus P for the optioned volume. P is defined as a price additionally paid, besides the price paid for the normal source of water supply (P ). If the exercise price agreed in the option contract were lower that the price paid for the normal source of water supply, P would then be negative. This situation is not very common, but it can occur when the contract is established between water users who have very different water productivities. In order to simplify the presentation of this approach, only positive P values are considered in the analysis, unless stated otherwise. In section 5.5, an example of an inter-basin exchange with a lower exercise price than P that took place in the Spanish water market is presented.

5. COMPARISON OF DIFFERENT WATER SUPPLY RISK
MANAGEMENT TOOLS FOR IRRIGATORS
101
where LIMGF is the Lower Incomplete Moment Generating Function25 of .
The maximum premium value that makes the contract attractive for the
farmer (i.e., the risk premium, ) results from making equal farmer’s
expected utility with and without the option contract (see Appendix 1, section
B.2 for the entire mathematical derivation).
Z
(9)
UIMGF is the Upper Incomplete Moment Generating Function of order
(see footnote 6). The risk premium depends on several parameters,
including farmer’s absolute risk aversion coefficient ( ), the marginal water
value ( ), the exercise price ( ), the guaranteed water volume ( ), and the
parameters of the gamma function that represents farmer’s water availability (α
and λ). Changes in these parameters have a quite complex impact on the risk
premium value. In section 5.4, the application of the theoretical model to a real
case will illustrate the relationship between the value of the risk premium and
some of these parameters.
Expression (9) is best interpreted inspecting the bracketed term within
the logarithm. If the bracketed term is greater than 1, then 0; and this
holds if b , which holds if . The
intuition is as follows: if the disutility of the left tail of the distribution covered
by the option (for ) – which is captured by – is lower than
25 MGF rb UIMGF rb LIMGF rb The UIMGF and the LIMGF are calculated in the same way, the only thing that changes is the value of the integral’s limits (In appendix 1, section C, the expression of UIMGF rb is obtained).
LIMGF rb MGF rb Q α, λ rb w 1 Q . is a regularized gamma function.

102
the disutility of water supply risk (for ) without the option
( b , then there will be a positive willingness to pay for the
instrument 0).
Apart from this option contract, two other risk management tools are
assessed in this work for different exercise conditions: an option contract (b)
with Z=1; and a drought insurance policy.
5.2.2.2. Option contract (b)
Option contract (b) allows the holder to exercise the option whenever his water
allotment is below a pre-established guaranteed level ( ). The difference with
option contract (a) is that in this case there is no additional trigger 1)
(additional condition for exercising the option). Thus, under option contract
(b), the option holder is going to have, at least, a water volume equivalent to
every season, paying the exercise price ( ) to the seller.
The mathematical expression of the risk premium ( ) for this
instrument is (see Appendix 1, section D):
(10)
The risk premium for the option contract (b) is greater than that of
option contract (a). The interpretation of equation (10) is simpler than that of
equation (9), because there is no risk associated with the execution of the
contract. Therefore, 0 holds if and only if and <
b , i.e. if the disutility of paying the premium is lower than the
disutility of not having the optioned water volume available.
While contract (b) is just a particular case of the contract (a), with Z=1, it
is more directly comparable to the insurance policy, because both guarantee
some compensation (either in water volume or in revenue) in case of shortage.
Also, contract (b) is easier to evaluate in economic costs.

5. COMPARISON OF DIFFERENT WATER SUPPLY RISK
MANAGEMENT TOOLS FOR IRRIGATORS
103
5.2.2.3. Insurance
The proposed insurance contract would have similar risk reduction effects as
option contract (b). It offers a financial compensation for the lost profit if the
received water volume by the farmer is below the guaranteed volume ( .
Applying the same methodology as the two previous cases, the risk
premium is (see Appendix 1, section E):
(11)
is the probability of the farmer’s water availability ( ) being lower than ;
i.e., the probability of receiving the insurance indemnity.
5.2.3. Analysis of the supply side of the instruments
It is important to make a distinction between the risk premium ( ) and the
premium actually paid by the farmer. The risk premium represents the
farmer’s willingness to pay for using a given instrument. The premium actually
paid is the amount of money that the farmer pays to the seller/insurance
company to have access to the optioned water volume/indemnity if needed.
Obviously, the farmer is not going to pay a premium higher than his WTP for
contracting the option/insurance.
As important as analyzing farmer’s WTP for different water supply
management tools, it is the evaluation of the supply side of these instruments.
The market price is going to determine the final decision to purchase one
instrument or the other. Each risk management tool (insurance and option
contract) has its own pricing mechanism.
For an insurance policy, the basic premium is equivalent to the expected
indemnity. Different costs (administrative costs, re-insurance costs, …) are
added to this basic premium to obtain the final value of the premium that the

104
farmer should pay to purchase the insurance policy. Thus, the commercial
premium is:
, 0 1 (12)
is the pure premium; , 0 is the expected compensation
and C represents all the associated costs.
For option contracts, the Black-Scholes-Merton model (Black & Scholes,
1973; Merton, 1973) is commonly used. The model is defined as follows:
(13)
with
√
(14)
√ (15)
is the value of the option (contract premium); is the spot price for water;
is the cumulative distribution function of a normal function; is the exercise
price of the option ( in our case); is the interest rate (in %); is the
time to maturity date in years; is the volatility (in %) of the underlying asset
(water). The option contract premium plus the exercise price represents the
total price of the option.
5.3. Comparison between instruments
In the following sections we compare the risk premium of option contracts (a)
and (b), with the insurance policy.
5.3.1. Comparison between option contract (b) and insurance
The risk premium for both cases ( and ) has been obtained in the
previous section (equations (10) and (11)), and they differ only on the

5. COMPARISON OF DIFFERENT WATER SUPPLY RISK
MANAGEMENT TOOLS FOR IRRIGATORS
105
denominator of the logarithm. In order to compare the risk premium value for
these cases, we compare the value of their denominators. Insurance is preferred
to option contract (b) if:
(16)
Expression (16) compares the utility of the risk associated to the left tail
of the distribution ( ) of the option contract with the certainty equivalent
of the tail guaranteed by the insurance26. Further algebra with (16) allows us to
conclude that, if > 0, is always going to be greater than , and thus
the insurance will be preferred to option contract (b).
0
0
1 0 (17)
As the upper limit of the integral is , is going to be always smaller
than . Thus, 1; and this expression would be positive for 0.
Both instruments offer similar protection level for farmers. However, in
the case of the option contract farmers must also pay an exercise price for
getting the optioned volume. That is why the insurance risk premium is higher
when the exercise price of the option contract is positive. The farmer would
have to pay all the costs of the insurance (the insurance premium) at the
beginning of the year. In the case of the option contract, the interaction between
buyer and seller takes place in two steps. First, all the contract terms are
established: the premium, the exercise price and the optioned volume. Water
availability is uncertain at this point, but the farmer has to decide whether to
26 LIMGF rP e P f w dw . As P 0 ; then e f w dw f w dw γ.

106
sign the option contract and pay the premium to the seller. In the second
period, when such uncertainty disappears, the buyer has to decide whether to
exercise the option, paying the exercise price for the optioned volume (Tomkins
& Weber, 2010).
If the price of the water acquired through the option contract were lower
than the usual source of water ( 0), then the option contract might be
preferred to the insurance policy27. This scenario occurred in inter-basin water
markets in Spain (see Garrido et al., 2012b), which operated during the 2006-
2008 drought years (see section 5.5).
The decision to purchase one instrument or the other would depend on
the effect that each tool has on farmer’s welfare. If and are the
premiums paid by the farmer for each instrument, he is going to purchase the
one that provides him higher welfare; i.e., the difference between the risk
premium and the premium paid is higher28. If , the
farmer would purchase the option contract.
and 1
(18)
where is the numerator of the risk premium (which is the same for both the
option contract (b) and the insurance); is the denominator of the option
27 Expression (17) can be rewritten as 1 0.
1 is the expected utility of , i.e., the expected utility of the increase in the cost of water due to obtaining it through the option contract instead of the usual water source. If 0, such expected utility would be positive and thus . 28 Obviously, irrigators will only sign the option contract if their WTP (risk premium, ) is higher than the price that they have to pay for it ( ); .

5. COMPARISON OF DIFFERENT WATER SUPPLY RISK
MANAGEMENT TOOLS FOR IRRIGATORS
107
contract’s risk premium (see Eq. 9); and the denominator of the risk
premium of the insurance (see Eq. 10).
Therefore, if , the farmer would prefer the option
contract. The value of the premium paid that makes the farmer indifferent
between both alternatives is: .
For a risk-averse farmer and 0, is greater than (and
greater than ), and therefore 0. Expression (18) would be:
0 (19)
This result implies that the farmer will choose the insurance even if the
premium to be paid for it is greater than the one to be paid for the option
contract, as long as the former does not overpass the latter in more
than .
On the other hand, if 0 (the optioned water is cheaper than the price
the farmer pays for his regular water allotment), is greater than (and
greater than ), and therefore 0. Expression (18) would
then be:
0 (20)
In this case, the farmer will purchase the option contract as long as this
premium does not overpass the premium to be paid for the insurance in more
than . Below, we discuss why 0 would hold probably in certain
contexts.

108
5.3.2. Comparison between option contract (a) and insurance
A similar comparison is made between option contract (a) and the insurance.
The probability of getting the compensation through the insurance is higher
than the probability of getting the optioned volume through this option
contract. For risk averse growers, always holds for 0 (proof
available for request). If 0 , only for very low exercise prices, the WTP for
this option contract could be slightly higher than . Similarly to the previous
comparison, the farmer will choose the insurance even if is greater than the
premium to be paid for this option contract, as long as the former does not
exceed the latter in more than .
In sum, when comparing two of these risk management tools ( and ),
the decision rule that determines which instrument is going to be purchased by
a risk-averse farmer is:
From all the possible pair-wise comparisons of the analyzed
instruments29, we obtain the order of preferences for them, considering a risk-
averse farmer, which is shown in Figure 12.
29 See appendix G, where the remaining comparisons between the proposed tools are shown.

5. COMPARISON OF DIFFERENT WATER SUPPLY RISK
MANAGEMENT TOOLS FOR IRRIGATORS
109
Figure 12. Farmer’s ordered preferences for the risk management tools
(according to the obtained risk premium for each case)
Source: Own elaboration.
Clearly, the parameters of each instrument will influence the farmer’s
WTP for a risk management tool, pointing out which factors are more
determinant when designing this type of tools30. As expected, a higher
guarantee level ( ) will increase the WTP for all the instruments. Higher
values of the gamma parameter , increase the value of the guaranteed volume
(which would increase the risk premium), whereas higher values of have the
opposite effect. A low exercise price in comparison to the price normally paid
for the water allotment or for alternative sources can change farmer’s
preferences for the different risk management tools considered in this study.
5.4. Application to an irrigation district in Spain
Currently, water trading mechanisms help reduce the risk of Spanish farmers
of not having enough water to irrigate their crops. Insurance providing
coverage against water shortages is still in a developing stage in Spain (Pérez-
Blanco & Gómez, 2012, 2013; Ruiz et al., 2014).
30 A comparative statics analysis has been carried out in order to determine the influence of the main parameters on the value of the risk premium for each instrument. This material can be provided by the authors upon request.

110
Since 1999, the Spanish National Water Law permits agreements
between water users to exchange water rights (temporary or permanent), under
several conditions and restrictions (Garrido et al., 2012b). During drought
periods, irrigators in less water-endowed areas resort to spot water markets to
increase their water availability. However, in these situations it is very difficult
to find a water seller and prices may be extremely high because of the
dominant position of the seller. Gómez-Ramos and Garrido (2004), Cubillo
(2010) and Gómez-Ramos (2013), among others, discuss the advantages of
water option contracts over spot water markets for the Spanish case.
Regarding insurance, while the Spanish crop insurance system is one of
the most developed worldwide (Antón & Kimura, 2011), insurance covering
water shortages is still under development. Several studies show the potential
of drought insurance for Spanish agriculture. Quiroga et al. (2011) highlight the
importance of reliable drought information to help farmers to avoid the
negative impacts of droughts and to develop effective hydrological risk
insurance schemes. Pérez-Blanco & Gómez (2012, 2013) focus on the potential
of drought insurance to reduce aquifers’ overexploitation during water scarcity
periods.
Average water productivity for irrigation in Spain vary among regions,
ranging from 0.3 to 3.4 €/m3 (Gil et al., 2009), due to the existence of wide
differences in climatic and soil conditions, and water supply costs. The price
that irrigators have to pay for water also differs widely, even within the same
basin (Garrido & Calatrava, 2009). But, in general, irrigation water price in
Spain is considerably low, covering only the operation and management costs
and a small share of investment costs. This heterogeneity in water productivity
and prices could lead to differences in farmers’ preferences for different water
supply risk management mechanisms, such as the ones proposed in this
chapter. In addition, this heterogeneity favors water exchanges between users
with different productivity levels, especially if they are in different basins.

5. COMPARISON OF DIFFERENT WATER SUPPLY RISK
MANAGEMENT TOOLS FOR IRRIGATORS
111
The theoretical framework presented in previous sections is applied to
irrigators in the Campo de Cartagena irrigation district in the Segura Basin
(Southeast Spain). This irrigation district (ID) is the largest in the basin, and one
of the largest in the country, with 41,065 hectares. Open-air intensive
horticulture is the predominant land use, covering 59% of the total district’s
irrigable area. The rest of the area is dedicated to citrus crops (30%),
greenhouses (7%) and fruit crops (4%).
Farmers in this ID have to deal with high variability and uncertainty of
their water supplies. However, the district has developed several adaptive
strategies to get water under water supply constraint situations (Martínez-
Álvarez et al., 2014). From its total annual water quota (141 hm3), 122 hm3
should come from the Tagus Basin through the Tagus-Segura inter-basin
Aqueduct; 4.2 hm3 from the Segura Basin, 2.2 hm3 from a desalination plant
and 13.2 hm3 from a wastewater treatment plant31. However, resources from
the Tagus-Segura are dependent on the hydrologic cycles in the area-of-origin,
the Upper Tagus Basin, and annual allotments rarely reach the 122 hm3 quota.
The initial database contains the annual water allotment data for this ID
(1979-2012). To use this database, some preliminary modifications were
required: first, the two first years of the database were removed, because
during those two years the Tagus-Segura Transfer was not working at full
capacity; second, the water volumes that come from the desalination plant
(since 2001), from the wastewater treatment plant (since 2008) and from the
spot market (2007-2010) were removed as well. The reason for doing this is that
those volumes were available for the ID only in some years of the period under
study. And third, the resulting water allotment data series for this irrigation
district was detrended, because runoff in upstream Tagus Basin has clearly
gone down (Lorenzo-Lacruz et al., 2010). After these recalculations were made, 31 http://www.crcc.es/informacion-general/informacion-c-r-c-c/

112
the water volume that this irrigation district currently receives from the
desalination plant (2.2 hm3) and from the wastewater treatment plant (13.2
hm3) were added to the annual water volume datum. At the end, we obtain a
detrended data series of the annual water allotment of this ID for the period
1981-2012, taking into account all the available water sources that irrigators in
this district have currently access to.
The probability distribution function (PDF) of the annual water
allotment for this ID was obtained (a gamma distribution function has been
fitted to these data; Chi2 = 1.375; p value = 0.927)32. From this PDF, we obtained
another PDF representing the mean water allotment per hectare, which is the
one used in our analysis (see Figure 13).
5.4.1. Willingness to pay for the different instruments
Knowing the water availability PDF ( ), and applying the theoretical
framework, we obtain the risk premium values for each instrument. By
changing the value of different parameters affecting the risk premium, we
derive some conclusions about the influence of these parameters on farmer’s
WTP for these risk management tools.
32 As the p-value approaches one, we have no basis to reject the hypothesis that the fitted distribution actually generated our data set (Source: @Risk Manual).

5. COMPARISON OF DIFFERENT WATER SUPPLY RISK
MANAGEMENT TOOLS FOR IRRIGATORS
113
Figure 13. PDF of farmer’s water availability (m3) per hectare in the Campo de
Cartagena irrigation district33.
Source: Own elaboration.
The water supply risk faced by a farmer is related to the coefficient of
variation (CV) of his water availability. With higher CV values, the farmer's
risk of not having enough water for irrigating his crops increases. Figure 14
shows farmer’s WTP (expressed in euro per ha) for the studied instruments
under different water availability CV values. The WTP is equivalent to the risk
premium for each instrument ( obtained in the theoretical models. The
maximum WTP for the option contract (a) is €123 per ha, but for the insurance
the maximum WTP is close to €142 per ha. The WTP for the insurance can vary
in approximately €140 per ha for the considered CV range.
33 The value of the gamma function’s coefficients are: α = 6.6292; λ = 0.003146.
0
1
2
3
4
5
60
500
1000
1500
2000
2500
3000
3500
4000
4500
5000
Val
ues i
n x
10^-
4
Water (m3 per ha)

114
Figure 14. Farmers’ willingness to pay for each instrument, by water
availability variation coefficient values34.
Source: Own elaboration.
Farmer’s risk preference is another factor that is going to affect the
farmer’s WTP for a given instrument. Figure 15 shows the WTP of farmers for
these tools, taking into account different risk aversion levels. The values of the
Arrow-Pratt absolute risk aversion coefficient have been obtained taking into
account farmer’s wealth in the area35, and the relative risk aversion values
normally applied to the agricultural sector. For the case study area, farmer’s
absolute risk aversion ranks from 0.00046 to 0.00185, being the relative risk
aversion 5-20. These high values of relative risk aversion are explained by the
definition of the farmer’s profit function, which only depends on his water
34 Parameters’ values for this figure: Absolute risk aversion=0.0012; marginal value of water, b = 0.7 €/m3; parameter affecting the probability of exercise the option (a), Z=0.95; guarantee level, w = 1406 m3 (probability γ =0.2); exercise price, = 0.12 €/m3. The chosen value for is the average marginal water value in the area according to Calatrava & Martínez-Granados (2012).
35 Wealth data obtained from the Spanish Farm Accountancy Data Network (RECAN), published by the Spanish Ministry of Agriculture, Food and Environment, MAGRAMA, http://www.magrama.gob.es/es/estadistica/temas/estadisticas-agrarias/economia/red-contable-recan/
0
20
40
60
80
100
120
140
160
15 20 25 30 35 40 45
Option contract (a) option contract (b) InsuranceCoefficient of Variation
WTP
(€/h
a)

5. COMPARISON OF DIFFERENT WATER SUPPLY RISK
MANAGEMENT TOOLS FOR IRRIGATORS
115
availability (a very realistic assumption in the area of study where water is the
limiting production factor and rain fed crop production is not profitable).
Similar values can be found in the literature (Kandel & Stambaugh, 1991;
Gómez-Limón et al., 2003).
Figure 15. Farmers’ willingness to pay for these instruments under different
risk aversion levels36
Source: Own elaboration.
For less risk-averse farmers, WTP for these instruments ranges from
€131 to €164 per ha (Figure 15). For higher risk aversion levels, the differences
among the WTP for these tools increase. As expected, farmer’s WTP for these
instruments increases with risk aversion, reaching €241 per ha for the
insurance, €208 for option contract (b) and €195 for option contract (a) when the
risk aversion level is the highest. The WTP for option contract (a) is lower than
for (b) because option contract (a) does not offer complete protection as there is
36 Parameters’ values for this figure: Marginal value of water, b = 0.7 €/m3; parameter affecting the probability of exercise the option (a), Z=0.95; guarantee level, w = 1808 m3 (probability γ =0.4); exercise price, = 0.12 €/m3.
0
50
100
150
200
250
300
0.0005 0.0006 0.0008 0.0010 0.0012 0.0014 0.0016 0.0019
Option contract (a) Option contract (b) InsuranceRisk aversion level
WTP
(€/h
a)
116
a probability of not being able to exercise the option due to the parameter Z
(see section 5.2.2).
Figure 16. Farmer’s willingness to pay (€/ha) for each instrument considering
different probabilities of exercising the option/getting the indemnity ( )37.
Absolute risk aversion level = 0.0005 and 0.001
r = 0.0005 r=0.001
Source: Own elaboration.
As expected, Figure 16 shows that the WTP for a risk management tool
increases with the probability of receiving the compensation. Since is the
probability of farmer’s water availability being lower than , a higher leads
to a higher guaranteed level. Note that WTP increases exponentially with and
has a positive second-derivative. The value of this kind of instruments depends
on the supply reliability they deliver. For a risk aversion level of 0.001, the WTP
for insurance decreases from nearly €650 when the probability of exercising the
option is 80% to €27 when this probability is only 10%. For a less risk-averse
farmer ( = 0.0005), the WTP for these instruments are lower than for the
previous case for all tools.
37 Parameters’ values for this figure: Absolute risk aversion level = 0.0004 and 0.001; marginal value of water, = 0.7 €/m3; parameter affecting the probability of exercise the option (a), =0.95; exercise price, = 0.12 €/m3.
0
1
2
3
4
5
6
7
0.80.70.60.50.40.30.20.1
Option contract (a) Option contract (b)Insurance
Probability (γ)
0
10
20
30
40
50
60
70
0.1 0.2 0.3 0.4 0.5 0.6 0.7 0.8
Option contract (a) Option contract (b)Insurance
Probability (γ)

5. COMPARISON OF DIFFERENT WATER SUPPLY RISK
MANAGEMENT TOOLS FOR IRRIGATORS
117
Figure 17. Farmer’s willingness to pay for each instrument considering different
exercise prices38
Source: Own elaboration.
Figure 17 shows the impact of a change in the option’s exercise price on
the farmer’s WTP for the option contracts. Obviously, the WTP for signing an
option contract decreases with its exercise price. For instance, the WTP for the
option contract (b) decreases from €222 to €168 per ha for the considered
exercise price range. When the price paid for the optioned water volume is
lower than the price of the regular water allotment ( < 0), the order of
preferences for these tools changes (see Figure 12). In this case, the farmer
would be willing to pay a higher premium for the option contract (b) than for
the insurance. It could be the case that the WTP for the option contract (a)
would be slightly higher than the WTP for the insurance when the exercise
price is excessively low.
38 Parameters’ values for this figure: Absolute risk aversion level=0.0012; marginal value of water, = 0.7 €/m3; parameter affecting the probability of exercise the option (a), =0.95; guarantee level, w = 1808 m3 (probability γ =0.4)
0
50
100
150
200
250
-0.08 -0.06 -0.04 -0.02 0 0.02 0.04 0.06 0.08 0.1 0.12 0.14
Option contract (a) Option contract (b) InsuranceExercise price (€/m3)

118
The previous results have been obtained under the assumption of
constant absolute risk aversion (CARA). However, farmers are usually less risk
averse when their wealth augments, exhibiting decreasing absolute risk
aversion (DARA). To check that our CARA assumption does not change the
farmer’s preferences for the proposed risk management tools in our case study,
we have compared the above presented results with those obtained assuming a
DARA utility function instead. We have used Monte Carlo simulation to obtain
the PDF of the farmer’s utility function for the different cases assuming both
CARA and DARA utility functions, because with DARA preferences and
asymmetric equation 5 does not have an analytic solution. Results show that
farmers’ ordered preferences for these instruments do not change from CARA
to DARA (proof available upon request).
5.4.2. Option contract and drought insurance prices
To calculate the price of the drought insurance for farmers in the Campo de
Cartagena irrigation district we have used equation (12). From the PDF of
farmer’s water availability in this district, and for different guarantee levels
( ), the expected compensation is calculated. This is the pure or basic
premium. All the costs that should be added to the basic premium to obtain the
final price of an insurance policy are clearly defined by the Spanish crop
insurance system: 9.24% of the basic premium for administrative costs, 5% for
legal reserves; 20.66% for commercial mark-up, and 5,60% for reinsurance costs
(Varela, 2008).
Our results show that the final price of the proposed insurance would be
from 70 €/ha to 377 €/ha for the considered range of guarantee levels (Figure
18). This price would be very close to the farmer’s WTP for the drought
insurance policy.

5. COMPARISON OF DIFFERENT WATER SUPPLY RISK
MANAGEMENT TOOLS FOR IRRIGATORS
119
Figure 18. Prices (€/ha) for option contract and drought insurance, and WTP
for these instruments for different guarantee levels (wg)39
Source: Own elaboration.
Figure 18 shows the tentative prices of a water option contract for two
different exercise prices. The price of the option contract has been calculated
applying the Black-Scholes-Merton formula (Eq.13). The final price of the
option is the sum of the option premium plus the exercise costs (exercise price
for each purchased cubic meter), transaction costs (nearly 1% based on
previous water trading experiences in the area) and a payment for
compensating third-party effects (near 5%, as applied in the option contracts
between the Metropolitan Water District of Southern California and several
Sacramento irrigation districts, reported by Hansen et al. (2013)). Although the
total cost of the option contract (premium + exercise costs) considering =-0.08
€/m3 is lower than the option with an exercise price of 0.12 €/m3 (Figure 18),
the premium of the former would be higher. This is because an option contract
with such a low exercise price would be more valuable for an irrigator. 39 Parameters’ values for the WTP curves: Absolute risk aversion level=0.001; marginal value of water, = 0.7 €/m3; parameter affecting the probability of exercise the option (a), =0.95.

120
A single price for the option contract is obtained, although two different
option contracts (a and b) are being considered. It would be expected that the
price of option contract (b) would be higher than option contract (a) because
the probability of being able to exercise the option is higher with option
contract (b). Some authors have argued that this formula tends to sub-estimate
option prices (Fleming et al., 2013). Thus, the actual prices of the proposed
option contracts might be higher than the ones reported here.
Although the price of the drought insurance would be higher than the
one for option contract, the final decision would depend on the potential for
increasing famer’s welfare. If the difference between the WTP for the insurance
and its price is higher than the different between the WTP for the option
contract and its final price, farmer would choose to contract the insurance
policy. As it can be seen in Figure 18, the difference between the WTP and the
price of the insurance is considerably lower than for the option contract.
However, as mentioned before, higher prices of the option contract could be
expected.
5.5. Discussion
The application of the theoretical framework to an irrigation district in Spain
allows us to rank the considered instruments under different situations. As it
can be seen from the results, the insurance policy is the most preferred
instrument. In this case, the received compensation could be used to overcome
the financial loss caused by the drought situation, or could be used to buy
water from another water source, including desalinized water. This risk
management tool has the advantage that farmers would gain in revenue
stability, transferring to the insurance market the risk of water shortage. One
disadvantage is that farm labor and both the processing and input supply
sectors would suffer the indirect consequences of reduced agricultural activity

5. COMPARISON OF DIFFERENT WATER SUPPLY RISK
MANAGEMENT TOOLS FOR IRRIGATORS
121
resulting from water shortages. However, in a real setting the cost of insurance
is greater than the cost of an option contract, as our results show.
Option contract (b) is the next most valued tool after the insurance. The
final decision to purchase one instrument or the other would be based on: (i)
the premium actually paid for each instrument (as previously explained in
section 5.3); (ii) the specific designing elements of the instrument (maturity
date, process to get the indemnity/optioned water, transaction costs); (iii)
farmer’s trust on the other agent involved in the contract (the water seller in the
case of the option contract, and the insurance company when he purchases the
insurance policy); and (iv), the exercise price of the option. If it is considerably
lower than the price that the farmer has to pay for his water allotment from the
regular supply source, the WTP for option contract (b) could increase and
become significantly higher than the WTP for the insurance (see Figure 17).
However, as mentioned before, there could be some cases where the
exercise price is lower than the normal water tariff ( ) paid by the buyer. In
these cases, the farmer’s ordered preferences for these risk management tools
change (see Figure 12). During the 2005-2008 drought period, the Spanish
Government permitted inter-basin market exchanges to alleviate the conditions
of the most affected river basins (Garrido et al., 2012b). It was materialized in
an agreement between the irrigation district Canal de Estremera (Tagus Basin)
and the SCRATS (Central Association of the Irrigators’ of the Tagus-Segura
Aqueduct, Sindicato Central de Regantes del Acueducto Tajo-Segura, Segura Basin).
The price paid by farmers in the Segura Basin was 0.18 €/m3 (they were
exempted from paying additional 0.12 €/m3, which is the Tagus-Segura
Transfer tariff). In fact, marginal value of irrigation water in the Tagus is lower
than the average price paid by water users in the Segura basin, so there is scope
for the latter water being cheaper than their usual sources of supply40. This
40 The authors are aware of agreements between water users in the Tagus (sellers) and Segura basins (buyers) to sell water at a price of 0.06 €/m3. If there is a drought period and they are exempt of paying the Aqueduct tariff, the final price of this water would be lower than the usual water price.

122
process resulted from a bilateral negotiation between farmers in the area-of-
origin (Tagus Basin) and farmers in the recipient basin (Segura Basin), and was
accepted by the Spanish Ministry of the Environment during three consecutive
years. It was beneficial for both parties, but downstream users in the Tagus
contested it (Garrido et al., 2012b). In October 2013, a memorandum41 of
understanding between the Ministry and the involved regional governments
was signed to reformulate the inter-basin managing tools, increasing the
prerequisites in the Tagus Basin to allow for exchanges, although leaving the
possibility of inter-basin market exchanges between parties. Considering the
differences of water productivity across regions (Garrido et al., 2010), market
exchanges would likely continue if the Ministry permits them again. The
potential transaction costs (transfer fees, environmental costs, etc.) would
determine the exercise price and whether the insurance policy would be more
attractive than an option contract or not.
Based on the current development of agricultural and drought insurance
(for rainfed crops, only), we would expect that the insurance premium would
not cost more than 20-30% more than our calculated risk premium for several
reasons. First, there is wide experience and expertise in the agro-insurance
sector in Spain, accumulated during 35 years (Antón & Kimura, 2011);
secondly, there is broad risk dispersion across 26 lines of crop insurance and 15
lines of livestock insurance, covering almost all insurable risks; and thirdly,
there are two independently executed projects looking at the implementation
details of this type of insurance that seem to suggest their feasibility (Pérez-
Blanco & Gómez, 2013; Ruiz et al., 2014).
Despite this, our results show that the insurance premium would be
higher than the total price of the option contract. In fact, many authors
highlight the need to subsidize insurance premium to make them affordable for
41 http://www.scrats.es/wp-content/uploads/2013/10/131014-ENMIENDAS-ATS-_TEXTO-DEFINITIVO_.pdf

5. COMPARISON OF DIFFERENT WATER SUPPLY RISK
MANAGEMENT TOOLS FOR IRRIGATORS
123
farmers (Bielza et al., 2008; Garrido & Zilberman, 2008; Pérez-Blanco & Gómez,
2013).
The farmer’s WTP obtained for the different water supply risk
management tools analyzed are consistent with those from previous studies in
this Spanish region (Tobarra, 2008; Rigby et al., 2010; Pérez-Blanco & Gómez,
2012). These authors evaluate the farmers’ willingness to pay for reducing
uncertainty with different water supply guarantee levels. It is thus difficult to
make a direct comparison among them, but they give us an idea of farmer’s
interest in these instruments in the region under study. Tobarra (2008) assessed
the farmers’ WTP for a reduction in their water supply uncertainty,
guaranteeing the average water allotment every year. According to his results,
for the Segura Basin (where the Campo de Cartagena irrigation district is
located), farmers’ mean WTP is €112-163 per hectare, but may reach
considerably higher values in the most productive areas of the basin, as it is the
case of the considered irrigation district in our study. Rigby et al. (2010)
claimed that farmers in this irrigation district are willing to pay a considerable
high premium to increase their water supply reliability. Their results show that
the average WTP of farmers for an increase of 25% in the certainty of getting
the average water supply is €330. Pérez-Blanco & Gómez (2012) obtained basic
risk premium values for specific crops in this area, expressed as a percentage of
the expected production value in a normal hydrological year. For citrus crops,
the WTP for a drought insurance is the highest in the district (3.66-9.13% of the
expected production), ranging from €199 to €234. It is important to note that
our proposed instruments have different objectives, as they are meant to
guarantee a minimum water volume in dry years.
Similar works have been carried out in other Spanish River basins,
highlighting the importance of water supply risk management tools for
Spanish agriculture. As an example, Mesa-Jurado et al. (2012) performed a
contingent valuation to assess farmers’ WTP for a guaranteed water supply
under scarcity conditions in the Guadalbullon river sub-basin (Guadalquivir

124
Basin, Spain). They obtained a mean WTP in irrigated olive farms of €42.5 and
€80.6 per ha, to ensure 2/3 of the average water application in 5 out of 10 years
or in 9 out of 10 years respectively. However, it must be taken into account that
farming in the Guadalquivir basin is less profitable than in the Segura Basin.
As Figure 18 shows, in general, that farmer’s WTP for these instruments
would be higher than their prices. Thus, a risk averse farmer would be
interested in purchasing these water supply risk management tools.
5.6. Conclusions
Water supply uncertainty is one of the main risks faced by irrigators. New and
innovative risk management tools can help them manage this important risk
factor, guaranteeing a minimum water volume each season to cover, at least,
their basic water needs, or else a financial compensation. We have analyzed
irrigators’ preferences and willingness to pay for different water supply risk
management tools, and the tentative prices of these instruments. In Spain, at
least, work is being done to develop this kind of instruments from a supply
perspective, and may be available commercially in short.
Our results show that farmer's decisions to use a water option contract
or a drought insurance policy depend on his risk aversion, profit function, risk
premium for each instrument and the administrative additional costs and fees,
and the trustworthy of the instrument.
Knowing the farmer’s WTP for the different risk management
instruments helps us understand the potential demand of these tools, and to
design the most appropriate mechanism for a certain region or agent. The
comparisons presented in this work can be applied to more general contexts,
giving values to the different parameters, providing the best option for a
farmer based on his risk preferences. We conclude that a menu of options

5. COMPARISON OF DIFFERENT WATER SUPPLY RISK
MANAGEMENT TOOLS FOR IRRIGATORS
125
might better fit the irrigated agricultural sector, especially if it regularly has to
cope with various uncertain water supply sources.
The potential of this type of mechanisms for the Spanish agriculture, and
some others similarly subject to water supply risks, is very high, as drought
episodes in this country are a recurrent phenomenon and may grows in the
future as a result of climate change. Differences in water productivity among
different water users facilitate the arrangement of this type of contracts
between them. Though in this study we are considering the case of a farmer as
a water option holder or as an insured agent, this same mechanism can be used
by cities as well, increasing cities’ water supply reliability during drought
periods; or by regional governments to enhance environmental flows. For the
implementation of these risk management tools in Spain, some legislative and
management changes are need.


6. OPTIMIZATION OF WATER PROCUREMENT
DECISIONS IN AN IRRIGATION DISTRICT
127
6. OPTIMIZATION OF WATER PROCUREMENT DECISIONS
IN AN IRRIGATION DISTRICT: THE ROLE OF OPTION
CONTRACTS
Abstract
Water supply instability is one of the main risks faced by irrigation districts.
The optimization of the water procurement decisions is essential to increase
supply reliability and reduce costs. The resource to temporary water markets,
such as spot purchases or water supply option contracts can provide flexibility
to this decision process. In this chapter, the potential interest of an option
contract for an irrigation district in Southeast Spain that has access to different
sources of water is analyzed. An stochastic recursive mathematical
programming model is applied to simulate the water procurement decisions of
a district in a context of water supply uncertainty and analyze the role that
different option contracts may play to secure its water supply. Results indicate
that the irrigation district would be willing to sign the proposed option contract
in most cases, under realistic values of the option contract economic conditions.
The contract’s premium and optioned volume are the variables that have a
greater impact on irrigation district’s decisions.
6.1. Introduction
Water supply uncertainty results from climatic variations that affect water
resources availability and reduce agricultural production. In water-scarce areas,
hydroclimatic uncertainty is also costly in terms of irrigation decisions
efficiency (Griffith et al., 2009). During low water availability periods, farmers
must cope with water shortages, but very often they must also take crop and
management decisions without knowing how much water they will have
available in the season (Calatrava & Garrido, 2005b; Iglesias et al., 2007).

128
Water supply reliability is an important attribute of a district’s service for
farmers. For example, Mesa-Jurado et al. (2012) found that farmers in South
Spain would be willing to increase by 10-20% their annual payment to the
irrigators’ community they belong to, as well as to accept a reduction of their
average water supply by 30% of their water concession, to increase water
supply guarantee. Irrigation districts’ boards in water-scarce areas do not only
aim to efficiently distribute water to their members, but also to manage the
water supply risks faced by them, for example, by trying to secure alternative
sources of water for dry periods.
A well-defined water planning strategy can help irrigators to reduce both
water delivery risks, and water procurement costs. Reducing these costs will be
even more essential in the coming decades as water tariffs are expected to
increase due to an increasing water scarcity (Rey et al., 2011).
According to Kidson et al. (2013), water supply reliability increases with
access to a pool of resources. Previous works have demonstrated that a water
planning portfolio that considers option contracts and/or spot purchases can
reduce costs and risks for an urban water supply agency (Jenkis and Lund,
2000; Gómez-Ramos & Garrido, 2004; Characklis et al., 2006; Kirsch et al., 2009),
for environmental purchases (Hollinshead & Lund, 2006), and for irrigation
districts (Calatrava & Garrido, 2005a).
Voluntary water exchanges among users reduce risk exposure (Easter et
al., 1998), providing flexibility and water supply reliability under hydrological
uncertainties (Calatrava & Garrido, 2005a, 2005b; Bjornlund, 2006; Cheng et al.,
2011). In Spain, agricultural water right holders have relied on water markets as
another source of water for scarcity situations. Here, although we consider
other strategic sources of water for dry periods, such as spot markets or
emergency wells, we focused on the role of water supply option contracts as an
alternative for irrigation districts.

6. OPTIMIZATION OF WATER PROCUREMENT
DECISIONS IN AN IRRIGATION DISTRICT
129
Water supply option contracts give the holder the right (not the
obligation) to buy or sell the underlying asset (Williamson et al., 2008; Cui &
Schreider, 2009; Cheng et al., 2011). They have a high risk-reduction potential in
comparison with spot purchases, lowering the supply and price uncertainty
risks for both buyers and sellers of water (Howitt, 1998; Brown & Carriquiry,
2007; Ranjan, 2010). Besides, the option contract allows the holder to delay
water purchase decisions until more information is available (Characklis et al.,
2006; Kaspzryk et al., 2009) and offers protection against spot prices volatility
(Hollinshead & Lund, 2006). Although water option contracts do not currently
exist in Spain, they have been previously evaluated for urban supply by
Gómez-Ramos & Garrido (2004) and Cubillo (2010), among others.
The aim of this work is to analyze the potential of an option contract to
secure water supply for an irrigation district (ID) that has access to different
sources of water but is subject to a high degree of uncertainty. An original
stochastic recursive mathematical programming model that determines the
optimal water procurement program of an ID in a context of water supply
uncertainty is presented. The analysis is focused on the decisions regarding the
signing and exercising of the option contract, which interacts with other supply
alternatives. The model is applied to a large ID in Southeast Spain.
The chapter is organized as follows: in section 6.2, the case study is
presented. Section 6.3 contains a description of the proposed option contract. In
section 6.4 all the specifications of the developed optimization model are
presented. Section 6.5 contains the model results. In section 6.6 the main
conclusions derived from this work are given.
6.2. Case study and data collection: The Lorca irrigation district
The optimization model is applied to the Lorca ID in the Segura Basin
(southeastern Spain, see Figure 19), one of the most water-stressed basins in
Europe (EEA, 2009; Maestre-Valero et al., 2013). This ID is located in the

130
Guadalentín River Valley, a major tributary of the Segura River. It comprises an
area of 12,116 hectares, and has 8,300 farmers, most of them with a relatively
small farm size. It stands as one of the largest and most productive IDs in Spain.
Farmers grow primarily high-valued horticultural crops, like lettuce, artichoke
and broccoli.
Figure 19. Location of the Lorca irrigation district
Source: own elaboration.
Traditionally, irrigation in the Lorca area was supplied with scarce and
highly variable surface resources. Water allocations to farmers were based on
auctions. With the massive development of groundwater use and the Tagus-
Segura Transfer (TST), the irrigated area enlarged, new distribution
infrastructures were built and water allocation changed to use the proportional
rule. The TST serves a large share of the district’s water supply but is subject to
a high degree of inter-annual variability, whereas groundwater resources are
increasingly scarce, what has driven the district’s management board to search
for additional sources to secure water supply for farmers.
Currently, the Lorca ID has access to a range of nine different water
sources, including an inter-basin spot market that only functions during
drought periods (Table 18). The portfolio of delivery sources has been widening
as new water supply sources became operational. The most recent ones are

6. OPTIMIZATION OF WATER PROCUREMENT
DECISIONS IN AN IRRIGATION DISTRICT
131
desalinized water, intermittent use of groundwater (the so-called ‘drought
wells42’), treated wastewater, and spot inter-basin water purchases from the
Tagus Basin.
For the characterization of water availability we rely upon data provided
by the district’s management office. The initial database contains the annual
ID’s water availability from each water source for the period 1994-2012. In this
period, two different drought episodes are included (1994-1995, 2005-2008). Our
water sources database has been processed to build data series that represent
the current situation on water availability for the district (Table 18).
Surface water resources come from three different sources: (a) a
concession of 14 hm3/year from the Puentes reservoir; (b) a concession of 29.06
hm3/year from the TST; and (c) a concession of 4.2 hm3/year from the Segura
River Regulation System. The original data consists of a series of annual water
availability from each source that have been detrended, when needed, to obtain
stationary series. These three series exhibited a significant (p<0.05) downward
trend. In practice, average values of water availability from each source are
quite below the amount of water set in the concession (8, 18.25 and 1.58
hm3/year, respectively; see Table 18).
42 Each basin in Spain has a Drought Management Plan, which determines all the actions aimed at reducing the impacts of the drought period (Estrela and Vargas, 2012). One of the proposed means to fight drought consequences are drought wells: wells owned and managed by the RBA and that can be used during drought periods in order to meet water users’ most urgent needs (e.g. emergency water applications to tree crops).

132
Table 18. Current water supply sources for the Lorca irrigation district
Water source Characterization
of water availability
Water available to the
district (hm3/year)
Water effectively used by the district
(hm3/year)
Volume set in the
concession Min. Average Max. Average Max.
Puentes Reservoir Variable 14 3.68 6.42 9.34 6.42 9.34
Tagus-Segura
Transfer Variable 29.06 1.31 18.25 36.85 18.25 36.85
Segura Basin regulation
system Variable 4.20 0.73 2.20 5.19 2.20 5.19
District’s own wells
Freely available up to a
maximum value 10,4 - - 10,4
(3†) 3‡ 4.4‡
Wastewater treatment
plant
Freely available up to a
maximum value 2.5 0.622 2.15 2.3 2.15 2.3
Aguilas desalination
plant
Freely available up to a
maximum value 8 8 8 8 0§ 0§
Purchase from private
wells
Freely available up to a
maximum value - - - 8.2 7.4† 8.2
Segura River Basin
Authority’s “drought
wells”
Only available in drought
periods upon authorization
- - 1.17 1.17 1.17 1.17
Inter-basin spot
purchases
Only available in drought
periods upon authorization
- - 2.034 2.034 2.034 2.034
†According to the district, maximum availability has declined over the last 20 years and currently is 3
hm3/year; ‡ In the past 10 years; § No historical water use record exists because these resources are
available since 2013.
Source: own elaboration based on the information provided by the ID.
Groundwater resources offer an important source of water for this ID,
which are jointly used with surface resources. The data for groundwater

6. OPTIMIZATION OF WATER PROCUREMENT
DECISIONS IN AN IRRIGATION DISTRICT
133
consists of a series of annual extractions from each source. The original series
have also been detrended to obtain stationary series of groundwater availability
(all are significantly downward, p<0.05). Pumped volume increases in dry years
and is reduced with more surface water availability. For that reason, we have
not characterized groundwater availability as stochastic but have considered
instead the maximum value as the maximum amount of water that the ID can
currently use from each source, according to district’s own availability
estimates.
Regarding non-conventional resources, the Lorca ID has a concession of
2.5 hm3/year from the local wastewater treatment plant and, since 2013,
another concession of 8 hm3/year of desalinized water from the coastal Aguilas
plant.
In addition, during drought periods, this ID has access to other relatively
minor sources of water. First, the Segura RBA has developed a ‘Strategic Set of
Drought Wells’ that is only used in scarcity situations to guarantee supply to
small municipalities and provide some water for irrigated areas. The Lorca ID
has received an average of 1.17 hm3/year, with small variations, during the last
drought period (2005-2008). Secondly, legislative changes during those years
allowed for inter-basin water exchanges in drought periods through the water
market (Garrido et al., 2012b). The Lorca ID participated, together with the
other agricultural water users of the TST, in an inter-basin program to purchase
water from water users in the Tagus Basin that was annually renewed during
the four years of the aforementioned drought period. The Lorca district
obtained 2.034 hm3 in each of the four years of this agreement. Based on the
redefinition of the statute of the operating rules of the TST43 in 2013, option and
spot contracts across basins can be approved. We assume in our model that 43 One of the aims of the Memorandum of Understanding on the Tagus-Segura Transfer (2013), apart from modifying the Tagus-Segura Transfer management rules, is to provide flexibility and efficiency to the exchanges of water rights using the infrastructures of the Tagus-Segura Aqueduct. Available in Spanish at: http://www.scrats.es/wp-content/uploads/2013/10/131014-ENMIENDAS-ATS-_TEXTO-DEFINITIVO_.pdf

134
these two sources – drought wells and inter-basin spot purchases – are available
to the district when water availability from the TST is below a certain threshold.
To characterize water supply uncertainty, we use the above description
of water availability for each source and consider each of the 19 years, spanning
1994-2012, as a single state of the nature with equal probability of occurrence.
The black line (Figure 20, right axis) shows total water availability under each
state of nature. This ID is exposed to a high variability of available water. The
minimum annual water availability is 31 hm3, being 73 hm3 the maximum. Bars
represent the percentage of each water source in the total water volume in each
scenario. Note that TST is the main water source in 14 out of the 19 considered
states of nature, in which it ranges from 29 to 53%, but it is also the major source
of variability. With reduced deliveries from the TST, the ID would rely more on
desalinized water and purchases from private wells.
Figure 20. Characterization of Lorca irrigation district’s current water
availability from each source (hm3) under each possible state of the nature
Source: Own elaboration.
Facing this set of possible scenarios (hydrological years), the ID
managers will have to decide how much water to use and from which sources,
0
10
20
30
40
50
60
70
80
0
10
20
30
40
50
60
70
80
90
100
1994
1995
1996
1997
1998
1999
2000
2001
2002
2003
2004
2005
2006
2007
2008
2009
2010
2011
2012
Spot market
Wastewater
Desalination plant
Drought wells
Segura Basin
Tagus-Segura TransferPrivate wells
Own wells
Reservoir
Total water
% Total water (hm3) (right axis)

6. OPTIMIZATION OF WATER PROCUREMENT
DECISIONS IN AN IRRIGATION DISTRICT
135
taking into account the available water from stochastic sources and the price of
the different water sources (shown in Table 19), and whether to sign or not
water supply option contract with different characteristics.
Table 19 reports the current water prices for each water source. These
prices are quite stable over time. Desalination is, by far, the most expensive
water source in the pool. Thus, the ID only uses desalinized water when other
sources are unavailable. If the objective of the ID was to minimize water
procurement costs, the strategy would be to purchase water from the cheapest
to the most expensive water until the ID water needs are fulfilled. However,
cost must be pondered against reliability.
Table 19. Current water prices for each water source paid by the irrigation
district (€/m3; distribution costs not included)
Water source €/m3
Puentes Reservoir 0.100
Tagus-Segura Transfer 0.127
Segura Basin regulation system 0.100
District’s own wells 0.140
Purchase from private wells 0.253
Wastewater treatment plant 0.100
Aguilas desalination plant 0.450
Segura River Basin Authority’s “drought wells” 0.270
Inter-basin spot purchases from the Tagus 0.205
Source: own elaboration based on the information provided by the ID.
6.3. Proposed water option contract
Several examples of water supply option contracts schemes can be found in the
literature, with different features and conditions. Jenkins & Lund (2000) studied
the potential of dry year option contracts, in combination with other water
supply reliability strategies, for an urban water supplier to acquire water

136
during periods of water deficit. Kirsch et al. (2009) worked on the optimization
of long-term (10 years) water supply portfolios, evaluating multiyear option
contracts which provide the option holder with year-to-year flexibility, while
still providing the long-term contractual security avoiding the cost and
inconvenience of annual renegotiation. Gómez-Ramos & Garrido (2004)
evaluated 18 different 4-years option contracts, with different delivered
volumes and triggering conditions, between an urban supply agency and an ID
in Spain. In our work, the proposed option contract aims at reducing the risk
faced by an ID in terms of water availability.
The proposed option contract is intended to provide another flexible
source of water to reduce ID’s supply risk. With the option contract, the ID
(buyer) could have access to the optioned volume at the maturity date paying
the agreed exercise price to the seller. As defined in this study, the option
holder could acquire all or part of the optioned volume at the maturity date. For
having the right to purchase the optioned volume, the ID would have to pay the
seller an annual premium.
The option contract involves two steps: in the first one, based on the ID’s
risk preferences and level of water supply reliability, the ID would have to
decide whether to sign the option contract to protect against the water supply
uncertainty it is exposed to, assuming there is an interested counterpart. If
signed, the ID would have access to the optioned volume if needed, in exchange
for paying a premium for having this right. In the second step, once supply
uncertainty has disappeared and if the trigger condition of the option contract
is met, the ID would have to decide whether to exercise the previously signed
option. The second-stage decision would be mainly determined by the water
volume that the ID is going to receive from the other water sources and the
price of alternative water sources.
Most examples of optioning water rights are subject to a condition or
trigger. The trigger is an external condition that should be met to exercise the

6. OPTIMIZATION OF WATER PROCUREMENT
DECISIONS IN AN IRRIGATION DISTRICT
137
option. In this particular case, the trigger is related to the water volume that the
ID receives from the Tagus Basin through the TST. When the volume is below
the set threshold, the ID could exercise the option if needed and acquire the
optioned volume. The reason to choose this trigger is that the TST is the main
water source for this ID (as shown in Figure 20), so it is a good indicator of the
ID potential water availability in a given year. The rationale of using a trigger,
that enables the holder of a call option to exercise the option when there is less
water available, is to ensure that the other party of the contract uses the water
in normal or abundant conditions (Gómez-Ramos & Garrido, 2004; Hafi et al.,
2005; Leroux & Crase, 2007). It thus works as a risk-transfer mechanism
amongst two water users with different supply reliability needs or risk aversion
levels.
6.4. Optimization model
To analyze the water procurement decisions of the Lorca ID, an optimization
model has been formulated. The objective of the optimization model is to
minimize the water procurement costs for the ID that meets the water
requirements for irrigators, taking into account each water source availability
and price. The model provides the optimal water acquisition strategy, including
the possible signing of an option contract.
It is a two-stage recursive stochastic model. In the first stage, when
uncertainty related to water availability exists, the ID has to decide whether to
sign the option contract or not. In the second stage, when the available volumes
from each source are known, the model finds the optimal water sourcing
strategy, including the decision of whether to exercise or not the option (if
contracted in the first stage and if the trigger condition holds) and acquires the
optioned volume.
In order to assess the benefits derived from the existence of the option
contract in the water source pool, we have also considered the case when the

138
option contract for water is not available. This is the “baseline scenario” to
compare the costs and the water reliability with and without an option contract
in the water sources pool.
6.4.1. First-stage stochastic decision model
The decision variables are: Q, whether to sign the option contract; and , , how
much water to get from each water source. The first-stage decision is modeled
as follows:
∑ ∑ , , (1)
subject to:
Water needs (the target amount of water that the district has to obtain).
∑ ∑ , (2)
Water use constraint (the ID cannot use more water than it is available).
, , (3)
Water use constraint for the option contract (for the option holder to
obtain the optioned water volume, a pre-established condition (trigger) should
be met).
, , ,
, 0 , (4)
Non-negativity constraint:
, 0 (5)
C is the total water procurement cost for the irrigation district (€ million).
The decision variables are:

6. OPTIMIZATION OF WATER PROCUREMENT
DECISIONS IN AN IRRIGATION DISTRICT
139
Wi,k : Used water by the irrigation district from each water source in each
state of nature (hm3).
Q: Decision variable. Binary variable that takes the value 0 when the
irrigation district decides not to sign the option contract, 1 otherwise.
With:
i (1,...,10): Water source (reservoir, Tagus-Segura Transfer, Segura Basin,
own wells, private wells, wastewater treatment plant, desalination plant,
drought wells, inter-basin spot purchases, option contract). The subscript
“opt” refers to the option contract; “TST” refers to the water volume that
comes from the Tagus-Segura Transfer.
k (1,…,19): States of nature. Each year of the database (1994-2012) is
considered a state of nature44. k=1 is the state of nature with the lowest
water availability, and k=19 the one with the highest water availability
for this ID.
And the parameters are:
Pi : Cost of each water source (€/m3).
OP: Option contract premium (€/m3).
Ai,k : Maximum water availability for each water source in each state of
nature (hm3).
Probk: Probability of each state of nature. All states of natures have the
same probability of occurrence (1/19).
N: Irrigation district’s water needs (hm3).
T: Trigger of the option contract (hm3).
44 Years from the original database (1994-2012) have been reordered based on the water availability: k1 (2006); k2 (2007); k3 (1995); k4 (2008); k5 (1994); k6 (1996); k7 (2005); k8 (2009); k9 (2010); k10 (2000); k11 (2002); k12 (2003); k13 (1997); k14 (2012); k15 (2004); k16 (2011); k17 (2001); k18 (1999); k19 (1998).

140
6.4.2. Second-stage deterministic decision model
Based on the decision of the first stage (whether to sign the option contract), the
second-stage model defines the optimal water procurement decisions for each
state of nature, k. At this step, decisions are made without water availability
uncertainty.
The decision variable Q of the first model is now introduced in this
second-stage model as a parameter (R=Q). The objective function is:
∑ ∑ , , (6)
being , the water volume obtained from each water source for each state of
nature.
Subject to:
, , (7)
∑ , (8)
, , ,
, 0 , (9)
, 0 (10)
6.4.3. Baseline model (without the option contract)
If we do not consider the option contract, the decisions are taken in a single
step, and for each state of nature. There is no uncertainty related to water
availability from each water source.
∑ ∑ , (11)
s.t:
6. OPTIMIZATION OF WATER PROCUREMENT
DECISIONS IN AN IRRIGATION DISTRICT
141
, , (12)
∑ , (13)
, 0 (14)
, is the obtained water volume from each water source in each state
of nature k.
The optimal solution has been obtained using GAMS (General Algebraic
Modeling System).
6.4.4. Parameterization of the option contract
A wide range of option contract parameters (premium, exercise price, optioned
volume and trigger) has been used to assess the conditions that make the option
contract an attractive supply source for the district (Table 20).
The central values of the range of parameters have been obtained from
records of previous trading experiences that involved irrigators in the Segura
Basin (Garrido et al., 2012b). We have tried to consider a realistic set of values
for the parameters, taking in to account that there are no previous water supply
option contract experiences45. For example, water prices in the formal leases
contracts that have taken place in the Segura Basin are on the range 0,03 to 0,30
€/m3, whereas prices in inter-basin trading during the last drought period was
0,21 €/m3. In total, we will examine 375 cases, resulting from the combination of
five exercise price levels, five premium levels, five contracted volumes and
three triggers (Table 20).
45 In the Spanish water market, option contracts are not a common type of exchange but there has been one experience of a multi-annual contract between water users in the Tagus and the Segura Basin during that drought period that resembles an option contract: Canal de Estremera ID (Tagus Basin) and SCRATS (Central Association of the Irrigators’ of the Tagus-Segura Aqueduct, Sindicato Central de Regantes del Acueducto Tajo-Segura, Segura Basin) signed a water trading contract for 31.05 million m3/year that was annually renewed during four years. The average price was 0.21 €/m3.

142
Table 20. Parameterization of the option contract conditions (number of cases
5x5x5x3=375)
Popt (€/m3) OP (€/m3) Aopt,k (hm3) T (hm3) 0.06 0.02 3 10 0.12 0.04 6 15 0.18 0.06 9 20 0.24 0.08 12 0.30 0.10 15
Popt: exercise price; OP: premium, Aopt,k : optioned volume, T : trigger.
Source: own elaboration.
The parameterization of the option contract conditions allows us to
obtain the optimal water procurement decisions of this ID in each case. As the
objective of the model is to obtain the needed water volume at the minimum
costs, these parameterizations are going to affect the total costs of the option
contract, and so, the ID’s water procurement decisions.
Figure 21 compares the option contract total price (in €/m3, the premium
plus the exercise price) with the rest of water sources prices. The range of
option contract’s parameters covers all the spectrum of water prices from other
sources. Desalinized water is always the most expensive water source, even
with the highest values of the premium and exercise price of the option
contract. Thus, the ID would always prefer the option contract rather than the
water that comes from the desalination plant. However, when the option
contract cannot be exercised because the trigger condition is not met, or when
more water is needed to meet ID water needs, desalinized water would be used.

6. OPTIMIZATION OF WATER PROCUREMENT
DECISIONS IN AN IRRIGATION DISTRICT
143
Figure 21. Water prices for the different water sources. For the option contract,
all the parameterizations (€/m3) of the premium (OP) and the exercise price (P)
are taken into account
Water resources from the wastewater treatment plant, Puentes reservoir and Segura Basin have the same
price: 0.1 €/m3. Dashed lines represent water sources that are only available during drought periods
(drought wells and inter-basin spot purchases).
Source: own elaboration.
Figure 21 shows that the cost-effectiveness of the option contract with
respect to other sources is totally dependent on its economic parameters, and
that of course depend on the willingness to engage in such agreement of the
counterpart.
6.5. Results
The analysis is focused on the decisions related to the option contract: whether
the ID would sign the option contract in the first stage, whether the ID would
exercise the option (if previously contracted), and the circumstances that
determine both decisions.
00.05
0.10.15
0.20.25
0.30.35
0.40.45
0.5
0.02 0.04 0.06 0.08 0.1 0.02 0.04 0.06 0.08 0.1 0.02 0.04 0.06 0.08 0.1 0.02 0.04 0.06 0.08 0.1 0.02 0.04 0.06 0.08 0.1
0.06 0.06 0.06 0.06 0.06 0.12 0.12 0.12 0.12 0.12 0.18 0.18 0.18 0.18 0.18 0.24 0.24 0.24 0.24 0.24 0.3 0.3 0.3 0.3 0.3
Option contract Puentes ReservoirTagus-Segura Transfer Segura BasinDistrict’s own wells Purchase from private wellsWastewater treatment plant Desalination plantDrought wells Spot purchases
€/m3
OP
P

144
6.5.1. First-stage decision results
In this stage, the ID has to make a decision about whether to sign the option
contract (Q in the model). Depending on the values of the option contract’s
parameters, the ID would consider it an attractive option or not. The district
will consider the probability of not meeting its target supply with its water
sources and will weigh the cost of purchasing the option against the relative
cost of the alternative water sources. Our results show that the ID would sign
the option contract (Q=1) in 48.3% of the considered cases, taking into account
all the parameterizations (see Figure 23).
Table 21 disaggregates the distribution of the optimal Q in all 375
possible cases, depending on the value of the option contract’s parameters. The
premium and the optioned volume are the parameters that are going to affect
most the decision of signing the option contract by the ID. For high premium
and optioned volume values, the ID would not sign the option contract. That is
because the overall costs of the contract would be higher than other available
alternatives. We can also see that there is a trade-off between the optioned
volume and the contract’s annual premium. Greater optioned volumes require
lower annual premiums for the district to enter the option contract.

6. OPTIMIZATION OF WATER PROCUREMENT
DECISIONS IN AN IRRIGATION DISTRICT
145
Table 21. Decision of signing the option contract, depending on the parameters’ values
Optioned volume (Aopt,k) (hm3) 3 6 9 12 15
Trigger (T) (hm3)
Trigger (T) (hm3)
Trigger (T) (hm3)
Trigger (T) (hm3)
Trigger (T) (hm3)
Price (Popt)
(€/m3) 20 15 10 20 15 10 20 15 10 20 15 10 20 15 10
Prem
ium
(OP)
(€/m
3 )
0.02
0.06
0.12
0.18
0.24
0.3
0.04
0.06
0.12
0.18
0.24
0.3
0.06
0.06
0.12
0.18
0.24
0.3
0.08
0.06
0.12
0.18
0.24
0.3
0.1
0.06
0.12
0.18
0.24
0.3
Grey: the ID would sign the option contract (Q = 1)
White: the ID would not sign the option contract (Q = 0)
Source: Own elaboration.

146
The decision of signing the option contract is analyzed through a logistic
regression, using all the 375 parameterizations. The results of this regression
(Table 22) show the influence of each parameter of the option (price, premium,
optioned volume and trigger) on the decision to sign the option contract (binary
variable; 0,1).
Table 22. Logistic regression results for the contract decision ( )
Explanatory variable Coef. Std. Err.
z P > |z| Marginal effects†
Popt -4.234 3.028 -1.40 0.162 -1.02
Aopt,k -1.682 0.344 -4.89 0.000 -0.40
OP -278.430 53.028 -5.25 0.000 -66.76
T 0.168 0.065 2.58 0.010 0.040
Intercept 29.678 6.192 4.79 0.000
Observations 375
Pseudo R2 0.81
% of corrected classified 93.60
% of “0” correctly predicted 94.85
% of “1” correctly predicted 92.27
†The marginal effect of each variable has been calculated holding all other
variables in the model at their means.
Popt: exercise price; OP: premium, Aopt,k : optioned volume, T : trigger.
Source: Own elaboration.
The results of the regression show that all variables, except for exercise
price (associated p-value = 0.162), are statistically significant. The premium (OP;
€/m3) and the option volume (Aopt,k hm3/year) determine the costs of signing
the option contract. This explains the negative value of their coefficients. For
higher optioned volumes or premium values, such cost increases and the ID’s
interest in the contract would decline. On the contrary, a greater trigger
increases the probability of signing the contract, increasing its appeal to the
district’s managers.

6. OPTIMIZATION OF WATER PROCUREMENT
DECISIONS IN AN IRRIGATION DISTRICT
147
The marginal effects show the impact that a change in each variable has
on the probability of signing the option contract, measured at the mean values
of the explanatory variables. For example, if the trigger increases from 15
hm3/year to 16 hm3/year, ceteris paribus, the probability of purchasing the
option contract increases by 4%.
From this logistic regression, we obtain the average probability of
signing the option contract depending on the parameters’ values. As seen in
Figure 22 and Table 22, the exercise price of the option is not going to have a
significant impact on the probability of signing the contract. Indeed it is the
premium that has a considerable effect on the average probability of signing it.
For a premium of 0.02 €/m3, the probability is close to 90% descending to less
than 10% when the premium is 0.1 €/m3. For the highest premium (0.1 €/m3)
and the highest optioned volume (15 hm3), the ID would never sign the option
contract because of the high fixed costs associated with doing so. Obviously, if
the ID has other alternative and cheaper water sources, an option contract with
that premium is not going to be attractive. We arrive to similar conclusions
regarding the optioned value.

148
Figure 22. Average probability of signing the option contract for each
parameter’s value
Source: Own elaboration.
6.5.2. Second-stage decision results
In this stage, the decision is taken in the absence of uncertainty. The ID has to
decide whether to exercise the option or not, depending on the available water
volume from other sources, that is determined by the state of nature, , and
contingent on the trigger condition being met.
Our results show that, if the ID signed the option contract in the first
stage, and if the trigger condition holds, the ID would always exercise the
option contract in the second stage (see Figure 23). When the trigger is met and
the ID exercises the option, the optioned volume is purchase in full in 99.46% of
the cases. The probabilities of meeting each of the considered triggers (i.e., the
probability of being able to exercise the option) are: nine out of 19 states of
nature for the 20 hm3 trigger; seven out of 19 for the 15 hm3 trigger; and five out

6. OPTIMIZATION OF WATER PROCUREMENT
DECISIONS IN AN IRRIGATION DISTRICT
149
of 19 for the 10 hm3 trigger. For states of the nature with high water availability
(k > 9), none of these triggers is met because the water volume received from
the TST is higher than 20 hm3, and as a consequence the ID could not exercise
the option.
Figure 23. Option contract decision tree (all the values of the parameters are
taking into account to calculate the probabilities of each step)
Whether the trigger is met is not a decision of the ID, but a condition imposed by the option
contract itself.
Source: Own elaboration.

150
To compare the ID’s total water availability and costs, Table 23 reports
the main statistics of the total costs and total water volume with and without
the option contract.
If the proposed option contract is added to the Lorca ID's water sources
pool, average annual water availability is slightly increased due to the access to
the optioned volumes. However, the major advantage of the option contract is
its risk-reduction effect, as it reduces the variation coefficient of water
availability and the probabilities of the left tails of the water availability
probability distribution. Although the average effect is small, the impact is quite
significant in scarcity situations. As seen in Table 23, water volumes for both the
5 and 25 percentile are higher with the option contract (see also Figure 24) than
without it. However, signing the option contract in the first stage, and
exercising the option in the second stage entail costs to the ID, slightly
increasing the total water procurement costs (on average by 0.01 €/m3).
Table 23. Comparison of water procurement costs and total water volume for
the Lorca irrigation district, with and without the option contract (average
values for all possible states of nature)
Statistics
With option contract (n=181) Without option contract (n=194)
Total volume (hm3)
Total costs
(mill €)
Average
Cost
(€/m3)
Total volume (hm3)
Total costs
(mill €)
Average
costs
(€/m3)
Mean 46.51 8.46 0.19 45.47 8.22 0.18
Std. deviation 5.13 1.14 0.04 6.04 1.00 0.04
Variation coefficient 0.11 0.14 0.19 0.13 0.12 0.20
Percentile 5% 36.57 6.26 0.13 31.20 5.90 0.12
Percentile 25% 43.59 7.60 0.15 41.45 7.39 0.15
Minimum 31.20 5.86 0.12 31.20 5.90 0.12
Maximum 50.00 12.54 0.27 50.00 9.51 0.25
Source: Own elaboration.

6. OPTIMIZATION OF WATER PROCUREMENT
DECISIONS IN AN IRRIGATION DISTRICT
151
Figure 24 shows the cumulative probability distribution of the water use
and unitary water cost for two specific option contracts and the baseline
scenario. The upper part of Figure 24 shows that water availability without the
option contract (“c”) is always lower than with option contract (curves “a” and
“b”). If there is no option contract among the available water sources (scenario
“c”), the probability of meeting the ID's water demand (50 hm3) is lower than
with the option (52% without contract, and 57 and 63% for cases “a” and “b”,
respectively). Between the two scenarios with option contract (“a” and “b”),
scenario “b” allows the ID to get more water from the option contract, but for
this water volume the total costs would be higher. Regarding the costs per m3,
the scenario ‘b’ is the one that entails higher costs for the ID. Scenario ‘a’ would
be the one with lowest costs per m3 among the three presented scenarios.
Figure 24. Cumulative ascending probability distribution of total water volume
(hm3) and costs (€/m3) in the irrigation district for three scenarios (a and b, with
option contract; c without option contract)
0%
20%
40%
60%
80%
100%
32 34 36 38 40 42 44 46 48 50
Cum
ulat
ive
Prob
abili
ty(%
)
Total water volume (hm3)

152
a: premium= 0.02 €/m3 and optioned volume =3 hm3; b: premium = 0.06 €/m3 and
optioned volume = 6 hm3; c: without contract.
Source: Own elaboration.
A relevant issue is the amount of water volume that the ID is going to
purchase from each water source. Specifically, we focus on which water sources
act as substitute of the other, i.e., whether the water option contract is used
instead of other water source, and vice versa (see Figure 25).
0%
20%
40%
60%
80%
100%
0.12 0.14 0.16 0.18 0.2 0.22 0.24 higher…
a b c
Cum
ulat
ive
Prob
abili
ty(%
)
costs (€/m3)

6. OPTIMIZATION OF WATER PROCUREMENT
DECISIONS IN AN IRRIGATION DISTRICT
153
Figure 25. Water volumes from different sources, for each parameterization of
the option contract (only those cases when the option is signed are shown in the
graph). Volumes represent the mean of the purchased volumes in the 19 states
of nature (X axis, unitary costs of the option contract (€/m3) and optioned
volume below (hm3))
0
1
2
3
4
5
6
7
8
0.08
0.08
0.08 0.1
0.12
0.14
0.14
0.14
0.16
0.16
0.18 0.2
0.2
0.2
0.22
0.24
0.26
0.26
0.26
0.28
0.28 0.3
0.32
0.32
0.32
0.34
0.36
0.38
3 6 9 1215 3 6 9 3 6 3 6 9 1215 3 3 6 9 3 6 3 6 9 1215 3 3 6 9 3 6 3 6 9 3 1215 3 6 9 3 6 3 6 9 3 1215 3 6 9 3 6 3
Trigger = 10
option contract private wells drought wells desalination plant
hm3
0
1
2
3
4
5
6
7
8
0.08
0.08
0.08 0.
10.
10.
120.
140.
140.
140.
160.
160.
18 0.2
0.2
0.2
0.22
0.22
0.24
0.26
0.26
0.26
0.28
0.28 0.
30.
320.
320.
320.
340.
340.
360.
38
3 6 912153 6 9123 9 3 6 912153 3 6 6 9123 9 3 6 912153 3 6 6 9 3 9 3 6 9 312153 6 9 6 3 9 3 6 9 312153 6 6 9 3 9 3 6
Trigger = 15
option contract private wells drought wells desalination plant
hm3

154
Source: Own elaboration.
Figure 25 shows that the desalinized water and the option contract are
acting like substitutes between them. As the volume of water established in the
option contract increases, the average volume of desalinized water purchased is
reduced and substituted by water from the option seller. Average water
volumes obtained from groundwater sources (private wells and drought wells)
are also reduced when the ID has access to the greatest optioned volume. As
Figure 21 shows, these groundwater resources are the most expensive ones after
the desalinized water. However, that reduction only occurs for total option
prices smaller than 0.27 €/m3 (the price of water from emergency drought
wells). Table A2.1 (Appendix 2), more detailed results of the water volume
obtained from different sources for several states of nature are shown. When
the optioned volume is not available (because the trigger is not met, or because
it was not signed in the first stage), the ID would purchase the maximum
volume to the desalination plant (8 hm3) (not shown in Figure 25).
0
1
2
3
4
5
6
7
80.
080.
080.
08 0.1
0.1
0.12
0.14
0.14
0.14
0.16
0.16
0.16
0.18 0.
20.
20.
20.
220.
220.
240.
260.
260.
260.
280.
28 0.3
0.32
0.32
0.32
0.34
0.34
0.36
0.38
3 6 912153 6 912153 6 3 6 912153 3 3 6 9123 6 3 6 912153 3 3 6 9123 6 3 3 6 912153 6 9 3 3 6 3 3 6 912153 3 6 9 3 6 3 3
Trigger = 20
option contract private wells drought wells desalination plant
hm3

6. OPTIMIZATION OF WATER PROCUREMENT
DECISIONS IN AN IRRIGATION DISTRICT
155
6.6. Conclusions
Irrigators have to take key production decisions facing uncertain prospects
about how much water they will utilize during the season. Reducing this
uncertainty improves farms' planning and promotes economic efficiency.
Collective organizations (Irrigation Districts or Communities) manage water for
more than two thirds of Spanish irrigation area (3.5 mill. hectares). Optimizing
water procurement decisions can help IDs to reduce costs and water availability
risks and help their growers be more efficient. We have developed a model to
represent the water procurement decisions of an ID when different water
sources are available, including water supply option contracts. This model can
be applied to any other ID which relies on multiple water sources.
During drought periods, water users can rely on spot water markets to
get the needed water volume to meet their demands. However, under these
conditions it might be difficult to find a water seller and prices are normally
high. With option contracts this situation can be avoided. Option contracts
could have an important risk-reduction potential. This type of contract allows
the option holder to secure access to a certain water volume for a given price
(exercise price) in the future in exchange of the payment of an annual premium.
As our model shows, option contracts can be combined with other sources,
including groundwater, adding more flexibility to the entire source pool.
As expected, an ID would be more interested in signing the option
contract when the associated costs (exercise price, premium) and the conditions
(optioned volume and trigger) are more favorable for its business. The most
relevant variables for this decision are the optioned volume and the premium,
i.e. the cost of contracting the option. The district considers the probability of
not meeting its target supply with the other available water sources and
weights the cost of purchasing the option against the relative cost of the
alternative water sources. Our results show that, for the considered option
parameters’ values, the probability of the ID signing the option contract is 48

156
per cent, i.e. the district would be interested in signing nearly half of the
considered option contracts, and that greater optioned volumes require lower
annual premiums for the district to sign the contract. Besides, when the ID signs
the option contract and the trigger condition is met, the ID would always
exercise the option.
The benefits in terms of reduced risk exposure of the option contract, at
an average unitary cost of 1 cent of € per cubic meter, highlight its advantages
for irrigation districts in water-scarce areas. Moreover, our case study considers
an irrigation district that, despite being subject to a high degree of supply
variability, is relatively well endowed compared with other districts in south
Spain that can rely on a more restricted pool of water sources. The potential
benefits of water supply option contracts for more vulnerable district are thus
likely to be much superior.
In practical terms, the ID’s decisions are more complex than they are
presented in our model. The main complication not addressed in the paper is
finding the contract’s counterpart. Water sellers in Spain have been agricultural
users that use their resources in normal years and sell them in dry years rather
than right holders that have water trading as their main activity. The
advantages of option contract for the former are numerous. There has also been
a large multi-annual lease contract between irrigator’s associations that
resembles an option contract; so we can adventure that there will also be
potential option sellers. However, the obtained results are an indication of the
potential of option contracts for an irrigation district facing an uncertain water
supply. Our model can be further developed to include several interesting
aspects, including varying levels of risk tolerance of the ID. Besides, here we are
assuming that the spot price for water is known in a first stage, when
uncertainty related to water availability exists. Nevertheless, the spot price
would depend on the hydrological situation, increasing sharply during drought
periods.

7. CONCLUSIONS
157
7. CONCLUSIONS
7.1. General conclusions
Water resources are essential for all users and to conserve ecosystems, but are
becoming increasingly scarce and, as a consequence, more valuable.
Competition for water has always existed and will be exacerbated in the coming
decades. Water crises are ranked number three amongst the most relevant
global risks (World Economic Forum, 2014). The same source put water supply
risks at number two amongst Top 5 Global Risks in terms of impact in its
annual reports of 2012 and 2013 (World Economic Forum, 2014). In these
documents, as well as in many other international reports and assessments,
droughts and floods embody such risks. They are considered major hazards
and threats for social well-being, environmental conservation and economic
development. Besides, climate change is expected to cause increase in the
severity and frequency of extreme events, such as floods and droughts (Mills,
2005; IPCC, 2007, 2014). Because of its dependence on water availability and
climatic conditions, agriculture is and will be one of the most affected sectors.
All water problems are policy problems. This quote by Getches (2014)
cannot express it more clearly: “Water issues are typically discussed as physical
problems […]. But essentially all water problems have a policy nexus. It is rare
that a water problem cannot be solved if public policy can be harnessed and
directed effectively. […] Often these problems of competition can be privately
resolved by payments from one party to another. But public policy must
intervene if water is to serve more and varied interests inasmuch as water is a
public good. “Wise” choices are also inhibited, even in public decision making,
unless broadbased values are represented in the process […] in the end,
behaviors must be guided not by self-restraint alone, but also by a combination
of regulation and market forces” (Getches, 2014 p.18).

158
Water problems will become more acute in a drier climate. Irrigation
water demand is expected to increase in the Mediterranean region, while water
resources will become scarcer. As a result of the increased competition for
water, it is likely that the opportunity cost of water, and thus its price, will rise
significantly, threatening the profitability of irrigated agriculture in some areas
and for some crops, or at least questioning its socio-economic rationale. Apart
of increased water tariffs, other allocation mechanisms to manage the sharing of
water resources, such as water markets, can alleviate tensions among
competing users. Once water rights are correctly established and enforced, a
market for water can be created.
Water markets allow for a more efficient use of available water resources,
reallocating water from low to high value uses, provided the right regulatory
framework. As with other allocation mechanism, water markets have some
advantages and disadvantages that should be taken into account (see section
2.3). Water markets are not the panacea to water scarcity and drought, but they
can be part of the solution. Trading mechanisms should be considered together
with other water management tools.
The potential of water markets as a reallocation mechanism has been
evaluated in many different institutional settings and both in real and
hypothetical scenarios. Some studies have also addressed its potential to
reduced risks related to water availability. Despite their greatest potential for
managing such risks, water option contracts have received less academic
attention, and have also been less implemented in practice, than, for example,
spot water markets. In the case of Spain, they have been proposed as a strategic
source of water for cities during drought periods. This thesis addresses, both
theoretically and empirically, their potential for agricultural users.
This thesis evaluates the role of option contracts as a water supply risk
management tool for agricultural users. Focusing on the Spanish case, an
assessment of the water market in the country motivates the need to improve

7. CONCLUSIONS
159
the management of water supply availability risks. Option contracts are
proposed as a possible improvement for all the advantages provided by them
(see section 2.6). An empirical application to one of the most water-stressed
agricultural areas in the country further highlights their benefits.
The main contributions of this thesis touch on the following aspects:
i) a deep description and evaluation of Spanish water markets;
ii) a design of an innovative inter-basin water option contract between
water users in the Tagus and the Segura basins, that could be applicable
to other cases;
iii) a theoretical framework to assess farmers’ preferences for different
water supply risk management tools, including option contracts and
insurance, the farmers’ WTP for them and their prices;
iv) an evaluation of the role of option contracts in the optimization of
water procurement decisions under an uncertain water supply.
7.2. Spanish water markets
Since the approval of the 1999 Reform of the Water Act, several water rights
exchanges have taken place in the Spanish territory, involving different water
users, water resources and basins. Although market participants make a
positive assessment of these experiences, which have alleviated their water
availability problems during drought periods, trading activity has been limited.
There are a number of shortcomings in Spanish water markets, similar to those
in other countries, that can provide an explanation to this: high transaction
costs, slow administrative procedures, difficulties in finding buyers/sellers,
prices fixed under non-competitive regimes, rigid legislation, insufficient
control of environmental externalities and unchecked market power. Overall,
there is still ample room for improving their functioning.

160
Chapter 3 contains a thorough description of the Spanish water market,
including past trading experiences, the economics of water trading and the
reasons behind limited success of water markets in this country. At the end of
that chapter, some improvements are proposed to overcome the main
shortcomings of the regulatory system. The following conclusions about the
main problems can be derived:
a) Lack of transparency. There is hardly any public information about who
uses the water, for what, what are the benefits and externalities.
Information availability and transparency would encourage market
participation.
b) The need for more flexibility in the priorities’ system in the water use.
c) The need to clarify the conditions under which those exchanges that
involve more than one region could be made. Also, the integration of
water trading in the process of Hydrological Planning would be
desirable.
d) The existing legislation should clarify aspects such as the spatial and
temporal restrictions to trading or the criteria for the approval or
rejection of water exchanges by the Water Authorities (e.g. the
environmental or third‐party effects, social impacts and damage to
cultural heritage and landscape).
e) Water prices are too high due to unbalanced negotiation standpoints
among trading partners, in which sellers have a dominant position. The
Government should regulate market prices making use of existing
regulatory provisions.
The existence of informal water markets along the Mediterranean basins
proves that there is a demand for water resources reallocation among users and
for improving supply reliability. There is also a demand to manage differently
quality-graded waters and allow each user to meet their requirements at the

7. CONCLUSIONS
161
least possible cost. This demand is not met within the current regulatory
framework, which is too limited and lacks provisions to cope with extremely
diverse, quality graded, poorly monitored groundwater users. There is clearly a
need for a new improved regulatory framework that provides sufficient
flexibility for users in the most water-stressed basins, while at the same time
allowing for protection of the public interests.
As important as trying to improve and encourage water markets there is
also a need to achieve a deeper knowledge and understanding of how water is
actually used in each Spanish basin and to control the effective use of this water
while reviewing water concessions and increasing control of illegal extractions.
Better control of the existing water resources and their final destination will
lead to a much more efficient use of water and, eventually, will also improve
the functioning of water markets.
7.3. Option contracts for water
Water option contracts have been studied in this thesis as a potential
improvement for the Spanish water market. In section 2.6, the main
characteristics of option contracts and the advantages derived from this trading
mechanism have been discussed. The main advantage of an option contract for
both the buyer and the seller is the institutional and legal stability it provides.
Chapters 4, 5 and 6 evaluate different aspects of option contracts for
water. In general, results show the potential for this type of contracts for
reducing water supply availability risks. Although this thesis is applied to the
Spanish case, the conclusions can be extrapolated to other countries or regions
experiencing water supply reliability problems.
These chapters follow a conceptual sequence, that begins with chapter 4,
in which models the hydrological parameters of the contract, including a
synthetic cost-benefit analysis of both the area-of-origin (Tagus Basin) and of

162
the recipient area (Segura Basin), and performs a risk assessment using Monte-
Carlo simulations. Chapter 5 delves into the potential demand of irrigators for
two alternative supply risk management instruments: option contract and
drought insurance. It presents the theoretical conditions under which one is
preferred to the other, adding as a complement a comparison of the willingness
to pay for them and the cost of both insurance and option contracts. Lastly,
chapter 6 takes the original approach of modeling the optimal water
procurement decisions of an irrigation district in the Segura Basin in a
stochastic context, with a view to the find optimal choice of water supply
sources and the decision to sign an option contract. Option contracts combined
with eight other water sources, including conventional and non-conventional
water sources, are analyzed with a stochastic recursive optimization model.
7.3.1. Inter-basin option contracts
The Spanish Tagus-Segura Transfer has alleviated water scarcity in the
Segura Basin. It operates under management rules that depend on stochastic
hydrological variables, but also under some political discretionary rule. The
change implemented in 2014 with the approval of the Tagus River Basin Plan in
the Transfer management rules will entail a reduction in the transferable
volumes to water users in the Segura Basin, especially in dry periods. The
transferred water volume from the Tagus to the Segura Basin through the
Tagus-Segura Aqueduct has an enormous importance in the recipient area, both
for irrigation and urban supplies. Irrigated agriculture in the Segura Basin
represents an important economic activity for the GDP of the region.
Guaranteeing irrigators’ access to the needed water volumes and reducing their
water supply availability risks is crucial for maintaining the activity of this
sector.
Chapter 4 proposed an innovative inter-basin option contract to reduce
the negative impacts derived from this change. The proposed option contract

7. CONCLUSIONS
163
has two different components with different purposes. The first tranche is
intended to protect Segura’s irrigators in those years when the stock level in the
Entrepeñas-Buendía reservoir (Upper Tagus Basin) is very low and thus the
probability of receiving water through the transfer based on the institutional
management rule is low. The second tranche of the contract would allow
irrigators in the Segura Basin to have access to a higher water volume in those
years when the stock level in the reservoir is high, as a compensation for the
change in the Transfer’s management rules.
With the new Transfer’s management rule, irrigators in the Segura Basin
would receive less water when the upstream storage is low, allowing for a
better and faster recovery of the water stock in the Upper Tagus Basin. In these
years, irrigators in the Segura Basin could have access to the first part of the
option contract and purchase a certain water volume from an irrigation district
in the Tagus Basin. When the stock level in the Entrepeñas-Buendía reservoir is
high, the option contract would allow irrigators in the Segura Basin to benefit
from this situation, having access to even more water than with the current rule.
Results show that the proposed inter-basin option contract would reduce
the negative impacts of the change in the Tagus-Segura management rules,
without compromising the main objective of this change (guarantee minimum
environmental flows in the middle Tagus). Besides, the average net benefit of
the whole Tagus-Segura system would increase as a result of the proposed
inter-basin option contract. Therefore, the establishment of a similar agreement
as the one proposed here could have important benefits for the whole system,
and it would allow to maintain the high-productive agriculture in the Segura
Basin.
164
7.3.2. Farmer’s preferences for different water supply risk
management tools (option contracts and drought
insurance)
Water supply uncertainty is one of the main risks faced by irrigators. Chapter 5
presents a theoretical framework to obtain farmer’s willingness to pay for
option contracts and drought insurance, and the tentative prices of these risk
management tools. From the application of this theoretical framework to one of
the most productive irrigation districts in Spain (Campo de Cartagena, Segura
Basin) it can be concluded that farmers would be willing to pay a considerable
amount of money for reducing their water availability risks through option
contracts or drought insurance. This shows the relevance of reducing water
supply risks for irrigators, conforming to the previous literature.
Results show that farmers' decisions to contract a water supply option or
a drought insurance policy depends on his attitudes towards risk, profit
function, risk premium for each instrument, the administrative additional costs
and fees, and the trustworthiness of the instrument. Unlike option contracts, an
insurance policy transfers the water supply risk outside the water and
agricultural markets. This feature may be crucial and worth pursuing under
conditions of extreme scarcity and very unstable sources.
The WTP values are consistent with previous works in the same area,
and higher than the obtained prices for these tools, highlighting the feasibility
of these risk reduction mechanisms for protecting farmers in the region.
Droughts are recurrent phenomena in Spain. Thus, the development of tools to
reduce water users’ risks is crucial and the potential demand for them is high.
Currently, neither water option contracts nor drought insurance exist in
Spain. However, the potential of these risk management tools has been
considered and studied. The Spanish insurance system is one of the most

7. CONCLUSIONS
165
developed worldwide (OECD, 2011), so our country has the needed legal and
institutional framework to implement drought insurance policies. Besides, the
familiarity of farmers with crop insurance might favor the success of this
mechanism. On the contrary, legislative changes would be needed for the
establishment of option contracts in the Spanish water market, together with
activities aimed at encouraging the participation of farmers in the water market.
7.3.3. Finding irrigation district’s optimal water procurement
decisions: the role of option contracts
Taking optimal water procurement decisions is essential to increase users’
supply reliability and reduce costs. The resource to temporary water markets,
such as spot purchases or water supply option contracts, can provide flexibility
to this decision process.
In chapter 6 a stochastic recursive mathematical programming model is
applied to simulate the water procurement decisions of an irrigation district in a
context of water supply uncertainty and analyze the role that different option
contracts may play to secure its water supply.
Results show that the irrigation district would be more interested in
signing the option contract when the associated costs (exercise price, premium)
and the conditions (optioned volume and trigger) are more favorable for its
business. The contract’s premium and optioned volume are the variables that
have a greater impact on irrigation district’s decisions. When the optioned
volume is not available because the option was not previously signed or
because the trigger is not met, the irrigation district would have to rely on more
expensive water resources, such as desalinized water. Option contracts and
desalinized water are substitutes within the pool of water sources. Water from
desalination plants is extremely expensive, and irrigation districts only resort to
it during drought periods when there is no other alternative. If drought
166
insurance, such as the one proposed in chapter 5 were available for farmers, the
received compensation could be used to buy water from another water source,
including desalinized water.
The large benefits in terms of reduced risk exposure of the option
contract, at an average increased unitary cost of 1 cent of € per cubic meter,
highlight its advantages for irrigation districts in water-scarce areas. These
benefits could be even higher for other irrigation districts with access to a more
restricted water supply.
7.4. Limitations and further research
This thesis represents an attempt to evaluate the potential of option contracts
for reducing water supply availability risks. Different aspects of option
contracts have been studied and interesting results have been obtained.
However, there are some limitations or aspects that should be further
developed:
• More sophisticated and complex versions of the inter-basin option
contract presented in chapter 4 could be developed. This thesis
represents the first step in the design of this kind of water sharing
mechanisms in such a unique case. Different versions of the proposed
water option contract could be further studied.
• The theoretical framework presented in chapter 5 gives us an
approximation to the farmer’s willingness to pay for different water
supply risk management tools. All the needed assumptions to obtain the
mathematical expressions of the risk premium for each case could be
affecting the real values of the WTP, but they are essential for carrying
out the analysis. Relaxing some of the most offensive assumptions would
represent a natural continuation of this thesis.

7. CONCLUSIONS
167
• The two-stage stochastic recursive optimization model developed in
chapter 6 does not take into account the risk aversion level of the
irrigation district’s managers. Risk aversion, should it be large, would
affect the water procurement decisions. Thus, the model could be further
developed in order to include risk aversion or alternative types of risks
preferences in the decision process.
• Water markets are only part of the solution to achieve an efficient
allocation of water resources. The combination of water markets with
other economic or administrative instruments is desirable. The role of
water markets in the whole allocation system could be further assessed,
as well as the most suitable mechanisms to be established together with
water markets.
• In this thesis, the potential of option contracts as risk reduction tools has
been studied from the point of view of a farmer or irrigation district,
because agriculture is the main water user in Spain. Similar interest for
water option contracts could be expected for other water users, as urban
water suppliers, industries or the government (for the preservation of
minimum environmental flows). The analysis carried out here could be
applied to any other water sector, basin or country.
• Although an evaluation of the prices of option contracts has been done in
chapter 6, this thesis is mainly focused on the demand side of the
instrument. The analysis of the supply side of water option contracts, the
definition of their functioning, the contract terms, and the required
legislative framework would be very interesting to have the whole
picture.


169
REFERENCES
Adler J.H. (2009). Warming Up to Water Markets. Regulation, winter 2008-2009: 14-17.
CATO Institute.
Aguilera-Klink F. and Sánchez-García J. (2005). Water Markets in Tenerife: the conflict
between instrumental and ceremonial functions of the institutions.
International Journal of Water, 3(2): 166-185.
Albiac J., Hanemann M., Calatrava J., Uche J. and Tapia J. (2006). The rise and fall of the
Ebro water transfer. Natural Resources Journal, 46(3): 727-757.
Ansink E. and Houba H. (2011). Market power in water markets. Tinbergen Institute
Discussion Paper, TI 2010-054/1.
Antón J. and Kimura S. (2011). Risk Management in Agriculture in Spain. OECD Food,
Agriculture and Fisheries Papers No. 43, OECD Publishing. Available at:
http://dx.doi.org/10.1787/5kgj0d57w0wd-en. Cited 15 Sept 2013.
Ariño G. and Sastre M. (2009). Water sector regulation and liberalization. In: Garrido
A. and Llamas M.R. (eds.), Water Policy in Spain. Taylor & Francis, Leiden, The
Netherlands, pp. 95-106.
Arriaza M., Gómez-Limón J.A. and Upton M. (2002). Local water markets for irrigation
in southern Spain: A multicriteria approach. Australian Journal of Agricultural
and Resource Economics, 46 (1): 21-43.
Bates B.C., Kundzewicz Z.W., Wu S. and Palutikof J.P. (2008). Climate Change and
Water. Technical paper of the Inter-Governmental Panel on Climate Change.
IPCC secretariat, Geneva.
Bauer C. (1998). Against the Current: Privatization, Water Markets, and the State in
Chile. Springer, 164 p.
Bauer C. (2003). Marketing water, marketing reform: Lessons from the Chilean
experience. Resources, summer 2003: 11-14.
Beare S., Heaney A. and Mues C. (2003). Water rights, transaction costs and policy
reform. Abare Conference Paper 03.10.

170
Berbel J., Viaggi D. and Manos B. (2009). Estimating demand for irrigation water in
European Mediterranean countries through MCDM models. Water Policy, 11:
348-361.
Bielza M., Conte C., Dittmann C., Gallego J. and Stroblmair J. (2008). Agricultural
Insurance Schemes. Directorate General, JRC. European Commission.
Bjornlund H. (2003). Efficient Water Market Mechanisms to Cope with Water Scarcity.
Water Resources Development, 19: 553-567.
Bjornlund H. (2006). Can water markets assist irrigators Managing Increased Supply
Risk? Some Australian experiences. Water International, 31(2): 221-232.
Bjornlund H. (2008). Water Markets and their Environmental, Social and Economic
Impacts in Australia. EXPO Zaragoza 2008. Available at:
http://www.zaragoza.es/contenidos/medioambiente/cajaAzul/25S8-P1-
Henning%20BjornlundACC.pdf
Bjornlund H., Wheeler S. and Rossini P. (2013). Water markets and their
environmental, social and economic impacts in Australia. In: Maestu J. (ed.),
Water Trading and Global Water Scarcity: International experiences. RFF Press,
Routledge, Abingdon, UK, pp. 68-93.
Black F. and Scholes M.S. (1973). The pricing of options and corporate liabilities.
Journal of Political Economy, 81: 637-654.
Blanco M., Navarro D. and Viladrich M. (2010). ¿Pueden los instrumentos económicos
contribuir a la sostenibilidad del regadío en las regiones mediterráneas? Anales
de Economía Aplicada, ISBN 978-84-92954-15-5.
Blanco M. and Viladrich M. (2013). Estimación de las ganancias mínimas que debe
garantizar la creación de un centro de intercambio de derechos de agua en la
cuenca del Segre. Presented at the IX Spanish National Congres of Agricultural
Economics, Castelldefels, 2013.
Bogardi J.J., Dudgeon D., Lawford R., Flinkerbusch E., Meyn A., Pahl-Wostl C.,
Vielhauer K. and Vörösmarty C. (2012). Water security for a planet under
pressure: interconnected challenges of a changing world call for sustainable
solutions. Current Opinion in Environmental Sustainability, 4(1): 35-43.

171
Briscoe J. (1997). Managing water as an economic good: rules for reformers. The
International Committee on Irrigation and Drainage Conference on Water as an
Economic Good. Oxford, 1997.
Brown T. C. (2006). Trends in water market activity and price in the western United
States. Water Resources Research, 42, W09402.
Brown C. and Carriquiry M. (2007). Managing hydroclimatological risk to water
supply with option contracts and reservoir index insurance. Water Resources
Research, 43, W11423.
Bruns B.R. and Meinzen-Dick R. (2005). Frameworks for Water Rights: An Overview of
Institutional Options. In: Bruns B.R., Ringler C. and Meinzen-Dick R. (eds.),
Water Rights Reform: Lessons for Institutional Design. International Food
Policy Research Institute, Washington, DC, pp. 3-25.
Calatrava J. (2007). Valoración Económica del Uso Agrario del Agua en el Regadío de
la Cuenca del Tajo. Technical report for the study 03.805.010/0411,
Confederación Hidrográfica del Tajo, Ministerio de Medio Ambiente.
Calatrava J. and Garrido A. (2005a). Spot water markets and risk in water supply.
Agricultural Economics, 33: 131-143.
Calatrava J. and Garrido A. (2005b). Modelling water markets under uncertain water
supply. European Review of Agricultural Economics, 32 (2): 119-142.
Calatrava J. and Garrido A. (2006). Difficulties in Adopting Formal Water Trading
Rules within User’s Associations. Journal of Economic Issues, XL (1): 27-44.
Calatrava J. and Gómez-Ramos A. (2009). El papel de los mercados de agua como
instrumento de asignación de recursos hídricos en el regadío español. In:
Gómez‐Limón J.A., Calatrava J., Garrido A., Sáez F.J. and Xabadia A. (eds.), La
economía del agua de riego en España. Fundación Cajamar, Almería, pp. 295‐
319.
Calatrava J. and Martínez-Granados D. (2012). El valor de uso del agua en el regadío de
la cuenca del Segura y en las zonas regables del trasvase Tajo-Segura. Economía
Agraria y Recursos Naturales, 12(1): 5-32.

172
Calzadilla A., Rehdanz K. and Tol R.S.J. (2010). The economic impact of more
sustainable water use in agriculture: A computable general equilibrium
analysis. Journal of Hydrology, 384: 292-305.
Carter H.O., Vaux Jr. H.R. and Scheuring A.F. (1994). Sharing scarcity. Gainers and
losers in water marketing. University of California, Agricultural Issues Center,
Davis, 239 p.
CEDEX (2011). Evaluación del impacto del cambio climático en los recursos hídricos en
régimen natural. CEDEX, Madrid, Spain.
Cerdá E. and Quiroga S. (2008). Cost-Loss Decision Models with Risk Aversion. ICEI
Working Papers, WP 01/08.
Characklis G., Kirsch B.R., Ramsey J., Dillard K. and Kelley C.T. (2006). Developing
portfolios of water supply transfers. Water Resources Research 42, W05403.
Cheng W-Ch., Hsu N-S., Cheng W-M and Yeh W-G. (2011). Optimization of European
Call Options considering physical delivery network and reservoir operation
rules. Water Resources Research 47, W10501.
CHJ (Confederación Hidrográfica del Júcar) (2010). Memoria 2004/2009.
Confederación Hidrográfica del Júcar, Valencia.
CHS (Confederación Hidrográfica del Segura) (2007). Estudio General sobre la
Demarcación Hidrográfica del Segura (versión del 2 de julio de 2007).
Confederación Hidrográfica del Segura, Murcia.
CHT (Confederación Hidrográfica del Tajo) (2003). The Tagus Basin in figures.
Confederación Hidrográfica del Tajo, Madrid.
CHT (2008). Plan Especial de Sequía de la Cuenca Hidrográfica del Tajo, Confederación
Hidrográfica del Tajo, Madrid.
CHT (2011). Memoria Anual de la Confederación Hidrográfica del Tajo, Confederación
Hidrográfica del Tajo, Madrid.
CHT (2013). Propuesta de proyecto de Plan hidrológico de cuenca de la parte española
de la Demarcación Hidrográfica del Tajo [Draft], Madrid, 2013.
Clifford P., Landry C. and Larsen-Hayden A. (2004). Analysis of Water Banks in the
Western States. Washington Department of Ecology, July 2004.

173
Coase R.H. (1960). The problem of social cost. Journal of Law and Economics, 3: 1– 44.
Collender R.N. and Zilberman D. (1985). Land Allocation under Uncertainty for
Alternative Specifications of Return Distributions. American Journal of
Agricultural Economics, 67 (4): 779-786.
Corominas J. (2011). Aplicación a los regadíos del Guadalquivir del intercambio de
derechos del agua en situaciones de dotación restringida. Presented at the
Botín Foundation Seminar on Water Markets in Spain. Madrid, June 2011.
Cubillo F. (2010). Looking for efficiency through integrated water management
between agriculture and urban uses (Review). Water Science and Technology:
Water Supply, 10 (4): 584-590.
Cui J. and Schreider S. (2009). Modelling of pricing and market impacts for water
options. Journal of Hydrology, 371: 31-41.
Cummins T. and Thompson C. (2002). Anticipating The Next Level Of Sophistication
In Water Markets. Connections: Farm, Food and resource issues, 4: 4-9.
Custodio E. (2011). Comentarios sobre el comercio y mercados del agua subterránea en
Canarias. In: Cabrera M. C., Jiménez J., and Custodio E. (eds.), El conocimiento
de los recursos hídricos en Canarias cuatro décadas después del proyecto SPA-
15. AIH-GE, 2011.
Custodio E. and Cabrera M.C. (2012). The Canary Islands. In: De Stefano L. and Llamas
M. R. (eds.), Water, Agriculture and the Environment in Spain: can we square
the circle? Botín Foundation, CRC Press, pp. 281-289.
De Stefano L. and Llamas M. R. (2012). Water, Agriculture and the Environment in
Spain: Can we square the circle? Botín Foundation, CRC Press, 316 p.
Dono G. and Mazzapicchio G. (2010). Uncertain water supply in an irrigated
Mediterranean area: an analysis of the possible economic impact of climate
change on the farm sector. Agricultural Systems, 103: 361-370.
Donoso G., Melo O. and Jordan C. (2012). Estimating Water Rights Demand and
Supply: Are buyer and seller characteristics important? Departamento de
Economía Agraria, Facultad de Agronomía, Pontificia Universidad Católica de
Chile.

174
Dosi C. and Easter W. K. (2000). Water Scarcity: Institutional Change, Water Markets
and Privatization. Fondazione Eni Enrico Mattei, Nota di lavoro 102.2000.
Dourojeanni A.C. (2009). Banco de Aguas: ¿Una opción para la gestión del agua en la
región de Atacama? Centro Atacama, agua & energía.
Easter W. K., Rosegrant M.W. and Dinar A. (1998). Markets for Water: Potential and
Performance. Norwell, MA. Kluwer Academic Publishers, 298 p.
EEA (European Environment Agency) (2009). Water resources across Europe –
confronting water scarcity and drought. EEA Report No 2/2009.
EEA (2012). Towards efficient use of water resources in Europe. EEA Report, No
1/2012.
Elorrieta J.I., Castellano E., Martinez de Anguita P., Pellitero M. and Rey C. (2003).
Establecimiento de un precio óptimo ambiental y social para el agua de riego
mediante la internalización de los costes ambientales y el uso de matrices de
contabilidad. Aplicación a la Comunidad Foral de Navarra. Economía Agraria y
de los Recursos Naturales, 3: 139-166.
Embid A. (2010). The foundations and principles of modern water law. In: Garrido A.
and Llamas M.R. (eds.), Water Policy in Spain. CRC press, Taylor & Francis,
Leiden, The Netherlands, pp. 109-116.
Estrela T. and Vargas E. (2012). Drought Management Plans in the European Union.
The Case of Spain. Water Resources Management doi: 10.1007/s11269-011-
9971-2.
European Commission (2012). A Blueprint to Safeguard Europe’s Water Resources.
COM(2012) 673 final, Brussels.
FAO (2003). Unlocking the Water Potential of Agriculture. Natural Resources
Management and Environment Department, FAO. Rome, Italy.
FAO (2006). Reforma Agraria y Evolución del Marco Jurídico del Agua en Chile.
Estudio legislativo de la FAO en Línea, 59. Conferencia Internacional sobre
Reforma Agraria y Desarrollo Rural. Brazil, March 7-10th, 2006.

175
Fleming E., Villano R. and Williamson B. (2013). Structuring Exotic Options Contracts
on Water to Improve the Efficiency of Resource Allocation in the Australian
Water Market. Australasian Agribusiness Perspectives, paper 96.
Frederick K.D. (2001). Water Marketing: Obstacles and Opportunities. Forum for
Applied Research and Public Policy. Spring 2001, pp. 54-62. Available at:
http://forum.ra.utk.edu/Archives/Spring2001/frederick.pdf
Freebairn J. and Quiggin J. (2006). Water rights for variable supplies. Australian
Journal of Agricultural and Resource Economics, 50(3): 295-312.
FNCA (Fundación Nueva Cultura del Agua) (2012). Posición de la FNCA ante la
reforma de la Ley de Aguas. Boletín nº 58, May 2012.
Garrick D., Siebentritt M.A., Aylward B., Bauer C.J. and Purkey A. (2009). Water
markets and freshwater ecosystem services: Policy reform and implementation
in the Columbia and Murray-Darling Basins. Ecological Economics, 69: 366-379.
Garrido A. (1998). An economic analysis of water markets within the Spanish
agricultural sector: can they provide substantial benefits? In: Easter K.W.,
Rosegrant M. and Dinar A. (eds.), Markets for Water: Potential and
Performance. Kluwer Academic Publishers, New York, pp. 223–239.
Garrido A. (2000). A mathematical programming model applied to the study of water
markets within the Spanish agricultural sector. Annals of Operations Research,
94: 105-123.
Garrido A., Martínez-Santos P. and Llamas M.R. (2006). Groundwater irrigation and its
implications for water policy in semiarid countries: the Spanish experience.
Hydrogeology Journal, 14 (3): 340-349.
Garrido A. (2007). Water markets design and evidence from experimental economics.
Environmental Resources Economics, 38: 31-330.
Garrido A. and Zilberman D. (2008). Revisiting the demand of agricultural insurance:
the case of Spain. Agricultural Finance Review, 68: 43-66.
Garrido A. and Calatrava J. (2009). Trends in water pricing and markets. In: Garrido A.
and Llamas M.R. (eds.), Water Policy in Spain. CRC Press, Taylor & Francis,
Leiden, The Netherlands, pp. 129-142.

176
Garrido A. and Gómez-Ramos A. (2009a). Risk Management Instruments Supporting
Drought Planning and Policy. In: Iglesias A., Garrote L., Cancelliere A., Cubillo
F. and Wilthite D. (eds.), Coping with Drought Risk in Agriculture and Water
Supply Systems. Springer, pp. 133-151.
Garrido A. and Gómez-Ramos A. (2009b). Propuesta para la implementación de un
centro de intercambio basado en contratos de opción. In: Gómez-Limón J.A.,
Calatrava J., Garrido A., Sáez F.J. and Xabadia A. (eds.), La economía del agua
de riego en España. Fundación Cajamar, Almería, pp. 321-341.
Garrido A. and Llamas M.R. (2009). Water Policy in Spain, CRC Press, Taylor &
Francis, Leiden, The Netherlands.
Garrido A., Llamas M.R., Varela-Ortega C., Novo P., Rodríguez-Casado R. and Aldaya
M.M. (2010). Water Footprint and Virtual Water Trade in Spain. Springer. New
York, 150 p.
Garrido A., Willaarts B., López-Gunn E. and Rey D. (2012a). Considerations on climate
variability and change in Spain. In: De Stefano L. and Llamas M. R. (eds.),
Water, Agriculture and the Environment in Spain: can we square the circle?
Botín Foundation, CRC Press, pp. 191-204.
Garrido A., Rey D. and Calatrava J. (2012b). Water trading in Spain. In: De Stefano, L.
and Llamas, M. R. (eds.), Water, Agriculture and the Environment in Spain: can
we square the circle? Botín Foundation, CRC Press, pp. 205-216.
Garrido A., Bielza M., Rey D., Mínguez M.I. and Ruiz-Ramos M. (2012c). Insurance as
an Adaptation to Climate Variability in Agriculture. In: Mendelsohn R. and
Dinar A. (eds.) Handbook on Climate Change and Agriculture. Edward Elgar,
pp. 420-445.
Garrido A., Calatrava J. and Rey D. (2013). La flexibilización del régimen de
concesiones y el mercado de aguas en los usos en regadío. In: Embid A. (ed.),
Usos del Agua (Concesiones, Autorizaciones y Mercados de Agua).
Universidad de Zaragoza and Confederación Hidrográfica del Ebro. Thomson
Reuters Aranzadi, Madrid, pp. 177-197.
Garrido A., Donoso G., Melo O. and Solanes M. (2014). Economic instruments for
allocating water and financing services. In: Willaarts B., Garrido A. and Llamas

177
M.R. (eds.), Water for Food Security and Well-Being in Latin America and the
Caribbean. Botin Foundation, Earthscan, Routledge, Santander, pp. 343-364.
Getches D.H. (2004). Water Wrongs: Why Can’t We Get It Right the First Time?
Environmental law, 34 (1). University of Colorado Law School.
Getches D.H. (2014). Water scarcity in the Americas. Common challenges - A Northern
Perspective. In: Garrido A. and Shechter M. (eds.), Water for the Americas.
Challenges and Opportunities. Routledge, London and New York, pp. 15-39.
Giannakopoulos C., Bindi M., Moriondo M., LeSager P. and Tin T. (2005). Climate
change impacts in the Mediterranean resulting from a 2oC global temperature
rise. WWF.
Giannocaro G., Pedraza V. and Berbel J. (2013). Analysis of Stakeholders’ Attitude
towards Water Markets in Southern Spain. Water, 5: 1517-1532.
Giansante C., Babiano L., Aguilar M., Garrido A., Gómez A., Iglesias E., Lise W., Del
Moral L. and Pedregal B. (2002). Institutional Adaptation to Changing Risk of
Water Scarcity in the Lower Guadalquivir Basin. Natural Resources Journal, 42:
521-563.
Gil M., Garrido A. and Gómez-Ramos A. (2009). Análisis de la productividad de la
tierra y del agua en el regadío español. In: Gómez‐Limón J.A., Calatrava J.,
Garrido A., Sáez F.J., and Xabadia A. (eds.), La economía del agua de riego en
España, Fundación Cajamar, Almería, pp. 95-114.
Gómez-Limón J.A., Riesgo L. and Arriaza M. (2002). Agricultural Risk Aversion
Revisited: A Multicriteria Decision-Making Approach. Paper prepared for
presentation at the Xth EAAE Congress Exploring Diversity in the European
Agri -Food System, Zaragoza (Spain), 28-31 August, 2002.
Gómez-Limón J.A., Arriaza M. and Riesgo L. (2003). An MCDM analysis of agricultural
risk aversion. European Journal of Operational Research, 151: 569-585.
Gómez-Limon J.A. and Martinez Y. (2006). Multi-criteria modelling of
irrigation water market at basin level: A Spanish case study. European Journal
of Operational Research, 173 (1): 313-336.
Gómez Ramos A. (2004). El contrato de opción como instrumento de cesión de agua.
Una aplicación a la ciudad de Sevilla. Tesis Doctoral. Departamento de

178
Economía y CCSS Agrarias. Universidad Politécnica de Madrid. Madrid, Enero
2004.
Gómez-Ramos A. and Garrido A. (2004). Formal risk-transfer mechanisms for
allocating uncertain water resources: The case of option contracts. Water
Resources Research 40, W12302.
Gómez-Ramos A. (2013) Drought management, uncertainty and option contracts. In:
Maestu J. (ed.) Water Trading and Global Water Scarcity: International
Experiences. RFF Press, Routledge, Abingdon, UK, pp. 286-297.
Grafton R.Q., Landry C., Libecap G.D. and O’Brien J.R. (2009). Water Markets:
Australia’s Murray-Darling Basin and the US SouthWest. International Centre
for Economic Research, Working Paper number 15.
Grafton R.Q., Landry C., Libecap G.D., McGlennon S. and O’Brien J.R. (2010). An
Integrated Assessment of Water Markets: Australia, Chile, China, South Africa
and the USA. National Bureau of Economic Research. Working Paper 16203.
Grafton R.Q., Libecap G.D., McGlennon S., Landry C. and O’Brien J.R. (2011). An
Integrated Assessment of Water Markets: A Cross-Country Comparison.
Review of Environmental Economics and Policy 5 (2): 219-239.
Graham W. (1998). A hundred rivers run through it. California floats its future on a
market for water. Harper’s Magazine. June, pp. 51-60.
Griffin R C., Peck D. E. and Maestu J. (2013). Myths, principles and issues in water
trading. In: Maestu J. (ed.), Water Trading and Global Water Scarcity:
international experiences. RFF Press , Routledge, Abingdon, UK, pp. 1-14.
Griffith M., Codner G., Weinmann E. and Schreider S. (2009). Modelling hydroclimatic
uncertainty and short-run irrigator decision making: the Goulburn system.
Australian Journal of Agricultural and Resource Economics, 53: 565-584.
Hafi A., Beare S., Heaney A. and Page S. (2005). Water options for environmental
flows. ABARE eReport 05.12, 2005.
Hanak E. (2003). Who Should Be Allowed to Sell Water in California? Third-Party
Issues and the Water Market. Public Policy Institute of California.

179
Hanak E. and Stryjewski E. (2012). California’s Water Market, By Numbers: Update
2012. Public Policy Institute of California.
Hansen K., Howitt R. and Williams J. (2006). Implementing Option Markets in
California To Manage Water Supply Uncertainty. American Agricultural
Economics Association Annual Meeting Long Beach, California July 23-36, 2006.
Hansen K., Kaplan J. and Kroll S. (2008). Valuing Options In Water Markets: A
Laboratory Investigation. DARE CSU Working Paper 001-08.
Hansen K., Howitt R. and Williams J. (2013). Water trades in the western United States.
In: Maestu J (ed.), Water Trading and Global Water Scarcity: International
Experiences. RFF Press, Routledge, Abingdon, UK, pp. 56-67.
Hardaker J.B. (2000). Some issues in dealing with risk in agriculture. Working Papers in
Agricultural and Resources Economics. Armidale, N.S.W. School of Economic
Studies. University of New England.
Hardaker J.B., Huirne R.B.M., Anderson J.R. and Lien G. (2004). Coping with risk in
agriculture. Second edition, CABI publishing.
Hardy L. and Garrido A. (2010). Análisis y evaluación de las relaciones entre el agua y
la energía en España. Papeles de Agua Virtual 6, Botin Foundation, Madrid.
Hardy L., Garrido A. and Juana L. (2012). Evaluation of Spain’s Water–Energy Nexus.
International Journal of Water Resources Development. 28(1): 151-170.
Heaney A. and Hafi A. (2005). Using water options to meet environmental demand,
ABARE conference paper 05.03, 2005.
Hernández-Mora N. and De Stefano L. (2013). Los mercados informales de agua en
España: una primera aproximación. In: Embid A. (ed.), Usos del Agua
Concesiones, Autorizaciones y Mercados del Agua. Thomson Reuters
Aranzadi, Madrid, pp. 375-401.
Heaney A., Dwyer G., Beare S., Peterson D. and Pechey L. (2006). Third-party effects of
water trading and potential policy responses. Australian Journal of Agricultural
and Resource Economics, 50 (3): 277-293.

180
Hearne R.R. and Easter K.W. (1995). Water Allocation and Water Markets: An Analysis
of Gains-from-Trade in Chile. World Bank Technical Paper Number 315,
Washington, DC.
Hearne R.R. and Donoso G. (2005). Water institutional reforms in Chile. Water Policy,
7: 53-69.
Hollinshead S.L. and Lund J.R. (2006). Optimization of Environmental Water
Purchases with Uncertainty. Water Resources Research 42, W08403.
Howitt R.E. (1994). Effects of water marketing on the farm economy. In: Carter H.O.,
Vaux Jr. H.R. and Scheuring A.F. (eds.), Sharing Scarcity. Gainers and Losers in
Water Marketing. University of California Agricultural Issues Center, Davis,
pp. 97-133.
Howitt R.E. (1998). Spot Prices, Option Prices, and Water Markets: An Analysis of
Emerging Markets in California. Natural Resource Management and Policy, 15:
119-140.
Hughes N. and Goesch T. (2009). Management of irrigation: carryover rights and
capacity sharing. ABARES research report 09.10.
Hui W., Huimin W., Zang L., Yin L. and Chen H. (2007). A methodology for valuing
water option contract of Eastern Rout of South-to-North Water Transfer. 18th
Annual Conference of the Production and Operations Management Society.
Dallas, Texas, May 4-7th 2007. Available at:
http://www.pomsmeetings.org/ConfProceedings/007/CDProgram/Topics/f
ull_length_papers_files/007-0418.pdf
Iglesias A., Estrela T. and Gallart F. (2005). Impactos sobre los recursos hídricos.
Impactos del cambio climático en España. Ministerio de Medio Ambiente,
Madrid, Spain.
Iglesias A., Avis K., Benzie M., Fisher P., Harley M., Hodgson N., Horrocks L., Moneo
M. and Webb J. (2007). Adaptation to climate change in the agricultural sector.
Report to European Commission Directorate General for Agriculture and Rural
Development, issue number 1.
Iglesias A. and Quiroga S. (2009). Cambio global y recursos hídricos para la agricultura.
In: Gómez‐Limón J.A., Calatrava J., Garrido A., Sáez F.J., and Xabadia A. (eds.),

181
La economía del agua de riego en España. Fundación Cajamar, Almería, pp.
179-198.
Iglesias A., Garrote L., Cancelliere A., Cubillo F. and Wilthite D. (2009). Coping with
Drought Risk in Agriculture and Water Supply Systems. Springer, 322 p.
Iglesias E., Garrido A. and Blanco M. (1996). Análisis de la actitud de los regantes ante
el establecimiento de políticas de precios públicos y de mercados de agua.
Revista Española de Economía Agraria, 178: 139-162.
IPCC (2007). Climate Change 2007: Impacts, Adaptation and Vulnerability.
Contribution of Working Group II to the Fourth Assessment Report of the
Intergovernmental Panel on Climate Change. Cambridge, UK: Cambridge
University Press.
IPCC (2014). Climate Change 2014: Impacts, Adaptation, and Vulnerability.
Contribution of Working Group II to the Fifth Assessment Report of the
Intergovernmental Panel on Climate Change. Cambridge, UK: Cambridge
University Press. Final Draft.
Janmaat J. (2011). Water Markets, Licenses, and Conservation: Some Implications. Land
Economics, 87: 145-159.
Jenkins M.W. and Lund J.R. (2000). Integrating yield and shortage management under
multiple uncertainties. Journal of Water Resources Planning and Management,
126(5): 288-297.
Johansson R.C., Tsur Y., Roe T.L., Doukkali R. and Dinar A. (2002). Pricing irrigation
water: a review of theory and practice. Water Policy, 4: 173-199.
Just D.R. and Peterson H. (2010). Is Expected Utility Theory Applicable? A Revealed
Preference Test. American Journal of Agricultural Economics, 92(1): 16-27.
Kahneman D. and Tversky A. (1979). Prospect theory: an analysis of decision under
risk. Econometrica, 47: 263-291.
Kandel S. and Stambaugh R.F. (1991). Asset returns and intertemporal preferences.
Journal of Monetary Economy, 27 (1): 39–71.

182
Kasprzyk J.R., Reed P.M., Kirsch B.R. and Characklis G.W. (2009). Managing
population and drought risks using many-objective water portfolio planning
under uncertainty. Water Resources Research 45, W12401.
Kidson R., Haddad B., Zheng H., Kasower S. and Raucher R. (2013). Optimising
Reliability: Portfolio Modeling of Contract Types for Retail Water Providers.
Water Resources Management, 27: 3209-3225.
Kirsch B.R., Characklis G.W., Dillard K. and Kelley C.T. (2009). More efficient
optimization of long-term water supply portfolios. Water Resources Research
45, W03414.
Kolokytha E. (2010). European policies for confronting the challenges of climate
change in water resources. Current Science, 98: 1069-1076.
Lefebvre M. (2011). Irrigation water allocation mechanisms and drought risk
management in agriculture. Thesis, Université Montpellier I.
Leiva A.J. and Skees J. (2008). Using Irrigation Insurance to Improve Water Usage of
the Rio Mayo Irrigation System in Northwestern Mexico. World Development,
36(12): 2663–2678.
Leroux A. and Crase L. (2007). Options Contracts for Managing Inter-Sectoral Water
Trade: A Preliminary Investigation of the Feasibility of Urban-Irrigation
Options Contracts in the Ovens Basin, Victoria, Australia. Australian
Agricultural and Resource Economics Society Annual Conference, 2007.
Libecap G.D. (2010). Water Rights and Markets in the US Semi-Arid West: Efficiency
and equity issues. The Evolution of Property Rights Related to Land and
Natural Resources Conference. Lincoln House, Cambridge, Massachusetts,
September 20-21, 2010
Llamas M.R., Fornés J.M., Hernández-Mora N. and Martínez L. (2001). Aguas
subterráneas: retos y oportunidades. Botín Foundation, Mundi-Prensa. Madrid,
529 p.
Llamas M.R., Varela-Ortega C., de la Hera A., Aldaya M.M., Villarroya F., Martínez-
Santos P., Blanco-Gutiérrez I.M.M., Carmona-García G., Esteve-Bengoechea P.,
De Stefano L., Hernández-Mora N. and Zorrilla P. (2010). The Guadiana Basin.
In: Mysiak J., Henrikson H.J., Sullivan C., Bromley J. and Pahl-Wostl C. (eds.),

183
The Adaptive Water Resource Management Handbook. Earthscan, London, pp.
103-116.
López-Gunn E., Dumont A. and Villarroya F. (2012). Tablas de Daimiel National Park
and groundwater conflicts. In: De Stefano L. and Llamas M. R. (eds.), Water,
Agriculture and the Environment in Spain: can we square the circle? CRC Press,
Taylor & Francis,Leiden, The Netherlands, pp. 45-66.
Lorenzo-Lacruz J., Vicente-Serrano S.M., López-Moreno J.I., Beguería S., García-Ruiz
J.M. and Cuadrat J.M. (2010). The impact of droughts and water management
on various hydrological systems in the headwaters of the Tagus River (central
Spain). Journal of Hydrology, 386: 13–26.
Maestre-Valero J.F., Martínez-Granados D., Martínez-Álvarez V. and Calatrava J.
(2013). Socio-Economic Impact of Evaporation Losses from Reservoirs Under
Past, Current and Future Water Availability Scenarios in the Semi-Arid Segura
Basin. Water Resources Management, 27:1411-1426.
Maestu J., Sánchez S. and Gómez-Ramos A. (2008). Mercados de agua: un instrumento
novedoso en la gestión pública del agua. Ambienta, Julio-Agosto, pp. 6-13.
Martí T.T. (2005). Use competition and water exchange in Marina Baja district,
Alicante, Spain. Water Science and Technology: Water Supply, 5: 265-272.
Martin P., Williams J. and Stone C. (2008). Transaction costs and water reform: the
devils hiding in the details. Cooperative Research Centre for Irrigation Futures.
Technical Report No. 08/08.
Martin-Ortega J., Berbel J. and Brouwer R. (2009). Valoración económica de los
beneficios ambientales no de mercado derivados de la mejora de la calidad del
agua: una estimación en aplicación de la Directiva Marco del Agua al
Guadalquivir. Revista de Economía Agraria y de los Recursos Naturales,
9(1):65–89
Martínez-Álvarez V., García-Bastida P.A., Martin-Gorriz B. and Soto-García M. (2014).
Adaptive strategies of on-farm water management under watersupply
constraints in south-eastern Spain. Agricultural Water Management, 136: 59-67.
Martínez-Granados D., Maestre-Valero J.F., Calatrava J. and Martínez-Álvarez V.
(2011). The economic impact of water evaporation losses from water reservoirs

184
in the Segura basin, SE Spain, Water Resource Management, 25: 3153-3175,
2011.
Martínez‐Santos P., De Stefano L., Llamas M.R. and Martínez‐Alfaro P.E. (2008).
Wetland Restoration in the Mancha Occidental Aquifer, Spain: A Critical
Perspective on Water, Agricultural, and Environmental Policies. Restoration
Ecology, 16(3): 511‐521.
Matthews O.P. (2004). Fundamental questions about water rights and market
reallocation. Water Resources Research 40, W09S08.
McCann L. and Easter W. K. (2004). A framework for estimating the transaction costs
of alternative mechanisms for water exchange and allocation. Water Resources
Research 40, W09S09.
Meinzen-Dick R. and Bakker M. (2000). Water rights and multiple water uses:
framework and application to Kirindi Oya irrigation system, Sri Lanka. EPTD
Discussion paper No. 59, IFPRI. Available at:
http://www.ifpri.org/sites/default/files/publications/eptdp59.pdf
Merton R.C. (1973). Theory of rational option pricing. Bell
Journal of Economics and Management Science, 4:141-183.
Mesa-Jurado A., Martin-Ortega J., Ruto E. and Berbel J. (2012). The economic value of
guaranteed water supply for irrigation under scarcity conditions. Agricultural
Water Management, 113: 10-18.
Michelsen A.M. and Young R.A. (1993). Optioning Agricultural Water Rights for
Urban Water Suppliers During Drought. American Journal of Agricultural
Economics, 75: 1010-1020.
Mills E. (2005). Insurance in a climate of change. Science, 309: 1040–44.
MMA (Ministerio de Medio Ambiente) (2000). Plan Hidrológico Nacional, Spanish
Ministry of Environment.
Molina J.L., García‐Aróstegui J.L., Benavente J., Varela C., de la Hera A. and
López‐Geta J.A. (2009). Aquifers Overexploitation in SE Spain: A Proposal for
the Integrated Analysis of Water Management. Water Resources Management,
23 (13): 2737‐2760.

185
Molle F. and Berkoff J. (2006). Cities versus Agriculture: Revisiting Intersectoral Water
Transfers, Potential Gains and Conflicts. Comprehensive assessment of water
management in agriculture. Research Report 10, IWMI.
Möller-Gulland J. (2010). The Initiation of Formal Water Markets – Global experiences
applied to England. Dissertation, University of Oxford.
Mongin P. (1997). Expected Utility Theory. In: Davis J., Hands W. and Maki U. (eds.),
Handbook of Economic Methodology. Edward Elgar, London, pp. 342-350.
Moreno J.M. (2005). Evaluación preliminar de los impactos en España por efecto del
cambio climático. Ministerio de Medio Ambiente, Madrid.
Musole M. (2009). Property rights, transaction costs and institutional change:
Conceptual framework and literature review. Progress in Planning, 71: 43-85.
National Research Council (1992). Water Transfers in the West: Efficiency, Equity, and
the Environment. The National Academies Press, Washington DC, USA, 320 p.
NWC (National Water Commission) (2010). Australian Water Markets Report 2009-
2010. Australian Government, National Water Commission.
OECD (2009). Managing risk in agriculture: a holistic approach. OECD publishing.
OECD (2011). Managing Risk in Agriculture: Policy Assessment and Design. OECD
Publishing. doi: 10.1787/9789264116146-en.
OECD (2013). Water and Climate Change Adaptation: Policies to navigate uncharted
waters. OECD Studies on Water, OECD Publishing. http://www.oecd-
ilibrary.org/environment/water-and-climate-change-
adaptation_9789264200449-en
Oficina de Estudios y Políticas Agrarias (2010). Análisis del Mercado de Agua de Riego
en Chile: Una revisión crítica a través del caso de la Región de Valparaíso.
Gobierno de Chile.
Pérez-Blanco C.D. and Gómez C.M. (2012). Design of optimum private insurance
schemes as a means to reduce water overexploitation during drought events. A
case study in Campo de Cartagena (Segura River Basin, Spain). Paper presented
at 86th Annual Conference of the Agricultural Economics Society, University of
Warwick, United Kingdom, April.

186
Pérez-Blanco C.D. and Gómez C.M. (2013). Designing optimum insurance schemes to
reduce water overexploitation during drought events: a case study of La
Campiña, Guadalquivir River Basin, Spain. Journal of Environment Economics
and Policy, 2(1): 1-15.
PwC (PricewaterhouseCoopers) (2013). Impacto económico del trasvase Tajo-Segura.
Pujol J., Raggi M. and Viaggi D. (2005). Agricultural Water Markets: Exploring Limits
and Opportunities in Italy and Spain. Dipartimento di Economia e Ingegneria
Agrarie, Working Paper DEIAgraWP-05-001.
Pujol J., Raggi M. and Viaggi D. (2006). The potential impacts of markets for irrigation
water in Italy and Spain: a comparison of two study areas. Australian Journal of
Agricultural and Resources Economics, 50: 361‐380.
Quiroga S., Garrote L., Fernandez-Haddad Z. and Iglesias A. (2011). Valuing drought
information for irrigation farmers: potential development of a hydrological risk
insurance in Spain. Spanish Journal of Agricultural Research, 9(4): 1059-1075.
Qureshi M. E., Shi T., Qureshi S. and Proctor W. (2009). Removing barriers to facilitate
efficient water markets in the Murray-Darling Basin of Australia. Agricultural
Water Management, 96: 1641-1651.
Ramajo-Hernández J. and Saz-Salazar S. (2012). Estimating the non-market benefits of
water quality improvement for a case study in Spain: A contingent valuation
approach. Environmental Science & Policy, 22: 47-59.
Ranjan R. (2010). Factors affecting Participation in Spot and Options Markets for Water.
Journal of Water Resources Planning and Management, 136 (4): 454-462.
Rey D., Garrido A., Mínguez M.I. and Gómez-Ramos M. (2011). Impacts of climate
change on maize´s water needs, yields and profitability under various water
prices in Spain. Spanish Journal of Agricultural Research, 9(4): 1047-1058.
Rey D., Garrido A. and Calatrava J. (2014). The Water Markets in Spain: moving
towards 21st century mechanisms and approaches with 20th century
regulations. In: Easter K.W. and Huang Q. (eds.), Water Markets for the 21st.
Century: What Have We Learned? Springer. In press.

187
Rico M. and Gómez-Limón J.A. (2005). Los mercados de agua: análisis de los
condicionantes para su correcto desarrollo en España. Estudios Agrosociales y
Pesqueros, 206: 33-62.
Riesgo L. and Gómez-Limón J.A. (2001). Mercados de agua. Análisis de las opciones
elegidas para su aplicación en España. Available at:
http://www.conagua.gob.mx/bancosdelaguadoctos/Noticias/Analisis%20opc
iones%20elegidas%20aplicacion%20Espa%C3%B1a.pdf
Rigby D., Alcon F. and Burton M. (2010). Supply uncertainty and the economic value of
irrigation water. European Review of Agricultural Economics, 37(1): 97-117.
Rosegrant M.W. and Binswanger H.P. (1994). Markets in tradable water rights:
potential for efficiency gains in developing country water resource allocation.
World development, 22 (11): 1613-1625.
Ruiz J., Bielza M., Garrido A. and Iglesias A. (2014). Managing drought economic
effects through insurance schemes based on local water availability. Water
Resources Management (in press).
San Martín E. (2011). Un análisis económico de los trasvases de agua intercuencas: el
trasvase Tajo-Segura, Thesis, UNED, Madrid.
Sancho I. (2008). El Trasvase Tajo-Segura: debate, impacto y propuestas. Madrid, 2008.
Savenije H. and Van der Zaag P. (2002). Water as an Economic Good and Demand
Management: Paradigms with Pitfalls. Water International, 27(1): 98-104.
Singletary L. (2005). An Overview of Water Scarcity and Water Market Development.
Water Issues Education Series Nº 5, University of Nevada.
Sivakumar M.V.K. and Motha R.P. (2007). Managing Weather and Climate Risks in
Agriculture. Springer, 504 p.
Slaughter R.A. (2009). A transactions cost approach to the theoretical foundations of
water markets. Journal of the American Water Resources Association, 45(2):
331-342.
Stickney D. (2008). Formal Water Markets: Global Examples and their Potential in
Alberta. Term Paper, BUEC 663.

188
Sumpsi J.M., Garrido A., Blanco M., Varela C. and Iglesias E. (1998). Economía y
Política de Gestión del Agua en la Agricultura. MAPA and Mundi-Prensa,
Madrid, 343 p.
The Allen Consulting Group (2006). Transaction costs of water markets and
environmental policy instruments. Final Report. Available at:
http://www.pc.gov.au/__data/assets/pdf_file/0009/63099/waterstudyreport
Thobani M. (1997). Formal Water Markets: Why, When, and How to Introduce
Tradable Water Rights. The World Bank Research Observer, 12 (2): 161-179.
Thompson (2010). Water Trading: The Western US Experience. Canadian Water
Resource Association, Alberta Branch Conference. Edmon, Alberta, March 2010
Tisdell J.G. (2001). The environmental impact of water markets: An Australian case-
study. Journal of Environmental Management, 62: 113–120.
Tobarra M.A. (2008). Gestión del recurso natural agua en situaciones de información
asimétrica, racionamiento e incertidumbre. Thesis, Universidad Politécnica de
Cartagena, Murcia, Spain.
Tomkins C.D. and Weber T.A. (2010). Option contracting in the California Water
Market. Journal of Regulatory Economics, 37: 107-141.
United Nations (2010). Climate Change Adaptation: The Pivotal Role of Water. UN
Water Policy Brief.
Varela D. (2008). Recargos de las primas: funciones y criterios de cálculo. Presented at
the Course “Marketing del seguro Aspectos técnicos del cálculo de las primas
de seguros agro-pecuarios”. Madrid, CEIGRAM, 18-19th November 2008.
Water Cap & Trade (2014). Final Statement of the Water Cap & Trade Project.
Watson R. and Scarborough B. (2005). Colorado River Water Bank: Making Water
Conservation Profitable. Water as a Crop Series. PERC Case Studies.
Williamson B., Villano R. and Fleming E. (2008). Structuring Exotic Option Contracts
on Water to Improve the Efficiency of Resource Allocation in the Water Spot
Water, AARES 52nd Annual Conference, February 2008.

189
World Economic Forum (WEF) (2014), Global Risks 2014.Ninth Edition. Available at:
http://www3.weforum.org/docs/WEF_GlobalRisks_Report_2014.pdf
WWF (2005). Los mercados de aguas y la conservación del medio ambiente:
Oportunidades y retos para su implantación en España. WWF.
WWF (2007). Allocating Scarce Water: A primer on water allocation, water rights and
water markets. WWF, Water Security Series Nº 1.
WWF (2012). El fiasco del agua en el Alto Guadiana. Informe WWF. Available at:
http://awsassets.wwf.es/downloads/facsheet_compra_derechos_wwf_aguas_
_2___2_.pdf
Yoskowitz D.W. (2001). Evaluation of the Texas Water Bank. Technical Report No.13,
Texas Center for Border Economic and Enterprise Development, Texas A&M
International University.
Zeuli K.A. and Skees J.R. (2005). Rainfall Insurance: A Promising Tool for Drought
Management. Water Resources Development, 21 (4): 663–675.


191
APPENDIX 1
A: Farmer’s expected utility with no risk management tool
π 1
1
1 (a.1)
B: Expected utility and risk premium with option contract (a)
B.1)
1
1 1 1
1
1
= 1
(b.1)

192
B.2)
1
1
Z
(b.2)
C: Upper Incomplete Moment Generation Function (UIMGF)
We consider that variable follows a Gamma distribution :
Γ
Γ
Γ
(c.1)
is an exponential integral function.
Γ 1 ,
Γ ,

193
So, the expression of is:
Γ
Γ ,
Γ
Γ , Γ ,Γ
,
, (c.2)
. is the regularized gamma function, whose domain is [0,1].
D: Expected utility and risk premium with option contract (b)
If we assume that the irrigator will always exercise the option at the maturity
date when his water allotment is below , his profit function is:
w
D.1)
1
1
1 1
(d.1)

194
D.2)
1
1
(d.2)
E: Expected utility and risk premium with insurance
Farmer’s profit function in this case is:
w
E.1)
1
1
1 1
(e.1)
195
E.2)
1 1
(e.2)
F: Comparison of instruments
Comparison between the two option contracts (a) and (b)
First the comparison of the risk premiums is presented; and then the
assessment of the conditions that make one instrument more attractive to the
farmer than the other. is going to be higher than for all cases.
Intuitively, the same conclusion can be obtained, as the option contract (b)
offers higher guarantees than contract (a), allowing the farmer to purchase the
optioned volume at the maturity date with higher probability.
If , then:
1 Z
(g.1)
For to be positive, the above expression must hold (as the
numerator of the logarithm, on the right side of the expression has to be higher
than the denominator, on the left side).

196
The conditions that determine the participation of the farmer in the
option contract or the insurance are obtained:
(g.2)
If ; he would choose the option contract (b).
And if ; he would purchase the option contract (a)
( is always higher than ). The farmer would be indifferent between
them if .

197
APPENDIX 2 Table A2.1. Optimization results for several states of nature (k) under different
parameterizations of the option contract.
Volume from different sources (%)
OP
(€/m3)
Aopt,k
(hm3)
Popt
(€/m3)
T
(hm3) k
Total
volume
(hm3)
option
contract
desalinized
water Groundwater†
Rest of
sources
0.08 3 0.06-
0.3
10;15;
20 1 34.20 8.77 23.39 36.17 31.67
10;15;20 3 39.59 7.58 20.21 31.25 40.97
10 7
44.29 0 18.06 25.29 56.65
15; 20 47.29 6.34 16.92 23.68 53.06
10;15;20 13 50.00 0 7.14 22.40 70.44
10; 15;
20 18 50.00 0 0 17.90 82.10
0.06 6 0.06-
0.3
10;15;20 1 37.20 16.13 21.51 33.25 29.11
10; 15;
20 3 42.59 14.09 18.78 29.04 38.08
10 7
44.29 0 15.42 25.29 56.65
15; 20 50.00 12.00 15.42 22.40 50.18
10; 15;
20 13 50.00 0 7.14 22.40 70.44
10;15;20 18 50.00 0 0 17.90 82.10
0.04 9 0.06-
0.3
10;15;
20 1 40.2 22.39 19.90 30.77 26.94
10;15;20 3 45.59 19.74 17.55 27.13 35.58

198
10 7
44.29 0 18.06 25.29 56.65
15;20 50.00 18.00 9.42 22.40 50.18
10;15;20 13 50.00 0 7.14 22.40 70.44
10;15;20 18 50.00 0 0 17.90 82.10
0.02 12 0.06-
0.3
10;15;20 1 43.2 27.78 18.52 28.63 25.07
10;15;20 3 48.59 24.67 16.461 25.46 33.38
10 7
44.29 0 18.06 25.29 56.65
15;20 50 24.00 3.42 22.40 50.18
10;15;20 13 50 0 7.14 22.40 70.44
10;15;20 18 50 0 0 17.90 82.10
0.02 15 0.06-
0.3
10;15;
20 1 46.20
10;15;20 3 50 30.00 12.82 24.74 32.44
10 7
44.29 0 18.06 25.29 56.65
15;20 50 30.00 0 19.82 50.18
10;15;20 13 50 0 7.14 22.40 70.44
10;15;20 18 50 0 0 17.90 82.10
†Groundwater sources: private wells, drought wells and ID’s own wells.
Popt: exercise price; OP: premium, Aopt,k : optioned volume, T : trigger; k : state of nature.