water pollution control and measurment
TRANSCRIPT

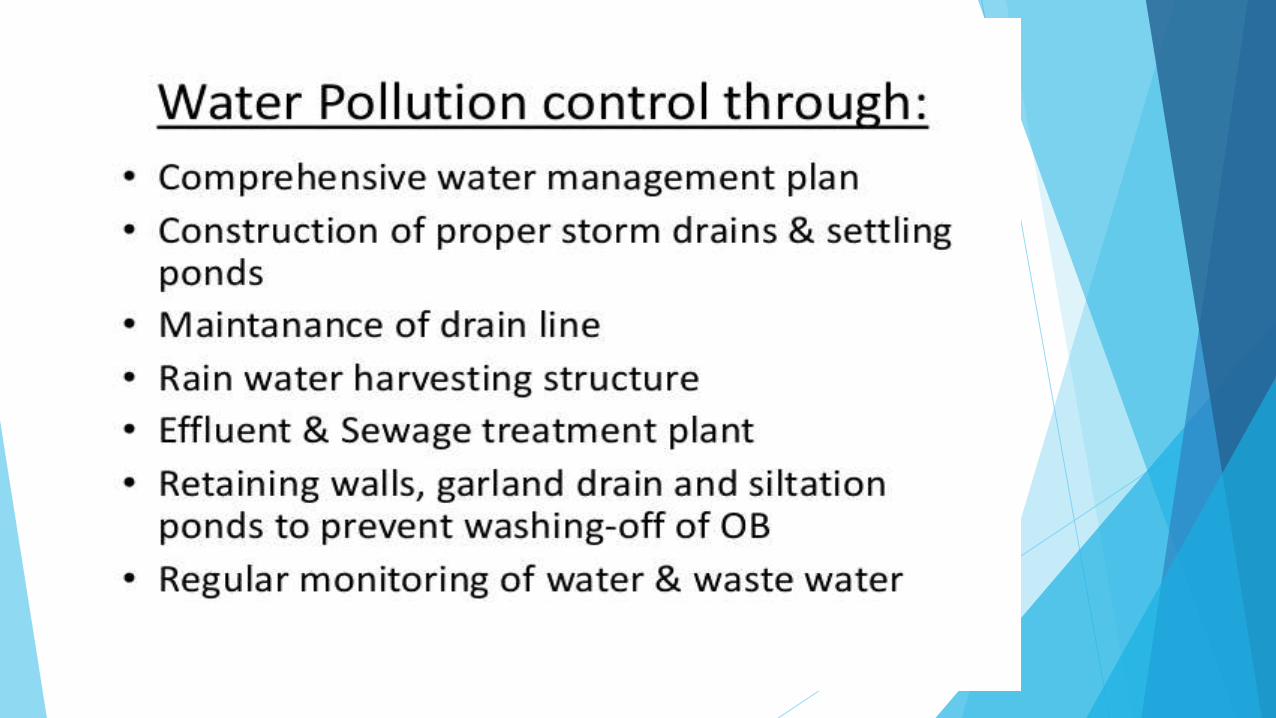
Control of water pollution
Presented by Rekha
4th semester
26 February 2015
BBAU Lucknow.

WASTEWATER


NEED FOR WATER MANAGEMENT
Today we all are facing the biggest problem that is scarcity of drinking water as the level
of water is continually decreasing.
In many countries people die because of contaminated water as they do not have any
water resources that contain pure water.
The first question comes in mind when we talk about water management is how can we
manage water. For this we need some well-planned strategies like if we know the places
where heavy rainfall occur, then we can put extra efforts there in order to save water for
future use.
Thousands of gallons of water can be saved if we keep our drainage system proper.
Many non-profit organizations are coming forward and they approach people for the
noble cause of saving water.
They educate people that how they can manage and save water in their homes. A lot of
water gets wasted due to leakage in water pipes. If we check all pipes and connections
timely, then we can avoid leakage problems.
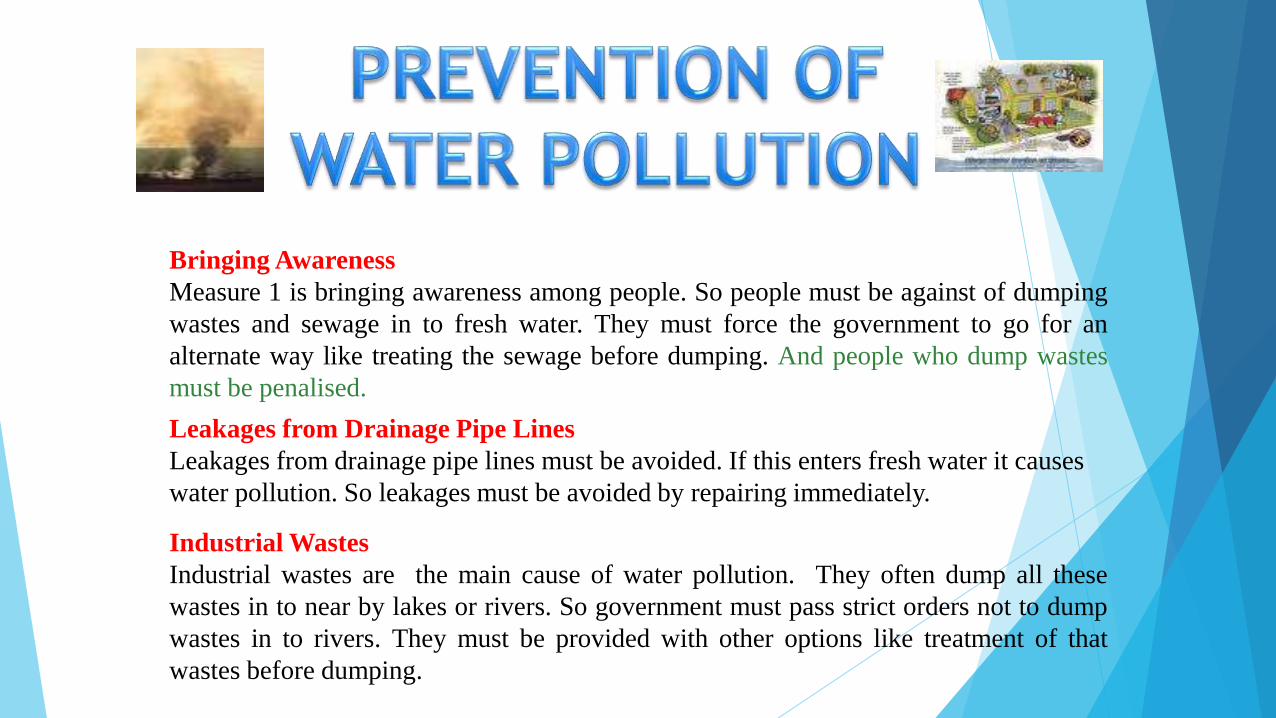
Bringing Awareness
Measure 1 is bringing awareness among people. So people must be against of dumping
wastes and sewage in to fresh water. They must force the government to go for an
alternate way like treating the sewage before dumping. And people who dump wastes
must be penalised.
Leakages from Drainage Pipe Lines
Leakages from drainage pipe lines must be avoided. If this enters fresh water it causes
water pollution. So leakages must be avoided by repairing immediately.
Industrial Wastes
Industrial wastes are the main cause of water pollution. They often dump all these
wastes in to near by lakes or rivers. So government must pass strict orders not to dump
wastes in to rivers. They must be provided with other options like treatment of that
wastes before dumping.

DON’T Use too much Pesticides
Farmers must take care and see that they don't use too much pesticides.
This will prevent runoffs of the material into nearby water sources.
Avoid Paint and Petroleum to Sinks
Do not throw paints or petroleum products in to your toilets or sinks. Since
paints and petroleum products cannot be treated they should not be
dumped to sewage water as it results in long lasting effects
Avoid Oil Spills in Oceans
Oil spills in ocean are one of the major contributors of water pollution.
So ships must transport oil only when weather conditions are good.
During storms ships must not be allowed to transport oil which might
result in shipwrecks and eventually oil spills.
GANGA ACTION PLANThe Ganga Action Plan or GAP was a program launched by Rajiv Gandhi in
1986 in order to reduce the pollution load on the river.
Human waste- domestic usage like bathing, laundry and public defecation
Industrial waste-dumping untreated waste into it.
Religious events -During festival seasons, people bathe in the Ganges to
cleanse themselves from their sins.. A Hindu belief is that dropping the ashes
of cremated bodies (at Varanasi) in the Ganges would give Moksha
(liberation) to the jiva (soul).

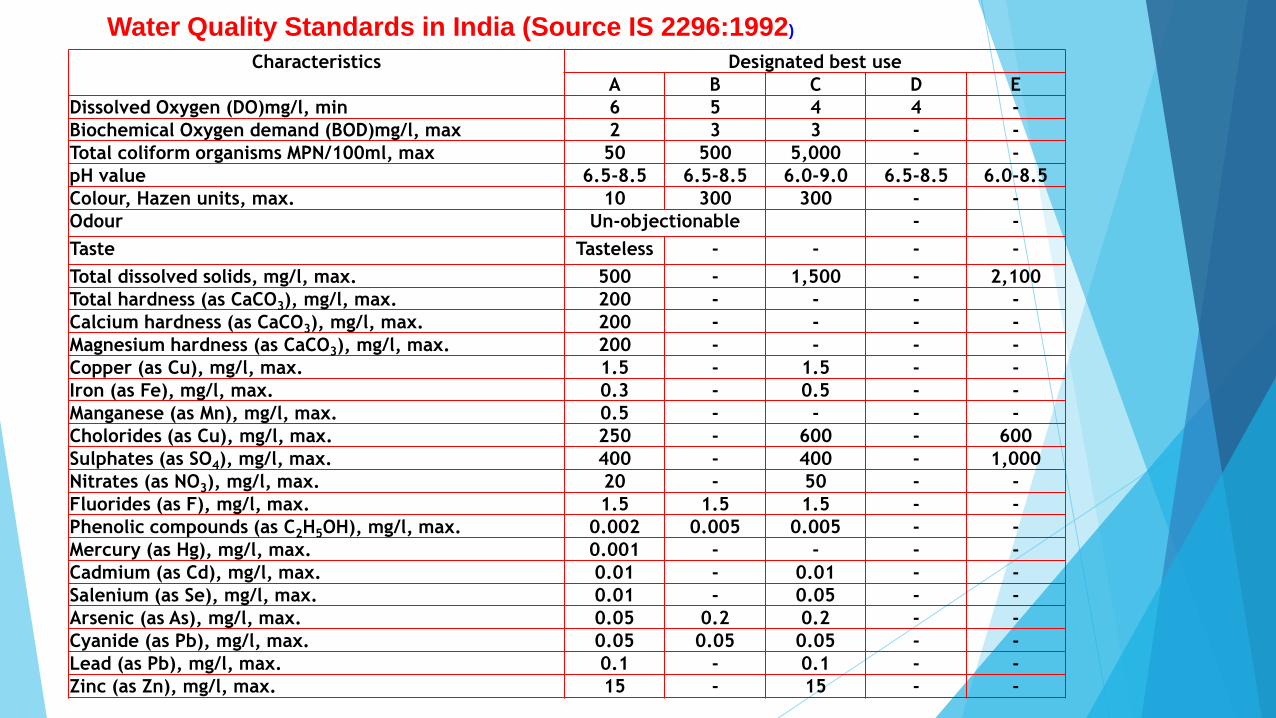
Characteristics Designated best use
A B C D E
Dissolved Oxygen (DO)mg/l, min 6 5 4 4 -
Biochemical Oxygen demand (BOD)mg/l, max 2 3 3 - -
Total coliform organisms MPN/100ml, max 50 500 5,000 - -
pH value 6.5-8.5 6.5-8.5 6.0-9.0 6.5-8.5 6.0-8.5
Colour, Hazen units, max. 10 300 300 - -
Odour Un-objectionable - -
Taste Tasteless - - - -
Total dissolved solids, mg/l, max. 500 - 1,500 - 2,100
Total hardness (as CaCO3), mg/l, max. 200 - - - -
Calcium hardness (as CaCO3), mg/l, max. 200 - - - -
Magnesium hardness (as CaCO3), mg/l, max. 200 - - - -
Copper (as Cu), mg/l, max. 1.5 - 1.5 - -
Iron (as Fe), mg/l, max. 0.3 - 0.5 - -
Manganese (as Mn), mg/l, max. 0.5 - - - -
Cholorides (as Cu), mg/l, max. 250 - 600 - 600
Sulphates (as SO4), mg/l, max. 400 - 400 - 1,000
Nitrates (as NO3), mg/l, max. 20 - 50 - -
Fluorides (as F), mg/l, max. 1.5 1.5 1.5 - -
Phenolic compounds (as C2H5OH), mg/l, max. 0.002 0.005 0.005 - -
Mercury (as Hg), mg/l, max. 0.001 - - - -
Cadmium (as Cd), mg/l, max. 0.01 - 0.01 - -
Salenium (as Se), mg/l, max. 0.01 - 0.05 - -
Arsenic (as As), mg/l, max. 0.05 0.2 0.2 - -
Cyanide (as Pb), mg/l, max. 0.05 0.05 0.05 - -
Lead (as Pb), mg/l, max. 0.1 - 0.1 - -
Zinc (as Zn), mg/l, max. 15 - 15 - -
Water Quality Standards in India (Source IS 2296:1992)

ParameterWorld Health
OrganizationEuropean Union United States China
Arsenic 10μg/l 10 μg/l 10μg/l 50μg/l
Antimony ns 5.0 μg/l 6.0 μg/l “
Boron 2.4mg/l 1.0 mg/L “ “
Cadmium 3 μg/l 5 μg/l 5 μg/l 5 μg/l
Chromium 50μg/l 50 μg/l 0.1 mg/L 50 μg/l (Cr6)
Copper “ 2.0 mg/l TT 1 mg/l
Cyanide “ 50 μg/l 0.2 mg/L 50 μg/l
Fluoride 1.5 mg/l 1.5 mg/l 4 mg/l 1 mg/l
Lead “ 10 μg/l 15 μg/l 10 μg/l
Mercury 6 μg/l 1 μg/l 2 μg/l 0.05 μg/l
Nickel “ 20 μg/l “ “
Nitrate 50 mg/l 50 mg/l 10 mg/L (as N) 10 mg/L (as N)
Nitrite “ 0.50 mg/l 1 mg/L (as N) “
Pesticides
(individual)“ 0.10 μg/ l “ “
Pesticides — Total “ 0.50 μg/l “ “
Selenium 40 μg/l 10 μg/l 50 μg/l 10 μg/l

MEASUREMENT OF WATER POLLUTION.
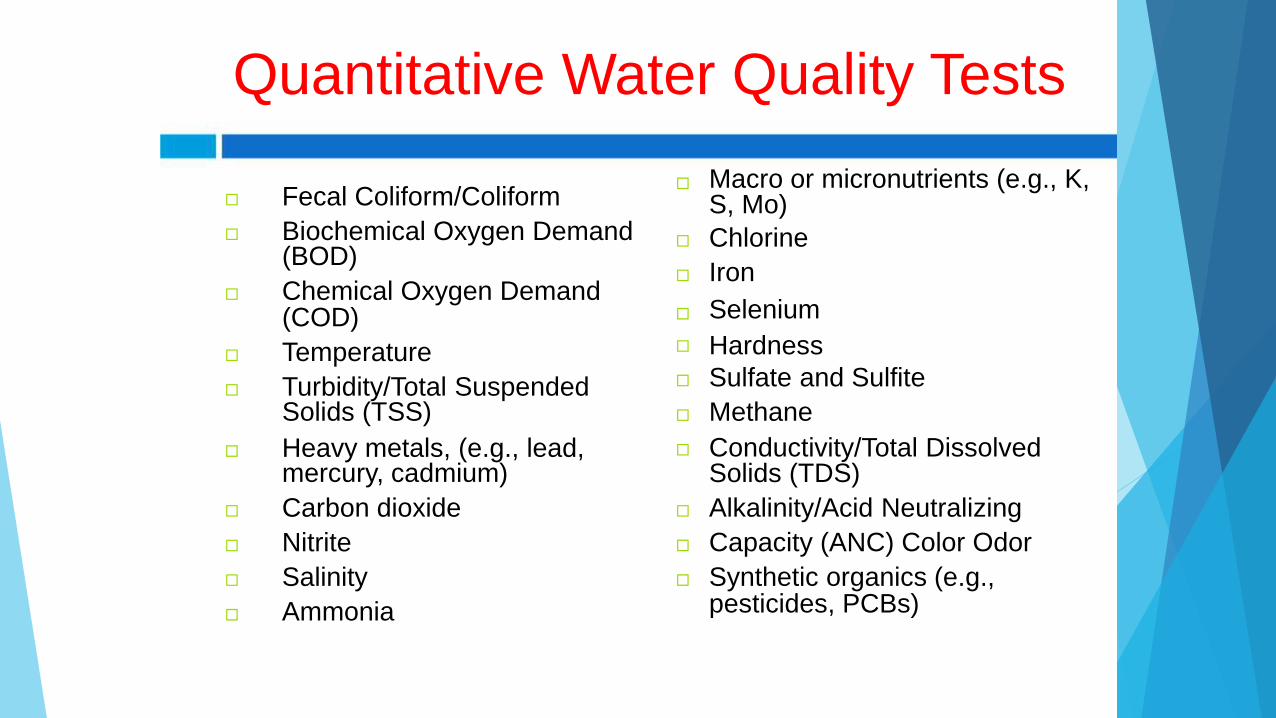
Quantitative Water Quality Tests
Fecal Coliform/Coliform
Biochemical Oxygen Demand(BOD)
Chemical Oxygen Demand(COD)
Temperature
Turbidity/Total SuspendedSolids (TSS)
Heavy metals, (e.g., lead,mercury, cadmium)
Carbon dioxide
Nitrite
Salinity
Ammonia
Macro or micronutrients (e.g., K,S, Mo)
Chlorine
Iron
Selenium
Hardness
Sulfate and Sulfite
Methane
Conductivity/Total DissolvedSolids (TDS)
Alkalinity/Acid Neutralizing
Capacity (ANC) Color Odor
Synthetic organics (e.g.,pesticides, PCBs)

pH
Measures hydrogen ion concentration
Negative log of hydrogen ion concentration
Ranges from 0 to 14 std. units
pH
7 neutral
0 - 7 acidic
7 - 14 alkaline
Thanks to Phil Brown

Solubility of Specific Ions Based on Water pH
Toxic metals less available in water at pH 6 to 8.
pH - Scientists measure pH to determine the
concentration of hydrogen in the water. Most waters
range from 6.5 to 8.5. Changes in pH can affect how
chemicals dissolve in the water and whether organisms
are affected by them. High acidity can be deadly to fish
and other aquatic organisms.
Low pH - corrosion, metallic taste
High pH – bitter/soda taste, depositsa decrease in pH
(below 6) may increase the amount of mercury soluble in
water. An increase in pH (above 8.5) enhances the
conversion of nontoxic ammonia (ammonium ion) to a
toxic form of ammonia (un-ionized ammonia).
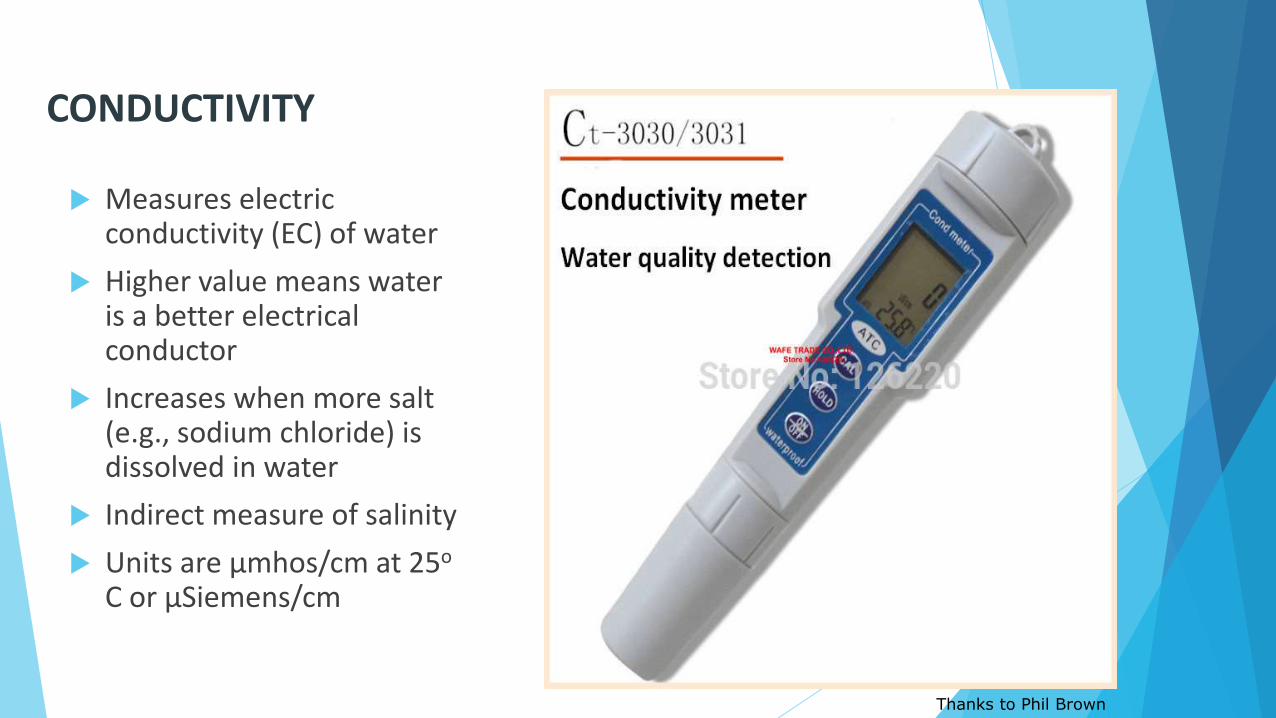
CONDUCTIVITY
Measures electric conductivity (EC) of water
Higher value means water is a better electrical conductor
Increases when more salt (e.g., sodium chloride) is dissolved in water
Indirect measure of salinity
Units are μmhos/cm at 25o
C or μSiemens/cm
Thanks to Phil Brown
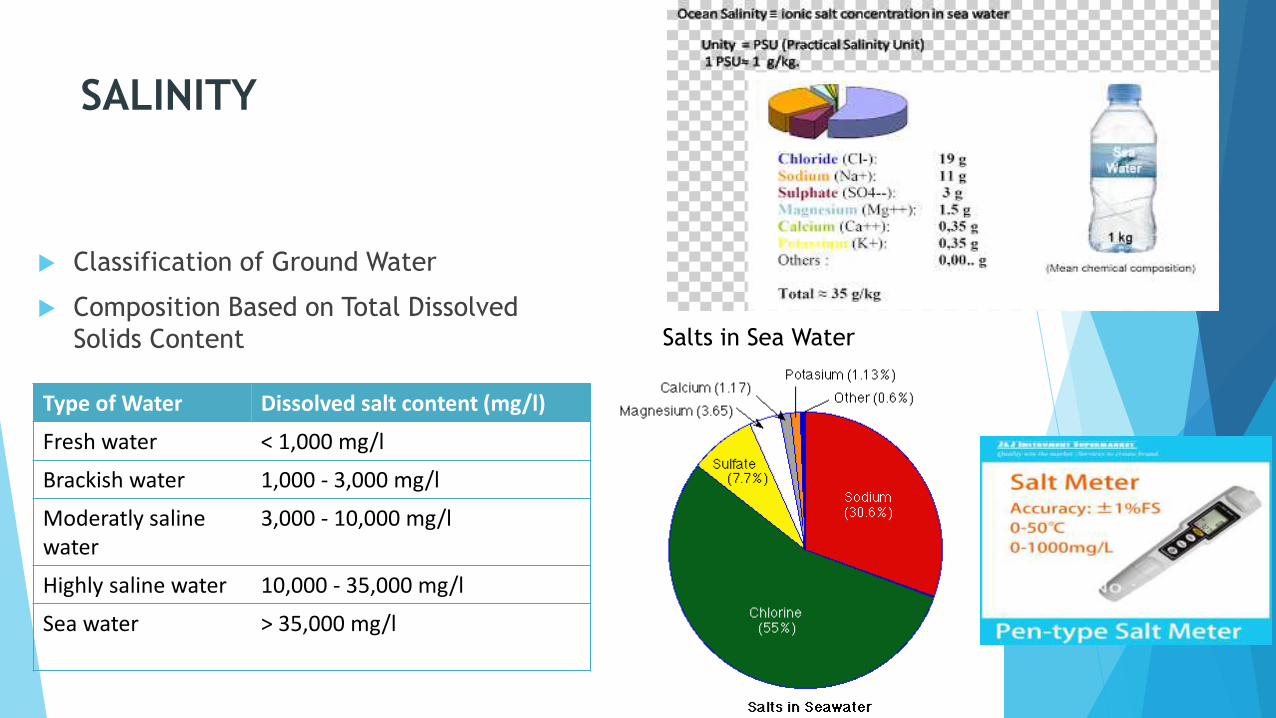
SALINITY
Classification of Ground Water
Composition Based on Total Dissolved
Solids Content Salts in Sea Water
Type of Water Dissolved salt content (mg/l)
Fresh water < 1,000 mg/l
Brackish water 1,000 - 3,000 mg/l
Moderatly saline water
3,000 - 10,000 mg/l
Highly saline water 10,000 - 35,000 mg/l
Sea water > 35,000 mg/l

TURBIDITY
Turbidity is a measure of the amount of total suspended solid (TSS) particles in the water. Algae, suspended sediment, and organic matter particles can cloud the water making it more turbid.
Suspended particles diffuse sunlight and absorb heat. This can increase temperature and reduce light available for algal photosynthesis.
If the turbidity is caused by suspended sediment, it can be an indicator of erosion, either natural or man-made. Suspended sediments can clog the gills of fish. Once the sediment settles, it can foul gravel beds and smother fish eggs and benthic insects. The sediment can also carry pathogens, pollutants and nutrients
The units of turbidity from a calibrated nephelometer are called Nephelometric Turbidity Units (NTU).

TURBIDITY Measured in Nephelometric Turbidity Units (NTU)
Estimates light scattering by suspended particles
Photocell set at 90o to the direction of light beam to estimate scattered rather than absorbed light
Good correlation with concentration of particles in water.
Thanks to Phil Brown

Temperature
If the temperature gets too hot or too cold for some organisms, theydie. Temperature also can affect the chemistry of the water. Forexample, warm water holds less oxygen than cold water. A healthycluster of trees and vegetation next to a stream or river helps keeptemperatures cool for trout and other fish.
Temperatures can increase the solubility and thus toxicity of certaincompounds. These elements include heavy metals such as cadmium,zinc and lead as well as compounds like ammonia .
Water temperature can not only increase the solubility of toxiccompounds, but it can also influence an organism’s tolerance limit .
Mortality rates for zinc are significantly higher at temperaturesabove 25°C than at temperatures below 20°C . This occurs becausetissue permeability, metabolic rate and oxygen consumption allincrease with increased water temperature.
In one study on labeo bata fish, the 24 hour 50% lethalconcentration (LC50) at 15°C was 540 mg/L, while at 30°C, theLC50 dropped to 210 mg/L .
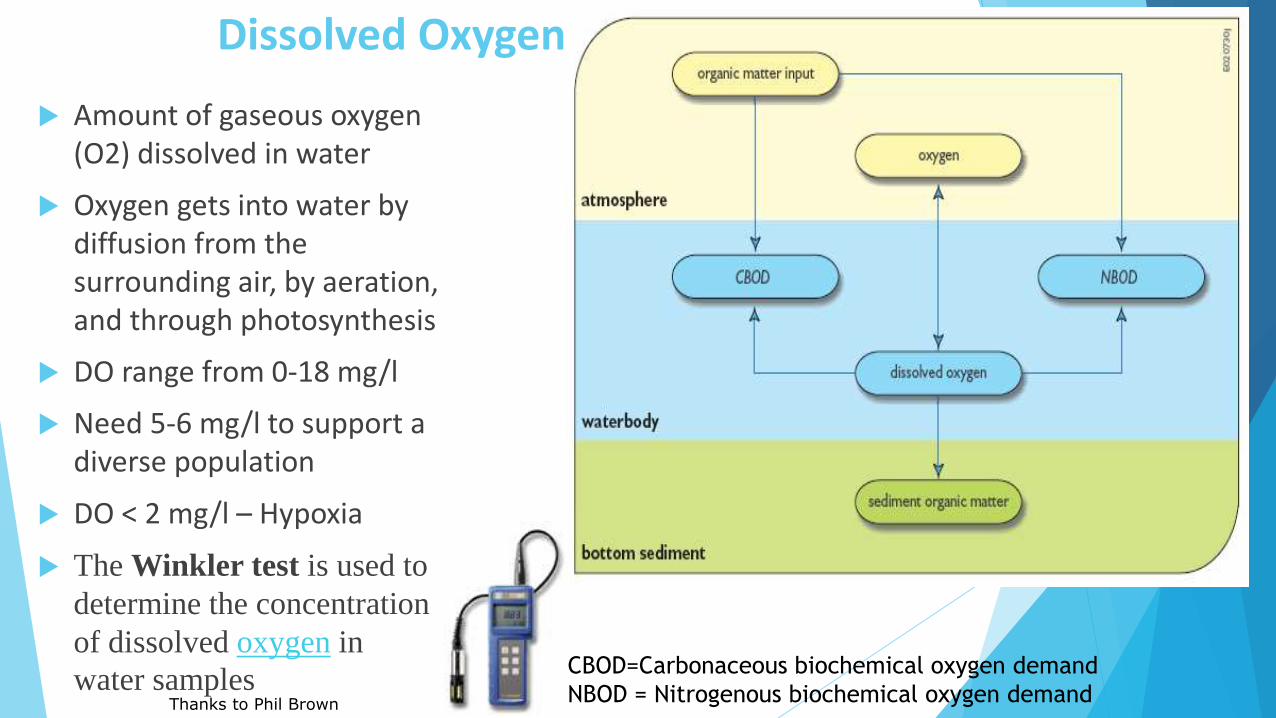
Dissolved Oxygen
Amount of gaseous oxygen (O2) dissolved in water
Oxygen gets into water by diffusion from the surrounding air, by aeration, and through photosynthesis
DO range from 0-18 mg/l
Need 5-6 mg/l to support a diverse population
DO < 2 mg/l – Hypoxia
The Winkler test is used to
determine the concentration
of dissolved oxygen in
water samplesThanks to Phil Brown
CBOD=Carbonaceous biochemical oxygen demand
NBOD = Nitrogenous biochemical oxygen demand

Biochemical oxygen demand (BOD) Measures oxygen required for biological oxidation of
biodegrable compounds.
BOD: oxygen uptake by microorganism during aerobic growth in ww sample
Standard BOD: 5 day incubation @ 20°C
Samples require a series of dilutions to achieve suitable oxygen consumption
Pure water BOD = 1 ppm
Polluted water BOD = 5 ppm or above
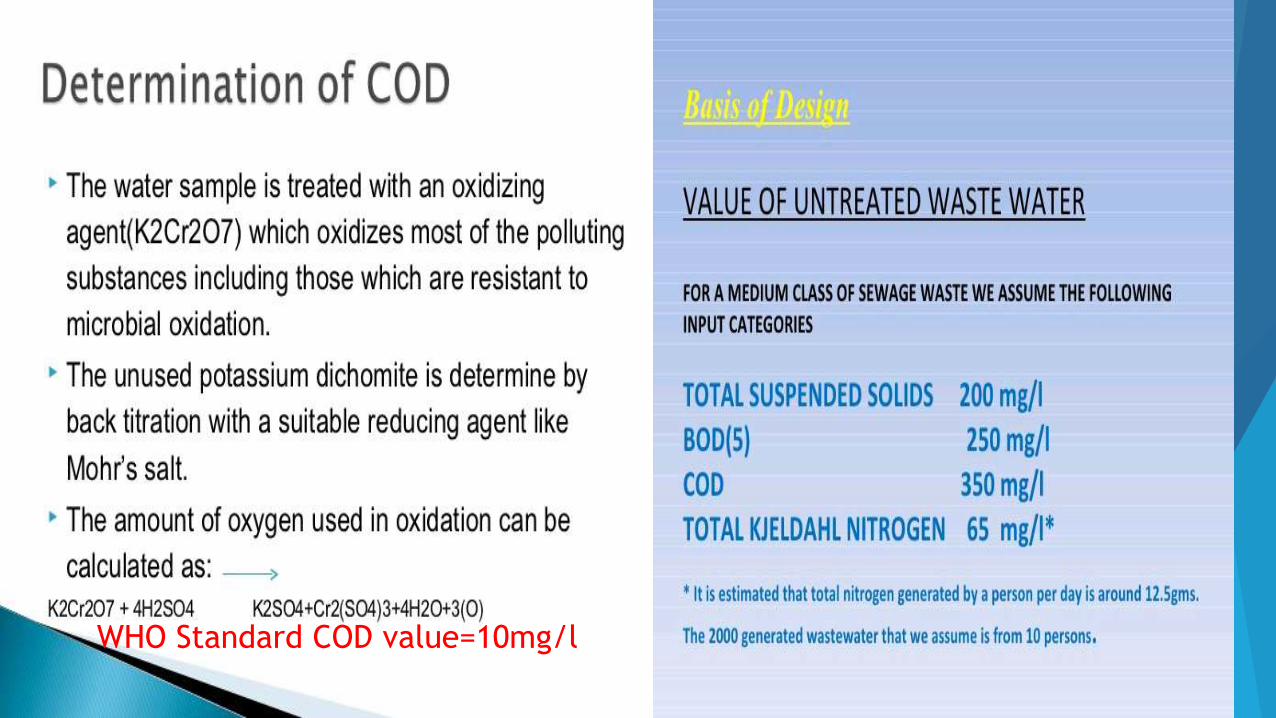
WHO Standard COD value=10mg/l
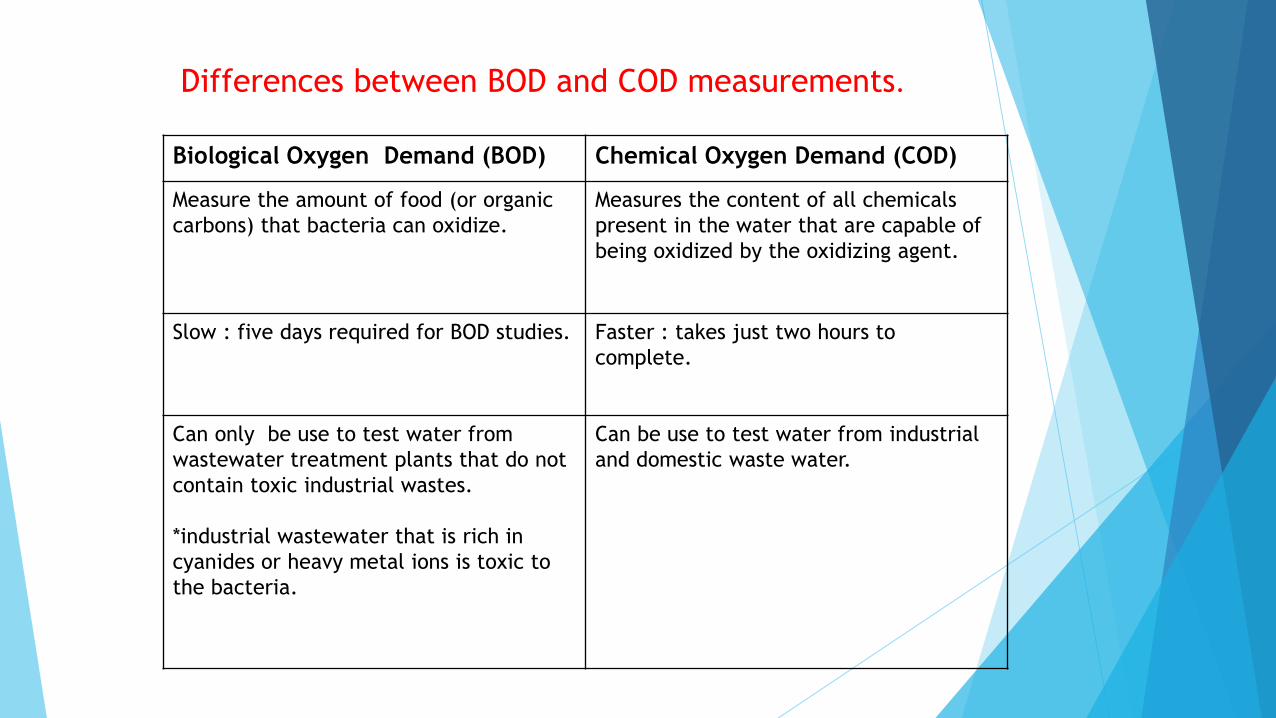
Differences between BOD and COD measurements.
Biological Oxygen Demand (BOD) Chemical Oxygen Demand (COD)
Measure the amount of food (or organic
carbons) that bacteria can oxidize.
Measures the content of all chemicals
present in the water that are capable of
being oxidized by the oxidizing agent.
Slow : five days required for BOD studies. Faster : takes just two hours to
complete.
Can only be use to test water from
wastewater treatment plants that do not
contain toxic industrial wastes.
*industrial wastewater that is rich in
cyanides or heavy metal ions is toxic to
the bacteria.
Can be use to test water from industrial
and domestic waste water.

Toxicity
Toxic Substances - Scientists also test for many harmful (toxic) things like metal, pesticides, andoil. For example, scientists are finding mercury in certain types of fish, especially in lakes andestuaries. Mercury comes from mining, natural sources and air harmful substances are aproblem in a stream, lake or bay.
Nutrients - The two major nutrients scientists measure are nitrogen and phosphorus. The presence of too many nutrients can hurt aquatic organisms by causing lots of algae to grow in the water. Nutrients can also affect pH, water clarity and temperature, and cause water to smell and look bad.
Algae blooms
DO changes, fish kills
Shift of trophic status toward eutrophication.
Drinking water impairment (direct and indirect)
Aesthetics (color, clarity, smell)
Uptake and release of toxics

Fecal coliform and total coliform
Increased levels of fecal coliforms (fecal bacteria) provide a warning of failure
in water treatment, a break in the integrity of the distribution system, or
possible contamination with pathogens.
The assay is intended to be an indicator of fecal contamination, or more
specifically E. coli which is an indicator microorganism for other pathogens
that may be present in feces.
EPA acceptable Levels is 0 colonies.
Total coliform bacteria, fecal coliform bacteria, and E. coli are all considered
indicators of water contaminated with fecal matter. Contaminated water may
contain other pathogens (micro-organisms that cause illness) that are more difficult
to test for. Therefore these indicator bacteria are useful in giving us a measure of
contamination levels

Indicator species Amphibians
Include frogs, toads,
salamanders, newts, and
gymnophiona, and are cold-
blooded animals that
metamorphose from a juvenile,
water-breathing form to an
adult, air-breathing form.
Are indicator species of
ecological conditions relating
to global warming, air
pollution chemicals, stormwater
runoff, and newly extant
diseases (e.g. fungus).

Control of water pollution act
Safe Water Drinking Act 1974
Established maximum contaminate levels
Regulated volatile organic compounds
Required lead-free plumbingWell-head protection
Clean water act 1972
Restore and maintain the chemical, physical, and biologicalintegrity of the nations water.
provide enforcement mechanisms (e.g. civil actions/criminalpenalties) to ensure.
Reduce polluted runoff from urban areas and animal feedingoperations.

Water Pollution Control Policy:
Domestic Dimension [U.S.]
Water Pollution Control Act, 1956
(i) Federal financial support for construction of waste treatment plants
focused on a control strategy based on subsidizing construction of waste treatment plants as a particular control activity.
Municipalities would receive grant of upto 55% for construction of waste treatment plants.
(ii) Enforcement conference mechanism
sought to effect direct federal regulation of waste discharges
Federal authority could call for a conference of interstate water pollution problem.