water quality accounts for south - statistics south africa
TRANSCRIPT
Published by Statistics South Africa, Private Bag X44, Pretoria 0001
© Statistics South Africa, 2005
Users may apply or process this data, provided Statistics South Africa (Stats SA) is acknowledged as the original source of the data; that it is specified that the application and/or analysis is the result of the user's independent processing of the data; and that neither the basic data nor any reprocessed version or application thereof may be sold or offered for sale in any form whatsoever without prior permission from Stats SA.
Natural resource accounts: Water quality accounts for South Africa, 2000
A complete set of Stats SA publications is available at Stats SA Library and the following libraries: National Library of South Africa, Pretoria Division National Library of South Africa, Cape Town Division Library of Parliament, Cape Town Bloemfontein Public Library Natal Society Library, Pietermaritzburg Johannesburg Public Library Eastern Cape Library Services, King William's Town Central Regional Library, Polokwane Central Reference Library, Nelspruit Central Reference Collection, Kimberley Central Reference Library, Mmabatho
This discussion document is available on the Stats SA website: www.statssa.gov.za
Copies are available from: Printing and Distribution, Statistics South Africa Tel: (012) 310 8044 / 310 8161 (012) 310 8161 Fax: (012) 321 7381 Email: [email protected]
Statistics South Africa i
Preface
This discussion document contains water quality accounts for South Africa for the reference year 2000. The monitoring and assessment of the quality of water resources is critically important for the determination of their fitness-for-use for various water use sectors.
The different characteristics of a water resource qualify it for some ecological and/or economic uses but not for others. Some water can be drunk without treatment; somecan ensure life for certain aquatic species; a third source is already so polluted that it can be used only for cooling, etc. Therefore, water ‘quality’ is not an objective characteristic and attributing a quality to a water resource is a normative task: the waterresource has to be evaluated against its potential uses.
The water accounts in physical terms for the 19 water management areas of South Africa for the hydrology year 2000, constructed according to the recommendations of the United Nations, System of Environmental and Economic Accounting, werepublished in 2004. The report described the flow of water, which is the supply, use and water assets.
This document envisages assigning quality to the flow of water. By linking thisdocument with the previously published report one could establish the link between the flow of water in the system and the quality thereof. Due to data constraints this was notpossible to do.
Water quality accounts for South Africa, 2000
Statistics South Africa ii
Abbreviations and acronyms
Ca calciumCl chlorideDOH Department of Health DWAF Department of Water Affairs and Forestry EC electrical conductivityF fluoride K potassiumMg magnesiummg/l milligram per litremS/m milliSiemens per metreN03+N02 nitrate plus nitriteNa sodiumNH4 ammoniumNRA natural resource accounting NTU nephelometric turbidity unitsRSA Republic of South Africa SAR sodium adsorption ratioSEEA System of Environmental and Economic Accounting SNA System of National Accounting SO4 sulphateSRU standard river unitStats SA Statistics South Africa TDS total dissolved solids TWQR Target Water Quality Range WMA water management area WRC Water Research Council
Water quality accounts for South Africa, 2000
Statistics South Africa iii
ContentsPreface.............................................................................................................................. iAbbreviations and Acronyms ....................................................................................... ii
1 Introduction.........................................................................................................12 Conceptual framework.......................................................................................23 International guidelines......................................................................................3
3.1 System of National Accounts..........................................................................3 3.2 International practices.....................................................................................33.3 System of Integrated Environmental and Economic Accounting...................3
4 Principles of water quality accounting..............................................................65 National water quality monitoring programmes .............................................76 Assessment methodology....................................................................................8
6.1 South Africa’s water management areas.........................................................86.2 Assessment basis.............................................................................................9
7 Typical water quality pollutants in South Africa...........................................107.1 Quality of surface water................................................................................107.2 Quality of groundwater .................................................................................11
8 Detailed tables ...................................................................................................129 Data collection, availability and problems experienced ................................3210 Concluding remarks .........................................................................................3311. Glossary .............................................................................................................3412. References..........................................................................................................36Annexure 1: Water quality account for a WMA, 2000 ............................................37Annexure 2: Water quality account for South Africa, 2000 ....................................38Annexure 3: Water quality criteria ............................................................................39Annexure 4: Domestic ‘health set’ ..............................................................................40 Annexure 5: Domestic ‘salinity set’ ............................................................................42Annexure 6: Water quality guidelines applicable to irrigated agriculture ............43
Water quality accounts for South Africa, 2000
Statistics South Africa iv
List of water quality account tables
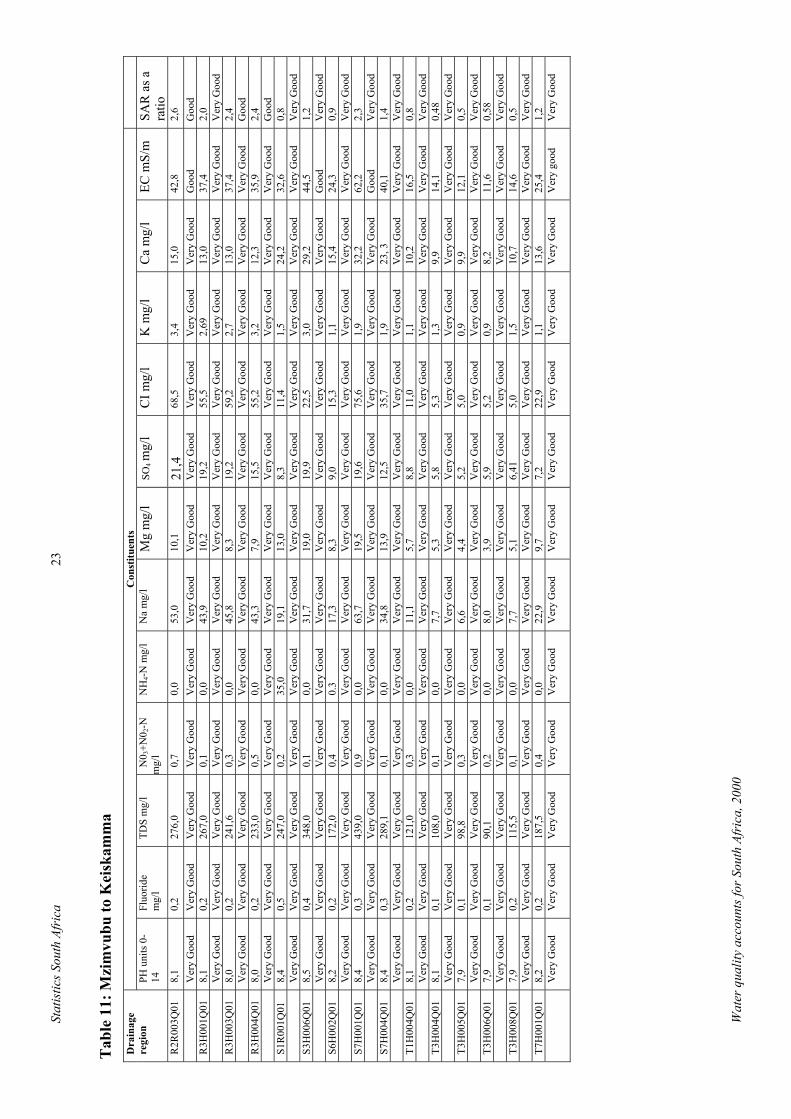
Table 1: Limpopo 13 Table 2: Luvhuvu and Letaba 14 Table 3: Crocodile and Marico 15 Table 4: Olifants 16 Table 5: Inkomati 17 Table 6: Usuthu to Mhlatuze 18 Table 7: Thukela 19 Table 8: Upper Vaal 20 Table 9: Middle Vaal 21 Table 10: Mvoti to Umzimkulu 22 Table 11: Mzimvubu to Keiskamma 23 Table 12: Upper Orange 24 Table 13: Lower Orange 25 Table 14: Fish to Tsitsikamma 26 Table 15: Gouritz 28 Table 16: Olifants/Doorn 29 Table 17: Breede 30 Table 18: Berg 31
Water quality accounts for South Africa, 2000
Statistics South Africa 1
1 Introduction Water is a vital natural resource, since it is fundamental to any form of life. Categories of water resources include surface water, groundwater, water in impoundments and precipitation. Water has a number of particular characteristics which call for specifictreatment in a resource account. It forms one of the ecosystem inputs1 recorded in the System of Environmental and Economic Accounting (SEEA). In addition to the consumption of water by households, the resource is used in many industrial and agricultural processes. In most cases, and perhaps increasingly in future, water is paid for and represents an intermediate expenditure on a product. Not all categories of water resources are measurablein terms of stock levels, and comprehensive valuations are unlikely at the moment. This will be addressed when evaluation strategies are formulated.
The hydrological cycle adds to water supply by river inflows and precipitation and deducts from it by outflows and evapotranspiration. Other major deductions come from abstractions for economic use, but eventually almost all water abstracted for economic use is returned to the environment. Traditionally it has been supposed that the abstraction of water for economic purposes is marginal compared with the natural recycling of water as it movesdown rivers, evaporates and falls again as precipitation. Increasingly there is a concern that this may not be so, at least at some locations and at some times. This is where a supplementary2 set of physical accounts can be extremely valuable. As with soil resources,much interest in water accounts focuses on the quality of water and not just the quantity available.
More important than measuring the sheer volume of water may be measures of water quality, but measuring water quality is fraught with definitional problems. Water not fit for humanconsumption may be perfectly satisfactory for some other uses. The use to which water canbe put depends crucially on its quality e.g. water used for hydro-electric power generation, industrial purposes and transportation does not require high standards of purity, whereasother uses, such as drinking, recreation, and habitats for aquatic organisms, rely on higher levels of purity.
Water quality accounts can assist in the analysis and design of sustainable water quality development strategies: ‘If you can’t measure it you can’t manage it’. This principle appliesas much to water resources management as to managing any other kind of human endeavour. Monitoring and assessing of water quality should be an integral part of water resourcesmanagement. In South Africa this is stated explicitly in the National Water Act (NWA), Act No. 36 of 1998, which mandates the Minister of Water Affairs and Forestry to establish national monitoring systems that monitor, record, assess and disseminate information on water resources.
This discussion document focuses on the typical water quality problems predominant in South Africa, followed by a brief overview of the principles of water accounting, the nationalwater quality monitoring programme and the methodology that was followed in this assessment. It concludes with an explanation of the conceptual framework and internationalguidelines applicable in this area of natural resource accounting, and an overview of therelevant available datasets in South Africa.
1 Ecosystem inputs are natural resources that provide direct use benefits.2 Water Resource accounts comprise stock and flows in physical terms and quality accounts.
Water quality accounts for South Africa, 2000
Statistics South Africa 2
2 Conceptual frameworkEnvironmental accounts can facilitate an integrated approach to a range of issues. These include a broader assessment of the consequences of economic growth, the contribution of sectors to particular problems and the sectoral implications of environmental policy measures (for example, regulation charges and incentives). The advantage of an environmental accountis that by linking together physical data and monetary data in a consistent framework it is possible to undertake scenario modeling. Issues that could be modeled include assessing the efficiencies in different sectors of the economy, and environment and resource implicationsof structural change.
The 1993 System of National Accounts (1993 SNA) supports policy-making at a national level; however, historically the methods have had little regard for environmental matters. The main aim of environmental accounting is to assess the sustainability of activities andeconomic growth by quantifying the depletion and degradation of a natural resource. An environmental account provides an information system that links the economic activities and uses of a resource to changes in the natural resource base.
Environmental accounts extend the boundaries of the 1993 SNA framework to include environmental resources, which occur outside the production and asset boundaries typically measured in such an analysis.
The development of physical accounting has risen from the desire to assess the sustainabilityof economic activities and their interaction on the depletion and degradation of naturalresources. Environmental accounting provides an integrated information system to link environmental and resource issues to economic data sets such as a country’s national accounts. This facilitates policy-making and analysis of the interaction between developmentand environmentally sound and sustainable economic growth.
Water quality accounts for South Africa, 2000
Statistics South Africa 3
3 International guidelines
3.1 System of National Accounts The internationally accepted set of guidelines for the preparation of national accounts is the 1993 SNA. This substantial work represents the efforts of five international economicorganisations to define the scope of national accounts and provide guidance on the concepts and methods to be used in their compilation.
For the first time since such international guidelines have been published, the 1993 SNAexplicitly discusses the incorporation of environmental information into the nationalaccounts. In fact, two sets of environment-related guidelines are presented. The first set deals with the incorporation of natural resource assets into balance sheet accounts. The second set,which is more far-reaching, describes the development of a ‘satellite system for integrated environmental and economic accounting’.
3.2 International practicesThe data collected from a sampling point is attributed to a stretch of watercourse. A simplistic way of attribution could be to attribute it to the portion between this point and the next sampling point downstream or upstream; or to a stretch centred at the measurement point. But the attribution can also be done in a more sophisticated manner, e.g. a model that takes into account the behaviour of different physicochemical determinants. When quality classes have been attributed to each stretch, the next step is to assign a quality class to the wholewatercourse, the whole river basin or the total national inland waters.
In France, quality was assessed against several families of parameters. One of them, the ‘organic matter indicator’, takes into consideration the following parameters: dissolvedoxygen, biochemical oxygen demand (BOD) at five days, chemical oxygen demand (COD) and ammonium ions (NH4). Other families of parameters were also tested, notably an euthrophication indicator. The parameter values were grouped into five quality classes, noted 1A (the best), 1B, 2, 3, and not classified (NC). Each stretch of watercourse was described by a quality class and a weight (depending on the length and outflow of the stretch) and, by adding the total weights for each class, the whole French water system could be broken down into five quality classes based on this family of parameters.
3.3 System of Integrated Environmental and Economic Accounting
The System of Integrated Environmental and Economic Accounting developed by the United Nations has two major objectives.
The first major objective of the SEEA is recognition of the standard SNA framework to better serve environmental analysis. One purpose of this reorganization is to make explicit the expenditures on environmental protection activities that prevent and mitigate environmentaldeterioration or restore the environment. A second purpose is to present in detail the values of natural resources asset stocks and annual changes in the volume of these stocks. This isclosely related to the 1993 SNA’s recommendation to include natural resource asset values innational balance sheet accounts.
Water quality accounts for South Africa, 2000
Statistics South Africa 4
The second major objective of the SEEA is the description of the interaction between the economy and the environment in physical terms. There is a strong emphasis in this component on the use of input–output accounting techniques to link physical data on resource use and waste production to economic data from the standard National Accounts.
The final major objective of the SEEA is the calculation of an environmentally adjusted measure of Net Domestic Product. This is essentially the traditional Net Domestic Product aggregate of the national accounts adjusted for depletion of natural resources and degradation of the environment.
According to the SEEA, the general structure of quality accounts is conceptually simplehowever, it presents numerous problems of measurements. Temporal and spatial considerations play important roles in water quality and should be taken into account when compiling quality accounts. The quality of a river, for example, might increase enormouslyduring particular weather conditions, and decrease rapidly when the conditions change.
Water Quality Accounts are done in the same way as the Asset Account (including an opening stock, changes in stock and a closing stock). Once quality classes are defined, water quality accounts can be constructed following the same general structure as an asset account. The accounts show the opening and closing stocks together with the changes in stocks during the accounting period for each quality class. Annexures 1 and 2 give examples of the water quality account framework for one water management area and for South Africa respectively.
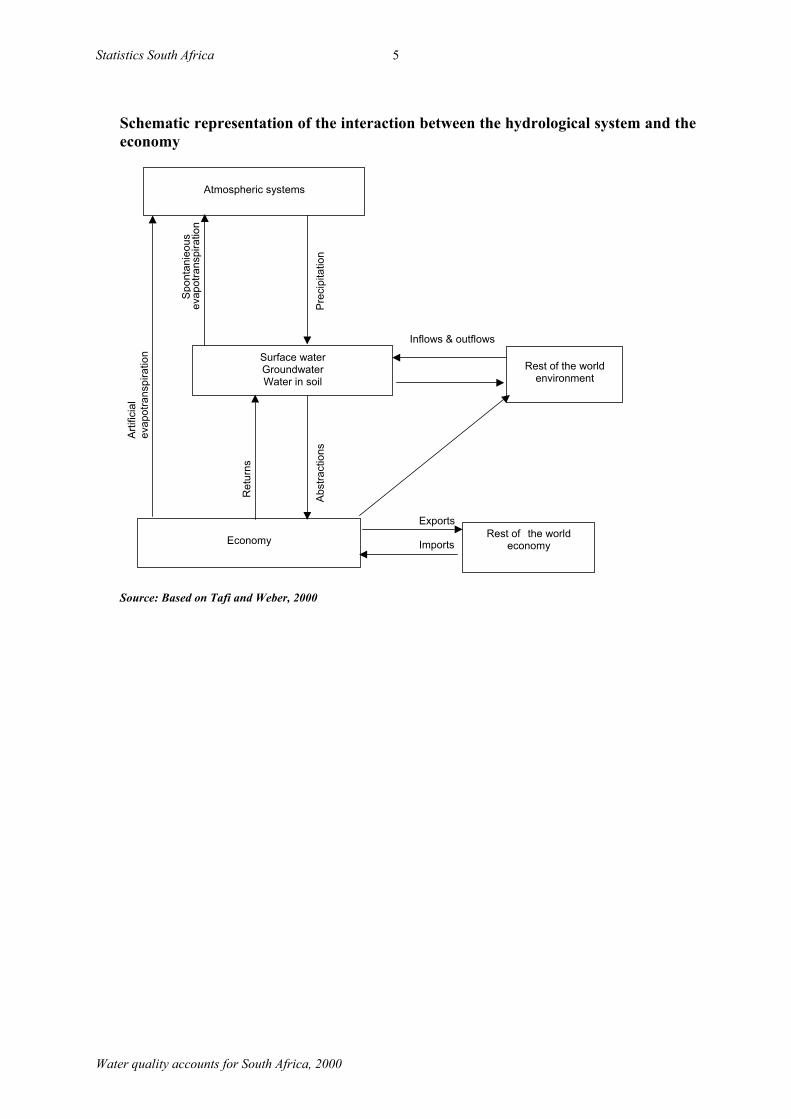
The exchanges of water between the environment and the economy include direct abstraction, irrigation, and returns of water to groundwater, surface water, the sea and brackish water. The passive uses of water by the economy which do not involve direct abstraction, such asrecreation or transportation, are not considered here. The storage and release of water in damsare not considered to take place within the economy but within the hydrological system. Thisis because it is difficult to make a distinction between the direct economic use of the waterand what is required for regulating the discharge of the rivers for, say, flood prevention or to support runoff in summer, as illustrated by the next diagram.
Water quality accounts for South Africa, 2000
Statistics South Africa 5
Schematic representation of the interaction between the hydrological system and the economy
Arti
ficia
l
Spo
ntan
ieou
sev
apot
rans
pira
tion
Pre
cipi
tatio
n
Inflows & outflows
evap
otra
nspi
ratio
n
Ret
urns
Abs
tract
ions
Exports
Imports
Atmospheric systems
Surface waterGroundwaterWater in soil
Economy Rest of the worldeconomy
Rest of the worldenvironment
Source: Based on Tafi and Weber, 2000
Water quality accounts for South Africa, 2000
Statistics South Africa 6
4 Principles of water quality accounting
Water quality accounts describe a specific aspect of the state of an inland water system. They enable the comparison of the quality of water resources between different inland water systems and the assessment of the evolution of the same water system between two dates. Quality accounting is specific to various use sectors (see Annexure 3). As quality is not an additive characteristic, the general way to construct assets accounts is to define quality classes. These are then applied to the same structure as an asset account in quantity terms,with the quality as another dimension. The account then shows the opening and closing stocks together with the changes in stocks during the accounting period for each quality class.
Quality accounting is particularly useful for following the evolution of the quality of waterresources and judging the efficiency of the measures taken to protect or improve the state ofwater bodies. Combined with emission accounts (and in particular when both accounts aredeveloped at the level of a river basin), quality accounts enable the analysis of impacts of economic activities, which itself helps in the elaboration of new measures.
Two steps are generally used to describe the quality of a water system:a) defining quality and quality classes,b) defining units, enabling the aggregation of water volumes sorted by quality classes.
A methodology for defining units enabling aggregation of water volumes sorted by qualityclasses, initiated by the French Institute for the Environment (Ifen), has been successfully tested in other European countries (England, Wales, Ireland and Slovenia). This methodologycould be applied in any country where water quality is regularly monitored on an adequatesample of sites. For European countries in particular, an appropriate use of the EuroWaterNetresults would allow for the establishment of regular water quality accounts. This methodology can be applied in any country where water quality is regularly monitored on adequate sampling sites.
Quality is a characteristic of a given volume of water at a given point in time and location. As water flows, quality changes. It is thus necessary to assign a quality measure to the waterflowing at a given location and to weight this quality by a quantity representative of the totalflow at this location. A specific measuring unit has been introduced by EuroWaterNet forEuropean countries, namely the standard river unit (SRU), which is worth 1 km.m3/s. An SRU can represent a 1km long watercourse with a 1m3/s outflow as well as a 0,5 km long watercourse with a 2 m3/s outflow. This unit allows the aggregation of stretches of watercourses of different sizes.
Water quality accounts for South Africa, 2000
Statistics South Africa 7
5 National water quality monitoring programmes
The Department of Water Affairs and Forestry (DWAF) has a national monitoring programme (the Chemical or Salinity Monitoring Programme), as well as establishedassessment procedures for assessing the inorganic chemical water quality of surface waters. For this programme, samples are regularly collected at approximately 1 600 monitoringstations on rivers, at a frequency that varies from weekly to monthly. In addition, a Trophic Status Monitoring Programme is conducted on a much smaller scale for selected South African impoundments that are managed by DWAF. The design of a more extensive Euthrophication Monitoring Programme has been completed and the Trophic StatusProgramme will be integrated with this programme as soon as it becomes operational.
A national microbiological water quality monitoring programme has been designed and is currently being implemented. One of its objectives is to provide information on the status and trends of the extent of faecal pollution, in terms of the microbial quality of surface waterresources in priority areas. At present only a limited sampling network exists and work isunderway to extend this network; however, it will be several years before it can provide a national indication of the microbiological water quality. A national network is not feasible at present because of the costs of sampling and analysis. Initiatives are under way to develop a National Toxicants Monitoring Programme that will include monitoring of organic and heavymetal pollutants. Radioactivity monitoring is done at regional level, only where such problems are known to exist.
The Inorganic Chemical Water Quality of Surface Water Resources in SA report by DWAF (2002) concentrates on the status of water quality in South Africa as reflected predominantlyin the mineral salts composition. Mineral salts arise both naturally from soil erosion and the washout of salts naturally present in the soil, and from the contribution from humansettlements and activities. Land use activities include both domestic (e.g. leading to nutrient enrichment or euthrophication) and industrial (e.g. the contamination of surface waters byacid mine drainage water containing constituents such as sulphate arising from accelerated oxidation of sulphur-bearing minerals in exposed rock consequent to mining operations). Inaddition to the information on the inorganic water quality constituents, information is alsogiven in this report on the nutrient status of selected impoundments that are monitored in South Africa, as reflected in the trophic status of the water bodies. The report does not deal with the microbiological status of the water resources, as this information is not yet readilyavailable. However, as a general rule it must be assumed that all surface water has thepotential for microbiological contamination, and needs to be treated before drinking.
Water quality accounts for South Africa, 2000
Statistics South Africa 8
6 Assessment methodology
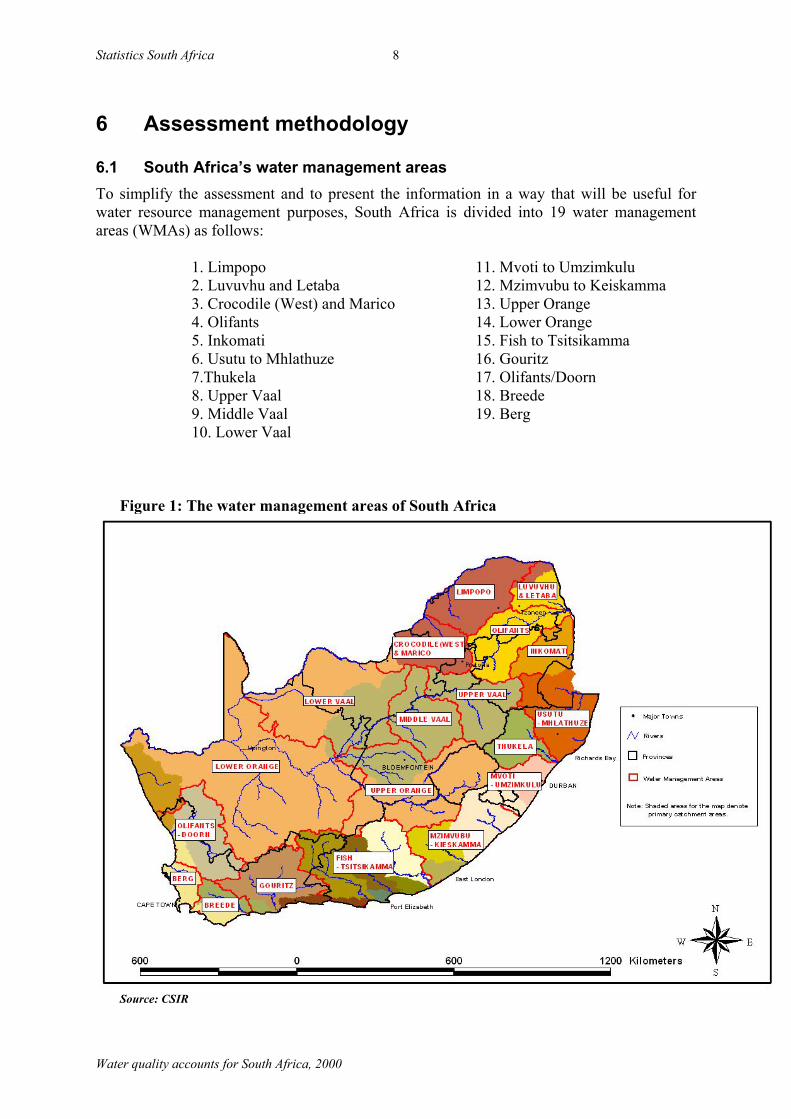
6.1 South Africa’s water management areas To simplify the assessment and to present the information in a way that will be useful forwater resource management purposes, South Africa is divided into 19 water managementareas (WMAs) as follows:
1. Limpopo2. Luvuvhu and Letaba 3. Crocodile (West) and Marico 4. Olifants5. Inkomati6. Usutu to Mhlathuze 7.Thukela8. Upper Vaal 9. Middle Vaal10. Lower Vaal
11. Mvoti to Umzimkulu12. Mzimvubu to Keiskamma 13. Upper Orange 14. Lower Orange 15. Fish to Tsitsikamma16. Gouritz 17. Olifants/Doorn 18. Breede 19. Berg
Figure 1: The water management areas of South Africa
Source: CSIR
Water quality accounts for South Africa, 2000
Statistics South Africa 9
6.2 Assessment basisTwo levels of sampling sites were selected from the chemical water quality database, namely:
a national level sample site set, anda comprehensive site set for each WMA.
The individual WMA sample site sets are based on the national set, with the addition of allother sample sites within the WMA that have sufficient record length and frequency, irrespective of their location within the WMA. Sites are only excluded when their sampling frequencies are too erratic or sparse, or where there are better sample sites geographically close to them. This was done to identify river reaches with sampling sites where water quality problems are prevalent.
The rationale behind the sample site selection was based on the overall sample site selectedfor a national assessment of surface chemical water quality, with the addition of all othersuitable water quality sample sites within the various WMAs. A suitable water quality samplesite is considered to be one with an adequate level of sampling (not too infrequent or sparse) over the chosen study period. An adequate and regular frequency of samples is necessary to ensure that the statistical analysis of the data set provides results that are representative of the study period. The selection of suitable sample sites is a qualitative process.
Since the intention is to make the best use of the available data, sample site selection may bemore rigorous in those WMAs with a large number of frequently sampled sites than thoseWMAs that do not have a high density of sample sites with regular samples having been taken.
The national assessment: For the national assessment, a sample site is selected for eachtertiary3 drainage region, ideally as close to the outflow point of the tertiary drainage region as possible, as a descriptor of the water quality within that drainage region. In those cases where no suitable site exists, the next closest site with a suitable data record is selected.
The WMA-level assessment: For the WMA-level assessment, sample sites in the nationalassessment sample site set are used together with additional sites with sufficient datathroughout each tertiary drainage region in order to be better able to link land use types and activities with the water quality sampled in the rivers.
3 All primary regions make up a tertiary region, and all tertiary regions make up the Water Management Area
Water quality accounts for South Africa, 2000
Statistics South Africa 10
7 Typical water quality pollutants in South AfricaThe greatest water quality problem in surface water in South Africa is likely to be faecalpollution, together with the associated disease-causing organisms, that occur in surface water near dense human settlements. However, total dissolved solids (TDS) in the form of elevatedsodium & chloride salt concentrations are also common in many parts of the country. In groundwater the most common problems are high nitrite/nitrate and fluoride concentrations. Surface water comprises all water that flows over or is stored on the surface, for example,reservoirs, lakes and rivers. Groundwater comprises all water that collects in porous layers of underground formations known as aquifers.
7.1 Quality of surface waterMost surface water in South Africa is of good quality (Q2) and requires only clarification and disinfection (determined from the results of the chemical monitoring programme). There are, however a few notable exceptions:
Faecal pollution High faecal pollution and total coliform counts (used as an indicator to indicate recent faecal pollution) occur in most surface water near dense human settlements.
Colour and stability The rivers that drain the mountain catchments along the southern coastline have waters that are highly coloured due to organic acids. These waters have characteristically low total dissolved salts (TDS), electrical conductivity (EC) concentrations and a low pH. Colour removal requires precise chemical dosing, and together with the stabilisation of the water, treatment is neither cheap nor easy.
Salt concentrations (TDS or EC, sodium, chloride and sulphate) The rivers that drain the dry interior regions carry water that may have a high TDS concentration mostly resulting from high sulphate and chloride concentrations. This meansthat the water is corrosive and has a distinctly salty taste. Salt removal by means of reverseosmosis or ion exchange is expensive, and most communities accept the water afterclarification and disinfections. Care should be taken in areas where the TDS, sulphate or chloride concentrations are in the red4 (poor quality) or purple (not acceptable quality)classes.
The rivers that drain the northern and eastern parts of South Africa generally carry good quality water, unless it has been contaminated due to human activity. A prime example of this is the Vaal River downstream of the Vaal Dam, which has high TDS due to effluent from theWitwatersrand area and from the gold mines. Treatment is expensive and the consumersnormally accept the highly salinity.
4 Colour tags are used during laboratory classifications.
Water quality accounts for South Africa, 2000
Statistics South Africa 11
Euthrophication (high algal concentrations)Some reservoirs in South Africa have high algal concentrations. Water from these water bodies may have taste and colour problems. In many cases, authorities have implementedtreatment options such as powdered activated carbon or processes such as dissolved air flotation, instead of the more conventional sedimentation in the clarification process. In somecases algae may produce toxins which are of concern to human health. Generally, however, the above processes also remove these toxins.
FluorideFluoride concentrations in groundwater in some areas tend to be high, especially in the central and western parts of the country. In the coal-bearing regions of the country fluorideconcentrations tend to be very high. Fluoride removal is expensive.
Sulphate and chloride Water with high TDS concentrations tends to have high sulphate and chloride concentrations as well. Sulphate and chloride removal (desalination or ion exchange) is expensive and normally not considered viable.
7.2 Quality of groundwaterThe quality of groundwater is measured according to three different aspects. These aresalinity, calcium and magnesium concentrations, and iron and manganese concentrations.
SalinityGroundwater commonly has high TDS concentrations, especially in the drier regions of thecountry where the predominant geological formations are sedimentary rocks of marine origin. The Karoo shales are a prime example of this. Salinity can be removed only at high cost andby means of, for instance, reverse osmosis, electrodialysis or deionisation.
Calcium and magnesiumThe groundwater in the dolomitic areas and the northern parts of the country tends to be veryhard. This usually has no health implications, except where concentrations are extremelyhigh. It does, however, leads to clogging of pipes and scaling of elements in hot water appliances. The cost of replacement and maintenance of these appliances may make it cheaper to treat the water. For small communities, or single households, water softening by means of ion exchange is recommended. For larger communities, chemical dosing, settling and filtration would be more economical. It is important to note that water softening by means of ion exchange adds sodium to the water. This could prove problematic if the sodium concentration is already high.
Iron and manganeseIron and manganese commonly occur in high concentrations in groundwater. Treatment forboth of these problems is cheap and easy, consisting of oxidation by means of aeration, or by adding chlorine.
Water quality accounts for South Africa, 2000
Statistics South Africa 12
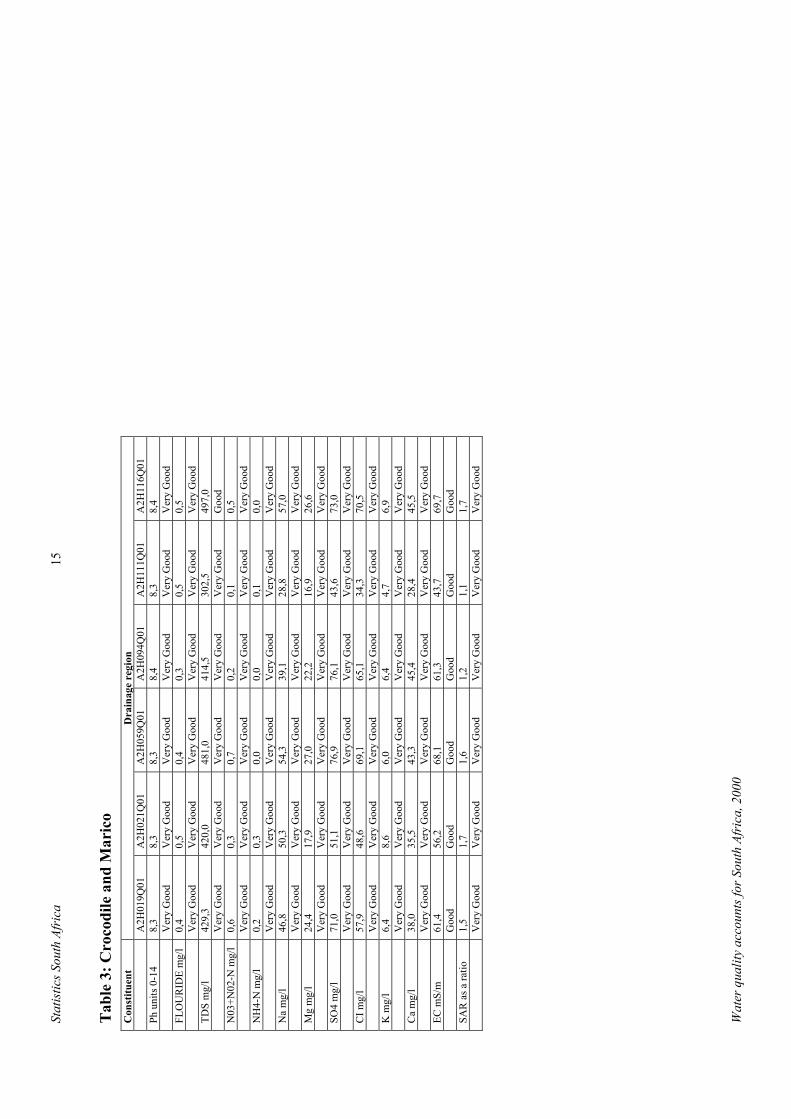
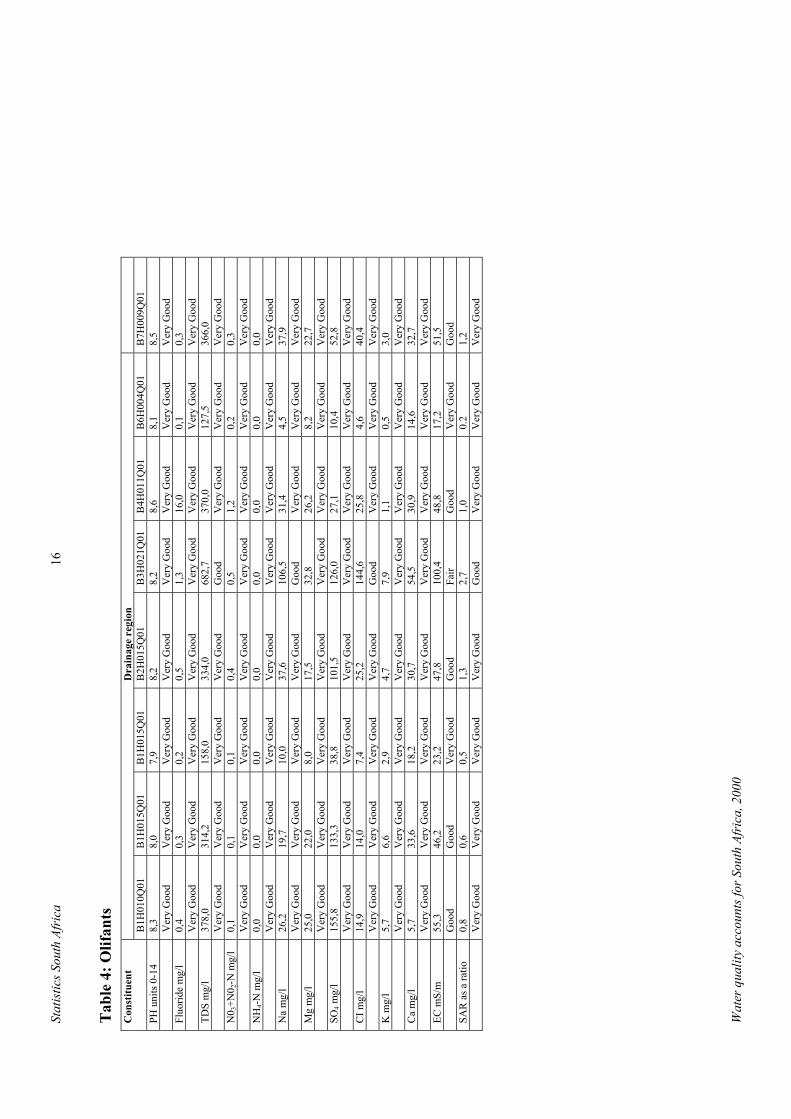
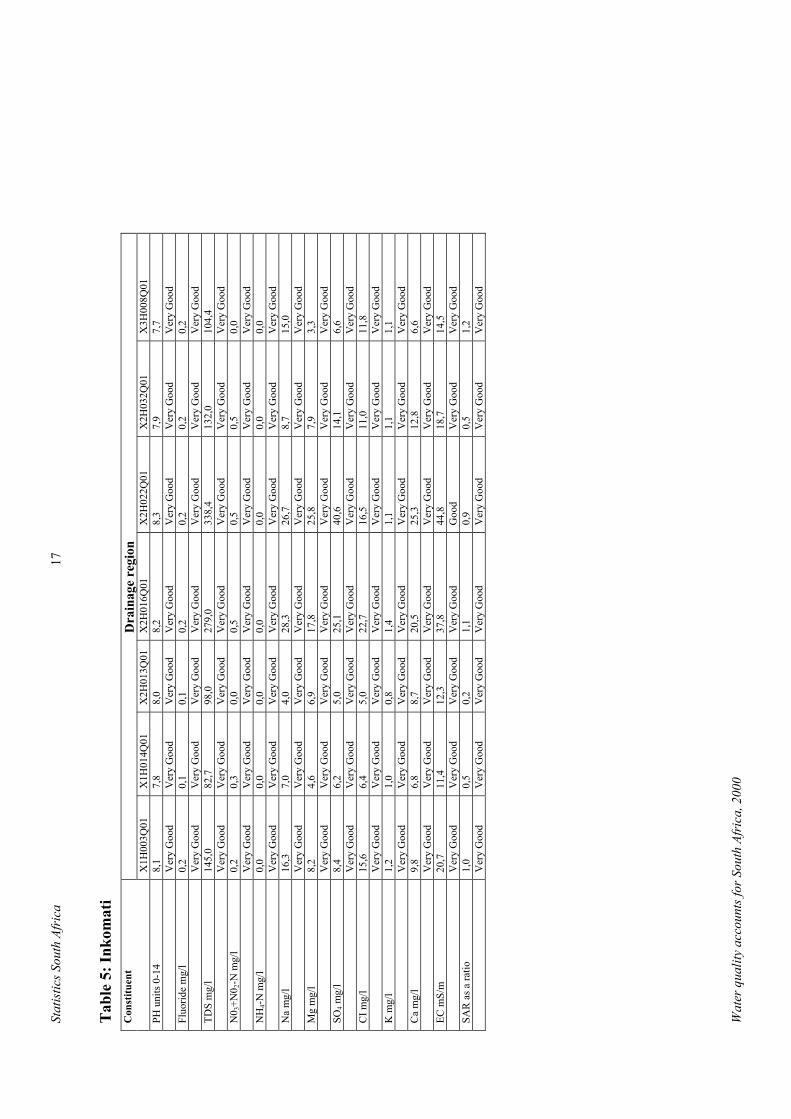
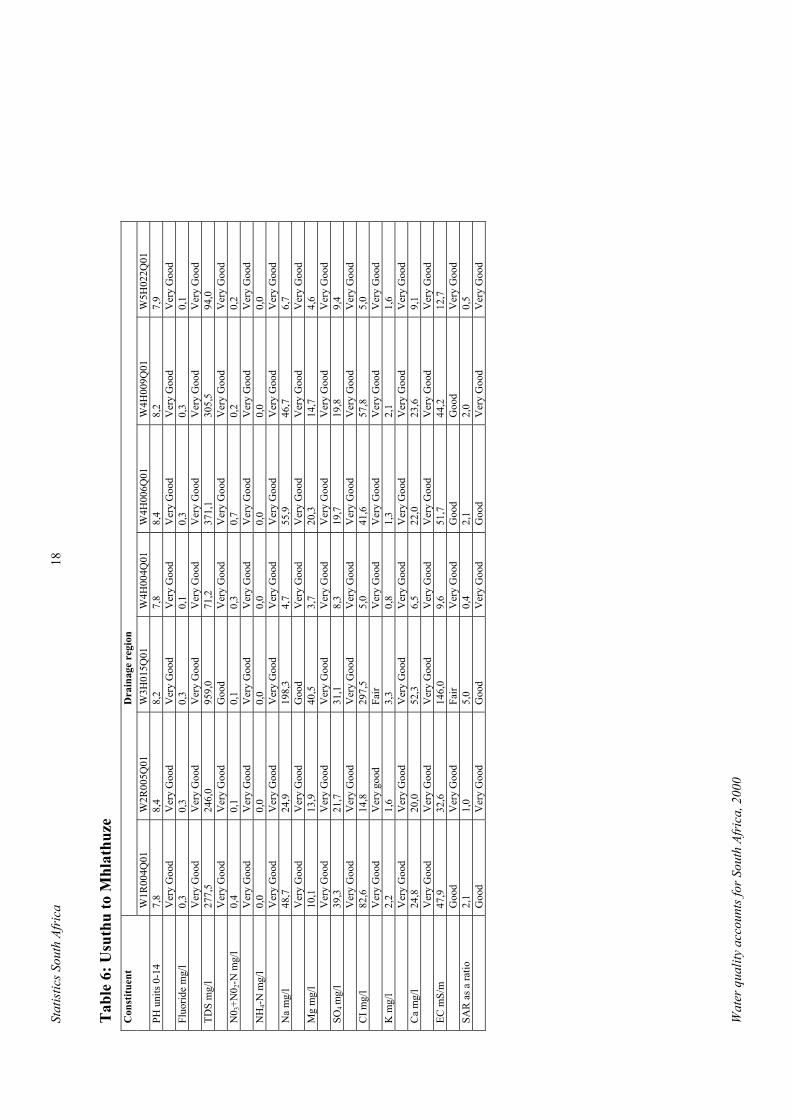
8 Detailed tables
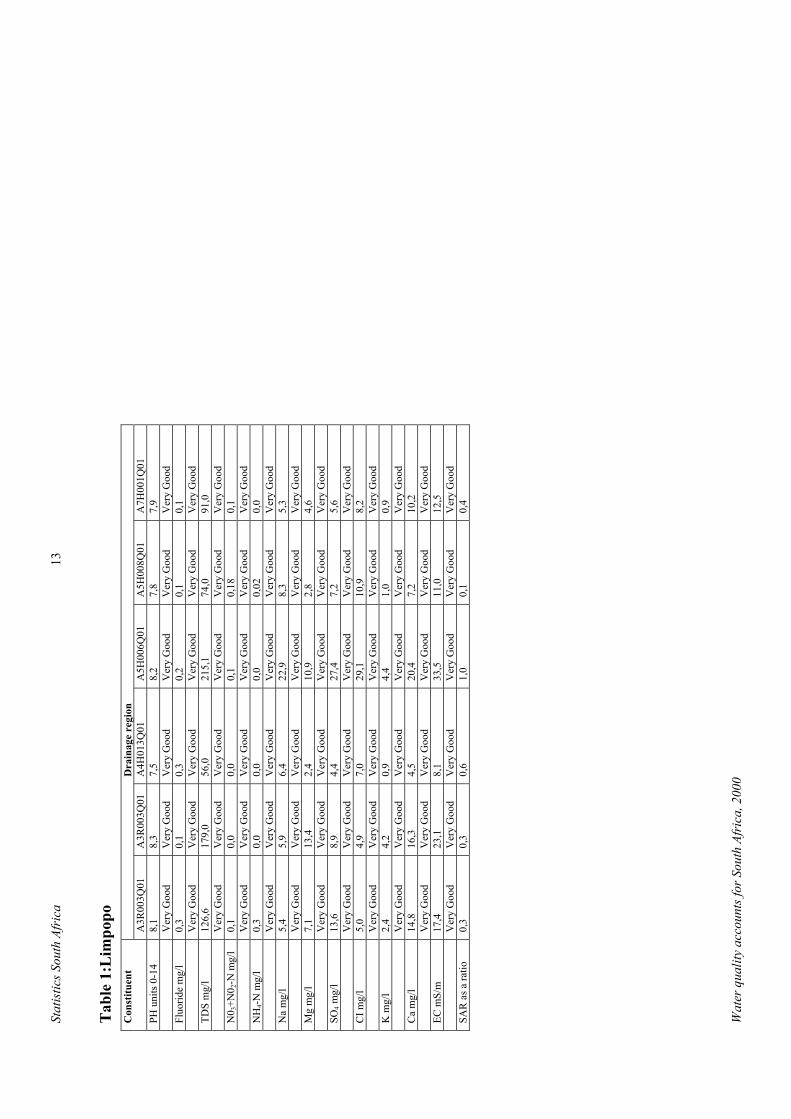
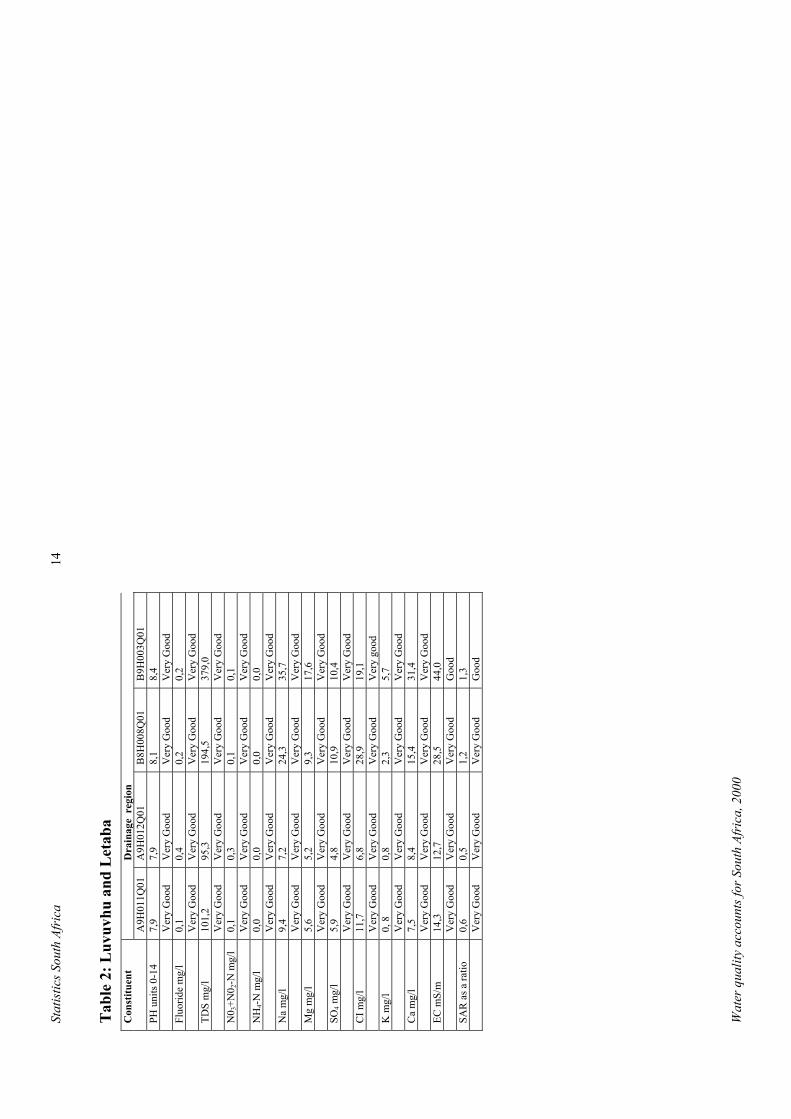
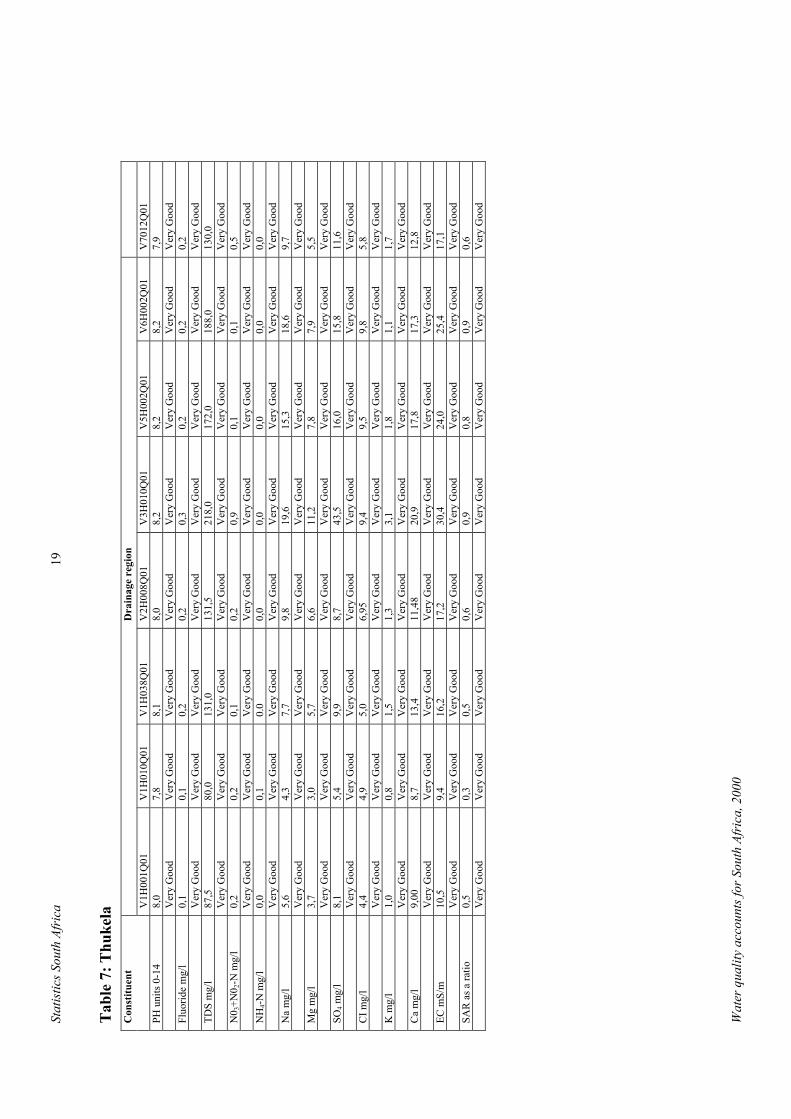
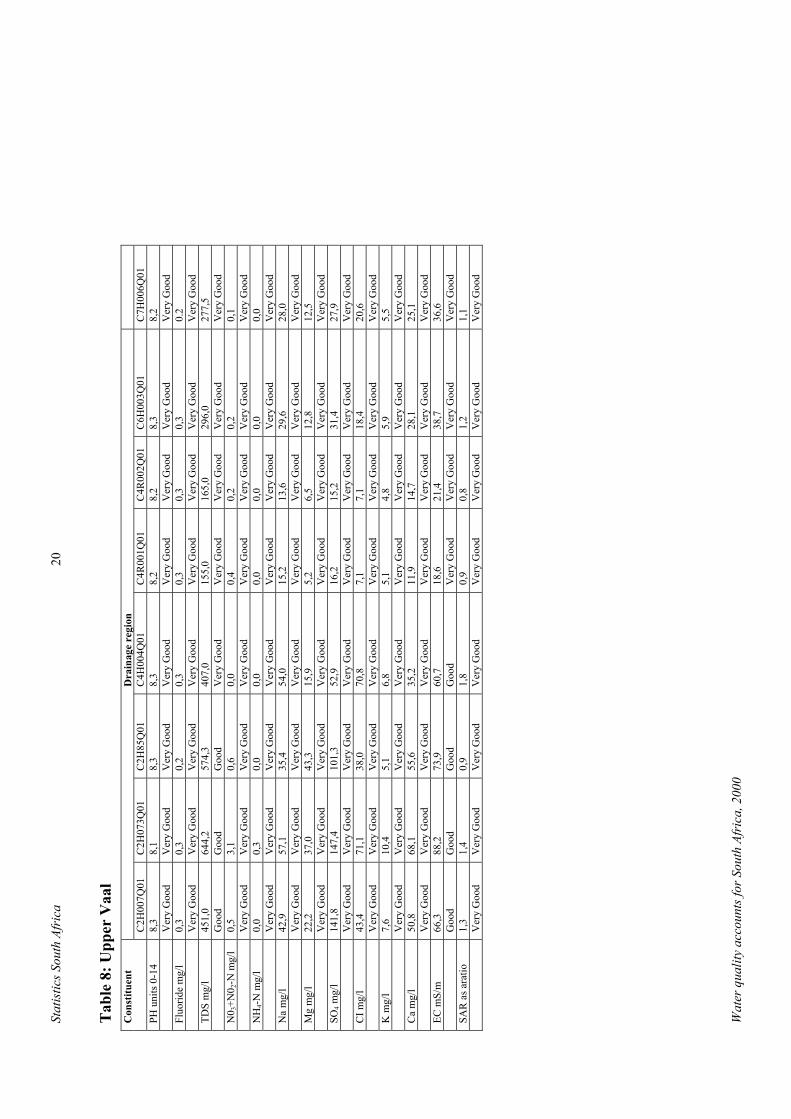
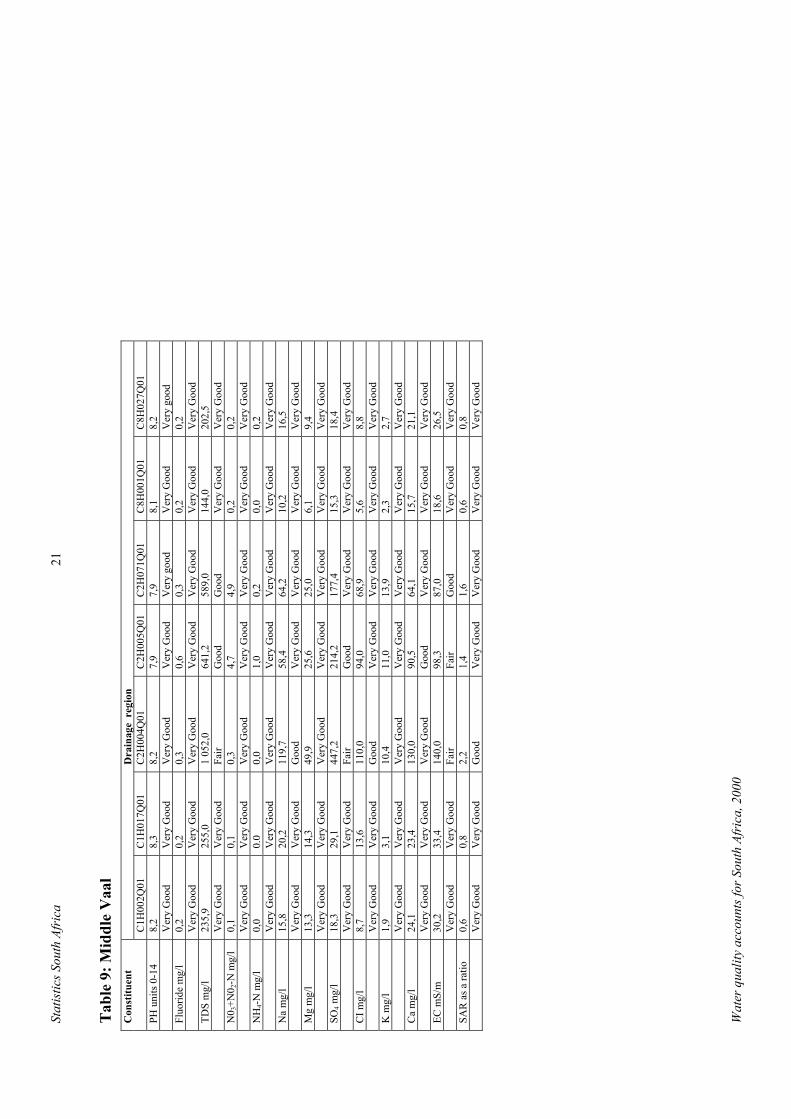
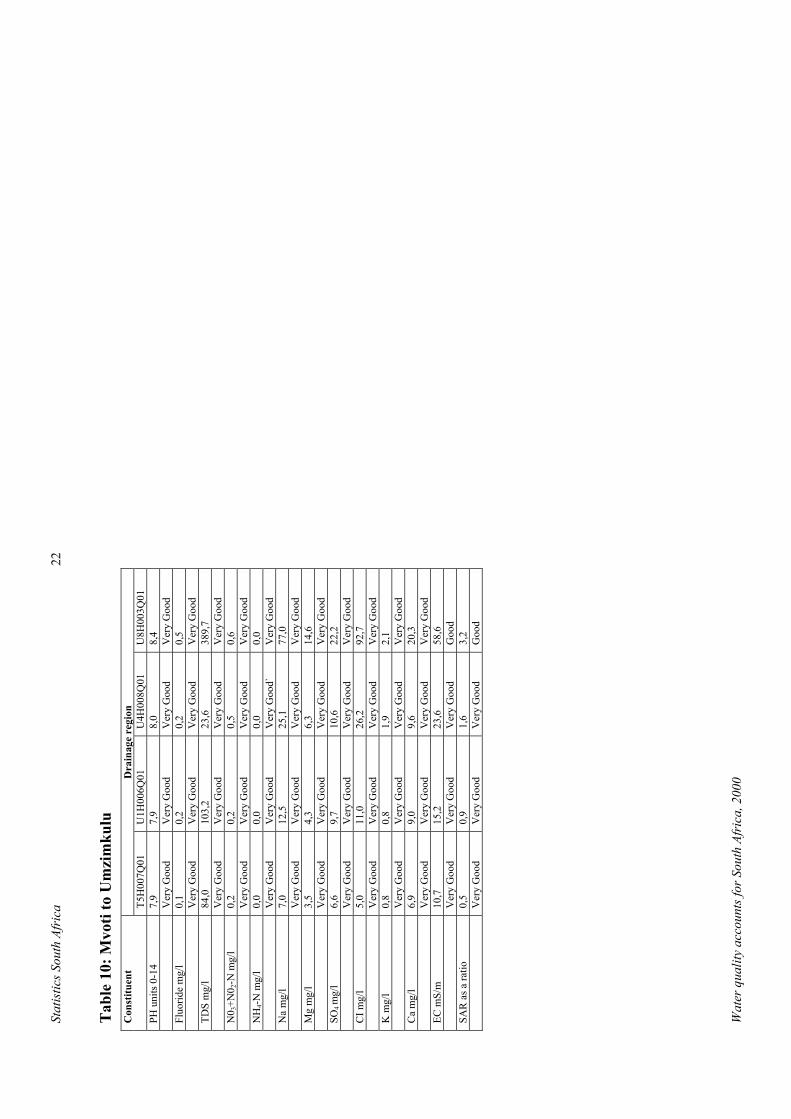
Tables 1-18 illustrate the water quality indicators for South Africa for the year 2000. Thesetables cover all the water management areas in South Africa except the Lower Vaal. There isno information for Lower Vaal because there were no suitable sites. All sites assessed areidentified by an alphanumeric code such as A2H019Q01. The tables were prepared using the water quality guidelines given in Annexures 4-6.
Water quality accounts for South Africa, 2000
Stat
istic
s Sou
th A
fric
a13
Tab
le 1
:Lim
popo
D
rain
age
regi
onC
onst
ituen
tA
3R00
3Q01
A3R
003Q
01A
4H01
3Q01
A5H
006Q
01A
5H00
8Q01
A7H
001Q
01PH
uni
ts 0
-14
8,1
8,3
7,5
8,2
7,8
7,9
Ver
y G
ood
Ver
y G
ood
Ver
y G
ood
Ver
y G
ood
Ver
y G
ood
Ver
y G
ood
Fluo
ride
mg/
l0,
30,
10,
30,
20,
10,
1V
ery
Goo
d V
ery
Goo
d V
ery
Goo
d V
ery
Goo
d V
ery
Goo
d V
ery
Goo
d TD
Sm
g/l
126,
617
9,0
56,0
215,
174
,091
,0V
ery
Goo
d V
ery
Goo
d V
ery
Goo
d V
ery
Goo
d V
ery
Goo
d V
ery
Goo
d N
0 3+N
0 2-N
mg/
l0,
10,
00,
00,
10,
180,
1V
ery
Goo
d V
ery
Goo
d V
ery
Goo
d V
ery
Goo
d V
ery
Goo
d V
ery
Goo
d N
H4-N
mg/
l0,
30,
00,
00,
00,
020,
0V
ery
Goo
d V
ery
Goo
d V
ery
Goo
d V
ery
Goo
d V
ery
Goo
d V
ery
Goo
d N
am
g/l
5,4
5,9
6,4
22,9
8,3
5,3
Ver
y G
ood
Ver
y G
ood
Ver
y G
ood
Ver
y G
ood
Ver
y G
ood
Ver
y G
ood
Mg
mg/
l7,
113
,42,
410
,92,
84,
6V
ery
Goo
d V
ery
Goo
d V
ery
Goo
d V
ery
Goo
d V
ery
Goo
d V
ery
Goo
d SO
4m
g/l
13,6
8,9
4,4
27,4
7,2
5,6
Ver
y G
ood
Ver
y G
ood
Ver
y G
ood
Ver
y G
ood
Ver
y G
ood
Ver
y G
ood
CIm
g/l
5,0
4,9
7,0
29,1
10,9
8,2
Ver
y G
ood
Ver
y G
ood
Ver
y G
ood
Ver
y G
ood
Ver
y G
ood
Ver
y G
ood
Km
g/l
2,4
4,2
0,9
4,4
1,0
0,9
Ver
y G
ood
Ver
y G
ood
Ver
y G
ood
Ver
y G
ood
Ver
y G
ood
Ver
y G
ood
Ca
mg/
l14
,816
,34,
520
,47,
210
,2V
ery
Goo
d V
ery
Goo
d V
ery
Goo
d V
ery
Goo
d V
ery
Goo
dV
ery
Goo
d EC
mS/
m17
,423
,18,
133
,511
,012
,5V
ery
Goo
d V
ery
Goo
d V
ery
Goo
d V
ery
Goo
d V
ery
Goo
d V
ery
Goo
d SA
R a
s a ra
tio0,
30,
30,
61,
00,
10,
4
Wat
erqu
ality
acco
unts
for S
outh
Afr
ica,
200
0
Stat
istic
s Sou
th A
fric
a14
Tab
le 2
: Luv
uvhu
and
Let
aba
Dra
inag
e r
egio
n C
onst
ituen
tA
9H01
1Q01
A9H
012Q
01B
8H00
8Q01
B9H
003Q
01PH
uni
ts 0
-14
7,9
7,9
8,1
8,4
Ver
y G
ood
Ver
y G
ood
Ver
y G
ood
Ver
y G
ood
Fluo
ride
mg/
l0,
10,
40,
20,
2V
ery
Goo
d V
ery
Goo
d V
ery
Goo
d V
ery
Goo
d TD
S m
g/l
101,
295
,319
4,5
379,
0V
ery
Goo
dV
ery
Goo
dV
ery
Goo
d V
ery
Goo
d N
0 3+N
0 2-N
mg/
l0,
10,
30,
10,
1V
ery
Goo
d V
ery
Goo
d V
ery
Goo
d V
ery
Goo
d N
H4-N
mg/
l0,
00,
00,
00,
0V
ery
Goo
d V
ery
Goo
d V
ery
Goo
d V
ery
Goo
d N
a m
g/l
9,4
7,2
24,3
35,7
Ver
y G
ood
Ver
y G
ood
Ver
y G
ood
Ver
y G
ood
Mg
mg/
l5,
65,
29,
317
,6V
ery
Goo
d V
ery
Goo
d V
ery
Goo
d V
ery
Goo
d SO
4 mg/
l5,
94,
810
,910
,4V
ery
Goo
d V
ery
Goo
d V
ery
Goo
d V
ery
Goo
d C
I mg/
l11
,76,
828
,919
,1V
ery
Goo
d V
ery
Goo
dV
ery
Goo
d V
ery
good
K
mg/
l0,
80,
82,
35,
7V
ery
Goo
d V
ery
Goo
d V
ery
Goo
d V
ery
Goo
d C
a m
g/l
7,5
8,4
15,4
31,4
Ver
y G
ood
Ver
y G
ood
Ver
y G
ood
Ver
y G
ood
EC m
S/m
14,3
12,7
28,5
44,0
Ver
yG
ood
Ver
yG
ood
Ver
yG
ood
Goo
dSA
R a
s a ra
tio0,
60,
51,
21,
3V
ery
Goo
dV
ery
Goo
dV
ery
Goo
dG
ood
Wat
erqu
ality
acco
unts
for S
outh
Afr
ica,
200
0
Stat
istic
s Sou
th A
fric
a15
Tab
le 3
: Cro
codi
le a
nd M
aric
o C
onst
ituen
tD
rain
age
regi
onA
2H01
9Q01
A2H
021Q
01A
2H05
9Q01
A2H
094Q
01A
2H11
1Q01
A2H
116Q
01Ph
units
0-14
8,3
8,3
8,3
8,4
8,3
8,4
Ver
y G
ood
Ver
y G
ood
Ver
y G
ood
Ver
y G
ood
Ver
y G
ood
Ver
y G
ood
FLO
UR
IDE
mg/
l0,
40,
50,
40,
30,
50,
5V
ery
Goo
d V
ery
Goo
d V
ery
Goo
d V
ery
Goo
d V
ery
Goo
dV
ery
Goo
d TD
Sm
g/l
429,
342
0,0
481,
041
4,5
302,
549
7,0
Ver
y G
ood
Ver
y G
ood
Ver
yG
ood
Ver
yG
ood
Ver
yG
ood
Goo
dN
03+N
02-N
mg/
l0,
60,
30,
70,
20,
10,
5V
ery
Goo
d V
ery
Goo
d V
ery
Goo
d V
ery
Goo
d V
ery
Goo
d V
ery
Goo
d N
H4-
Nm
g/l
0,2
0,3
0,0
0,0
0,1
0,0
Ver
y G
ood
Ver
y G
ood
Ver
y G
ood
Ver
y G
ood
Ver
y G
ood
Ver
y G
ood
Na
mg/
l46
,850
,354
,339
,128
,857
,0V
ery
Goo
d V
ery
Goo
d V
ery
Goo
d V
ery
Goo
d V
ery
Goo
d V
ery
Goo
d M
gm
g/l
24,4
17,9
27,0
22,2
16,9
26,6
Ver
y G
ood
Ver
y G
ood
Ver
y G
ood
Ver
y G
ood
Ver
y G
ood
Ver
y G
ood
SO4
mg/
l71
,051
,176
,976
,143
,673
,0V
ery
Goo
d V
ery
Goo
d V
ery
Goo
d V
ery
Goo
d V
ery
Goo
d V
ery
Goo
d C
Img/
l57
,948
,669
,165
,134
,370
,5V
ery
Goo
d V
ery
Goo
d V
ery
Goo
d V
ery
Goo
d V
ery
Goo
d V
ery
Goo
d K
mg/
l6,
48,
66,
06,
44,
76,
9V
ery
Goo
d V
ery
Goo
d V
ery
Goo
d V
ery
Goo
d V
ery
Goo
d V
ery
Goo
d C
am
g/l
38,0
35,5
43,3
45,4
28,4
45,5
Ver
y G
ood
Ver
y G
ood
Ver
y G
ood
Ver
y G
ood
Ver
y G
ood
Ver
y G
ood
ECm
S/m
61,4
56,2
68,1
61,3
43,7
69,7
Goo
dG
ood
Goo
dG
ood
Goo
dG
ood
SAR
asa
ratio
1,5
1,7
1,6
1,2
1,1
1,7
Ver
y G
ood
Ver
y G
ood
Ver
y G
ood
Ver
y G
ood
Ver
y G
ood
Ver
y G
ood
Wat
erqu
ality
acco
unts
for S
outh
Afr
ica,
200
0
Stat
istic
s Sou
th A
fric
a16
Tab
le 4
: Olif
ants
D
rain
age
regi
onC
onst
ituen
tB
1H01
0Q01
B1H
015Q
01B
1H01
5Q01
B2H
015Q
01B
3H02
1Q01
B4H
011Q
01B
6H00
4Q01
B7H
009Q
01PH
units
0-14
8,3
8,0
7,9
8,2
8,2
8,6
8,1
8,5
Ver
y G
ood
Ver
y G
ood
Ver
yG
ood
Ver
y G
ood
Ver
y G
ood
Ver
y G
ood
Ver
y G
ood
Ver
y G
ood
Fluo
ride
mg/
l0,
40,
30,
20,
51,
316
,00,
10,
3V
ery
Goo
d V
ery
Goo
d V
ery
Goo
dV
ery
Goo
d V
ery
Goo
d V
ery
Goo
d V
ery
Goo
d V
ery
Goo
d TD
Sm
g/l
378,
031
4,2
158,
033
4,0
682,
737
0,0
127,
536
6,0
Ver
y G
ood
Ver
y G
ood
Ver
y G
ood
Ver
y G
ood
Goo
dV
ery
Goo
d V
ery
Goo
d V
ery
Goo
d N
0 3+N
0 2-N
mg/
l0,
10,
10,
10,
40,
51,
20,
20,
3V
ery
Goo
d V
ery
Goo
d V
ery
Goo
dV
ery
Goo
dV
ery
Goo
d V
ery
Goo
d V
ery
Goo
d V
ery
Goo
d N
H4-N
mg/
l0,
00,
00,
00,
00,
00,
00,
00,
0V
ery
Goo
d V
ery
Goo
d V
ery
Goo
dV
ery
Goo
d V
ery
Goo
d V
ery
Goo
d V
ery
Goo
dV
ery
Goo
d N
am
g/l
26,2
19,7
10,0
37,6
106,
531
,44,
537
,9V
ery
Goo
d V
ery
Goo
d V
ery
Goo
d V
ery
Goo
d G
ood
Ver
yG
ood
Ver
yG
ood
Ver
yG
ood
Mg
mg/
l25
,022
,08,
017
,532
,826
,28,
222
,7V
ery
Goo
d V
ery
Goo
d V
ery
Goo
dV
ery
Goo
d V
ery
Goo
d V
ery
Goo
d V
ery
Goo
d V
ery
Goo
d SO
4m
g/l
155,
813
3,3
38,8
101,
512
6,0
27,1
10,4
52,8
Ver
y G
ood
Ver
y G
ood
Ver
yG
ood
Ver
y G
ood
Ver
y G
ood
Ver
y G
ood
Ver
y G
ood
Ver
y G
ood
CIm
g/l
14,9
14,0
7,4
25,2
144,
625
,84,
640
,4V
ery
Goo
d V
ery
Goo
d V
ery
Goo
d V
ery
Goo
d G
ood
Ver
yG
ood
Ver
yG
ood
Ver
yG
ood
Km
g/l
5,7
6,6
2,9
4,7
7,9
1,1
0,5
3,0
Ver
y G
ood
Ver
y G
ood
Ver
yG
ood
Ver
y G
ood
Ver
y G
ood
Ver
y G
ood
Ver
y G
ood
Ver
y G
ood
Ca
mg/
l5,
733
,618
,230
,754
,530
,914
,632
,7V
ery
Goo
d V
ery
Goo
d V
ery
Goo
dV
ery
Goo
d V
ery
Goo
d V
ery
Goo
d V
ery
Goo
d V
ery
Goo
d EC
mS/
m55
,346
,223
,247
,810
0,4
48,8
17,2
51,5
Goo
dG
ood
Ver
yG
ood
Goo
dFa
irG
ood
Ver
yG
ood
Goo
dSA
Ras
ara
tio0,
80,
60,
51,
32,
71,
00.
21,
2V
ery
Goo
d V
ery
Goo
d V
ery
Goo
d V
ery
Goo
d G
ood
Ver
yG
ood
Ver
yG
ood
Ver
yG
ood
Wat
erqu
ality
acco
unts
for S
outh
Afr
ica,
200
0
Stat
istic
s Sou
th A
fric
a17
Tab
le 5
: Ink
omat
iD
rain
age
regi
onC
onst
ituen
tX
1H00
3Q01
X1H
014Q
01X
2H01
3Q01
X2H
016Q
01X
2H02
2Q01
X2H
032Q
01X
3H00
8Q01
PH u
nits
0-1
48,
17,
88,
08,
28,
37,
97,
7V
ery
Goo
d V
ery
Goo
d V
ery
Goo
d V
ery
Goo
d V
ery
Goo
dV
ery
Goo
dV
ery
Goo
dFl
uorid
em
g/l
0,2
0,1
0,1
0,2
0,2
0,2
0,2
Ver
y G
ood
Ver
y G
ood
Ver
y G
ood
Ver
y G
ood
Ver
yG
ood
Ver
yG
ood
Ver
yG
ood
TDS
mg/
l14
5,0
82,7
98,0
279,
033
8,4
132,
010
4,4
Ver
y G
ood
Ver
y G
ood
Ver
y G
ood
Ver
y G
ood
Ver
yG
ood
Ver
yG
ood
Ver
yG
ood
N0 3
+N0 2
-Nm
g/l
0,2
0,3
0,0
0,5
0,5
0,5
0,0
Ver
y G
ood
Ver
y G
ood
Ver
y G
ood
Ver
y G
ood
Ver
yG
ood
Ver
yG
ood
Ver
yG
ood
NH
4-Nm
g/l
0,0
0,0
0,0
0,0
0,0
0,0
0,0
Ver
y G
ood
Ver
y G
ood
Ver
y G
ood
Ver
y G
ood
Ver
yG
ood
Ver
yG
ood
Ver
yG
ood
Na
mg/
l16
,37,
04,
028
,326
,78,
715
,0V
ery
Goo
d V
ery
Goo
d V
ery
Goo
d V
ery
Goo
d V
ery
Goo
dV
ery
Goo
dV
ery
Goo
dM
g m
g/l
8,2
4,6
6,9
17,8
25,8
7,9
3,3
Ver
y G
ood
Ver
y G
ood
Ver
y G
ood
Ver
y G
ood
Ver
yG
ood
Ver
yG
ood
Ver
yG
ood
SO4 m
g/l
8,4
6,2
5,0
25,1
40,6
14,1
6,6
Ver
y G
ood
Ver
y G
ood
Ver
y G
ood
Ver
y G
ood
Ver
yG
ood
Ver
yG
ood
Ver
yG
ood
CI m
g/l
15,6
6,4
5,0
22,7
16,5
11,0
11,8
Ver
y G
ood
Ver
y G
ood
Ver
y G
ood
Ver
y G
ood
Ver
yG
ood
Ver
yG
ood
Ver
yG
ood
Km
g/l
1,2
1,0
0,8
1,4
1,1
1,1
1,1
Ver
y G
ood
Ver
y G
ood
Ver
y G
ood
Ver
y G
ood
Ver
yG
ood
Ver
yG
ood
Ver
yG
ood
Ca
mg/
l9,
86,
88,
720
,525
,312
,86,
6V
ery
Goo
d V
ery
Goo
d V
ery
Goo
d V
ery
Goo
d V
ery
Goo
dV
ery
Goo
dV
ery
Goo
dEC
mS/
m20
,711
,412
,337
,844
,818
,714
,5V
ery
Goo
d V
ery
Goo
d V
ery
Goo
d V
ery
Goo
d G
ood
Ver
y G
ood
Ver
y G
ood
SAR
as a
ratio
1,0
0,5
0,2
1,1
0,9
0,5
1,2
Ver
y G
ood
Ver
y G
ood
Ver
y G
ood
Ver
y G
ood
Ver
yG
ood
Ver
yG
ood
Ver
yG
ood
Wat
erqu
ality
acco
unts
for S
outh
Afr
ica,
200
0
Stat
istic
s Sou
th A
fric
a18
Tab
le 6
: Usu
thu
to M
hlat
huze
Dra
inag
e re
gion
C
onst
ituen
tW
1R00
4Q01
W2R
005Q
01W
3H01
5Q01
W4H
004Q
01W
4H00
6Q01
W4H
009Q
01W
5H02
2Q01
PH u
nits
0-1
47,
88,
48,
27,
88,
48,
27,
9V
ery
Goo
d V
ery
Goo
d V
ery
Goo
d V
ery
Goo
d V
ery
Goo
dV
ery
Goo
dV
ery
Goo
dFl
uorid
em
g/l
0,3
0,3
0,3
0,1
0,3
0,3
0,1
Ver
y G
ood
Ver
y G
ood
Ver
y G
ood
Ver
y G
ood
Ver
yG
ood
Ver
yG
ood
Ver
yG
ood
TDS
mg/
l27
7,5
246,
095
9,0
71,2
371,
130
5,5
94,0
Ver
y G
ood
Ver
y G
ood
Goo
dV
ery
Goo
dV
ery
Goo
d V
ery
Goo
d V
ery
Goo
d N
0 3+N
0 2-N
mg/
l0,
40,
10,
10,
30,
70,
20,
2V
ery
Goo
d V
ery
Goo
d V
ery
Goo
d V
ery
Goo
d V
ery
Goo
dV
ery
Goo
dV
ery
Goo
dN
H4-N
mg/
l0,
00,
00,
00,
00,
00,
00,
0V
ery
Goo
d V
ery
Goo
d V
ery
Goo
d V
ery
Goo
d V
ery
Goo
dV
ery
Goo
dV
ery
Goo
dN
am
g/l
48,7
24,9
198,
34,
755
,946
,76,
7V
ery
Goo
d V
ery
Goo
d G
ood
Ver
y G
ood
Ver
y G
ood
Ver
y G
ood
Ver
y G
ood
Mg
mg/
l10
,113
,940
,53,
720
,314
,74,
6V
ery
Goo
d V
ery
Goo
d V
ery
Goo
d V
ery
Goo
d V
ery
Goo
dV
ery
Goo
dV
ery
Goo
dSO
4m
g/l
39,3
21,7
31,1
8,3
19,7
19,8
9,4
Ver
y G
ood
Ver
y G
ood
Ver
y G
ood
Ver
y G
ood
Ver
yG
ood
Ver
yG
ood
Ver
yG
ood
CIm
g/l
82,6
14,8
297,
55,
041
,657
,85,
0V
ery
Goo
d V
ery
good
Fa
irV
ery
Goo
dV
ery
Goo
d V
ery
Goo
d V
ery
Goo
dK
mg/
l2,
21,
63,
30,
81,
32,
11,
6V
ery
Goo
d V
ery
Goo
d V
ery
Goo
d V
ery
Goo
d V
ery
Goo
dV
ery
Goo
dV
ery
Goo
dC
am
g/l
24,8
20,0
52,3
6,5
22,0
23,6
9,1
Ver
y G
ood
Ver
y G
ood
Ver
y G
ood
Ver
y G
ood
Ver
yG
ood
Ver
yG
ood
Ver
yG
ood
ECm
S/m
47,9
32,6
146,
09,
651
,744
,212
,7G
ood
Ver
yG
ood
Fair
Ver
yG
ood
Goo
dG
ood
Ver
yG
ood
SAR
as a
ratio
2,1
1,0
5,0
0,4
2,1
2,0
0,5
Goo
dV
ery
Goo
dG
ood
Ver
yG
ood
Goo
dV
ery
Goo
d V
ery
Goo
d
Wat
erqu
ality
acco
unts
for S
outh
Afr
ica,
200
0
Stat
istic
s Sou
th A
fric
a19
Tab
le 7
: Thu
kela
Dra
inag
ere
gion
Con
stitu
ent
V1H
001Q
01V
1H01
0Q01
V1H
038Q
01V
2H00
8Q01
V3H
010Q
01V
5H00
2Q01
V6H
002Q
01V
7012
Q01
PHun
its0-
148,
07,
88,
18,
08,
28,
28,
27,
9V
ery
Goo
d V
ery
Goo
d V
ery
Goo
dV
ery
Goo
dV
ery
Goo
dV
ery
Goo
d V
ery
Goo
d V
ery
Goo
d Fl
uorid
em
g/l
0,1
0,1
0,2
0,2
0,3
0,2
0,2
0,2
Ver
y G
ood
Ver
y G
ood
Ver
yG
ood
Ver
yG
ood
Ver
yG
ood
Ver
y G
ood
Ver
y G
ood
Ver
y G
ood
TDS
mg/
l87
,580
,013
1,0
131,
521
8,0
172,
018
8,0
130,
0V
ery
Goo
d V
ery
Goo
d V
ery
Goo
dV
ery
Goo
dV
ery
Goo
dV
ery
Goo
d V
ery
Goo
d V
ery
Goo
d N
0 3+N
0 2-N
mg/
l0,
20,
20,
10,
20,
90,
10,
10,
5V
ery
Goo
d V
ery
Goo
d V
ery
Goo
dV
ery
Goo
dV
ery
Goo
dV
ery
Goo
d V
ery
Goo
d V
ery
Goo
d N
H4-N
mg/
l0,
00,
10.
00,
00,
00,
00,
00,
0V
ery
Goo
d V
ery
Goo
d V
ery
Goo
dV
ery
Goo
dV
ery
Goo
dV
ery
Goo
d V
ery
Goo
d V
ery
Goo
d N
am
g/l
5,6
4,3
7,7
9,8
19,6
15,3
18,6
9,7
Ver
y G
ood
Ver
y G
ood
Ver
yG
ood
Ver
yG
ood
Ver
yG
ood
Ver
y G
ood
Ver
y G
ood
Ver
y G
ood
Mg
mg/
l3,
73,
05,
76,
611
,27,
87,
95,
5V
ery
Goo
d V
ery
Goo
d V
ery
Goo
dV
ery
Goo
dV
ery
Goo
dV
ery
Goo
d V
ery
Goo
d V
ery
Goo
d SO
4m
g/l
8,1
5,4
9,9
8,7
43,5
16,0
15,8
11,6
Ver
y G
ood
Ver
y G
ood
Ver
yG
ood
Ver
yG
ood
Ver
yG
ood
Ver
y G
ood
Ver
y G
ood
Ver
y G
ood
CIm
g/l
4,4
4,9
5,0
6,95
9,4
9,5
9,8
5,8
Ver
y G
ood
Ver
y G
ood
Ver
yG
ood
Ver
yG
ood
Ver
yG
ood
Ver
y G
ood
Ver
y G
ood
Ver
y G
ood
Km
g/l
1,0
0,8
1,5
1,3
3,1
1,8
1,1
1,7
Ver
y G
ood
Ver
y G
ood
Ver
yG
ood
Ver
yG
ood
Ver
yG
ood
Ver
y G
ood
Ver
y G
ood
Ver
y G
ood
Ca
mg/
l9,
008,
713
,411
,48
20,9
17,8
17,3
12,8
Ver
y G
ood
Ver
y G
ood
Ver
yG
ood
Ver
yG
ood
Ver
yG
ood
Ver
y G
ood
Ver
y G
ood
Ver
y G
ood
ECm
S/m
10,5
9,4
16,2
17,2
30,4
24,0
25,4
17,1
Ver
y G
ood
Ver
y G
ood
Ver
yG
ood
Ver
yG
ood
Ver
yG
ood
Ver
y G
ood
Ver
y G
ood
Ver
y G
ood
SAR
asa
ratio
0,5
0,3
0,5
0,6
0,9
0,8
0,9
0,6
Ver
y G
ood
Ver
y G
ood
Ver
yG
ood
Ver
yG
ood
Ver
yG
ood
Ver
y G
ood
Ver
y G
ood
Ver
y G
ood
Wat
erqu
ality
acco
unts
for S
outh
Afr
ica,
200
0
Stat
istic
s Sou
th A
fric
a20
Tab
le 8
: Upp
er V
aal
Dra
inag
ere
gion
Con
stitu
ent
C2H
007Q
01C
2H07
3Q01
C2H
85Q
01C
4H00
4Q01
C4R
001Q
01C
4R00
2Q01
C6H
003Q
01C
7H00
6Q01
PH u
nits
0-1
48,
38,
18,
38,
38,
28,
28,
38,
2V
ery
Goo
d V
ery
Goo
d V
ery
Goo
dV
ery
Goo
d V
ery
Goo
d V
ery
Goo
d V
ery
Goo
d V
ery
Goo
d Fl
uorid
e m
g/l
0,3
0,3
0,2
0,3
0,3
0,3
0,3
0.2
Ver
y G
ood
Ver
y G
ood
Ver
yG
ood
Ver
y G
ood
Ver
y G
ood
Ver
y G
ood
Ver
y G
ood
Ver
y G
ood
TDS
mg/
l45
1,0
644,
257
4,3
407,
015
5,0
165,
029
6,0
277,
5G
ood
Goo
dG
ood
Ver
y G
ood
Ver
y G
ood
Ver
y G
ood
Ver
y G
ood
Ver
y G
ood
N0 3
+N0 2
-N m
g/l
0,5
3,1
0,6
0,0
0,4
0,2
0,2
0,1
Ver
y G
ood
Ver
y G
ood
Ver
yG
ood
Ver
y G
ood
Ver
y G
ood
Ver
y G
ood
Ver
y G
ood
Ver
y G
ood
NH
4-N m
g/l
0,0
0,3
0,0
0,0
0,0
0,0
0,0
0,0
Ver
y G
ood
Ver
y G
ood
Ver
yG
ood
Ver
y G
ood
Ver
y G
ood
Ver
y G
ood
Ver
y G
ood
Ver
y G
ood
Na
mg/
l42
,957
,135
,454
,015
,213
,629
,628
,0V
ery
Goo
d V
ery
Goo
d V
ery
Goo
dV
ery
Goo
d V
ery
Goo
d V
ery
Goo
d V
ery
Goo
d V
ery
Goo
d M
g m
g/l
22,2
37,0
43,3
15,9
5,2
6,5
12,8
12,5
Ver
y G
ood
Ver
y G
ood
Ver
yG
ood
Ver
y G
ood
Ver
y G
ood
Ver
y G
ood
Ver
y G
ood
Ver
y G
ood
SO4 m
g/l
141,
814
7,4
101,
352
,916
,215
,231
,427
,9V
ery
Goo
d V
ery
Goo
d V
ery
Goo
dV
ery
Goo
d V
ery
Goo
dV
ery
Goo
d V
ery
Goo
d V
ery
Goo
d C
I mg/
l43
,471
,138
,070
,87,
17,
118
,420
,6V
ery
Goo
d V
ery
Goo
d V
ery
Goo
dV
ery
Goo
d V
ery
Goo
d V
ery
Goo
d V
ery
Goo
d V
ery
Goo
d K
mg/
l7,
610
,45,
16,
85,
14,
85,
95,
5V
ery
Goo
d V
ery
Goo
d V
ery
Goo
dV
ery
Goo
d V
ery
Goo
d V
ery
Goo
d V
ery
Goo
d V
ery
Goo
d C
a m
g/l
50,8
68,1
55,6
35,2
11,9
14,7
28,1
25,1
Ver
y G
ood
Ver
y G
ood
Ver
yG
ood
Ver
y G
ood
Ver
y G
ood
Ver
y G
ood
Ver
y G
ood
Ver
y G
ood
EC m
S/m
66,3
88,2
73,9
60,7
18,6
21,4
38,7
36,6
Goo
dG
ood
Goo
dG
ood
Ver
yG
ood
Ver
y G
ood
Ver
y G
ood
Ver
y G
ood
SAR
as a
ratio
1,3
1,4
0,9
1,8
0,9
0,8
1,2
1,1
Ver
y G
ood
Ver
y G
ood
Ver
yG
ood
Ver
y G
ood
Ver
y G
ood
Ver
y G
ood
Ver
y G
ood
Ver
y G
ood
Wat
erqu
ality
acco
unts
for S
outh
Afr
ica,
200
0
Stat
istic
s Sou
th A
fric
a21
Tab
le 9
: Mid
dle
Vaa
lD
rain
age
reg
ion
Con
stitu
ent
C1H
002Q
01C
1H01
7Q01
C2H
004Q
01C
2H00
5Q01
C2H
071Q
01C
8H00
1Q01
C8H
027Q
01PH
units
0-14
8,2
8,3
8,2
7,9
7,9
8,1
8,2
Ver
y G
ood
Ver
y G
ood
Ver
y G
ood
Ver
y G
ood
Ver
y go
od
Ver
y G
ood
Ver
y go
od
Fluo
ride
mg/
l0,
20,
20,
30,
60,
30,
20,
2V
ery
Goo
d V
ery
Goo
d V
ery
Goo
d V
ery
Goo
d V
ery
Goo
dV
ery
Goo
dV
ery
Goo
dTD
Sm
g/l
235,
925
5,0
105
2,0
641,
258
9,0
144,
020
2,5
Ver
y G
ood
Ver
y G
ood
Fair
Goo
dG
ood
Ver
y G
ood
Ver
y G
ood
N0 3
+N0 2
-Nm
g/l
0,1
0,1
0,3
4,7
4,9
0,2
0,2
Ver
y G
ood
Ver
y G
ood
Ver
y G
ood
Ver
y G
ood
Ver
yG
ood
Ver
yG
ood
Ver
yG
ood
NH
4-Nm
g/l
0,0
0.0
0,0
1,0
0,2
0,0
0,2
Ver
y G
ood
Ver
y G
ood
Ver
y G
ood
Ver
y G
ood
Ver
yG
ood
Ver
yG
ood
Ver
yG
ood
Na
mg/
l15
,820
,211
9,7
58,4
64,2
10,2
16,5
Ver
y G
ood
Ver
y G
ood
Goo
dV
ery
Goo
dV
ery
Goo
d V
ery
Goo
d V
ery
Goo
d M
gm
g/l
13,3
14,3
49,9
25,6
25,0
6,1
9,4
Ver
y G
ood
Ver
y G
ood
Ver
y G
ood
Ver
y G
ood
Ver
yG
ood
Ver
yG
ood
Ver
yG
ood
SO4
mg/
l18
,329
,144
7,2
214,
217
7,4
15,3
18,4
Ver
y G
ood
Ver
y G
ood
Fair
Goo
dV
ery
Goo
d V
ery
Goo
d V
ery
Goo
d C
Img/
l8,
713
,611
0,0
94,0
68,9
5,6
8,8
Ver
y G
ood
Ver
y G
ood
Goo
dV
ery
Goo
dV
ery
Goo
d V
ery
Goo
d V
ery
Goo
d K
mg/
l1,
93,
110
,411
,013
,92,
32,
7V
ery
Goo
d V
ery
Goo
d V
ery
Goo
d V
ery
Goo
d V
ery
Goo
dV
ery
Goo
dV
ery
Goo
dC
am
g/l
24,1
23,4
130,
090
,564
,115
,721
,1V
ery
Goo
d V
ery
Goo
d V
ery
Goo
d G
ood
Ver
y G
ood
Ver
y G
ood
Ver
y G
ood
ECm
S/m
30,2
33,4
140,
098
,387
,018
,626
,5V
ery
Goo
d V
ery
Goo
d Fa
irFa
irG
ood
Ver
y G
ood
Ver
y G
ood
SAR
asa
ratio
0,6
0,8
2,2
1,4
1,6
0,6
0,8
Ver
y G
ood
Ver
y G
ood
Goo
dV
ery
Goo
dV
ery
Goo
d V
ery
Goo
d V
ery
Goo
d
Wat
erqu
ality
acco
unts
for S
outh
Afr
ica,
200
0
Stat
istic
s Sou
th A
fric
a22
Tab
le 1
0: M
voti
to U
mzi
mku
luD
rain
age
regi
onC
onst
ituen
tT5
H00
7Q01
U1H
006Q
01U
4H00
8Q01
U8H
003Q
01PH
uni
ts 0
-14
7,9
7,9
8,0
8,4
Ver
y G
ood
Ver
y G
ood
Ver
y G
ood
Ver
y G
ood
Fluo
ride
mg/
l0,
10,
20,
20,
5V
ery
Goo
d V
ery
Goo
d V
ery
Goo
d V
ery
Goo
d TD
S m
g/l
84,0
103,
223
,638
9,7
Ver
y G
ood
Ver
y G
ood
Ver
y G
ood
Ver
y G
ood
N0 3
+N0 2
-N m
g/l
0,2
0,2
0,5
0,6
Ver
y G
ood
Ver
y G
ood
Ver
y G
ood
Ver
y G
ood
NH
4-N m
g/l
0,0
0,0
0,0
0,0
Ver
y G
ood
Ver
y G
ood
Ver
y G
ood`
Ver
y G
ood
Na
mg/
l7,
012
,525
,177
,0V
ery
Goo
d V
ery
Goo
d V
ery
Goo
d V
ery
Goo
d M
g m
g/l
3,5
4,3
6,3
14,6
Ver
y G
ood
Ver
y G
ood
Ver
y G
ood
Ver
y G
ood
SO4m
g/l
6,6
9,7
10,6
22,2
Ver
y G
ood
Ver
y G
ood
Ver
y G
ood
Ver
y G
ood
CI m
g/l
5,0
11,0
26,2
92,7
Ver
y G
ood
Ver
y G
ood
Ver
y G
ood
Ver
y G
ood
K m
g/l
0,8
0,8
1,9
2,1
Ver
y G
ood
Ver
y G
ood
Ver
y G
ood
Ver
y G
ood
Ca
mg/
l6,
99,
09,
620
,3V
ery
Goo
d V
ery
Goo
d V
ery
Goo
d V
ery
Goo
d EC
mS/
m10
,715
,223
,658
,6V
ery
Goo
dV
ery
Goo
dV
ery
Goo
dG
ood
SAR
as a
ratio
0,5
0,9
1,6
3,2
Ver
yG
ood
Ver
yG
ood
Ver
yG
ood
Goo
d
Wat
erqu
ality
acco
unts
for S
outh
Afr
ica,
200
0
Stat
istic
s Sou
th A
fric
a23
Tab
le 1
1: M
zim
vubu
to K
eisk
amm
a C
onst
ituen
tsD
rain
age
regi
onPH
uni
ts 0
-14
Fluo
ride
mg/
lTD
S m
g/l
N0 3
+N0 2
-Nm
g/l
NH
4-N m
g/l
Na
mg/
lM
g m
g/l
SO4m
g/l
CIm
g/l
K m
g/l
Ca
mg/
lEC
mS/
mSA
R a
s a
ratio
R2R
003Q
018,
10,
227
6,0
0,7
0,0
53,0
10,1
21,4
68,5
3,4
15,0
42,8
2,6
Ver
y G
ood
Ver
y G
ood
Ver
y G
ood
Ver
y G
ood
Ver
y G
ood
Ver
y G
ood
Ver
y G
ood
Ver
y G
ood
Ver
y G
ood
Ver
y G
ood
Ver
y G
ood
Goo
dG
ood
R3H
001Q
018,
10,
226
7,0
0,1
0,0
43,9
10,2
19,2
55,5
2,69
13,0
37,4
2,0
Ver
y G
ood
Ver
y G
ood
Ver
y G
ood
Ver
y G
ood
Ver
y G
ood
Ver
y G
ood
Ver
y G
ood
Ver
y G
ood
Ver
y G
ood
Ver
yG
ood
Ver
yG
ood
Ver
yG
ood
Ver
yG
ood
R3H
003Q
018,
00,
224
1,6
0,3
0,0
45,8
8,3
19,2
59,2
2,7
13,0
37,4
2,4
Ver
y G
ood
Ver
y G
ood
Ver
y G
ood
Ver
y G
ood
Ver
y G
ood
Ver
y G
ood
Ver
y G
ood
Ver
y G
ood
Ver
y G
ood
Ver
y G
ood
Ver
y G
ood
Ver
y G
ood
Goo
dR
3H00
4Q01
8,0
0,2
233,
00,
50,
043
,37,
915
,555
,23,
212
,335
,92,
4V
ery
Goo
d V
ery
Goo
d V
ery
Goo
d V
ery
Goo
d V
ery
Goo
d V
ery
Goo
d V
ery
Goo
d V
ery
Goo
d V
ery
Goo
d V
ery
Goo
d V
ery
Goo
d V
ery
Goo
d G
ood
S1R
001Q
018,
40,
524
7,0
0,2
35,0
19,1
13,0
8,3
11,4
1,5
24,2
32,6
0,8
Ver
y G
ood
Ver
y G
ood
Ver
y G
ood
Ver
y G
ood
Ver
y G
ood
Ver
y G
ood
Ver
y G
ood
Ver
y G
ood
Ver
y G
ood
Ver
yG
ood
Ver
yG
ood
Ver
yG
ood
Ver
yG
ood
S3H
006Q
018,
50,
434
8,0
0,1
0,0
31,7
19,0
19,9
22,5
3,0
29,2
44,5
1,2
Ver
y G
ood
Ver
y G
ood
Ver
y G
ood
Ver
y G
ood
Ver
y G
ood
Ver
y G
ood
Ver
y G
ood
Ver
y G
ood
Ver
y G
ood
Ver
y G
ood
Ver
y G
ood
Goo
dV
ery
Goo
d S6
H00
2Q01
8,2
0,2
172,
00,
40.
317
,38,
39,
015
,31,
115
,424
,30,
9V
ery
Goo
d V
ery
Goo
d V
ery
Goo
d V
ery
Goo
d V
ery
Goo
d V
ery
Goo
d V
ery
Goo
d V
ery
Goo
d V
ery
Goo
d V
ery
Goo
dV
ery
Goo
dV
ery
Goo
dV
ery
Goo
dS7
H00
1Q01
8,4
0,3
439,
00,
90,
063
,719
,519
,675
,61,
932
,262
,22,
3V
ery
Goo
d V
ery
Goo
d V
ery
Goo
d V
ery
Goo
d V
ery
Goo
d V
ery
Goo
d V
ery
Goo
d V
ery
Goo
d V
ery
Goo
d V
ery
Goo
d V
ery
Goo
d G
ood
Ver
y G
ood
S7H
004Q
018,
40,
328
9,1
0,1
0,0
34,8
13,9
12,5
35,7
1,9
23,3
40,1
1,4
Ver
y G
ood
Ver
y G
ood
Ver
y G
ood
Ver
y G
ood
Ver
y G
ood
Ver
y G
ood
Ver
y G
ood
Ver
y G
ood
Ver
y G
ood
Ver
yG
ood
Ver
yG
ood
Ver
yG
ood
Ver
yG
ood
T1H
004Q
018,
10,
212
1,0
0,3
0,0
11,1
5,7
8,8
11,0
1,1
10,2
16,5
0,8
Ver
y G
ood
Ver
y G
ood
Ver
y G
ood
Ver
y G
ood
Ver
y G
ood
Ver
y G
ood
Ver
y G
ood
Ver
y G
ood
Ver
y G
ood
Ver
yG
ood
Ver
yG
ood
Ver
yG
ood
Ver
yG
ood
T3H
004Q
018,
10,
110
8,0
0,1
0,0
7,7
5,3
5,8
5,3
1,3
9,9
14,1
0,48
Ver
y G
ood
Ver
y G
ood
Ver
y G
ood
Ver
y G
ood
Ver
y G
ood
Ver
y G
ood
Ver
y G
ood
Ver
y G
ood
Ver
y G
ood
Ver
yG
ood
Ver
yG
ood
Ver
yG
ood
Ver
yG
ood
T3H
005Q
017,
90,
198
,80,
30,
06,
64,
45,
25,
00,
99,
912
,10,
5V
ery
Goo
d V
ery
Goo
d V
ery
Goo
d V
ery
Goo
d V
ery
Goo
d V
ery
Goo
d V
ery
Goo
d V
ery
Goo
d V
ery
Goo
d V
ery
Goo
dV
ery
Goo
d V
ery
Goo
dV
ery
Goo
dT3
H00
6Q01
7,9
0,1
90,1
0,2
0,0
8,0
3,9
5,9
5,2
0,9
8,2
11,6
0,58
Ver
y G
ood
Ver
y G
ood
Ver
y G
ood
Ver
y G
ood
Ver
y G
ood
Ver
y G
ood
Ver
y G
ood
Ver
y G
ood
Ver
y G
ood
Ver
yG
ood
Ver
yG
ood
Ver
yG
ood
Ver
yG
ood
T3H
008Q
017,
90,
211
5,5
0,1
0,0
7,7
5,1
6,41
5,0
1,5
10,7
14,6
0,5
Ver
y G
ood
Ver
y G
ood
Ver
y G
ood
Ver
y G
ood
Ver
y G
ood
Ver
y G
ood
Ver
y G
ood
Ver
y G
ood
Ver
y G
ood
Ver
yG
ood
Ver
yG
ood
Ver
yG
ood
Ver
yG
ood
T7H
001Q
018,
20,
218
7,5
0,4
0,0
22,9
9,7
7,2
22,9
1,1
13,6
25,4
1,2
Ver
y G
ood
Ver
y G
ood
Ver
yG
ood
Ver
yG
ood
Ver
yG
ood
Ver
y G
ood
Ver
y G
ood
Ver
y G
ood
Ver
y G
ood
Ver
y G
ood
Ver
y G
ood
Ver
y go
od
Ver
y G
ood
Wat
erqu
ality
acco
unts
for S
outh
Afr
ica,
200
0
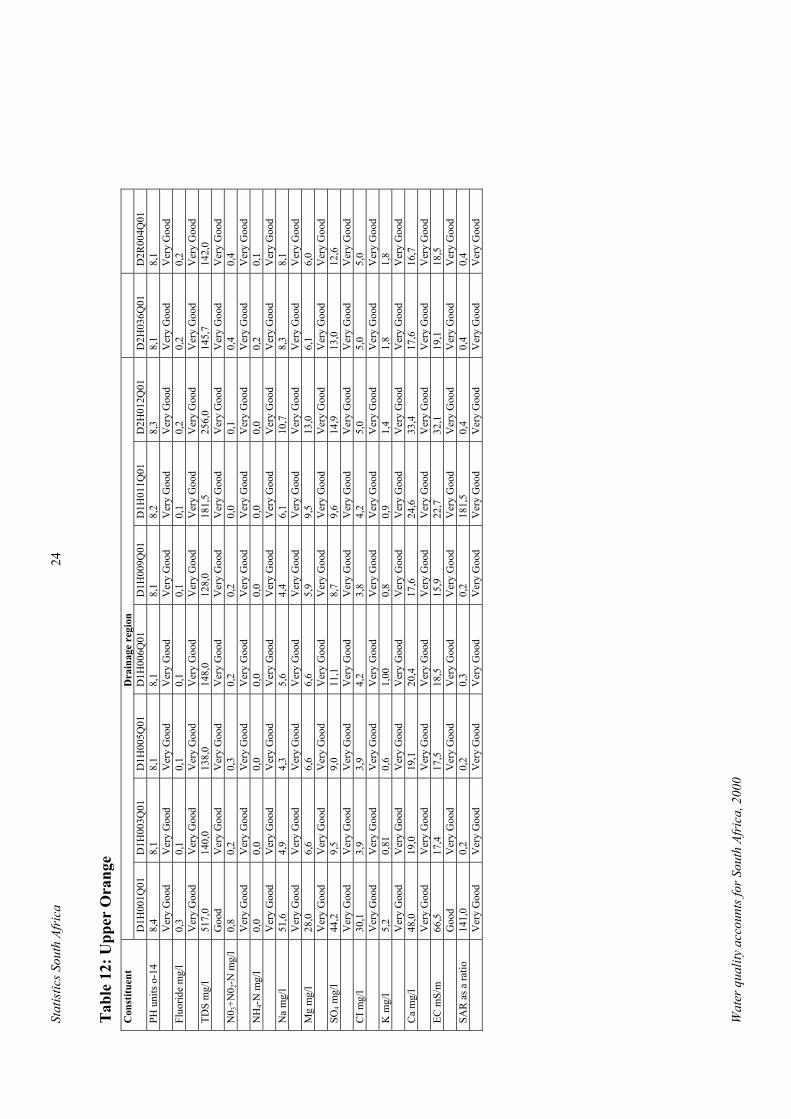
Stat
istic
s Sou
th A
fric
a24
Tab
le 1
2: U
pper
Ora
nge
Dra
inag
ere
gion
Con
stitu
ent
D1H
001Q
01D
1H00
3Q01
D1H
005Q
01D
1H00
6Q01
D1H
009Q
01D
1H01
1Q01
D2H
012Q
01D
2H03
6Q01
D2R
004Q
01PH
units
o-14
8,4
8,1
8,1
8,1
8,1
8,2
8,3
8,1
8,1
Ver
y G
ood
Ver
y G
ood
Ver
y G
ood
Ver
y G
ood
Ver
y G
ood
Ver
y G
ood
Ver
y G
ood
Ver
y G
ood
Ver
y G
ood
Fluo
ride
mg/
l0,
30,
10,
10,
10,
10,
10,
20,
20,
2V
ery
Goo
d V
ery
Goo
d V
ery
Goo
d V
ery
Goo
d V
ery
Goo
d V
ery
Goo
d V
ery
Goo
d V
ery
Goo
d V
ery
Goo
d TD
Sm
g/l
517,
014
0,0
138,
014
8,0
128,
018
1,5
256,
014
5,7
142,
0G
ood
Ver
y G
ood
Ver
y G
ood
Ver
y G
ood
Ver
y G
ood
Ver
y G
ood
Ver
y G
ood
Ver
y G
ood
Ver
y G
ood
N0 3
+N0 2
-Nm
g/l
0,8
0,2
0,3
0,2
0,2
0,0
0,1
0,4
0,4
Ver
y G
ood
Ver
y G
ood
Ver
y G
ood
Ver
y G
ood
Ver
y G
ood
Ver
y G
ood
Ver
y G
ood
Ver
y G
ood
Ver
y G
ood
NH
4-Nm
g/l
0,0
0,0
0,0
0,0
0,0
0,0
0,0
0,2
0,1
Ver
y G
ood
Ver
y G
ood
Ver
y G
ood
Ver
y G
ood
Ver
y G
ood
Ver
y G
ood
Ver
y G
ood
Ver
y G
ood
Ver
y G
ood
Na
mg/
l51
,64,
94,
35,
64,
46,
110
,78,
38,
1V
ery
Goo
d V
ery
Goo
d V
ery
Goo
d V
ery
Goo
d V
ery
Goo
d V
ery
Goo
d V
ery
Goo
d V
ery
Goo
d V
ery
Goo
d M
gm
g/l
28,0
6,6
6,6
6,6
5,9
9,5
13,0
6,1
6,0
Ver
y G
ood
Ver
y G
ood
Ver
y G
ood
Ver
y G
ood
Ver
y G
ood
Ver
y G
ood
Ver
y G
ood
Ver
y G
ood
Ver
y G
ood
SO4
mg/
l44
,29,
59,
011
,18,
79,
614
,913
,012
,6V
ery
Goo
d V
ery
Goo
d V
ery
Goo
d V
ery
Goo
d V
ery
Goo
d V
ery
Goo
d V
ery
Goo
d V
ery
Goo
d V
ery
Goo
d C
Img/
l30
,13,
93,
94,
23,
84,
25,
05,
05,
0V
ery
Goo
d V
ery
Goo
d V
ery
Goo
d V
ery
Goo
d V
ery
Goo
d V
ery
Goo
d V
ery
Goo
d V
ery
Goo
d V
ery
Goo
d K
mg/
l5,
20,
810,
61,
000,
80,
91,
41,
81,
8V
ery
Goo
d V
ery
Goo
d V
ery
Goo
d V
ery
Goo
d V
ery
Goo
d V
ery
Goo
d V
ery
Goo
d V
ery
Goo
d V
ery
Goo
d C
am
g/l
48,0
19,0
19,1
20,4
17,6
24,6
33,4
17,6
16,7
Ver
y G
ood
Ver
y G
ood
Ver
y G
ood
Ver
y G
ood
Ver
y G
ood
Ver
y G
ood
Ver
y G
ood
Ver
y G
ood
Ver
y G
ood
ECm
S/m
66,5
17,4
17,5
18,5
15,9
22,7
32,1
19,1
18,5
Goo
dV
ery
Goo
d V
ery
Goo
d V
ery
Goo
d V
ery
Goo
d V
ery
Goo
d V
ery
Goo
d V
ery
Goo
d V
ery
Goo
d SA
R a
s a ra
tio14
1,0
0,2
0,2
0,3
0,2
181,
50,
40,
40,
4V
ery
Goo
d V
ery
Goo
d V
ery
Goo
d V
ery
Goo
d V
ery
Goo
d V
ery
Goo
d V
ery
Goo
d V
ery
Goo
d V
ery
Goo
d
Wat
erqu
ality
acco
unts
for S
outh
Afr
ica,
200
0
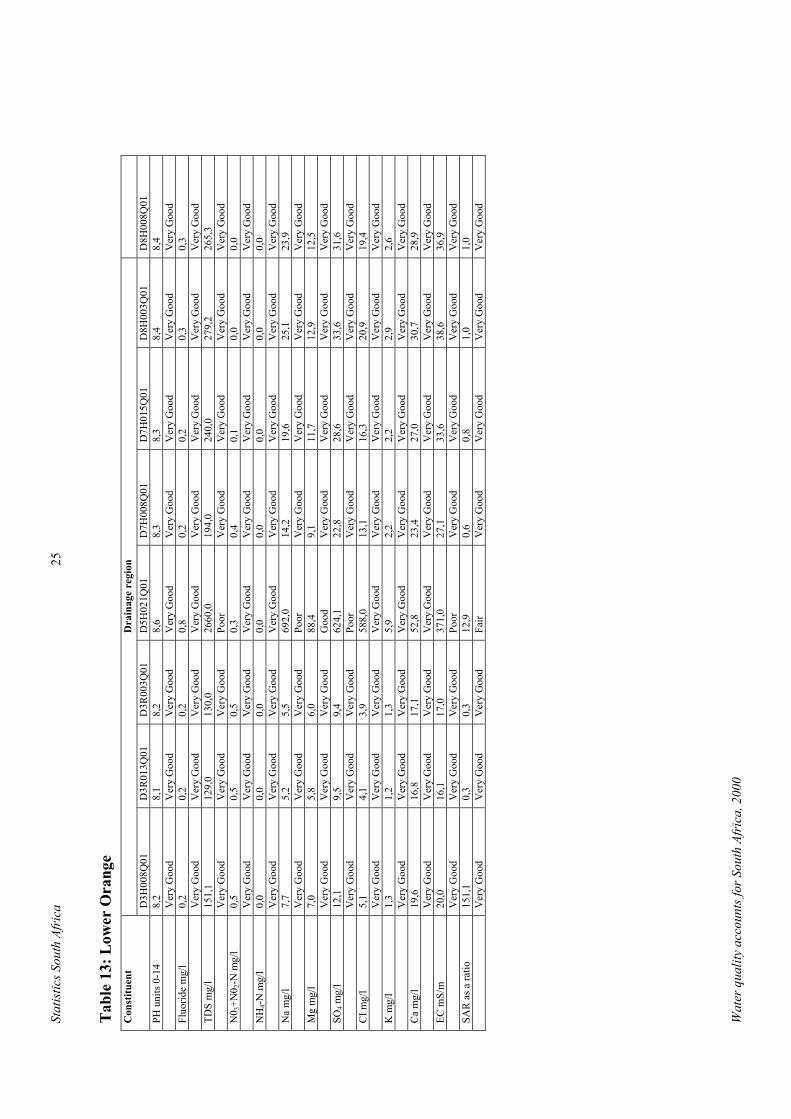
Stat
istic
s Sou
th A
fric
a25
Tab
le 1
3: L
ower
Ora
nge
Dra
inag
ere
gion
Con
stitu
ent
D3H
008Q
01D
3R01
3Q01
D3R
003Q
01D
5H02
1Q01
D7H
008Q
01D
7H01
5Q01
D8H
003Q
01D
8H00
8Q01
PH u
nits
0-1
48,
28,
18,
28,
68,
38,
38,
48,
4V
ery
Goo
d V
ery
Goo
d V
ery
Goo
dV
ery
Goo
d V
ery
Goo
d V
ery
Goo
d V
ery
Goo
d V
ery
Goo
d Fl
uorid
em
g/l
0,2
0,2
0,2
0,8
0,2
0,2
0,3
0,3
Ver
y G
ood
Ver
y G
ood
Ver
yG
ood
Ver
y G
ood
Ver
y G
ood
Ver
y G
ood
Ver
y G
ood
Ver
y G
ood
TDS
mg/
l15
1,1
129,
013
0,0
2660
,019
4,0
240,
027
9,2
265,
3V
ery
Goo
d V
ery
Goo
d V
ery
Goo
dPo
orV
ery
Goo
d V
ery
Goo
d V
ery
Goo
d V
ery
Goo
d N
0 3+N
0 2-N
mg/
l0,
50,
50,
50,
30,
40,
10,
00,
0V
ery
Goo
d V
ery
Goo
d V
ery
Goo
dV
ery
Goo
d V
ery
Goo
d V
ery
Goo
d V
ery
Goo
d V
ery
Goo
d N
H4-N
mg/
l0,
00,
00,
00,
00,
00,
00,
00,
0V
ery
Goo
d V
ery
Goo
d V
ery
Goo
dV
ery
Goo
d V
ery
Goo
d V
ery
Goo
d V
ery
Goo
d V
ery
Goo
d N
am
g/l
7,7
5,2
5,5
692,
014
,219
,625
,123
,9V
ery
Goo
d V
ery
Goo
d V
ery
Goo
d Po
orV
ery
Goo
d V
ery
Goo
d V
ery
Goo
d V
ery
Goo
d M
gm
g/l
7,0
5,8
6,0
88,4
9,1
11,7
12,9
12,5
Ver
y G
ood
Ver
y G
ood
Ver
y G
ood
Goo
dV
ery
Goo
d V
ery
Goo
dV
ery
Goo
d V
ery
Goo
d SO
4m
g/l
12,1
9,5
9,4
624,
122
,828
,633
,631
,6V
ery
Goo
d V
ery
Goo
d V
ery
Goo
d Po
orV
ery
Goo
d V
ery
Goo
d V
ery
Goo
d V
ery
Goo
d C
Img/
l5,
14,
13,
958
8,0
13,1
16,3
20,9
19,4
Ver
y G
ood
Ver
y G
ood
Ver
yG
ood
Ver
y G
ood
Ver
y G
ood
Ver
y G
ood
Ver
y G
ood
Ver
y G
ood
Km
g/l
1,3
1,2
1,3
5,9
2,2
2,2
2,9
2,6
Ver
y G
ood
Ver
y G
ood
Ver
yG
ood
Ver
y G
ood
Ver
y G
ood
Ver
y G
ood
Ver
y G
ood
Ver
y G
ood
Ca
mg/
l19
,616
,817
,152
,823
,427
,030
,728
,9V
ery
Goo
d V
ery
Goo
d V
ery
Goo
dV
ery
Goo
d V
ery
Goo
d V
ery
Goo
d V
ery
Goo
d V
ery
Goo
d EC
mS/
m20
,016
,117
,037
1,0
27,1
33,6
38,6
36,9
Ver
y G
ood
Ver
y G
ood
Ver
y G
ood
Poor
Ver
y G
ood
Ver
y G
ood
Ver
y G
ood
Ver
y G
ood
SAR
as a
ratio
151,
10,
30,
312
,90,
60,
81,
01,
0V
ery
Goo
d V
ery
Goo
d V
ery
Goo
d Fa
irV
ery
Goo
d V
ery
Goo
d V
ery
Goo
d V
ery
Goo
d
Wat
erqu
ality
acco
unts
for S
outh
Afr
ica,
200
0
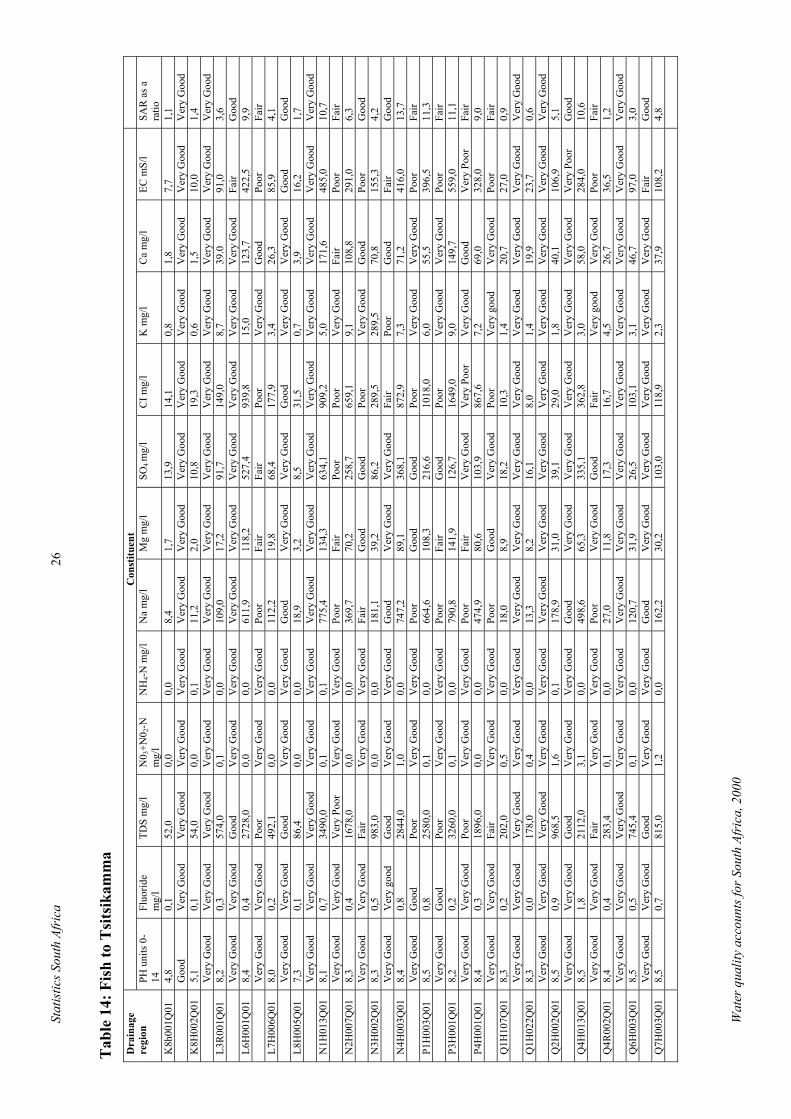
Stat
istic
s Sou
th A
fric
a26
Tab
le 1
4: F
ish
to T
sits
ikam
ma
Con
stitu
ent
Dra
inag
ere
gion
PH u
nits
0-
14Fl
uorid
em
g/l
TDS
mg/
lN
0 3+N
0 2-N
mg/
lN
H4-N
mg/
lN
a m
g/l
Mg
mg/
lSO
4m
g/l
CI m
g/l
K m
g/l
Ca
mg/
lEC
mS/
lSA
Ras
ara
tioK
8h00
1Q01
4,8
0,1
52,0
0,0
0,0
8,4
1,7
13,9
14,1
0,8
1,8
7,7
1,1
Goo
dV
ery
Goo
d V
ery
Goo
d V
ery
Goo
dV
ery
Goo
dV
ery
Goo
dV
ery
Goo
dV
ery
Goo
dV
ery
Goo
dV
ery
Goo
dV
ery
Goo
d V
ery
Goo
d V
ery
Goo
d K
8H00
2Q01
5,1
0,1
54,0
0,0
0,1
11,2
2,0
10,8
19,3
0,6
1,5
10,0
1,4
Ver
y G
ood
Ver
y G
ood
Ver
y G
ood
Ver
y G
ood
Ver
y G
ood
Ver
y G
ood
Ver
y G
ood
Ver
y G
ood
Ver
y G
ood
Ver
yG
ood
Ver
yG
ood
Ver
yG
ood
Ver
yG
ood
L3R
001Q
018,
20,
357
4,0
0,1
0,0
109,
017
,291
,714
9,0
8,7
39.0
91,0
3,6
Ver
y G
ood
Ver
y G
ood
Goo
dV
ery
Goo
d V
ery
Goo
d V
ery
Goo
d V
ery
Goo
d V
ery
Goo
d V
ery
Goo
d V
ery
Goo
d V
ery
Goo
d Fa
irG
ood
L6H
001Q
018,
40,
427
28,0
0,0
0,0
611,
911
8,2
527,
493
9,8
15,0
123,
742
2,5
9,9
Ver
y G
ood
Ver
y G
ood
Poor
Ver
yG
ood
Ver
yG
ood
Poor
Fair
Fair
Poor
Ver
yG
ood
Goo
dPo
orFa
irL7
H00
6Q01
8,0
0,2
492,
10,
00,
011
2,2
19,8
68,4
177,
93,
426
,385
,94,
1V
ery
Goo
d V
ery
Goo
d G
ood
Ver
y G
ood
Ver
yG
ood
Goo
dV
ery
Goo
dV
ery
Goo
dG
ood
Ver
yG
ood
Ver
y G
ood
Goo
dG
ood
L8H
005Q
017,
30,
186
,40,
00,
018
,93,
28,
531
,50,
73,
916
,21,
7V
ery
Goo
d V
ery
Goo
d V
ery
Goo
d V
ery
Goo
d V
ery
Goo
d V
ery
Goo
d V
ery
Goo
d V
ery
Goo
d V
ery
Goo
d V
ery
Goo
dV
ery
Goo
dV
ery
Goo
dV
ery
Goo
dN
1H01
3Q01
8,1
0,7
3490
,00,
10,
177
5,4
134,
363
4,1
909,
25,
017
1,6
485,
010
,7V
ery
Goo
d V
ery
Goo
d V
ery
Poor
Ver
y G
ood
Ver
y G
ood
Poor
Fair
Poor
Poor
Ver
y G
ood
Fair
Poor
Fair
N2H
007Q
018,
30,
416
78,0
0,0
0,0
369,
770
,225
8,7
659,
19,
110
8,8
291,
06,
3V
ery
Goo
d V
ery
Goo
d Fa
irV
ery
Goo
d V
ery
Goo
d Fa
irG
ood
Goo
dPo
orV
ery
Goo
dG
ood
Poor
Goo
dN
3H00
2Q01
8,3
0,5
983,
00,
00,
018
1,1
39,2
86,2
289,
528
9,5
70,8
155,
34,
2V
ery
Goo
d V
ery
good
G
ood
Ver
y G
ood
Ver
yG
ood
Goo
dV
ery
Goo
dV
ery
Goo
dFa
irPo
orG
ood
Fair
Goo
dN
4H00
3Q01
8,4
0,8
2844
,01,
00,
074
7,2
89,1
368,
187
2,9
7,3
71,2
416,
013
,7V
ery
Goo
d G
ood
Poor
Ver
y G
ood
Ver
yG
ood
Poor
Goo
dG
ood
Poor
Ver
y G
ood
Ver
y G
ood
Poor
Fair
P1H
003Q
018,
50,
825
80,0
0,1
0,0
664,
610
8,3
216,
610
18,0
6,0
55,5
396,
511
,3V
ery
Goo
d G
ood
Poor
Ver
y G
ood
Ver
y G
ood
Poor
Fair
Goo
dPo
orV
ery
Goo
d V
ery
Goo
d Po
orFa
irP3
H00
1Q01
8,2
0,2
3260
,00,
10,
079
0,8
141,
912
6,7
1649
,09,
014
9,7
559,
011
,1V
ery
Goo
d V
ery
Goo
d Po
orV
ery
Goo
d V
ery
Goo
d Po
orFa
irV
ery
Goo
d V
ery
Poor
Ver
y G
ood
Goo
dV
ery
Poor
Fair
P4H
001Q
018,
40,
318
96,0
0,0
0,0
474,
980
,610
3,9
867,
67,
269
,032
8,0
9,0
Ver
y G
ood
Ver
y G
ood
Fair
Ver
y G
ood
Ver
yG
ood
Poor
Goo
dV
ery
Goo
dPo
orV
ery
good
V
ery
Goo
d Po
orFa
irQ
1H10
7Q01
8,3
0,2
202,
00,
50,
018
,08,
918
,210
,31,
420
,727
,00,
9V
ery
Goo
d V
ery
Goo
d V
ery
Goo
d V
ery
Goo
d V
ery
Goo
d V
ery
Goo
d V
ery
Goo
dV
ery
Goo
d V
ery
Goo
d V
ery
Goo
d V
ery
Goo
d V
ery
Goo
d V
ery
Goo
dQ
1H02
2Q01
8,3
0,0
178,
00,
40,
013
,38,
216
,18,
01,
419
,923
,70,
6V
ery
Goo
d V
ery
Goo
d V
ery
Goo
d V
ery
Goo
d V
ery
Goo
d V
ery
Goo
d V
ery
Goo
d V
ery
Goo
d V
ery
Goo
d V
ery
Goo
dV
ery
Goo
dV
ery
Goo
dV
ery
Goo
dQ
2H00
2Q01
8,5
0,9
968,
51,
60,
117
8,9
31,0
39,1
29,0
1,8
40,1
106,
95,
1V
ery
Goo
d V
ery
Goo
d G
ood
Ver
y G
ood
Ver
y G
ood
Goo
dV
ery
Goo
d V
ery
Goo
d V
ery
Goo
d V
ery
Goo
dV
ery
Goo
dV
ery
Poor
Goo
dQ
4H01
3Q01
8,5
1,8
2112
,03,
10,
049
8,6
65,3
335,
136
2,8
3,0
58,0
284,
010
,6V
ery
Goo
d V
ery
Goo
d Fa
irV
ery
Goo
dV
ery
Goo
dPo
orV
ery
Goo
dG
ood
Fair
Ver
y go
od
Ver
y G
ood
Poor
Fair
Q4R
002Q
018,
40,
428
3,4
0,1
0,0
27,0
11,8
17,3
16,7
4,5
26,7
36,5
1,2
Ver
y G
ood
Ver
y G
ood
Ver
y G
ood
Ver
y G
ood
Ver
y G
ood
Ver
y G
ood
Ver
y G
ood
Ver
y G
ood
Ver
y G
ood
Ver
yG
ood
Ver
yG
ood
Ver
yG
ood
Ver
yG
ood
Q6H
003Q
018,
50,
574
5,4
0,1
0,0
120,
731
,926
,510
3,1
3,1
46,7
97,0
3,0
Ver
y G
ood
Ver
y G
ood
Goo
dV
ery
Goo
d V
ery
Goo
d G
ood
Ver
yG
ood
Ver
yG
ood
Ver
yG
ood
Ver
y G
ood
Ver
y G
ood
Fair
Goo
dQ
7H00
3Q01
8,5
0,7
815,
01,
20,
016
2,2
30,2
103,
011
8,9
2,3
37,9
108,
24,
8
Wat
erqu
ality
acco
unts
for S
outh
Afr
ica,
200
0
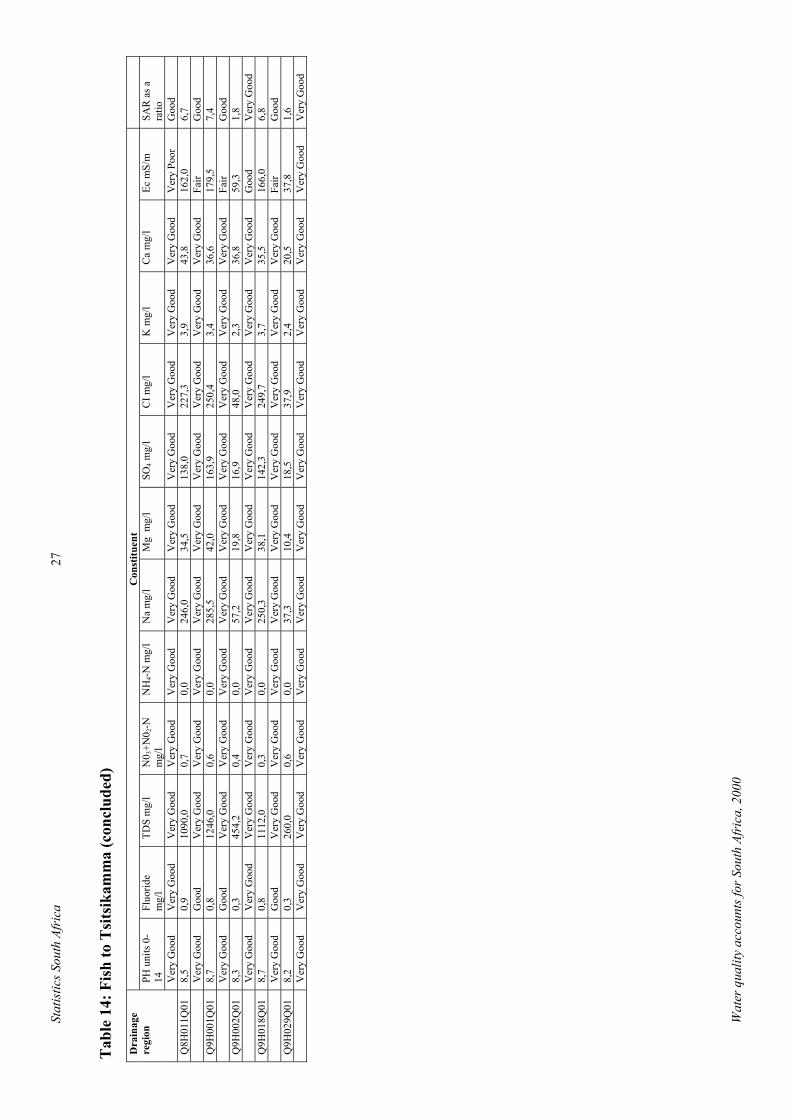
Stat
istic
s Sou
th A
fric
a27
Tab
le 1
4: F
ish
to T
sits
ikam
ma
(con
clud
ed)
Con
stitu
ent
PH u
nits
0-
14Fl
uorid
em
g/l
TDS
mg/
lN
0 3+N
0 2-N
mg/
lN
H4-N
mg/
lN
a m
g/l
Mg
mg/
lSO
4 mg/
lC
I mg/
lK
mg/
lC
a m
g/l
Ecm
S/m
SAR
asa
ratio
Dra
inag
ere
gion
Ver
y G
ood
Ver
y G
ood
Ver
y G
ood
Ver
y G
ood
Ver
y G
ood
Ver
y G
ood
Ver
y G
ood
Ver
y G
ood
Ver
y G
ood
Ver
yG
ood
Ver
yG
ood
Ver
yPo
orG
ood
Q8H
011Q
018,
50,
910
90,0
0,7
0,0
246,
034
,513
8,0
227,
33,
943
,816
2,0
6,7
Ver
y G
ood
Goo
dV
ery
Goo
d V
ery
Goo
d V
ery
Goo
d V
ery
Goo
d V
ery
Goo
d V
ery
Goo
d V
ery
Goo
d V
ery
Goo
d V
ery
Goo
d Fa
irG
ood
Q9H
001Q
018,
70,
812
46,0
0,6
0,0
285,
542
,016
3,9
250,
43,
436
,617
9,5
7,4
Ver
y G
ood
Goo
dV
ery
Goo
d V
ery
Goo
d V
ery
Goo
d V
ery
Goo
d V
ery
Goo
d V
ery
Goo
d V
ery
Goo
d V
ery
Goo
d V
ery
Goo
d Fa
irG
ood
Q9H
002Q
018,
30,
345
4,2
0,4
0,0
57,2
19,8
16,9
48,0
2,3
36,8
59,3
1,8
Ver
y G
ood
Ver
y G
ood
Ver
y G
ood
Ver
y G
ood
Ver
y G
ood
Ver
y G
ood
Ver
y G
ood
Ver
y G
ood
Ver
y G
ood
Ver
y G
ood
Ver
y G
ood
Goo
dV
ery
Goo
d Q
9H01
8Q01
8,7
0,8
1112
,00,
30,
025
0,3
38,1
142,
324
9,7
3,7
35,5
166,
06,
8V
ery
Goo
d G
ood
Ver
y G
ood
Ver
y G
ood
Ver
y G
ood
Ver
y G
ood
Ver
y G
ood
Ver
y G
ood
Ver
y G
ood
Ver
y G
ood
Ver
y G
ood
Fair
Goo
dQ
9H02
9Q01
8,2
0,3
260,
00,
60,
037
,310
,418
,537
,92,
420
,537
,81,
6V
ery
Goo
d V
ery
Goo
d V
ery
Goo
d V
ery
Goo
d V
ery
Goo
d V
ery
Goo
d V
ery
Goo
d V
ery
Goo
d V
ery
Goo
d V
ery
Goo
dV
ery
Goo
dV
ery
Goo
dV
ery
Goo
d
Wat
erqu
ality
acco
unts
for S
outh
Afr
ica,
200
0
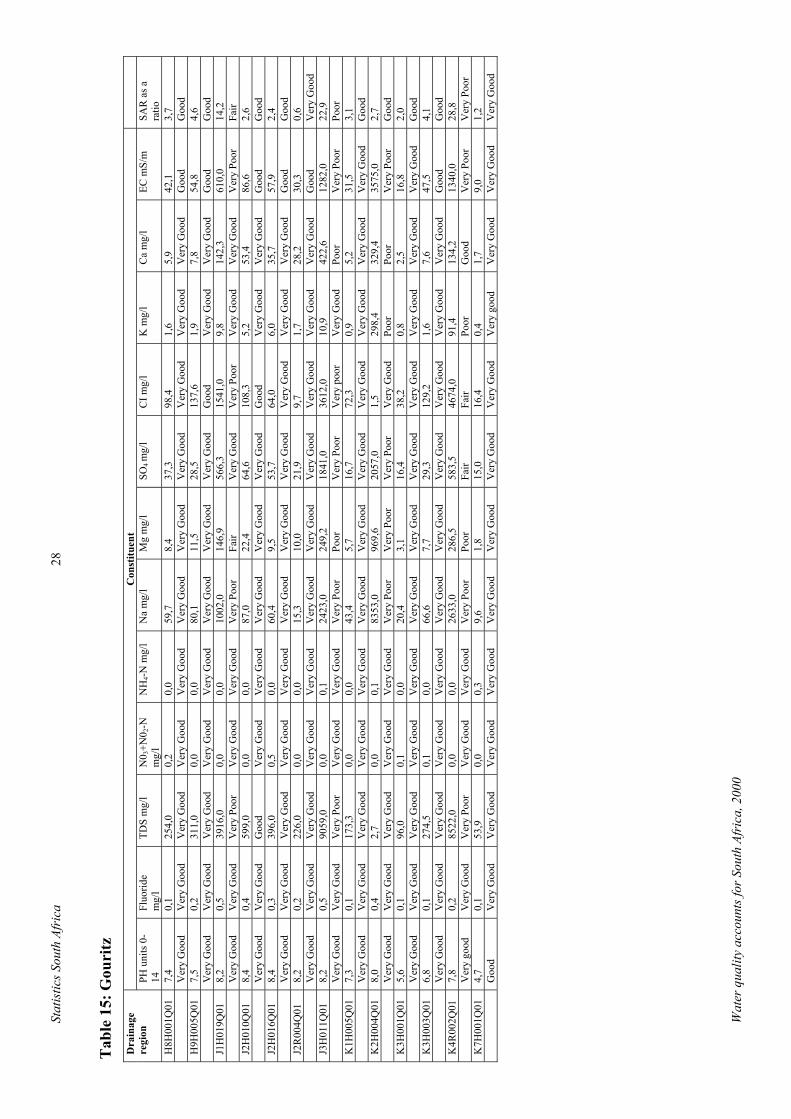
Stat
istic
s Sou
th A
fric
a28
Tab
le 1
5: G
ouri
tzC
onst
ituen
tD
rain
age
regi
onPH
uni
ts 0
-14
Fluo
ride
mg/
lTD
S m
g/l
N0 3
+N0 2
-Nm
g/l
NH
4-N m
g/l
Na
mg/
lM
gm
g/l
SO4m
g/l
CI m
g/l
K m
g/l
Ca
mg/
lEC
mS/
mSA
Ras
ara
tioH
8H00
1Q01
7,4
0,1
254,
00,
20,
059
,78,
437
,398
,41,
65,
942
,13,
7V
ery
Goo
d V
ery
Goo
d V
ery
Goo
dV
ery
Goo
dV
ery
Goo
dV
ery
Goo
dV
ery
Goo
dV
ery
Goo
dV
ery
Goo
dV
ery
Goo
dV
ery
Goo
dG
ood
Goo
dH
9H00
5Q01
7,5
0,2
311,
00,
00,
080
,111
,528
,513
7,6
1,9
7,8
54,8
4,6
Ver
y G
ood
Ver
y G
ood
Ver
y G
ood
Ver
yG
ood
Ver
yG
ood
Ver
yG
ood
Ver
yG
ood
Ver
yG
ood
Goo
dV
ery
Goo
d G
ood
Goo
dJ1
H01
9Q01
8,2
0,5
3916
,00,
00,
010
02,0
146,
956
6,3
1541
,09,
814
2,3
610,
014
,2V
ery
Goo
d V
ery
Goo
d V
ery
Poor
Ver
y G
ood
Ver
y G
ood
Ver
y Po
orFa
irV
ery
Goo
d V
ery
Poor
Ver
yG
ood
Ver
yG
ood
Ver
yPo
orFa
irJ2
H01
0Q01
8,4
0,4
599,
00,
00,
087
,022
,464
,610
8,3
5,2
53,4
86,6
2,6
Ver
y G
ood
Ver
y G
ood
Goo
dV
ery
Goo
d V
ery
Goo
d V
ery
Goo
d V
ery
Goo
d V
ery
Goo
d G
ood
Ver
y G
ood
Ver
y G
ood
Goo
dG
ood
J2H
016Q
018,
40,
339
6,0
0,5
0,0
60,4
9,5
53,7
64,0
6,0
35,7
57,9
2,4
Ver
y G
ood
Ver
y G
ood
Ver
y G
ood
Ver
yG
ood
Ver
yG
ood
Ver
yG
ood
Ver
yG
ood
Ver
yG
ood
Ver
yG
ood
Ver
yG
ood
Ver
yG
ood
Goo
dG
ood
J2R
004Q
018,
20,
222
6,0
0,0
0,0
15,3
10,0
21,9
9,7
1,7
28,2
30,3
0,6
Ver
y G
ood
Ver
y G
ood
Ver
y G
ood
Ver
y G
ood
Ver
y G
ood
Ver
y G
ood
Ver
y G
ood
Ver
y G
ood
Ver
y G
ood
Ver
y G
ood
Ver
y G
ood
Goo
dV
ery
Goo
d J3
H01
1Q01
8,2
0,5
9059
,00,
00,
124
23,0
249,
218
41,0
3612
,010
,942
2,6
1282
,022
,9V
ery
Goo
d V
ery
Goo
d V
ery
Poor
Ver
y G
ood
Ver
y G
ood
Ver
y Po
orPo
orV
ery
Poor
Ver
y po
orV
ery
Goo
d Po
orV
ery
Poor
Poor
K1H
005Q
017,
30,
117
3,3
0,0
0,0
43,4
5,7
16,7
72,3
0,9
5,2
31,5
3,1
Ver
y G
ood
Ver
y G
ood
Ver
y G
ood
Ver
y G
ood
Ver
y G
ood
Ver
y G
ood
Ver
y G
ood
Ver
y G
ood
Ver
y G
ood
Ver
y G
ood
Ver
y G
ood
Ver
y G
ood
Goo
dK
2H00
4Q01
8,0
0,4
2,7
0,0
0,1
8353
,096
9,6
2057
,01,
529
8,4
329,
435
75,0
2,7
Ver
y G
ood
Ver
y G
ood
Ver
y G
ood
Ver
y G
ood
Ver
y G
ood
Ver
y Po
orV
ery
Poor
Ver
y Po
orV
ery
Goo
dPo
orPo
orV
ery
Poor
Goo
dK
3H00
1Q01
5,6
0,1
96,0
0,1
0,0
20,4
3,1
16,4
38,2
0,8
2,5
16,8
2,0
Ver
y G
ood
Ver
y G
ood
Ver
y G
ood
Ver
y G
ood
Ver
y G
ood
Ver
y G
ood
Ver
y G
ood
Ver
y G
ood
Ver
y G
ood
Ver
y G
ood
Ver
y G
ood
Ver
y G
ood
Goo
dK
3H00
3Q01
6,8
0,1
274,
50,
10,
066
,67,
729
,312
9,2
1,6
7,6
47,5
4,1
Ver
y G
ood
Ver
y G
ood
Ver
y G
ood
Ver
yG
ood
Ver
yG
ood
Ver
yG
ood
Ver
yG
ood
Ver
yG
ood
Ver
yG
ood
Ver
yG
ood
Ver
yG
ood
Goo
dG
ood
K4R
002Q
017,
80,
285
22,0
0,0
0,0
2633
,028
6,5
583,
546
74,0
91,4
134,
213
40,0
28,8
Ver
y go
od
Ver
y G
ood
Ver
y Po
orV
ery
Goo
dV
ery
Goo
dV
ery
Poor
Poor
Fair
Fair
Poor
Goo
dV
ery
Poor
Ver
y Po
orK
7H00
1Q01
4,7
0,1
53,9
0,0
0,3
9,6
1,8
15,0
16,4
0,4
1,7
9,0
1,2
Goo
dV
ery
Goo
d V
ery
Goo
d V
ery
Goo
dV
ery
Goo
dV
ery
Goo
dV
ery
Goo
dV
ery
Goo
dV
ery
Goo
dV
ery
good
Ver
y G
ood
Ver
y G
ood
Ver
y G
ood
Ver
y G
ood
Wat
erqu
ality
acco
unts
for S
outh
Afr
ica,
200
0
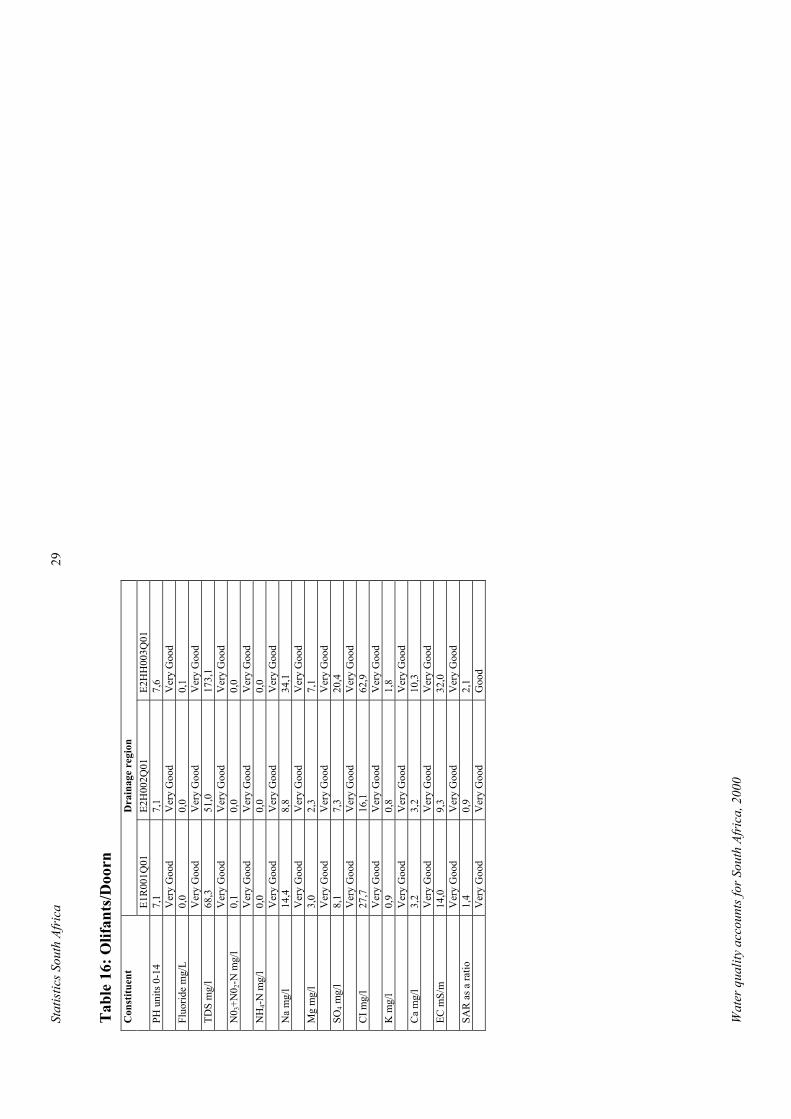
Stat
istic
s Sou
th A
fric
a29
Tab
le 1
6: O
lifan
ts/D
oorn
Dra
inag
ere
gion
Con
stitu
ent
E1R
001Q
01E2
H00
2Q01
E2H
H00
3Q01
PH u
nits
0-1
47,
17,
17,
6V
ery
Goo
d V
ery
Goo
d V
ery
Goo
d Fl
uorid
e m
g/L
0,0
0,0
0,1
Ver
y G
ood
Ver
y G
ood
Ver
y G
ood
TDS
mg/
l68
,351
,017
3,1
Ver
y G
ood
Ver
y G
ood
Ver
y G
ood
N0 3
+N0 2
-N m
g/l
0,1
0,0
0,0
Ver
y G
ood
Ver
y G
ood
Ver
y G
ood
NH
4-N m
g/l
0,0
0,0
0,0
Ver
y G
ood
Ver
y G
ood
Ver
y G
ood
Na
mg/
l14
,48,
834
,1V
ery
Goo
d V
ery
Goo
d V
ery
Goo
d M
g m
g/l
3,0
2,3
7,1
Ver
y G
ood
Ver
y G
ood
Ver
y G
ood
SO4 m
g/l
8,1
7,3
20,4
Ver
y G
ood
Ver
y G
ood
Ver
y G
ood
CI m
g/l
27,7
16,1
62,9
Ver
y G
ood
Ver
y G
ood
Ver
y G
ood
K m
g/l
0,9
0,8
1,8
Ver
y G
ood
Ver
y G
ood
Ver
y G
ood
Ca
mg/
l3,
23,
210
,3V
ery
Goo
d V
ery
Goo
d V
ery
Goo
d EC
mS/
m14
,09,
332
,0V
ery
Goo
d V
ery
Goo
d V
ery
Goo
d SA
R a
s a ra
tio1,
40,
92,
1V
ery
Goo
d V
ery
Goo
d G
ood
Wat
erqu
ality
acco
unts
for S
outh
Afr
ica,
200
0
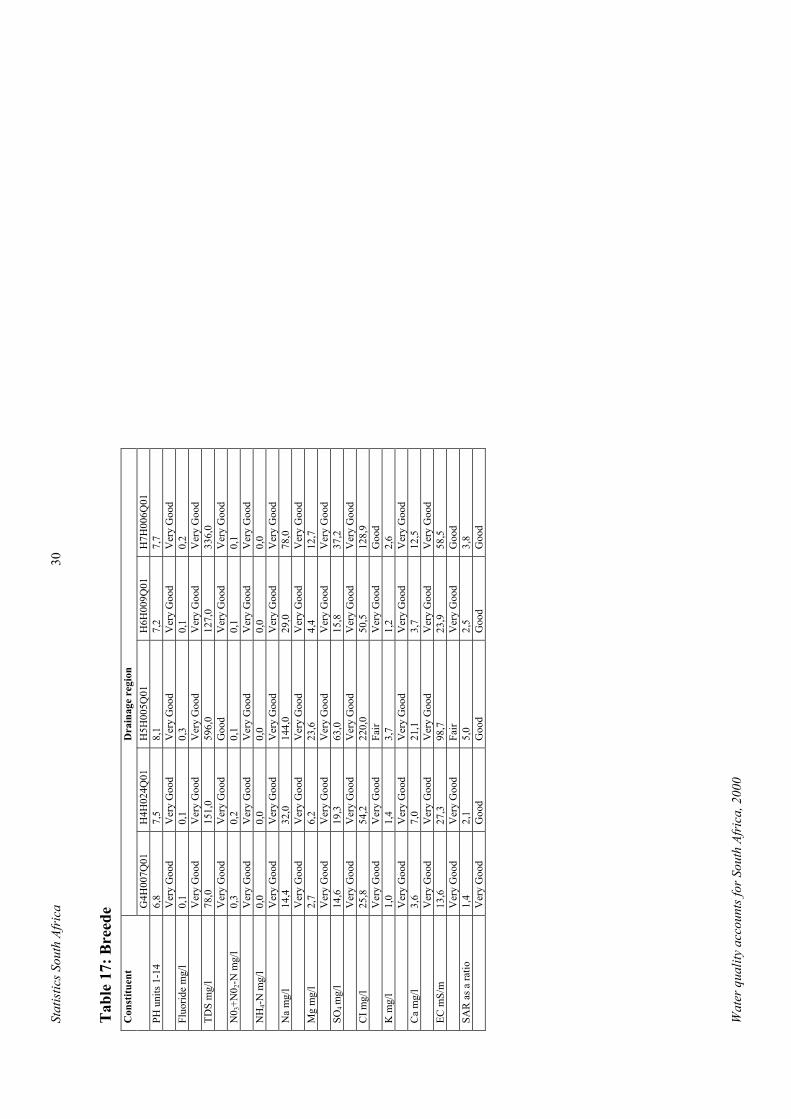
Stat
istic
s Sou
th A
fric
a30
Tab
le 1
7: B
reed
e D
rain
age
regi
onC
onst
ituen
tG
4H00
7Q01
H4H
024Q
01H
5H00
5Q01
H6H
009Q
01H
7H00
6Q01
PH u
nits
1-1
46,
87,
58,
17,
27,
7V
ery
Goo
d V
ery
Goo
d V
ery
Goo
d V
ery
Goo
d V
ery
Goo
d Fl
uorid
em
g/l
0,1
0,1
0,3
0,1
0,2
Ver
y G
ood
Ver
y G
ood
Ver
y G
ood
Ver
y G
ood
Ver
y G
ood
TDS
mg/
l78
,015
1,0
596,
012
7,0
336,
0V
ery
Goo
d V
ery
Goo
d G
ood
Ver
y G
ood
Ver
y G
ood
N0 3
+N0 2
-Nm
g/l
0,3
0,2
0,1
0,1
0,1
Ver
y G
ood
Ver
y G
ood
Ver
y G
ood
Ver
y G
ood
Ver
y G
ood
NH
4-Nm
g/l
0,0
0,0
0,0
0,0
0,0
Ver
y G
ood
Ver
y G
ood
Ver
y G
ood
Ver
y G
ood
Ver
y G
ood
Na
mg/
l14
,432
,014
4,0
29,0
78,0
Ver
y G
ood
Ver
y G
ood
Ver
y G
ood
Ver
y G
ood
Ver
y G
ood
Mg
mg/
l2,
76,
223
,64,
412
,7V
ery
Goo
d V
ery
Goo
d V
ery
Goo
d V
ery
Goo
d V
ery
Goo
d SO
4m
g/l
14,6
19,3
63,0
15,8
37,2
Ver
y G
ood
Ver
y G
ood
Ver
y G
ood
Ver
y G
ood
Ver
y G
ood
CIm
g/l
25,8
54,2
220,
050
,512
8,9
Ver
y G
ood
Ver
y G
ood
Fair
Ver
yG
ood
Goo
dK
mg/
l1,
01,
43,
71,
22,
6V
ery
Goo
d V
ery
Goo
d V
ery
Goo
d V
ery
Goo
d V
ery
Goo
d C
am
g/l
3,6
7,0
21,1
3,7
12,5
Ver
y G
ood
Ver
y G
ood
Ver
y G
ood
Ver
y G
ood
Ver
y G
ood
ECm
S/m
13,6
27,3
98,7
23,9
58,5
Ver
y G
ood
Ver
y G
ood
Fair
Ver
yG
ood
Goo
dSA
R a
s a ra
tio1,
42,
15,
02,
53,
8V
ery
Goo
dG
ood
Goo
dG
ood
Goo
d
Wat
erqu
ality
acco
unts
for S
outh
Afr
ica,
200
0
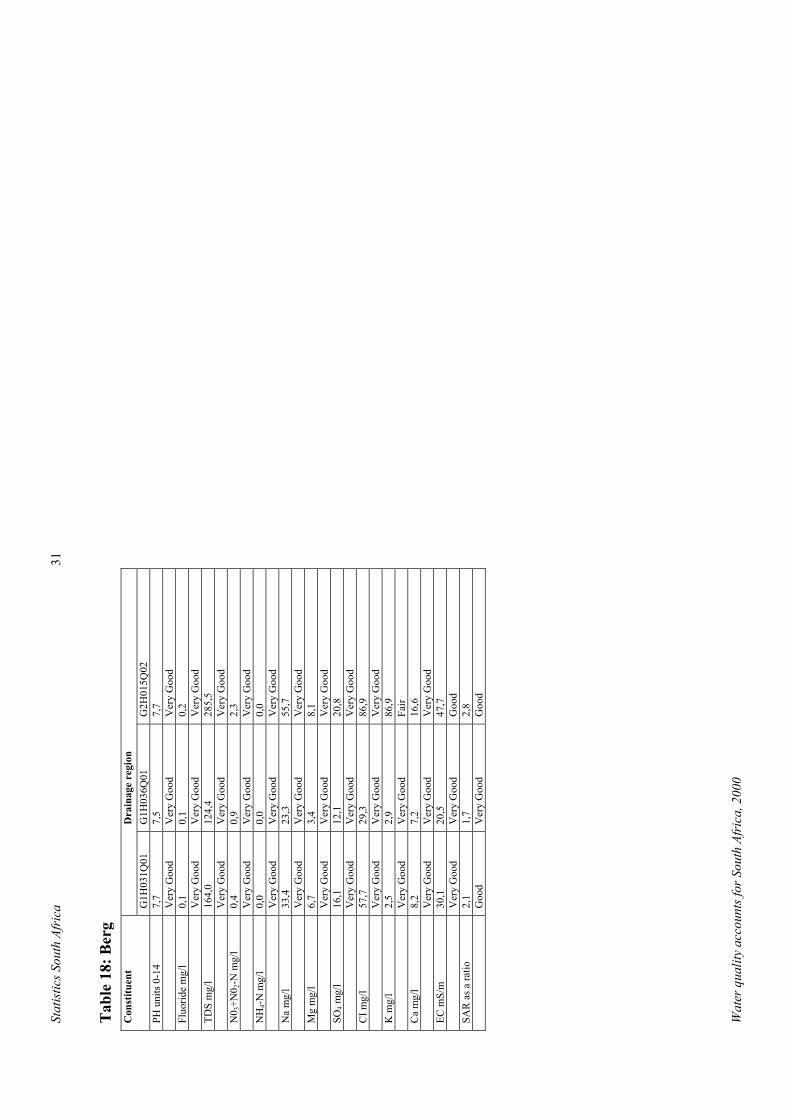
Stat
istic
s Sou
th A
fric
a31
Tab
le 1
8: B
erg
Dra
inag
e re
gion
C
onst
ituen
tG
1H03
1Q01
G1H
036Q
01G
2H01
5Q02
PH u
nits
0-1
47,
77,
57,
7V
ery
Goo
d V
ery
Goo
d V
ery
Goo
d Fl
uorid
e m
g/l
0,1
0,1
0,2
Ver
y G
ood
Ver
y G
ood
Ver
y G
ood
TDS
mg/
l16
4,0
124,
428
5,5
Ver
y G
ood
Ver
y G
ood
Ver
y G
ood
32
0,4
0,9
2,3
Ver
y G
ood
Ver
y G
ood
Ver
y G
ood
NH
4-N m
g/l
0,0
0,0
0,0
Ver
y G
ood
Ver
y G
ood
Ver
y G
ood
Na
mg/
l33
,423
,355
,7V
ery
Goo
d G
ood
Ver
yV
ery
Goo
d M
g m
g/l
6,7
3,4
8,1
Ver
y G
ood
Ver
y G
ood
Ver
y G
ood
SO4 m
g/l
16,1
12,1
20,8
Ver
y G
ood
Ver
y G
ood
Ver
y G
ood
CI m
g/l
57,7
29,3
86,9
Ver
y G
ood
Ver
y G
ood
Ver
y G
ood
K m
g/l
2,5
2,9
86,9
Ver
y G
ood
Ver
y G
ood
Fair
Ca
mg/
l8,
27,
216
,6V
ery
Goo
d V
ery
Goo
d V
ery
Goo
d EC
mS/
m30
,120
,547
,7V
ery
Goo
d V
ery
Goo
d G
ood
SAR
as a
ratio
2,1
1,7
2,8
Goo
dV
ery
Goo
dG
ood
N0
+N0
-N m
g/l
Wat
erqu
ality
acco
unts
for S
outh
Afr
ica,
200
0
Statistics South Africa 32
9 Data collection, availability and problems experienced The water quality data that were used in the assessment of the fitness for use of South Africa’s surface and groundwater resources for domestic and irrigated agricultural werecollected as part of the National Chemical or Salinity Monitoring Programme. Thisprogramme has been in operation since the early 1970s and samples are regularly collected atapproximately 1 600 monitoring stations at a frequency that varies from weekly to monthly. The samples collected for this programme are analysed at the laboratories of the Institute forWater Quality Studies and the data is stored on DWAF’s Water Management System (WMS)database.
Further development of water quality accounts in South Africa is constrained by a severe lack of relevant information. Research indicates that international agencies are faced with the same problem and have consequently made very little progress in the construction of waterquality accounts. At present, South Africa does not have information where loads (flow combined with quality) have been calculated. Therefore there are no records where quantity is linked with quality at the moment.
Flow in South African rivers is characterised by variability above all. Rainfall over most of the country is seasonal and accordingly within a year flow is low during the dry season andhigher during the rainy season. Between years, flow can be even more variable, and can range from a trickle during severe droughts to raging floods in a wet year. The important point here is that the quantity information does not relate to static volumes of water that could be expected to flow in a river over a period of time. The information provided by the Inorganic Chemical Water Quality of Surface Water Resources gives only an indication of average water quality across the country, and indicates where there are problems to be addressed; it cannot be sensibly combined with water quantity information to give any meaningful result.
Water quality accounts for South Africa, 2000
Statistics South Africa 33
10 Concluding remarksThis discussion document shows the water quality indicators information obtained from theNational Chemical Water Quality Monitoring Programme. The data generated by this programme were used to provide information on the status of the chemical water quality of South Africa surface water to water resource managers, scientists, decision-makers, and the public in an easy to understand way. The main water quality problems for domestic water users are high total dissolved salts and, in other places, fluoride concentrations. The sodium adsorption ratio, electrical conductivity, pH and chloride are potential problems for irrigated agriculture.
The inability to combine the quality data with quantity data is a challenge that needs to beaddressed. This was the first step in attempting to compile water quality accounts. Whenrelevant data becomes available it will be possible to follow the prescribed guidelines so that the accounts are comparable to other countries.
We invite all stakeholders to provide us with any comments and suggestions as they mighthave regarding the content of this discussion document. The comments and suggestions will be included in the next publication.
Comments and suggestions can be e-mailed to the following addresses:
[email protected] orEdithM@statssa,gov.za
Water quality accounts for South Africa, 2000
Statistics South Africa 34
11. Glossary
Account An account is a tool which records, for given aspects of economic life, (a) the uses and resources or (b) the changes in assets and the changes in liabilities and/or (c) the stock of assets and liabilities existing at a certaintime; transaction accounts include a balancing item which is used to equate the two sides of the accounts (e.g. resources and uses) and which is a meaningfulmeasure of economic performance in itself.
Catchment A catchment is an area on which rain falls and fromwhich the water runs into a particular river.
Evapotranspiration Evapotranspiration is the combined loss of water byevaporation from soil or surface water and transpiration from plants and animals.
Groundwater Freshwater beneath the earth’s surface (usually inaquifers) supplying wells and springs.
Mean annual runoff Average annual flow under natural conditions. (This definition is dependent on the runoff regime for each river basin).
Natural resourceAccounting (NRA) Accounting system that deals with stocks and stock
changes of natural assets, comprising biota (produced or wild), subsoil assets (proved reserves), water and land, with their aquatic and terrestrial ecosystems. It is frequently used in the sense of physical accounting as distinguished from monetary (environmental)accounting.
System of IntegratedEnvironmental and Economic Accounting (SEEA) The SEEA was developed by the United Nations
Statistical Division, as a satellite system to the System of National Accounts (SNA), for the incorporation of environmental concerns (environmental costs, benefits and assets) in the national accounts. The SEEA isintended to be a system with global application andstandards, suitable for all countries and all aspects of theenvironment.
Water quality accounts for South Africa, 2000
Statistics South Africa 35
System of NationalAccounts (SNA) An international accounting framework consisting of a
coherent, consistent and integrated set of macro-economic accounts, balance sheets and tables based on a set of internationally agreed concepts, definitions,classifications and accounting rules. It provides a comprehensive accounting framework within which economic data can be compiled and presented in a format that is designed for the purposes of economicanalysis, and decision and policy making.(UN,1993,1.1)
Water management area A water management area is an area defined for specific water management purposes.
Water quality accounts for South Africa, 2000
Statistics South Africa 36
12. ReferencesDepartment of Water Affairs and Forestry. 1996. The South African Water Quality Guidelines 1996, 2nd Edition, Department of Water Affairs and Forestry, Pretoria
Department of Water Affairs and Forestry. 2001. Quality of Domestic Water SuppliesHandbook 2nd Edition 1998, Department of Water Affairs and Forestry, Pretoria
Department of Water Affairs and Forestry. 2002 (SA) Volume 1 Inorganic Chemical Water Quality of Surface Water Resources in SA, 1st Edition 2002, Department of Water Affairs and Forestry, Pretoria
Statistics Canada. 1997. Canadian System of Environmental and Resource Accounts.Statistics Canada Catalogue No 16-505-GPE, Canada
Statistics South Africa (Stats SA). 2000 Water Accounts for Nineteen Water ManagementAreas, Statistics South Africa, Pretoria
Tafi, J and JL Weber (2000). Inland Water Accounts of the Republic of Moldova, PreliminaryResults of Resource Accounts in Raw Quantities, 1994 and 1998, Eurostat, TACIS Project MD92FR01
United Nations Statistics Division. 2003. Handbook on Integrated Environmental and Economic Accounting. (SEEA). Unstad
United Nations. 1993. System of National Accounts (SNA), System adopted worldwide forconventional Economic (National) Accounting (Commission of the European Communities and others, 1993)
Water quality accounts for South Africa, 2000
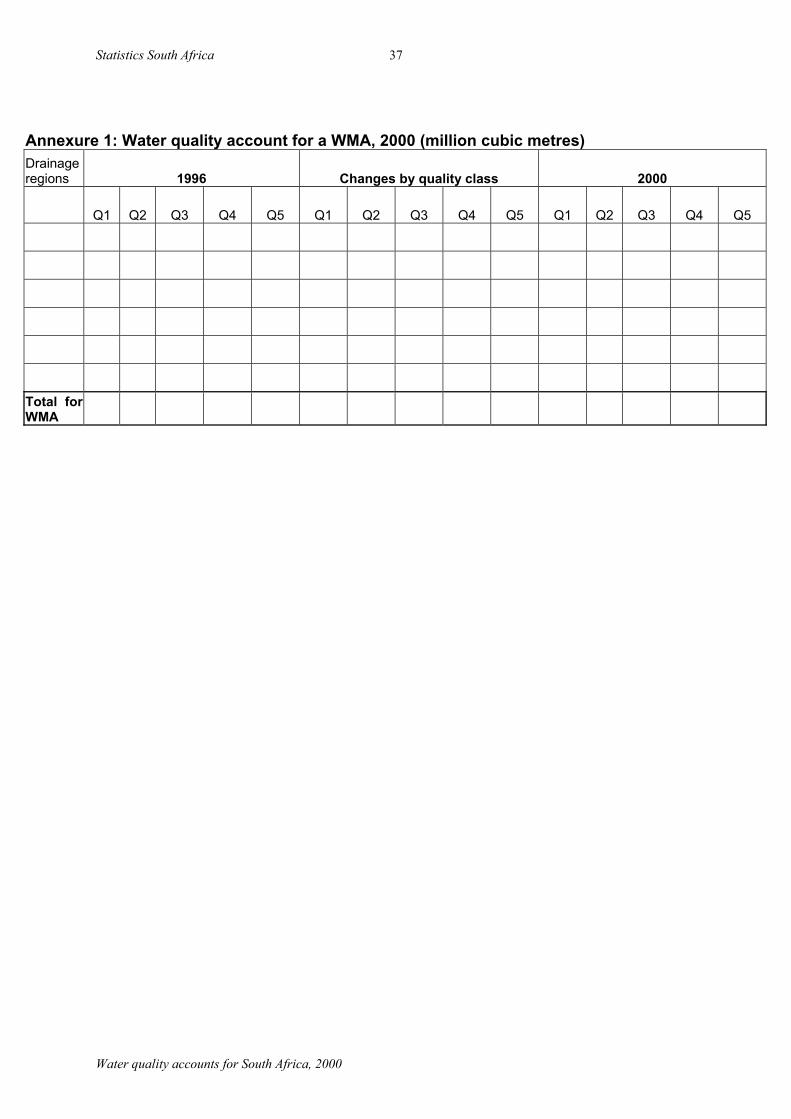
Statistics South Africa 37
Annexure 1: Water quality account for a WMA, 2000 (million cubic metres) Drainageregions 1996 Changes by quality class 2000
Q1 Q2 Q3 Q4 Q5 Q1 Q2 Q3 Q4 Q5 Q1 Q2 Q3 Q4 Q5
Total forWMA
Water quality accounts for South Africa, 2000
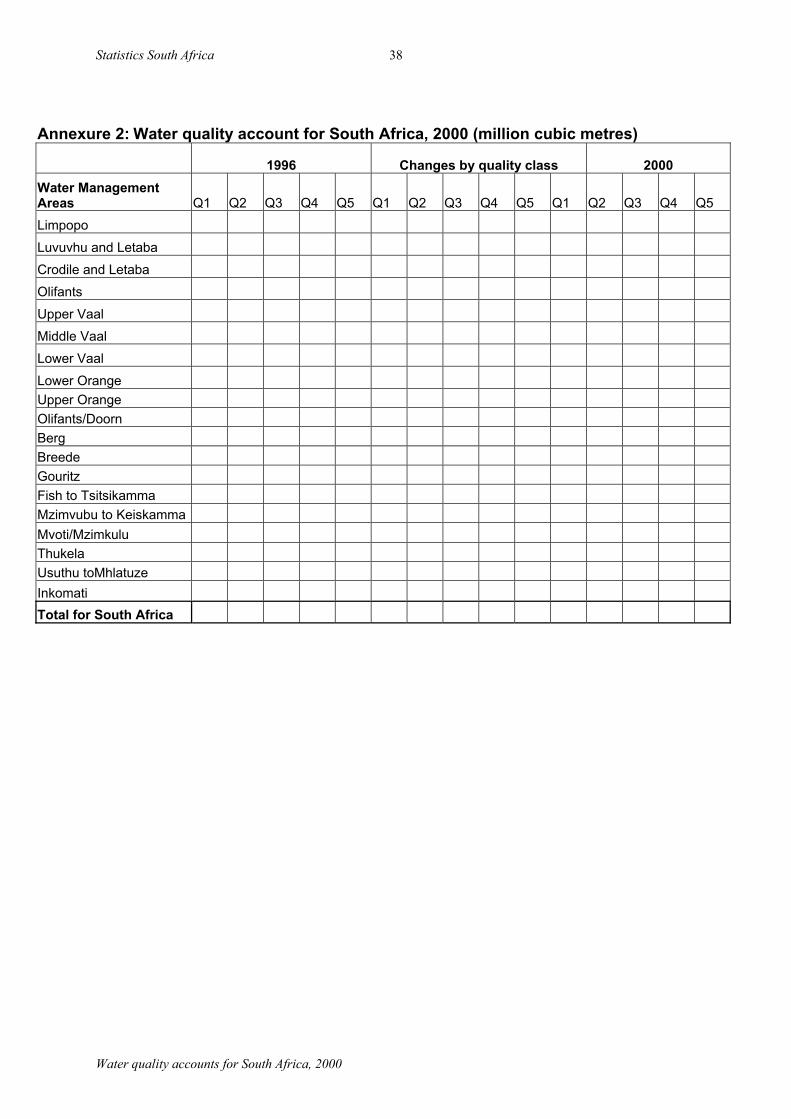
Statistics South Africa 38
Annexure 2: Water quality account for South Africa, 2000 (million cubic metres)
1996 Changes by quality class 2000Water ManagementAreas Q1 Q2 Q3 Q4 Q5 Q1 Q2 Q3 Q4 Q5 Q1 Q2 Q3 Q4 Q5
Limpopo
Luvuvhu and Letaba
Crodile and Letaba
Olifants
Upper Vaal
Middle Vaal
Lower Vaal
Lower Orange Upper Orange Olifants/DoornBergBreedeGouritzFish to TsitsikammaMzimvubu to KeiskammaMvoti/MzimkuluThukelaUsuthu toMhlatuzeInkomatiTotal for South Africa
Water quality accounts for South Africa, 2000
Statistics South Africa 39
Annexure 3: Water quality criteria
Water quality criteria are scientific and technical information provided for a particular waterquality constituent in the form of numerical data and/or narrative descriptions of its effects on the fitness of water for a particular use or the health of aquatic ecosystems. For each waterquality constituent there is a No Effect Range. This is the range of concentration or levels at which the presence of that constituent would have not known or anticipated adverse effects on the fitness of water for a particular use or on the protection of aquatic ecosystem. Theseranges were determined by assuming long-term continuous use (life-long exposure) and incorporate a margin of safety. As a matter of policy, the Department of Water Affairs and Forestry (DWAF) strives to maintain the quality of South Africa’s water resources such that they remain within the No Effect Range. DWAF encourages all stakeholders concerned withthe quality of South Africa’s water resources to join forces and aim to maintain water quality within the No Effect Range where and whenever possible.
For this reason, the No Effect Range in the South African Water Quality Guidelines (DWAF)is referred to as the Target Water Quality Range (TWQR). It is included and highlighted as such in the water quality criteria provided for each of the constituents in the guidelines. Usersof the guidelines should note that an important implication of setting the Target WaterQuality Range equal to the No Effect Range is that it specifies good or ideal water quality instead of water quality that is merely acceptable. Part of DWAF’s mission is to maintain the fitness for use of water on a sustained basis. The concept of fitness for use is therefore central to water quality management in South Africa and to the development and use of these guidelines. Four broad categories of use are recognised in the South African Water Act, namely:
domestic purposes, industrial purposes, agricultural purposes, and recreational purposes.
DWAF’s mandate also requires it to protect the health and integrity of aquatic ecosystems.The water quality requirements of the four uses given above and those for the protection of aquatic ecosystems form the basis on which the fitness for use of water is judged.
Fitness for use
The fitness for use of water is a judgment of how suitable the use of water is for its intendeduse or for the health of aquatic ecosystems. To be able to make judgments about its fitness foruse, one needs to:
characterise the water and/or particular aquatic ecosystem from a water quality perspective;determine the quality requirements of the intended uses and/or that of aquatic ecosystems;obtain information on the key constituents that determine the fitness of water for its intended uses or that affect the health of aquatic ecosystems;establish how, and how much, the intended use or aquatic ecosystems will be affectedby the prevailing water quality; and determine whether the undesirable effects of water quality on a particular use can bemitigated.
Water quality accounts for South Africa, 2000
Statistics South Africa 40
The fitness for use of water can range from being completely unfit for use to being 100% orideally fit for a specific use. The narrative descriptions commonly used to express judgmentsabout the fitness of water for use are:
ideal; 100% fit for use; desirable water quality; target water quality range (TWQR)acceptable;tolerable, usually for a limited time period only;unacceptable for use; andcompletely unfit for use.
There is a need to divide water quality into classes and to define the quality classes beforewater quality accounts can be constructed. Generally quality is classified into five classes to describe the ecological state of a river. The five classes are:
This is the point where the South African Water Quality Guidelines prove useful. They areused as a primary source of information and decision-support to judge the fitness of water for use and for other water quality management purposes. These guidelines contain informationsimilar to that in the international literature. They are similar to the international literature in that their aim is to provide scientific yardsticks against which the fitness for use of a particular water body for a designated use may be evaluated. However the information in the South African water quality guidelines is more detailed, and provides not only information on the ideal water quality for water uses but in addition provides background information to help users of the guidelines make informed judgments about the fitness of water use. Theseguidelines are being developed by DWAF as an important information resource, primarily forwater quality managers. Nevertheless, educators and other interested and affected membersof the general public are likely to find them a valuable source of information for manyaspects of water quality and its management.
Q1 - represents water of very good quality Q2 - represents water of good quality Q3 - represents water of fair quality Q4 -represents water of poor quality Q5 - represents water of very poor quality
Although scientific measurements are used to define the quality of water, it’s not a simplething to say that “this water is good or this water is bad”. The quality of water that is required to wash a car is not the same as the quality that is required for drinking. Therefore when wespeak of water quality we usually want to know if the water is suitable for its intended use, be it domestic, farming, mining or industrial purposes, or its suitability to maintain a healthy ecosystem.
Water quality accounts for South Africa, 2000
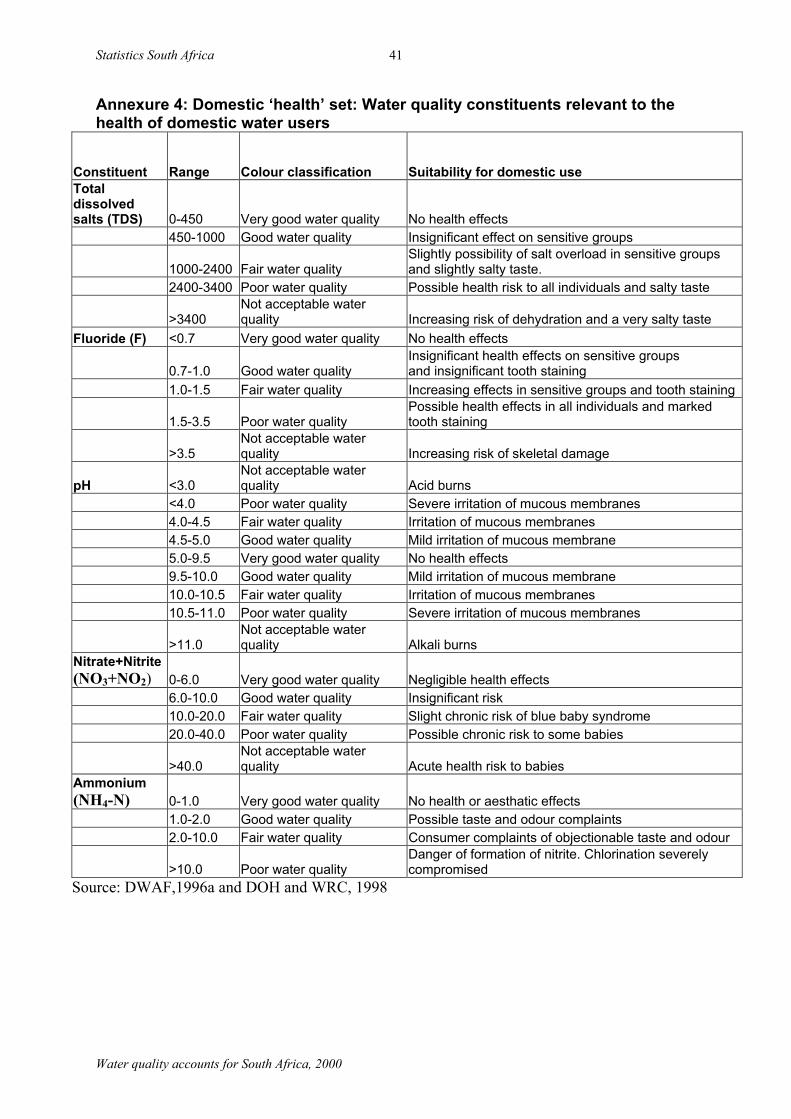
Statistics South Africa 41
Annexure 4: Domestic ‘health’ set: Water quality constituents relevant to the health of domestic water users
Constituent Range Colour classification Suitability for domestic use
0-450 Very good water quality No health effects 450-1000 Good water quality Insignificant effect on sensitive groups
1000-2400 Fair water qualitySlightly possibility of salt overload in sensitive groupsand slightly salty taste.
2400-3400 Poor water quality Possible health risk to all individuals and salty taste
>3400Not acceptable water quality Increasing risk of dehydration and a very salty taste
Fluoride (F) <0.7 Very good water quality No health effects
0.7-1.0 Good water qualityInsignificant health effects on sensitive groupsand insignificant tooth staining
1.0-1.5 Fair water quality Increasing effects in sensitive groups and tooth staining
1.5-3.5 Poor water qualityPossible health effects in all individuals and markedtooth staining
>3.5Not acceptable water quality Increasing risk of skeletal damage
pH <3.0Not acceptable water quality Acid burns
<4.0 Poor water quality Severe irritation of mucous membranes4.0-4.5 Fair water quality Irritation of mucous membranes4.5-5.0 Good water quality Mild irritation of mucous membrane
Very good water quality No health effects 9.5-10.0 Good water quality Mild irritation of mucous membrane10.0-10.5 Fair water quality Irritation of mucous membranes10.5-11.0 Poor water quality Severe irritation of mucous membranes
>11.0Not acceptable water quality Alkali burns
Nitrate+Nitrite(NO3+NO2) 0-6.0 Very good water quality Negligible health effects
6.0-10.0 Good water quality Insignificant risk10.0-20.0 Fair water quality Slight chronic risk of blue baby syndrome20.0-40.0 Poor water quality Possible chronic risk to some babies
>40.0Not acceptable water quality Acute health risk to babies
Ammonium(NH4-N) 0-1.0 Very good water quality No health or aesthatic effects
1.0-2.0 Good water quality Possible taste and odour complaints2.0-10.0 Fair water quality Consumer complaints of objectionable taste and odour
>10.0 Poor water qualityDanger of formation of nitrite. Chlorination severelycompromised
Totaldissolvedsalts (TDS)
5.0-9.5
Source: DWAF,1996a and DOH and WRC, 1998
Water quality accounts for South Africa, 2000
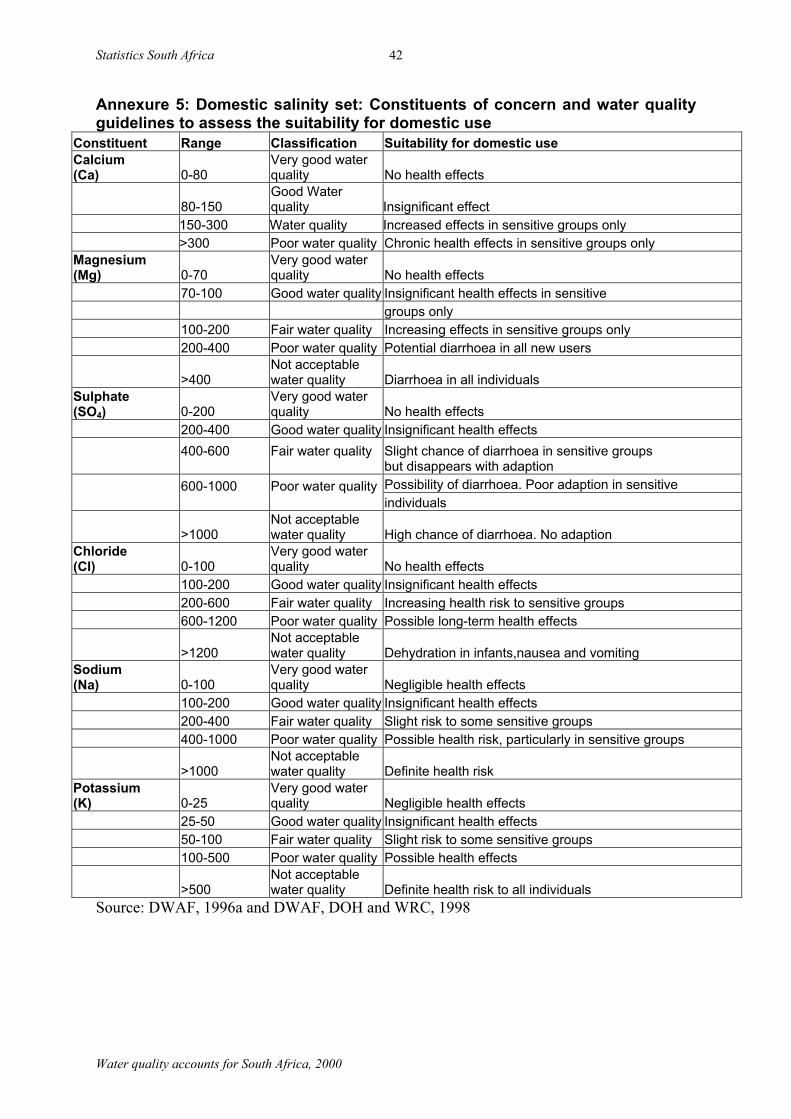
Statistics South Africa 42
Annexure 5: Domestic salinity set: Constituents of concern and water qualityguidelines to assess the suitability for domestic use
Constituent Range Classification Suitability for domestic useCalcium(Ca) 0-80
Very good waterquality No health effects
80-150Good Waterquality Insignificant effect
150-300 rWater quality Increased effects in sensitive groups only>300 oPoor water quality Chronic health effects in sensitive groups only
Magnesium(Mg) 0-70
Very good waterquality No health effects
70-100 Good water quality Insignificant health effects in sensitivegroups only
100-200 Fair water quality Increasing effects in sensitive groups only200-400 Poor water quality Potential diarrhoea in all new users
>400Not acceptablewater quality Diarrhoea in all individuals
Sulphate(SO4) 0-200
Very good waterquality No health effects
200-400 Good water quality Insignificant health effects 400-600 Fair water quality Slight chance of diarrhoea in sensitive groups
but disappears with adaptionPossibility of diarrhoea. Poor adaption in sensitive600-1000 Poor water qualityindividuals
>1000Not acceptablewater quality High chance of diarrhoea. No adaption
Chloride(CI) 0-100
Very good waterquality No health effects
100-200 Good water quality Insignificant health effects 200-600 Fair water quality Increasing health risk to sensitive groups600-1200 Poor water quality Possible long-term health effects
>1200Not acceptablewater quality Dehydration in infants,nausea and vomiting
Sodium(Na) 0-100
Very good waterquality Negligible health effects
100-200 Good water quality Insignificant health effects 200-400 Fair water quality Slight risk to some sensitive groups400-1000 Poor water quality Possible health risk, particularly in sensitive groups
>1000Not acceptablewater quality Definite health risk
Potassium(K) 0-25
Very good waterquality Negligible health effects
25-50 Good water quality Insignificant health effects 50-100 Fair water quality Slight risk to some sensitive groups100-500 Poor water quality Possible health effects
>500Not acceptablewater quality Definite health risk to all individuals
Source: DWAF, 1996a and DWAF, DOH and WRC, 1998
Water quality accounts for South Africa, 2000
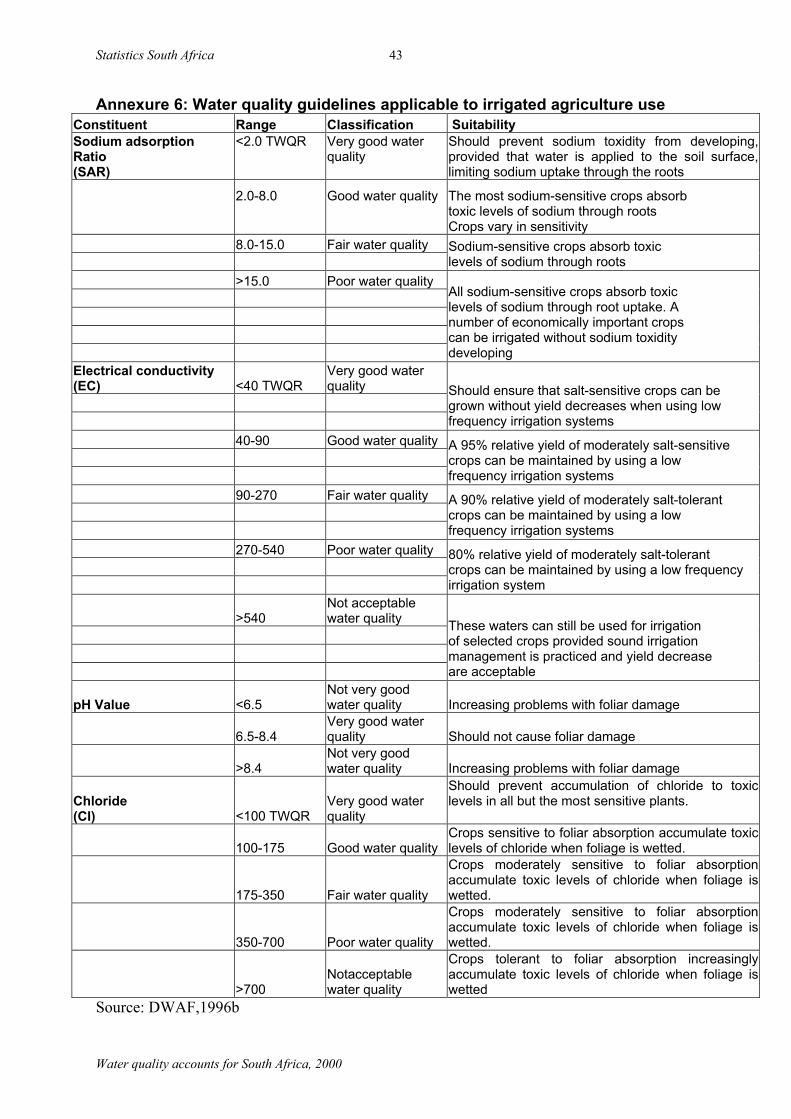
Statistics South Africa 43
Annexure 6: Water quality guidelines applicable to irrigated agriculture useConstituent Range Classification SuitabilitySodium adsorptionRatio(SAR)
<2.0 TWQR Very good waterquality
Should prevent sodium toxidity from developing,provided that water is applied to the soil surface,limiting sodium uptake through the roots
2.0-8.0 Good water quality The most sodium-sensitive crops absorbtoxic levels of sodium through rootsCrops vary in sensitivity
8.0-15.0 Fair water quality Sodium-sensitive crops absorb toxiclevels of sodium through roots
>15.0 Poor water qualityAll sodium-sensitive crops absorb toxic levels of sodium through root uptake. Anumber of economically important cropscan be irrigated without sodium toxidity developing
Electrical conductivity(EC) <40 TWQR
Very good waterquality Should ensure that salt-sensitive crops can be
grown without yield decreases when using lowfrequency irrigation systems
40-90 Good water quality A 95% relative yield of moderately salt-sensitivecrops can be maintained by using a lowfrequency irrigation systems
90-270 Fair water quality A 90% relative yield of moderately salt-tolerantcrops can be maintained by using a lowfrequency irrigation systems
270-540 Poor water quality 80% relative yield of moderately salt-tolerantcrops can be maintained by using a low frequencyirrigation system
>540Not acceptablewater quality These waters can still be used for irrigation
of selected crops provided sound irrigationmanagement is practiced and yield decreaseare acceptable
pH Value <6.5Not very goodwater quality Increasing problems with foliar damage
6.5-8.4Very good waterquality Should not cause foliar damage
>8.4Not very goodwater quality Increasing problems with foliar damage
Chloride(CI) <100 TWQR
Very good waterquality
Should prevent accumulation of chloride to toxiclevels in all but the most sensitive plants.
100-175 Good water qualityCrops sensitive to foliar absorption accumulate toxic levels of chloride when foliage is wetted.
175-350 Fair water quality
Crops moderately sensitive to foliar absorptionaccumulate toxic levels of chloride when foliage is wetted.
350-700 Poor water quality
Crops moderately sensitive to foliar absorptionaccumulate toxic levels of chloride when foliage is wetted.
>700Notacceptablewater quality
Crops tolerant to foliar absorption increasinglyaccumulate toxic levels of chloride when foliage is wetted
Source: DWAF,1996b
Water quality accounts for South Africa, 2000