water-quality and lake-stage data for wisconsin … · water-quality and lake-stage data for...
TRANSCRIPT

Water-Quality and Lake-Stage Data for Wisconsin Lakes, Water Year 1996
U.S. GEOLOGICAL SURVEY Open-File Report 97-123
Prepared in cooperation with theState of Wisconsin and local agencies


WATER-QUALITY AND LAKE-STAGE DATA FOR WISCONSIN LAKES, WATER YEAR 1996
By Wisconsin District Lake-Studies Team
U.S. GEOLOGICAL SURVEY Open-File Report 97-123
A report by the Wisconsin District Lake-Studies Team- J.F. Elder (team leader), H.S. Garn, G.L Goddard, S.B. Marsh, D.L Olson, D.M. Robertson, and W.J. Rose
Prepared in cooperation withTHE STATE OF WISCONSIN AND OTHER AGENCIES
Madison, Wisconsin 1997
U.S. DEPARTMENT OF THE INTERIOR BRUCE BABBITT, Secretary
U.S. GEOLOGICAL SURVEY Gordon P. Eaton, Director
For additional information write to:
District Chief U.S. Geological Survey 6417 Normandy Lane Madison, Wl 53719
Copies of this report can be purchased from:
U.S. Geological Survey Earth Science Information Center Open-File Reports Section Box25286, MS 517 Denver Federal Center Denver, CO 80225
CONTENTS
Introduction........................................................................ 1Methods of data collection ............................................................ 4
Explanation of physical and chemical characteristics of lakes................................. 7Water temperature and thermal stratification........................................ 7
Specific conductance.......................................................... 8Water clarity................................................................. 9pH ....................................................................... 9Dissolved oxygen ........................................................... 10Phosphorus ................................................................ 10Nitrogen................................................................... 11Chlorophyll a ............................................................... 11
Classification of lakes............................................................... 12References cited................................................................... 14Lake data ........................................................................ 15
Alma near St. Germain, 455426089254700 ....................................... 17Balsam near Birchwood, 453907091345800....................................... 20Big Hills (Hills) near Wild Rose, 440912089092000 ................................. 22
Big MuskegoBass Bay, near Muskego, 425344088070100 .................................. 24near Wind Lake, 425109088075000.......................................... 26
Big St. Germainnear Lake Tomahawk, 05390750 ............................................ 27
near St. Germain, 455557089311000......................................... 28Big Sissabagama near Stone Lake, 454724091303600.............................. 30Delavan
near Delavan, 423706088363400............................................ 33at Center near Delavan Lake, 423556088365001 ............................... 34at North End near Lake Lawn, 423659088354401 ............................... 37at SW End near Delavan Lake, 423526088380101 .............................. 37
Denoon at Wind Lake, 425044088100300 ........................................ 38Devils near Baraboo, 05404500 ................................................ 40Druid near Hartford, 431643088243300 .......................................... 41Eagle near Kansasville, 05544500 .............................................. 44Eagle, at Deep Hole, near Kansasville, 424207088072400 ........................... 45Eagle Spring at Eagleville, 425103088261500 ..................................... 47Elizabeth near Twin Lakes, 423051088155300..................................... 49Fish near Sauk City, 05406050 ................................................. 51Forest near Dundee, 433632088100200.......................................... 52Fowler, Center, at Oconomowoc, 430653088294601 ................................ 54
in

CONTENTS-Continued
Green at County Trunk Highway A near Green Lake, 434918088553601 ................ 57Hemlock near Mikana, 453421091333700 ........................................ 58Kirby near Cumberland, 453554092042101 ....................................... 60
Site 1 near Cumberland, 453608092035801 ................................... 61Site 2 near Cumberland, 453601092035301 ................................... 63Site 3 near Cumberland, 453612092034901 ................................... 64Site 4 near Cumberland, 453603092035701 ................................... 65Site 5 near Cumberland, 453608092041201 ................................... 66Site 6 near Cumberland, 453555092040901 ................................... 67
Koshkonong near Newville, 05427235 ........................................... 68Little Arbor Vitae near Woodruff, 455446089370300 ................................ 69Little Green, at Center, near Markesan, 434412088590700 ........................... 72Little Muskego at Muskego, 425425088083500 .................................... 74Little Rock near Woodruff, 455946089415702 ..................................... 76
Little St. Germainnear Eagle River, 05390700 ................................................ 77Northeast Bay, near St. Germain, 455545089262500 ............................ 79South Bay, near St. Germain, 455437089270800 ............................... 80West Bay, at St. Germain, 455428089282400 .................................. 81
Long (Kee Nong Go-Mong) at Wind Lake, 424937088103400......................... 82Mary (Marie) at Twin Lakes, 423128088151200.................................... 84Max near Woodruff, 460128089423501 .......................................... 86Mendota at Madison, 05428000 ................................................ 87Middle Genesse near Oconomowoc, 430309088284800 ............................. 88Monona at Madison, 05429000................................................. 89Montello at Montello, 434748089195800 ......................................... 90Moon near St. Germain,455504089260500....................................... 92Morgan near Fence, 454622088324801 .......................................... 94
OconomowocNo. 1 (Center) at Oconomowoc, 430551088273500 ............................. 95No. 2 (off Hewitt Point) at Oconomowoc, 430609088262200....................... 97
Okaucheeat Okauchee, 430723088252100 ............................................ 99No. 1, near Okauchee, 430759088244200.................................... 101No. 2, at Okauchee, 430645088264500...................................... 101No. 3, at Okauchee, 430642088252400...................................... 102No. 4, at Okauchee, 430757088261700...................................... 102
Potter near Mukwonago, 424905088204000 ..................................... 103Powers at Powers Lake, 423246088175800...................................... 105Pretty at Deep Hole near Dousman, 425722088295000............................. 107
IV
CONTENTS-ContinuedRed Cedar
Deep Hole, near Mikana, 453725091345100 .................................. 109
South End, near Mikana, 453519091352500 .................................. 111
Silver near Oconomowoc, 430436088293300 .................................... 113
Silver at West Bend, 432322088125000......................................... 115
Tichigan near Waterford, 424854088123300 ..................................... 116
Vandercook near Woodruff, 455909089405602 ................................... 118
Waubeesee at Wind Lake, 424857088101500 .................................... 119
Whitewater near Whitewater, 424608088414800 .................................. 121
Wind
at Wind Lake, 424915088083900........................................... 122Outlet at Wind Lake, 424848088083100...................................... 125
Winnebagoat Oshkosh, 04082500 ................................................... 126
near Stockbridge, 04084255............................................... 127
Wolf near Mt. Calvary, 435152088123100 ....................................... 128
Wisconsin District publications pertaining to lakes........................................ 131
FIGURE
Figure 1. Map showing location of lake water-quality and lake-stage stations in Wisconsin....................2
TABLE
Table 1. Discontinued lake stations..........................................................................................................5


WATER-QUALITY AND LAKE-STAGE DATA
FOR WISCONSIN LAKES, WATER YEAR 1996By Wisconsin District Lake-Studies Team
INTRODUCTION
The U.S. Geological Survey (USGS), in cooperation with local and other agencies, collects data at selected lakes throughout Wisconsin. These data, accumulated over many years, provide a data base for developing an improved understanding of the water quality of lakes. To make these data available to interested parties outside the USGS, the data are published annually in this report series. The location of surface water-quality and lake-stage stations in Wisconsin for water year 1996 are shown in figure 1. A water year is the 12-month period from October 1 through September 30. It is designated by the calendar year in which it ends and which includes 9 of the 12 months. Thus the period October 1, 1995 through September 30, 1996, is called "water year 1996."
The purpose of this report is to provide information about the physical and chemical charac teristics of Wisconsin lakes. Data that have been collected at specific lakes, and information to aid in the interpretation of those data, are included in this report. Data collected includes measurements of lake stage and in-lake water quality. Graphs of Secchi depths, surface total- phosphorus and chlorophyll-a concentrations versus time are included for lakes with two or more years of data. Graphs of vertical profiles of temperature, dissolved oxygen, pH, and specific conductance are included for sites where these parameters were measured. Descriptive infor mation for each lake includes: location of the lake, drainage area of the lake's watershed, period for which data are available, revisions to previously published records, and pertinent remarks. Additional data, such as streamflow and water quality in tributary and outlet streams of some of the lakes, are published in another volume: "Water Resources Data-Wisconsin, 1996."
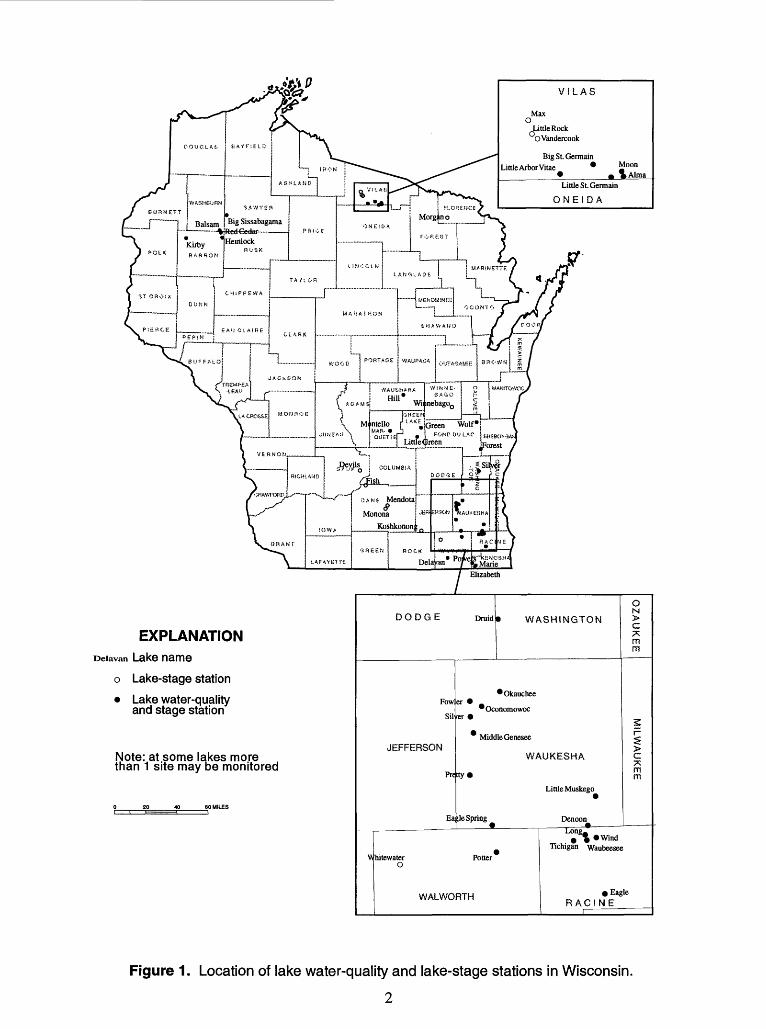
EXPLANATIONvan Lake name
o Lake-stage station
Lake water-quality and stage station
Note: at some lakes more than 1 site may be monitored
20____ 40 60 MILES
DODGE Dniid
Fow
Sil
JEFFERSON
Pre
Ea
W
WASHINGTON
Okauchee er
OconomowocKI
* Middle Genesee
tty
;le Spring
Tiitewater Potter O
WALWORTH
WAUKESHA
Little Muskego
Denoon
ON
C
m m
Sr~
Cm m
Long. , \ *Wind
Tichigan Waubeesee
Eagle RACINE
i
Figure 1. Location of lake water-quality and lake-stage stations in Wisconsin.
2

The USGS has done cooperative lake monitoring with local and other agencies since 1983. Cooperators in 1996 included:
Alma Lake - Moon Lake, Protection and Rehabilitation DistrictBig Hills Lake Management DistrictBig Muskego Lake DistrictCity of MuskegoDane County Department of Public WorksDruid Lake Protection and Rehabilitation DistrictEagle Spring Lake Management DistrictFowler Lake Management DistrictGreen Lake Sanitary DistrictKirby Lake Management DistrictLittle Arbor Vitae Lake Protection and Rehabilitation DistrictLittle Green Lake Protection and Rehabilitation DistrictLittle Muskego Lake Protection and Rehabilitation DistrictMontello Lake Inland Protection and Rehabilitation DistrictOkauchee Lake Management DistrictPotters Lake Protection and Rehabilitation DistrictPowers Lake Management DistrictPretty Lake Protection and Rehabilitation DistrictRock County Public Works DepartmentSilver Lake Protection and Rehabilitation DistrictTown of AuburnTown of Cedar LakeTown of DelavanTown of KansasvilleTown of NorwayTown of Sand LakeTown of St. GermainTown of SummitTown of WaterfordTwin Lakes Protection and Rehabilitation DistrictU.S. Army Corps of EngineersVillage of Oconomowoc LakeWhitewater Lake Management DistrictWind Lake Management DistrictWisconsin Department of Natural ResourcesWolf Lake Management District
Lake data collection sites are identified by a unique identification number. Lake water- quality sites are identified by a 15-digit number that is a concatenation of the site's latitude, longitude, and a two-digit sequence number. The sequence number is used to distinguish between sites located at the same latitude-longitude designation. The site identification number is permanently assigned to the site; actual latitude and longitude of the site are subject to update and are stored separately. For some of the lakes, which have historical records of lake stage, an eight-to-ten digit number is assigned according to downstream order. Gaps are left in the numerical series to allow for new stations; hence, the numbers are not consecutive. The first two digits of the complete eight-to-ten digit number, such as 04087000, 054310157, or 0407809265, designate the major river basin. For example, "04" designates the St. Lawrence River Basin and "05" designates the Upper Mississippi River Basin.
The water-quality lake stations that were discontinued prior to water year 1996 are listed in table 1. Discontinued lake-stage stations are not included in this table.
This report is the culmination of a concerted effort by a number of people who collected, compiled, analyzed, verified, and organized the data, and who typed, edited, and assembled the report. The authors had primary responsibility for assuring that the information contained herein is accurate, complete, and adheres to USGS policy and established guidelines. Technicians-in- charge of the field offices are: T.J. Popowski (Rice Lake), J.W. George (Merrill), and J. Habale (Madison). The data were collected and processed by G.L. Goddard, J.J. Hanig, D.E. Housner, G.L. Kjornes, S.L. McNamara, S.B. Marsh, E.A. Mergener, D.L. Olson, J.G. Schuler, and T.L. Seidel. S.H. Under prepared the location map. P.A. Stark assembled, edited, and formatted the report. Additional assistance in preparation of the report was provided by K.A. Lonsdorf.
METHODS OF DATA COLLECTION
Depth profiles of water temperature, dissolved oxygen, pH, and specific conductance were collected using a multi-parameter meter. Prior to measurements, the meter is calibrated using standards for pH and conductance, and dissolved oxygen is calibrated using the air calibration method.
4
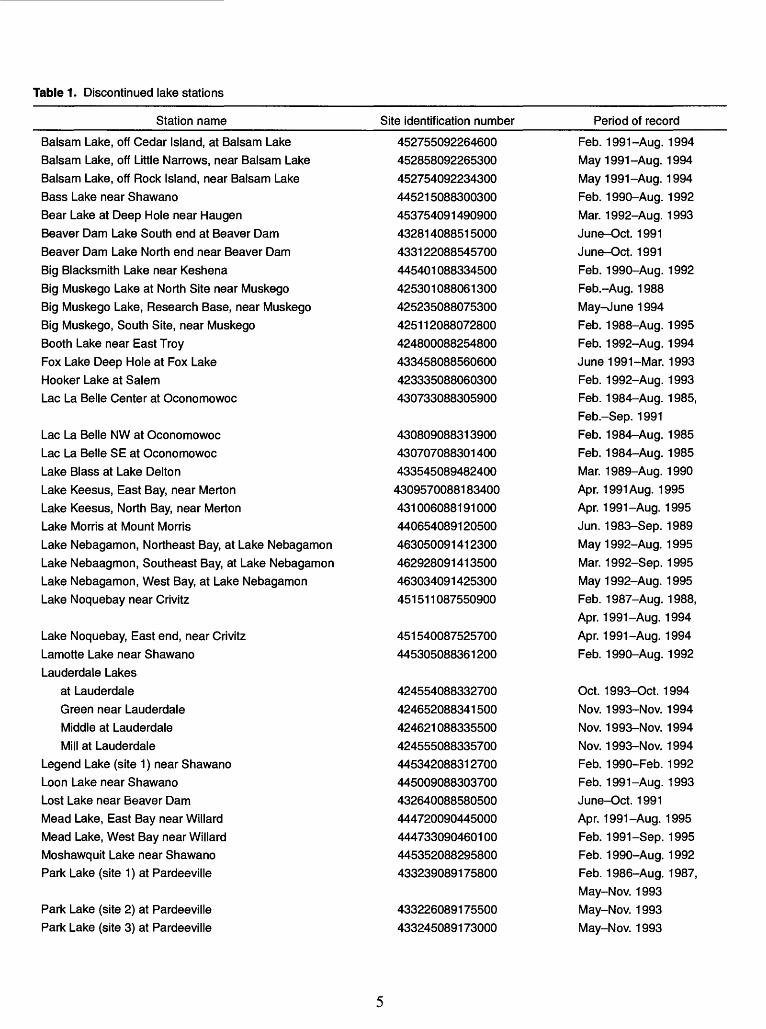
Table 1. Discontinued lake stations
Station name
Balsam Lake, off Cedar Island, at Balsam LakeBalsam Lake, off Little Narrows, near Balsam Lake
Balsam Lake, off Rock Island, near Balsam LakeBass Lake near Shawano
Bear Lake at Deep Hole near HaugenBeaver Dam Lake South end at Beaver Dam
Beaver Dam Lake North end near Beaver Dam
Big Blacksmith Lake near Keshena
Big Muskego Lake at North Site near MuskegoBig Muskego Lake, Research Base, near Muskego
Big Muskego, South Site, near MuskegoBooth Lake near East Troy
Fox Lake Deep Hole at Fox LakeHooker Lake at SalemLac La Belle Center at Oconomowoc
Lac La Belle NW at Oconomowoc
Lac La Belle SE at OconomowocLake Blass at Lake Delton
Lake Keesus, East Bay, near MertonLake Keesus, North Bay, near MertonLake Morris at Mount Morris
Lake Nebagamon, Northeast Bay, at Lake NebagamonLake Nebaagmon, Southeast Bay, at Lake NebagamonLake Nebagamon, West Bay, at Lake NebagamonLake Noquebay near Crivitz
Lake Noquebay, East end, near Crivitz
Lamotte Lake near Shawano
Site identification number
452755092264600
452858092265300
452754092234300
445215088300300
453754091490900
432814088515000
433122088545700
445401088334500
425301088061300
425235088075300
425112088072800
424800088254800
433458088560600
423335088060300
430733088305900
430809088313900
430707088301400
433545089482400
4309570088183400
431006088191000
440654089120500
463050091412300
462928091413500
463034091425300
451511087550900
451540087525700
445305088361200
Period of record
Feb. 1991 -Aug. 1994May 1991 -Aug. 1994
May 1991 -Aug. 1994
Feb. 1990-Aug. 1992Mar. 1992-Aug. 1993
June-Oct. 1991June-Oct. 1991Feb. 1990-Aug. 1992
Feb.-Aug. 1988
May-nJune 1994Feb. 1988-Aug. 1995Feb. 1992-Aug. 1994
June1991-Mar. 1993Feb. 1992-Aug. 1993Feb. 1984-Aug. 1985,Feb.-Sep. 1991Feb. 1984-Aug. 1985
Feb. 1984-Aug. 1985Mar. 1989-Aug. 1990Apr. 1991 Aug. 1995Apr. 1991 -Aug. 1995Jun. 1983-Sep. 1989
May 1992-Aug. 1995
Mar. 1992-Sep. 1995May 1992-Aug. 1995
Feb. 1987-Aug. 1988,Apr. 1991 -Aug. 1994Apr. 1991 -Aug. 1994
Feb. 1990-Aug. 1992
Lauderdale Lakes
at LauderdaleGreen near LauderdaleMiddle at Lauderdale
Mill at LauderdaleLegend Lake (site 1) near Shawano Loon Lake near Shawano Lost Lake near Beaver Dam Mead Lake, East Bay near Willard Mead Lake, West Bay near Willard Moshawquit Lake near Shawano Park Lake (site 1) at Pardeeville
Park Lake (site 2) at Pardeeville Park Lake (site 3) at Pardeeville
424554088332700
424652088341500424621088335500
424555088335700445342088312700
445009088303700432640088580500444720090445000
444733090460100445352088295800433239089175800
433226089175500
433245089173000
Oct. 1993-Oct. 1994
Nov. 1993-Nov. 1994 Nov. 1993-Nov. 1994 Nov. 1993-Nov. 1994 Feb. 1990-Feb. 1992 Feb. 1991-Aug. 1993 June-Oct. 1991 Apr. 1991-Aug. 1995 Feb. 1991-Sep. 1995 Feb. 1990-Aug. 1992 Feb. 1986-Aug. 1987,
May-Nov. 1993 May-Nov. 1993 May-Nov. 1993
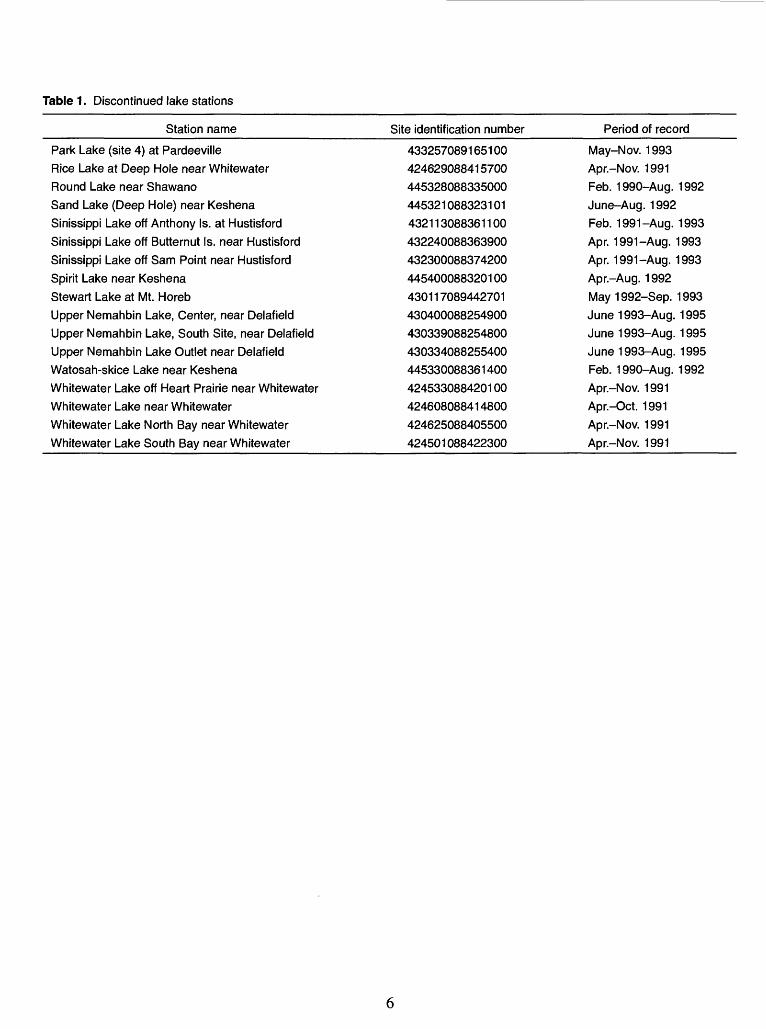
Table 1. Discontinued lake stations
Station name Site identification number Period of record
Park Lake (site 4) at PardeevilleRice Lake at Deep Hole near WhitewaterRound Lake near Shawano
Sand Lake (Deep Hole) near KeshenaSinissippi Lake off Anthony Is. at Hustisford
Sinissippi Lake off Butternut Is. near HustisfordSinissippi Lake off Sam Point near Hustisford
Spirit Lake near Keshena
Stewart Lake at Mt. Horeb
Upper Nemahbin Lake, Center, near DelafieldUpper Nemahbin Lake, South Site, near DelafieldUpper Nemahbin Lake Outlet near DelafieldWatosah-skice Lake near Keshena
Whitewater Lake off Heart Prairie near WhitewaterWhitewater Lake near Whitewater
Whitewater Lake North Bay near Whitewater
Whitewater Lake South Bay near Whitewater
433257089165100424629088415700445328088335000445321088323101432113088361100
432240088363900432300088374200
445400088320100
430117089442701
430400088254900430339088254800430334088255400445330088361400424533088420100
424608088414800
424625088405500424501088422300
May-Nov. 1993
Apr.-Nov. 1991 Feb. 1990-Aug. 1992 June-Aug. 1992
Feb. 1991-Aug. 1993 Apr. 1991-Aug. 1993
Apr. 1991-Aug. 1993 Apr.-Aug. 1992
May1992-Sep. 1993 June 1993-Aug. 1995
June 1993-Aug. 1995 June 1993-Aug. 1995 Feb. 1990-Aug. 1992 Apr.-Nov. 1991
Apr.-Oct. 1991 Apr.-Nov. 1991
Apr.-Nov. 1991
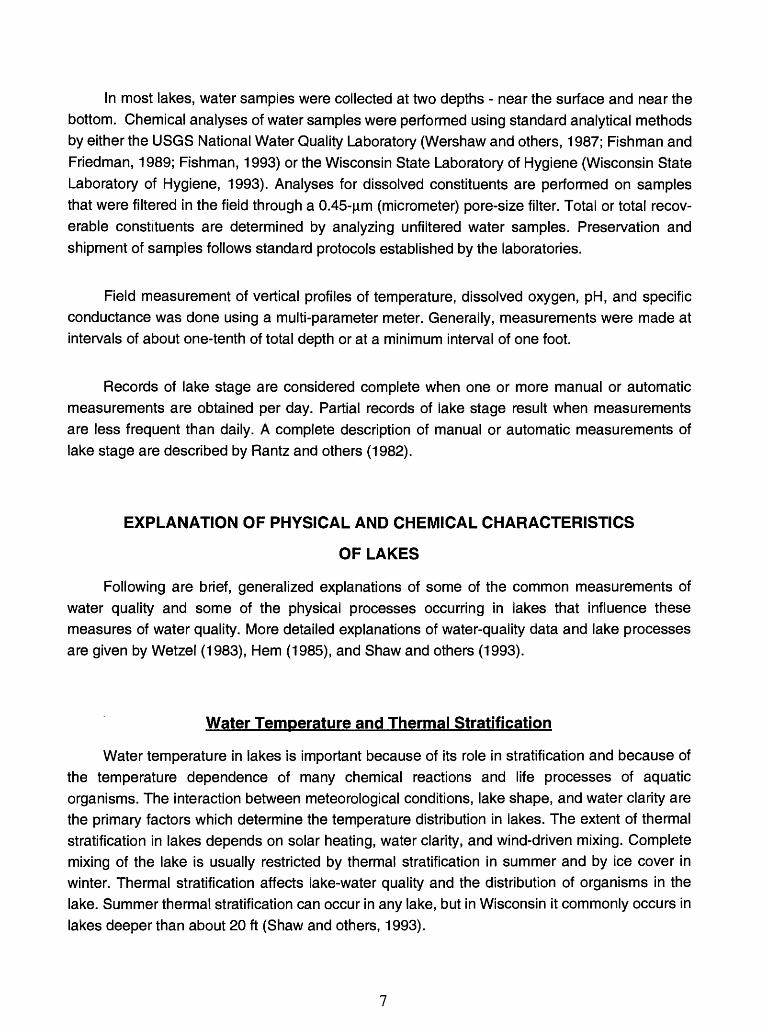
In most lakes, water samples were collected at two depths - near the surface and near the bottom. Chemical analyses of water samples were performed using standard analytical methods by either the USGS National Water Quality Laboratory (Wershaw and others, 1987; Fishman and Friedman, 1989; Fishman, 1993) or the Wisconsin State Laboratory of Hygiene (Wisconsin State Laboratory of Hygiene, 1993). Analyses for dissolved constituents are performed on samples that were filtered in the field through a 0.45-|im (micrometer) pore-size filter. Total or total recov erable constituents are determined by analyzing unfiltered water samples. Preservation and shipment of samples follows standard protocols established by the laboratories.
Field measurement of vertical profiles of temperature, dissolved oxygen, pH, and specific conductance was done using a multi-parameter meter. Generally, measurements were made at intervals of about one-tenth of total depth or at a minimum interval of one foot.
Records of lake stage are considered complete when one or more manual or automatic measurements are obtained per day. Partial records of lake stage result when measurements are less frequent than daily. A complete description of manual or automatic measurements of lake stage are described by Rantz and others (1982).
EXPLANATION OF PHYSICAL AND CHEMICAL CHARACTERISTICS
OF LAKES
Following are brief, generalized explanations of some of the common measurements of water quality and some of the physical processes occurring in lakes that influence these measures of water quality. More detailed explanations of water-quality data and lake processes are given by Wetzel (1983), Hem (1985), and Shaw and others (1993).
Water Temperature and Thermal Stratification
Water temperature in lakes is important because of its role in stratification and because of the temperature dependence of many chemical reactions and life processes of aquatic organisms. The interaction between meteorological conditions, lake shape, and water clarity are the primary factors which determine the temperature distribution in lakes. The extent of thermal stratification in lakes depends on solar heating, water clarity, and wind-driven mixing. Complete mixing of the lake is usually restricted by thermal stratification in summer and by ice cover in winter. Thermal stratification affects lake-water quality and the distribution of organisms in the lake. Summer thermal stratification can occur in any lake, but in Wisconsin it commonly occurs in lakes deeper than about 20 ft (Shaw and others, 1993).
The density of water increases with decreasing temperature down to a temperature of 4 °C, then decreases with decreasing temperature between 4°C and the freezing point of water (0°C). For a brief period in the spring after the ice is out, water temperature is uniform through the entire water column and wind action causes the lake to mix completely. This process is known as "spring turnover." As the lake absorbs the sun's energy, the surface water becomes warmer and its density decreases, making it more resistant to complete mixing. The difference in density caused by different water temperatures can prevent warm and cold water from mixing. In most lakes, therefore, a density "barrier" forms between the warmer surface water and the underlying colder water. This barrier is often marked by a sharp temperature gradient known as the "thermocline." During the stratified summer period, three distinct layers of lake water are present. The upper warm layer is known as the "epilimnion" and the cold lower layer is known as the "hypolimnion." The transition layer between the epilimnion and the hypolimnion has a steep temperature gradient (greatest temperature change per foot of depth), and is known as the "thermocline" or "metalimnion." As the temperature difference between surface and deep water increases, this "stratified" condition stabilizes and can persist until surface temperatures decrease in the fall, which decreases the stability of the stratification. The mixing of the lake water in the fall is known as "fall turnover."
Thermal stratification may also occur under ice cover in the winter. In the winter, the coldest water (near 0°C) under the ice at the surface of the lake is less dense than water deeper in the lake with a temperature near 4°C.
Specific Conductance
Specific conductance is a measure of the ability of water to conduct an electrical current and is an indicator of the concentration of dissolved solids in the water. Because conductance is temperature related, reported values are normalized at 25°C and are termed specific conduc tance. As the concentration of dissolved minerals increases, specific conductance increases. During winter and summer thermal stratification, concentrations of dissolved constituents near the lake bottom increase due to the decomposition of materials settling from the epilimnion, or release of dissolved materials (such as iron, manganese, and phosphorus) from the bottom sediments during anoxic periods. Therefore, differences in specific conductance with depth indicate differences in concentrations of dissolved solids.
Water Clarity
Water clarity, or transparency, is commonly measured using a Secchi disc. The range of depths within which photosynthetic activity occurs depends largely on depth of light penetration, which is influenced by water clarity. A Secchi disc, most commonly an 8-in. -diameter disc with alternating black-and-white quadrants, is lowered to a depth at which it is no longer visible. This depth is referred to as the Secchi depth. Clarity can be reduced by algae and zooplankton, water color, and suspended sediment. Algae are often the most dominant influence on clarity in most lakes and, therefore, Secchi depth is usually correlated with the algal abundance. Secchi depth is generally the least during late summer when algal populations are largest.
The pH is a measure of the acidity of the water. It is defined as the negative logarithm of hydrogen-ion concentration and varies over a 14-unit log scale, with a pH of 7 being neutral. Values less than 7 indicate acidic conditions; the lower the value, the stronger the acidity. Values greater than 7 indicate alkaline conditions. The pH of water is influenced in part by photosyn thesis and respiration of planktonic algae and aquatic plants. It is important because it affects the solubility of many chemical constituents, and because aquatic organisms have limited pH toler ances. Planktonic algae and aquatic plants produce oxygen and consume carbon dioxide as they photosynthesize during daytime; they consume oxygen and produce carbon dioxide when they respire at night. Carbon dioxide combines with the water molecule to form carbonic acid; therefore respiration causes a decrease in pH at night and photosynthesis causes an increase in pH in the day time. The result is a daily cycle of pH. Because phytoplankton are usually concen trated in the near-surface water, changes in pH in the epilimnion are more extreme than in the hypolimnion, where less photosynthesis usually occurs.
Values of pH greater than 8.5 have been shown to cause the release of phosphorus from lake sediments (James and Barko, 1991). As pH increases above 8.5 the release rate of phosphorus also increases. Lakes having good fish populations and productivity generally have a pH between 6.7 and 8.2.
Dissolved Oxygen
Dissolved oxygen is one of the most critical factors affecting a lake ecosystem because it is essential to most aquatic organisms, and it is involved in many chemical reactions. Very low dissolved oxygen concentrations can control chemical reactions that require oxygen. The solubility of oxygen in water is inversely related to temperature-that is, oxygen solubility decreases as water temperature increases. This relation is important because at warmer temper atures the metabolic rate of organisms increases but less oxygen is available for respiration. The primary sources of dissolved oxygen are from the air and from photosynthesis. The minimum dissolved-oxygen concentration specified in national water-quality criteria for warmwater aquatic life is 5.0 mg/L (U.S. Environmental Protection Agency, 1986).
In early summer, if thermal stratification develops, the metalimnion restricts the surface supply of dissolved oxygen to the hypolimnion. The hypolimnion can become isolated from the atmosphere. Thus, as summer progresses, the dissolved-oxygen concentration can decrease in response to decomposition of dead algae that settle from the epilimnion and in response to the biological and chemical oxygen demand of the sediments. The oxygen demand from these processes may completely deplete the oxygen (anoxia) in the water near the lake bottom. The oxygen depletion then progresses upward but usually is confined to the hypolimnion.
Anoxia in the hypolimnion is common in stratified eutrophic (nutrient-rich) lakes in Wisconsin. During anoxic conditions, many aquatic organisms cannot survive, but many other species (primarily bacteria) actually function only in such conditions. Therefore, a shift from oxic to anoxic conditions produces a rapid and dramatic change in the biological community and chemical environment. Anoxia also can cause release of phosphorus from the bottom sediments. This phosphorus then mixes throughout the water column during spring and fall turnover.
Phosphorus
Phosphorus is one of the essential nutrients for plant growth. High phosphorus concentra tions can cause dense algal populations (blooms) and can therefore be a major cause of eutrophication in lakes. In many regions of the country, other nutrients, particularly nitrogen, tend to be in abundant supply. Phosphorus is often the nutrient in shortest supply, therefore limiting or controlling plant growth. About 90 percent of the lakes in Wisconsin are limited by phosphorus (Shaw and others, 1993). In water, dissolved orthophosphate is that part of total phosphorus that is most readily available for use by algae.
10
Internal phosphorus recycling occurs in many lakes. Phosphorus used by algae, aquatic plants, fish, and zooplankton is stored within these organisms. As these organisms die and decompose, this phosphorus is returned to the lake water and sediments. Anoxia in the hypolimnion makes phosphorus more soluble, adding further to the release of phosphorus from the falling particles and the lake sediments. During spring and fall turnover the phosphorus, which was released from the bottom sediments into the hypolimnion during anoxia, is mixed throughout the lake. The phosphorus is then available for algal growth. These phenomena are part of the internal-recycling processes of lakes.
Nitrogen
Nitrogen, like phosphorus, is an essential nutrient for plant and algal growth. Usually, nitrogen is in abundant supply from the atmosphere and other sources. If phosphorus is abundant relative to algal needs, nitrogen can become the limiting nutrient. In that case, algal blooms are more likely to be triggered by increases in nitrogen than by increases in phosphorus. Some bluegreen algal species can fix nitrogen from the atmosphere (Wetzel, 1983). Therefore, in situations where other types of algae are excluded because of a shortage of nitrogen, the nitrogen-fixing bluegreen algae have a competitive advantage and may be present in abundance.
Lakes with a total nitrogen to total phosphorus ratio larger than 15 to 1 near the surface may generally be considered phosphorus limited; a ratio from 10 to 1 to 15 to 1 indicates a transition situation; and a ratio smaller than 10 to 1 generally indicates nitrogen limitation (Lillie and Mason, 1983). Total nitrogen is the sum of ammonia and organic nitrogen, and nitrate and nitrite nitrogen. The near-surface concentration is used to compute the total nitrogen to phosphorus ratio because most algal species grow near the lake surface.
Chlorophyll a
Chlorophyll a is a photosynthetic pigment found in algae (Wetzel, 1983). Its concentration, therefore, is commonly used as a measure of the density of the algal population in a lake. Chloro phyll a concentrations are generally highest when algal populations are highest, usually during summer. Moderate populations of desirable algae are important in the food chain; however, excessive populations or algal blooms are undesirable. Algal blooms can cause taste and odor problems, and limit light penetration needed to support growth of submerged aquatic plants. Certain species of bluegreen algae can produce toxins (Rapavich and others, 1987).
11

CLASSIFICATION OF LAKES
Two methods are commonly used to classify Wisconsin lakes according to their water quality or trophic state: Lillie and Mason's (1983) water-quality index and a modification of Carlson's (1977) Trophic State Index (TSI) are commonly used. Both methods evaluate in-lake conditions. Three water-quality measures are used in these classification systems: near-surface concentrations of total phosphorus and chlorophyll a, and water clarity as indicated by the Secchi depth.
Lillie and Mason's (1983) water-quality index of Wisconsin lakes used random summer measurements of total phosphorus and chlorophyll a concentrations, and Secchi depth as shown below:
Water-quality index
Excellent
Very good
Good
Fair
Poor
Very poor
Approximate total phosphorus range
(mg/L)
<0.001
.001-010
.010-030
.030-.050
.050-. 150
>.150
Approximate chlorophyll a range
fog/L)<1
1-5
5-10
10-15
15-30
>30
Approximate water clarity range
(Secchi depth, in meters)
>6.0
3.0-6.0
2.0-3.0
1 .5-2.0
1 .0-1 .5
<1.0
Three trophic conditions are generally used to describe the wide range of lake water-quality conditions. Oligotrophic lakes are typically clear, algal populations and phosphorus concentrations are low, and the deepest water is likely to contain oxygen throughout the year. Mesotrophic lakes typically have a moderate supply of nutrients, experience moderate algal blooms, and have occasional oxygen depletions at depth. Eutrophic lakes are nutrient rich with relatively severe water- quality problems, such as frequent seasonal algal blooms, oxygen depletion in lower parts of the lakes, and poor clarity. When eutrophic conditions are very severe, the lake is considered hyper- eutrophic.
12

The WDNR modified the lakes classification scheme developed by Carlson (1977) to apply specifically to Wisconsin lakes. The WDNR system (Lillie and others, 1993) uses surface total phosphorus and chlorophyll a concentrations, and Secchi depth for ice-free periods to calculate values for Trophic State Indexes. The WDNR has adopted the following TSI ranges to classify Wisconsin lakes: indexes of less than 40 define oligotrophic conditions, 40 to 50 define mesotrophic conditions, greater than 50 to 70 define eutrophic conditions, and greater than 70 define hyper- eutrophic conditions (Wisconsin Department of Natural Resources, 1992, p. 52-53). These ranges are used to make relative comparisons in all Wisconsin lake trophic-state evaluations by the WDNR and others.
The TSI for a lake can be calculated using the following equations (Lillie and others, 1993):
TSI Secchi = 60 - 33 -2 ( Io9io Secchi depth)
TS'chiorophyii a = 34 -82 + C17 -41 ( Io9io chlorophyll a concentration))
phosphorus = 28.24 + (17.81 (Iog 10 total phosphorus concentration))
where: Secchi depth is in meters,
chlorophyll a is in micrograms per liter, and
total phosphorus is in micrograms per liter.
The three trophic conditions are defined with the following boundaries for total phosphorus, Secchi disc, and chlorophyll a:
Trophic Level
Trophic State Index
Total phosphorus (W3/L)
Secchi disc (m)
Chlorophyll a (l^tg/L)
Eutrophic
-..._ ____........__.. so . ... ....... 17...................... 2.0 - - -7.5
Mesotrophic
........................... 40 ................ ______ 4... _-___.-_-- .-- 4.0 -- - -- 2.0
Oligotrophic
13
REFERENCES CITED
Carlson, R.E., 1977, A trophic state index for lakes: Limnology and Oceanography, March, v. 22, no. 2, p. 361-369.
Fishman, M.J., ed., 1993, Methods of analysis by the U.S. Geological Survey National Water Quality Laboratory-Determination of inorganic and organic constituents in water and fluvial sediments: U.S. Geological Survey Open-File Report 93-125, 217 p.
Fishman, M.J., and Friedman, L.C., eds., 1989, Methods for determination of inorganic substances in water and fluvial sediments (3d ed.): U.S. Geological Survey Techniques of Water- Resources Investigations, book 5, chap. A1, 545 p.
Hem, J.D., 1985, Study and interpretation of the chemical characteristics of natural water (3rd ed.): U.S. Geological Survey Water-Supply Paper 2254, 263 p.
James, W.F., and Barko, J.W., 1991, Littoral-pelagic phosphorus dynamics during nighttime convec- tive circulation: Limnology and Oceanography, v. 36, no. 5, p. 946-960.
Lillie, R.A., Graham, S., and Rasmussen, P., 1993, Trophic-State Index equations and regional pre dictive equations for Wisconsin lakes: Wisconsin Department of Natural Resources Research Management Findings No. 35, 4 p.
Lillie, R.A., and Mason, J.W., 1983, Limnological characteristics of Wisconsin lakes: Wisconsin Department of Natural Resources Technical Bulletin No. 138,116 p.
Rantz, S.E., and others, 1982, Measurement and computation of streamflow: U.S. Geological Sur vey Water-Supply Paper 2175, 631 p.
Rapavich, W.M., Sonzogni, W.C., Standridge, J.H., Vennie J.G., and Wedepohl, R.E., 1987, Inci dence of algal toxins in Wisconsin water experiencing blue-green algae blooms: Wisconsin State Laboratory of Hygiene and Wisconsin Department of Natural Resources, Informational Paper, 8 p.
Shaw, B., Mechenich, C., and Klessig, L., 1993, Understanding Lake Data: G3582: University of Wisconsin Extension, Madison, Wis., 19 p.
U.S. Environmental Protection Agency, 1986, Quality Criteria for Water 1986: U.S. Environmental Protection Agency publication, EPA 440/5-86-001 [variously paged].
Wershaw, R.L, Fishman, M.J., Grabbe, R.R., and Lowe, L.E., eds., 1987, Methods for the determi nation of organic substances in water and fluvial sediments: U.S. Geological Survey Tech niques of Water-Resources Investigations, book 5, chap. A3, 80 p.
Wetzel, R.G., 1983, Limnology (2d ed.): New York, 767 p.
Wisconsin Department of Natural Resources, 1992, Wisconsin water quality assessment-Report to Congress, 1992: Wisconsin Department of Natural Resources Publ-WR254-92-REV, 220 p.
Wisconsin State Laboratory of Hygiene, Environmental Sciences Section, 1993, Manual of analytical methods, inorganic chemistry unit: Wisconsin State Laboratory of Hygiene, revised November 1993 [variously paged].
14
LAKE DATA
15


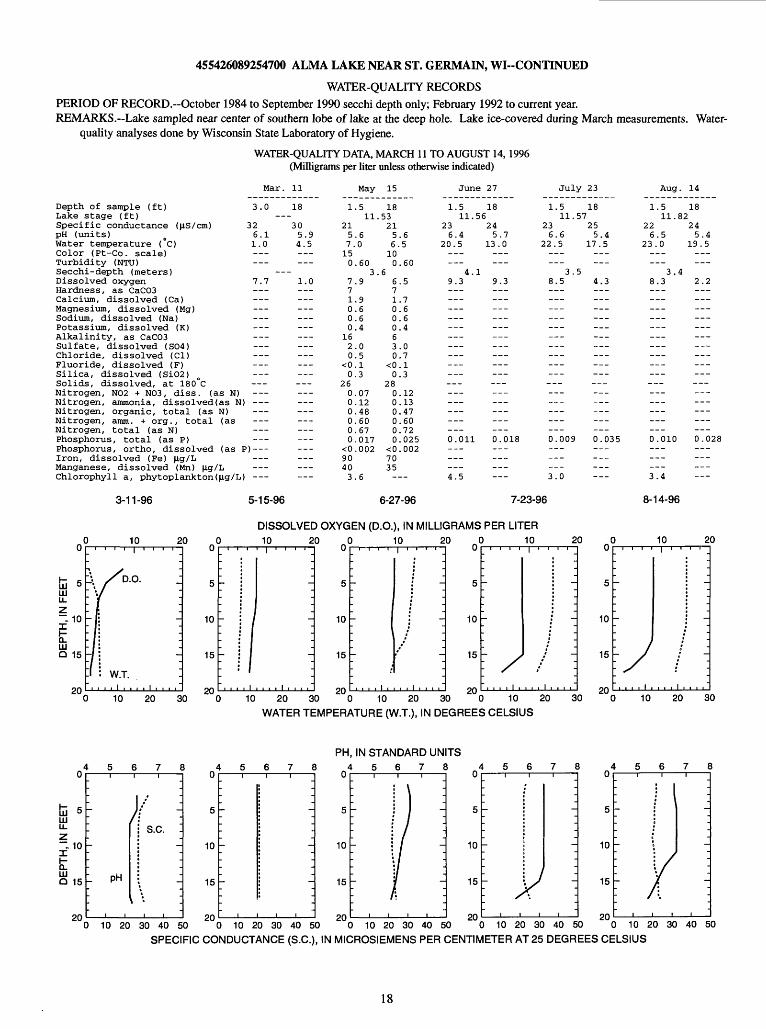
455426089254700 ALMA LAKE NEAR ST. GERMAIN, WI
LOCATION.--Lat 45°54'26", long 89°25'47", in NE 1/4 sec.36, T.40 N., R.8 E., Vilas County, Hydrologic Unit 07070001, 3 mi east of St. Germain.
LAKE-STAGE RECORDS
PERIOD OF RECORD.-October 1984 to September 1990, May 1992 to current year.
GAGE. Staff gage read by Douglas Pagel.
EXTREMES FOR PERIOD OF RECORD.-Maximum gage height observed, 12.35 ft, Apr. 11, 12, 1986; minimum observed, 8.98 ft, Oct. 26, 27,1989.
EXTREMES FOR CURRENT YEAR.-Maximum gage height observed, 11.82 ft, Aug. 14; minimum observed, 10.81 ft, Oct. 8.
GAGE HEIGHT, FEET, WATER YEAR OCTOBER 1995 TO SEPTEMBER 1996
DAILY MEAN VALUES
DAY OCT NOV DEC JAN FEE MAR APR MAY JUN JUL AUG SEP
2 ___ ___ ___ ___ ___ ___ ___ ___ ___ ___ ___ ___3 11.594 5 11.51 11.81
67 8 10.81 11.53 9
10 11.79
11 10.99 12 13 14 11.47 11.82 15 11.53
16 17 11.79 18 1920 11.47 11.63
21 2223 11.57 2425
26 27 11.56 28 11.57 29 11.49 30 31
17
455426089254700 ALMA LAKE NEAR ST. GERMAIN, WI--CONTINUED
WATER-QUALITY RECORDSPERIOD OF RECORD.-October 1984 to September 1990 secchi depth only; February 1992 to current year.REMARKS.--Lake sampled near center of southern lobe of lake at the deep hole. Lake ice-covered during March measurements. Water-
quality analyses done by Wisconsin State Laboratory of Hygiene.
WATER-QUALITY DATA, MARCH 11 TO AUGUST 14, 1996 (Milligrams per liter unless otherwise indicated)
Depth of sample (ft)Lake stage (ft)Specific conductance (US/cm)pH (units)Water temperature (°C)Color (Pt-Co. scale)Turbidity (NTU)Secchi-depth (meters)Dissolved oxygenHardness, as CaC03Calcium, dissolved (Ca)Magnesium, dissolved (Mg)Sodium, dissolved (Na)Potassium, dissolved (K)Alkalinity, as CaC03Sulfate, dissolved (S04)Chloride, dissolved (Cl)Fluoride, dissolved (F)Silica, dissolved (Si02)Solids, dissolved, at 180°CNitrogen, N02 + N03, diss. (as N)Nitrogen, ammonia, dissolved(as N)Nitrogen, organic, total (as N)Nitrogen, amm. + org., total (asNitrogen, total (as N)Phosphorus, total (as P)Phosphorus, ortho, dissolved (as P)--Iron, dissolved (Fe) (ig/LManganese, dissolved (Mn) Lig/LChlorophyll a, phytoplankton(Lig/L)
Mar.
3.0
326.11.0
7.7
___
___
>)
11
18-305.94.5
-1.0
___
_________
1
2157.150
771000
1620
<00
26000000
<090403
May
.511.
.60
.603.
.9
.9
.6
.6
.4
.0
.5
.1
.3
.07
.12
.48
.60
.67
.017
.002
.6
15
18,532156100
.6671000630
<00
28000000
<07035-
.6.5
.60
.5
.7
.6
.6
.4
.0
.7
.1
.3
.12
.13
.47
.60
.72
.025
.002
Jun
1.511.
236.4
20.5___
4.9.3
___
0.011
______4.5
e 27
1856
245.7
13.0
19.3
___
______0.018______
July
1.511.57
236.6
22.5
3.58.5 ______
___
0.009
___3.0
23
18
255.4
17.5______
4.3__________________
___
___---______---______0.035---______
Aug
1.511.
226.5
23.0______
3.8.3___
______
___ _________
_______________0.010_________3.4
. 14
1882
245.4
19.5
___4
2.2__________________
______
---______
___0.028_________
Lil
~ 10
O. Lil Q 15
20
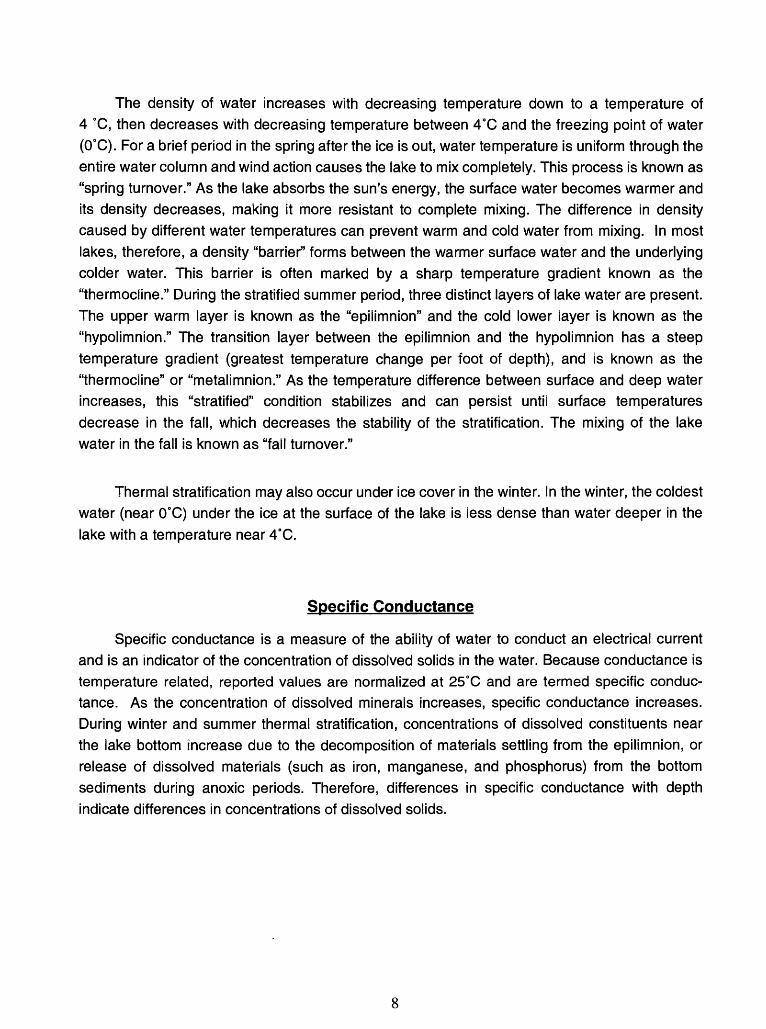
3-11-96
10 20
D.O.
0 10 20 30
5-15-96 6-27-96 7-23-96
DISSOLVED OXYGEN (D.O.), IN MILLIGRAMS PER LITER10 20
u
5
10
15
on
-
-
-
-
'
-
-
-
10 20u
5
10
15
on
-
-
-
-
,
-
j -
-
10 20
8-14-96
10 20
10 20 30 0 10 20 30
WATER TEMPERATURE (W.T.), IN DEGREES CELSIUS
u
5
10
15
20
-
-
-
) 10
,,,,,_
-
-
20 3
u
5
10
15
20 0 (
-
-
-
\)3 10
,,.,,_
-
-
20 3
PH, IN STANDARD UNITS
LLI
45678
5 -
"10 -
CL LLIQ 15 h
20
PH
S.C.
45678u
5
10
15
on
.
-
-
-
1
_
i -
-
-
i i
A0
5
10
15
on
5
-
-
-
678
J -
/ -
-
i0
5
10
15
on
\ 5 6
-
-
\ J
7 8
-
-
-
45678
5 -
10 -
15 -
20 £\J " """ " £VJ ' -^ ^y f^j
0 10 20 30 40 50 0 10 20 30 40 50 0 10 20 30 40 50 0 10 20 30 40 50 0 10 20 30 40 50 SPECIFIC CONDUCTANCE (S.C.), IN MICROSIEMENS PER CENTIMETER AT 25 DEGREES CELSIUS
18
0.018
O Q- 0.014 O m
5520.012
TOTAL PHOS IN MIL
p p c
i i i i i i i i i i i i i i i i i i i i i i i i i i i i i i i i i i i i i i i i i i i i i i i i i i i i i i i1992 1993 1994 1995 1996
For 5 < HI
o
£g gs3-o
" 1 1 1 1 1 1 1 1 1 1 11992
i i i i i i i i i i i1993
i i i i i i i i i i i1994
i i i i i 1*1 i i i i1995
i i i i i i i i i i i *1996
1 1 1 1 1 1 1 1 1 1 11992
i i i i i i i i i i i1993
i i i i i i i i i i i1994
i i i i i i i i i i i1995
i i i i i i i i i i i1996
CALENDAR YEAR
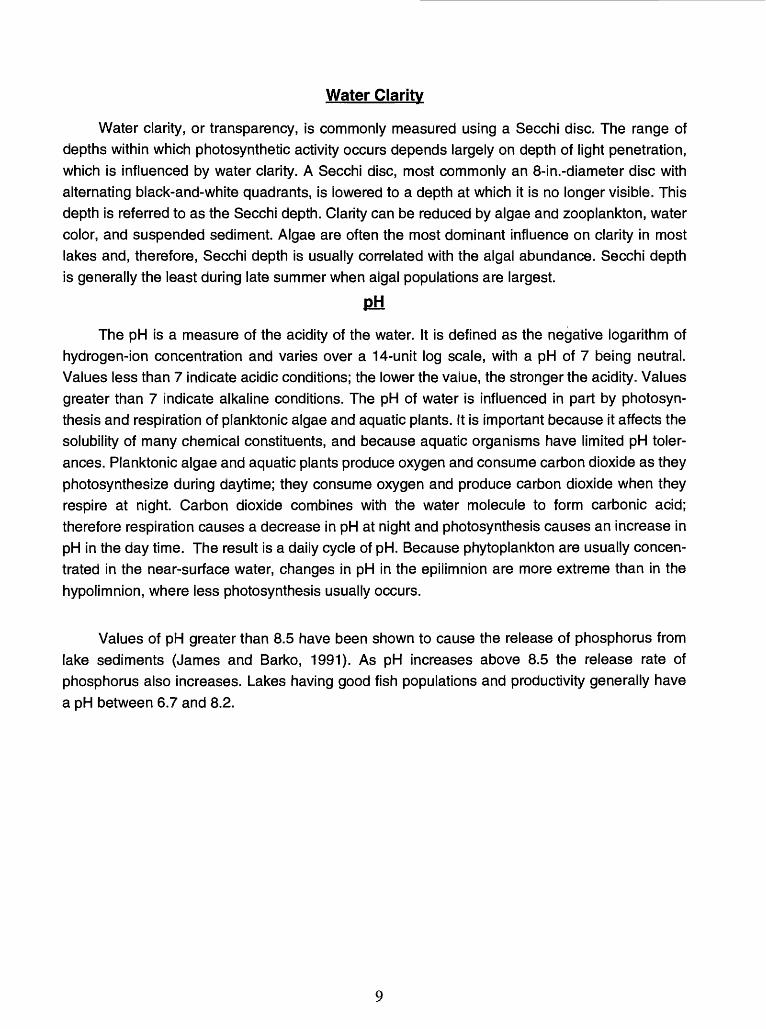
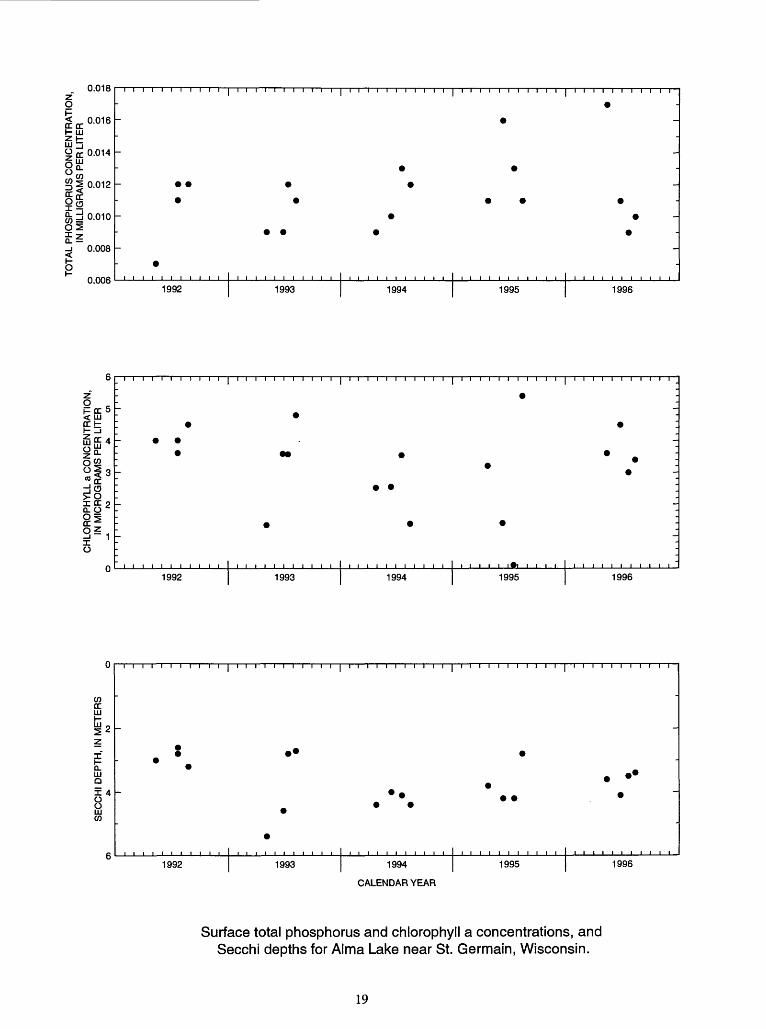
Surface total phosphorus and chlorophyll a concentrations, and Secchi depths for Alma Lake near St. Germain, Wisconsin.
19
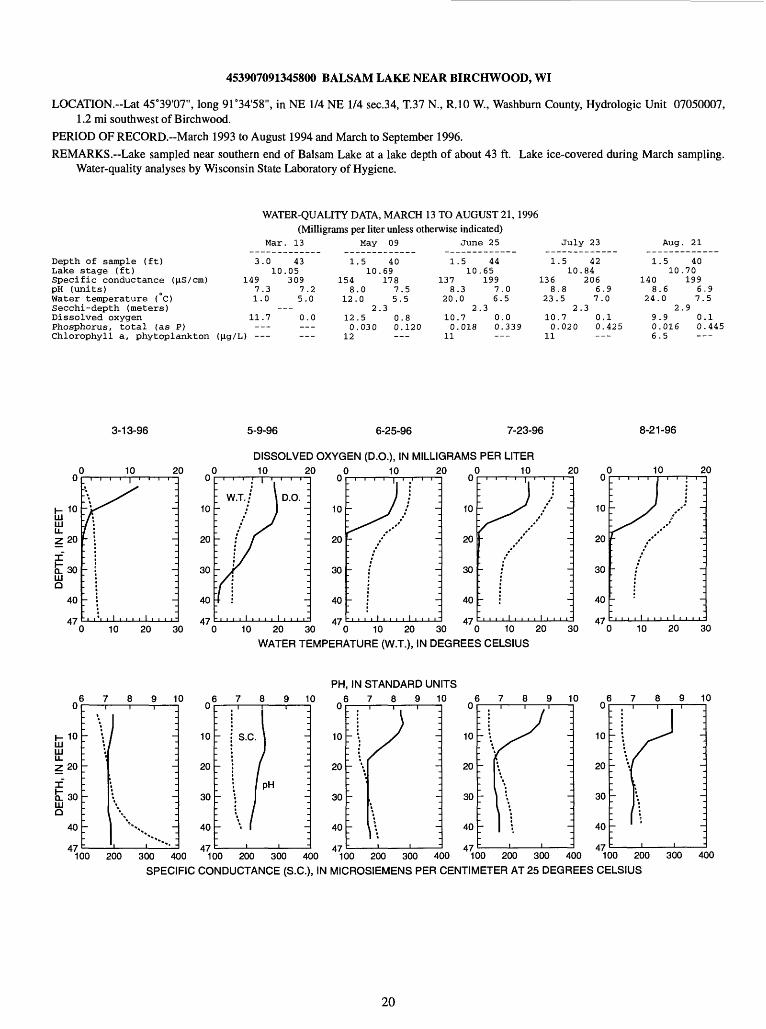
453907091345800 BALSAM LAKE NEAR BIRCHWOOD, WI
LOCATION.--Lat 45°39'07", long 91°34'58" ) in NE 1/4 NE 1/4 sec.34, T.37 N., R.IO W., Washburn County, Hydrologic Unit 07050007,1.2 mi southwest of Birchwood.
PERIOD OF RECORD.-March 1993 to August 1994 and March to September 1996. REMARKS. Lake sampled near southern end of Balsam Lake at a lake depth of about 43 ft. Lake ice-covered during March sampling.
Water-quality analyses by Wisconsin State Laboratory of Hygiene.
WATER-QUALITY DATA, MARCH 13 TO AUGUST 21, 1996 (Milligrams per liter unless otherwise indicated)
Mar. 13
Depth of sample (ft)Lake stage (ft)Specific conductance ((iS/cm)pH (units)Water temperature (°C)Secchi-depth (meters)Dissolved oxygenPhosphorus, total (as P)Chlorophyll a, phytoplankton (ng/L) -
May 09 June 25 July 23 Aug. 21
3.0
1497.31.0
11.7___
.)
4310.05
3097.25.0
___0.0
1.5 4010.69
154 1788.0 7.5
12.0 5.52.3
12.5 0.80.030 0.120
12
1.5 4410.65
137 1998.3 7.0
20.0 6.52.3
10.7 0.00.018 0.339
11
1.5 4210.84
136 2068.8 6.9
23.5 7.02.3
10.7 0.10.020 0.425
11
1.5 4010.70
140 1998.6 6.9
24.0 7.52.9
9.9 0.10.016 0.4456.5
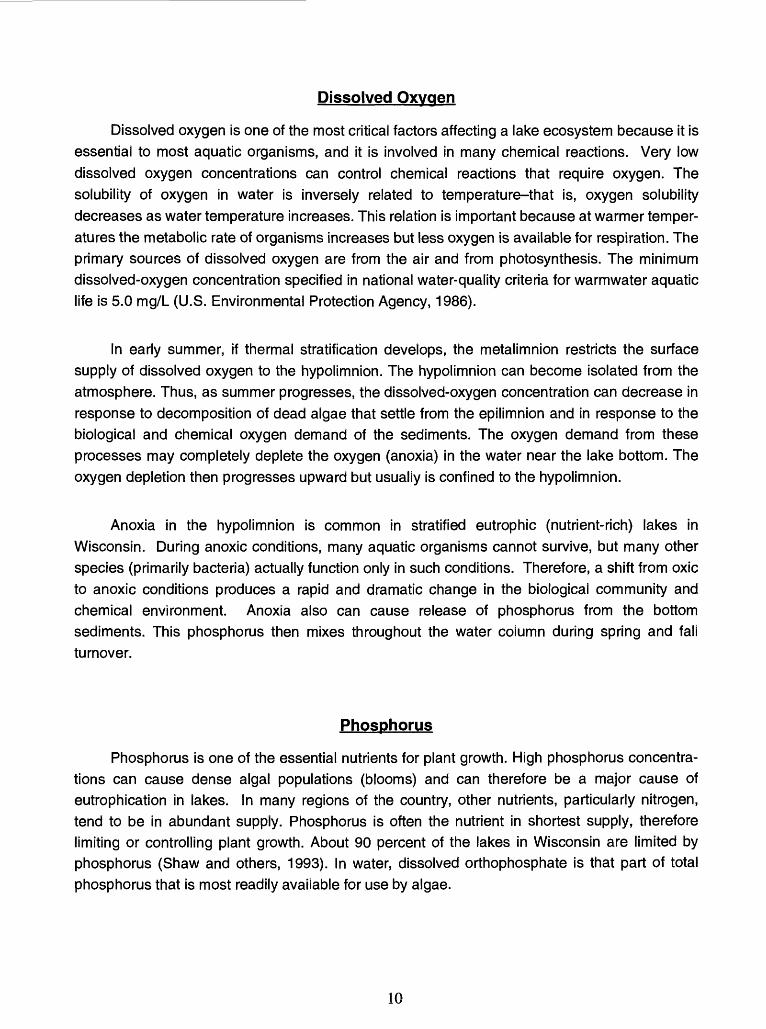
3-13-96 5-9-96 6-25-96 7-23-96
DISSOLVED OXYGEN (D.O.), IN MILLIGRAMS PER LITER
10 20 30 10 20 30 10 20 30 10 20
WATER TEMPERATURE (W.T.), IN DEGREES CELSIUS
30
8-21-96
n (
ID 10LU
Z20
iCL 30 LU O
40
AT
) 10 2
.s^
/ "-
-^
1 , , 1 , , , , 1 , , , ,-
0 (0
10
20
30
40
A7
) 10 2_,,,_,,,,,,_
W.T.; \ D.O. -
' x / =r y -i
K -r i
0 n (0
10
20
30
40
A7
) 10 2
U1 ;
;
/ :-
:
"
0 o C0
10
20
30
40
A.7
10 2-^/]-j
-
0 0 C 0
10
20
30
40
A.7
) 10 2
: / :I ' -
\s/ / ~-
/ ~-
1 ~
10 20 30
PH, IN STANDARD UNITS
0
Si 10LU U. Z 20
_LU O
30
40
47
10 6 7 8 9 10 670
8 9 10 670
8 9 10 6 7 8 9 10
100 200 300 400 100 200 300 400 100 200 300 400 100 200 300 400 100 200 300 400
SPECIFIC CONDUCTANCE (S.C.), IN MICROSIEMENS PER CENTIMETER AT 25 DEGREES CELSIUS
20
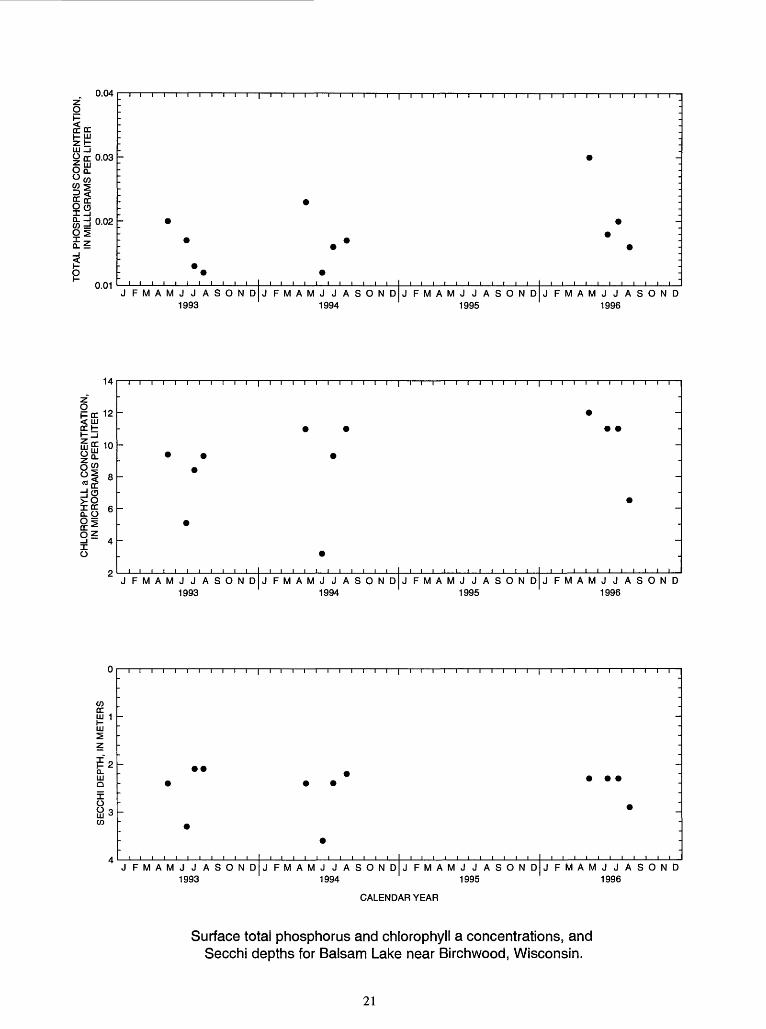
0.04
o a: 0.03 z LU Qo-
T .j 85 d 0.02
0.01JFMAMJJASONDJFMAMJJASONDJFMAMJJASONDJFMAMJJASOND
1993 1994 1995 1996
14z"
Pa: 12 < iii O:Hh-I]
m£ 10 o£ O w °I 8
JFMAMJJASOND 1993
JFMAMJJASOND 1994
JFMAMJJASOND 1995
JFMAMJJASOND 1996
$2 a. iii oT O O qQJ °
05
JFMAMJJASOND 1993
JFMAMJJASOND JFMAMJJASOND1994 1995
JFMAMJJASOND 1996
CALENDAR YEAR
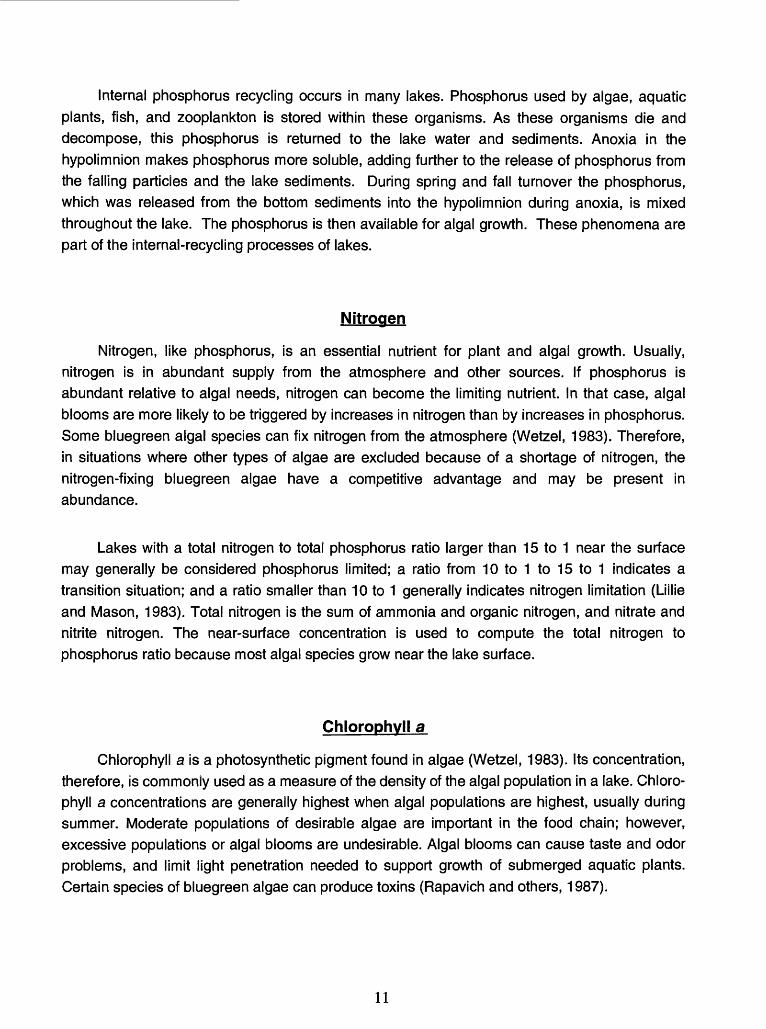
Surface total phosphorus and chlorophyll a concentrations, and Secchi depths for Balsam Lake near Birchwood, Wisconsin.
21
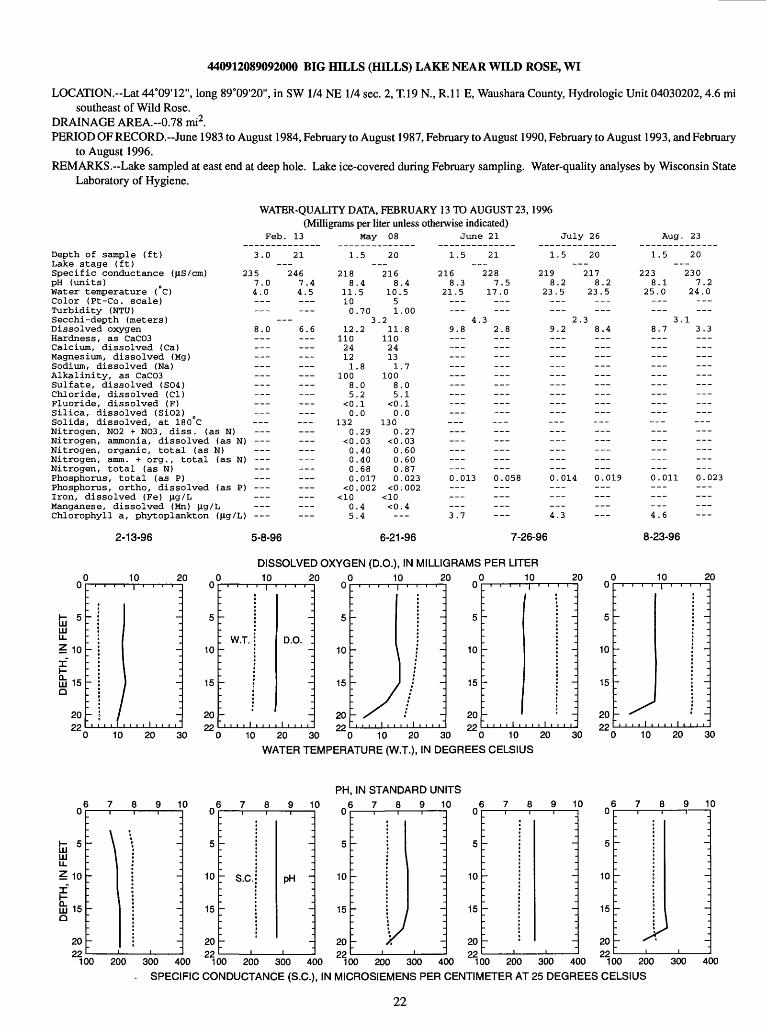
440912089092000 BIG HILLS (HILLS) LAKE NEAR WILD ROSE, WI
LOCATION.-Lat 44°09'12", long 89 009'20", in SW 1/4 NE 1/4 sec. 2, T.19 N., R.ll E, Waushara County, Hydrologic Unit 04030202, 4.6 misoutheast of Wild Rose.
DRAINAGE AREA.-0.78 mi2. PERIOD OF RECORD.--June 1983 to August 1984, February to August 1987, February to August 1990, February to August 1993, and February
to August 1996. REMARKS. Lake sampled at east end at deep hole. Lake ice-covered during February sampling. Water-quality analyses by Wisconsin State
Laboratory of Hygiene.
WATER-QUALITY DATA, FEBRUARY 13 TO AUGUST 23,1996 (Milligrams per liter unless otherwise indicated)
Depth of sample (ft)Lake stage (ft)Specific conductance (jiS/cm)pH (units)Water temperature ( C)Color (Pt-Co. scale)Turbidity (NTU)Secchi-depth (meters)Dissolved oxygenHardness, as CaC03Calcium, dissolved (Ca)Magnesium, dissolved (Mg)Sodium, dissolved (Na)Alkalinity, as CaC03Sulfate, dissolved (S04)Chloride, dissolved (CDFluoride, dissolved (F)Silica, dissolved (Si02)Solids, dissolved, at 180°CNitrogen, N02 + N03, diss. (as N)Nitrogen, ammonia, dissolved (as N)Nitrogen, organic, total (as N)Nitrogen, amm. + org., total (as N)Nitrogen, total (as N)Phosphorus, total (as P)Phosphorus, ortho, dissolved (as P)Iron, dissolved (Fe) \ig/LManganese, dissolved (Mn) \ig/LChlorophyll a, phytoplankton (jig/L)
2-13-96
Feb.
3.0
2357.04.0
--8.0
___
---
I) -___
I) ___
>)
___,)
13
21
2467.44.5
-6.6
___
______
1
2188
11.100
1211024121
10085
<00
1320
<00000
<0
05
May
.5
.4
.5
.703
.2
.8
.0
.2
.1
.0
.29
.03
.40
.40
.68
.017
.002
.4
.4
08
20
2168
1051
.211
11024131
10085
<00
1300
<00000
<0
<0-
.4.5
.00
.8
.7
.0
.1
.1
.0
.27
.03
.60
.60
.87
.023
.002
.4--
June
1.5
2168.3
21.5
___4.
9.8___
___
___0.013-
___3.7
21
21
2287.5
17.0
32.8
___
______
___
___0.058___
___
Jul
1.5
2198.2
23.5______
29.2___---______------
---___
___---___---___0.014---
4.3
y 26
20
2178.2
23.5______
.38.4---_________
______---___
---
___0.019
Aug
1.5
2238.1
25.0
38.7
___
---
---
---0.011___
4.6
. 23
20
2307.2
24.0---
.13.3
---___---
___0.02___
___
5-8-96 6-21-96 7-26-96 8-23-96
10 20U
h- 5
LU U.
DEPTH, 1 01 C
2099
:
'-
'-
'-
]
-_
~
10 20 30
DISSOLVED OXYGEN (D.O.), IN MILLIGRAMS PER LITER10 20
u
5
10
15
20 oo
. . i i |
: W.T.
'-
'-
_
D.O. :
-_
i , , i~
20 10 20
10 20 30 "0 10 20 30 "0 10 20 WATER TEMPERATURE (W.T.), IN DEGREES CELSIUS
30
10 20u
5
10
15
2000
~7
\S
-_
,,!,,,,'
U
5
10
15
2099
-
7
'-
"i i i i 1 i
-_
-_
i , i 1 i i i i"
U
5
10
15
2099
-
-
^-
"i i i i I i
-_
-_
i , i 1 i i i"
10 20 30
89 10u
ID 5LU U.
DEPTH, 1 01 C
2099
i- \
7
-
-j
-_
89 10
5
10
15
20 oo
-
- s.c.
7
-
-_
PH -
-_
-_
PH, IN STANDARD UNITS 89 10 89 10
u
5
10
15
2000
' '
'-
'-
: -
L /i
'
-
-_
-j
_i
u
5
10
15
2099
_
~-
'-
'7
-
I
'
-_
-m
-_
-
i
8 9 10u
5
10
15
2099
.
-
7
'-
L sCi
1
-_
j
-
i'100 200 300 400 00 200 300 400 00 200 300 400 100 200 300 400 "TOO 200 300 400
- SPECIFIC CONDUCTANCE (S.C.), IN MICRO-SIEMENS PER CENTIMETER AT 25 DEGREES CELSIUS
22
z o
1 jjj 0.03
§£
TOTAL PHOSPHORUS C IN MILLIGRAMS F
o o b b3 - l\3
' \
' -
|- -:
\ -
' mm ^ 'i- . o v V * J! % I
1983 1984 1985 1986 1987 1988 1989 1990 1991 1992 1993 1994 1995 1996
O PCC<f LLIffbe
2 JJR ££0.0
1983 1984 1985 1986 1987 1988 1989 1990 1991 1992 1993 1994 1995 1996
1
CO o OC 2 LLJ
LLJ
? 3
t
e 4OoW 5
6
1 II.
: . 9 -.
" *":
* -
"
1983 1984 1985 1986 1987 1988 1989 1990 1991 1992 1993 1994 1995 1996
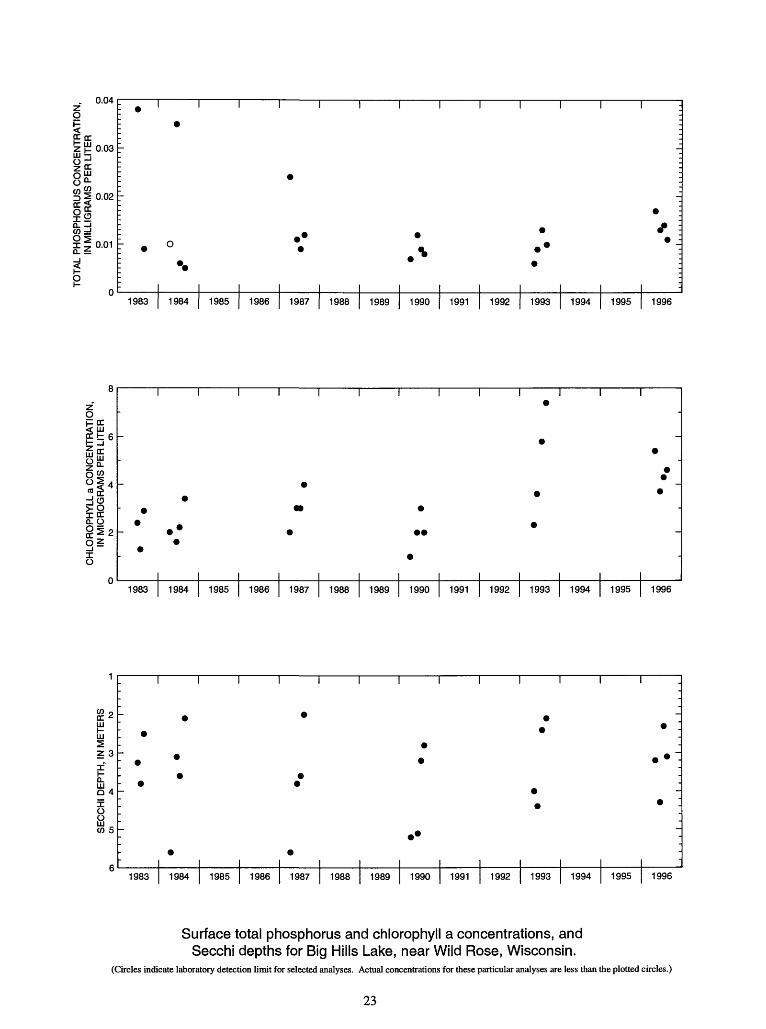
Surface total phosphorus and chlorophyll a concentrations, and Secchi depths for Big Hills Lake, near Wild Rose, Wisconsin.
(Circles indicate laboratory detection limit for selected analyses. Actual concentrations for these particular analyses are less than the plotted circles.)
23

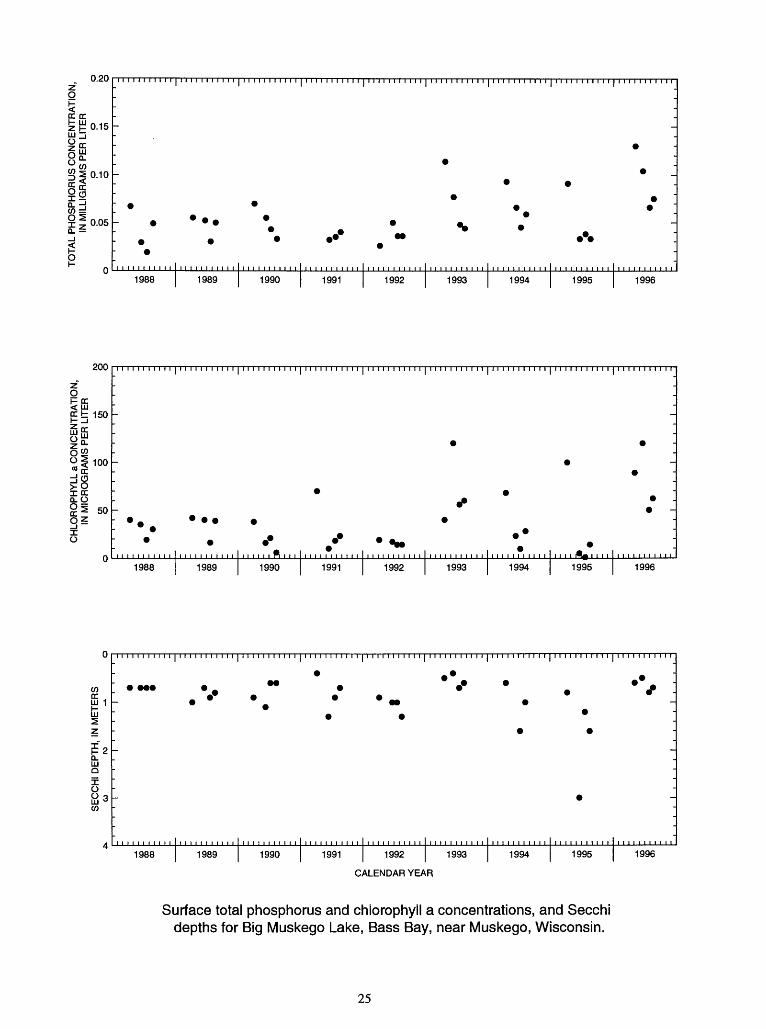
425344088070100 BIG MUSKEGO LAKE, BASS BAY, NEAR MUSKEGO, WI
LOCATION.--Lat 42°53'44", long 88"07'01", in SW 1/4 NE 1/4 sec. 15, T.5 N., R.20 E., Waukesha County, Hydrologic Unit 07120006, 1.3 misoutheast of Muskego.
PERIOD OF RECORD.--February 1988 to current year. REMARKS. Lake sampled near center of lake at the deep hole. Lake ice-covered during February measurements. Lake stages not recorded due
to drainage of south site. Water-quality analyses done by Wisconsin State Laboratory of Hygiene.
WATER-QUALITY DATA, FEBRUARY 06 TO AUGUST 20, 1996 (Milligrams per liter unless otherwise indicated)
Feb. 06 May 07 June 20 July 29
Depth of sample (ft)Lake stage (ft)Specific conductance (US/cm)pH (units)Water temperature (°C)Color (Pt-Co. scale)Turbidity (NTU)Secchi-depth (meters)Dissolved oxygenHardness, as CaCO3Calcium, dissolved (Ca)Magnesium, dissolved (Mg)Sodium, dissolved (Na)Alkalinity, as CaCOSSulfate, dissolved (SO4)Chloride, dissolved (Cl)Fluoride, dissolved (F)Silica, dissolved (SiO2)Solids, dissolved, at 180 CNitrogen, NO2 + NO3, diss. (as N)
ammonia, dissolved (as N) organic, total (as N) amm. + org., total (as N) total (as N)
total (as P) ortho, dissolved
Nitrogen, Nitrogen, Nitrogen, Nitrogen, Phosphorus, Phosphorus,
Aug. 2 0
(asIron, dissolved (Fe) (ig/L Manganese, dissolved (Mn) |lg/L Chlorophyll a, phytoplankton (|ig/L)
3.0
5868.50.5___
17.1
___
---
---0
---0
______
___,)
23
7417.54.0
0.8___
___
___
___
1
5698
11.308
11250493122
200394902
3500012200
0,89
.5
.60
.90
.6
.2
.2
.33
.12
.9
.0
.3
.130
.002
.5
20
5748
104015
.69
250493122
200384902
3460022200
2-
.5.5
.0
.2
.4
.33
.21
.2
.4
.7
.157
.003
--
1.5
5108.8
22.0
___0
16.2_______________
___
______0.104
___120
22
6327.7
15.5
__...5
0.5
______
___
___
___
___0.088
___
1.5
5688.2
23.0
0.6.9______
___
___
---
0.066
___50
21
5897.4
22.0
80.5
_________
___
_______________
___0.085
___
1.5
5518.3
25.0______
0.8.2
___
___ ______
___0.075
___62
21
5647.7
24.0______
72.3
---______---
_________ 0.082
______
2-6-96 5-7-96 6-20-96 7-29-96 8-20-96
DISSOLVED OXYGEN (D.O.), IN MILLIGRAMS PER LITER 10 20 .0 10 20 .0 10
10 20 30 10 20 30 0 10 20 30 0 10 20 30 WATER TEMPERATURE (W.T.), IN DEGREES CELSIUS
20 00
10 20
10 20 30
PH, IN STANDARD UNITS 6789 10 6789 10 6789 10 6789 10 6789 10
Z 10
I
20
23500 600 700 800 500 600 700 800 500 600 700 800 500 600 700 800 500 600 700 800
SPECIFIC CONDUCTANCE (S.C.), IN MICROSIEMENS PER CENTIMETER AT 25 DEGREES CELSIUS
24
0.20
CC DC zTO-15"J^
°co §20.10
0.05
1988 1989 1990 1991 1992 1993 1994 1995 1996
<£UU
z"
OSffi |b150
z Q-
«< 10°>o £g§2 50
O
0
in,,,,,,,, ,.,,,,,,,,,,,,,,,,,,,,, ,,,,,,,,,,, ,,,,,,,,,,, ,,,,,,,,, ,,|,,, ,,,,,,,, ,,,,,,,,,,,
: . -
-* - * «b» *
",.,.,.,,,,. ,,,,,,,,,,, ,,,,", ft,,, ,,,,*,,,,, MM, TT,,, MM,,,,,,, M,,,?,,,,, ,,,,*-,,,, MM,,,,,,,"
1988 1989 1990 1991 1992 1993 1994 1995 1996
CO
£1
1988 1989 1990 1991 1992 1993
CALENDAR YEAR
1994 1995 1996
Surface total phosphorus and chlorophyll a concentrations, and Secchi depths for Big Muskego Lake, Bass Bay, near Muskego, Wisconsin.
25
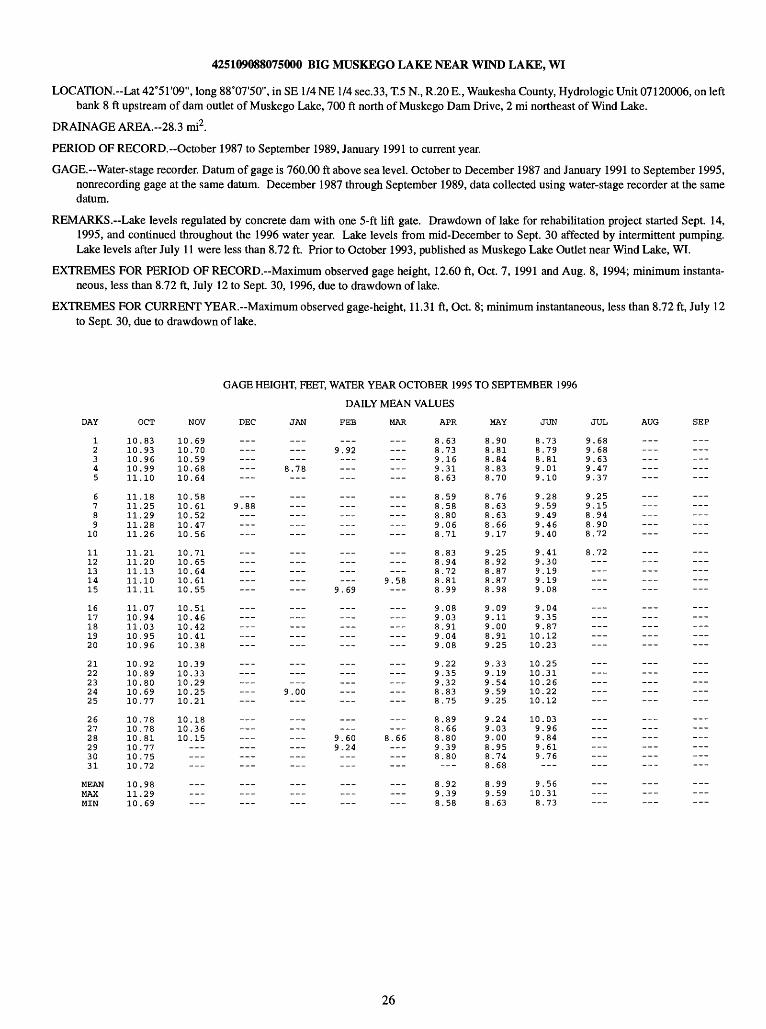
425109088075000 BIG MUSKEGO LAKE NEAR WIND LAKE, WI
LOCATION.-Lat 42°51'09", long 88°07'50", in SE 1/4 NE 1/4 sec.33, T.5 N., R.20 E., Waukesha County, Hydrologic Unit 07120006, on left bank 8 ft upstream of dam outlet of Muskego Lake, 700 ft north of Muskego Dam Drive, 2 mi northeast of Wind Lake.
DRAINAGE AREA.--28.3 mi2 .
PERIOD OF RECORD.--October 1987 to September 1989, January 1991 to current year.
GAGE. Water-stage recorder. Datum of gage is 760.00 ft above sea level. October to December 1987 and January 1991 to September 1995, nonrecording gage at the same datum. December 1987 through September 1989, data collected using water-stage recorder at the same datum.
REMARKS.--Lake levels regulated by concrete dam with one 5-ft lift gate. Drawdown of lake for rehabilitation project started Sept. 14, 1995, and continued throughout the 1996 water year. Lake levels from mid-December to Sept. 30 affected by intermittent pumping. Lake levels after July 11 were less than 8.72 ft. Prior to October 1993, published as Muskego Lake Outlet near Wind Lake, WI.
EXTREMES FOR PERIOD OF RECORD.-Maximum observed gage height, 12.60 ft, Oct. 7, 1991 and Aug. 8, 1994; minimum instanta neous, less than 8.72 ft, July 12 to Sept. 30, 1996, due to drawdown of lake.
EXTREMES FOR CURRENT YEAR.-Maximum observed gage-height, 11.31 ft, Oct. 8; minimum instantaneous, less than 8.72 ft, July 12 to Sept. 30, due to drawdown of lake.
GAGE HEIGHT, FEET, WATER YEAR OCTOBER 1995 TO SEPTEMBER 1996
DAILY MEAN VALUES
DAY OCT NOV DEC JAN FEE MAR APR MAY JUN JUL AUG SEP
1 10.83 10.69 8.63 8.90 8.73 9.68 2 10.93 10.70 9.92 8.73 8.81 8.79 9.68 3 10.96 10.59 9.16 8.84 8.81 9.63 4 10.99 10.68 8.78 9.31 8.83 9.01 9.47 5 11.10 10.64 8.63 8.70 9.10 9.37
6 11.18 10.58 8.59 8.76 9.28 9.257 11.25 10.61 9.88 8.58 8.63 9.59 9.15 8 11.29 10.52 8.80 8.63 9.49 8.94 9 11.28 10.47 9.06 8.66 9.46 8.90
10 11.26 10.56 - 8.71 9.17 9.40 8.72
11 11.21 10.71 8.83 9.25 9.41 8.72 12 11.20 10.65 8.94 8.92 9.30 13 11.13 10.64 8.72 8.87 9.19 14 11.10 10.61 - 9.58 8.81 8.87 9.19 --- -15 11.11 10.55 9.69 --- 8.99 8.98 9.08 -
16 11.07 10.51 9.08 9.09 9.04 17 10.94 10.46 9.03 9.11 9.3518 11.03 10.42 8.91 9.00 9.87 19 10.95 10.41 9.04 8.91 10.1220 10.96 10.38 9.08 9.25 10.23
21 10.92 10.39 9.22 9.33 10.25 22 10.89 10.33 9.35 9.19 10.31 23 10.80 10.29 9.32 9.54 10.26 24 10.69 10.25 9.00 8.83 9.59 10.22 25 10.77 10.21 8.75 9.25 10.12
26 10.78 10.18 8.89 9.24 10.03 27 10.78 10.36 8.66 9.03 9.96 28 10.81 10.15 --- 9.60 8.66 8.80 9.00 9.84 - --- ---29 10.77 9.24 9.39 8.95 9.61 30 10.75 8.80 8.74 9.76 31 10.72 --- --- --- --- 8.68 --- ---
MEAN 10.98 - --- 8.92 8.99 9.56 - ---MAX 11.29 9.39 9.59 10.31 ---MIN 10.69 --- - --- 8.58 8.63 8.73 -
26

05390750 BIG ST. GERMAIN LAKE NEAR LAKE TOMAHAWK, WI
LOCATION.-Lat 45°55'00", long 89°31 '55" in NE 1/4 SE 1/4 sec.30, T.40 N., R.8 E., Vilas County, Hydrologic Unit 07070001, at dam outlet, 7.7 mi northeast of Lake Tomahawk.
DRAINAGE AREA.--73.1 mi2 .
PERIOD OF RECORD.-October 1991 to current year. Lake stages for previous years were recorded by Wisconsin Valley Improvement Company.
GAGE.-Nonrecording gage. Datum of gage is 1,580 ft, above sea level.
COOPERATION.-Lake stages provided by Wisconsin Valley Improvement Company.
EXTREMES FOR PERIOD OF RECORD.-Maximum gage height observed, 10.94 ft, Oct. 6, 1995; minimum observed, 8.16 ft, Jan. 26, 1996.
EXTREMES FOR CURRENT YEAR.-Maximum gage height observed, 10.94 ft, Oct. 6; minimum observed, 8.16 ft, Jan. 26.
DAY
12345
6789
10
1112131415
1617181920
2122232425
262728293031
MEANMAXMIN
OCT
10.8010.8010.7810.8010.84
10.9410.9010.8610.8210.78
10.7010.6410.6010.5810.54
10.4810.4610.4410.4610.46
10.4410.4810.5010.6210.60
10.6010.6410.6810.6810.6810.68
10.6510.9410.44
NOV
10.7610.7610.7610.7610.74
10.7410.7210.7010.6810.68
10.6610.6610.6610.60
10.30
10.08
9.96
GAGE HEIGHT, FEET, WATER YEAR OCTOBER 1995 TO SEPTEMBER 1996
DAILY MEAN VALUES
DEC JAN FEE MAR APR MAY JUN JUL
9.80 9.02 9.02 9.02 9.00
9.60 8.!
9.52
9.40
9.32
9.27
9.18
9.10 8.16
8.82
8.78
1.90 8.90
8.90
8.82
8.80
8.82
8.70
8.62
9.06
8.56
8.56
8.589.02
8.66
8.68
8.78
9.02
9.189.229.289.40
9.529.549.589.629.70
9.769.809.829.849.88
9.929.949.969.98
10.00
10.0410.0810.0810.1010.14
10.1610.2010.2410.2610.40
10.4410.4610.4810.5210.54
10.5410.5610.5410.5010.4810.48
10.2010.569.76
10.4810.5210.5610.5810.56
10.6410.6210.6010.5810.60
10.6410.6210.6010.5610.52
10.5010.5210.5610.5610.54
10.5210.5810.5810.6210.60
10.6010.6610.6810.6210.58
10.5810.6810.48
10.5210.6010.5610.5410.54
10.5410.5210.5610.5610.50
10.5210.5610.5810.5810.60
10.6410.6410.7810.7410.70
10.6810.6610.6210.5810.54
10.5010.5210.5410.5810.5810.58
10.5910.7810.50
AUG
10.5810.5810.5810.5810.60
10.7810.8010.7810.7610.72
10.6810.6410.6210.6010.58
10.5410.5610.5610.5410.50
10.5010.5810.5610.5610.54
10.5410.5210.5010.5010.5010.50
10.5910.8010.50
SEP
10.5010.4810.4810.5210.54
10.5610.5810.5810.6010.58
10.5810.5610.5610.5610.56
10.5410.5410.5210.5010.50
10.5010.5210.5210.5210.52
10.5210.5610.5610.5810.58
10.5410.6010.48
27
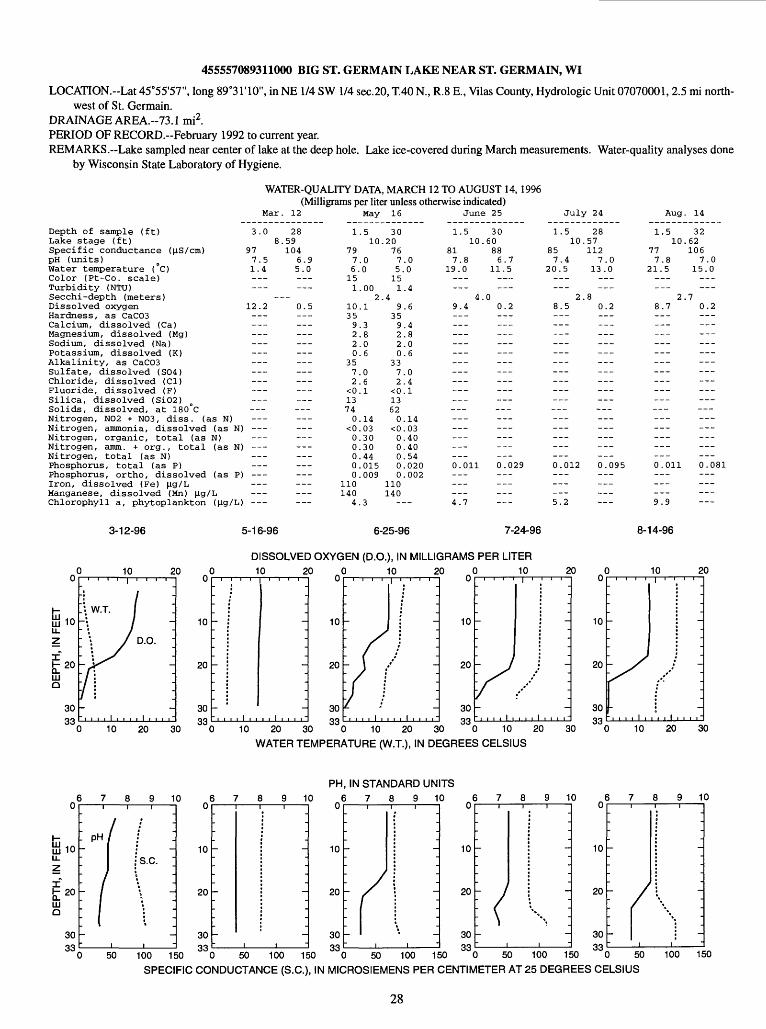
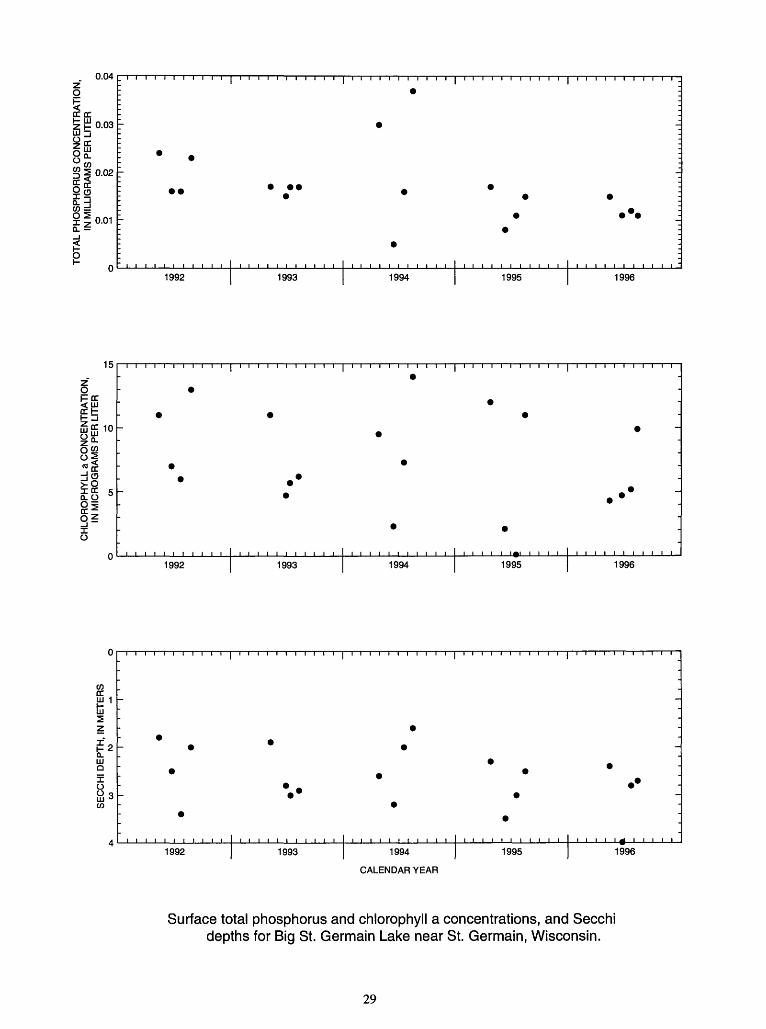
455557089311000 BIG ST. GERMAIN LAKE NEAR ST. GERMAIN, WI
LOCATION.--Lat 45°55'57", long 89°31'10", in NE 1/4 SW 1/4 sec.20, T.40 N., R.8 E., Vilas County, Hydrologic Unit 07070001, 2.5 mi north west of St. Germain.
DRAINAGE AREA.--73.1 mi2.PERIOD OF RECORD.--February 1992 to current year.REMARKS.--Lake sampled near center of lake at the deep hole. Lake ice-covered during March measurements. Water-quality analyses done
by Wisconsin State Laboratory of Hygiene.
WATER-QUALITY DATA, MARCH 12 TO AUGUST 14, 1996 (Milligrams per liter unless otherwise indicated)
Mar. 12 May 16 June 25 July 24
Depth of sample (ft)Lake stage (ft)Specific conductance (|O.S/cm)pH (units)Water temperature (°C)Color (Pt-Co. scale)Turbidity (NTU)Secchi-depth (meters)Dissolved oxygenHardness, as CaC03Calcium, dissolved (Ca)Magnesium, dissolved (Mg)Sodium, dissolved (Na)Potassium, dissolved (K)Alkalinity, as CaC03Sulfate, dissolved (S04)Chloride, dissolved (Cl)Fluoride, dissolved (F)Silica, dissolved (Si02)Solids, dissolved, at 180°CNitrogen, N02 + N03, diss. (as N)Nitrogen, ammonia, dissolved (as N)Nitrogen, organic, total (as N)Nitrogen, amm. + org., total (as N)Nitrogen, total (as N)Phosphorus, total (as P)Phosphorus, ortho, dissolved (asIron, dissolved (Fe) (J.g/LManganese, dissolved (Mn) fig/LChlorophyll a, phytoplankton (|J.g/L)
Aug. 14
3.0
977.51.4______
12.2_________
___
___
___------
)
) ______
) ______
)
288.59
1046.95.0
______
0.5
---
___
1
7976.151
10359220
3572
<013740
<000000
110140
4
.510
.00
.002
.1
.3
.8
.0
.6
.0
.6
.1
.14
.03
.30
.30
.44
.015
.009
.3
30.207675151
.49
359220
3372
<013620
<000000
110140
-
.0.0
.4
.6
.4
.8
.0
.6
.0
.4
.1
.14
.03
.40
.40
.54
.020
.002
1.510,
817.8
19.0
4,9.4
---______------___---___
---
0.011
4.7
30.60
886.7
11.5__..
.00.2
___
---
---
------___0.029___
___
1.510,
857.4
20.5---___
2.8.5
___---______------------------
---___---___0.012______
5.2
28.57112
7.013.0___
.80.2
------___---------
___
______0.095_________
1.510.
777.8
21.5______
2.8.7______---______---_________
---______---___0.011
___9.9
32.62106
7.015.0______
.70.2___------______---
___
0.08
___
3-12-96 5-16-96 6-25-96 7-24-96 8-14-96
fflioLi-
Q_ HI Q
10 20
D.O.
10 20 30
DISSOLVED OXYGEN (D.O.), IN MILLIGRAMS PER LITER10 20
u
10
20
30 *>*>
-
-i i i . I . i
-
. 1 . i i .-
10
20
10 20
10
20
10
10 20 30 0 10 20 30 0 10 20 WATER TEMPERATURE (W.T.), IN DEGREES CELSIUS
20
30
10 20u
10
20
30 oo
-
-}
, i . i I i
I \ ' '
t.
,°, , I , , i ,-10 20 30
PH, IN STANDARD UNITS6789 10 6789 10 6789 10 6 7 8 9 10 6 7 8 9 100| i I i I 0| i i i i Oi i I I 1 0u
BioLL
z
£20LUO
30 rtrt
' PH/ ' ~:
'. s.c. ;
. :I *
( I --
10
20
10
20
10
20
10
20
50 100 150 0 50 100 150 0 50 100 150 0 50 100 150 0 50 100 150 SPECIFIC CONDUCTANCE (S.C.), IN MICROSIEMENS PER CENTIMETER AT 25 DEGREES CELSIUS
28
03
C/D
O
^
CQ
wCD
03
ia 9?.
o
u
3-
=3
*<
CD =
03
D3
rr\
OC
/J
O^
3
0^
CDCD Q
.
SE
CC
HI
DE
PT
H,
IN M
ET
ER
S
CH
LOR
OP
HY
LL a
CO
NC
EN
TR
AT
ION
, IN
MIC
RO
GR
AM
S P
ER
LIT
ER
TO
TA
L P
HO
SP
HO
RU
S C
ON
CE
NT
RA
TIO
N,
IN M
ILLI
GR
AM
S P
ER
LIT
ER
o
o
p
p
3 2
g 8
g

454724091303600 BIG SISSABAGAMA LAKE NEAR STONE LAKE, WI
,loi
DRAINAGE AREA.--9.47 mi2.
LOCATION.-Lat 45°47'24", long 91°30'36", in NW 1/4 SE 1/4 sec.6, T.38 N., R.9 W., Sawyer County, Hydrologic Unit 07050001, near Stone Lake.
LAKE-STAGE RECORDS
PERIOD OF RECORD.-April 1986 to current year.
GAGE.--Staff gage near lake outlet read by Richard Roehrich and John Eary.
EXTREMES FOR PERIOD OF RECORD: Maximum gage height observed, 6.09 ft, May 7 and Sept. 15,1991; minimum observed, 4.78 ft, Sept. 15,16,1988.
EXTREMES FOR CURRENT YEAR.-Maximum gage height observed, 6.04 ft, Apr. 21-23; minimum observed, 5.49 ft, Mar. 13, and Sept. 20, 22-23.
GAGE HEIGHT, FEET, WATER YEAR OCTOBER 1995 TO SEPTEMBER 1996
DAILY MEAN VALUES
DAY OCT NOV DEC JAN FEE MAR APR MAY JUN JUL AUG SEP
1 5.79 5.77 5.64 2 5.77 5.78 5.63 3 5.78 5.78 5.634 5.76 5.77 5.635 5.73 5.75 5.63
6 5.80 5.68 5.627 5.80 5.61 5.60 8 5.78 5.59 5.609 5.82 5.58 5.59
10 5.84 5.57
11 5.85 5.5712 5.83 5.58 - 13 5.82 5.6014 5.81 5.63 15 5.78 5.65
16 5.75 5.6517 5.72 5.6518 5.72 5.65 19 5.71 5.65 20 5.70 5.65
21 5.71 5.6522 5.71 5.65 23 5.73 5.65 24 5.79 5.6525 5.80 5.65
26 5.79 5.65 27 5.80 5.65 28 5.79 5.65 29 5.79 5.6430 5.78 5.64 31 5.77
MEAN 5.77 5.65 MAX 5.85 5.78 ---MIN 5.70 5.57
5
555
66665
55555
___
___
.49
___
.87
.93
.98
.04
.04
.04
.00
.99
.98
.98
.96
.95
.91---
_________
55.5,5,5,
5,5,5,5,5,
5,5,5,5,5,
5,5,5,5,5,
5,5.5.5.5.
5.5.5.5.5.5.
5,5,5,
.90
.87
.86
.85
.87
.86
.85
.82
.81
.80
.78
.77
.76
.77
.76
.75
.73
.73
.98
.99
.99
.96
.96
.93
.87
.86
.83
.80
.80
.79
.79
.84
.99
.73
5.5.5.5.5.
5.5.5.5.5.
5.5.5.5.5.
5.5.5.5.5.
5.5.5.5.5.
5.6.6.6.6.-
5.6.5.
7887888786
8786868584
8382828079
7982858584
8684858584
9903020201--
870378
65555
55555
55555
555
55555
555555
.00
.99
.96
.94
.91
.90
.97
.97
.95
.92
.90
.93
.91
.89
.89
______.91.92.89
.89
.85
.83
.87
.86
.85
.83
.89
.87
.86
.86
_________
5,5,5,5,5,
5.5.5.5.5.
5.5.5.5.5.
5.5.5.5.5.
5.5.5.5.5.
5.5.5.5.5.5.
5.5.5.
.84
.84
.83
.81
.81
.81
.86
.83
.79
.79
.78
.78
.77
.75
.75
.74
.73
.72
.74
.73
.71
.75
.74,73,71
,70,69,68.66,66,65
.75
.86
.65
55555
55555
55555
55555
55555
55555
555
.65
.62
.65
.66
.66
.64
.63
.63
.62
.61
.60
.60
.57
.56
.54
.51
.51
.51
.50
.49
.51
.49
.49
.51
.51
.52
.53
.53
.53
.53 -
.56
.66
.49
30
454724091303600 BIG SISSABAGAMA LAKE NEAR STONE LAKE, WI--CONTINUED
WATER-QUALITY RECORDS
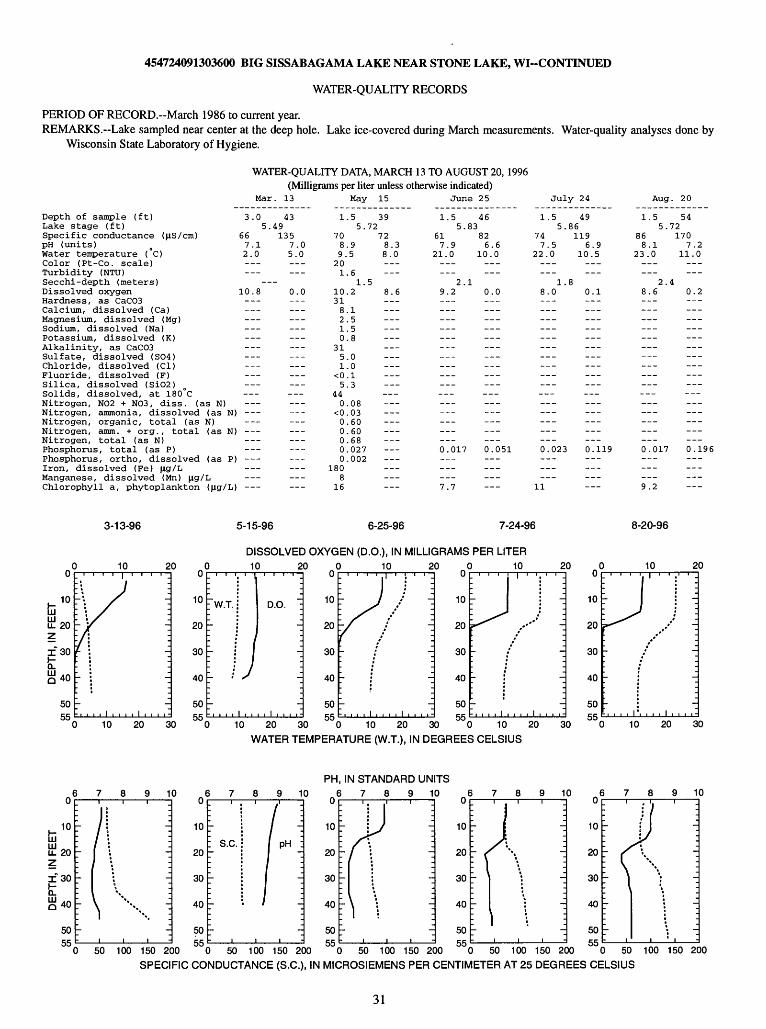
PERIOD OF RECORD.--March 1986 to current year.REMARKS.--Lake sampled near center at the deep hole. Lake ice-covered during March measurements. Water-quality analyses done by
Wisconsin State Laboratory of Hygiene.
WATER-QUALITY DATA, MARCH 13 TO AUGUST 20, 1996 (Milligrams per liter unless otherwise indicated)
Mar. 13 May 15 June 25
Depth of sample (ft)Lake stage (ft)Specific conductance ((iS/cm)pH (units)Water temperature (°C)Color (Pt-Co. scale)Turbidity (NTU)Secchi-depth (meters)Dissolved oxygenHardness, as CaCO3Calcium, dissolved (Ca)Magnesium, dissolved (Mg)Sodium, dissolved (Na)Potassium, dissolved (K)Alkalinity, as CaCO3Sulfate, dissolved (SO4)Chloride, dissolved (Cl)Fluoride, dissolved (F)Silica, dissolved (SiO2)Solids, dissolved, at 180°CNitrogen, NO2 + NO3, diss. (as N)Nitrogen, ammonia, dissolved (as N)Nitrogen, organic, total (as N)Nitrogen, amm. + org., total (as N)Nitrogen, total (as N)Phosphorus, total (as P)Phosphorus, ortho, dissolved (as P)Iron, dissolved (Fe) |ig/LManganese, dissolved (Mn) |ig/LChlorophyll a, phytoplankton (|ig/L)
July 24 Aug. 20
3.0
667.12.0___
10.8
)
) ___
)
435.49
1357.05.0______
0.0____________
___
___
____________
___
1
7089.201
10318210
3151
<05
440
<000000
180
.55.
.95
.61.
.2
.1
.5
.5
.8
.0
.0
.1
.3
.08
.03
.60
.60
.68
.027
.002
3972
728.38.0
58.6
______
___
1.55.
617.9
21.0
___2.
9.2___
_______________________________________0.017______
4683
826.6
10.0______
10.0
______________________________
____________0.051
___
1.55.
747.5
22.0
___1.
8.0
________________________
_________0.023___
4986119
610--
80----------- -----0--
.9.5
.1 -- -- --.119 --
1.55.
868.1
23.0
2.
8.6___
____________---___
___
___0.017
___
5472170
7.211.0______
40.2________________________
---
______
___0.19------
16 7.7 11 9.2
I 30t g40
5055
III ui 20
I 30t g40
50
3-13-96 5-15-96 6-25-96 7-24-96
DISSOLVED OXYGEN (D.O.), IN MILLIGRAMS PER LITER10 20
10 20 30
10
10 20 10 20 10 20
10
8-20-96
10 20
D.O. :
-_
-_
20 3
VATER TE
) 9 1
I PH :
I!
u
10
20
30
40
5055
0 C
MPER>
PH0 o'
10
20
30
40
50 «;«;
- J)"\
7 / -j/ ~-l -.
-_) 10 20 3
\TURE (W.T.), IN DE
, IN STANDARD UN 37891
[^ I'- -_
h \ \
u
10
20
30
40
5055
0 C
1GREEJ
TS0 o f
10
20
30
40
50 KK
:'T""j
r^^ ' '" ~:
~.
-m
-, , , , i , , , , i , , , ,-) 10 20 3
3 CELSIUS
37891j':- I ] 1-
L > l> jIII-
u
10
20
30
40
50o 55 c
0 o (
10
20
30
40
50 e;e;
_'J""'j
r^^ / \-.-_-_
) 10 20 3(
5 7 8 9 K
l'J i" \ ': \
i -
0 50 100 150 200 0 50 100 150 200 0 50 100 150 200 "0 50 100 150 200 0 50 100 150 200
SPECIFIC CONDUCTANCE (S.C.), IN MICROSIEMENS PER CENTIMETER AT 25 DEGREES CELSIUS
31

U)
S3
SE
CC
HI
DE
PT
H,
IN M
ET
ER
S
*>.
co
ro
-^
CH
LOR
OP
HY
LL a
CO
NC
EN
TR
AT
ION
, IN
MIC
RO
GR
AM
S P
ER
LIT
ER
in
o
ui
o
TO
TA
L P
HO
SP
HO
RU
S C
ON
CE
NT
RA
TIO
N,
IN M
ILLI
GR
AM
S P
ER
LIT
ER
p
p
p
p
b
b
b
o
-
ro
co
K
i O)
C/3 c
_^^»
(0
Q
) 03
Q.
0
^
CD
<1>
IS «
»
80"°
°°
CQ
'"D
_T
to
Cfl
o
1
c/>
p
w
wcr
JD
(Q
Q.
%Q
} O
5
c~)
o
»
0
m
£f
1 i
" <
sCD
JD
3
Ǥ
io
oZJ
CD
E7 3
i
0*
s:
w
^
Qj
£
W
3
<p8
°-u
0)
W
CD
5'
o
...0
«oZ
8 ii
! i*
:
"
. 1
=
= E
i*
j
! "'
1
1 "
'"
1
i .
i I
\
\
\ '
'
\
1 '
" 1
i O) i -Nj i 00 i (O (O s i i N> (0 i (O
(0 01 (O
(O
0)
=
:=
*
: :
*
:
=
::
: :
:
:
:
!
\
-
-
\ '
\-
-
-
:
i
:
=
:
1 "
i
\ '
'
\:
:
!
!
| '
.'
|
f "
i
1
"
1
i 0) i -sj i o> i (O I (O
(O i i co i .p- co 8 i! *
"
!-
m -
\ *
.
\
:
:
! "
\
\ '
** \
-
-
I
\
!
'
1
i
..
i:
:
i "
1
1" "
1
\ '
'
\
1 :
|
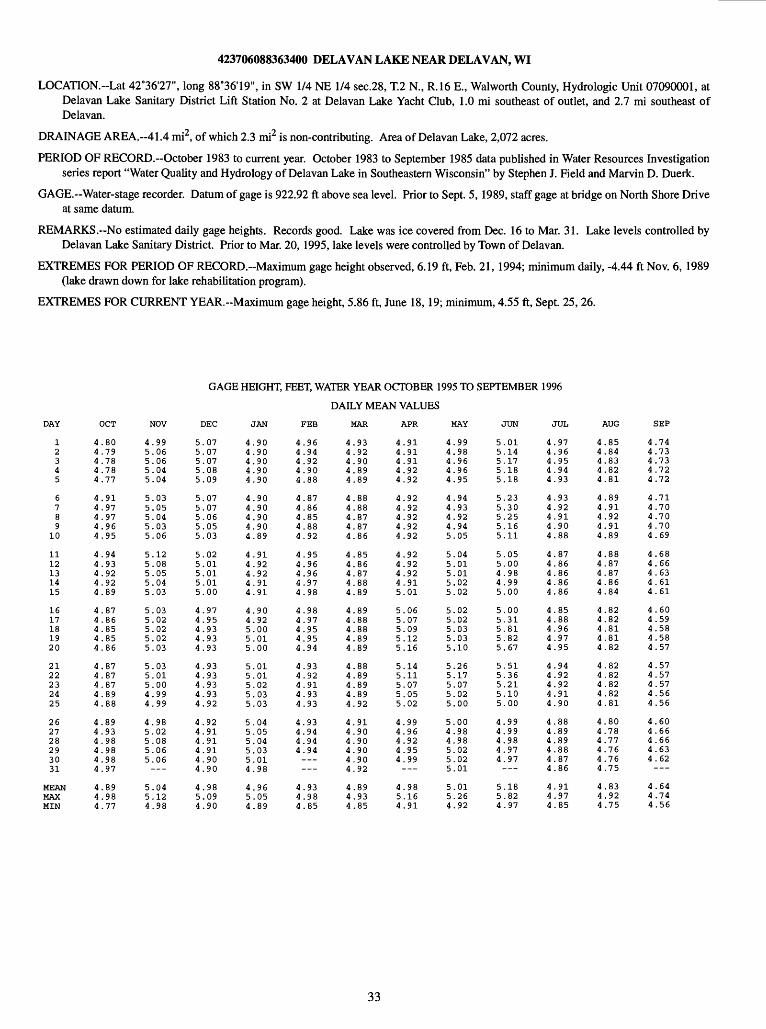
423706088363400 DELAVAN LAKE NEAR DELAVAN, WI
LOCATION.--Lat 42°36'27", long 88°36'19", in SW 1/4 NE 1/4 sec.28, T.2 N., R.16 E., Walworth County, Hydrologic Unit 07090001, at Delavan Lake Sanitary District Lift Station No. 2 at Delavan Lake Yacht Club, 1.0 mi southeast of outlet, and 2.7 mi southeast of Delavan.
DRAINAGE AREA.--41.4 mi2 , of which 2.3 mi2 is non-contributing. Area of Delavan Lake, 2,072 acres.
PERIOD OF RECORD.-October 1983 to current year. October 1983 to September 1985 data published in Water Resources Investigation series report "Water Quality and Hydrology of Delavan Lake in Southeastern Wisconsin" by Stephen J. Field and Marvin D. Duerk.
GAGE.-Water-stage recorder. Datum of gage is 922.92 ft above sea level. Prior to Sept. 5,1989, staff gage at bridge on North Shore Drive at same datum.
REMARKS. No estimated daily gage heights. Records good. Lake was ice covered from Dec. 16 to Mar. 31. Lake levels controlled by Delavan Lake Sanitary District. Prior to Mar. 20,1995, lake levels were controlled by Town of Delavan.
EXTREMES FOR PERIOD OF RECORD.-Maximum gage height observed, 6.19 ft, Feb. 21, 1994; minimum daily, -4.44 ft Nov. 6,1989 (lake drawn down for lake rehabilitation program).
EXTREMES FOR CURRENT YEAR.-Maximum gage height, 5.86 ft, June 18,19; minimum, 4.55 ft, Sept. 25, 26.
DAY OCT NOV
GAGE HEIGHT, FEET, WATER YEAR OCTOBER 1995 TO SEPTEMBER 1996
DAILY MEAN VALUES
DEC JAN FEE MAR APR MAY JUN JUL AUG
12345
6789
10
1112131415
1617181920
2122232425
262728293031
MEANMAXMIN
4.804.794.784.784.77
4.914.974.974.964.95
4.944.934.924.924.89
4.874.864.854.854.86
4.874.874.874.894.88
4.894.934.984.984.984.97
4.894.984.77
4.995.065.065.045.04
5.035.055.045.035.06
5.125.085.055.045.03
5.035.025.025.025.03
5.035.015.004.994.99
4.985.025.085.065.06
5.045.124.98
5.075.075.075.085.09
5.075.075.065.055.03
5.025.015.015.015.00
4.974.954.934.934.93
4.934.934.934.934.92
4.924.914.914.914.904.90
4.985.094.90
4.904.904.904.904.90
4.904.904.904.904.89
4.914.924.924.914.91
4.904.925.005.015.00
5.015.015.025.035.03
5.045.055.045.035.014.98
4.965.054.89
4.964.944.924.904.88
4.874.864.854.884.92
4.954.964.964.974.98
4.984.974.954.954.94
4.934.924.914.934.93
4.934.944.944.94
4.934.984.85
4.934.924.904.894.89
4.884.884.874.874.86
4.854.864.874.884.89
4.894.884.884.894.89
4.884.894.894.894.92
4.914.904.904.904.904.92
4.894.934.85
4.914.914.914.924.92
4.924.924.924.924.92
4.924.924.924.915.01
5.065.075.095.125.16
5.145.115.075.055.02
4.994.964.924.954.99
4.985.164.91
4.994.984.964.964.95
4.944.934.924.945.05
5.045.015.015.025.02
5.025.025.035.035.10
5.265.175.075.025.00
5.004.984.985.025.025.01
5.015.264.92
5.015.145.175.185.18
5.235.305.255.165.11
5.055.004.984.995.00
5.005.315.815.825.67
5.515.365.215.105.00
4.994.994.984.974.97
5.185.824.97
4.974.964.954.944.93
4.934.924.914.904.88
4.874.864.864.864.86
4.854.884.964.974.95
4.944.924.924.914.90
4.884.894.894.884.874.86
4.914.974.85
4.854.844.834.824.81
4.894.914.924.914.89
4.884.874.874.864.84
4.824.824.814.814.82
4.824.824.824.824.81
4.804.784.774.764.764.75
4.834.924.75
4.744.734.734.724.72
4.714.704.704.704.69
4.684.664.634.614.61
4.604.594.584.584.57
4.574.574.574.564.56
4.604.664.664.634.62___
4.644.744.56
33

423556088365001 DELAVAN LAKE AT CENTER NEAR DELAVAN LAKE, WI
LOCATION.-Lat 42°35'56", long 88°36'50", in SE 1/4 SW 1/4, sec.28, T.2 N., R.16 E., Walworth County, Hydrologic Unit 07090001,2.6 mi southeast of Delavan.
DRAINAGE AREA.-41.4 mi2, of which 2.3 mi2 is non-contributing. PERIOD OF RECORD.-October 1983 to current year. REMARKS. Lake ice-covered during February measurements. Water-quality analyses done by the U.S. Geological Survey National Water
Quality Laboratory.
WATER-QUALITY DATA, NOVEMBER 22, 1995 TO MAY 13, 1996 (Milligrams per liter unless otherwise indicated)
Nov. 22 Feb. 29 Apr. 22 May 13
Depth of sample (ft)Lake stage (ft)Specific conductancepH (units)Water temperature (°C)Color (Pt-Co. scale)Turbidity (NTU)Secchi-depth (meters)Dissolved oxygenHardness, as CaCO3Calcium, dissolved (Ca)Magnesium, dissolved (Mg)Sodium, dissolved (Na)Potassium, dissolved (K)Alkalinity, as CaCO3Sulfate, dissolved (SO4)Chloride, dissolved (Cl)Fluoride, dissolved (F)Silica, dissolved (SiO2)Solids, dissolved, at 180 CNitrogen, N02 + NO3, diss. (as N)Nitrogen, ammonia, dissolved (as N)Nitrogen, amm. + org., total (as N)Nitrogen, total (as N)Phosphorus, total (as P)Phosphorus, ortho, dissolved (as P)Iron, dissolved (Fe) jig/LManganese, dissolved (Mn) jig/LChlorophyll a, phytoplankton (jig/L)
11-22-95
1.5 5.
5788.14.0
4.11.7______
0.24 0.600.840.0780.066___ 1.7
53 ,01580
84--
,911-----------.----00---
.4.0--
.0-- -- ---- -- --.086.042--
1
56383--
19----------_.000000-_8
.5 4,
.8.0 --
2..8-----_---_ --.21.00.60.81.069.001--__.9
53 .94920
7.54.0
.1
0.6
____________
___
0.2400.190
1
5928870
112404333263
190306000
320--0000
1091
.5 5
.4.5
.306
.3
.2
.6
----.70.70.071.032
.2
53 .11595
87100
.410
2404332263
190306000
317--0000
128-
.3.5
.30
.6
.2
.8
-- .80.80.086.012
1.5 5,
5978.3
11.0
8,10.3______
0.250.050.600.850.0690.043
0.2
53 .01606
8.19.5
.1
8.1
_______________
___
0.0840.055______
10 20u
H 1 °LLJ
u! 20Z
I 30
Q.g40
50KK
iiii,
: W.T.
:-:-
- , i i , i i i i
, , , , _
-i-;
D.o. :
j. 1 1 1 1 1 -
0 10 20
40 40
2-29-96 4-22-96
DISSOLVED OXYGEN (D.O.), IN MILLIGRAMS PER LITER
0 10 200 . {< i i i | . . . . 0
10 L (- 10
20 - / - 20
30 - ^S - 30
10 20 30 0 10 20 30 0 10 20 30 0
WATER TEMPERATURE (W.T.), IN DEGREES CELSIUS
5-13-96
10 20u
10
20
30
40
50KK
-
-
-
~
~7
/
-_
-_
-_
~_
10 20 30
PH, IN STANDARD UNITS
10 8 10 10 8 9 10U
t"
ui 20Z
I 30
§40
50
5!(
;' \
-
S.C.
'- |
X) 750
PH :
;-
-_
-m
1,0
u
10
20
30
40
50
55 IOO 5(
i 1 ' 71- 1 -- 1 -
\ \l ~:r /- --... -
)0 750 1 ,C
U
10
20
30
40
50
55 IOO 5(
'-
-
'-
'-
X) 750
-_
-
-
-_
-_
1,0
u
10
20
30
40
50
00 5(
'-
-
-
)
X) 750
-j
I-
-j
-
1,0
SPECIFIC CONDUCTANCE (S.C.), IN MICRO-SIEMENS PER CENTIMETER AT 25 DEGREES CELSIUS
34
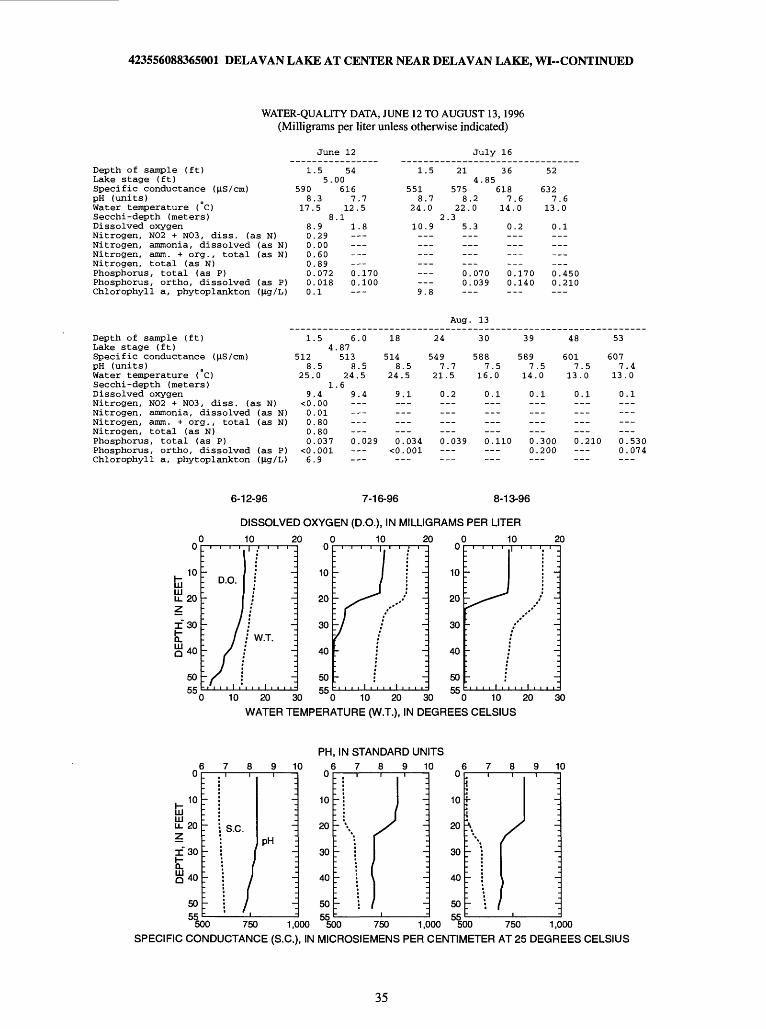
423556088365001 DELAVAN LAKE AT CENTER NEAR DELAVAN LAKE, WI--CONTINUED
WATER-QUALITY DATA, JUNE 12 TO AUGUST 13, 1996 (Milligrams per liter unless otherwise indicated)
June 12 July 16
Depth of sample (ft)Lake stage (ft)Specific conductance (|iS/cm)pH (units)Water temperature (°C)Secchi-depth (meters)Dissolved oxygenNitrogen, N02 + N03, diss. (as N)Nitrogen, ammonia, dissolved (as N)Nitrogen, amm. + org., total (as N)Nitrogen, total (as N)Phosphorus, total (as P)Phosphorus, ortho, dissolved (as P)Chlorophyll a, phytoplankton (|ig/L)
1
5908
17.
80000000
.5 5.C
.35
8..9.29.00.60
.072
.018
.1
54 )0616
712
.11
00-
.7.5
.8
.170
.100--
1.5
5518.7
24.0
10.9
___
9.8
21
5758
222.3
5
00-
4.85
.2.0
.3
.070
.039--
36
6187
14
0
00-
.6.0
.2
.170
.140--
52
6327
13
0
00-
.6.0
.1
.450
.210--
Depth of sample (ft)Lake stage (ft)Specific conductance (|iS/cm)pH (units)Water temperature (°C)Secchi-depth (meters)Dissolved oxygenNitrogen, N02 + N03, diss. (as N)Nitrogen, ammonia, dissolved (as N)Nitrogen, amm. + org., total (as N)Nitrogen, total (as N)Phosphorus, total (as P)Phosphorus, ortho, dissolved (as P)Chlorophyll a, phytoplankton (|ig/L)
1
512 8
25.
9<0 000 0
<0 P.
.54,
.5 0
1. .4.00 .01
.037
.001Q
6 .87 513
8 24
.6 9
0
.0
.5 .5
.4
.029
18
514 8
24.
9
0, <0,
.5 5
.1
.034
.001
Aug
24
549 7.7
21.5
0.2
0.039
. 13
30
588 7.5
16.0
0.1
0.110
39
589 7
14.
0
0 0
.5 0
.1
.300
.200
48
601 7.5
13.0
0.1
0.210
53
607 7
13.
0
0 0
.4 0
.1
.530
.074
6-12-96 7-16-96 8-13-96
0°
HI
ui 20Z
130
Q.
£40
50
66 (
)
D.O.
-
/
- J
V | j
) 10
10 2
-_
-
j -
; -_
1 w.T. :
i
20 3
DISSOLVED OXYGEN (D.O.), IN MILLIGRAMS PER LITER
0 10 20 .0 10 20
0 10 20 30 0 10 20
WATER TEMPERATURE (W.T.), IN DEGREES CELSIUS
30
PH, IN STANDARD UNITS 789 10 6789 10 6789 10
u
I- 10iuLUu. 20Z
I 30
Q.
£40
50 cc
5
1 '
L.
~ S.C.
i30 750
1
_I-__-
pH ;-
~,-_
-_
1,0 00
u
10
20
30
40
50
5!(
-
r ..
'7
7
r)0
H-m
-_
-_
750 1,0
u
10
20
30
40
50
00 5(
i-
X'7
'r
r . /
)0
)
750
-_
-_
-_
-_
-_
1,0 00SPECIFIC CONDUCTANCE (S.C.), IN MICROSIEMENS PER CENTIMETER AT 25 DEGREES CELSIUS
35

SECCHI DEP
TH,
IN METERS
oo
CD
*.
ro
o
CH
LOR
OP
HY
LL a
C
ON
CE
NT
RA
TIO
N,
IN M
ICR
OG
RA
MS
PE
R L
ITE
RT
OT
AL
PH
OS
PH
OR
US
CO
NC
EN
TR
AT
ION
,IN
MIL
LIG
RA
MS
PE
R L
ITE
R
p
o
p
o
p
p'
(Circles indica
te labora
tory detection
limit
for
selected
analyses. Actu
al concentra
tions for
these
particular
analyses are less
than
the
plotted circle
s.)
36
Surface
total
phosphorus and
chlorop
hyll a concentrations, and
Secch
i dept
hs for
Delavan
Lake
at
Center
near Delavan
Lake,
Wisconsin.
CO s ! CD
01 1 i Nl CO
C
D
CD
>
_L
r~
co
m
co
z
co
O > m
co
>
o33
1 1 CO
CO
CO 1 01 CO
m
T
V
»}»
'»
.
"
.
.
'
9
;
. 1
,1,1,1,1,
"
sf *
rn
w
s1
1
*; *./.
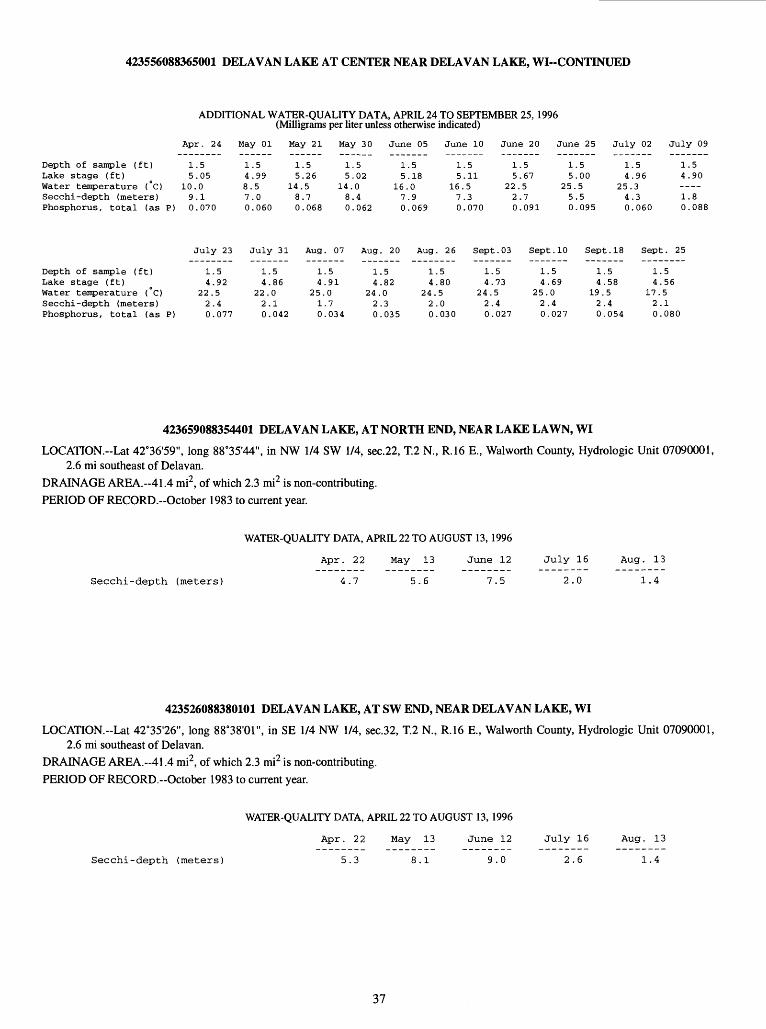
423556088365001 DELAVAN LAKE AT CENTER NEAR DELAVAN LAKE, WI--CONTINUED
ADDITIONAL WATER-QUALITY DATA, APRIL 24 TO SEPTEMBER 25, 1996 (Milligrams per liter unless otherwise indicated)
Apr. 24 May 01 May 21 May 30 June 05 June 10 June 20 June 25 July 02 July 09
Depth of sample (ft) Lake stage (ft) Water temperature (°C) Secchi-depth (meters) Phosphorus, total (as P)
July 23 July 31 Aug. 07 Aug. 20 Aug. 26 Sept.03 Sept.10 Sept.18 Sept. 25
Depth of sample (ft)Lake stage (ft)Water temperature (°C)Secchi-depth (meters)Phosphorus, total (as P) 0.077 0.042 0.034 0.035 0.030 0.027 0.027 0.054 0.080
1.55.05
10.09.10.070
1.54.998.57.00.060
1.55.26
14.58.70.068
1.55.02
14.08.40.062
1.55.18
16.07.90.069
1.55.11
16.57.30.070
1.55.67
22.52.70.091
1.55.00
25.55.50.095
1.54.96
25.34.30.060
1.54.90
1.80.088
1.54.92
22.52.4
1.54.86
22.02.1
1.54.91
25.01.7
1.54.82
24.02.3
1.54.80
24.52.0
1.54.73
24.52.4
1.54.69
25.02.4
1.54.58
19.52.4
1.54.56
17.52.1
423659088354401 DELAVAN LAKE, AT NORTH END, NEAR LAKE LAWN, WI
LOCATION.--Lat 42°36'59", long 88°35'44", in NW 1/4 SW 1/4, sec.22, T.2 N., R.16 E., Walworth County, Hydrologic Unit 07090001,2.6 mi southeast of Delavan.
DRAINAGE AREA.--41.4 mi2, of which 2.3 mi2 is non-contributing. PERIOD OF RECORD.-October 1983 to current year.
WATER-QUALITY DATA, APRIL 22 TO AUGUST 13, 1996
Apr. 22 May 13 June 12 July 16 Aug. 13
Secchi-depth (meters) 4.7 5.6 7.5 2.0 1.4
423526088380101 DELAVAN LAKE, AT SW END, NEAR DELAVAN LAKE, WI
LOCATION.-Lat 42°35'26", long 88°38'01", in SE 1/4 NW 1/4, sec.32, T.2 N., R.16 E., Walworth County, Hydrologic Unit 07090001,2.6 mi southeast of Delavan.
DRAINAGE AREA.-41.4 mi2 , of which 2.3 mi2 is non-contributing. PERIOD OF RECORD.-October 1983 to current year.
WATER-QUALITY DATA, APRIL 22 TO AUGUST 13, 1996
Apr. 22 May 13 June 12 July 16 Aug. 13
Secchi-depth (meters) 5.3 8.1 9.0 2.6 1.4
37
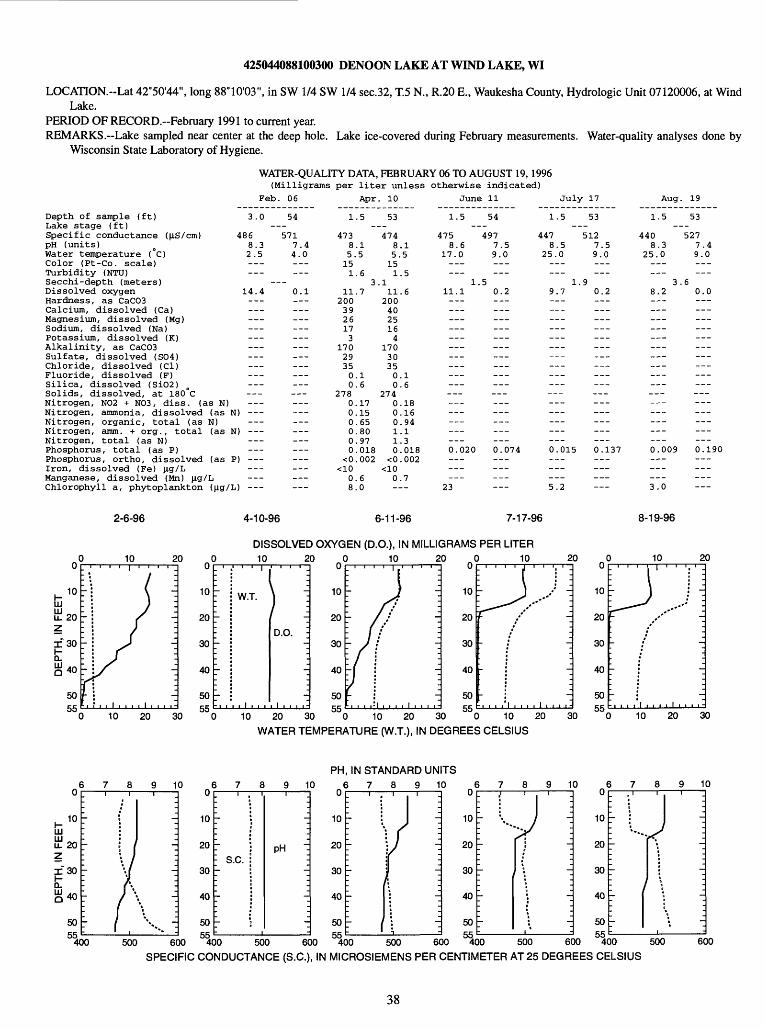
425044088100300 DENOON LAKE AT WIND LAKE, WI
LOCATION.--Lat 42°50144", long 88°10'03", in SW 1/4 SW 1/4 sec.32, T.5 N., R.20 E., Waukesha County, Hydrologic Unit 07120006, at WindLake.
PERIOD OF RECORD.-February 1991 to current year. REMARKS.-Lake sampled near center at the deep hole. Lake ice-covered during February measurements. Water-quality analyses done by
Wisconsin State Laboratory of Hygiene.
WATER-QUALITY DATA, FEBRUARY 06 TO AUGUST 19,1996(Milligrams per liter unless otherwise indicated)
Feb. 06
Depth of sample (ft)Lake stage (ft)Specific conductancepH (units)Water temperature (°C)Color (Pt-Co. scale)Turbidity (NTU)Secchi-depth (meters)Dissolved oxygenHardness, as CaCO3Calcium, dissolved (Ca)Magnesium, dissolved (Mg)Sodium, dissolved (Na)Potassium, dissolved (K)Alkalinity, as CaCO3Sulfate, dissolved (SO4)Chloride, dissolved (Cl)Fluoride, dissolved (F)Silica, dissolved (SiO2)Solids, dissolved, at 180 CNitrogen, NO2 + NO3, diss. (as N)Nitrogen, ammonia, dissolved (as N)Nitrogen, organic, total (as N)Nitrogen, amm. + org., total (as N)Nitrogen, total (as N)Phosphorus, total (as P)Phosphorus, ortho, dissolved (asIron, dissolved (Fe) ng/LManganese, dissolved (Mn) ng/LChlorophyll a, phytoplankton ([ig/L)
Apr. 10 June 11 July 17 Aug. 19
3.0
4868.32.5______
14.4_________
___
___
[)
[)
___,)
54
5717.44.0
___0.1
___
___
___
___
1
47385.151
112003926173
170293500
278000000
<0
08
.5
.15
.63
.7
.1
.6
.17
.15
.65
.80
.97
.018
.002
.6
.0
53
47485151
.111
2004025164
170303500
274000110
<0
0-
.1.5
.5
.6
.1
.6
.18
.16
.94
.1
.3
.018
.002
.7--
1.5
4758.6
17.0
111.1
___
---
0.020
___23
54
4977.59.0______
.50.2
______
___
0.074
______
1.5
4478.5
25.0
19.7___
___
---
0.015
___5.2
53
5127.59.0
.9
0.2
_________
0.137___
1.5
4408.3
25.0______
38.2
_________
_______________------___---
0.009
___3.0
53
5277.49.0___
.60.0
---______
___
0.190
___
2-6-96 4-10-96 6-11-96 7-17-96
DISSOLVED OXYGEN (D.O.), IN MILLIGRAMS PER LITER10 10 20
u
10
20
30
40
50KC;
-
-
-
_, ,
W.T.
i i i i i i
) jD.O. ;
^
-I
i 1 i i i i-
10 20 30
10 20 10 20
10 20 30
u
10
20
30
40
50KK
-J ) \r/ ''--~_~_~_10 20 30
WATER TEMPERATURE (W.T.), IN DEGREES CELSIUS
PH, IN STANDARD UNITS
8-19-96
10
10
20
20 30
(
10
u! 20Z
r so
HI ,n Q 40
50££
57891
J
; } ]- A \\ I , v -j
0 (0
10
20
30
40
50££
5 7 8
1
: s.c.
'7
j-
9 1
-I
pH -
-_
-_
0 (0
10
20
30
40
50££
57891
j
; V i\
r I i
° j0
10
20
30
40
50 ««
5 7
\
-
-
'-
8 9 1:j\f/ :
-_
-_
0 J0
10
20
30
40
50 fifi
5 7 8 9 K
M \ ^'- -
~~ \ \ ' -- \ \ -.
'^00 500 600 "400 500 600 "400 500 600 400 500 600 400 500 600
SPECIFIC CONDUCTANCE (S.C.), IN MICROSIEMENS PER CENTIMETER AT 25 DEGREES CELSIUS
38

C
col
CD
T3
a
rr
=? Q
O
Q,
3
OI-
^~
OJ
o"
^ 1
CD
O
5"
0>
Q.
O
ro2>
§
§
IsQ
,
SE
CC
HI
DE
PT
H,
IN M
ET
ER
S
CH
LOR
OP
HY
LL a
CO
NC
EN
TR
AT
ION
, IN
MIC
RO
GR
AM
S P
ER
LIT
ER
TO
TA
L P
HO
SP
HO
RU
S C
ON
CE
NT
RA
TIO
N,
IN M
ILL
IGR
AM
S P
ER
LIT
ER
o
p
p
p
c b
'o
b
b
c
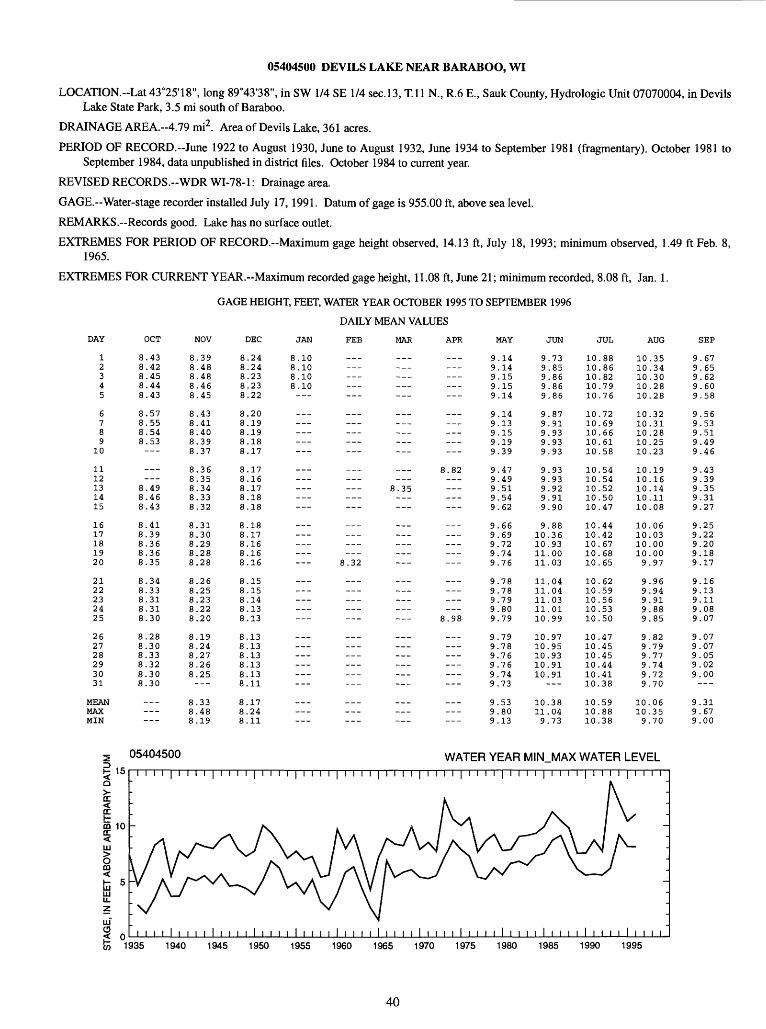
05404500 DEVILS LAKE NEAR BARABOO, WI
LOCATION.--Lat 43°25'18", long 89°43'38", in SW 1/4 SE 1/4 sec.13, T.ll N., R.6 E., Sauk County, Hydrologic Unit 07070004, in Devils Lake State Park, 3.5 mi south of Baraboo.
DRAINAGE AREA.~4.79 mi2 . Area of Devils Lake, 361 acres.
PERIOD OF RECORD.-June 1922 to August 1930, June to August 1932, June 1934 to September 1981 (fragmentary). October 1981 to September 1984, data unpublished in district files. October 1984 to current year.
REVISED RECORDS.-WDR WI-78-1: Drainage area.
GAGE.-Water-stage recorder installed July 17,1991. Datum of gage is 955.00 ft, above sea level.
REMARKS.-Records good. Lake has no surface outlet.
EXTREMES FOR PERIOD OF RECORD.-Maximum gage height observed, 14.13 ft, July 18, 1993; minimum observed, 1.49 ft Feb. 8, 1965.
EXTREMES FOR CURRENT YEAR.-Maximum recorded gage height, 11.08 ft, June 21; minimum recorded, 8.08 ft, Jan. 1.
OCT
3.433.423.453.443.43
GAGE HEIGHT, FEET, WATER YEAR OCTOBER 1995 TO SEPTEMBER 1996
DAILY MEAN VALUES
NOV DEC JAN FEB MAR APR MAY JUN
.39
.48
.48
.46
.45
.24
.24
.23
.23
.22
.10
.10
.10
.10
9.149.149.159.159.14
9.739.859.869.869.86
JUL
10.8810.8610.8210.7910.76
AUG
10.3510.3410.3010.2810.28
SEP
9.679.659.629.609.58
10
1112131415
1617181920
1.57 !.55 !.54 i.53
.49
.46
.43
.41
.39
.36
.36
.35
.43
.41
.40
.39
.37
.36
.35
.34
.33
.32
.31
.30
.29
.28
.28
.20
.19
.19
.18
.17
.17
.16
.17
.18
.18
.18
.17
.16
.16
.16
8.82
8.35
8.32
9.149.139.159.199.39
9.479.499.519.549.62
9.669.699.729.749.76
9.879.919.939.939.93
9.939.939.929.919.90
9.8810.3610.9311.0011.03
10.7210.6910.6610.6110.58
10.5410.5410.5210.5010.47
10.4410.4210.6710.6810.65
10.3210.3110.2810.2510.23
10.1910.1610.1410.1110.08
10.0610.0310.0010.009.97
9.569.539.519.499.46
9.439.399.359.319.27
9.259.229.209.189.17
2122232425
262728293031
.34
.33
.31
.31
.30
.28
.30
.33
.32
.30
.30
.26
.25
.23
.22
.20
.19
.24
.27
.26
.25
.15
.15
.14
.13
.13
.13
.13
.13
.13
.13
.11
8.98
9.789.789.799.80
9.799.789.769.769.749.73
11.0411.0411.0311.0110.99
10.9710.9510.9310.9110.91
10.6210.5910.5610.5310.50
10.4710.4510.4510.4410.4110.38
9.969.949.919.889.85
9.829.799.779.749.729.70
9.169.139.119.089.07
.07
.07
.05
.02
MEANMAXMIN
.33
.48
.19
8.178.248.11
9.539.809.13
10.3811.049.73
10.5910.8810.38
10.0610.359.70
9.319.679.00
05404500 WATER YEAR MIN MAX WATER LEVEL
10
55 1935 1940 1945 1950 1955 1960 1965 1970 1975 1980 1985 1990 1995
40

431643088243300 DRUID LAKE NEAR HARTFORD, WI
LOCATION.--Lat 43°16'43" long 88°24'33", in NW 1/4 ME 1/4 sec.6, T.9 N., R.18 E., Washington County, Hydrologic Unit 07090001, 3.2 mi southwest of Hartford.
LAKE-STAGE RECORDS
PERIOD OF RECORD.-June 1991 to current year.
GAGE. Staff gage read by Bill Noennig at his residence.
EXTREMES FOR PERIOD OF RECORD.-Maximum gage height observed, 13.22 ft, June 19, 1996; minimum observed, 10.71 ft, Sept. 21,1996.
EXTREMES FOR CURRENT YEAR.-Maximum gage height observed, 13.22 ft, June 19; minimum observed, 10.71 ft, Sept. 21.
GAGE HEIGHT, FEET, WATER YEAR OCTOBER 1995 TO SEPTEMBER 1996
DAILY MEAN VALUES
DAY OCT NOV DEC JAN FEE MAR APR MAY JUN JUL AUG SEP
1 10.932 11.57 3 10.87 10.874 5 11.03
6 7 11.13 8 12.12 11.379 12.43 11.07
10 12.43 10.82
11 12 12.01 13 11.92 11.3114 11.71 10.97 15
16 11.47 17 10.93 12.15 1 8 11.41 12.9119 13.22 11.62 20 13.04 11.17
21 12.81 10.7122 12.61 23 12.41 11.45 24 12.2125 11.13 12.03
26 2728 10.97 29 11.77 11.25 3031 10.93
41

431643088243300 DRUID LAKE NEAR HARTFORD, WI-CONTINUED
WATER-QUALITY RECORDS PERIOD OF RECORD.-February 1991 to current year.REMARKS. Lake sampled near center at the deep hole. Lake ice-covered during February measurements. Water-quality analyses done by
Wisconsin State Laboratory of Hygiene.WATER-QUALITY DATA, FEBRUARY 09 TO AUGUST 09, 1996
(Milligrams per liter unless otherwise indicated) Feb. 09 Apr. 24 June 13 July 24 Aug. 09
Depth of sample (ft)Lake stage (ft)Specific conductance (fiS/cm)pH (units)Water temperature ( C)Color (Pt-Co. scale)Turbidity (NTU)Secchi-depth (meters)Dissolved oxygenHardness, as CaCO3Calcium, dissolved (Ca)Magnesium, dissolved (Mg)Sodium, dissolved (Na)Potassium, dissolved (K)Alkalinity, as CaCO3Sulfate, dissolved (S04)Chloride, dissolved (Cl)Fluoride, dissolved (F)Silica, dissolved (Si02)Solids, dissolved, at 180°CNitrogen, NO2 + NO3, diss. (as N)Nitrogen, ammonia, dissolved (as N)Nitrogen, organic, total (as N)Nitrogen, amm. + org., total (as N)Nitrogen, total (as N)Phosphorus, total (as P)Phosphorus, ortho, dissolved (as P)Iron, dissolved (Fe) jig/LManganese, dissolved (Mn) jig/LChlorophyll a, phytoplankton (jig/L)
3.0
6018.43.0
14.0
___
n n
>>
,)
51
7237.53.5______
2.6__________________
______
___
1
6228
10350
103106835102
270302704
37400-000
<0
155
.5-
.1.0
.604
.9
.1
.7
.64
.17--.10.74.027.002
.1
53--627
86--
.19
320683692
2803027-4
3760001100
_-
.0.5 --
.5
.8
--.9
.62
.31
.69
.0
.6
.036
.004
__
1.511.
5898.4
22.5______
2.11.0---___
_____________________
______
______0.027
8.5
51.87640
7.78.5---___
.10.4____________ ___
___
0.241
1.511.
5548.2
22.5
___2.
8.3
___ ___
0.019
8.3
49.37651
7.68.5
.10.0
0.517
1.511.
5598.4
25.0______
1,9.0______
__________________ ______---______0.019---
15
47.09646
7.69.0---___
.40.2______
_______________
______
___0.493___
2-9-96 4-24-96 6-13-96 7-24-96 8-9-96
DISSOLVED OXYGEN (D.O.), IN MILLIGRAMS PER LITER10
10 20
20 00
30
10 20 10 20 10U
10
20
30
40
50££
-
-/
-
-
_i i i i
1 ' ' ' : ' ' :
x / -_i
-_
-_
-i,,,,i,,,,-
10 20 30 0 10 20 30 0 10 20 WATER TEMPERATURE (W.T.), IN DEGREES CELSIUS
30
10 20
10 20 30
u! 20zI 30
§40
50
10 10u
10
20
30
40
50 cc
1
~-
- s.c.
7
j-
7
1
-_
PH ~
-
-
-_
PH, IN STANDARD UNITS6 8 9 10 8 9 10 10
U
10
20
30
40
50«
U ) ' \- 1 -i
\ I -;i- [ \lr I? ^
u
10
20
30
40
50 55
K J ' !: y ~:\ I \: A !i- '' -I
u
10
20
30
40
50 w
'- \
r"7
j-
'-
) \-
\
\ -_
-_
600 700 800 500 600 700 800 500 600 700 800 500 600 700 800 600 700 800
SPECIFIC CONDUCTANCE (S.C.), IN MICROSIEMENS PER CENTIMETER AT 25 DEGREES CELSIUS
42
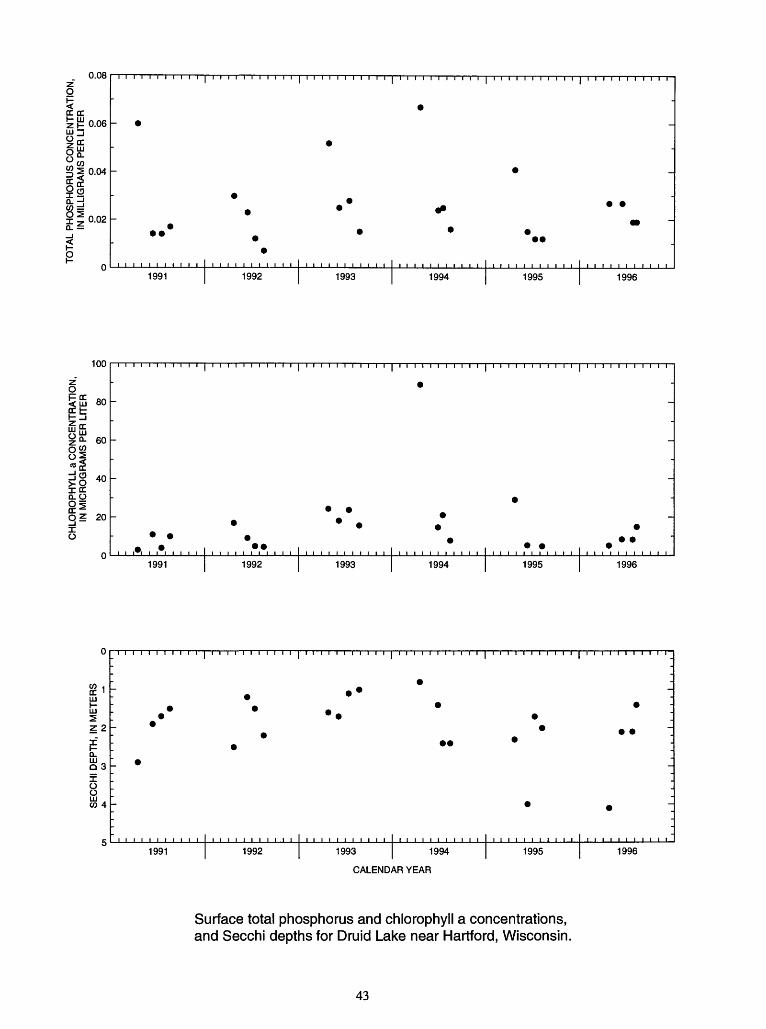
II C/5
g o
Q
§ 5
(D
TJ E
W .
mQ
- 3
?£ °
1-1
{U aO
fi$
<
(D
o
Q>
O
=f-
(/)
35'-w
SE
CC
HI
DE
PT
H,
IN M
ET
ER
SA
W
IV
) -»
O
CH
LOR
OP
HY
LL a
CO
NC
EN
TR
AT
ION
, IN
MIC
RO
GR
AM
S P
ER
LIT
ER
ro
^
o)
03
o
o
o
o
o
o
TO
TA
L P
HO
SP
HO
RU
S C
ON
CE
NT
RA
TIO
N,
IN M
ILLI
GR
AM
S P
ER
LIT
ER
p
oe
D 5 33
_
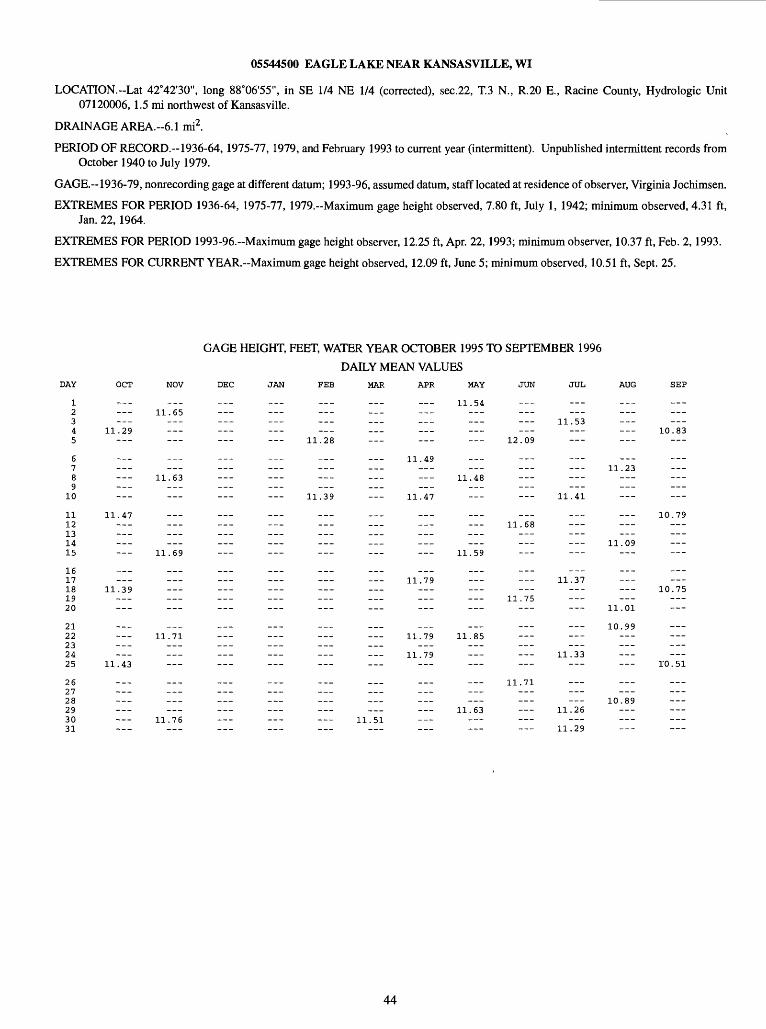
05544500 EAGLE LAKE NEAR KANSASVILLE, WI
LOCATION.--Lat 42°42'30", long 88°06'55", in SE 1/4 NE 1/4 (corrected), sec.22, T.3 N., R.20 E., Racine County, Hydrologic Unit 07120006, 1.5 mi northwest of Kansasville.
DRAINAGE AREA.--6.1 mi2 .
PERIOD OF RECORD.--1936-64, 1975-77, 1979, and February 1993 to current year (intermittent). Unpublished intermittent records from October 1940 to July 1979.
GAGE. 1936-79, nonrecording gage at different datum; 1993-96, assumed datum, staff located at residence of observer, Virginia Jochimsen.
EXTREMES FOR PERIOD 1936-64, 1975-77, 1979.-Maximum gage height observed, 7.80 ft, July 1, 1942; minimum observed, 4.31 ft, Jan. 22, 1964.
EXTREMES FOR PERIOD 1993-96.-Maximum gage height observer, 12.25 ft, Apr. 22,1993; minimum observer, 10.37 ft, Feb. 2,1993.
EXTREMES FOR CURRENT YEAR.-Maximum gage height observed, 12.09 ft, June 5; minimum observed, 10.51 ft, Sept. 25.
GAGE HEIGHT, FEET, WATER YEAR OCTOBER 1995 TO SEPTEMBER 1996
DAILY MEAN VALUESDAY OCT NOV DEC JAN FEE MAR APR MAY JUN JUL AUG SEP
1 11.54 -2 11.653 11.53 4 11.29 10.835 11.28 12.09
6 11.49 - 7 11.23 8 11.63 11.48 9
10 11.39 11.47 11.41
11 11.47 10.7912 11.68 1314 11.09 15 11.69 11.59
1617 11.79 11.37 18 11.39 10.7519 11.7520 11.01
21 10.99 22 11.71 11.79 11.85 23 24 11.79 11.3325 11.43 10.51
26 11.7127 28 10.89 ---29 11.63 11.26 30 11.76 11.51 31 11.29
44
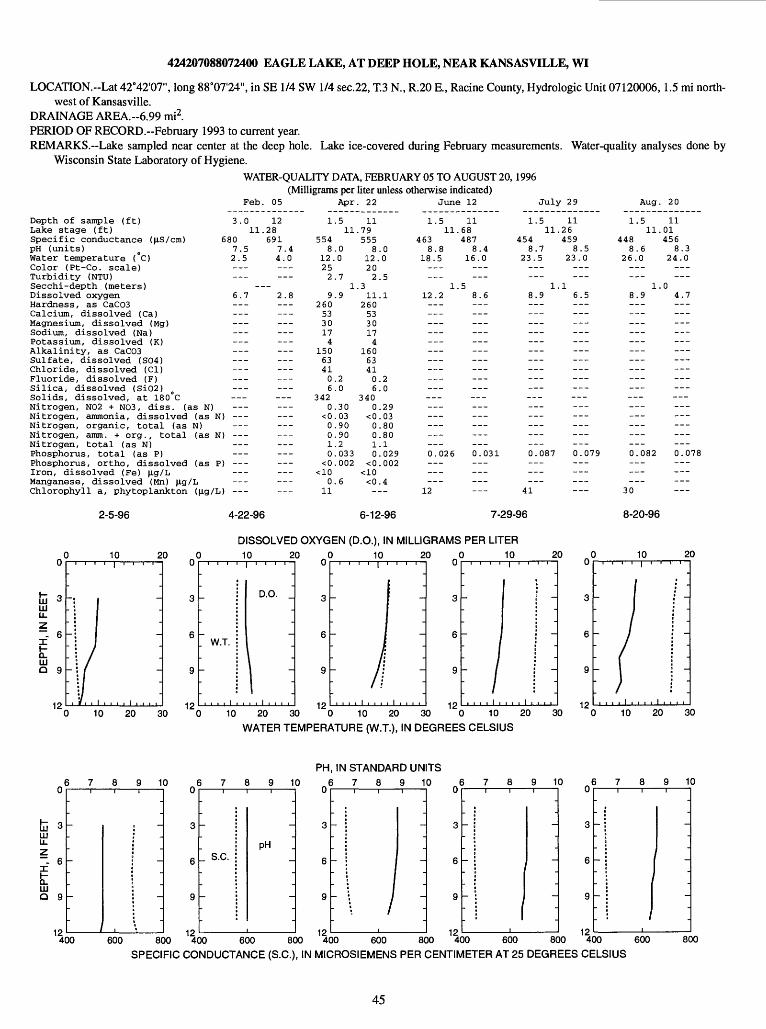
424207088072400 EAGLE LAKE, AT DEEP HOLE, NEAR KANSASVILLE, WI
LOCATION.--Lat 42°42'07", long 88°07'24", in SE 1/4 SW 1/4 sec.22, T.3 N., R.20 E., Racine County, Hydrologic Unit 07120006,1.5 mi north west of Kansasville.
DRAINAGE AREA.--6.99 mi2.PERIOD OF RECORD.-February 1993 to current year.REMARKS. Lake sampled near center at the deep hole. Lake ice-covered during February measurements. Water-quality analyses done by
Wisconsin State Laboratory of Hygiene.WATER-QUALITY DATA, FEBRUARY 05 TO AUGUST 20,1996
(Milligrams per liter unless otherwise indicated)Feb. 05 Apr. 22 June 12 July 29 Aug. 20
Depth of sample (ft)Lake stage (ft)Specific conductance (US/cm)pH (units)Water temperature (°C)Color (Pt-Co. scale)Turbidity (NTU)Secchi-depth (meters)Dissolved oxygenHardness, as CaC03Calcium, dissolved (Ca)Magnesium, dissolved (Mg)Sodium, dissolved (Na)Potassium, dissolved (K)Alkalinity, as CaC03Sulfate, dissolved (S04)Chloride, dissolved (Cl)Fluoride, dissolved (F)Silica, dissolved (Si02)Solids, dissolved, at 180°CNitrogen, N02 + N03, diss. (as N)Nitrogen, ammonia, dissolved (as N)Nitrogen, organic, total (as N)Nitrogen, amm. + org., total (as N)Nitrogen, total (as N)Phosphorus, total (as P)Phosphorus, ortho, dissolved (as P)Iron, dissolved (Fe) Jig/LManganese, dissolved (Mn) p.g/LChlorophyll a, phytoplankton
3.011
6807.52.5______
-6.7_________________________________
I)
I)
>) ---
12.28691
7.44.0______
2.8___
________________________
_____________________
1
5548
12.252
92605330174
150634106
3420
<00010
<0
.511
.00
.71
.9
.2
.0
.30
.03
.90
.90
.2
.033
.002
11.79555
812.202
.311
2605330174
160634106
3400
<00010
<0
.00
.5
.1
.2
.0
.29
.03
.80
.80
.1
.029
.002
1.511.
4638.8
18.5______
1.12.2
___
_______________ ___
0.026___
11.68487
8.416.0
.58.6
___
___
___0.031---
1.511,
4548.7
23.5______
1.8.9
---
0.087
11.26459
8.523.0___
.16.5
------__________________
---______---___0.079___
1.511
4488.6
26.0
___1
8.9
---
---___
--- 0.082---
11.01456
8.324.0
.04.7
___---___
___0.078
0.611
<0.412 41 30
2-5-96 4-22-96 6-12-96 7-29-96 8-20-96
HI UJ
~ 6
UJ Q 9
12
10 20
10 20 3012
DISSOLVED OXYGEN (D.O.), IN MILLIGRAMS PER LITER10 20
W.T.
D.O.
12
10 20
12
10
10 20 30 "0 10 20 30 0 10 20 WATER TEMPERATURE (W.T.), IN DEGREES CELSIUS
20
3012
10 20
10 20 30
PH, IN STANDARD UNITS
6 7 8 9 10 6 7 8 9 10 6 7 8 9 10 6 7 8 9 10 6 7 8 9 10u
tD 3W LJ.
z~~. 6I0_UJQ 9
124(
-
---.
.
i30
-
-- .
_
i600 8C
12
S.C.PH
12 12 12400 600 800 400 600 800 400 600 800 400 600
SPECIFIC CONDUCTANCE (S.C.), IN MICROSIEMENS PER CENTIMETER AT 25 DEGREES CELSIUS800
45
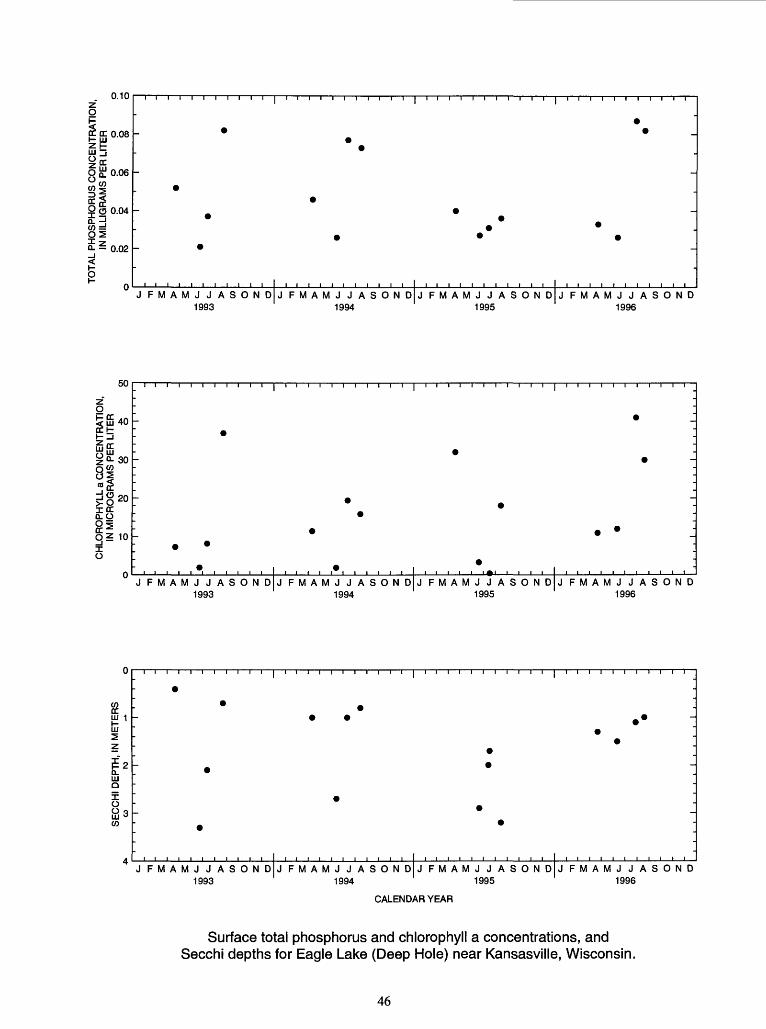
0.10
fE £ o.08
OSO.06
g (3 0.04Q.-J cod
JFMAMJJASONDJFMAMJJASONDJFMAMJJASONDJFMAMJJASOND 1993 1994 1995 1996
50
tS 40 15
308i^§20
2 10
JFMAMJJASOND 1993
J FMAMJ JASOND 1994
JFMAMJJASOND 1995
J FMAMJ JASOND 1996
JFMAMJJASOND 1993
JFMAMJJASOND JFMAMJJASOND1994 1995
JFMAMJJASOND 1996
CALENDAR YEAR
Surface total phosphorus and chlorophyll a concentrations, and Secchi depths for Eagle Lake (Deep Hole) near Kansasville, Wisconsin.
46
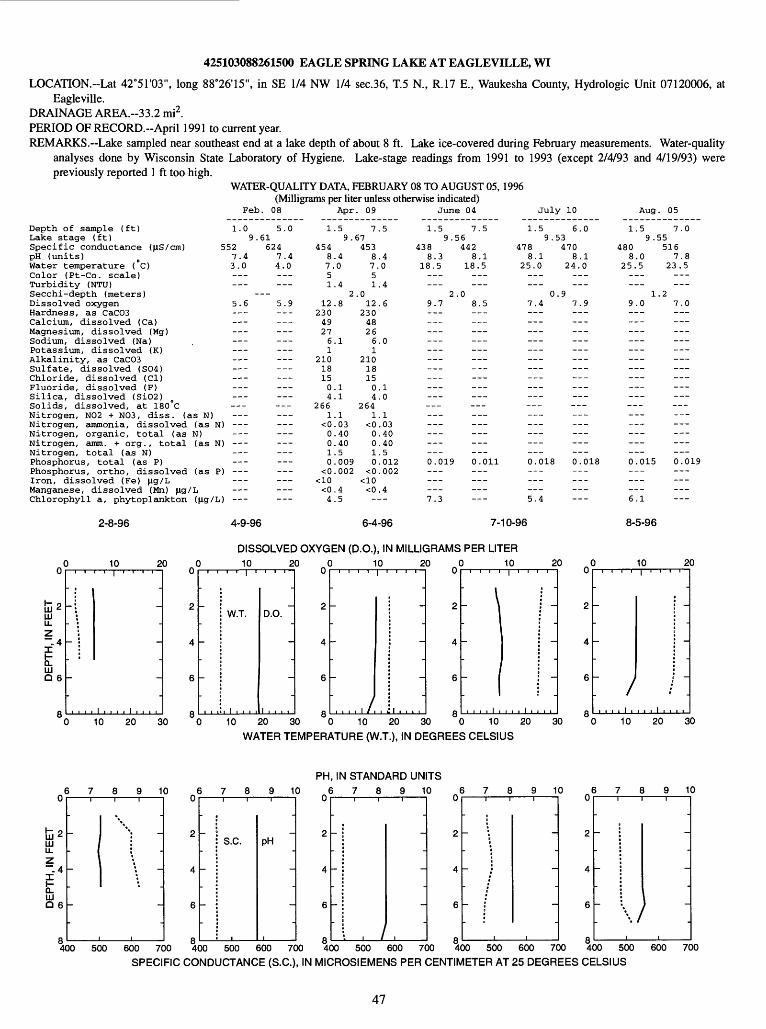
425103088261500 EAGLE SPRING LAKE AT EAGLEVILLE, WI
LOCATION.--Lat 42°51'03", long 88°26'15", in SE 1/4 NW 1/4 sec.36, T.5 N., R.17 E., Waukesha County, Hydrologic Unit 07120006, atEagleville.
DRAINAGE AREA.--33.2 mi2 . PERIOD OF RECORD.--April 1991 to current year.REMARKS. Lake sampled near southeast end at a lake depth of about 8 ft. Lake ice-covered during February measurements. Water-quality
analyses done by Wisconsin State Laboratory of Hygiene. Lake-stage readings from 1991 to 1993 (except 2/4/93 and 4/19/93) were previously reported 1 ft too high.
WATER-QUALITY DATA, FEBRUARY 08 TO AUGUST 05, 1996 (Milligrams per liter unless otherwise indicated)
Feb. 08 Apr. 09 June 04 July 10 Aug. 05
Depth of sample (ft)Lake stage (ft)Specific conductance (us/cm)pH (units)Water temperature (°C)Color (Pt-Co. scale)Turbidity (NTU)Secchi-depth (meters)Dissolved oxygenHardness, as CaC03Calcium, dissolved (Ca)Magnesium, dissolved (Mg)Sodium, dissolved (Na)Potassium, dissolved (K)Alkalinity, as CaC03Sulfate, dissolved (S04)Chloride, dissolved (Cl)Fluoride, dissolved (F)Silica, dissolved (Si02)Solids, dissolved, at 180°CNitrogen, N02 + N03, diss. (as N)Nitrogen, ammonia, dissolved (as N)Nitrogen, organic, total (as N)Nitrogen, amm. + org., total (as N)Nitrogen, total (as N)Phosphorus, total (as P)Phosphorus, ortho, dissolved (as P)Iron, dissolved (Fe) |Ag/LManganese, dissolved (Mn) (Ag/LChlorophyll a, phytoplankton (|Ag/L)
2-8-96 4-9-96 6-4-96 7-10-96 8-5-96
1.0 5.09.61
552 6247.4 7.43.0 4.0
______
5.6 5.9___
___
______
______ ______ ______ ___
I) ___
I) ___ ___
___>)
___ ___,)
1
45487.51
12230492761
210181504
2661
<00010
<0
<04
.59.
.40
.42
.8
.1
.1
.1
.1
.03
.40
.40
.5
.009
.002
.4
.5
767453
8751
.012
230482661
210181504
2641
<00010
<0
<0-
.5
.4.0
.4
.6
.0
.1
.0
.1
.03
.40
.40
.5
.012
.002
.4--
1
4388
18--
9----------- -----0-
_7
.5 7.59.56
442.3 8.1.5 18.5
__
2.0.7 8.5
______
_____
____
_____
______
.019 0.011
___.3
1.59.
4788.1
25.0
07.4
___
___
___
___0.018
___5.4
653470
824--
.97----------- -----0-
_-
.0
.1.0----
.9-------------------- ----------.018--
__--
1.59.
4808.0
25.5
19.0
0.015___
___6.1
7.055516
7.823.5______
.27.0
_________
___
---
---
______
0.019
______
DISSOLVED OXYGEN (D.O.), IN MILLIGRAMS PER LITER10 20
u
ts 2UJLL
z~ 4
I
tUJ0 6
a
_
_
_
-
_
-
I , , , , 1 , , , ,10 20 30
D 10i i i i i i
W.T.
-
-
2
D.O. ~
-
-
0 « C0
2
4
6
a
) 1
-
-
-
',,,,,/
0 2,1111
-
-
1 U 1 1 1 , 1
0 n (0
2
4
6
a
)
; \-
-
, , , , i
10 2
-
-
,..!,,,,
0 « (0
2
4
6
a
)
-
-
- J
i i i i i
10 2(
-
-
-
,.,!,,,,
0 10 20 30 "0 10 20 30 0 10 20 30
WATER TEMPERATURE (W.T.), IN DEGREES CELSIUS
10 20 30
PH, IN STANDARD UNITS 6789 10 6789 10 6789 10 6 7 8 9 10 6 7 8 9 10
~ 4
I LU 06
400
S.C. PH
8 8500 600 700 400 500 600 700 400 500 600 700 400 500 600 700 400 500 600 700
SPECIFIC CONDUCTANCE (S.C.), IN MICROSIEMENS PER CENTIMETER AT 25 DEGREES CELSIUS
47
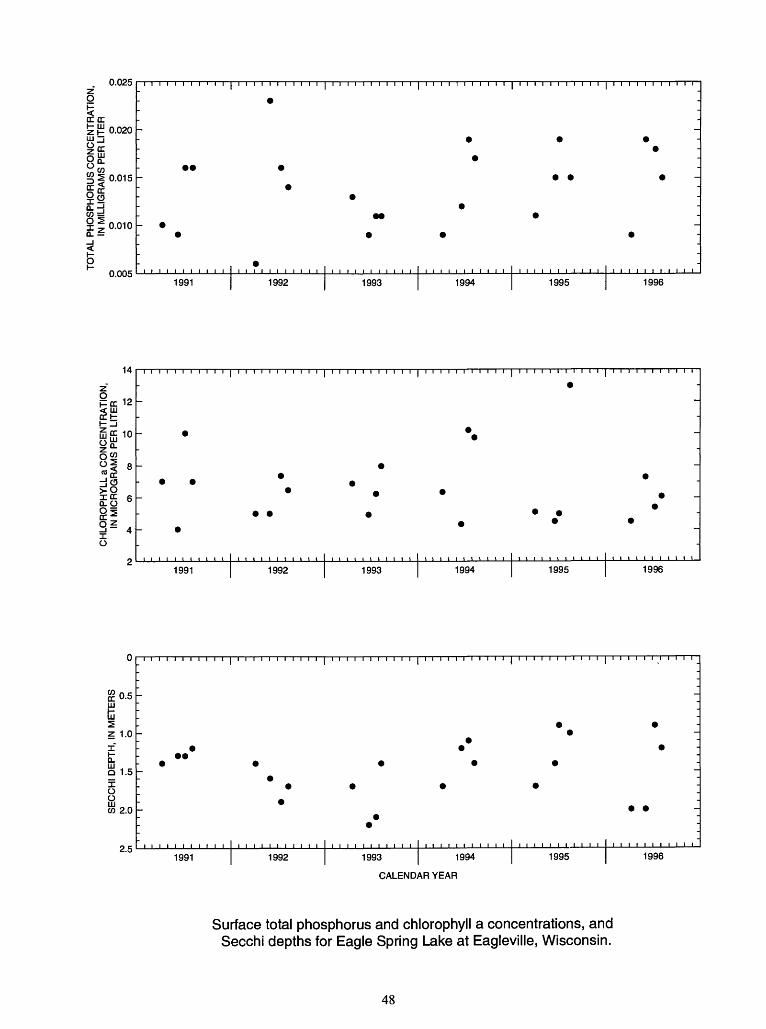
C/D
C/D
C
(D
=k
O
0)
O
O
OL.
0
-g g
w O*
W
(g |
(D
W
C/D
9>"o
5
(Qo
l§ <. o
=
(D
(D
3
to
OO
3
O
j/>
to
0)
SE
CC
HI
DE
PT
H,
IN M
ET
ER
Sro
-k
-k
o
CH
LOR
OP
HY
LL a
CO
NC
EN
TR
AT
ION
, IN
MIC
RO
GR
AM
S P
ER
LIT
ER
TO
TA
L P
HO
SP
HO
RU
S C
ON
CE
NT
RA
TIO
N,
IN M
ILLI
GR
AM
S P
ER
LIT
ER
p
p
p
p
p
§b
b
b
b
_k
_k
r\3
|0
en
o
01
o
01
$
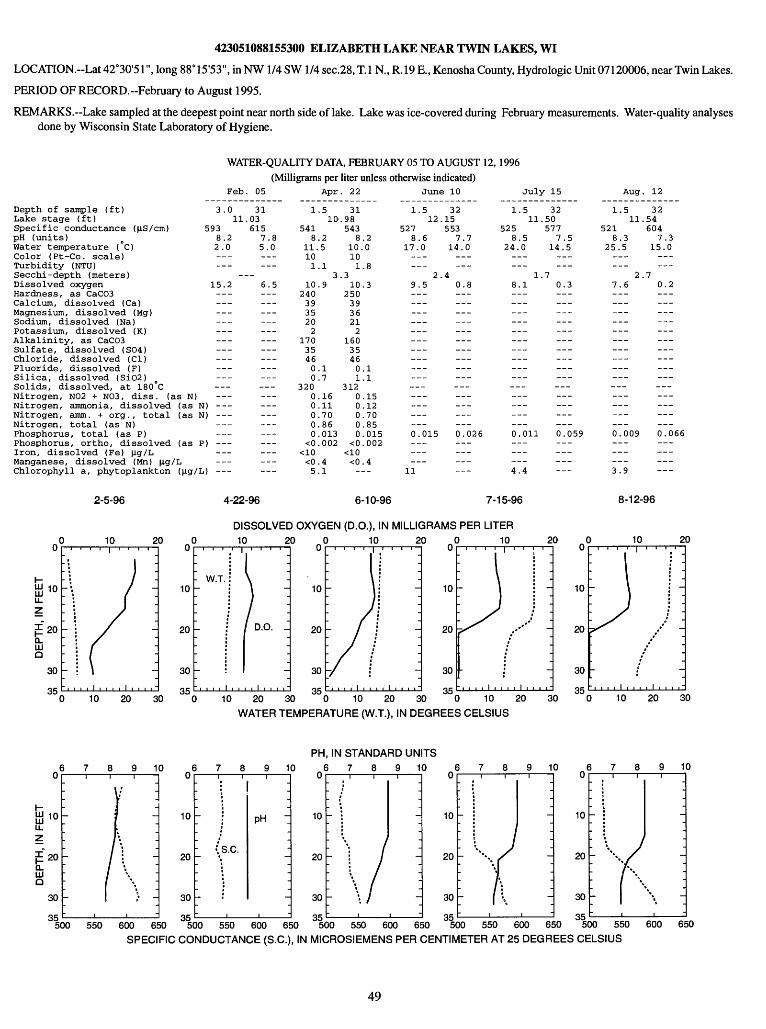
423051088155300 ELIZABETH LAKE NEAR TWIN LAKES, WI
LOCATION.-Lat 42°30'51", long 88°15'53", in NW 1/4 SW1/4 sec.28, T. 1 N., R. 19 E., Kenosha County, Hydrologic Unit 07120006, near Twin Lakes.
PERIOD OF RECORD.-February to August 1995.
REMARKS. Lake sampled at the deepest point near north side of lake. Lake was ice-covered during February measurements. Water-quality analyses done by Wisconsin State Laboratory of Hygiene.
WATER-QUALITY DATA, FEBRUARY 05 TO AUGUST 12,1996 (Milligrams per liter unless otherwise indicated)
Feb. 05 Apr. 22 June 10 July 15 Aug. 12
Depth of sample (ft)Lake stage (ft)
3.0 31 1.5 31 1.5 32 1.5 32 1.5 3211.03 10.98 12.15 11.50 11.54
Specific conductance (US/cm) 593 615 541 543 527 553 525 577 521 604pH (units)Water temperature ( C)Color (Pt-Co. scale)Turbidity (NTU)Secchi-depth (meters)Dissolved oxygenHardness, as CaCO3
8.2 7.8 8.2 8.2 8.6 7.7 8.5 7.5 8.3 7.32.0 5.0 11.5 10.0 17.0 14.0 24.0 14.5 25.5 15.0 10 10 1.1 i_ 8
3.3 2.4 1.7 2.715.2 6.5 10.9 10.3 9.5 0.8 8.1 0.3 7.6 0.2 240 250
Calcium, dissolved (Ca) --- - 39 39 --- --- --- - ---Magnesium, dissolved (Mg) --- - 35 36 --- --- --- Sodium, dissolved (Na) --- --- 20 21 --- - --- - ---Potassium, dissolved (K) 2 2 - Alkalinity, as CaCO3 170 160 - Sulfate, dissolved (SO4) 35 35 - Chloride, dissolved (Cl) 46 46 - Fluoride, dissolved (F) 0.1 0.1 - - Silica, dissolved (SiO2) . 0.7 1.1 - Solids, dissolved, at 180 C 320 312 Nitrogen, N02 + NO3, diss. (as N) - 0.16 0.15 - - - Nitrogen, ammonia, dissolved (as N) --- --- 0.11 0.12 --- - --- - Nitrogen, amm. + org.,Nitrogen, total (as NPhosphorus, total (as
total (as N) - 0.70 0.70 - 0.86 0.85
P) 0.013 0.015 0.015 0.026 0.011 0.059 0.009 0.066Phosphorus, ortho, dissolved (as P) <0.002 <0.002 - - Iron, dissolved (Fe) (i.g/L - - <10 <10 --- --- - - ---Manganese, dissolved (Mn) ng/L --- - <0.4 <0.4 --- --- - - --- ---Chlorophyll a, phytoplankton ^g/L) 5.1 11 4.4 - 3.9
2-5-96
0 10o
S 10LLzi 20IDQ
30
oc
' ' ' ' \ ' '
1
'I I I I 1 . I , I 1 Ioo 0 10 20
4-22-96 6-10-96 7-15-96 8-12-96
DISSOLVED OXYGEN (D.O.), IN MILLIGRAMS PER LITER20 0 10 20 0 10 20 0 10 20 0 10 2C
-
-
~'
-
.
u
10
20
30
oc
- W.T. \ -
; } "
- D.O. 1
~~
-
I I
u
10
20
30
oc
1111)111!
} '-.
'- 1 "f '
/ :7 I ~-,,,.!,,,, ,1,1-
u
10
20
30
oc
^ ij; '
I
. , , , I , , , , I , , , ,-
v
10
20
30
oc
: J ':
r S ~-^* '/
-, , , , i , . . . i , , , i-30 0 10 20 30 0 10 20 30 0 10 20 30 0 10 20 3(
WATER TEMPERATURE (W.T.), IN DEGREES CELSIUS
PH, IN STANDARD UNITS6 7 8 9 10 & 7 8 9 10 & 7 8 9 10 _6 7 8 9 10 _6 7 8 9 K
W 10 HI LLzjE 20Q.LUO
30
IK
HIu
10
20
30
as
: PH :; ;- (s.c. -
i i
U
10
20
30
3t;
_ _
Ivl1 1
U
10
20
30
se:
_ _
.
r -''"_
~
i i
V
10
20
30
3R
_ _
i "1 \s :/ / %e" \ '.-
i i550 600 650 500 550 600 650 500 550 600 650 500 550 600 650 500 550 600 650
SPECIFIC CONDUCTANCE (S.C.), IN MICROSIEMENS PER CENTIMETER AT 25 DEGREES CELSIUS
49
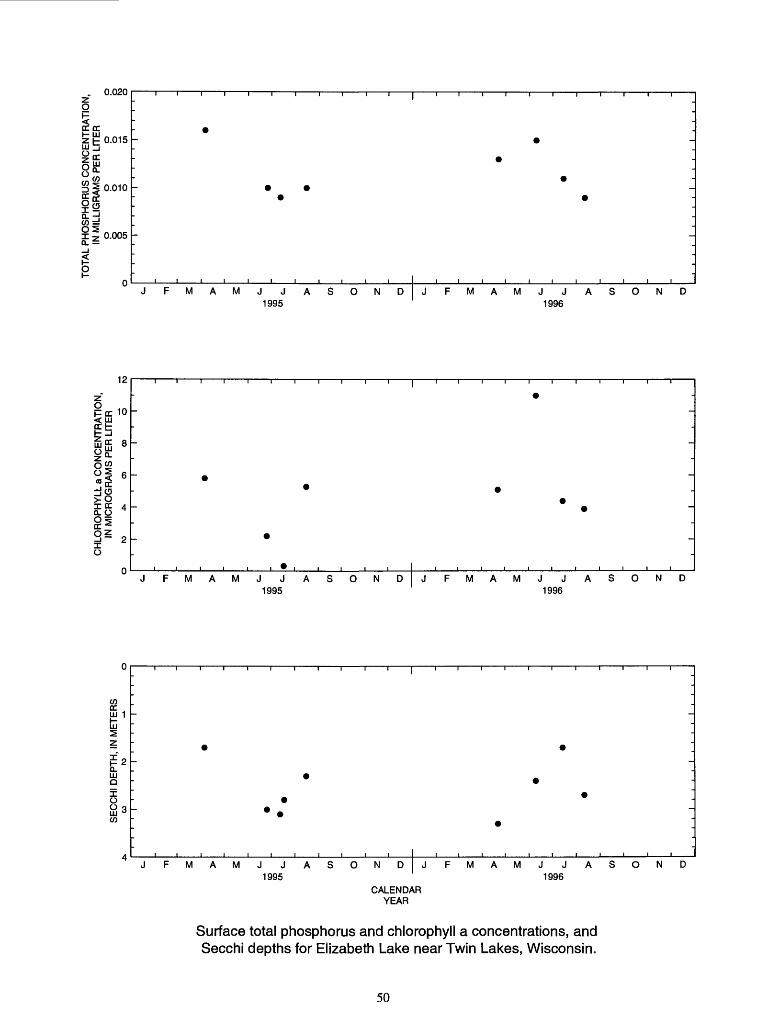
o
LH Ul 0.015
8 sw^
o:
0.010
0.005
JFMAMJ JASOND 1995
JFMAMJJASOND 1996
12
Fee 10
o
JFMAMJJASONDJFMAMJJASOND 1995 1996
i i i i iJFMAMJJASOND
1995JFMAMJ JASOND
1996
CALENDAR YEAR
Surface total phosphorus and chlorophyll a concentrations, and Secchi depths for Elizabeth Lake near Twin Lakes, Wisconsin.
50
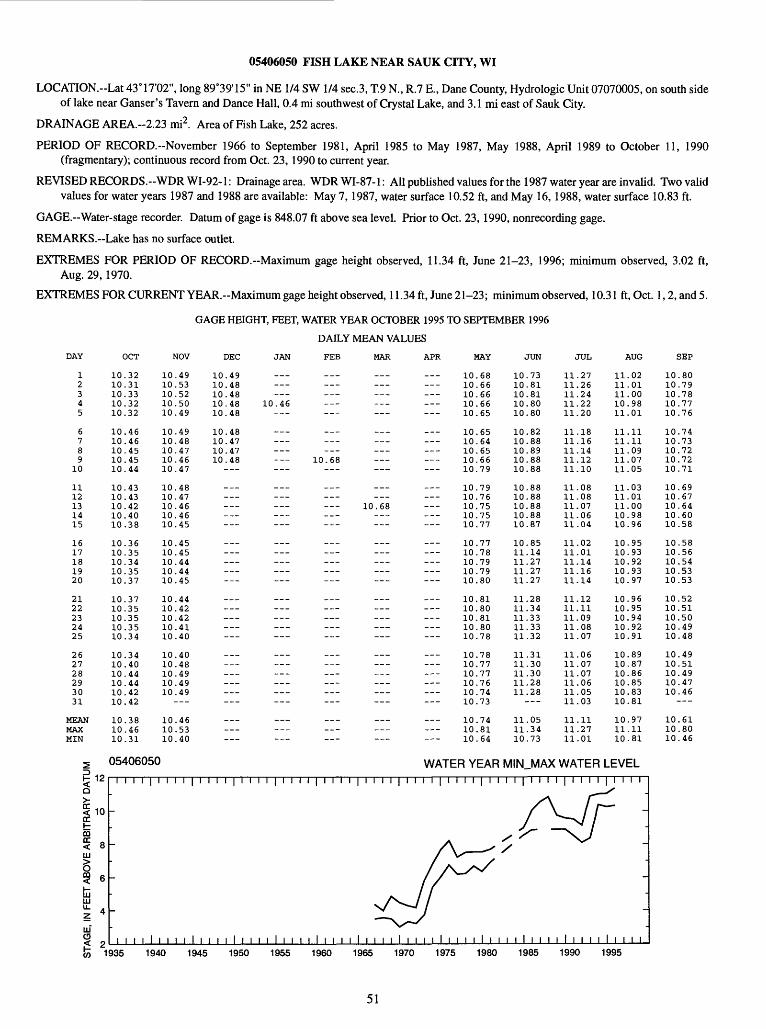
05406050 FISH LAKE NEAR SAUK CITY, WI
LOCATION.--Lat 43°17'02", long 89°39'15" in NE 1/4 SW 1/4 sec.3, T.9 N., R.7 E., Dane County, Hydrologic Unit 07070005, on south side of lake near Gamer's Tavern and Dance Hall, 0.4 mi southwest of Crystal Lake, and 3.1 mi east of Sauk City.
DRAINAGE AREA.--2.23 mi2. Area of Fish Lake, 252 acres.
PERIOD OF RECORD.-November 1966 to September 1981, April 1985 to May 1987, May 1988, April 1989 to October 11, 1990 (fragmentary); continuous record from Oct. 23, 1990 to current year.
REVISED RECORDS.-WDRWI-92-1: Drainage area. WDRWI-87-1: All published values for the 1987 water year are invalid. Two valid values for water years 1987 and 1988 are available: May 7,1987, water surface 10.52 ft, and May 16,1988, water surface 10.83 ft.
GAGE.-Water-stage recorder. Datum of gage is 848.07 ft above sea level. Prior to Oct. 23,1990, nonrecording gage.
REMARKS. Lake has no surface outlet.
EXTREMES FOR PERIOD OF RECORD.-Maximum gage height observed, 11.34 ft, June 21-23, 1996; minimum observed, 3.02 ft, Aug. 29,1970.
EXTREMES FOR CURRENT YEAR.-Maximum gage height observed, 11.34ft, June 21-23; minimum observed, 10.31 ft, Oct. I,2,and5.
GAGE HEIGHT, FEET, WATER YEAR OCTOBER 1995 TO SEPTEMBER 1996
DAILY MEAN VALUES
NOV DEC JAN FEE MAR APR MAY JUN
12345
6789
10
1112131415
1617181920
2122232425
262728293031
MEANMAXMIN
OCT
10.3210.3110.3310.3210.32
10.4610.4610.4510.4510.44
10.4310.4310.4210.4010.38
10.3610.3510.3410.3510.37
10.3710.3510.3510.3510.34
10.3410.4010.4410.4410.4210.42
10.3810.4610.31
10.4910.5310.5210.5010.49
10.4910.4810.4710.4610.47
10.4810.4710.4610.4610.45
10.4510.4510.4410.4410.45
10.4410.4210.4210.4110.40
10.4010.4810.4910.4910.49
10.4610.5310.40
10.4910.4810.4810.4810.48
10.4810.4710.4710.48
10.46
10.68
10.68
10.6810.6610.6610.6610.65
10.6510.6410.6510.6610.79
10.7910.7610.7510.7510.77
10.7710.7810.7910.7910.80
10.8110.8010.8110.8010.78
10.7810.7710.7710.7610.7410.73
10.7410.8110.64
10.7310.8110.8110.8010.80
10.8210.8810.8910.8810.88
10.8810.8810.8810.8810.87
10.8511.1411.2711.2711.27
11.2811.3411.3311.3311.32
11.3111.3011.3011.2811.28
11.0511.3410.73
JUL
11.2711.2611.2411.2211.20
11.1811.1611.1411.1211.10
11.0811.0811.0711.0611.04
11.0211.0111.1411.1611.14
11.1211.1111.0911.0811.07
11.0611.0711.0711.0611.0511.03
11.1111.2711.01
AUG
11.0211.0111.0010.9811.01
11.1111.1111.0911.0711.05
11.0311.0111.0010.9810.96
10.9510.9310.9210.9310.97
10.9610.9510.9410.9210.91
10.8910.8710.8610.8510.8310.81
10.9711.1110.81
05406050 WATER YEAR MIN_MAX WATER LEVELrrr
SEP
10.8010.7910.7810.7710.76
10.7410.7310.7210.7210.71
10.6910.6710.6410.6010.58
10.5810.5610.5410.5310.53
10.5210.5110.5010.4910.48
10.4910.5110.4910.4710.46
10.6110.8010.46
1935 1940 1945 1950 1955 1960 1965 1970 1975 1980 1985 1990 1995
51
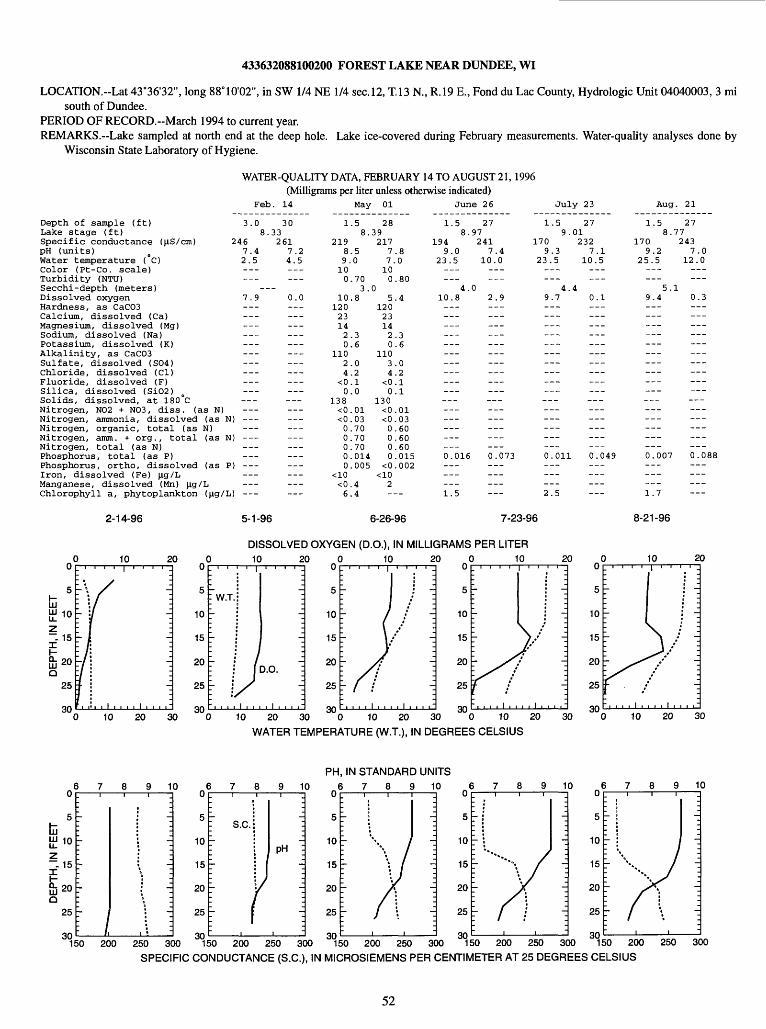
433632088100200 FOREST LAKE NEAR DUNDEE, WI
LOCATION.--Lat 43°36'32", long 88°10'02", in SW 1/4 NE 1/4 sec.12, T.13 N., R.19 E., Fond du Lac County, Hydrologic Unit 04040003, 3 misouth of Dundee.
PERIOD OF RECORD.-March 1994 to current year. REMARKS. Lake sampled at north end at the deep hole. Lake ice-covered during February measurements. Water-quality analyses done by
Wisconsin State Laboratory of Hygiene.
WATER-QUALITY DATA, FEBRUARY 14 TO AUGUST 21, 1996 (Milligrams per liter unless otherwise indicated)
Feb. 14 May 01 June 26 July 23 Aug. 21
Depth of sample (ft)Lake stage (ft)Specific conductance ()iS/cm)pH (units)Water temperature ( C)Color (Pt-Co. scale)Turbidity (NTU)Secchi-depth (meters)Dissolved oxygenHardness, as CaC03Calcium, dissolved (Ca)Magnesium, dissolved (Mg)Sodium, dissolved (Na)Potassium, dissolved (K)Alkalinity, as CaC03Sulfate, dissolved (S04)Chloride, dissolved (Cl)Fluoride, dissolved (F)Silica, dissolved (Si02)Solids, dissolved, at 180 CNitrogen, N02 + N03, diss. (as N)Nitrogen, ammonia, dissolved (as N)Nitrogen, organic, total (as N)Nitrogen, amm. + org., total (as N)Nitrogen, total (as N)Phosphorus, total (as P)Phosphorus, ortho, dissolved (as P)Iron, dissolved (Fe) )ig/LManganese, dissolved (Mn) )ig/LChlorophyll a, phytoplankton ()ig/L)
2-14-96
10 20
5
ID 10~ 15
25
3010 20 30
10u
5
£z~ 15
Si 20Q
25
an
1
_
~
-
-
i
1 '
j*
I~
; -
\ -
\ -m
, : :
3.0 30 1.5 288.33 8.39
246 261 219 2177.4 7.2 8.5 7.82.5 4.5 9.0 7.0 10 10 0.70 0.80
3.07.9 0.0 10.8 5.4 120 120 23 23 14 14 2.3 2.3 0.6 0.6 110 110
2.0 3.0 4.2 4.2 <0.1 <0.1 0.0 0.1
138 130 <0.01 <0.01
N) <0.03 <0.03 0.70 0.60
N) 0.70 0.600.70 0.60
1.5 27 1.5 27 1.5 278.97 9.01 8.77
194 241 170 232 170 2439.0 7.4 9.3 7.1 9.2 7.0
23.5 10.0 23.5 10.5 25.5 12.0___ ___ ______ ___ ___ _ ___
4.0 4.4 5.110.8 2.9 9.7 0.1 9.4 0.3
___ ___--- --- - - ---
___ ___ ___ ___ --- --- --- ---
___ ___--_ ---
--- --- ---___ _ ___ _ ___ --____ _ _ ___ ___ __-
___ ___ _ ___ --_--- - --- --- --- ---___ _ ___ _ ___ _--
--_ ------ --- ---
___ _ ___ ___ _-____ ___ ___ ___ ___ _--
0.014 0.015 0.016 0.073 0.011 0.049 0.007 0.088P) 0.005 <0.002
<0.4 2L) 6.4
5-1-96 6-26-96
___ _ ___ ___ --_ ---1.5 2.5 1.7
7-23-96 8-21-96
DISSOLVED OXYGEN (D.O.), IN MILLIGRAMS PER LITER
10 20 0 10,,.,,,_
T. :-j
-_
I jI D-°- :
/ \ i i i . i i i i i i i-
u
5
10
15
20
25
Ort
' i
r
''~- ( ;/
1- \ /
'- s\ /I
'- 1 I
i , , i i i ._. i i111111111 ou 10 20 30 0 10 20
20 0 10 20 0 10 20. :
i -_-_
-_
jj
-_
:
U
5
10
15
20
25
on
_ i i i i i i i i _
'- -_
r -_
'-- y \'- St '-': s' / :
t / ~-:, , , , | ,,,,1,,,,:
u
5
10
15
20
25
on
.,,,.,,, , .
i- \
7 \
- N / \'- .s^/ '-"-^^^^ / '
I / ~:-i i i i i ... i i ... i~
30 0 10 20 30 0 10 20 30
WATER TEMPERATURE (W.T.), IN DEGREES CELSIUS
PH, IN STANDARD UNITS7 8 9 10 6 7 8 9 10 _6 7 8 9 10 _6 7 8 9 10
:
S.C. 1_i
pH :-/ :
u
5
10
15
20
25
an
,/
\ /
X- f\
!
;
-
-
-3
-_
-_
U
5
10
15
20
25
an
| ':
_
/
' /- y -!i- ft i
U
5
10
15
20
25
an
: :
| ;1 -
' *« y ~-~ ***** J ~~-- >\ -- I \ -
"150 200 250 300 "150 200 250 300 "150 200 250 300 "150 200 250 300 150 200 250 300 SPECIFIC CONDUCTANCE (S.C.), IN MICROSIEMENS PER CENTIMETER AT 25 DEGREES CELSIUS
52
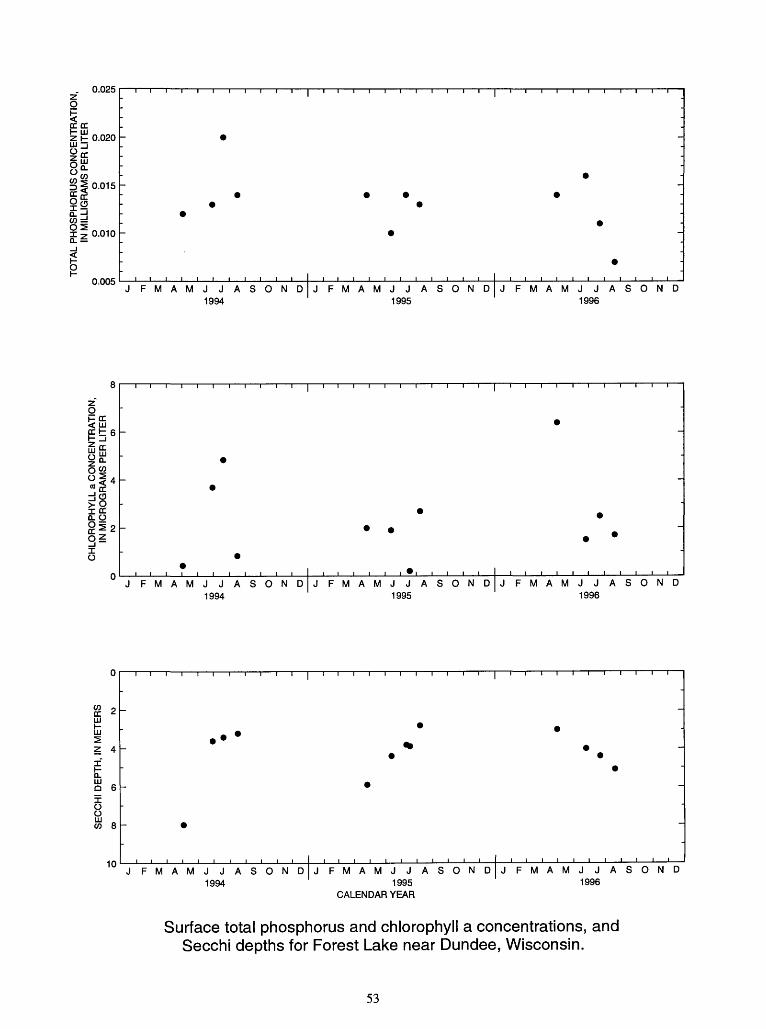
SE
CC
HI
DE
PT
H,
IN M
ET
ER
SC
HLO
RO
PH
YLL
a C
ON
CE
NT
RA
TIO
N,
IN M
ICR
OG
RA
MS
PE
R L
ITE
R
TO
TA
L P
HO
SP
HO
RU
S C
ON
CE
NT
RA
TIO
N,
IN M
ILLI
GR
AM
S P
ER
LIT
ER
p
p
p
p
p
§b
b
b
b
-*
-*
to
to
O
en
O
en
c_
Tl
CO
>
00
»
*"
^i
. .£*
> C
Q_
O
.
>
0
&} S
OT^ 3
- °
W
o
z
-+,
0)
O
"D
o
Tl
O
«-O
"^
^
C
Tl
00)
0
M
0)
£
£g.
1 *
7T
O
3>
S
0
IT
j<
£
C_
52
3
S «-
®
0»f
n
"^C
=
0
Q. ^
z0
Q
.-,
0 °
°3
c_
§§
§ §
^
w.
o
srt
T"
-JP
w m
S
51
3 o>
c_
Q.
> CO O z
o
. 1
. 1
. 1
. 1
.
.
_ -
9
- - '.
-
i ,
i ,
i ,
i
c_ Tl
S
> S
-j.
C_
CO g^
> CO O Z o c_ Tl
S > s_k
C_
CO
C
O
01
C- > CO o z O c_ Tl
S
> S
-j.
C_
CO
C
O
0)
C_ > CO o z o
. 1
I 1
. 1
.
-
- -
-
-
.1.1.1.
c_ Tl s
> s-i.
C_
CO
C
O *.
c_ > CO o z
o c_ Tl s > s
-j.
C_
s 01
C- > CO o z o c_ Tl s
> 2_i.
C_
CO
C
O
O)
C_ > CO o z o
....
1 ..
1
. 1 ....
1 ...
1
- -
-
-
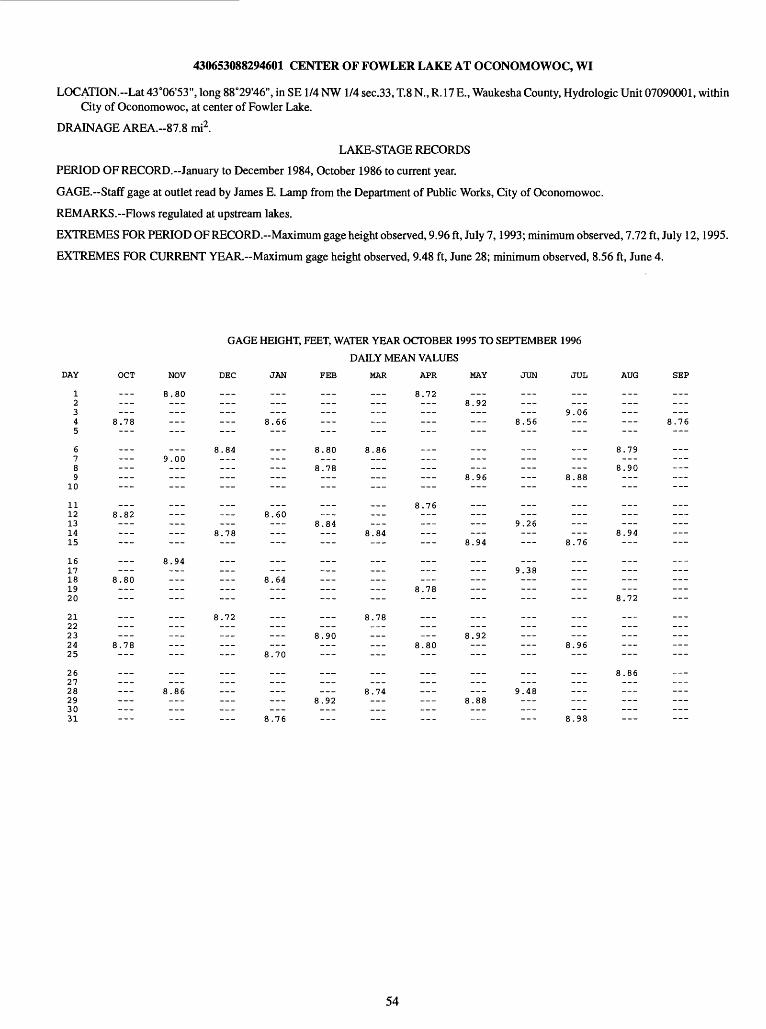
430653088294601 CENTER OF FOWLER LAKE AT OCONOMOWOC, WI
LOCATION.--Lat 43°06'53", long 88°29'46", in SE 1/4 NW 1/4 sec.33, T.8 N., R. 17 E., Waukesha County, Hydrologic Unit 07090001, within City of Oconomowoc, at center of Fowler Lake.
DRAINAGE AREA.--87.8 mi2 .
LAKE-STAGE RECORDS
PERIOD OF RECORD.--January to December 1984, October 1986 to current year.
GAGE.-Staff gage at outlet read by James E. Lamp from the Department of Public Works, City of Oconomowoc.
REMARKS. Flows regulated at upstream lakes.
EXTREMES FOR PERIOD OF RECORD.-Maximum gage height observed, 9.96 ft, July 7,1993; minimum observed, 7.72 ft, July 12,1995.
EXTREMES FOR CURRENT YEAR.--Maximum gage height observed, 9.48 ft, June 28; minimum observed, 8.56 ft, June 4.
GAGE HEIGHT, FEET, WATER YEAR OCTOBER 1995 TO SEPTEMBER 1996
DAILY MEAN VALUES
DAY OCT NOV DEC JAN FEE MAR APR MAY JUN JUL AUG SEP
1 8.80 8.722 8.923 9.06 4 8.78 8.66 8.565
6 8.84 8.80 8.86 7 9.00 8 8.789 8.96 8.88
10
11 8.7612 8.82 8.60 13 8.84 9.2614 8.78 8.84 8.9415 8.94 8.76
16 8.94 17 9.38 18 8.80 8.6419 8.78 20 8.72
21 8.72 8.78 2223 8.90 8.9224 8.78 8.80 8.96 25 8.70
26 8.8627 28 8.86 8.74 9.48 29 8.92 8.88 ---30 31 8.76 8.98
54
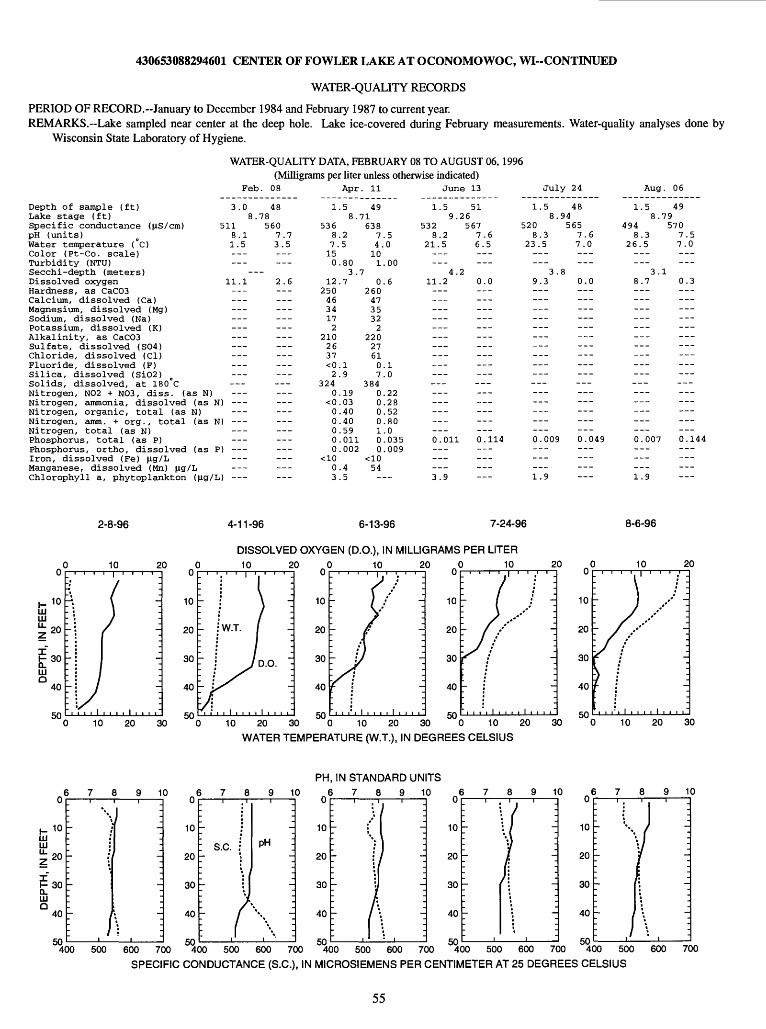
430653088294601 CENTER OF FOWLER LAKE AT OCONOMOWOC, WI--CONTINUED
WATER-QUALITY RECORDS
PERIOD OF RECORD.--January to December 1984 and February 1987 to current year.REMARKS. Lake sampled near center at the deep hole. Lake ice-covered during February measurements. Water-quality analyses done by
Wisconsin State Laboratory of Hygiene.
WATER-QUALITY DATA, FEBRUARY 08 TO AUGUST 06, 1996 (Milligrams per liter unless otherwise indicated)
Feb. 08 Apr. 11 June 13 July 24
Depth of sample (ft)Lake stage (ft)Specific conductance (^S/cm)pH (units)Water temperature (°C)Color (Pt-Co. scale)Turbidity (NTU)Secchi-depth (meters)Dissolved oxygenHardness, as CaCO3Calcium, dissolved (Ca)Magnesium, dissolved (Mg)Sodium, dissolved (Na)Potassium, dissolved (K)Alkalinity, as CaCO3Sulfate, dissolved (SO4)Chloride, dissolved (Cl)Fluoride, dissolved (F)Silica, dissolved (Si02)Solids, dissolved, at 180°CNitrogen, NO2 + NO3, diss. (as N)Nitrogen, ammonia, dissolved (as N)Nitrogen, organic, total (as N)Nitrogen, amm. + org., total (as N)Nitrogen, total (as N)Phosphorus, total (as P)Phosphorus, ortho, dissolved (as P)Iron, dissolved (Fe) |J.g/LManganese, dissolved (Mn) |ig/LChlorophyll a, phytoplankton (|ig/L)
Aug. 06
3.0
5118.11.5______
11.1
____________
_________ ___
I) ___
I)
>)
___,)
488.78
5607.73.5___
2.6
____________
___
___
___
___
1
53687.150
122504634172
2102637<02
3240
<000000
03
.58.
.25
.803.
.7
.1
.9
.19
.03
.40
.40
.59
.011
.002
.4
.5
4971638
74101
70
2604735322
220276107
3840000100
54-
.5.0
.00
.6
.1
.0
.22
.28
.52
.80
.0
.035
.009
1.59.
5328.2
21.5
4.11.2___
___
_________
_______________0.011
___3.9
5126567
7.66.5
20.0
___---___
___
0.114
______
1.58.
5208.3
23.5
3.9.3
______
___---
_______________0.009
1.9
4894565
7.67.0______
80.0
___---
___0.049___
1.58.
4948.3
26.5______
3.8.7_________------______---______---
0.007
1.9
4979570
7.57.0
---1
0.3_________
------___ ___
0.144___
2-8-96
10
10 20 30
4-11-96 6-13-96 7-24-96 8-6-96
DISSOLVED OXYGEN (D.O.), IN MILLIGRAMS PER LITER10
10 20 30 "0 10 20 30 "0 10 20 30
WATER TEMPERATURE (W.T.), IN DEGREES CELSIUS
20
10 20 30
PH, IN STANDARD UNITS
8 9 10u
I- 10IIIIII
H 30Q_III0
40
v\
\i
_ f
\
i /
-
I
_I
\~
8 9 10
S.C. PH
6 8 9 10 8 9 10 8 9 10
400 500 600 700 400 500 600 700 400 500 600 700 400 500 600 700 400 500 600 700
SPECIFIC CONDUCTANCE (S.C.), IN MICROS!EMENS PER CENTIMETER AT 25 DEGREES CELSIUS
55

o
CCCC2 H 0.03
JSPHORUS CONCI 1ILLIGRAMS PER L
o 8
I 2 0.01i"H o
-w .
: j
7 -_
'' * * ''-
:-« > £ 9 " ,** * *\ -_
; . * j
1984 1985 1986 1987 1988 1989 1990 1991 1992 1993 1994 1995 1996
oPDC< UJ DC t 6
ICC 0.0
1984 1985
O GO
1986 1987 1988 1989 1990 1991 1992 1993 1994 1995 1996
0)1ccUJ§ 2fa0. UJ Q
I I 1 \ \ I I I I I
1984 1985 1986 1987 1988 1989 1990 1991 1992 1993 1994 1995 1996
CALENDAR YEAR
Surface total phosphorus and chlorophyll a concentrations and Secchi depths for Center of Fowler Lake at Oconomowoc, Wisconsin.
(Circles indicate laboratory detection limit for selected analyses. Actual concentrations for these particular analyses are less than the plotted circles.)
56
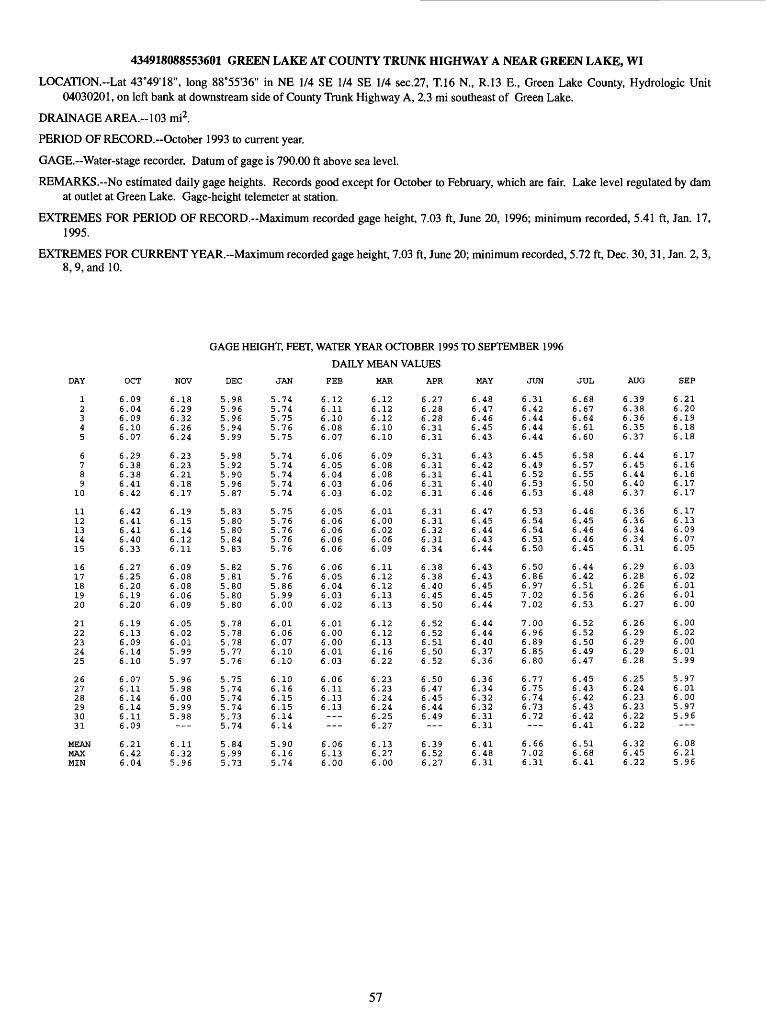
434918088553601 GREEN LAKE AT COUNTY TRUNK HIGHWAY A NEAR GREEN LAKE, WI
LOCATION.-Lat 43°49'18", long 88°55'36" in NE 1/4 SE 1/4 SE 1/4 sec.27, T.16 N., R.13 E., Green Lake County, Hydrologic Unit 04030201, on left bank at downstream side of County Trunk Highway A, 2.3 mi southeast of Green Lake.
DRAINAGE AREA.--103 mi2 .
PERIOD OF RECORD.-October 1993 to current year.
GAGE.-Water-stage recorder. Datum of gage is 790.00 ft above sea level.
REMARKS.-No estimated daily gage heights. Records good except for October to February, which are fair. Lake level regulated by dam at outlet at Green Lake. Gage-height telemeter at station.
EXTREMES FOR PERIOD OF RECORD.-Maximum recorded gage height, 7.03 ft, June 20, 1996; minimum recorded, 5.41 ft, Jan. 17, 1995.
EXTREMES FOR CURRENT YEAR.~Maximum recorded gage height, 7.03 ft, June 20; minimum recorded, 5.72 ft, Dec. 30, 31, Jan. 2, 3, 8,9, and 10.
GAGE HEIGHT, FEET, WATER YEAR OCTOBER 1995 TO SEPTEMBER 1996
DAILY MEAN VALUES
DAY OCT NOV DEC JAN FEE MAR APR MAY JUN JUL AUG SEP
12345
6789
10
1112131415
1617181920
2122232425
262728293031
MEANMAXMIN
6.096.046.096.106.07
6.296.386.386.416.42
6.426.416.416.406.33
6.276.256.206.196.20
6.196.136.096.146.10
6.076.116.146.146.116.09
6.216.426.04
6.186.296.326.266.24
6.236.236.216.186.17
6.196.156.146.126.11
6.096.086.086.066.09
6.056.026.015.995.97
5.965.986.005.995.98---
6.116.325.96
5.985.965.965.945.99
5.985.925.905.965.87
5.835.805.805.845.83
5.825.815.805.805.80
5.785.785.785.775.76
5.755.745.745.745.735.74
5.845.995.73
5.745.745.755.765.75
5.745.745.745.745.74
5.755.765.765.765.76
5.765.765.865.996.00
6.016.066.076.106.10
6.106.166.156.156.146.14
5.906.165.74
6.126.116.106.086.07
6.066.056.046.036.03
6.056.066.066.066.06
6.066.056.046.036.02
6.016.006.006.016.03
6.066.116.136.13
6.066.136.00
6.126.126.126.106.10
6.096.086.086.066.02
6.016.006.026.066.09
6.116.126.126.136.13
6.126.126.136.166.22
6.236.236.246.246.256.27
6.136.276.00
6.276.286.286.316.31
6.316.316.316.316.31
6.316.316.326.316.34
6.386.386.406.456.50
6.526.526.516.506.52
6.506.476.456.446.49
6.396.526.27
6.486.476.466.456.43
6.436.426.416.406.46
6.476.456.446.436.44
6.436.436.456.456.44
6.446.446.406.376.36
6.366.346.326.326.316.31
6.416.486.31
6.316.426.446.446.44
6.456.496.526.536.53
6.536.546.546.536.50
6.506.866.977.027.02
7.006.966.896.856.80
6.776.756.746.736.72
6.667.026.31
6.686.676.646.616.60
6.586.576.556.506.48
6.466.456.466.466.45
6.446.426.516.566.53
6.526.526.506.496.47
6.456.436.426.436.426.41
6.516.686.41
6.396.386.366.356.37
6.446.456.446.406.37
6.366.366.346.346.31
6.296.286.266.266.27
6.266.296.296.296.28
6.256.246.236.236.226.22
6.326.456.22
6.216.206.196.186.18
6.176.166.166.176.17
6.176.136.096.076.05
6.036.026.016.016.00
6.006.026.006.015.99
5.976.016.005.975.96___
6.086.215.96
57

453421091333700 HEMLOCK LAKE NEAR MIKANA, WI
LOCATION.~Lat 45°34'21", long 91°33'37", in SE 1/4 SE 1/4 sec.26, T.36 N., R.10 W, Barron County, Hydrologic Unit 07050007, 2.5 misoutheast of Mikana.
PERIOD OF RECORD.-March 1993 to August 1994 and March to September 1996. REMARKS. Lake sampled at deep hole near center of lake. Lake ice-covered during March sampling. Water-quality analyses by Wisconsin
State Laboratory of Hygiene.
WATER-QUALITY DATA, MARCH 12 TO AUGUST 21,1996 (Milligrams per liter unless otherwise indicated)
Depth of sample (ft)Lake stage (ft)Specific conductance (jiS/cm)pH (units)Water temperature ( C)Secchi-depth (meters)Dissolved oxygenPhosphorus, total (as P)Chlorophyll a, phytoplankton
Ma
3.010
1096.52.0
8.3
r. 12
19.05161
64
___0--
.7.5
.0
May
1.510.
778.0
11.51.
10.50.034
14
09
1969
7779
890-
.8.0
.3
.045--
1
817
20.
80
12
June 25
.5 2010.65
110.3 60 131.5
.8 0
.029 0-
.8.5
.0
.197
1
907
23.
80
12
Jul
.510.
.602.
.6
.030
y 23
2184143
614
000-
.9.0
.1
.530--
1
997
23.
90
13
Aug
.510.
.802.
.1
.017
. 21
2170185
7.314.5
10.10.325
3-12-96 5-9-96 6-25-96 7-23-96 8-21-96
ID 5LLJ LL
g]15 Q
10
10 20
20
30
DISSOLVED OXYGEN (D.O.), IN MILLIGRAMS PER LITER
WATER TEMPERATURE (W.T.), IN DEGREES CELSIUS
o (
5
10
15
2022
) 1C
: W.T.'-
'- I1 } 10
) 2
-_
D.O. ~
-j
-
20 3
0 ( 0
5
10
15
2022
0 (
) 10 2
':/ I ':
Y 1 i
', i i i I ... i .111"} 10 20 3
0 n (0
5
10
15
20 22
0 (
) 10 2
r ? ~~-I \
'. , . i i , . , . i . . , i') 10 20 3
0 o c
5
10
15
20 22
0 C
) 10 2
r ^ ''-1 \
. i . i i . . . . i i i i i") 10 20 3
PH, IN STANDARD UNITS6789 10 6789 10 6789 10 6 7 8 9 10 6 7 8 9 10Oi i i i i 0| i i i | 0u
ID 5LLJLL
I
Si 15O
2099
.
-
'-
j-
-
:
-\ I
\ ''"-,. J
u
5
10
15
2099
IS.C.'-
'-
'-
-'-
PH -
-
-j
0 100 200 300 ~~0 100 200 300 ~~0 100 200 300 0 100 200 300 0 100 200 300
SPECIFIC CONDUCTANCE (S.C.), IN MICROSIEMENS PER CENTIMETER AT 25 DEGREES CELSIUS
58
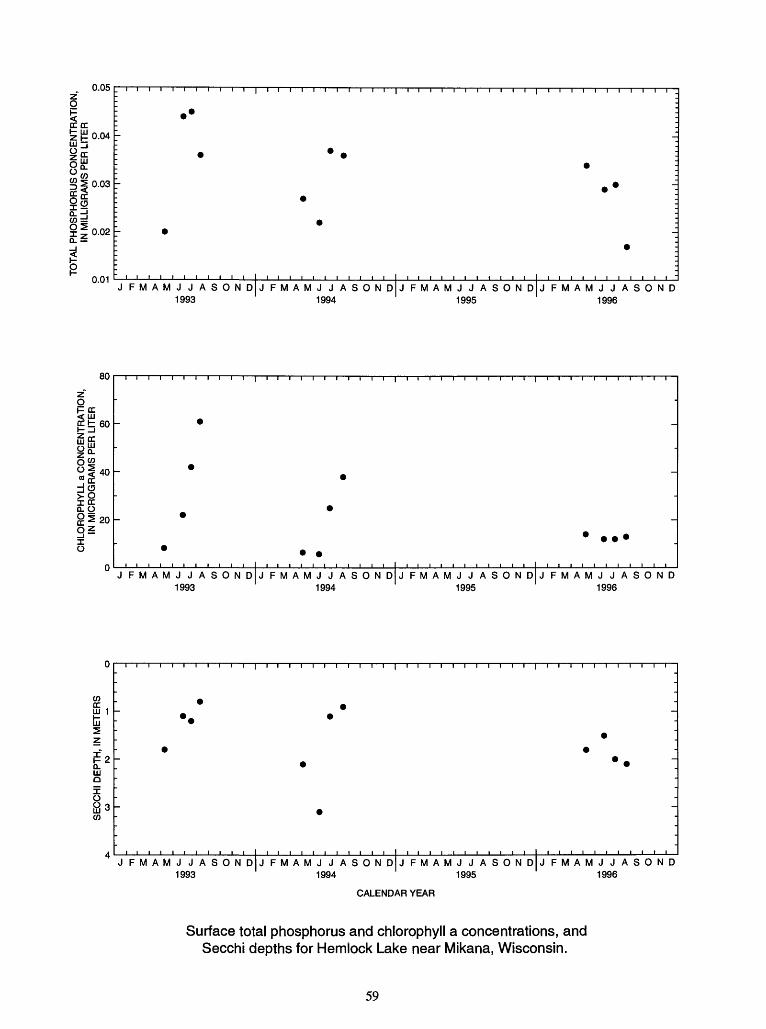
CH
LOR
OP
HY
LL a
CO
NC
EN
TR
AT
ION
,T
OT
AL
PH
OS
PH
OR
US
CO
NC
EN
TR
AT
ION
, IN
MIL
LIG
RA
MS
PE
R L
ITE
R
4
C_
Tl 2 > 2
CO
*~
0)
8^
CO
§_
>co
o
coIS
°
ot
w
o^
sn*
w
>
io
|-
3
S
A>
O
fl>
co
03
0
I*-
0.
£
°|
Q
m
zQ>
IT
o
O2T
o
5*
,
CD
X
JJ
c--j
O
<
TI
0
"2-
52
ft>
C5
3D
^T
^»
^
^
2
5r r
i 5
*~
Oi
j^
<0 f
Jii
O
01
0)
0
>-
ro co
< 2
. o
8'S
|
Si
4|»
,
JD
2
3
>°-
2(O
<~
O)
c- > CO 0 z o
SE
CC
HI
DE
PT
H,
IN M
ET
ER
S*
CO
N>
-
C
- ~
[
^
" \
- -
-
.
-
«
- " " - - ;
0"_
"
3 C
c_ Tl 2 > 2
5s-
w
c- > CO O z o c_ Tl
2 > 21
" > CO
O Z o c_ Tl 2 > 2
5^
CO ,
01
c- > CO O z 0 c_ Tl 2 > 2
w<
-S
^ > CO O z o
IIN M
iixi-iu
oiiM
ivio
rcii L
I i c
r-i
8 §
S 8
i
i i
. i
,
"
~ ]
- - -
"
'_
- - ~
1,1
,1
.
C
3 <
c_ Tl 2 > 2
w«
-S
^ > CO O z o c_ Tl 2 > 2 ! > CO o z o c_ Tl 2 > 2
w«-
CO ,
01
c~ > CO o z 0 c_ Tl 2 > 2
»
«-
S^ > CO o z 0
3
O
O
O
C3
b
b
ip
cN
> CO
S
0
- -
'_
- ~ ~ - ~ -
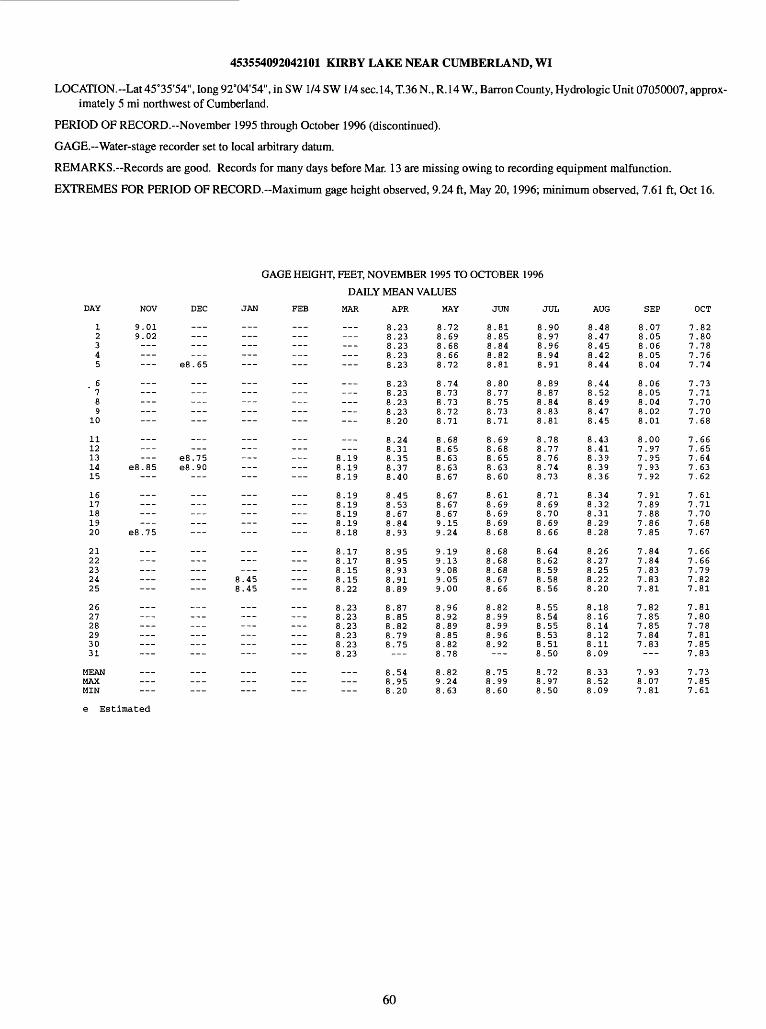
453554092042101 KIRBY LAKE NEAR CUMBERLAND, WI
LOCATION.--Lat45 0 35'54", long 92°04'54", in SW 1/4 SW 1/4 sec. 14, T.36 N., R.14 W, Barron County, Hydrologic Unit 07050007, approx imately 5 mi northwest of Cumberland.
PERIOD OF RECORD.-November 1995 through October 1996 (discontinued).
GAGE.--Water-stage recorder set to local arbitrary datum.
REMARKS. Records are good. Records for many days before Mar. 13 are missing owing to recording equipment malfunction.
EXTREMES FOR PERIOD OF RECORD.-Maximum gage height observed, 9.24 ft, May 20, 1996; minimum observed, 7.61 ft, Oct 16.
DAY
12345
6 " 7
10
1112131415
1617181920
2122232425
262728293031
MEANMAXMIN
NOV
9.019.02
GAGE HEIGHT, FEET, NOVEMBER 1995 TO OCTOBER 1996
DAILY MEAN VALUES
JAN FEE MAR APR MAY JUN JUL AUG
68.65
68.85
e8.75
e8.75 e8.90
.45
.45
SEP OCT
.__
.__
.__
.__
.__
.__
.__191919
1919191918
1717151522
232323232323
.__
.__
8.8.8.8.8.
8.8.8.8.8.
8.8.8.8.8.
8.8.8.8.8.
8.8.8.8.8.
8.8.8.8.8.-
8.8.8.
2323232323
2323232320
2431353740
4553678493
9595939189
8785827975
549520
8.728.698.688.668.72
8.748.738.738.728.71
8.688.658.638.638.67
8.678.678.679.159.24
9.199.139.089.059.00
8.968.928.898.858.828.78
8.829.248.63
8.8.8.8.8.
8.8.8.8.8.
8.8.8.8.8.
8.8.8.8.8.
8.8.8.8.8.
8.8.8.8.8.-
8.8.8.
8185848281
8077757371
6968656360
6169696968
6868686766
8299999692
759960
88888
8888,8.
8,8,8,8.8.
8.8.8.8.8.
8.8.8.8.8.
8.8.8.8.8.8.
8.8.8.
.90
.97
.96
.94
.91
.89
.87
.84
.83
.81
.78
.77
.76
.74
.73
.71
.69
.70
.69
.66
,64,62595856
555455535150
729750
8.488.478.458.428.44
8.448.528.498.478.45
8.438.418.398.398.36
8.348.328.318.298.28
8.268.278.258.228.20
8.188.168.148.128.118.09
8.338.528.09
8.8.8.8.8.
8.8.8.8.8.
8.7.7.7.7.
7.7.7 .7.7.
7.7.7.7.7.
7.7.7.7.7.-
7.8.7.
0705060504
0605040201
0097959392
9189888685
8484838381
8285858483
930781
7.827.807.787.767.74
7.737.717.707.707.68
7.667.657.647.637.62
7.617.717.707.687.67
7.667.667.797.827.81
7.817.807.787.817.857.83
7.737.857.61
Estimated
60

453608092035801 KIRBY LAKE (SITE 1) NEAR CUMBERLAND, WI
LOCATION.-Lat 45°36'08", long 92°03'58", in NE 1/4 SW 1/4 sec.14, T.36 N., R. 14 W, Barron County, Hydrologic Unit 07050007, approx imately 5 mi northwest of Cumberland.
PERIOD OF RECORD.-November 1995 through November 1996 (discontinued).
REMARKS. Water-quality analyses by Wisconsin State Laboratory of Hygiene. Lake was ice-covered during January and March measure ments.
WATER-QUALITY DATA, NOVEMBER 01, 1995 TO MAY 10, 1996 (Milligrams per liter unless otherwise indicated)
Depth of sample (ft)Lake stage (ft)
Nov. 01 Jan. 24 Mar. 14 May 08 May 10
1.5 15 2.5 17 4.0 17 1.5 17 1.59.01 8.45 8.19 8.71
Specific conductance (jiS/cm) 30 31 21 23 23 32 33 -pH (units)Water temperature ( C)Secchi-depth (meters)Dissolved oxygenAlkalinity, as CaCO3Chloride, dissolved (Cl)Nitrogen, NO2 + NO3, diss.
5.8 5.6 5.6 5.5 5.5 2.5 1.5 2.0 12.5 8.5
1.8 1.811.0 11.0 3.2 3.3 2.3 10.5 8.7
6 6 7 0.9
(as N) 0.08 Nitrogen, ammonia, dissolved (as N) - - --- --- <0.03 ---Nitrogen, organic, total (as N) - - --- - - 0.60 ---Nitrogen, amm. + org., total (as N) - - - - 0.60 ---Nitrogen, total (as N)Phosphorus, total (as P)
0.68 0.023 0.022 0.030 0.018 0.024 0.027 0.030 0.023
Chlorophyll a, phytoplankton (jig/L) 6.4 - 7.4
11-01-95 1-24-96 3-14-96 5-8-96
DISSOLVED OXYGEN (D.O.), IN MILLIGRAMS PER LITER
0 10 20 0 10 20 0 10 20 0 10 20
KLU 5LULLZt" 10Q-LUQ
15
m
W.T. ..-
-
-
*,,,,!,,,18 o 10
5670
LU 5 LULLZ
110Q.LUQ
15
10
-
_.
D.O. :-
I'll'"
u
5
10
15
-4 O
\-I_.-
-
-
i i i i i i i
_.-
-
_
i i i i i i i i i I i i i i
U
5
10
15
4 O
- -
-i _.-
-
~m
'. i, , , , I . . . . l . . . .
\J
5
10
15
10
-
..
:- / -t
;
: I / :i i i i I i i i i i i i i
20 30 '"O 10 20 30 '"o 10 20 30 '°0 10 20 30
WATER TEMPERATURE (W.T.), IN DEGREES CELSIUS
PH, IN STANDARD UNITS
8 9 10 ^5 6 7 8 9 10 ,,5 6 7 8 9 10 ,,5 6 7 8 9 10
i i i i
U
5
10
15
10
-
-
-
PH :s.c. -
_--
_-
, ,
U
5
10
15
10
-
.
-
'_ ~_
_-
i i i i
u
5
10
15
1«
-
-
.
-
.
.
i i i i0 10 20 30 40 50 0 10 20 30 40 50 0 10 20 30 40 50
SPECIFIC CONDUCTANCE (S.C.), IN MICROSIEMENS PER CENTIMETER AT 25 DEGREES CELSIUS
61
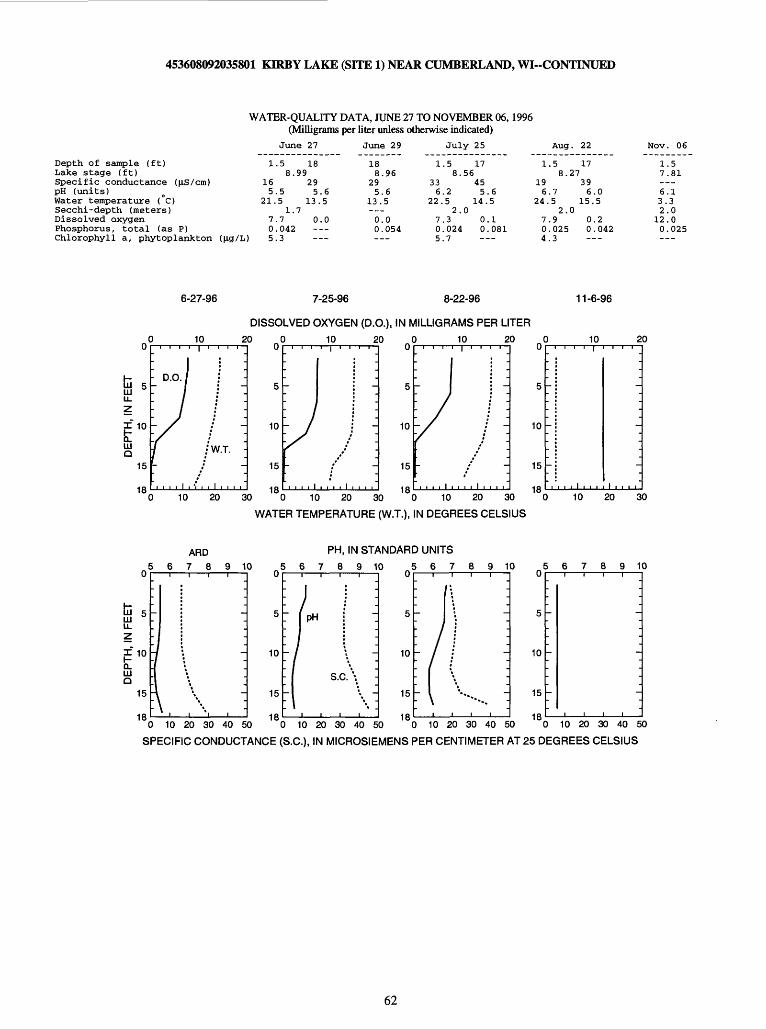
453608092035801 KIRBY LAKE (SITE 1) NEAR CUMBERLAND, WI-CONTINUED
Depth of sample (ft)Lake stage (ft)Specific conductance (US/cm)pH (units)Water temperature ( C)Secchi-depth (meters)Dissolved oxygenPhosphorus, total (as P)Chlorophyll a, phytoplankton
WATER-QUALITY DATA, JUNE 27 TO NOVEMBER 06,1996 (Milligrams per liter unless otherwise indicated)
June 27 June 29 July 25 Aug. 22 Nov. 06
1.58.
165.5
21.51.
7.70.0425.3
1899
295
137
0--
.6.5
.0--
188
295
13--00-
.96
.6.5-.0.054
1.58.
336.2
22.52.
7.30.0245.7
1756
455
140
00-
.6.5
.1
.081
1.58.
196.7
24.52.
7.90.0254.3
1727
396
150
00-
.0.5
.2
.042--
1.57.81 6.13.32.012.00.025
6-27-96 7-25-96 8-22-96
DISSOLVED OXYGEN (D.O.), IN MILLIGRAMS PER LITER
11-6-96
o c
fc 5 UJu_zDEPTH, I
0
15
10
) 10
: D.O./
n,*
2
-
V.T. -
-
0 « c0
5
10
15
10J
10 2i i i i i i
-
' :
0 « c0
5
10
15
1C
)
'-/i i i i I
10 2
-
/
! ':
0 J0
5
10
15
1ft
J 10 i i i I
-
:
2
-
-
I , , i ,"10 20 30 0 10 20 30 0 10 20 30 0
WATER TEMPERATURE (W.T.), IN DEGREES CELSIUS
10 20 30
X10a.UJQ
15
18
ARD PH, IN STANDARD UNITS
567 8 9 10 56789 10 56 7 8 9 10 5 6 7 8 9 10 Oi \ i i i i Oi i i i i i Oi i i i i i 0
0 10 20 30 40 50
10
0 10 20 30 40 50
10
0 10 20 30 40 50
10
0 10 20 30 40 50
SPECIFIC CONDUCTANCE (S.C.), IN MICROSIEMENS PER CENTIMETER AT 25 DEGREES CELSIUS
62

453601092035301 KIRBY LAKE (SITE 2) NEAR CUMBERLAND, WI
LOCATION.-Lat 45°36'01", long 92°03'53", in NE 1/4 SW 1/4 sec.14, T.36 N., R. 14 W, Barren County, Hydrologic Unit 07050007, approx imately 5 mi northwest of Cumberland.
PERIOD OF RECORD.-November 1995 through November 1996 (discontinued).
REMARKS. Water-quality analyses by Wisconsin State Laboratory of Hygiene. Lake was ice-covered during measurements.
WATER-QUALITY DATA, JANUARY 23 AND MARCH 13, 1996 (Milligrams per liter unless otherwise indicated)
Depth of sample (ft)Lake stage (ft)Specific conductance (US/cm)pH (units)Water temperature (°C)Secchi-depth (meters)Dissolved oxygenPhosphorus, total (as P)
Jan. 2 3 Mar. 13
2.0 108.45
21 216.8 6.20.5 2.0
5.8 5.20.018 0.017
3.08
235.81.5
3.30.027
9.0.19
225.71.5
3.00.023
1-23-96 3-13-96
DISSOLVED OXYGEN (D.O.), IN MILLIGRAMS PER LITER
10 20u
2
LLJLLJ 4LL
Z~ 6I
Q10
19
rW.T --
_D.O.
_-
.-
10 20
10 20 30
u
2
4
6
8
10
12
-
-
-
-
-
)
-
-
-
-
, , I , . , , I i i i i10 20 3
WATER TEMPERATURE (W.T.), IN DEGREES CELSIUS
PH, IN STANDARD UNITS
5 6 8 9 10 5 6 8 9 10
PHs.c.
0 10 20 30 40 50
u
2
4
6
8
10
19
-
-
-
-
-
1 1 1 1
-
-
-
-
-
1 1 1 1
0 10 20 30 40 50
SPECIFIC CONDUCTANCE (S.C.), IN MICROSIEMENS PER CENTIMETER AT 25 DEGREES CELSIUS
63

453612092034901 KIRBY LAKE (SITE 3) NEAR CUMBERLAND, WI
LOCATION.--Lat 45°36'12", long 92°03'49", in SW 1/4 NE 1/4 sec.14, T.36 N., R.14 W., Barron County, Hydrologic Unit 07050007, approx imately 5 mi northwest of Cumberland.
PERIOD OF RECORD.-November 1995 through November 1996 (discontinued).
REMARKS. Lake was ice-covered during measurements.
1-23-96 3-13-96
DISSOLVED OXYGEN (D.O.), IN MILLIGRAMS PER LITER
10 20
tn2
4
W.T.
6 D.O.
QJ
10
1210 20 30
o (
2
4
6
8
10
12 c
)
-
-
-
--
)
10 2
-
-
-
10 20 3
WATER TEMPERATURE (W.T.), IN DEGREES CELSIUS
PH, IN STANDARD UNITS
8 9 10u
2
uj 4 u.z f 6
5] 8 a
10
19
-
h
-
-
s.c. ~
PH ~
i i i
5 6 7 8 9 10
0 10 20 30 40 50
u
2
4
6
8
10
10
-
-
-
-
-
i i i i
-
-
-
-
-
i i i i0 10 20 30 40 50
SPECIFIC CONDUCTANCE (S.C.), IN MICROSIEMENS PER CENTIMETER AT 25 DEGREES CELSIUS
64
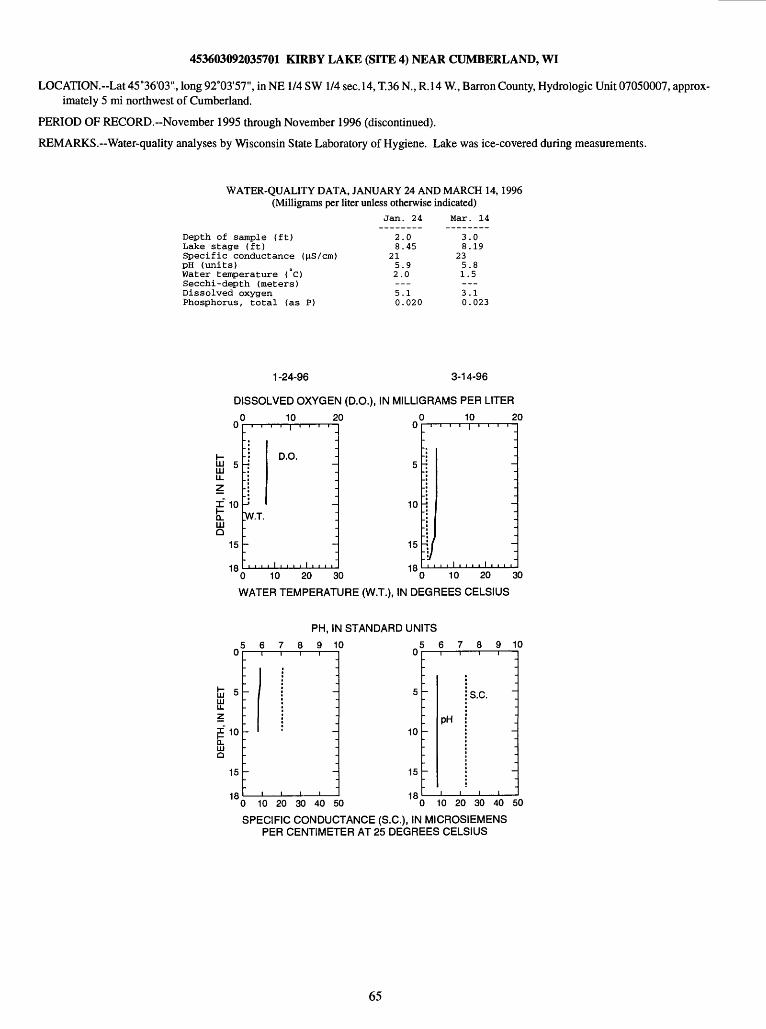
453603092035701 KIRBY LAKE (SITE 4) NEAR CUMBERLAND, WI
LOCATION.--Lat 45°36'03", long 92°03'57", in NE 1/4 SW 1/4 sec.14, T.36 N., R.14 W., Barren County, Hydrologic Unit 07050007, approx imately 5 mi northwest of Cumberland.
PERIOD OF RECORD.-November 1995 through November 1996 (discontinued).
REMARKS. Water-quality analyses by Wisconsin State Laboratory of Hygiene. Lake was ice-covered during measurements.
WATER-QUALITY DATA, JANUARY 24 AND MARCH 14, 1996 (Milligrams per liter unless otherwise indicated)
Depth of sample (ft) Lake stage (ft) Specific conductance pH (units)Water temperature (°C) Secchi-depth (meters) Dissolved oxygen Phosphorus, total (as P)
Jan. 24
2.08.45
215.92.0
5.10.020
Mar. 14
3.08.19
235.81.5
3.10.023
1-24-96 3-14-96
DISSOLVED OXYGEN (D.O.), IN MILLIGRAMS PER LITER
10 20u
111 ^in °LL
zt" 10a.HI0
15
1ft
-
_..-'->
W.T.\-"111
D.O. _..-
-
;~-
, i , , , , i , , , ,*
10 20
10
15
180 10 20 30 '0 10 20 30
WATER TEMPERATURE (W.T.), IN DEGREES CELSIUS
PH, IN STANDARD UNITS
6 7 8 9 10u
fc 5LU U.
I 10Lil Q
15
10
-
-
~
-
-
1 1 1 1
0 10 20 30 40 50
10
15
18
6 7 8 9 10
PH
B.C.
0 10 20 30 40 50
SPECIFIC CONDUCTANCE (S.C.), IN MICROSIEMENS PER CENTIMETER AT 25 DEGREES CELSIUS
65
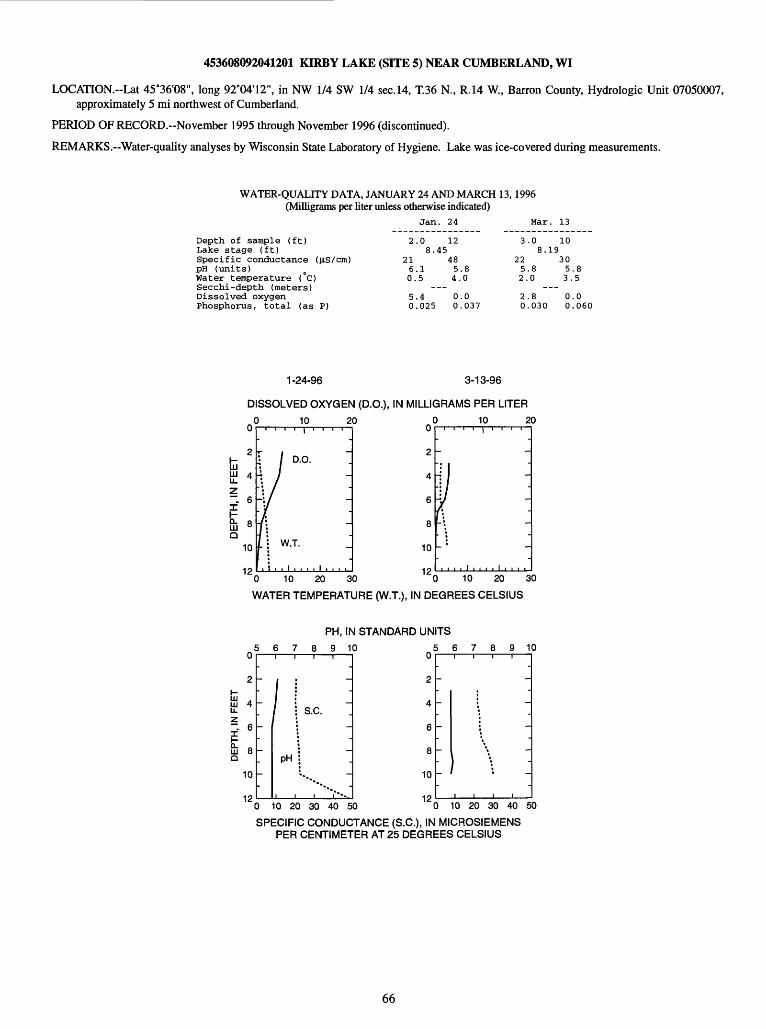
453608092041201 KIRBY LAKE (SITE 5) NEAR CUMBERLAND, WI
LOCATION.~Lat 45°36'08", long 92°041 12", in NW 1/4 SW 1/4 sec.14, T.36 N., R.14 W, Barron County, Hydrologic Unit 07050007, approximately 5 mi northwest of Cumberland.
PERIOD OF RECORD.-November 1995 through November 1996 (discontinued).
REMARKS. Water-quality analyses by Wisconsin State Laboratory of Hygiene. Lake was ice-covered during measurements.
WATER-QUALITY DATA, JANUARY 24 AND MARCH 13, 1996 (Milligrams per liter unless otherwise indicated)
Depth of sample (ft)Lake stage (ft)Specific conductance (US/cm)pH (units)Water temperature ( C)Secchi-depth (meters)Dissolved oxygenPhosphorus, total (as P)
Jan. 24 Mar. 13
2.0 128.45
21 486.1 5.80.5 4.0
5.4 0.00.025 0.037
3.0 108.19
22 305.8 5.82.0 3.5
2.8 0.00.030 0.060
1-24-96 3-13-96
DISSOLVED OXYGEN (D.O.), IN MILLIGRAMS PER LITER
10 20u
2
4
6
8
10
"c
-
"1
fK- :
, , , , i , , , , i , , , ,) 10 20 3
WATER TEMPERATURE (W.T.), IN DEGREES CELSIUS
PH, IN STANDARD UNITS
6 7 8 9 10u
2
tz .Hi 4Li.z ~. 6
S] 8Q
10
19
-
-
-
-
-
-
s.c. ~-
PH "
.v
i i * .
7 8 9 10
0 10 20 30 40 50
u
2
4
6
8
10
10
-
-
-
-
-
III!
-
-
-
\
:
1 1 1 1
0 10 20 30 40 50
SPECIFIC CONDUCTANCE (S.C.), IN MICROSIEMENS PER CENTIMETER AT 25 DEGREES CELSIUS
66
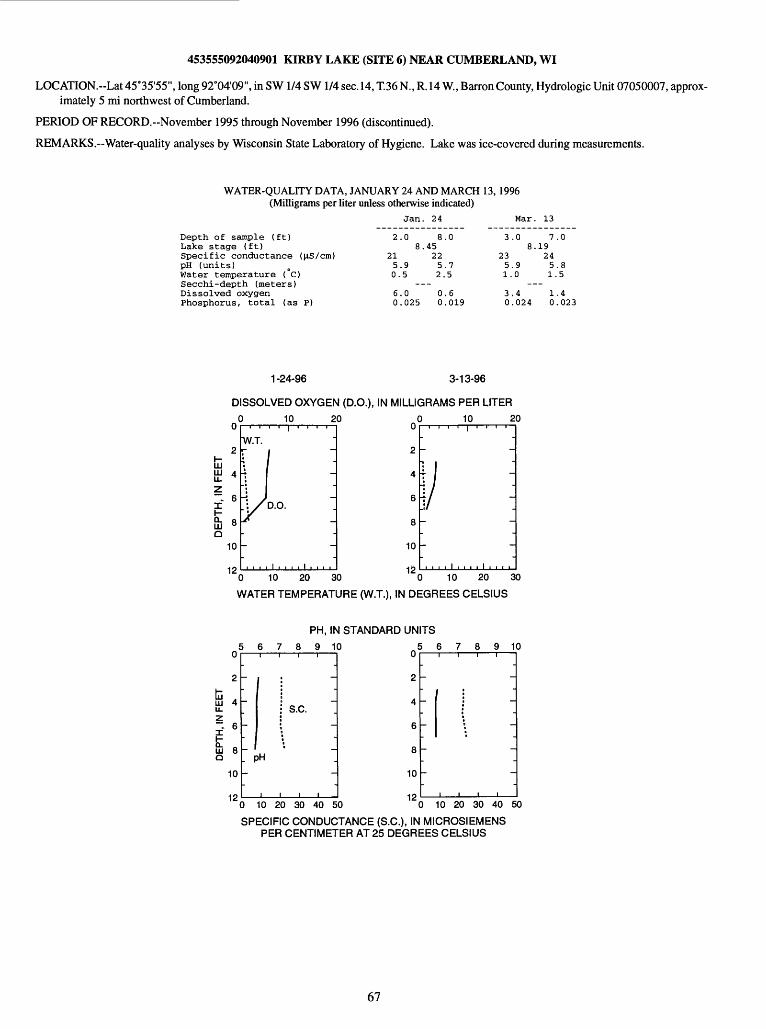
453555092040901 KIRBY LAKE (SITE 6) NEAR CUMBERLAND, WI
LOCATION.-Lat 45°35'55", long 92°04'09", in SW 1/4 SW 1/4 sec. 14, T.36 N., R. 14 W, Barren County, Hydrologic Unit 07050007, approx imately 5 mi northwest of Cumberland.
PERIOD OF RECORD.-November 1995 through November 1996 (discontinued).
REMARKS. Water-quality analyses by Wisconsin State Laboratory of Hygiene. Lake was ice-covered during measurements.
WATER-QUALITY DATA, JANUARY 24 AND MARCH 13,1996 (Milligrams per liter unless otherwise indicated)
Depth of sample (ft)Lake stage (ft)Specific conductance ((is/cm)pH (units)Water temperature ( C)Secchi-depth (meters)Dissolved oxygenPhosphorus, total (as P)
Jan. 24 Mar. 13
2.08.
215.90.5
6.00.025
8.045225.72.5
0.60.019
3.08.
235.91.0
3.40.024
7.019245.81.5
1.40.023
1-24-96 3-13-96
DISSOLVED OXYGEN (D.O.), IN MILLIGRAMS PER LITER
10 20u
2t!ffi 4z~ 6I
2] 8Q
10
iv
W.T.r i ~
y_
~
_5.O.
- -
, , , , i , , , . i , , , ,
10 20
10 20 30
u
2
4
6
8
10
12
/ :
) 10 20 aWATER TEMPERATURE (W.T.), IN DEGREES CELSIUS
PH, IN STANDARD UNITS
7 8 9 10u
2
UJ 4 Li-DEPTH, lf>
00 O>
10
10
-
-
. F
-
-
s.c. ~
>H
i i i i0 10 20 30 40 50
5 6 7 8 9 10
0 10 20 30 40 50
SPECIFIC CONDUCTANCE (S.C.), IN MICROSIEMENS PER CENTIMETER AT 25 DEGREES CELSIUS
67
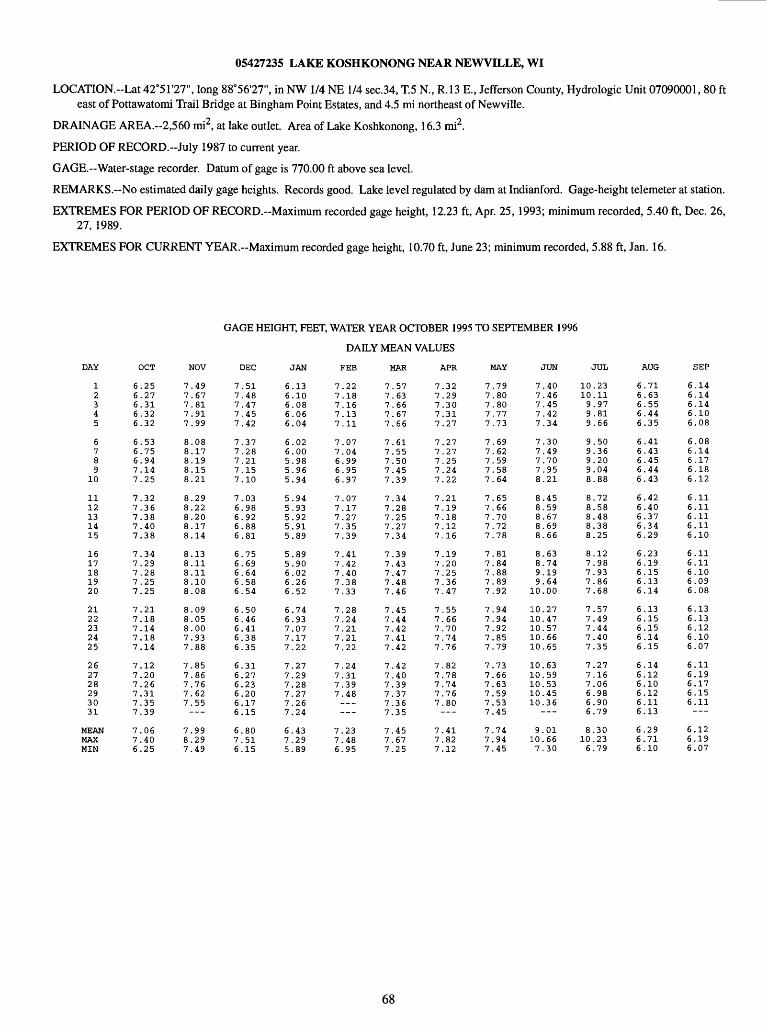
05427235 LAKE KOSHKONONG NEAR NEWVILLE, WI
LOCATION.--Lat 42051'27", long 88°56'27", in NW 1/4 NE 1/4 sec.34, T.5 N., R.I3 E., Jefferson County, Hydrologic Unit 07090001, 80 ft east of Pottawatomi Trail Bridge at Bingham Point Estates, and 4.5 mi northeast of Newville.
DRAINAGE AREA.~2,560 mi2, at lake outlet. Area of Lake Koshkonong, 16.3 mi2 .
PERIOD OF RECORD.--July 1987 to current year.
GAGE. Water-stage recorder. Datum of gage is 770.00 ft above sea level.
REMARKS. No estimated daily gage heights. Records good. Lake level regulated by dam at Indianford. Gage-height telemeter at station.
EXTREMES FOR PERIOD OF RECORD.-Maximum recorded gage height, 12.23 ft, Apr. 25, 1993; minimum recorded, 5.40 ft, Dec. 26, 27, 1989.
EXTREMES FOR CURRENT YEAR.-Maximum recorded gage height, 10.70 ft, June 23; minimum recorded, 5.88 ft, Jan. 16.
OCT
GAGE HEIGHT, FEET, WATER YEAR OCTOBER 1995 TO SEPTEMBER 1996
DAILY MEAN VALUES
NOV DEC MAY JUN AUG SEP
12345
6789
10
1112131415
1617181920
2122232425
262728293031
MEANMAXMIN
6.256.276.316.326.32
6.536.756.947.147.25
7.327.367.387.407.38
7.347.297.287.257.25
7.217.187.147.187.14
7.127.207.267.317.357.39
7.067.406.25
7.497.677.817.917.99
8.088.178.198.158.21
8.298.228.208.178.14
8.138.118.118.108.08
8.098.058.007.937.88
7.857.867.767.627.55
7.998.297.49
7.517.487.477.457.42
7.377.287.217.157.10
7.036.986.926.886.81
6.756.696.646.586.54
6.506.466.416.386.35
6.316.276.236.206.176.15
6.807.516.15
6.136.106.086.066.04
6.026.005.985.965.94
5.945.935.925.915.89
5.895.906.026.266.52
6.746.937.077.177.22
7.277.297.287.277.267.24
6.437.295.89
7.227.187.167.137.11
7.077.046.996.956.97
7.077.177.277.357.39
7.417.427.407.387.33
7.287.247.217.217.22
7.247.317.397.48___
7.237.486.95
7.577.637.667.677.66
7.617.557.507.457.39
7.347.287.257.277.34
7.397.437.477.487.46
7.457.447.427.417.42
7.427.407.397.377.367.35
7.457.677.25
7.327.297.307.317.27
7.277.277.257.247.22
7.217.197.187.127.16
7.197.207.257.367.47
7.557.667.707.747.76
7.827.787.747.767.80
7.417.827.12
7.797.807.807.777.73
7.697.627.597.587.64
7.657.667.707.727.78
7.817.847.887.897.92
7.947.947.927.857.79
7.737.667.637.597.537.45
7.747.947.45
7.407.467.457.427.34
7.307.497.707.958.21
8.458.598.678.698.66
8.638.749.199.64
10.00
10.2710.4710.5710.6610.65
10.6310.5910.5310.4510.36
9.0110.667.30
10.2310.119.979.819.66
9.509.369.209.048.88
8.728.588.488.388.25
8.127.987.937.867.68
7.577.497.447.407.35
7.277.167.066.986.906.79
8.3010.236.79
6.716.636.556.446.35
6.416.436.456.446.43
6.426.406.376.346.29
6.236.196.156.136.14
6.136.156.156.146.15
6.146.126.106.126.116.13
6.296.716.10
6.146.146.146.106.08
6.086.146.176.186.12
6.116.116.116.116.10
6.116.116.106.096.08
6.136.136.126.106.07
6.116.196.176.156.11___
6.126.196.07
68
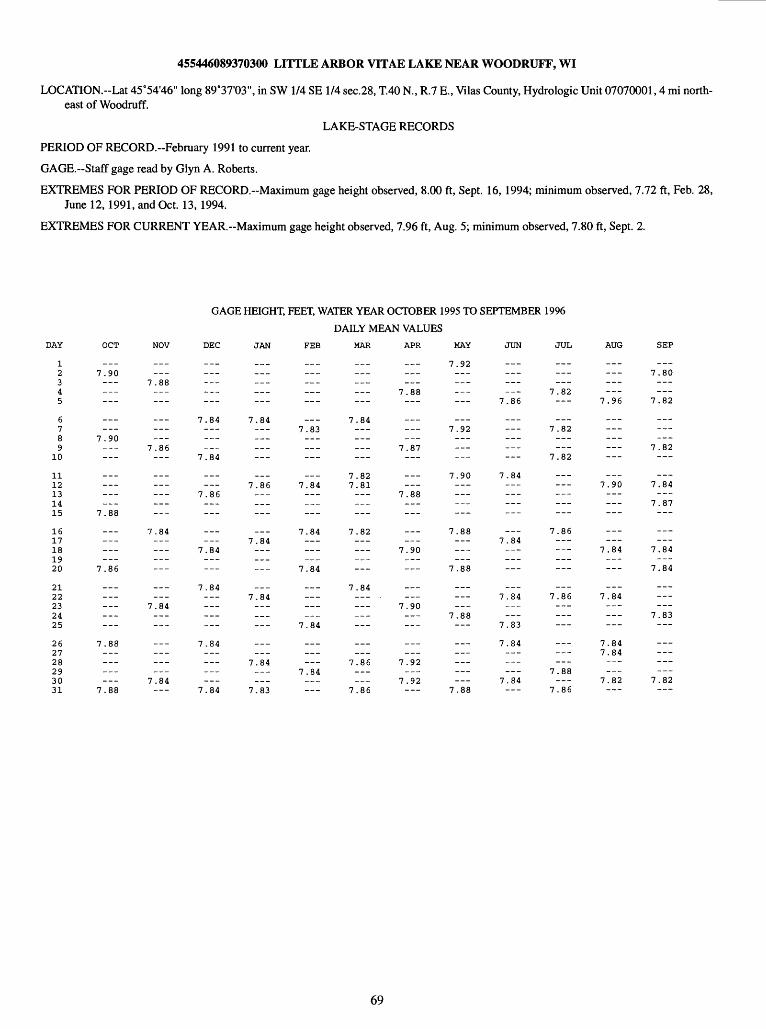
455446089370300 LITTLE ARBOR VITAE LAKE NEAR WOODRUFF, WI
LOCATION.-Lat 45°54'46" long 89°37'03", in SW 1/4 SE 1/4 sec.28, T.40 N., R.7 E., Vilas County, Hydrologic Unit 07070001,4 mi north east of Woodruff.
LAKE-STAGE RECORDS
PERIOD OF RECORD.-February 1991 to current year.
GAGE.-Staff gage read by Glyn A. Roberts.
EXTREMES FOR PERIOD OF RECORD.-Maximum gage height observed, 8.00 ft, Sept. 16, 1994; minimum observed, 7.72 ft, Feb. 28, June 12,1991, and Oct. 13, 1994.
EXTREMES FOR CURRENT YEAR.~Maximum gage height observed, 7.96 ft, Aug. 5; minimum observed, 7.80 ft, Sept. 2.
GAGE HEIGHT, FEET, WATER YEAR OCTOBER 1995 TO SEPTEMBER 1996
DAILY MEAN VALUES
)AY
12345
6789
10
1112131415
1617181920
2122232425
262728293031
OCT
___7.90
___
___
7.90
____________
7.88
_________
7.86
____________
7.88____________
7.88
NOV DEC
___ ______ ___
7.88___
7.84
7.86 7.84
___ ______
7.86
7.84 ___ ___
7.84 ___
7.84
7.84 ___
7.84_________ ___
7.84 7.84
JAN
____________
7.84______
___7.86______
___7.84___
---
___7.84______
______
7.84______
7.83
FEE MAR
___ ______
___ ______
---
7.847.83
______
7.827.84 7.81___ ______
7.84 7.82_________
7.84
7.84___ .______
7.84
___ ___
7.867.84 ___ 7.86
APR
______
7.88
___
7.87
___
7.88
______
7.90___
___
7.90
___
7.92
7.92
MAY
7.92_________
___7.92
7.90
___
7.88
___
7.88
___
7.88
___
___
___7.88
JUN
______
7.86
___
___
7.84______
___7.84
___
___7.84___
7.83
7.84
7.84
JUL
______
7.82
___7.82
7.82
______
---
7.86
---
___7.86___
_________
7.88___
7.86
AUG
____________
7.96
_________
___7.90___
______
7.84---___
___7.84______
7.847.84
7.82
SEP
__7.80
7.82
7.82
7.84___
7.87___
___
7.84
7.84
---
7.83
---
7.82
69

455446089370300 LITTLE ARBOR VITAE LAKE NEAR WOODRUFF, WI-CONTINUED
WATER-QUALITY RECORDS PERIOD OF RECORD.-February 1991 to current year.REMARKS. Lake sampled at the deep hole. Lake ice-covered during March measurements. Water-quality analyses done by Wisconsin State
Laboratory of Hygiene.
WATER-QUALITY DATA, MARCH 12 TO AUGUST 14, 1996 (Milligrams per liter unless otherwise indicated)
Mar. 12 May 16 June 25 July 26 Aug. 14
Depth of sample (ft)Lake stage (ft)Specific conductance (^.S/cm)pH (units)Water temperature ( C)Color (Pt-Co. scale)Turbidity (NTU)Secchi-depth (meters)Dissolved oxygenHardness, as CaC03Calcium, dissolved (Ca)Magnesium, dissolved (Mg)Sodium, dissolved (Na)Potassium, dissolved (K)Alkalinity, as CaC03Sulfate, dissolved (S04)Chloride, dissolved (Cl)Fluoride, dissolved (F)Silica, dissolved (Si02)Solids, dissolved, at 180°CNitrogen, N02 + N03, diss. (as N)Nitrogen, ammonia, dissolved (as N)Nitrogen, organic, total (as N)Nitrogen, amm. + org., total (as N)Nitrogen, total (as N)Phosphorus, total (as P)Phosphorus, ortho, dissolved (as P)Iron, dissolved (Fe) \ig/LManganese, dissolved (Mn) (ig/LChlorophyll a, phytoplankton (\ig/L)
3-12-96
3.0
1257.51.0
7.2
___
t )
f)
,) ___
,)
287.81
2588.06.0
___0.2
___
___
______
1
9778.152
124613320
4762
<09
720
<000000
17021017
.57.
.65
.01.
.0
.4
.4
.7
.0
.7
.1
.6
.07
.03
.50
.50
.57
.035
.004
2886114
75307
58
5415420
58720
12860000000
630480
-
.2.5
.0
.6
.0
.5
.9
.0
.6
.1
.01
.43
.47
.90
.91
.061
.009
1.57.
1058.1
20.5______
1.9.7
___
___
_________
_________0.023___ ___
15
2783144
7.113.0
70.2
_________
1.57.
1098.4
21.5
1.9.3
0.026___
15
2784185
7.215.0
60.2
0.302
1.57.
1058.7
22.5______
1.9.9________________________
____________
___
0.029
___43
3287291
7.714.0______
00.2
___
______------ _______________0.16
---
10 20
m
~~-16
I m Q 24
3210 20 30
5-16-96 6-25-96 7-26-96
DISSOLVED OXYGEN (D.O.), IN MILLIGRAMS PER LITER10 20
U
8
16
24
so
-
-
:' ' j ' ' ' :
' I iW.T. I :
/ :
/ D.O. j
i i i i i i i i i i i-
10 10 20
16
24
3210 20 30 0 10 20 30 0 10 20
WATER TEMPERATURE (W.T.), IN DEGREES CELSIUS
30
8-14-96
10 20u
8
16
24
3932 £
1 ' ' ' 1 ' ' § ' ' -
-_
\ 1 ^-_
, , , , 1 , , ',' , i , , , , -
) 10 20 3
PH, IN STANDARD UNITS789 10 6789 10 6789 10 6 7 8 9 10 6 7 8 9 10Oc i i i 3 Oc i i i n Oc i i i 3 0u
1- ftHI oHI H.Z ~ 16
£HIQ 24
V3
1
-
Pf
« ii ;
:~
:
-i
V S.C. :v »»% -
A \ 116
24
32
16
24
32
16
24
32
16
24
320 100 200 300 " 0 100 200 300 0 100 200 300 0 100 200 300 0 100 200 300
SPECIFIC CONDUCTANCE (S.C.), IN MICROSIEMENS PER CENTIMETER AT 25 DEGREES CELSIUS
70
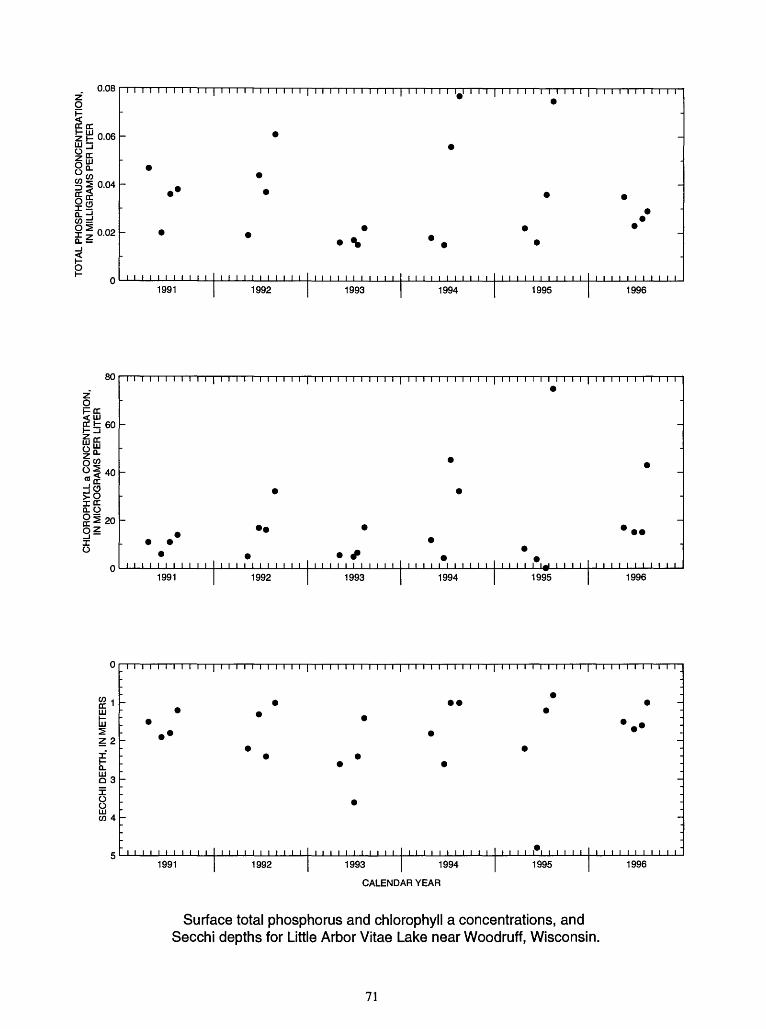
CO 8 g
3-S. CD
Q.
O
(D
®"D
-
E?
2-
o>
B|
L_.
0>
CJ
O)
O
Q,
<i.
S"
O
CD
*^ -i 13 *
<.
(D
O
7Z8.
8-i
2.
c
=t
^ f
l>
w-
co8
0
)
i
g.
SECCHI DEP
TH,
IN METERS
A
o
i\>
-
o
CH
LOR
OP
HY
LL a
CO
NC
EN
TR
AT
ION
, IN
MIC
RO
GR
AM
S P
ER
LIT
ER
ro
*.
o>
o
o
o
TO
TA
L P
HO
SP
HO
RU
S C
ON
CE
NT
RA
TIO
N,
IN M
ILLI
GR
AM
S P
ER
LIT
ER
po
pe
b
b
b
co
ro
*.
55
o
0
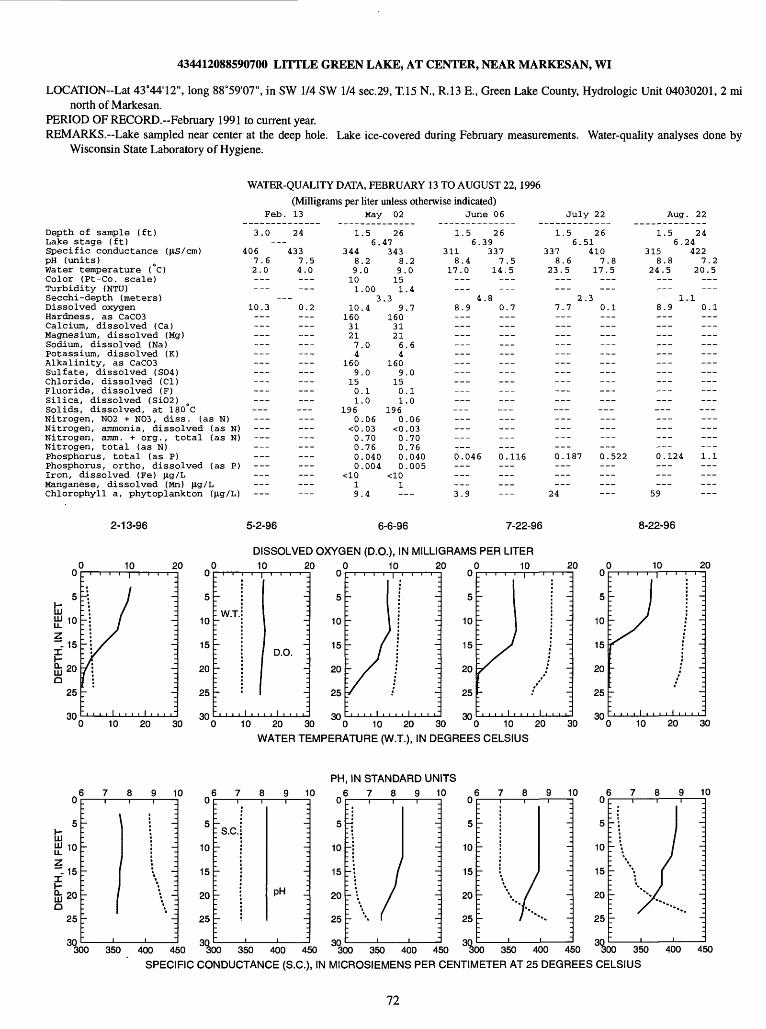
434412088590700 LITTLE GREEN LAKE, AT CENTER, NEAR MARKESAN, WI
LOCATION«Lat 43°44'12", long 88°59'07", in SW 1/4 SW 1/4 sec.29, T.15 N., R.13 E., Green Lake County, Hydrologic Unit 04030201, 2 minorth of Markesan.
PERIOD OF RECORD.-February 1991 to current year. REMARKS. Lake sampled near center at the deep hole. Lake ice-covered during February measurements. Water-quality analyses done by
Wisconsin State Laboratory of Hygiene.
WATER-QUALITY DATA, FEBRUARY 13 TO AUGUST 22, 1996
(Milligrams per liter unless otherwise indicated)Feb. 13
Depth of sample (ft)Lake stage (ft)Specific conductance (H.S/CTI)pH (units)Water temperature ( C)Color (Pt-Co. scale)Turbidity (NTU)Secchi-depth (meters)Dissolved oxygenHardness, as CaC03Calcium, dissolved (Ca)Magnesium, dissolved (Mg)Sodium, dissolved (Na)Potassium, dissolved (K)Alkalinity, as CaC03Sulfate, dissolved (S04)Chloride, dissolved (Cl)Fluoride, dissolved (F)Silica, dissolved (Si02)Solids, dissolved, at 180 CNitrogen, N02 + N03, diss. (as N)Nitrogen, ammonia, dissolved (as N)Nitrogen, amm. + org., total (as N)Nitrogen, total (as N)Phosphorus, total (as P)Phosphorus, ortho, dissolved (as P)Iron, dissolved (Fe) H-g/LManganese, dissolved (Mn) (ig/LChlorophyll a, phytoplankton
May 02 June 06 July 22 Aug. 22
3.0
4067.62.0------
10.3---___
_______________---___
___---
24
4337.54.0______
0.2
----___
____________
1
34489.101
10160312174
1609
1501
1960
<00000
19
.56.
.20
.003
.4
.0
.0
.1
.0
.06
.03
.70
.76
.040
.004
.4
2647343
89151
.39
160312164
1609
1501
1960
<00000
1-
.2.0
.4
.7
.6
.0
.1
.0
.06
.03
.70
.76
.040
.005
--
1.56.
3118.4
17.0
___4
8.9______
_________
---
___0.046
___3.9
2639337
7.514.5______
.80.7
_________------ ---
0.116
___
1.56.
3378.6
23.5---___
27.7
_______________
---
0.187
___24
2651410
7.817.5
___.3
0.1______
_________
___
0.522
___
1.56.
3158.8
24.5
___1
8.9______
______
___------___---_________0.124___
59
2424422
7.220.5 ---
.10.1______---
___
___
___1.1
---
2-13-96 5-2-96 6-6-96 7-22-96 8-22-96
UJ10
z~ 15
10
10 20
20
30
DISSOLVED OXYGEN (D.O.), IN MILLIGRAMS PER LITER 10 20 .0 10 20 .0 10
u
5
10
15
20
25
in
: ' '
r: W.T.
r
-
-
1 ' ' ' :
-.
-.
D.O. ":-_
-_
10 20 30 0 10 20 30 0 10 20
WATER TEMPERATURE (W.T.), IN DEGREES CELSIUS
20
30
10
10 20
20u
5
10
15
20
25
nn
')
-_
-.
, , , , I , . . . I . . . .-30
PH, IN STANDARD UNITS
u
5
ftUJ10
Z~1 15I
&20O
25
in
1
_
-
-
r:
r
1 '
_;i-
-_-
_-
\ -^*, ~
\
10
300 350 400 450
u
5
10
15
20
25
in
', '
i~sc'-
r
r
r: ,
1
-j
-|
-_
pH J
-.
i
10
350 400 450
8 10
300 350 400 450
u
5
10
15
20
25
in
j '
j-
-
N1
-_-_-_-_
«
10
350 400 450
10
350 400 450
SPECIFIC CONDUCTANCE (S.C.), IN MICROSIEMENS PER CENTIMETER AT 25 DEGREES CELSIUS
72
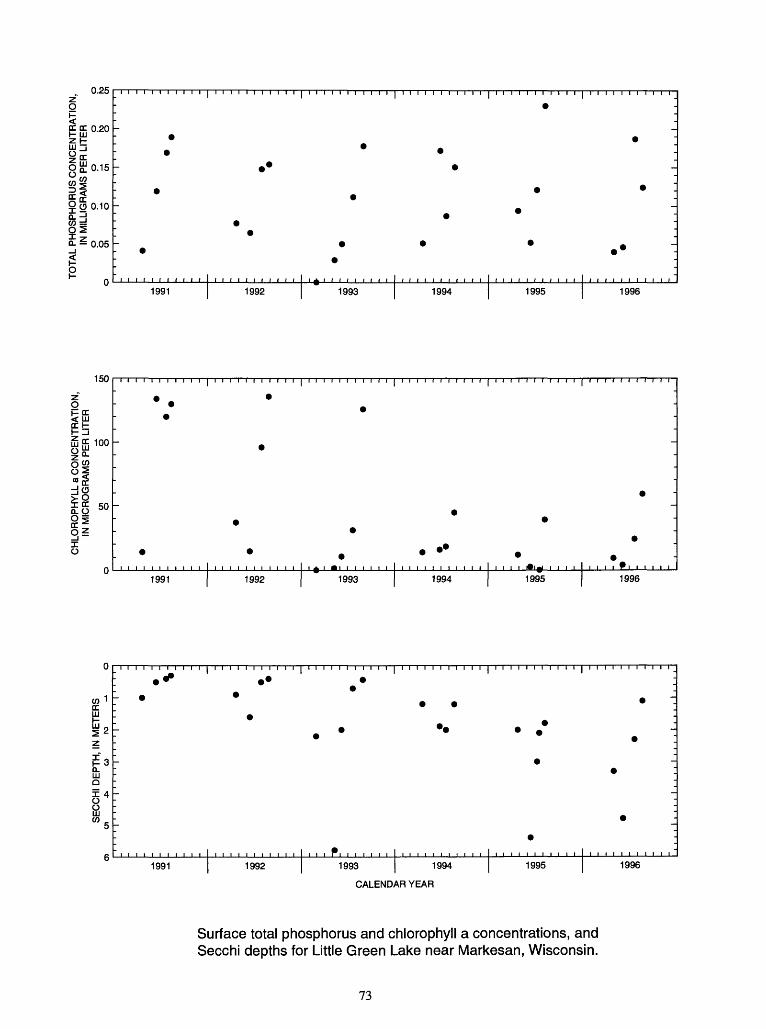
ro
c
2 ^
O
O)
?
O
&S
"O
-*
w -
a w
ro ^
ro
0)§ i
^2
if
0)
v^
1
i
^
0)
03
O
ro ^
JD ro
P
2.
55' o
O
3
O
0)
l§ ?
Q.
SE
CC
HI
DE
PT
H,
IN M
ET
ER
S
CH
LOR
OP
HY
LL a
CO
NC
EN
TR
AT
ION
, IN
MIC
RO
GR
AM
S P
ER
LIT
ER
TO
TA
L P
HO
SP
HO
RU
S C
ON
CE
NT
RA
TIO
N,
IN M
ILLI
GR
AM
S P
ER
LIT
ER
p
p
p
p
p
o
en
o
en
o
en
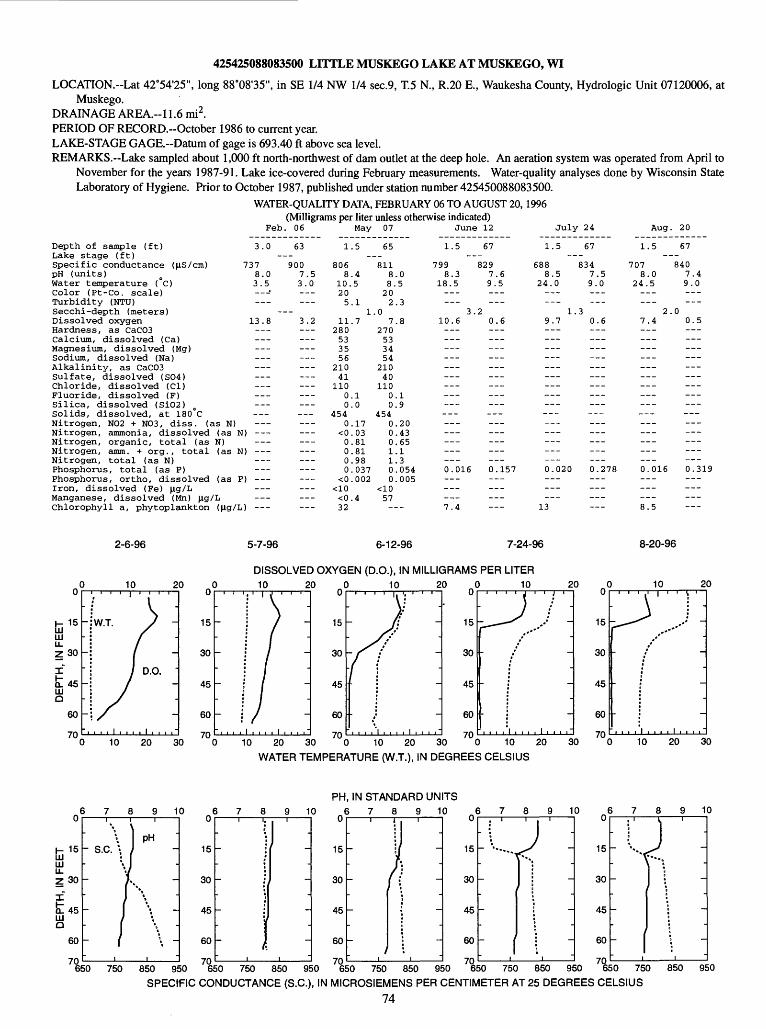
425425088083500 LITTLE MUSKEGO LAKE AT MUSKEGO, WI
LOCATION.-Lat 42°54'25", long 88°08'35", in SE 1/4 NW 1/4 sec.9, T.5 N., R.20 E., Waukesha County, Hydrologic Unit 07120006, atMuskego.
DRAINAGE AREA.-11.6 mi2 . PERIOD OF RECORD.-October 1986 to current year. LAKE-STAGE GAGE.-Datum of gage is 693.40 ft above sea level. REMARKS. Lake sampled about 1,000 ft north-northwest of dam outlet at the deep hole. An aeration system was operated from April to
November for the years 1987-91. Lake ice-covered during February measurements. Water-quality analyses done by Wisconsin StateLaboratory of Hygiene. Prior to October 1987, published under station number 425450088083500.
WATER-QUALITY DATA, FEBRUARY 06 TO AUGUST 20, 1996 (Milligrams per liter unless otherwise indicated)
Feb
Depth of sample (ft)Lake stage (ft)Specific conductancepH (units)Water temperature (°C)Color (Pt-Co. scale)Turbidity (NTU)Secchi-depth (meters)Dissolved oxygenHardness, as CaCO3Calcium, dissolved (Ca)Magnesium, dissolved (Mg)Sodium, dissolved (Na)Alkalinity, as CaCO3Sulfate, dissolved (SO4)Chloride, dissolved (CDFluoride, dissolved (F)Silica, dissolved (SiO2)Solids, dissolved, at 180 CNitrogen, NO2 + NO3, diss. (as N)Nitrogen, ammonia, dissolved (as N)Nitrogen, organic, total (as N)Nitrogen, amm. + org., total (as N)Nitrogen, total (as N)Phosphorus, total (as P)Phosphorus, ortho, dissolved (as P)Iron, dissolved (Fe) (ig/LManganese, dissolved (Mn) fig/LChlorophyll a, phytoplankton (|ig/L)
Feb.
3.0
7378.03.5
--
13.8
_________
0
0
>>
___,)
06
63
9007.53.0
-3.2
______
______
1
8068
10.205
11280533556
21041
11000
4540
<00000
<0
<032
May
.5
.45
.11
.7
.1
.0
.17
.03
.81
.81
.98
.037
.002
.4
07
65
81188202
.07
270533454
21040
11000
4540001100
57-
.0.5
.3
.8
.1
.9
.20
.43
.65
.1
.3
.054
.005
--
June
1.5
7998.3
18.5______
3.10.6
0.016
7.4
12
67
8297.69.5______
20.6---___
___
___0.157
July
1.5
688 88.5
24.0---
1.39.7
_________---
------0.020___
13
24
67
347.59.0______
0.6
____________
___0.278___
Aug
1.5
7078.0
24.5
27.4
_____________________0.016___
8.5
. 20
67
8407.49.0___
.00.5
______---
___---0.31___
2-6-96
10
5-7-96 6-12-96 7-24-96 8-20-96
10 20 30
DISSOLVED OXYGEN (D.O.), IN MILLIGRAMS PER LITER10 20
10 20 30
10 20
10 20 30
10 20u
15
30
45
60
70 c
' j ' ' /
~\^ ~
/
,,,,!,,,,-
10 20 3
WATER TEMPERATURE (W.T.), IN DEGREES CELSIUS
00
15
30
45
60
70 c
10 2
r^.J-/
-
10 20 3
PH, IN STANDARD UNITS
u
h- 150101o.Z 30
I£ 4501a
60
706i
'*. V '
\ 1 PH- s.c. \ i
i\ 1\J!*
1 \
\i »
1f \ -
i i50 750 850 9£
u
15
30
45
60
7050 6!
' ': ----_
,,
50 750
1-
-
-
-
-
_
-
-
,850 95
10 o e
15
30
45
60
vn
5 7
-
-
-
;
8 9 1i i i
r --
-
u
15
30
45
60
vn
: '
***!
-
-
-,
1 '
n "
-
-1
u
15
30
45
60
70
" ** %*5
-
-
-,
) -***
\
I
I1
350 750 850 950 650 750 850 950 SPECIFIC CONDUCTANCE (S.C.), IN MICROSIEMENS PER CENTIMETER AT 25 DEGREES CELSIUS
74
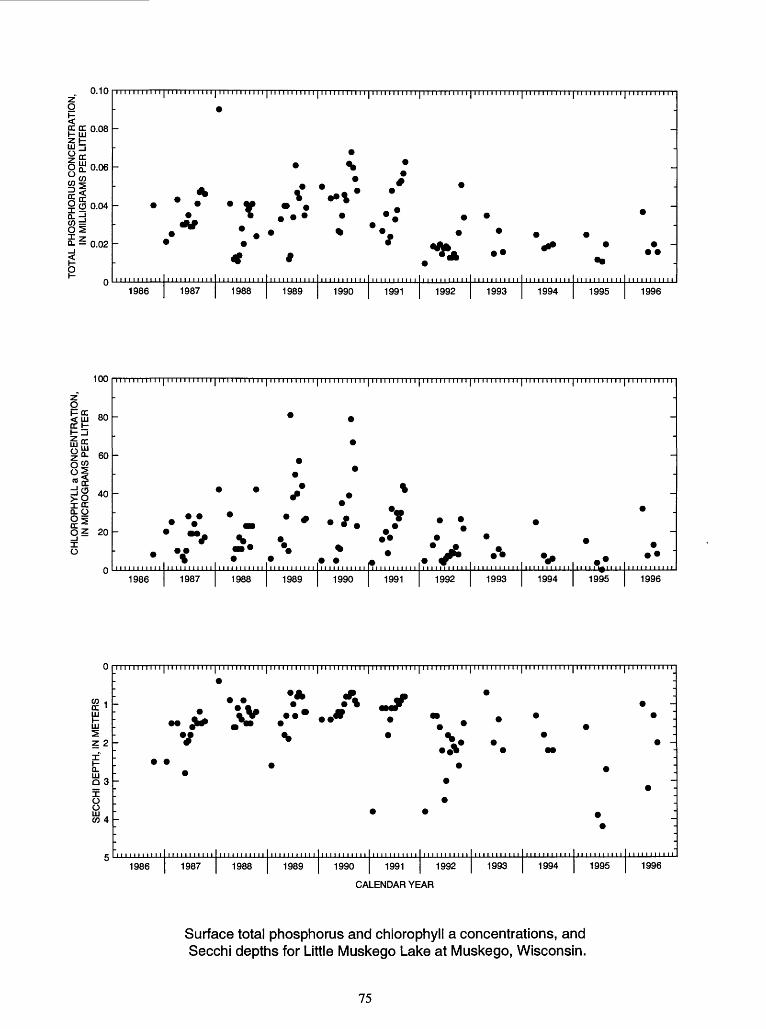
U.1U
g
f£°-08Z 1- UJ j
0^0.06
CO^
9 0 0.04ij
S - 0.02_i
*~ 0
.'""""" '""""" 9 '"""" "'"""" """" 1 " 1 """"" """"'" """"'" '""""" " 1 """" 1M11111111_
-
i
* «y **" ^ .. .
* . ^
", ,,,,,,,,,,, ,*, , ,,' ,.,,,, , ,,*.,,A , **, , , *, ," ;1986 1987 1988 1989 1990 1991 1992 1993 1994 1995 1996
100
o Foe
80
60
iz 20
1986 1987 1988 1989 1990 1991 1992 1993 1994 1995 1996
CO 4CC ' UJ
a.LJJ Q 3
O Oco 4
* f\ / * *
1986 1987 1988 1989 1990 1991 1992 1993 1994 1995 1996
CALENDAR YEAR
Surface total phosphorus and chlorophyll a concentrations, and Secchi depths for Little Muskego Lake at Muskego, Wisconsin.
75
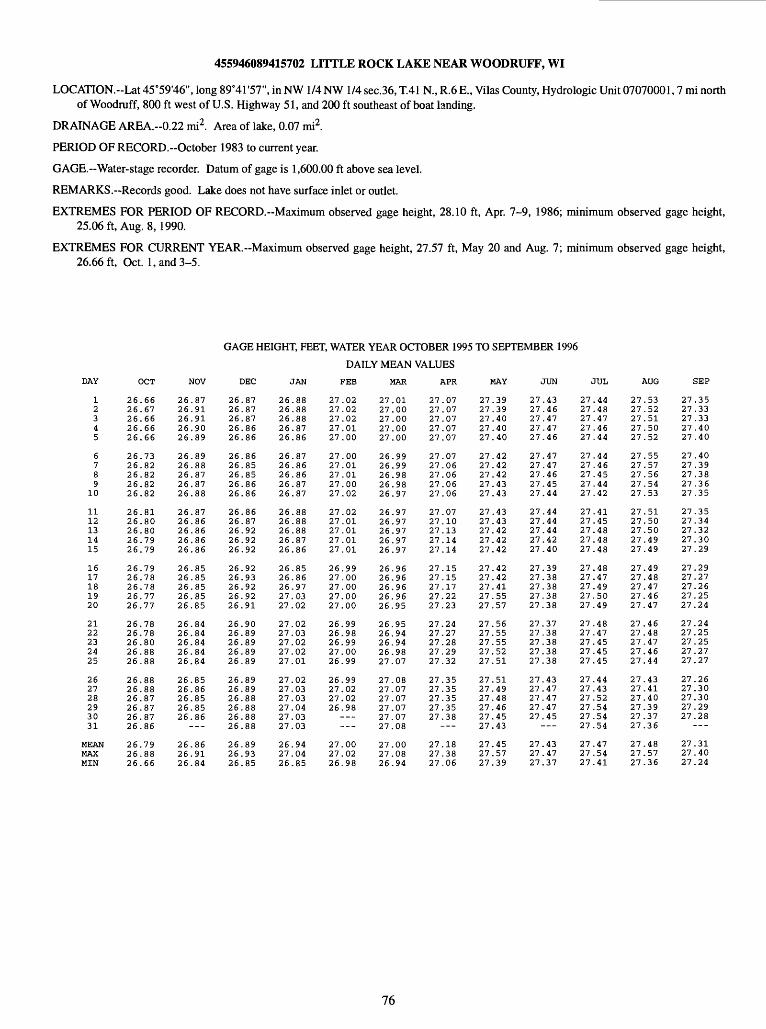
455946089415702 LITTLE ROCK LAKE NEAR WOODRUFF, WI
LOCATION.-Lat 45°59'46", long 89041'57", in NW 1/4 NW 1/4 sec.36, T.41 N., R.6 E., Vilas County, Hydrologic Unit 07070001,7 mi north of Woodruff, 800 ft west of U.S. Highway 51, and 200 ft southeast of boat landing.
DRAINAGE AREA.-0.22 mi2. Area of lake, 0.07 mi2.
PERIOD OF RECORD.-October 1983 to current year.
GAGE.--Water-stage recorder. Datum of gage is 1,600.00 ft above sea level.
REMARKS. Records good. Lake does not have surface inlet or outlet.
EXTREMES FOR PERIOD OF RECORD.-Maximum observed gage height, 28.10 ft, Apr. 7-9, 1986; minimum observed gage height, 25.06 ft, Aug. 8,1990.
EXTREMES FOR CURRENT YEAR.-Maximum observed gage height, 27.57 ft, May 20 and Aug. 7; minimum observed gage height, 26.66ft, Oct. 1, and 3-5.
12345
6789
10
1112131415
1617181920
2122232425
262728293031
MEANMAXMIN
OCT
26.6626.6726.6626.6626.66
26.7326.8226.8226.8226.82
26.8126.8026.8026.7926.79
26.7926.7826.7826.7726.77
26.7826.7826.8026.8826.88
26.8826.8826.8726.8726.8726.86
26.7926.8826.66
NOV
26.8726.9126.9126.90
GAGE HEIGHT, FEET, WATER YEAR OCTOBER 1995 TO SEPTEMBER 1996
DAILY MEAN VALUES
DEC JAN FEE MAR APR MAY JUN
26.8926.8826.8726.8726.88
26.8726.8626.8626.8626.86
26.8526.8526.8526.8526.85
26.8426.8426.8426.8426.84
26.8526.8626.8526.8526.86
26.8626.9126.84
26.8726.8726.8726.8626.86
26.8626.8526.8526.8626.86
26.8626.8726.9226.9226.92
26.9226.9326.9226.9226.91
26.9026.8926.8926.8926.89
26.8926.8926.8826.8826.8826.88
26.8926.9326.85
26.8826.8826.8826.8726.86
26.8726.8626.8626.8726.87
26.8826.8826.8826.8726.86
26.8526.8626.9727.0327.02
27.0227.0327.0227.0227.01
27.0227.0327.0327.0427.0327.03
26.9427.0426.85
27.0227.0227.0227.0127.00
27.0027.0127.0127.0027.02
27.0227.0127.0127.0127.01
26.9927.0027.0027.0027.00
26.9926.9826.9927.0026.99
26.9927.0227.0226.98
27.0027.0226.98
27.0127.0027.0027.0027.00
26.9926.9926.9826.9826.97
26.9726.9726.9726.9726.97
26.9626.9626.9626.9626.95
26.9526.9426.9426.9827.07
27.0827.0727.0727.0727.0727.08
27.0027.0826.94
27.0727.0727.0727.0727.07
27.0727.0627.0627.0627.06
27.0727.1027.1327.1427.14
27.1527.1527.1727.2227.23
27.2427.2727.2827.2927.32
27.3527.3527.3527.3527.38
27.1827.3827.06
27.3927.3927.4027.4027.40
27.4227.4227.4227.4327.43
27.4327.4327.4227.4227.42
27.4227.4227.4127.5527.57
27.5627.5527.5527.5227.51
27.5127.4927.4827.4627.4527.43
27.4527.5727.39
27.4327.4627.4727.4727.46
27.4727.4727.4627.4527.44
27.4427.4427.4427.4227.40
27.3927.3827.3827.3827.38
27.3727.3827.3827.3827.38
27.4327.4727.4727.4727.45
27.4327.4727.37
JUL
27.4427.4827.4727.4627.44
27.4427.4627.4527.4427.42
27.4127.4527.4827.4827.48
27.4827.4727.4927.5027.49
27.4827 .4727.4527.4527.45
27.4427.4327.5227.5427.5427.54
27.4727.5427.41
AUG
27.5327.5227.5127.5027.52
27.5527.5727.5627.5427.53
27.5127.5027.5027.4927.49
27.4927.4827.4727.4627.47
27.4627.4827.4727.4627.44
27.4327.4127.4027.3927.3727.36
27.4827.5727.36
SEP
27.3527.3327.3327.4027.40
27.4027.3927.3827.3627.35
27.3527.3427.3227.3027.29
27.2927.2727.2627.2527.24
27.2427.2527.2527.2727.27
27.2627.3027.3027.2927.28
27.3127.4027.24
76
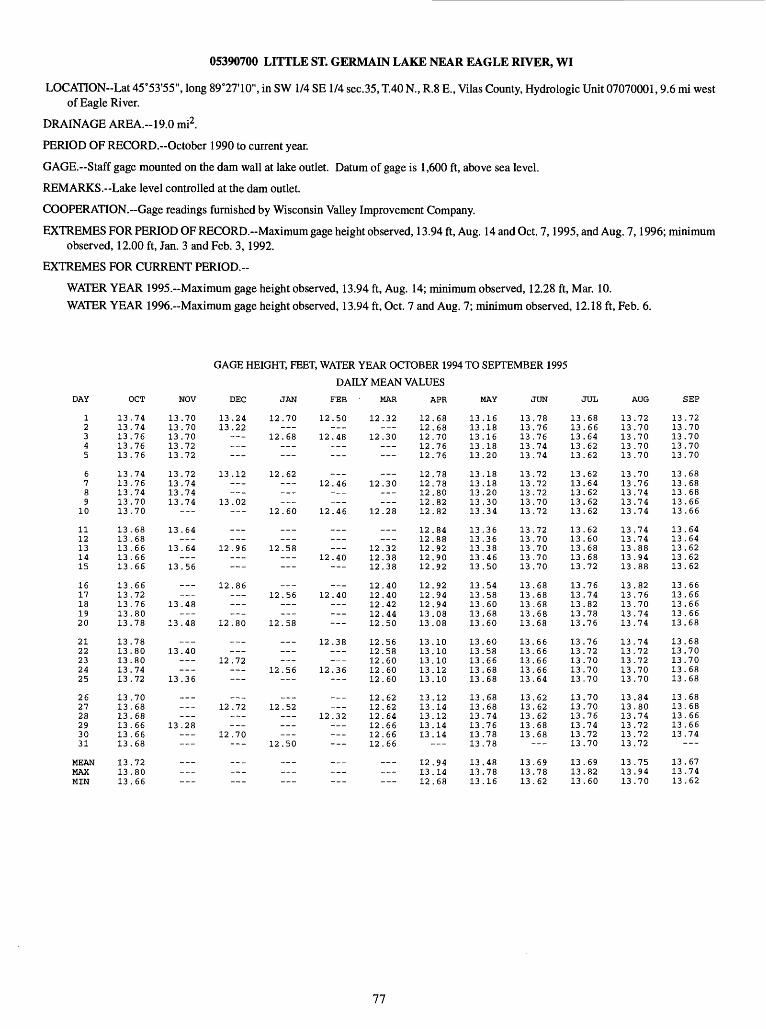
05390700 LITTLE ST. GERMAIN LAKE NEAR EAGLE RIVER, WI
LOCATION--Lat 45°53'55", long 89°27'10", in SW 1/4 SE 1/4 sec.35, T.40 R, R.8 E., Vilas County, Hydrologic Unit 07070001,9.6 mi west of Eagle River.
DRAINAGE AREA.-19.0 mi2 .
PERIOD OF RECORD.--October 1990 to current year.
GAGE.-Staff gage mounted on the dam wall at lake outlet. Datum of gage is 1,600 ft, above sea level.
REMARKS. Lake level controlled at the dam outlet.
COOPERATION.-Gage readings furnished by Wisconsin Valley Improvement Company.
EXTREMES FOR PERIOD OF RECORD.-Maximum gage height observed, 13.94 ft, Aug. 14 and Oct. 7,1995, and Aug. 7,1996; minimum observed, 12.00 ft, Jan. 3 and Feb. 3,1992.
EXTREMES FOR CURRENT PERIOD.-
WATER YEAR 1995.--Maximum gage height observed, 13.94 ft, Aug. 14; minimum observed, 12.28 ft, Mar. 10. WATER YEAR 1996.~Maximum gage height observed, 13.94 ft, Oct. 7 and Aug. 7; minimum observed, 12.18 ft, Feb. 6.
GAGE HEIGHT, FEET, WATER YEAR OCTOBER 1994 TO SEPTEMBER 1995
DAILY MEAN VALUES
OCT NOV DEC JAN FEE MAR APR MAY JUN JUL AUG SEP
12345
6789
10
1112131415
1617181920
2122232425
262728293031
MEANMAXMIN
13.7413.7413.7613.7613.76
13.7413.7613.7413.7013.70
13.6813.6813.6613.6613.66
13.6613.7213.7613.8013.78
13.7813.8013.8013.7413.72
13.7013.6813.6813.6613.6613.68
13.7213.8013.66
13.7013.7013.7013.7213.72
13.7213.7413.7413.74
13.64___
13.64___
13.56
______
13.48___
13.48
___13.40
______
13.36
_________
13.28
___
_________
13.2413.22
___
13.12
___13.02
______
12.96___
12.86_________
12.80
______
12.72
___12.72
12.70
___
12.70
12.68___
12.62
___
12.60
______
12.58___
___12.56
12.58
___
12.56
___12.52
______
12.50
___
12.50___
12.48___
___12.46
___
12.46
___
12.40
___12.40
______
12.38____.._
12.36
___
12.32______
______
12.32
12.30
___12.30
______
12.28
___
12.3212.3812.38
12.4012.4012.4212.4412.50
12.5612.5812.6012.6012.60
12.6212.6212.6412.6612.6612.66
______
12.6812.6812.7012.7612.76
12.7812.7812.8012.8212.82
12.8412.8812.9212.9012.92
12.9212.9412.9413.0813.08
13.1013.1013.1013.1213.10
13.1213.1413.1213.1413.14
---
12.9413.1412.68
13.1613.1813.1613.1813.20
13.1813.1813.2013.3013.34
13.3613.3613.3813.4613.50
13.5413.5813.6013.6813.60
13.6013.5813.6613.6813.68
13.6813.6813.7413.7613.7813.78
13.4813.7813.16
13.7813.7613.7613.7413.74
13.7213.7213.7213.7013.72
13.7213.7013.7013.7013.70
13.6813.6813.6813.6813.68
13.6613.6613.6613.6613.64
13.6213.6213.6213.6813.68
13.6913.7813.62
13.6813.6613.6413.6213.62
13.6213.6413.6213.6213.62
13.6213.6013.6813.6813.72
13.7613.7413.8213.7813.76
13.7613.7213.7013.7013.70
13.7013.7013.7613.7413.7213.70
13.6913.8213.60
13.7213.7013.7013.7013.70
13.7013.7613.7413.7413.74
13.7413.7413.8813.9413.88
13.8213.7613.7013.7413.74
13.7413.7213.7213.7013.70
13.8413.8013.7413.7213.7213.72
13.7513.9413.70
13.7213.7013.7013.7013.70
13.6813.6813.6813.6613.66
13.6413.6413.6213.6213.62
13.6613.6613.6613.6613.68
13.6813.7013.7013.6813.68
13.6813.6813.6613.6613.74
___
13.6713.7413.62
77
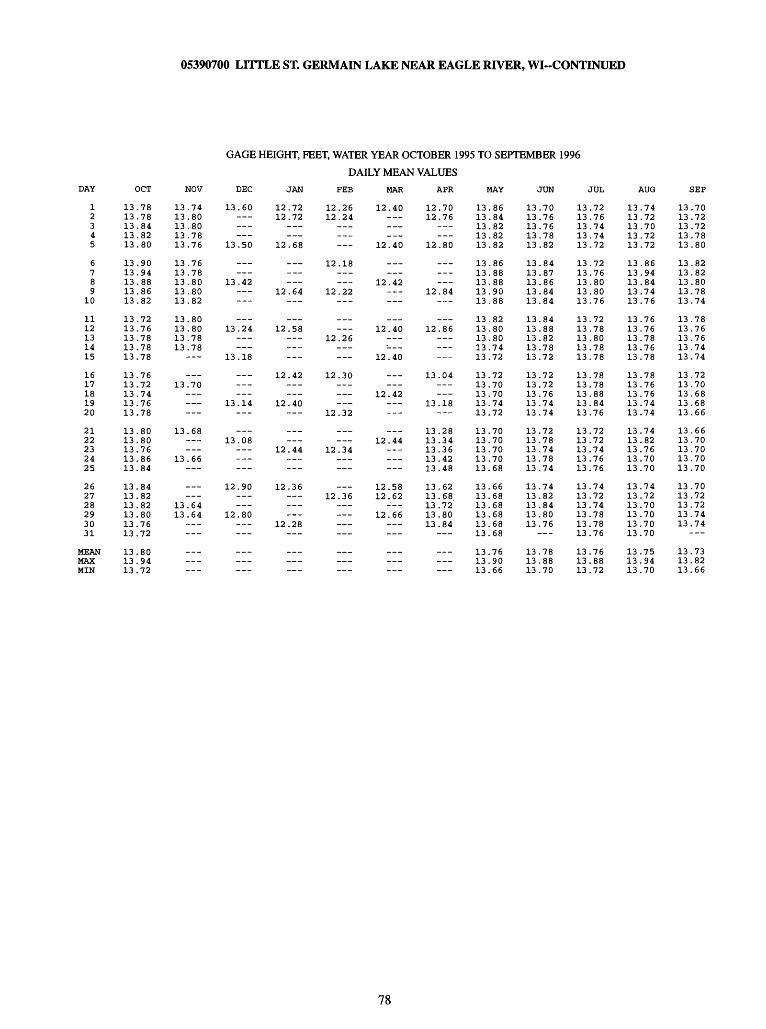
05390700 LITTLE ST. GERMAIN LAKE NEAR EAGLE RIVER, WI--CONTINUED
GAGE HEIGHT, FEET, WATER YEAR OCTOBER 1995 TO SEPTEMBER 1996
DAILY MEAN VALUES
DAY OCT NOV DEC JAN FEE MAR APR MAY JUN JUL AUG SEP
1 13.78 13.74 13.60 12.72 12.26 12.40 12.70 13.86 13.70 13.72 13.74 13.702 13.78 13.80 12.72 12.24 12.76 13.84 13.76 13.76 13.72 13.723 13.84 13.80 13.82 13.76 13.74 13.70 13.724 13.82 13.78 13.82 13.78 13.74 13.72 13.785 13.80 13.76 13.50 12.68 12.40 12.80 13.82 13.82 13.72 13.72 13.80
6 13.90 13.76 12.187 13.94 13.78 8 13.88 13.80 13.42 9 13.86 13.80 12.64 12.22
10 13.82 13.82
11 13.72 13.80 12 13.76 13.80 13.24 12.5813 13.78 13.78 12.2614 13.78 13.7815 13.78 13.18
16 13.76 12.42 12.3017 13.72 13.70 18 13.7419 13.76 13.14 12.4020 13.78 12.32
21 13.80 13.6822 13.80 13.08 23 13.76 12.44 12.3424 13.86 13.6625 13.84
26 13.84 12.90 12.36 27 13.82 12.3628 13.82 13.6429 13.80 13.64 12.80 30 13.76 12.28 31 13.72
MEAN 13.80 MAX 13.94 MIN 13.72 ---
12.42
___12.40
12.40
______
12.42___
___12.44
______
12.5812.62
___12.66
___
_________
12
12
13
13
1313131313
1313131313
.84 -
___.86______
.04
.18
.28
.34
.36
.42
.48
.62
.68.72'
.80
.84 -
___
1313131313
1313131313
1313131313.
1313131313.
13.13.131313.13.
13.13.13,
.86
.88
.88
.90
.88
.82
.80
.80
.74
.72
.72
.70
.70
.74
.72
.70
.70
.70
.70
.68
.66
.68
.68
.68
.68
.68
.76
.90
.66
1313131313
1313131313
1313131313
1313131313
1313131313
131313
.84
.87
.86
.84
.84
.84
.88
.82
.78
.72
.72
.72
.76
.74
.74
.72
.78
.74
.78
.74
.74
.82
.84
.80
.76 -
.78
.88
.70
1313131313
1313131313
1313.1313.13
13.13.13,13.13,
13.13.13,13,13,13,
13,13,13,
.72
.76
.80
.80
.76
.72
.78
.80
.78
.78
.78
.78
.88
.84
.76
.72
.72
.74
.76
.76
.74
.72
.74
.78
.78
.76
.76
.88
.72
1313131313
13131313,13.
13.13.13.13.13.
13.13.13,13.13,
13.13.13,13,13.13.
13,13.13,
.86
.94
.84
.74
.76
.76
.76
.78
.76
.78
.78
.76
.76
.74
.74
.74
.82
.76
.70
.70
.74
.72
.70
.70
.70
.70
.75
.94
.70
1313131313
1313131313
1313131313
1313131313
1313131313
131313
.82
.82
.80
.78
.74
.78
.76
.76
.74
.74
.72
.70
.68
.68
.66
.66
.70
.70
.70
.70
.70
.72
.72
.74
.74
.73
.82
.66
78
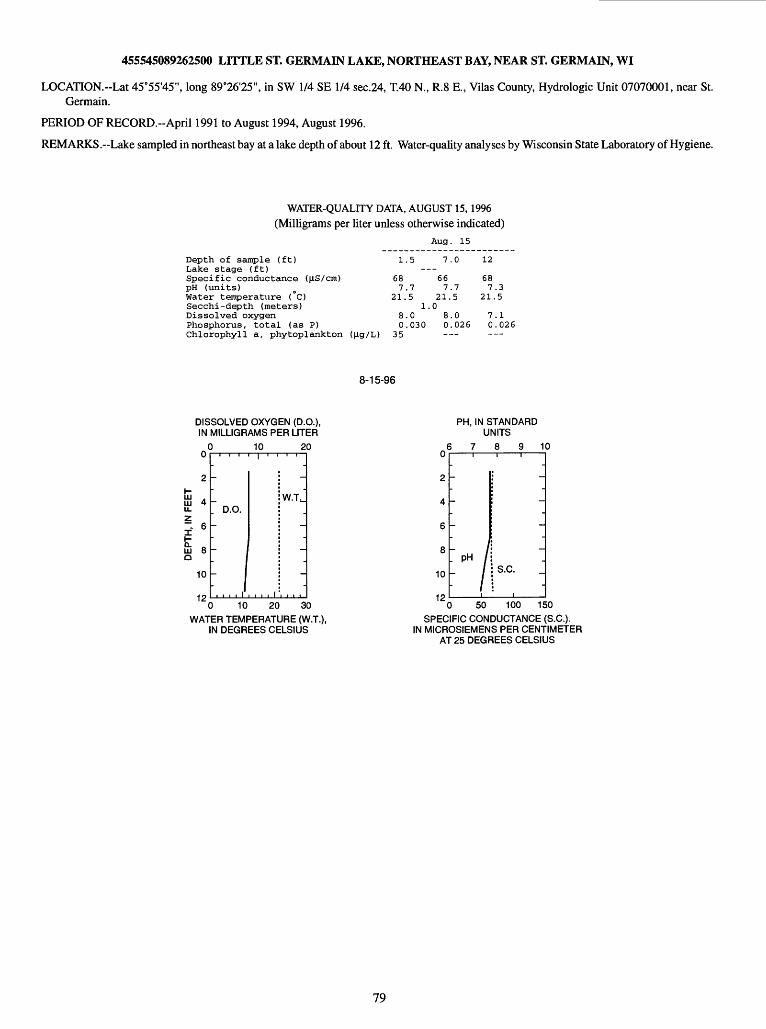
455545089262500 LITTLE ST. GERMAIN LAKE, NORTHEAST BAY, NEAR ST. GERMAIN, WI
LOCATION."Lat 45°55'45", long 89°26'25", in SW 1/4 SE 1/4 sec.24, T.40 N., R.8 E., Vilas County, Hydrologic Unit 07070001, near St. Germain.
PERIOD OF RECORD.-April 1991 to August 1994, August 1996.
REMARKS . Lake sampled in northeast bay at a lake depth of about 12 ft. Water-quality analyses by Wisconsin State Laboratory of Hygiene.
WATER-QUALITY DATA, AUGUST 15, 1996 (Milligrams per liter unless otherwise indicated)
Depth of sample (ft)Lake stage (ft)Specific conductance (uS/cm)pH (units)Water temperature ( C)Secchi-depth (meters)Dissolved oxygenPhosphorus, total (as P)Chlorophyll a, phytoplankton (ug/L)
Aug. 15
1.5
687.7
21.51.
8.00.030
35
7.0
667.7
21.50
8.00.026
12
687.3
21.5
7.10.026
8-15-96
DISSOLVED OXYGEN (D.O.), IN MILLIGRAMS PER LITER
10 20u
2
LJJ 4LL.
- 6
LJJ 8a
10
19
_
D.O.-
-
W.T._
-
-
i i i i i i L"0 10 20 30
WATER TEMPERATURE (W.T.), IN DEGREES CELSIUS
PH, IN STANDARDUNITS
6 7 8 9 10u
2
4
6
8
10
19
1
-
-
-
- 1:"/
1 '
i
-
-
-
s.c. 1
i0 50 100 150
SPECIFIC CONDUCTANCE (S.C.).IN MICROSIEMENS PER CENTIMETER
AT 25 DEGREES CELSIUS
79
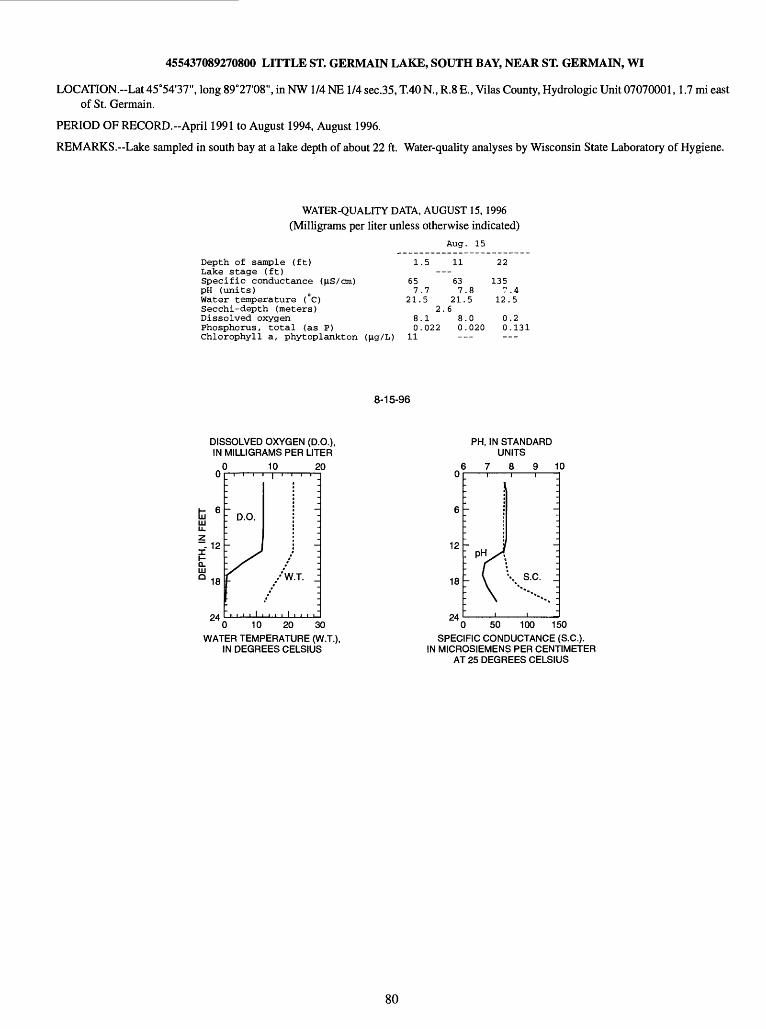
455437089270800 LITTLE ST. GERMAIN LAKE, SOUTH BAY, NEAR ST. GERMAIN, WI
LOCATION.--Lat 45 0 54'37", long 89°27 108", in NW 1/4 NE 1/4 sec.35, T.40 R, R.8 E., Vilas County, Hydrologic Unit 07070001,1.7 mi east of St. Germain.
PERIOD OF RECORD.-April 1991 to August 1994, August 1996.
REMARKS. Lake sampled in south bay at a lake depth of about 22 ft. Water-quah'ty analyses by Wisconsin State Laboratory of Hygiene.
WATER-QUALITY DATA, AUGUST 15, 1996 (Milligrams per liter unless otherwise indicated)
Aug. 15
Depth of sample (ft)Lake stage (ft)Specific conductance (n.S/cm)pH (units)Water temperature (°C)Secchi-depth (meters)Dissolved oxygenPhosphorus, total (as P)Chlorophyll a, phytoplankton ([ig/l>) 11
1.5
657.7
21.52
8.10.022
11
637.8
21.5.6
8.00.020
22
1357.4
12.5
0.20.131
8-15-96
DISSOLVED OXYGEN (D.O.), IN MILLIGRAMS PER LITER
10
0 10 20 30WATER TEMPERATURE (W.T.),
IN DEGREES CELSIUS
PH, IN STANDARDUNITS
6 7 8 9 10
12
18
0 50 100 150SPECIFIC CONDUCTANCE (S.C.).
IN MICROSIEMENS PER CENTIMETERAT 25 DEGREES CELSIUS
80

455428089282400 LITTLE ST. GERMAIN LAKE, WEST BAY, AT ST. GERMAIN, WI
LOCATION.--Lat 45°54'28", long 89°28'24", in SW 1/4 NE 1/4 sec.34, T.40 N., R.8 E., Vilas County, Hydrologic Unit 07070001, at St. Germain.
PERIOD OF RECORD.-April 1991 to August 1994, August 1996.
REMARKS.-Lake sampled in west bay at a lake depth of about 53 ft. Water-quality analyses by Wisconsin State Laboratory of Hygiene.
WATER-QUALITY DATA, AUGUST 15,1996 (Milligrams per liter unless otherwise indicated)
Aug. 15
Depth of sample (ft)Lake stage (ft)Specific conductance (\iS/cm)pH (units)Water temperature (°C)Secchi-depth (meters)Dissolved oxygenPhosphorus, total (as P)Chlorophyll a, phytoplankton (jig/L)
1
717
21.
803
.5
.45
.5
.007
.8
20
737
14
80-
13.
.4.0
2..4.03--
.80
.7
L5
32
8577
00-
.0.0
.2
.063--
53
10376
00-
.2.0
.2
.084--
8-15-96
DISSOLVED OXYGEN (D.O.), IN MILLIGRAMS PER LITER
o c
10
ID£20z
I 30Q_ HIQ 40
50KK
) 10 2
L j: D.o. j ,.. '' :
- / '-' w.T. :
-_
0 10 20 30WATER TEMPERATURE (W.T.),
IN DEGREES CELSIUS
PH, IN STANDARD UNITS
6 7 8 9 10u
10
20
30
40
50
-
_pH
-
-
-
>I
-_
S.C. ~
-_
\ -j
\ -j
0 50 100 150SPECIFIC CONDUCTANCE (S.C.).
IN MICROSIEMENS PER CENTIMETERAT 25 DEGREES CELSIUS
81
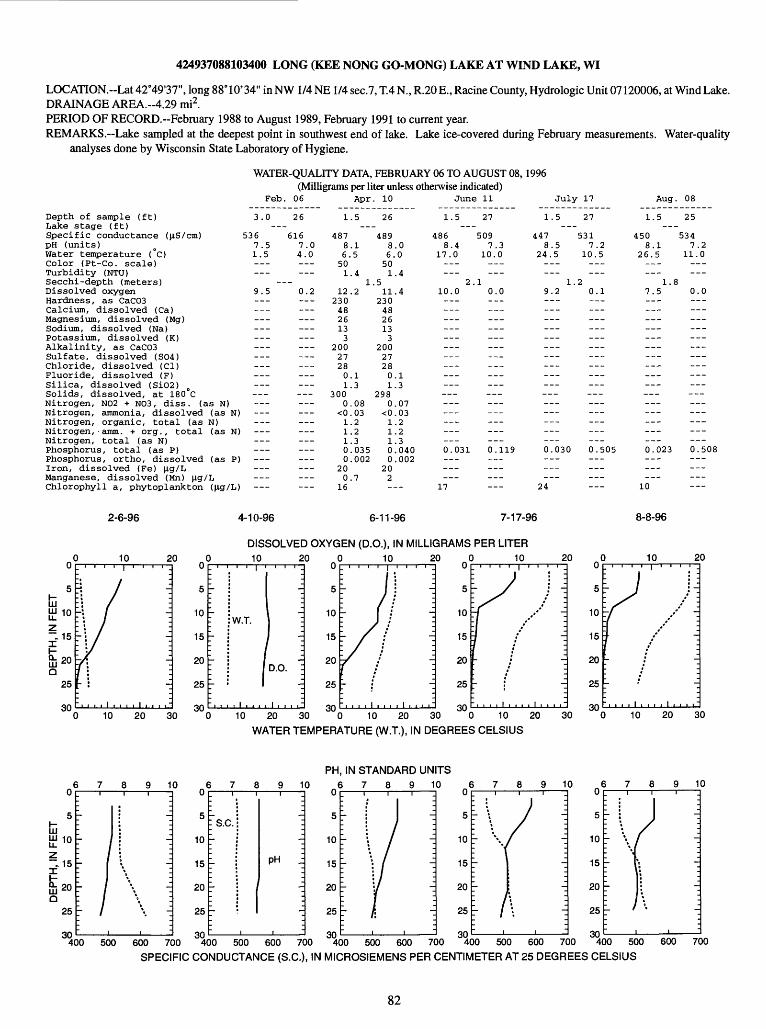
424937088103400 LONG (KEE NONG GO-MONG) LAKE AT WIND LAKE, WI
LOCATION.~Lat 42°49'37", long 88° 10'34" in NW 1/4 NE1/4 sec.7, T.4 N., R.20 E., Racine County, Hydrologic Unit 07120006, at Wind Lake. DRAINAGE AREA.-4.29 mi2.PERIOD OF RECORD.-February 1988 to August 1989, February 1991 to current year.REMARKS. Lake sampled at the deepest point in southwest end of lake. Lake ice-covered during February measurements. Water-quality
analyses done by Wisconsin State Laboratory of Hygiene.
WATER-QUALITY DATA, FEBRUARY 06 TO AUGUST 08, 1996 (Milligrams per liter unless otherwise indicated)
Feb.
Depth of sample (ft)Lake stage (ft)Specific conductance (jiS/cm)pH (units)Water temperature (°C)Color (Pt-Co. scale)Turbidity (NTU)Secchi-depth (meters)Dissolved oxygenHardness, as CaC03Calcium, dissolved (Ca)Magnesium, dissolved (Mg)Sodium, dissolved (Na)Potassium, dissolved (K)Alkalinity, as CaC03Sulfate, dissolved (S04)Chloride, dissolved (Cl)Fluoride, dissolved (F)Silica, dissolved (Si02)Solids, dissolved, at 180 CNitrogen, N02 + N03, diss. (as N)Nitrogen, ammonia, dissolved (as N)Nitrogen, organic, total (as N)Nitrogen,-amm. + org., total (as N)Nitrogen, total (as N)Phosphorus, total (as P)Phosphorus, ortho, dissolved (as P)Iron, dissolved (Fe) jig/LManganese, dissolved (Mn) jig/LChlorophyll a, phytoplankton (Jig/L)
2-6-96
Feb. 06
3.0 26
536 6167.5 7.01.5 4.0
______
9.5 0.2___--- ______ ______ _________
___)
___I)
___
Apr. 10 June 11 July 17 Aug. 08
1.5 26 1.5 27 1.5
487 489 486 509 4478.1 8.0 8.4 7.3 8.56.5 6.0 17.0 10.0 24.5
50 50 1.4 1.4
1.5 2.112.2 11.4 10.0 0.0 9.2
230 230 48 4826 26 13 13
3 3 200 200
27 27 28 280.1 0.1 1.3 1.3
300 298 0.08 0.07
<0.03 <0.03 1.2 1.2 1.2 1.2 1.3 1.3
27 1.5 25
531 450 5347.2 8.1 7.2
10.5 26.5 11.0
___ ___1.2 1.8
0.1 7.5 0.0___ ______ ---___
___
___ _
___ ___
___ ___ ___
______ ___ _-_
0.035 0.040 0.031 0.119 0.030 0.505 0.023 0.508)
___
)
4-10-96
0.002 0.002 20 20 0.7 2
16 17 24
6-11-96 7-17-96
___ _________
10
8-8-96
DISSOLVED OXYGEN (D.O.), IN MILLIGRAMS PER LITER10 20
V.T. :-_
^
D.O. :i
i . . . . i , . , ,-
0 10 20 0 10o . i i . . | j i . i . o . i i i i | i i <t i
5 "~ 1 ~- 5 ~ ./ 110 i- | / -: 10 :J
15 r / / -. 15 H /
20 ~Y 1 -_ 20 1- /
25 - ;' 25 h |
on : i . i i 1 i i i . 1 i i i J on F i i i i 1 i . . i 1 i i i
20 0 10 20- 0 . . . i i | i i i i .
\ 10 Y / i~- 15 I /' ~--- 2°r / --
-. 25 h "
: an Fi i i i I i i i.i I i i i i10 20 30 0 10 20 30 0 10 20
WATER TEMPERATURE (W.T.), IN DEGREES CELSIUS
30 10 20 30
u
5
Sioz~ 15Ika>LU ^u0
25
.on
1
IIi
1 '
-_
-
j* ;
% i\
*, I-_
, -
10 o
5
10
15
20
25
on
> 7
~r
-
-
-
-
fl
,
9 1
-_
-_
pH j
-_
-
, '-
PH, IN STANDARD UNITS 6 7 8 9 10 .6 10 10
U
5
10
15
20
25
on
- ' '
r
111
I
j
1
-_
-~
-_
-
-,
0
5
10
15
20
25
on
; 1
7
-
f /
/ i-
-_
\ -_
u
5
10
15
20
25
on
-
-
l t
>1 -
i-:
400 500 600 700 "400 500 600 700 400 500 600 700 400 500 600 700 400 500 600 700
SPECIFIC CONDUCTANCE (S.C.), IN MICROSIEMENS PER CENTIMETER AT 25 DEGREES CELSIUS
82
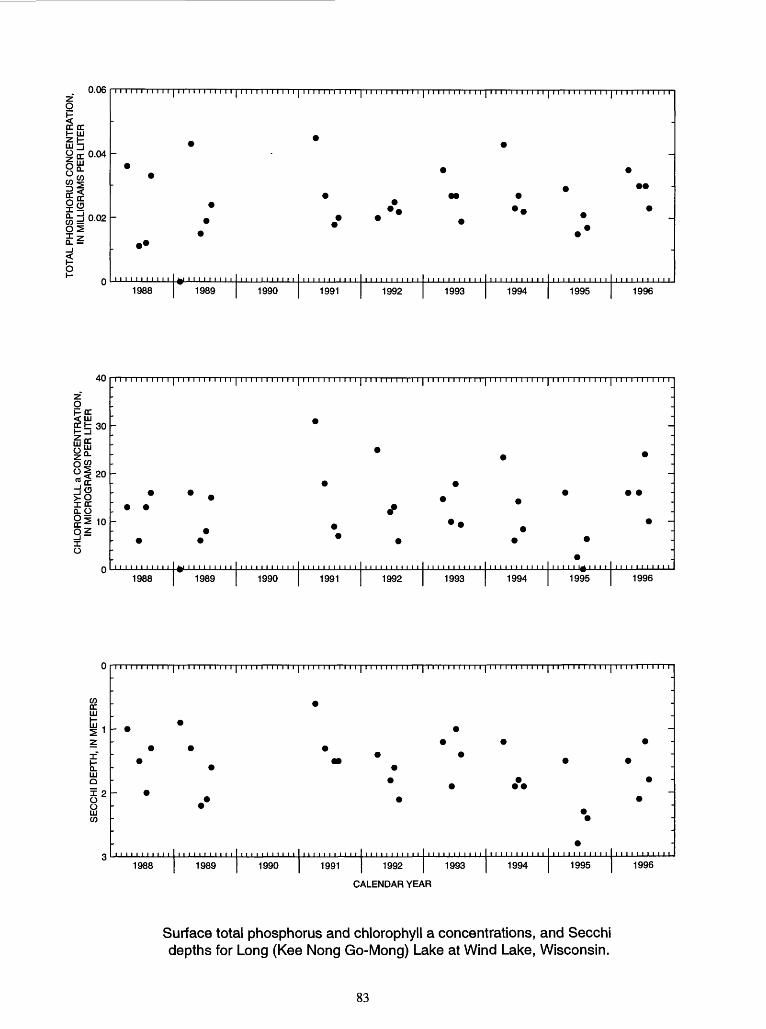
0.06
O
0.04
8j J 0.02
1988 1989 1990 1991 1992 1993 1994 1995 1996
40
OFoe< UJorb 30
uiffi
*< 20 «ocdo >oICC Q.O§2103 2o
1988 1989 1990 1991 1992 1993 1994 1995 1996
1988 1989 1990 1991 1992
CALENDAR YEAR
1993 1994 1995 1996
Surface total phosphorus and chlorophyll a concentrations, and Secchi depths for Long (Kee Nong Go-Mong) Lake at Wind Lake, Wisconsin.
83
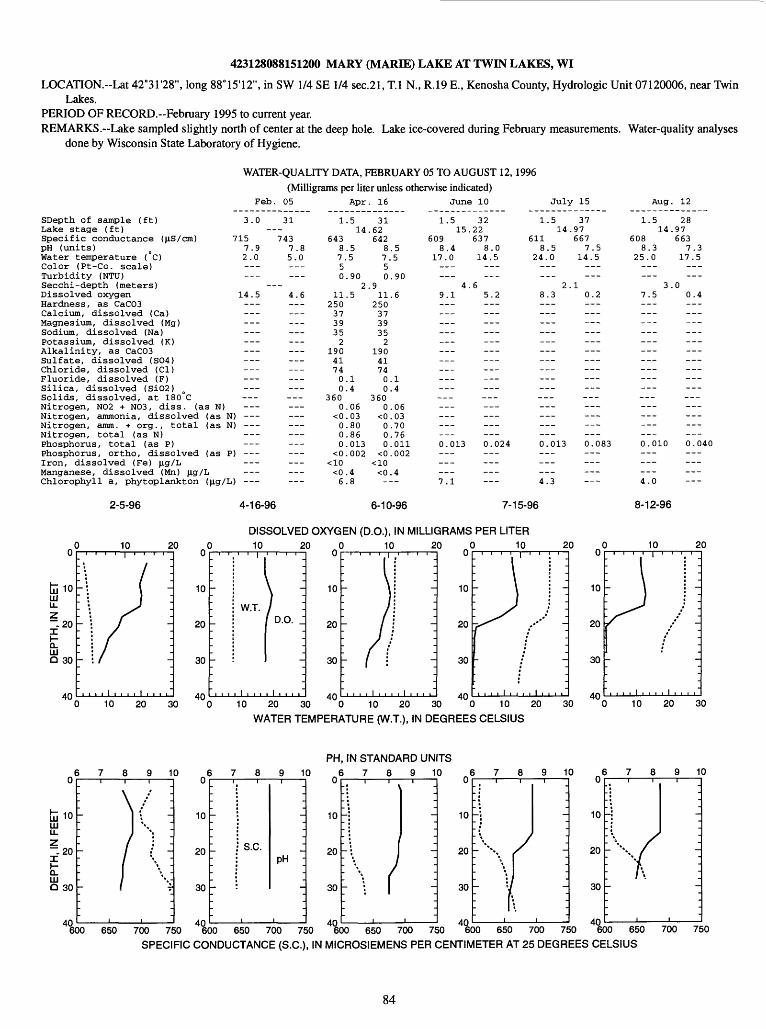
423128088151200 MARY (MARIE) LAKE AT TWIN LAKES, WI
LOCATION.--Lat 42°31'28", long 88°15'12", in SW 1/4 SE 1/4 sec.21, T.I N., R.19 E., Kenosha County, Hydrologic Unit 07120006, near TwinLakes.
PERIOD OF RECORD.-February 1995 to current year. REMARKS. Lake sampled slightly north of center at the deep hole. Lake ice-covered during February measurements. Water-quality analyses
done by Wisconsin State Laboratory of Hygiene.
WATER-QUALITY DATA, FEBRUARY 05 TO AUGUST 12, 1996 (Milligrams per liter unless otherwise indicated)
Feb. 05 Apr. 16 June 10 July 15
SDepth of sample (ft)Lake stage (ft)Specific conductance (p,S/cm)pH (units)Water temperature (°C)Color (Pt-Co. scale)Turbidity (NTU)Secchi-depth (meters)Dissolved oxygenHardness, as CaC03Calcium, dissolved (Ca)Magnesium, dissolved (Mg)Sodium, dissolved (Na)Potassium, dissolved (K)Alkalinity, as CaC03Sulfate, dissolved (S04)Chloride, dissolved (Cl)Fluoride, dissolved (F)Silica, dissolved (Si02)Solids, dissolved, at 180 CNitrogen, N02 + N03, diss. (as N)Nitrogen, ammonia, dissolved (as N)Nitrogen, amm. + org., total (as N)Nitrogen, total (as N)Phosphorus, total (as P)Phosphorus, ortho, dissolved (as P)Iron, dissolved (Fe) n,g/LManganese, dissolved (Mn) n,g/LChlorophyll a, phytoplankton
2-5-96 4-16-96
Aug. 12
3.0
7157.92.0---___
14.5
---
---
I) ---I) -
______
,)
___
31___
7437.85.0___
___4.6
___
___
1
64387.50
112503739352
190417400
3600
<0000
<0
<06
.514
.55
.902
.5
.1
.4
.06
.03
.80
.86
.013
.002
.4
.8
31.62642
8750
.911
2503739352
190417400
3600
<0000
<0
<0-
.5.5
.90
.6
.1
.4
.06
.03
.70
.76
.011
.002
.4--
1.515.
6098.4
17.0
49.1
______
______
0.013
___7.1
32.22637
8.014.5______
.65.2
___
__________________0.024
___
1.514,
6118.5
24.0
2,8.3
___
______
___
0.013
___4.3
37.97667
7.514.5
___.1
0.2
______
___
___0.083
1.514
6088.3
25.0______
37.5______------___---_________---
______---___0.010___
___4.0
28.97663
7.317.5---___
.00.4_________------___---__________________
0.040
___---
6-10-96 7-15-96 8-12-96
10
20
CL Lil 0 30
40
10 20
10 20 30
10
20
30
40
DISSOLVED OXYGEN (D.O.), IN MILLIGRAMS PER LITER10 20
W.T.D.O.
10 20
10
20
30
40
10 20
10 20 30 0 10 20 30 0 10 20
WATER TEMPERATURE (W.T.), IN DEGREES CELSIUS
PH, IN STANDARD UNITS
6789 10 6789 10 6789 10 6789 10 6 789 10u
in 10LilLL
Z~ 20ICLLLJ0 30
An
\ ' -- I (' '-
I **»
/ **/ I
/ ."
/ ** « -I *** "
1 **» "
: :
10
20
30
S.C.PH
10
20
30
10
20
30
10
20
30
40 ' ' ' 650 700 750 600 650 700 750 "600 650 700 750 '600 650 700 750 600 650 700 750
SPECIFIC CONDUCTANCE (S.C.), IN MICROSIEMENS PER CENTIMETER AT 25 DEGREES CELSIUS
84
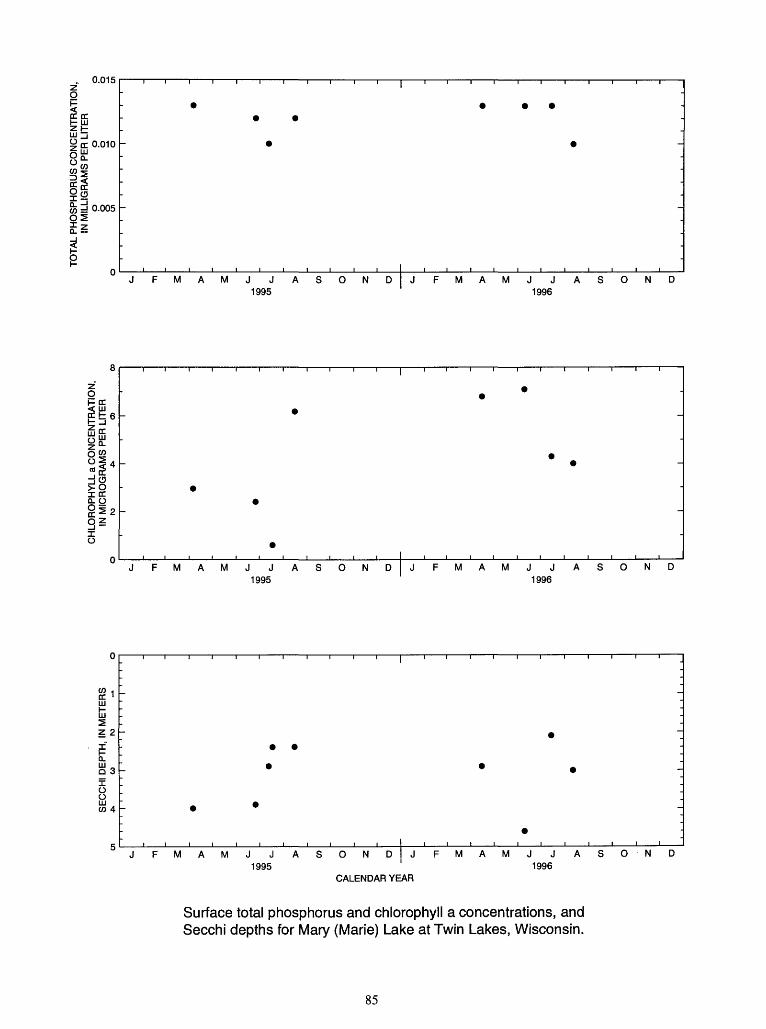
SE
CC
HI
DE
PT
H,
IN M
ET
ER
SC
HLO
RO
PH
YLL
a C
ON
CE
NT
RA
TIO
N,
IN M
ICR
OG
RA
MS
PE
R L
ITE
R
o
iv>
^
o>
oo
TO
TA
L P
HO
SP
HO
RU
S C
ON
CE
NT
RA
TIO
N,
IN M
ILLI
GR
AM
S P
ER
LIT
ER
po
p
82
2
c_
-n 2
C/)
C/)
°
c
>
O ^
~ °
2!"§ !=
£
0)
CO r
toC
O
-Q
W
C-
~l
CO
>
=5
O
CO
|§
|
°
rt
1 o
(DO
33
c_
0
) "§
-
H^
-"
3
o
sCD
5
^
o" §
w'
o'
- °-
83
CO
0
) m
^
CO
0)
?"
Q.
> CO O D
1 ,
I I
1 ....
1 ....
1 1 ...
1 1
I ..
. 9
- - - '
' ' -
c_
n 2 c_CO
CO 01
^ > CO O z D c_ -n £ > 2 C-
i <"
c_ > CO O D
1 .
1 .
1 ,
- - -
*
" -
I.I.I,
c_
-n 2 c_CO
CO 01
c_ > CO O Z D c_
n s > 2 C-
i «"
c_ > CO O D
.
- - - "
"
*
" -

460128089423501 MAX LAKE NEAR WOODRUFF, WI
LOCATION.--Lat 46"01 128", long 89°42'35", in NW 1/4 NE 1/4 sec.23, T.41 N., R.6 E., Vilas County, Hydrologic Unit 07070001, 8.5 mi north of Woodruff, 1,500 ft west of U.S. Highway 51.
DRAINAGE AREA.-Unknown. Area of lake, 0.036 mi2 .
PERIOD OF RECORD.-Unpublished intermittent data from March 1988 to September 1989; intermittent segments of daily data since July 1990; discontinued December 1996.
GAGE. Staff gage and water-stage recorder. Datum of gages is about 1,613 ft above sea level.
REMARKS. Records good. Lake does not have surface inlet or outlet.
EXTREMES FOR PERIOD OF RECORD.--Maximum observed gage height, 6.75 ft, Aug. 7,1996; minimum observed gage height, 3.97 ft, Nov. 16,1989.
EXTREMES FOR CURRENT PERIOD.-Maximum recorded gage height, 6.75 ft, Aug. 7; minimum recorded, 5.52 ft, Oct. 1 and 5.
GAGE HEIGHT, FEET, OCTOBER 1995 THROUGH DECEMBER 1996
DAILY MEAN VALUES
DAY OCT
1995NOV DEC APR MAY JUN JUL
1996AUG SEP OCT NOV DEC
12345
6789
10
1112131415
1617181920
2122232425
262728293031
MEANMAXMIN
5.525.535.535.535.52
5.71
5.705.705.695.695.69
5.82
.85
.89
.89
.88
5.93
5.88
5.88
6.516.526.53
5.916.536.526.526.51
6.51
6.59
6.57
6.546.566.556.53
6.516.606.676.666.65
6.646.636.676.686.66
6.656.646.626.626.61
6.596.596.726.746.726.72
6.716.706.696.676.71
6.746.756.736.726.70
6.686.676.676.666.65
6.646.626.616.596.60
5.52
6.596.596.586.566.54
6.536.516.496.476.466.45
6.626.756.45
6.43 6.42 6.41 6.49 6'.48
6.476.466.456.436.43
6.446.446.4.16.396.38
6.376.366.356.346.32
6.326.346.336.346.32
6.326.366.366.356.34
6.396.496.32
6.336.326.306.296.28
6.286.286.276.276.26
6.256.246.236.226.21
6.216.306.316.316.30
6.296.296.356.396.38
6.386.376.366.386.446.42
6.316.446.21
6.416.416.406.406.41
6.416.416.406.426.42
6.426.426.426.426.42
6.506.586.586.596.59
6.586.59
6.53
86
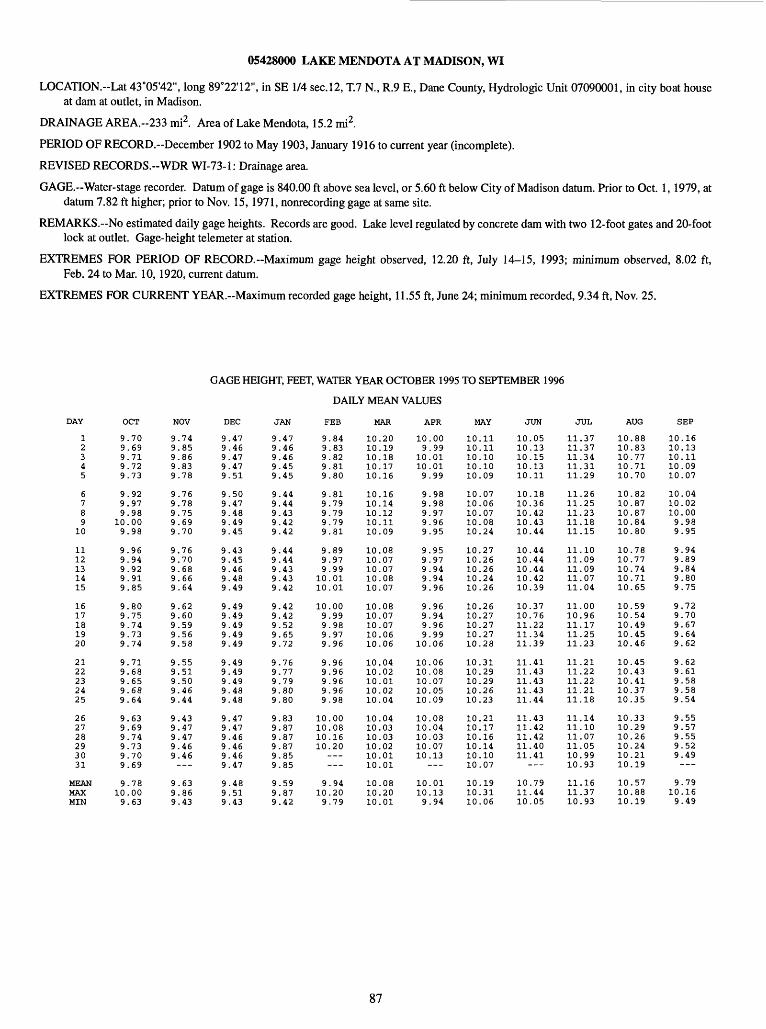
05428000 LAKE MENDOTA AT MADISON, WI
LOCATION.--Lat 43°05'42", long 89°22'12", in SE 1/4 sec. 12, T.7 N., R.9 E., Dane County, Hydrologic Unit 07090001, in city boat house at dam at outlet, in Madison.
DRAINAGE AREA.--233 mi2. Area of Lake Mendota, 15.2 mi2.
PERIOD OF RECORD.-December 1902 to May 1903, January 1916 to current year (incomplete).
REVISED RECORDS.--WDR WI-73-1: Drainage area.
GAGE.--Water-stage recorder. Datum of gage is 840.00 ft above sea level, or 5.60 ft below City of Madison datum. Prior to Oct. 1,1979, at datum 7.82 ft higher; prior to Nov. 15,1971, nonrecording gage at same site.
REMARKS.-No estimated daily gage heights. Records are good. Lake level regulated by concrete dam with two 12-foot gates and 20-foot lock at outlet. Gage-height telemeter at station.
EXTREMES FOR PERIOD OF RECORD.-Maximum gage height observed, 12.20 ft, July 14-15, 1993; minimum observed, 8.02 ft, Feb. 24 to Mar. 10,1920, current datum.
EXTREMES FOR CURRENT YEAR.-Maximum recorded gage height, 11.55 ft, June 24; minimum recorded, 9.34 ft, Nov. 25.
GAGE HEIGHT, FEET, WATER YEAR OCTOBER 1995 TO SEPTEMBER 1996
DAILY MEAN VALUES
OCT NOV DEC JAN FEE MAR APR MAY JUN JUL AUG SEP
12345
6789
10
1112131415
1617181920
2122232425
262728293031
MEANMAXMIN
9.709.699.719.729.73
9.929.979.98
10.009.98
9.969.949.929.919.85
9.809.759.749.739.74
9.719.689.659.689.64
9.639.699.749.739.709.69
9.7810.009.63
9.749.859.869.839.78
9.769.789.759.699.70
9.769.709.689.669.64
9.629.609.599.569.58
9.559.519.509.469.44
9.439.479.479.469.46-
9.639.869.43
9.479.469.479.479.51
9.509.479.489.499.45
9.439.459.469.489.49
9.499.499.499.499.49
9.499.499.499.489.48
9.479.479.469.469.469.47
9.489.519.43
9.479.469.469.459.45
9.449.449.439.429.42
9.449.449.439.439.42
9.429.429.529.659.72
9.769.779.799.809.80
9.839.879.879.879.859.85
9.599.879.42
9.849.839.829.819.80
9.819.799.799.799.81
9.899.979.99
10.0110.01
10.009.999.989.979.96
9.969.969.969.969.98
10.0010.0810.1610.20
9.9410.209.79
10.2010.1910.1810.1710.16
10.1610.1410.1210.1110.09
10.0810.0710.0710.0810.07
10.0810.0710.0710.0610.06
10.0410.0210.0110.0210.04
10.0410.0310.0310.0210.0110.01
10.0810.2010.01
10.009.99
10.0110.019.99
9.989.989.979.969.95
9.959.979.949.949.96
9.969.949.969.99
10.06
10.0610.0810.0710.0510.09
10.0810.0410.0310.0710.13
10.0110.139.94
10.1110.1110.1010.1010.09
10.0710.0610.0710.0810.24
10.2710.2610.2610.2410.26
10.2610.2710.2710.2710.28
10.3110.2910.2910.2610.23
10.2110.1710.1610.1410.1010.07
10.1910.3110.06
10.0510.1310.1510.1310.11
10.1810.3610.4210.4310.44
10.4410.4410.4410.4210.39
10.3710.7611.2211.3411.39
11.4111.4311.4311.4311.44
11.4311.4211.4211.4011.41
10.7911.4410.05
11.3711.3711.3411.3111.29
11.2611.2511.2311.1811.15
11.1011.0911.0911.0711.04
11.0010.9611.1711.2511.23
11.2111.2211.2211.2111.18
11.1411.1011.0711.0510.9910.93
11.1611.3710.93
10.8810.8310.7710.7110.70
10.8210.8710.8710.8410.80
10.7810.7710.7410.7110.65
10.5910.5410.4910.4510.46
10.4510.4310.4110.3710.35
10.3310.2910.2610.2410.2110.19
10.5710.8810.19
10.1610.1310.1110.0910.07
10.0410.0210.009.989.95
9.949.899.849.809.75
9.729.709.679.649.62
9.629.619.589.589.54
9.559.579.559.529.49
9.7910.169.49
87

430309088284800 MIDDLE GENESEE LAKE NEAR OCONOMOWOC, WI
LOCATION.-Lat 43°03'09", long 88°28'48", in NW 1/4 SW 1/4 sec.22, T.7 N., R.17 E., Waukesha County, Hydrologic Unit 07090001, 1.8 misouth of Oconomowoc.
PERIOD OF RECORD.-February to August 1996. REMARKS. --Lake sampled near center at the deep hole. Lake ice-covered during February measurements. Water-quality analyses done by
Wisconsin State Laboratory of Hygiene.
WATER-QUALITY DATA, FEBRUARY 08 TO AUGUST 06, 1996 (Milligrams per liter unless otherwise indicated)
Feb. 08 Apr. 11 June 05 July 11
Depth of sample (ft)Lake stage (ft)Specific conductance (^S/cm)pH (units)Water temperature ( C)Color (Pt-Co. scale)Turbidity (NTU)Secchi-depth (meters)Dissolved oxygenHardness, as CaC03Calcium, dissolved (Ca)Magnesium, dissolved (Mg)Sodium, dissolved (Na)Potassium, dissolved (K)Alkalinity, as CaC03Sulfate, dissolved (S04)Chloride, dissolved (Cl)Fluoride, dissolved (F)Silica, dissolved (Si02) oSolids, dissolved, at 180 CNitrogen, N02 + N03, diss. (as N)Nitrogen, ammonia, dissolved (as N)Nitrogen, organic, total (as N)Nitrogen, amm. + org., total (as N)Nitrogen, total (as N)Phosphorus, total (as P)Phosphorus, ortho, dissolved (as P)Iron, dissolved (Fe) \ig/LManganese, dissolved (Mn) jig/LChlorophyll a, phytoplankton
Aug. 06
3.0
4228.44.0---
12.9 ___
------______---
r) ___
D ___
')
___
38
5097.55.0___
0.3
___
___
___
1
42087.100
122103330102
1801823<0,
2520.0.0,0.0,0.0.
<0,2.
.5
.30
.604
.6
1'
.02
.21
.59
.80
.82
.007
.002
.4
.0
39
42186201
.412
2103330102
1801823<0
250000000
<0
<0-
.3.0
.4
.4
1'
.06
.23
.57
.80
.86
.011
.002
.4
1.5
4258.3
18.0
4.9.6___ ---___
______
___0.007
___1.0
38
4308.0
11.0
57.0
_________
______
0.007
___
1.5
4388.4
24.0
27.8_________
___
___<0.007
___2.0
40
4547.9
12.5
.63.3___
___
___
___
0.012___
1.5
4178.3
25.5______
28.5
___---_________
___
---___---
<0.007
___2.3
43
4767.6
13.0______
.70.0
---___
______
___
___---___ 0.022
2-8-96 4-11-96 6-5-96 7-11-96 8-6-96
uj 10UJ LLz~~- 20
UJ Q 30
40
10
10 20
20
30
10
20
30
40
DISSOLVED OXYGEN (D.O.), IN MILLIGRAMS PER LITER10 20
W.T.
D.O. -
10 20
10
20
30
40
10
10
20
30
4010 20 30 0 10 20 30 0 10 20
WATER TEMPERATURE (W.T.), IN DEGREES CELSIUS
20
30
10
20
30
10 20
10 20 30
PH, IN STANDARD UNITS6789 10 6789 10 6789 10 6789 10 6789 10 0| i i i i Oi i i i i Oi i i i i 0| i i i i 0
UJ 10 UJ
20
UJ Q 30
40400
u
10
20
30
An
-
~ S.C.
,
-
-
PH :
,
10
20
30
40
10
20
30
40
10
20
30
40450 500 550 400 450 500 550 400 450 500 550 400 450 500 550 400 450 500 550
SPECIFIC CONDUCTANCE (S.C.), IN MICROSIEMENS PER CENTIMETER AT 25 DEGREES CELSIUS
88
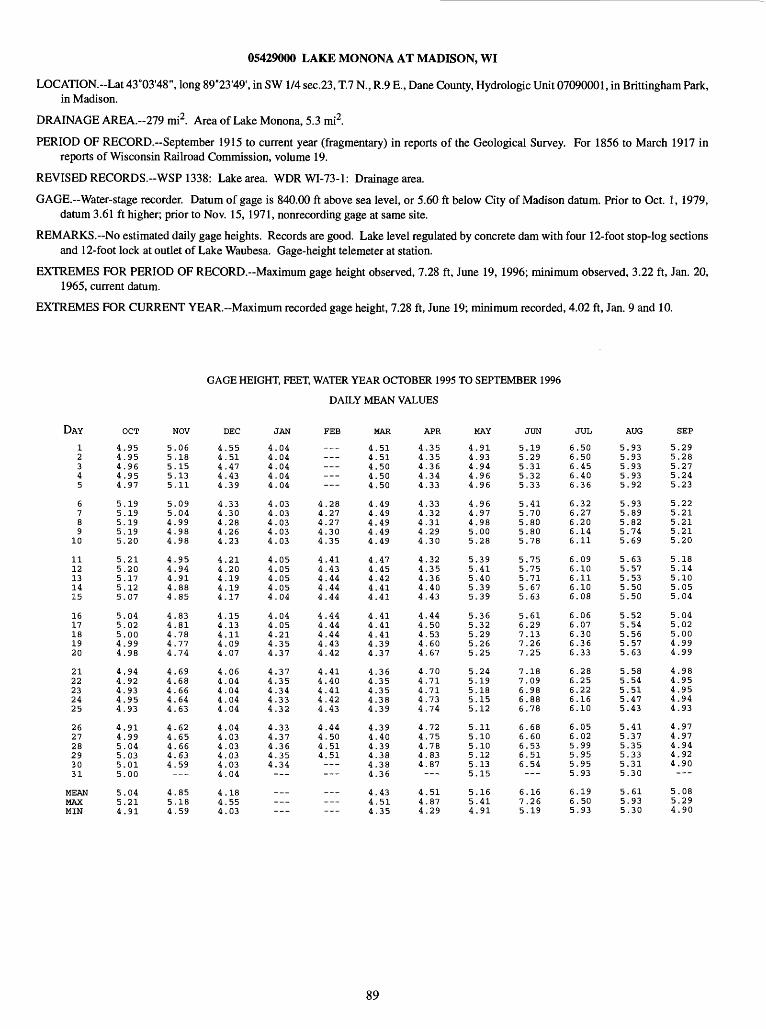
05429000 LAKE MONONA AT MADISON, WI
LOCATION.--Lat 43°03'48", long 89°23'49', in SW 1/4 sec.23, T.7 R, R.9 E., Dane County, Hydrologic Unit 07090001, in Brittingham Park, in Madison.
DRAINAGE AREA.--279 mi2. Area of Lake Monona, 5.3 mi2.
PERIOD OF RECORD.-September 1915 to current year (fragmentary) in reports of the Geological Survey. For 1856 to March 1917 in reports of Wisconsin Railroad Commission, volume 19.
REVISED RECORDS.--WSP 1338: Lake area. WDRWI-73-1: Drainage area.
GAGE.-Water-stage recorder. Datum of gage is 840.00 ft above sea level, or 5.60 ft below City of Madison datum. Prior to Oct. 1, 1979, datum 3.61 ft higher; prior to Nov. 15,1971, nonrecording gage at same site.
REMARKS. No estimated daily gage heights. Records are good. Lake level regulated by concrete dam with four 12-foot stop-log sections and 12-foot lock at outlet of Lake Waubesa. Gage-height telemeter at station.
EXTREMES FOR PERIOD OF RECORD.-Maximum gage height observed, 7.28 ft, June 19, 1996; minimum observed, 3.22 ft, Jan. 20, 1965, current datum.
EXTREMES FOR CURRENT YEAR.--Maximum recorded gage height, 7.28 ft, June 19; minimum recorded, 4.02 ft, Jan. 9 and 10.
GAGE HEIGHT, FEET, WATER YEAR OCTOBER 1995 TO SEPTEMBER 1996
DAILY MEAN VALUES
DAY OCT NOV DEC JAN FEE MAR APR MAY JUN JUL AUG SEP12345
6789
10
1112131415
1617181920
2122232425
262728293031
MEANMAXMIN
4.954.954.964.954.97
5.195.195.195.195.20
5.215.205.175.125.07
5.045.025.004.994.98
4.944.924.934.954.93
4.914.995.045.035.015.00
5.045.214.91
5.065.185.155.135.11
5.095.044.994.984.98
4.954.944.914.884.85
4.834.814.784.774.74
4.694.684.664.644.63
4.624.654.664.634.59---
4.855.184.59
4.554.514.474.434.39
4.334.304.284.264.23
4.214.204.194.194.17
4.154.134.114.094.07
4.064.044.044.044.04
4.044.034.034.034.034.04
4.184.554.03
4.044.044.044.044.04
4.034.034.034.034.03
4.054.054.054.054.04
4.044.054.214.354.37
4.374.354.344.334.32
4.334.374.364.354.34
______
____________
4.284.274.274.304.35
4.414.434.444.444.44
4.444.444.444.434.42
4.414.404.414.424.43
4.444.504.514.51______
___
4.514.514.504.504.50
4.494.494.494.494.49
4.474.454.424.414.41
4.414.414.414.394.37
4.364.354.354.384.39
4.394.404.394.384.384.36
4.434.514.35
4.354.354.364.344.33
4.334.324.314.294.30
4.324.354.364.404.43
4.444.504.534.604.67
4.704.714.714.734.74
4.724.754.784.834.87
4.514.874.29
4.914.934.944.964.96
4.964.974.985.005.28
5.395.415.405.395.39
5.365.325.295.265.25
5.245.195.185.155.12
5.115.105.105.125.135.15
5.165.414.91
5.195.295.315.325.33
5.415.705.805.805.78
5.755.755.715.675.63
5.616.297.137.267.25
7.187.096.986.886.78
6.686.606.536.516.54
6.167.265.19
6.506.506.456.406.36
6.326.276.206.146.11
6.096.106.116.106.08
6.066.076.306.366.33
6.286.256.226.166.10
6.056.025.995.955.955.93
6.196.505.93
5.935.935.935.935.92
5.935.895.825.745.69
5.635.575.535.505.50
5.525.545.565.575.63
5.585.545.515.475.43
5.415.375.355.335.315.30
5.615.935.30
5.295.285.275.245.23
5.225.215.215.215.20
5.185.145.105.055.04
5.045.025.004.994.99
4.984.954.954.944.93
4.974.974.944.924.90___
5.085.294.90
89
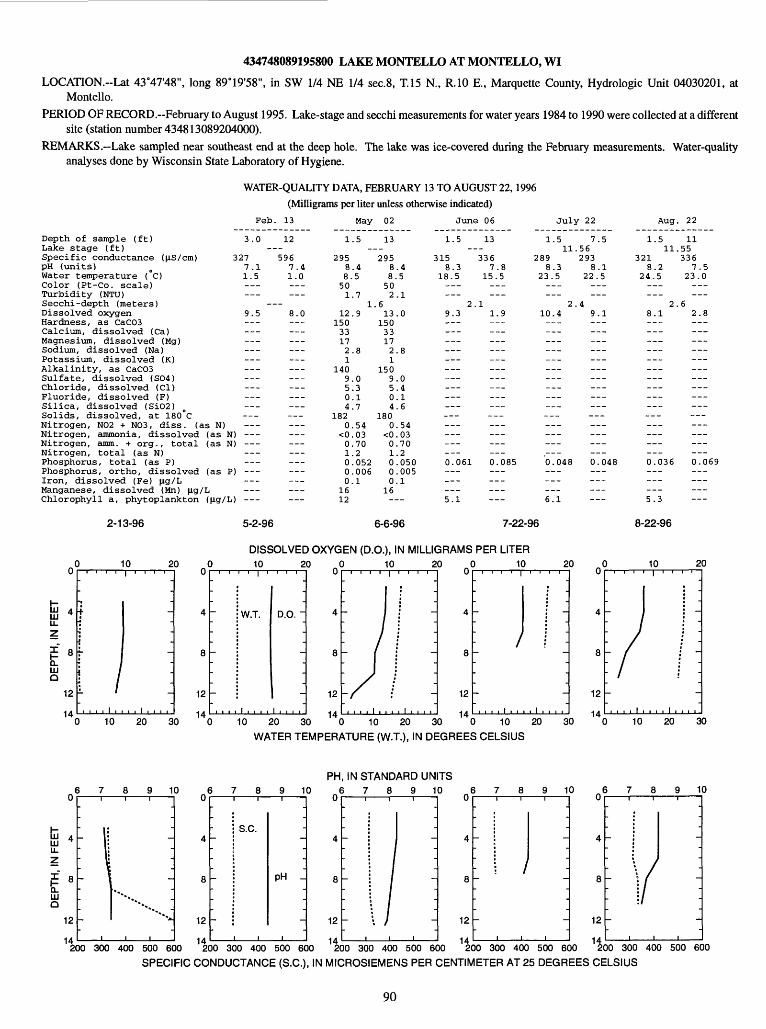
434748089195800 LAKE MONTELLO AT MONTELLO, WI
LOCATION."Lat 43°47'48", long 89°19'58", in SW 1/4 NE 1/4 sec.8, T.15 N., R.IO E., Marquette County, Hydrologic Unit 04030201, at Montello.
PERIOD OF RECORD.-February to August 1995. Lake-stage and secchi measurements for water years 1984 to 1990 were collected at a differentsite (station number 434813089204000).
REMARKS.-Lake sampled near southeast end at the deep hole. The lake was ice-covered during the February measurements. Water-qualityanalyses done by Wisconsin State Laboratory of Hygiene.
WATER-QUALITY DATA, FEBRUARY 13 TO AUGUST 22, 1996
(Milligrams per liter unless otherwise indicated)
Feb. 13 May 02 June 0 6 July 22 Aug. 22
Depth of sample (ft)Lake stage (ft)Specific conductance (p.S/cm)pH (units)Water temperature (°C)Color (Pt-Co. scale)Turbidity (NTU)Secchi-depth (meters)Dissolved oxygenHardness, as CaCO3Calcium, dissolved (Ca)Magnesium, dissolved (Mg)Sodium, dissolved (Na)Potassium, dissolved (K)Alkalinity, as CaC03Sulfate, dissolved (S04)Chloride, dissolved (Cl)Fluoride, dissolved (F)Silica, dissolved (Si02)Solids, dissolved, at 180°CNitrogen, N02 + N03, diss. (as N)Nitrogen, ammonia, dissolved (as N)Nitrogen, amm. + org., total (as N)Nitrogen, total (as N)Phosphorus, total (as P)Phosphorus, ortho, dissolved (as P)Iron, dissolved (Fe) p.g/Manganese, dissolved (Mn) .Chlorophyll a, phytoplankton
2-13-96
10 20
fc"UJ Q
12
1410 20 30
3.0
3277.11.5
9.5
_________
___
j) I)
___
>)
___
12___
5967.41.0
8.0
___
_________
___
1
29588.501
12150331721
1409504
1820
<001000
1612
.5-
.45
.71
.9
.8
.0
.3
.1
.7
.54
.03
.70
.2
.052
.006
.1
13 295
88502
.613
150331721
1509504
1800
<001000
16-
.4.5
.1
.0
.8
.0
.4
.1
.6
.54
.03
.70
.2
.050
.005
.1
--
1.5-
3158.3
18.5
2
9.3___
______
______
___0.061
______5.1
13 336
7.815.5______
.11.9
___
___
___
___0.085 _________
1.511,
2898.3
23.5___
2.10.4
_________
______ .---0.048
______6.1
7.5.56293
8.122.5
,4
9.1
______
______
___
___0.048
---___
1.511.
3218.2
24.5
2.8.1______
_________
___0.036___
___5.3
11.55336
7.523.0___
.62.8
_______________
___0.069___
___
5-2-96 6-6-96 7-22-96
DISSOLVED OXYGEN (D.O.), IN MILLIGRAMS PER LITER10 20
u
4
8
12
1 A
. ' ' ' ' ' '
W.T.
-
-
,,,,!,,,,
-
D.O. ~
-
-
i i i i
10 20 10 20
8-22-96
10 20
12 12
10 20 30 0 10 20 30 0 10 20 WATER TEMPERATURE (W.T.), IN DEGREES CELSIUS
30 10 20 30
PH, IN STANDARD UNITS 6789 10 6789 10 6789 10 6789 10 6 789 10
u
UJ 4UJ U.z
£ aQ.UJQ
12
1/4
_
-
_
.
-
-
-
_, *»^
""* «."** *
I I I
12
H2
S.C.
pH _
12
142
12
I____I____I
12
'i200 300 400 500 600 200 300 400 500 600 200 300 400 500 600 200 300 400 500 600 200 300 400 500 600
SPECIFIC CONDUCTANCE (S.C.), IN MICROSIEMENS PER CENTIMETER AT 25 DEGREES CELSIUS
90
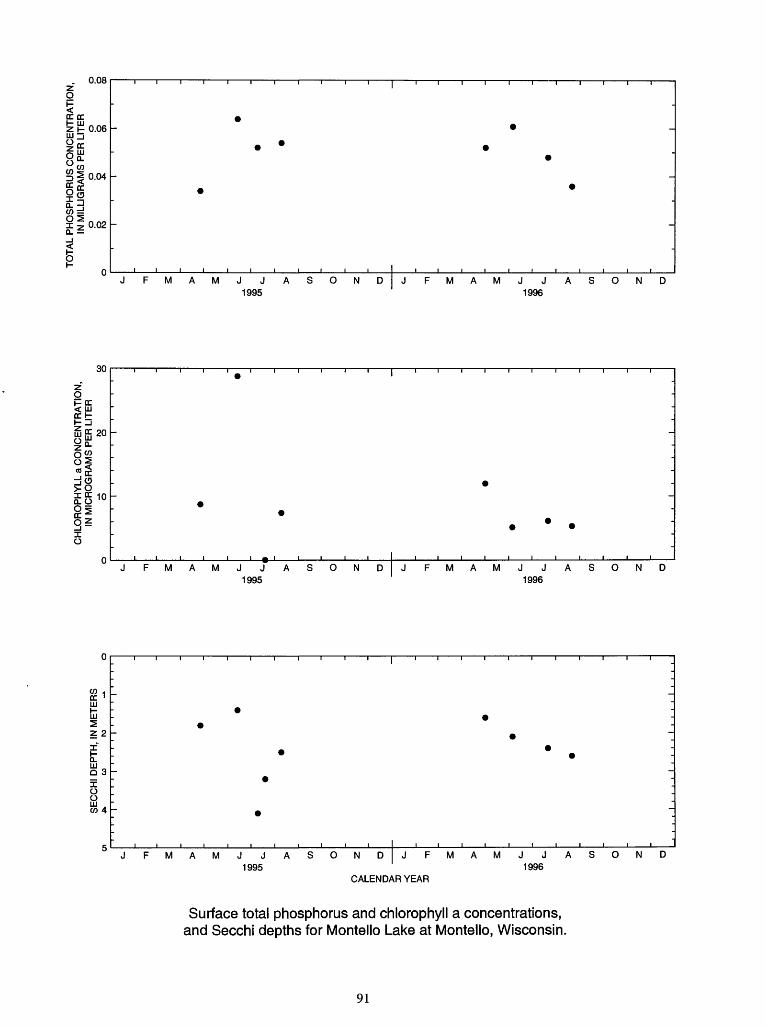
0.08
IT ITZH1
LU j0.06
COO COisQ. -j
iii
0.04
0.02
JFMAMJJASOND 1995
JFMAMJJASOND 1996
30
O Pec< LU EC t
o
JFMAMJJASOND 1995
JFMAMJJASOND 1996
CO 4EC 'LU
01 _ Q 3
JFMAMJJASOND JFMAMJJASOND1995 1996
CALENDAR YEAR
Surface total phosphorus and chlorophyll a concentrations, and Secchi depths for Montello Lake at Montello, Wisconsin.
91

455504089260500 MOON LAKE NEAR ST. GERMAIN, WI
LOCATION.--Lat 45°55'04", long 89°26'05", in SE 1/4 SE 1/4 sec.25, T.40 N., R.8 E., Vilas County, Hydrologic Unit 07070001, 2.9 mi northeastof St. Germain.
PERIOD OF RECORD.--May 1985 to September 1988 and October 1989 to September 1990, Secchi depth only; February 1992 to current year. REMARKS.--The stage of Moon Lake is the same as Alma Lake; lake stages read at Alma Lake. Lake sampled near center at the deep hole. Lake
ice-covered during March measurements. Water-quality analyses done by Wisconsin State Laboratory of Hygiene.
WATER-QUALITY DATA, MARCH 11 TO AUGUST 14, 1996 (Milligrams per liter unless otherwise indicated)
Depth of sample (ft)Lake stage (ft)Specific conductance ((iS/cm)pH (units)Water temperature (°C)Color (Pt-Co. scale)Turbidity (NTU)Secchi-depth (meters)Dissolved oxygenHardness, as CaCO3Calcium, dissolved (Ca)Magnesium, dissolved (Mg)Sodium, dissolved (Na)Potassium, dissolved (K)Alkalinity, as CaCO3Sulfate, dissolved (SO4)Chloride, dissolved (Cl)Fluoride, dissolved (F)Silica, dissolved (SiO2)Solids, dissolved, at 180 CNitrogen, NO2 + NO3, diss. (as N)Nitrogen, ammonia, dissolved (as N)Nitrogen, organic, total (as N)Nitrogen, amm. + org., total (as N)Nitrogen, total (as N)Phosphorus, total (as P)Phosphorus, ortho, dissolved (as P)Iron, dissolved (Fe) (ig/LManganese, dissolved (Mn) (ig/LChlorophyll a, phytoplankton ((ig/L)
Mar.
3.0___
307.10.5______
--12.8
______------
______
______
) ___
) ___
) ______
)
11
37
626.55.0
-0.3
___
_________
___
1
1966.10<0
8
2000730
<00
280
<00000
<070102,
May
.511.
.00
.503.
.3
.0
.7
.6
.4
.0
.6
.1
.2
.10
.03
.50
.50
.60
.016
.002
.5
15
3753195510<0
,76
2000730
<00
280
<00000
<0808-
.9.0
.50
.4
.0
.8
.6
.4
.0
.5
.1
.3
.11
.03
.40
.40
.51
.013
.002
--
June
1.511.
226.9
20.5___
5.9.2
___
___
___
___0.008
___2.2
27
3756255.97.0
10.9
_______________---_____________________---___0.090___
___
July
1.511.5
226.9
22.0______
4.28.6
___---_________---______---
___---___---___0.007___---___1.2
23
387256.08.0
0.4
___---
---
---
___0.036______------
Aug.
1.511.
236.6
22.5______
4.8.5
___
---
___0.007
------2.0
. 14
37.82276.09.0
___.7
0.3
___
---
---0.00
---------
3-11-96
10
5-15-96 6-27-96 7-23-96 8-14-96
DISSOLVED OXYGEN (D.O.), IN MILLIGRAMS PER LITER
10 20 30 "0 10 20 30 ~0 10 20
WATER TEMPERATURE (W.T.), IN DEGREES CELSIUS
30 10 20 30
PH, IN STANDARD UNITS
45678 45678 45678 45678 45678
UJ 10 HI
"20
Q.UJ Q 30
S.C. 10
20
30
10
20
30
10
20
30
10
20
30
40 I i i i I 40' i i ' I 40 ' ' ' ' ' 40' ' ' ' ' 40 0 25 50 75 100 0 25 50 75 100 0 25 50 75 100 0 25 50 75 100 0 25 50 75 100
SPECIFIC CONDUCTANCE (S.C.), IN MICROSIEMENS PER CENTIMETER AT 25 DEGREES CELSIUS
92
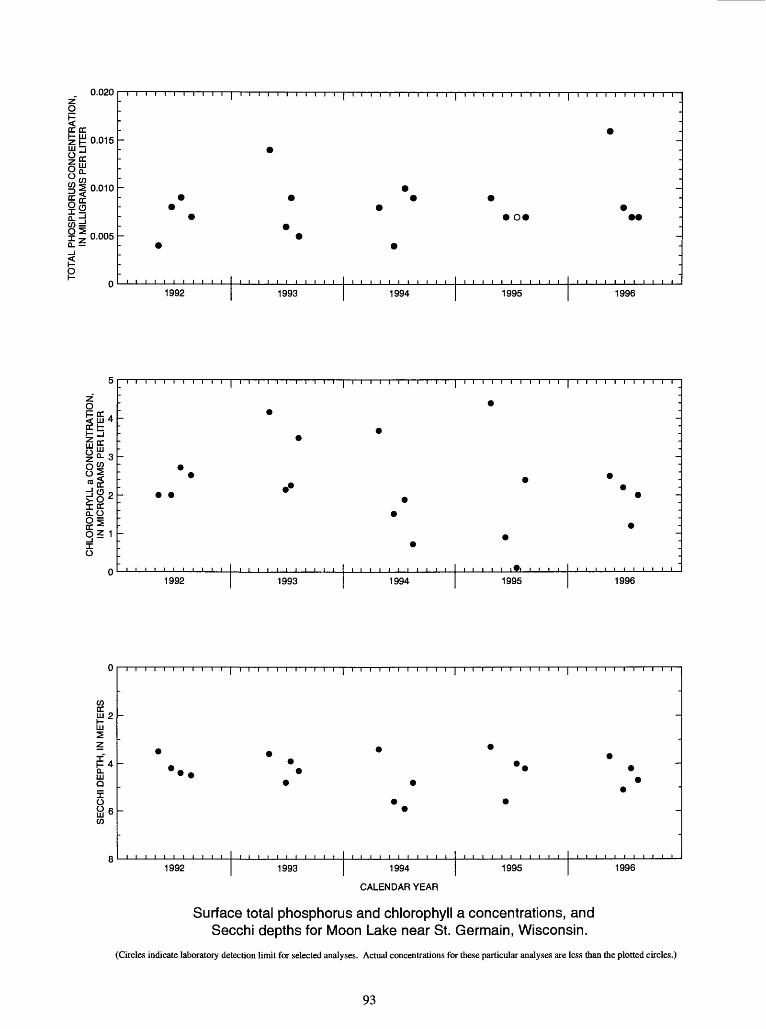
0.020
0.015
50.010
± 0.0050.
o«
1992 1993 1994 1995 1996
oFee< LJJ2b
E£CL 3
>oICC 0-0
§" 1o
1992 1993 1994 1995 1996
1992 1993 1994
CALENDAR YEAR
1995 1996
Surface total phosphorus and chlorophyll a concentrations, and Secchi depths for Moon Lake near St. Germain, Wisconsin.
(Circles indicate laboratory detection limit for selected analyses. Actual concentrations for these particular analyses are less than the plotted ckcles.)
93

454622088324801 MORGAN LAKE NEAR FENCE, WI
LOCATION.-Lat 45°46'22", long 88°32'48", in NE 1/4 NW 1/4 SW 1/4 sec. 18, T.38 N., R.16 E., Florence County, Hydrologic Unit 04030108, at southwest end of lake on dirt road off Forest Service Road 2161,6 mi west northwest of Fence.
DRAINAGE AREA.--Not determined. Area of lake, 44 acres.
PERIOD OF RECORD.-October 1987 to current year.
GAGE. Water-stage recorder. Datum of gage is approximately 1,400.00 ft above sea level.
REMARKS.--Records good.
EXTREMES FOR PERIOD OF RECORD.--Maximum observed gage height, 66.36 ft, June 21-22, 1993; minimum observed gage height, 63.61 ft, Oct. 19,1989.
EXTREMES FOR CURRENT YEAR.-Maximum observed gage height, 66.35 ft, May 11; minimum observed gage height, 65.24 ft, Oct. 2-5.
GAGE HEIGHT, FEET, WATER YEAR OCTOBER 1995 TO SEPTEMBER 1996
DAILY MEAN VALUES
OCT NOV DEC JAN FEE MAR APR MAY JUN JUL AUG SEP
12345
6789
10
1112131415
1617181920
2122232425
262728293031
MEANMAXMIN
65.2565.2465.2465.2465.24
65.3565.4365.4365.4365.45
65.4665.4665.4565.4465.43
65.4465.4465.4365.4165.42
65.4665.4865.5065.5765.57
65.5865.5865.5865.5865.5865.58
65.4465.5865.24
65.6165.6665.6565.6565.65
65.6665.6565.6465.6365.63
65.6465.6465.6265.6265.62
65.6365.6365.6365.6365.63
65.6465.6465.6465.6465.64
65.6665.6865.6965.6965.70 -
65.6465.7065.61
65.7065.7165.7165.7065.71
65.7065.7065.7065.7165.71
65.7165.7165.7165.7665.77
65.7665.7665.7665.7665.76
65.7665.7665.7565.7565.74
65.7465.7465.7365.7365.7365.73
65.7365.7765.70
65.7465.7365.7365.7365.74
65.7365.7365.7365.7465.74
65.7465.7365.7365.7365.72
65.7265.7265.8065.8565.86
65.8665.8565.8365.8365.83
65.8365.9065.9065.9265.9165.90
65.7965.9265.72
65.8965.8965.8965.8965.88
65.8865.8865.8865.8865.89
65.8865.8865.8865.8865.88
65.8865.8865.8965.8965.89
65.8665.8665.8665.8665.86
65.8665.8765.8865.89
65.8865.8965.86
65.9065.8965.8865.8965.89
65.8665.8565.8565.8565.85
65.8465.8365.8365.8365.83
65.8365.8365.8365.8365.80
65.7965.7865.7865.8265.90
65.9065.9065.9065.9065.9065.90
65.8565.9065.78
65.8965.8965.8865.8965.90
65.9065.9065.9065.8865.88
65.8765.8965.9365.9465.94
65.9665.9665.9766.0366.08
66.1166.1266.1266.1466.18
66.2066.2066.2166.2166.24
66.0166.2465.87
66.2566.2566.2666.2666.27
66.2966.3066.3066.3066.33
66.3566.3466.3366.3366.33
66.3066.3066.3266.3266.33
66.3166.3066.2966.2866.25
66.2466.2366.2266.2166.1866.17
66.2866.3566.17
66.1766.2266.2366.2466.24
66.2866.2'966.3066.3066.30
66.3066.2866.2766.2466.23
66.2266.2366.2566.2566.26
66.2666.2866.2566.2466.24
66.2466.2966.3066.2966.28
66.2666.3066.17
66.2466.2666.2466.2366.22
66.1966.1866.1766.1666.16
66.1266.1466.1866.1866.17
66.1766.1666.2166.2366.22
66.2166.1866.1766.1766.17
66.1666.1566.1666.1766.1666.16
66.1866.2666.12
66.1666.1566.1366.1266.14
66.1766.2266.2266.1966.17
66.1666.1666.1666.1366.11
66.1066.1066.0866.0666.05
66.0466.0666.0566.0466.03
65.9965.9865.9865.9865.9465.93
66.0966.2265.93
65.9365.9365.9265.9165.89
65.8765.8765.8665.8665.84
65.8565.8165.8065.7765.76
65.7565.7465.7465.7365.71
65.7265.7565.7565.7665.75
65.7565.7565.7565.7565.75
___
65.8065.9365.71
94
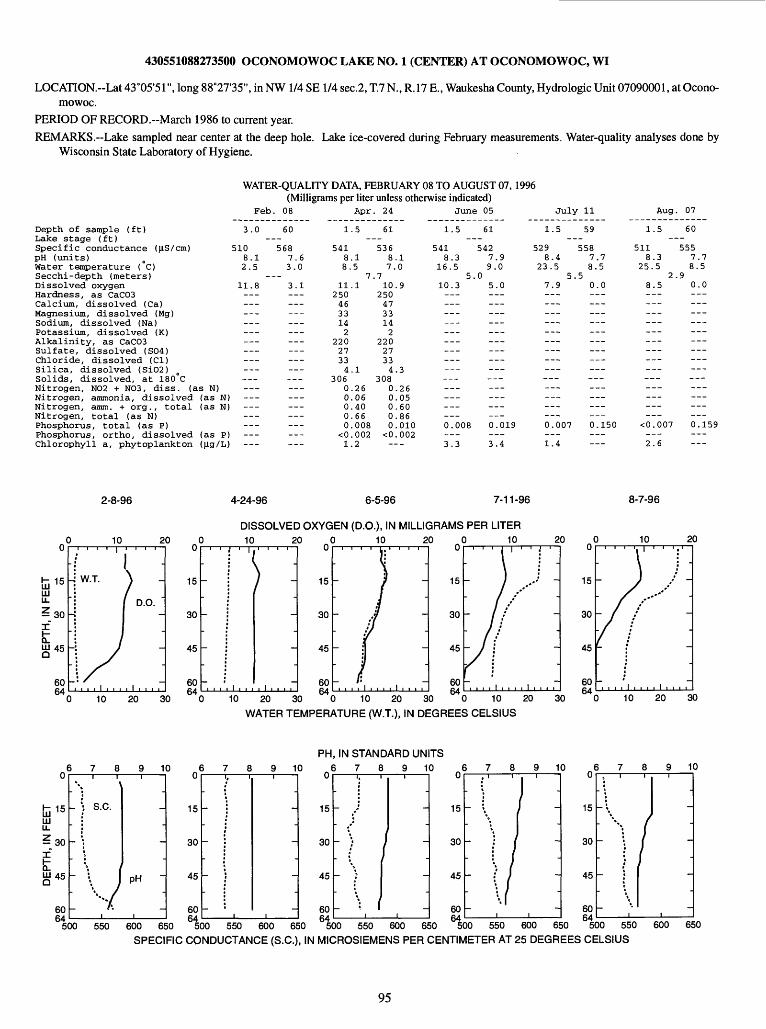
430551088273500 OCONOMOWOC LAKE NO. 1 (CENTER) AT OCONOMOWOC, WI
LOCATION.--Lat 43°05'51", long 880 27'35", in NW 1/4 SE 1/4 sec.2, T.7 N., R.17 E., Waukesha County, Hydrologic Unit 07090001, at Ocono-mowoc.
PERIOD OF RECORD.-March 1986 to current year. REMARKS.--Lake sampled near center at the deep hole. Lake ice-covered during February measurements. Water-quality analyses done by
Wisconsin State Laboratory of Hygiene.
WATER-QUALITY DATA, FEBRUARY 08 TO AUGUST 07, 1996 (Milligrams per liter unless otherwise indicated)
Depth of sample (ft)Lake stage (ft)Specific conductance (US/cm)pH (units)Water temperature ( C)Secchi-depth (meters)Dissolved oxygenHardness, as CaC03Calcium, dissolved (Ca)Magnesium, dissolved (Mg)Sodium, dissolved (Na)Potassium, dissolved (K)Alkalinity, as CaC03Sulfate, dissolved (S04)Chloride, dissolved (Cl)Silica, dissolved (Si02)Solids, dissolved, at 180 CNitrogen, N02 + N03, diss. (as N)Nitrogen, ammonia, dissolved (as N)Nitrogen, amm. + org., total (as N)Nitrogen, total (as N)Phosphorus, total (as P)Phosphorus, ortho, dissolved (as P)Chlorophyll a, phytoplankton (|ig/L)
Feb.
3.0
5108.12.5
-_11.8
___
___
__________________
08
60
5687.63.0
_3.1
___
_________
______
___
1
54188.
112504633142
22027334
30600000
<01
Apr
.5
.15
7.1
.1
.26
.06
.40
.66
.008
.002
.2
. 24
61
53687
.710
2504733142
22027334
30800000
<0-
.1.0
.9
.3
.26
.05
.60
.86
.010
.002--
Jun
1.5
5418.3
16.55
10.3
___
___
______
___
______0.008___3.3
e 05
61
5427.99.0
.05.0___
______
___
---___
___0.019___3.4
July
1.5
529 58.4
23.55.5
7.9
------
______0.007___1.4
11
59
587.78.5
0.0
---
0.150
Aug.
1.5
5118.3
25.52.
8.5___---_______________
___
<0.007
2.6
07
60
5557.78.5
90.0------___---------_________
---
___
0.1
2-8-96 4-24-96 6-5-96 7-11-96 8-7-96
10
fc 15
-_30
UJ45
20 00
W.T.
D.O.
10 20 30
15
30
45
DISSOLVED OXYGEN (D.O.), IN MILLIGRAMS PER LITER10 20 10 20
15
30
45
10
15
30
45
20
10 20 30 0 10 20 30 0 10 20 30 WATER TEMPERATURE (W.T.), IN DEGREES CELSIUS
15
30
45
10 20
10 20 30
PH, IN STANDARD UNITS
6789 10 6789 10 6789 10 6789 10 6 789 10u
J_ 15111 U.- 30
It£45
60RA
\
s.c..
-
»- '.
: V
1
_
-
-
PH -
i
15
30
45
u
15
30
45
60CA
~ .'
~
~ }
1
-
-
-
1
15
30
45
15
30
45
500 550 600 650 500 550 600 650 500 550 600 650 500 550 600 650 500 550 600 650
SPECIFIC CONDUCTANCE (S.C.), IN MICROSIEMENS PER CENTIMETER AT 25 DEGREES CELSIUS
95
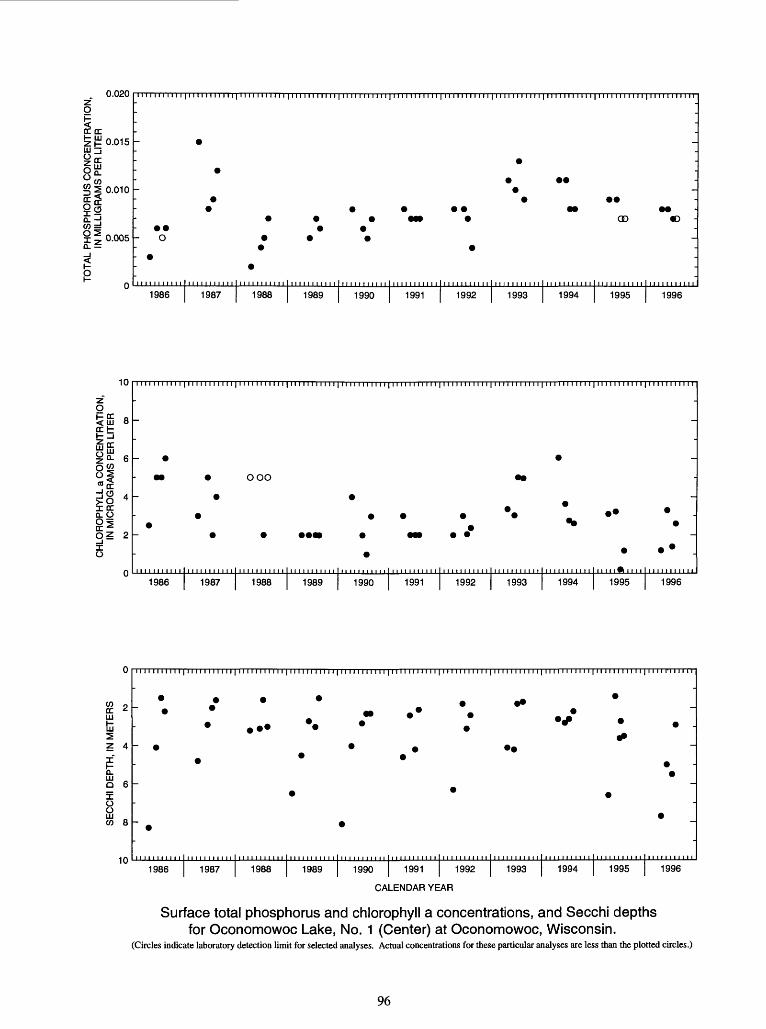
0.020
CCCC ££0.015LU I] O^
0.010
I<3
oiQ.
I
0.005
00 0
1986 1987 1988 1989 1990 1991 1992 1993 1994 1995 1996
10
Sw 8I sgp: ^Q- 6
P §1 2
O
ooo
1986 1987 1988 1989 1990 1991 1992 1993 1994 1995 1996
Q.LU _ Q 6
O OLUco 8
1986 1987 1988 1989 1990 1991 1992 1993 1994 1995 1996
CALENDAR YEAR
Surface total phosphorus and chlorophyll a concentrations, and Secchi depths for Oconomowoc Lake, No. 1 (Center) at Oconomowoc, Wisconsin.
(Circles indicate laboratory detection limit for selected analyses. Actual concentrations for these particular analyses are less than the plotted circles.)
96
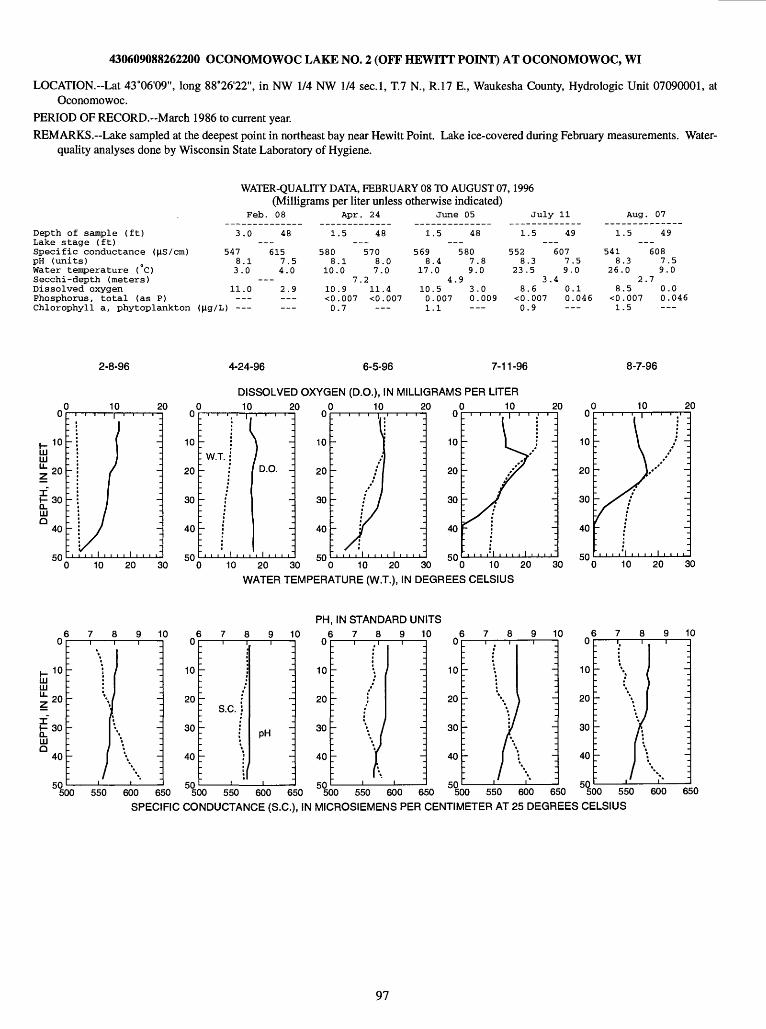
430609088262200 OCONOMOWOC LAKE NO. 2 (OFF HEWITT POINT) AT OCONOMOWOC, WI
LOCATION.--Lat 43°06'09", long 88°26'22", in NW 1/4 NW 1/4 sec.l, T.7 N., R.17 E., Waukesha County, Hydrologic Unit 07090001, at Oconomowoc.
PERIOD OF RECORD.-March 1986 to current year.REMARKS. Lake sampled at the deepest point in northeast bay near Hewitt Point. Lake ice-covered during February measurements. Water-
quality analyses done by Wisconsin State Laboratory of Hygiene.
WATER-QUALITY DATA, FEBRUARY 08 TO AUGUST 07,1996 (Milligrams per liter unless otherwise indicated)
Depth of sample (ft)Lake stage (ft)Specific conductance (H-S/cm)pH (units)Water temperature ( C)Secchi-depth (meters)Dissolved oxygenPhosphorus, total (as P)Chlorophyll a, phytoplankton (\ig/L) ---
Feb.
3.0
5478.13.0
--11.0___
,)
08
48
6157.54.0
-2.9___
1
5808
10.
10<00
Apr.
.5
.10
7..9.007.7
24
48
5708.07.0
211.4<0.007___
1
5698
17.
1001
Jun
.5
.4
.04
.5
.007
.1
e 05
48
5807.89.0
.93.00.009
1
5528
23.
8<00
July 11
.5 49
607.3 7.55 9.0
3.4.6 0.1.007 0.046.9
Aug.
1.5
5418.3
26.02.
8.5<0.0071.5
07
49
6087.59.0
70.00.046___
2-8-96 4-24-96 6-5-96 7-11-96 8-7-96
DISSOLVED OXYGEN (D.O.), IN MILLIGRAMS PER LITER10 20 0
0
10 20 30
8 9 10u
1-10UJ UJ
£20
t 3°
HIo
40
5l
Ml Jj I :
i ^r- ^
i iDO 550 600 65
10
: W.T.
20 00
10 20
D.O. -
10 20 30 10 20 30
10
WATER TEMPERATURE (W.T.), IN DEGREES CELSIUS
8 9 10u
10
20
30
40
5°5<
1 '
'-
_S.C.
-
: \DO 550
1
-_
_I
;
pH ~
600 6£
PH, IN STANDARD UNITS 8 9 10
20 00
10 20 30
8 9 10u
10
20
30
40
5°5(
1 '
j-
- (t
DO 550
1
-_
-_
-_
-_
i600 6J
u
10
20
30
40
50 5°5(
1 ; '
\
7
r I'- ri
X) 550
1 :
-_
-_
-_
-_
i*
600 6£
10 20
10 20 30
8 9 10u
10
20
30
40
5°5C
'/
- \
'r
\ V- yDO 550
:-_
-_
-_
-
600 6£
SPECIFIC CONDUCTANCE (S.C.), IN MICROSIEMENS PER CENTIMETER AT 25 DEGREES CELSIUS
97
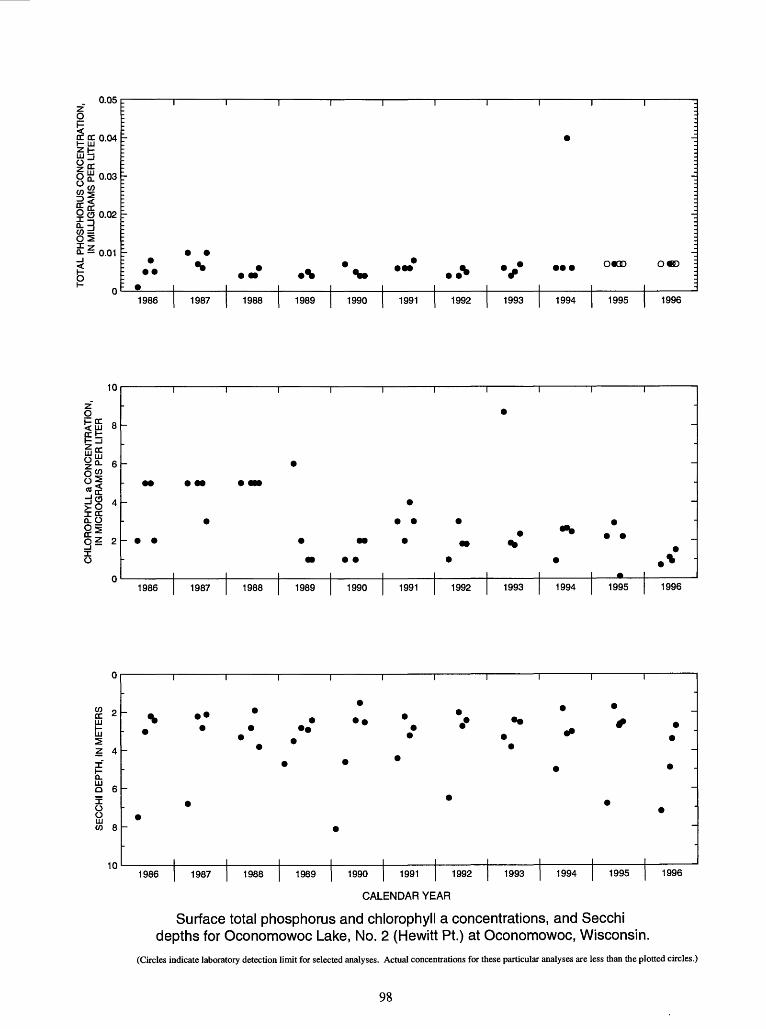
SE
CC
HI
DE
PT
H,
IN M
ET
ER
S
oo
o>
&
ro
o
CH
LOR
OP
HY
LL a
CO
NC
EN
TR
AT
ION
, IN
MIC
RO
GR
AM
S P
ER
LIT
ER
TO
TA
L P
HO
SP
HO
RU
S C
ON
CE
NT
RA
TIO
N,
IN M
ILLI
GR
AM
S P
ER
LIT
ER
p
p
p
p
p
9 2
g 8
8 §
n cT VI o'
B) 0 1 § 0. tf. § 1 s> » S- I P £ § i g & 1 1 0 1o'
C,
P) n 0 oT ;s than
th 0 "2.
0 s. E
Q.
(D 3
C?
-H ^
o
oo
2.8|
3
O -o
3
= o
o
i
wo ^
.0
o5T
^0>
0)
p
o10
6"
"r
oo-o
s.*<
. "*
" ~
^
>ur*
o
'
o
*~^
m
c? 3
.§
H>
Is o
c/> ll < C
O^ f
l>(/)
o
§1
£ P
o r~ m z D 3D m 3D
to O)
CO 23 CO
00
00 Is 00 (O to g _,,
(O
CO i N)
(O
(O CO to CO -I*.
CO
CO en i O)
1 1
' 1
' 1
' 1
'
_
_
9
9 9
0
£
%
*
~~
-
*
«
^
1 ,
1 ,
1 ,
1 ,
J
i O) to 23 to
oo
oo to oo
to i o to
to to s to
to CO to s i en (O
1 I
' 1
' 1
' 1
'
I t
_
_
. *
1
1 * t
~
1
*
*.
* t
~
I*
-
*.
1.1,1.1.
V
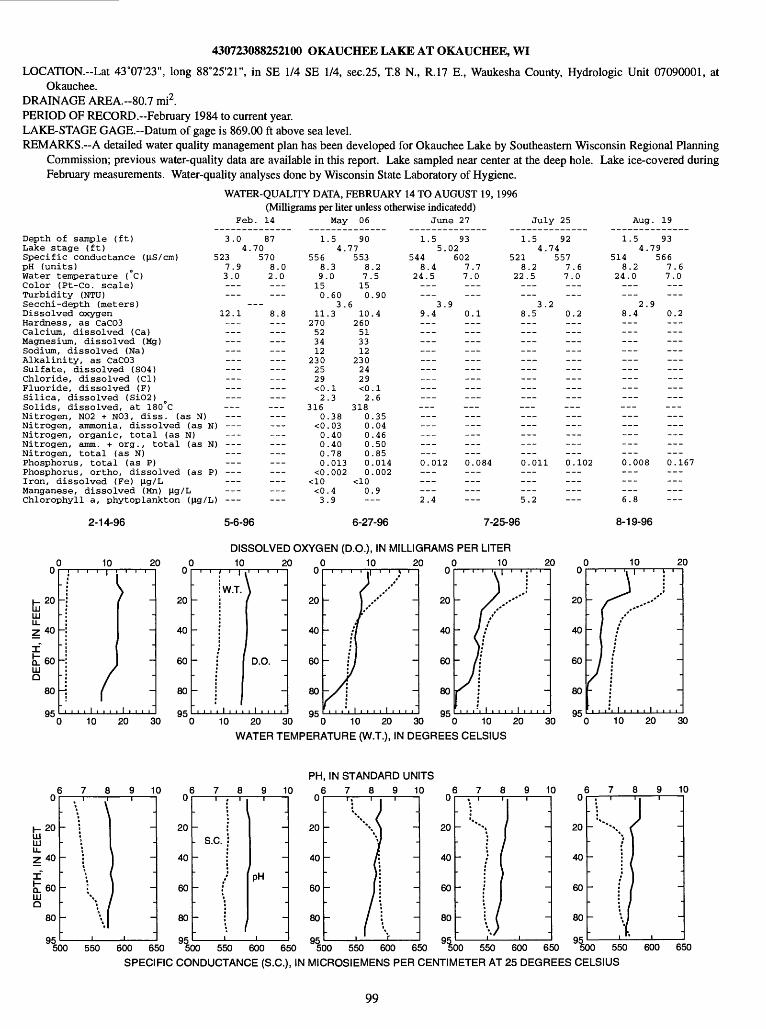
430723088252100 OKAUCHEE LAKE AT OKAUCHEE, WI
LOCATION.--Lat 43°07'23", long 88°25'21", in SE 1/4 SE 1/4, sec.25, T.8 N., R.17 E., Waukesha County, Hydrologic Unit 07090001, atOkauchee.
DRAINAGE AREA.--80.7 mi2 . PERIOD OF RECORD.-February 1984 to current year. LAKE-STAGE GAGE.-Datum of gage is 869.00 ft above sea level. REMARKS.--A detailed water quality management plan has been developed for Okauchee Lake by Southeastern Wisconsin Regional Planning
Commission; previous water-quality data are available in this report. Lake sampled near center at the deep hole. Lake ice-covered duringFebruary measurements. Water-quality analyses done by Wisconsin State Laboratory of Hygiene.
WATER-QUALITY DATA, FEBRUARY 14 TO AUGUST 19, 1996 (Milligrams per liter unless otherwise indicatedd)
Feb. 14 May 06 June 27 July 25 Aug. 19
Depth of sample (ft)Lake stage (ft)Specific conductance ((is/cm)pH (units)Water temperature (°C)Color (Pt-Co. scale)Turbidity (NTU)Secchi-depth (meters)Dissolved oxygenHardness, as CaC03Calcium, dissolved (Ca)Magnesium, dissolved (Mg)Sodium, dissolved (Na)Alkalinity, as CaC03Sulfate, dissolved (S04)Chloride, dissolved (Cl)Fluoride, dissolved (F)Silica, dissolved (Si02)Solids, dissolved, at 180 CNitrogen, N02 + N03, diss. (as N)Nitrogen, ammonia, dissolved (as N)Nitrogen, organic, total (as N)Nitrogen, amm. + org., total (as N)Nitrogen, total (as N)Phosphorus, total (as P)Phosphorus, ortho, dissolved (as P)Iron, dissolved (Fe) jig/LManganese, dissolved (Mn) jig/LChlorophyll a, phytoplankton (jig/L)
2-14-96
3.0
5237.93.0______
12.1_________
_______________
___I)
___r)
___
>)
___,)
874.70
5708.02.0___
___8.8
___
___
1
55689.150
11270523412
2302529<02
3160
<00000
<0
<03
.54.
.30
.603.
.3
.1
.3
.38
.03
.40
.40
.78
.013
.002
.4
.9
9077553
87150
610
260513312
2302429<02
3180000000
0-
.2.5
.90
.4
.1
.6
.35
.04
.46
.50
.85
.014
.002
.9
1.55.
5448.4
24.5___
3.9.4___
___
___
___ ______
___0.012
___2.4
9302602
7.77.0______
90.1
___
0.084
___
1.54.
5218.2
22.5
___3.
8.5
0.011
___5.2
9274557
7.67.0
2
0.2
______
___0.102
__
1.54.
5148.2
24.0
___2.
8.4________________________
_______________0.008___
6.8
9379566
7.67.0
90.2
___
___
______
___0.167___
5-6-96 6-27-96 7-25-96 8-19-96
DISSOLVED OXYGEN (D.O.), IN MILLIGRAMS PER LITERo c
I- 20LUHI
Z 40
I
n~ 60HI Q
80
QC.
) 10
. " ' '
"
-
-
-
r /".,,,!..,
2
\~
-
-
-
-
I . , , ,
0 « C0
20
40
60
80
QC.
) 10i i i |
W.T.
-
-
-
, i , , i , , ,
2V"-
--
D.O. -
, i , , , ,
0 « (0
20
40
60
80
OK
) 10 2. , , . ; .1 ** ~~Is'
I
f1
~ 1
-/ -, , , 1 , , , , 1 . , , ."
0 « c0
20
40
60
80
QC.
10 2
_ S ^** / »
/ /
" I"'
V/
/ :, , , ! , i , , , , i , , , i"
o c0
20
40
60
80
QK
)
1 |
10 2 } ) ..'
/ '
-
-
, I , , , , I , , , ,10 20 30 10 20 30 * 0 10 20 30 0 10 20 30
WATER TEMPERATURE (W.T.), IN DEGREES CELSIUS
6 7 8 9 10U
,-20HIHIU.Z 40
I
a. 60LUQ
80
OK
v \- :*
- :
\
\\
-- ---
\ 1
: M :550 600 650
PH, IN STANDARD UNITS 789 10 6789 10
u
20
40
60
80
OK
1 '
_
- S.C.
-
-
1
_
--
PH '_
-
i
8 9 10 8 9 10U
20
40
60
80
OK
_ . _/ -
/
i ' r
U
20
40
60
80
OK
[
-
-- .1P
-
1
u
20
40
60
80
QC.
~ **\ \
~
-
- I
:-
-
-
550 600 650 500 550 600 650 550 600 650 500 550 600 650
SPECIFIC CONDUCTANCE (S.C.), IN MICRO-SIEMENS PER CENTIMETER AT 25 DEGREES CELSIUS
99
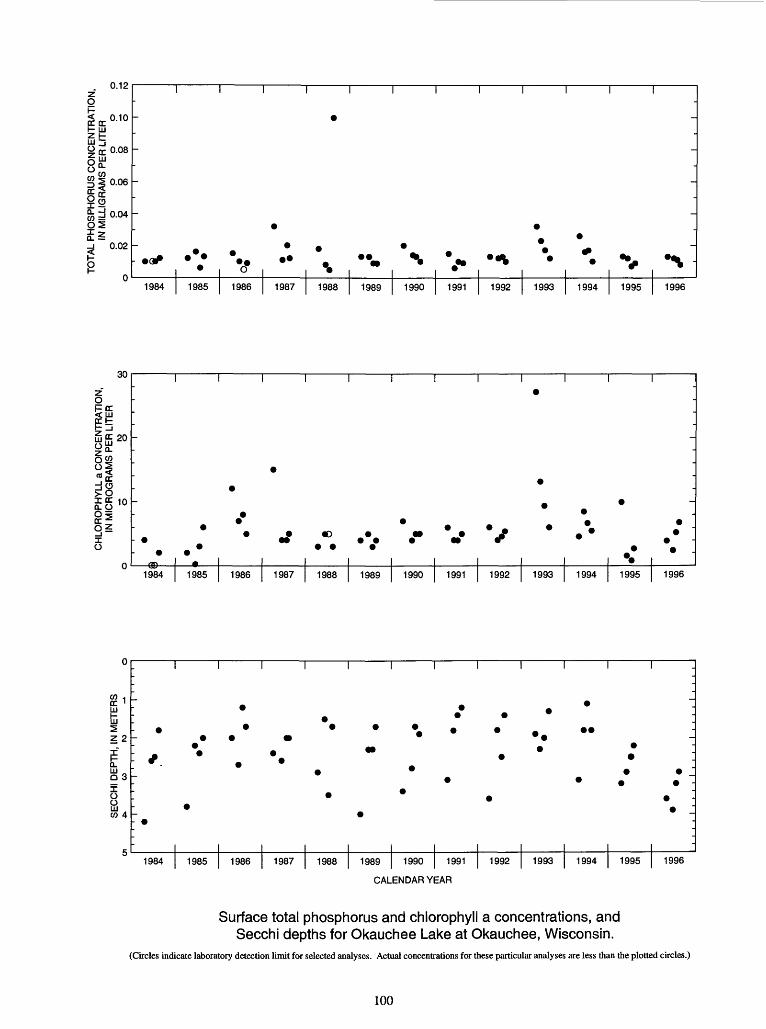
U. IZzO
Is 0' 10UJ 2j<£ CC 0.081-rn W
^f, 0.06
CC jSogcod 0.04OSX 2Q. ^ 0.02
*~ ° n i \ i i i i i i
I I III
.
-
.
-
~
-
0 0~. 9
* * * * *%_ * *
c? \ m *1984 1985 1986 1987 1988 1989 1990 1991 1992 1993 1994 1995 1996
30
OHOC
SISfS20
QCO ol
°I OS
O
1984 1985 1986 1987 1988 1989 1990 1991 1992 1993 1994 1995 1996
iUJ _ Q 3
o
co 4
1984 1985 1986 1987 1988 1989 1990 1991 1992 1993 1994 1995 1996
CALENDAR YEAR
Surface total phosphorus and chlorophyll a concentrations, and Secchi depths for Okauchee Lake at Okauchee, Wisconsin.
(Circles indicate laboratory detection limit for selected analyses. Actual concentrations for these particular analyses are less than the plotted circles.)
100
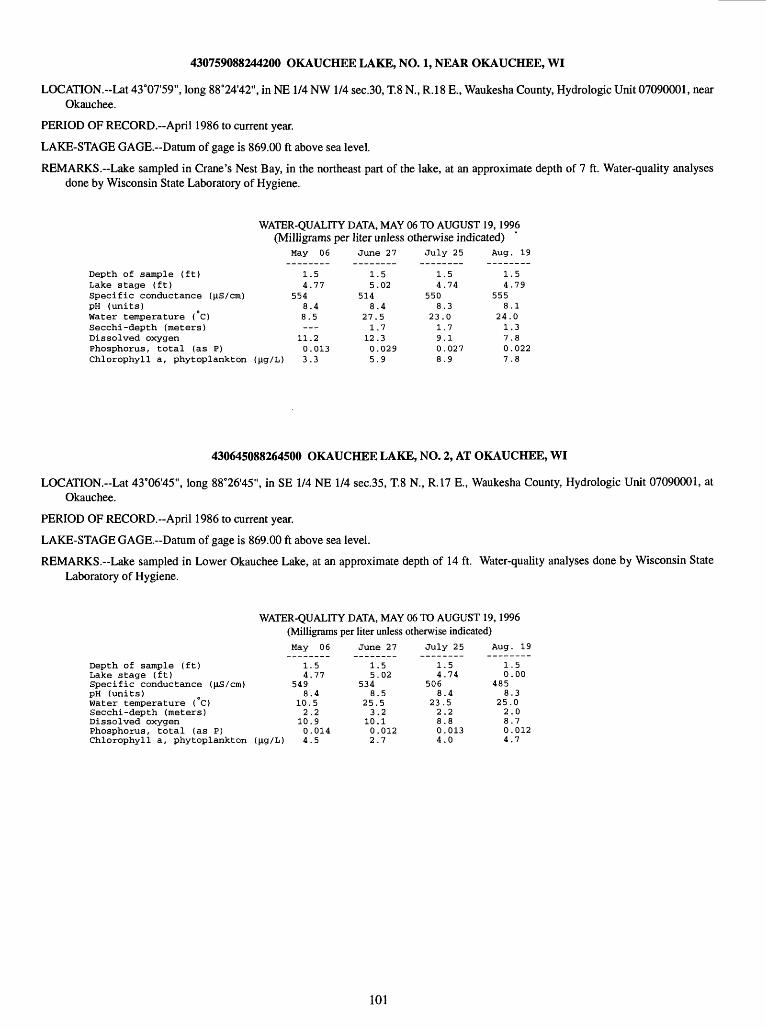
430759088244200 OKAUCHEE LAKE, NO. 1, NEAR OKAUCHEE, WI
LOCATION.--Lat 43°07'59", long 88°24'42", in NE 1/4 NW 1/4 sec.30, T.8 N., R.18 E., Waukesha County, Hydrologic Unit 07090001, near Okauchee.
PERIOD OF RECORD.--April 1986 to current year.
LAKE-STAGE GAGE.-Datum of gage is 869.00 ft above sea level.
REMARKS.-Lake sampled in Crane's Nest Bay, in the northeast part of the lake, at an approximate depth of 7 ft. Water-quality analyses done by Wisconsin State Laboratory of Hygiene.
WATER-QUALITY DATA, MAY 06 TO AUGUST 19, 1996 (Milligrams per liter unless otherwise indicated)
May 06 June 27 July 25 Aug. 19
Depth of sample (ft) 1.5 1.5 1.5 1.5Lake stage (ft) 4.77 5.02 4.74 4.79Specific conductance (\iS/cm) 554 514 550 555pH (units) e 8.4 8.4 8.3 8.1Water temperature (°C) 8.5 27.5 23.0 24.0Secchi-depth (meters) 1.7 1.7 1.3Dissolved oxygen 11.2 12.3 9.1 7.8Phosphorus, total (as P) 0.013 0.029 0.027 0.022Chlorophyll a, phytoplankton (^ig/L) 3.3 5.9 8.9 7.8
430645088264500 OKAUCHEE LAKE, NO. 2, AT OKAUCHEE, WI
LOCATION.-Lat 43°06'45", long 88°26'45", in SE 1/4 NE 1/4 sec.35, T.8 N., R.17 E., Waukesha County, Hydrologic Unit 07090001, at Okauchee.
PERIOD OF RECORD.--April 1986 to current year.
LAKE-STAGE GAGE.-Datum of gage is 869.00 ft above sea level.
REMARKS.-Lake sampled in Lower Okauchee Lake, at an approximate depth of 14 ft. Water-quality analyses done by Wisconsin State Laboratory of Hygiene.
WATER-QUALITY DATA, MAY 06 TO AUGUST 19, 1996 (Milligrams per liter unless otherwise indicated)May 06 June 27 July 25 Aug. 19
Depth of sample (ft) 1.5 1.5 1.5 1.5Lake stage (ft) 4.77 5.02 4.74 0.00Specific conductance (^S/cm) 549 534 506 485pH (units) o 8.4 8.5 8.4 8.3Water temperature (°C) 10.5 25.5 23.5 25.0Secchi-depth (meters) 2.2 3.2 2.2 2.0Dissolved oxygen 10.9 10.1 8.8 8.7Phosphorus, total (as P) 0.014 0.012 0.013 0.012Chlorophyll a, phytoplankton (^ig/L) 4.5 2.7 4.0 4.7
101
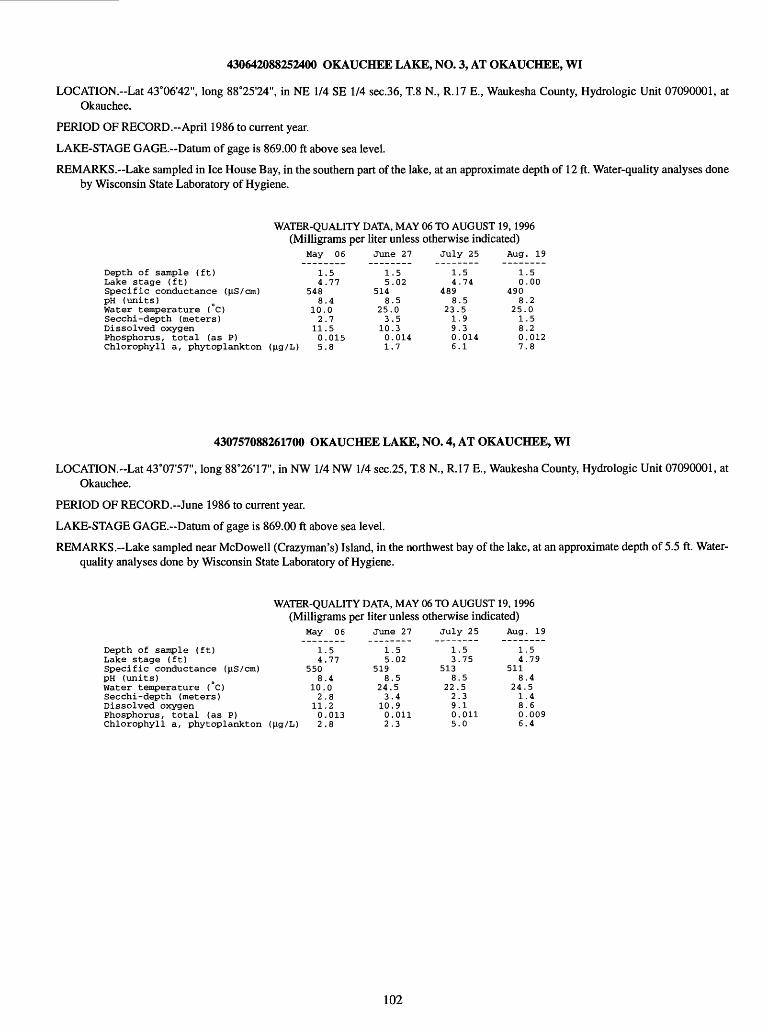
430642088252400 OKAUCHEE LAKE, NO. 3, AT OKAUCHEE, WI
LOCATION.--Lat 43°06'42", long 88°25'24", in NE 1/4 SE 1/4 sec.36, T.8 N., R.17 E., Waukesha County, Hydrologic Unit 07090001, at Okauchee.
PERIOD OF RECORD.--April 1986 to current year.
LAKE-STAGE GAGE.-Datum of gage is 869.00 ft above sea level.
REMARKS. Lake sampled in Ice House Bay, in the southern part of the lake, at an approximate depth of 12 ft. Water-quality analyses done by Wisconsin State Laboratory of Hygiene.
WATER-QUALITY DATA, MAY 06 TO AUGUST 19,1996 (Milligrams per liter unless otherwise indicated)
May 06 June 27 July 25 Aug. 19
Depth of sample (ft) 1.5 1.5 1.5 1.5Lake stage (ft) 4.77 5.02 4.74 0.00Specific conductance (US/cm) 548 514 489 490pH (units) 8.4 8.5 8.5 8.2Water temperature ( C) 10.0 25.0 23.5 25.0Secchi-depth (meters) 2.7 3.5 1.9 1.5Dissolved oxygen 11.5 10.3 9.3 8.2Phosphorus, total (as P) 0.015 0.014 0.014 0.012Chlorophyll a, phytoplankton (jig/L) 5.8 1.7 6.1 7.8
430757088261700 OKAUCHEE LAKE, NO. 4, AT OKAUCHEE, WI
LOCATION.~Lat 43°07'57", long 88°26'17", in NW 1/4 NW 1/4 sec.25, T.8 N., R.17 E., Waukesha County, Hydrologic Unit 07090001, at Okauchee.
PERIOD OF RECORD.-June 1986 to current year.
LAKE-STAGE GAGE.-Datum of gage is 869.00 ft above sea level.
REMARKS.-Lake sampled near McDowell (Crazyman's) Island, in the northwest bay of the lake, at an approximate depth of 5.5 ft. Water- quality analyses done by Wisconsin State Laboratory of Hygiene.
WATER-QUALITY DATA, MAY 06 TO AUGUST 19, 1996 (Milligrams per liter unless otherwise indicated)
May 06 June 27 July 25 Aug. 19
Depth of sample (ft) 1.5 1.5 1.5 1.5Lake stage (ft) 4.77 5.02 3.75 4.79Specific conductance (jiS/cm) 550 519 513 511pH (units) o 8.4 8.5 8.5 8.4Water temperature (°C) 10.0 24.5 22.5 24.5Secchi-depth (meters) 2.8 3.4 2.3 1.4Dissolved oxygen 11.2 10.9 9.1 8.6Phosphorus, total (as P) 0.013 0.011 0.011 0.009Chlorophyll a, phytoplankton (Jlg/L) 2.8 2.3 5.0 6.4
102
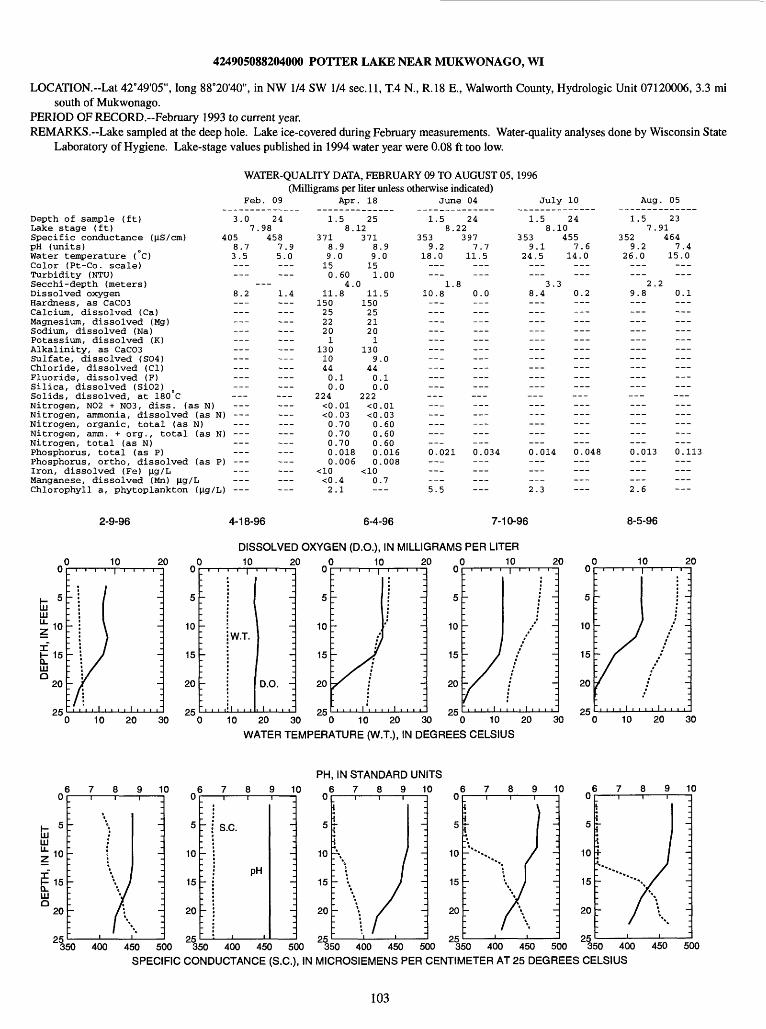
424905088204000 POTTER LAKE NEAR MUKWONAGO, WI
LOCATION.-Lat 42°49'05", long 88°20'40", in NW 1/4 SW 1/4 sec. 11, T.4 N., R.18 E., Walworth County, Hydrologic Unit 07120006, 3.3 misouth of Mukwonago.
PERIOD OF RECORD.-February 1993 to current year. REMARKS. Lake sampled at the deep hole. Lake ice-covered during February measurements. Water-quality analyses done by Wisconsin State
Laboratory of Hygiene. Lake-stage values published in 1994 water year were 0.08 ft too low.
WATER-QUALITY DATA, FEBRUARY 09 TO AUGUST 05, 1996 (Milligrams per liter unless otherwise indicated)
Feb. 09 Apr. 18 June 04 July 10
Depth of sample (ft)Lake stage (ft)Specific conductance (|i.S/cm)pH (units)Water temperature (°C)Color (Pt-Co. scale)Turbidity (NTU)Secchi-depth (meters)Dissolved oxygenHardness, as CaCOSCalcium, dissolved (Ca)Magnesium, dissolved (Mg)Sodium, dissolved (Na)Potassium, dissolved (K)Alkalinity, as CaCOSSulfate, dissolved (S04)Chloride, dissolved (Cl)Fluoride, dissolved (F)Silica, dissolved (Si02)Solids, dissolved, at 180 CNitrogen, N02 + N03, diss. (as N)Nitrogen, ammonia, dissolved (as N)Nitrogen, organic, total (as N)Nitrogen, amm. + org., total (as N)Nitrogen, total (as N)Phosphorus, total (as P)Phosphorus, ortho, dissolved (as P)Iron, dissolved (Fe) (Kj/LManganese, dissolved (Mn) ng/Chlorophyll a, phytoplankton (|i.g/L)
Aug. 05
3.07
4058.73.5
___
8.2
______
___
I) - ___
I) ---______
,)
___i)
24.98458
7.95.0______
1.4__________________
___
__
1
37189.150
111502522201
130104400
224<0<000000
<02
.58.
.90
.604.
.8
.1
.0
.01
.03
.70
.70
.70
.018
.006
.4
.1
2512371
89151
011
1502521201
1309
4400
222<0<000000
0-
.9.0
.00
.5
.0
.1
.0
.01
.03
.60
.60
.60
.016
.008
.7--
1.58.
3539.2
18.0
1.10.8
____________
___ ___
0.021
___5.5
2422397
7.711.5
80.0
___
______
___
___
0.034
___
1.58.
3539.1
24.5___
3.8.4
______
____________
0.014
2.3
2410455
7.614.0
30.2
______---_________
____________
0.048
1.57 .
3529.2
26.0 ___
2.9.8___---___
0.013___
2.6
2391464
7.415.0______
20.1
___0.113___
___
2-9-96 4-18-96 6-4-96 7-10-96 8-5-96
DISSOLVED OXYGEN (D.O.), IN MILLIGRAMS PER LITER
UJ Q
10 20
10 20 30
10 20u
5
10
15
20
<3K
'-
'_
'- W.T.
j-
'-
! , . , . i , . ,
1 :
-j
_i-
-j
D.O. -j
iii.."
10 20 10 20u
5
10
15
20
<3K
.
-
-
\ J
-/
-,,,,!
I ' _'_
i -I
/ ~.-_
j -_I. . i , , . , :
10 20 30 0 10 20 30 0 10 20 30
WATER TEMPERATURE (W.T.), IN DEGREES CELSIUS
10 20
10 20 30
PH, IN STANDARD UNITS
UJo
8 9 10
350 400 450 500
8 9 10u
5
10
15
20
<3K
-
-
~
-
1 '
s.c.
PH
' :
-_
-_
-~
-j
400 450 500
8 9 10 8 9 10 8 9 10
50 400 450 500 350 400 450 500 350 400 450 500
SPECIFIC CONDUCTANCE (S.C.), IN MICROSIEMENS PER CENTIMETER AT 25 DEGREES CELSIUS
103
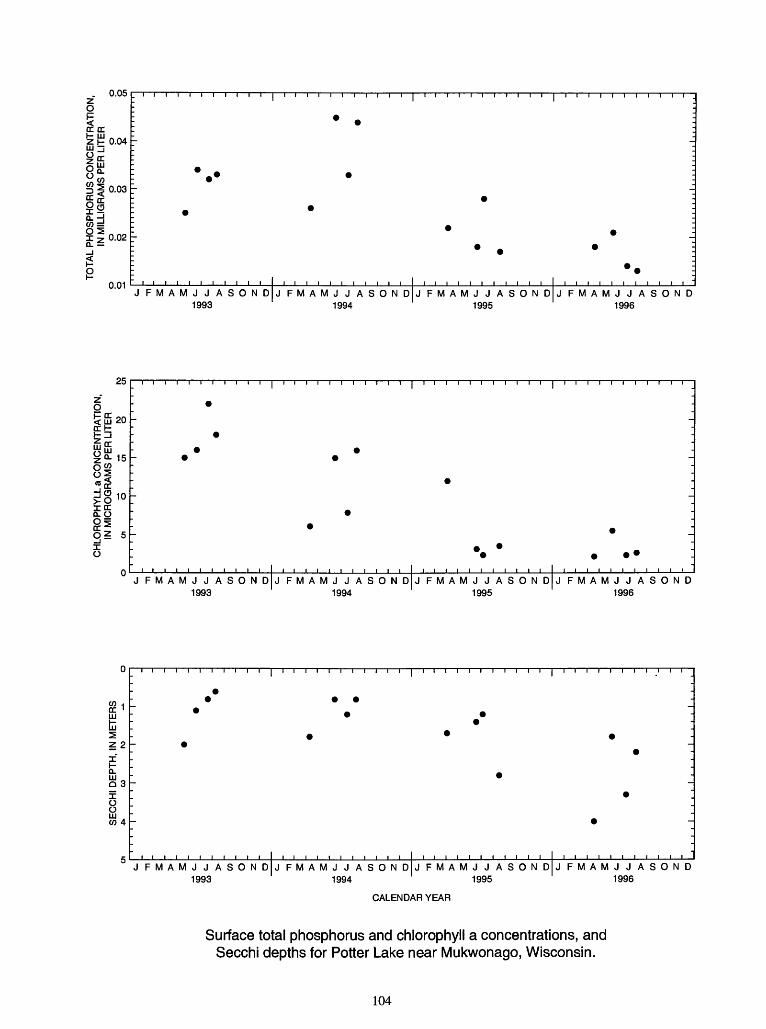
0.05
oI.0.04
0.03
0.01 IL-LJFMAMJJASOND
1993JFMAMJJASOND
1994JFMAMJJASOND
1995JFMAMJJASOND
1996
25
15
O
JFMAMJJASONDJFMAMJJASONDJFMAMJJASONDJFMAMJJASOND 1993 1994 1995 1996
i01 _O 3
JFMAMJJASOND 1993
JFMAMJJASOND JFMAMJJASOND1994 1995
JFMAMJJASOND 1996
CALENDAR YEAR
Surface total phosphorus and chlorophyll a concentrations, and Secchi depths for Potter Lake near Mukwonago, Wisconsin.
104

423246088175800 POWERS LAKE AT POWERS LAKE, WI
LOCATION.--Lat 42°32'46", long 88°17'58", in NW 1/4 SE 1/4 sec.13, T.I N., R.18 E., Walworth County, Hydrologic Unit 07120006, at PowersLake.
DRAINAGE AREA.--3.42 mi2. PERIOD OF RECORD.-March 1986 to current year. REMARKS. Lake sampled near center at the deep hole. Lake ice-covered during February measurements. Water-quality analyses done by
Wisconsin State Laboratory of Hygiene.
WATER-QUALITY DATA, FEBRUARY 05 TO AUGUST 12, 1996 (Milligrams per liter unless otherwise indicated)
Feb. 05 Apr. 16 June 10 July 15
Depth of sample (ft)Lake stage (ft)Specific conductance (^.S/cm)pH (units)Water temperature (°C)Color (Pt-Co. scale)Turbidity (NTU)Secchi-depth (meters)Dissolved oxygenHardness, as CaC03Calcium, dissolved (Ca)Magnesium, dissolved (Mg)Sodium, dissolved (Na)Potassium, dissolved (K)Alkalinity, as CaC03Sulfate, dissolved (S04)Chloride, dissolved (Cl)Fluoride, dissolved (F)Silica, dissolved (Si02)Solids, dissolved, at 180°CNitrogen, N02 + N03, diss. (as N)Nitrogen, ammonia, dissolved (as N)Nitrogen, amm. + org., total (as N)Nitrogen, total (as N)Phosphorus, total (as P)Phosphorus, ortho, dissolved (as P)Iron, dissolved (Fe) Jig/LManganese, dissolved (Mn) jig/LChlorophyll a, phytoplankton (jig/L)
Aug. 12
3.0
4967.63.0
14.2
___
I) I)
>)
___,)
3410.68
5327.84.5
___4.2
_________
_________
___-- -
___
1
48287.5
<0
112203433172
180323505
3100
<000
<0<0
<02
.510
.40
.504
.6
.1
.9
.02
.03
.50
.52
.007
.002
.4
.0
33.07483
875
<0.6
112203433162
180323505
3080
<000
<0<0
<0-
.4.0
.50
.5
.1
.9
.02
.03
.50
.52
.007
.002
.4
1.510,
4738.4
17.5______
3,9.8___
___
______0.014
8.0
34.33489
7.713.5______
.62.0
____________0.031
___
1.59,
4808.5
24.0
___3
8.5___
---_________ ___
___
___0.012
___2.8
33.82508
7.613.5
.00.3___
---___
___
___
___0.065
1.510.
4698.4
26.5
2,8.6
______ ______
0.009___
___3.9
31.10503
7.414.5
.10.2
---
0.040---
10
20
2-5-96
10
4-16-96 6-10-96 7-15-96 8-12-96
20
10 20 30
10 -
20 -
30 -
DISSOLVED OXYGEN (D.O.), IN MILLIGRAMS PER LITERD 10n
W.T.
2(
^
D.O. -
10
20
30
35
10 20
10 20 30 0 10 20 30 0 10 20
WATER TEMPERATURE (W.T.), IN DEGREES CELSIUS
PH, IN STANDARD UNITS
6789 10 6789 10 6789 10 6789 10 6 7 8 9 10u
t-UJ 10UJ IUu_z
JE 200.LUQ
30
QK
: \_
~
-- J,
-._---~
« ,*-.t
' !
10
20
30
S.C.10
20
30
35
10
20
30
35
10
20
30
35450 500 550 450 500 550 450 500 550 450 500 550 450 500
SPECIFIC CONDUCTANCE (S.C.), IN MICROSIEMENS PER CENTIMETER AT 25 DEGREES CELSIUS
550
105
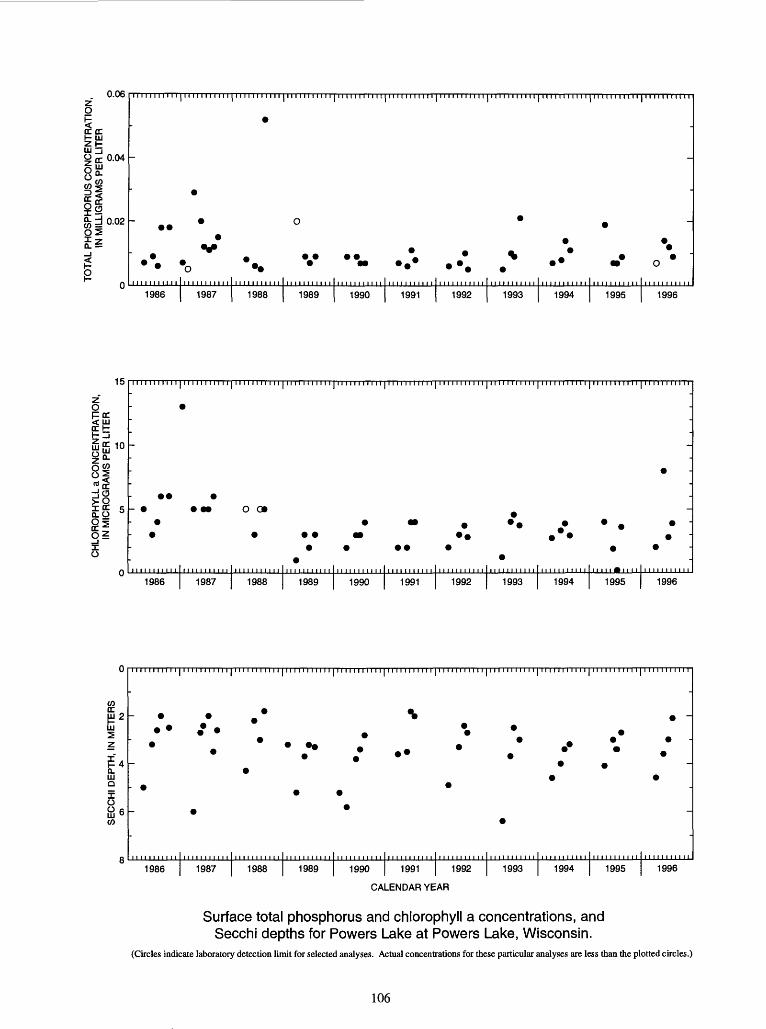
0.06
0^0.04o£sS
83 d 0-02
1986 1987 1988 1989 1990 1991 1992 1993 1994 1995 1996
15
O FPC
O
3-o
oa
1986 1987 1988 1989 1990 1991 1992 1993 1994 1995 1996
P4 u.UJ Q
O
1986 1987 1988 1989 1990 1991 1992 1993 1994 1995 1996
CALENDAR YEAR
Surface total phosphorus and chlorophyll a concentrations, and Secchi depths for Powers Lake at Powers Lake, Wisconsin.
(Circles indicate laboratory detection limit for selected analyses. Actual concentrations for these particular analyses are less than the plotted circles.)
106
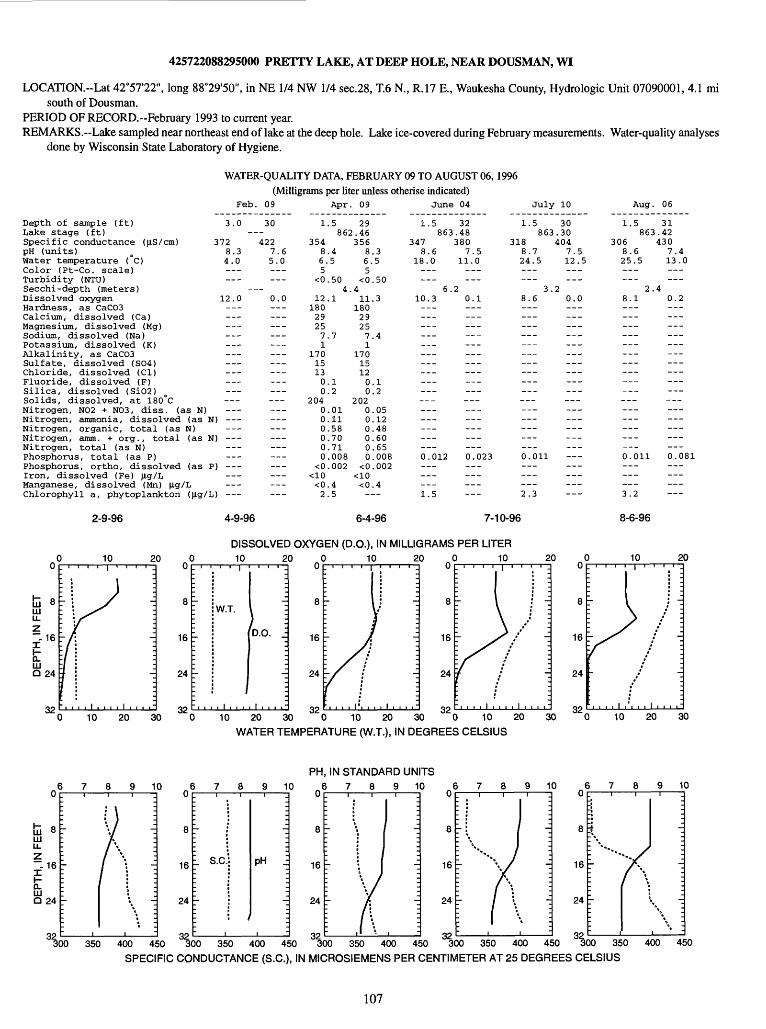
425722088295000 PRETTY LAKE, AT DEEP HOLE, NEAR DOUSMAN, WI
LOCATION.--Lat 42°57'22", long 88°29'50", in NE 1/4 NW 1/4 sec.28, T.6 N., R.17 E., Waukesha County, Hydrologic Unit 07090001, 4.1 misouth of Dousman.
PERIOD OF RECORD.-February 1993 to current year. REMARKS. Lake sampled near northeast end of lake at the deep hole. Lake ice-covered during February measurements. Water-quality analyses
done by Wisconsin State Laboratory of Hygiene.
WATER-QUALITY DATA, FEBRUARY 09 TO AUGUST 06, 1996 (Milligrams per liter unless etherise indicated)
Feb. 09 Apr. 09 June 04 July 10 Aug. 06
Depth of sample (ft)Lake stage (ft)Specific conductance (LiS/cm)pH (units)Water temperature (°C)Color (Pt-Co. scale)Turbidity (NTU)Secchi-depth (meters)Dissolved oxygenHardness, as CaCO3Calcium, dissolved (Ca)Magnesium, dissolved (Mg)Sodium, dissolved (Na)Potassium, dissolved (K)Alkalinity, as CaCO3Sulfate, dissolved (SO4)Chloride, dissolved (Cl)Fluoride, dissolved (F)Silica, dissolved (Si02)Solids, dissolved, at 180°CNitrogen, NO2 + NO3, diss. (as N)Nitrogen, ammonia, dissolved (as N)Nitrogen, organic, total (as N)Nitrogen, amm. + org., total (as N)Nitrogen, total (as N)Phosphorus, total (as P)Phosphorus, ortho, dissolved (as P)Iron, dissolved (Fe) Llg/LManganese, dissolved (Mn) \ig/LChlorophyll a, phytoplankton (Llg/L)
2-9-96
3.0
3728.34.0
12.0
___I)
I)
>)
___,) -
30
4227.65.0
0.0
______
___
1
35486.5
<0
1218029257.1
170151300
204000000
<0
<02
.5862
.45
.504.
.1
.7
.1
.2
.01
.11
.58
.70
.71
.008
.002
.4
.5
29.46356
865
<0411
180292571
170151200
202000000
<0
<0-
.3.5
.50
.3
.4
.1
.2
.05
.12
.48
.60
.65
.008
.002
.4
1.5863
3478.6
18.0
___6.
10.3
___
_________
___ ______
___
0.012
_ _1.5
32.48380
7.511.0
20.1___
_________
0.023
___
1.5863
3188.724.5
3.8.6
0.011
2.3
30.30404
7.512.5
2
0.0
__________________
1.5863
3068.625.5______
2.8.1______
____________---___
0.011
3.2
31.42430
7.413.0
40.2____________
______
____________0.08
10 20
16
24
32
4-9-96 6-4-96 7-10-96
DISSOLVED OXYGEN (D.O.), IN MILLIGRAMS PER LITER10 20 10
W.T.
D.O. J
10 20
16
24
3210 20 30 0 10 20 30 0 10 20
WATER TEMPERATURE (W.T.), IN DEGREES CELSIUS
30
16
24
32
8-6-96
10 20
10 20 30
PH, IN STANDARD UNITS
6789 10 6789 10 6789 10 6789 10 6789 10u
LU 8LLJLL
z~1 16ItLUQ 24
no
': '
'_
-
-
\
.' ' :
V ^// ** / ** " '
-
\ :
16
24
323
S.C PH j
0
16
24
32350 400 450 300 350 400 450 300 350 400 450
16
24
350 400 450
16
24
32300350 400 450
SPECIFIC CONDUCTANCE (S.C.), IN MICROSIEMENS PER CENTIMETER AT 25 DEGREES CELSIUS
107

0.018
< ff 0.016h- LU Z h- LU j
CE 0.014LU8^
0.012
os;=J 0.010
0.008
0.006 i i i i i i i i i iJFMAMJJASONDJFMAMJJASONDJFMAMJJASONDJFMAMJJASOND
1993 1994 1995 1996
ICE< LU CCb 4
I CE 0.0
Q?
,,,,JFMAMJJASOND
1993JFMAMJJASOND
1994JFMAMJJASOND
1995JFMAMJJASOND
1996
c/jLU 2
LU
JFMAMJJASOND 1993
JFMAMJJASOND JFMAMJJASOND1994 1995
JFMAMJJASOND 1996
CALENDAR YEAR
Surface total phosphorus and chlorophyll a concentrations, and Secchi depths for Pretty Lake, at Deep Hole, near Dousman, Wisconsin.
108
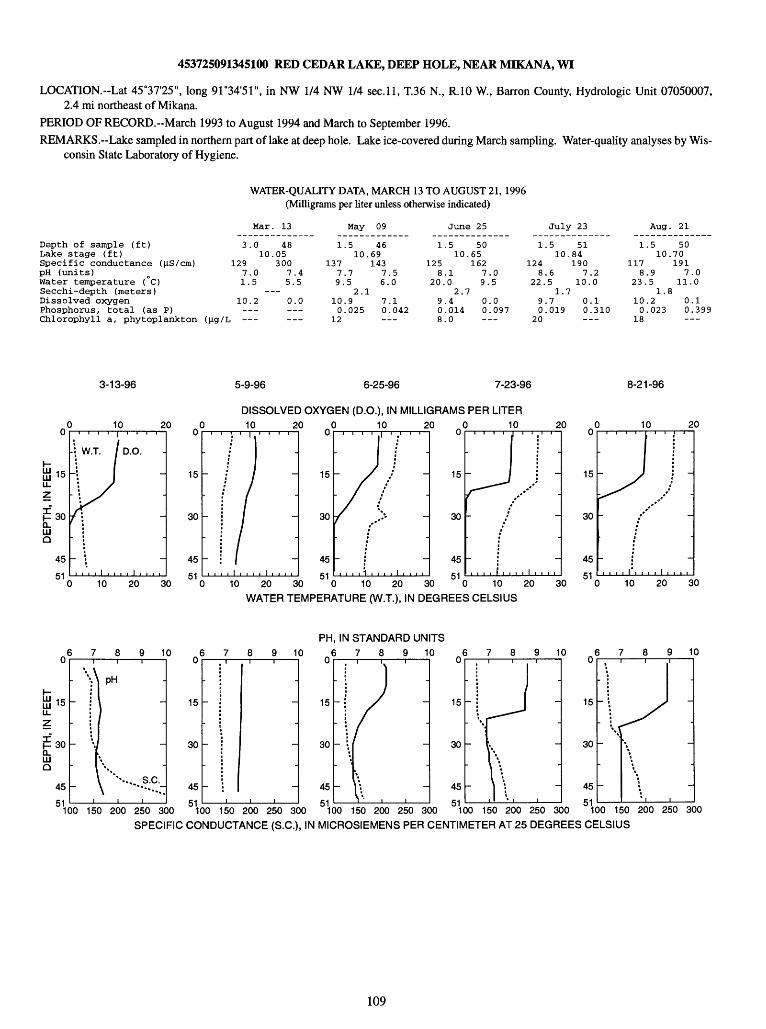
453725091345100 RED CEDAR LAKE, DEEP HOLE, NEAR MIKANA, WI
LOCATION.-Lat 45°37'25", long 91°34'5r, in NW 1/4 NW 1/4 sec. 11, T.36 N., R.10 W, Barren County, Hydrologic Unit 07050007, 2.4 mi northeast of Mikana.
PERIOD OF RECORD.-March 1993 to August 1994 and March to September 1996.REMARKS. Lake sampled in northern part of lake at deep hole. Lake ice-covered during March sampling. Water-quality analyses by Wis
consin State Laboratory of Hygiene.
WATER-QUALITY DATA, MARCH 13 TO AUGUST 21, 1996 (Milligrams per liter unless otherwise indicated)
Mar. 13
Depth of sample (ft)Lake stage (ft)Specific conductance ((is/cm)pH (units)Water temperature (°C)Secchi-depth (meters)Dissolved oxygenPhosphorus, total (as P)Chlorophyll a, phytoplankton (|ig/L -
May 09 June 25 July 23 Aug. 21
3.0
1297.01.5
10.2
i
4810.05
3007.45.5
0.0
1.5 4610.69
137 1437.7 7.59.5 6.0
2.110.9 7.10.025 0.042
12
1.5 5010.65
125 1628.1 7.0
20.0 9.52.7
9.4 0.00.014 0.0978.0
1.5 5110.84
124 1908.6 7.2
22.5 10.01.7
9.7 0.10.019 0.310
20
1.5 5010.70
117 1918.9 7.0
23.5 11.01.8
10.2 0.10.023 0.399
18
3-13-96
10
- W.T. D.O.
15
30
45
10 20
20 00
15
30
45
30
5-9-96 6-25-96 7-23-96
DISSOLVED OXYGEN (D.O.), IN MILLIGRAMS PER LITER10 20
15
30
45
10 20 10
15
30
45
10 20 30 0 10 20 30 0 10 20
WATER TEMPERATURE (W.T.), IN DEGREES CELSIUS
20
30
15
30
45
8-21-96
10
10 20
20
30
PH, IN STANDARD UNITS
6789 10 6789 10 6789 10 6789 10 6789 10u
&15UJ '5UL
z
fE 30Q.UJQ
45
t;i
\\
.
,"
-
pH
.
_
\%****.... S.C.
\ "--.. :
15
30
15
30
15
30
15
30
100 150 200 250 300 100 150 200 250 300 100 150 200 250 300 100 150 200 250 300 100 150 200 250 300 SPECIFIC CONDUCTANCE (S.C.), IN MICROSIEMENS PER CENTIMETER AT 25 DEGREES CELSIUS
109
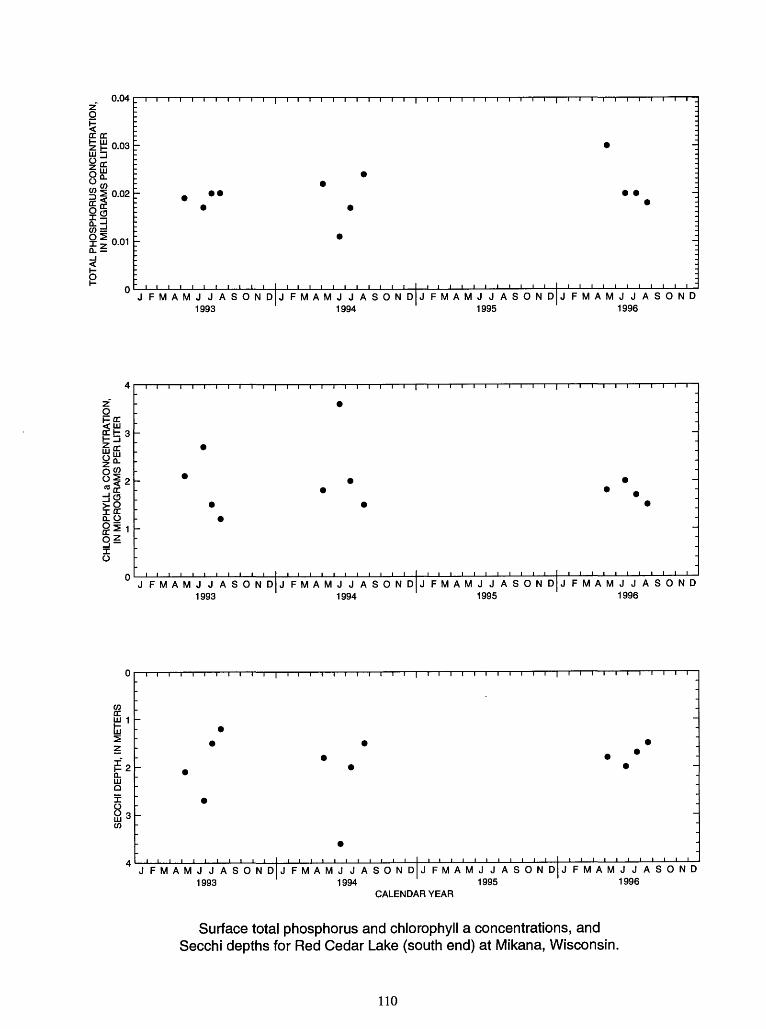
SE
CC
HI
DE
PT
H,
IN M
ET
ER
SCO
M
-"
O
CH
LOR
OP
HY
LL a
CO
NC
EN
TR
AT
ION
, IN
MIC
RO
GR
AM
S P
ER
LIT
ER
O
-
M
CO
TO
TA
L P
HO
SP
HO
RU
S C
ON
CE
NT
RA
TIO
N,
IN M
ILLI
GR
AM
S P
ER
LIT
ER
p
p
p
p
82
c_ Tl
3»CO
z.
CD
_^ ^
9- c
8
c-
-l«
>
Q.
0>
CD
0
«
"E 2
. °
w
§
o?4
J-jg
=r
TICD
c/>
^
Q-
"O
>
CD ^
- c
_ Q
. C
Jg
r
0)
W
*> c
-"
l Q
) >
Ft
g
"
*r
£
oCD
o
S,-
^ ^
zW
0
5°
°5
5 "
^
5 ^
CD ^.
5
^
Q.
0)
^
^8
g-_,
3
tn
c-
~
m
^m
" 3
w
g g
0
<
O
o
55' -
5°
^~Q
0) f^
«.
^CO
^^
^
?
sto
c"
« en c
- > CO O z 0
1 1
1 1
1 1
. 1
1 1
1 I ..
1
1 1
1 1
-
0-
*
_ - -
-:
.
-
- - . . - . - - '. *
i_ w
00
, ,
, ,
1 ,
, ,
, 1
, .
, ,
1 ,
, ,
.
C_
Tl
S.
> 7
-. «
_
8 «
- > CO O z 0 c_ Tl
S > it > CO O z 0 c_
Tl
S
> S
5"
tn
c- > CO O z 0 c_ Tl
2 > 2
r
to o> c
- > CO O z 0
-
_ - r ~
~
- - - . - . -
, , , ,
i , , ,
, i , .
. . i ,
, , ,
c_ Tl
S > 2
5^
to ,
co «
- > CO O z 0 c_ Tl
2 > S
to *
~ > CO O z o c_ Tl
2
> 2
5
«-
1- > CO O z o c_ T
l
2 > S
5
C-<0
,
o> c
- > CO o z o
-
. - _
- - - - - . - -
. . , .
I . . .
, 1 . 1
, 1 , ,
, . 1 1
. , 1 .
. . . .
. 1 . .
. . . .
I . .
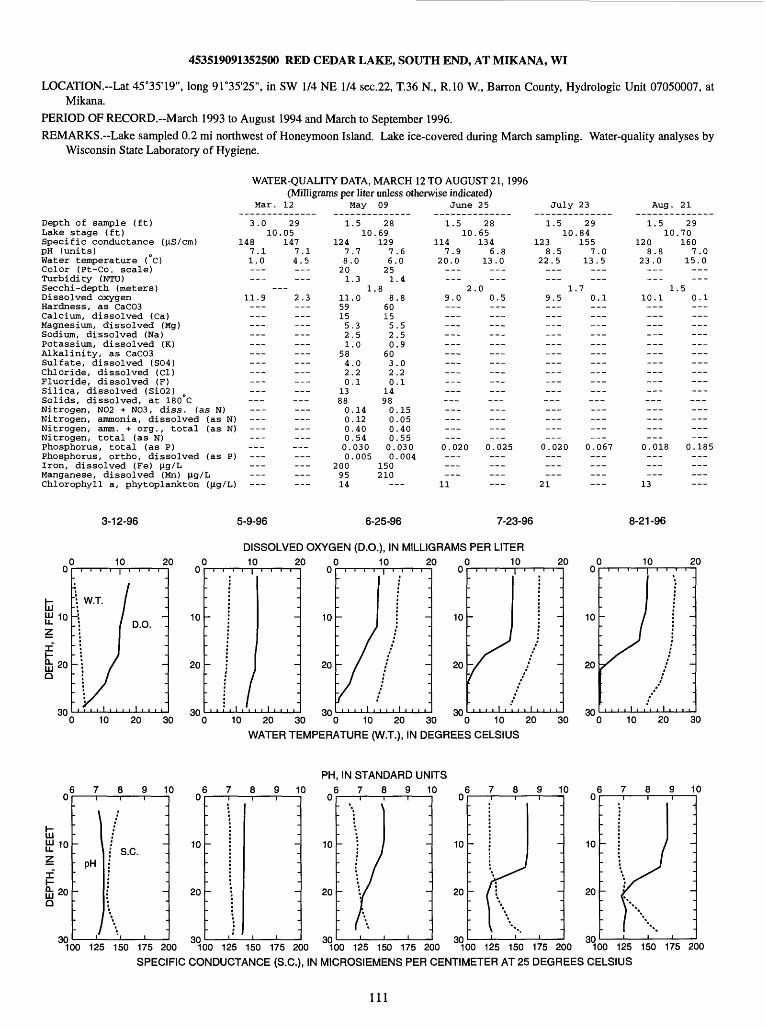
453519091352500 RED CEDAR LAKE, SOUTH END, AT MIKANA, WI
LOCATION.«Lat 45°35'19", long 91°35'25", in SW 1/4 NE 1/4 sec.22, T.36 N., R.IO W, Barron County, Hydrologic Unit 07050007, at Mikana.
PERIOD OF RECORD.-March 1993 to August 1994 and March to September 1996.REMARKS. Lake sampled 0.2 mi northwest of Honeymoon Island. Lake ice-covered during March sampling. Water-quality analyses by
Wisconsin State Laboratory of Hygiene.
WATER-QUALITY DATA, MARCH 12 TO AUGUST 21, 1996 (Milligrams per liter unless otherwise indicated)
Mar. 12
Depth of sample (ft)Lake stage (ft)Specific conductance (n.S/cm)pH (units)Water temperature (°C)Color (Pt-Co. scale)Turbidity (NTU)Secchi-depth (meters)Dissolved oxygenHardness, as CaC03Calcium, dissolved (Ca)Magnesium, dissolved (Mg)Sodium, dissolved (Na)Potassium, dissolved (K)Alkalinity, as CaC03Sulfate, dissolved (S04)Chloride, dissolved (Cl)Fluoride, dissolved (F)Silica, dissolved (Si02)Solids, dissolved, at 180°CNitrogen, N02 + N03, diss. (as N)Nitrogen, ammonia, dissolved (as N)Nitrogen, amm. + org., total (as N)Nitrogen, total (as N)Phosphorus, total (as P)Phosphorus, ortho, dissolved (as P)Iron, dissolved (Fe) |ig/LManganese, dissolved (Mn) (ig/LChlorophyll a, phytoplankton ((ig/L)
11.9 2.3
May 09 June 25 July 23
1.8115915521
58420
138800000.0
2009514
.0
.3
.5
.0
.0
.2
.1
.14
.12
.40
.54030.005
86015520
60320
149800000.0
150210
-
.8
.5
.5
.9
.0
.2
.1
.15
.05
.40
.55.030.004
--
2.0 .0 0.
0.020 0.025
11
1.7 .5 0.
Aug. 21
3.0 2910.05
148 1477.1 7.11.0 4.5
______ ___
1.5 2810.69
124 1297.7 7.68.0 6.020 251.3 1.4
1.5 2810.65
114 1347.9 6.8
20.0 13.0___ ______
1.5 2910.84
123 1558.5 7.0
22.5 13.5
___
1.5 2910.70
120 1608.8 7.0
23.0 15.0___ ______ ___
1.510.1 0.1
0.020 0.067 0.018 0.185
21 13
3-12-96 5-9-96 6-25-96 7-23-96 8-21-96
DISSOLVED OXYGEN (D.O.), IN MILLIGRAMS PER LITER
KHo
ig]20 Q
30
10 20 00
D.O.
10 20 30
10
20
30
10 20
10
20
30
10 20 00
10
20
30
10 20 0 10 20 Oi i i i i |
10 20 30 0 10 20 30 0 10 20
WATER TEMPERATURE (W.T.), IN DEGREES CELSIUS
30
10
20
3010 20 30
PH, IN STANDARD UNITS 6789 10 6789 10 6789 10 6789 10 6789 10
£10Z
IQ_ n/\ UJ «J
a
PHs.c. 10
20
30
10
20
30
10
20
30
10
20
30100 125 150 175 200 100 125 150 175 200 100 125 150 175 200 100 125 150 175 200 100 125 150 175 200
SPECIFIC CONDUCTANCE (S.C.), IN MICROSIEMENS PER CENTIMETER AT 25 DEGREES CELSIUS
111

0.04
DC DC
S3o£O CO
Iifed
JFMAMJJASOND 1993
JFMAMJJASOND 1994
JFMAMJJASOND 1995
JFMAMJJASOND 1996
O Fee< LUOC t 3
I EC Q.O05 or-22-
o
O 1 "- I I I I
JFMAMJJASOND 1993
JFMAMJJASOND 1994
JFMAMJJASOND 1995
JFMAMJJASOND 1996
CO
I 1
z
JFMAMJJASOND 1993
JFMAMJJASOND JFMAMJJASOND1994 1995
JFMAMJJASOND 1996
CALENDAR YEAR
Surface total phosphorus and chlorophyll a concentrations, and Secchi depths for Red Cedar Lake (south end) at Mikana, Wisconsin.
112
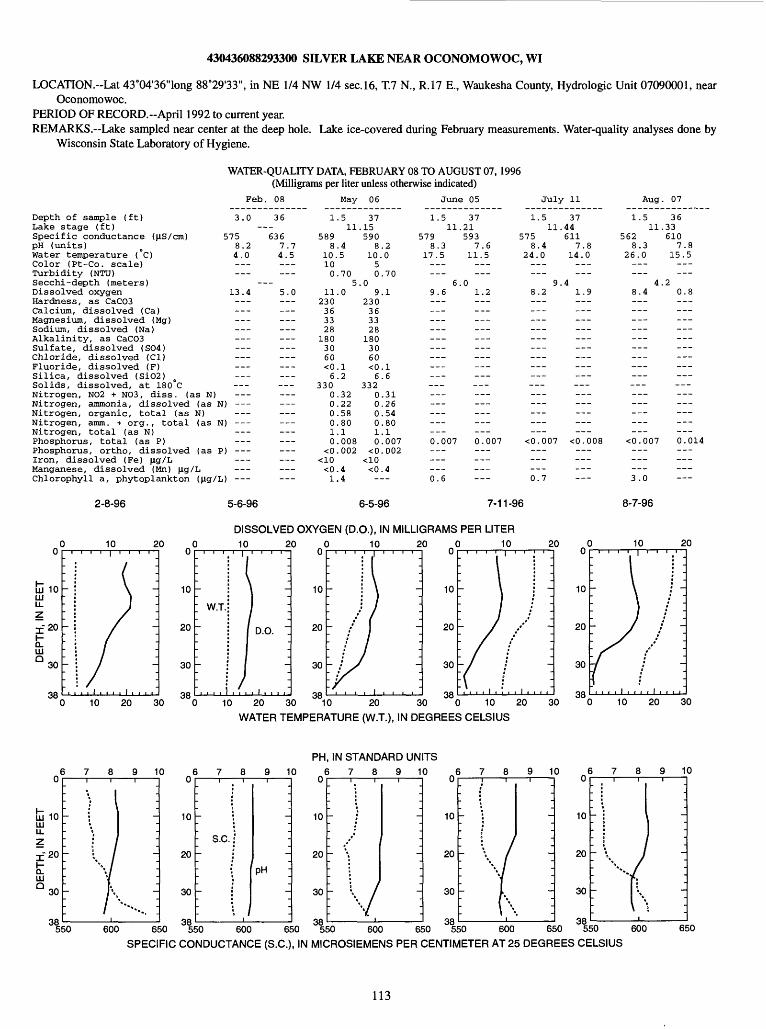
430436088293300 SILVER LAKE NEAR OCONOMOWOC, WI
LOCATION.~Lat 43°04'36"long 88°29'33", in NE 1/4 NW 1/4 sec.16, T.7 N., R.17 E., Waukesha County, Hydrologic Unit 07090001, nearOconomowoc.
PERIOD OF RECORD.--April 1992 to current year. REMARKS. Lake sampled near center at the deep hole. Lake ice-covered during February measurements. Water-quality analyses done by
Wisconsin State Laboratory of Hygiene.
WATER-QUALITY DATA, FEBRUARY 08 TO AUGUST 07, 1996 (Milligrams per liter unless otherwise indicated)
Feb. 08 May 06 June 05 July 11
Depth of sample (ft)Lake stage (ft)Specific conductance (US/cm)pH (units)Water temperature (°C)Color (Pt-Co. scale)Turbidity (NTU)Secchi-depth (meters)Dissolved oxygenHardness, as CaCOSCalcium, dissolved (Ca)Magnesium, dissolved (Mg)Sodium, dissolved (Na)Alkalinity, as CaCO3Sulfate, dissolved (SO4)Chloride, dissolved (Cl)Fluoride, dissolved (F)Silica, dissolved (SiO2)Solids, dissolved, at 180°CNitrogen, NO2 + N03, diss. (as N)Nitrogen, ammonia, dissolved (as N)Nitrogen, organic, total (as N)Nitrogen, amm. + org., total (as N)Nitrogen, total (as N)Phosphorus, total (as P)Phosphorus, ortho, dissolved (as P)Iron, dissolved (Fe) Lig/LManganese, dissolved (Mn) ng/Chlorophyll a, phytoplankton (jig/L)
2-8-96 5-6-96
Aug. 07
3.0
5758.24.0
___
13.4____________
I) ___
j) ______
>)
___j}
36___
6367.74.5______
5.0
_________
___
___
___
1
5898
10.100
11230363328
1803060<06
330000010
<0
<01
.511
.45
.705
.0
.1
.2
.32
.22
.58
.80
.1
.008
.002
.4
.4
37.15590
81050
.09
230363328
1803060<06
332000010
<0
<0-
.2.0
.70
.1
.1
.6
.31
.26
.54
.80
.1
.007
.002
.4--
1.511
5798.3
17.5______
69.6
___
___---
0.007
___0.6
37.21593
7.611.5______
.01.2
_______________
0.007
______
1.511
5758.4
24.0______
9,8.2
___
___
<0.007---
0.7
37.44611
7.814.0
___.4
1.9___---
___ ______
<0.008
1.511
5628.3
26.0
___4
8.4
______
---
---______
<0.007___
___3.0
36.33610
7.815.5
---.2
0.8
______
---
---___0.014
6-5-96 7-11-96 8-7-96
LJ 10 LLJ
T--20
10
10 20
20
30
DISSOLVED OXYGEN (D.O.), IN MILLIGRAMS PER LITER10 20
10
20
30
38
W.T.
D.O.
10 20
10
20
30
38
10
10
20
30
3810 20 30 10 20 30 0 10 20
WATER TEMPERATURE (W.T.), IN DEGREES CELSIUS
20
30
10
20
30
38
10
10 20
20
30
PH, IN STANDARD UNITS
6789 10 6789 10 6789 10 6789 10 6 789 10u
w 10wLJLz£20
w°30
00OO
5.
: ' I jI
: ' j :
: \ :-'. \l '.
: /" -., \50 600 6£
U
10
20
30
oo 50 5!
: s.c.-
i
50 600
:
-
-
pH
-
6£
U
10
20
30
oo >0 5.
/- \-
IV50 60C
-
-
-
-
) 6£
u
10
20
30
>0 51
'- }
'* /
; \/
; (\50 600
\'-
-
-
-
6£
u
10
20
30
oo 5.
\ I I: x J \
\ ts \50 600 65
SPECIFIC CONDUCTANCE (S.C.), IN MICROSIEMENS PER CENTIMETER AT 25 DEGREES CELSIUS
113

0.020
z H 0.015
M w3 i 0.010
ii fedT i 0.005
I
©O
1992 1993 1994 1995 1996
o UJ0-3
0
1992 1993 1994 1995 1996
0| i i i i i i i i i . i I i i i i i i i i i i i I i
O OUJ - (O 8
10 I I I I I I I I I
1992 1993 1994
CALENDAR YEAR
1995 1996
Surface total phosphorus and chlorophyll a concentrations, and Secchi depths for Silver Lake near Oconomowoc, Wisconsin.
(Circles indicate laboratory detection limit for selected analyses. Actual concentrations for these particular analyses are less than the plotted circles.)
114
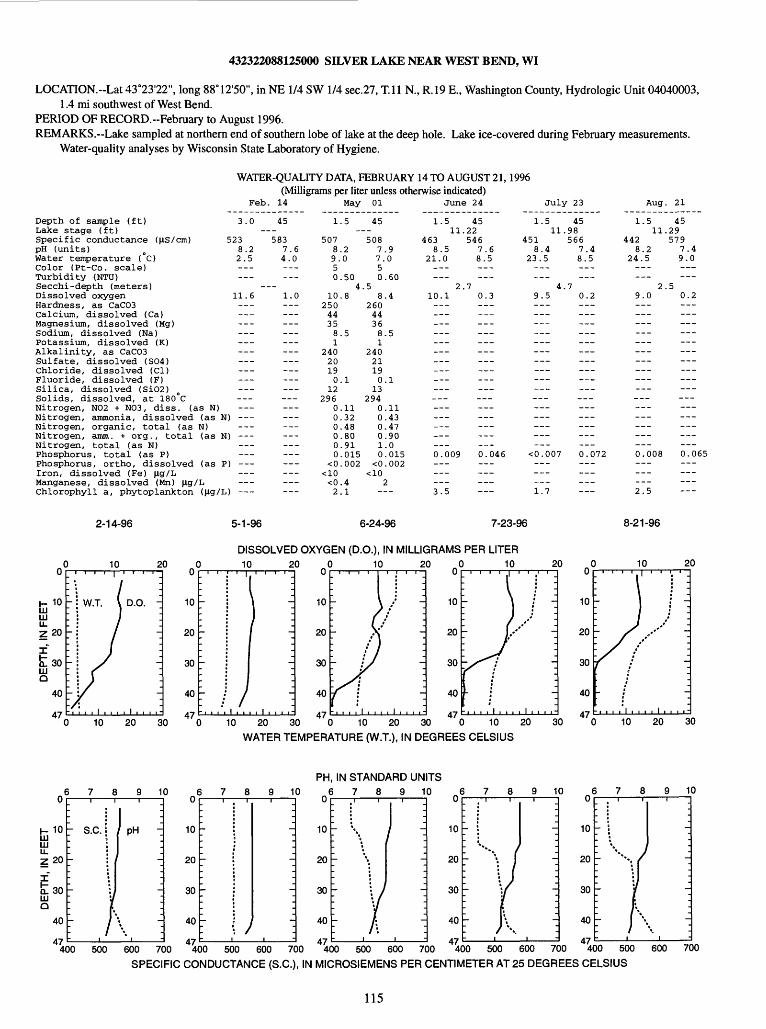
432322088125000 SILVER LAKE NEAR WEST BEND, WI
LOCATION.--Lat 43°23'22", long 88"12'50", in NE 1/4 SW 1/4 sec.27, T.ll N., R.19 E., Washington County, Hydrologic Unit 04040003,1.4 mi southwest of West Bend.
PERIOD OF RECORD.--February to August 1996. REMARKS. Lake sampled at northern end of southern lobe of lake at the deep hole. Lake ice-covered during February measurements.
Water-quality analyses by Wisconsin State Laboratory of Hygiene.
WATER-QUALITY DATA, FEBRUARY 14 TO AUGUST 21, 1996 (Milligrams per liter unless otherwise indicated)
Depth of sample (ft)Lake stage (ft)Specific conductance (fiS/cm)pH (units)Water temperature (°C)Color (Pt-Co. scale)Turbidity (NTU)Secchi-depth (meters)Dissolved oxygenHardness, as CaC03Calcium, dissolved (Ca)Magnesium, dissolved (Mg)Sodium, dissolved (Na)Potassium, dissolved (K)Alkalinity, as CaC03Sulfate, dissolved (S04)Chloride, dissolved (Cl)Fluoride, dissolved (F)Silica, dissolved (Si02)Solids, dissolved, at 180 CNitrogen, N02 + N03, diss. (as N)Nitrogen, ammonia, dissolved (as N)Nitrogen, organic, total (as N)Nitrogen, amm. + org., total (as N)Nitrogen, total (as N)Phosphorus, total (as P)Phosphorus, ortho, dissolved (as P)Iron, dissolved (Fe) fig/LManganese, dissolved (Mn) fig/LChlorophyll a, phytoplankton (fig/L)
Feb.
3.0
5238.22.5
___--
11.6_______________
_______________
f) -
1)
,)
___,)
14
45-583
7.64.0
-1.0
___
___
___
____________
______
1.
5078.9.50
1025044358,1
24020190
12296
000000
<0
<02
May
.5--
.20
.504,
.8
.5
.1
.11
.32
.48
.80
.91
.015
.002
.4
.1
01
45--508
7750
.58
260443681
24021190
13294
000010
<00
-
.9.0
.60
.4
.5
.1
.11
.43
.47
.90
.0
.015
.002
2--
June
1.511.
4638.5
21.0
2.10.1
______
___
___
0.009
___3.5
24
4522546
7.68.5______
70.3___
_______________
___
______
0.046
___
July
1.511.
4518.4
23.5______
4.9.5___
______
___
<0.007___
1.7
23
4598566
7.48.5___
70.2
___
___ ______0.072___
Aug.
1.511.
4428.2
24.5___
2.9.0
______
---
_________0.008
2.5
, 21
45.29579
7.49.0
,50.2
___
0.065___
2-14-96 5-1-96 6-24-96 7-23-96 8-21-96
DISSOLVED OXYGEN (D.O.), IN MILLIGRAMS PER LITER
UJ O
10 20
D.O. -
10 20 30
c0
10
20
30
40
47 c
-
-
-
-
)
1C
10
) 2(
\ I-j
20 3
10 20 10
0 10 20 30 " 0 10 20
WATER TEMPERATURE (W.T.), IN DEGREES CELSIUS
30
10
10 20
20
30
o 6
te 10UJu.220
t 30 UJ O
40
ATI
7
- s.c.
-
: )
8 9 K
PH -_
-
]
i
8 9 10PH, IN STANDARD UNITS
6 7 8 9 10 10 10U
10
20
30
40
rf7
1 '
~-
'-
-
^ J
: ,
1
-^
-_
-_
-_,
0
10
20
30
40
AT
;'
J- \
'-
r }
'- Ii
J \-_
-_
-_
,
0
10
20
30
40
A.-7
1 '
'7
\ ""\ 1
r V
i- |.; ,
:-j
-_
-m
-j,
u
10
20
30
40
47
1 ' '
- -_
~~ ""\\ '
r jf -.
r l\ -I- i ' i
400 500 600 700 400 500 600 700 400 500 600 700 400 500 600 700 400 500 600 700
SPECIFIC CONDUCTANCE (S.C.), IN MICROSIEMENS PER CENTIMETER AT 25 DEGREES CELSIUS
115
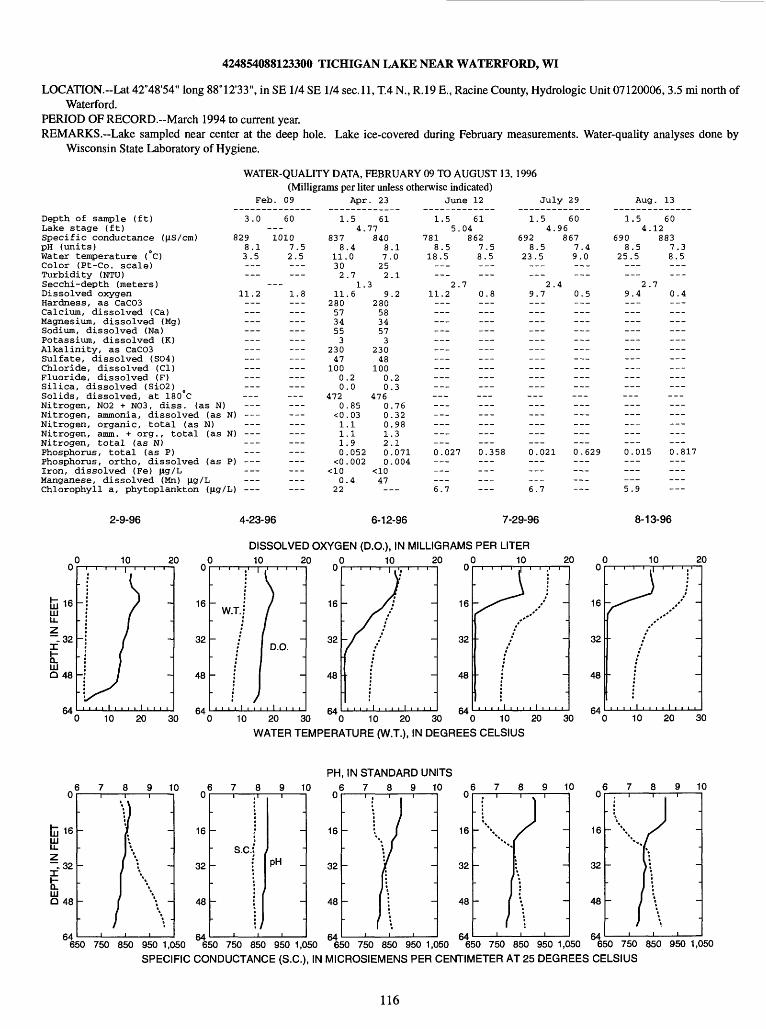
424854088123300 TICHIGAN LAKE NEAR WATERFORD, WI
LOCATION.--Lat 42°48'54" long 88°12'33", in SE 1/4 SE 1/4 sec. 11, T.4 N., R.19 E., Racine County, Hydrologic Unit 07120006,3.5 mi north ofWaterford.
PERIOD OF RECORD.-March 1994 to current year. REMARKS. Lake sampled near center at the deep hole. Lake ice-covered during February measurements. Water-quality analyses done by
Wisconsin State Laboratory of Hygiene.
WATER-QUALITY DATA, FEBRUARY 09 TO AUGUST 13, 1996 (Milligrams per liter unless otherwise indicated)
Feb. 09 Apr. 23 June 12 July 29 Aug. 13
Depth of sample (ft)Lake stage (ft)Specific conductance (|iS/cm)pH (units)Water temperature (°C)Color (Pt-Co. scale)Turbidity (NTU)Secchi-depth (meters)Dissolved oxygenHardness, as CaC03Calcium, dissolved (Ca)Magnesium, dissolved (Mg)Sodium, dissolved (Na)Potassium, dissolved (K)Alkalinity, as CaC03Sulfate, dissolved (S04)Chloride, dissolved (Cl)Fluoride, dissolved (F)Silica, dissolved (Si02)Solids, dissolved, at 180°CNitrogen, N02 + N03, diss. (as N)Nitrogen, ammonia, dissolved (as N)Nitrogen, organic, total (as N)Nitrogen, amm. + org., total (as N)Nitrogen, total (as N)Phosphorus, total (as P)Phosphorus, ortho, dissolved (as P)Iron, dissolved (Fe) |ig/LManganese, dissolved (Mn) (ig/LChlorophyll a, phytoplankton (|ig/L)
3.0
8298.13.5
11.2
___
I) ___
[) ______
,)
___,)
60___1010
7.52.5______
1.8___
_________---___________________________
___
1
8378
11.302
112805734553
23047
10000
4720
<01110
<0
022
.54.
.4,0
.71.
.6
.2
.0
.85
.03
.1
.1
.9
.052
.002
.4
6177840
87252
39
2805834573
23048
10000
4760001200
47-
.1.0
.1
.2
.2
.3
.76
.32
.98
.3
.1
.071
.004
1.55.
7818.5
18.5___
2.11.2
____________
___
___
0.027
___6.7
6104862
7.58.5
70.8
___
____________0.358
___
1.54.
6928.5
23.5___
2.9.7---______---___---
_________
---___
______0.021
___6.7
6096867
7.49.0
40.5
___
---
---
___
---____________0.629___
1.54.
6908.5
25.5
2.
9.4
___
---
___0.015---
5.9
6012883
7.38.5______
70.4------___---___---
______---
---___---______0.817___
______
fc} 16UJLL
z~ 32
UJ O 48
64
2-9-96
10
10 20
20
30
4-23-96 6-12-96 7-29-96 8-13-96
DISSOLVED OXYGEN (D.O.), IN MILLIGRAMS PER LITER10 20
16
32
48
64
10 20
16
32
48
64
10
10 20 30 "0 10 20 30 " 0 10 20
WATER TEMPERATURE (W.T.), IN DEGREES CELSIUS
20u
16
32
48
RA
-SJ-1
30
c0
16
32
48
CAC4 o
10 2
J ) '!
, , , , I , . , , I , , . i10 20 3
PH, IN STANDARD UNITS6789 10 6789 10 6789 10 6789 10 6789 10 0| i i i i 0| i i i i 0| i i i | 0| i i r-i I Or-; i
16UJ
~ 32
Q_ UJQ 48
64
u
16
32
48
RA
s.c.-
-
J
-
-PH _
-
"
16
32
48
64
16
32
48
64
16
32
48
64650 750 850 950 1,050 650 750 850 950 1,050 650 750 850 950 1,050 650 750 850 950 1,050 650 750 850 950 1,050
SPECIFIC CONDUCTANCE (S.C.), IN MICROSIEMENS PER CENTIMETER AT 25 DEGREES CELSIUS
116
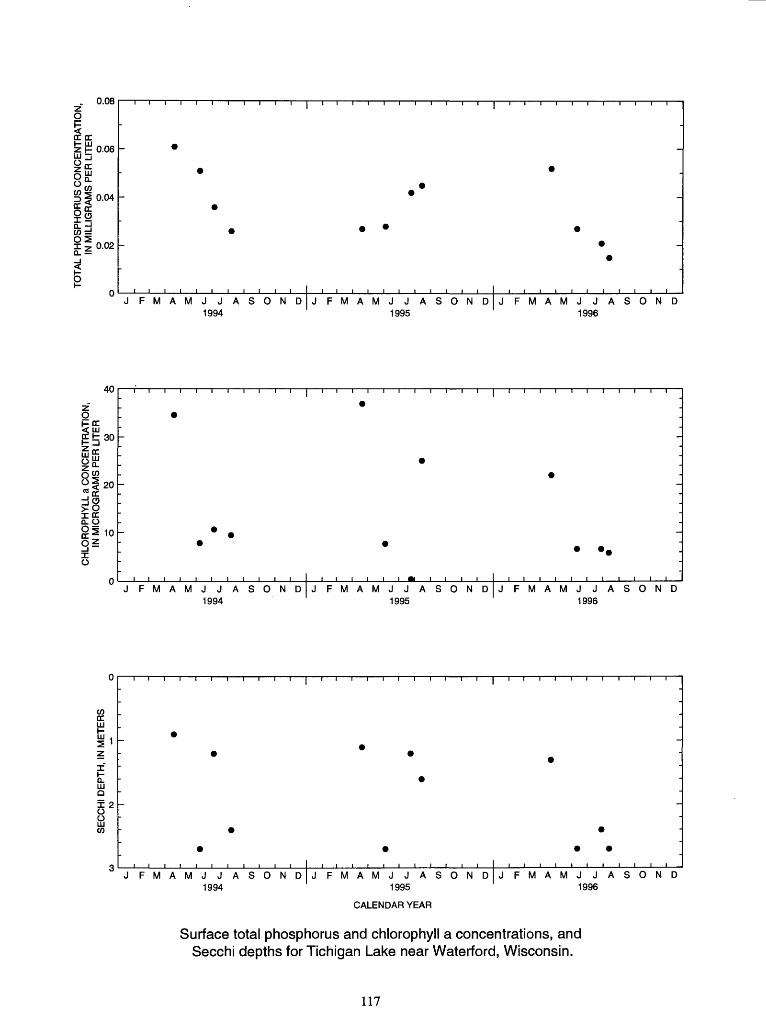
z O
Lzl^
^
0.08
0.06
°,
3^0.04DC,
co =! O2
0.02
JFMAMJJASOND 1994
JFMAMJJASOND 1995
JFMAMJJASOND 1996
OHOC < LU
30
8!
iI OCio
20
o
JFMAMJJASONDJFMAMJJASONDJFMAMJJASOND 1994 1995 1996
iLU Q5 2
JFMAMJJASOND 1994
JFMAMJJASOND 1995
CALENDAR YEAR
JFMAMJJASOND 1996
Surface total phosphorus and chlorophyll a concentrations, and Secchi depths for Tichigan Lake near Waterford, Wisconsin.
117
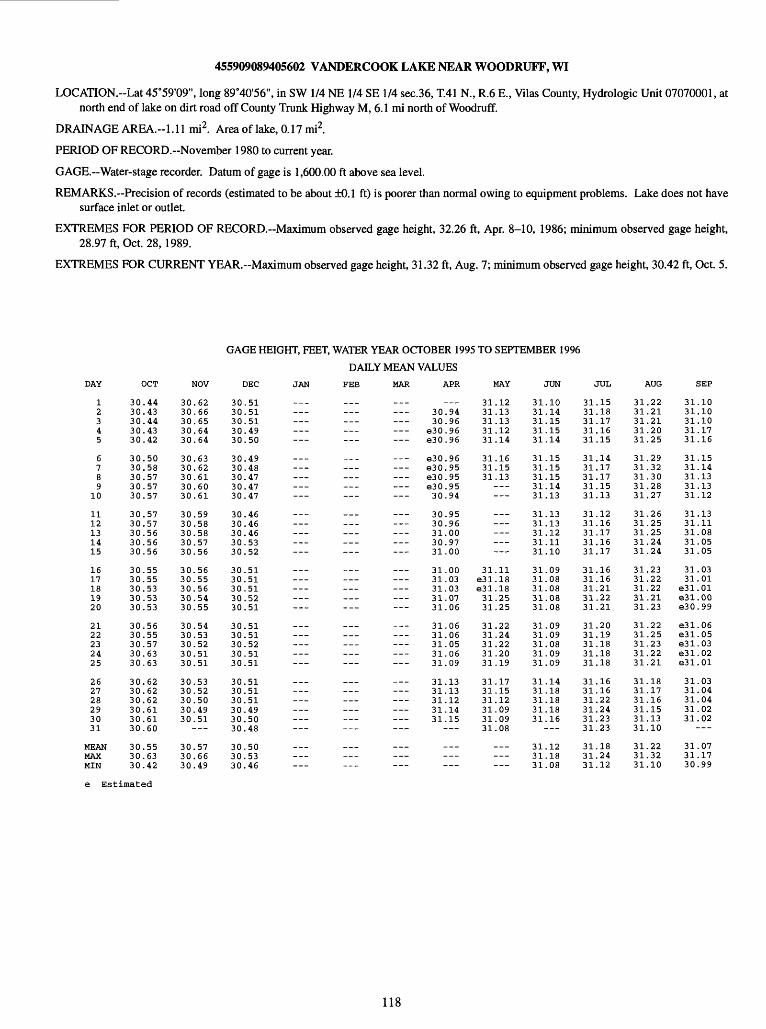
455909089405602 VANDERCOOK LAKE NEAR WOODRUFF, WI
LOCATION.--Lat 45°59'09", long 89°40'56", in SW 1/4 NE 1/4 SE 1/4 sec.36, T.41 N., R.6 E., Vilas County, Hydrologic Unit 07070001, at north end of lake on dirt road off County Trunk Highway M, 6.1 mi north of Woodruff.
DRAINAGE AREA.--1.11 mi2 . Area of lake, 0.17 mi2.
PERIOD OF RECORD.-November 1980 to current year.
GAGE.-Water-stage recorder. Datum of gage is 1,600.00 ft above sea level.
REMARKS. Precision of records (estimated to be about ±0.1 ft) is poorer than normal owing to equipment problems. Lake does not have surface inlet or outlet.
EXTREMES FOR PERIOD OF RECORD.-Maximum observed gage height, 32.26 ft, Apr. 8-10, 1986; minimum observed gage height, 28.97 ft, Oct. 28,1989.
EXTREMES FOR CURRENT YEAR.-Maximum observed gage height, 31.32 ft, Aug. 7; minimum observed gage height, 30.42 ft, Oct. 5.
GAGE HEIGHT, FEET, WATER YEAR OCTOBER 1995 TO SEPTEMBER 1996
DAILY MEAN VALUES
DAY OCT NOV DEC JAN FEE MAR APR MAY JUN JUL AUG SEP
1 30.44 30.62 30.51 31.12 31.10 31.15 31.22 31.102 30.43 30.66 30.51 30.94 31.13 31.14 31.18 31.21 31.103 30.44 30.65 30.51 30.96 31.13 31.15 31.17 31.21 31.104 30.43 30.64 30.49 e30.96 31.12 31.15 31.16 31.20 31.175 30.42 30.64 30.50 e30.96 31.14 31.14 31.15 31.25 31.16
6 30.50 30.63 30.49 e30.96 31.16 31.15 31.14 31.29 31.157 30.58 30.62 30.48 e30.95 31.15 31.15 31.17 31.32 31.148 30.57 30.61 30.47 e30.95 31.13 31.15 31.17 31.30 31.139 30.57 30.60 30.47 e30.95 31.14 31.15 31.28 31.13
10 30.57 30.61 30.47 30.94 31.13 31.13 31.27 31.12
11 30.57 30.59 30.46 30.95 31.13 31.12 31.26 31.1312 30.57 30.58 30.46 30.96 31.13 31.16 31.25 31.1113 30.56 30.58 30.46 31.00 31.12 31.17 31.25 31.0814 30.56 30.57 30.53 30.97 31.11 31.16 31.24 31.0515 30.56 30.56 30.52 31.00 31.10 31.17 31.24 31.05
16 30.55 30.56 30.51 31.00 31.11 31.09 31.16 31.23 31.0317 30.55 30.55 30.51 31.03 e31.18 31.08 31.16 31.22 31.0118 30.53 30.56 30.51 31.03 e31.18 31.08 31.21 31.22 e31.0119 30.53 30.54 30.52 31.07 31.25 31.08 31.22 31.21 eSl.OO20 30.53 30.55 30.51 31.06 31.25 31.08 31.21 31.23 e30.99
21 30.56 30.54 30.51 31.06 31.22 31.09 31.20 31.22 e31.0622 30.55 30.53 30.51 31.06 31.24 31.09 31.19 31.25 e31.0523 30.57 30.52 30.52 31.05 31.22 31.08 31.18 31.23 e31.0324 30.63 30.51 30.51 31.06 31.20 31.09 31.18 31.22 e31.0225 30.63 30.51 30.51 31.09 31.19 31.09 31.18 31.21 e31.01
26 30.62 30.53 30.51 31.13 31.17 31.14 31.16 31.18 31.0327 30.62 30.52 30.51 31.13 31.15 31.18 31.16 31.17 31.0428 30.62 30.50 30.51 31.12 31.12 31.18 31.22 31.16 31.0429 30.61 30.49 30.49 31.14 31.09 31.18 31.24 31.15 31.0230 30.61 30.51 30.50 31.15 31.09 31.16 31.23 31.13 31.0231 30.60 30.48 31.08 31.23 31.10 -
MEAN 30.55 30.57 30.50 31.12 31.18 31.22 31.07MAX 30.63 30.66 30.53 31.18 31.24 31.32 31.17MIN 30.42 30.49 30.46 31.08 31.12 31.10 30.99
e Estimated
118
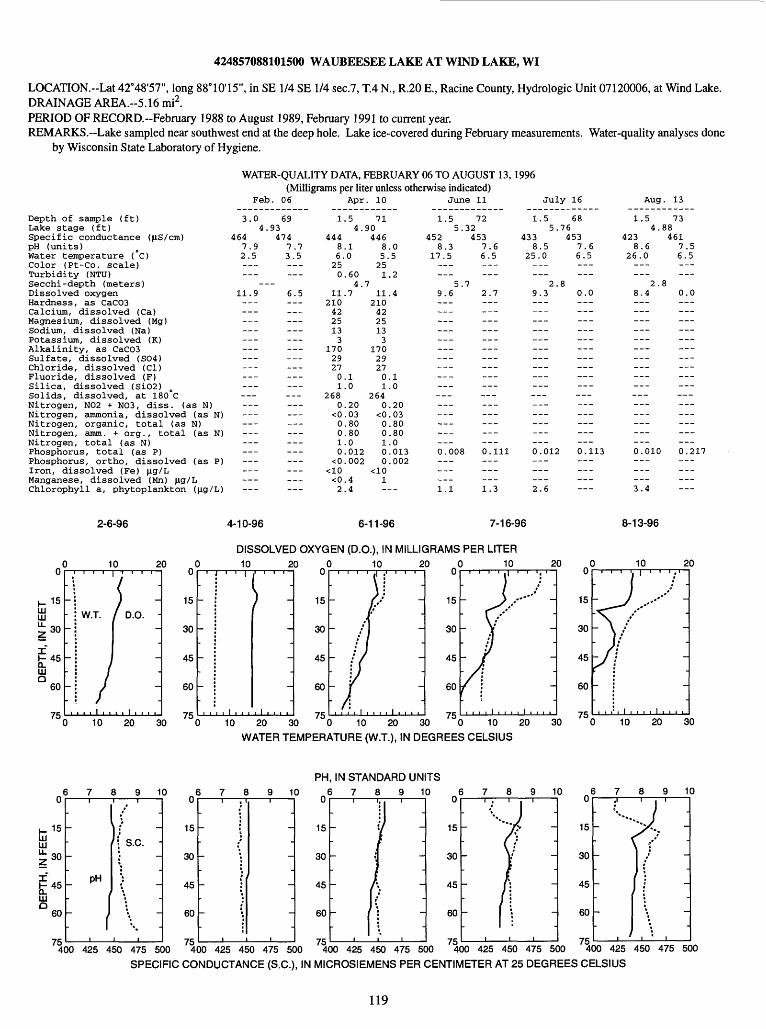
424857088101500 WAUBEESEE LAKE AT WIND LAKE, WI
LOCATION.-Lat 42°48'57", long 88°10'15", in SE 1/4 SE 1/4 sec.7, T.4 N., R.20 E., Racine County, Hydrologic Unit 07120006, at Wind Lake. DRAINAGE AREA.-5.16 mi2 .PERIOD OF RECORD.-Febraary 1988 to August 1989, February 1991 to current year.REMARKS. Lake sampled near southwest end at the deep hole. Lake ice-covered during February measurements. Water-quality analyses done
by Wisconsin State Laboratory of Hygiene.
Depth of sample (ft)Lake stage (ft)Specific conductance (H-S/cm)pH (units)Water temperature ( C)Color (Pt-Co. scale)Turbidity (NTU)Secchi-depth (meters)Dissolved oxygenHardness, as CaCO3Calcium, dissolved (Ca)Magnesium, dissolved (Mg)Sodium, dissolved (Na)Potassium, dissolved (K)Alkalinity, as CaCO3Sulfate, dissolved (SO4)Chloride, dissolved (CDFluoride, dissolved (F)Silica, dissolved (SiO2)Solids, dissolved, at 180 CNitrogen, NO2 + NO3, diss. (as N)Nitrogen, ammonia, dissolved (as N)Nitrogen, organic, total (as N)Nitrogen, amm. + org., total (as N)Nitrogen, total (as N)Phosphorus, total (as P)Phosphorus, ortho, dissolved (as P)Iron, dissolved (Fe) }ig/LManganese, dissolved (Mn) }ig/LChlorophyll a, phytoplankton (}ig/L)
WATER-QUALITY DATA, FEBRUARY 06 TO AUGUST 13, 1996 (Milligrams per liter unless otherwise indicated)
Feb. 06 Apr. 10 June 11 July 16 Aug. 13
3.04
4647.92.5
-11.9_______________
____________
___
69.93474
7.73.5___
--6.5
______
___
___
1
44486.250
112104225133
170292701
2680
<00010
<0
<02
.54.
.10
.604.
.7
.1
.0
.20
.03
.80
.80
.0
.012
.002
.4
.4
7190446
85251
711
2104225133
170292701
2640
<000100
1-
.0.5
.2
.4
.1
.0
.20
.03
.80
.80
.0
.013
.002
--
1.55.
4528.3
17.5
5.9.6___
_________
______
0.008---
___1.1
7232453
7.66.5
7
2.7
__________________
______0.111___
___1.3
1.55.
4338.5
25.0
2.9.3
_________---
_________0.012___
___2.6
6876453
7.66.5
80.0
___---___---
___
0.113___
______
1.54.
4238.6
26.0
___2.
8.4
______---___
______
0.010___
3.4
7388461
7.56.5
80.0
___
______---
0.217___
2-6-96
10
4-10-96 6-11-96 7-16-96 8-13-96
DISSOLVED OXYGEN (D.O.), IN MILLIGRAMS PER LITER
10 20 30 10 20 30 10 20 30
WATER TEMPERATURE (W.T.), IN DEGREES CELSIUS
PH, IN STANDARD UNITS 10 10 10
0
t 15111-30
I
111o60
7K
1
-
-
'_ pH
.-
i
I 1 ' '
' s.c. --
_
.g
«, -
, ,
0
15
30
45
60
7K
1
-
-
_
.
-
1
1
-
-
_
.
,
0
15
30
45
60
7K
I '
; / :i
- / -II
i, i
0
15
30
45
60
7C
' : ' I '
- "o -I
- / -//~
i i i
u
15
30
45
60
75
i
-
-
-
~
, I
' 1 '
^''
' ~
-
"~
, '' ,
400 425 450 475 500 400 425 450 475 500 400 425 450 475 500 400 425 450 475 500 400 425 450 475 500
SPECIFIC CONDUCTANCE (S.C.), IN MICROSIEMENS PER CENTIMETER AT 25 DEGREES CELSIUS
119
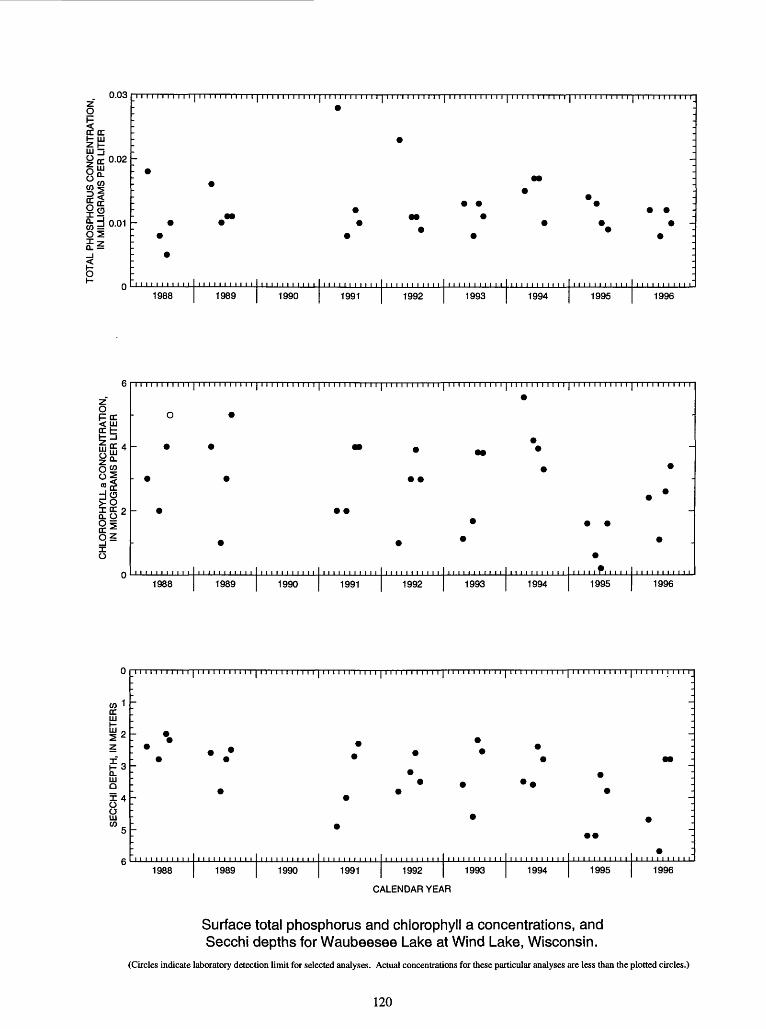
0.03
Q ff 0.02
°co
|l85 d 0.0102 £2
o u1988 1989 1990 1991 1992 1993 1994 1995 1996
oHOC < LU
1988 1989 1990 1991 1992 1993 1994 1995 1996
0)1 CC
E.
1988 1989 1990 1991 1992 1993
CALENDAR YEAR
1994 1995 1996
Surface total phosphorus and chlorophyll a concentrations, and Secchj depths for Waubeesee Lake at Wind Lake, Wisconsin.
(Circles indicate laboratory detection limit for selected analyses. Actual concentrations for these particular analyses are less than the plotted circles.)
120
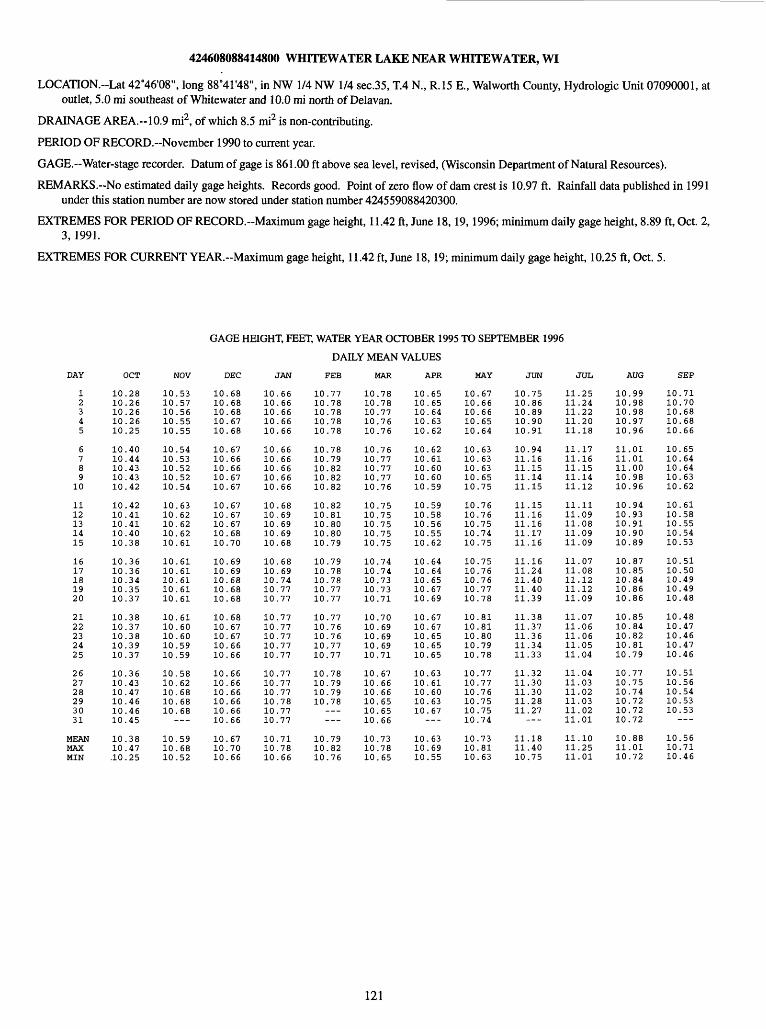
424608088414800 WHTTEWATER LAKE NEAR WHTTEWATER, WI
LOCATION.-Lat 42°46'08", long 88°41'48", in NW 1/4 NW 1/4 sec.35, T.4 N., R.15 E., Walworth County, Hydrologic Unit 07090001, at outlet, 5.0 mi southeast of Whitewater and 10.0 mi north of Delavan.
DRAINAGE AREA.--10.9 mi2, of which 8.5 mi2 is non-contributing.
PERIOD OF RECORD.-November 1990 to current year.
GAGE.-Water-stage recorder. Datum of gage is 861.00 ft above sea level, revised, (Wisconsin Department of Natural Resources).
REMARKS.-No estimated daily gage heights. Records good. Point of zero flow of dam crest is 10.97 ft. Rainfall data published in 1991 under this station number are now stored under station number 424559088420300.
EXTREMES FOR PERIOD OF RECORD.-Maximum gage height, 11.42 ft, June 18,19,1996; minimum daily gage height, 8.89 ft, Oct. 2, 3,1991.
EXTREMES FOR CURRENT YEAR.--Maximum gage height, 11.42 ft, June 18,19; minimum daily gage height, 10.25 ft, Oct. 5.
12345
6789
10
1112131415
1617181920
2122232425
262728293031
MEANMAXMIN
OCT
10.2810.2610.2610.2610.25
10.4010.4410.4310.4310.42
10.4210.4110.4110.4010.38
10.3610.3610.3410.3510.37
10.3810.3710.3810.3910.37
10.3610.4310.4710.4610.4610.45
10.3810.47.10.25
NOV
10.5310.5710.5610.5510.55
10.5410.5310.5210.5210.54
10.6310.6210.6210.6210.61
10.6110.6110.6110.6110.61
10.6110.6010.6010.5910.59
10.5810.6210.6810.6810.68
10.5910.6810.52
GAGE HEIGHT, FEET, WATER YEAR OCTOBER 1995 TO SEPTEMBER 1996
DAILY MEAN VALUES
DEC JAN FEE MAR APR MAY JUN JUL
10.6810.6810.6810.6710.68
10.6710.6610.6610.6710.67
10.6710.6710.6710.6810.70
10.6910.6910.6810.6810.68
10.6810.6710.6710.6610.66
10.6610.6610.6610.6610.6610.66
10.6710.7010.66
10.6610.6610.6610.6610.66
10.6610.6610.6610.6610.66
10.6810.6910.6910.6910.68
10.6810.6910.7410.7710.77
10.7710.7710.7710.7710.77
10.7710.7710.7710.7810.7710.77
10.7110.7810.66
10.7710.7810.7810.7810.78
10.7810.7910.8210.8210.82
10.8210.8110.8010.8010.79
10.7910.7810.7810.7710.77
10.7710.7610.7610.7710.77
10.7810.7910.7910.78
10.7910.8210.76
10.7810.7810.7710.7610.76
10.7610.7710.7710.7710.76
10.7510.7510.7510.7510.75
10.7410.7410.7310.7310.71
10.7010.6910.6910.6910.71
10.6710.6610.6610.6510.6510.66
10.7310.7810.65
10.6510.6510.6410.6310.62
10.6210.6110.6010.6010.59
10.5910.5810.5610.5510.62
10.6410.6410.6510.6710.69
10.6710.6710.6510.6510.65
10.6310.6110.6010.6310.67
10.6310.6910.55
10.6710.6610.6610.6510.64
10.6310.6310.6310.6510.75
10.7610.7610.7510.7410.75
10.7510.7610.7610.7710.78
10.8110.8110.8010.7910.78
10.7710.7710.7610.7510.7510.74
10.7310.8110.63
10.7510.8610.8910.9010.91
10.9411.1611.1511.1411.15
11.1511.1611.1611.1711.16
11.1611.2411.4011.4011.39
11.3811.3711.3611.3411.33
11.3211.3011.3011.2811.27
11.1811.4010.75
11.2511.2411.2211.2011.18
11.1711.1611.1511.1411.12
11.1111.0911.0811.0911.09
11.0711.0811.1211.1211.09
11.0711.0611.0611.0511.04
11.0411.0311.0211.0311.0211.01
11.1011.2511.01
AUG
10.9910.9810.9810.9710.96
11.0111.0111.0010.9810.96
10.9410.9310.9110.9010.89
10.8710.8510.8410.8610.86
10.8510.8410.8210.8110.79
10.7710.7510.7410.7210.7210.72
10.8811.0110.72
SEP
10.7110.7010.6810.6810.66
10.6510.6410.6410.6310.62
10.6110.5810.5510.5410.53
10.5110.5010.4910.4910.48
10.4810.4710.4610.4710.46
10.5110.5610.5410.5310.53
10.5610.7110.46
121
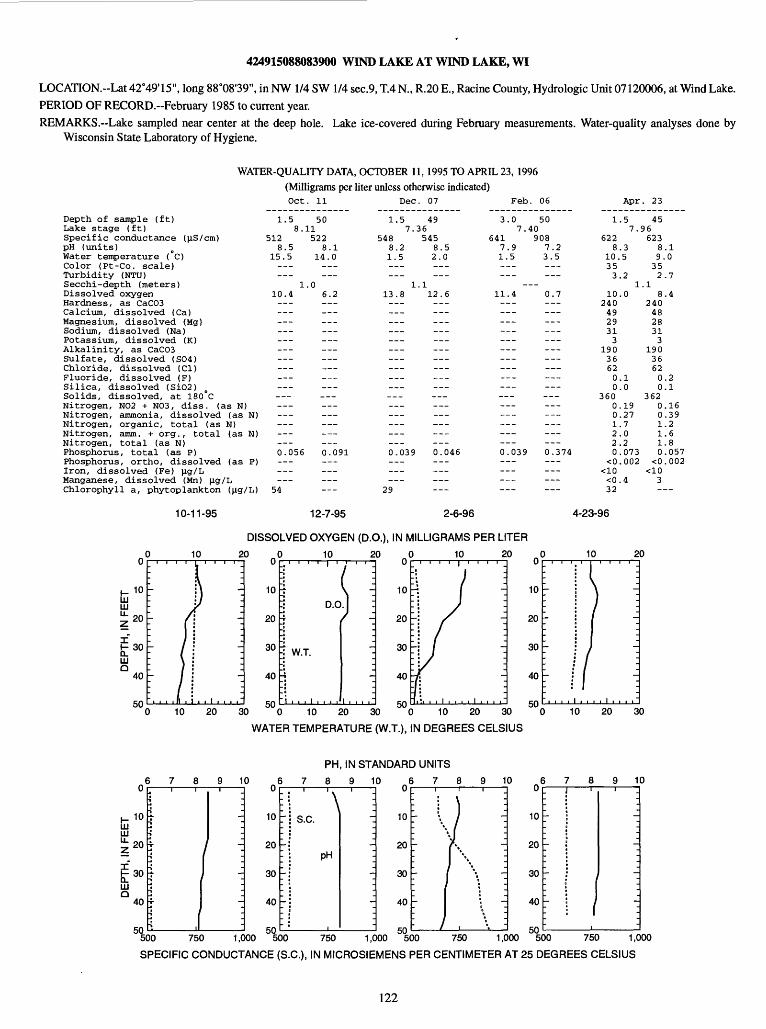
424915088083900 WIND LAKE AT WIND LAKE, WI
LOCATION.--Lat 42°49'15", long 88°08'39", in NW 1/4 SW 1/4 sec.9, T.4 N., R.20 E., Racine County, Hydrologic Unit 07120006, at Wind Lake. PERIOD OF RECORD.-February 1985 to current year.REMARKS. Lake sampled near center at the deep hole. Lake ice-covered during February measurements. Water-quality analyses done by
Wisconsin State Laboratory of Hygiene.
WATER-QUALITY DATA, OCTOBER 11,1995 TO APRIL 23, 1996 (Milligrams per liter unless otherwise indicated)Oct. 11 Dec. 07 Feb. 06 Apr. 23
Depth of sample (ft)Lake stage (ft)Specific conductance (uS/cm)pH (units)Water temperature (°C)Color (Pt-Co. scale)Turbidity (NTU)Secchi-depth (meters)Dissolved oxygenHardness, as CaC03Calcium, dissolved (Ca)Magnesium, dissolved (Mg)Sodium, dissolved (Na)Potassium, dissolved (K)Alkalinity, as CaC03Sulfate, dissolved (S04)Chloride, dissolved (Cl)Fluoride, dissolved (F)Silica, dissolved (Si02)Solids, dissolved, at 180°CNitrogen, N02 + N03, diss. (as N)Nitrogen, ammonia, dissolved (as N)Nitrogen, organic, total (as N)Nitrogen, amm. + org., total (as N)Nitrogen, total (as N)Phosphorus, total (as P)Phosphorus, ortho, dissolved (as P)Iron, dissolved (Fe) ug/LManganese, dissolved (Mn) ug/LChlorophyll a, phytoplankton (ug/L)
1.58.
5128.5
15.5
1
10.4_________
___
0.056---
___54
5011522
8.114.0___
.06.2___
___
___
0.091
___
1.57.
5488.21.5
___1
13.8___ ___
______
___
_________0.039
___29
4936545
8.52.0
.112.6___
___
______
___
______0.046___
___
3
64171--
11-----------.-----0-
_-
.07.
.9.5----
-.4---------------------- ---- --.039
__
5040908
73--
0----------- -----0-
_-
.2.5
.7-- ---- ---- -- --.374--
__
1
6228
10.353
102404929313
190366200
360001220
<0
<032
.57.
.3,5
.21
.0
.1
.0
.19
.27
.7
.0
.2
.073
.002
.4
4596623
89352
.18
2404828313
190366200
362001110
<0
3-
.1.0
.7
.4
.2
.1
.16
.39
.2
.6
.8
.057
.002
10
20
I- 30 CL UJ Q
40
50
10-11-95
10
12-7-95 2-6-96
DISSOLVED OXYGEN (D.O.), IN MILLIGRAMS PER LITER
20 10 20 10 20
D.O.
-! W.T.
10 20 30 "0 10 20 30 "0 10 20 30
WATER TEMPERATURE (W.T.), IN DEGREES CELSIUS
4-23-96
10 20u
10
20
30
40
en
-
-
-
~- ;'
" i i i
M/ ^. , . i i i i i~
10 20 30
PH, IN STANDARD UNITS
50
10 8 10u
10
20
30
40
>;n
'\- s.c.
L: PH'-
-
-
_i:
-_
-_
10u
10
20
30
40
zn
i '
~-
~7
'-
: I
1
-j
-_
-_
-j
10
500 750 1,000 500 750 1,000 500 750 1,000 500 750 1,000
SPECIFIC CONDUCTANCE (S.C.), IN MICRO-SIEMENS PER CENTIMETER AT 25 DEGREES CELSIUS
122

424915088083900 WIND LAKE AT WIND LAKE, WI--CONTINUED
WATER-QUALITY DATA, JUNE 11 TO AAUGUST 08, 1996(Milligrams per liter unless otherwise indicated)
June 11 July 16
Depth of sample (ft)Lake stage (ft)Specific conductance (jlS/cm)pH (units)Water temperature (°C)Secchi-depth (meters)Dissolved oxygenPhosphorus, total-(as P)Chlorophyll a, phytoplankton (jig/L)
Aug. 08
1.5 50 8.41
603 6418.4 7.3
17.0 11.02.5
8.4 0.20.070 0.3238.6
1.5 48 8.22
587 6578.4 7.4
24.5 12.01.2
9.3 0.30.053 0.43524
1.5 50 8.29
580 6648.4 7.2
26.5 12.01.1
8.0 0.60.039 0.48317
6-11-96 7-16-96 8-8-96
DISSOLVED OXYGEN (D.O.), IN MILLIGRAMS PER LITER
o c
h- 1 °tu tu-20
H 30 Q_tuQ
40
tin
10 2
D.O. y ~
^ ' ~
f \ W.T. ~
0 C0
10
20
30
40
«;n
10 2
' -
. , , , I *, . . . 1 . i , .'
0 C0
10
20
30
40
«;n
10 2/;i.** ~
10 20 30 10 20 30
WATER TEMPERATURE (W.T.), IN DEGREES CELSIUS
8 9 10PH, IN STANDARD UNITS
8 9 10
10 20 30
8 9 10u
t 10UJI 20H 30CLUJQ
40
«;n
1 '
'7
- S.C. j/
1/1
1
j1 ,
1
-j
--
PH :_i~~.~
:
u
10
20
30
40
Rn
1
-
i- \
\"_
~
'
\_
~".
~
i
u
10
20
30
40
«;n
1
'-
- \
\_ '/I
_~~
.~
,500 750 1,000 500 750 1,000 500 750 1,000
SPECIFIC CONDUCTANCE (S.C.), IN MICROSIEMENS PER CENTIMETER AT 25 DEGREES CELSIUS
123
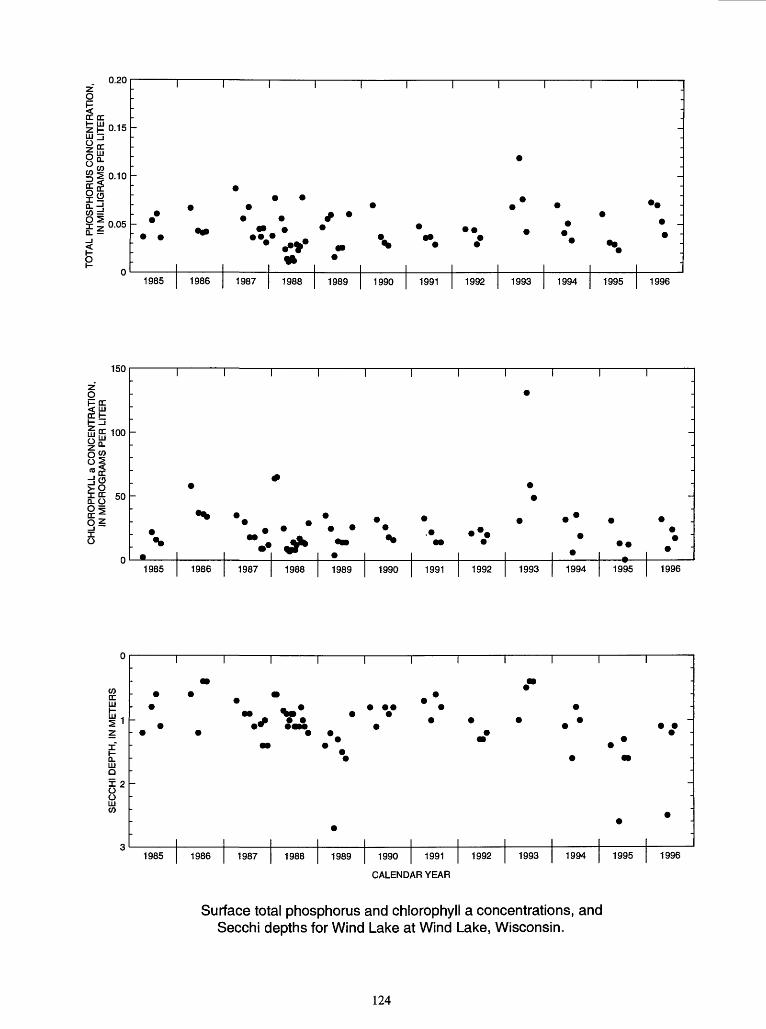
0
cccc1- UI n -IE ZH 0.15UJ Ij
O °~
||o.,o
||0.05
_l
I I
-
~ « ~
i " " / . 9 * ". *. :' ^* * _ ** * * ^ «PT » ^ * ~- n * '.
1985 1986 1987 1988 1989 1990 1991 1992 1993 1994 1995 1996
150
O I- CC< UJ
100
50
I I
1985 1986 1987 1988 1989 1990 1991 1992 1993 1994 1995 1996
i i i r i r i i
1985 1986 1987 1988 1989 1990 1991 1992 1993 1994 1995
CALENDAR YEAR
1996
Surface total phosphorus and chlorophyll a concentrations, and Secchi depths for Wind Lake at Wind Lake, Wisconsin.
124
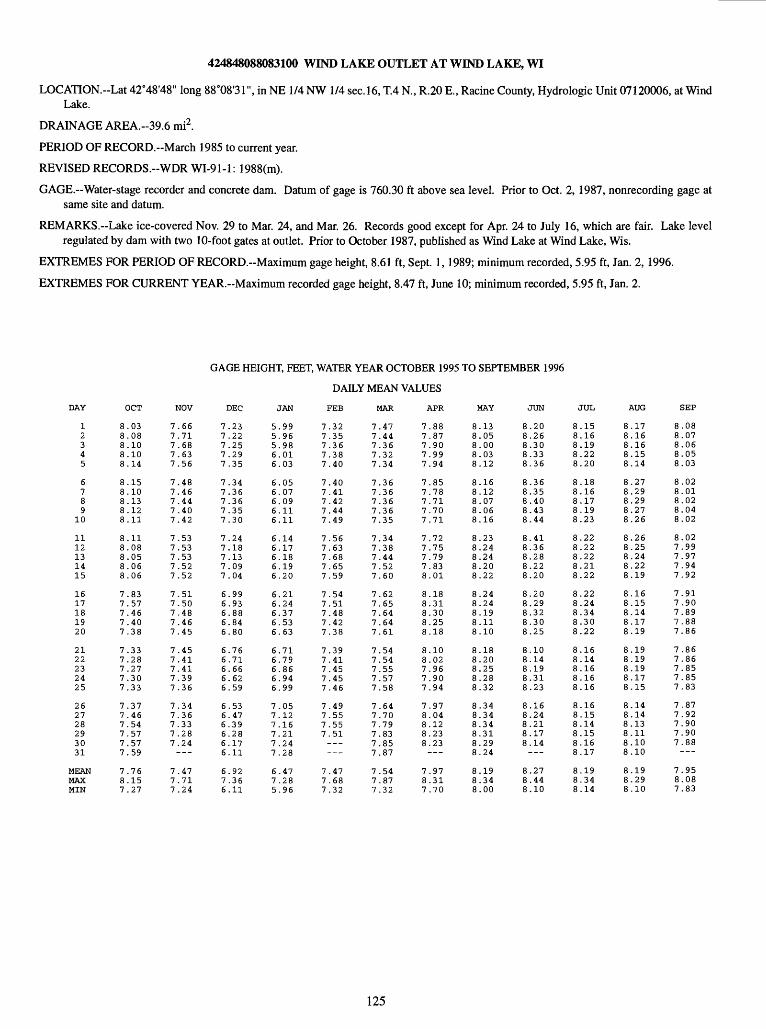
424848088083100 WIND LAKE OUTLET AT WIND LAKE, WI
LOCATION.-Lat 42°48'48" long 88 008'31", in NE 1/4 NW 1/4 sec.16, T.4 N., R.20 E., Racine County, Hydrologic Unit 07120006, at Wind Lake.
DRAINAGE AREA.--39.6 mi2 .
PERIOD OF RECORD.-March 1985 to current year.
REVISED RECORDS.--WDR WI-91-1: 1988(m).
GAGE.-Water-stage recorder and concrete dam. Datum of gage is 760.30 ft above sea level. Prior to Oct. 2, 1987, nonrecording gage at same site and datum.
REMARKS.-Lake ice-covered Nov. 29 to Mar. 24, and Mar. 26. Records good except for Apr. 24 to July 16, which are fair. Lake level regulated by dam with two 10-foot gates at outlet. Prior to October 1987, published as Wind Lake at Wind Lake, Wis.
EXTREMES FOR PERIOD OF RECORD.-Maximum gage height, 8.61 ft, Sept. 1,1989; minimum recorded, 5.95 ft, Jan. 2,1996.
EXTREMES FOR CURRENT YEAR.-Maximum recorded gage height, 8.47 ft, June 10; minimum recorded, 5.95 ft, Jan. 2.
GAGE HEIGHT, FEET, WATER YEAR OCTOBER 1995 TO SEPTEMBER 1996
DAILY MEAN VALUES
DEC JAN FEE MAR APR MAY JUN AUG SEP
12345
6789
10
1112131415
1617181920
2122232425
262728293031
MEANMAXMIN
8.038.088.108.108.14
8.158.108.138.128.11
8.118.088.058.068.06
7.837.577.467.407.38
7.337.287.277.307.33
7.377.467.547.577.577.59
7.768.157.27
7.667.717.687.637.56
7.487.467.447.407.42
7.537.537.537.527.52
7.517.507.487.467.45
7.457.417.417.397.36
7.347.367.337.287.24
7.477.717.24
7.237.227.257.297.35
7.347.367.367.357.30
7.247.187.137.097.04
6.996.936.886.846.80
6.766.716.666.626.59
6.536.476.396.286.176.11
6.927.366.11
5.995.965.986.016.03
6.056.076.096.116.11
6.146.176.186.196.20
6.216.246.376.536.63
6.716.796.866.946.99
7.057.127.167.217.247.28
6.477.285.96
7.327.357.367.387.40
7.407.417.427.447.49
7.567.637.687.657.59
7.547.517.487.427.38
7.397.417.457.457.46
7.497.557.557.51___
7.477.687.32
7.477.447.367.327.34
7.367.367.367.367.35
7.347.387.447.527.60
7.627.657.647.647.61
7.547.547.557.577.58
7.647.707.797.837.857.87
7.547.877.32
7.887.877.907.997.94
7.857.787.717.707.71
7.727.757.797.838.01
8.188.318.308.258.18
8.108.027.967.907.94
7.978.048.128.238.23___
7.978.317.70
8.138.058.008.038.12
8.168.128.078.068.16
8.238.248.248.208.22
8.248.248.198.118.10
8.188.208.258.288.32
8.348.348.348.318.298.24
8.198.348.00
8.208.268.308.338.36
8.368.358.408.438.44
8.418.368.288.228.20
8.208.298.328.308.25
8.108.148.198.318.23
8.168.248.218.178.14___
8.278.448.10
8.158.168.198.228.20
8.188.168.178.198.23
8.228.228.228.218.22
8.228.248.348.308.22
8.168.148.168.168.16
8.168.158.148.158.168.17
8.198.348.14
8.178.168.168.158.14
8.278.298.298.278.26
8.268.258.248.228.19
8.168.158.148.178.19
8.198.198.198.178.15
8.148.148.138.118.108.10
8.198.298.10
8.088.078.068.058.03
8.028.018.028.048.02
8.027.997.977.947.92
7.917.907.897.887.86
7.867.867.857.857.83
7.877.927.907.907.88___
7.958.087.83
125

04082500 LAKEWINNEBAGOATOSHKOSH,WI
LOCATION.--Lat 44°00'35", long 88°31'38", in NE 1/4 NE 1/4 sec.25, T.18 N., R.16 E., Winnebago County, Hydrologic Unit 04030203, at 905 Bay Shore Drive, 800 ft east of mouth of the upper Fox River.
DRAINAGE AREA.~5.880 mi2, at lake outlet at Menasha Dam. Area of Lake Winnebago, 215 mi2 .
PERIOD OF RECORD.-October 1938 to current year in reports of Geological Survey. Records from 1882 to 1938 in files of Geological Survey and U.S. Army Corps of Engineers. A report on Fox River by U.S. Army Corps of Engineers, published as House Document No. 146, 67th Congress, 2nd session, contains semi-monthly records of inflow of Lake Winnebago for the period 1896-1917.
REVISED RECORD.--WDR WI-83-1: Drainage area.
GAGE.-Water-stage recorder. Nonrecording gage read once daily October 1938 to October 1978. Datum of gage is 745.05 ft above mean tide at New York City (levels by U.S. Army Corps of Engineers). Datum of Deuchman gage is 745.00 ft above mean tide at New York City.
REMARKS.--Estimated daily gage heights: May 11-19. Records good except for estimated daily gage heights, which are fair. Lake eleva tions controlled by dams at Menasha and Neenah, which are operated in the interest of navigation. Crests of both dams are at elevation 746.73 ft. Present limits of regulation are from 21 1/4 in. above the crest of Menasha dam to crest during navigation season, plus addi tional 18 in. below crest during winter. Oshkosh staff gage gives true level of lake, while Deuchman gage readings are affected by loss of head in the channel between lake and dam. Data-collection platform at station.
EXTREMES FOR PERIOD OF RECORD.-Maximum gage height observed, 5.33 ft (Deuchman gage) Nov. 8,1881; minimum observed, -2.00 ft (Deuchman gage) Nov. 28, 1891.
EXTREMES FOR CURRENT YEAR.-Maximum recorded gage height, 3.67 ft, July 2; minimum recorded, 1.18 ft, Mar. 12,13.
GAGE HEIGHT, FEET, WATER YEAR OCTOBER 1995 TO SEPTEMBER 1996
DAILY MEAN VALUES
12345
6789
10
1112131415
1617181920
2122232425
262728293031
MEANMAXMIN
OCT
3.053.143.133.123.16
3.143.193.253.253.25
3.233.213.123.013.03
2.80
2.762.772.742.592.63
2.612.632.662.622.642.64
2.943.252.59
NOV
2.672.672.662.722.66
2.632.582.572.602.51
2.462.512.462.442.38
2.372.372.342.312.21
2.192.232.192.172.12
2.102.122.102.092.08
2.382.722.08
DEC JAN FEE APR
1.94
2.052.052.032.032.01
1.97
1.961.941.931.921.90
1.891.871.861.851.83
1.821.811.801.791.771.76
1.751.741.731.721.71
1.64
1.58
1.571.561.601.651.65
1.661.671.681.701.71
1.781.781.781.771.76
1.751.741.741.721.70
1.691.681.661.641.61
1.581.561.531.501.47
1.441.41
1.76 1.56
1.35
1.351.371.371.36
1.581.781.35
1.341.321.311.291.29
1.281.261.251.231.22
1.201.191.191.231.27
1.321.361.411.441.48
1.501.531.571.611.68
1.721.731.751.781.811.86
1.431.861.19
2.01
2.032.05
.07
.092. 2. 2.11
2.132.122.142.172.20
2.222.282.282.332.43
2.522.542.612.642.58
2.592.682.692.772.68
2.292.771.90
MAY
2.782.792.812.812.80
2.782.732.752.742.84
2.802.702.702.702.70
2.702.802.802.902.95
2.972.993.053.063.00
JUN
3.093.143.173.233.21
JUL AUG
3.22
3.193.17
.14
.133, 3, 3.11
3.083.323.413.403.37
3.353.333.343.273.28
3.283.283.293.253.27
2.70
3.243.413.08
3.283.283.253.193.13
2.973.002.98
2.942.95
.98
.002.3. 2.98
2.99
3.17
3.12
3.09
090704070706
0828
3.053.033.012.992.98
3.03
2.992.972.982.952.95
2.94
2.932.932.932.922.96
2.962.963.002.972.96
2.982.962.942.952.942.93
2.983.052.92
SEP
2.932.922.912.922.92
2.912.912.942.982.96
2.932.932.902.872.86
2.882.872.852.852.82
2.822.822.84
812.83
2.852.752.802.822.83
2.872.982.75
126
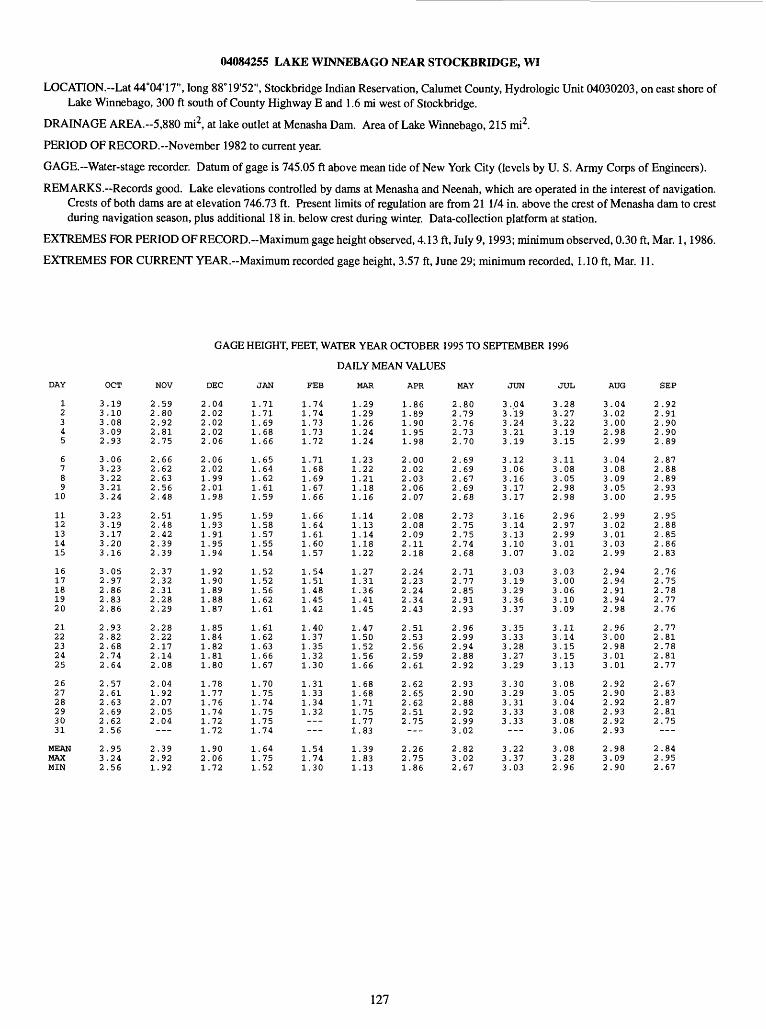
04084255 LAKE WINNEBAGO NEAR STOCKBRIDGE, WI
LOCATION.--Lat 44°04'17", long 88°19'52", Stockbridge Indian Reservation, Calumet County, Hydrologic Unit 04030203, on east shore of Lake Winnebago, 300 ft south of County Highway E and 1.6 mi west of Stockbridge.
DRAINAGE AREA.-5,880 mi2, at lake outlet at Menasha Dam. Area of Lake Winnebago, 215 mi2 .
PERIOD OF RECORD.-November 1982 to current year.
GAGE.--Water-stage recorder. Datum of gage is 745.05 ft above mean tide of New York City (levels by U. S. Army Corps of Engineers).
REMARKS.-Records good. Lake elevations controlled by dams at Menasha and Neenah, which are operated in the interest of navigation. Crests of both dams are at elevation 746.73 ft. Present limits of regulation are from 21 1/4 in. above the crest of Menasha dam to crest during navigation season, plus additional 18 in. below crest during winter. Data-collection platform at station.
EXTREMES FOR PERIOD OF RECORD.-Maximum gage height observed, 4.13 ft, July 9,1993; minimum observed, 0.30 ft, Mar. 1,1986.
EXTREMES FOR CURRENT YEAR.~Maximum recorded gage height, 3.57 ft, June 29; minimum recorded, 1.10 ft, Mar. 11.
GAGE HEIGHT, FEET, WATER YEAR OCTOBER 1995 TO SEPTEMBER 1996
DAILY MEAN VALUES
DAY
12345
6789
10
1112131415
1617181920
2122232425
262728293031
MEANMAXMIN
OCT
3.193.103.083.092.93
3.063.233.223.213.24
3.233.193.173.203.16
3.052.972.862.832.86
2.932.822.682.742.64
2.572.612.632.692.622.56
2.953.242.56
NOV
2.592.802.922.812.75
2.662.622.632.562.48
2.512.482.422.392.39
2.372.322.312.282.29
2.282.222.172.142.08
2.041.922.072.052.04
2.392.921.92
DEC
2.042.022.022.022.06
2.062.021.992.011.98
1.951.931.911.951.94
1.921.901.891.881.87
1.851.841.821.811.80
1.781.771.761.741.721.72
1.902.061.72
JAN
1.711.711.691.681.66
1.651.641.621.611.59
1.591.581.571.551.54
1.521.521.561.621.61
1.611.621.631.661.67
1.701.751.741.751.751.74
1.641.751.52
FEE
1.741.741.731.731.72
1.711.681.691.671.66
1.661.641.611.601.57
1.541.511.481.451.42
1.401.371.351.321.30
1.311.331.341.32
1.541.741.30
MAR
1.291.291.261.241.24
1.231.221.211.181.16
1.141.131.141.181.22
1.271.311.361.411.45
1.471.501.521.561.66
1.681.681.711.751.771.83
1.391.831.13
APR
1.861.891.901.951.98
2.002.022.032.062.07
2.082.082.092.112.18
2.242.232.242.342.43
2.512.532.562.592.61
2.622.652.622.512.75
2.262.751.86
MAY
2.802.792.762.732.70
2.692.692.672.692.68
2.732.752.752.742.68
2.712.772.852.912.93
2.962.992.942.882.92
2.932.902.882.922.993.02
2.823.022.67
JUN
3.043.193.243.213.19
3.123.063.163.173.17
3.163.143.133.103.07
3.033.193.293.363.37
3.353.333.283.273.29
3.303.293.313.333.33
3.223.373.03
JUL
3.283.273.223.193.15
3.113.083.052.982.98
2.962.972.993.013.02
3.033.003.063.103.09
3.113.143.153.153.13
3.083.053.043.083.083.06
3.083.282.96
AUG
3.043.023.002.982.99
3.043.083.093.053.00
2.993.023.013.032.99
2.942.942.912.942.98
2.963.002.983.013.01
2.922.902.922.932.922.93
2.983.092.90
SEP
2.922.912.902.902.89
2.872.882.892.932.95
2.952.882.852.862.83
2.762.752.782.772.76
2.772.812.782.812.77
2.672.832.872.812.75
2.842.952.67
127

435152088123100 WOLF LAKE NEAR MT. CALVARY, WI
LOCATION.--Lat 43°51'52", long 88°12'31", in SW 1/4 SE 1/4 sec.10, T.16 N., R.19 E., Fond du Lac County, Hydrologic Unit 04030101, 3.2 mi northeast of Mt. Calvary.
DRAINAGE AREA.--3.43 mi2.
LAKE-STAGE RECORDS
PERIOD OF RECORD.--November 1983 to September 1986, November 1992 to current year.
GAGE. Stage measured by Alan Depies at lake outlet.
EXTREMES FOR PERIOD OF RECORD.-Maximum gage height observed, 6.81 ft, Sept. 15, 1986; minimum observed, 4.42 ft, July 24, 1985.
EXTREMES FOR CURRENT YEAR.-Maximum gage height observed, 6.14 ft, June 26; minimum observed, 4.72 ft, Oct. 1.
12345
6789
10
1112131415
1617181920
2122232425
262728293031
GAGE HEIGHT, FEET, WATER YEAR OCTOBER 1995 TO SEPTEMBER 1996
DAILY MEAN VALUES
OCT NOV DEC JAN FEE MAR APR MAY JUN JUL AUG SEP
4.72 5.56 5.77 5.434.89 5.06
5.87 5.77 5.52
5.47
5.89
5.06
6.14
5.81
5.39
5.48
5.18
5.31
5.31
5.47
5.06
128
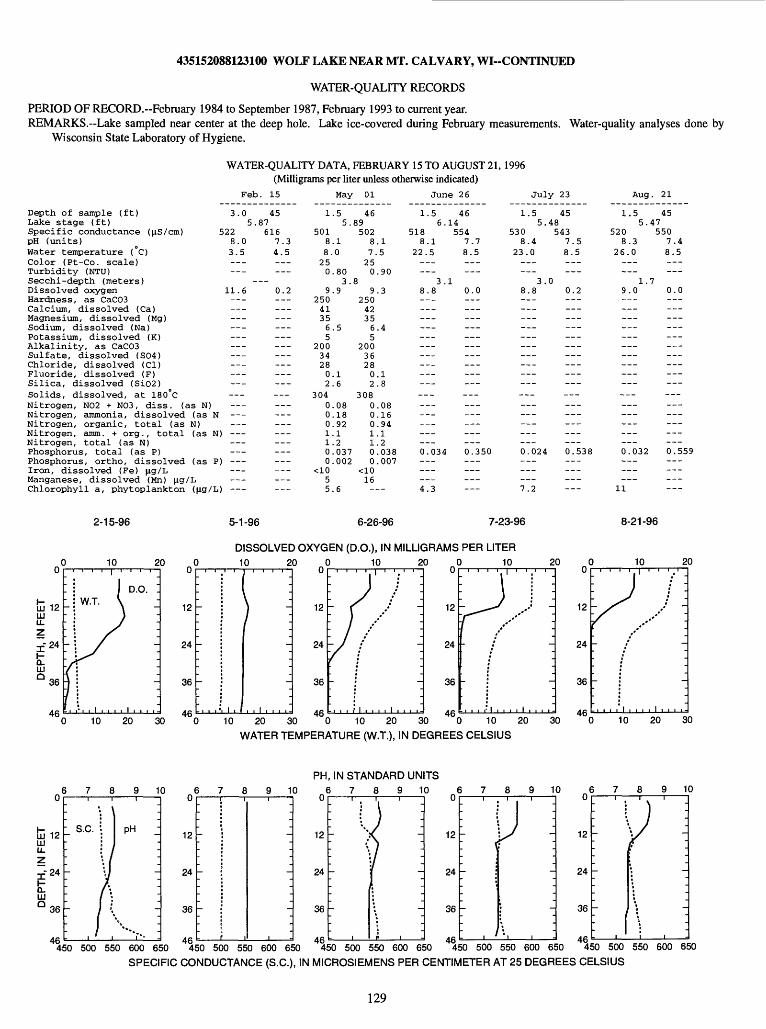
435152088123100 WOLF LAKE NEAR MT. CALVARY, WI--CONTINUED
WATER-QUALITY RECORDS
PERIOD OF RECORD.-February 1984 to September 1987, February 1993 to current year.REMARKS. Lake sampled near center at the deep hole. Lake ice-covered during February measurements. Water-quality analyses done by
Wisconsin State Laboratory of Hygiene.
WATER-QUALITY DATA, FEBRUARY 15 TO AUGUST 21, 1996 (Milligrams per liter unless otherwise indicated)
Feb. 15 May 01 June 26 July 23
Depth of sample (ft)Lake stage (ft)Specific conductance (jiS/cm)pH (units)Water temperature (°C)Color (Pt-Co. scale)Turbidity (NTU)Secchi-depth (meters)Dissolved oxygenHardness, as CaC03Calcium, dissolved (Ca)Magnesium, dissolved (Mg)Sodium, dissolved (Na)Potassium, dissolved (K)Alkalinity, as CaC03Sulfate, dissolved (S04)Chloride, dissolved (Cl)Fluoride, dissolved (F)Silica, dissolved (Si02)Solids, dissolved, at 180°CNitrogen, N02 + N03, diss. (as N)Nitrogen, ammonia, dissolved (as NNitrogen, organic, total (as N)Nitrogen, amm. + org., total (as N)Nitrogen, total (as N)Phosphorus, total (as P)Phosphorus, ortho, dissolved (as P)Iron, dissolved (Fe) fig/LManganese, dissolved (Mn) fig/LChlorophyll a, phytoplankton (fig/L)
Aug. 21
3.05
5228.03.5______
11.6
___
___
___
r
r)
>)
___,)
45.87616
7.34.5
___0.2
________________________ __________________
---
___
1
50188.250
9250413565
200342802
3040001100
55
.55.
.10
.803.
.9
.5
.1
.6
.08
.18
.92
.1
.2
.037
.002
.6
4689502
87250
89
250423565
200362802
3080001100
16-
.1.5
.90
.3
.4
.1
.8
.08
.16
.94
.1
.2
.038
.007
1.56.
5188.1
22.5
___3.
8.8
______
_________
___0.034
___4.3
4614554
7.78.5______
10.0
___ ___ ______
___
0.350
___
1.55.
5308.4
23.0 ___
3.8.8
______ ___
___
0.024
___7.2
4548543
7.58.5______
00.2___
___---
_________
___---
___
0.538
1.55.
5208.3
26.0___
1.9.0
___
0.032
11
4547550
7.48.5
70.0
0.559___
2-15-96
10
5-1-96 6-26-96 7-23-96
10 20 30
DISSOLVED OXYGEN (D.O.), IN MILLIGRAMS PER LITER10 20
12
24
36
46
10 20 C0
12
24
36
AC
10 2
jJ. , i/ -
-
10 20 30 ~0 10 20 30 0 10 20 WATER TEMPERATURE (W.T.), IN DEGREES CELSIUS
30
12
24
36
46
8-21-96
10 20
10 20 30
PH, IN STANDARD UNITS
6789 10 6789 10 6789 10 6789 10 6789 10
W 12 UJ
r s.c.
-24
36
46
PH12
24
36
46
12
24
36
46
12
24
36
46
12
24
36
46450 500 550 600 650 450 500 550 600 650 450 500 550 600 650 450 500 550 600 650 450 500 550 600 650
SPECIFIC CONDUCTANCE (S.C.), IN MICROSIEMENS PER CENTIMETER AT 25 DEGREES CELSIUS
129
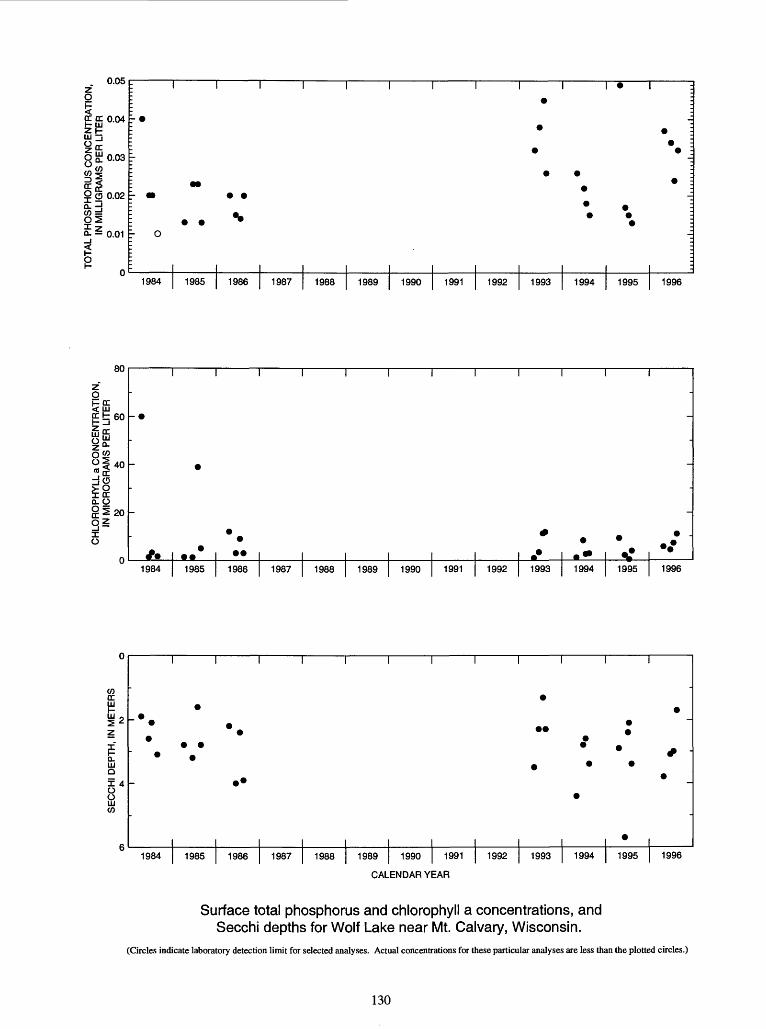
JENTRATION,
LITER
0 C S S
0 £ 0.03
TOTAL PHOSPHORL IN MILLIGRA 0 O 2 ft
II I :
]
* * 4
o i
1984 1985 1986 1987 1988 1989 1990 1991 1992 1993 1994 1995 1996
CENTRATION,
'ER LITER
§ 2
z °l40
"2S- O
ICC Q.O
0
0
III II
-
. * * .// . <
1984 1985 1986 1987 1988 1989 1990 1991 1992 1993 1994 1995 1996
I I I I I I
1984 1985 1986 1987 1988 1989 1990 1991 1992 1993 1994 1995 1996
CALENDAR YEAR
Surface total phosphorus and chlorophyll a concentrations, and Secchi depths for Wolf Lake near Mt. Calvary, Wisconsin.
(Circles indicate laboratory detection limit for selected analyses. Actual concentrations for these particular analyses are less than the plotted circles.)
130

WISCONSIN DISTRICT PUBLICATIONS PERTAINING TO LAKES
The reports published in a U.S. Geological Survey series are for sale by the U.S. Geological Survey, Box 25425, Federal Center, Denver, CO 80225. Prepayment is required. Remittance should be sent by check or money order payable to the U.S. Geological Survey. Prices can be obtained by writing to the above address or by calling (303) 236-7476. Reprints of journal articles may be obtained by writing directly to the author at U.S. Geological Survey, 6417 Normandy Lane, Madison, Wl 53719.
Anderson, W.L., Robertson, D.M., and Magnuson, J.J., 1996, Evidence of recent warming and El Nino-related variation in ice breakup of Wisconsin lakes, Limnology and Oceanography, Vol. 41, p. 815-821.
Elder, J.F. and Goddard, G.L., 1996, Sediment and nutrient trapping efficiency of a constructed wetland near Delavan Lake, Wisconsin, 1993-1995: U.S. Geological Survey Fact Sheet FS-232-96.
Garn, H.S., Olson, D.L., Seidel, T.L, and Rose, W.J., 1996, Hydrology and water quality of Lau- derdale Lakes, Walworth County, Wisconsin, 1993-94: U.S. Geological Survey Water-Re sources Investigations Report 96-4235, 29 p.
Hunt, R.J. and Krohelski, J.T., 1996, The application of an analytical element model to investigate groundwater-lake interactions at Pretty Lake, Wisconsin, Lake and Reservoir Management, Vol. 12, p. 487-495.
Imberger, J., Robertson, D.M., and Boland, K., 1996, Lake Number: A quantitative indicator of mixing to be used in water quality management. Scientificlmpeller, Solna, Sweden, No. 4, p. 9-15.
Kammerer, P.A., Jr., 1996, Hydrology and water quality of Park Lake, Sourth-central Wisconsin: U.S. Geological Survy Fact Sheet FS-197-96.
Robertson, D.M., Field, S.J, Elder, J.F., Goddard, G.L., and James, W.F., 1996, Phosphorus dy namics of Delavan Lake Inlet in southeastern Wisconsin. U.S. Geological Survey Water- Resources Investigations Report 96-4160,18 p.
Assel, R.A. and Robertson, D.M. 1995, Changes in winter air temperatures near Lake Michigan during 1851 -1993, as determined from regional lake-ice records, Limnology and Oceanogra phy, v. 40, p 165-176.
Assel, R.A., Robertson, D.M., Hoff, M.H., and Selgeby, J.H., 1995, Climatic-change implications from long-term (1823-1994) ice records near the Laurentian Great Lakes: Annals of Glaciolo- gy, v. 21, p. 383-386.
Krabbenhoft, D.P., and Webster, K.E., 1995, Transient hydrogeological controls on the chemistry of a seepage lake: Water Resources Research, v. 31, no. 9, p. 2295-2305.
Krohelski, J.T. and Batten, W.G., 1995, Simulation of stage and the hydrologic budget of Devils Lake, Sauk County, Wisconsin: U.S. Geological Survey Open-File Report 94-348, 22 p.
Wentz, D.A., Rose, W.J., and Webster, K.E., 1995, Long-term hydrologic and biogeochemical re sponses of a soft water seepage lake in north central Wisconsin: Water Resources Research, v. 31, no. 1,p 199-212.
Elder, J.F., 1994, Distribution and grain-size partitioning of metals in bottom sediments of an ex perimentally acidified lake: Water Resources Bulletin, v. 30, no. 2, p. 251-259.
131
Goddard, G.L., and Field, S.J., 1994, Hydrology and water quality of Whitewater and Rice Lakes in southeastern Wisconsin, 1990-91: U.S. Geological Survey Water-Resources Investigations Report 94-4101, 36 p.
Greb, S.R., and Wentz, D.A., 1994, Chemical budgets, in Klepinger, K.E., ed., RILWAS 1983-86: Wisconsin Regional Integrated Lake Watershed Acidification Study, Volume 1: Madison, Wisconsin Department of Natural Resources, PUBL-RS-909-94, Chapter 7, 20 p.
Hurley, J.P., Krabbenhoft, D.P., Babiarz, C.L., and Andren, A.W., 1994, Cycling processes of mer cury across sediment/water interfaces in seepage lakes, in Baker, L.A. ed., Environmental Chemistry of Lakes and Reservoirs: Advances in Chemistry Series, American Chemical Society, Washington, D.C., p. 426-449.
Krabbenhoft, D.P., Bowser, C.J., Kendall, C., and Gat, J.R., 1994, Use of oxygen-19 and deute rium to assess the hydrology of ground-water/lake systems, in Baker, L.A. ed., Environmental Chemistry of Lakes and Reservoirs: Advances in Chemistry Series, American Chemical Society, Washington, D.C., p. 67-90.
Robertson, D.M., Anderson, W., and Magnuson, J.J., 1994, Relations between El Nino/Southern Oscillation events and the climate and ice cover of lakes in Wisconsin. P 48-57, in Greenland, D. ed., El Nino and Long-Term Ecological Research (LTER) Sites: Publication No. 18. LTER Network Office: University of Washington, Seattle, WA, USA., 57 p.
Robertson, D.M. and Imberger, J. 1994, Lake Number, a quantitative indicator of mixing used to estimate changes in dissolved oxygen, Internationale Revue der gesamten Hydrobiologie, v. 79, p. 159-176.
Watras, C.J., Bloom, N.S., Hurley, J.P., Fitzgerald, W.F., Andren, A.W., Krabbenhoft, D.P., and Porcella, D.B., 1994, Sources and fates of mercury and methylmercury in Wisconsin lakes, in Waltras and Huckabee eds., Mercury as a Global Pollutant: Intergration and Synthesis, Lewis Pub., Chelsea, Ml., p 153-177.
Wentz, D.A., 1994, Chemistry of snowpack and ground water, in Klepinger, K.E., ed., RILWAS 1983-86: Wisconsin Regional Integrated Lake Watershed Acidification Study, Volume 1: Madison, Wisconsin Department of Natural Resources, PUBL-RS-909-94, Chapter 6, 45 p.
Wentz, D.A., Krohelski, J.T., and Rose, W.J., 1994, Hydrology, in Klepinger, K.E., ed., RILWAS 1983-86: Wisconsin Regional Integrated Lake Watershed Acidification Study, Volume 1: Mad ison, Wisconsin Department of Natural Resources, PUBL-RS-909-94, Chapter 7, 74 p.
Field, S.J., 1993, Hydrology and water quality of Powers Lake, southeastern Wisconsin: U.S. Geological Survey Water-Resources Investigations Report 90-4126, 36 p.
Field, S.J., 1993, Hydrology and water quality of Wind Lake in southeastern Wisconsin: U.S. Geological Survey Water-Resources Investigations Report 91-4107, 61 p.
House, L.B., 1993, Simulation of the effects of hypothetical residential development on water levels in Graber Pond, Middleton, Wisconsin: U.S. Geological Survey Water-Resources Investigations Report 92-4029,10 p.
House, L.B., Waschbusch, R.J., and Hughes, P.E., 1993, Water quality of an urban wet detention pond in Madison, Wisconsin, 1987-88: U.S. Geological Survey Open-File Report 93-172, 57 p.
Hughes, P.E., 1993, Hydrology, water quality, trophic status, and aquatic plants of Fowler Lake, Wisconsin: U.S. Geological Survey Water-Resources Investigations Report 91-4076, 44 p.
132
Rose, W.J., 1993, Hydrology of Little Rock Lake in Vilas County, north-central Wisconsin: U.S. Geological Survey Water-Resources Investigations Report 93-4139, 22 p.
Rose, W.J., 1993, Water and phosphorus budgets and trophic state, Balsam Lake, northwestern Wisconsin, 1987-1989: U.S. Geological Survey Water-Resources Investigations Report 91-4125, 28 p.
Elder, J.F., Krabbenhoft, DP, and Walker, J.F., 1992, Water, energy, and biogeochemical bud gets (WEBB) program: Data availability and research at the northern temperate lakes site, Wisconsin: U.S. Geological Survey Open-File Report 92-48,15 p.
Krabbenhoft, D.P., and Babiarz, C.L., 1992, Role of groundwater transport in aquatic mercury cy cling: Water Resources Research, vol. 28, no. 12, p. 3119-3128.
Krabbenhoft, DP., and Krohelski, J.T., 1992, Data on water quality, lake sediment, and lake-level fluctuation, St. Croix Indian Reservation, Wisconsin, 1981-87: U.S. Geological Survey Open- File Report 92-26, 53 p.
Robertson, D.M., Ragotzkie, R.A., and Magnuson, J.J. 1992, Lake ice records used to detect his torical and future climatic changes: Climatic Change, v. 21, p. 407-427.
Wentz, D.A., and Rose, W.J., 1991, Hydrology of Lakes Clara and Vandercook in North-Central Wisconsin: U.S. Geological Survey Water-Resources Investigations Report 89-4204, 24 p.
Watras, C.J., Andre, A.W., Bloom, N.S., Fitzgerald, W.F., Hurley, J.P., Krabbenhoft, DP., Rada, R.G., Wiener, J.G., 1991, Mercury in temperate lakes: a mechanistic field study: Verhandlun- gen Internal. Verein. Limnologie, 24, p. 2199-2202.
Walker, J.F., Pickard, S.A., and Sonzogni, W.C., 1989 Spreadsheet watershed modeling for non- point-source pollution management in a Wisconsin basin: Water Resources Bulletin, v. 25, no. 1,p. 139-147.
Wentz, D.A., Garrison, P.J., and Bockheim, J.G., 1989, Section 7 Chemical input-output bud gets, in Knauer, D., and Brouwer, S.A., eds., The Wisconsin Regional Integrated Lake-Water shed Acidification Study (RILWAS): 1981-1983: Palo Alto, California, Electric Power Research Institute Report EA-6214, p. 7-1 to 7-30.
Wentz, D.A., and Rose, W.J., 1989, Interrelationships among hydrologic-budget components of a northern Wisconsin seepage lake and implications for acid-deposition modeling: Archives of Environmental Contamination and Toxicology, v. 18, p. 147-155.
Wentz, D.A., Rose, W.J., and Krohelski, J.T., 1989, Section 5 Hydrologic component, in Knauer, D., and Brouwer, S.A., eds., The Wisconsin Regional Integrated Lake-Watershed Acidification Study (RILWAS): 1981-1983: Palo Alto, California, Electric Power Research Institute Report EA-6214, p. 5-1 to 5-77.
Field, S.J., and Duerk, M.D., 1988, Hydrology and water quality of Delavan Lake in southeastern Wisconsin: U.S. Geological Survey Water-Resources Investigations Report 87-4168, 61 p.
Krug, W.R., Ostenso, N.A., and Krohelski, J.T., 1988, Prediction of the effects of mine dewatering on four lakes near Crandon, Wisconsin, by use of a water-budget model: U.S. Geological Sur vey Open-File Report 87-471, 63 p.
Wentz, D.A., Krohelski, J.T., Rose, W.J., Bockheim, J.G., Garrison, P.J., Knauer, D.R., and Gold- stein, R.A., 1987, Hydrologic and chemical budgets of Wisconsin lakes, in Perrry, R., Harrison, R.M., Bel, J.N.B., and Lester, J.N., eds., Acid Rain: Scientific and Technical Advances, Selper Ltd., London, p. 309-316.
133
House, L.B., 1986, Stage fluctuations of Wisconsin Lakes: Wisconsin Geological and Natural History Survey Information Circular No. 49, 84 p.
House, L.B., 1984, Effects of urbanization on three ponds in Middleton, Wisconsin: U.S. Geological Survey Water-Resources Investigations Report 84-4051,17 p.
Krug, W.R., and House, L.B., 1984, Evaluation of alternative reservoir-management practices in the Rock River basin, Wisconsin: U.S. Geological Survey Water-Resources Investigations Report 83-4186, 21 p.
House, L.B., 1981, An assessment of streamflow, water quality, and the effects of construction on impoundment on Bridge Creek at Augusta, Wisconsin: U.S. Geological Survey Water- Resources Investigations Open-File Report 81-1192, 25 p.
Krug, W.R., 1981, Hydrologic effects of proposed changes in management practices, Winnebago Pool, Wisconsin: U.S. Geological Survey Water-Resources Investigations 80-107,19 p.
Batten, W.G., and Hindall, S.M., 1980, Sediment deposition in the White River Reservoir, north western Wisconsin: U.S. Geological Survey Water-Supply Paper 2069, 30 p.
Novitzki, R.P., and Holmstrom, B.K., 1979, Monthly and annual water budgets of Lake Wingra, Madison, Wisconsin, 1971-77: U.S. Geological Survey Water-Resources Investigations 79-100,31 p.
Rose, W.J., 1977, Hydrologic considerations associated with dredging spring ponds in Wisconsin: U.S. Geological Survey Water-Resources Investigations 77-18, 35 p.
Oakes, E.L., Hendrickson, G.E., and Zuehls, E.E., 1975, Hydrology of the Lake Wingra basin, Dane County, Wisconsin: U.S. Geological Survey Water-Resources Investigations 17-75, 31 p.
Novitzki, R.P., 1971, Hydrologic investigations of Heart Lake, Green Lake County, Wisconsin: U.S. Geological Survey Administrative Report, 9 p.
134