water-quality assessment of the cook inlet basin, alaska - usgs
TRANSCRIPT
ALASKAC
OO
K IN
LET
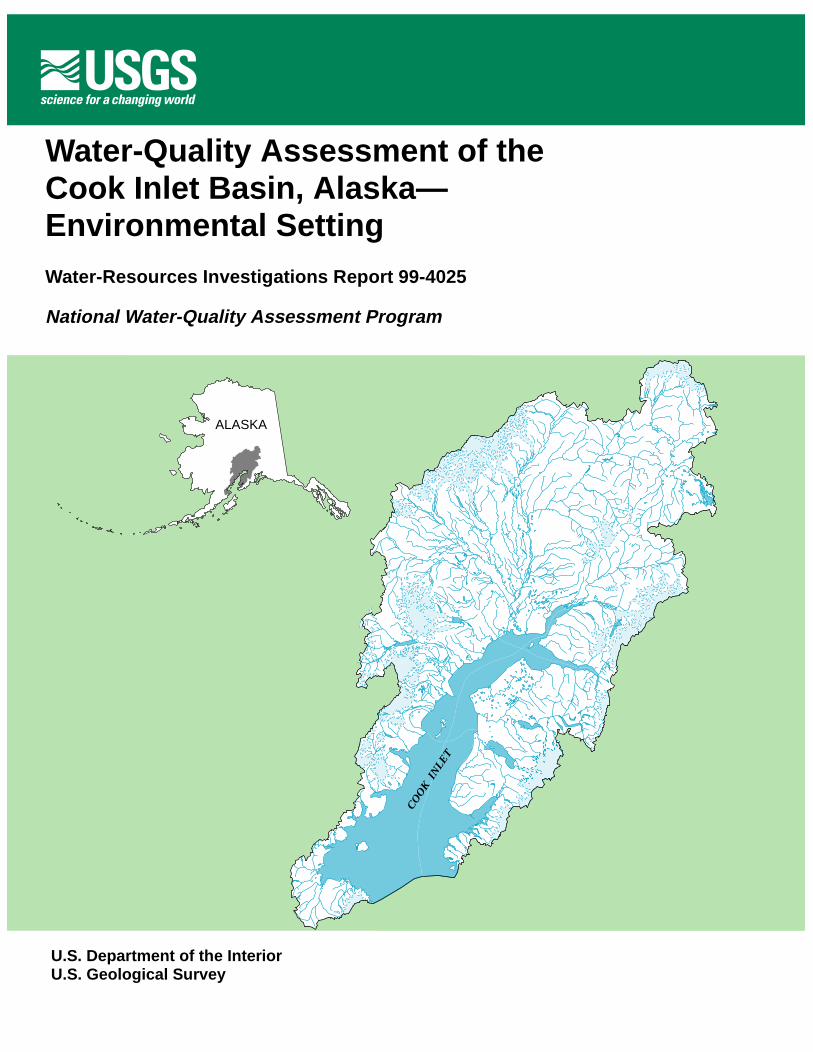
Water-Quality Assessment of the Cook Inlet Basin, Alaska—Environmental SettingWater-Resources Investigations Report 99-4025
National Water-Quality Assessment Program
U.S. Department of the InteriorU.S. Geological Survey
Water-Quality Assessment of the Cook Inlet
Basin, Alaska—Environmental Setting
By Timothy P. Brabets, Gordon L. Nelson, Joseph M. Dorava, and Alexander M. Milner_____________________________________________________________________
U.S. GEOLOGICAL SURVEY
Water-Resources Investigations Report 99-4025
National Water-Quality Assessment Program
Anchorage, Alaska 1999
U.S. DEPARTMENT OF THE INTERIORBRUCE BABBITT, Secretary
U.S. GEOLOGICAL SURVEYCharles G. Groat, Director
CONTRIBUTING U.S. GEOLOGICAL SURVEY STAFF
Editorial, Graphics, and Text PreparationE.F. Snyder, Technical EditorL-L. Harris, Cartographic TechnicianS.L. Benson, Technical Editor
For additional information write to: Copies of this report may be purchased from:
District Chief U.S. Geological SurveyU.S. Geological Survey Branch of Information Services4230 University Drive, Suite 201 Box 25286Anchorage, AK 99508-4664 Denver, CO 80225-0286
Internet URL’s:Alaska Water Resources: ak.water.usgs.govCook Inlet Basin NAWQA: ak.water.usgs.gov/Projects/nawqa.htmNational NAWQA: wwwrvares.er.usgs.gov/nawqa/nawqa_home.html
,
nd
-
as
o-
d
l-
by a-s-e e n
n y s all
Robert M. Hirsch
FOREWORDThe mission of the U.S. Geological Survey
(USGS) is to assess the quantity and quality of the earth resources of the Nation and to provide informa-tion that will assist resource managers and policy-makers at Federal, State, and local levels in making sound decisions. Assessment of water-quality condi-tions and trends is an important part of this overall mission.
One of the greatest challenges faced by water-resources scientists is acquiring reliable information that will guide the use and protection of the Nation’water resources. That challenge is being addressedFederal, State, interstate, and local water-resourceagencies and by many academic institutions. Thesorganizations are collecting water-quality data for ahost of purposes that include: compliance with per-mits and water-supply standards; development of remediation plans for specific contamination prob-lems; operational decisions on industrial, wastewator water-supply facilities; and research on factors thaffect water quality. An additional need for water-quality information is to provide a basis on which regional- and national-level policy decisions can bebased. Wise decisions must be based on sound infmation. As a society we need to know whether certain types of water-quality problems are isolated orubiquitous, whether there are significant differencein conditions among regions, whether the conditionare changing over time, and why these conditions change from place to place and over time. The infomation can be used to help determine the efficacy existing water-quality policies and to help analysts determine the need for and likely consequences ofnew policies.
To address these needs, the U.S. Congress appriated funds in 1986 for the USGS to begin a pilotprogram in seven project areas to develop and refithe National Water-Quality Assessment (NAWQA) Program. In 1991, the USGS began full implementtion of the program. The NAWQA Program builds upon an existing base of water-quality studies of thUSGS, as well as those of other Federal, State, anlocal agencies. The objectives of the NAWQA Pro-gram are to:
• Describe current water-quality conditions for alarge part of the Nation’s freshwater streamsrivers, and aquifers.
s by e
er, at
or-- s s
r-of
pro- ne
a-
e d
• Describe how water quality is changing over time.
• Improve understanding of the primary naturaland human factors that affect water-qualityconditions.
This information will help support the develop-ment and evaluation of management, regulatory, amonitoring decisions by other Federal, State, and local agencies to protect, use, and enhance water resources.
The goals of the NAWQA Program are being achieved through ongoing and proposed investigations of 59 of the Nation’s most important river basins and aquifer systems, which are referred to study units. These study units are distributed throughout the Nation and cover a diversity of hydrgeologic settings. More than two-thirds of the Nation’s freshwater use occurs within the 59 studyunits and more than two-thirds of the people serveby public water-supply systems live within their boundaries.
National synthesis of data analysis, based on aggregation of comparable information obtained from the study units, is a major component of the program. This effort focuses on selected water-quaity topics using nationally consistent information. Comparative studies will explain differences and similarities in observed water-quality conditions among study areas and will identify changes and trends and their causes. The first topics addressedthe national synthesis are pesticides, nutrients, voltile organic compounds, and aquatic biology. Discusions on these and other water-quality topics will bpublished in periodic summaries of the quality of thNation’s ground and surface water as the informatiobecomes available.
This report is an element of the comprehensivebody of information developed as part of the NAWQA Program. The program depends heavily othe advice, cooperation, and information from manFederal, State, interstate, Tribal, and local agencieand the public. The assistance and suggestions ofare greatly appreciated.
Chief Hydrologist
CONTENTS
Abstract . . . . . . . . . . . . . . . . . . . . . . . . . . . . . . . . . . . . . . . . . . . . . . . . . . . . . . . . . . . . . 1
Introduction . . . . . . . . . . . . . . . . . . . . . . . . . . . . . . . . . . . . . . . . . . . . . . . . . . . . . . . . . . . . . 1
Background . . . . . . . . . . . . . . . . . . . . . . . . . . . . . . . . . . . . . . . . . . . . . . . . . . . . . . . . . . . 1
Purpose and scope . . . . . . . . . . . . . . . . . . . . . . . . . . . . . . . . . . . . . . . . . . . . . . . . . . . . . . 3
Water-quality issues . . . . . . . . . . . . . . . . . . . . . . . . . . . . . . . . . . . . . . . . . . . . . . . . . . . . 3
Natural factors. . . . . . . . . . . . . . . . . . . . . . . . . . . . . . . . . . . . . . . . . . . . . . . . . . . . . 4
Human activities . . . . . . . . . . . . . . . . . . . . . . . . . . . . . . . . . . . . . . . . . . . . . . . . . . . 4
Physical characteristics of the Cook Inlet Basin . . . . . . . . . . . . . . . . . . . . . . . . . . . . . . . . . . .8
Climate . . . . . . . . . . . . . . . . . . . . . . . . . . . . . . . . . . . . . . . . . . . . . . . . . . . . . . . . . . . . . 10
Physiography . . . . . . . . . . . . . . . . . . . . . . . . . . . . . . . . . . . . . . . . . . . . . . . . . . . . . . . . . . 12
Geology . . . . . . . . . . . . . . . . . . . . . . . . . . . . . . . . . . . . . . . . . . . . . . . . . . . . . . . . . . . . . 14
Soils . . . . . . . . . . . . . . . . . . . . . . . . . . . . . . . . . . . . . . . . . . . . . . . . . . . . . . . . . . . . . 18
Land cover . . . . . . . . . . . . . . . . . . . . . . . . . . . . . . . . . . . . . . . . . . . . . . . . . . . . . . . . . . . . 21
Ecoregions . . . . . . . . . . . . . . . . . . . . . . . . . . . . . . . . . . . . . . . . . . . . . . . . . . . . . . . . . . . . 24
Hydrologic characteristics of the Cook Inlet Basin . . . . . . . . . . . . . . . . . . . . . . . . . . . . . . . . .26
Surface water . . . . . . . . . . . . . . . . . . . . . . . . . . . . . . . . . . . . . . . . . . . . . . . . . . . . . . . . . . 26
Snow and ice . . . . . . . . . . . . . . . . . . . . . . . . . . . . . . . . . . . . . . . . . . . . . . . . . . . . . . 30
Glacial and nonglacial streams and rivers. . . . . . . . . . . . . . . . . . . . . . . . . . . . . . . .28
Streamflow . . . . . . . . . . . . . . . . . . . . . . . . . . . . . . . . . . . . . . . . . . . . . . . . . . . . . . . 30
Floods . . . . . . . . . . . . . . . . . . . . . . . . . . . . . . . . . . . . . . . . . . . . . . . . . . . . . . . . . . . 30
Droughts . . . . . . . . . . . . . . . . . . . . . . . . . . . . . . . . . . . . . . . . . . . . . . . . . . . . . . . . . 35
Effects from volcanic eruptions . . . . . . . . . . . . . . . . . . . . . . . . . . . . . . . . . . . . . . . 37
Water quality. . . . . . . . . . . . . . . . . . . . . . . . . . . . . . . . . . . . . . . . . . . . . . . . . . . . . . 38
Ground water . . . . . . . . . . . . . . . . . . . . . . . . . . . . . . . . . . . . . . . . . . . . . . . . . . . . . . . . . . 42
Anchorage Lowlands aquifers . . . . . . . . . . . . . . . . . . . . . . . . . . . . . . . . . . . . . . . . 42
Unconfined aquifer . . . . . . . . . . . . . . . . . . . . . . . . . . . . . . . . . . . . . . . . . . . . . 43
Confining layer . . . . . . . . . . . . . . . . . . . . . . . . . . . . . . . . . . . . . . . . . . . . . . . . 45
Confined aquifer . . . . . . . . . . . . . . . . . . . . . . . . . . . . . . . . . . . . . . . . . . . . . . . 46
Kenai Lowlands aquifer . . . . . . . . . . . . . . . . . . . . . . . . . . . . . . . . . . . . . . . . . . . . . 47
Unconfined aquifer . . . . . . . . . . . . . . . . . . . . . . . . . . . . . . . . . . . . . . . . . . . . . 48
Confining layer . . . . . . . . . . . . . . . . . . . . . . . . . . . . . . . . . . . . . . . . . . . . . . . . 48
Upper confined aquifer . . . . . . . . . . . . . . . . . . . . . . . . . . . . . . . . . . . . . . . . . . 48
Deeper aquifers and confining layers . . . . . . . . . . . . . . . . . . . . . . . . . . . . . . .50
Matanuska and Susitna Lowlands aquifers . . . . . . . . . . . . . . . . . . . . . . . . . . . . . . .50
Tertiary-age uplands aquifers . . . . . . . . . . . . . . . . . . . . . . . . . . . . . . . . . . . . . . . . . 52
Igneous and metamorphic aquifers . . . . . . . . . . . . . . . . . . . . . . . . . . . . . . . . . . . . . 54
Aquatic biological characteristics of the Cook Inlet Basin . . . . . . . . . . . . . . . . . . . . . . . . . . . 55
Fish . . . . . . . . . . . . . . . . . . . . . . . . . . . . . . . . . . . . . . . . . . . . . . . . . . . . . . . . . . . . . 55
Aquatic invertebrates. . . . . . . . . . . . . . . . . . . . . . . . . . . . . . . . . . . . . . . . . . . . . . . . . . . . 55
Aquatic plants . . . . . . . . . . . . . . . . . . . . . . . . . . . . . . . . . . . . . . . . . . . . . . . . . . . . . . . . . 57
Macrophytes . . . . . . . . . . . . . . . . . . . . . . . . . . . . . . . . . . . . . . . . . . . . . . . . . . . . . . 57
Algae . . . . . . . . . . . . . . . . . . . . . . . . . . . . . . . . . . . . . . . . . . . . . . . . . . . . . . . . . . . . 58
Anthropogenic characteristics of the Cook Inlet Basin . . . . . . . . . . . . . . . . . . . . . . . . . . . . . . 58
Population and economic activity . . . . . . . . . . . . . . . . . . . . . . . . . . . . . . . . . . . . . . . . . . 58
Land ownership and land use . . . . . . . . . . . . . . . . . . . . . . . . . . . . . . . . . . . . . . . . . . . . . 60
Water use . . . . . . . . . . . . . . . . . . . . . . . . . . . . . . . . . . . . . . . . . . . . . . . . . . . . . . . . . . . . . 60
Summary . . . . . . . . . . . . . . . . . . . . . . . . . . . . . . . . . . . . . . . . . . . . . . . . . . . . . . . . . . . . . 62
References cited . . . . . . . . . . . . . . . . . . . . . . . . . . . . . . . . . . . . . . . . . . . . . . . . . . . . . . . . . . . . 63
FIGURES
1-11. Maps showing:
1. Location of the Cook Inlet Basin, Alaska, and major features . . . . . . . . . . . . .VIII
2. Towns, highways, railroad, and borough boundaries, Cook Inlet Basin,
Alaska . . . . . . . . . . . . . . . . . . . . . . . . . . . . . . . . . . . . . . . . . . . . . . . . . . . . . . . . 2
3. Major streams and land features of the Municipality of Anchorage, Alaska . . 5
4. Kenai River watershed, Alaska . . . . . . . . . . . . . . . . . . . . . . . . . . . . . . . . . . . . . 6
5. Major drainage areas of the Cook Inlet Basin, Alaska . . . . . . . . . . . . . . . . . . . 9
6. Climate and precipitation zones of the Cook Inlet Basin, Alaska . . . . . . . . . . 11
7. Physiographic regions of the Cook Inlet Basin, Alaska . . . . . . . . . . . . . . . . . . 13
8. Geology of the Cook Inlet Basin, Alaska . . . . . . . . . . . . . . . . . . . . . . . . . . . . . 17
9. Soils of the Cook Inlet Basin, Alaska . . . . . . . . . . . . . . . . . . . . . . . . . . . . . . . .19
10. Land cover of the Cook Inlet Basin, Alaska . . . . . . . . . . . . . . . . . . . . . . . . . . . 22
11. Ecoregions of the Cook Inlet Basin, Alaska . . . . . . . . . . . . . . . . . . . . . . . . . . . 25
12. Selected streams, lakes, and glaciers in the Cook Inlet Basin, Alaska . . . . . . . 27
13-15. Graphs showing:
13. Comparison of discharge between glacial and non-glacial streams
draining moderately small watersheds, Cook Inlet Basin, Alaska . . . . . . . . . . 28
14. Comparison of discharge between glacial and non-glacial streams
draining moderately large watersheds, Cook Inlet Basin, Alaska . . . . . . . . . . 28
15. Flow-duration curves for several streams in the Cook Inlet Basin . . . . . . . . . . 29
16. Map showing location of streamflow-gaging stations with 10 or more years
of record in the Cook Inlet Basin . . . . . . . . . . . . . . . . . . . . . . . . . . . . . . . . . . . . . . . . 31
17-18. Graphs showing:
17. Monthly discharge of streams into Cook Inlet Basin, Alaska. . . . . . . . . . . . . . 34
18. Departure from average discharge for several long-term
streamflow-gaging stations in the Cook Inlet Basin, Alaska . . . . . . . . . . . . . . 36
19. Boxplots of suspended sediment for seven rivers in the Cook Inlet Basin, Alaska . . 39
20. Graph showing monthly suspended-sediment load and water discharge for
Matanuska River, Alaska . . . . . . . . . . . . . . . . . . . . . . . . . . . . . . . . . . . . . . . . . . . . . . 40
21-23. Boxplots of:
21. Alkalinity for four rivers in the Cook Inlet Basin, Alaska . . . . . . . . . . . . . . . . 41
22. Dissolved solids for four rivers in the Cook Inlet Basin, Alaska . . . . . . . . . . . 41
23. Total phosphorus for four rivers in the Cook Inlet Basin, Alaska . . . . . . . . . . 41
24. Map showing location of geographic features in the Municipality of
Anchorage area, Alaska . . . . . . . . . . . . . . . . . . . . . . . . . . . . . . . . . . . . . . . . . . . . . . . 43
25. Sketch of subsurface conditions in the Anchorage area, Alaska . . . . . . . . . . . . . . . . 44
26. Map showing water-table contours and directions of ground-water flow in
Ship Creek basin, Alaska . . . . . . . . . . . . . . . . . . . . . . . . . . . . . . . . . . . . . . . . . . . . . . 46
27. Graph of ground-water pumpage data for 13 wells in the Municipality of Anchorage,
Alaska water system . . . . . . . . . . . . . . . . . . . . . . . . . . . . . . . . . . . . . . . . . . . . . . . . . . 47
28. Geologic sections showing subsurface conditions in the Nikiski area, Alaska . . . . . 49
29. Sketches of subsurface conditions in the Wasilla area and the Palmer-Butte
area, Alaska. . . . . . . . . . . . . . . . . . . . . . . . . . . . . . . . . . . . . . . . . . . . . . . . . . . . . . . . . 51
30. Map showing location of salt-water wells near Willow in the Susitna River
Basin, Alaska . . . . . . . . . . . . . . . . . . . . . . . . . . . . . . . . . . . . . . . . . . . . . . . . . . . . . . . 52
31. Map showing areas of the Cook Inlet Basin, Alaska, underlain by Tertiary
sediments of the Kenai Group . . . . . . . . . . . . . . . . . . . . . . . . . . . . . . . . . . . . . . . . . . 53
32. Map and graphs showing salmon harvest and escapement data for selected
water bodies in the Cook Inlet Basin, Alaska. . . . . . . . . . . . . . . . . . . . . . . . . . . . . . .56
33. Map showing land ownership of the Cook Inlet Basin, Alaska . . . . . . . . . . . . . . . . . 61
TABLES
1. Types and amounts of land cover in the Cook Inlet Basin, Alaska . . . . . . . . . . . . . . . 23
2. Streamflow-gaging stations with 10 or more years of record in the
Cook Inlet Basin, Alaska . . . . . . . . . . . . . . . . . . . . . . . . . . . . . . . . . . . . . . . . . . . . . . . . 32
3. Relative flow contributions from hydrologic units to Cook Inlet, Alaska . . . . . . . . . . . 33
4. Summary of flood discharges for the flood of October 10-12, 1986,
Cook Inlet Basin, Alaska . . . . . . . . . . . . . . . . . . . . . . . . . . . . . . . . . . . . . . . . . . . . . . . . 34
5. Summary of flood discharges during floods in September 1995,
Cook Inlet Basin, Alaska . . . . . . . . . . . . . . . . . . . . . . . . . . . . . . . . . . . . . . . . . . . . . . . . 35
6. Magnitude of floods from eruptions of Redoubt and Mt Spurr volcanoes,
Alaska. . . . . . . . . . . . . . . . . . . . . . . . . . . . . . . . . . . . . . . . . . . . . . . . . . . . . . . . . . . . . . . 37
7. Annual suspended-sediment loads for major rivers in the Cook Inlet Basin,
Alaska. . . . . . . . . . . . . . . . . . . . . . . . . . . . . . . . . . . . . . . . . . . . . . . . . . . . . . . . . . . . . . . 39
8. Baseflow in selected streams during late winter, Anchorage, Alaska . . . . . . . . . . . . . 45
9. Mean percent composition of the aquatic insect fauna in streams of the
Cook Inlet Basin, Alaska . . . . . . . . . . . . . . . . . . . . . . . . . . . . . . . . . . . . . . . . . . . . . . . . 57
10. Population data for communities in the Cook Inlet Basin, Alaska . . . . . . . . . . . . . . . . 59
11. Estimated water use during 1995 in the Cook Inlet Basin, Alaska . . . . . . . . . . . . . . . . 60
rived
evel
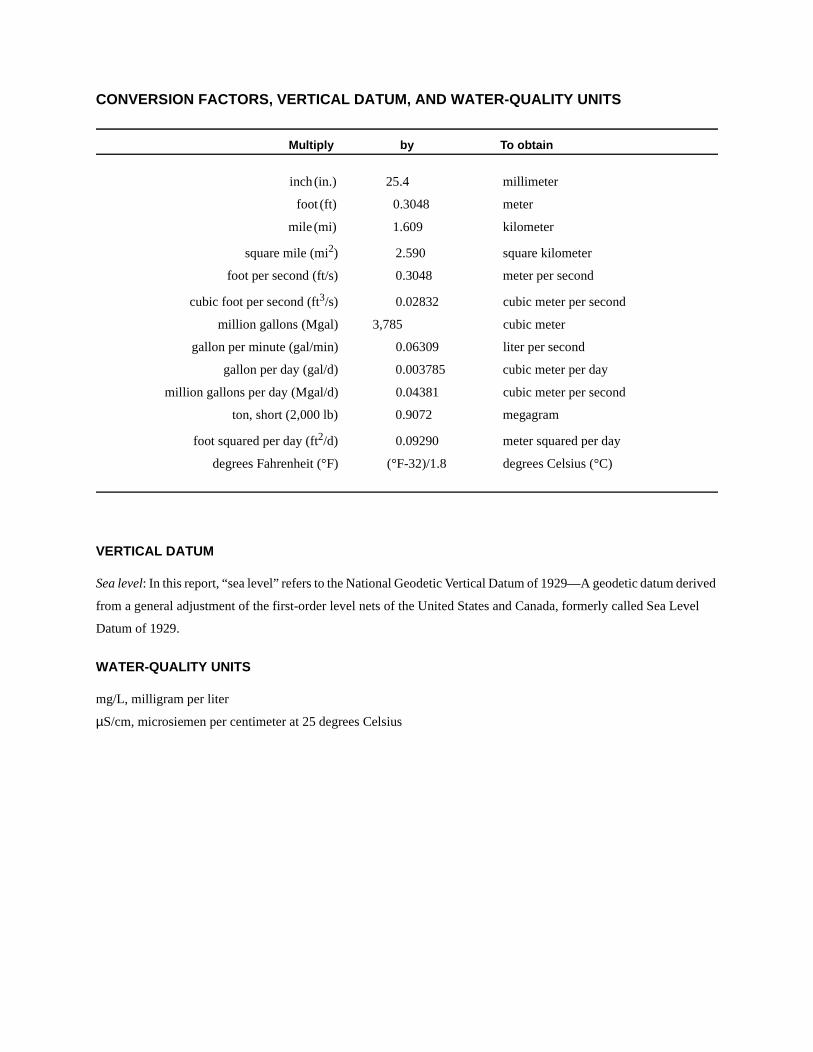
CONVERSION FACTORS, VERTICAL DATUM, AND WATER-QUALITY UNITS
Multiply by To obtain
inch (in.) 25.4 millimeter
foot (ft) 0.3048 meter
mile (mi) 1.609 kilometer
square mile (mi2) 2.590 square kilometer
foot per second (ft/s) 0.3048 meter per second
cubic foot per second (ft3/s) 0.02832 cubic meter per second
million gallons (Mgal) 3,785 cubic meter
gallon per minute (gal/min) 0.06309 liter per second
gallon per day (gal/d) 0.003785 cubic meter per day
million gallons per day (Mgal/d) 0.04381 cubic meter per second
ton, short (2,000 lb) 0.9072 megagram
foot squared per day (ft2/d) 0.09290 meter squared per day
degrees Fahrenheit (°F) (°F-32)/1.8 degrees Celsius (°C)
VERTICAL DATUM
Sea level: In this report, “sea level” refers to the National Geodetic Vertical Datum of 1929—A geodetic datum de
from a general adjustment of the first-order level nets of the United States and Canada, formerly called Sea L
Datum of 1929.
WATER-QUALITY UNITS
mg/L, milligram per liter
µS/cm, microsiemen per centimeter at 25 degrees Celsius
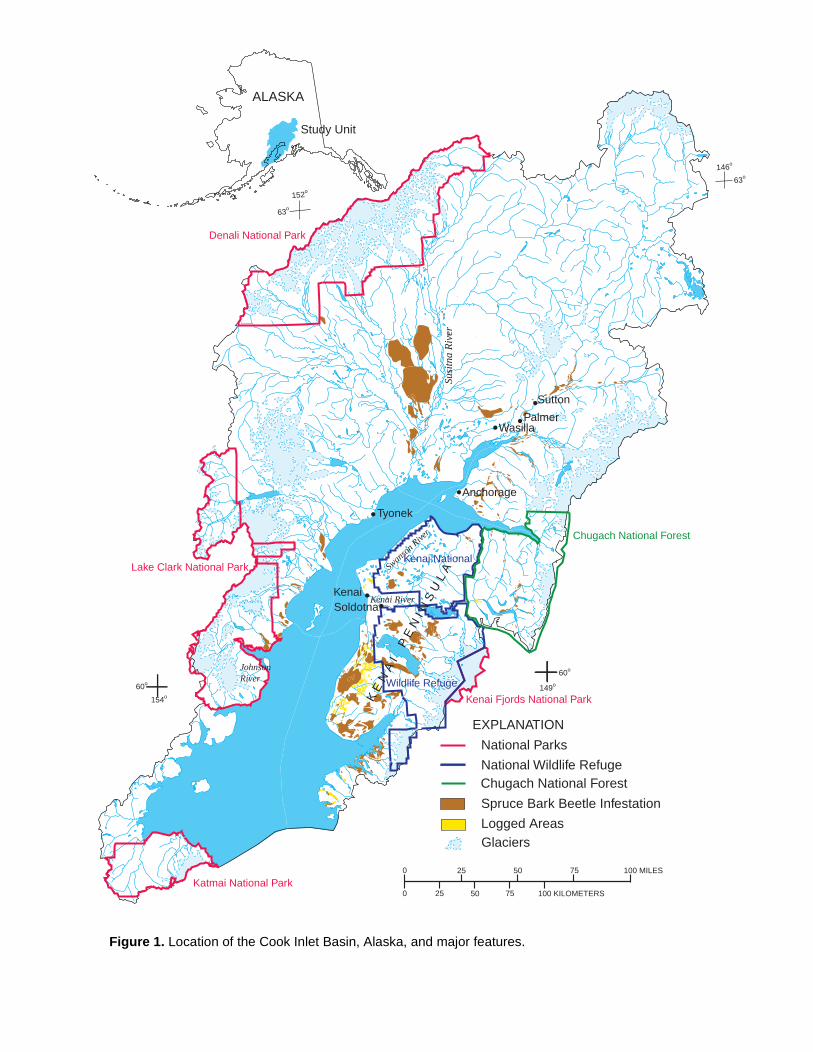
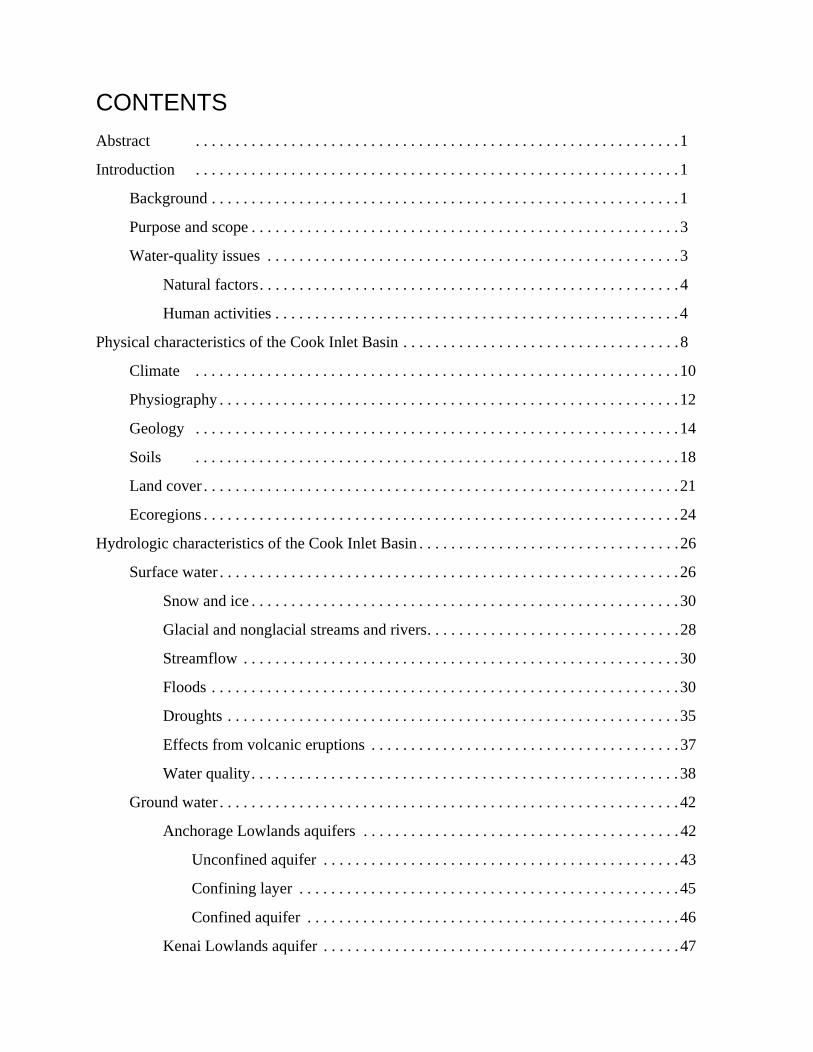
Figure 1. Location of the Cook Inlet Basin, Alaska, and major features.
Kenai Fjords National Park
Katmai National Park
Lake Clark National Park
Denali National Park
Kenai National
Wildlife Refuge
Chugach National Forest
Sutton
PalmerWasilla
Anchorage
Tyonek
KenaiSoldotna
100 MILES75
100 KILOMETERS
50
75
25
5025
0
0
149o
60o
60o
154o
63o
152o
146o
63o
Study Unit
ALASKA
National Parks
National Wildlife Refuge
Spruce Bark Beetle Infestation
Logged Areas
EXPLANATION
Su
sitn
a R
ive
r
Kenai River
K E
N A
I
P E
N I
N S
U L
A
JohnsonRiver
Swanso
n Rive
r
Chugach National Forest
Glaciers
Water-Quality Assessment of the
Cook Inlet Basin, Alaska—Environmental Setting
By Timothy P. Brabets, Gordon L. Nelson, Joseph M. Dorava, and Alexander M. Milner
eses-r
l
-t-or),isir-
ren.nde
s aton-z-al
rhent,
orfetr,s
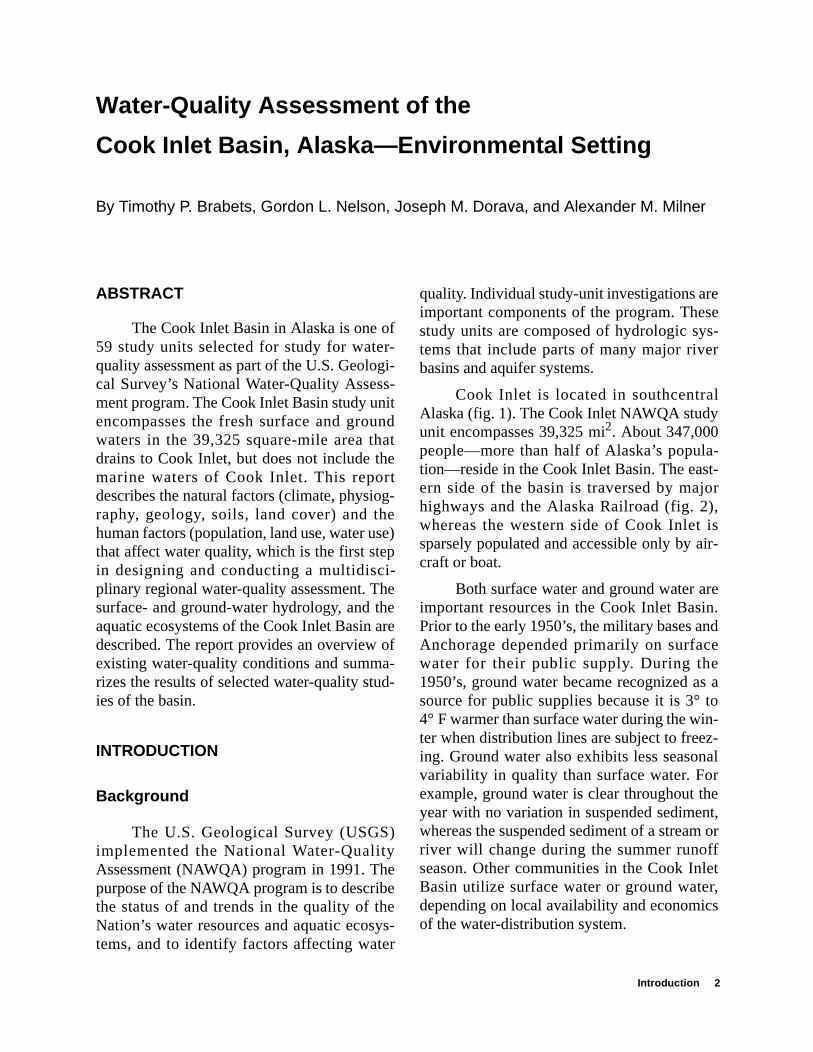
ABSTRACT
The Cook Inlet Basin in Alaska is one of59 study units selected for study for water-quality assessment as part of the U.S. Geologi-cal Survey’s National Water-Quality Assess-ment program. The Cook Inlet Basin study unitencompasses the fresh surface and groundwaters in the 39,325 square-mile area thatdrains to Cook Inlet, but does not include themarine waters of Cook Inlet. This reportdescribes the natural factors (climate, physiog-raphy, geology, soils, land cover) and thehuman factors (population, land use, water use)that affect water quality, which is the first stepin designing and conducting a multidisci-plinary regional water-quality assessment. Thesurface- and ground-water hydrology, and theaquatic ecosystems of the Cook Inlet Basin aredescribed. The report provides an overview ofexisting water-quality conditions and summa-rizes the results of selected water-quality stud-ies of the basin.
INTRODUCTION
Background
The U.S. Geological Survey (USGS)implemented the National Water-QualityAssessment (NAWQA) program in 1991. Thepurpose of the NAWQA program is to describethe status of and trends in the quality of theNation’s water resources and aquatic ecosys-tems, and to identify factors affecting water
quality. Individual study-unit investigations arimportant components of the program. Thestudy units are composed of hydrologic sytems that include parts of many major rivebasins and aquifer systems.
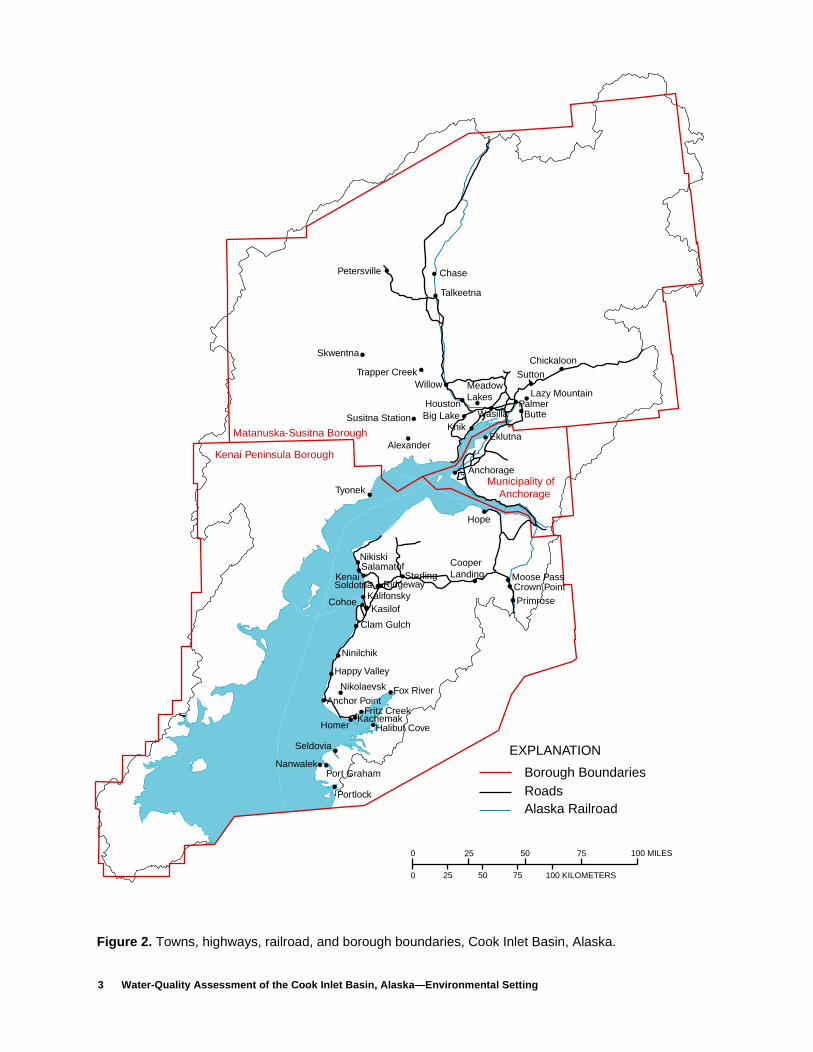
Cook Inlet is located in southcentraAlaska (fig. 1). The Cook Inlet NAWQA studyunit encompasses 39,325 mi2. About 347,000people—more than half of Alaska’s population—reside in the Cook Inlet Basin. The easern side of the basin is traversed by majhighways and the Alaska Railroad (fig. 2whereas the western side of Cook Inlet sparsely populated and accessible only by acraft or boat.
Both surface water and ground water aimportant resources in the Cook Inlet BasiPrior to the early 1950’s, the military bases aAnchorage depended primarily on surfacwater for their public supply. During the1950’s, ground water became recognized asource for public supplies because it is 3° 4° F warmer than surface water during the witer when distribution lines are subject to freeing. Ground water also exhibits less seasonvariability in quality than surface water. Foexample, ground water is clear throughout tyear with no variation in suspended sedimewhereas the suspended sediment of a streamriver will change during the summer runofseason. Other communities in the Cook InlBasin utilize surface water or ground watedepending on local availability and economicof the water-distribution system.
Introduction 2
3 Water-Quality Assessment of the Cook Inlet Basin, Alaska—Environmental Setting
Figure 2. Towns, highways, railroad, and borough boundaries, Cook Inlet Basin, Alaska.
0
0 25
25
50
50
75
75
100 KILOMETERS
100 MILES
Matanuska-Susitna Borough
Kenai Peninsula Borough
Municipality of Anchorage
Sutton
Chickaloon
Lazy MountainPalmer
ButteWasilla
Meadow Lakes
EklutnaKnik
Big LakeHouston
WillowTrapper Creek
Skwentna
Talkeetna
Chase
Alexander
Tyonek
Anchorage
Hope
PrimroseCrown PointMoose Pass
CooperLanding
Clam Gulch
KasilofCohoe
Kalifonsky
SterlingKenaiSalamatofNikiski
RidgewaySoldotna
Ninilchik
Happy Valley
Fox RiverNikolaevsk
Anchor PointFritz Creek
Halibut CoveHomerKachemak
Seldovia
Port Graham
Portlock
Nanwalek
Petersville
Susitna Station
Borough BoundariesRoadsAlaska Railroad
EXPLANATION
s,r--s
l-nyiredh
ink
stinayssesod
yl,ynd-
r-s,et,ce-he
dnar.ets-ofntt
nt
Purpose and Scope
The purpose of the Cook Inlet NAWQAstudy is to (1) describe the status of and trendsin the quality of water resources within theCook Inlet Basin and (2) provide an under-standing of factors affecting water quality andaquatic ecosystems. Geographic and seasonaldistribution of water quality, aquatic biota, andaquatic habitat conditions in relation to anthro-pogenic activities, as well as natural featureswill be determined. These characteristics alsoare important from a national perspective,because one of the primary objectives of theNAWQA program is to describe the quality ofthe Nation’s water resources.
The purpose of this report is to describthe environmental setting of the Cook InleNAWQA study unit. The scope includes thphysical, hydrologic, and aquatic-biologicacharacteristics of the freshwater streams thflow into Cook Inlet, and how these characteistics affect or are affected by water qualitMajor aquifers and their properties are idenfied. Baseline and historical information is useto describe what is currently known about thwater quality of Cook Inlet. Future reports wiaddress specific water-quality issues and pcesses controlling and affecting water qualitythe study area. The marine waters of Cook Inare not considered part of the Cook InlNAWQA and are not discussed in this report
The description of the environmental seting of the study unit is based on a review currently available reports and data from Feeral, State and local agencies. Many repoabout various subjects specific to Cook Inlhave been written. However, it is beyond thscope of this report to detail every one; thuonly general reports and USGS reports aused. As reports dealing with specific topics the Cook Inlet NAWQA study are writtenmore thorough literature searches will bundertaken to obtain all relevant information.
et
elatr-y.ti-de
llro- inletet.
t-ofd-rtsetes,reof,e
Water-Quality Issues
The water quality of the streams, riverand aquifers in the Cook Inlet Basin is detemined by different combinations of natural factors and human activities. Natural factorinfluencing water quality include climate, geoogy, vegetation, soils, and physiography. Maof the rivers in the Cook Inlet Basin have theheadwaters in mountainous terrain unaffectby man, and contain abundant water of higquality. Most settlement in the Cook Inlet Basis in the lowlands along the shores of CooInlet and in the lower alluvial valleys, and moof the human impact on water quality occurs these areas. Contamination of these waterwand aquifers has the potential to alter water uand biological cycles and is of concern taffected consumers, recreationists, anresource managers.
An adequate description of water qualitincludes the integration of physical, chemicaand biological components. Water-qualitissues can be viewed from both national aAlaska perspectives. From the national viewpoint, Cook Inlet offers the opportunity to chaacterize water quality in undeveloped areawhich is not possible in most parts of thUnited States. From the Alaska viewpoinmany believe that development can take plawithout degradation of water quality. A common theme is that “Alaska is where we have tlast chance to do it right the first time.”
The Cook Inlet NAWQA program willfocus on how the following natural factors anhuman activities influence water quality igeneral and the salmon fisheries in particulThese particular elements of the Cook InlNAWQA were based on internal discussionwith NAWQA personnel and on external discussions with a liaison committee consisting Federal, State, and local water-managemeand water-quality agencies. Cook InleNAWQA personnel will continue to meet withthe liaison committee twice a year to presefindings on various aspects of the program.
Introduction 4
ndsi-r-ig.todi-
ia,c-d
)alro-thes
ale,a
ni--ialille-
Natural Factors
The Cook Inlet Basin has moderate tohigh annual precipitation (Jones and Fahl,1994). In the mountainous areas, which areunaffected by man, the water quality is con-trolled by factors such as the geology, soils, andvegetation. Dissolved-solids concentrationsrange from 33 to 185 mg/L (U.S. GeologicalSurvey, 1959-96), which indicates that concen-trations of ions, such as calcium and sulfate, arebelow drinking-water standards. The limitednitrogen and phosphorus data also indicatedthat nutrient concentrations in the naturalwaters are comparable with background con-centrations found in water in the conterminous48 states of the U.S. (Mueller and Helsel,1996). Thus, the chemical quality of most sur-face water throughout the basin is consideredgood and is suitable for most uses.
Natural suspended-sediment concentra-tions are highly variable in Cook Inlet streamsand rivers. Sediment concentration is sensitiveto increases in streamflow. For example, duringlow-flow periods in winter, suspended-sedi-ment concentrations commonly are less than 10mg/L, but during high-flow periods mayincrease to more than 1,000 mg/L (Knott andothers, 1987). If a stream or river is fed by gla-cial meltwater, relatively high suspended-sedi-ment concentrations will remain for longerperiods, particularly in mid- to late summer.Regardless of whether or not a stream is glacierfed, most sediment transport will occur duringthe open-water period, from May to September.
Large floods, including those caused byvolcanic eruptions, have occurred at irregularintervals in all parts of the Cook Inlet Basin.These floods typically cause massive erosionand can deliver anomalously large loads of sed-iment. The effects of erosion or deposition oflarge amounts of sediment in streambeds can bedetrimental to fish spawning. Floods through-out the Cook Inlet Basin have been caused pri-marily by large rainstorms occurring in August
or September.
A unique characteristic of the Cook InletNAWQA is the large area of national parks andwildlife refuges in the basin (fig. 1). These Fed-eral lands are unlikely to be developed, exceptfor some Native inholdings. Collection of base-line data in these areas offers the possibility toexamine trends through time and how naturalconditions affect water quality.
Human Activities
Human activities can contribute contami-nants to surface and ground water in the CookInlet Basin through both point and nonpointsource pathways. The primary human activitiesthat have led or can lead to degradation of waterquality are summarized here:
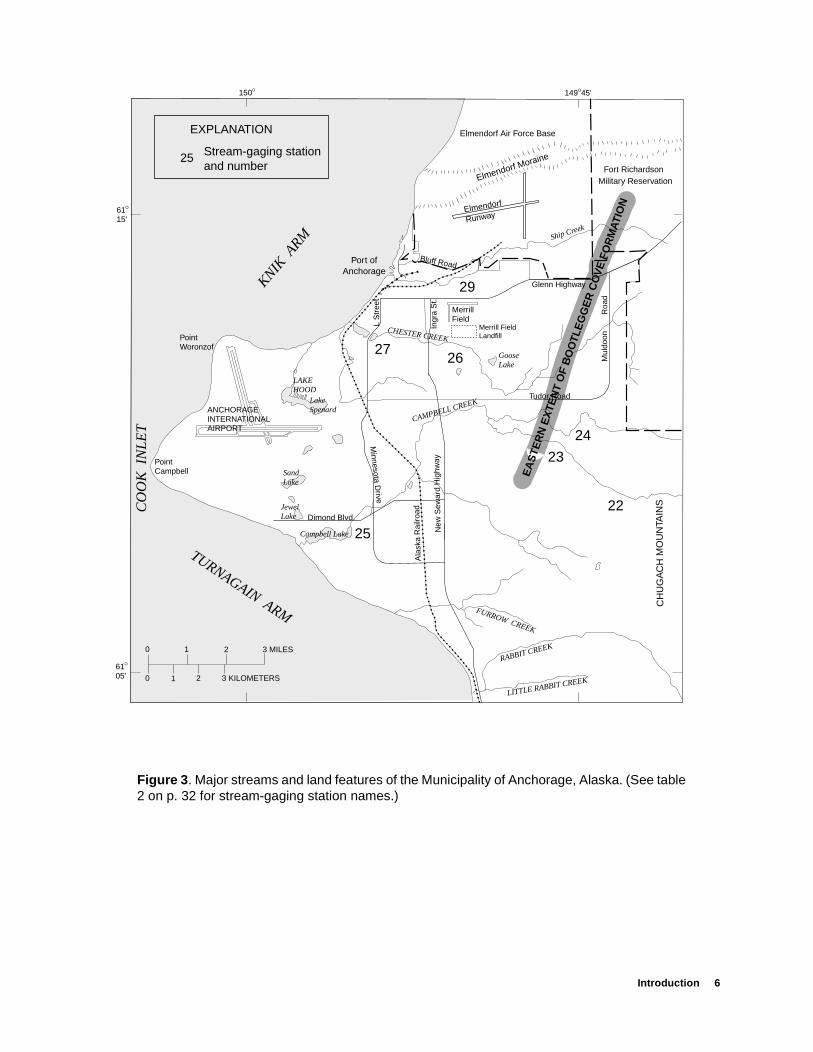
Residential development—Previousstudies by Brabets and Wittenberg (1983) aBrabets (1987) documented the effects of redential development in two streams in Anchoage: Campbell Creek and Chester Creek (f3). Residential development has led increases in concentrations of suspended sement, trace elements, fecal coliform bacterand dissolved constituents. Brunett (1990) doumented the movement of contaminateground water from Merrill Field landfill (fig. 3)in Anchorage. Milner and Oswood (1990described the adverse impacts on biologiccommunities in the lakes and streams. Petleum hydrocarbons also have been found in bottom materials of one lake in Anchorage. Aa result, the fisheries of some of the locstreams have been affected. At the present timthe Wasilla–Palmer and the Kenai–Soldotnareas (fig. 2) are the fastest growing commuties in the Cook Inlet Basin. A thorough investigation of the causes and effects of residentdevelopment on water quality and fisheries whelp planners minimize the effects of futurresidential development in the growing communities.
5 Water-Quality Assessment of the Cook Inlet Basin, Alaska—Environmental Setting
Introduction 6
Figure 3. Major streams and land features of the Municipality of Anchorage, Alaska. (See table2 on p. 32 for stream-gaging station names.)
Elmendorf Moraine
Port ofAnchorage
Fort RichardsonMilitary Reservation
Elmendorf Air Force Base
EA
STE
RN
EX
TEN
T O
F B
OO
TLE
GG
ER
CO
VE
FO
RM
ATIO
N
29
2627
24
23
22
25
Elmendorf
Runway
Merrill FieldLandfill
KNIK A
RM
CO
OK
IN
LE
T
TURNAGAIN ARMFURROW CREEK
RABBIT CREEK
LITTLE RABBIT CREEK
CAMPBELL CREEK
LAKEHOOD
LakeSpenard
SandLake
JewelLake
Campbell Lake
GooseLake
CH
UG
AC
H M
OU
NTA
INS
New
Sew
ard
Hig
hway
Ala
ska
Rai
lroad
Dimond Blvd.
Minnesota D
rive
Tudor Road
MerrillField
L S
tree
t
Mul
doon
Ingr
a S
t.
Roa
d
Bluff Road
Glenn Highway
PointWoronzof
PointCampbell
ANCHORAGEINTERNATIONALAIRPORT
0
0
1
1 2
2 3 MILES
3 KILOMETERS
61O
05'
61O
15'
149O45'
Ship Creek
150O
CHESTER CREEK
25
EXPLANATION
Stream-gaging station and number
icsvendfesln-s,
as a
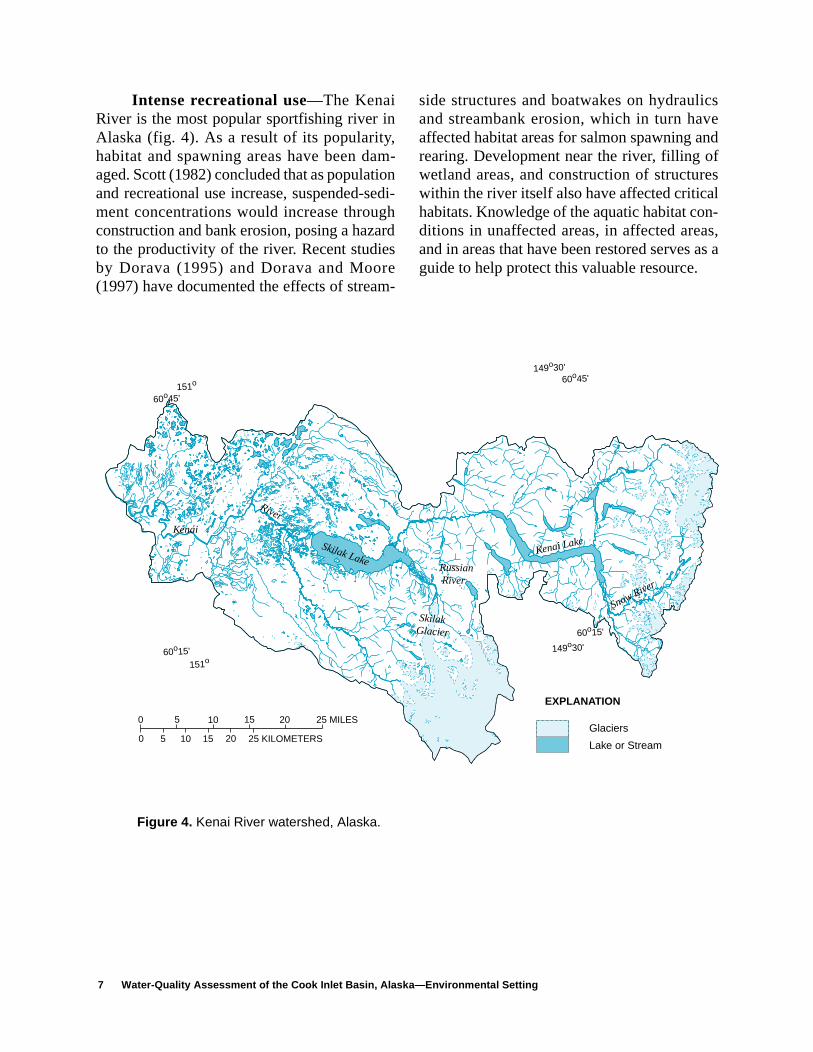
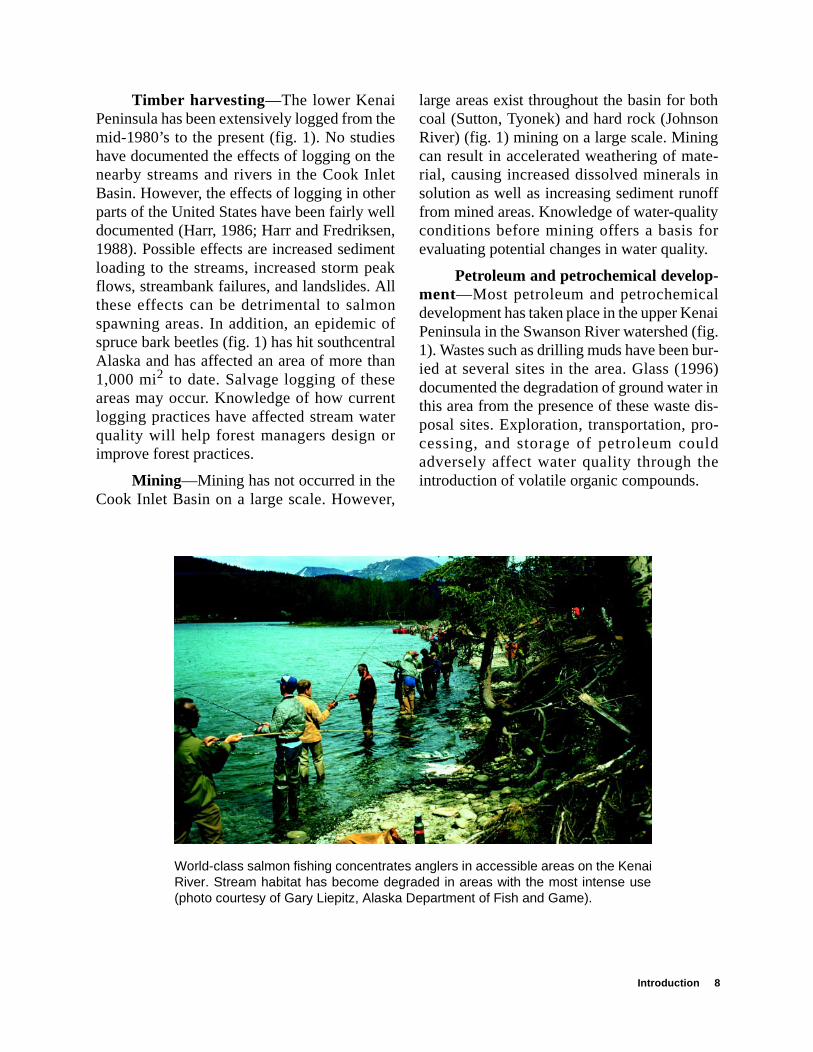
Intense recreational use—The KenaiRiver is the most popular sportfishing river inAlaska (fig. 4). As a result of its popularity,habitat and spawning areas have been dam-aged. Scott (1982) concluded that as populationand recreational use increase, suspended-sedi-ment concentrations would increase throughconstruction and bank erosion, posing a hazardto the productivity of the river. Recent studiesby Dorava (1995) and Dorava and Moore(1997) have documented the effects of stream-
side structures and boatwakes on hydrauland streambank erosion, which in turn haaffected habitat areas for salmon spawning arearing. Development near the river, filling owetland areas, and construction of structurwithin the river itself also have affected criticahabitats. Knowledge of the aquatic habitat coditions in unaffected areas, in affected areaand in areas that have been restored servesguide to help protect this valuable resource.
7 Water-Quality Assessment of the Cook Inlet Basin, Alaska—Environmental Setting
Figure 4. Kenai River watershed, Alaska.
EXPLANATION
Glaciers
Lake or Stream
0
0
5
5 10
10
15
15
20
20
25 KILOMETERS
25 MILES
Kenai
River
Skilak LakeKenai Lake
Snow RiverRussian River
Skilak Glacier
60o15'
60o15'
149o30'
151o
60o45'151o 60o45'
149o30'
thon
te-inff
tyr
.
lnaiig.ur-6)
indis-o-lde
Timber harvesting—The lower KenaiPeninsula has been extensively logged from themid-1980’s to the present (fig. 1). No studieshave documented the effects of logging on thenearby streams and rivers in the Cook InletBasin. However, the effects of logging in otherparts of the United States have been fairly welldocumented (Harr, 1986; Harr and Fredriksen,1988). Possible effects are increased sedimentloading to the streams, increased storm peakflows, streambank failures, and landslides. Allthese effects can be detrimental to salmonspawning areas. In addition, an epidemic ofspruce bark beetles (fig. 1) has hit southcentralAlaska and has affected an area of more than1,000 mi2 to date. Salvage logging of theseareas may occur. Knowledge of how currentlogging practices have affected stream waterquality will help forest managers design orimprove forest practices.
Mining—Mining has not occurred in theCook Inlet Basin on a large scale. However,
large areas exist throughout the basin for bocoal (Sutton, Tyonek) and hard rock (JohnsRiver) (fig. 1) mining on a large scale. Miningcan result in accelerated weathering of marial, causing increased dissolved minerals solution as well as increasing sediment runofrom mined areas. Knowledge of water-qualiconditions before mining offers a basis foevaluating potential changes in water quality
Petroleum and petrochemical develop-ment—Most petroleum and petrochemicadevelopment has taken place in the upper KePeninsula in the Swanson River watershed (f1). Wastes such as drilling muds have been bied at several sites in the area. Glass (199documented the degradation of ground waterthis area from the presence of these waste posal sites. Exploration, transportation, prcessing, and storage of petroleum couadversely affect water quality through thintroduction of volatile organic compounds.
Introduction 8
World-class salmon fishing concentrates anglers in accessible areas on the KenaiRiver. Stream habitat has become degraded in areas with the most intense use(photo courtesy of Gary Liepitz, Alaska Department of Fish and Game).
y
in-i-r
of
n by-
ford
Insteais,
ostev-t,t ben-
m-tna
nisitd
.
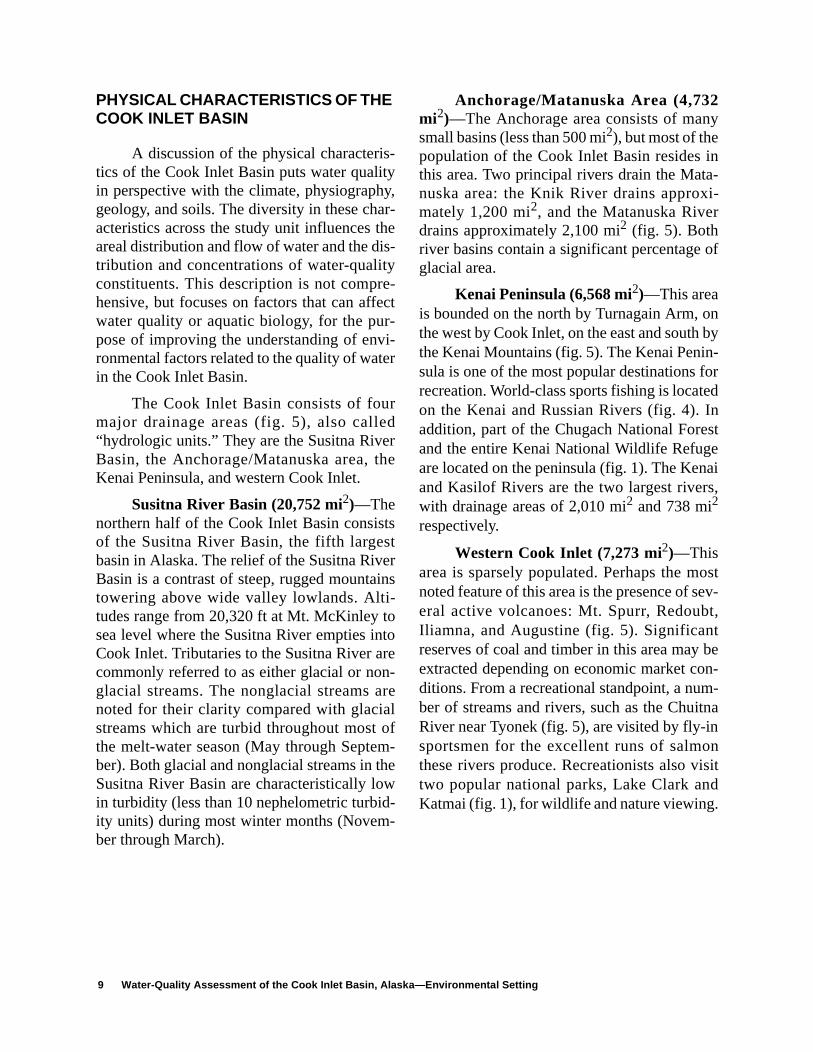
PHYSICAL CHARACTERISTICS OF THE COOK INLET BASIN
A discussion of the physical characteris-tics of the Cook Inlet Basin puts water qualityin perspective with the climate, physiography,geology, and soils. The diversity in these char-acteristics across the study unit influences theareal distribution and flow of water and the dis-tribution and concentrations of water-qualityconstituents. This description is not compre-hensive, but focuses on factors that can affectwater quality or aquatic biology, for the pur-pose of improving the understanding of envi-ronmental factors related to the quality of waterin the Cook Inlet Basin.
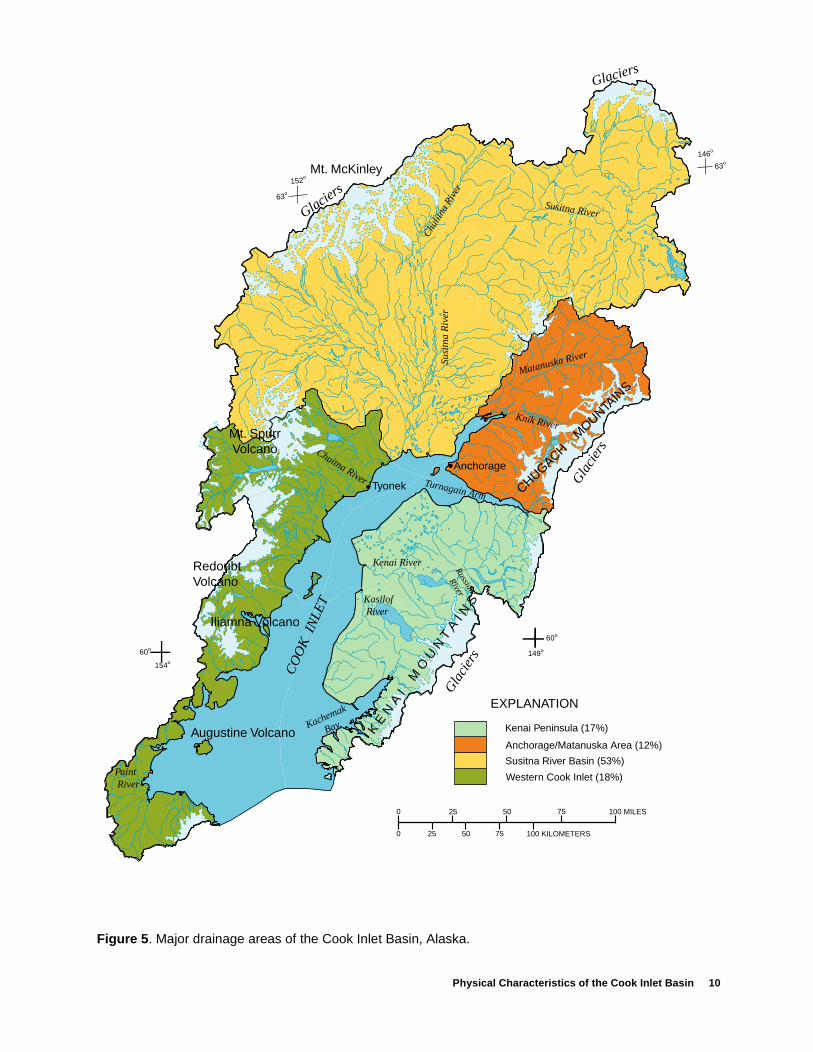
The Cook Inlet Basin consists of fourmajor drainage areas (fig. 5), also called“hydrologic units.” They are the Susitna RiverBasin, the Anchorage/Matanuska area, theKenai Peninsula, and western Cook Inlet.
Susitna River Basin (20,752 mi2)—Thenorthern half of the Cook Inlet Basin consistsof the Susitna River Basin, the fifth largestbasin in Alaska. The relief of the Susitna RiverBasin is a contrast of steep, rugged mountainstowering above wide valley lowlands. Alti-tudes range from 20,320 ft at Mt. McKinley tosea level where the Susitna River empties intoCook Inlet. Tributaries to the Susitna River arecommonly referred to as either glacial or non-glacial streams. The nonglacial streams arenoted for their clarity compared with glacialstreams which are turbid throughout most ofthe melt-water season (May through Septem-ber). Both glacial and nonglacial streams in theSusitna River Basin are characteristically lowin turbidity (less than 10 nephelometric turbid-ity units) during most winter months (Novem-ber through March).
Anchorage/Matanuska Area (4,732mi2)—The Anchorage area consists of mansmall basins (less than 500 mi2), but most of thepopulation of the Cook Inlet Basin resides this area. Two principal rivers drain the Matanuska area: the Knik River drains approxmately 1,200 mi2, and the Matanuska Rivedrains approximately 2,100 mi2 (fig. 5). Bothriver basins contain a significant percentageglacial area.
Kenai Peninsula (6,568 mi2)—This areais bounded on the north by Turnagain Arm, othe west by Cook Inlet, on the east and souththe Kenai Mountains (fig. 5). The Kenai Peninsula is one of the most popular destinations recreation. World-class sports fishing is locateon the Kenai and Russian Rivers (fig. 4). addition, part of the Chugach National Foreand the entire Kenai National Wildlife Refugare located on the peninsula (fig. 1). The Kenand Kasilof Rivers are the two largest riverwith drainage areas of 2,010 mi2 and 738 mi2
respectively.
Western Cook Inlet (7,273 mi2)—Thisarea is sparsely populated. Perhaps the mnoted feature of this area is the presence of seral active volcanoes: Mt. Spurr, RedoubIliamna, and Augustine (fig. 5). Significanreserves of coal and timber in this area mayextracted depending on economic market coditions. From a recreational standpoint, a nuber of streams and rivers, such as the ChuiRiver near Tyonek (fig. 5), are visited by fly-insportsmen for the excellent runs of salmothese rivers produce. Recreationists also vtwo popular national parks, Lake Clark anKatmai (fig. 1), for wildlife and nature viewing
9 Water-Quality Assessment of the Cook Inlet Basin, Alaska—Environmental Setting
Physical Characteristics of the Cook Inlet Basin 10
Figure 5. Major drainage areas of the Cook Inlet Basin, Alaska.
Anchorage
Tyonek
100 MILES75
100 KILOMETERS
50
75
25
5025
0
0
149o
60o
60o
154o
63o
152o
146o
63o
Mt. SpurrVolcano
RedoubtVolcano
Iliamna Volcano
Augustine Volcano
Mt. McKinley
Kenai Peninsula (17%)
Anchorage/Matanuska Area (12%)
Susitna River Basin (53%)
Western Cook Inlet (18%)
EXPLANATION
K E
N A I
M
O U
N T
A I
N S
CHUGACH M
OUNTAIN
S
Kenai River
Su
sitn
a R
ive
r
Kasilof River
Knik River
Matanuska River
Susitna River
Chu
litna
Riv
er
CO
OK
IN
LET
Gla
cier
s
Gla
cier
s
Glaciers
Glaciers
Chuitna River Turnagain Arm
Paint River
Kachemak
Bay
Russian
River
).re-t-at-aslsw,
in
rtee
sre
Climate
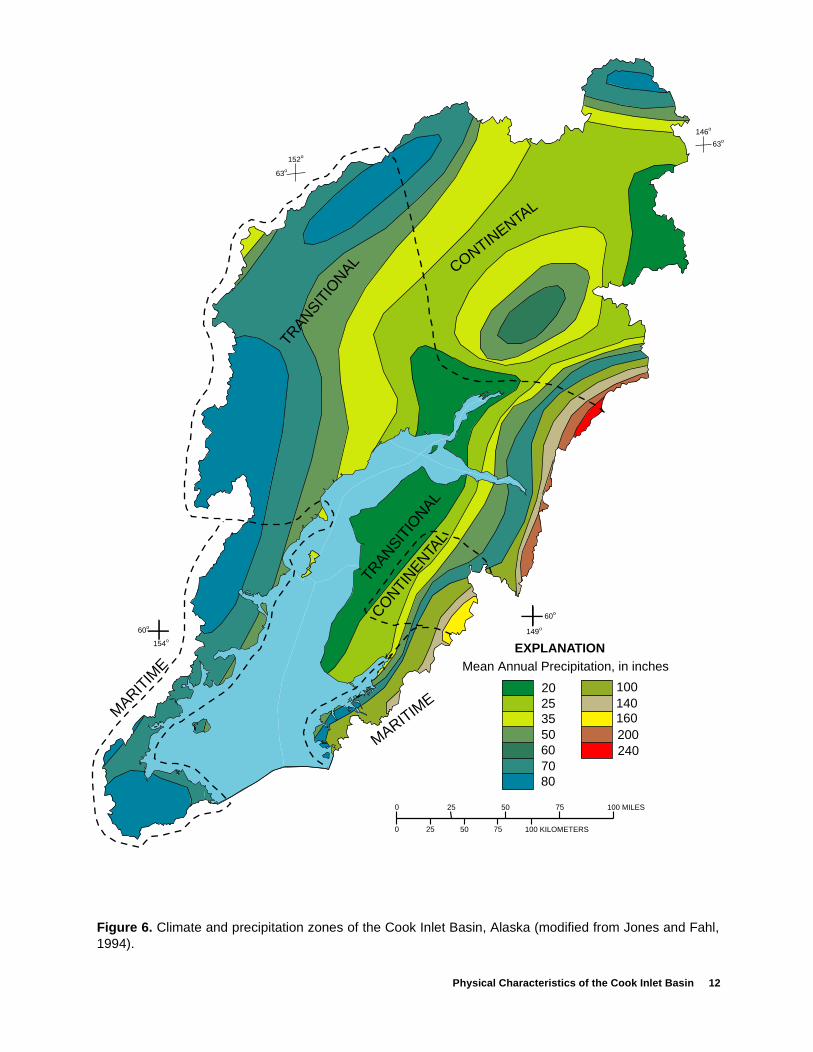
The Cook Inlet Basin has three climatezones because of its large size and range in alti-tude of the land surface. Climate zones havebeen broadly defined primarily by variations inprecipitation and temperature (Searby, 1968;Hartman and Johnson, 1978). The ContinentalZone (fig. 6) is characterized by an averageannual precipitation of about 20 in. and an aver-age temperature of about 22 °F. Temperatureextremes are greater in the Continental Zonethan in the other climatic zones. Averageannual precipitation in the Transition Zone isabout 30 in. and temperatures average about 27°F. The Maritime Zone is extremely wet rela-tive to the other climatic zones; average annualprecipitation is about 70 in. and average annualtemperatures are about 42 °F. This zone lacksprolonged periods of freezing weather at lowaltitudes and is characterized by frequentclouds and fog.
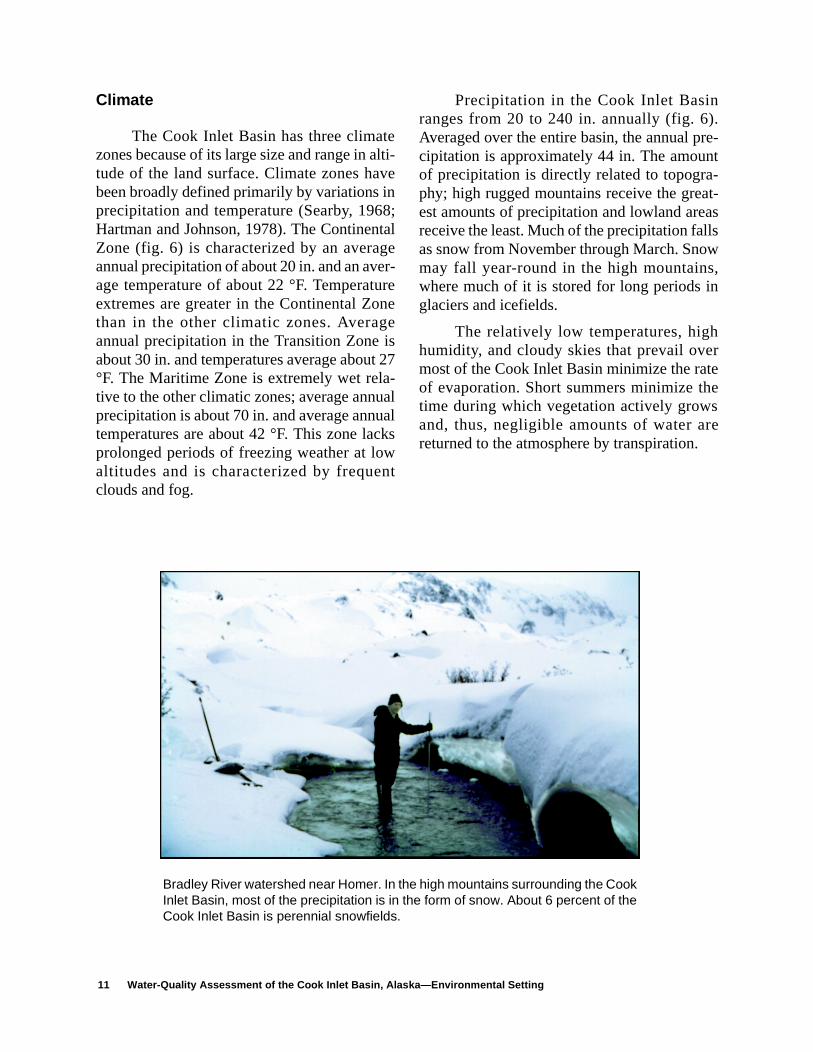
Precipitation in the Cook Inlet Basinranges from 20 to 240 in. annually (fig. 6Averaged over the entire basin, the annual pcipitation is approximately 44 in. The amounof precipitation is directly related to topography; high rugged mountains receive the greest amounts of precipitation and lowland arereceive the least. Much of the precipitation falas snow from November through March. Snomay fall year-round in the high mountainswhere much of it is stored for long periods glaciers and icefields.
The relatively low temperatures, highhumidity, and cloudy skies that prevail ovemost of the Cook Inlet Basin minimize the raof evaporation. Short summers minimize thtime during which vegetation actively growand, thus, negligible amounts of water areturned to the atmosphere by transpiration.
11 Water-Quality Assessment of the Cook Inlet Basin, Alaska—Environmental Setting
Bradley River watershed near Homer. In the high mountains surrounding the CookInlet Basin, most of the precipitation is in the form of snow. About 6 percent of theCook Inlet Basin is perennial snowfields.
Physical Characteristics of the Cook Inlet Basin 12
Figure 6. Climate and precipitation zones of the Cook Inlet Basin, Alaska (modified from Jones and Fahl,1994).
100 MILES75
100 KILOMETERS
50
75
25
5025
0
0
149o
60o
60o
154o
20253550607080
100140160200240
Mean Annual Precipitation, in inchesEXPLANATION
63o
152o
63o
146o
CONTINENTA
L
CONTI
NENTAL
MARITIME
MARIT
IME
TRANSIT
IONAL
TRANSIT
IONAL
ndhe
dlinhenddisen-n-af
edaksth.
ede,p-
e,henaaatw-naes
-
el-y,
alaset
hey
Physiography
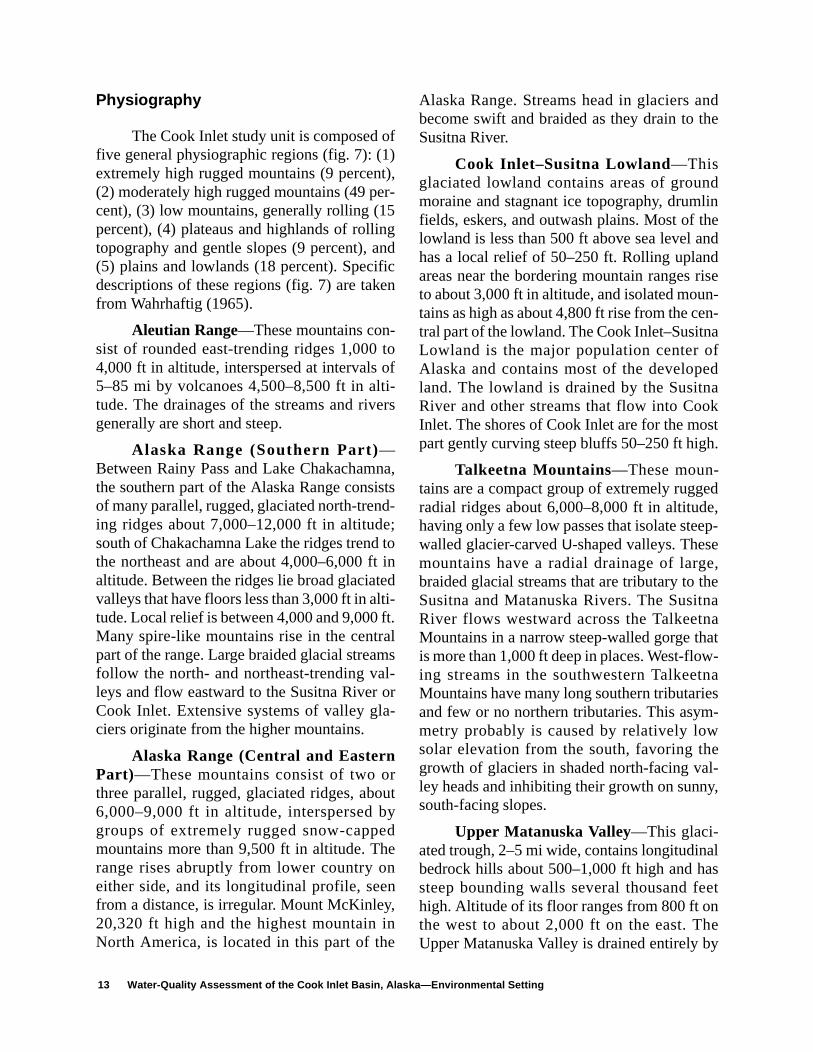
The Cook Inlet study unit is composed offive general physiographic regions (fig. 7): (1)extremely high rugged mountains (9 percent),(2) moderately high rugged mountains (49 per-cent), (3) low mountains, generally rolling (15percent), (4) plateaus and highlands of rollingtopography and gentle slopes (9 percent), and(5) plains and lowlands (18 percent). Specificdescriptions of these regions (fig. 7) are takenfrom Wahrhaftig (1965).
Aleutian Range—These mountains con-sist of rounded east-trending ridges 1,000 to4,000 ft in altitude, interspersed at intervals of5–85 mi by volcanoes 4,500–8,500 ft in alti-tude. The drainages of the streams and riversgenerally are short and steep.
Alaska Range (Southern Part)—Between Rainy Pass and Lake Chakachamna,the southern part of the Alaska Range consistsof many parallel, rugged, glaciated north-trend-ing ridges about 7,000–12,000 ft in altitude;south of Chakachamna Lake the ridges trend tothe northeast and are about 4,000–6,000 ft inaltitude. Between the ridges lie broad glaciatedvalleys that have floors less than 3,000 ft in alti-tude. Local relief is between 4,000 and 9,000 ft.Many spire-like mountains rise in the centralpart of the range. Large braided glacial streamsfollow the north- and northeast-trending val-leys and flow eastward to the Susitna River orCook Inlet. Extensive systems of valley gla-ciers originate from the higher mountains.
Alaska Range (Central and EasternPart)—These mountains consist of two orthree parallel, rugged, glaciated ridges, about6,000–9,000 ft in altitude, interspersed bygroups of extremely rugged snow-cappedmountains more than 9,500 ft in altitude. Therange rises abruptly from lower country oneither side, and its longitudinal profile, seenfrom a distance, is irregular. Mount McKinley,20,320 ft high and the highest mountain inNorth America, is located in this part of the
Alaska Range. Streams head in glaciers abecome swift and braided as they drain to tSusitna River.
Cook Inlet–Susitna Lowland—Thisglaciated lowland contains areas of grounmoraine and stagnant ice topography, drumfields, eskers, and outwash plains. Most of tlowland is less than 500 ft above sea level ahas a local relief of 50–250 ft. Rolling uplanareas near the bordering mountain ranges rto about 3,000 ft in altitude, and isolated moutains as high as about 4,800 ft rise from the cetral part of the lowland. The Cook Inlet–SusitnLowland is the major population center oAlaska and contains most of the developland. The lowland is drained by the SusitnRiver and other streams that flow into CooInlet. The shores of Cook Inlet are for the mopart gently curving steep bluffs 50–250 ft hig
Talkeetna Mountains—These moun-tains are a compact group of extremely ruggradial ridges about 6,000–8,000 ft in altitudhaving only a few low passes that isolate steewalled glacier-carved U-shaped valleys. Thesemountains have a radial drainage of largbraided glacial streams that are tributary to tSusitna and Matanuska Rivers. The SusitRiver flows westward across the TalkeetnMountains in a narrow steep-walled gorge this more than 1,000 ft deep in places. West-floing streams in the southwestern TalkeetMountains have many long southern tributariand few or no northern tributaries. This asymmetry probably is caused by relatively lowsolar elevation from the south, favoring thgrowth of glaciers in shaded north-facing valey heads and inhibiting their growth on sunnsouth-facing slopes.
Upper Matanuska Valley—This glaci-ated trough, 2–5 mi wide, contains longitudinbedrock hills about 500–1,000 ft high and hsteep bounding walls several thousand fehigh. Altitude of its floor ranges from 800 ft onthe west to about 2,000 ft on the east. TUpper Matanuska Valley is drained entirely b
13 Water-Quality Assessment of the Cook Inlet Basin, Alaska—Environmental Setting
Physical Characteristics of the Cook Inlet Basin 14
Figure 7. Physiographic regions of the Cook Inlet Basin, Alaska (modified from Wahrhaftig, 1965).
100 MILES75
100 KILOMETERS
50
75
25
5025
0
0
Extremely high rugged mountains (9%)
Moderately high rugged mountains (49%)
Low mountains, generally rolling (15%)Plateaus and highlands of rolling topography and gentle slopes (9%)Plains and lowlands (18%)
EXPLANATION
Matanuska
Glacier
GulkanaUpland
Upper Matanuska
Copper RiverLowland
ValleyCook Inlet-
Susitna Lowland
Mt.McKinley
Rainy Pass
63o
146o
63o
152o
60o
154o
149o
60o
K E
N A I
M
O U
N T
A I
N S
CHUGACH M
OUNTAIN
S
ALASKA
RANGE
(Cen
tral &
Eas
tern P
art)
ALA
SK
A
RA
NG
E
(Sou
ther
n Pa
rt)
ALEU
TIAN
RAN
GE
TALKEETNAMOUNTAINS
Lake Louise
Chakachamna Lake
Matanuska River
CO
OK
IN
LET
utn-mihethe
since
ebyofr-epto-Aatis-s.ntd
r atk
the Matanuska River, which flows westwardalong the trough. Matanuska Glacier is locatedat the east end of the trough.
Gulkana Upland—This upland consistsof rounded east-trending ridges separated bylowlands 2–10 mi wide. The ridge crests, about3,500–5,500 ft in altitude, are 4–15 mi apartand are cut at intervals of 5–15 mi by notchesand gaps that were eroded by glaciers or glacialmelt water. The lowlands have floors of glacialdeposits showing morainal and stagnant-icetopography and contain large esker systems.Drainage is to the southwest to the SusitnaRiver.
Copper River Lowland—The westernpart of the Copper River Lowland is located inthe Cook Inlet Basin and is also referred to asthe “Lake Louise Plateau.” It is a smooth plainabout 2,200–3,500 ft in altitude, and hasmorainal and stagnant-ice topography. Drain-age is northwest to the Susitna River.
Kenai-Chugach Mountains—Thesemountains form a rugged barrier along thenorth coast of the Gulf of Alaska. High seg-ments of the mountains are dominated by
extremely rugged east-trending ridges abo7,000–13,000 ft in altitude. Low segments cosist of discrete massive mountains 5–10 across and about 3,000–6,000 ft in altitude. Tentire range has been heavily glaciated and topography is characterized by cirques, U-shaped valleys and passes, and rock-balakes. The drainage divide is generally an idivide along the highest ridges.
Geology
Water-quality characteristics of surfacwater and ground water are strongly affected surficial and bedrock geology. The geology the Cook Inlet Basin is complex and the intepretation of the geology is based on the concthat the Cook Inlet Basin is a mosaic of gelogic terranes (Silberling and others, 1994). terrane is a body of rock of regional extent this bounded by faults, and whose geologic htory is different from that of adjacent terraneThe terranes in the Cook Inlet Basin represeblocks of the Earth’s crust that have movelarge or small distances relative to each othedifferent times in the geologic past. In the Coo
15 Water-Quality Assessment of the Cook Inlet Basin, Alaska—Environmental Setting
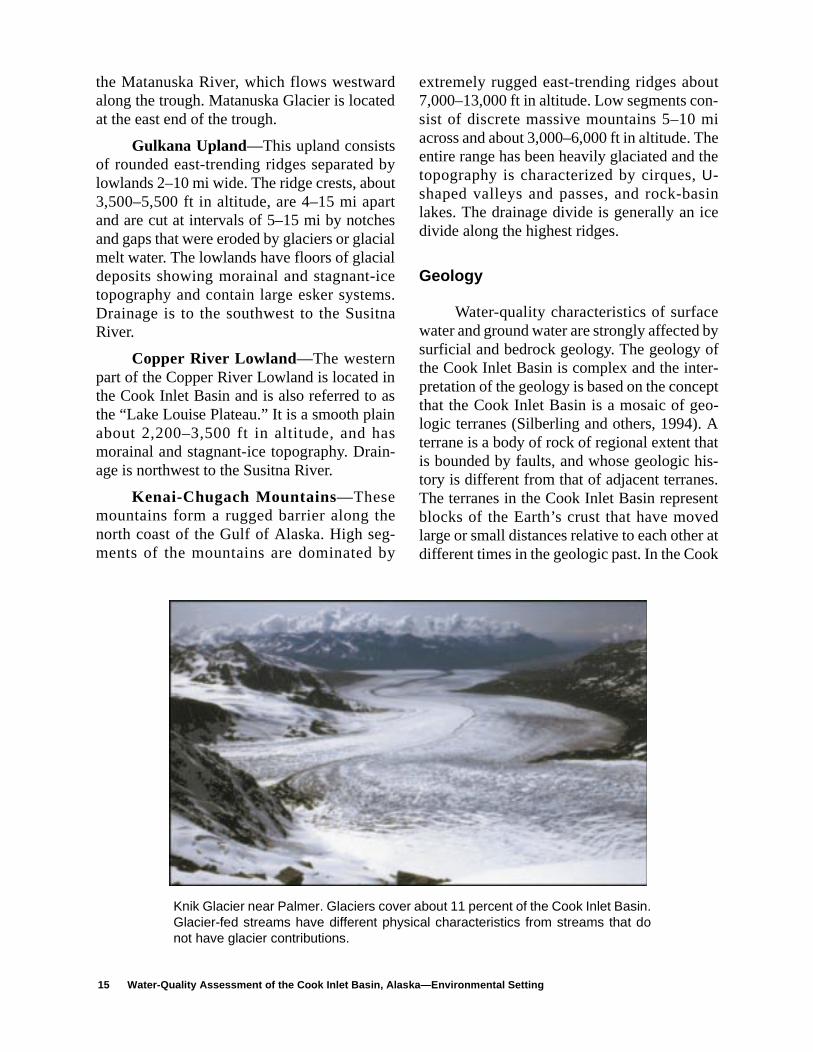
Knik Glacier near Palmer. Glaciers cover about 11 percent of the Cook Inlet Basin.Glacier-fed streams have different physical characteristics from streams that donot have glacier contributions.
Physical Characteristics of the Cook Inlet Basin 16
PHOTO
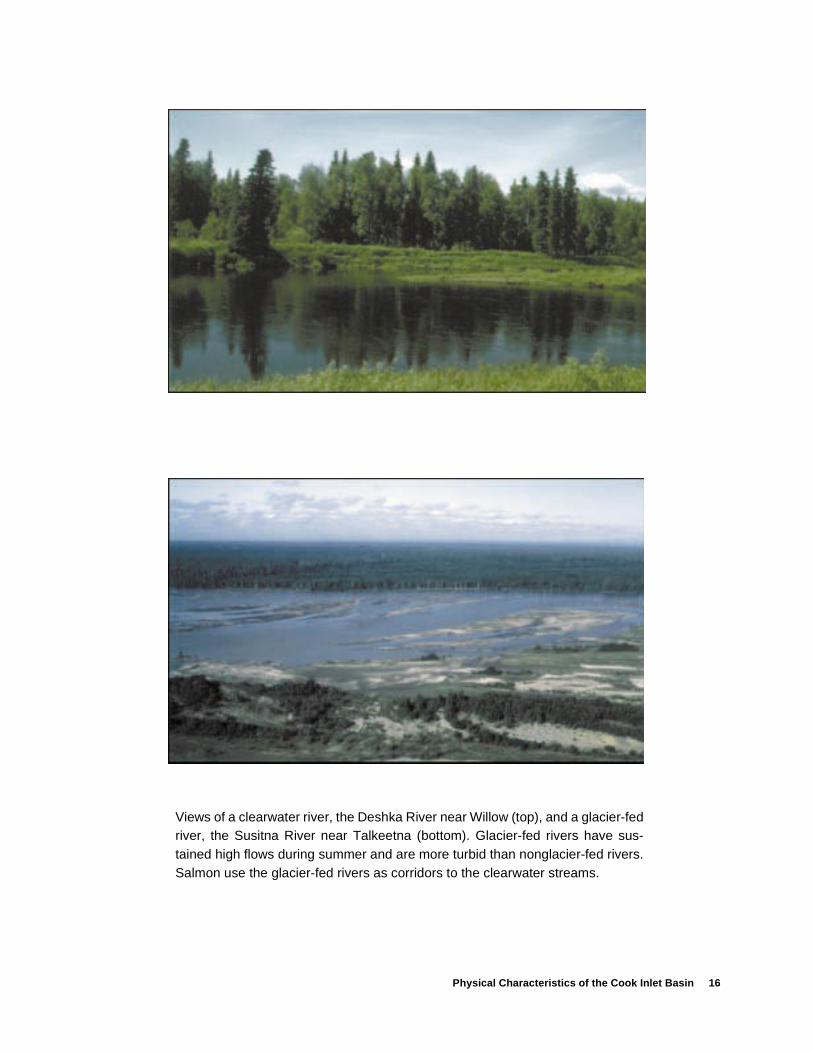
Views of a clearwater river, the Deshka River near Willow (top), and a glacier-fedriver, the Susitna River near Talkeetna (bottom). Glacier-fed rivers have sus-tained high flows during summer and are more turbid than nonglacier-fed rivers.Salmon use the glacier-fed rivers as corridors to the clearwater streams.
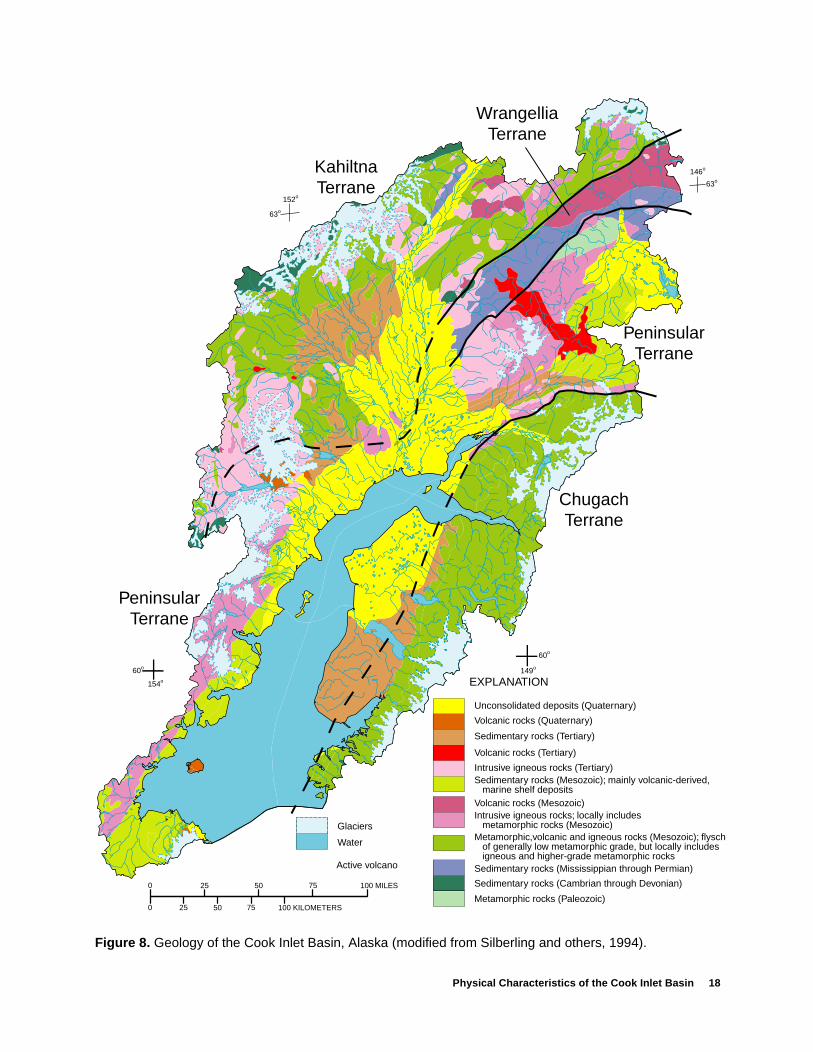
Inlet Basin, the four main terranes are Chugach,Peninsular, Kahiltna, and Wrangellia (fig. 8).
For the Cook Inlet Basin, the geologicmaterials are discussed in two categories: con-solidated rocks and unconsolidated deposits(fig. 8). The rocks range in age from Paleozoic(600 million years) to Holocene (the last10,000 years). Consolidated rocks crop out inthe mountain ranges surrounding the basin andconsist of sedimentary and metasedimentaryrocks, as well as intrusive and volcanic rocks.Glacial drift deposited during the PleistoceneEpoch by large valley glaciers mantles moun-tain flanks and adjacent lowland areas in mostof the mountain areas. Major deposits are asfollows:
Unconsolidated deposits of Quaternaryage are present in lowland areas throughout theCook Inlet Basin. Only thick accumulations ofthese deposits are shown. Deposits consist pri-marily of alluvium and glacial deposits, butalso include eolian and beach deposits. TheQuaternary-age sediments in the Cook InletBasin are the major aquifer of ground waternow being used. The thickness and grain size ofthese sediments are some of the principal fac-tors controlling the ground-water potential ofan area. As a general rule, the thicker the sedi-ments and larger the grain size, the better thechances that those sediments include a water-yielding unit (Freethey and Scully, 1980).
Sedimentary rocks of Tertiary age(Cenozoic) are found in the lower Kenai Penin-sula and the upper Susitna River Basin. Theserocks are composed primarily of sandstone,siltstone, and shale, but also contain amounts ofcoal, mudstone, and conglomerate.
Intrusive igneous rocks of Tertiary age(Cenozoic) are found in the southern part of theAlaska Range and in the Talkeetna Mountains.These rocks range in composition from gabbroto granite.
Sedimentary rocks, mainly volcani-clastic, marine shelf sediments of Mesozoicage are found in the southern part of the AlaskaRange, the Talkeetna Mountains, and the north-ern part of the Aleutian Range. These rocks aremostly shale, siltstone, and sandstone, butlocally include limestone.
Volcanic rocks of Mesozoic age arepresent in the Talkeetna Mountains. Thesedeposits range in composition from andesite tobasalt.
Intrusive igneous rocks of Mesozoicage are found in western Cook Inlet along thesouthern flank of the Alaska Range, and in theTalkeetna Mountains. These rocks are mostlyin upland and mountainous areas and range incomposition from granite to gabbro.
Volcanic and intrusive rocks of gener-ally low metamorphic grade of Mesozoic ageunderlie large parts of the Kenai-ChugachMountains. These rocks consist of greenstone,limestone, chert, granodiorite, schist, and lay-ered gabbro. Their contacts and extent areincompletely known because of glacial cover inmany places.
Sedimentary rocks of Mississippianthrough Permian ages (Paleozoic) occur inthe northern and eastern parts of the AlaskanRange and in the Talkeetna Mountains. Theserocks are mostly limestone, shale, siltstone, andsandstone, but include beds of conglomerate,dolomite, and chert. Locally, marble, argillite,and metasedimentary and metavolcanic rocksare mapped in this category.
Sedimentary rocks of Cambrianthrough Devonian ages (Paleozoic) are foundin the easternmost part of the Alaska Range andin the northern foothills that border that range.These rocks consist mostly of sandstone, shale,and siltstone, but also include beds of lime-stone, dolomite, and chert.
17 Water-Quality Assessment of the Cook Inlet Basin, Alaska—Environmental Setting
Physical Characteristics of the Cook Inlet Basin 18
Figure 8. Geology of the Cook Inlet Basin, Alaska (modified from Silberling and others, 1994).
100 MILES75
100 KILOMETERS
50
75
25
5025
0
0
63o
146o
63o
152o
60o
154o
149o
60o
EXPLANATION
ChugachTerrane
PeninsularTerrane
WrangelliaTerrane
Glaciers
Water
Unconsolidated deposits (Quaternary)
Sedimentary rocks (Tertiary)
Sedimentary rocks (Mesozoic); mainly volcanic-derived, marine shelf deposits
Sedimentary rocks (Mississippian through Permian)
Sedimentary rocks (Cambrian through Devonian)
Intrusive igneous rocks (Tertiary)
Volcanic rocks (Mesozoic)
Volcanic rocks (Tertiary)
Volcanic rocks (Quaternary)
Metamorphic rocks (Paleozoic)
Intrusive igneous rocks; locally includes metamorphic rocks (Mesozoic)
PeninsularTerrane
KahiltnaTerrane
Active volcano
Metamorphic,volcanic and igneous rocks (Mesozoic); flysch of generally low metamorphic grade, but locally includes igneous and higher-grade metamorphic rocks

re-pehannoor
tere
heoknsnt
-
ee
l
ote
z-hve
ndreinernt
rale,
Soils
The formation of soils depends primarilyon five factors: type of parent material, climate,relief or topography, living organisms, and time(Singer and Munns, 1987). The type of soildepends on which factor is the most dominant.In the Cook Inlet Basin, type of material, cli-mate, and relief have been the most dominantfactors in the development of soils. Soil typecan affect water quality as precipitation infil-trates the soil, reacts with the minerals that arepresent, and then discharges into a stream. Soiltype and distribution also are factors that affectthe amount of soil erosion.
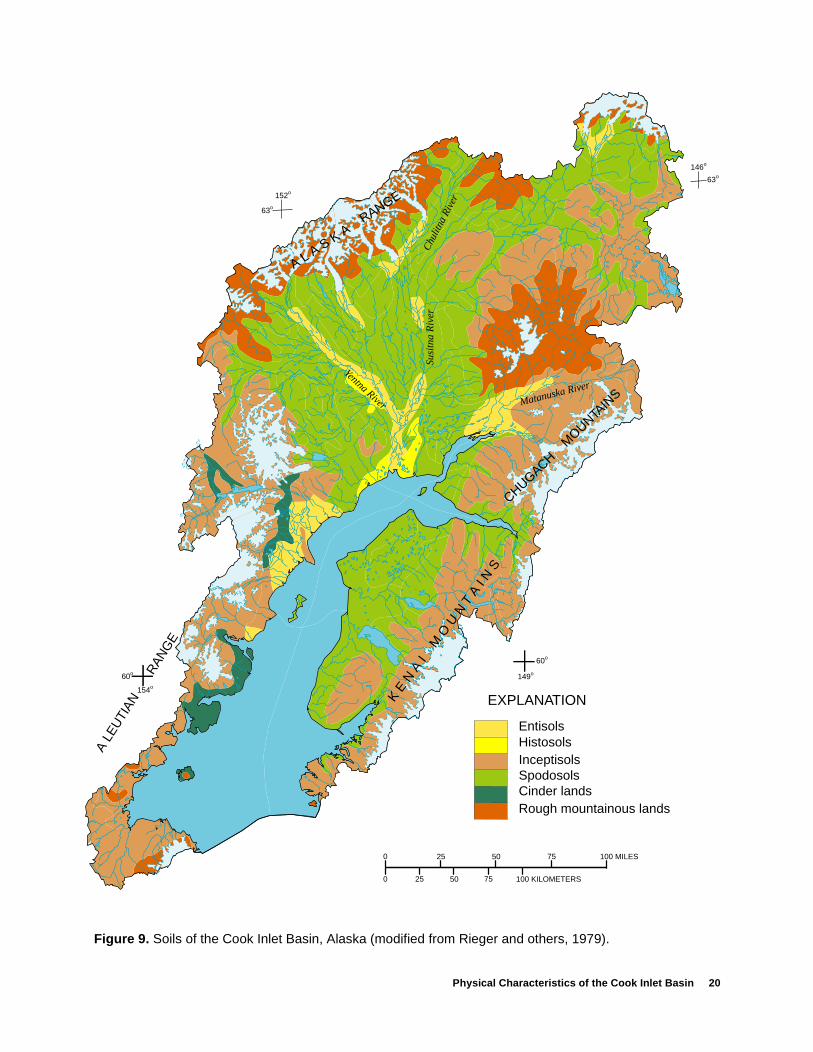
In the soil taxonomy of the U.S. Depart-ment of Agriculture (1975), soils were groupedat six levels or categories. The two broadestcategories are the order, followed by the morenarrowly defined category, the suborder. Of apossible 10 soil orders, 4 soil orders are foundin the Cook Inlet Basin: Entisols, Histosols,Inceptisols, and Spodosols (fig. 9). In addition,two other areas are not classified as ordersbecause they are largely unvegetated: cinderlands (areas of fresh volcanic ash and cinderflows) and rough mountainous lands (Riegerand others, 1979).
Entisols—These are recently formedsoils with little soil horizon development andare found in areas of glacial outwash or allu-vium. These areas are the basins of the Mata-nuska, Susitna, Yentna, and Chulitna Riversand are also along part of western Cook Inlet.Suborders of Entisols found in the Cook InletBasin are aquents. Soils in this suborder are theTypic Cryaquents, which have a wide range ofproperties. The texture ranges from very grav-elly sand to fine clay and the color from gray tograyish brown. A common property of thesesoils is that they are always nearly saturated.
Histosols—These are yellow-brown todark black organic-rich soils generally formedin wetlands. They are generally found near themouth of the Susitna River. Suborders of Histo-
sols that are present are the Fibrists. The pdominant soil is Sphagnic Borofibrists, a deeorganic soil composed dominantly of sedgpeat, but with one or more layers in whicsphagnum moss fibers make up more ththree-quarters of the peat. The soils have permafrost but are frozen to a depth of 2 in. more during winter.
Inceptisols—These are recently formedsoils but, in contrast to Entisols, have a greadegree of soil horizon development than thEntisols. These soils are located along tAleutian and Alaska Ranges in western CoInlet and along the Kenai–Chugach Mountaion the east side of Cook Inlet. Predominasuborders and soils are:
• Ochrepts Suborder Andic Cryochrepts—A layer of siltyvolcanic ash over soils of the typic subgroup.
• Aquepts Suborder Histic Cryaquepts—Soils with a thickaccumulation of organic matter at thsoil surface in a peaty mat above thmineral soil or mixed with the minerasoil.Pergelic Cryaquepts—Soils that havepermafrost at some depth, but do nhave thick peaty accumulations on thsurface.
• Umbrepts Suborder Pergelic Cryumbrepts—Soils that havemean annual temperatures below freeing. These soils occur in locations witgood surface drainage, in areas abotreeline.
Spodosols—These consist of soils withlight-colored surface horizons and organic aaluminum-rich subsurface horizons. These athe predominant soils in the Cook Inlet Basand are located throughout the Susitna RivBasin and the Kenai Peninsula. Predominasuborders and soils are (Joe Moore, NatuResources Conservation Service, Anchoragwritten commun., 1998):
19 Water-Quality Assessment of the Cook Inlet Basin, Alaska—Environmental Setting
Physical Characteristics of the Cook Inlet Basin 20
Figure 9. Soils of the Cook Inlet Basin, Alaska (modified from Rieger and others, 1979).
100 MILES75
100 KILOMETERS
50
75
25
5025
0
0
63o
146o
63o
152o
60o
154o
149o
60o
EXPLANATION
A L A S K A RANGE
K E
N A I
M
O U
N T
A I
N SCHUGACH
MOUNTA
INS
Su
sitn
a R
ive
r
Matanuska RiverYentna River
A LE
UTI
AN
R
ANG
E
EntisolsHistosolsInceptisolsSpodosolsCinder landsRough mountainous lands
Chu
litna
Riv
er
re-t
hn.flsre
di-lya
• Aquods SuborderAndic Haplocryods—Well-drained soilsformed in volcanic ash. These soils con-sist of an ashy loess layer overlying var-ious substratum materials includingglacial till, alluvium, or colluvium.Formed on stable landforms, these soilsdevelop acidic conditions, and theacidic weathering results in leaching ofiron, alumina, and organic colloids fromnear-surface layers and subsequentaccumulation of these materials at lowerdepths.Typic Haplocryods—Generally sandysoils that occur mostly in areas subjectto frequent fluctuations in ground-waterlevels. Andic Humicryods—These soils aresimilar to the Andic Haplocryods butwith signif icant accumulation oforganic carbon in the reddish subsoilzone. They are found in areas with highprecipitation.Typic Humicryods—Soils very similarto the Andic Humicryods but without
the influence of volcanic ash. Eitherthere is no loess mantle or the loessmantle is derived from glacial silts ofnon-volcanic origin. Pergelic Haplocryods—The dominantfeature of these soils is a temperatuperennially at or below 32 °F (permafrost). The presence of permafrosrestricts moisture movement througthe soil as well as plant root penetratioThey may or may not be stable iallowed to warm and thaw. These soiform in acidic environments and occuat higher altitudes, generally abovtreeline or on north-facing aspects.
• Orthods SuborderHumic Cryorthods—Well-drained soilsin which organic carbon, aluminum, aniron are all present in significant quantties. These soils generally occur directabove treeline in the Cook Inlet/SusitnLowland.
21 Water-Quality Assessment of the Cook Inlet Basin, Alaska—Environmental Setting
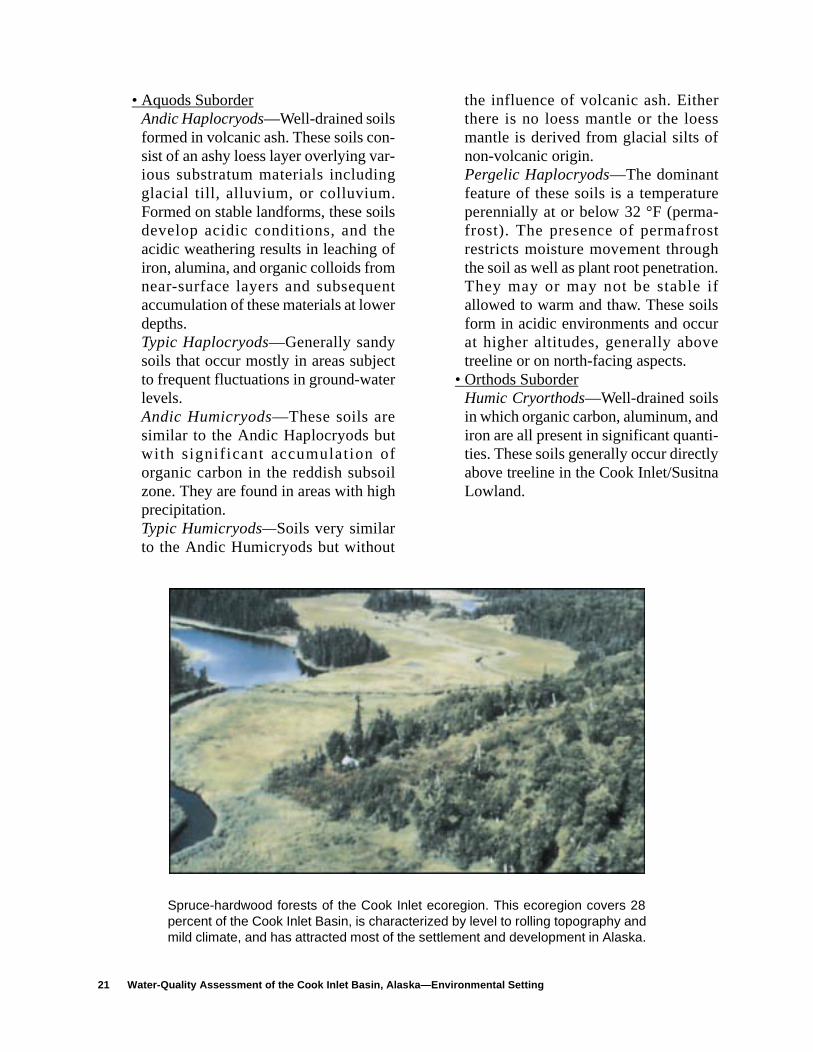
Spruce-hardwood forests of the Cook Inlet ecoregion. This ecoregion covers 28percent of the Cook Inlet Basin, is characterized by level to rolling topography andmild climate, and has attracted most of the settlement and development in Alaska.
Land Cover
Land cover influences a number of hydro-logic factors, such as snow accumulation, soilmoisture depletion, surface runoff, infiltration,and erosion. These factors, in turn, can affectthe water quality of a particular stream or river.For example, certain types of vegetation canprevent erosion, thus reducing the amount ofsediment that enters a stream. Also, the compo-sition of certain types of vegetation will, inturn, affect the chemistry of the water.
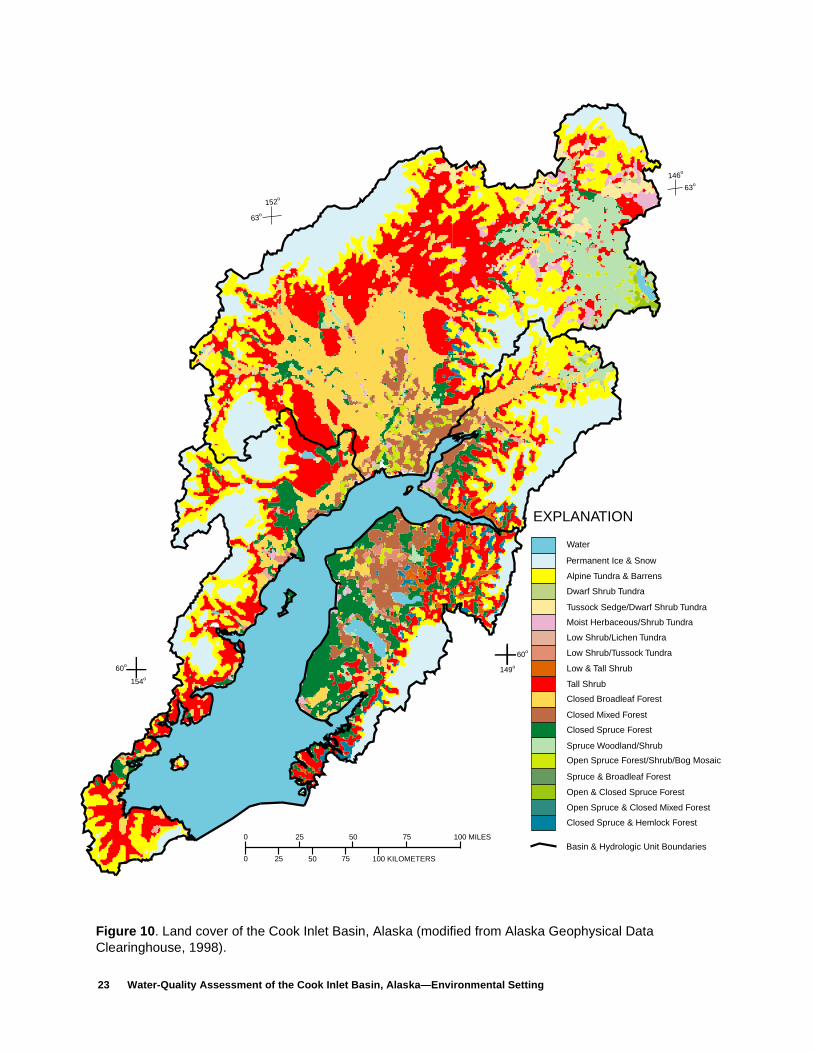
Water, permanent snow, and ice arepresent in about 19 percent of the Cook InletBasin (fig. 10; table 1) (Alaska Geospatial DataClearinghouse, 1998). In the Anchorage/Mata-
nuska area and in western Cook Inlet (fig. 10),these features account for 29 and 27 percent oftheir total areas respectively. Tall shrub is thedominant vegetation in the Cook Inlet Basinand accounts for about 24 percent of the totalvegetation. Alpine tundra accounts for about 19percent of the total area of Cook Inlet and ispresent in a large extent in the Susitna, Anchor-age/Matanuska, and western Cook Inlet areas.Other distinguishing features are the amount ofclosed broadleaf forest found in the Susitnaarea (17 percent) and the amount of closedmixed forest (13 percent) and closed spruceforest (26 percent) found in the Kenai Penin-sula area.
Physical Characteristics of the Cook Inlet Basin 22
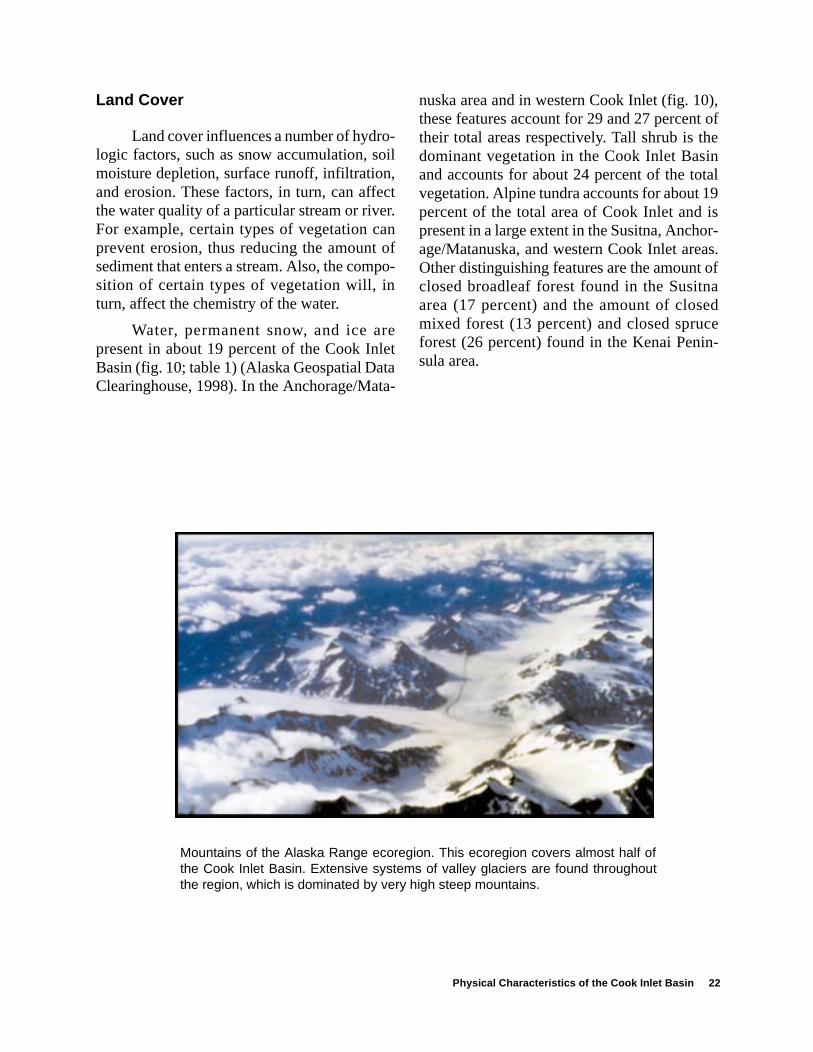
Mountains of the Alaska Range ecoregion. This ecoregion covers almost half ofthe Cook Inlet Basin. Extensive systems of valley glaciers are found throughoutthe region, which is dominated by very high steep mountains.
23 Water-Quality Assessment of the Cook Inlet Basin, Alaska—Environmental Setting
Figure 10. Land cover of the Cook Inlet Basin, Alaska (modified from Alaska Geophysical Data Clearinghouse, 1998).
Water
Permanent Ice & Snow
Alpine Tundra & Barrens
Dwarf Shrub Tundra
Tussock Sedge/Dwarf Shrub Tundra
Moist Herbaceous/Shrub Tundra
Low Shrub/Lichen Tundra
Low Shrub/Tussock Tundra
Low & Tall Shrub
Tall Shrub
Closed Broadleaf Forest
Closed Mixed Forest
Closed Spruce Forest
Spruce Woodland/Shrub
Open Spruce Forest/Shrub/Bog Mosaic
Spruce & Broadleaf Forest
Open & Closed Spruce Forest
Open Spruce & Closed Mixed Forest
Closed Spruce & Hemlock Forest
EXPLANATION
146o
63o
100 MILES75
100 KILOMETERS
50
75
25
5025
0
0
149o
60o
60o
154o
63o
152o
Basin & Hydrologic Unit Boundaries
Physical Characteristics of the Cook Inlet Basin 24
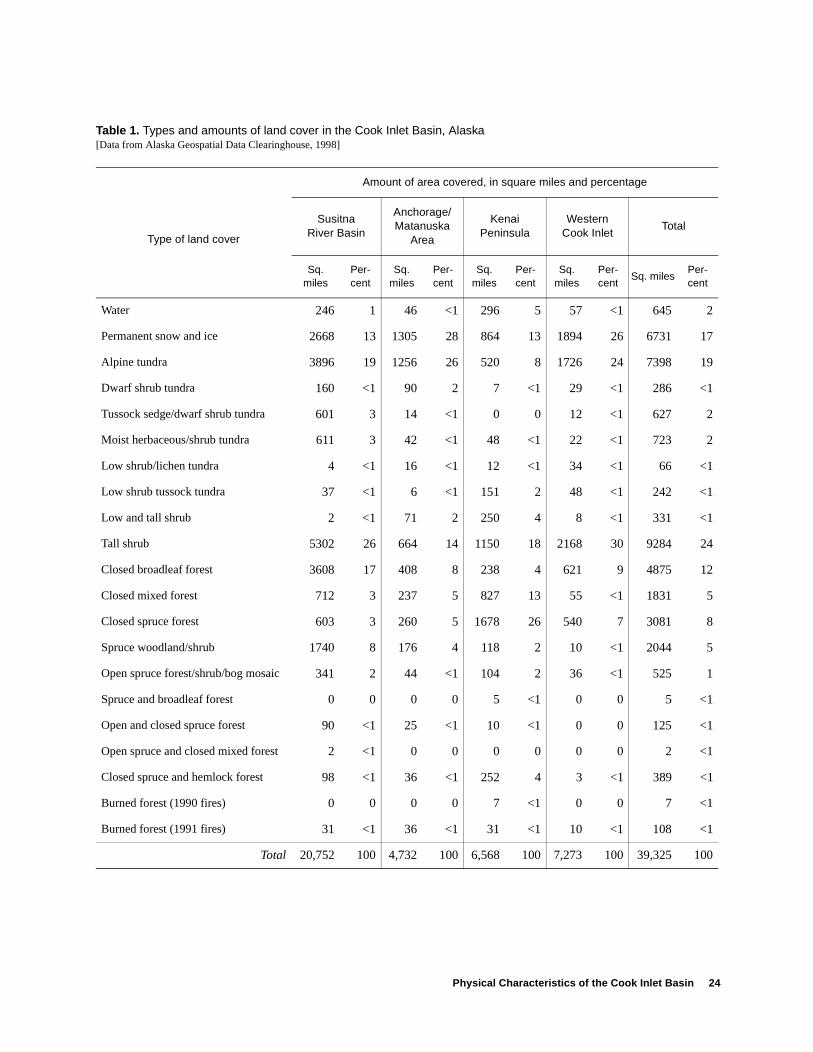
Table 1. Types and amounts of land cover in the Cook Inlet Basin, Alaska[Data from Alaska Geospatial Data Clearinghouse, 1998]
Type of land cover
Amount of area covered, in square miles and percentage
SusitnaRiver Basin
Anchorage/ Matanuska
Area
KenaiPeninsula
WesternCook Inlet
Total
Sq.miles
Per-cent
Sq. miles
Per-cent
Sq. miles
Per-cent
Sq. miles
Per-cent
Sq. milesPer-cent
Water 246 1 46 <1 296 5 57 <1 645 2
Permanent snow and ice 2668 13 1305 28 864 13 1894 26 6731 17
Alpine tundra 3896 19 1256 26 520 8 1726 24 7398 19
Dwarf shrub tundra 160 <1 90 2 7 <1 29 <1 286 <1
Tussock sedge/dwarf shrub tundra 601 3 14 <1 0 0 12 <1 627 2
Moist herbaceous/shrub tundra 611 3 42 <1 48 <1 22 <1 723 2
Low shrub/lichen tundra 4 <1 16 <1 12 <1 34 <1 66 <1
Low shrub tussock tundra 37 <1 6 <1 151 2 48 <1 242 <1
Low and tall shrub 2 <1 71 2 250 4 8 <1 331 <1
Tall shrub 5302 26 664 14 1150 18 2168 30 9284 24
Closed broadleaf forest 3608 17 408 8 238 4 621 9 4875 12
Closed mixed forest 712 3 237 5 827 13 55 <1 1831 5
Closed spruce forest 603 3 260 5 1678 26 540 7 3081 8
Spruce woodland/shrub 1740 8 176 4 118 2 10 <1 2044 5
Open spruce forest/shrub/bog mosaic 341 2 44 <1 104 2 36 <1 525 1
Spruce and broadleaf forest 0 0 0 0 5 <1 0 0 5 <1
Open and closed spruce forest 90 <1 25 <1 10 <1 0 0 125 <1
Open spruce and closed mixed forest 2 <1 0 0 0 0 0 0 2 <1
Closed spruce and hemlock forest 98 <1 36 <1 252 4 3 <1 389 <1
Burned forest (1990 fires) 0 0 0 0 7 <1 0 0 7 <1
Burned forest (1991 fires) 31 <1 36 <1 31 <1 10 <1 108 <1
Total 20,752 100 4,732 100 6,568 100 7,273 100 39,325 100

onst.teof
ita--e
sll-ils
nrelljor
th-hisllyede
e-n,b
-in
ur-nereat on,
ialofr
gern
Ecoregions
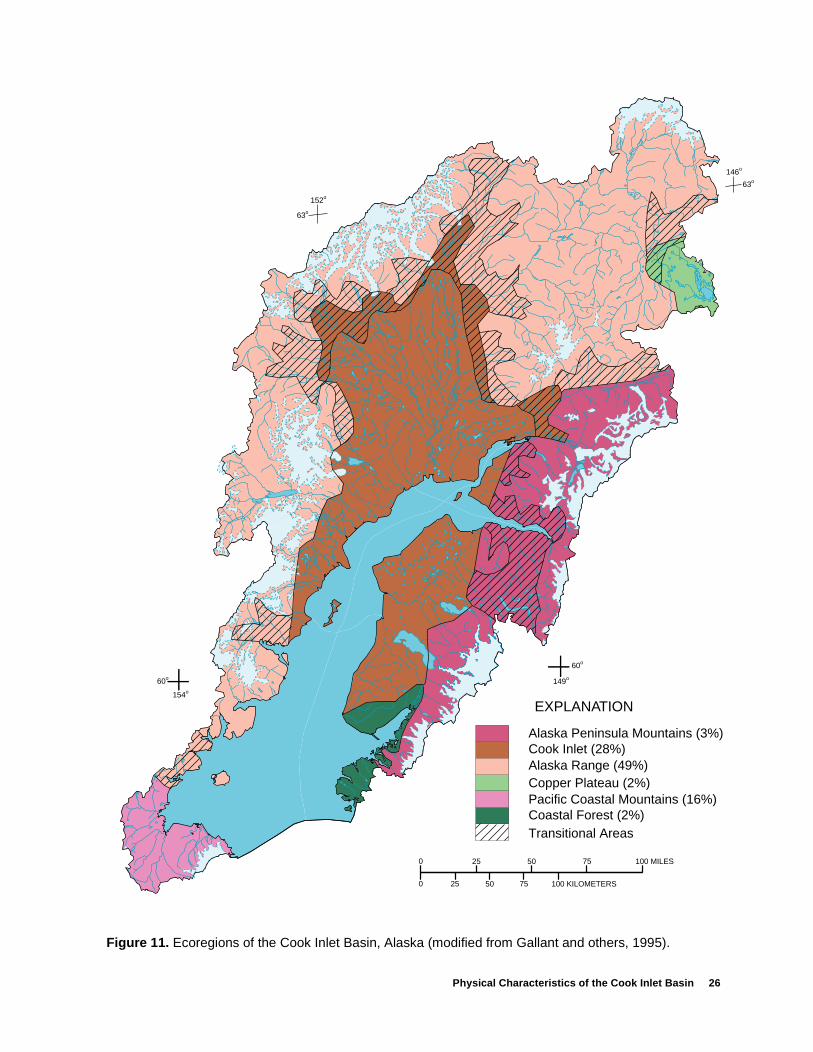
Omernik (1995) has defined ecoregionsas areas with common ecological settings thathave relatively homogeneous features includ-ing potential natural vegetation, geology, min-eral availability from soils, physiography, andland use and land cover. The Cook Inlet Basincontains parts of six ecoregions (fig. 11): (1)Alaska Peninsula Mountains, (2) Cook Inlet,(3) Alaska Range, (4) Copper Plateau, (5)Pacific Coastal Mountains, and (6) CoastalForest. Specific descriptions of these regionsare taken from Gallant and others (1995).
Alaska Peninsula Mountains—Com-posed of rounded, folded, and faulted sedimen-tary ridges intermittently surrounded byvolcanoes. The mountains were heavily glaci-ated during the Pleistocene Epoch (QuaternaryPeriod). A maritime climate prevails, and theregion is generally free of permafrost. Manysoils formed in deposits of volcanic ash andcinder over glacial deposits and are highlyerodible. Vegetation cover commonly consistsof dwarf scrub communities at higher altitudesand on sites exposed to wind, and low scrubcommunities at lower altitudes and in moreprotected sites.
Cook Inlet—Located in the southcentralpart of Alaska adjacent to Cook Inlet, has oneof the mildest climates in the State. The cli-mate, the level-to-rolling topography, and thecoastal proximity have attracted most of thesettlement and development in Alaska. Theregion has a variety of vegetation communitiesbut is dominated by stands of spruce and hard-wood species. The area is generally free frompermafrost. Unlike many of the other nonmon-tane ecoregions, the Cook Inlet ecoregion wasintensely glaciated during the PleistoceneEpoch.
Alaska Range—Covered by rockyslopes, icefields, and glaciers. Much of the areais barren of vegetation. Dwarf scrub communi-
ties are common at higher altitudes and windswept sites where vegetation does exiThe Alaska Range is in the Continental ClimaZone, but because of the extreme height many of the ridges and peaks, annual preciption at higher altitudes is similar to that measured for some ecoregions in the MaritimZone (fig. 6).
Copper Plateau—Occupies the site of alarge lake that existed during glacial time(Pleistocene Epoch). The nearly level-to-roing plain has many lakes and wetlands. Soare predominantly silty or clayey, formed fromglaciolacustrine sediments. Much of the regiohas a shallow permafrost table, and soils apoorly drained. Black spruce forests and tascrub, interspersed with wetlands, are the matypes of vegetation communities.
Pacific Coastal Mountains—Composedof steep and rugged mountains along the soueastern and southcentral coast of Alaska. Tecoregion receives more precipitation annuathan the Alaska Range ecoregion. Glaciatduring the Pleistocene Epoch, most of thecoregion is still covered by glaciers and icfields. Most of the area is barren of vegetatiobut where plants do occur, dwarf and low-scrucommunities dominate.
Coastal Forest—Located near the southeastern part of the Cook Inlet Basin. The terrais a result of intense erosion and deposition ding late glacial advances of the PleistoceEpoch. Evidence of the effects of glaciation adeep narrow bays, steep valley walls thexpose much bedrock, thin moraine depositshills and in valleys, very irregular coastlinehigh sea cliffs, and deeply dissected glacmoraine deposits covering the lower slopes valley walls. The region has the mildest wintetemperatures in Alaska accompanied by laramounts of precipitation. Forests of westehemlock and Sitka spruce are widespread.
25 Water-Quality Assessment of the Cook Inlet Basin, Alaska—Environmental Setting
Physical Characteristics of the Cook Inlet Basin 26
Figure 11. Ecoregions of the Cook Inlet Basin, Alaska (modified from Gallant and others, 1995).
100 MILES75
100 KILOMETERS
50
75
25
5025
0
0
63o
146o
63o
152o
60o
154o
149o
60o
Alaska Peninsula Mountains (3%)Cook Inlet (28%)Alaska Range (49%)Copper Plateau (2%)Pacific Coastal Mountains (16%)Coastal Forest (2%)Transitional Areas
EXPLANATION
ofersisp-
red-
HYDROLOGIC CHARACTERISTICS OF THE COOK INLET BASIN
Surface Water
Streamflow quantity and variability haveconsiderable influence on the quality of surfacewater. The quantity of water in a stream or riverinfluences its ability to support aquatic commu-nities, to assimilate or dilute waste discharges,and to carry suspended sediment. Temporalvariability of streamflow may, in turn, causetemporal variability of water quality. Thus,knowledge of streamflow is important tounderstand the water-quality and ecologicaldynamics of a watershed.
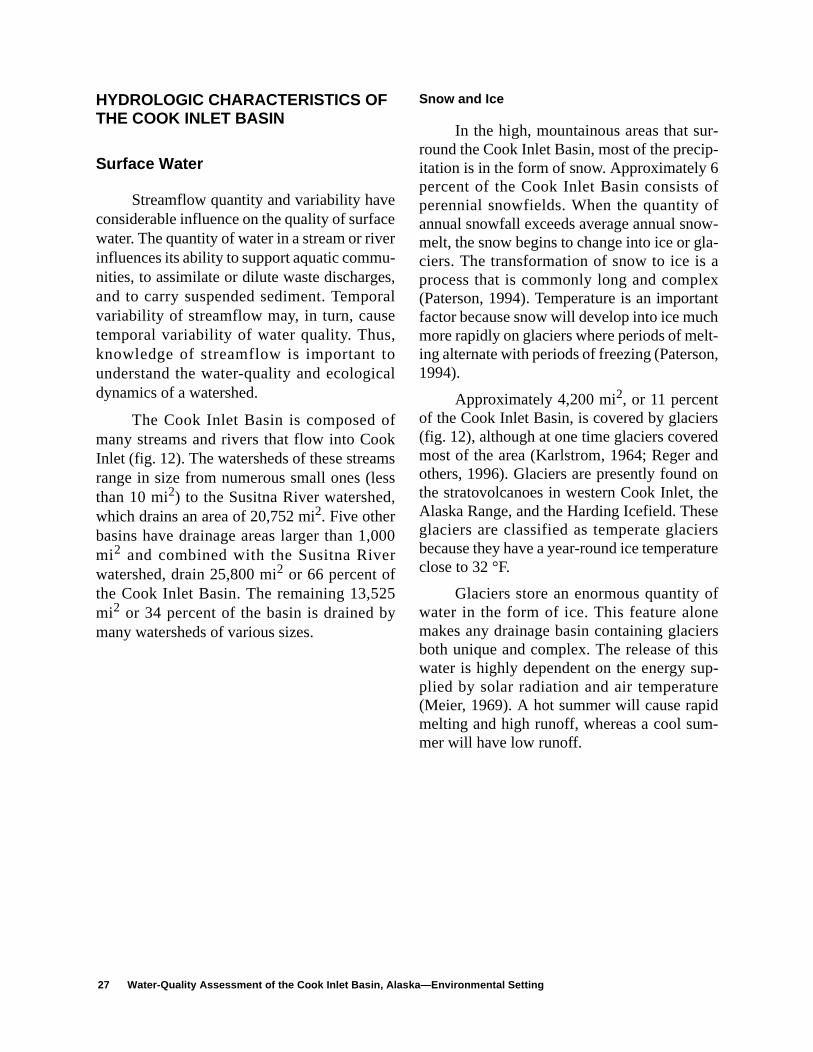
The Cook Inlet Basin is composed ofmany streams and rivers that flow into CookInlet (fig. 12). The watersheds of these streamsrange in size from numerous small ones (lessthan 10 mi2) to the Susitna River watershed,which drains an area of 20,752 mi2. Five otherbasins have drainage areas larger than 1,000mi2 and combined with the Susitna Riverwatershed, drain 25,800 mi2 or 66 percent ofthe Cook Inlet Basin. The remaining 13,525mi2 or 34 percent of the basin is drained bymany watersheds of various sizes.
Snow and Ice
In the high, mountainous areas that sur-round the Cook Inlet Basin, most of the precip-itation is in the form of snow. Approximately 6percent of the Cook Inlet Basin consists ofperennial snowfields. When the quantity ofannual snowfall exceeds average annual snow-melt, the snow begins to change into ice or gla-ciers. The transformation of snow to ice is aprocess that is commonly long and complex(Paterson, 1994). Temperature is an importantfactor because snow will develop into ice muchmore rapidly on glaciers where periods of melt-ing alternate with periods of freezing (Paterson,1994).
Approximately 4,200 mi2, or 11 percentof the Cook Inlet Basin, is covered by glaciers(fig. 12), although at one time glaciers coveredmost of the area (Karlstrom, 1964; Reger andothers, 1996). Glaciers are presently found onthe stratovolcanoes in western Cook Inlet, theAlaska Range, and the Harding Icefield. Theseglaciers are classified as temperate glaciersbecause they have a year-round ice temperatureclose to 32 °F.
Glaciers store an enormous quantity water in the form of ice. This feature alonmakes any drainage basin containing glacieboth unique and complex. The release of thwater is highly dependent on the energy suplied by solar radiation and air temperatu(Meier, 1969). A hot summer will cause rapimelting and high runoff, whereas a cool summer will have low runoff.
27 Water-Quality Assessment of the Cook Inlet Basin, Alaska—Environmental Setting
Hydrologic Characteristics of the Cook Inlet Basin 28
Figure 12. Selected streams, lakes, and glaciers in the Cook Inlet Basin, Alaska.
100 MILES75
100 KILOMETERS
50
75
25
5025
0
0
Mt. Spurr Volcano
RedoubtVolcano
Iliamna Volcano
Augustine Volcano
A
E
C
D
B 149o
60o
63o
146o
63o
152o
60o
154o
A L A S
K A
RANGE
Su
sitn
a R
ive
r
Maclaren River
CO
OK
IN
LET
Har
ding
Ice
Fiel
d
South Fork Campbell Creek
West Fork Eklutna Creek
Caribou Creek
GlacierWater body or lake
EXPLANATION
A. Susitna River at Gold CreekB. Ninilchik River at NinilchikC. Chuitna River near Tyonek
E. Susitna River at Susitna StationD. Kenai River at Soldotna
STREAM-GAGING STATIONS
Glacial and Nonglacial Streams and Rivers
Because water quality is dependent onthe quantity and timing of runoff, it is impor-tant to understand the distinction between gla-cial and nonglacial basins. A basin with aglacier will yield more water than an adjacentnonglacial basin, whether the glacier is grow-ing or shrinking. Most of the meltwater from aglacier will be released during a fairly shortsummer season. The peak runoff from glaciersoccurs later than that from lower altitude, non-glacial areas (Meier and Tangborn, 1961).Fountain and Tangborn (1985) also found thatin certain years the water yield from a glacialbasin was 20 to 30 percent greater than thewater yield from a nonglacial basin.
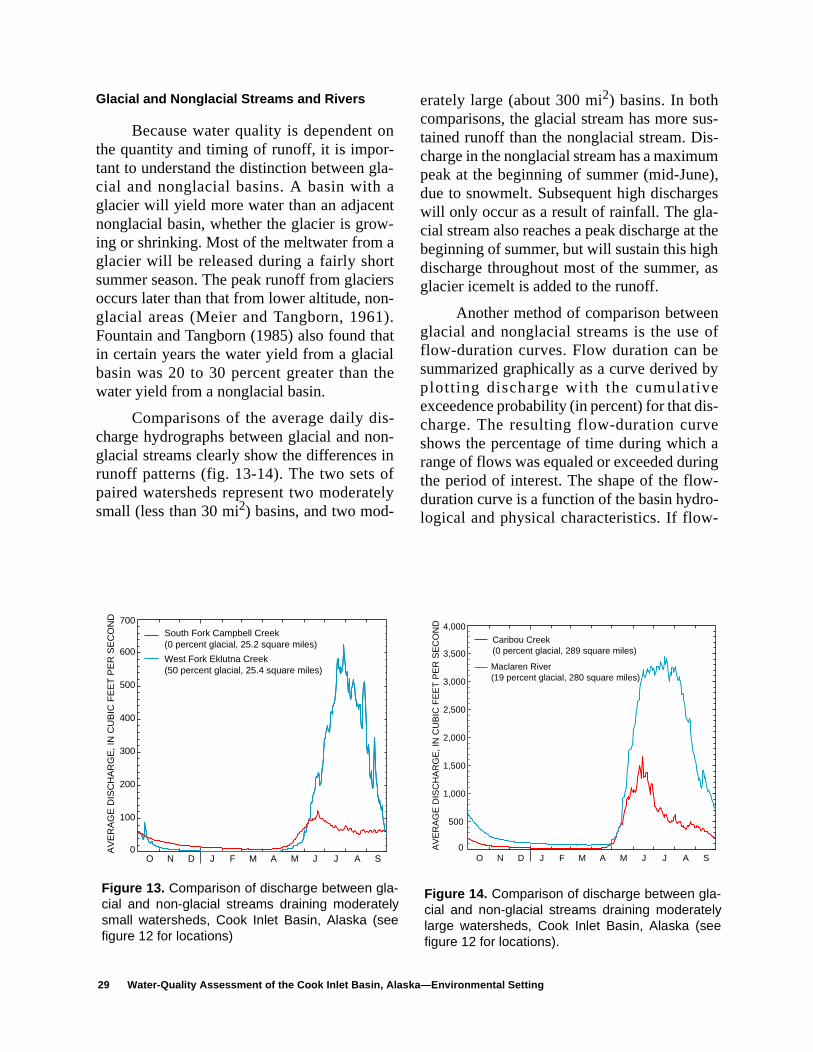
Comparisons of the average daily dis-charge hydrographs between glacial and non-glacial streams clearly show the differences inrunoff patterns (fig. 13-14). The two sets ofpaired watersheds represent two moderatelysmall (less than 30 mi2) basins, and two mod-
erately large (about 300 mi2) basins. In bothcomparisons, the glacial stream has more sus-tained runoff than the nonglacial stream. Dis-charge in the nonglacial stream has a maximumpeak at the beginning of summer (mid-June),due to snowmelt. Subsequent high dischargeswill only occur as a result of rainfall. The gla-cial stream also reaches a peak discharge at thebeginning of summer, but will sustain this highdischarge throughout most of the summer, asglacier icemelt is added to the runoff.
Another method of comparison betweenglacial and nonglacial streams is the use offlow-duration curves. Flow duration can besummarized graphically as a curve derived byplotting discharge with the cumulativeexceedence probability (in percent) for that dis-charge. The resulting flow-duration curveshows the percentage of time during which arange of flows was equaled or exceeded duringthe period of interest. The shape of the flow-duration curve is a function of the basin hydro-logical and physical characteristics. If flow-
29 Water-Quality Assessment of the Cook Inlet Basin, Alaska—Environmental Setting
O N D J F M A M J J A S0
700
100
200
300
400
500
600
AV
ER
AG
E D
ISC
HA
RG
E, I
N C
UB
IC F
EE
T P
ER
SE
CO
ND
South Fork Campbell Creek (0 percent glacial, 25.2 square miles)
West Fork Eklutna Creek (50 percent glacial, 25.4 square miles)
O N D J F M A M J J A S0
4,000
500
1,000
1,500
2,000
2,500
3,000
3,500
AV
ER
AG
E D
ISC
HA
RG
E, I
N C
UB
IC F
EE
T P
ER
SE
CO
ND
Caribou Creek (0 percent glacial, 289 square miles)
Maclaren River(19 percent glacial, 280 square miles)
Figure 13. Comparison of discharge between gla-cial and non-glacial streams draining moderatelysmall watersheds, Cook Inlet Basin, Alaska (seefigure 12 for locations)
Figure 14. Comparison of discharge between gla-cial and non-glacial streams draining moderatelylarge watersheds, Cook Inlet Basin, Alaska (seefigure 12 for locations).
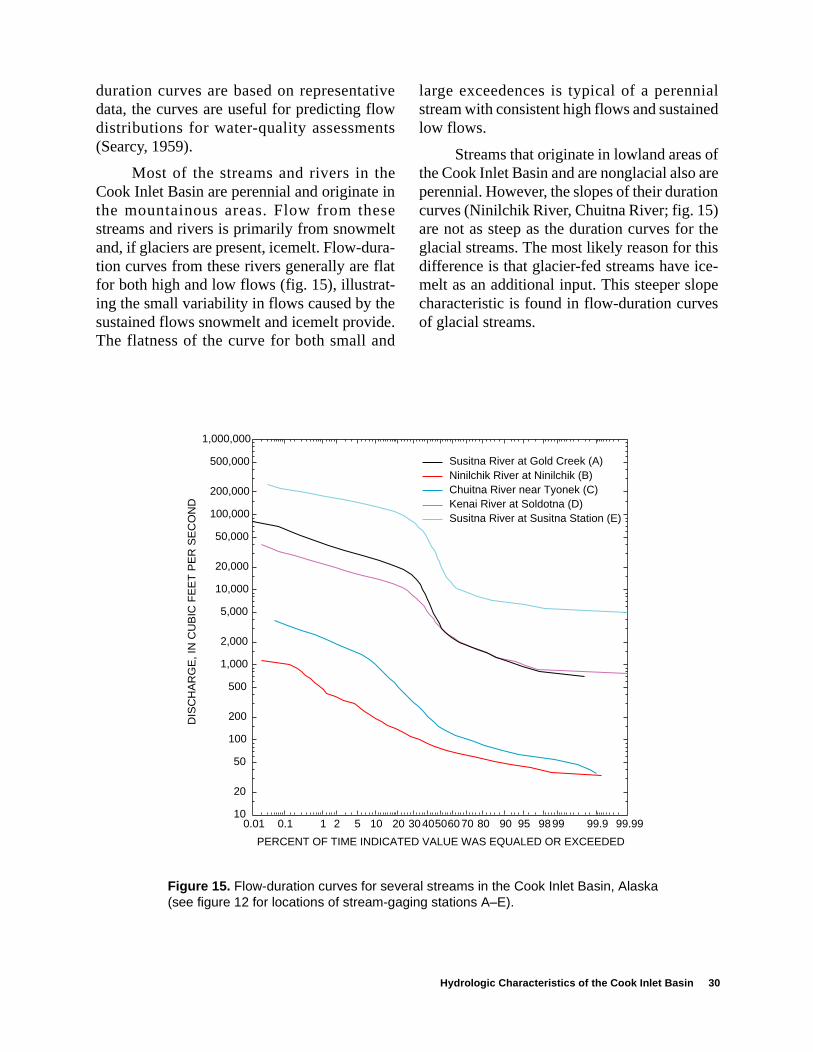
duration curves are based on representativedata, the curves are useful for predicting flowdistributions for water-quality assessments(Searcy, 1959).
Most of the streams and rivers in theCook Inlet Basin are perennial and originate inthe mountainous areas. Flow from thesestreams and rivers is primarily from snowmeltand, if glaciers are present, icemelt. Flow-dura-tion curves from these rivers generally are flatfor both high and low flows (fig. 15), illustrat-ing the small variability in flows caused by thesustained flows snowmelt and icemelt provide.The flatness of the curve for both small and
large exceedences is typical of a perennialstream with consistent high flows and sustainedlow flows.
Streams that originate in lowland areas ofthe Cook Inlet Basin and are nonglacial also areperennial. However, the slopes of their durationcurves (Ninilchik River, Chuitna River; fig. 15)are not as steep as the duration curves for theglacial streams. The most likely reason for thisdifference is that glacier-fed streams have ice-melt as an additional input. This steeper slopecharacteristic is found in flow-duration curvesof glacial streams.
Hydrologic Characteristics of the Cook Inlet Basin 30
0.01 0.1 1 2 5 10 20 3040506070 80 90 95 9899 99.9 99.99
PERCENT OF TIME INDICATED VALUE WAS EQUALED OR EXCEEDED
10
1,000,000
20
50
100
200
500
1,000
2,000
5,000
10,000
20,000
50,000
100,000
200,000
500,000
DIS
CH
AR
GE
, IN
CU
BIC
FE
ET
PE
R S
EC
ON
D
Susitna River at Gold Creek (A)Ninilchik River at Ninilchik (B)Chuitna River near Tyonek (C)Kenai River at Soldotna (D)Susitna River at Susitna Station (E)
Figure 15. Flow-duration curves for several streams in the Cook Inlet Basin, Alaska (see figure 12 for locations of stream-gaging stations A–E).
r),i-e
at ofur
v-ch forileyeib-ule,t-eer-i-astelteaner-
t-
g’s. in, ofrty
healed
Streamflow
Forty-nine streamflow-gaging stationsoperated by the USGS in the Cook Inlet Basinhave 10 or more years of record (fig. 16; table2). Because most of the gaging stations arelocated along the road system, a complete spa-tial coverage of streams is not available, espe-cially in western Cook Inlet. Using theavailable streamflow information, the contribu-tion to Cook Inlet from each hydrologic unitwas determined (table 3). The contributionfrom a particular hydrologic unit was estimatedby (1) calculating the average discharge forgaging stations that represented the mouth of aparticular stream or river and (2) adjusting thesum of the average discharges to represent thetotal area of the hydrologic unit. For example,in the Susitna River Basin hydrologic unit, twostations (map Nos. 35 and 46, fig. 16) represent94 percent of the basin (table 3). Thus, the aver-age discharge for this hydrologic unit, 50,600ft3/s, was divided by 0.94 to compute the aver-age discharge for this hydrologic unit.
The total average annual surface-waterdischarge into Cook Inlet is estimated to be116,000 ft3/s (table 3). As expected, the largestinput to Cook Inlet is from the Susitna RiverBasin which accounts for about 47 percent ofthe annual total or 54,000 ft3/s. The Anchor-age/Matanuska area and the Kenai Peninsula,which account for 12 and 17 percent respec-tively of the area of the Cook Inlet Basin, con-tribute about the same percentage (14 and 16percent) of flow. However, western CookInlet—which constitutes 18 percent of the totalarea of Cook Inlet—contributes about 22 per-cent of the total discharge. This higher dis-charge most likely is due to the presence ofmany glaciers in western Cook Inlet as well asthe high precipitation this region receives.
A similar analysis was done for the samestreamflow-gaging stations, only this time theflow contributions were analyzed by month.The purpose of this analysis was to show the
relative timing of the flow (fig. 17). During theopen-water period, (May through Septembethe average inflow to Cook Inlet is approxmately 224,000 ft3/s, almost twice the averagannual inflow (116,000 ft3/s). The lowestinflow occurs in March (18,500 ft3/s) and thehighest inflow in July (303,000 ft3/s).
Floods
Floods are extreme hydrologic events thcan degrade water quality. The largest loadsmany constituents from nonpoint sources occduring flooding. Floodwaters may scour graels and deposit fine-grained sediment, whiare processes detrimental to spawning bedssome fish species. Floods also wash juvenfish out of the river. Recent declines in sockesalmon harvests in Cook Inlet have been attruted to the 1995 flood on the Kenai River (PaRuesch, Alaska Department of Fish and Gamwritten commun., 1998). In the Cook InleBasin, annual high flows occur during the summer rainy season. Nearly all major floods in thCook Inlet Basin have occurred during thperiod July to early October. The floods geneally result from intense, warm rains that orignate in the Pacific Ocean and move to the eor northeast. Floods can occur during snowmseason (May–June) if the snowpack in thmountains is above average. Flooding also cbe caused by the release of water from glacidammed lakes or ice jams.
The history of flooding in the Cook InleBasin is virtually unknown before the establishment of a network of streamflow-gaginstations in the late 1940’s and early 1950Since 1949, four major floods have occurredthe Cook Inlet Basin—in 1971, 1986, 1989and 1995. These floods covered large areasthe basin and caused considerable propedamage.
Flood of 1971—In May 1971, snowcover was 150 percent of average along tAlaska Range (Lamke, 1972). Below-normair temperatures in May and June delay
31 Water-Quality Assessment of the Cook Inlet Basin, Alaska—Environmental Setting
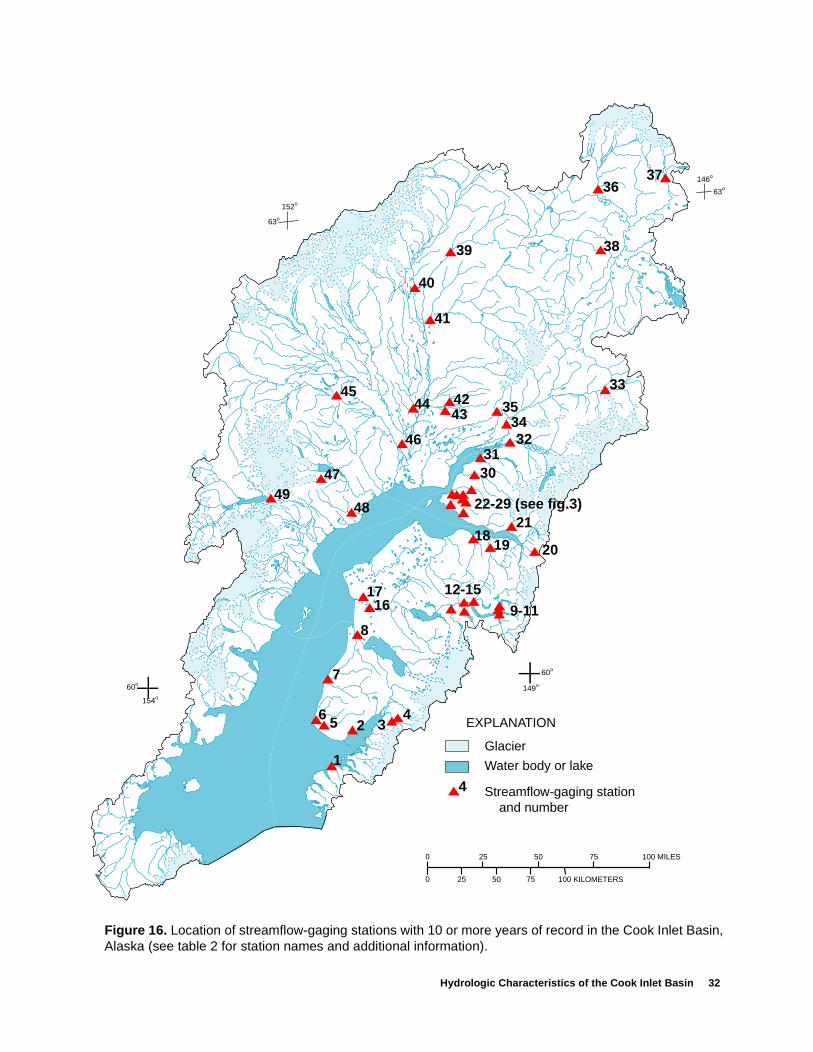
Hydrologic Characteristics of the Cook Inlet Basin 32
100 MILES75
100 KILOMETERS
50
75
25
5025
0
0
Glacier
Water body or lake
EXPLANATION
Streamflow-gaging station and number
4
39
40
41
36
38
37
4544 42
43
46
4749
48
353432
33
3130
22-29 (see fig.3)21
1819 20
12-159-11
1716
8
7
34
1
256
63o
146o
63o
152o
60o
154o
149o
60o
Figure 16. Location of streamflow-gaging stations with 10 or more years of record in the Cook Inlet Basin, Alaska (see table 2 for station names and additional information).
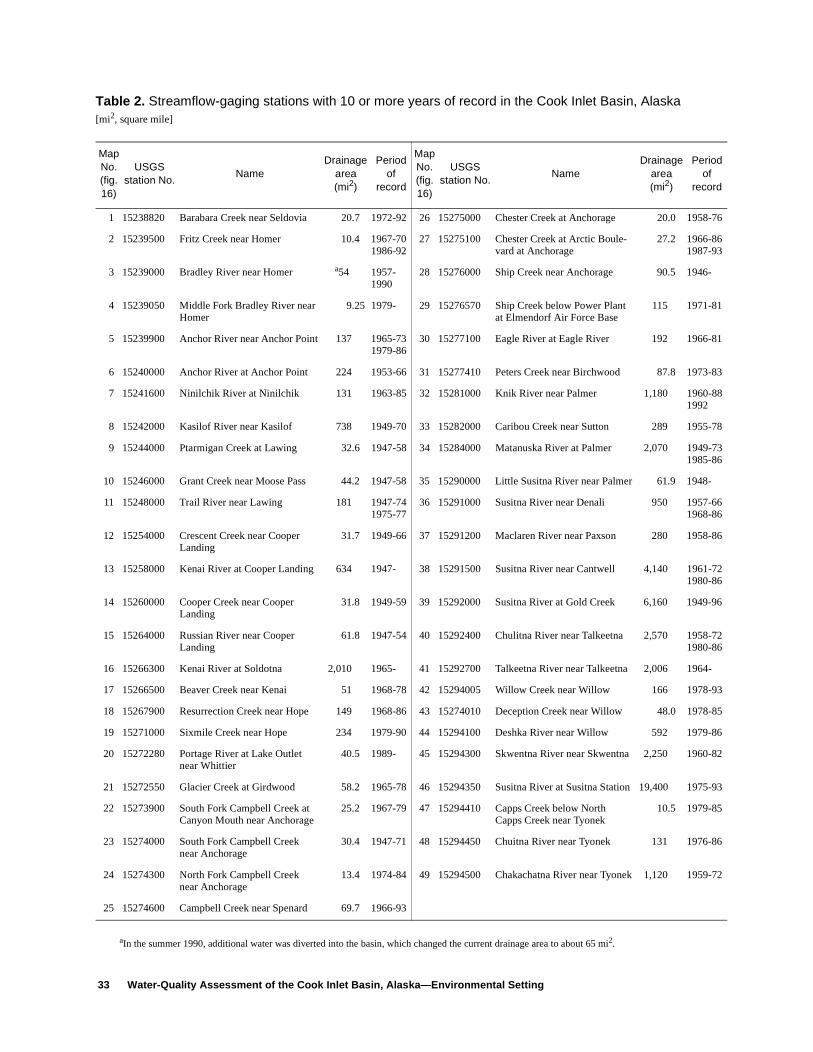
33 Water-Quality Assessment of the Cook Inlet Basin, Alaska—Environmental Setting
Table 2. Streamflow-gaging stations with 10 or more years of record in the Cook Inlet Basin, Alaska[mi2, square mile]
Map No.(fig. 16)
USGSstation No.
NameDrainage
area(mi2)
Period of
record
MapNo. (fig. 16)
USGSstation No.
NameDrainage
area(mi2)
Period of
record
1 15238820 Barabara Creek near Seldovia 20.7 1972-92 26 15275000 Chester Creek at Anchorage 20.0 1958-76
2 15239500 Fritz Creek near Homer 10.4 1967-701986-92
27 15275100 Chester Creek at Arctic Boule-vard at Anchorage
27.2 1966-861987-93
3 15239000 Bradley River near Homer a54
aIn the summer 1990, additional water was diverted into the basin, which changed the current drainage area to about 65 mi2.
1957-1990
28 15276000 Ship Creek near Anchorage 90.5 1946-
4 15239050 Middle Fork Bradley River near Homer
9.25 1979- 29 15276570 Ship Creek below Power Plant at Elmendorf Air Force Base
115 1971-81
5 15239900 Anchor River near Anchor Point 137 1965-731979-86
30 15277100 Eagle River at Eagle River 192 1966-81
6 15240000 Anchor River at Anchor Point 224 1953-66 31 15277410 Peters Creek near Birchwood 87.8 1973-83
7 15241600 Ninilchik River at Ninilchik 131 1963-85 32 15281000 Knik River near Palmer 1,180 1960-881992
8 15242000 Kasilof River near Kasilof 738 1949-70 33 15282000 Caribou Creek near Sutton 289 1955-78
9 15244000 Ptarmigan Creek at Lawing 32.6 1947-58 34 15284000 Matanuska River at Palmer 2,070 1949-731985-86
10 15246000 Grant Creek near Moose Pass 44.2 1947-58 35 15290000 Little Susitna River near Palmer 61.9 1948-
11 15248000 Trail River near Lawing 181 1947-741975-77
36 15291000 Susitna River near Denali 950 1957-661968-86
12 15254000 Crescent Creek near Cooper Landing
31.7 1949-66 37 15291200 Maclaren River near Paxson 280 1958-86
13 15258000 Kenai River at Cooper Landing 634 1947- 38 15291500 Susitna River near Cantwell 4,140 1961-721980-86
14 15260000 Cooper Creek near Cooper Landing
31.8 1949-59 39 15292000 Susitna River at Gold Creek 6,160 1949-96
15 15264000 Russian River near Cooper Landing
61.8 1947-54 40 15292400 Chulitna River near Talkeetna 2,570 1958-721980-86
16 15266300 Kenai River at Soldotna 2,010 1965- 41 15292700 Talkeetna River near Talkeetna 2,006 1964-
17 15266500 Beaver Creek near Kenai 51 1968-78 42 15294005 Willow Creek near Willow 166 1978-93
18 15267900 Resurrection Creek near Hope 149 1968-86 43 15274010 Deception Creek near Willow 48.0 1978-85
19 15271000 Sixmile Creek near Hope 234 1979-90 44 15294100 Deshka River near Willow 592 1979-86
20 15272280 Portage River at Lake Outlet near Whittier
40.5 1989- 45 15294300 Skwentna River near Skwentna 2,250 1960-82
21 15272550 Glacier Creek at Girdwood 58.2 1965-78 46 15294350 Susitna River at Susitna Station 19,400 1975-93
22 15273900 South Fork Campbell Creek at Canyon Mouth near Anchorage
25.2 1967-79 47 15294410 Capps Creek below North Capps Creek near Tyonek
10.5 1979-85
23 15274000 South Fork Campbell Creek near Anchorage
30.4 1947-71 48 15294450 Chuitna River near Tyonek 131 1976-86
24 15274300 North Fork Campbell Creek near Anchorage
13.4 1974-84 49 15294500 Chakachatna River near Tyonek 1,120 1959-72
25 15274600 Campbell Creek near Spenard 69.7 1966-93
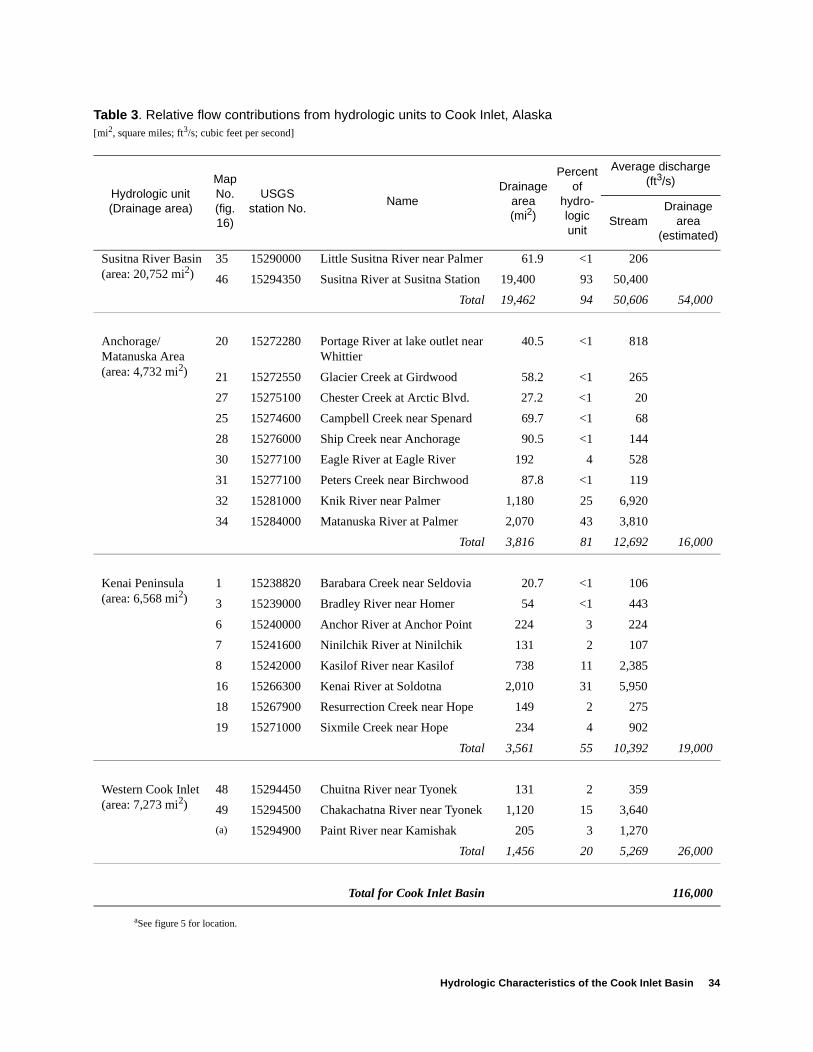
Hydrologic Characteristics of the Cook Inlet Basin 34
Table 3. Relative flow contributions from hydrologic units to Cook Inlet, Alaska[mi2, square miles; ft3/s; cubic feet per second]
Hydrologic unit (Drainage area)
Map No. (fig. 16)
USGS station No.
NameDrainage
area(mi2)
Percent of
hydro-logicunit
Average discharge(ft3/s)
StreamDrainage
area(estimated)
Susitna River Basin (area: 20,752 mi2)
35 15290000 Little Susitna River near Palmer 61.9 <1 206
46 15294350 Susitna River at Susitna Station 19,400 93 50,400
Total 19,462 94 50,606 54,000
Anchorage/Matanuska Area(area: 4,732 mi2)
20 15272280 Portage River at lake outlet near Whittier
40.5 <1 818
21 15272550 Glacier Creek at Girdwood 58.2 <1 265
27 15275100 Chester Creek at Arctic Blvd. 27.2 <1 20
25 15274600 Campbell Creek near Spenard 69.7 <1 68
28 15276000 Ship Creek near Anchorage 90.5 <1 144
30 15277100 Eagle River at Eagle River 192 4 528
31 15277100 Peters Creek near Birchwood 87.8 <1 119
32 15281000 Knik River near Palmer 1,180 25 6,920
34 15284000 Matanuska River at Palmer 2,070 43 3,810
Total 3,816 81 12,692 16,000
Kenai Peninsula(area: 6,568 mi2)
1 15238820 Barabara Creek near Seldovia 20.7 <1 106
3 15239000 Bradley River near Homer 54 <1 443
6 15240000 Anchor River at Anchor Point 224 3 224
7 15241600 Ninilchik River at Ninilchik 131 2 107
8 15242000 Kasilof River near Kasilof 738 11 2,385
16 15266300 Kenai River at Soldotna 2,010 31 5,950
18 15267900 Resurrection Creek near Hope 149 2 275
19 15271000 Sixmile Creek near Hope 234 4 902
Total 3,561 55 10,392 19,000
Western Cook Inlet (area: 7,273 mi2)
48 15294450 Chuitna River near Tyonek 131 2 359
49 15294500 Chakachatna River near Tyonek 1,120 15 3,640
(a) 15294900 Paint River near Kamishak 205 3 1,270
Total 1,456 20 5,269 26,000
Total for Cook Inlet Basin 116,000
aSee figure 5 for location.
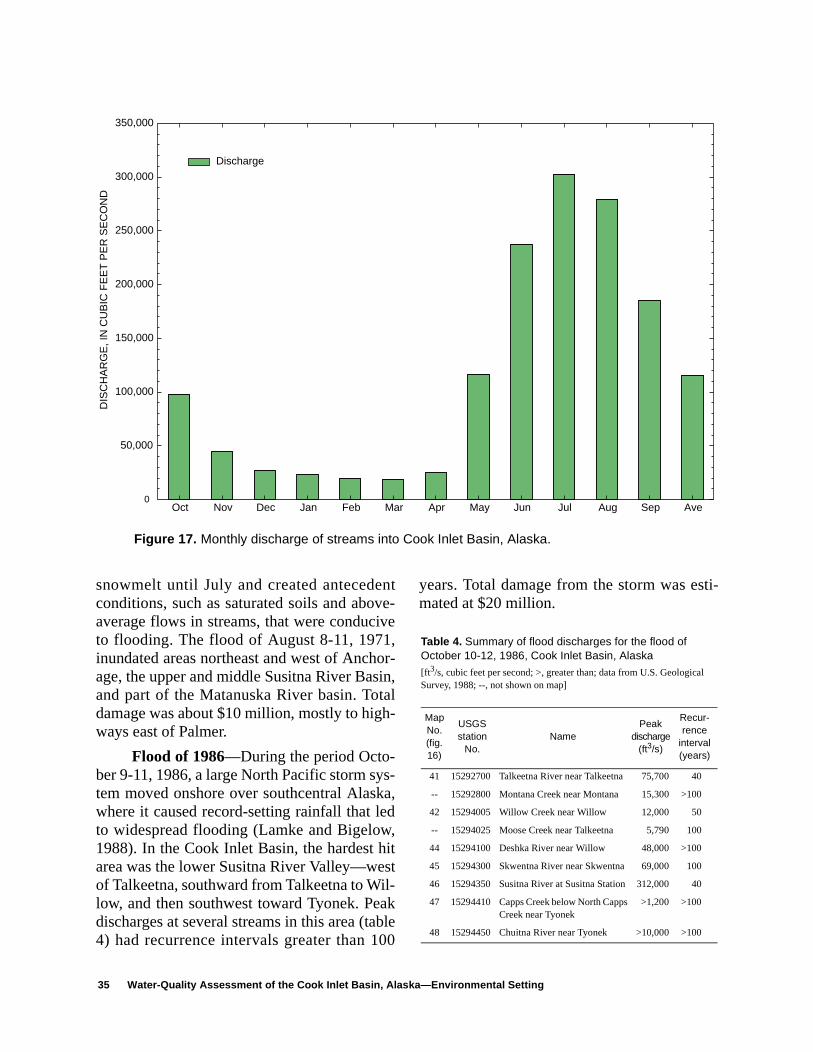
ti-
Oct Nov Dec Jan Feb Mar Apr May Jun Jul Aug Sep Ave
350,000
50,000
100,000
150,000
200,000
250,000
300,000
DIS
CH
AR
GE
, IN
CU
BIC
FE
ET
PE
R S
EC
ON
D
Discharge
0
Figure 17. Monthly discharge of streams into Cook Inlet Basin, Alaska.
snowmelt until July and created antecedentconditions, such as saturated soils and above-average flows in streams, that were conduciveto flooding. The flood of August 8-11, 1971,inundated areas northeast and west of Anchor-age, the upper and middle Susitna River Basin,and part of the Matanuska River basin. Totaldamage was about $10 million, mostly to high-ways east of Palmer.
Flood of 1986—During the period Octo-ber 9-11, 1986, a large North Pacific storm sys-tem moved onshore over southcentral Alaska,where it caused record-setting rainfall that ledto widespread flooding (Lamke and Bigelow,1988). In the Cook Inlet Basin, the hardest hitarea was the lower Susitna River Valley—westof Talkeetna, southward from Talkeetna to Wil-low, and then southwest toward Tyonek. Peakdischarges at several streams in this area (table4) had recurrence intervals greater than 100
years. Total damage from the storm was esmated at $20 million.
Table 4. Summary of flood discharges for the flood of October 10-12, 1986, Cook Inlet Basin, Alaska
[ft3/s, cubic feet per second; >, greater than; data from U.S. Geological Survey, 1988; --, not shown on map]
Map No. (fig. 16)
USGS station
No.Name
Peak discharge
(ft3/s)
Recur-rence
interval(years)
41 15292700 Talkeetna River near Talkeetna 75,700 40
-- 15292800 Montana Creek near Montana 15,300 >100
42 15294005 Willow Creek near Willow 12,000 50
-- 15294025 Moose Creek near Talkeetna 5,790 100
44 15294100 Deshka River near Willow 48,000 >100
45 15294300 Skwentna River near Skwentna 69,000 100
46 15294350 Susitna River at Susitna Station 312,000 40
47 15294410 Capps Creek below North Capps Creek near Tyonek
>1,200 >100
48 15294450 Chuitna River near Tyonek >10,000 >100
35 Water-Quality Assessment of the Cook Inlet Basin, Alaska—Environmental Setting
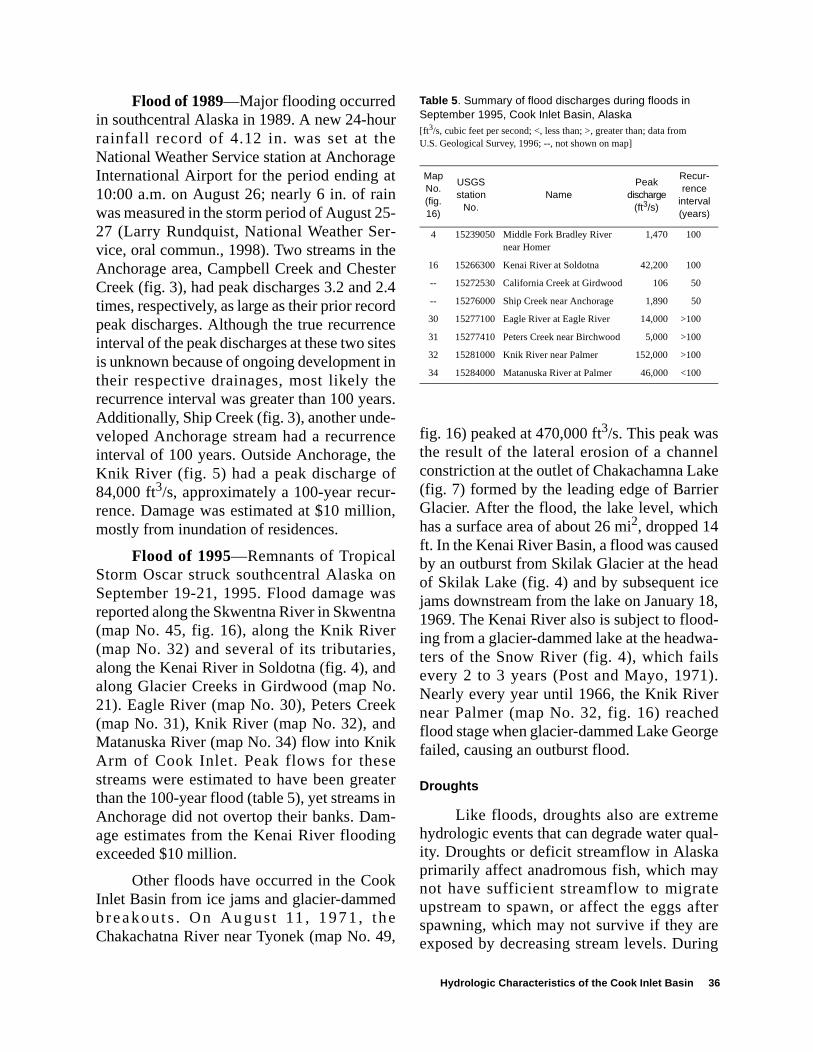
elker
dde8,
d-a-
).rd
ge
eal-
yetereng
Flood of 1989—Major flooding occurredin southcentral Alaska in 1989. A new 24-horainfall record of 4.12 in. was set at thNational Weather Service station at AnchoraInternational Airport for the period ending a10:00 a.m. on August 26; nearly 6 in. of rawas measured in the storm period of August 227 (Larry Rundquist, National Weather Sevice, oral commun., 1998). Two streams in tAnchorage area, Campbell Creek and ChesCreek (fig. 3), had peak discharges 3.2 and times, respectively, as large as their prior recopeak discharges. Although the true recurreninterval of the peak discharges at these two sis unknown because of ongoing developmenttheir respective drainages, most likely threcurrence interval was greater than 100 yeaAdditionally, Ship Creek (fig. 3), another undeveloped Anchorage stream had a recurreninterval of 100 years. Outside Anchorage, tKnik River (fig. 5) had a peak discharge o84,000 ft3/s, approximately a 100-year recurence. Damage was estimated at $10 milliomostly from inundation of residences.
Flood of 1995—Remnants of TropicalStorm Oscar struck southcentral Alaska oSeptember 19-21, 1995. Flood damage wreported along the Skwentna River in Skwent(map No. 45, fig. 16), along the Knik Rive(map No. 32) and several of its tributariealong the Kenai River in Soldotna (fig. 4), analong Glacier Creeks in Girdwood (map No21). Eagle River (map No. 30), Peters Cre(map No. 31), Knik River (map No. 32), anMatanuska River (map No. 34) flow into KnikArm of Cook Inlet. Peak flows for thesestreams were estimated to have been greathan the 100-year flood (table 5), yet streamsAnchorage did not overtop their banks. Damage estimates from the Kenai River floodinexceeded $10 million.
Other floods have occurred in the CooInlet Basin from ice jams and glacier-dammebreakouts . On August 11 , 1971, thChakachatna River near Tyonek (map No. 4
uregetin5-r-heter2.4rdce
ites iners.-ce
hef
r-n,
nasnars,d.
ekd
ter in-
g
kde9,
fig. 16) peaked at 470,000 ft3/s. This peak wasthe result of the lateral erosion of a channconstriction at the outlet of Chakachamna La(fig. 7) formed by the leading edge of BarrieGlacier. After the flood, the lake level, whichhas a surface area of about 26 mi2, dropped 14ft. In the Kenai River Basin, a flood was causeby an outburst from Skilak Glacier at the heaof Skilak Lake (fig. 4) and by subsequent icjams downstream from the lake on January 11969. The Kenai River also is subject to flooing from a glacier-dammed lake at the headwters of the Snow River (fig. 4), which failsevery 2 to 3 years (Post and Mayo, 1971Nearly every year until 1966, the Knik Rivenear Palmer (map No. 32, fig. 16) reacheflood stage when glacier-dammed Lake Georfailed, causing an outburst flood.
Droughts
Like floods, droughts also are extremhydrologic events that can degrade water quity. Droughts or deficit streamflow in Alaskaprimarily affect anadromous fish, which manot have sufficient streamflow to migratupstream to spawn, or affect the eggs afspawning, which may not survive if they arexposed by decreasing stream levels. Duri
Table 5. Summary of flood discharges during floods inSeptember 1995, Cook Inlet Basin, Alaska[ft3/s, cubic feet per second; <, less than; >, greater than; data from U.S. Geological Survey, 1996; --, not shown on map]
Map No. (fig. 16)
USGS station
No.Name
Peak discharge
(ft3/s)
Recur-rence
interval(years)
4 15239050 Middle Fork Bradley River near Homer
1,470 100
16 15266300 Kenai River at Soldotna 42,200 100
-- 15272530 California Creek at Girdwood 106 50
-- 15276000 Ship Creek near Anchorage 1,890 50
30 15277100 Eagle River at Eagle River 14,000 >100
31 15277410 Peters Creek near Birchwood 5,000 >100
32 15281000 Knik River near Palmer 152,000 >100
34 15284000 Matanuska River at Palmer 46,000 <100
Hydrologic Characteristics of the Cook Inlet Basin 36
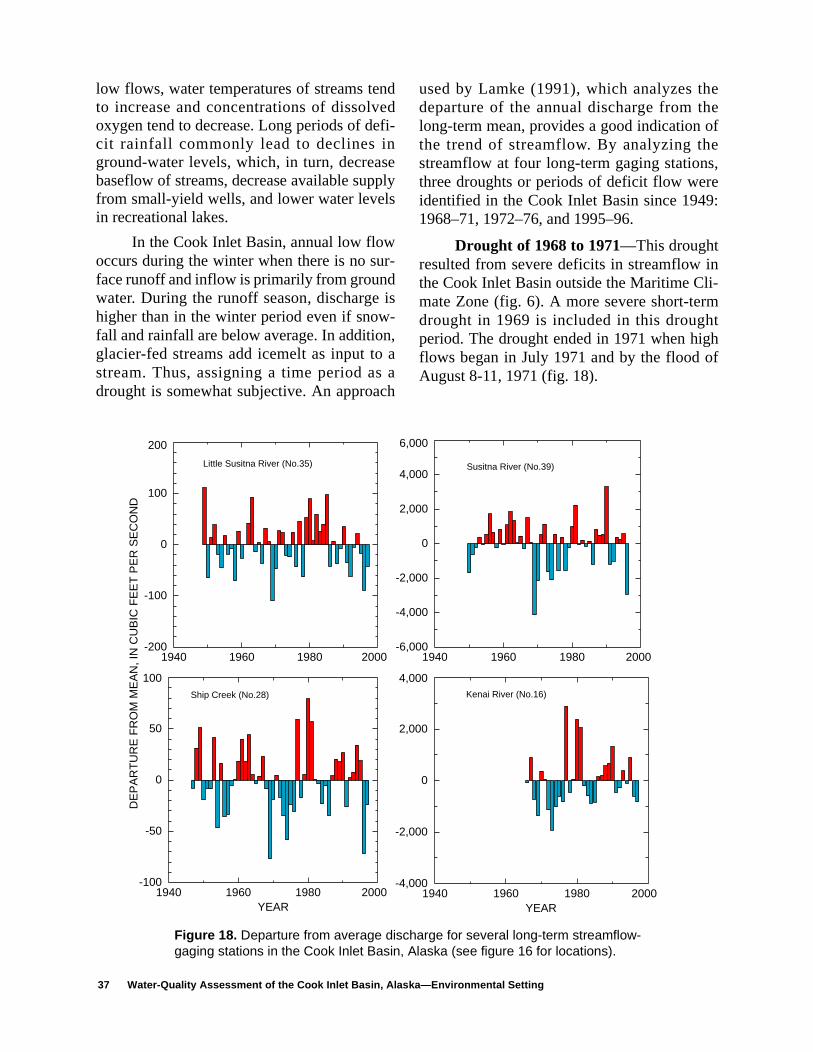
ini-mt
ghf
low flows, water temperatures of streams tendto increase and concentrations of dissolvedoxygen tend to decrease. Long periods of defi-cit rainfall commonly lead to declines inground-water levels, which, in turn, decreasebaseflow of streams, decrease available supplyfrom small-yield wells, and lower water levelsin recreational lakes.
In the Cook Inlet Basin, annual low flowoccurs during the winter when there is no sur-face runoff and inflow is primarily from groundwater. During the runoff season, discharge ishigher than in the winter period even if snow-fall and rainfall are below average. In addition,glacier-fed streams add icemelt as input to astream. Thus, assigning a time period as adrought is somewhat subjective. An approach
used by Lamke (1991), which analyzes thedeparture of the annual discharge from thelong-term mean, provides a good indication ofthe trend of streamflow. By analyzing thestreamflow at four long-term gaging stations,three droughts or periods of deficit flow wereidentified in the Cook Inlet Basin since 1949:1968–71, 1972–76, and 1995–96.
Drought of 1968 to 1971—This droughtresulted from severe deficits in streamflow the Cook Inlet Basin outside the Maritime Clmate Zone (fig. 6). A more severe short-terdrought in 1969 is included in this droughperiod. The drought ended in 1971 when hiflows began in July 1971 and by the flood oAugust 8-11, 1971 (fig. 18).
37 Water-Quality Assessment of the Cook Inlet Basin, Alaska—Environmental Setting
1940 20001960 1980-200
200
-100
100
Little Susitna River (No.35)
1940 20001960 1980-6,000
6,000
-4,000
-2,000
2,000
4,000Susitna River (No.39)
1940 20001960 1980YEAR
-100
100
-50
0
50
DE
PA
RT
UR
E F
RO
M M
EA
N, I
N C
UB
IC F
EE
T P
ER
SE
CO
ND
Ship Creek (No.28)
2000YEAR
-4,000
4,000
-2,000
2,000
Kenai River (No.16)
1940 1960 1980
0 0
0
Figure 18. Departure from average discharge for several long-term streamflow-gaging stations in the Cook Inlet Basin, Alaska (see figure 16 for locations).
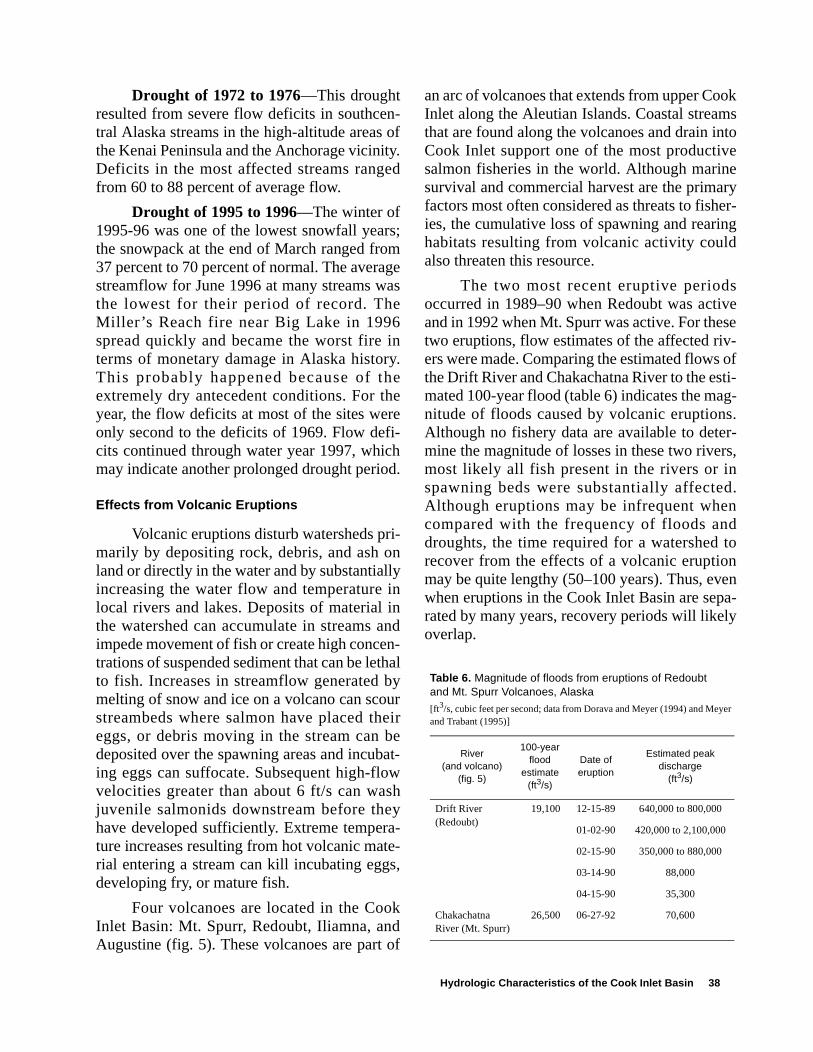
okstoeeryer-ng
svesev- ofti-g-s.r-rs,
d.ndtonena-
ly
Drought of 1972 to 1976—This droughtresulted from severe flow deficits in southcetral Alaska streams in the high-altitude areasthe Kenai Peninsula and the Anchorage viciniDeficits in the most affected streams rangfrom 60 to 88 percent of average flow.
Drought of 1995 to 1996—The winter of1995-96 was one of the lowest snowfall yeathe snowpack at the end of March ranged fro37 percent to 70 percent of normal. The averastreamflow for June 1996 at many streams wthe lowest for their period of record. ThMiller’s Reach fire near Big Lake in 1996spread quickly and became the worst fire terms of monetary damage in Alaska historThis probably happened because of thextremely dry antecedent conditions. For thyear, the flow deficits at most of the sites weonly second to the deficits of 1969. Flow defcits continued through water year 1997, whicmay indicate another prolonged drought perio
Effects from Volcanic Eruptions
Volcanic eruptions disturb watersheds prmarily by depositing rock, debris, and ash oland or directly in the water and by substantialincreasing the water flow and temperature local rivers and lakes. Deposits of material the watershed can accumulate in streams aimpede movement of fish or create high concetrations of suspended sediment that can be leto fish. Increases in streamflow generated melting of snow and ice on a volcano can scostreambeds where salmon have placed theggs, or debris moving in the stream can deposited over the spawning areas and incubing eggs can suffocate. Subsequent high-flovelocities greater than about 6 ft/s can wajuvenile salmonids downstream before thehave developed sufficiently. Extreme temperture increases resulting from hot volcanic matrial entering a stream can kill incubating eggdeveloping fry, or mature fish.
Four volcanoes are located in the CooInlet Basin: Mt. Spurr, Redoubt, Iliamna, anAugustine (fig. 5). These volcanoes are part
n- ofty.ed
rs;mgease
iny.ee
rei-hd.
i-nlyininndn-
thalbyureirbeat-w
shy
a-e-s,
kdof
an arc of volcanoes that extends from upper CoInlet along the Aleutian Islands. Coastal streamthat are found along the volcanoes and drain inCook Inlet support one of the most productivsalmon fisheries in the world. Although marinsurvival and commercial harvest are the primafactors most often considered as threats to fishies, the cumulative loss of spawning and rearihabitats resulting from volcanic activity couldalso threaten this resource.
The two most recent eruptive periodoccurred in 1989–90 when Redoubt was actiand in 1992 when Mt. Spurr was active. For thetwo eruptions, flow estimates of the affected riers were made. Comparing the estimated flowsthe Drift River and Chakachatna River to the esmated 100-year flood (table 6) indicates the manitude of floods caused by volcanic eruptionAlthough no fishery data are available to detemine the magnitude of losses in these two rivemost likely all fish present in the rivers or inspawning beds were substantially affecteAlthough eruptions may be infrequent whecompared with the frequency of floods androughts, the time required for a watershed recover from the effects of a volcanic eruptiomay be quite lengthy (50–100 years). Thus, evwhen eruptions in the Cook Inlet Basin are seprated by many years, recovery periods will likeoverlap.
Table 6. Magnitude of floods from eruptions of Redoubt and Mt. Spurr Volcanoes, Alaska
[ft3/s, cubic feet per second; data from Dorava and Meyer (1994) and Meyer and Trabant (1995)]
River(and volcano)
(fig. 5)
100-year flood
estimate (ft3/s)
Date of eruption
Estimated peak discharge
(ft3/s)
Drift River(Redoubt)
19,100 12-15-89 640,000 to 800,000
01-02-90 420,000 to 2,100,000
02-15-90 350,000 to 880,000
03-14-90 88,000
04-15-90 35,300
Chakachatna River (Mt. Spurr)
26,500 06-27-92 70,600
Hydrologic Characteristics of the Cook Inlet Basin 38
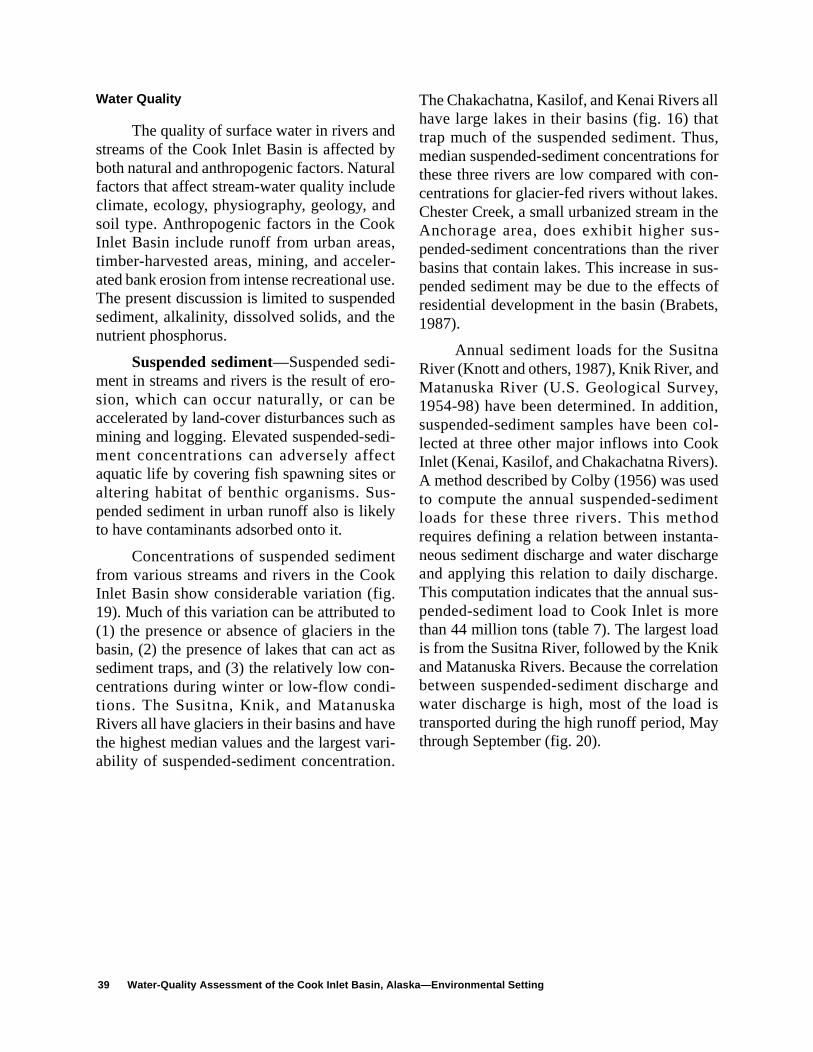
allatus, forn-s.thes-
verus- ofts,
ady,n,col-k).edentda-rge.s-
red
kionnd
isy
Water Quality
The quality of surface water in rivers andstreams of the Cook Inlet Basin is affected byboth natural and anthropogenic factors. Naturalfactors that affect stream-water quality includeclimate, ecology, physiography, geology, andsoil type. Anthropogenic factors in the CookInlet Basin include runoff from urban areas,timber-harvested areas, mining, and acceler-ated bank erosion from intense recreational use.The present discussion is limited to suspendedsediment, alkalinity, dissolved solids, and thenutrient phosphorus.
Suspended sediment—Suspended sedi-ment in streams and rivers is the result of ero-sion, which can occur naturally, or can beaccelerated by land-cover disturbances such asmining and logging. Elevated suspended-sedi-ment concentrations can adversely affectaquatic life by covering fish spawning sites oraltering habitat of benthic organisms. Sus-pended sediment in urban runoff also is likelyto have contaminants adsorbed onto it.
Concentrations of suspended sedimentfrom various streams and rivers in the CookInlet Basin show considerable variation (fig.19). Much of this variation can be attributed to(1) the presence or absence of glaciers in thebasin, (2) the presence of lakes that can act assediment traps, and (3) the relatively low con-centrations during winter or low-flow condi-tions. The Susitna, Knik, and MatanuskaRivers all have glaciers in their basins and havethe highest median values and the largest vari-ability of suspended-sediment concentration.
The Chakachatna, Kasilof, and Kenai Rivers have large lakes in their basins (fig. 16) thtrap much of the suspended sediment. Thmedian suspended-sediment concentrationsthese three rivers are low compared with cocentrations for glacier-fed rivers without lakeChester Creek, a small urbanized stream in Anchorage area, does exhibit higher supended-sediment concentrations than the ribasins that contain lakes. This increase in spended sediment may be due to the effectsresidential development in the basin (Brabe1987).
Annual sediment loads for the SusitnRiver (Knott and others, 1987), Knik River, anMatanuska River (U.S. Geological Surve1954-98) have been determined. In additiosuspended-sediment samples have been lected at three other major inflows into CooInlet (Kenai, Kasilof, and Chakachatna RiversA method described by Colby (1956) was usto compute the annual suspended-sedimloads for these three rivers. This methorequires defining a relation between instantneous sediment discharge and water dischaand applying this relation to daily dischargeThis computation indicates that the annual supended-sediment load to Cook Inlet is mothan 44 million tons (table 7). The largest loais from the Susitna River, followed by the Kniand Matanuska Rivers. Because the correlatbetween suspended-sediment discharge awater discharge is high, most of the load transported during the high runoff period, Mathrough September (fig. 20).
39 Water-Quality Assessment of the Cook Inlet Basin, Alaska—Environmental Setting
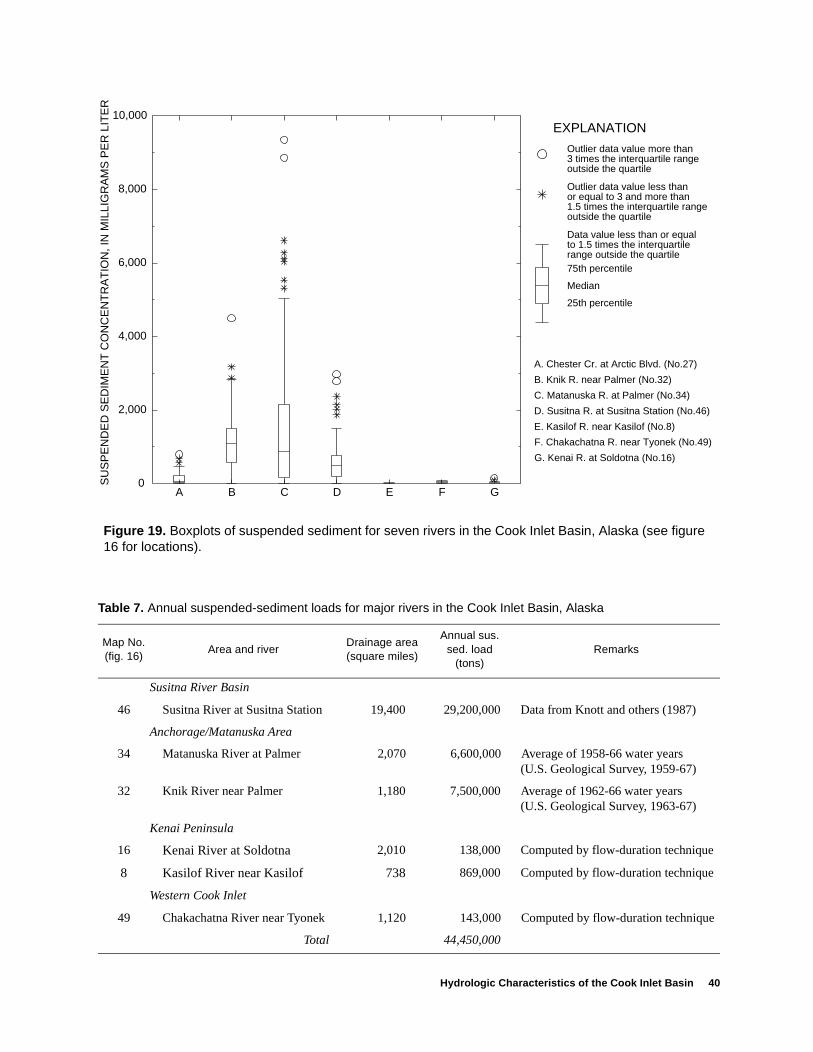
Hydrologic Characteristics of the Cook Inlet Basin 40
F. Chakachatna R. near Tyonek (No.49)
G. Kenai R. at Soldotna (No.16)
A. Chester Cr. at Arctic Blvd. (No.27)
B. Knik R. near Palmer (No.32)
C. Matanuska R. at Palmer (No.34)
D. Susitna R. at Susitna Station (No.46)
E. Kasilof R. near Kasilof (No.8)
25th percentile
Median
75th percentile
Data value less than or equal to 1.5 times the interquartilerange outside the quartile
Outlier data value less than or equal to 3 and more than 1.5 times the interquartile range outside the quartile
Outlier data value more than 3 times the interquartile range outside the quartile
EXPLANATION
A B C D E F G0
10,000
2,000
4,000
6,000
8,000
SU
SP
EN
DE
D S
ED
IME
NT
CO
NC
EN
TR
AT
ION
, IN
MIL
LIG
RA
MS
PE
R L
ITE
R
Figure 19. Boxplots of suspended sediment for seven rivers in the Cook Inlet Basin, Alaska (see figure16 for locations).
Table 7. Annual suspended-sediment loads for major rivers in the Cook Inlet Basin, Alaska
Map No.(fig. 16)
Area and riverDrainage area(square miles)
Annual sus. sed. load
(tons)Remarks
Susitna River Basin
46 Susitna River at Susitna Station 19,400 29,200,000 Data from Knott and others (1987)
Anchorage/Matanuska Area
34 Matanuska River at Palmer 2,070 6,600,000 Average of 1958-66 water years (U.S. Geological Survey, 1959-67)
32 Knik River near Palmer 1,180 7,500,000 Average of 1962-66 water years(U.S. Geological Survey, 1963-67)
Kenai Peninsula
16 Kenai River at Soldotna 2,010 138,000 Computed by flow-duration technique
8 Kasilof River near Kasilof 738 869,000 Computed by flow-duration technique
Western Cook Inlet
49 Chakachatna River near Tyonek 1,120 143,000 Computed by flow-duration technique
Total 44,450,000
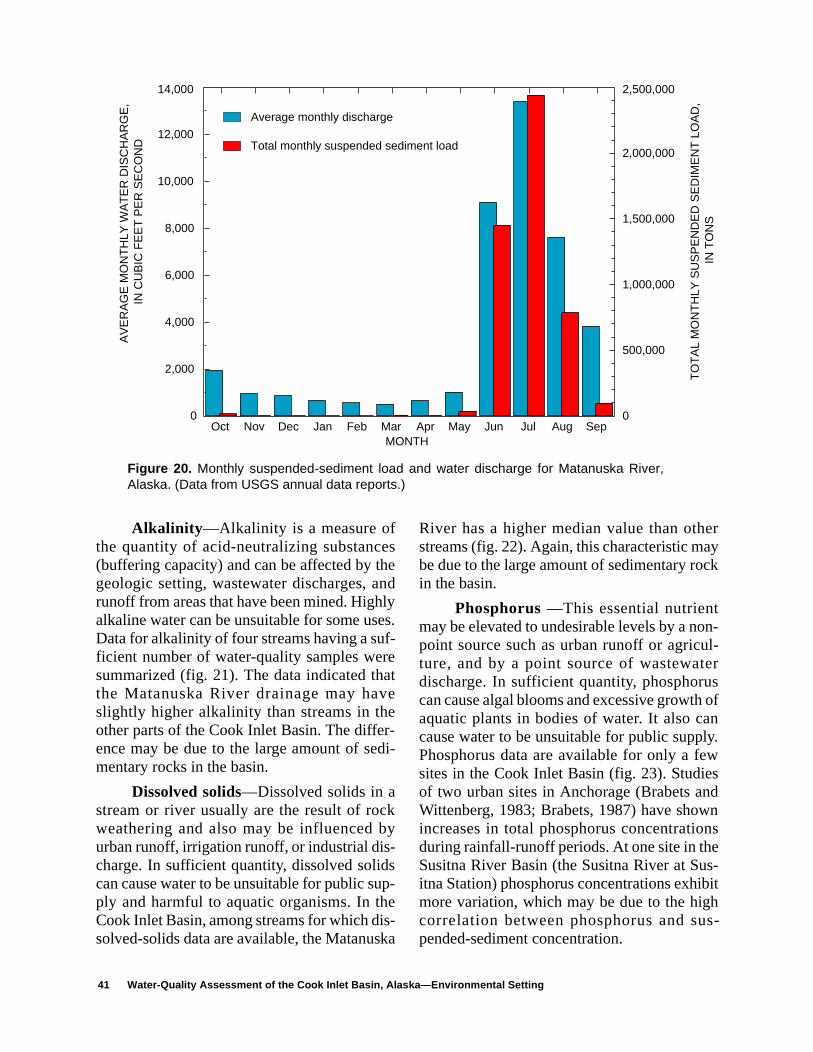
eryck
n-l-
ers ofn
ly.ws
ndn
nses-
biths-
Oct Nov Dec Jan Feb Mar Apr May Jun Jul Aug SepMONTH
0
14,000
2,000
4,000
6,000
8,000
10,000
12,000A
VE
RA
GE
MO
NT
HLY
WA
TE
R D
ISC
HA
RG
E,
IN C
UB
IC F
EE
T P
ER
SE
CO
ND
0
2,500,000
500,000
1,000,000
1,500,000
2,000,000
TO
TA
L M
ON
TH
LY S
US
PE
ND
ED
SE
DIM
EN
T L
OA
D,
IN T
ON
S
Average monthly discharge
Total monthly suspended sediment load
Figure 20. Monthly suspended-sediment load and water discharge for Matanuska River,Alaska. (Data from USGS annual data reports.)
Alkalinity—Alkalinity is a measure ofthe quantity of acid-neutralizing substances(buffering capacity) and can be affected by thegeologic setting, wastewater discharges, andrunoff from areas that have been mined. Highlyalkaline water can be unsuitable for some uses.Data for alkalinity of four streams having a suf-ficient number of water-quality samples weresummarized (fig. 21). The data indicated thatthe Matanuska River drainage may haveslightly higher alkalinity than streams in theother parts of the Cook Inlet Basin. The differ-ence may be due to the large amount of sedi-mentary rocks in the basin.
Dissolved solids—Dissolved solids in astream or river usually are the result of rockweathering and also may be influenced byurban runoff, irrigation runoff, or industrial dis-charge. In sufficient quantity, dissolved solidscan cause water to be unsuitable for public sup-ply and harmful to aquatic organisms. In theCook Inlet Basin, among streams for which dis-solved-solids data are available, the Matanuska
River has a higher median value than othstreams (fig. 22). Again, this characteristic mabe due to the large amount of sedimentary roin the basin.
Phosphorus —This essential nutrientmay be elevated to undesirable levels by a nopoint source such as urban runoff or agricuture, and by a point source of wastewatdischarge. In sufficient quantity, phosphorucan cause algal blooms and excessive growthaquatic plants in bodies of water. It also cacause water to be unsuitable for public suppPhosphorus data are available for only a fesites in the Cook Inlet Basin (fig. 23). Studieof two urban sites in Anchorage (Brabets aWittenberg, 1983; Brabets, 1987) have showincreases in total phosphorus concentratioduring rainfall-runoff periods. At one site in thSusitna River Basin (the Susitna River at Suitna Station) phosphorus concentrations exhimore variation, which may be due to the higcorrelation between phosphorus and supended-sediment concentration.
41 Water-Quality Assessment of the Cook Inlet Basin, Alaska—Environmental Setting
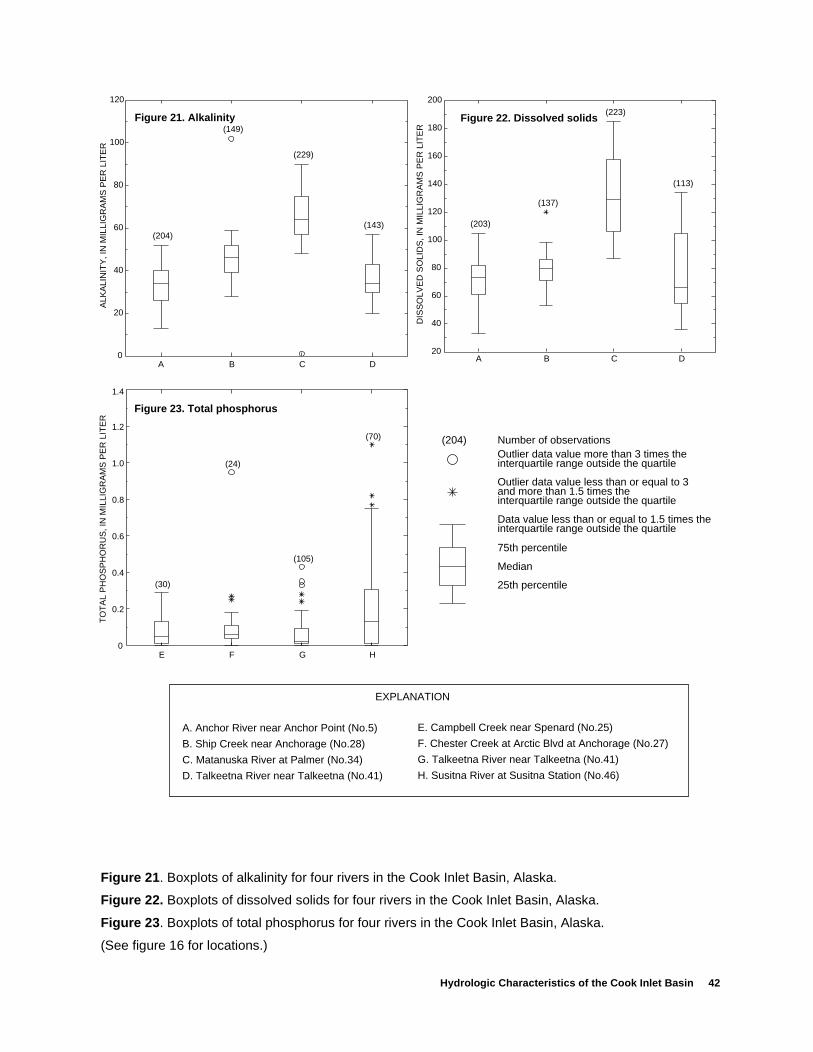
Hydrologic Characteristics of the Cook Inlet Basin 42
EXPLANATION
25th percentile
Median
75th percentile
interquartile range outside the quartileData value less than or equal to 1.5 times the
interquartile range outside the quartileand more than 1.5 times theOutlier data value less than or equal to 3
interquartile range outside the quartileOutlier data value more than 3 times the
(204) Number of observations
A. Anchor River near Anchor Point (No.5)
B. Ship Creek near Anchorage (No.28)
C. Matanuska River at Palmer (No.34)
D. Talkeetna River near Talkeetna (No.41)
E. Campbell Creek near Spenard (No.25)
F. Chester Creek at Arctic Blvd at Anchorage (No.27)
G. Talkeetna River near Talkeetna (No.41)
H. Susitna River at Susitna Station (No.46)
(30)
(24)
(105)
(70)
E F G H0
0.2
0.4
0.6
0.8
1.0
1.2
1.4
TO
TA
L P
HO
SP
HO
RU
S, I
N M
ILLI
GR
AM
S P
ER
LIT
ER
Figure 21. Alkalinity Figure 22. Dissolved solids
Figure 23. Total phosphorus
(204)
(149)
(229)
(143)
A B C D0
120
20
40
60
80
100
ALK
ALI
NIT
Y, I
N M
ILLI
GR
AM
S P
ER
LIT
ER
(203)
(137)
(223)
(113)
A B C D20
200
40
60
80
100
120
140
160
180
DIS
SO
LVE
D S
OLI
DS
, IN
MIL
LIG
RA
MS
PE
R L
ITE
R
Figure 21. Boxplots of alkalinity for four rivers in the Cook Inlet Basin, Alaska.
Figure 22. Boxplots of dissolved solids for four rivers in the Cook Inlet Basin, Alaska.
Figure 23. Boxplots of total phosphorus for four rivers in the Cook Inlet Basin, Alaska.
(See figure 16 for locations.)
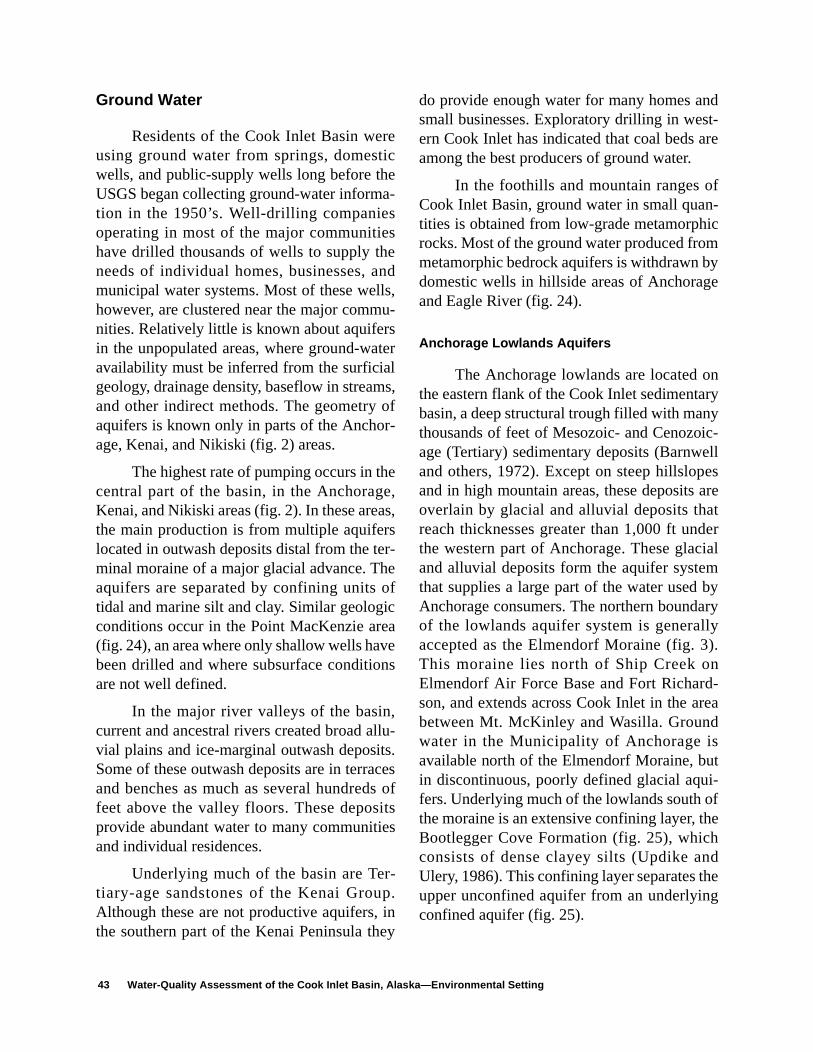
ndt-re
f-
icmye
nryy
ic-ll
esaret
derialmbyry
ly).n-
rea
ti-f
hehde
g
Ground Water
Residents of the Cook Inlet Basin wereusing ground water from springs, domesticwells, and public-supply wells long before theUSGS began collecting ground-water informa-tion in the 1950’s. Well-drilling companiesoperating in most of the major communitieshave drilled thousands of wells to supply theneeds of individual homes, businesses, andmunicipal water systems. Most of these wells,however, are clustered near the major commu-nities. Relatively little is known about aquifersin the unpopulated areas, where ground-wateravailability must be inferred from the surficialgeology, drainage density, baseflow in streams,and other indirect methods. The geometry ofaquifers is known only in parts of the Anchor-age, Kenai, and Nikiski (fig. 2) areas.
The highest rate of pumping occurs in thecentral part of the basin, in the Anchorage,Kenai, and Nikiski areas (fig. 2). In these areas,the main production is from multiple aquiferslocated in outwash deposits distal from the ter-minal moraine of a major glacial advance. Theaquifers are separated by confining units oftidal and marine silt and clay. Similar geologicconditions occur in the Point MacKenzie area(fig. 24), an area where only shallow wells havebeen drilled and where subsurface conditionsare not well defined.
In the major river valleys of the basin,current and ancestral rivers created broad allu-vial plains and ice-marginal outwash deposits.Some of these outwash deposits are in terracesand benches as much as several hundreds offeet above the valley floors. These depositsprovide abundant water to many communitiesand individual residences.
Underlying much of the basin are Ter-tiary-age sandstones of the Kenai Group.Although these are not productive aquifers, inthe southern part of the Kenai Peninsula they
do provide enough water for many homes asmall businesses. Exploratory drilling in wesern Cook Inlet has indicated that coal beds aamong the best producers of ground water.
In the foothills and mountain ranges oCook Inlet Basin, ground water in small quantities is obtained from low-grade metamorphrocks. Most of the ground water produced frometamorphic bedrock aquifers is withdrawn bdomestic wells in hillside areas of Anchoragand Eagle River (fig. 24).
Anchorage Lowlands Aquifers
The Anchorage lowlands are located othe eastern flank of the Cook Inlet sedimentabasin, a deep structural trough filled with manthousands of feet of Mesozoic- and Cenozoage (Tertiary) sedimentary deposits (Barnweand others, 1972). Except on steep hillslopand in high mountain areas, these deposits overlain by glacial and alluvial deposits thareach thicknesses greater than 1,000 ft unthe western part of Anchorage. These glacand alluvial deposits form the aquifer systethat supplies a large part of the water used Anchorage consumers. The northern boundaof the lowlands aquifer system is generalaccepted as the Elmendorf Moraine (fig. 3This moraine lies north of Ship Creek oElmendorf Air Force Base and Fort Richardson, and extends across Cook Inlet in the abetween Mt. McKinley and Wasilla. Groundwater in the Municipality of Anchorage isavailable north of the Elmendorf Moraine, buin discontinuous, poorly defined glacial aqufers. Underlying much of the lowlands south othe moraine is an extensive confining layer, tBootlegger Cove Formation (fig. 25), whicconsists of dense clayey silts (Updike anUlery, 1986). This confining layer separates thupper unconfined aquifer from an underlyinconfined aquifer (fig. 25).
43 Water-Quality Assessment of the Cook Inlet Basin, Alaska—Environmental Setting
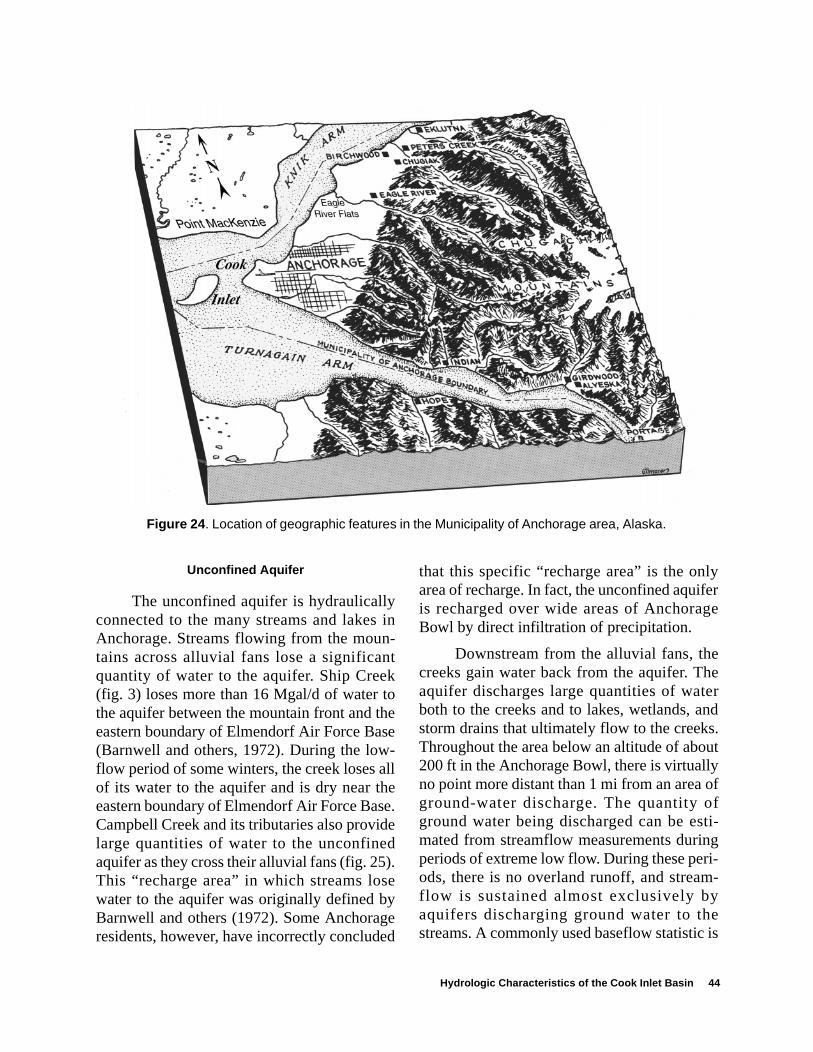
lyferge
ee
ernds.ut
y offti-
ngi-m-ye is
Figure 24. Location of geographic features in the Municipality of Anchorage area, Alaska.
Unconfined Aquifer
The unconfined aquifer is hydraulicallyconnected to the many streams and lakes inAnchorage. Streams flowing from the moun-tains across alluvial fans lose a significantquantity of water to the aquifer. Ship Creek(fig. 3) loses more than 16 Mgal/d of water tothe aquifer between the mountain front and theeastern boundary of Elmendorf Air Force Base(Barnwell and others, 1972). During the low-flow period of some winters, the creek loses allof its water to the aquifer and is dry near theeastern boundary of Elmendorf Air Force Base.Campbell Creek and its tributaries also providelarge quantities of water to the unconfinedaquifer as they cross their alluvial fans (fig. 25).This “recharge area” in which streams losewater to the aquifer was originally defined byBarnwell and others (1972). Some Anchorageresidents, however, have incorrectly concluded
that this specific “recharge area” is the onarea of recharge. In fact, the unconfined aquiis recharged over wide areas of AnchoraBowl by direct infiltration of precipitation.
Downstream from the alluvial fans, thcreeks gain water back from the aquifer. Thaquifer discharges large quantities of watboth to the creeks and to lakes, wetlands, astorm drains that ultimately flow to the creekThroughout the area below an altitude of abo200 ft in the Anchorage Bowl, there is virtuallno point more distant than 1 mi from an areaground-water discharge. The quantity oground water being discharged can be esmated from streamflow measurements duriperiods of extreme low flow. During these perods, there is no overland runoff, and streaflow is sustained almost exclusively baquifers discharging ground water to thstreams. A commonly used baseflow statistic
Hydrologic Characteristics of the Cook Inlet Basin 44
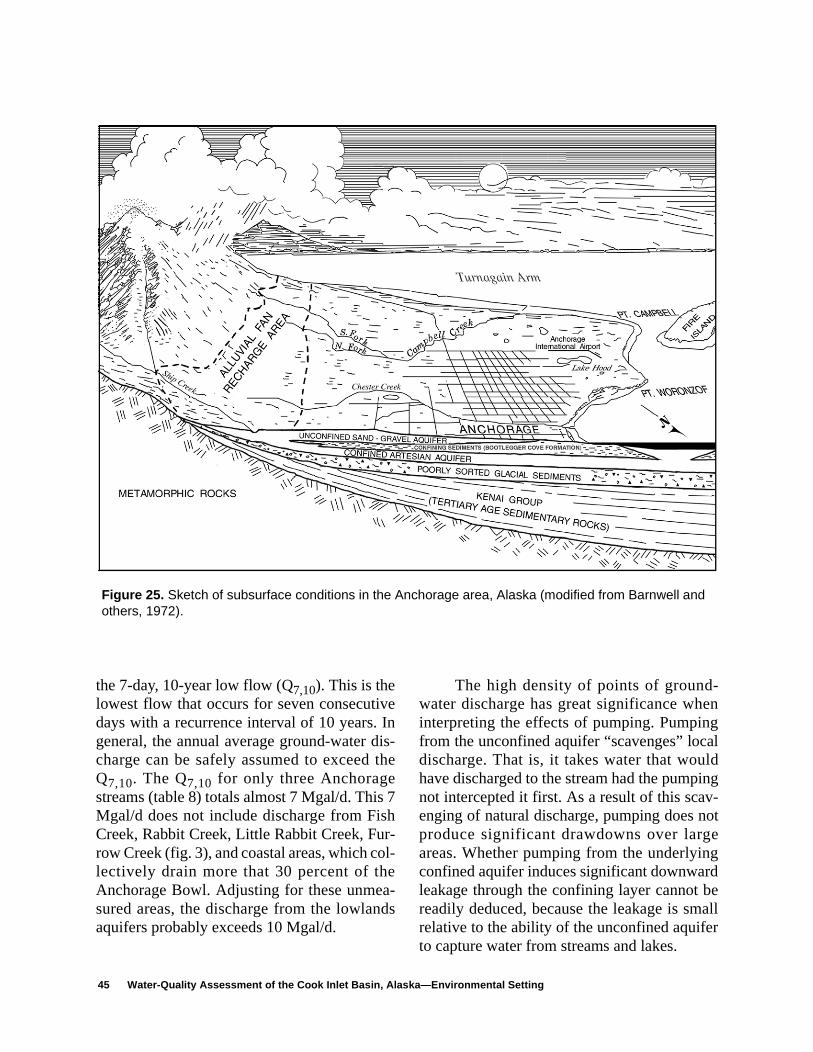
alldingv-otegdbeallr
Figure 25. Sketch of subsurface conditions in the Anchorage area, Alaska (modified from Barnwell and others, 1972).
the 7-day, 10-year low flow (Q7,10). This is thelowest flow that occurs for seven consecutivedays with a recurrence interval of 10 years. Ingeneral, the annual average ground-water dis-charge can be safely assumed to exceed theQ7,10. The Q7,10 for only three Anchoragestreams (table 8) totals almost 7 Mgal/d. This 7Mgal/d does not include discharge from FishCreek, Rabbit Creek, Little Rabbit Creek, Fur-row Creek (fig. 3), and coastal areas, which col-lectively drain more that 30 percent of theAnchorage Bowl. Adjusting for these unmea-sured areas, the discharge from the lowlandsaquifers probably exceeds 10 Mgal/d.
The high density of points of ground-water discharge has great significance wheninterpreting the effects of pumping. Pumpingfrom the unconfined aquifer “scavenges” locdischarge. That is, it takes water that wouhave discharged to the stream had the pumpnot intercepted it first. As a result of this scaenging of natural discharge, pumping does nproduce significant drawdowns over largareas. Whether pumping from the underlyinconfined aquifer induces significant downwarleakage through the confining layer cannot readily deduced, because the leakage is smrelative to the ability of the unconfined aquifeto capture water from streams and lakes.
45 Water-Quality Assessment of the Cook Inlet Basin, Alaska—Environmental Setting
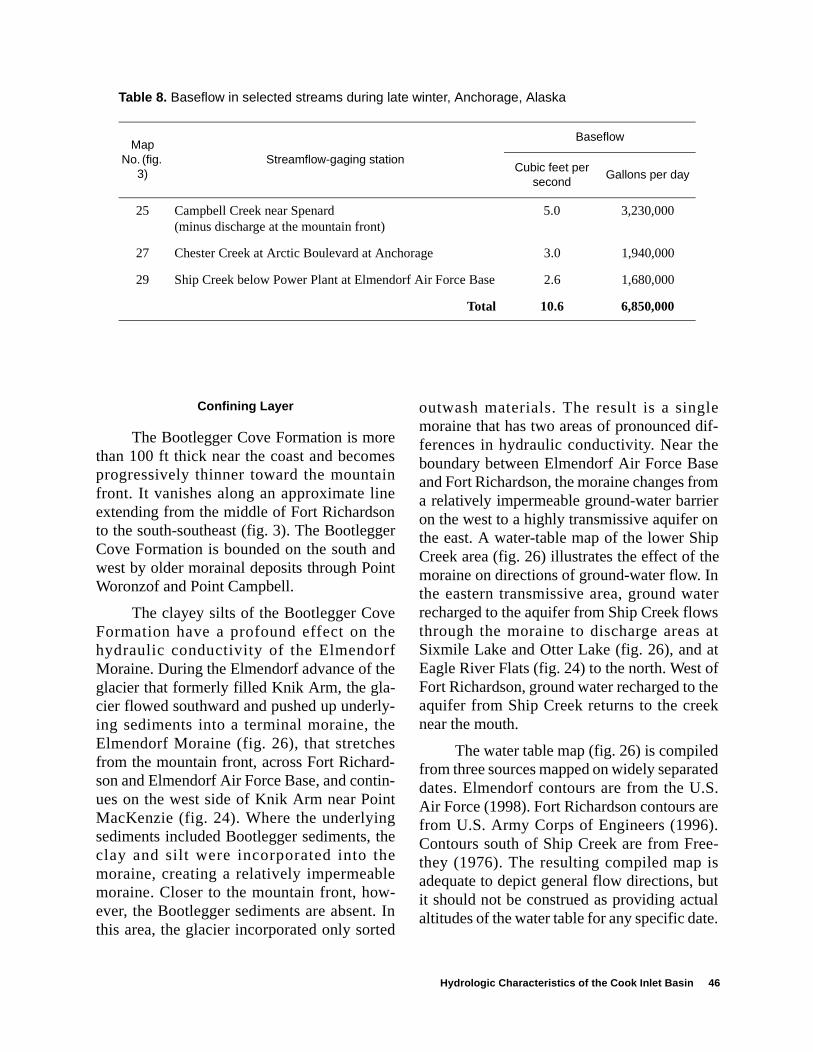
Table 8. Baseflow in selected streams during late winter, Anchorage, Alaska
Map No. (fig.
3)Streamflow-gaging station
Baseflow
Cubic feet per second
Gallons per day
25 Campbell Creek near Spenard(minus discharge at the mountain front)
5.0 3,230,000
27 Chester Creek at Arctic Boulevard at Anchorage 3.0 1,940,000
29 Ship Creek below Power Plant at Elmendorf Air Force Base 2.6 1,680,000
Total 10.6 6,850,000
Confining Layer
The Bootlegger Cove Formation is morethan 100 ft thick near the coast and becomesprogressively thinner toward the mountainfront. It vanishes along an approximate lineextending from the middle of Fort Richardsonto the south-southeast (fig. 3). The BootleggerCove Formation is bounded on the south andwest by older morainal deposits through PointWoronzof and Point Campbell.
The clayey silts of the Bootlegger CoveFormation have a profound effect on thehydraulic conductivity of the ElmendorfMoraine. During the Elmendorf advance of theglacier that formerly filled Knik Arm, the gla-cier flowed southward and pushed up underly-ing sediments into a terminal moraine, theElmendorf Moraine (fig. 26), that stretchesfrom the mountain front, across Fort Richard-son and Elmendorf Air Force Base, and contin-ues on the west side of Knik Arm near PointMacKenzie (fig. 24). Where the underlyingsediments included Bootlegger sediments, theclay and silt were incorporated into themoraine, creating a relatively impermeablemoraine. Closer to the mountain front, how-ever, the Bootlegger sediments are absent. Inthis area, the glacier incorporated only sorted
outwash materials. The result is a singlemoraine that has two areas of pronounced dif-ferences in hydraulic conductivity. Near theboundary between Elmendorf Air Force Baseand Fort Richardson, the moraine changes froma relatively impermeable ground-water barrieron the west to a highly transmissive aquifer onthe east. A water-table map of the lower ShipCreek area (fig. 26) illustrates the effect of themoraine on directions of ground-water flow. Inthe eastern transmissive area, ground waterrecharged to the aquifer from Ship Creek flowsthrough the moraine to discharge areas atSixmile Lake and Otter Lake (fig. 26), and atEagle River Flats (fig. 24) to the north. West ofFort Richardson, ground water recharged to theaquifer from Ship Creek returns to the creeknear the mouth.
The water table map (fig. 26) is compiledfrom three sources mapped on widely separateddates. Elmendorf contours are from the U.S.Air Force (1998). Fort Richardson contours arefrom U.S. Army Corps of Engineers (1996).Contours south of Ship Creek are from Free-they (1976). The resulting compiled map isadequate to depict general flow directions, butit should not be construed as providing actualaltitudes of the water table for any specific date.
Hydrologic Characteristics of the Cook Inlet Basin 46
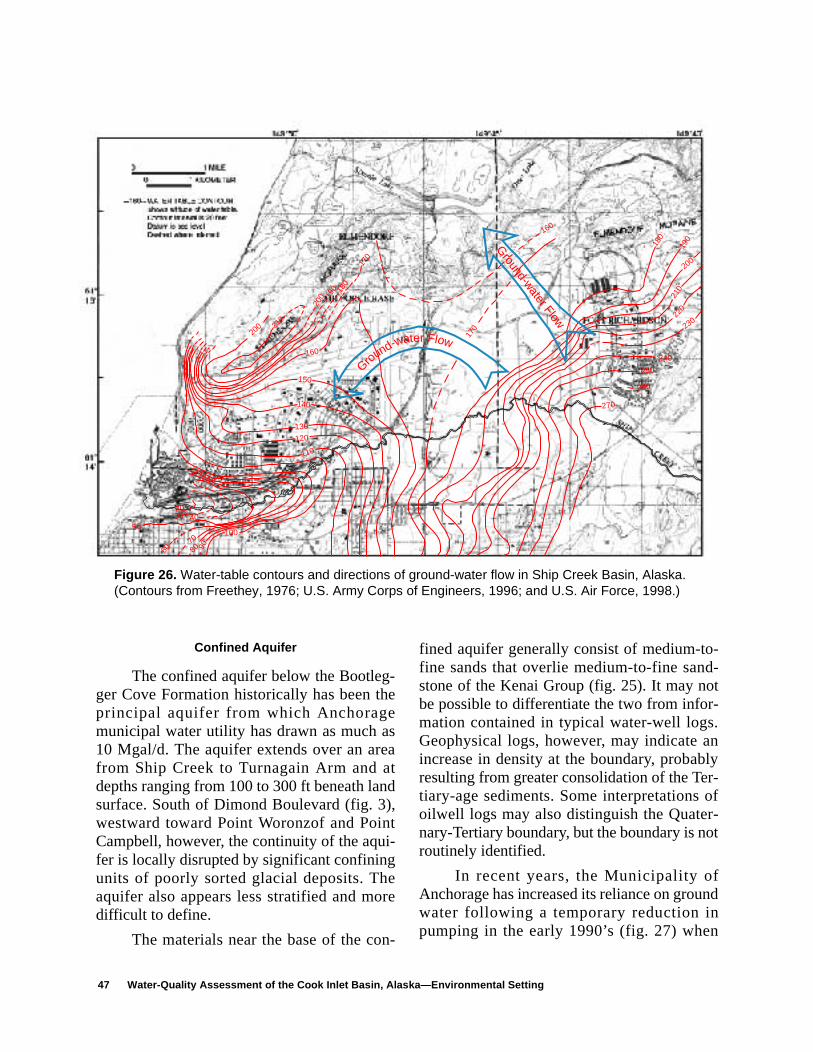
n
Ground-water Flow
Ground-water Flow
200
160
170
100
270
260
250
240
230
220
210
200
190
180
210
200 19
0 180
170
160
150
140
130
120
110
9080
70
60
504030
20
Figure 26. Water-table contours and directions of ground-water flow in Ship Creek Basin, Alaska. (Contours from Freethey, 1976; U.S. Army Corps of Engineers, 1996; and U.S. Air Force, 1998.)
Confined Aquifer
The confined aquifer below the Bootleg-ger Cove Formation historically has been theprincipal aquifer from which Anchoragemunicipal water utility has drawn as much as10 Mgal/d. The aquifer extends over an areafrom Ship Creek to Turnagain Arm and atdepths ranging from 100 to 300 ft beneath landsurface. South of Dimond Boulevard (fig. 3),westward toward Point Woronzof and PointCampbell, however, the continuity of the aqui-fer is locally disrupted by significant confiningunits of poorly sorted glacial deposits. Theaquifer also appears less stratified and moredifficult to define.
The materials near the base of the con-
fined aquifer generally consist of medium-to-fine sands that overlie medium-to-fine sand-stone of the Kenai Group (fig. 25). It may notbe possible to differentiate the two from infor-mation contained in typical water-well logs.Geophysical logs, however, may indicate anincrease in density at the boundary, probablyresulting from greater consolidation of the Ter-tiary-age sediments. Some interpretations ofoilwell logs may also distinguish the Quater-nary-Tertiary boundary, but the boundary is notroutinely identified.
In recent years, the Municipality ofAnchorage has increased its reliance on groundwater following a temporary reduction inpumping in the early 1990’s (fig. 27) whe
47 Water-Quality Assessment of the Cook Inlet Basin, Alaska—Environmental Setting
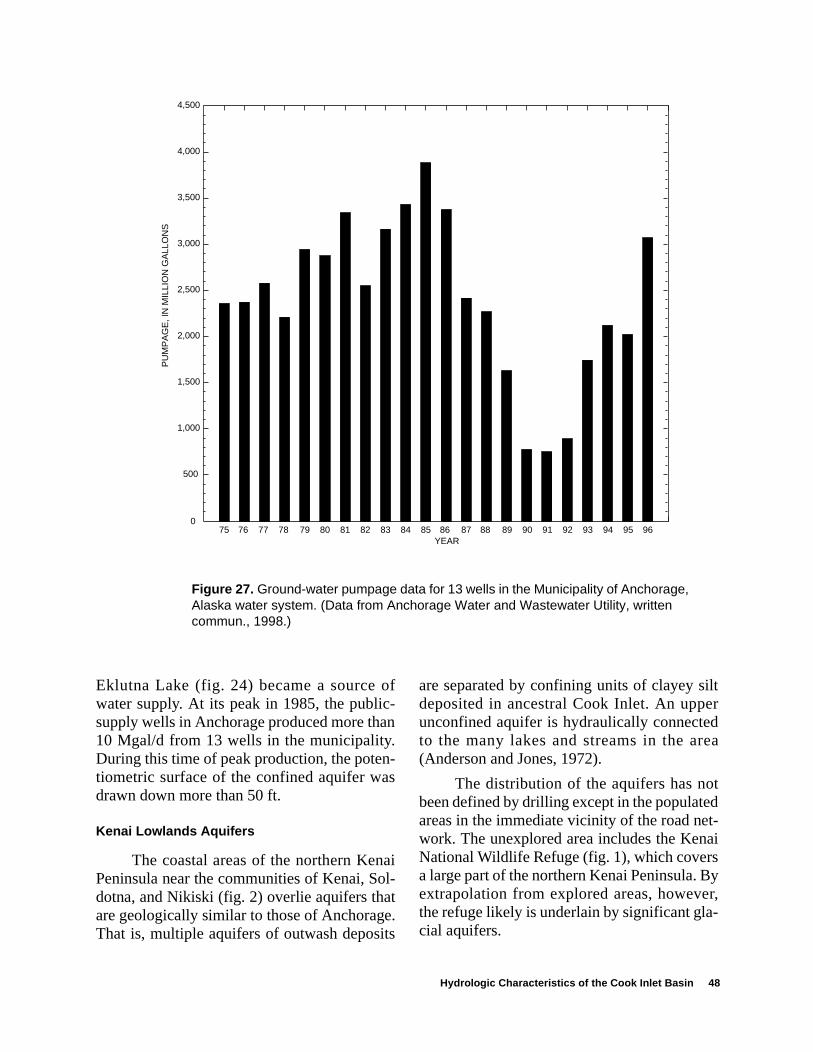
Figure 27. Ground-water pumpage data for 13 wells in the Municipality of Anchorage, Alaska water system. (Data from Anchorage Water and Wastewater Utility, written commun., 1998.)
0
4,500
500
1,000
1,500
2,000
2,500
3,000
3,500
4,000
PU
MP
AG
E, I
N M
ILLI
ON
GA
LLO
NS
75 76 77 78 79 80 81 82 83 84 85 86 87 88 89 90 91 92 93 94 95 96YEAR
Eklutna Lake (fig. 24) became a source ofwater supply. At its peak in 1985, the public-supply wells in Anchorage produced more than10 Mgal/d from 13 wells in the municipality.During this time of peak production, the poten-tiometric surface of the confined aquifer wasdrawn down more than 50 ft.
Kenai Lowlands Aquifers
The coastal areas of the northern KenaiPeninsula near the communities of Kenai, Sol-dotna, and Nikiski (fig. 2) overlie aquifers thatare geologically similar to those of Anchorage.That is, multiple aquifers of outwash deposits
are separated by confining units of clayey siltdeposited in ancestral Cook Inlet. An upperunconfined aquifer is hydraulically connectedto the many lakes and streams in the area(Anderson and Jones, 1972).
The distribution of the aquifers has notbeen defined by drilling except in the populatedareas in the immediate vicinity of the road net-work. The unexplored area includes the KenaiNational Wildlife Refuge (fig. 1), which coversa large part of the northern Kenai Peninsula. Byextrapolation from explored areas, however,the refuge likely is underlain by significant gla-cial aquifers.
Hydrologic Characteristics of the Cook Inlet Basin 48
Unconfined Aquifer
The last major advance of glaciers ema-nating from mountains in western Cook Inletterminated at a moraine that trends southwest-northeast through Nikiski. Outwash from thisand other glaciers entering the Kenai Lowlandsdeposited well-sorted sands and gravels that arethe unconfined aquifer of the region. Most ofthe lowlands area was periodically inundatedby marine waters of Cook Inlet. Fine-grainedmarine and tidal deposits commonly form thebase of the unconfined aquifer.
The unconfined aquifer is the principalaquifer supplying water to thousands of domes-tic wells in the Kenai lowlands. It is generallynot used, however, for the large industrial sup-plies in the Nikiski area nor for the municipalsupply wells in Kenai and Soldotna. In theNikiski area, early attempts to develop theunconfined aquifer for industrial water suppliescreated a drawdown of local lakes that wasunacceptable to lakeside residents. Industriesquickly converted to pumping the confinedaquifers instead.
It is likely that pumping from the deeperaquifers does have some effect on the uncon-fined aquifer. This effect appears to be mani-fested as a reduction in outflow from somestreams rather than a pronounced drawdown ofthe water table. For example, the outlet streamfrom Bernice Lake, about 1 mi east of Nikiski,largely has ceased to flow, except during briefperiods of snowmelt or heavy precipitation.
In the Kenai-Soldotna area, the KenaiRiver has incised through the unconfined aqui-fer. At Kenai, the aquifer can be seen in out-crops along the river bluffs near the harbor. Itappears as an unsaturated, buff-colored unitoverlying the dark gray confining layer that iskept wet by water discharging from the aquiferabove. Elsewhere in bluff exposures, the aqui-fer largely is covered by colluvium and not vis-ible. Springs along the bluff, however, mark thecontact between the unconfined aquifer and theconfining layer.
Alluvium adjacent to the Kenai River,although saturated, is not a commonly usedaquifer in the lower 10 mi of the river. In thisarea, the aquifer has been eroded by the riverand is too thin over the confining layer to sup-ply water to wells. Farther upstream, KenaiRiver alluvium and associated terrace depositsdo provide water to wells.
Confining Layer
Except in the Nikiski industrial area,drilling has been inadequate to define accu-rately the thickness and lateral extent of theconfining layer. In the Nikiski area, the confin-ing layer is about 100 ft below land surface andappears to reflect topography (Nelson, 1981).The confining layer under the industrial area isleaky, and drawdowns in the confined aquiferstabilize within days by inducing leakage fromthe overlying unconfined aquifer. The upperconfining layer appears to be only one of sev-eral confining units that separate multiple aqui-fers (fig. 28).
Upper Confined Aquifer
Where it has been explored, the upperconfined aquifer is about 100 ft thick and isbounded on the bottom by a thick confiningunit. It supplies much of the industrial water inthe Nikiski area, about 5 Mgal/d.
The upper confined aquifer is rechargedby downward leakage from the overlyingunconfined aquifer. The aquifer loses water bydischarge to Cook Inlet, by upward leakage tothe unconfined aquifer, and by pumping. Inspite of its ability to supply large quantities ofwater to the industrial area, it is not a univer-sally productive aquifer. Several wells in theNikiski area have penetrated fine-grainedmaterials in the depth-equivalent interval of theupper confined aquifer.
49 Water-Quality Assessment of the Cook Inlet Basin, Alaska—Environmental Setting
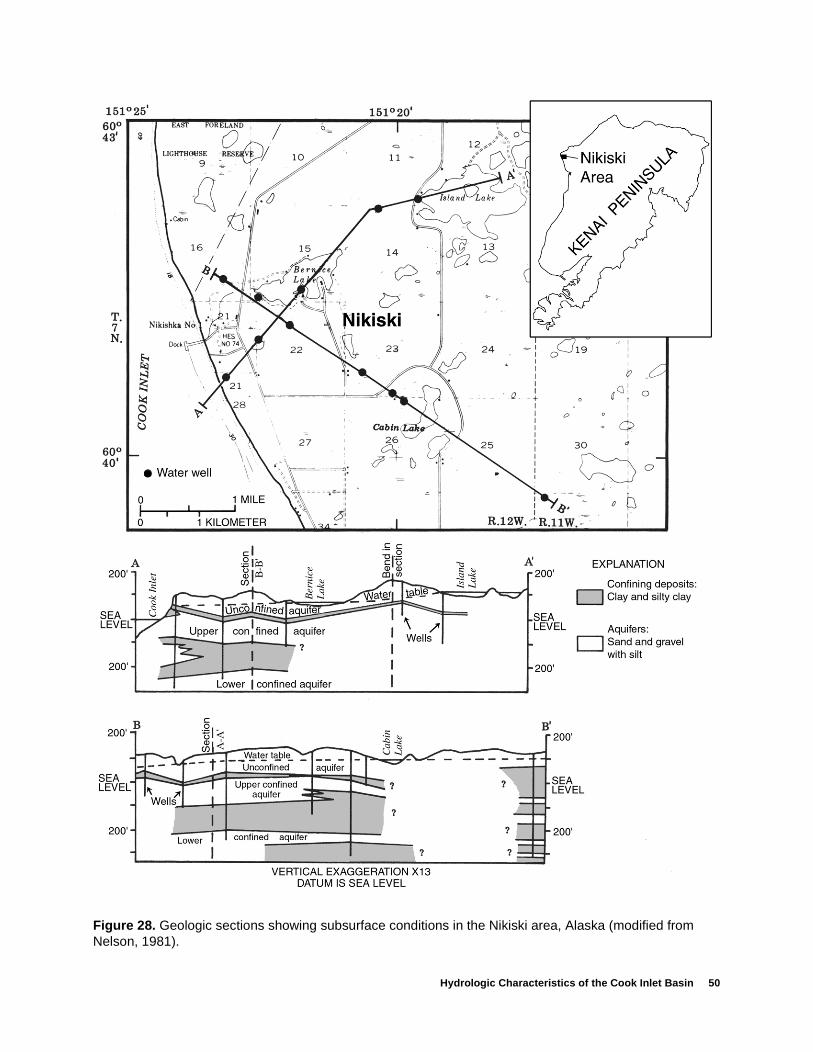
Hydrologic Characteristics of the Cook Inlet Basin 50
Figure 28. Geologic sections showing subsurface conditions in the Nikiski area, Alaska (modified from Nelson, 1981).
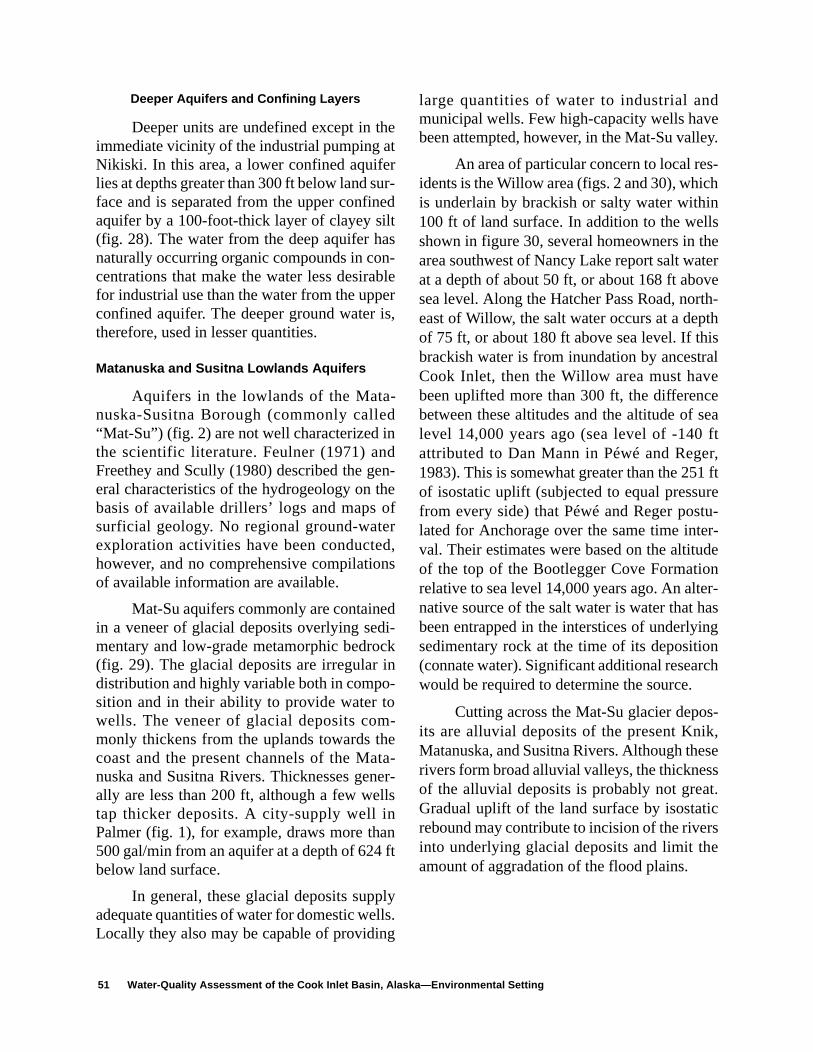
dey.
s-hnlsheterveth-thisaleeea
ftr, ftretu-r-dener-asngn
ch
s-k,sest.icrse
Deeper Aquifers and Confining Layers
Deeper units are undefined except in theimmediate vicinity of the industrial pumping atNikiski. In this area, a lower confined aquiferlies at depths greater than 300 ft below land sur-face and is separated from the upper confinedaquifer by a 100-foot-thick layer of clayey silt(fig. 28). The water from the deep aquifer hasnaturally occurring organic compounds in con-centrations that make the water less desirablefor industrial use than the water from the upperconfined aquifer. The deeper ground water is,therefore, used in lesser quantities.
Matanuska and Susitna Lowlands Aquifers
Aquifers in the lowlands of the Mata-nuska-Susitna Borough (commonly called“Mat-Su”) (fig. 2) are not well characterized inthe scientific literature. Feulner (1971) andFreethey and Scully (1980) described the gen-eral characteristics of the hydrogeology on thebasis of available drillers’ logs and maps ofsurficial geology. No regional ground-waterexploration activities have been conducted,however, and no comprehensive compilationsof available information are available.
Mat-Su aquifers commonly are containedin a veneer of glacial deposits overlying sedi-mentary and low-grade metamorphic bedrock(fig. 29). The glacial deposits are irregular indistribution and highly variable both in compo-sition and in their ability to provide water towells. The veneer of glacial deposits com-monly thickens from the uplands towards thecoast and the present channels of the Mata-nuska and Susitna Rivers. Thicknesses gener-ally are less than 200 ft, although a few wellstap thicker deposits. A city-supply well inPalmer (fig. 1), for example, draws more than500 gal/min from an aquifer at a depth of 624 ftbelow land surface.
In general, these glacial deposits supplyadequate quantities of water for domestic wells.Locally they also may be capable of providing
large quantities of water to industrial anmunicipal wells. Few high-capacity wells havbeen attempted, however, in the Mat-Su valle
An area of particular concern to local reidents is the Willow area (figs. 2 and 30), whicis underlain by brackish or salty water withi100 ft of land surface. In addition to the welshown in figure 30, several homeowners in tarea southwest of Nancy Lake report salt waat a depth of about 50 ft, or about 168 ft abosea level. Along the Hatcher Pass Road, noreast of Willow, the salt water occurs at a depof 75 ft, or about 180 ft above sea level. If thbrackish water is from inundation by ancestrCook Inlet, then the Willow area must havbeen uplifted more than 300 ft, the differencbetween these altitudes and the altitude of slevel 14,000 years ago (sea level of -140attributed to Dan Mann in Péwé and Rege1983). This is somewhat greater than the 251of isostatic uplift (subjected to equal pressufrom every side) that Péwé and Reger poslated for Anchorage over the same time inteval. Their estimates were based on the altituof the top of the Bootlegger Cove Formatiorelative to sea level 14,000 years ago. An altnative source of the salt water is water that hbeen entrapped in the interstices of underlyisedimentary rock at the time of its depositio(connate water). Significant additional researwould be required to determine the source.
Cutting across the Mat-Su glacier depoits are alluvial deposits of the present KniMatanuska, and Susitna Rivers. Although therivers form broad alluvial valleys, the thicknesof the alluvial deposits is probably not greaGradual uplift of the land surface by isostatrebound may contribute to incision of the riveinto underlying glacial deposits and limit thamount of aggradation of the flood plains.
51 Water-Quality Assessment of the Cook Inlet Basin, Alaska—Environmental Setting
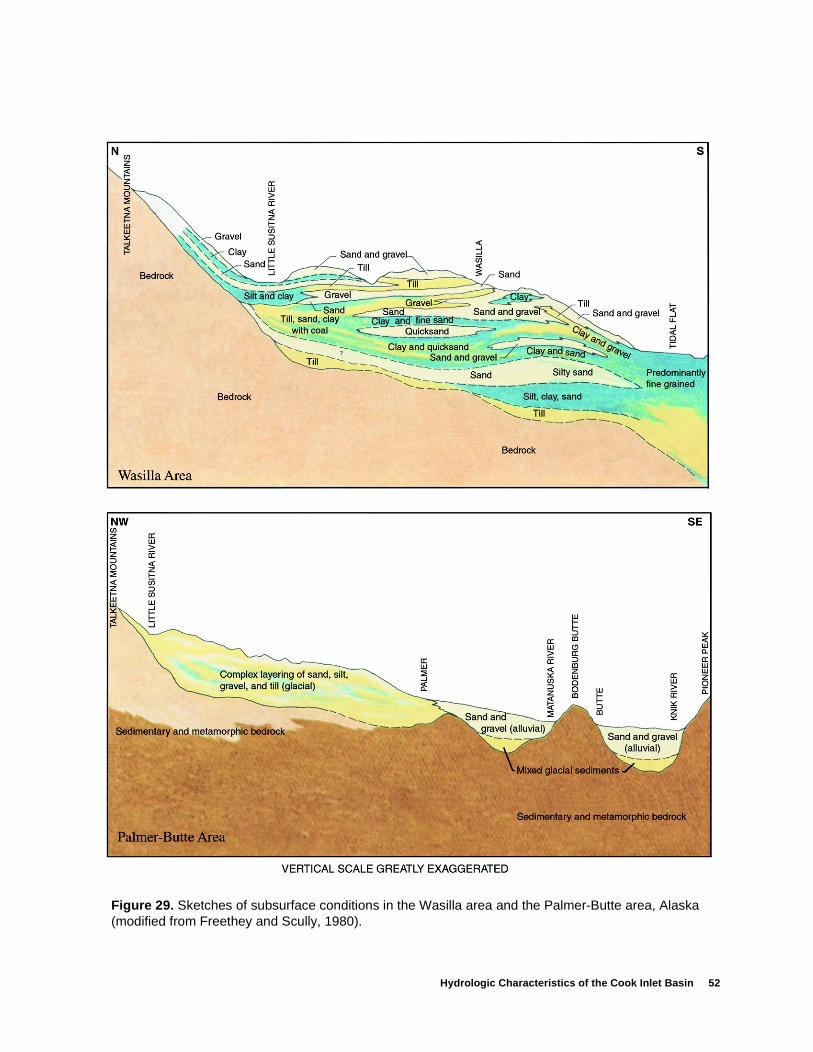
Hydrologic Characteristics of the Cook Inlet Basin 52
Figure 29. Sketches of subsurface conditions in the Wasilla area and the Palmer-Butte area, Alaska (modified from Freethey and Scully, 1980).
Parks Highway
Hatcher Pass Road
Willow•
C
B
A
NancyLake
Willow Creek
0 1 2 3 MILES
150° 05'
61°39'
149° 55'
61° 46'
0 1 2 3 KILOMETERS
A. 75 ft-deep-well yielding "very salty" water according to driller's log.
B. 85 ft-deep-well yielding water with specific conductance of 3400
C. 246 ft-deep-well yielding water with specific conductance of 22,000
EXPLANATION
µS/cm.
µS/cm.
Figure 30. Location of salt-water wells near Willow in the Susitna River Basin, Alaska.
Tertiary-Age Uplands Aquifers
Tertiary-age sediments of the KenaiGroup underlie glacial and alluvial deposits ofthe central part of the Cook Inlet Basin (fig.31). These sedimentary rocks also outcroparound the margins of the Cook Inlet Basin,forming gently rolling hills between Cook Inletand the rugged mountains of the Kenai, Tal-
keetna, and Alaska Ranges. In the Kenai Penin-sula, Tertiary-age sediments form the CaribouHills. North of Tyonek, they form hills contain-ing abundant coal deposits. The Tertiary-agesediments commonly contain aquifers that areadequate for domestic wells. High capacitymunicipal and industrial wells, however, havenot been developed in the Tertiary-age sedi-
53 Water-Quality Assessment of the Cook Inlet Basin, Alaska—Environmental Setting
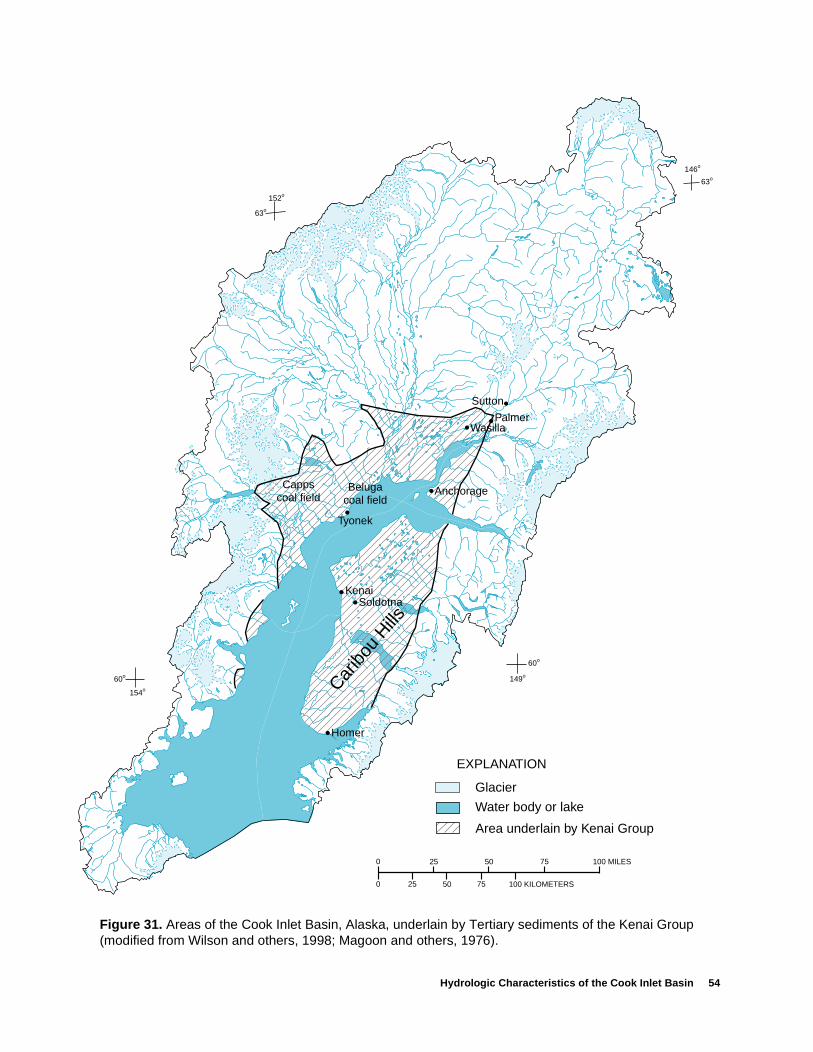
Hydrologic Characteristics of the Cook Inlet Basin 54
Sutton
PalmerWasilla
Anchorage
Tyonek
KenaiSoldotna
100 MILES75
100 KILOMETERS
50
75
25
5025
0
0
Glacier
Water body or lake
EXPLANATION
Area underlain by Kenai Group
63o
146o
63o
152o
60o
154o
149o
60o
Homer
Carib
ou H
ills
Cappscoal field
Belugacoal field
Figure 31. Areas of the Cook Inlet Basin, Alaska, underlain by Tertiary sediments of the Kenai Group (modified from Wilson and others, 1998; Magoon and others, 1976).
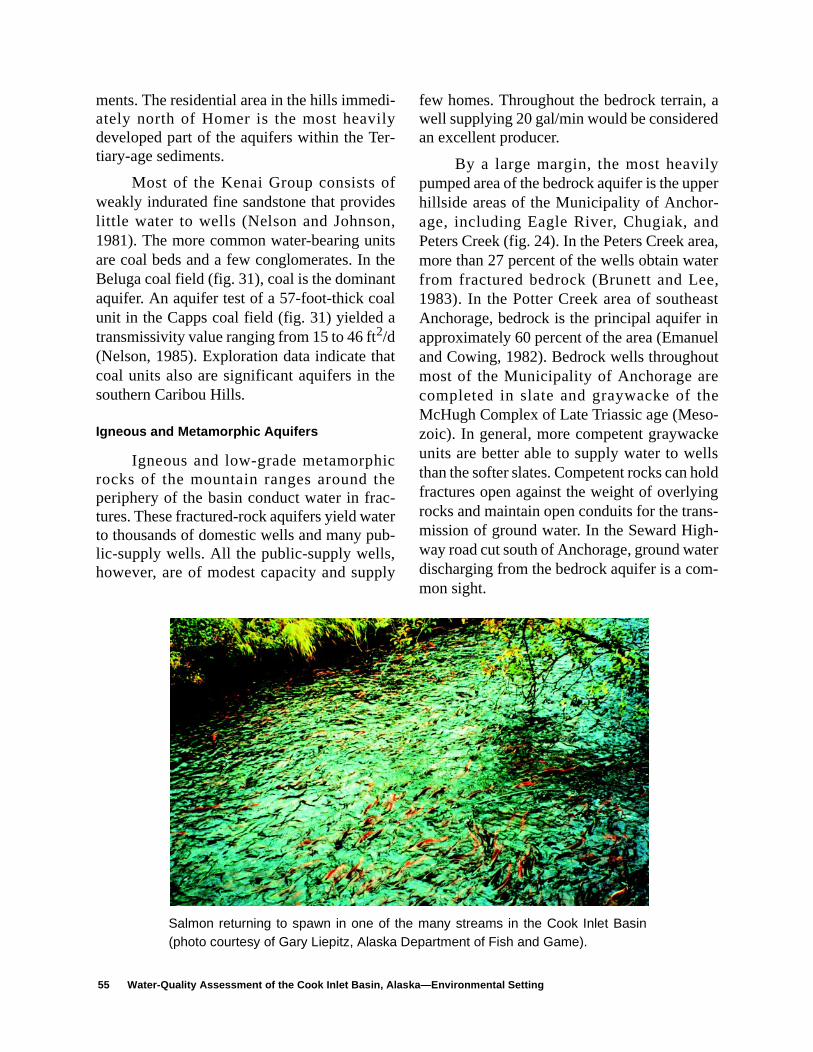
ments. The residential area in the hills immedi-ately north of Homer is the most heavilydeveloped part of the aquifers within the Ter-tiary-age sediments.
Most of the Kenai Group consists ofweakly indurated fine sandstone that provideslittle water to wells (Nelson and Johnson,1981). The more common water-bearing unitsare coal beds and a few conglomerates. In theBeluga coal field (fig. 31), coal is the dominantaquifer. An aquifer test of a 57-foot-thick coalunit in the Capps coal field (fig. 31) yielded atransmissivity value ranging from 15 to 46 ft2/d(Nelson, 1985). Exploration data indicate thatcoal units also are significant aquifers in thesouthern Caribou Hills.
Igneous and Metamorphic Aquifers
Igneous and low-grade metamorphicrocks of the mountain ranges around theperiphery of the basin conduct water in frac-tures. These fractured-rock aquifers yield waterto thousands of domestic wells and many pub-lic-supply wells. All the public-supply wells,however, are of modest capacity and supply
few homes. Throughout the bedrock terrain, awell supplying 20 gal/min would be consideredan excellent producer.
By a large margin, the most heavilypumped area of the bedrock aquifer is the upperhillside areas of the Municipality of Anchor-age, including Eagle River, Chugiak, andPeters Creek (fig. 24). In the Peters Creek area,more than 27 percent of the wells obtain waterfrom fractured bedrock (Brunett and Lee,1983). In the Potter Creek area of southeastAnchorage, bedrock is the principal aquifer inapproximately 60 percent of the area (Emanueland Cowing, 1982). Bedrock wells throughoutmost of the Municipality of Anchorage arecompleted in slate and graywacke of theMcHugh Complex of Late Triassic age (Meso-zoic). In general, more competent graywackeunits are better able to supply water to wellsthan the softer slates. Competent rocks can holdfractures open against the weight of overlyingrocks and maintain open conduits for the trans-mission of ground water. In the Seward High-way road cut south of Anchorage, ground waterdischarging from the bedrock aquifer is a com-mon sight.
55 Water-Quality Assessment of the Cook Inlet Basin, Alaska—Environmental Setting
Salmon returning to spawn in one of the many streams in the Cook Inlet Basin(photo courtesy of Gary Liepitz, Alaska Department of Fish and Game).
redagin
AQUATIC BIOLOGICAL CHARACTERISTICS OF THE COOK INLET BASIN
The biological characteristics of interestfor the NAWQA program include informationon the spatial distribution, community struc-ture, and relative abundance of fish, aquaticinvertebrates, macrophytes, and algae. Thisinformation can be used in conjunction withphysical and chemical measurements of waterquality to determine the status of and trends inwater quality and how it related to natural con-ditions and anthropogenic factors.
Fish
Fish-community analysis is an effectivetool for large-scale water-quality assessments(Meador and others, 1993). Fish communitiesreflect the present physical and chemical char-acteristics of a stream along with historical con-ditions to which they were exposed. Inaddition, analyses of fish tissue for bioaccumu-lative contaminants, which have low concen-trations in sediments or water, may revealconcentrations that represent health risks to thefish communities or possibly to humans if con-sumed.
The numerous cold-water streams withinthe Cook Inlet Basin support an assemblage ofmigratory and resident fish. Migratory fishinclude five species of Pacific salmon: chi-nook, chum, coho, pink, and sockeye. Residentspecies of fish include Dolly Varden, rain-bow/steelhead trout, and round whitefish. Mostof the fisheries work within the Cook InletBasin has focused on salmon rather than on theresident fish, because the salmon represent animportant cultural, recreational, and economiccomponent of the Cook Inlet Basin. In 1997,approximately 4 million salmon were har-vested in the upper Cook Inlet fishery (fig. 32).
Of the streams draining into Cook Inlet,the three river systems supporting the greatest
number of spawning salmon are the Kenai, theKasilof, and the Susitna Rivers. For example,in the Kenai River, the number of sockeyesalmon has averaged about 2.7 million since1972 (fig. 32), with a harvest ranging from500,000 to 8.9 million. The Kasilof River sock-eye fishery has averaged about 700,000 fish peryear since 1972, and ranges from 80,000 to 1.7million sockeye (fig. 32). The third largestsockeye fishery is the Susitna River, which hasprovided an average of about 600,000 sockeyesalmon since 1972, with ranges from 180,000to 1.06 million (fig. 32). Many of the otherstreams that flow into Cook Inlet, such as theCrescent River (fig. 32), also support healthysalmon runs, but no data are routinely availablefor these stream systems. These streams arevisited frequently for sportfishing. In 1997,Ship Creek had 62,000 angler-days and theKenai River had 321,000 angler-days (BarryStranton, Alaska Department of Fish andGame, oral commun., 1998). (One angler-dayis equivalent to one person or a combinationpersons who fish for 12 hours.)
Aquatic Invertebrates
Benthic macroinvertebrates can reflectthe quality of water at a site because they live inthe streambed for a large part of their lives.Both by the density of their occurrence and thespecies composition of the community found ina stream, they can indicate the quality of habitatavailable to them during the time period ofweeks to months. Bioassessment techniquesare becoming widespread in their use as indica-tors of stream degradation.
The taxonomic structure of macroinverte-brate communities in streams of Alaska as awhole has been summarized by Oswood andothers (1995). Most of Alaska’s streams atypically characterized by low diversity andominated by Diptera (trueflies) of which major part are the Chironomidae (non-bitinmidges). The streams of the Cook Inlet Bas
Aquatic Biological Characteristics of the Cook Inlet Basin 56
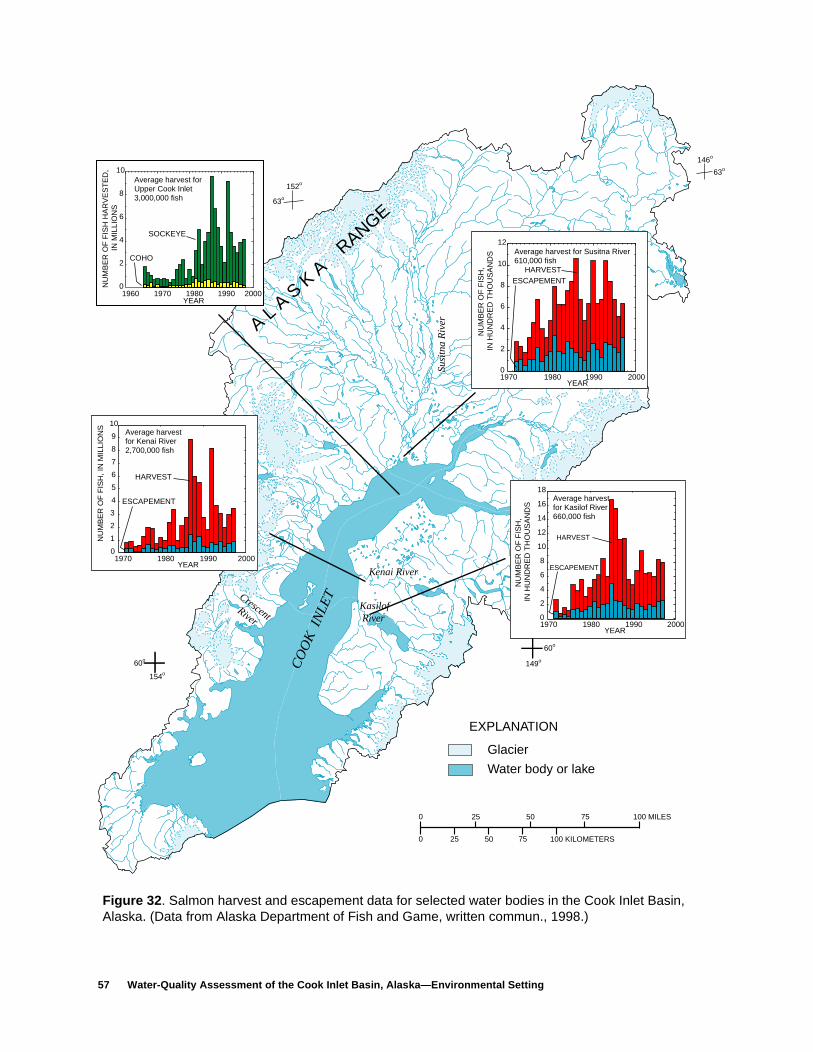
57 Water-Quality Assessment of the Cook Inlet Basin, Alaska—Environmental Setting
100 MILES75
100 KILOMETERS
50
75
25
5025
0
0
CrescentRiver
Su
sitn
a R
ive
r
Glacier
Water body or lake
EXPLANATION
A L A S
K A
RANGE
CO
OK
IN
LET
Kasilof River
Kenai River
63o
146o
63o
152o
60o
154o
149o
60o
1960 20001970 1980 1990YEAR
0
10
2
4
6
8
NU
MB
ER
OF
FIS
H H
AR
VE
ST
ED
, IN
MIL
LIO
NS
SOCKEYE
COHO
Average harvest for Upper Cook Inlet3,000,000 fish
1970 20001980 1990YEAR
0
10
1
2
3
4
5
6
7
8
9
NU
MB
ER
OF
FIS
H, I
N M
ILLI
ON
S
HARVEST
ESCAPEMENT
Average harvest for Kenai River2,700,000 fish
1970 20001980 1990YEAR
0
18
2
4
6
8
10
12
14
16
NU
MB
ER
OF
FIS
H,
IN H
UN
DR
ED
TH
OU
SA
ND
SHARVEST
ESCAPEMENT
Average harvestfor Kasilof River660,000 fish
1970 20001980 1990YEAR
HARVESTESCAPEMENT
Average harvest for Susitna River610,000 fish
NU
MB
ER
OF
FIS
H,
IN H
UN
DR
ED
TH
OU
SA
ND
S
0
12
2
4
6
8
10
Figure 32. Salmon harvest and escapement data for selected water bodies in the Cook Inlet Basin, Alaska. (Data from Alaska Department of Fish and Game, written commun., 1998.)
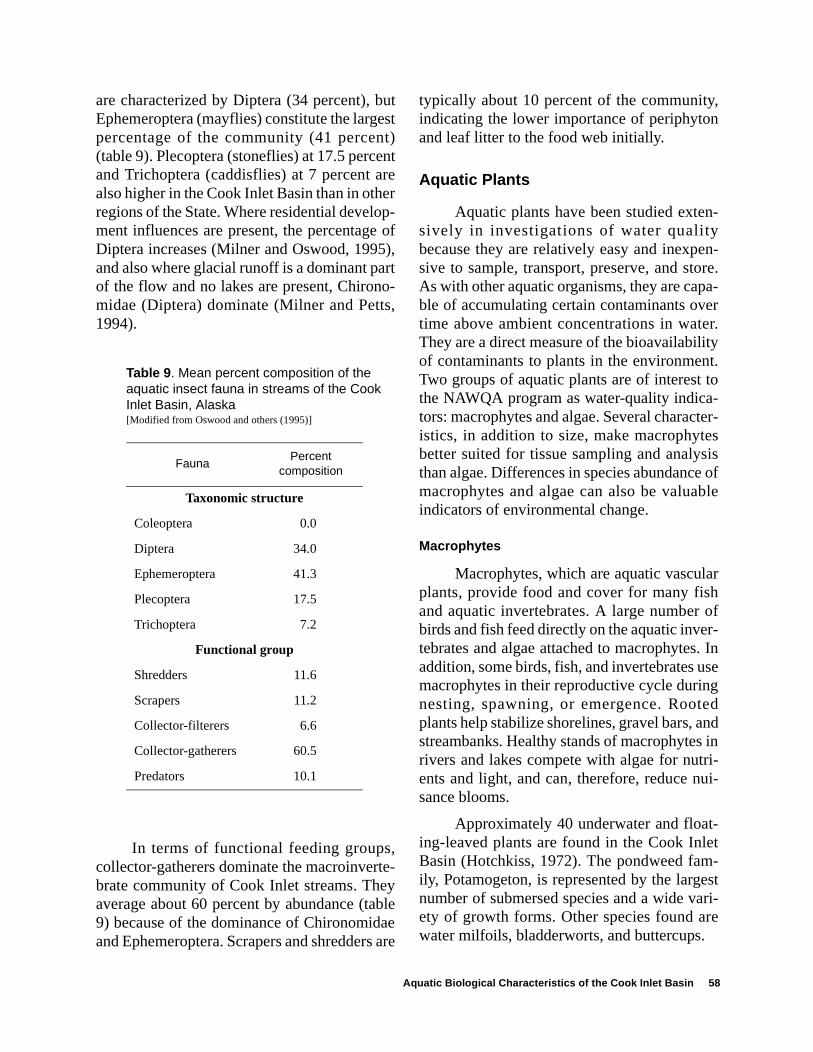
are characterized by Diptera (34 percent), butEphemeroptera (mayflies) constitute the largestpercentage of the community (41 percent)(table 9). Plecoptera (stoneflies) at 17.5 percentand Trichoptera (caddisflies) at 7 percent arealso higher in the Cook Inlet Basin than in otherregions of the State. Where residential develop-ment influences are present, the percentage ofDiptera increases (Milner and Oswood, 1995),and also where glacial runoff is a dominant partof the flow and no lakes are present, Chirono-midae (Diptera) dominate (Milner and Petts,1994).
In terms of functional feeding groups,collector-gatherers dominate the macroinverte-brate community of Cook Inlet streams. Theyaverage about 60 percent by abundance (table9) because of the dominance of Chironomidaeand Ephemeroptera. Scrapers and shredders are
typically about 10 percent of the community,indicating the lower importance of periphytonand leaf litter to the food web initially.
Aquatic Plants
Aquatic plants have been studied exten-sively in investigations of water qualitybecause they are relatively easy and inexpen-sive to sample, transport, preserve, and store.As with other aquatic organisms, they are capa-ble of accumulating certain contaminants overtime above ambient concentrations in water.They are a direct measure of the bioavailabilityof contaminants to plants in the environment.Two groups of aquatic plants are of interest tothe NAWQA program as water-quality indica-tors: macrophytes and algae. Several character-istics, in addition to size, make macrophytesbetter suited for tissue sampling and analysisthan algae. Differences in species abundance ofmacrophytes and algae can also be valuableindicators of environmental change.
Macrophytes
Macrophytes, which are aquatic vascularplants, provide food and cover for many fishand aquatic invertebrates. A large number ofbirds and fish feed directly on the aquatic inver-tebrates and algae attached to macrophytes. Inaddition, some birds, fish, and invertebrates usemacrophytes in their reproductive cycle duringnesting, spawning, or emergence. Rootedplants help stabilize shorelines, gravel bars, andstreambanks. Healthy stands of macrophytes inrivers and lakes compete with algae for nutri-ents and light, and can, therefore, reduce nui-sance blooms.
Approximately 40 underwater and float-ing-leaved plants are found in the Cook InletBasin (Hotchkiss, 1972). The pondweed fam-ily, Potamogeton, is represented by the largestnumber of submersed species and a wide vari-ety of growth forms. Other species found arewater milfoils, bladderworts, and buttercups.
Table 9. Mean percent composition of the aquatic insect fauna in streams of the Cook Inlet Basin, Alaska[Modified from Oswood and others (1995)]
FaunaPercent
composition
Taxonomic structure
Coleoptera 0.0
Diptera 34.0
Ephemeroptera 41.3
Plecoptera 17.5
Trichoptera 7.2
Functional group
Shredders 11.6
Scrapers 11.2
Collector-filterers 6.6
Collector-gatherers 60.5
Predators 10.1
Aquatic Biological Characteristics of the Cook Inlet Basin 58
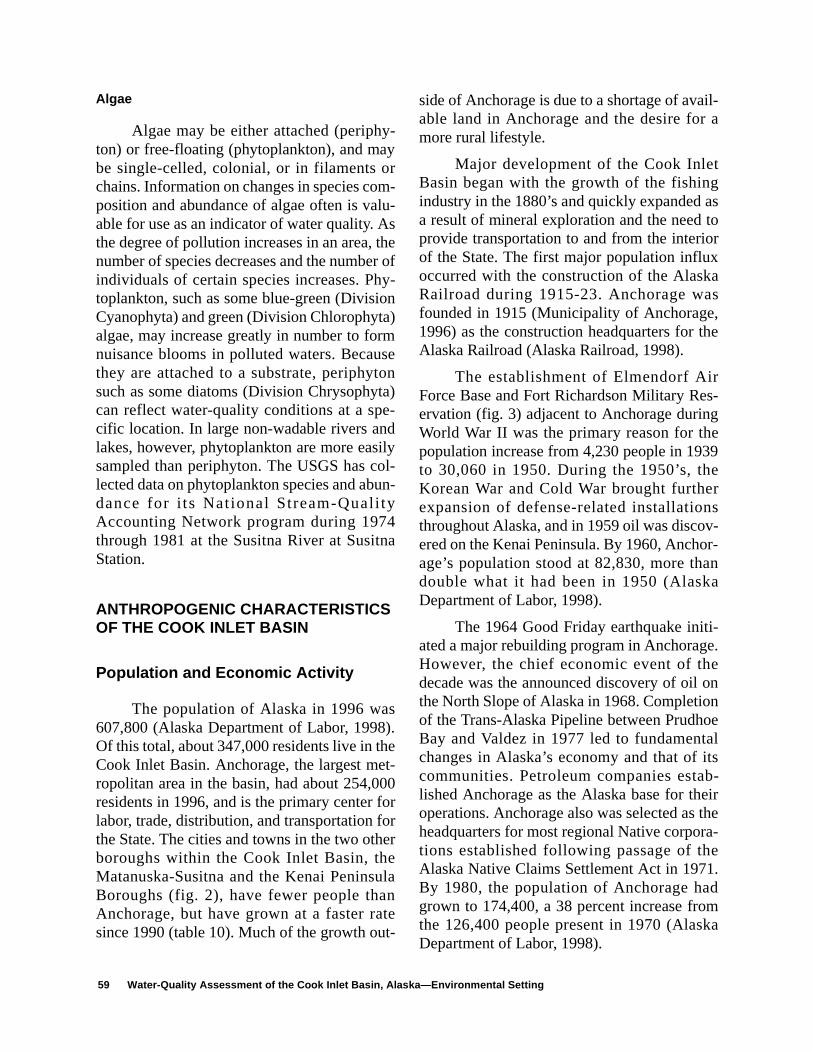
as tor
xas,the
rs-ge39ers
v-r-
ana
i-e.eonnoealitsb-eir thea-e.dm
ka
Algae
Algae may be either attached (periphy-ton) or free-floating (phytoplankton), and maybe single-celled, colonial, or in filaments orchains. Information on changes in species com-position and abundance of algae often is valu-able for use as an indicator of water quality. Asthe degree of pollution increases in an area, thenumber of species decreases and the number ofindividuals of certain species increases. Phy-toplankton, such as some blue-green (DivisionCyanophyta) and green (Division Chlorophyta)algae, may increase greatly in number to formnuisance blooms in polluted waters. Becausethey are attached to a substrate, periphytonsuch as some diatoms (Division Chrysophyta)can reflect water-quality conditions at a spe-cific location. In large non-wadable rivers andlakes, however, phytoplankton are more easilysampled than periphyton. The USGS has col-lected data on phytoplankton species and abun-dance for i t s National Stream-Quali tyAccounting Network program during 1974through 1981 at the Susitna River at SusitnaStation.
ANTHROPOGENIC CHARACTERISTICS OF THE COOK INLET BASIN
Population and Economic Activity
The population of Alaska in 1996 was607,800 (Alaska Department of Labor, 1998).Of this total, about 347,000 residents live in theCook Inlet Basin. Anchorage, the largest met-ropolitan area in the basin, had about 254,000residents in 1996, and is the primary center forlabor, trade, distribution, and transportation forthe State. The cities and towns in the two otherboroughs within the Cook Inlet Basin, theMatanuska-Susitna and the Kenai PeninsulaBoroughs (fig. 2), have fewer people thanAnchorage, but have grown at a faster ratesince 1990 (table 10). Much of the growth out-
side of Anchorage is due to a shortage of avail-able land in Anchorage and the desire for amore rural lifestyle.
Major development of the Cook InletBasin began with the growth of the fishingindustry in the 1880’s and quickly expanded a result of mineral exploration and the needprovide transportation to and from the interioof the State. The first major population influoccurred with the construction of the AlaskRailroad during 1915-23. Anchorage wafounded in 1915 (Municipality of Anchorage1996) as the construction headquarters for Alaska Railroad (Alaska Railroad, 1998).
The establishment of Elmendorf AiForce Base and Fort Richardson Military Reervation (fig. 3) adjacent to Anchorage durinWorld War II was the primary reason for thpopulation increase from 4,230 people in 19to 30,060 in 1950. During the 1950’s, thKorean War and Cold War brought furtheexpansion of defense-related installationthroughout Alaska, and in 1959 oil was discoered on the Kenai Peninsula. By 1960, Anchoage’s population stood at 82,830, more thdouble what it had been in 1950 (AlaskDepartment of Labor, 1998).
The 1964 Good Friday earthquake initated a major rebuilding program in AnchoragHowever, the chief economic event of thdecade was the announced discovery of oil the North Slope of Alaska in 1968. Completioof the Trans-Alaska Pipeline between PrudhBay and Valdez in 1977 led to fundamentchanges in Alaska’s economy and that of communities. Petroleum companies estalished Anchorage as the Alaska base for thoperations. Anchorage also was selected asheadquarters for most regional Native corportions established following passage of thAlaska Native Claims Settlement Act in 1971By 1980, the population of Anchorage hagrown to 174,400, a 38 percent increase frothe 126,400 people present in 1970 (AlasDepartment of Labor, 1998).
59 Water-Quality Assessment of the Cook Inlet Basin, Alaska—Environmental Setting
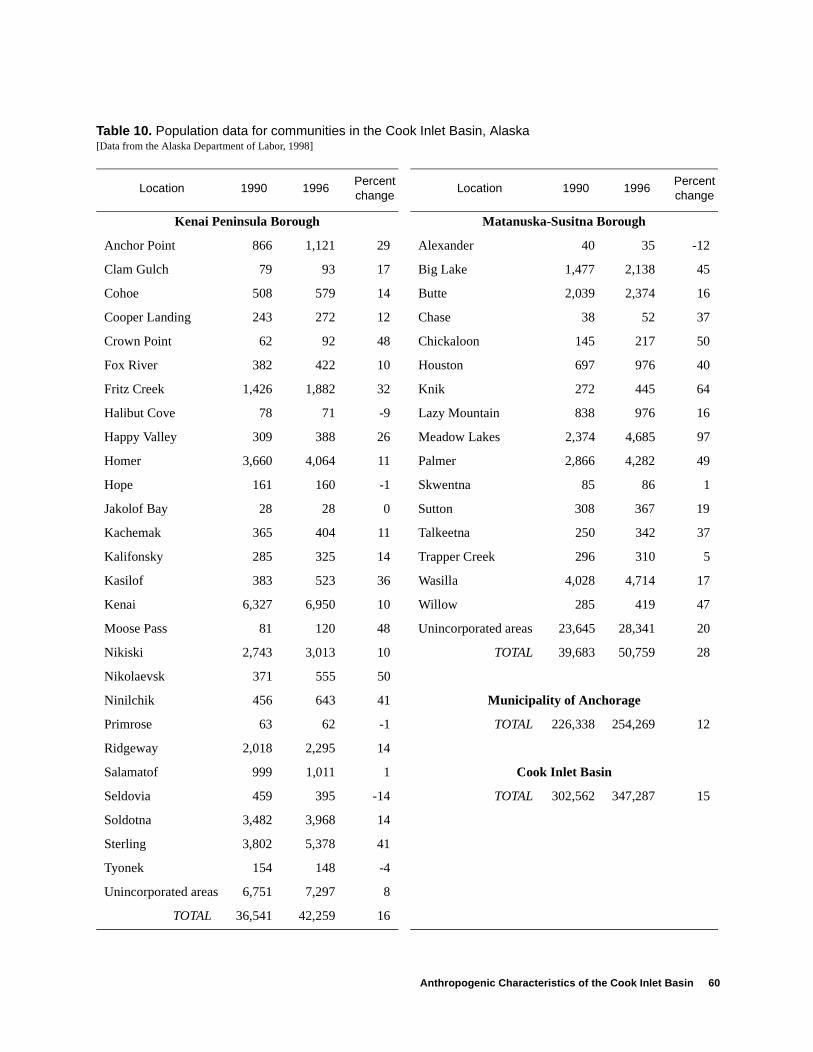
Anthropogenic Characteristics of the Cook Inlet Basin 60
Table 10. Population data for communities in the Cook Inlet Basin, Alaska[Data from the Alaska Department of Labor, 1998]
Location 1990 1996Percent change
Location 1990 1996Percent change
Kenai Peninsula Borough Matanuska-Susitna Borough
Anchor Point 866 1,121 29 Alexander 40 35 -12
Clam Gulch 79 93 17 Big Lake 1,477 2,138 45
Cohoe 508 579 14 Butte 2,039 2,374 16
Cooper Landing 243 272 12 Chase 38 52 37
Crown Point 62 92 48 Chickaloon 145 217 50
Fox River 382 422 10 Houston 697 976 40
Fritz Creek 1,426 1,882 32 Knik 272 445 64
Halibut Cove 78 71 -9 Lazy Mountain 838 976 16
Happy Valley 309 388 26 Meadow Lakes 2,374 4,685 97
Homer 3,660 4,064 11 Palmer 2,866 4,282 49
Hope 161 160 -1 Skwentna 85 86 1
Jakolof Bay 28 28 0 Sutton 308 367 19
Kachemak 365 404 11 Talkeetna 250 342 37
Kalifonsky 285 325 14 Trapper Creek 296 310 5
Kasilof 383 523 36 Wasilla 4,028 4,714 17
Kenai 6,327 6,950 10 Willow 285 419 47
Moose Pass 81 120 48 Unincorporated areas 23,645 28,341 20
Nikiski 2,743 3,013 10 TOTAL 39,683 50,759 28
Nikolaevsk 371 555 50
Ninilchik 456 643 41 Municipality of Anchorage
Primrose 63 62 -1 TOTAL 226,338 254,269 12
Ridgeway 2,018 2,295 14
Salamatof 999 1,011 1 Cook Inlet Basin
Seldovia 459 395 -14 TOTAL 302,562 347,287 15
Soldotna 3,482 3,968 14
Sterling 3,802 5,378 41
Tyonek 154 148 -4
Unincorporated areas 6,751 7,297 8
TOTAL 36,541 42,259 16
or
etry
og-ne
learsi-ai
mnen-54ern.allser
t.2mce
Rapid growth continued in Anchoragethrough the early 1980’s, peaking at an esti-mated 248,300 people in 1985. However, theboom period, caused primarily by an acceler-ated rate of government spending, was not sus-tainable and the economy sl ipped intorecession in late 1985. The severity of therecession was greatly compounded by a crashin oil prices in early 1986.
The Anchorage economy began torecover in 1989, spurred initially by clean-upefforts after the 1989 Exxon Valdez oil spill anda temporary increase in oil prices resultingfrom the Iraqi invasion of Kuwait. The 1990census counted 226,300 people in Anchorage,about 10 percent fewer than the 1985 peak, butstill about 30 percent more than the commu-nity’s 1980 population. Increased spending oncapital projects by the State following the oilspill settlement and employment growth inconstruction and retail trade have helped fuelthe local economy since 1990. Growth in tour-ism and in the use of Anchorage InternationalAirport for international cargo flights also arepositive developments. Anchorage’s popula-tion in 1996 had increased by more than 12 per-cent since 1990 (Alaska Department of Labor,1998).
Land Ownership and Land Use
Approximately 30 percent of the CookInlet Basin is Federal land (fig. 33). Parts offour national parks—Denali, Lake Clark, Kat-mai, and Kenai Fjords—are located in the basin(fig. 1). Nearly 1,800 mi2 of the ChugachNational Forest, and the 3,000 mi2 KenaiNational Wildlife Refuge also are within thestudy unit (fig. 1). Most likely, these areas willremain undeveloped with the possible excep-tion of logging within the Chugach NationalForest. State-owned and Native-owned landsaccount for 49 percent and 9 percent respec-tively. The remaining 12 percent is currentlyFederally owned, and managed by the Bureauof Land Management. This land has been
selected for eventual conveyance to the Stateto Native corporations.
Less than 10 percent of the Cook InlBasin has been developed. The two primaland uses are residential development and lging. A large part of the Native-owned land ithe lower Kenai Peninsula has been or will blogged (fig. 1). Additional logging likely willoccur on State-owned lands. Other possibland uses are potential mining activities neSutton and Tyonek (fig. 1) and increased redential development near towns in the Kenand Matanuska-Susitna Boroughs.
Water Use
Water-use data have been compiled frothe USGS National Water-Use InformatioProgram data base and from other State agcies (table 11). Surface water accounted for percent of all water withdrawals in 1995 in thCook Inlet Basin. Public supply accounted foabout 72 percent of surface water withdrawGround water accounted for 46 percent of water withdrawals in 1995. Domestic wellaccount for about 17 percent of ground-watuse.
Public water supplies served abou211,000 people in 1995. An average of 39Mgal/d of water were used—31 percent froground water and 69 percent from surfa
Table 11. Estimated water use during 1995 in the Cook Inlet Basin, Alaska[Data in million gallons per day; estimates from G.L. Solin, U.S. Geological Survey, written commun., 1998]
CategoryGround water
Surface water
Total
Public supply 12.25 26.95 39.20
Domestic (self supplied) 5.48 0 5.48
Commercial 9.50 8.16 17.66
Industrial 4.21 1.14 5.35
Other 0.19 1.27 1.46
Total 31.63 37.52 69.15
61 Water-Quality Assessment of the Cook Inlet Basin, Alaska—Environmental Setting
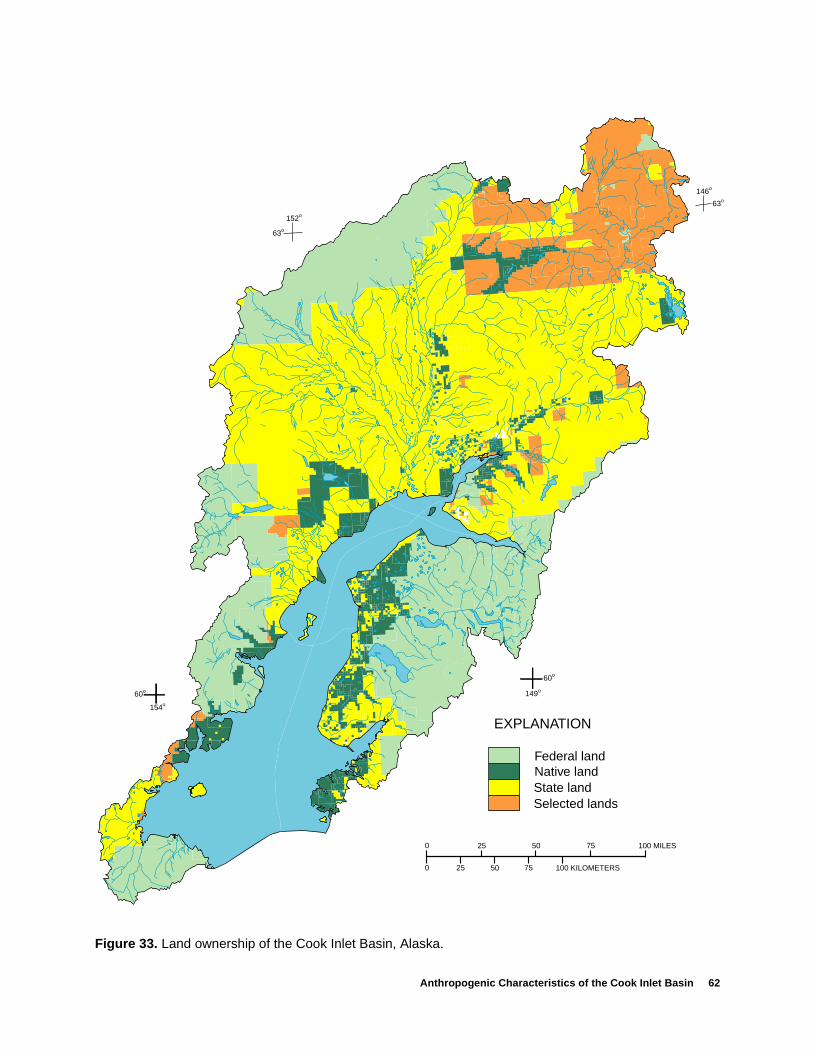
Anthropogenic Characteristics of the Cook Inlet Basin 62
100 MILES75
100 KILOMETERS
50
75
25
5025
0
0
EXPLANATION
Federal landNative landState landSelected lands
63o
146o
63o
152o
60o
154o
149o
60o
Figure 33. Land ownership of the Cook Inlet Basin, Alaska.

nyinli-d
pri-e
eed.mla-ur-s
nt.
okla- tot
ndhe
n-
seleall
byd
eeai,yof, ofe
water. Public water supplies for Anchorage areprimarily from Ship Creek (fig. 3) and EklutnaLake (fig. 24). Ground water is the source formost other public water supplies. Domestic useaccounts for 52 percent of the total public sup-ply water use, commercial use about 30 per-cent, and industrial use about 4 percent.Average per capita use for public supplies in theCook Inlet Basin is about 186 gal/d. About125,000 people in the Cook Inlet Basin use pri-vate domestic wells. Average per capita use fordomestic self-supplied water is 44 gal/d.
Consumptive use includes water that isevaporated, transpired by plants, or consumedby humans and not immediately available foruse. In the Cook Inlet Basin, public suppliesand domestic self supplies combined have aconsumptive use of about 10 percent. Waterused for commercial and industry uses haveconsumption rates of about 15 percent. Utilitycompany use has a consumption rate of about10 percent.
SUMMARY
This report describes the general environ-mental setting of the Cook Inlet Basin, one of59 study units of the USGS National Water-Quality Assessment (NAWQA) program. Theprimary natural and human features of theCook Inlet Basin are as follows:
• Natural factors that influence the water qual-ity of the streams and rivers of Cook Inlet aregeology, soils, land cover, and the presence ofglaciers. Human factors that influence waterquality are residential development, intenserecreational use, timber harvesting, mining,and petroleum development.
• The climate of the Cook Inlet Basin is variablebecause of its large size and range in altitude.Precipitation ranges from 20 to 240 in. annu-ally and average air temperature ranges from22 °F to 42 °F. About half the basin consistsof moderately high rugged mountains.
• The geology is complex and consists of matypes of consolidated rocks in the mountaranges surrounding the basin and unconsodated sediments deposited in the lowlanareas. Inceptisols and Spodosols are the mary soils in the basin, and tall shrub is thmost widespread vegetation.
• Discharge from streams and rivers in thCook Inlet Basin varies depending on thpresence of glaciers in a particular watersheMelting glaciers add more water to a streaand have more sustained runoff than nongcial streams. The total average annual sface-water discharge into Cook Inlet iestimated to be 116,000 ft3/s, of which theSusitna River basin accounts for 47 perceMost of the inflow to Cook Inlet occurs fromMay through September.
• Suspended sediment is variable in the CoInlet Basin depending on the presence of gciers. The annual suspended-sediment loadCook Inlet is more than 44 million tons. Mosof the load is transported between May aSeptember. The largest loads are from tSusitna, Matanuska, and Knik Rivers.
• Ground water is used primarily from the cetral part of the Cook Inlet Basin—theAnchorage, Kenai, and Nikiski areas. In theareas, ground water is obtained from multipaquifers located in outwash deposits distfrom the terminal moraine of a major glaciaadvance. These aquifers are separatedconfining units of tidal and marine silt anclay.
• Approximately 4 million salmon per year arharvested from the Cook Inlet Basin. Ththree major spawning streams are the KenKasilof, and Susitna Rivers. The primarmacroinvertebrates found in the streams the Cook In le t Bas in a re D ip te raEphemeroptera and Plecoptera. In termsthe insect functional-group composition, thcollector-gatherers dominate.
63 Water-Quality Assessment of the Cook Inlet Basin, Alaska—Environmental Setting
tere,es
nd
rt
y.S.ns
toe
arr,
es
z-ho,
a:h,
t-a:ti-
gya,r-6,
of aa:s
ofes
il-,
h-h-e-
• The population of the Cook Inlet Basin in1996 was approximately 347,000 people,which represents more than half of Alaska’spopulation. The major metropolitan area isAnchorage. Communities outside of Anchor-age located in the Matanuska-Susitna and theKenai Peninsula Boroughs are growing at afaster rate than Anchorage.
• Most of the land in the Cook Inlet Basin isundeveloped and is owned by the State ofAlaska or the Federal government. Parts offour national parks—Denali, Lake Clark,Katmai, and Kenai Fjords—are located in thebasin. The developed land consists primarilyof urbanized areas and logged areas on thelower Kenai Peninsula.
• Approximately 69 Mgal of water are useddaily in the Cook Inlet Basin. About 39 Mgalof this total is used for public water supplyand surface water accounts for about 69 per-cent of this total.
REFERENCES CITED
Alaska Department of Labor, 1998, Research & analysis,demographics unit, population estimates: accessedSeptember 1998 at URLwww.labor.state.ak.us/research/pop/popmain.htm
Alaska Geophysical Data Clearinghouse, 1998, Prelimi-nary vegetation classes: accessed September 1998at URLagdc.usgs.gov/data/usgs/erosafo/veg/veg.html
Alaska Railroad, 1998, Railroad history: accessed Sep-tember 1998 at URLwww.akrr.com/History/timeline.html
Anderson, G.S., and Jones, S.H., 1972, Water resourcesof the Kenai-Soldotna area, Alaska: U.S. Geologi-cal Survey Open-File Report, 81 p., 2 pl.
Barnwell, W.W., George, R.S., Dearborn, L.L., Weeks,J.B., and Zenone, Chester, 1972, Water for Anchor-age—An atlas of the water resources of the Anchor-age area, Alaska: City of Anchorage and GreaterAnchorage Area Borough, 77 p.
Brabets, T.P., 1987, Quantity and quality of urban runofffrom the Chester Creek basin, Anchorage, Alaska:U.S. Geological Survey Water-Resources Investi-gations Report 86-4312, 58 p.
Brabets, T.P., and Wittenberg, L.A., 1983, Surface-waquality in the Campbell Creek basin, AnchoragAlaska: U.S. Geological Survey Water-ResourcInvestigations Report 83-4096, 28 p.
Brunett, J.O., 1990, Movement of contaminated grouwater from Merrill Field landfill, Anchorage,Alaska: U.S. Geological Survey Open-File Repo89-624, 20 p.
Brunett, Jilann and Lee, Michael, 1983, Hydrogeologfor land-use planning—The Peters Creek area: UGeological Survey Water-Resources InvestigatioReport 82-4120, 6 sheets.
Colby, B.R., 1956, Relationship of sediment dischargestreamflow: U.S. Geological Survey Open-FilReport, 170 p.
Dorava, J.M., 1995, Hydraulic characteristics nestreamside structures along the Kenai RiveAlaska: U.S. Geological Survey Water-ResourcInvestigations Report 95-4226, 41 p.
Dorava, J.M., and Meyer, D.F., 1994, Hydrologic haards in the lower Drift River basin associated witthe 1989-1990 eruptions of Redoubt VolcanAlaska, in Miller, T.P. and Chouet, B.A., eds., The1989-1990 eruptions of Redoubt Volcano, AlaskJournal of Volcanology and Geothermal ResearcSpecial Issue, v. 62, no. 1-4, p. 387-407.
Dorava, J.M., and Moore, G.W., 1997, Effects of boawakes on streambank erosion, Kenai River, AlaskU.S. Geological Survey Water-Resources Invesgations Report 97-4105, 84 p.
Emanuel, R.P., and Cowing, D.J., 1982, Hydrogeolofor land-use planning—The Potter Creek areAnchorage, Alaska: U.S. Geological Survey WateResources Investigations Open-File Report 82-84 sheets.
Feulner, A.J., 1971, Water-resources reconnaissancepart of the Matanuska-Susitna Borough, AlaskU.S. Geological Survey Hydrologic InvestigationAtlas HA-364, scale,
Fountain, A.G., and Tangborn, W.V., 1985, The effect glaciers on streamflow variations: Water ResourcResearch, v. 21, no. 4, p. 579-586.
Freethey, G.W., 1976, Preliminary report on water avaability in the lower Ship Creek basin, AnchorageAlaska—With a special reference to the fish hatcery on Fort Richardson and a proposed fish-hatcery site near the Elmendorf Air Force Baspowerplant: U.S. Geological Survey WaterResources Investigations Report 48-75, 21 p.
References Cited 64
a,
y,
e.
l
s--1-
e-l5-
terin-r-
Freethey, G.W., and Scully, D.R., 1980, Water resourcesof the Cook Inlet basin, Alaska: U.S. GeologicalSurvey Hydrologic Investigations Atlas HA-620, 4sheets.
Gallant, A.L., Binnian, E.F., Omernik, J.M., and Shasby,M.B., 1995, Ecoregions of Alaska: U.S. GeologicalSurvey Professional Paper 1567, 73 p., 1 pl.
Glass, R.L., 1996, Ground-water conditions and qualityin the western part of Kenai Peninsula, southcentralAlaska: U.S. Geological Survey Open-File Report96-466, 66 p.
Harr, R.D., 1986, Effects of clearcutting on rain-on-snowrunoff in western Oregon—A new look at old stud-ies: Water Resources Research, v. 22, no. 7, p.1,095-1,100.
Harr, R.D., and Fredriksen, R.L., 1988, Water qualityafter logging small watersheds within the Bull RunWatershed, Oregon: Water Resources Research, v.24, no. 5, p. 1,103-1,111.
Hartman, C.W., and Johnson, P.R., 1978, Environmentalatlas of Alaska (2d ed.): University of Alaska, Insti-tute of Water Resources, 95 p.
Hotchkiss, N., 1972, Common marsh, underwater, andfloating-leaved plants of the United States and Can-ada: New York, Dover Publications, 124 p.
Jones, S.H., and Fahl, C.B., 1994, Magnitude and fre-quency of floods in Alaska and conterminous basinsof Canada: U.S. Geological Survey Water-Resources Investigations Report 93-4179, 122 p. +2 pl.
Karlstrom, T.N.V., 1964, Quaternary geology of theKenai lowlands and glacial history of the Cook Inletregion, Alaska: U.S. Geological Survey Profes-sional Paper 443, 69 p.
Knott, J.M., Lipscomb, S.W., and Lewis, T.W., 1987,Sediment transport characteristics of selectedstreams in the Susitna River basin, Alaska—Datafor water year 1985 and trends in bedload discharge,1981-85: U.S. Geological Survey Open-File Report87-229, 51 p.
Lamke, R.D., 1972, Floods of the summer of 1971 insouthcentral Alaska: U.S. Geological Survey Open-File Report, 88 p.
Lamke, R.D., 1991, Alaska floods and droughts, in Paul-son, R.W., and others, National water summary,1988-89—Hydrologic events and floods anddroughts: U.S. Geological Survey Water-SupplyPaper 2375, p. 171-180.
Lamke, R.D., and Bigelow, B.B., 1988, Floods of Octo-ber 1986 in southcentral Alaska: U.S. GeologicalSurvey Open-File Report 87-391, 31 p.
Magoon, L.B., Adkison,W.l., and Egbert, R.M., 1976,Map showing geology, wildcat wells, Tertiary planlocalities, K/Ar age dates, and petroleum opera-tions, Cook Inlet area, Alaska: U.S. Geological Sur-vey Miscellaneous Investigations Series Map I-1019, scale 1:250,000, 3 sheets.
Meador, M.R., Cuffney, T.F., and Gurtz, M.E., 1993,Methods for sampling fish communities as part ofthe National Water-Quality Assessment Program:U.S. Geological Survey Open-File Report 93-104,40 p.
Meier, M.F., 1969, Glaciers and water supply: Journal ofthe American Water Works Association, v. 61, no.1, p. 8-12.
Meier, M.F., and Tangborn, W.V., 1961, Distinctive char-acteristics of glacier runoff: U.S. Geological SurveyProfessional Paper 424-B, p. 14-16.
Meyer, D.F., and Trabant, D.C., 1995, Lahars from the1992 eruptions of Crater Peak, Mount Spurr Vol-cano, Alaska, in Keith, T.E.C., ed., The 1992 erup-tions of Crater Peak vent, Mount Spurr Volcano,Alaska: U.S. Geological Survey Bulletin 2139, p.183-198.
Milner, A.M., and Oswood, M.W., 1990, Macroinverte-brate water quality monitoring program in Anchor-age streams—1989 results: University of AlaskInstitute of Arctic Biology, variously paged.
Milner, A.M., and Petts, G.E., 1994, Glacial rivers—Physical habitat and ecology: Freshwater Biologv. 32, p. 295-308.
Mueller, D.K., and Helsel, D.R., 1996, Nutrients in thNation’s waters—Too much of a good thing?: U.SGeological Survey Circular 1136, 24 p.
Municipality of Anchorage, 1996, Anchorage historicahighlights: accessed September 1998 at URL www.ci.anchorage.ak.us/History/index.html
Nelson, G.L., 1981, Hydrology and the effects of indutrial pumping in the Nikiski area, Alaska: U.S. Geological Survey Water-Resources Investigations 8685, 22 p.
Nelson, G.L., 1985, Results of test drilling and hydrogology of Capps coal field, Alaska: U.S. GeologicaSurvey Water-Resources Investigations Report 84114, 23 p.
Nelson, G.L., and Johnson, P.R., 1981, Ground-wareconnaissance of part of the lower Kenai Pensula, Alaska: U.S. Geological Survey WateResources Investigations 81-905, 32 p.
65 Water-Quality Assessment of the Cook Inlet Basin, Alaska—Environmental Setting
,rf-
alt
dr-k
tyl-erer0;
terter
ofS.
ofS.
atas:1
ataal
a:51
.,giclts,
Omernik, J.M., 1995, Ecoregions—A spatial frameworkfor environmental management, in Davis, W.S. andSimon, T., eds., Biological assessment and crite-ria—Tools for water resource planning and decisionmaking: Boca Raton, Florida, Lewis Publishers, p.49-62.
Oswood, M.W., Irons, J.G., and Milner, A.M., 1995,River and stream ecosystems of Alaska, in Cushing,C.E., Cummins, K.W., and Minshall, G.W., eds.,Ecosystems of the world, 22, River and stream eco-systems: New York, Elsevier Science Inc., p. 9-32.
Paterson, W.S.B., 1994, The physics of glaciers (3d ed.):New York, Elsevier Science Inc., 480 p.
Péwé, T.L., and Reger, R.D., 1983, Guidebook to perma-frost and Quaternary geology along the Richardsonand Glenn Highways between Fairbanks andAnchorage, Alaska: Alaska Division of Geologicaland Geophysical Surveys Guidebook 1, 263 p.
Post, Austin, and Mayo, L.R., 1971, Glacier-dammedlakes and outburst floods in Alaska: U.S. Geologi-cal Survey Hydrologic Atlas HA-455, 10 p., 3 pl.
Reger, R.D., Pinney, D.S., Burke, R.M., and Wiltse,M.A., 1996, Catalog and initial analyses of geologicdata related to middle to late Quaternary deposits,Cook Inlet region, Alaska: Alaska Division of Geo-logical and Geophysical Surveys Report of Investi-gations 95-6, 188 p.
Rieger, S., Schoephorster, D.B., and Furbish, C.E., 1979,Exploratory soil survey of Alaska: U.S. Departmentof Agriculture, Soil Conservation Service, 213 p.
Scott, K.M., 1982, Erosion and sedimentation in theKenai River, Alaska: U.S. Geological Survey Pro-fessional Paper 1235, 35 p.
Searby, H.W., 1968, Climates of the States—Alaska:Environmental Data Service ESSA, Climatology ofthe United States, no. 60-49.
Searcy, J.K., 1959, Flow-duration curves: U.S. Geologi-cal Survey Water-Supply Paper 1542-A, 33 p.
Silberling, N.J., Jones, D.L., Monger, J.W.H., Coney,P.J., Berg, H.C., and Plafker, George, 1994, Litho-tectonic terrane map of Alaska and adjacent parts ofCanada, in Plafker, George, and Berg, H.C., eds.,The geology of Alaska, v. G-1 in The Geology ofNorth America: The Geological Society of Amer-ica, plate 3, 1 sheet, scale 1:7,500.000.
Singer, M.J., and Munns, D.N., 1987, Soils—An intro-duction: New York, MacMillan Publishing Com-pany, 492 p.
Updike, R.G., and Ulery, C.A., 1986, A geotechnicalcross section for downtown Anchorage using theelectric-cone-penetration test: Alaska Division ofGeological and Geophysical Surveys Report ofInvestigations 86-3, 41 p.
U.S. Air Force, 1998, Environmental restoration pro-gram—Basewide water level monitoring programJuly-December 1997: U.S. Air Force, ElmendoAir Force Base, Alaska, Biannual Technical Memorandum, variously paged.
U.S. Army Corps of Engineers, 1996, Geotechnicreport for groundwater monitoring network, ForRichardson, Alaska: Alaska District, U.S. ArmyCorps of Engineers, 16 p. + 3 appendixes.
U.S. Department of Agriculture, 1975, Soil taxonomy—A basic system of soil classification for making aninterpreting soil surveys: Soil Conservation Sevice, U.S. Department of Agriculture Handboo436, 754 p.
U.S. Geological Survey, 1954-62, Quantity and qualiof surface waters of Alaska. Annual reports as folows: water years 1951-53, Water-Supply Pap1466; water years 1954-56, Water-Supply Pap1486; water year 1957, Water-Supply Paper 150water year 1958, Water-Supply Paper 1570; wayear 1959, Water-Supply Paper 1640; and wayear 1960, Water-Supply Paper 1720.
U.S. Geological Survey, 1971, Surface-water supply the United States, 1961-65, Part 15, Alaska: U.Geological Survey Water-Supply Paper 1936.
U.S. Geological Survey, 1976, Surface-water supply the United States, 1966-70, Part 15, Alaska: U.Geological Survey Water-Supply Paper 2136.
U.S. Geological Survey, 1972-75, Water resources dfor Alaska, 1971-74, Part 1, Surface water recordU.S. Geological Survey Water-Data Reports AK-7to AK-74 (published annually).
U.S. Geological Survey, 1976-96, Water resources dfor Alaska, water years 1975-95: U.S. GeologicSurvey Water-Data Reports AK-75-1 to AK-95-1(published annually).
Wahrhaftig, C., 1965, Physiographic divisions of AlaskU.S. Geological Survey Professional Paper 482, p., 6 pl.
Wilson, F.H., Dover, J.H., Bradley, D.C., Weber, F.RBundtzen, T.K., and Haeussler, P.J., 1998, Geolomap of central (interior) Alaska: U.S. GeologicaSurvey Open-File Report 98-133, 63 p. + 3 sheescale 1:500,000.
References Cited 66

References Cited 67