water quality assessment of the lewis ginter botanical ... · approximately 50 acres of ornamental...
TRANSCRIPT

Water Quality Assessment of the Lewis Ginter Botanical Garden Irrigation Pond
For submission to the Faculty of Virginia Polytechnic Institute and Sate University in partial fulfillment of the requirements for the Master’s Degree in Crop and Soil Environmental Science: CSES 5904, Project and Report
Correspondence to:
Karin A. Stretchko
Graduate Student, Virginia Polytechnic Institute and State University
Blacksburg, VA 24061
Tel:804 8835090
E-mail: [email protected]
Date: Spring 2013
Karin A. Stretchko
Graduate Student, Virginia Polytechnic Institute and State University,
Blacksburg, VA 24061

2
ABSTRACT
Stormwater reuse for irrigation purposes on public and private land is a way to
overcome the increasing pressure on finite water resources. Unfortunately,
stormwater runoff can contain common pollutants such as nutrients, bacteria and
petroleum products. Lewis Ginter Botanical Garden is an 82-acre public garden in
Richmond, Virginia that uses stormwater runoff to irrigate garden displays. The
objective of this study was to determine levels of Escherichia coli (E. coli), nitrogen,
phosphorous, and total petroleum hydrocarbons in the irrigation water that
contains stormwater runoff. Results of the study showed that the irrigation water E.
coli level of 91mpn/100ml was below both United States Environmental Protection
Agency (U.S. EPA) and Virginia Department of Environmental Quality (VA DEQ)
recreational freshwater system standards. Total nitrogen of 0.3 mg/L, Total Kjeldahl
Nitrogen of 0.28 mg/L, and nitrate + nitrite of <0.1 mg/L indicate that the irrigation
water quality is very near U.S. EPA reference conditions. Total ammonia nitrogen of
0.19 mg N/L was well below VA DEQ surface freshwater criteria. Results from two
separate testing methods show total phosphorus levels at 0.05 mg/L and 0.16 mg/L
which indicates the irrigation water level is above both U.S. EPA reference
conditions and VA DEQ water quality criteria levels. Total Petroleum
Hydrocarbons-Volatiles (Gas Range Organics) and Total Petroleum Hydrocarbons-
Semi-Volatiles (Oil Range Organics) levels of < 0.5 mg/L and 1 mg/L were below Lab
Quantitation Limits indicating that results are below applicable limits as established
by the U.S. EPA.
KEYWORDS
Stormwater reuse; nitrogen; phosphorus; E. coli; total petroleum hydrocarbon.

3
LIST OF ABBREVIATIONS
API Aquarium Pharmaceuticals
E. coli Escherichia coli
GRO Gas Range Organics
mpn most probable number
ORO Oil Range Organics
TKN Total Kjeldahl Nitrogen
TPH Total Petroleum Hydrocarbons
U.S. EPA United States Environmental Protection Agency
VA DEQ Virginia Department of Environmental Quality

4
INTRODUCTION
Unpolluted water is a vital biological and economic resource. Its many uses include
drinking, fishing, hunting, irrigation, recreation, ecological values, aesthetics and
industry. In recent years, water pollutant input levels have increased. The result of
this increase has been water quality degradation of many vital water systems
including rivers, lakes, streams and ponds (Carpenter et al., 1998). Water shortages
are becoming more common, and they are likely to become worse in the future
because contaminated water increases the costs of treating water for use, which
reduces overall supply (Postel, 1997; Postel et al., 1996).
Water pollution occurs when contaminants such as chemicals and wastes discharge
directly into a water body without adequate treatment to remove harmful
compounds. Stormwater pollution is caused by untreated contaminated runoff from
land uses within a catchment area that drain into waterways. The contaminated
runoff can affect the overall health of the receiving water body and can also
adversely affect the aquatic habitats and the aesthetics of the water body
(Settacharnwit et al., 2003). When contaminated runoff degrades water quality to
the point where the water body cannot be utilized for its intended purpose,
environmental, economic and social losses can occur (Joliffe, 1995).
According to the U.S. EPA 2000 National Water Quality Inventory, urban runoff is
one of the leading sources of water quality impairment in surface waters in the
United States. A list of common pollutants found in uncontrolled or untreated

5
runoff from urban areas includes fertilizers/nutrients, pesticides and herbicides
from residential areas; bacteria/pathogens from pet wastes or flawed septic
systems; heavy metals and petroleum products such as oil and gas from streets,
roadways, and improper disposal of household chemicals; and sediments from
construction sites that are not properly managed. (U.S. EPA, 2002)
Stormwater reuse is one way to overcome the increasing pressures on finite water
resources (Hatt et al., 2007). Capturing and harvesting stormwater for irrigation use
on both public and private lands can reduce potable water demands in urban
settings. However, the stormwater pollutant level can effect the overall quality of
the irrigation water and impact soil, plants, irrigation systems and public health (He
et al., 2008).
Lewis Ginter Botanical Garden is an 82-acre public garden located in the
metropolitan Richmond, Virginia area, just north of the Richmond city limits.
Established in 1984, the garden consists of approximately 50 public acres of themed
garden displays, a classical domed conservatory and several buildings including the
E. Claiborne Robins Visitors Center and the Education and Library Complex. The
remaining non-public sections of the garden include several maintenance yards and
buildings, a small pond, and the Massey Greenhouse. The garden depends on the
small pond located on the property, referred to as the Irrigation Pond, to provide
irrigation for the gardens. The Irrigation Pond receives its water from a
combination of localized runoff, stormwater overflow and from a well located on the
property that pumps water to the pond.

6
The objectives of this study were fourfold. The first objective was to determine
which pollutants Lewis Ginter Botanical Garden was concerned about in the
Irrigation Pond. The second objective was to test for pollutants of concern to
determine their levels. The third objective was to determine if the pollutant levels
were high enough to require remediation of the Irrigation Pond water before it is
used for irrigation. The fourth objective was to determine and suggest appropriate
remedial actions.
WATER QUALITY CONCERNS
The Lewis Ginter Botanical Garden Irrigation Pond is used to irrigate the garden’s
approximately 50 acres of ornamental plantings as well a edible plant material in
the Children’s Garden and the Community Kitchen Garden. After several discussions
with Lewis Ginter Botanical Garden staff, the most common concerns of using the
Irrigation Pond water were public safety, plant material health, and garden
aesthetics. Several concerns were voiced about using water with fecal coliform
bacteria contamination during visitation hours and on the edible plant material.
Another major concern was the excessive algae growth and the associated putrid
smell that the pond occasionally emitted. Lastly, there were discussions as to what
appeared to be an oily residue on the plant material after irrigation. Based on these
discussions and concerns, it was decided that the following chemical and biological
parameters would be tested for: pH, fecal coliform bacteria, nitrogen, phosphorous,
and TPH.

7
pH is a measure of the hydrogen ion activity and is equal to –log [H+]. It ranges from
0 to 14, with a value of 7 being considered neutral. It affects many biological and
chemical processes in water, including the solubility of heavy metals and other
dissolved constituents. A low pH increases the availability and toxicity of acid
soluble metals such as iron, aluminum and manganese, while decreasing
phosphorous availability to aquatic plants and animals. High pH increases the
toxicity of ammonia in water.
Fecal coliform bacteria such as E. coli are found in human and animal wastes. In
urban stormwater, fecal coliform bacteria originates from sources such as animal
wastes from residential developments, failing sewer and septic systems, area
wildlife, and animal manure fertilized areas (Cook & Baker, 2001; Moog & Whiting,
2002; Jameison et al., 2003). Fecal coliform bacteria are considered to be indicator
organisms of potential pathogenic microbes (Mallin & Wheeler, 2000). These
microbes can pollute area waters, cause human illness and ultimately affect the
ability of the water body and area to achieve its intended use (U.S. EPA ,1986; Jones,
1997). Stormwater reuse for irrigating the Lewis Ginter Botanical Garden gardens
has the potential to expose the general public to micobially contaminated water and
is a major concern. Previous research has shown that pathogenic microorganism
transmission through irrigation has resulted in pathophysiological conditions such
as skin irritations, ear, eye and wound infections, gastrointestinal illnesses and
upper respiratory infections (House et al., 1993).
Nutrients such as nitrogen and phosphorus can originate from fertilizer and
8
chemical application runoff from area agriculture, residential and commercial
developments. Excessive input of these nutrients can cause eutrophication of
surface water. The eutrophication cycle consists of:
Excess nutrients stimulate phytoplankton and submerged aquatic vegetation
growth
Increase in turbidity causes decreased subsurface light penetration
Death of submerged aquatic vegetation and phytoplankton
Oxygen demand is accelerated and depleted by organic decomposition and
microbe and phytoplankton respiration.
Low dissolved oxygen kills fish and other aquatic creatures; water smells
bad; water cannot fulfill intended use.
Eutrophication is the most common impairment of surface waters in the United
States (U.S. EPA, 1990). It negatively affects aquatic ecosystems and commonly
makes the water body unsuitable for its designated use (Carpenter et al., 1998).
Petroleum hydrocarbons, including products such as oil and gas, are generated from
surrounding area roadways by traffic activity, fluid leakage, component wear,
roadway maintenance and pavement degradation (Sansalone & Buchberger, 1997;
Shinya et al., 2000). These pollutants contain polycyclic aromatic hydrocarbons
which are known to have both carcinogenic and mutagenic properties (Farrington &
Meyers, 1975; Farrington, 1980). The volatile and more water soluable petroleum
compounds found in these products have been found to have harmful effects on the
reproduction and behavior of fish, along with detrimental effects on overall water

9
quality (Cranwell, 1975).
SITE DESCRIPTION
Lewis Ginter Botanical Garden is an 82-acre public garden located in the
metropolitan Richmond, Virginia area, just north of the Richmond city limits.
It is located at the lower part of the North Run Watershed and is further divided into
two smaller watersheds called the Thorpe Branch Watershed and the Small Streams
Watershed (Figure 1). From a high point on the site near the Garden’s main
buildings, approximately half the property drains into the Thorpe Branch
Watershed and the other half into the Small Streams Watershed. The garden is
surrounded by commercial and residential developments to the north, south and
west. Lakeside Country Club borders the northeast boundary of the site and
Belmont Golf Course and Lakeside Avenue border the southeast boundary. These
neighborhoods drain into either the smaller Thorpe Branch or Small Streams
Watersheds or directly into the North Run Watershed (Figure 2). It is expected that
the runoff from these urban areas carry typical urban pollutants including nitrogen,
phosphorus, fecal coliform bacteria and petroleum products.
Three man-made lakes are located on the property and are a contiguous part of the
many water features located in the Garden. Sydnor Lake is a focal point of the
garden’s public area and includes a wetland garden, two small recirculation streams,
and a smaller pond located behind the Robins Tea House. It was constructed in
1990 for water storage and has a total capacity of approximately 10 million gallons.

10
Sydnor Lake receives its water from a combination of localized garden runoff, a
deep well known as Well #2 that was drilled on the property in 1987, and Thorpe
Branch stormwater. At the location of the intake pipe that carries stormwater
overflow to Sydnor Lake, Thorpe Branch drains an approximately 16.1 square mile
stormwater runoff area. The 6” intake pipe is capable of delivering up to 250 gpm of
floodwater runoff to Sydnor Lake during major storm events. From Sydnor Lake,
water is pumped up into another man-made lake on the property known as the
Irrigation Pond. The Irrigation Pond was constructed in 2000 as part of the garden’s
long-term water management plan to provide sustainable and affordable irrigation
water for the gardens. The Irrigation Pond is not part of the garden’s public display
area and its primary function is to store water for garden irrigation. The majority of
the water stored in the Irrigation Pond is water pumped from Sydnor Lake, but it
also receives drainage water from localized garden runoff. The Irrigation Pond
covers an area of approximately 3.5 acres, has a maximum depth of 13’, and has an
approximate storage capacity of 10 million gallons (Figure 3; Nelson Byrd Woltz
Landscape Architects et al., 2007).
MATERIALS AND METHODS
The Irrigation Pond water sampling was conducted during the months of June, July
and August 2012. No attempt was made to favor either rain events or dry periods.
Water sampling was collected using a clear plastic container once a week in the late
afternoon at one of two sampling locations as shown on Figure 4 at a depth of

11
approximately 20 to 30 cm below the water surface. A total of 12 water samples
were obtained.
On the first testing day, the water was transferred to bottles provided by Air, Water
and Soil Laboratories, Inc. of Richmond, Virginia and was immediately taken to their
laboratory so that they could run the following tests: E. Coli [Colilert 18/QT], nitrate
+ nitrite [SM 18/4500-NO3 F], total nitrogen [Calc.2], TKN [EPA351.2/R2.0], total
phosphorus [SM 18/4500-P E], TPH-Semi-Volatiles (ORO)[SW8015C], and TPH-
Volatiles (GRO)[SW8015C]. (Note - test methods are in brackets) Tests conform to
the Virginia Environmental Laboratory Accreditation Program, which is overseen by
the National Environmental Laboratory Accreditation Conference. All tests are
approved by the U.S. EPA and conform to either Standard Methods for the
Examination of Water and Wastewater (American Public Health Association, 1998),
Guidelines Establishing Test Procedures for the Analysis of Pollutants; Analytical
Methods for Biological Pollutants in Ambient Waters; Final Rule (U.S. EPA, 2003) or
the Clean Water Act Analytical Methods (U.S. EPA , 2012). The water was also tested
on site that day and for the remaining testing dates for pH, total ammonia
(NH3+NH4+), nitrite (NO2-), nitrate (NO3-), and phosphate (PO43-) using an API (of
Chalfont, Pennsylvania) Freshwater Master Test Kit and Phosphate Test Kit.

12
DATA
The results of the water sample testing performed by Air, Water and Soil
Laboratories, Inc. of Richmond, Virginia are shown in full in Appendix A as provided
by them.
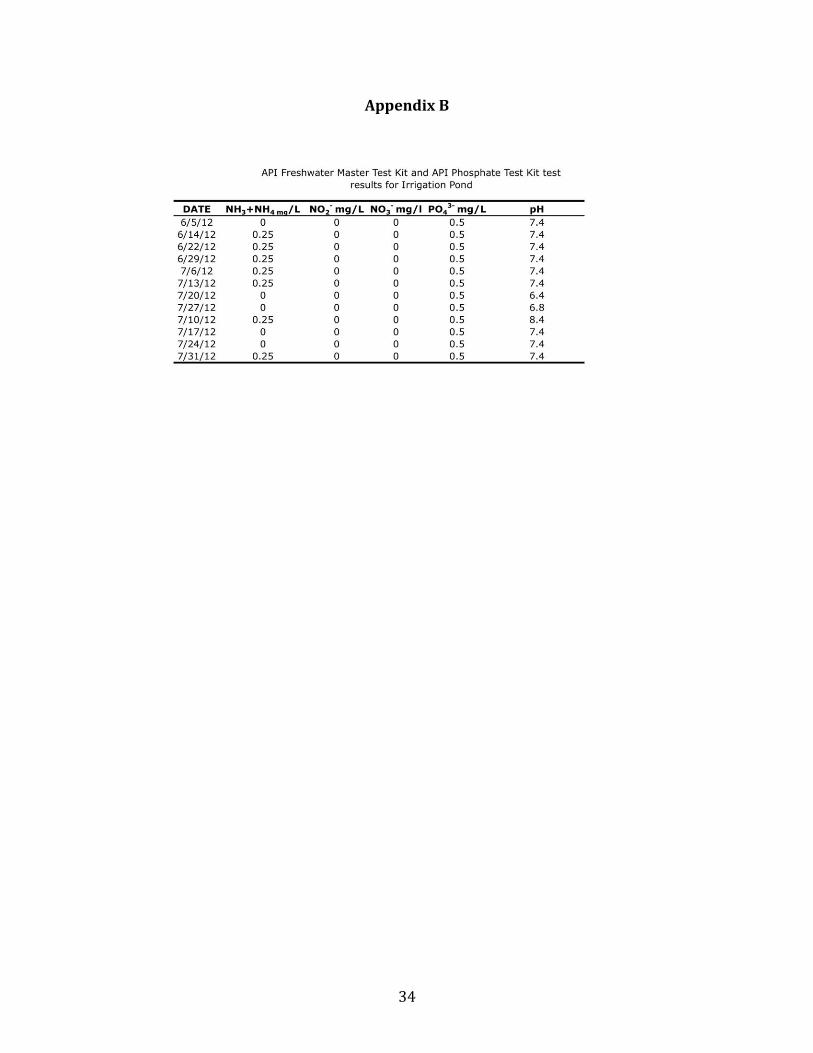
The data obtained from the 12 water samples taken over the months of June –
August 2012 is shown in Appendix B and is organized to show the pH, total
ammonia (NH3+NH4+), nitrite (NO2-), nitrate (NO3-), and phosphate (PO43-) for each
date tested.
RESULTS
The Irrigation Pond test results from the analysis done by Air, Water and Soil
Laboratories, Inc. of Richmond, Virginia on June 6, 2012 are as follows: E. Coli at
91mpn/100ml, TPH-Volatiles (GRO) at < 0.5 mg/L, TPH-Semi-Volatiles (ORO) at < 1
mg/L, total nitrogen at 0.3mg/L, TKN at 0.28mg/L and nitrate + nitrite at < 0.1mg/L
and total phosphorous at 0.05 mg/L (See Table 1. Below)
Table 1. Irrigation Pond Test Results – Air, Water and Soil Laboratories, Inc.
Parameter Results E. Coli mpn/100ml 91 TPH-Volatiles (GRO) mg/L < 0.5 TPH-Semi Volatiles (ORO) mg/L < 1 Nitrate + Nitrite mg/L < 0.1 Phosphorus, Total mg/L 0.05 TKN mg/L .28 Nitrogen, Total mg/L 0.3

13
The Irrigation Pond test results from the onsite water testing done using the API
Freshwater Master Test Kit and the API Phosphate Test Kit from June – August 2012
are as follows: pH for the Irrigation Pond ranged from a low of 6.4 to a high of 8.4
with a mode of 7.4. Total ammonia (NH3+NH4+) ranged from 0 to 0.25 mg/L with a
mode of 0.25 mg/L. Nitrite (NO2- ) and nitrate (NO3- ) test results were a constant 0
mg/L. phosphate (PO43-) test results were a constant 0.5 mg/L. (See Table 2. below)
Table 2. Irrigation Pond Test Results - API Freshwater Master Test Kit and the API Phosphate Test Kit
June 2012 July 2012 August 2012 5 14 22 29 6 13 20 27 10 17 24 31 pH 7.4 7.4 7.4 7.4 7.4 7.4 6.4 6.8 8.4 7.4 7.4 7.4 Ammonia
NH3+NH4+
mg/L 1
0 0.25 0.25 0.25 0.25 0.25 0 0 0.25 0 0 0.25
Nitrite NO2-
mg/L 2
0 0 0 0 0 0 0 0 0 0 0 0
Nitrate NO3-
mg/L 3
0 0 0 0 0 0 0 0 0 0 0 0
Phosphate PO43- mg/L 4
0.5 0.5 0.5 0.5 0.5 0.5 0.5 0.5 0.5 0.5 0.5 0.5
1 Ammonia (NH3+NH4+) - See Appendix C for API Color Chart. The results in the table reflect the
values from the Color Chart. On October 6, 2012, Mars Fishcare Technical Service and Research
representative Nathan Fekula noted that an Ammonia value of 0 mg/L might indicate an ammonia
range of 0 - 0.125 mg/L and an ammonia value of 0.25 mg/L might indicate an ammonia range of
0.125 - 0.375 mg/L.
2 Nitrite (NO2-) - See Appendix C for API Color Chart. The results in the table reflect the values from
the Color Chart. On October 6, 2012, Mars Fishcare Technical Service and Research representative
Nathan Fekula noted that a nitrite value of 0 mg/L might indicate a nitrite range of 0 -0.125 mg/L .
3 Nitrate (NO3-) - See Appendix C for API Color Chart. The results in the table reflect the values from
the Color Chart. On October 6, 2012 Mars Fishcare Technical Service and Research representative
Nathan Fekula noted that a nitrate value of 0 mg/L might indicate a nitrate range of 0 - 2.5 mg/L.

14
4 Phosphate (PO43-) - See Appendix C for API Color Chart. The results in the table reflect the values
from the Color Chart. On October 6, 2012 Mars Fishcare Technical Service and Research
representative Nathan Fekula noted that a phosphate value of 0.5 mg/L might indicate a phosphate
range of 0.375 - 0.75 mg/L.
DISCUSSION
Neither the U.S. EPA or the VA DEQ has developed irrigation water quality standards
for the parameters tested. A combination of U.S. EPA and VA DEQ surface
freshwater standards, ambient freshwater standards and recreational surface
freshwater standards combined with The Food and Agriculture Organization of the
United Nations irrigation water standards were used for the discussion that follows.
Lewis Ginter Botanical Garden falls within Ecoregion IX, level III, ecoregion 45 for
U.S. EPA Ambient Water Quality Criteria Recommendations (U.S. EPA, 2000). It falls
within ecoregion 9 for the VA DEQ Freshwater Nutrient Criteria (Virginia Water
Resources Research Center, 2005).
pH
The pH of the Irrigation Pond ranged from a low of 6.4 on July 20, 2012 to a high of
8.4 on August 10, 2012 with a mode of 7.4. The VA DEQ numerical criteria for
surface water pH ranges between 6.0 and 9.0 (Virginia Administrative Code:
Virginia Legislative Information System, 2012) and the U.S. EPA national
recommended water quality criteria for pH for freshwater aquatic life ranges from
6.5 to 9.0 (U.S. EPA, 1986). The Food and Agriculture Organization of the United

15
Nations lists the normal pH range for irrigation water between 6.5 and 8.4 (Ayers &
Westcot, 1985). The pH of the Irrigation Pond affects the solubility of trace
elements and nutrients, and a pH outside of the normal range can cause a nutrient
imbalance or a metal toxicity to aquatic life. All pH reading fall within VA DEQ
surface water quality criteria. The 6.4 pH reading on July 20, 2012 falls outside of
the U.S. EPA water quality criteria and The Food and Agriculture Organization of the
United Nations normal pH range for irrigation waters. However, it is only a tenth of
a pH unit outside the normal range. Although a pH reading outside the normal
limits does not necessarily indicate poor water quality, it is an indication that the
water needs further evaluation.
E. Coli
Both the U.S. EPA and VA DEQ use the following E. coli water quality standard for
recreational freshwater systems: E. coli bacteria shall not exceed a monthly
geometric mean (a minimum of five samples over a 30 day period for VA DEQ and 2
samples over a 30 day period for U.S. EPA) of 126mpn/100ml. If data is insufficient
to calculate the geometric monthly mean, then no more than 10% of the total
samples in the assessment period shall exceed 235mpn/100ml. (Virginia
Administrative Code: Virginia Legislative Information System, 2012; U.S. EPA, 2003).
Only one E. coli test was done on the Irrigation Pond on June 5, 2012. The E. Coli
level on that date was 91mpn/100ml, which falls well below the single sample
maximum of 235mpn/100ml. The EPA accepts the Colilert-18 testing method as an
approved method for enumerating E. coli in ambient water (U.S. EPA, 2003).

16
Nutrients –Nitrogen
The U.S. EPA Ambient Water Quality Criteria Recommendations lists reference
conditions for nutrients for Lakes and Reservoirs. Reference conditions indicate
levels of nutrients that would be in waters that are relatively undisturbed or in least
disturbed conditions. The U.S. EPA reference conditions for total nitrogen, TKN and
nitrate + nitrite for Ecoregion IX, level III, ecoregion 45 were 0.304 mg/L, 0.245
mg/L and 0.059 mg/L respectively. Results from Air, Water and Soil Laboratories,
Inc. show total nitrogen at 0.3mg/L, TKN at 0.28mg/L and nitrate + nitrite at <
0.1mg/L indicating that the Irrigation Pond is very near what the U.S. EPA would
consider a reference condition. (U.S. EPA, 2000)
VA DEQ does not have recommended numerical criteria for total nitrogen. The
limiting factor in the eutrophication of Virginia's warm water lakes is almost always
phosphorus, therefore making criteria for nitrogen unnecessary (VA. DEQ, 2004).
However, the Virginia Water Resources Research Center, 2005, studied total
nitrogen levels for 41 lakes in ecoregion 9, and the study showed total nitrogen
ranging from 0.30 mg/L to 1.08 mg/L in that area. The total nitrogen for the
Irrigation Pond was 0.3 mg/L, which is at the low end of the ecoregion 9 total
nitrogen range of values, measured in the 41 lakes by Virginia Water Resources
Research Center.
The VA DEQ does have surface freshwater criteria for total ammonia nitrogen.
Ammonia is toxic to fish and the toxicity is dependent upon pH. According to VA

17
DEQ, at a pH of 6.4, total ammonia nitrogen should not exceed 50.5 mg N/L; at a pH
of 7.4, total ammonia nitrogen should not exceed 23mg N/L; and at a pH of 8.4, total
ammonia nitrogen should not exceed 3.88 mg N/L. At pH 8.4, the Irrigation Pond
total ammonia was 0.25mg/L. Converting total ammonia to total ammonia nitrogen1
(multiplying 0.25 mg/L x .7762) results in total ammonia nitrogen of 0.19 mg N/L,
which falls well below the VA DEQ criteria. (Virginia Administrative Code: Virginia
Legislative Information System, 2012)
Nutrients –Phosphorus
The U.S. EPA Ambient Water Quality Criteria Recommendations indicate that a
reference condition for total phosphorus for Ecoregion IX, level III, ecoregion 45 is
0.0225 mg/L (U.S. EPA, 2000). Additionally, VA DEQ recommends total phosphorus
levels should be no greater than between 0.03 and 0.04 mg/L for ecoregion
9. (Virginia Administrative Code: Virginia Legislative Information System, 2012).
Results from Air, Water and Soil Laboratories, Inc. show total phosphorus at 0.05
mg/L and results from the API Phosphate Test Kit show a total phosphate (PO43-) of
0.5 mg/L. Converting total phosphate to total phosphorus2 (multiplying PO43- by
0.3268) results in total phosphorus of 0.16 mg/L. Both tests clearly show that the
Irrigation Pond total phosphorus levels are above both U.S. EPA reference
conditions and VA DEQ water quality criteria levels.
1 The API Freshwater Master Test Kit reads total ammonia (NH3+NH4+) as an ammonia ion, and is a measure of both nitrogen and hydrogen atoms in the molecule. VA DEQ results are reported as total ammonia nitrogen, which is a measure of only the nitrogen atoms in the molecule. 2 The API Freshwater Master Test Kit reads total phosphate (PO43-) as a phosphate ion, and is a measure of both
phosphorus and oxygen atoms in the molecule. U.S. EPA and VA DEQ results are reported as total phosphorus, which is a measure of only the phosphorus atoms in the molecule.

18
Total Petroleum Hydrocarbons
Total Petroleum Hydrocarbons is a term that is used to describe a wide variety of
chemical compounds derived from crude oil and its by-products. The U.S. EPA
indicated in their Quality Criteria for Water 1986, that it is difficult to set criteria for
oil and grease because they are not definitive chemical categories and include
thousands of organic compounds with properties that vary physically, chemically
and toxicologically (U.S. EPA, 1986). Since the Irrigation Pond was tested for TPH-
Volatiles (GRO) and TPH-Semi-Volatiles (ORO), and not for particular products,
there is no way to analyze the results against the criteria as set forth by the U.S. EPA
Quality Criteria for Water 1986. Additionally, the results of TPH- Volatiles (GRO) of
< 0.5 mg/L and TPH-Semi-Volatiles (ORO) < 1 mg/L are both below the Lab
Quantitation Limits as approved for the testing method by the U.S. EPA, which is an
indication that the results are below the applicable limit as established by the U.S.
EPA (U.S. EPA, 2007). However, it should be noted that aquatic flora and fauna have
shown negative effects to individual oil and gas product levels below the Lab
Quantification Limits and further evalutation of this product is needed to make any
meaningful conclusions (U.S. EPA, 1986).
CONCLUSIONS AND RECOMMENDATIONS
pH, Nitrogen and E. Coli
The Irrigation Pond pH was within VA DEQ numerical criteria for surface waters
and was within or very near water quality criteria for U.S. EPA freshwater aquatic
life and The Food and Agriculture Organization of the United Nations normal range
for irrigation water. Nitrogen levels in the Irrigation Pond were very near reference

19
conditions per U.S. EPA Ambient Water Quality Criteria Recommendations and were
also at the low end of the ecoregion 9 total nitrogen range of values measured in the
41 lakes by Virginia Water Resources Research Center. Ammonia levels were also
within the VA DEQ surface freshwater criteria. E. coli bacteria levels were below
both U.S. EPA and VA DEQ water quality standards for recreational freshwater
systems. The only recommendation for these variables at this time is to continue
testing and monitoring the Irrigation Pond year round - on a monthly basis from
October to March and weekly from April to September. The test methods can be
improved with the use of better and more sensitive test kits. The testing should be
expanded to include Sydnor Lake, which is an integral part of the Lewis Ginter
Botanical Garden water storage system.
Phosphorus
Phosphorus levels in the Irrigation Pond were above both U.S. EPA Ambient Water
Quality Criteria Recommendations and VA DEQ recommended levels. Excessive
inputs of phosphorus, in combination with nitrogen, can cause eutrophication of
surface water. In the United States, eutrophication is the most common impairment
of surface waters, often making the water body unsuitable for its designated use.
Weekly visual observation of the Irrigation Pond did not show any substantial algae
or other aquatic vegetation growth. It is possible that this was because the total
nitrogen to total phosphorus ratio (TN:TP) was less than 7:1, which some studies
have shown is indicative of potential N-limitation (Abell et al., 2010). However, since
phosphorus is above both U.S. EPA and VA DEQ recommendations, further research
needs to be done to determine the cause of the elevated phosphorous levels, and if

20
at all possible, methods to reduce these levels. Short-term remedies for excessive
phosphorus inputs and possible associated eutrophication include:
the addition of oxygen to waters via aerators. This step has already been
done. Four aerators were installed in the Irrigation Pond several years ago to
assist in controlling existing eutrophication problems.
the addition of Ca, Al, or Fe salts to accelerate the precipitation of phosphates
(Nichols, 1983; Ryding, 1985).
The addition of aquatic plants such as Juncus effuses, Iris ensata, Scirpus
triqueter, Iris pseudacorus and Zizania latifolia. These plants, as well as other
types of vegetation, have been shown to reduce both nitrogen and
phosphorus levels in planted wetlands (Iamchaturapatr et al., 2007;
Gumbricht, 1993).
Further discussion with Lewis Ginter Botanical Garden staff regarding the remedial
steps to eliminate phosphorus is recommended.
Total Petroleum Hydrocarbons
The U.S. EPA Quality Criteria for Water 1986 for oil and grease establishes limits for
particular products, and there is there is no way to analyze the TPH- Volatiles (GRO)
and TPH-Semi-Volatiles (ORO) results against those criteria. In addition, the results
for TPH-Volatiles (GRO) and TPH-Semi-Volatiles (ORO) were below Lab
Quantitation Limits. This indicates that quantities for both items were below the
applicable limit as established by the U.S. EPA (U.S. EPA, 2007). However, individual
oil and grease products have been shown to be harmful at limits lower than the Lab
Quantitation Limits, and further research in this area is needed to establish whether

21
levels of these products in the Irrigation Pond are safe.

22
Acknowledgments
The author would like to thank Matt Eick, my Advisory Committee Chairperson, for
his prompt reviews, constructive comments and guidance throughout the project;
Dr. Lee Daniels and Dr. Holly Scoggins for being Advisory Committee members; Jim
Watwood for his encouragement to begin the to graduate program; and Nathan and
Andi Watwood for their eternal patience as I worked on this project and the rest of
my graduate degree. The author would also like to acknowledge the following
persons for their assistance with this project: Margaret Merrill, Dr. Carl Zipper,
Grace Chapman, Shane Tippett, Frank Robinson, Brian Vick, Jonah Holland, Lilly and
Sonya.

23
REFERENCES CITED
Abell, J. M., Ozkundakci, D., & Hamilton, D. P. (2010). Nitrogen and phosphorus limitation of phytoplankton growth in New Zealand lakes: implications for eutrophication control. Ecosystems, 13, 966-977.
American Public Health Association. (1998). Standard methods for the examination of water and wastewater, 20th ed. (L. S. Clesceri, A. E. Greenberg, A. D. Eaton, & M. Franson, Eds.) Washington, D.C.: American Public Health Association, American Water Works Association, Water Environment Federation.
Ayers, R. S., & Westcot, D. W. (1985). Water quality for agriculture. Food and Agriculture Organization of the United Nations, Rome.
Carpenter, S. R., Caraco, N. F., Correll, D., Howarth, R. W., Sharpley, A. N., & Smith, V. H. (1998). Nonpoint pollution of surface waters with phosphorus and nitrogen. Ecological Applications, 8 (3), 559-568.
Cook, M., & Baker, J. (2001). Bacteria and nutrient transport to the lines shortly after application of large volumes of liquid swine manure. Trans. Am. Soc. Ag. Eng., 44, 495-503.
Cranwell, P. A. (1975). Environmental organic chemistry of rivers and lakes, both water and sediment. In T. C. Society, & G. Eglinton (Ed.), Environmental Chemistry (Vol. 1, pp. 22-54). London.
Farrington, J. W. (1980). An overview of the biogeochemisty of fossil fuel hydrocarbons in the marine environment. In L. F. Petrakis, & T. Weiss (Eds.), Petroleum in the Marine Environment, Advances in Chemistry Series 185. (pp. 1-22). Washington, D.C.
Farrington, J. W., & Meyers, P. A. (1975). Hydrocarbon in the marine environment. In T. C. Society, & G. Eglinton (Ed.), Environmental Chemistry (Vol. 1, pp. 109- 136). London.
Gumbricht, T. (1993). Nutrient removal processes in freshwater submersed macrophyte systems. Ecological Engineering, 2, 1-30.
Hatt, B. E., Deletic, A., & Fletcher, T. D. (2007). Stormwater reuse: designing biofiltration systems for reliable treatment. Water Science and Technology , 55 (4), 201-209.
He, J., Valeo, C., Chu, A., & Neumann, N. F. (2008). Water quality assessment in the application of stormwater reuse for irrigation public lands. Water Qual. Res. J. Can., 43 (2/3), 145-159.
House, M. A., Ellis, J. B., Herricks, E. E., Hvitved-Jacobsen, T., Seager, J., Lijklema, L., et al. (1993). Urban drainage - impacts on receiving water quality. Water Sci. Technol., 27, 117-158.
Iamchaturapatr, J., Yi, S. W., & Rhee, J. S. (2007). Nutrient removals by 21 aquatic plants for vertical free surface-flow (VFS) constructed wetland. Ecological Engineering , 29, 287-293.
Jameison, R. C., Gordon, R. J., Tattrie, S. C., & Stratton, G. W. (2003). Sources and persistence of fecal coliform bacteria in a rural watershed. Water Qual. Res. J. Can., 38, 33-47.
Joliffe, I. (1995). Hydrological cycle and impacts of urbanization. In Environmental Aspects of Urban Drainage, Concord Function Centre (Sharpin, M.G. ed., pp. 1-

24
20/2). Sydney. Jones, D. L. (1997). Potential health risks associated with the persistence of
Escherichia coli O157 in agricultural environments. Soil Use Mangmt., 15 (2), 76-83.
Mallin, M. A., & Wheeler, T. L. (2000). Nutrient and fecal coliform discharge from coastal North Carolina golf courses. J. Environ. Qual., 29, 979-986.
Moog, D., & Whiting, P. (2002). Climatic and agricultural contributions to changing loads in two watersheds in Ohio. J. Environ. Qual., 31, 72-83.
Nelson Byrd Woltz Landscape Architects with Nitsch Engineering, Inc., OHK Environmental Inc., and Hydro Environmental. (2007). Lewis Ginter Botanical Garden Hydrologic Master Plan. Richmond.
Nichols, D. S. (1983). Capacity of natural wetlands to remove nutrients from wastewater. J. Water Pollut. Contr. Fed., 55, 495-505.
Postel, S. L., Daily, G. C., & Ehrlich, P. R. (1996). Human appropriation of renewable fresh water. Science, 271, 785-788.
Postel, S. (1997). Last oasis. (Second edition ed.). Washington, D.C.: Island Press. Ryding, S. O. (1985). Chemical and microbiological processes as regulators of the
exchange of substances between sediments in shallow, eutrophic lakes. Int. Rev. Gesamten Hydrobiol., 70, 657-702.
Sansalone, J. J., & Buchberger, S. G. (1997). Partitioning and First Flush of Metals in Urban Roadway Storm Water . J. Environ. Eng., 123 (2), 134-143.
Settacharnwit, S., Buckney, R., & Lim, R. (2003). The nutrient status of Nong Han, a shallow tropical lake in north-eastern Thailand: spacial and temporal variations. Lakes and Reservoirs: Research and Management, 8, 189-200.
Shinya, M., Tsuchinaga, T., Kitano, M., Tamada, Y., & Ishikawa, M. (2000). Characterization of Heavy Metals and Polycyclic Aromatic Hydrocarbons in Urban Highway Runoff. Water Sci. Technol., 42, 201-208.
U.S. EPA . (2012). Clean Water Act Analytical Methods: United States Environmental Protection Agency. Retrieved 2012, from United States Environmental Protection Agency: http://water.epa.gov/scitech/methods/cwa
U.S. EPA. (2002). 2000 National Water Quality Inventory. U.S. EPA, Office of Water, Washington, D.C.
U.S. EPA. (1986). Ambient water quality criteria for bacteria -1986. EPA/440/5-84- 002, U.S. EPA, Office of Water Regulation and Standards, Washington, DC.
U.S. EPA. (2000). Ambient water quality criteria recommendations: Information supporting the development of state and tribal nutrient criteria for lakes and reservoirs in nutrient ecoregion IX. U.S. EPA, Office of Water, Washington, D.C.
U.S. EPA. (2003). Bacteria water quality standards for recreational waters (freshwater and marine waters). U.S. EPA, Office of Water, Washington, D.C. U.S. EPA. (2003). Guidelines establishing test procedures for the analysis of pollutants; analytical methods for biological pollutants in ambient water; final rule. U.S.
EPA. U.S. Federal Register - 40 CFR Part 136, Vol. 68, No. 139. U.S. EPA. (1990). National water quality inventory. 1988 Report to Congress. U.S. EPA,
Office of Water, Washington D.C. U.S. EPA. (1986). Quality criteria for water 1986. U.S. EPA, Office of Water,
Washington, D.C.

25
U.S. EPA. (2007). Report of the Federal Advisory Committee on detection and quantification approaches and uses in Clean Water Act programs. U.S. EPA,
Washington, D.C. . VA. DEQ. (2004). Nutrient criteria development plan for the Commonwealth of Virginia. Office of Water Quality Programs. Virginia Administrative Code: Virginia Legislative Information System. (2012).
Retrieved 2012, 29-October from Virginia Legislative Information System: http://www.lis.virginia.gov/lis.htm
Virginia Water Resources Research Center. (2005). January 2005 Report of the Academic Avisory Committee to Virginia Department of Environmental Quality: Freshwater Nutrient Criteria.
Water:United States Environmental Protection Agency. (2012, 26-April). Retrieved 2012, 28-April from United States Environmental Protection Agency: http://www.epa.gov

26
Figure Captions
Figure 1 - Regional Map of Richmond showing watersheds and counties
Figure 2 - Local Watersheds in immediate vicinity of LGBG
Figure 3 - Locator Plan of Lewis Ginter Botanical Garden and Existing Conditions
Figure 4 - Irrigation Pond Sampling Locations
All Figures are from the Lewis Ginter Botanical Garden Hydrologic Master Plan and
are used with permission from Shane Tippett, Executive Director, Lewis Ginter
Botanical Garden.

27
Figure 1

28
Figure 2

29
Figure 3

30
Figure 4
Irrigation Pond Sampling Locations

31
Appendix A

32

33
34
Appendix B

35
Appendix C