water quality assessment of the plover river …
TRANSCRIPT

WWAATTEERR QQUUAALLIITTYY AASSSSEESSSSMMEENNTT OOFF TTHHEE
PPLLOOVVEERR RRIIVVEERR WWAATTEERRSSHHEEDD LLAANNGGLLAADDEE,, MMAARRAATTHHOONN AANNDD PPOORRTTAAGGEE
CCOOUUNNTTIIEESS,, WWIISSCCOONNSSIINN
DECEMBER 2001
Report to the Wisconsin Department of Natural Resources
A. Freihoefer, N. Turyk, B. Shaw
Environmental Task Force Program
University of Wisconsin – Stevens Point

Acknowledgements The following groups and individuals made the Plover River Water Quality Study possible:
• Wisconsin Department of Natural Resources • Plover River Alliance • Golden Sands RC&D • Marathon and Portage County Land Conservation Departments • Stevens Point Water and Sewer • Bill Cook Chapter Izaak Walton League • Portage County Wildlife Club • University of Wisconsin Environmental Task Force Program
iii
Executive Summary
This project was initiated by members of the community and agency personnel to
assess current water quality conditions in the Plover River. Areas that impact the river
were determined by sub-watershed to better focus agency resources to the areas that can
most likely improve river water quality though improved land use practices. Results of
this project will also be used by landowners within the watershed to develop protection
strategies and understand how they can adjust their land use management practices to
ensure the protection of the river for future generations.
The Plover River travels southwesterly for 42 miles through Langlade, Marathon,
and Portage Counties. Many rural and urban residents enjoy the Plover River and its
watershed though activities that include swimming, fishing, canoeing, cross country
skiing, hiking, and relaxation through its aesthetic beauty. In addition, the Stevens Point
municipal well field, which provides drinking water for the entire Stevens Point area, is
located in the lower end of the watershed. According to the Plover River Plan, 64% of
the water that comes from the wells originates directly from the Plover River itself;
therefore, it is essential that Portage County work to protect the Plover River. (PCPZD,
2000).
The assessment of the Plover River was accomplished by completing a
longitudinal study of water quality on the Plover River between June 2000 and July 2001.
Although some sporadic water quality data has been collected, comprehensive sampling
from headwaters to mouth has never been conducted. Water quality data is essential for a
beneficial management plan to be implemented thus protecting the river and its watershed
for multiple uses.
Portage and Marathon County Land Conservation Department staff collected
water quality samples from 18 locations along the Plover River. Samples from the 18
sites were collected for summer and winter baseflow (low flow, mostly groundwater fed)
and runoff events (storm events and/or snow melt). Siphon samplers were used to collect
the storm flow events. These samplers collect the water sample once the river reaches a
certain height during a given runoff event.
iv

Following the collection of water samples, the UWSP Environmental Task Force
laboratory (ETF) analyzed the samples for a variety of constituents. All samples were
analyzed for nitrate plus nitrite nitrogen, ammonium nitrogen, total Kjeldahl nitrogen,
total phosphorus, reactive phosphorus, and chloride. In addition, the event flow samples
were analyzed for total suspended solids (TSS) and volatile suspended solids (VSS) and
fecal coliform were analyzed during four events. Sites with elevated nitrogen were also
analyzed once for Triazine and seven of the sites with the highest Triazine concentrations
were tested for additional pesticides. The data from these constituents were used in
concert with land use information to determine areas of groundwater and runoff related
non-point pollution; this information can than be used to identify the best management
strategies for these areas.
Overall, the Plover River has good water quality when compared with other rivers
located in Central Wisconsin. This is likely due to the fact that the river is well buffered
though most of the system, most natural wetlands still exist, and development is not very
intense (except for the lower end). Wetlands act as nutrient sinks and reduce the impacts
of heavy rain events. The river system had four distinct segments based on discharge,
water quality, and associated land use. The headwaters are predominantly wooded, with
minimal development impacts, the next segment downstream has lower impact
agriculture (i.e. hay, grazing), the third segment has increasing row crops, and the fourth
segment is predominantly urban. Re-release of nutrients appears to occur in the upper
portion of the watershed during events. Fecal coliform counts were in excess of the
swimming beach standards in many of the samples taken during rain events. Nitrate
concentrations gradually increase from headwaters downstream, and inputs are
predominantly from groundwater discharging to the river. Several of the tributaries in the
third segment have elevated nitrate as high as 20 mg/L during baseflow conditions.
Triazine was detected in eight of the nine samples tested and pesticides were detected in
all seven samples that were tested.
v

Table of Contents Acknowledgements............................................................................................................ iii Executive Summary ........................................................................................................... iv Introduction:........................................................................................................................ 1
Background Information................................................................................................. 1 Study Area and Land Uses.............................................................................................. 2 Groundwater Flow .......................................................................................................... 3 Geology........................................................................................................................... 8 Morphology..................................................................................................................... 8
Objectives ........................................................................................................................... 9 Methods............................................................................................................................... 9 Water Quality Interpretation ............................................................................................. 13
Nutrients........................................................................................................................ 13 Fecal Coliform .............................................................................................................. 16 Chloride......................................................................................................................... 16 Atrazine......................................................................................................................... 17 Total Suspended Solids................................................................................................. 18 Volatile Suspended Solids ............................................................................................ 18
Results............................................................................................................................... 19
Land use / Sub-basins Description................................................................................ 19 Segment A................................................................................................................. 21 Segment B................................................................................................................. 24 Segment C................................................................................................................. 26 Segment D................................................................................................................. 27
Longitudinal Water Quality Analysis ........................................................................... 29 Segment A................................................................................................................. 31 Segment B................................................................................................................. 34 Segment C................................................................................................................. 37 Segment D................................................................................................................. 40
Fecal Coliform .............................................................................................................. 42 Pesticides....................................................................................................................... 44 Temperature Monitoring Data ...................................................................................... 47
Conclusions....................................................................................................................... 63 Literature Cited ................................................................................................................. 65 APPENDICES .................................................................................................................. 68
vi
List of Figures: Figure 1: Location of the Plover River Watershed within Wisconsin. ............................... 4 Figure 2: Roadways within the Plover River Watershed. Sample site sub-watershed
boundaries are indicated. ............................................................................................ 5 Figure 3: Sample site locations and associated site sub-watersheds within Plover River
Watershed. .................................................................................................................. 6 Figure 4: Land uses of Plover River Watershed (From WISCLAND Land Cover Data
collected between 1991 and 1993.)............................................................................. 7 Figure 5: Diagram showing the runoff event siphon sampler assembly........................... 11 Figure 6: Diagram of the transformation of various forms of nitrogen within the
environment. (University of Minnesota 2000)......................................................... 15 Figure 7: Map of Plover River watershed sample site locations and related sub-
watersheds................................................................................................................. 20 Figure 8: Watershed segments based on discharge, water quality, and landuse............... 30 Figure 9: Fecal Coliform Bacteria Concentrations for four sampling dates. .................... 44 Figure 10: Graph of general land uses in each sample site sub-watershed....................... 50 Figure 11: Average Baseflow Nitrate Concentrations for Sampling Sites ....................... 51 Figure 12: Average Event flow Nitrate Concentrations for Sampling Sites..................... 51 Figure 13: Average Baseflow TKN Concentrations for Sampling Sites .......................... 52 Figure 14: Average Event flow TKN Concentrations for Sampling Sites ....................... 52 Figure 15: Average Baseflow Ammonia Concentrations for Sampling Sites .................. 53 Figure 16: Average Event flow Ammonia Concentrations for Sampling Sites................ 53 Figure 17: Average Baseflow TP Concentrations for Sampling Sites.............................. 54 Figure 18: Average Event flow TP Concentrations for Sampling Sites ........................... 54 Figure 19: Average Baseflow Reactive P Concentrations for Sampling Sites ................. 55
vii
Figure 20: Average Event flow Reactive P Concentrations for Sampling Sites............... 55 Figure 21: Average Baseflow Chloride Concentrations for Sampling Sites .................... 56 Figure 22: Average Event flow Chloride Concentrations for Sampling Sites.................. 56 Figure 23: Total and volatile suspended solid sample concentrations and associated trend
lines. Samples were collected during events from each study site. ......................... 57 Figure 24: Total and volatile suspended solid concentrations (mg/L) and resulting
Pearson correlation coefficient. ................................................................................ 57 Figure 25: River Discharges for Baseflow Sampling Dates ............................................. 58 Figure 26: Precipitation Data for 2000 ............................................................................. 58 Figure 27: Average Nitrate Yield (lbs/year/acre) during Baseflow for each Sampling Site
................................................................................................................................... 59 Figure 28: Average Total Phosphorus Yield (lbs/year/acre) during Baseflow for each
Sampling Site ............................................................................................................ 59 Figure 29: Average Reactive Phosphorus Yield (lbs/year/acre) during Baseflow for each
Sampling Site ............................................................................................................ 60 Figure 30: Average Nitrate Load (lbs/day) during Baseflow for each Sampling Site...... 60 Figure 31: Average Total Phosphorus Load (lbs/day) during Baseflow for each Sampling
Site ............................................................................................................................ 61 Figure 32: Average Reactive Phosphorus Load (lbs/day) during Baseflow for each
Sampling Site ............................................................................................................ 61
viii
List of Tables: Table 1: Analytical Methods and Corresponding Detection Limits for water quality
analyses run in the UWSP Environmental Task Force Lab...................................... 13 Table 2: Land uses for each sample site sub-watershed. Sites on the Plover River are
bold. .......................................................................................................................... 22 Table 3: Cumulative land uses contributing to each sample site. Sites located in the
Plover River are bold. ............................................................................................... 23 Table 4: Average nitrate load and yield for sites 1,2, 3, and 4 during baseflow conditions.
................................................................................................................................... 32 Table 5: Average reactive and total P load and yield for sites 1, 2, 3, and 4 during
baseflow conditions. ................................................................................................. 33 Table 6: Average nitrate load and yield for sites 4, 5, 6, 7, 8, and 9 during baseflow
conditions.................................................................................................................. 35 Table 7: Average reactive and total P load and yield for sites 5, 6, 7, 8, and 9 during
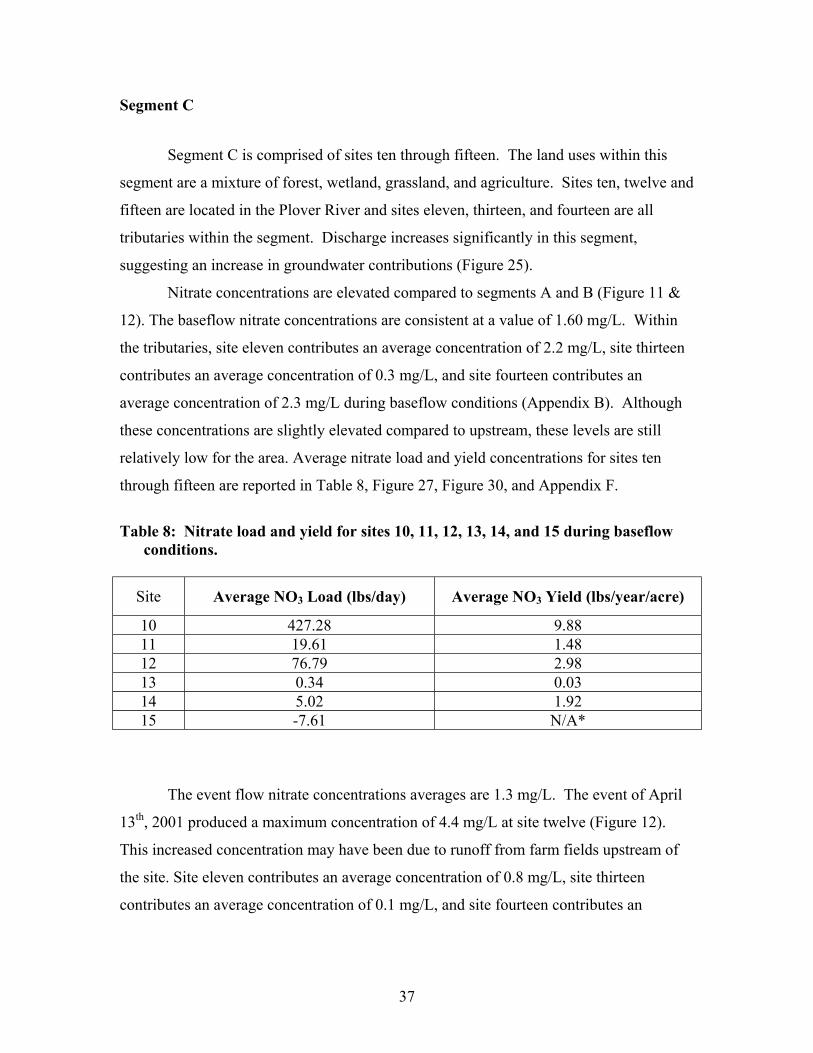
baseflow conditions. ................................................................................................. 36 Table 8: Nitrate load and yield for sites 10, 11, 12, 13, 14, and 15 during baseflow
conditions.................................................................................................................. 37 Table 9: Average reactive and total P load and yield for sites 10, 11, 12, 13, 14, and 15
during baseflow conditions. ...................................................................................... 39 Table 10: Nitrate load and yield for sites 16, 17, and 18 during baseflow conditions. ... 41 Table 11: Reactive and total P load and yield for sites 16, 17, and 18 during baseflow
conditions.................................................................................................................. 42 Table 12: Triazine Data for 9 samples sites in Plover River Watershed .......................... 45 Table 13: Pesticides in the Plover River and tributaries sampled June 2001.
Concentrations are reported in parts per billion (ug/l).............................................. 46 Table 14: Plover River Temperature Monitoring from June 26 – August 31, 2000......... 48
ix
Introduction: Background Information
Water quality in the Plover River has never been studied for its entire length.
Water quality data is essential for a beneficial management plan to be implemented;
determinations can be made such as which stretches need remediation and which should
be focused on protection and ultimately, how best to protect the watershed for its multiple
uses. This data can be used in the future to re-assess management and determine whether
the water quality is changing over time.
Uses of the Plover River and its immediate corridor include aesthetics, cross-
country skiing, hiking, birding, swimming, fishing, and canoeing. In addition, wells for
the Stevens Point municipality, which provide drinking water for the entire Stevens Point
area, are located at the lower end of the watershed, near site 18 (Figure 3). According to
the Golden Sands Phase II proposal, 64% of the water going to the wells comes from the
Plover River. (PCPZD 2000)
The Plover River was studied on a watershed scale from June 2000 to August
2001. According to the BASINS website, a watershed can be defined as an area of land
in which all rain and snow runoff, as well as tributaries, drain into a common body of
water such as a river or lake (Murphy 2000). A watershed’s boundaries are delineated by
topography; the highest points on the landscape separate one watershed from another.
Many rivers in Wisconsin also have groundwater sheds that are defined by boundaries
found below ground and relating to the slope of the water table. Sometimes the
topographic and groundwater sheds are approximately the same land areas, on other
occasions they are very different.
In this study, 18 sites were selected for sample analysis: 13 sites on the main
stream, 2 tributaries, and 3 ditches (Figure 3). During the study, two types of samples
were taken, runoff events and baseflow samples. Stream flow was measured during the
collection of baseflow samples.
Baseflow sampling was conducted when runoff was nonexistent, therefore acting
as an indicator of average groundwater quality, since groundwater is the only source of
recharge during baseflow time periods. Typically this condition is present in parts of the
1
summer, late fall, and winter. During the fall season biological processes are slower,
giving a clearer picture of baseflow water quality due to minimal nutrient uptake by
aquatic plants.
Runoff event sampling was instituted during runoff events via siphon sampler or
grab samples. Event flow allows one to evaluate the constituents that enter the river via
surface runoff (nutrients, sediment, pesticides, and bacteria). Many of these constituents
are related to the land use practices within the watershed.
Study Area and Land Uses
The Plover River, which has a 147 square mile watershed within the Wisconsin
River Basin, travels southwesterly for 42 miles from Langlade through Marathon, and
Portage Counties (Figures 1 and 2). The watershed is not terribly complex; it has a very
long and narrow shape, and some small tributaries that feed the Plover, including several
agricultural ditches. Big Bass and Pike Lakes are located within the watershed and there
are three impoundments found along the length of the river: Bentley Pond, Jordan Pond,
and McDill Pond. The average elevation drop along the river is approximately five feet
per mile (Lyden 2001). The Plover River’s headwaters are located west of the village of
Aniwa.
The Plover River watershed can be characterized as being dominated by forests
and wetlands in the northern reaches; however, wetlands are located throughout the
watershed. Agriculture also is prevalent within this watershed, more so in the southern
portion of the watershed. (Figure 4) With the exception of the rural housing and the small
urban areas of the village of Hatley and the unincorporated village of Bevent, the only
major urban area in the watershed is the city of Stevens Point, which is located in the
southern most part of the watershed (Figures 2 and 3). For most of its length, the river
has a buffered riparian zone, a vegetated area adjacent to a river.
A major use of the Plover River watershed is recreation. Fishing is dominant
north of the unincorporated village of Bevent, where the Plover is a cold water trout
stream. The majority of the river can be canoed and kayaked. Portage County has a
system of jogging and cross-country ski trails through the watershed. The large forested
areas also allow for hunting along the Plover’s corridor. During the summer months,
2
both Iverson and Jordan parks serve as public swimming areas on the Plover River.
Some of the Stevens Point municipal wells are located at the lower end of the watershed
near site 18 (Figure 3).
Groundwater Flow The groundwater in the Plover River Watershed flows from the outer most boundaries of
the watershed towards the river. Basically the groundwater flow mimics the surface
topography. The eastern border of the watershed is hydrogeologically separated from
surrounding watersheds by a groundwater divide. The groundwater east of the
groundwater divide boundary flows towards the Fox-Wolf Basin and west of the
boundary the groundwater flows towards the Plover River and eventually the Wisconsin
River Basin (Lippelt 1981). Due to the limits of the study, the specific segments of the
Plover River that are receiving groundwater through recharge, or losing through down
welling are not known.
3

Figure 1: Location of the Plover River Watershed within Wisconsin.
4
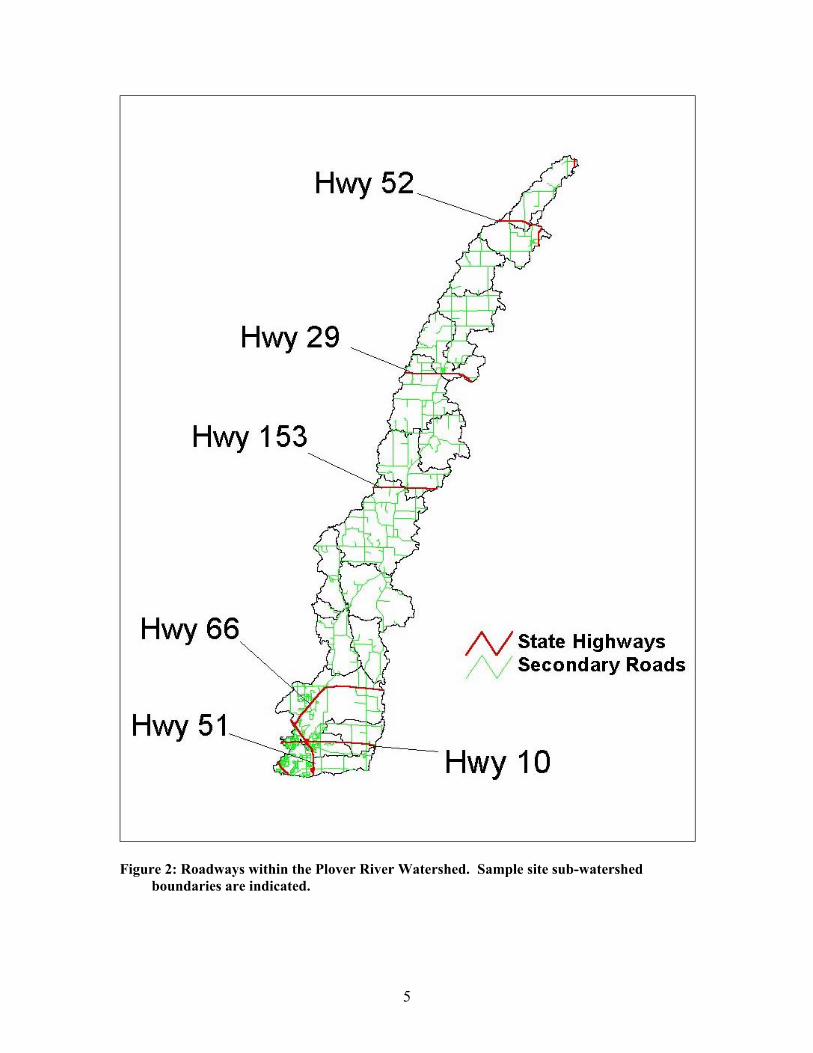
Figure 2: Roadways within the Plover River Watershed. Sample site sub-watershed
boundaries are indicated.
5
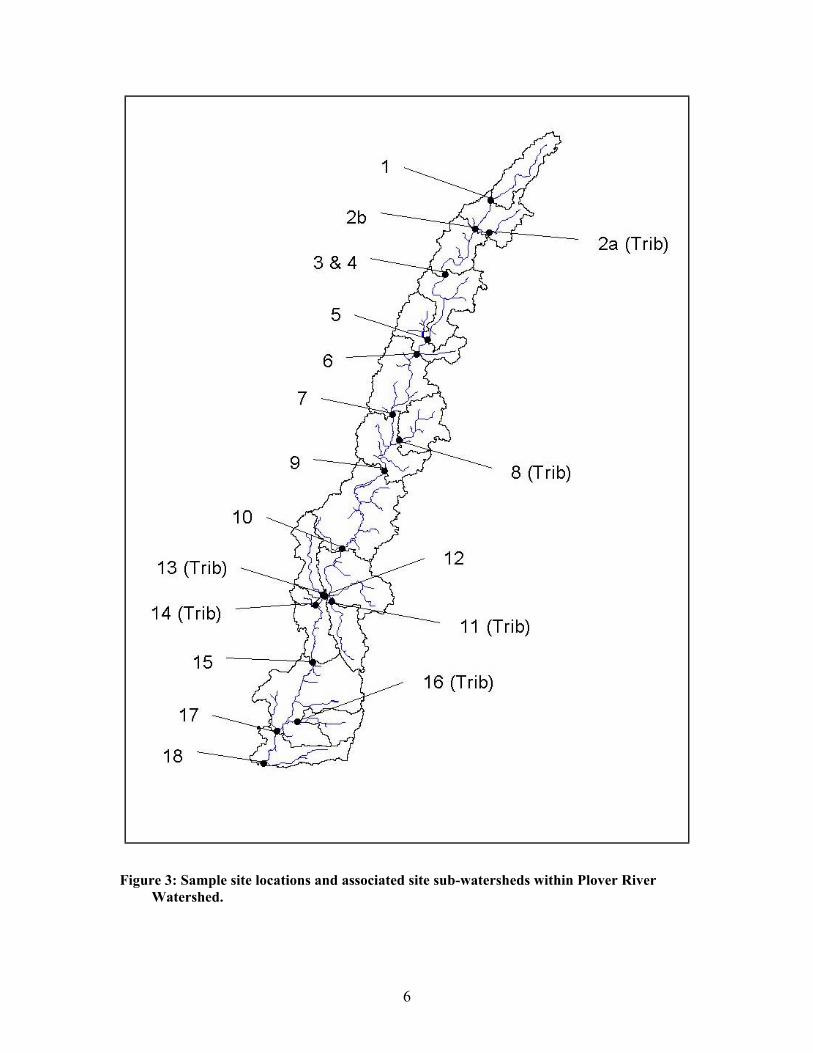
Figure 3: Sample site locations and associated site sub-watersheds within Plover River
Watershed.
6
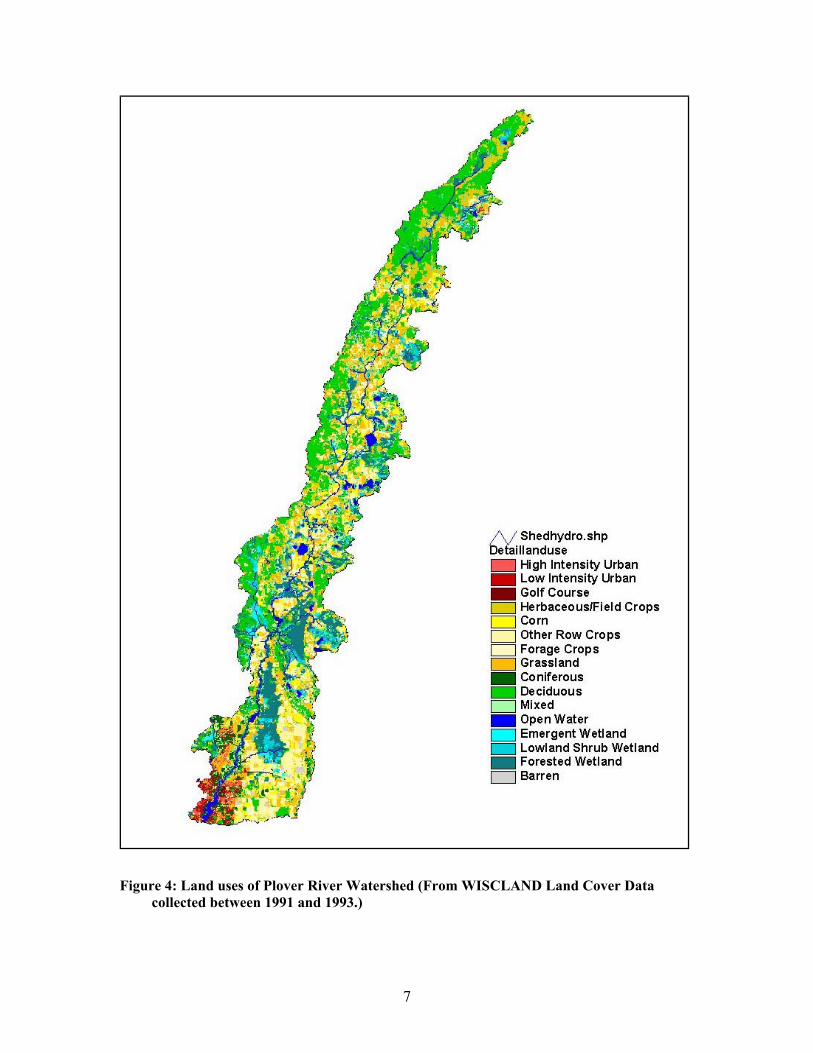
Figure 4: Land uses of Plover River Watershed (From WISCLAND Land Cover Data
collected between 1991 and 1993.)
7
Geology
The Pleistocene geology is fairly similar through much of the watershed.
Throughout the entire river basin lies non-glacial stream sediment (silt, sand, and gravelly
sand) deposited on the floodplains from the modern river. The non-glacial sediment is
found immediately next to the Plover River. Outside of the non-glacial stream sediment
is melt water stream sediment of the Horicon Formation. This sediment was deposited on
solid ground by streams created from the Green Bay Lobe. The sediment consists of
dolomitic sand, gravelly sand, and sandy gravel (Clayton 1986 & Attig 1989).
The bedrock geology of the watershed differs in the Northern portion compared to
the Southern portion. Wolf River granite dominates much of the Marathon County
portion of the watershed, which consists of coarse grained, porphyritic hornblende
(LaBerge 1983). The southern tip of Marathon County and all of Portage County
contains of Red River Adamellite that is comprised of medium to coarse-grained
porphyritic Adamellite (Greenberg 1986).
Morphology
The soils of the northern portion of the watershed are predominantly dominated
by soils underlain by loamy glacial till. Kennan – Hatley soil association is the major soil
type from this classification in the watershed. It is identified as being a deep, cobbly,
bouldery, silty, and loamy soil on moraines and drumlins. The soils of the northern
portion of the watershed are predominantly sandy and well drained. One soil association,
although less prevailing is the Kennan – Hatley soil association, which is underlain by
siltly, loamy, or sandy alluvial, lacustrine, or outwash deposits. The other soil association
in the watershed is the Chetek-Rosholt-Oesterle association, which is classified as being
deep, nearly level to steep, well drained with silt and loamy soils on outwash plains and
stream terraces (Fiala 1989).
The soils of the southern portion of the watershed are predominately dominated
through the formation of outwash sand and gravel. An example of one type of these soils
is the Plainfield-Friendship association that is excessively to moderately drained, with
nearly level to sloping soils that form in sandy deposits. Also within the watershed exist
8
soils that are formed through the deposition of alluvium or organic deposits. The
Markey-Seelyville-Cathro association is major type of organic deposit in the watershed.
It is classified as very poorly drained with nearly level soils forming in organic deposits
over sandy and loamy deposits. (Otter 1978)
Objectives
• Collect water quality data and identify areas within the watershed that may
contribute to reduced water quality.
• Establish a foundation of water quality data that is representative of current
conditions.
• Summarize data in a format that will assist citizens and local agencies in
understanding the functions within the Plover River Watershed and help lead
to river protection strategies.
Methods
Eighteen sample sights were selected throughout the watershed; most were
located next to roads or bridges. Sampling was conducted during baseflow and runoff
events, and for fecal coliform and pesticides.
When a baseflow sample was taken three bottles were filled with sample from
each site using a 60 mL plastic syringe. One 60 mL polyethylene bottle, which was
preserved with 1 molar H2SO4, was filled with filtered sample. Samples were filtered
using an in-line plastic filter cassette screwed onto the plastic syringe. A .45 µm filter
paper was used as the fine filter paper and a 934 / AH glass filter is used for the coarse
filter paper. Both filters are 47 mm in diameter and were layered with the sample moving
through the 934 / AH first. The filter papers (coarse and fine) were placed with the grid
pattern sides facing one another. The second bottle was a 60 mL polyethylene bottle,
which was preserved with 1 molar H2SO4, and filled with unfiltered sample. The third
bottle was a 500 mL polyethylene bottle that was left unpreserved and unfiltered.
9
River discharge was measured at each site during the time baseflow samples were
collected using a Marsh McBirney Model 2000 portable current meter along with a 100-
foot tape and two chaining pins. Measurements were taken at a constant interval along
the rivers width. The number of velocity measurements per stream transect varied with
stream width. For example, a 12-foot section of the river had velocity measurements
taken every foot, and a 63-foot section of the river had measurements taken every 7 feet.
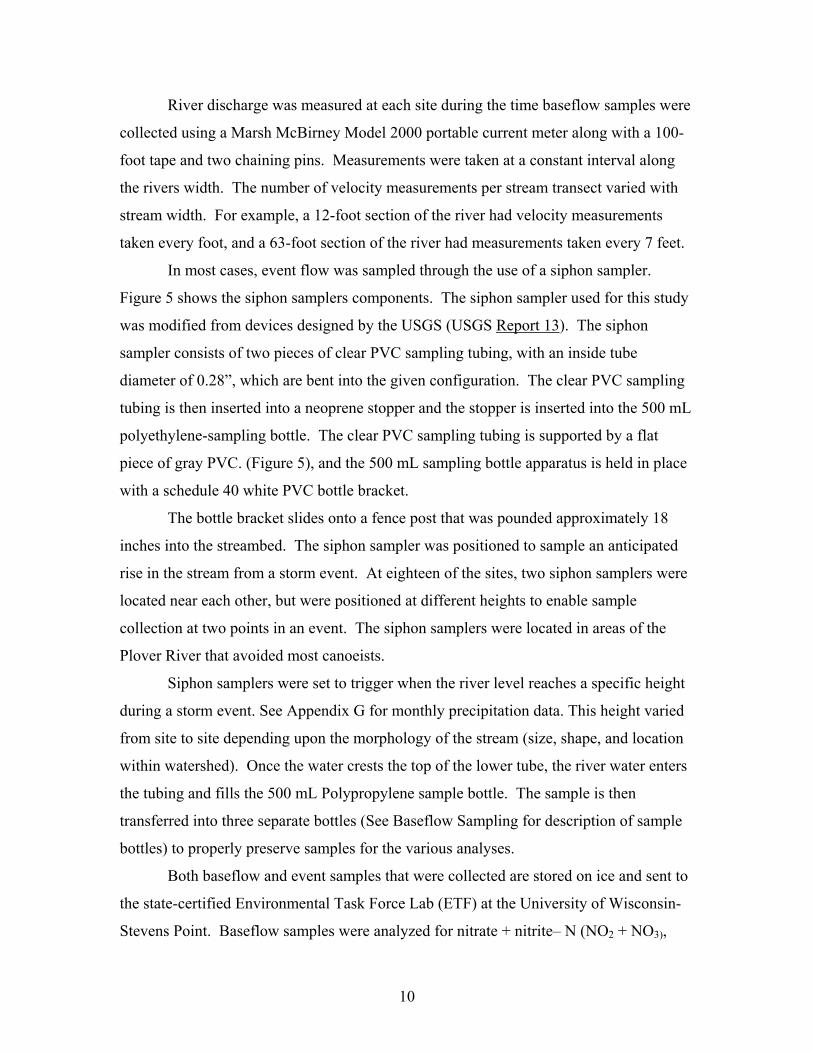
In most cases, event flow was sampled through the use of a siphon sampler.
Figure 5 shows the siphon samplers components. The siphon sampler used for this study
was modified from devices designed by the USGS (USGS Report 13). The siphon
sampler consists of two pieces of clear PVC sampling tubing, with an inside tube
diameter of 0.28”, which are bent into the given configuration. The clear PVC sampling
tubing is then inserted into a neoprene stopper and the stopper is inserted into the 500 mL
polyethylene-sampling bottle. The clear PVC sampling tubing is supported by a flat
piece of gray PVC. (Figure 5), and the 500 mL sampling bottle apparatus is held in place
with a schedule 40 white PVC bottle bracket.
The bottle bracket slides onto a fence post that was pounded approximately 18
inches into the streambed. The siphon sampler was positioned to sample an anticipated
rise in the stream from a storm event. At eighteen of the sites, two siphon samplers were
located near each other, but were positioned at different heights to enable sample
collection at two points in an event. The siphon samplers were located in areas of the
Plover River that avoided most canoeists.
Siphon samplers were set to trigger when the river level reaches a specific height
during a storm event. See Appendix G for monthly precipitation data. This height varied
from site to site depending upon the morphology of the stream (size, shape, and location
within watershed). Once the water crests the top of the lower tube, the river water enters
the tubing and fills the 500 mL Polypropylene sample bottle. The sample is then
transferred into three separate bottles (See Baseflow Sampling for description of sample
bottles) to properly preserve samples for the various analyses.
Both baseflow and event samples that were collected are stored on ice and sent to
the state-certified Environmental Task Force Lab (ETF) at the University of Wisconsin-
Stevens Point. Baseflow samples were analyzed for nitrate + nitrite– N (NO2 + NO3),
10
Gray PVC backing
Clear PVC tubing
Neoprene Stopper attached to 500mL polypropylene sample bottle
500 mL wide mouth bottle Polypropylene Type
Figure 5: Diagram showing the runoff event siphon sampler assembly.
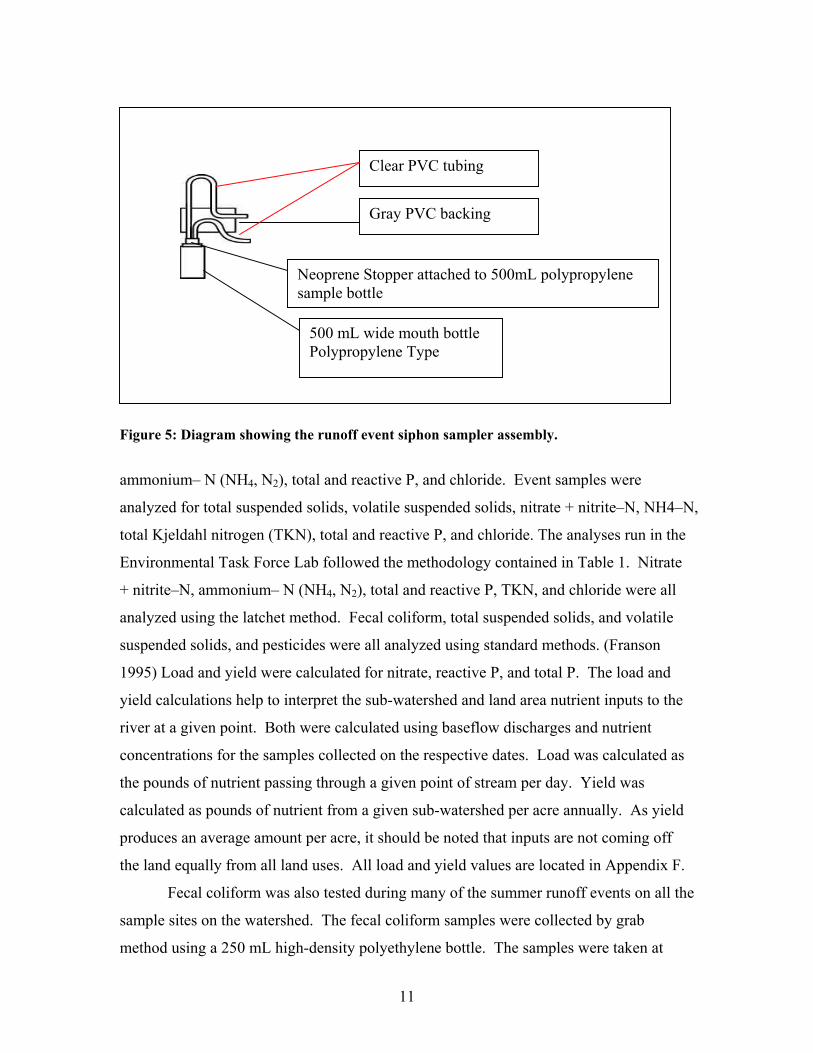
ammonium– N (NH4, N2), total and reactive P, and chloride. Event samples were
analyzed for total suspended solids, volatile suspended solids, nitrate + nitrite–N, NH4–N,
total Kjeldahl nitrogen (TKN), total and reactive P, and chloride. The analyses run in the
Environmental Task Force Lab followed the methodology contained in Table 1. Nitrate
+ nitrite–N, ammonium– N (NH4, N2), total and reactive P, TKN, and chloride were all
analyzed using the latchet method. Fecal coliform, total suspended solids, and volatile
suspended solids, and pesticides were all analyzed using standard methods. (Franson
1995) Load and yield were calculated for nitrate, reactive P, and total P. The load and
yield calculations help to interpret the sub-watershed and land area nutrient inputs to the
river at a given point. Both were calculated using baseflow discharges and nutrient
concentrations for the samples collected on the respective dates. Load was calculated as
the pounds of nutrient passing through a given point of stream per day. Yield was
calculated as pounds of nutrient from a given sub-watershed per acre annually. As yield
produces an average amount per acre, it should be noted that inputs are not coming off
the land equally from all land uses. All load and yield values are located in Appendix F.
Fecal coliform was also tested during many of the summer runoff events on all the
sample sites on the watershed. The fecal coliform samples were collected by grab
method using a 250 mL high-density polyethylene bottle. The samples were taken at
11
least one-foot below the water’s surface to ensure that the sun’s ultraviolet rays had not
altered the number of viable bacteria. To take the sample, the mouth of the bottle was
placed at a perpendicular angle to the surface of the water. Once the bottle was
submerged at a depth of at least one foot, the bottle was rotated so the mouth was facing
upstream, parallel to the current of the river and the sample was collected. The sample
bottle was then capped, stored on ice, and returned to the lab for analysis.
Funding permitted the analysis of Triazine from nine sample sites within the
watershed. The sites were selected from sample sites that had elevated nitrate and
chloride concentrations, this includes sites nine through eighteen. Each sample was taken
in a 50 mL polypropylene bottle.
Nitrogen / Phosphorus (N/P) pesticides were sampled at seven sites within the
watershed as permitted by grant funds. Elevated concentrations of triazine were used in
sample site selection for N/P pesticides analysis. A 500 mL brown glass bottle was used
to take a grab sample from the river. Samples were collected at the same time as the
triazine samples, June 13th, 2001.
12
Table 1: Analytical Methods and Corresponding Detection Limits for water quality
analyses run in the UWSP Environmental Task Force Lab.
Analyses Method Method Detection Limit
Chloride Automated Ferricyanide 4500 C1 E
0.2 mg/L
Fecal Coliform Membrane Filter 922 D Not applicable
Nitrogen, Ammonia Automated Salicylate 4500-NH3 G
0.01 mg/L
Nitrogen, Nitrate +
Nitrite Automated Cadmium Reduction
4500-NO3 F 0.021 mg/L
Nitrogen, Total Kjeldahl Block Digester; Auto Salicylate 4500-NH3 G
0.08 mg/L
Phosphorus, Reactive Automated Colorimetric 4500 P F
0.003 mg/L
Phosphorus, Total Block Digestor, Automated 4500 P F
0.012 mg/L
Total Suspended Solids Gravimetric 2540 D 2.0 mg/L
Volatile Suspended Solids Gravimetric 2540 E 2.0 mg/L
Triazine Enzyme Linked Immunosorbant assay
0.05 mg/L
N/P Pesticides EPA Method 8270 Varies
Water Quality Interpretation Nutrients
A primary main nutrient within the Plover River watershed is nitrogen. In an
aquatic ecosystem, it is imperative to have nitrogen in its various forms for plant and
animal growth and survival. However, having an excess of nitrogen can have devastating
effects on the ecosystem, affecting the plant life, invertebrates, fish and humans. As on
land, nitrogen can influence plant growth as elevated concentrations can lead to abundant
plant growth. This can affect the types of plants and ecological communities that are
present as available oxygen is decreased during the decomposition of plant material.
13

Excess nutrients can be transported to rivers via groundwater, overland flow, and
sedimentation.
Nitrogen can be found in several forms: NO2 + NO3, NH4, N2 and TKN. The
different forms of nitrogen are formed both through biological and physical mechanisms.
The nitrogen cycle illustrates how the different forms of nitrogen are derived and
transformed (Figure 6). The forms of nitrogen analyzed in this study included nitrate +
nitrite (NO2 + NO3), ammonia (NH4), and total Kjeldahl nitrogen (TKN).
Nitrate is a highly soluble form of nitrogen that is formed through nitrogen
fixation and deposition. Deposition of nitrate in surface water is derived from sources
such as livestock excrement, nitrogenous fertilizers, irrigation return flows, lawn
fertilizers, septic systems, and wildlife. These multiple sources are transported across the
land and into the river via overland flow, unsaturated flow, and via groundwater transport.
(NCSWQG 2002)
The nitrate that is applied to the land through fertilizers and manure spreading can
follow several paths. It can either be taken up by plants, degraded by microorganisms in
the substrate, removed by leaching of infiltrating water and thus transported into the
groundwater, or the nitrate goes through denitrification, a process by which the nitrate is
reduced to the gaseous form of nitrogen (Figure 6). Nitrate is extremely soluble, so if
allowed to infiltrate the groundwater it will persist unless it is reduced to another form of
nitrogen or moves to a discharge region such as a lake or river. (NCSWQG 2002)
Ammonium is another form of nitrogen pertinent to water quality. Ammonium
serves as a secondary source of nitrogen to plant life (NCSWQG 2002). The major
sources of NH4 include sources such as livestock waste, fertilizers, and spillage during
transportation of the NH4 fertilizer. Septic systems and improper disposal of household
cleaning products containing ammonia are also sources of ammonia in the rivers. A
natural source of NH4 release in the environment is wetlands. Wetlands initially act as
sink for nutrients like nitrogen; however, given the right conditions ammonia can be
released. Ammonia is transported into rivers via overland flow after a precipitation event.
It is also transported to surface water through groundwater recharge. (NCSWQG 2002)
14
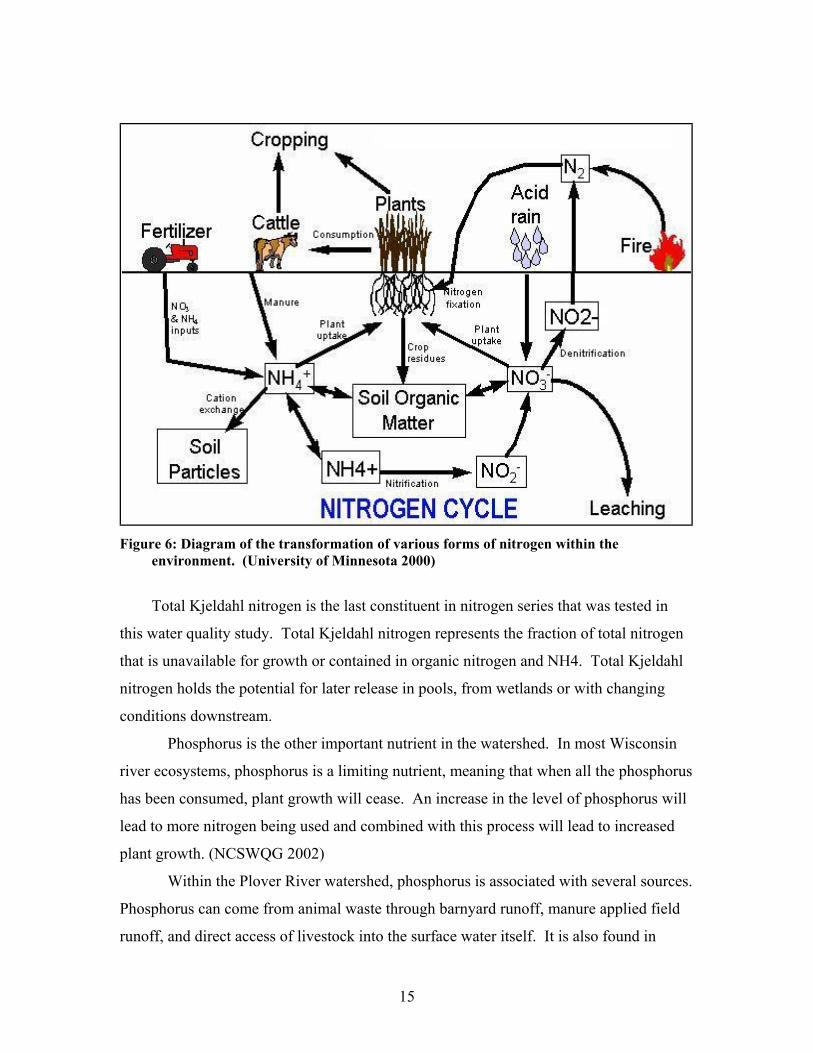
Figure 6: Diagram of the transformation of various forms of nitrogen within the
environment. (University of Minnesota 2000)
Total Kjeldahl nitrogen is the last constituent in nitrogen series that was tested in
this water quality study. Total Kjeldahl nitrogen represents the fraction of total nitrogen
that is unavailable for growth or contained in organic nitrogen and NH4. Total Kjeldahl
nitrogen holds the potential for later release in pools, from wetlands or with changing
conditions downstream.
Phosphorus is the other important nutrient in the watershed. In most Wisconsin
river ecosystems, phosphorus is a limiting nutrient, meaning that when all the phosphorus
has been consumed, plant growth will cease. An increase in the level of phosphorus will
lead to more nitrogen being used and combined with this process will lead to increased
plant growth. (NCSWQG 2002)
Within the Plover River watershed, phosphorus is associated with several sources.
Phosphorus can come from animal waste through barnyard runoff, manure applied field
runoff, and direct access of livestock into the surface water itself. It is also found in
15

agricultural and lawn/garden fertilizers and over time, phosphorus associated with septic
systems can move from the drainfield to groundwater. Phosphorus frequently adsorbs to
soil particles that are later eroded away, but once the adsorption sites on soil are
exhausted, phosphorus can leach into the groundwater, later discharging to a surface
water body. Like nitrogen, phosphorus can also be re-released from wetland sediments.
Dying vegetation releases phosphorus from its tissue, therefore, in the fall trees along a
river can contribute some phosphorus through leaf drop. Phosphorus is necessary for a
healthy aquatic ecosystem, yet in excess can lead to multiple surface water related
problems such as: increase aquatic plant growth, cause taste and odor problems in waters
used for human consumption, and oxygen consumption from excessive plant
decomposition can lead to fish kills. (Shaw 1995)
Fecal Coliform
Fecal coliform bacteria are an important constituent studied in the determination
of water quality. Fecal coliform are bacteria derived from the intestinal tract of warm-
blooded animals. Sources of the bacteria are wildlife, feedlots, manure applications to
fields, wastewater treatment plant discharges, and failing septic systems (Christensen
1996). Fecal coliform multiply in warm and moist conditions, and in a river with varying
temperatures, the number of fecal coliform in the river is not easily measured. Fecal
Coliform can multiply more quickly in warm water with little sunlight, as ultraviolet rays
can kill fecal coliform (Hamel 2001).
Fecal Coliform is responsible for the closure of many swimming beaches within
Wisconsin (Lauhn-Jensen 1995). Swimming in water with high levels of fecal coliform
can lead to an increased chance for illness because pathogens may enter the mouth, ears,
and cuts in the skin (Murphy 2000). Therefore, keeping the levels of fecal coliform
below the 200 MFFCC (membrane filter Fecal Coliform colonies)\ 100 mL of water
sample health standard for beaches is a desirable goal.
Chloride
Chloride is a common ion used as an indicator of other contaminants within a
watershed and can be used as a tracer. Chloride can originate from numerous sources
16
such as animal and human waste, potassium chloride fertilizers used in agriculture and
lawns. Chloride can also be derived from the dissolution of halite (road salt) that is
applied to roads in the winter months (Boutt 1999). As microorganisms do not degrade
chloride, it’s more long-lived then nitrate. Numerous studies show that chloride
concentrations tend to be higher during baseflow, when groundwater is the dominant
contributor to a river and the opposite holds true when runoff is high and solute
concentrations are diluted (Barker 1986).
Atrazine
Atrazine belongs to the chemical class Triazine. Atrazine, a triazine herbicide, is
one of the most frequently used selective pesticides in the United States. Its primary
function is to control broadleaf and annual grasses (NCSWQG 2002). Atrazine is taken
up through plant roots and foliage. Although this process takes the atrazine out of the
shallow subsurface, it inhibits the growth of the plants by limiting photosynthesis
(Oregon State University 1996). Atrazine was most widely used between 1987 and 1989
throughout the Midwest, including Wisconsin, however it is still quite widely used today
(EPA Consumer Fact Sheet – Atrazine 2001). If atrazine is used, following current best
management practices can reduce its effects on the aquatic environment.
Atrazine is classified as being very persistent in the soil substrate, although soil
microorganisms can degrade atrazine at shallow depths (Oregon State University 1996).
In areas of low to medium clay content, similar to the subsurface conditions of the Plover
Watershed, atrazine is very mobile through the soil horizons, therefore threatening
groundwater. Wisconsin has a 3 ug/L drinking water standard for atrazine, but no
standards for surface water exist.
17
Total Suspended Solids
TSS (total suspended solids) is the sediment particles that are floating in a water
column. TSS can be an indicator of runoff from sources such as agricultural fields,
construction sites, and forested areas. High concentrations of TSS can transport other
constituents, such as pesticides, nutrients, and bacteria that adhere to soil colloids and
travel into the river through overland flow during a storm event. (EPA – Turbidity and
Solids 2000). Excess TSS can also turn waters murky; therefore, limiting the amount of
sunlight able to reach the rivers. The decrease in sunlight inhibits plant growth in the
rivers. Another problem associated with high TSS is an increase in water temperature.
When the river is dark, murky color it will absorb light, therefore increasing the water
temperature and inhibiting invertebrate and fish habitat by lower oxygen concentrations
(Murphy 2000).
Volatile Suspended Solids
VSS (volatile suspended solids) is the portion of the TSS that is due to organic
particles. Sources of this suspended organic matter are frequently from wetlands that are
disturbed. Like TSS, the organic colloids can have nutrients and pesticides associated
with them. They are classified as volatile suspended solids because they are “volatilized”
into the air when a TSS sample is heated to 550 degrees Fahrenheit.
18
Results
Land use / Sub-basins Description
There are 17 sub-watersheds within the Plover River Watershed that are related to
the sampling sites used during this study (Figure 7). A sub-watershed is the land area
that contributes hydrologically to a given area. Sub-watersheds are delineated the same
way the entire watershed is, with the use of topography (surface elevation). With the
exception of sites 3 and 4, which have the same sub-watershed, each of the sample sites
has its own sub-watershed. Deriving the sub-watersheds allows for a better
understanding of the landscape that is contributing to water quality for each individual
sampling site and will assist the Land Conservation Departments in determining areas
that may need implementation of best management practices to improve water quality
within a given stretch of the river.
The sub-watersheds in this study were delineated using electronic digital elevation
models (DEMs), and Arc View’s spatial analyst along with their CRWR preprocessor.
Overlying the land use maps helped to relate water quality with associated land uses in
each sub-watershed. WISCLAND was the land cover used, which contains land use
imagery collected between August 1991 and May 1993. (Figure 4) WISCLAND
characterizes the landscape by classifying each 30-meter by 30-meter area within the
watershed, assuming one dominant land use for each area. Appendix A contains a
summary of the land uses within each sub-watershed.
The Plover River watershed can be characterized as being dominated by forests
and wetlands in the northern reaches. Agriculture exists throughout the watershed, but
different practices exist. The northern half is predominantly grazing and non-row crops
and row-crops become more dominant in the southern portion of the watershed.
Wetlands are located throughout the entire watershed helping to reduce major
fluctuations in water levels and flooding. With the exception of the small urban areas of
Hatley and Bevent, the only major urban area in the watershed is the Town of Hull and
City of Stevens Point, which is located in the southern most part of the watershed.
19
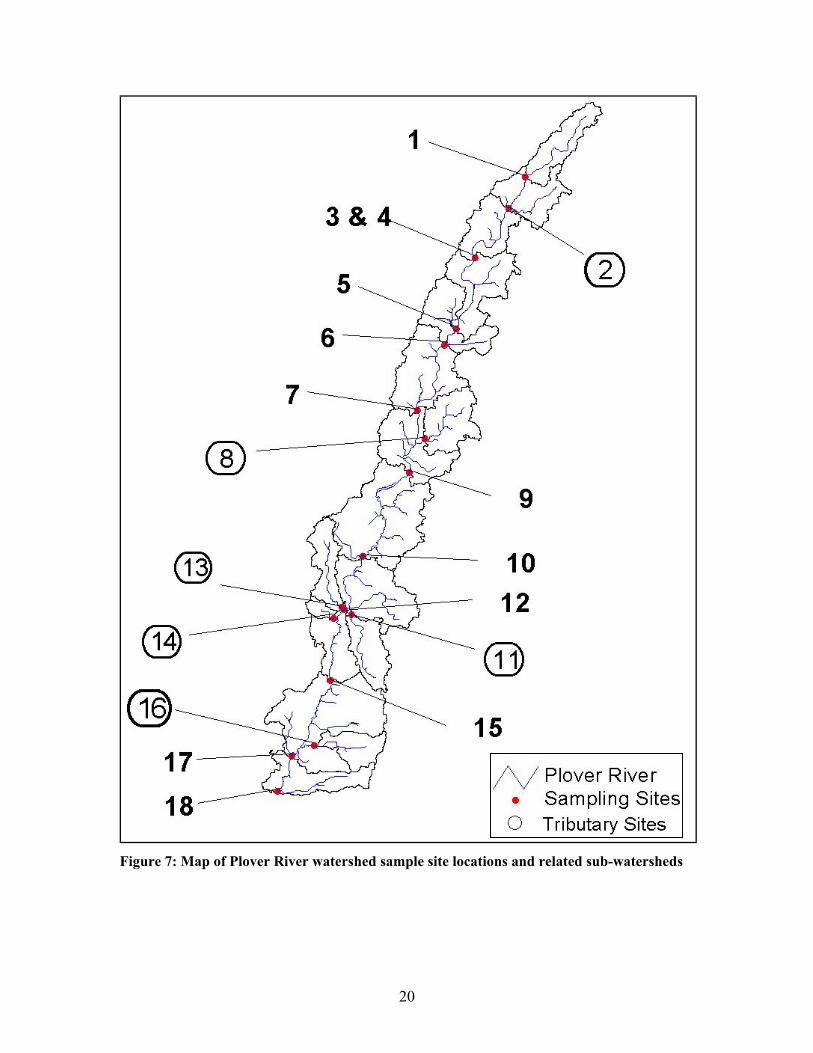
Figure 7: Map of Plover River watershed sample site locations and related sub-watersheds
20
In relation to land use, soil type was characterized for each sub-watershed with the use of
the Marathon and Portage County Soil Survey books. Soil type was used to help predict
the level of precipitation infiltration occurring within each sub-watershed.
Based on discharge, common land uses, and water quality results, the watershed
had four fairly distinct segments. (Figure 8) The following land use descriptions for each
site and the water quality discussion are broken into these four segments. Table 2 shows
the land use composition for each sample site sub-watershed. The sub-watershed size
and land use refers to the area between two sites that drains to the downstream site.
Table 3 shows the cumulative land use affecting each sample site. The cumulative land
use is the total area of the watershed draining to a given sample site. It is important to
analyze overall land use contributing to a site as well as the land uses contributing below
the previous site to assess the water quality data as accurately as possible. A more
detailed analysis of land uses for each sub-watershed is presented in Appendix A.
Segment A
Site 1 (Highway 52) is located in the headwaters of the watershed. This site is part of the
main channel of the Plover River. The stream’s substrate is made up of a fine to medium
size gravel and the banks are comprised of thick vegetation. The dominant soil
association of this sub-watershed is the Chetek-Rosholt-Oesterle association. Five
thousand two hundred and thirty acres of land contribute to the sites water quality. The
land use in this sub-watershed is dominated by forests, which make up 57% of the sub-
watershed.
Site 2 (Sportsman Road) is located in a forest-dominated section of the watershed. This
portion of the stream’s substrate is made up of gravel with small rocks and the stream
banks are well vegetated. The dominant soil association of the sub-watershed is the
Kennan – Hatley association. The sub-watershed for this sample site is 5,687 acres and
has a total contributing area of 10,917 acres of land. The land use of the sub-watershed
and overall contributing land is dominated by forests, which make up
21

Table 2: Land uses for each sample site sub-watershed. Sites on the Plover River are bold.
Site Number Urban Agriculture Grassland Forested
Open Water Wetland Barren Total
1 Acres 0 1,057 470 3,007 20 676 0 5,230 % 0.0 20.0 8.9 57.0 0.4 12.8 0 2 Acres 40 682 822 3,097 37 1,009 0 5,687 % 0.7 11.9 14.4 54.1 0.6 17.6 0
3 and 4 Acres 0 895 313 3,598 3 662 0 5,471 % 0.0 16.2 5.7 65.1 0.1 12.0 0 5 Acres 0 2,784 2,049 2,026 58 877 0 7,794 % 0.0 35.7 26.3 26.0 0.7 11.2 0 6 Acres 20 848 1,217 2,850 25 1,223 0 6,183 % 0.3 13.7 19.7 46.1 0.4 19.8 0 7 Acres 0 2,054 2,548 3,336 108 1,377 0 9,423 % 0.0 22.0 27.0 36.0 1.0 16.0 0 8 Acres 0 1256 1140 1937 252 1510 0 6095 % 0.0 20.6 18.7 31.8 4.1 24.8 0 9 Acres 0 1,774 1,395 3,549 258 914 0 7,890 % 0.0 22.5 17.7 45.0 3.3 11.6 0
10 Acres 0 3,775 4,095 4,988 432 2,494 0 15,784 % 0.0 23.9 25.9 31.6 2.7 15.8 0
11 Acres 0 1,080 904 1,443 63 1,332 0 4,822 % 0.0 22.3 18.7 29.8 1.3 27.5 0
12 Acres 0 1,723 1,331 1,948 232 4,149 20 9,403 % 0.0 18.3 14.1 20.7 2.5 44.1 0.2
13 Acres 0 516 338 2,280 3 1,394 7 4,538 % 0.0 11.4 7.4 50.1 0.1 30.7 0.2
14 Acres 0 146 45 353 3 398 0 945 % 0.0 15.4 4.8 37.1 0.4 41.8 0.0
15 Acres 0 1,152 898 1,141 28 1,869 41 5,129 % 0.0 22.3 17.4 22.1 0.5 36.2 0.8
16 Acres 20 2,109 625 512 10 491 239 4,006 % 0.5 55.9 16.6 13.6 0.3 6.7 6.3
17 Acres 974 4,436 3,021 4,031 117 3,830 297 16,706 % 5.9 26.9 18.3 24.4 0.7 21.4 1.8
18 Acres 1,522 1,733 821 1,309 238 82 111 5,816 % 26.1 29.7 14.1 22.5 4.1 1.4 1.9
22
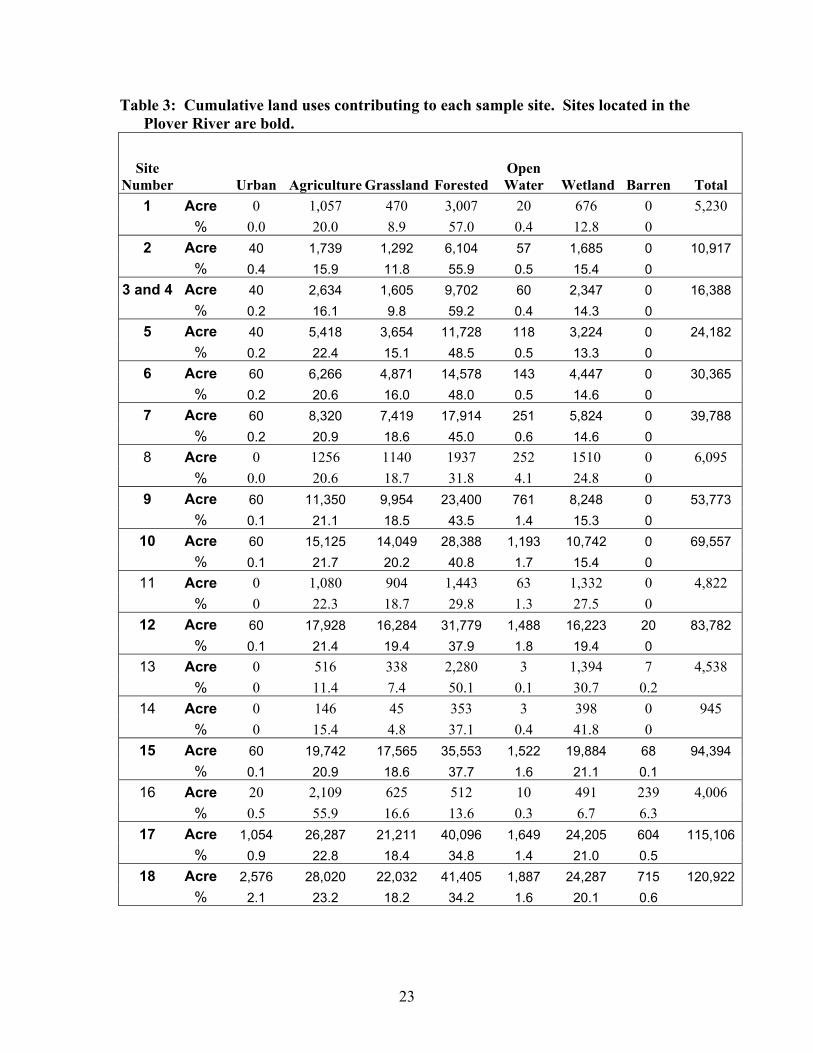
Table 3: Cumulative land uses contributing to each sample site. Sites located in the Plover River are bold.
Site Number Urban Agriculture Grassland Forested
Open Water Wetland Barren Total
1 Acre 0 1,057 470 3,007 20 676 0 5,230 % 0.0 20.0 8.9 57.0 0.4 12.8 0 2 Acre 40 1,739 1,292 6,104 57 1,685 0 10,917 % 0.4 15.9 11.8 55.9 0.5 15.4 0
3 and 4 Acre 40 2,634 1,605 9,702 60 2,347 0 16,388 % 0.2 16.1 9.8 59.2 0.4 14.3 0 5 Acre 40 5,418 3,654 11,728 118 3,224 0 24,182 % 0.2 22.4 15.1 48.5 0.5 13.3 0 6 Acre 60 6,266 4,871 14,578 143 4,447 0 30,365 % 0.2 20.6 16.0 48.0 0.5 14.6 0 7 Acre 60 8,320 7,419 17,914 251 5,824 0 39,788 % 0.2 20.9 18.6 45.0 0.6 14.6 0 8 Acre 0 1256 1140 1937 252 1510 0 6,095 % 0.0 20.6 18.7 31.8 4.1 24.8 0 9 Acre 60 11,350 9,954 23,400 761 8,248 0 53,773 % 0.1 21.1 18.5 43.5 1.4 15.3 0
10 Acre 60 15,125 14,049 28,388 1,193 10,742 0 69,557 % 0.1 21.7 20.2 40.8 1.7 15.4 0
11 Acre 0 1,080 904 1,443 63 1,332 0 4,822 % 0 22.3 18.7 29.8 1.3 27.5 0
12 Acre 60 17,928 16,284 31,779 1,488 16,223 20 83,782 % 0.1 21.4 19.4 37.9 1.8 19.4 0
13 Acre 0 516 338 2,280 3 1,394 7 4,538 % 0 11.4 7.4 50.1 0.1 30.7 0.2
14 Acre 0 146 45 353 3 398 0 945 % 0 15.4 4.8 37.1 0.4 41.8 0
15 Acre 60 19,742 17,565 35,553 1,522 19,884 68 94,394 % 0.1 20.9 18.6 37.7 1.6 21.1 0.1
16 Acre 20 2,109 625 512 10 491 239 4,006 % 0.5 55.9 16.6 13.6 0.3 6.7 6.3
17 Acre 1,054 26,287 21,211 40,096 1,649 24,205 604 115,106 % 0.9 22.8 18.4 34.8 1.4 21.0 0.5
18 Acre 2,576 28,020 22,032 41,405 1,887 24,287 715 120,922 % 2.1 23.2 18.2 34.2 1.6 20.1 0.6
23
approximately 54%. As several crews were involved with sample collection throughout
the study, inadvertently there were two different sample locations being sampled at this
point in the watershed. One location was on the Plover River itself (denoted as 2b in
Appendix A) and the other location was Aniwa Creek (denoted as 2a in Appendix A).
All of the siphon samples and most baseflow samples were taken from Aniwa Creek, a
tributary of the Plover River.
Site 3 (Pine View Road – above) is located in a predominantly forested section of the
watershed. This site is located in the main channel of the Plover River. Sand and gravel
are the primary substrate in this section of stream, with portions of the banks comprised
of vegetation and an area of cattle grazing adjacent and into the river. The dominant soil
association of the sub-watershed is the Kennan - Hatley association. The sampling site is
located to the north of the Pine View Road bridge and is stationed upstream of a watering
ramp for cattle, which penetrates the river. This site has 16,524 acres of land contributing
to the water quality sampled at this site. The land use is dominated by forests, which
make up 65% of the contributing land.
Site 4 (Pine View Road – below) is located in a predominantly forested section of the
watershed with an agriculture influence. This site is part of the main channel of the
Plover River and is located 100 meter south of the Pine View Road Bridge, and
approximately 200 meters downstream from site 3. This site involves the same sub-
watershed as described above for sample site 3, however it includes the cattle access area
just down stream of site 3.
Segment B
Site 5 (Highway Y Bridge) is located in a predominantly forested section of the
watershed. Site 5 is just upstream from the village of Hatley located on the main channel
of the Plover River. This portion of the stream’s substrate is made up of sand with large
rocks and scattered boulders. The stream banks near the site include a narrow vegetative
buffer with agricultural fields beyond the buffer. The dominant soil association in the
sub-watershed is the Kennan – Hatley and Chetek-Rosholt-Oesterle associations. The
24
land use in this sites’ 7,794-acre sub-watershed is 36% agriculture, 26% grassland, and
26% forested. Overall, there are a total of 24,182 acres of land contributing to this sites’
water quality and the dominant land use in this area is 48% forested.
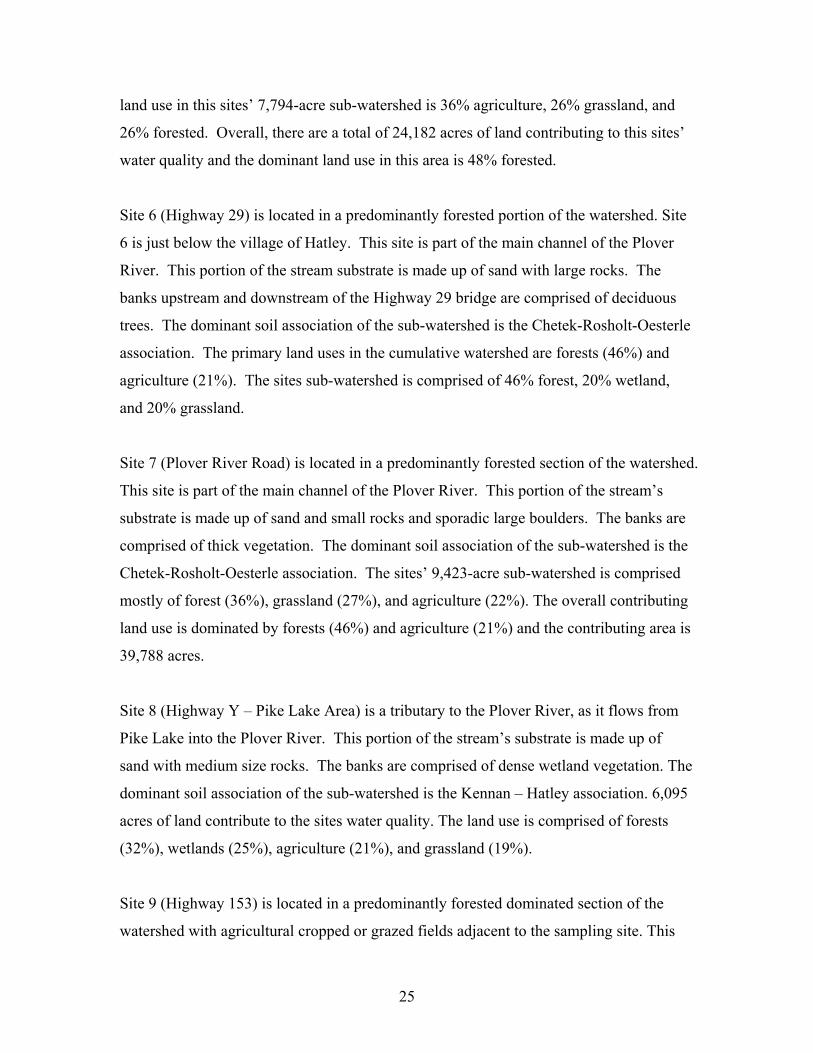
Site 6 (Highway 29) is located in a predominantly forested portion of the watershed. Site
6 is just below the village of Hatley. This site is part of the main channel of the Plover
River. This portion of the stream substrate is made up of sand with large rocks. The
banks upstream and downstream of the Highway 29 bridge are comprised of deciduous
trees. The dominant soil association of the sub-watershed is the Chetek-Rosholt-Oesterle
association. The primary land uses in the cumulative watershed are forests (46%) and
agriculture (21%). The sites sub-watershed is comprised of 46% forest, 20% wetland,
and 20% grassland.
Site 7 (Plover River Road) is located in a predominantly forested section of the watershed.
This site is part of the main channel of the Plover River. This portion of the stream’s
substrate is made up of sand and small rocks and sporadic large boulders. The banks are
comprised of thick vegetation. The dominant soil association of the sub-watershed is the
Chetek-Rosholt-Oesterle association. The sites’ 9,423-acre sub-watershed is comprised
mostly of forest (36%), grassland (27%), and agriculture (22%). The overall contributing
land use is dominated by forests (46%) and agriculture (21%) and the contributing area is
39,788 acres.
Site 8 (Highway Y – Pike Lake Area) is a tributary to the Plover River, as it flows from
Pike Lake into the Plover River. This portion of the stream’s substrate is made up of
sand with medium size rocks. The banks are comprised of dense wetland vegetation. The
dominant soil association of the sub-watershed is the Kennan – Hatley association. 6,095
acres of land contribute to the sites water quality. The land use is comprised of forests
(32%), wetlands (25%), agriculture (21%), and grassland (19%).
Site 9 (Highway 153) is located in a predominantly forested dominated section of the
watershed with agricultural cropped or grazed fields adjacent to the sampling site. This
25
site is part of the main channel of the Plover River. This portion of the stream’s substrate
is gravelly with large rocks. The banks are comprised of native vegetation. The
dominant soil association of the sub-watershed is the Chetek-Rosholt-Oesterle
association. Land use composition of both the sample site sub-watershed and
contributing area are very similar: approximately 45% forest, 22% agriculture, and 28%
grassland.
Segment C
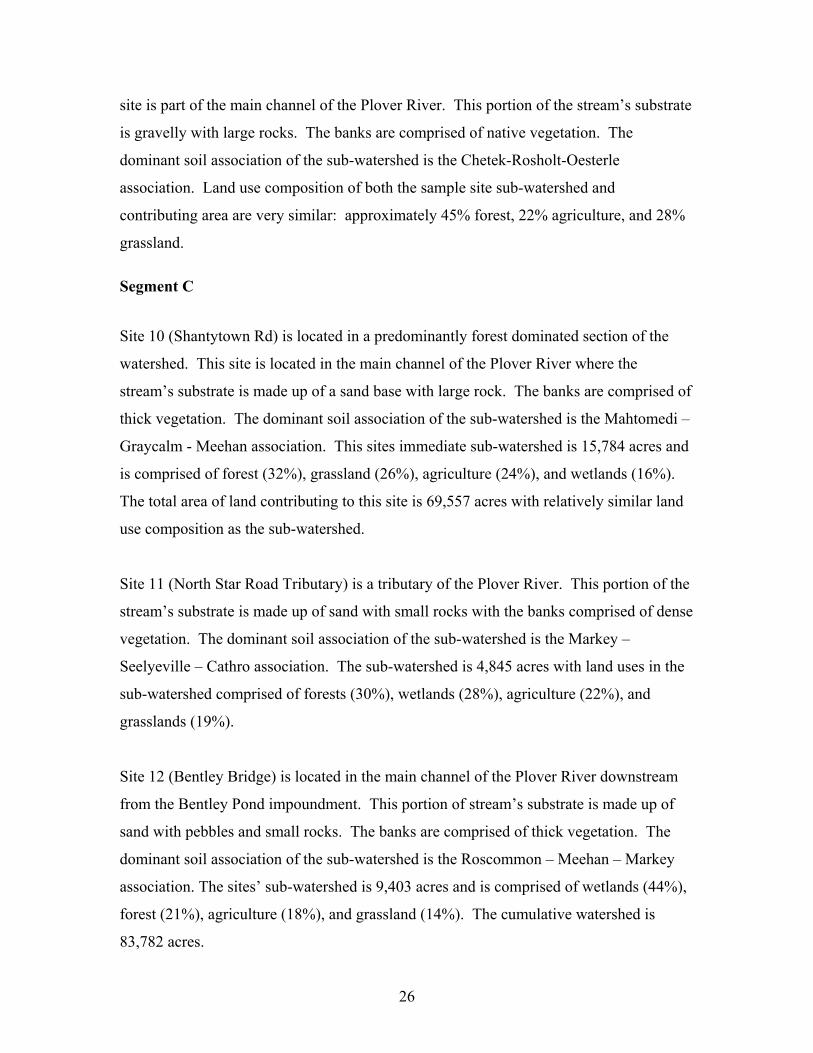
Site 10 (Shantytown Rd) is located in a predominantly forest dominated section of the
watershed. This site is located in the main channel of the Plover River where the
stream’s substrate is made up of a sand base with large rock. The banks are comprised of
thick vegetation. The dominant soil association of the sub-watershed is the Mahtomedi –
Graycalm - Meehan association. This sites immediate sub-watershed is 15,784 acres and
is comprised of forest (32%), grassland (26%), agriculture (24%), and wetlands (16%).
The total area of land contributing to this site is 69,557 acres with relatively similar land
use composition as the sub-watershed.
Site 11 (North Star Road Tributary) is a tributary of the Plover River. This portion of the
stream’s substrate is made up of sand with small rocks with the banks comprised of dense
vegetation. The dominant soil association of the sub-watershed is the Markey –
Seelyeville – Cathro association. The sub-watershed is 4,845 acres with land uses in the
sub-watershed comprised of forests (30%), wetlands (28%), agriculture (22%), and
grasslands (19%).
Site 12 (Bentley Bridge) is located in the main channel of the Plover River downstream
from the Bentley Pond impoundment. This portion of stream’s substrate is made up of
sand with pebbles and small rocks. The banks are comprised of thick vegetation. The
dominant soil association of the sub-watershed is the Roscommon – Meehan – Markey
association. The sites’ sub-watershed is 9,403 acres and is comprised of wetlands (44%),
forest (21%), agriculture (18%), and grassland (14%). The cumulative watershed is
83,782 acres.
26

Site 13 is a tributary to the Plover River. This portion of stream is made up of a sandy
substrate with banks comprised of dense vegetation. The dominant soil association of the
sub-watershed is the Roscommon – Meehan – Markey association. 4,549 acres of land
contribute to the site’s water quality. Predominant land use in this sub-watershed is
forest (50%), wetland (31%).
Site 14 is located in a predominantly agriculturally dominated section of the watershed.
This site is a tributary of the Plover River. This portion of stream’s substrate is made up
of vegetation. The banks are comprised of grasses with agricultural fields along both
sides of the ditch. The dominant soil association of the sub-watershed is the Plainfield –
Friendship association. 952 acres of land contribute to the sites’ water quality. The
dominant land use in the sub-watershed is wetlands, making up 42% of the sub-watershed.
Site 15 (Jordan North) is located on the main channel of the Plover River. This portion of
the stream is made up of a sandy substrate with banks comprised of vegetation. The
dominant soil association of the sub-watershed is the Plainfield – Friendship association.
This sites’ sub-watershed is 5,129 acres and has a mix of land uses including wetland
(36%), forest (22%), agriculture (22%), and grassland (17%). Overall, 94,394 acres of
land contribute to the sites water quality.
Segment D
Site 16 is a tributary of the Plover River. Land use in this sites’ sub-watershed has the
greatest percentage of agriculture in the watershed (56%). Other land uses in this 4,006-
acre sub-watershed include grassland (17%), forest (14%), wetland (7%), barren (6%),
and the beginning of the urban activities (0.5%). This portion of the stream’s substrate is
made up of sand and gravel. The banks are wooded downstream and lawns comprise the
upstream portion of the sampling site. The dominant soil association of the sub-
watershed is the Roscommon – Meehan – Markey association as well as wet, loamy,
mostly muck soils.
27
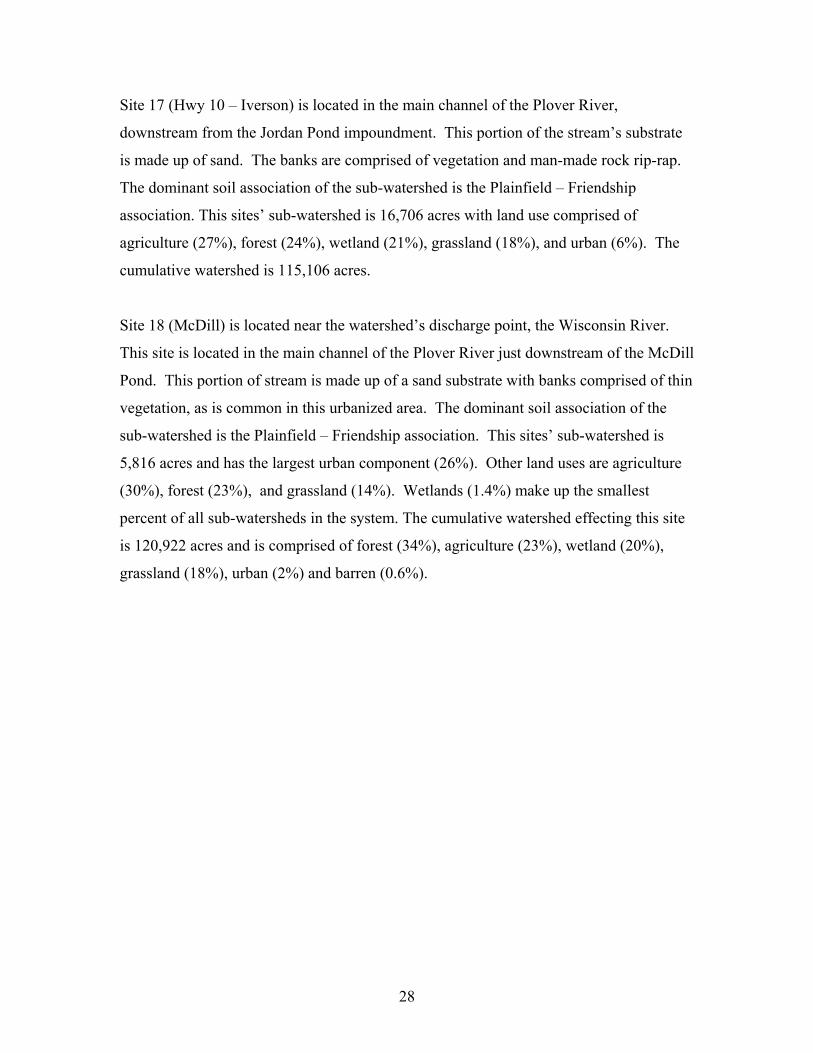
Site 17 (Hwy 10 – Iverson) is located in the main channel of the Plover River,
downstream from the Jordan Pond impoundment. This portion of the stream’s substrate
is made up of sand. The banks are comprised of vegetation and man-made rock rip-rap.
The dominant soil association of the sub-watershed is the Plainfield – Friendship
association. This sites’ sub-watershed is 16,706 acres with land use comprised of
agriculture (27%), forest (24%), wetland (21%), grassland (18%), and urban (6%). The
cumulative watershed is 115,106 acres.
Site 18 (McDill) is located near the watershed’s discharge point, the Wisconsin River.
This site is located in the main channel of the Plover River just downstream of the McDill
Pond. This portion of stream is made up of a sand substrate with banks comprised of thin
vegetation, as is common in this urbanized area. The dominant soil association of the
sub-watershed is the Plainfield – Friendship association. This sites’ sub-watershed is
5,816 acres and has the largest urban component (26%). Other land uses are agriculture
(30%), forest (23%), and grassland (14%). Wetlands (1.4%) make up the smallest
percent of all sub-watersheds in the system. The cumulative watershed effecting this site
is 120,922 acres and is comprised of forest (34%), agriculture (23%), wetland (20%),
grassland (18%), urban (2%) and barren (0.6%).
28
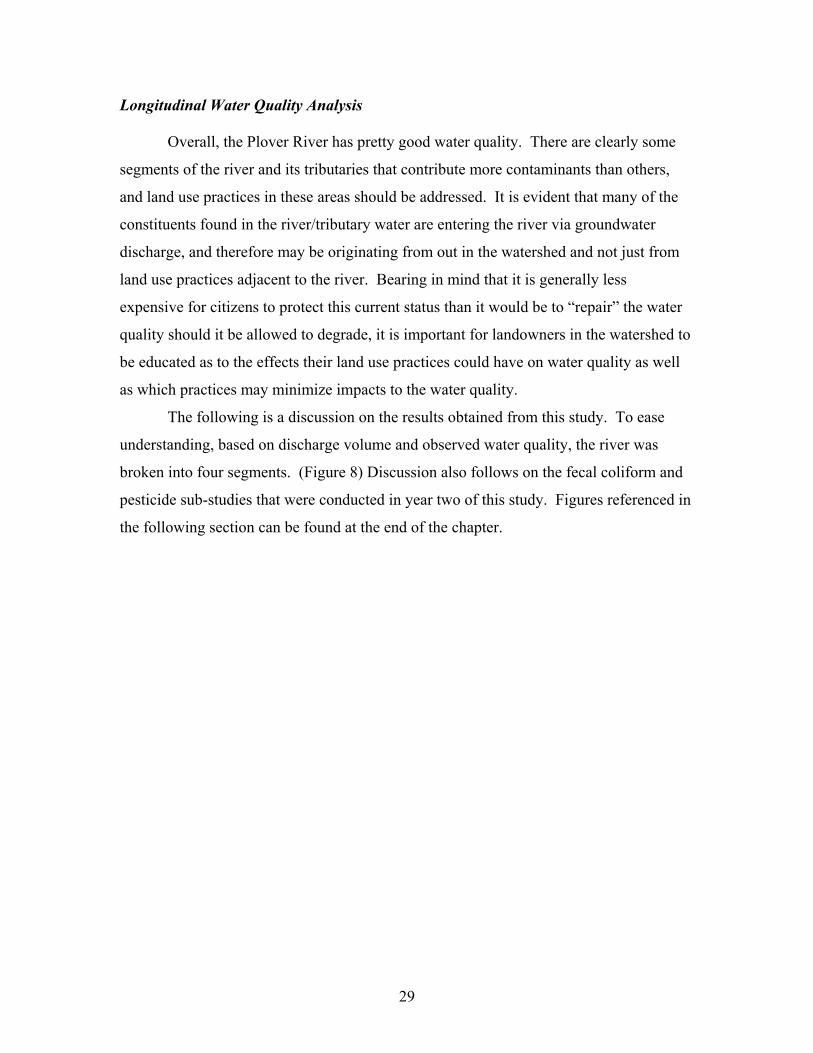
Longitudinal Water Quality Analysis
Overall, the Plover River has pretty good water quality. There are clearly some
segments of the river and its tributaries that contribute more contaminants than others,
and land use practices in these areas should be addressed. It is evident that many of the
constituents found in the river/tributary water are entering the river via groundwater
discharge, and therefore may be originating from out in the watershed and not just from
land use practices adjacent to the river. Bearing in mind that it is generally less
expensive for citizens to protect this current status than it would be to “repair” the water
quality should it be allowed to degrade, it is important for landowners in the watershed to
be educated as to the effects their land use practices could have on water quality as well
as which practices may minimize impacts to the water quality.
The following is a discussion on the results obtained from this study. To ease
understanding, based on discharge volume and observed water quality, the river was
broken into four segments. (Figure 8) Discussion also follows on the fecal coliform and
pesticide sub-studies that were conducted in year two of this study. Figures referenced in
the following section can be found at the end of the chapter.
29
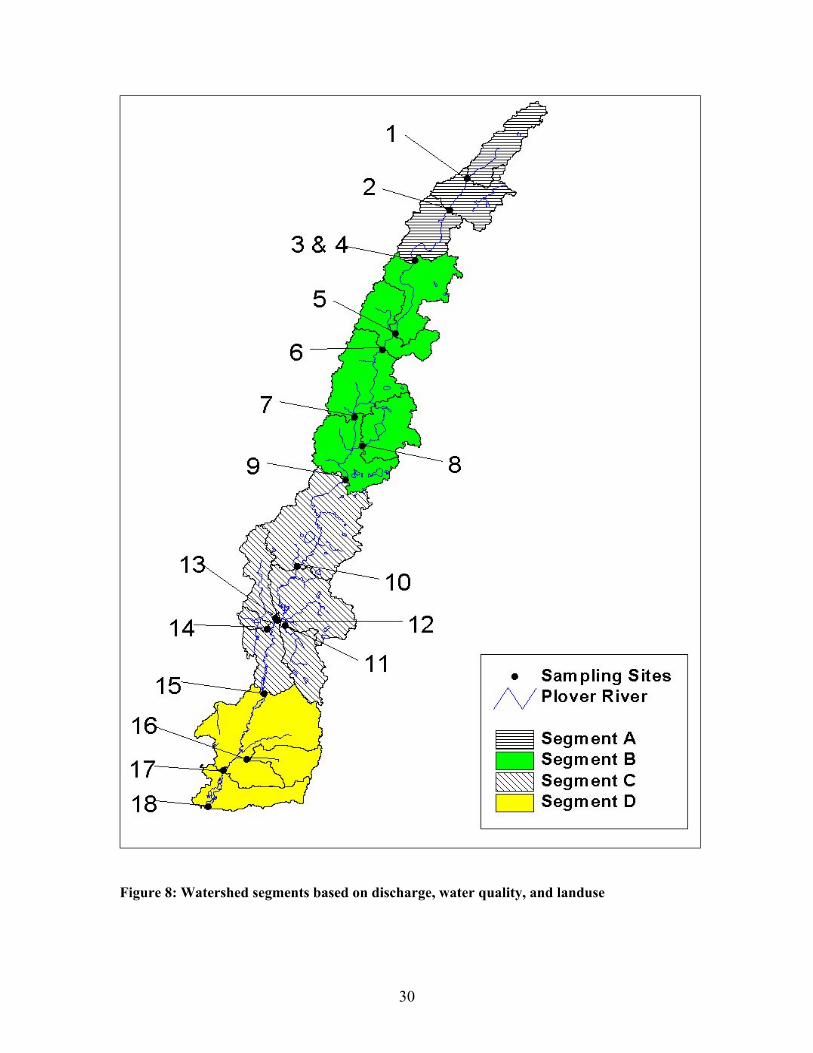
Figure 8: Watershed segments based on discharge, water quality, and landuse
30
Segment A Segment A includes sites one through four. It is identified as the headwaters of
the Plover River study area. Forests dominate the land in this segment, making up over
50% of each sub-watershed land use (Figure 10). Discharge increases from 1 cfs (cubic
feet per second) at site one to 20 cfs by site 4 (Figure 25). These headwaters are
predominantly groundwater fed.
Site two differs from the general trend of the other sites in the segment during
several events. This is due to the fact that site two was inadvertently sampled at two
different locations. One location was on the Plover River itself (denoted as 2b in
Appendix A) and the other location was Aniwa Creek (denoted as 2a in Appendix A).
The siphon samples and several baseflow samples were taken from Aniwa Creek, a
tributary of the Plover River, instead of the Plover River itself so the water quality differs
from the main channels chemistry. Concentrations on all of the water chemistry graphs
are samples taken from Site 2b, in the Plover River. Site three and four are located in
close proximity to one another. Site three is just above a cattle-watering area (which is
being addressed by the landowner and the Marathon County Land Conservation
Department). Site four is located just downstream of the animal impacted area.
The nitrate constituent is relatively low in value during both event flow and
baseflow conditions. Mean nitrate concentration is around 0.65 mg/L during baseflow
and 0.42 mg/L during events (Figures 11 and 12). The Aniwa Creek tributary contributes
an average nitrate concentration of 0.70 mg/L during baseflow and 0.10 mg/L during
eventflow. The low values in nitrate through segment A may be due to the forest-
dominated landscape, which allows for the uptake of nitrate by plants and agricultural
practices that tend to have lower impacts to water quality. Average nitrate load and yield
for sites one, two, three, and four are reported in Table 4, Figure 27, Figure 30 and
Appendix F.
31
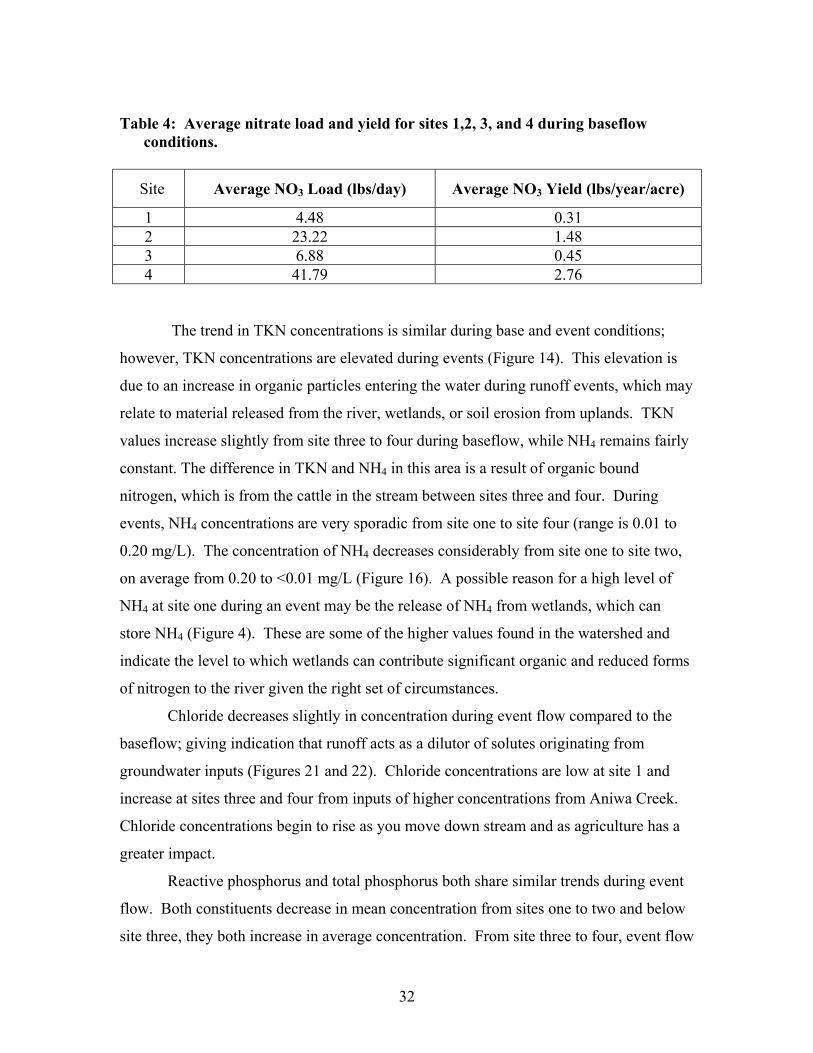
Table 4: Average nitrate load and yield for sites 1,2, 3, and 4 during baseflow
conditions.
Site Average NO3 Load (lbs/day) Average NO3 Yield (lbs/year/acre)
1 4.48 0.31 2 23.22 1.48 3 6.88 0.45 4 41.79 2.76
The trend in TKN concentrations is similar during base and event conditions;
however, TKN concentrations are elevated during events (Figure 14). This elevation is
due to an increase in organic particles entering the water during runoff events, which may
relate to material released from the river, wetlands, or soil erosion from uplands. TKN
values increase slightly from site three to four during baseflow, while NH4 remains fairly
constant. The difference in TKN and NH4 in this area is a result of organic bound
nitrogen, which is from the cattle in the stream between sites three and four. During
events, NH4 concentrations are very sporadic from site one to site four (range is 0.01 to
0.20 mg/L). The concentration of NH4 decreases considerably from site one to site two,
on average from 0.20 to <0.01 mg/L (Figure 16). A possible reason for a high level of
NH4 at site one during an event may be the release of NH4 from wetlands, which can
store NH4 (Figure 4). These are some of the higher values found in the watershed and
indicate the level to which wetlands can contribute significant organic and reduced forms
of nitrogen to the river given the right set of circumstances.
Chloride decreases slightly in concentration during event flow compared to the
baseflow; giving indication that runoff acts as a dilutor of solutes originating from
groundwater inputs (Figures 21 and 22). Chloride concentrations are low at site 1 and
increase at sites three and four from inputs of higher concentrations from Aniwa Creek.
Chloride concentrations begin to rise as you move down stream and as agriculture has a
greater impact.
Reactive phosphorus and total phosphorus both share similar trends during event
flow. Both constituents decrease in mean concentration from sites one to two and below
site three, they both increase in average concentration. From site three to four, event flow
32

reactive P average concentrations increased from 0.02 to 0.08 mg/L and event flow TP
average concentrations increased from 0.04 to 0.17 mg/L (Figures 18 and 20). The
August 14th, 2000 event of 0.20 mg/L TP is strongly affecting the average concentrations
at site 4 (Figure 26). The storm event flushed material from the cattle-watering ramp
between sites 3 and 4. The baseflow concentrations of reactive and TP exhibited little
variation and averaged around 0.03 mg/L and 0.05 mg/L, respectively. Average reactive
phosphorus load and yield for sites one through four is reported in Table 5, Figure 29,
Figure 32, and Appendix F. Average total phosphorus load and yield for sites one through
four was reported in Table 5, Figure 28, Figure 31, and Appendix F. Nutrients yields
resulted in negative values, however, this is not directly related to the land within the
watershed, but is likely due to in-stream losses or dilution from groundwater inflow. The
negative values are reported as N/A in the tables.
Table 5: Average reactive and total P load and yield for sites 1, 2, 3, and 4 during
baseflow conditions.
Site
Average Total P Load
(lbs/day)
Average Total P Yield
(lbs/year/acre)
Average Reactive P Load
(lbs/day)
Average Reactive P Yield
(lbs/year/acre) 1 0.38 0.03 0.30 0.02 2 1.48 0.10 1.03 0.07 3 3.41 0.24 2.13 0.15 4 -0.24 N/A* 0.07 0.01
*Nutrients yields resulted in negative values, however, this is not directly related to the land within the watershed, but is likely due to in-stream losses or dilution from groundwater inflow.
The overall trend for TSS concentrations in Segment A is a decreasing trend as
shown in Figures 22 and 23. TSS concentrations are high at site one, with an average
value of 71 mg/L. Part of that may be due to sediments being washed out of the wetland
area upstream from site one. Aniwa Creek contributed an average of 30.67 mg/L of TSS
to the river. The concentration of TSS diminishes to an average concentration of 26 mg/L
at site four. When comparing precipitation to TSS concentrations it is apparent that
during larger storm events the TSS concentrations are much higher than other events
sampled from the same site. The highest suspended solid concentrations for Segment A
all come from the August 14th, 2000 event. Other factors that also contribute to the
33
concentration of TSS entering the river include the amount of exposed soil, amount and
type of vegetative cover, and topography.
VSS concentrations are at least half the concentration of TSS values between sites
one and four. (Appendix A) Segment A possess a positive correlation between TSS and
VSS. (Figure 24) The constant ratio between TSS and VSS means that organic sources
are impacting the watershed.
Segment B
Segment B consists of sites five through nine. The dominant land uses in this
segment are forests (37%), and agriculture (23%), and grasslands (22%). All three land
uses make up a considerable percentage (82%) of the combined sub-watersheds in this
segment.
During baseflow measurements, it was observed that discharge increases
considerably from site five to site nine. Discharge increases from an average of 35 cfs at
site five to near 60 cfs at site nine. (Figure 25)
Nitrate levels in both baseflow and event flow conditions remain at a constant
level between sites four and nine. Nitrate concentrations during baseflow averaged one
mg/L. Site eight, a tributary to the Plover, had an average baseflow nitrate concentration
of 0.22 mg/L and an average discharge of 1.26 cfs. The mean concentration and average
discharge resulted in nitrate loading of about 1.8 lbs/day and flux approximately 0.1
lbs/ac/yr at site eight. This site had an average event flow nitrate concentration of 0.45
mg/L. Nitrate concentrations on the main river during event flow averaged 0.70 mg/L.
Nitrate concentrations during baseflow remain higher than event concentrations;
therefore the main source of nitrate is through groundwater recharge into the river and
storm events are diluting the concentration of nitrate (Figures 11 and 12). Average nitrate
load and yield concentrations for sites five through nine are reported in Table 6, Figure
27, Figure 30, and Appendix F.
34

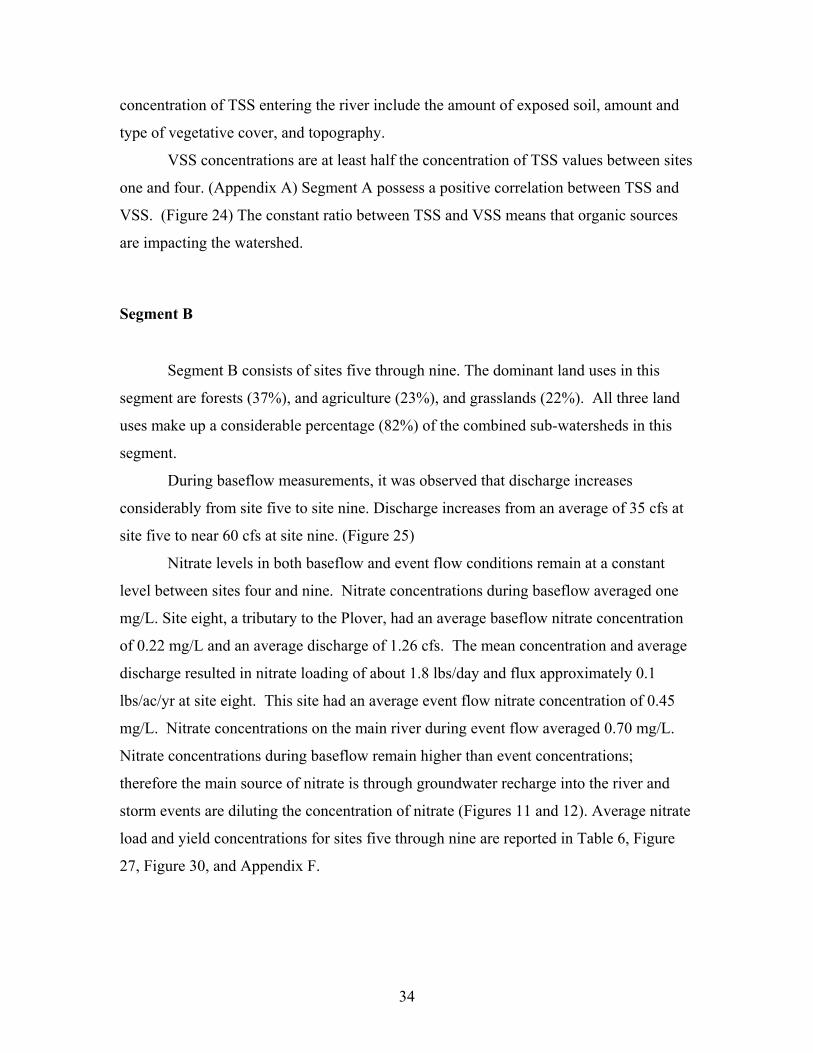
Table 6: Average nitrate load and yield for sites 4, 5, 6, 7, 8, and 9 during baseflow conditions.
Site Average NO3 Load (lbs/day) Average NO3 Yield (lbs/year/acre)
5 94.12 4.40 6 4.55 0.27 7 52.40 2.03 8 1.77 0.11 9 98.14 4.54
TKN concentrations increase from site five to six during storm events and
baseflow (Figure 14). One possible source for this may be a wetland-dominated tributary
that flows into the Plover River above site six. Event TKN concentrations continue to
increase to site seven; however, NH4 decreases in concentration over that same stream
length (Figures 14 and 16). This may be due to NH4 uptake by plants. Baseflow NH4
concentrations follow a decreasing trend from site five to nine, whereas event flow NH4
concentrations possess an overall increasing trend. This contrasting trend indicates the
NH4 is originating from overland flow through wetlands during storm events.
Baseflow TP concentrations remain nearly level averaging 0.04 mg/L. The event
flow TP increases from site five to six and then levels off (Figure 18). The increase in TP,
as well as an increase in TKN and TSS, suggests that organic matter is causing a slight
increase in the concentrations. This organic matter could be originating from farmland
runoff or wetlands; both types of land uses are prevalent between sites five and six
(Figure 4). Average reactive phosphorus load and yield is reported in Table 7, Figure 29,
Figure 32, and Appendix F. Average total phosphorus load and yield is reported in Table
7, Figure 28, Figure 31, and Appendix F.
During both baseflow and event flow, chloride values seem to increase slightly
throughout segment B, with the exception of site five. Runoff during the August 8th,
2000 storm event had high chloride concentrations in the sample collected from this site.
The rest of the sites within the segment have a little variation between the maximum and
35
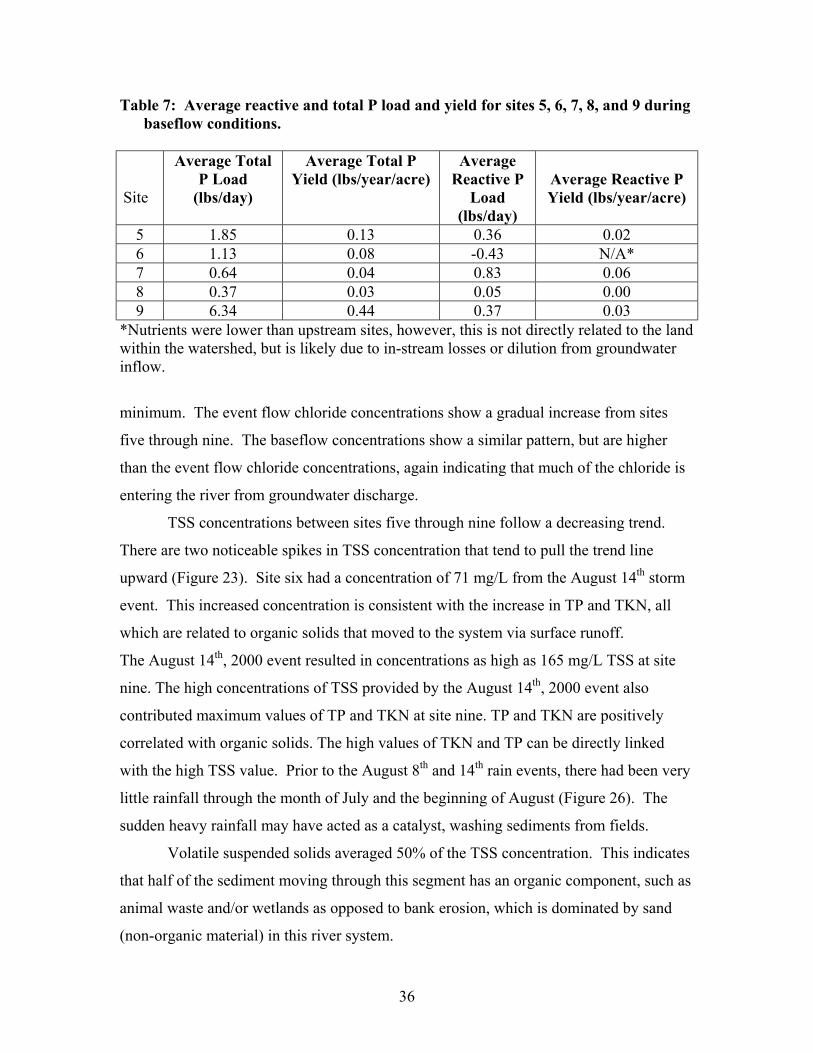
Table 7: Average reactive and total P load and yield for sites 5, 6, 7, 8, and 9 during baseflow conditions.
Site
Average Total P Load
(lbs/day)
Average Total P Yield (lbs/year/acre)
Average Reactive P
Load (lbs/day)
Average Reactive P Yield (lbs/year/acre)
5 1.85 0.13 0.36 0.02 6 1.13 0.08 -0.43 N/A* 7 0.64 0.04 0.83 0.06 8 0.37 0.03 0.05 0.00 9 6.34 0.44 0.37 0.03
*Nutrients were lower than upstream sites, however, this is not directly related to the land within the watershed, but is likely due to in-stream losses or dilution from groundwater inflow.
minimum. The event flow chloride concentrations show a gradual increase from sites
five through nine. The baseflow concentrations show a similar pattern, but are higher
than the event flow chloride concentrations, again indicating that much of the chloride is
entering the river from groundwater discharge.
TSS concentrations between sites five through nine follow a decreasing trend.
There are two noticeable spikes in TSS concentration that tend to pull the trend line
upward (Figure 23). Site six had a concentration of 71 mg/L from the August 14th storm
event. This increased concentration is consistent with the increase in TP and TKN, all
which are related to organic solids that moved to the system via surface runoff.
The August 14th, 2000 event resulted in concentrations as high as 165 mg/L TSS at site
nine. The high concentrations of TSS provided by the August 14th, 2000 event also
contributed maximum values of TP and TKN at site nine. TP and TKN are positively
correlated with organic solids. The high values of TKN and TP can be directly linked
with the high TSS value. Prior to the August 8th and 14th rain events, there had been very
little rainfall through the month of July and the beginning of August (Figure 26). The
sudden heavy rainfall may have acted as a catalyst, washing sediments from fields.
Volatile suspended solids averaged 50% of the TSS concentration. This indicates
that half of the sediment moving through this segment has an organic component, such as
animal waste and/or wetlands as opposed to bank erosion, which is dominated by sand
(non-organic material) in this river system.
36
Segment C
Segment C is comprised of sites ten through fifteen. The land uses within this
segment are a mixture of forest, wetland, grassland, and agriculture. Sites ten, twelve and
fifteen are located in the Plover River and sites eleven, thirteen, and fourteen are all
tributaries within the segment. Discharge increases significantly in this segment,
suggesting an increase in groundwater contributions (Figure 25).
Nitrate concentrations are elevated compared to segments A and B (Figure 11 &
12). The baseflow nitrate concentrations are consistent at a value of 1.60 mg/L. Within
the tributaries, site eleven contributes an average concentration of 2.2 mg/L, site thirteen
contributes an average concentration of 0.3 mg/L, and site fourteen contributes an
average concentration of 2.3 mg/L during baseflow conditions (Appendix B). Although
these concentrations are slightly elevated compared to upstream, these levels are still
relatively low for the area. Average nitrate load and yield concentrations for sites ten
through fifteen are reported in Table 8, Figure 27, Figure 30, and Appendix F.
Table 8: Nitrate load and yield for sites 10, 11, 12, 13, 14, and 15 during baseflow
conditions.
Site Average NO3 Load (lbs/day) Average NO3 Yield (lbs/year/acre)
10 427.28 9.88 11 19.61 1.48 12 76.79 2.98 13 0.34 0.03 14 5.02 1.92 15 -7.61 N/A*
The event flow nitrate concentrations averages are 1.3 mg/L. The event of April
13th, 2001 produced a maximum concentration of 4.4 mg/L at site twelve (Figure 12).
This increased concentration may have been due to runoff from farm fields upstream of
the site. Site eleven contributes an average concentration of 0.8 mg/L, site thirteen
contributes an average concentration of 0.1 mg/L, and site fourteen contributes an
37
average concentration of 0.6 mg/L during event flow conditions (Appendix B). In
general there are lower concentrations during baseflow.
Concentrations of NH4 in this segment remained fairly low during all sample
periods. Baseflow NH4 concentrations steadily increase from 0.01 mg/L at site 10 to 0.06
mg/L at site 15 (Figure 15). Segment C has an average baseflow NH4 concentration of
0.04 mg/L. Average tributary inputs during baseflow are: 0.10 mg/L at site eleven, 0.18
mg/L at site thirteen, and 0.19 mg/L at site fourteen. The NH4 is not usually transported
through groundwater, but is generally found in reducing conditions like wetlands. Based
on the close proximity of agricultural land in relation to the sites, agricultural inputs may
also be contributing (Figure 4).
The event flow NH4 average concentration in the river was 0.04 mg/L (Figure 16).
Event flow average tributary values were: 0.03 mg/L at site eleven, 0.12 mg/L at site
thirteen, and 0.11 mg/L at site fourteen. The release of NH4 from wetlands, barnyards,
and fields during a storm event may be the cause for the slightly increased tributary
concentrations.
Baseflow concentrations of TP remain constant in the main river at a
concentration of 0.03 mg/L (Figure 17). Tributaries were found to have 0.03 mg/L at site
eleven, 0.05 mg/L at site thirteen, and 0.14 mg/L at site fourteen. Event flow
concentrations of TP increase in the river from 0.05 mg/L at site twelve to 0.08 mg/L at
site fifteen (Figure 18). During event flow conditions site eleven contributes an average
concentration of 0.06 mg/L, site thirteen contributes an average of 0.07 mg/L, and site
fourteen contributes an average of 0.17 mg/L. The elevated concentrations from the
tributaries may account for the increased concentrations from site twelve to site fifteen.
Both baseflow and event flow concentrations of reactive P is minimal. The baseflow
reactive P average concentration is 0.01mg/L and the event flow reactive P average
concentration is 0.02 mg/L (Figures 19 and 20). Average reactive phosphorus load and
yield for sites ten through fifteen is reported in Table 9, Figure 29, Figure 32, and
Appendix F. Average total phosphorus load and yield for sites ten through fifteen are
reported in Table 9, Figure 28, Figure 31, and Appendix F.
38

Table 9: Average reactive and total P load and yield for sites 10, 11, 12, 13, 14, and 15 during baseflow conditions.
Site
Average Total P Load
(lbs/day)
Average Total P Yield
(lbs/year/acre)
Average Reactive P
Load (lbs/day)
Average Reactive P Yield (lbs/year/acre)
10 -0.08 N/A* 1.16 0.08 11 0.20 0.01 0.08 0.01 12 -0.83 N/A* 0.10 0.01 13 0.10 0.01 0.05 0.00 14 0.30 0.02 0.02 0.00 15 2.50 0.17 -1.57 N/A*
*Nutrients yields resulted in negative values, however, this is not directly related to the land within the watershed, but is likely due to in-stream losses or dilution from groundwater inflow.
Chloride values show an increasing trend during baseflow and a decreasing trend
during event flow (Figures 21 and 22). Baseflow concentrations average 8.5 mg/L.
During baseflow conditions, tributary site eleven contributes an average concentration of
10.9 mg/L, site thirteen contributes an average of 1.9 mg/L, and site fourteen contributes
an average of 17.7 mg/l. The increase in chloride in the segment, with high inputs from
tributary sites eleven and fourteen, would suggest high levels of chloride entering the
system through groundwater recharge, most likely from agricultural activity.
Average event flow concentrations of chloride are 7.2 mg/L for sites located
directly on the river and the maximum concentration of 16.4 mg/L was collected at site
ten on June 2nd, 2000 (Figures 22 and 26). As noted upstream, storm events dilute the
baseflow concentrations of chloride. During event flow conditions, tributary site eleven
contributes an average concentration of 6.7 mg/L, site thirteen an average of 0.6 mg/L,
and site fourteen had an average of 5.9 mg/L.
TSS follows a decreasing trend from site ten to site fifteen (Figure 23). The
average TSS concentration within segment C is 18 mg/L. The highest concentrations in
this segment were measured during two August, 2000 storm events, 71mg/L from site
thirteen during the August 14th, 2000 storm event and 77 mg/L from site fifteen during
the August 9th, 2000 storm event (Figure 23). The average TSS concentrations from
tributary sites eleven, thirteen, and fourteen were 9.5, 27, and 7 mg/L, respectively.
39
The VSS from the tributaries have a higher ratio of VSS to TSS, suggesting that
the solids that originate from the tributaries come from a more organic source such as
animal waste or wetlands, both are plausible sources in all three tributaries in segment C.
Segment D Segment D is comprised of sites sixteen through site eighteen. Site sixteen is a
tributary, and sites seventeen and eighteen are located in the Plover River. This segment
begins downstream of Jordan pond and the final sample site is just downstream of McDill
Pond. The mixed land uses within this segment include agriculture, urban grassland and
some forest. The city of Stevens Point is located within this segment, creating a large
urban influence (Figure 4). Despite the fact that some groundwater is drawn away from
the river in this segment to supply municipal water to Stevens Point, there is a 30 %
increase in discharge in this segment and a 28% increase in drainage area.
Average nitrate concentrations increase through segment D during baseflow
conditions (Figure 11). Site sixteen, a tributary, contributes an average concentration of
19.3 mg/L. The high levels of nitrate contaminated groundwater discharging to site
sixteen is likely due to the agricultural dominated sub-watershed, with predominantly
sand substrate that allows nitrates from fertilizer to readily leach into the groundwater
(Figure 4). Average nitrate concentrations at sites seventeen and eighteen are
approximately 2.1 mg/L. The average concentration from sites seventeen and eighteen
increased from segment C’s average baseflow nitrate concentration of 1.6 mg/L. This
increase is likely due to tributary site sixteen contributing high concentrations, yet in
relatively small volumes. The average event flow nitrate concentrations are less than that
of baseflow. This indicates that groundwater influences nitrate concentrations more so
than runoff in the region. Average nitrate load and yield concentrations for sites sixteen
through eighteen are reported in Table 10, Figure 27, Figure 30, and Appendix F.
NH4 concentrations decrease slightly during baseflow conditions. During event flow
conditions, NH4 peaks in concentration at site seventeen (Figure 16). The increase in
NH4 levels at site seventeen may be due to the effects of agricultural runoff or the
flushing of the wetlands during storm events.
40
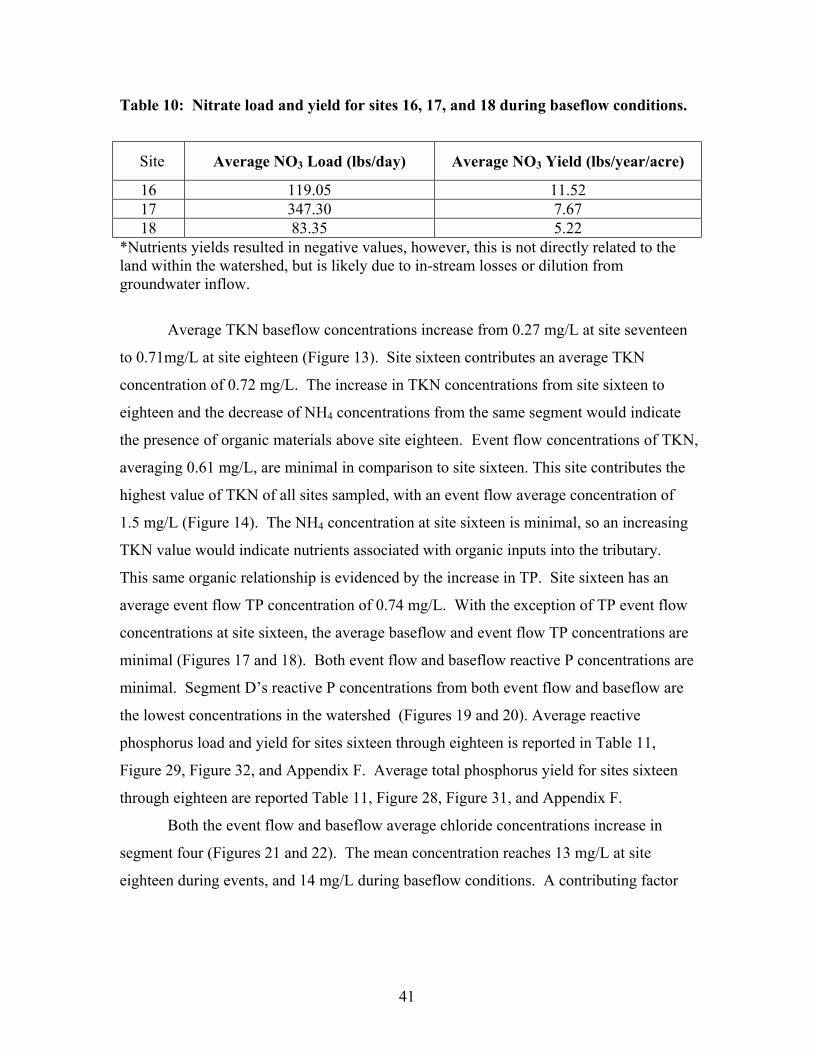
Table 10: Nitrate load and yield for sites 16, 17, and 18 during baseflow conditions.
Site Average NO3 Load (lbs/day) Average NO3 Yield (lbs/year/acre)
16 119.05 11.52 17 347.30 7.67 18 83.35 5.22
*Nutrients yields resulted in negative values, however, this is not directly related to the land within the watershed, but is likely due to in-stream losses or dilution from groundwater inflow.
Average TKN baseflow concentrations increase from 0.27 mg/L at site seventeen
to 0.71mg/L at site eighteen (Figure 13). Site sixteen contributes an average TKN
concentration of 0.72 mg/L. The increase in TKN concentrations from site sixteen to
eighteen and the decrease of NH4 concentrations from the same segment would indicate
the presence of organic materials above site eighteen. Event flow concentrations of TKN,
averaging 0.61 mg/L, are minimal in comparison to site sixteen. This site contributes the
highest value of TKN of all sites sampled, with an event flow average concentration of
1.5 mg/L (Figure 14). The NH4 concentration at site sixteen is minimal, so an increasing
TKN value would indicate nutrients associated with organic inputs into the tributary.
This same organic relationship is evidenced by the increase in TP. Site sixteen has an
average event flow TP concentration of 0.74 mg/L. With the exception of TP event flow
concentrations at site sixteen, the average baseflow and event flow TP concentrations are
minimal (Figures 17 and 18). Both event flow and baseflow reactive P concentrations are
minimal. Segment D’s reactive P concentrations from both event flow and baseflow are
the lowest concentrations in the watershed (Figures 19 and 20). Average reactive
phosphorus load and yield for sites sixteen through eighteen is reported in Table 11,
Figure 29, Figure 32, and Appendix F. Average total phosphorus yield for sites sixteen
through eighteen are reported Table 11, Figure 28, Figure 31, and Appendix F.
Both the event flow and baseflow average chloride concentrations increase in
segment four (Figures 21 and 22). The mean concentration reaches 13 mg/L at site
eighteen during events, and 14 mg/L during baseflow conditions. A contributing factor
41
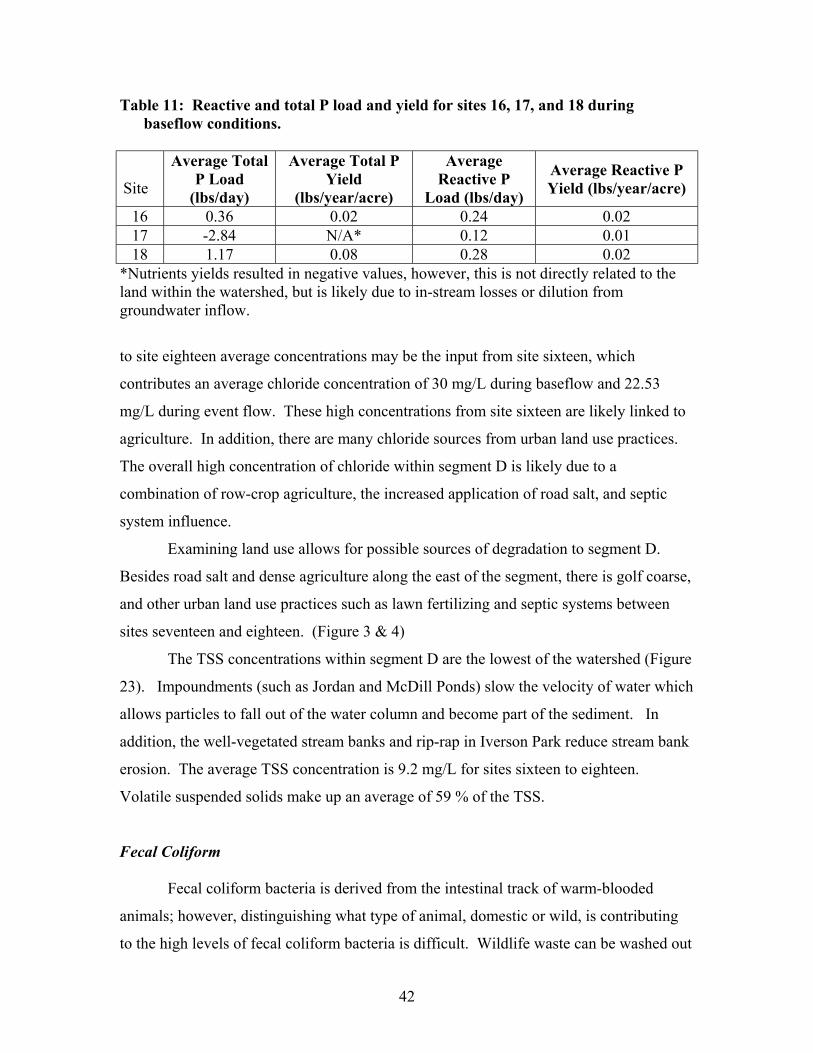
Table 11: Reactive and total P load and yield for sites 16, 17, and 18 during baseflow conditions.
Site
Average Total P Load
(lbs/day)
Average Total P Yield
(lbs/year/acre)
Average Reactive P
Load (lbs/day)
Average Reactive P Yield (lbs/year/acre)
16 0.36 0.02 0.24 0.02 17 -2.84 N/A* 0.12 0.01 18 1.17 0.08 0.28 0.02
*Nutrients yields resulted in negative values, however, this is not directly related to the land within the watershed, but is likely due to in-stream losses or dilution from groundwater inflow.
to site eighteen average concentrations may be the input from site sixteen, which
contributes an average chloride concentration of 30 mg/L during baseflow and 22.53
mg/L during event flow. These high concentrations from site sixteen are likely linked to
agriculture. In addition, there are many chloride sources from urban land use practices.
The overall high concentration of chloride within segment D is likely due to a
combination of row-crop agriculture, the increased application of road salt, and septic
system influence.
Examining land use allows for possible sources of degradation to segment D.
Besides road salt and dense agriculture along the east of the segment, there is golf coarse,
and other urban land use practices such as lawn fertilizing and septic systems between
sites seventeen and eighteen. (Figure 3 & 4)
The TSS concentrations within segment D are the lowest of the watershed (Figure
23). Impoundments (such as Jordan and McDill Ponds) slow the velocity of water which
allows particles to fall out of the water column and become part of the sediment. In
addition, the well-vegetated stream banks and rip-rap in Iverson Park reduce stream bank
erosion. The average TSS concentration is 9.2 mg/L for sites sixteen to eighteen.
Volatile suspended solids make up an average of 59 % of the TSS.
Fecal Coliform
Fecal coliform bacteria is derived from the intestinal track of warm-blooded
animals; however, distinguishing what type of animal, domestic or wild, is contributing
to the high levels of fecal coliform bacteria is difficult. Wildlife waste can be washed out
42
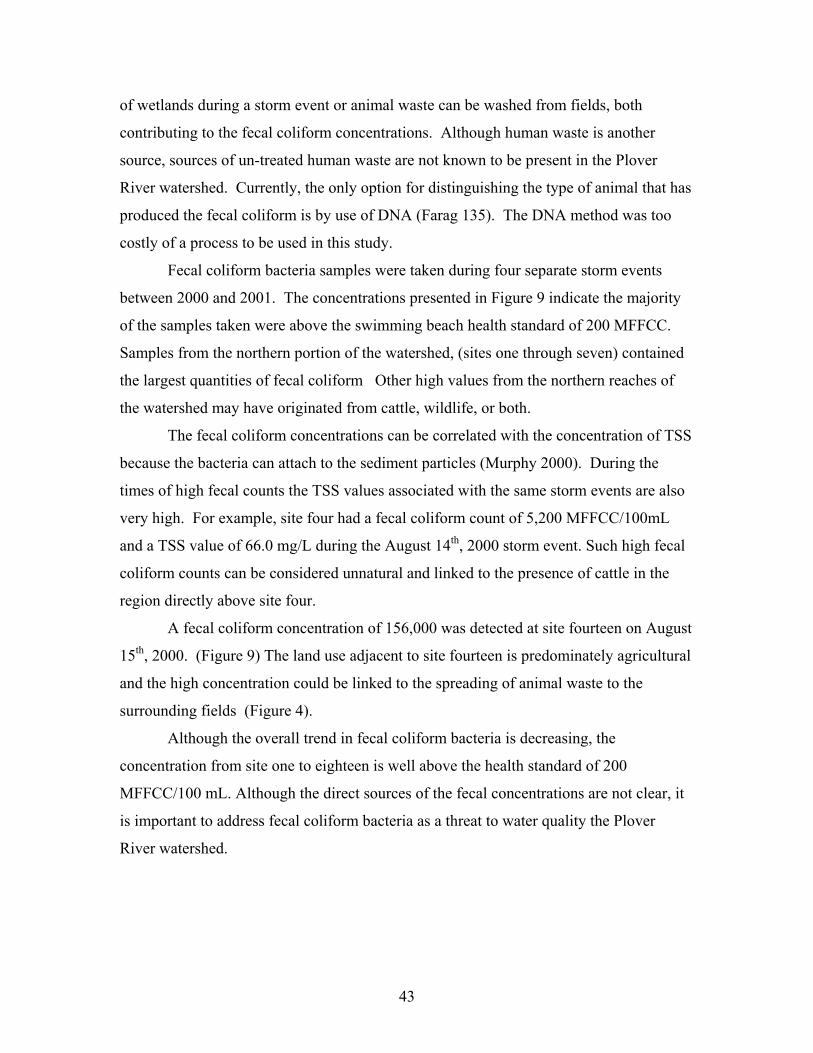
of wetlands during a storm event or animal waste can be washed from fields, both
contributing to the fecal coliform concentrations. Although human waste is another
source, sources of un-treated human waste are not known to be present in the Plover
River watershed. Currently, the only option for distinguishing the type of animal that has
produced the fecal coliform is by use of DNA (Farag 135). The DNA method was too
costly of a process to be used in this study.
Fecal coliform bacteria samples were taken during four separate storm events
between 2000 and 2001. The concentrations presented in Figure 9 indicate the majority
of the samples taken were above the swimming beach health standard of 200 MFFCC.
Samples from the northern portion of the watershed, (sites one through seven) contained
the largest quantities of fecal coliform Other high values from the northern reaches of
the watershed may have originated from cattle, wildlife, or both.
The fecal coliform concentrations can be correlated with the concentration of TSS
because the bacteria can attach to the sediment particles (Murphy 2000). During the
times of high fecal counts the TSS values associated with the same storm events are also
very high. For example, site four had a fecal coliform count of 5,200 MFFCC/100mL
and a TSS value of 66.0 mg/L during the August 14th, 2000 storm event. Such high fecal
coliform counts can be considered unnatural and linked to the presence of cattle in the
region directly above site four.
A fecal coliform concentration of 156,000 was detected at site fourteen on August
15th, 2000. (Figure 9) The land use adjacent to site fourteen is predominately agricultural
and the high concentration could be linked to the spreading of animal waste to the
surrounding fields (Figure 4).
Although the overall trend in fecal coliform bacteria is decreasing, the
concentration from site one to eighteen is well above the health standard of 200
MFFCC/100 mL. Although the direct sources of the fecal concentrations are not clear, it
is important to address fecal coliform bacteria as a threat to water quality the Plover
River watershed.
43
Fecal Coliform
10
100
1,000
10,000
100,000
1 2 3 4 5 6 7 8 9 10 11 12 13 14 15 16 17 18Site #
Feca
l Col
iform
(MFF
CC
\100
ml)
Aug 15, 2000
June 13, 2001
Aug 1, 2001
Aug 16, 2001
HealthStandard
156,000
Figure 9: Fecal Coliform Bacteria Concentrations for four sampling dates. Pesticides
Pesticides do not occur naturally in the environment. Those pesticides that are
leached into the subsurface penetrate the water table and once in the groundwater the
breakdown of the pesticides is minimal. The pesticides then enter the river ecosystem
through groundwater discharge. Nine sample sites were selected for triazine screens in
June 2001. (Table 12) As pesticides frequently move through the environment with
fertilizers, elevated nitrate and/or chloride concentrations were used in the site selection
process. Triazine was detected at all but one of these sites; however, they were all below
the level of quantification. This means that presence/absence of triazine can be
determined, but specific quantities cannot. Following the triazine screen, seven sites
along the Plover River were selected for more comprehensive pesticide analysis.
A variety of pesticides were present in the seven samples, but most were below
the level of quantification. The pesticides that were detected are all variations of corn
herbicides (Poplyk 1989). A major pesticide within the triazine chemical class is atrazine,
which was a common herbicide found in the samples. The pesticides that were detected
44
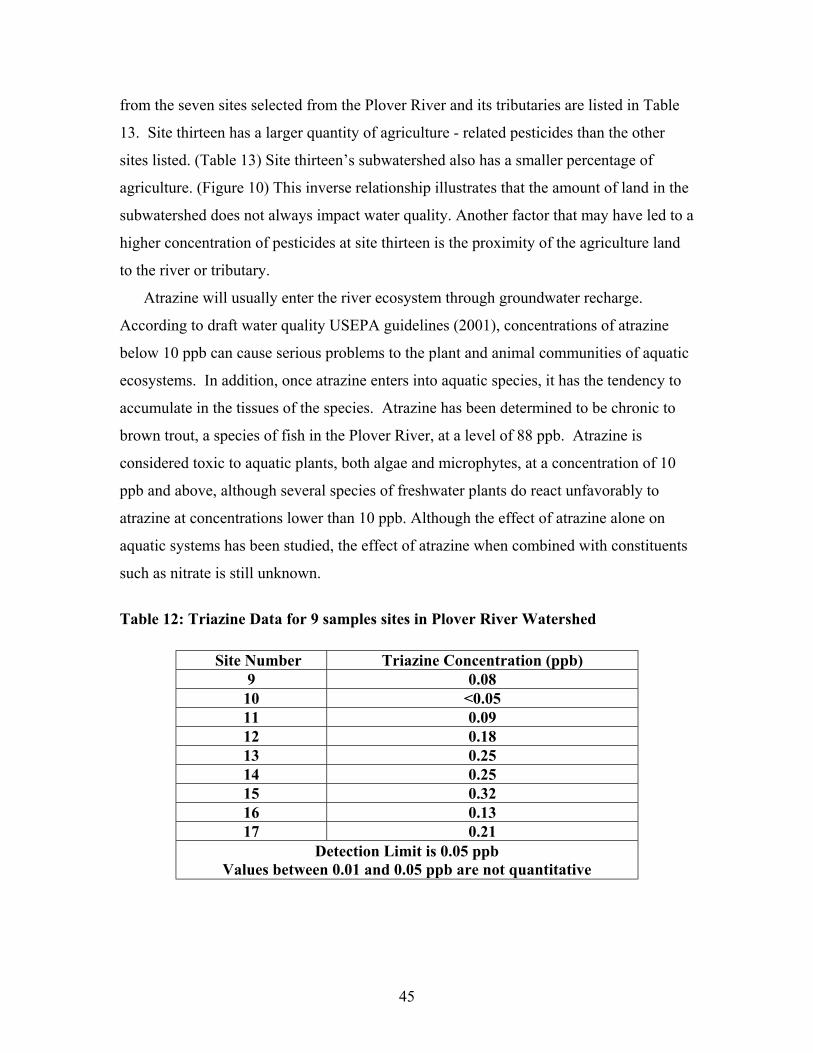
from the seven sites selected from the Plover River and its tributaries are listed in Table
13. Site thirteen has a larger quantity of agriculture - related pesticides than the other
sites listed. (Table 13) Site thirteen’s subwatershed also has a smaller percentage of
agriculture. (Figure 10) This inverse relationship illustrates that the amount of land in the
subwatershed does not always impact water quality. Another factor that may have led to a
higher concentration of pesticides at site thirteen is the proximity of the agriculture land
to the river or tributary.
Atrazine will usually enter the river ecosystem through groundwater recharge.
According to draft water quality USEPA guidelines (2001), concentrations of atrazine
below 10 ppb can cause serious problems to the plant and animal communities of aquatic
ecosystems. In addition, once atrazine enters into aquatic species, it has the tendency to
accumulate in the tissues of the species. Atrazine has been determined to be chronic to
brown trout, a species of fish in the Plover River, at a level of 88 ppb. Atrazine is
considered toxic to aquatic plants, both algae and microphytes, at a concentration of 10
ppb and above, although several species of freshwater plants do react unfavorably to
atrazine at concentrations lower than 10 ppb. Although the effect of atrazine alone on
aquatic systems has been studied, the effect of atrazine when combined with constituents
such as nitrate is still unknown.
Table 12: Triazine Data for 9 samples sites in Plover River Watershed Site Number Triazine Concentration (ppb)
9 0.08 10 <0.05 11 0.09 12 0.18 13 0.25 14 0.25 15 0.32 16 0.13 17 0.21
Detection Limit is 0.05 ppb Values between 0.01 and 0.05 ppb are not quantitative
45
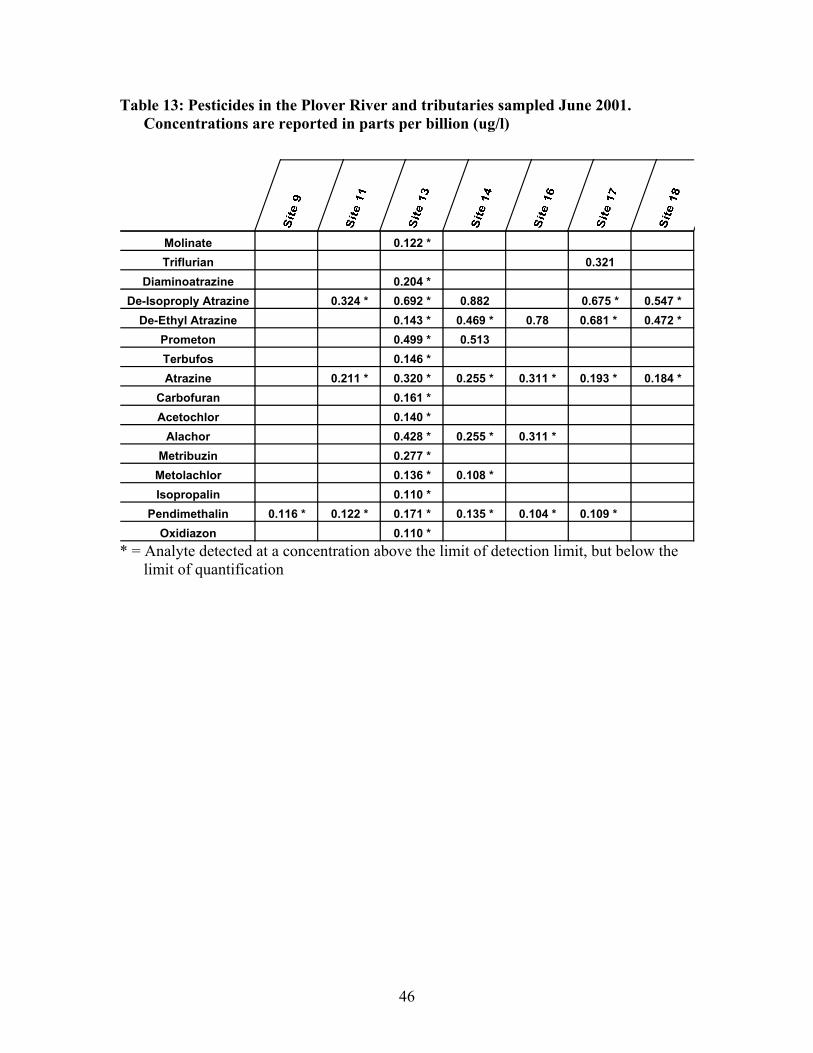
Table 13: Pesticides in the Plover River and tributaries sampled June 2001. Concentrations are reported in parts per billion (ug/l)
Molinate 0.122 *Triflurian 0.321
Diaminoatrazine 0.204 *De-Isoproply Atrazine 0.324 * 0.692 * 0.882 0.675 * 0.547 *
De-Ethyl Atrazine 0.143 * 0.469 * 0.78 0.681 * 0.472 *Prometon 0.499 * 0.513Terbufos 0.146 *Atrazine 0.211 * 0.320 * 0.255 * 0.311 * 0.193 * 0.184 *
Carbofuran 0.161 *Acetochlor 0.140 *
Alachor 0.428 * 0.255 * 0.311 *Metribuzin 0.277 *
Metolachlor 0.136 * 0.108 *Isopropalin 0.110 *
Pendimethalin 0.116 * 0.122 * 0.171 * 0.135 * 0.104 * 0.109 * Oxidiazon 0.110 *
* = Analyte detected at a concentration above the limit of detection limit, but below the limit of quantification
46

Temperature Monitoring Data Contributed by the Department of Natural Resources (M. Hazuga and A. Hauber)
The Department of Natural Resources (DNR) completed baseline-monitoring
surveys in the summer of 2000 in the Plover River Watershed. Components of the
baseline monitoring included fishery surveys, habitat evaluations, macroinvertebrate
sampling and continuous temperature monitoring. The Plover River Group purchased
HOBO continuous temperature recorders, through a Rivers Protection Grant, to assist the
department with collecting temperature data. Continuous temperature monitoring was
completed at 15 sites in the watersheds on the Plover River, Little Plover River, Pike
Creek, North Creek and Aniwa Creek. A summary of temperature data for each site can
be found in Table 14.
Water temperature is an important limiting factor to trout populations. Suitable
water temperatures are required during spawning, egg and fry development and for carry-
over of adult fish. Studies have been completed to determine the optimal temperature
range for trout, however these optimal ranges vary between studies. The US Fish and
Wildlife Service developed Habitat Suitability Index models for trout and based on
reviews of these studies suggest the optimal temperature range for brook trout is 52-61
degrees Fahrenheit (11-16 C) and the maximum limiting temperature is 75 degrees
Fahrenheit (24 C). The optimal temperature range for brown trout is 54-66 degrees
Fahrenheit (12-19 C) and the maximum limiting temperature is 81 degrees Fahrenheit
(27.2 C).
Survey results indicate higher densities of brook and brown trout are found in the
upstream reaches of the Plover River (upstream of Hatley) where water temperatures
tended to be colder and spent the majority of the time within the optimal range for trout.
Water temperatures downstream of Hatley increased rapidly and spent much less time in
the optimal range for trout. Brook and brown trout numbers also declined in this reach.
Surveys completed at Pinery Road (downstream of Hatley) found an increase in trout
numbers and a decrease in water temperature. The improvement at this site is likely a
result of a cold water spring inputs approximately ¼ mile upstream of the road.
47
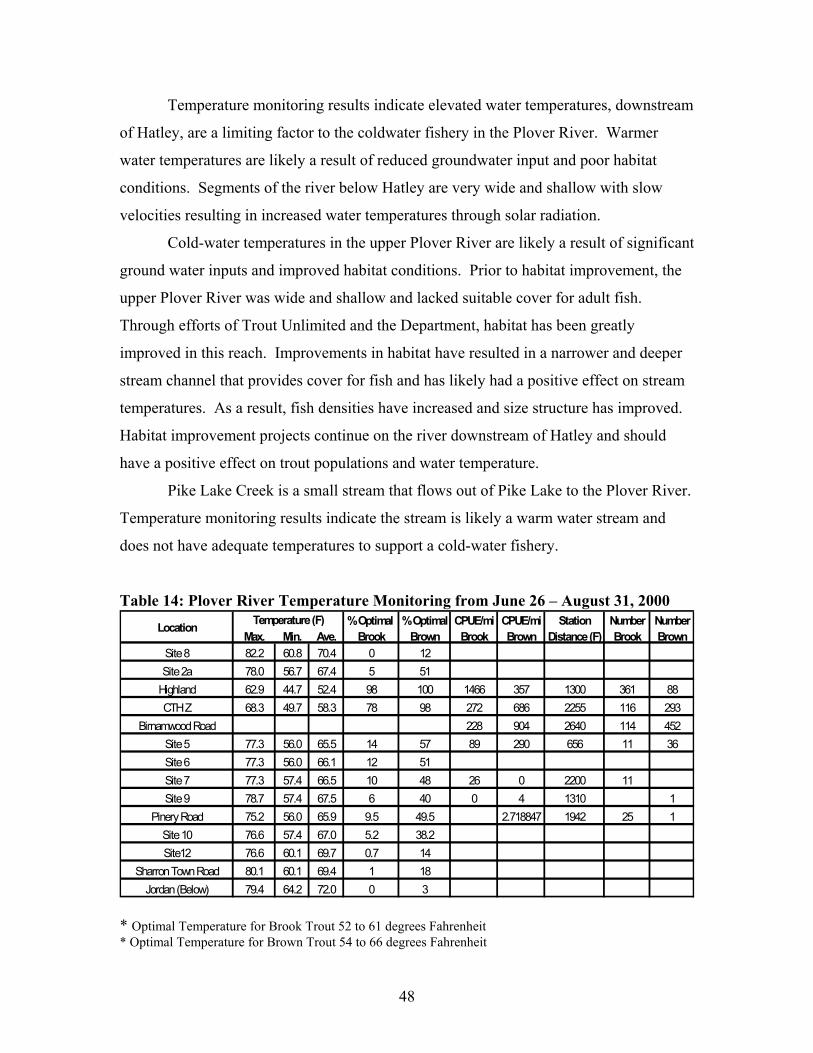
Temperature monitoring results indicate elevated water temperatures, downstream
of Hatley, are a limiting factor to the coldwater fishery in the Plover River. Warmer
water temperatures are likely a result of reduced groundwater input and poor habitat
conditions. Segments of the river below Hatley are very wide and shallow with slow
velocities resulting in increased water temperatures through solar radiation.
Cold-water temperatures in the upper Plover River are likely a result of significant
ground water inputs and improved habitat conditions. Prior to habitat improvement, the
upper Plover River was wide and shallow and lacked suitable cover for adult fish.
Through efforts of Trout Unlimited and the Department, habitat has been greatly
improved in this reach. Improvements in habitat have resulted in a narrower and deeper
stream channel that provides cover for fish and has likely had a positive effect on stream
temperatures. As a result, fish densities have increased and size structure has improved.
Habitat improvement projects continue on the river downstream of Hatley and should
have a positive effect on trout populations and water temperature.
Pike Lake Creek is a small stream that flows out of Pike Lake to the Plover River.
Temperature monitoring results indicate the stream is likely a warm water stream and
does not have adequate temperatures to support a cold-water fishery.
Table 14: Plover River Temperature Monitoring from June 26 – August 31, 2000
Optimal Temperature for Brook Trout 52 to 61 degrees Fahrenheit
% Optimal % Optimal CPUE/mi CPUE/mi Station Number NumberMax. Min. Ave. Brook Brown Brook Brown Distance (F) Brook Brown
Site 8 82.2 60.8 70.4 0 12Site 2a 78.0 56.7 67.4 5 51
Highland 62.9 44.7 52.4 98 100 1466 357 1300 361 88CTH Z 68.3 49.7 58.3 78 98 272 686 2255 116 293
Birnamwood Road 228 904 2640 114 452Site 5 77.3 56.0 65.5 14 57 89 290 656 11 36Site 6 77.3 56.0 66.1 12 51Site 7 77.3 57.4 66.5 10 48 26 0 2200 11Site 9 78.7 57.4 67.5 6 40 0 4 1310 1
Pinery Road 75.2 56.0 65.9 9.5 49.5 2.718847 1942 25 1Site 10 76.6 57.4 67.0 5.2 38.2Site12 76.6 60.1 69.7 0.7 14
Sharron Town Road 80.1 60.1 69.4 1 18Jordan (Below) 79.4 64.2 72.0 0 3
Location Temperature (F)
** Optimal Temperature for Brown Trout 54 to 66 degrees Fahrenheit
48

Aniwa Creek is a five-mile Class II trout stream that originates in Shawano
County from a small pond in Aniwa and flows to the upper Plover River in Marathon
County. Temperature monitoring results indicate water temperatures are not optimal for
brook trout but may be adequate from brown trout. A fishery survey near the mouth
found one brown trout.
49
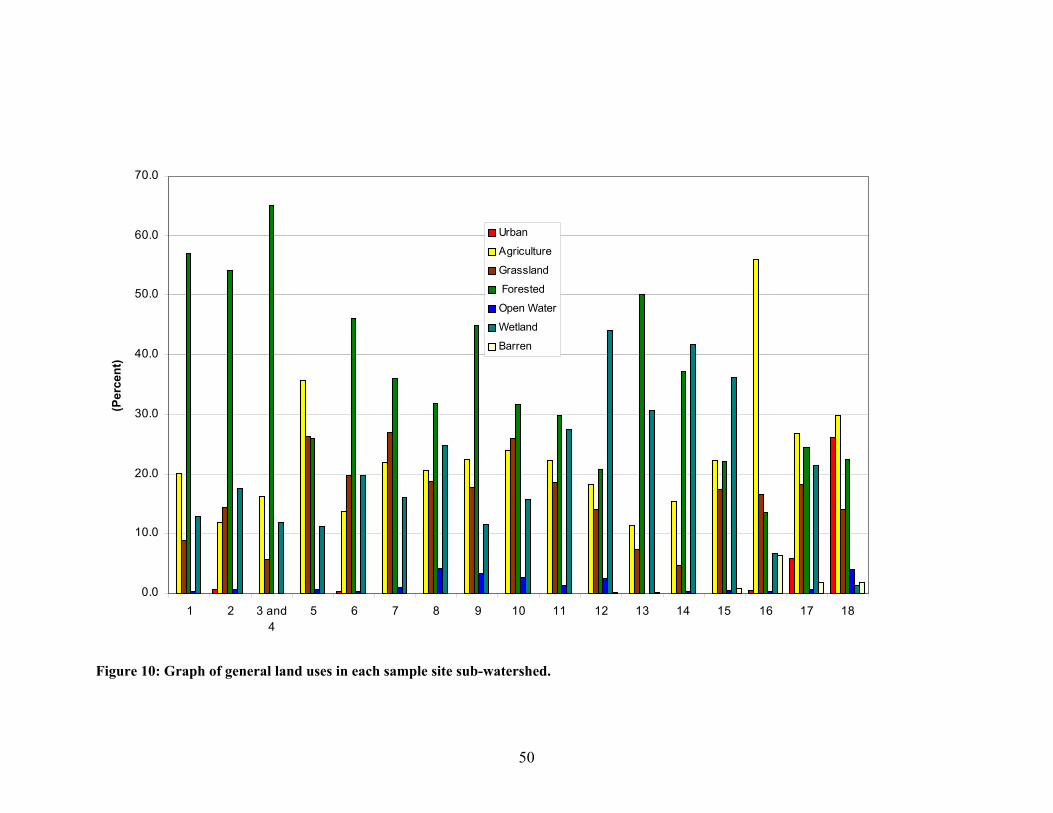
0.0
10.0
20.0
30.0
40.0
50.0
60.0
70.0
1 2 3 and4
5 6 7 8 9 10 11 12 13 14 15 16 17 18
(Per
cent
)
Urban
Agriculture
Grassland
Forested
Open Water
Wetland
Barren
Figure 10: Graph of general land uses in each sample site sub-watershed.
50

Baseflow Nitrate Concentrations: River AVG, MIN, & MAXTributary AVG Concentrations
0.00
2.00
4.00
6.00
8.00
10.00
12.00
14.00
16.00
18.00
20.00
1 2 3 4 5 6 7 8 9 10 11 12 13 14 15 16 17 18
Site Number
Con
cent
ratio
n ( m
g/l )
AVGMINMAXAVG TRIB
Figure 11: Average Baseflow Nitrate Concentrations for Sampling Sites
Figure 12: Average Event flow Nitrate Concentrations for Sampling Sites
Eventflow Nitrate Concentrations: River AVG, MIN, & MAXTributary AVG Concentrations
0.00
2.00
4.00
6.00
8.00
10.00
12.00
14.00
16.00
18.00
20.00
1 2 3 4 5 6 7 8 9 10 11 12 13 14 15 16 17 18
Site Number
Con
cent
ratio
n ( m
g/l )
AVGMINMAXAVG TRIB
51
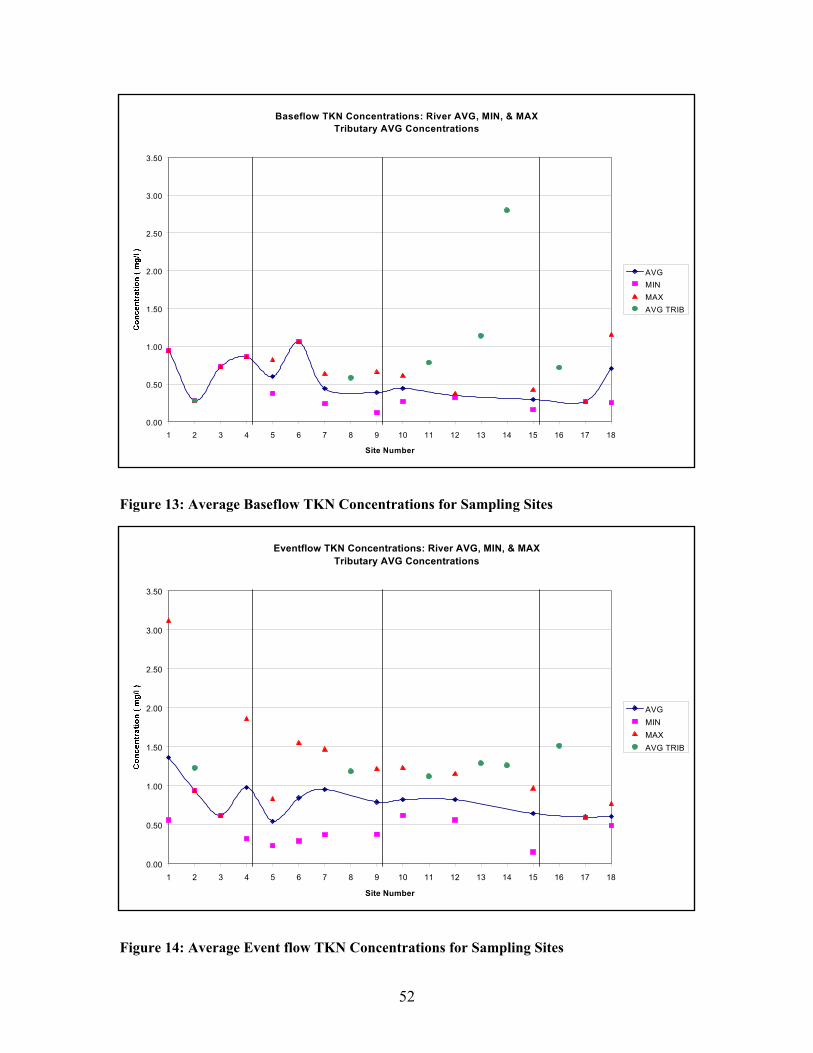
Baseflow TKN Concentrations: River AVG, MIN, & MAXTributary AVG Concentrations
0.00
0.50
1.00
1.50
2.00
2.50
3.00
3.50
1 2 3 4 5 6 7 8 9 10 11 12 13 14 15 16 17 18
Site Number
AVGMINMAXAVG TRIB
Figure 13: Average Baseflow TKN Concentrations for Sampling Sites
Eventflow TKN Concentrations: River AVG, MIN, & MAXTributary AVG Concentrations
0.00
0.50
1.00
1.50
2.00
2.50
3.00
3.50
1 2 3 4 5 6 7 8 9 10 11 12 13 14 15 16 17 18
Site Number
AVGMINMAXAVG TRIB
Figure 14: Average Event flow TKN Concentrations for Sampling Sites
52
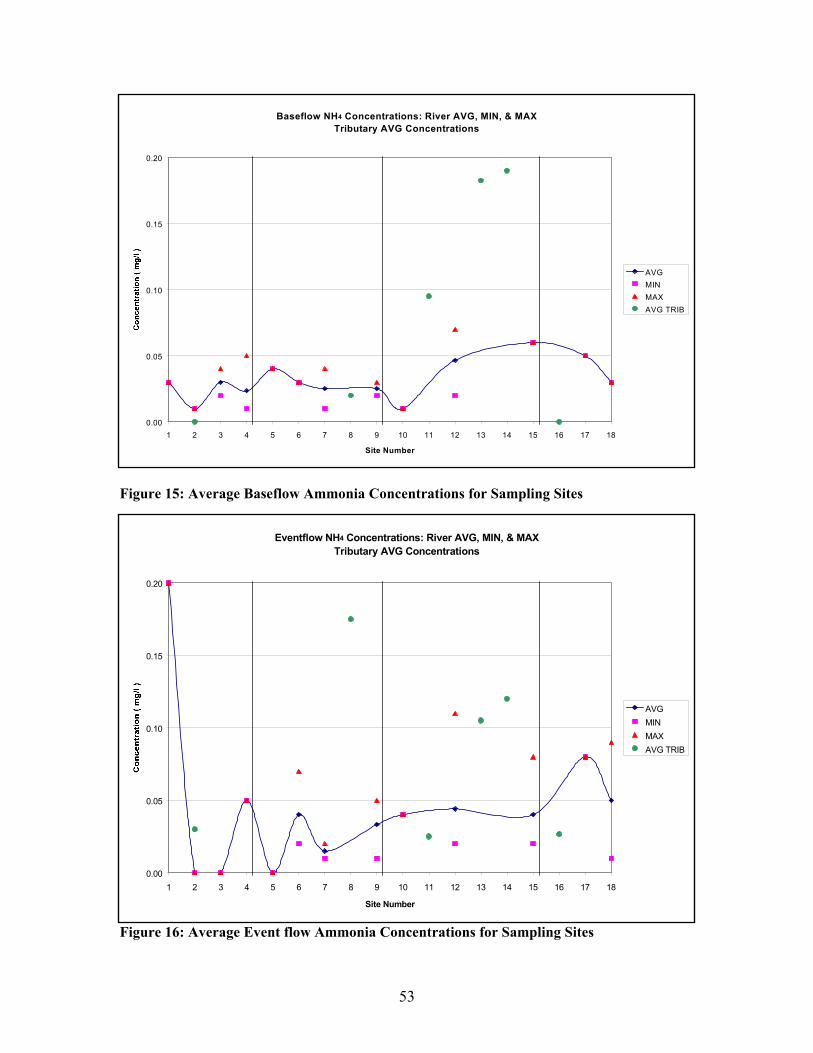
Baseflow NH4 Concentrations: River AVG, MIN, & MAXTributary AVG Concentrations
0.00
0.05
0.10
0.15
0.20
1 2 3 4 5 6 7 8 9 10 11 12 13 14 15 16 17 18
Site Number
AVGMINMAXAVG TRIB
Figure 15: Average Baseflow Ammonia Concentrations for Sampling Sites
Figure 16: Average Event flow Ammonia Concentrations for Sampling Sites
Eventflow NH4 Concentrations: River AVG, MIN, & MAXTributary AVG Concentrations
0.00
0.05
0.10
0.15
0.20
1 2 3 4 5 6 7 8 9 10 11 12 13 14 15 16 17 18
Site Number
AVGMINMAXAVG TRIB
53
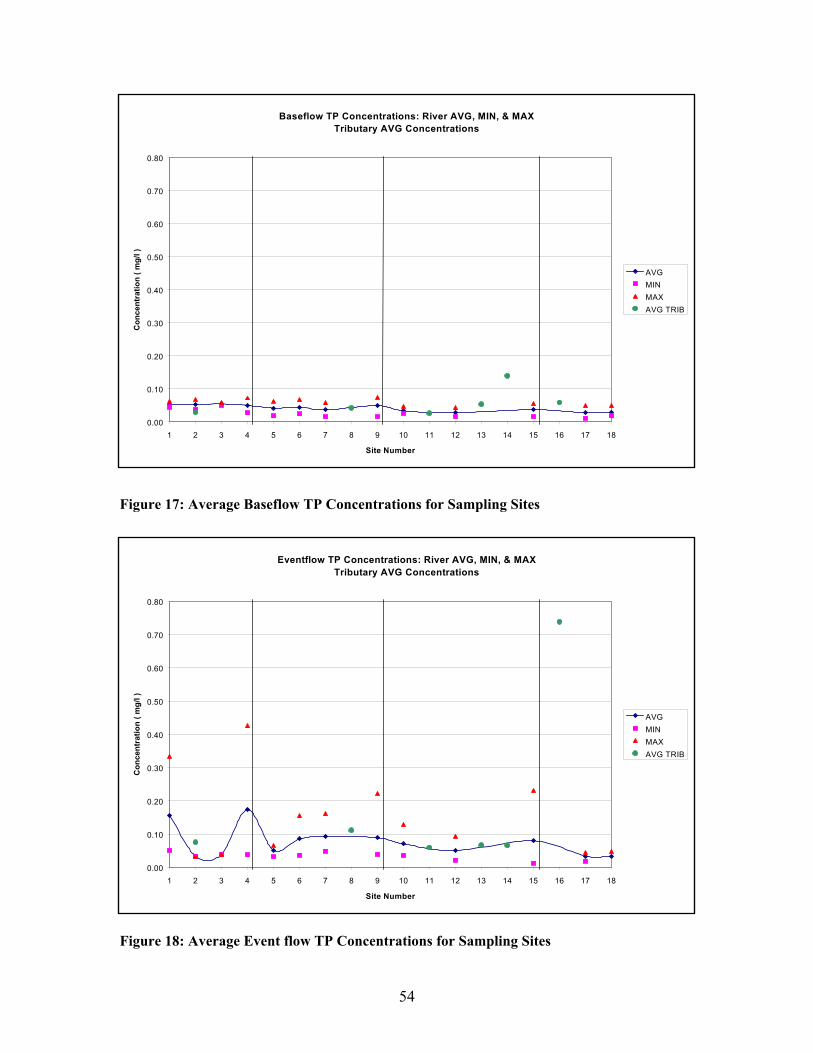
Baseflow TP Concentrations: River AVG, MIN, & MAXTributary AVG Concentrations
0.00
0.10
0.20
0.30
0.40
0.50
0.60
0.70
0.80
1 2 3 4 5 6 7 8 9 10 11 12 13 14 15 16 17 18
Site Number
Con
cent
ratio
n ( m
g/l )
AVGMINMAXAVG TRIB
Figure 17: Average Baseflow TP Concentrations for Sampling Sites
Eventflow TP Concentrations: River AVG, MIN, & MAXTributary AVG Concentrations
0.00
0.10
0.20
0.30
0.40
0.50
0.60
0.70
0.80
1 2 3 4 5 6 7 8 9 10 11 12 13 14 15 16 17 18
Site Number
Con
cent
ratio
n ( m
g/l )
AVGMINMAXAVG TRIB
Figure 18: Average Event flow TP Concentrations for Sampling Sites
54
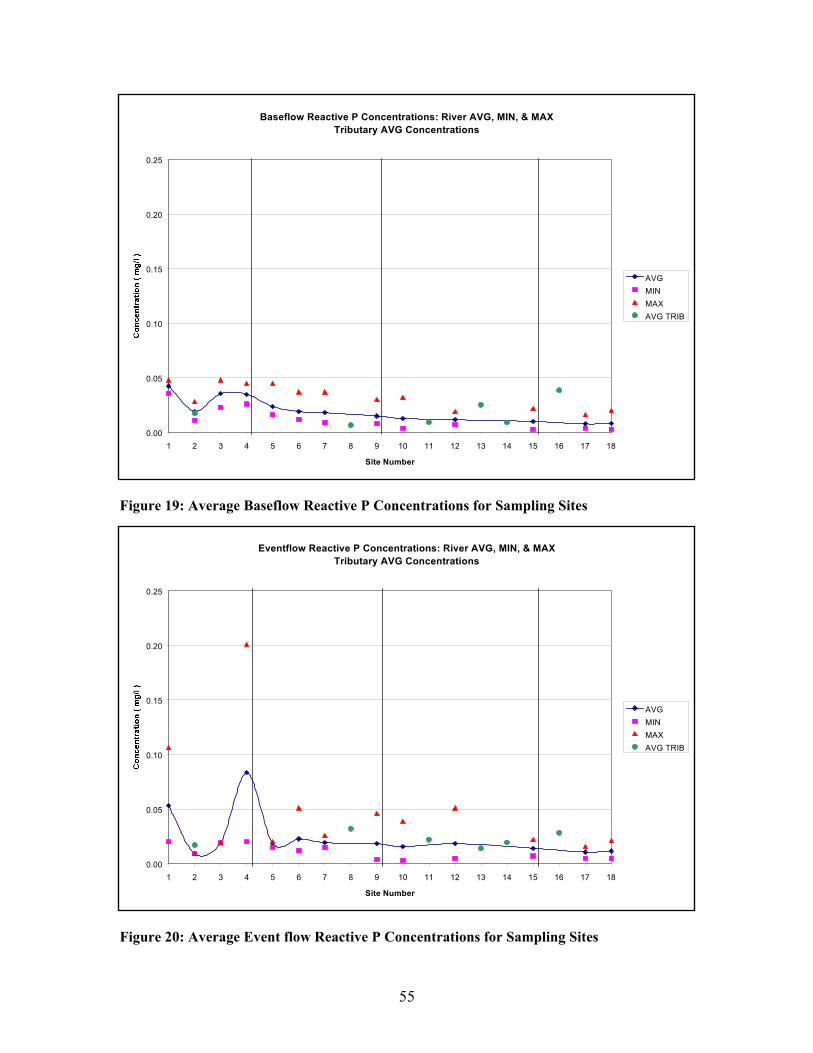
Baseflow Reactive P Concentrations: River AVG, MIN, & MAXTributary AVG Concentrations
0.00
0.05
0.10
0.15
0.20
0.25
1 2 3 4 5 6 7 8 9 10 11 12 13 14 15 16 17 18
Site Number
AVGMINMAXAVG TRIB
Figure 19: Average Baseflow Reactive P Concentrations for Sampling Sites
Eventflow Reactive P Concentrations: River AVG, MIN, & MAXTributary AVG Concentrations
0.00
0.05
0.10
0.15
0.20
0.25
1 2 3 4 5 6 7 8 9 10 11 12 13 14 15 16 17 18
Site Number
AVGMINMAXAVG TRIB
Figure 20: Average Event flow Reactive P Concentrations for Sampling Sites
55
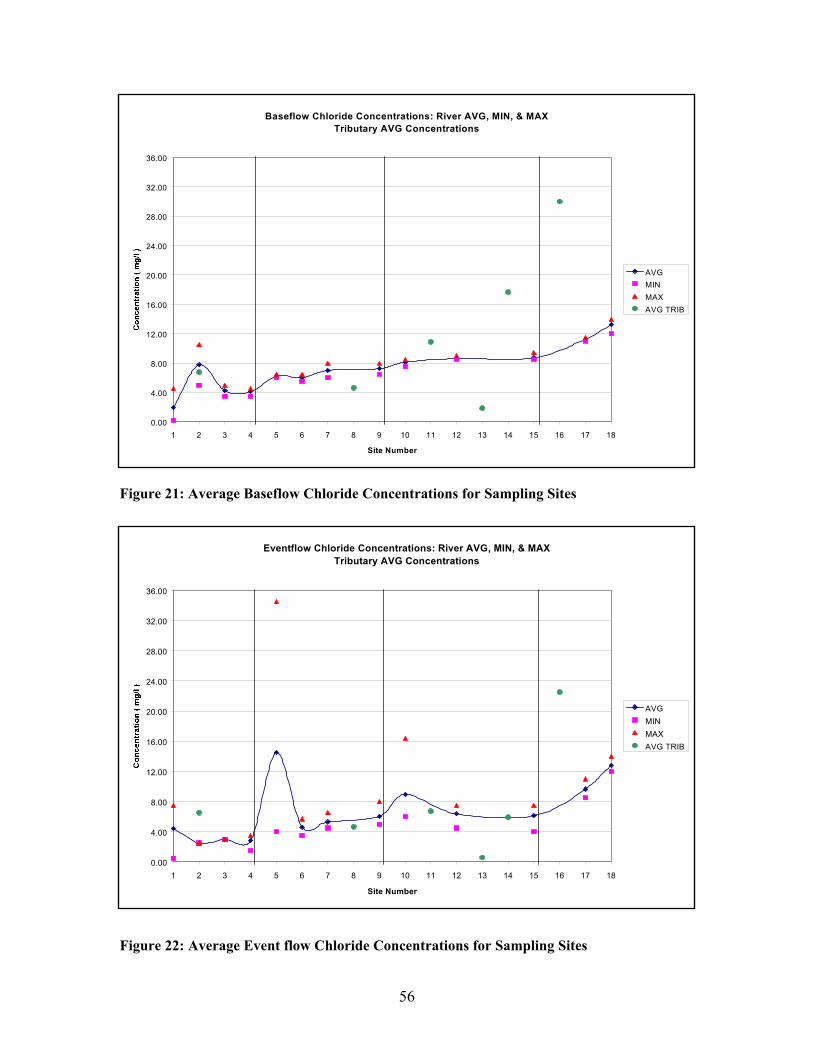
Baseflow Chloride Concentrations: River AVG, MIN, & MAXTributary AVG Concentrations
0.00
4.00
8.00
12.00
16.00
20.00
24.00
28.00
32.00
36.00
1 2 3 4 5 6 7 8 9 10 11 12 13 14 15 16 17 18
Site Number
AVGMINMAXAVG TRIB
Figure 21: Average Baseflow Chloride Concentrations for Sampling Sites
Eventflow Chloride Concentrations: River AVG, MIN, & MAXTributary AVG Concentrations
0.00
4.00
8.00
12.00
16.00
20.00
24.00
28.00
32.00
36.00
1 2 3 4 5 6 7 8 9 10 11 12 13 14 15 16 17 18
Site Number
AVGMINMAXAVG TRIB
Figure 22: Average Event flow Chloride Concentrations for Sampling Sites
56
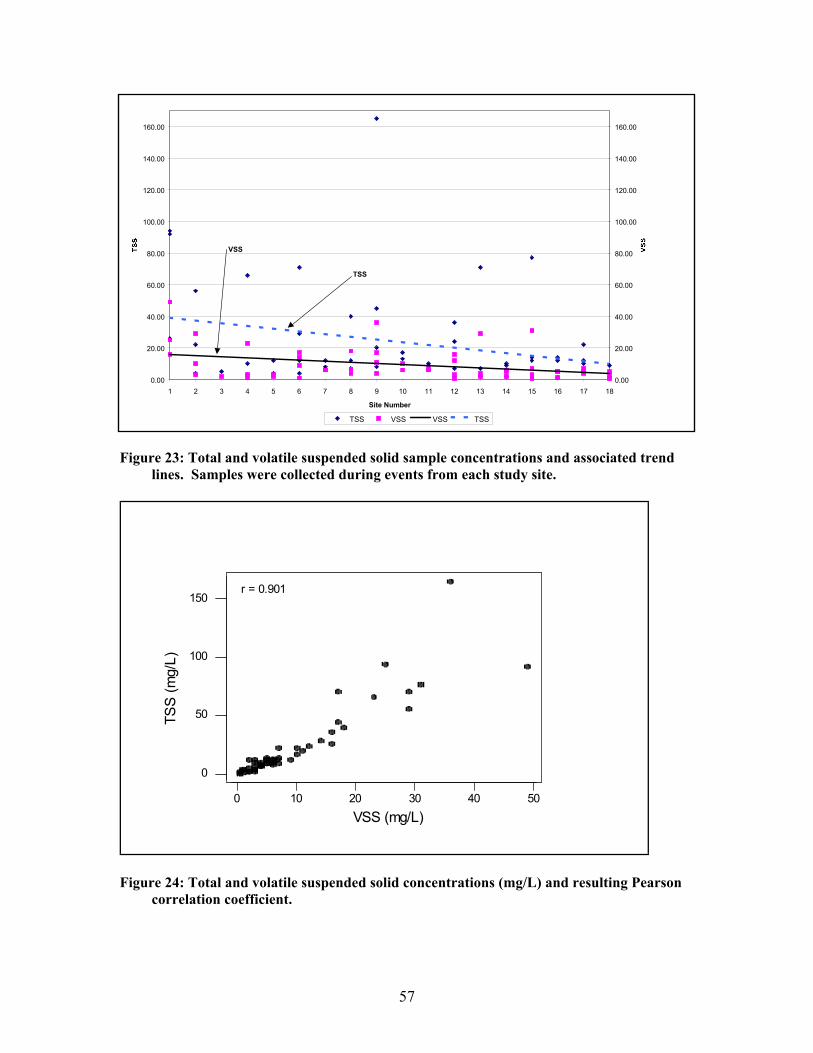
0.00
20.00
40.00
60.00
80.00
100.00
120.00
140.00
160.00
1 2 3 4 5 6 7 8 9 10 11 12 13 14 15 16 17 18
Site Number
0.00
20.00
40.00
60.00
80.00
100.00
120.00
140.00
160.00
TSS VSS VSS TSS
TSS
VSS
Figure 23: Total and volatile suspended solid sample concentrations and associated trend lines. Samples were collected during events from each study site.
0 10 20 30 40 50
0
50
100
150
VSS (mg/L)
TSS
(mg/
L)
r = 0.901
Figure 24: Total and volatile suspended solid concentrations (mg/L) and resulting Pearson
correlation coefficient.
57
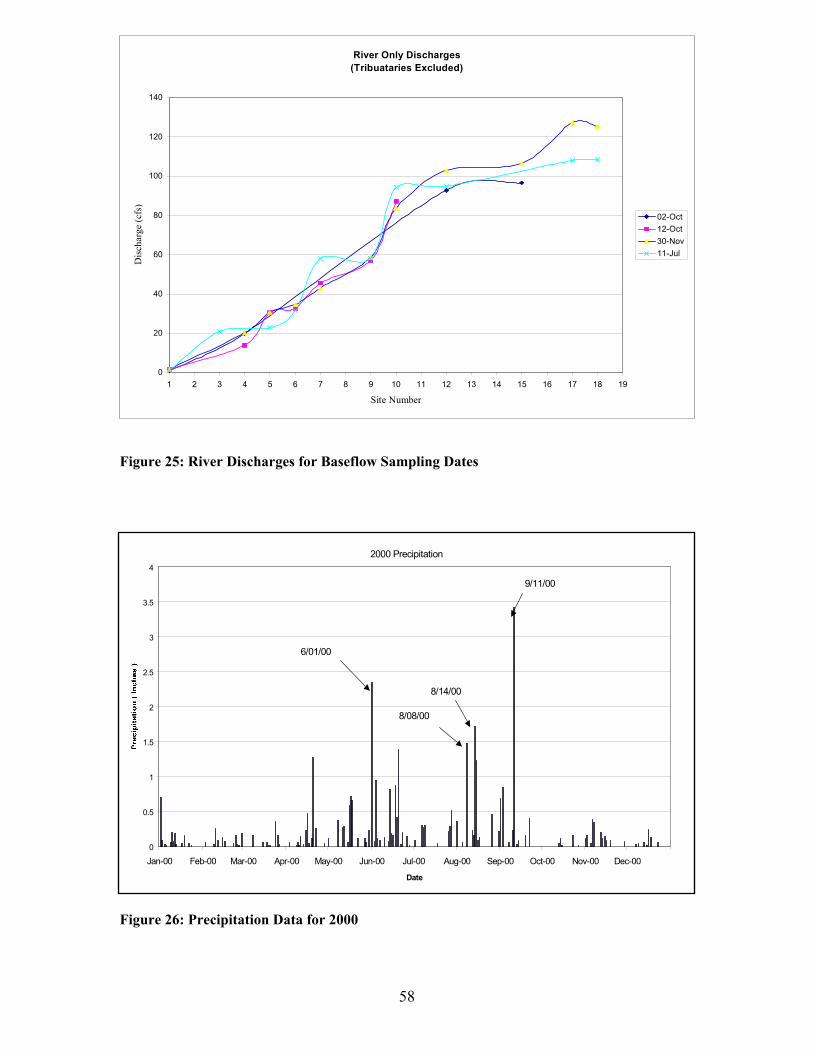
River Only Discharges (Tribuataries Excluded)
0
20
40
60
80
100
120
140
1 2 3 4 5 6 7 8 9 10 11 12 13 14 15 16 17 18 19
Site Number
Dis
char
ge (c
fs)
02-Oct12-Oct30-Nov11-Jul
Figure 25: River Discharges for Baseflow Sampling Dates
2000 Precipitation
0
0.5
1
1.5
2
2.5
3
3.5
4
Jan-00 Feb-00 Mar-00 Apr-00 May-00 Jun-00 Jul-00 Aug-00 Sep-00 Oct-00 Nov-00 Dec-00
Date
8/14/00
8/08/00
6/01/00
9/11/00
Figure 26: Precipitation Data for 2000
58

Nitrate Average Yield
0
5
10
15
1 2 3 4 5 6 7 8 9 10 11 12 13 14 15 16 17 18SITE NUMBER
NO
3 Yi
eld
(lbs
/ yea
r / a
c)
Figure 27: Average Nitrate Yield (lbs/year/acre) during Baseflow for each Sampling Site
Total Phosphorus Average Yield
0.00
0.05
0.10
0.15
0.20
0.25
0.30
0.35
0.40
0.45
0.50
1 2 3 4 5 6 7 8 9 10 11 12 13 14 15 16 17 18SITE NUMBER
Tota
l Pho
spho
rus
Yiel
d (lb
s/ y
ear/
ac)
Figure 28: Average Total Phosphorus Yield (lbs/year/acre) during Baseflow for each Sampling Site
59
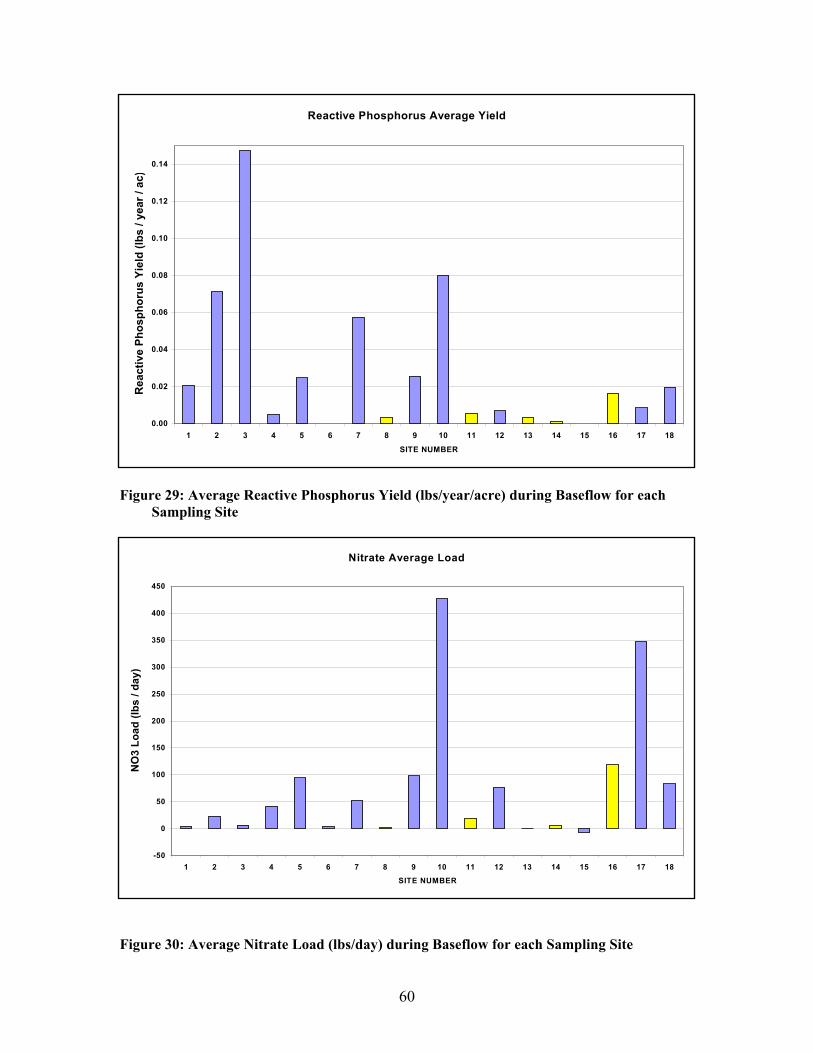
Reactive Phosphorus Average Yield
0.00
0.02
0.04
0.06
0.08
0.10
0.12
0.14
1 2 3 4 5 6 7 8 9 10 11 12 13 14 15 16 17 18SITE NUMBER
Rea
ctiv
e Ph
osph
orus
Yie
ld (l
bs /
year
/ ac
)
Figure 29: Average Reactive Phosphorus Yield (lbs/year/acre) during Baseflow for each Sampling Site
Nitrate Average Load
-50
0
50
100
150
200
250
300
350
400
450
1 2 3 4 5 6 7 8 9 10 11 12 13 14 15 16 17 18SITE NUMBER
NO
3 Lo
ad (l
bs /
day)
Figure 30: Average Nitrate Load (lbs/day) during Baseflow for each Sampling Site
60
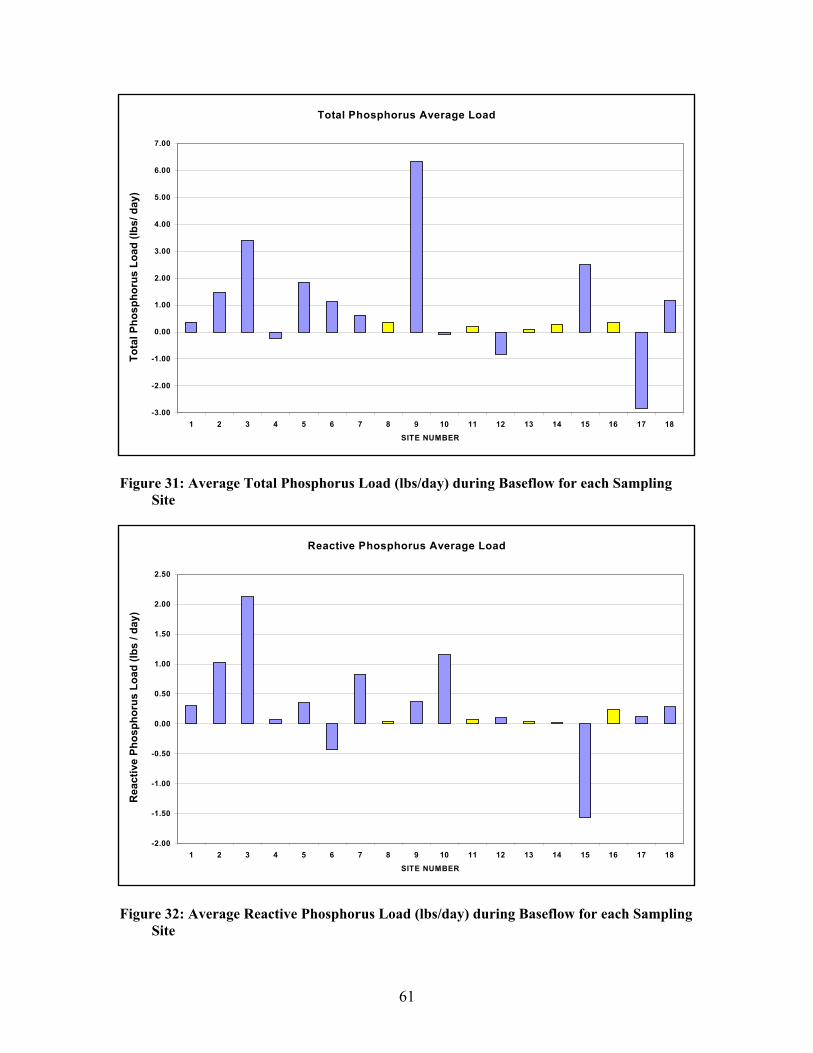
Total Phosphorus Average Load
-3.00
-2.00
-1.00
0.00
1.00
2.00
3.00
4.00
5.00
6.00
7.00
1 2 3 4 5 6 7 8 9 10 11 12 13 14 15 16 17 18SITE NUMBER
Tota
l Pho
spho
rus
Load
(lbs
/ day
)
Figure 31: Average Total Phosphorus Load (lbs/day) during Baseflow for each Sampling Site
Reactive Phosphorus Average Load
-2.00
-1.50
-1.00
-0.50
0.00
0.50
1.00
1.50
2.00
2.50
1 2 3 4 5 6 7 8 9 10 11 12 13 14 15 16 17 18SITE NUMBER
Rea
ctiv
e Ph
osph
orus
Loa
d (lb
s / d
ay)
Figure 32: Average Reactive Phosphorus Load (lbs/day) during Baseflow for each Sampling Site
61

62
Conclusions
• Inputs to the Plover River are found in three zones. The upper end receives the greatest amount of fecal coliform bacteria. The mid section receives some pesticides and nutrients, and the water quality in the lower end exhibits urban impacts.
• Water quality in the Plover River is in generally good condition. To maintain
current water quality status, efforts should be made to protect the watershed and river corridor.
• Areas resulting in higher concentrations of contaminants should be further
evaluated and practices should be implemented to reduce inputs whenever possible. This includes addressing high concentrations of nitrate in sub-watershed 17 and pesticides in sub-watershed 12.
• Inputs to the Plover River are entering the system during both runoff events and
through groundwater discharge.
• Nitrate and chloride concentrations in tributaries are similar for baseflow and runoff events. Concentrations are slightly lower during runoff indicating that groundwater is a major contributor of nitrate and chloride from fertilizer leaching.
• Moving from headwaters downstream, chloride concentrations show an
increasing trend. This is due to greater influence of agriculture and development in the watershed. The same is true for TKN and Total P in tributaries.
• Runoff samples from tributaries and the Plover River show fairly low
concentrations of measured chemistries compared to most watersheds in the Central Sands. Short flow paths, well-buffered streams; along with minimal surface runoff help keep the values low.
• Some concentrations in the lower part of the watershed are high enough to
support excessive growth of algae and aquatic plants.
• Water quality should be monitored routinely to determine if changes are occurring.
• Discharge should be measured above and below the Stevens Point municipal well field to determine how pumping is effecting the river flow.
• Total P and TKN values decrease moving down river in spite of nutrient impacts
from tributaries. The presence of impoundments that act as nutrient traps plus increasing aquatic plant growth in the slower moving river segments allow for nutrient removal from the system. It is possible that significant amounts of these
63
nutrients are building up in impoundment sediments that could be released in late fall or winter as plants die and decay.
• Temperature monitoring results indicate water temperatures on the Plover River
upstream of Hatley were adequate for trout survival and reproduction. Water temperatures downstream of Hatley increased and spent much less time in the optimal range for trout. Fishery surveys found the highest densities of trout upstream of Hatley where cold water temperatures and improved habitat conditions exist.
• Trout densities declined at stations downstream of Hatley and their occurrence was more inconsistent. Trout were generally found in areas of localized cold water inputs, which resulted in lower water temperatures. One such site was at Pinery Road where a spring pond approximately ¼ mile upstream apparently lowered water temperatures resulting in slightly higher densities of trout at the site.
• Habitat improvements on the Plover River upstream from Hatley likely had a
positive influence on stream temperatures. The river downstream of Hatley is relatively wide and shallow which promotes warmer water temperatures through solar radiation. Habitat improvement projects planned for this section of the river will create a narrower and deeper stream channel that will provide more cover and should reduce the effects of solar radiation.
• Temperature monitoring should be completed annually at selected sites to
evaluate the effects of habitat improvement on water temperature and to access natural variability.
64

Literature Cited Aichele, S. (USGS), R. Hill-Rowley (CAER), and M. Malone (CAER). Arsenic, Nitrate,
and Chloride in Groundwater, Oakland County, Michigan. 23 September 2000. http://mi.water.usgs.gov/reports/Aichele1.html.
Attig, John W., Maureen A. Muldoon. "Pleistocene Geology of Marathon County,
Wisconsin." 1989. Barker, James L. "Temporal Changes in Sulfate, Chloride, and Sodium Concentrations
in Four Eastern Pennsylvania Streams." USGS Water Resources Investigation Report 85-4074. 1986.
Boutt, David F. INTERPRETING THE IMPACTS OF LAND USE ON WATER
QUALITY USING GROUNDWATER FLOW AND TRANSPORT SIMULATIONS IN THE GRAND TRAVERSE BAY WATERSHED . 1999. http://www.nmt.edu/~dboutt/thesis_text.pdf.
Christensen, Vicotria G., Larry M. Pope. "Occurrence of Dissolved Soilds, Nutrients,
Atrazine, and Fecal Coliform Bacteria During Low Flow in the Cheney Reservior Watershed, South-Central Kansas, 1996." USGS Water - Resources Investigations Report 97-4153. 07 September 2000. http://ks.water.usgs.gov/Kansas/pubs/reports/wrir.97-4153.html.
Clayton, Lee. "Pleistocene Geology of Portage County, Wisconsin." . 1986. Conservation Technology Information Center. "Water Quality." Know Your Watershed.
26 November 2001. http://www.ctic.purdue.edu/KYW/TipsAndHints/Page16.html.
EPA. "Consumer Fact Sheet on Atrazine." EPA - Groundwater and Drinking water. 12
March 2001. http://www.epa.gov/safewater/dwh/c-soc/atrazine.html. EPA. "Turbidity and Total Solids." Volunteer Estuary Monitoring : A Methods Manual .
4 August 2000. http://www.epa.gov/owow/estuaries/monitor/chptr15.html.
65
Farag, Aida M, et al. "Water Quality in Three Creeks in the Backcountry of Grand Teton National Park, USA." Journal of Freshwater Ecology. 16 vols. March 2001.
Fiala, William; David Buss, Sam Hagedorn, Kim Kidney, and John Werlein. "Soil
Survey of Marathon County, Wisconsin." Sept. 1989. Franson, Mary Ann (Editor). Standard Methods for the Examination of Water and
Wastewater. 19 ed. 1995. Greenberg, J.K., B.A. Brown. "Bedrock Geology of Portage County, Wisconsin." .
1986. Hamel, Kathy. "A Citizen's Guide to Understanding and Monitoring Lakes and
Streams." Washington State Department of Ecology: Water Quality Program. 30 October 2001. http://www.ecy.wa.gov/programs/wq/plants/management/joysmanual/fecalcoliform.html.
LaBerge, Gene, P.E. Meyers. "Bedrock Geology of Marathon County, Wisconsin." .
1983. Lauhn-Jensen, Kristin. "Swim At Your Own Risk." Conscious Choices: The Journal of
Ecology & Natural Living July 1995. Lippelt, I.D. "Water Table Elevation Map of Marathon County." . 1981. Lippelt, I.D. "Water Table Elevation Map of Portage County." . 1981 Lyden, Tiffany. "McDill Pond Lake Management Plan." . Feb. 2001. Environmental
Task Force Program, Univ. Wisconsin-Stevens Point. Murphy, Sheila . "BASINS: Information on Water Quality Parameters." Boulder Creek
Watershed COB Water QualityMonitoring Sites. 13 September 2000. http://bcn.boulder.co.us/basin/data/NUTRIENTS/info/.
66
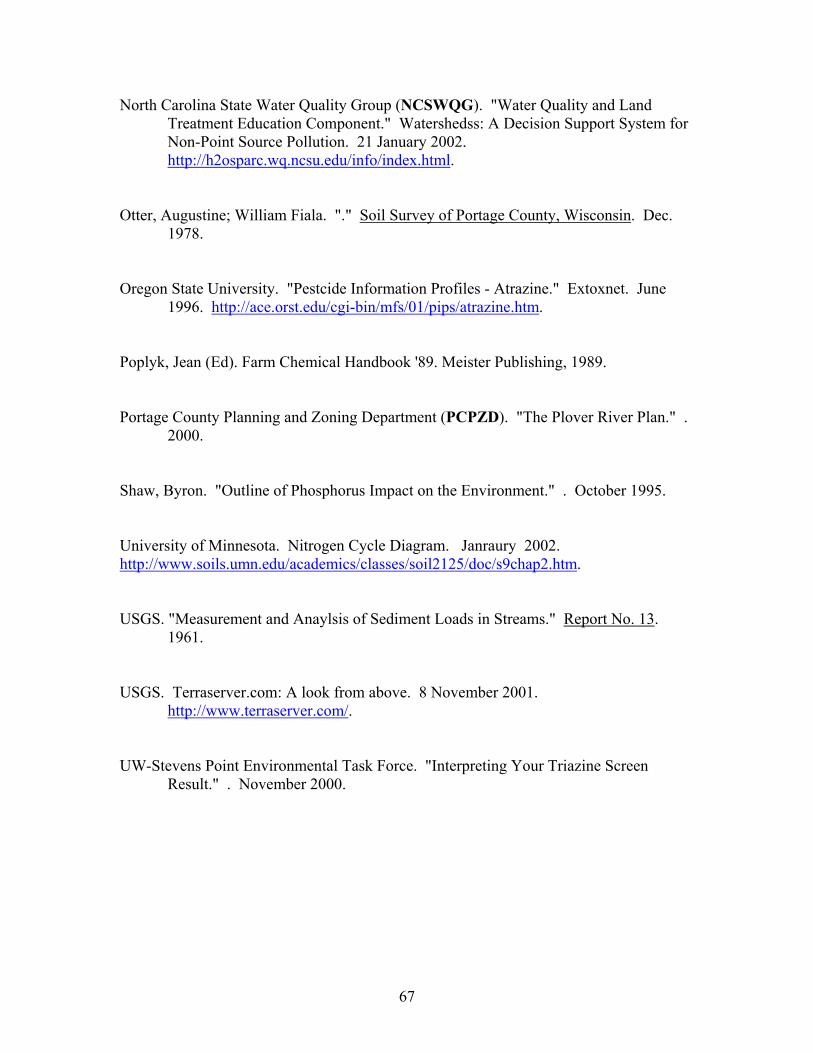
North Carolina State Water Quality Group (NCSWQG). "Water Quality and Land Treatment Education Component." Watershedss: A Decision Support System for Non-Point Source Pollution. 21 January 2002. http://h2osparc.wq.ncsu.edu/info/index.html.
Otter, Augustine; William Fiala. "." Soil Survey of Portage County, Wisconsin. Dec.
1978. Oregon State University. "Pestcide Information Profiles - Atrazine." Extoxnet. June
1996. http://ace.orst.edu/cgi-bin/mfs/01/pips/atrazine.htm. Poplyk, Jean (Ed). Farm Chemical Handbook '89. Meister Publishing, 1989. Portage County Planning and Zoning Department (PCPZD). "The Plover River Plan." .
2000. Shaw, Byron. "Outline of Phosphorus Impact on the Environment." . October 1995. University of Minnesota. Nitrogen Cycle Diagram. Janraury 2002. http://www.soils.umn.edu/academics/classes/soil2125/doc/s9chap2.htm. USGS. "Measurement and Anaylsis of Sediment Loads in Streams." Report No. 13.
1961. USGS. Terraserver.com: A look from above. 8 November 2001.
http://www.terraserver.com/. UW-Stevens Point Environmental Task Force. "Interpreting Your Triazine Screen
Result." . November 2000.
67

APPENDICES
APPENDIX A-WATER CHEMISTRY DATA
APPENDIX B-BASEFLOW WATER CHEMISTRY-AVERAGE, MIN, MAX
APPENDIX C-EVENT FLOW WATER CHEMISTRY-AVERAGE, MIN, MAX
APPENDIX D-LAND USES BY SUB-WATERSHED
APPENDIX E-FECAL COLIFORM
APPENDIX F-LOAD AND YIELD NITRATE, REACTIVE P, TOTAL P
APPENDIX G-PRECIPITATION
APPENDIX H-DISCHARGE
68