water quality related macroinvertebrate community
TRANSCRIPT

Water quality related macroinvertebrate community responsesto environmental gradients in the Portoviejo River (Ecuador)
Thi Hanh Tien Nguyen1,2, Pieter Boets1,3*, Koen Lock1, Marie Anne Eurie Forio1,Wout Van Echelpoel1, Jana Van Butsel1, Juan Antonio Duenas Utreras1,4, Gert Everaert1,Luis Elvin Dominguez Granda5, Thu Huong Thi Hoang6 and Peter L.M. Goethals1
1 Laboratory of Environmental Toxicology and Aquatic Ecology, Ghent University, Campus Coupure – Building F – 2nd floor,Coupure Links 653, B-9000 Ghent, Belgium
2 Research Institute for Aquaculture No1, Dinh Bang, Tu Son, Bac Ninh, Vietnam3 Provincial Centre of Environmental Research, Godshuizenlaan 95, B-9000 Ghent, Belgium4 Departamento de Ingenierıa Industrial, Universidad Tecnica de Manabı, Av. Universitaria y Che Guevara,130104 Portoviejo, Ecuador
5 Centro del Agua y Desarrollo Sustentable, Escuela Superior Politecnica del Litoral (ESPOL), Campus Gustavo Galindo, Km. 30.5Via Perimetral, P.O. Box 09-01-5863, Guayaquil, Ecuador
6 Hanoi University of Science and Technology, School of Environmental Science and Technology, No 1 Dai Co Viet, Hanoi, Vietnam
Received 6 October 2016; Accepted 22 February 2017
Abstract – The Portoviejo River, located in the central western part of Ecuador, has been heavily impacted
by damming, intensive agriculture and untreated wastewater discharge. Unfortunately, detailed informationon the water quality and the ecological status of the Portoviejo River is not available, inhibiting decision-making and the development of water management plans. Therefore, the aims of this study were (1) to assessthe ecological water quality, (2) to investigate the point along the environmental gradient where the most
significant change in macroinvertebrate community occurs and (3) to find potential macroinvertebrate taxathat significantly change in abundance and frequency of occurrence along the Portoviejo River. To this end,macroinvertebrate and physico-chemical data were collected and hydro-morphological conditions were re-
corded at 31 locations during the dry season of 2015. The results showed that the ecological water quality ofthe sampling sites ranged from good to bad. In addition, the Threshold Indicator Taxa ANalysis was used toexamine changes in macroinvertebrate communities and revealed significant community change points for
sensitive taxa declining at a conductivity value of 930 (mS.cmx1) and nitrate-nitrogen concentrations of0.6 mg.Lx1. In addition, the thresholds estimated for tolerant taxa were set at a conductivity value of1430 mS.cmx1 and nitrate-nitrogen concentration of 2.3 mg.L. Atyidae, Corbiculidae, Thiaridae, Acari,
Baetidae and Leptohyphidae can be considered indicator taxa, showing shifts in the community. This studysuggests that values of conductivity and nitrate-nitrogen concentrations should not exceed the threshold levelsin order to protect macroinvertebrate biodiversity in the Portoviejo River.
Key words: Macroinvertebrates / ecological water quality / threshold indicator taxa analysis /portoviejo river
Introduction
Rivers are one of the most important freshwaterresources for human life (Chapman, 1996). They providemany ecosystem services such as a source of drinkingwater, irrigation of croplands, industrial and municipalwater supply, waste disposal, fishing, sightseeing, shipping
and an aesthetic value (Chapman, 1996; Pan et al., 2012).However, the increase in population and human activitiesoften leads to habitat degradation, poor water quality(Kibena et al., 2014) and reduced ecosystem services (Panet al., 2012) as rivers are highly vulnerable to anthropo-genic activities (e.g., urbanization, changes in land use,intensification of agriculture) (Bredenhand and Samways,2008). For example, the construction of a dam changes thehydrological conditions, and modifies the flow regime and*Corresponding author: [email protected]
Article published by EDP Sciences
Ann. Limnol. - Int. J. Lim. 53 (2017) 203–219 Available online at:� EDP Sciences, 2017 www.limnology-journal.orgDOI: 10.1051/limn/2017007
sediment transportation (Takao et al., 2008), thusstrongly influencing aquatic ecosystems (Zhang et al.,2010).
Water pollution, erosion, alterations in stream hydro-logy and changing habitat structure are known to affectfreshwater organisms (Allan, 2004). Various types ofaquatic organisms (e.g., fish and macroinvertebrates) havebeen used as indicators of water quality and biologicalintegrity. Among them, macroinvertebrates are consideredto be good indicators of overall ecosystem health (WaterFramework Directive, 2002). Their presence, abundanceand activities are a representation of water quality andmay effectively reveal the ecological status of the ecosys-tem (Bredenhand and Samways, 2008). Moreover, macro-invertebrates reflect stream conditions and integrate hu-man and natural stressors over a long period of time, thusgiving a good representation of the quality of theirsurroundings (Cairns and Pratt, 1993). Therefore, macro-invertebrates have been used for freshwater monitoringand assessment for several decades (Smith et al., 2007).The information about the ecological sensitivities of eachmacroinvertebrate taxon has been used to developbiological indices (e.g., biological monitoring workingparty (BMWP) (Armitage et al., 1983)) for the assessmentof water quality. Afterwards, the English BMWP indexwas adapted to specific countries or regions such as theBMWP for Colombia (Perez, 2003a). The BMWP-Colombia index has already been applied in Ecuador tostudy the ecological water quality in the Guayas riverbasin (Damanik-Ambarita et al., 2016) and Chaguanariver basin (Dominguez-Granda et al., 2011).
In Ecuador, water quality issues, aquatic ecosystemsand ecosystem services received limited attention. To ourknowledge, standardized sampling procedures and envir-onmental monitoring programs are not available to assesswater quality, resulting in limited availability of informa-tion on the physical, chemical and ecological status ofEcuadorian rivers (Andres, 2009; Nolivos et al., 2015).However, water managers and political leaders need tomanage water to meet human requirements, to identifyand protect endangered species and to support freshwaterecosystems (Richter et al., 2003). Therefore, thresholdidentification is needed for the development of environ-mental standards for river water quality. However, whenreviewing the criteria for preservation of aquatic lifeestablished for the Ecuadorian environment, most of thecriteria were found to be defined only for heavy metals(e.g., Ag, Pb) and water quality standards for importantvariables (e.g., conductivity) were missing.
Portoviejo city is considered as the center of economic,political and cultural events in the province of Manabı.During recent years, high pressure has been exerted onwater quality and natural ecosystems in the PortoviejoRiver basin driven by the growing population andincreasing anthropogenic activities such as intensiveagriculture and damming. Pollution of the PortoviejoRiver causes scarcity of clean water for domestic con-sumption and irrigation, loss of fishing grounds (Parragaand Aguirre, 2010) and strongly affects biodiversity and
mangrove ecosystems in the Portoviejo River Estuary(ACBIO, 2012). However, to our knowledge, no researchhas been carried out on the assessment of water qualityand macroinvertebrate communities in the PortoviejoRiver. Therefore, the main objective of this study was toassess the ecological water quality of the Portoviejo Riverbased on benthic macroinvertebrate communities. Morespecifically, we investigated shifts in macroinvertebratecommunities along measured physico-chemical gradientsand identified potential macroinvertebrate indicator taxathat significantly change in abundance and frequency ofoccurrence due to water quality degradation. The thresh-olds relevant to the macroinvertebrate communities’response in the Portoviejo River will be particularlyuseful for early warning in Ecuadorian rivers. Thisinformation could be used to establish priorities forconservation efforts for the Portoviejo River and othersimilar river basins, where water resources are facingmultiple threats.
Materials and methods
Study area
Portoviejo is the capital of the Province of Manabı(Ecuador) and is situated 30 km from the Pacific coast.The Portoviejo River basin, with a total area of 2231 km2
and a river length of 132 km (Perez, 2003b), is locatedalong the coast in the western part of Ecuador (US ArmyCorps of Engineers, 1998). The river provides water to700 000 inhabitants for domestic use, agriculture, recrea-tion and other purposes (Perez, 2003b). The PortoviejoRiver basin is one of the most productive farming regionsin Ecuador, with production of bananas, mangoes andother tropical fruits, tomatoes, onions, peppers, coffee andespecially cattle and fish (http://www.gutenberg.us 2016).The Poza Honda dam is located 30 km upstream fromthe city of Portoviejo and started operating in 1971. ThePoza Honda reservoir has a water storage capacity of100 million m3 (US Army Corps of Engineers, 1998),a maximum surface area of approximately 607.5 ha and amaximum depth of 37.3 m. The reservoir faces eutrophica-tion problems due to intensive agriculture and livestock(Perez, 2004) in the surrounding area.
Portoviejo is located at low latitude and has asemi-arid, hot climate. The seasons are well defined;rainfall is concentrated in the period December–May,in which 90% of the annual rainfall occurs and thedry season months are June–November. The meantemperature and monthly rainfall of the region varybetween 24 and 29 xC and 2–115 mm, respectively (http://www.portoviejo.climatemps.com “http://www.gutenberg.us,2016 Portoviejo.http://www.gutenberg.us/article/WHEBN0001827357/Portoviejo (in Spanish, assesseddate 12.02.2016”). Land use in the basin consists mostly ofarable land and plantations (onions, bananas and othertropical fruits), with urban and semi-urban areas.
T. H. T. Nguyen et al..: Ann. Limnol. - Int. J. Lim. 53 (2017) 203–219204
Sampling and assessment methods
Description of sampling sites
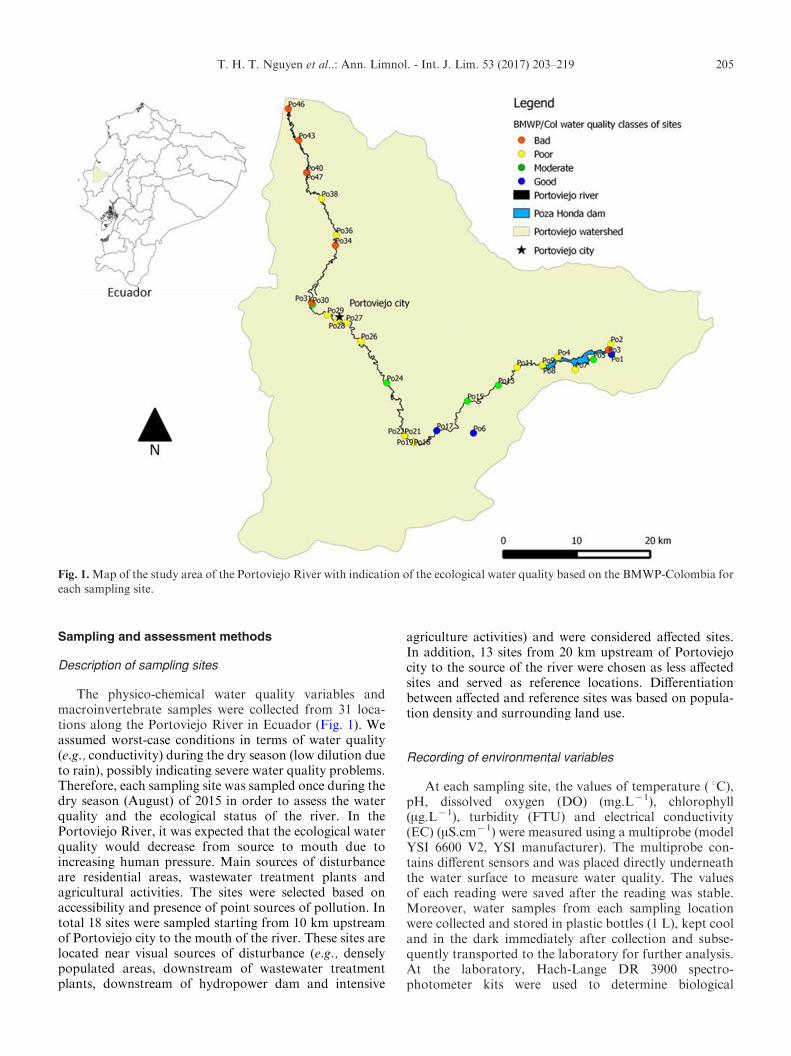
The physico-chemical water quality variables andmacroinvertebrate samples were collected from 31 loca-tions along the Portoviejo River in Ecuador (Fig. 1). Weassumed worst-case conditions in terms of water quality(e.g., conductivity) during the dry season (low dilution dueto rain), possibly indicating severe water quality problems.Therefore, each sampling site was sampled once during thedry season (August) of 2015 in order to assess the waterquality and the ecological status of the river. In thePortoviejo River, it was expected that the ecological waterquality would decrease from source to mouth due toincreasing human pressure. Main sources of disturbanceare residential areas, wastewater treatment plants andagricultural activities. The sites were selected based onaccessibility and presence of point sources of pollution. Intotal 18 sites were sampled starting from 10 km upstreamof Portoviejo city to the mouth of the river. These sites arelocated near visual sources of disturbance (e.g., denselypopulated areas, downstream of wastewater treatmentplants, downstream of hydropower dam and intensive
agriculture activities) and were considered affected sites.In addition, 13 sites from 20 km upstream of Portoviejocity to the source of the river were chosen as less affectedsites and served as reference locations. Differentiationbetween affected and reference sites was based on popula-tion density and surrounding land use.
Recording of environmental variables
At each sampling site, the values of temperature ( xC),pH, dissolved oxygen (DO) (mg.Lx1), chlorophyll(mg.Lx1), turbidity (FTU) and electrical conductivity(EC) (mS.cmx1) were measured using a multiprobe (modelYSI 6600 V2, YSI manufacturer). The multiprobe con-tains different sensors and was placed directly underneaththe water surface to measure water quality. The valuesof each reading were saved after the reading was stable.Moreover, water samples from each sampling locationwere collected and stored in plastic bottles (1 L), kept cooland in the dark immediately after collection and subse-quently transported to the laboratory for further analysis.At the laboratory, Hach-Lange DR 3900 spectro-photometer kits were used to determine biological
Fig. 1.Map of the study area of the Portoviejo River with indication of the ecological water quality based on the BMWP-Colombia foreach sampling site.
T. H. T. Nguyen et al..: Ann. Limnol. - Int. J. Lim. 53 (2017) 203–219 205
oxygen demand (BOD5) (mg.Lx1), total phosphorus(TP) (mg.Lx1), orthophosphate-phosphorus (oPO4
3x)(mg.Lx1), ammonium-nitrogen (NH4
+) (mg.Lx1), nitrate-nitrogen (NO3
x) (mg.Lx1), nitrite-nitrogen (NO2x)
(mg.Lx1), total nitrogen (TN) (mg.Lx1) and total organiccarbon (TOC) (mg.Lx1).
The elevation of sampling sites was measured usingGlobal Positioning System (GPS) equipment (GarminGPS). Stream velocity was measured with a handheldflow meter (HFA, Hontzsch, Waiblingen, Germany). Thesurrounding land use was visually estimated at bothbanks for a stretch of 100r10 m (the point where thewater sample was taken was considered as the centre).The surrounding land use was divided into five classes(shrubs/grasses, orchard, residential/urban areas, arableland (suitable for farming) and forest). The type ofdominant substrate was visually assessed at each siteand divided into five classes (silt or clay, sand, gravel,cobble and boulder). The sludge layer was classified intoabsent, <5, 5–20 and >20 cm. Six classes of pool-rifflepattern were distinguished (structural changes, absent,poorly developed, moderately developed, well developedand pristine). The percentage of water hyacinth cover wasvisually estimated from the bank along a transect of100 m. The site where water samples were taken wasconsidered as the centre. The vegetation cover classeswere divided as follows (based on the Braun-Blanquetcover/abundance scale): 0=non-vegetated/absent,1=1–5% (rare), 2=5–25% (occasional), 3=25–50%(frequent), 4=50–75% (common) and 5=75–100%(abundant). Classes rather than exact values for cover ofvegetation were used as this yields more reliable measures(Ellenberg and Mueller-Dombois, 1974). The hydro-morphological characteristics of the sampling sites weredetermined based on field inspection and completed persampling location by a standard field protocol. The fieldprotocol was modified from the Australian RiverAssessment System (AUSRIVAS) physical assessmentprotocol (AUSRIVAS, 1994) and UK and Isle of ManRiver Habitat Quality (Raven et al., 1998).
Sampling of macroinvertebrates
Samples of macroinvertebrates were collected fromeach sampling site immediately after determining thephysico-chemical water quality variables. Macro-invertebrates were collected with a standard hand netconsisting of a metal frame holding a conical net (mesh-size 300 mm) at the same sites where water quality wasmeasured. Macroinvertebrates were collected over 5 minactive sampling, including all different microhabitatspresent at the sampling site (Gabriels et al., 2010). Sampleswere sieved (500 mm mesh size) in the laboratory andsorted in white trays. Macroinvertebrates from eachlocation were placed in separate small plastic vialscontaining 80% ethanol for preservation. After sorting,organisms were counted and identified under a stereo-microscope. Macroinvertebrates were identified to familylevel using the identification keys developed by
Domınguez and Fernandez (2009) for two reasons. Firstly,previous research has shown that using biotic indicesbased on family level provides sufficient information toassess biological water quality (Dominguez-Granda et al.,2011; Mereta et al., 2013; Everaert et al., 2014). Secondly,because of practical implications, we could only identifyup to family level as there are no detailed keys available tolower taxonomic levels.
Calculation of macroinvertebrate metrics
The biotic macroinvertebrate index BMWP-Colombiawas calculated according to the method proposed byZuniga and Cardona (2009). Each macroinvertebratetaxon received a score that reflects its susceptibility topollution, where pollution-intolerant taxa receive highscores, whereas pollution-tolerant taxa were given lowscores (Zuniga and Cardona, 2009). Eight taxa did notappear in the original index and were considered inthe BMWP-Colombia index calculation, being Acari(Actinotrichida), Cambaridae (Decapoda), Corbiculidae(Veneroidea), Gerridae (Hemiptera), Littorinidae(Neotaenioglossa), Mysidae (Mysida), Ochteridae(Hemiptera) and Spionidae (Polychaeta). The BMWP-Colombia was calculated per site based on a summationof all tolerance scores of the macroinvertebrate taxapresent. The total score for each site indicated ecologicalwater quality, with categories ranging from very bad(0–15), bad (16–35), poor (36–60), moderate (61–100) togood (>100). To obtain a more complete understandingof the community structure, species abundances werecalculated and taxonomic richness (number of taxa) andShannon–Wiener Diversity Index (Shannon and Wiener,1949) were computed using the Vegan package (Oksanenet al., 2016) for each sampling site.
Data analysis
All statistical analyses were done using R software(version 3.2.3) (R Core Team, 2015). The protocol fordata exploration as described by Zuur et al. (2010) wasused to avoid common statistical problems related tooutliers and correlated variables. Prior to the actual dataanalysis, the initial data set was tested for outliersand correlations between explanatory variables. Onesampling location with five extremely high and lowvalues compared to the majority of observations (e.g.,conductivity=49384 mS.cmx1, TN=below detectionlimit, elevation=x4 m a.s.l.), was discarded from theanalysis as high conductivity indicated saline conditions.
Spearman’s rank correlation coefficient was used toexplore the relationship among physico-chemical variablesand the BMWP-Colombia ecological water quality index.A Mann–Whitney U-test was used to compare physico-chemical variables between more affected and less affectedsampling sites in order to test for significant differences inenvironmental variables between these sites. Scatter plotswere made to visualize the relationship between the
T. H. T. Nguyen et al..: Ann. Limnol. - Int. J. Lim. 53 (2017) 203–219206

BMWP-Colombia water quality index and all measuredvariables. A Kruskal–Wallis test followed by post hocmultiple pairwise comparisons was performed to testwhether significant differences in ecological indices couldbe found between different types of land use, dominantsubstrate, sludge layer and pool-riffle pattern.
Threshold Indicator Taxa ANalysis (TITAN) was usedto detect community shifts along each measured physico-chemical variable in the Portoviejo River. TITAN is anon-parametric technique that integrates occurrence,abundance and directionality of taxa responses along aphysico-chemical gradient. For each value within thisgradient, the data were split into two groups: one groupconsisting of taxa present at lower values (the so-callednegative side of the partition, i.e., the (zx)-group) andone group consisting of taxa present at higher values(the so-called positive side of the partition, i.e., the(z+ )-group). For each taxon, an optimal change pointwas determined as the value that maximizes the associa-tion of taxa within both groups. When passing this changepoint from low to high values, the abundance andfrequency of occurrence of the (zx)-group will decrease,while an increase will be observed for the (z+ )-group. Todetermine the accuracy of the change point value, boot-strapping (1000 repetitions) was implemented. Thisallowed us to derive two important diagnostic indices forevaluating the quality of the response for each taxon:purity and reliability. Purity is defined as the proportionof response directions (increasing or decreasing) whenpassing the change point that agree with the observedresponse. Pure indicators are consistently assigned thesame response direction. Reliability is estimated by theproportion of change points that consistently result inthe significant grouping of a taxon. Only taxa with highreliability (i0.95) can be considered as indicator taxa.Graphical representation of the change point identifica-tion is supported by the summation of the standardizedassociation values for each indicator taxon along the
physico-chemical gradient, resulting in fsum(zx ) andfsum(z+) scores. Both scores will obtain a maximumvalue along the physico-chemical gradient, representingthe change points for both the (zx)-group and the(z+)-group separately, and can be defined as the commu-nity change point (of the considered taxa). TITAN wasperformed in the package TITAN 2 (Baker et al., 2015) inR software (version R.3.2.3). Only taxa occurring in atleast five sites were included in the TITAN (Baker et al.,2015). Abundance data were not transformed becausetransformation is unnecessary in TITAN 2. 1000 permuta-tions were used to determine species specific z-scores andrelated fsum(z)-scores, as this calculation is based on asmall dataset, thus a higher number of permutations arerecommended for more precise z-scores (Baker et al.,2015). Further information and details of the TITANmethod can be found in Baker and King (2010), King andBaker (2014) and Baker et al. (2015).
Results
Physico-chemical water quality
High oxygen levels were observed for most samplingsites. The lowest water velocity (0 m.sx1) was measuredat the reservoir. There was a significant negativecorrelation between elevation and conductivity, NO3
x,NO2
x, oPO43x, TP and TOC (r=x0.84, r=x0.81,
r=x0.78, r=x0.76, r=x0.73, r=x0.86, respec-tively) (Appendix 1). The lower conductivity values(<880 mS.cmx1) were observed at non-affected sites,while higher conductivity values (980–2447 mS.cmx1) weremeasured at the affected and more downstream sites.The values of every variable measured at 30 samplinglocations (one site was discarded from the analysis) withinthe Portoviejo River are presented in Table 1. Based on theMann–Whitney U-test (P<0.05), it was found that
Table 1. Mean, median, maximum, minimum values and standard deviation of continuous environmental variables measured in the
Portoviejo River and their Spearman’s Rank correlation coefficients with the BMWP-Colombia index (*P<0.05, **P<0.01).
Variable Mean Median Max. Min. SD r
Velocity (m.sx1) 0.38 0.45 0.88 0.00 0.29 0.48**
Temperature ( xC) 27.71 27.91 31.33 25.56 1.40 x0.38*Conductivity (mS.cmx1) 880 385 2447 164 722 x0.39*pH 7.87 7.85 8.81 6.50 0.41 x0.05Dissolved oxygen (mg.Lx1) 8.05 7.72 18.29 2.22 2.50 0.08Chlorophyll (mg.Lx1) 13.50 7.21 55.16 1.86 15.18 x0.47**
Turbidity (FTU) 14.46 12.40 34.54 0.00 11.20 0.09BOD5 (mg.Lx1) 3.02 2.94 5.86 0.79 1.47 x0.21Nitrate-nitrogen (mg.Lx1) 1.05 0.54 2.81 0.23 0.89 x0.27Nitrite-nitrogen (mg.Lx1) 0.04 0.03 0.14 0.00 0.04 x0.33Ammonium-nitrogen (mg. Lx1) 0.09 0.08 0.19 0.04 0.04 0.30Total nitrogen (mg.Lx1) 1.81 1.20 5.70 0.50 1.49 x0.18Orthophosphate (mg.Lx1) 0.20 0.21 0.33 0.05 0.08 x0.17Total phosphorus (mg.Lx1) 0.23 0.21 0.53 0.05 0.11 x0.39*Total organic carbon (mg.Lx1) 15.78 16.85 37.70 3.00 10.38 x0.35Elevation (m a.s.l.) 61 59 121 0 37 0.39*
T. H. T. Nguyen et al..: Ann. Limnol. - Int. J. Lim. 53 (2017) 203–219 207
conductivity and concentrations of NO3x, NO2
x, oPO43x,
TN, TP, TOC and chlorophyll were significantly higherfor more affected sites, compared with reference (lessaffected) sites.
Relationship between macroinvertebratecommunities, physico-chemical conditions andhabitat characteristics
In total, more than 8300 individuals belonging to53 macroinvertebrate families were found (Appendix 2).The taxon richness varied from 4 to 22 taxa per samplingsite. Chironomidae (Diptera) was the most frequentlyencountered taxon, followed by Coenagrionidae(Odonata) and Libellulidae (Odonata) (29, 21 and 20 sites,respectively). Thiaridae (Pectinibranchia) was the mostabundant taxon, followed by Chironomidae (5231 and 805individuals, respectively). Based on the BMWP-Colombiascores, the sampling sites of the Portoviejo River werecategorized into four water quality classes: good, moder-ate, poor and bad (Fig. 1). The Shannon–Wiener indexranged from 0.23 to 2.58, representing from very low tointermediate community diversity. There was a strongpositive correlation between the BMWP-Colombia scoresand taxonomic richness (S) (Spearman’s rank correlationcoefficient=0.94). The Spearman’s rank correlation coef-ficient between BMWP-Colombia and Shannon’s diversityindex (H) was 0.58. The Spearman’s rank correlation
coefficient between the BMWP-Colombia and taxaabundance was 0.30. The highest BMWP-Colombia value(140) was recorded at one sampling site where thetaxonomic richness was also the highest (22 taxa). Thislocation is surrounded by forest, has gravel substrate and amoderately developed pool-riffle pattern.
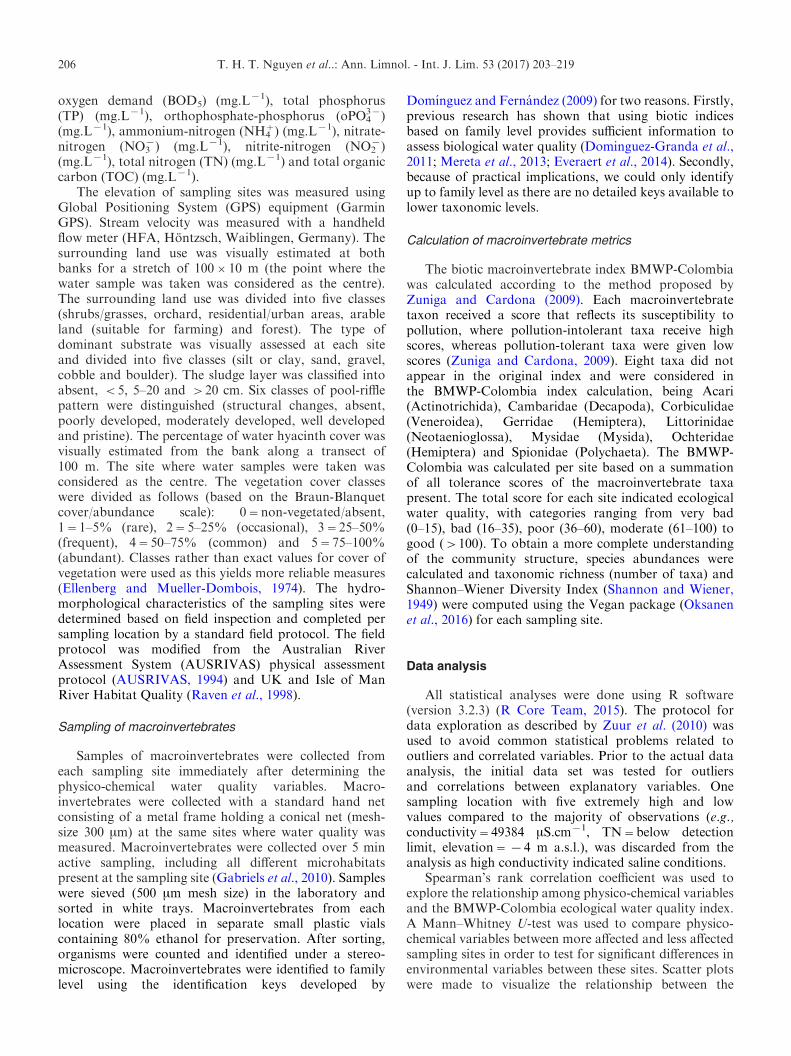
The Spearman’s rank correlation coefficients betweenthe biological water quality index (BMWP-Colombia) andthe physico-chemical variables indicated that the BMWP-Colombia scores were positively correlated with elevationand stream velocity (Table 1, Fig. 2). In addition, BMWP-Colombia values showed a negative association withtemperature, conductivity, chlorophyll and TP (Table 1,Fig. 2). Higher BMWP-Colombia values were observedat sampling sites surrounded by arable land, gravelsediment, absence of a sludge layer and at least amoderately developed pool-riffle pattern (Fig. 3).However, the statistical analysis did not reveal anysignificant difference.
Threshold change points and indicator taxa
TITAN was used to detect the variation in taxonomiccomposition of macroinvertebrate communities in re-sponse to all physico-chemical variables. However, dueto the low number of reliable indicator taxa, TITAN didnot find strong evidence of a threshold for temperature,pH, DO, chlorophyll, turbidity, BOD5, TP, oPO4
3x,
Fig. 2. Plots of physico-chemical variables in relation to BMWP-Colombia for sampling sites in the Portoviejo River.
T. H. T. Nguyen et al..: Ann. Limnol. - Int. J. Lim. 53 (2017) 203–219208

NH4+, NO2, TN, TOC and stream velocity. TITAN
could only reveal the community change along thegradient of elevation, conductivity and nitrate-nitrogenconcentration (Table 3).
Two groups of indicator taxa were identified: (1) taxapreferring low altitude (zx ), but high conductivity andnitrate concentrations (z+) and (2) taxa preferring highaltitude (z+ ), but low conductivity and nitrate concentra-tion (zx ). The first group is characterized by a sharpincrease in either abundance or frequency of occurrencewhen conductivity values go beyond 1430 mS.cmx1 andnitrate concentrations pass the 2.3 mg.Lx1 change point.The second group will show a sharp decrease in eitherabundance or frequency of occurrence when conductivityvalues go beyond 930 mS.cmx1 and nitrate concentrationspass the 0.6 mg.Lx1 change point (Table 2, Fig. 4(C)and (E)). In contrast, the first group is negatively influencedby increasing elevation (change point at 30 m a.s.l.), while
the second group is positively influenced (change point at58 m a.s.l.) (Table 2, Fig. 4(A)).
The threshold values were obtained for different taxasuch as Atyidae (Decapoda), Thiaridae (Gastropoda)and Corbiculidae (Bivalvia), which displayed a negativeresponse to increasing elevation (zx), while they showeda positive response to the increase of conductivityand nitrate-nitrogen (z+ ). In contrast to those taxa,Acari, Baetidae (Ephemeroptera) and Leptohyphidae(Ephemeroptera) showed a positive response to increasingelevation (z+ , Fig. 4(B)) and displayed a negativeresponse to increasing conductivity (zx , Fig. 4(D)) andincreasing nitrate-nitrogen values (zx , Fig. 4(F)).Naucoridae (Hemiptera) showed a positive response toan increase in elevation (z+ , Fig. 4(B)), while Veliidae(Hemiptera) and Libellulidae (Odonata) showed a nega-tive response to an increase of conductivity and nitrate-nitrogen, respectively (zx , Fig. 4(D) and (F)).
Fig. 3. Boxplots of the different classes of land use, type of sediment, sludge layer and pool-riffle class in relation to BMWP-Colombiafor sampling sites in the Portoviejo River. Bold horizontal lines represent medians, boxes represent interquartile ranges (25–75%
percentiles) and range bars show maximum and minimum values; small black dots show outliers.
Table 2. Threshold Indicator Analysis (TITAN) community response results for observed changes points (Obs.) and selectedquantiles (5, 50 and 95%) correspond to change points from 1000 bootstrap replicates of the observed data. Thresholds are givenfor only those taxa that are determined to be pure and reliable indicators.
Environmental gradient Change points
Obs. 5% 50% 95%Elevation (m.a.s.l.) fsumzx 30 26 32 53
fsumz+ 58 44 58 66Conductivity (mS.cmx1) fsumzx 930 330 930 1160
fsumz+ 1430 663 982 1433Nitrate-Nitrogen (mg.Lx1) fsumzx 0.6 0.2 0.6 1.5
fsumz+ 2.3 0.6 1.7 2.5
T. H. T. Nguyen et al..: Ann. Limnol. - Int. J. Lim. 53 (2017) 203–219 209

Table
3.Threshold
IndicatorTaxaAnalysisofindividualtaxain
response
to(a)elevation,(b)conductivityand(c)Nitrate-nitrogen
inthePortoviejo
River.Taxaare
listed
inalphabeticorder.
Taxa
Shortcode
ienv.cp
zenv.cp
freq
maxgrp
IndVal
obsiv.prob
zscore
5(%
)50(%
)95(%
)Purity
reliability
z.median
filter
a.Elevation(m
a.s.l.)
Acari
ACARI
94
94
62
71.3
0.00
7.01
72
94
112
1.00
0.99
6.64
2
Atyidae
ATYID
AE
26
26
61
83.0
0.00
7.59
25
28
35
1.00
0.99
7.54
1
Baetidae
BAETID
AE
40
52
19
277.7
0.00
5.06
38
44
58
1.00
1.00
4.97
2
Belostomatidae
BELOSTOM
27
27
92
39.1
0.09
1.60
27
58
109
0.86
0.55
2.34
0Calopterygidae
CALOPTER
75
75
11
152.4
0.02
2.80
27
75
90
0.78
0.86
2.89
0Cambaridae
CAMBARID
33
33
61
27.9
0.19
1.20
26
41
94
0.80
0.43
1.91
0Ceratopogonidae
CERATOPO
109
109
82
29.4
0.25
0.59
29
61
114
0.71
0.38
1.70
0Chironomidae
CHIR
ONOM
25
25
29
170.9
0.23
0.84
23
59
114
0.70
0.45
1.76
0Coenagrionidae
COENAGRI
75
75
21
169.9
0.01
3.14
25
75
112
0.85
0.87
3.29
0Corbiculidae
CORBIC
UL
52
52
91
61.2
0.00
3.60
30
49
53
1.00
0.97
4.36
1
Corydalidae
CORYDALI
62
62
32
23.1
0.07
2.12
59
62
109
0.94
0.41
2.35
0Dryopidae
DRYOPID
A72
72
32
27.3
0.00
2.85
66
73
94
0.96
0.57
3.24
0Elm
idae
ELMID
AE
33
33
62
28.6
0.14
1.42
32
72
109
0.90
0.50
2.42
0Gerridae
GERRID
AE
112
44
52
18.3
0.46
0.40
21
56
107
0.46
0.18
1.47
0Gomphidae
GOMPHID
A26
26
17
248.0
0.24
0.71
20
62
113
0.61
0.50
1.96
0Haliplidae
HALIPLID
44
44
92
50.0
0.01
3.85
41
48
79
0.99
0.90
3.87
0Hydrophilidae
HYDROPHI
27
27
52
21.7
0.15
0.48
28
58
94
0.48
0.24
x0.99
0Hydropsychidae
HYDROPSY
112
112
91
36.0
0.25
0.77
33
72
112
0.71
0.37
1.67
0Hydroptilidae
HYDROPTI
109
109
42
30.3
0.09
2.08
30
73
111
0.85
0.47
2.65
0Leptoceridae
LEPTOCER
59
59
92
42.4
0.04
2.07
30
59
114
0.92
0.71
2.72
0Leptohyphidae
LEPTOHYP
58
58
11
268.8
0.00
4.30
50
58
66
1.00
1.00
4.85
2
Leptophlebiidae
LEPTOPHL
62
62
82
46.8
0.01
4.02
38
62
109
1.00
0.90
4.32
0Libellulidae
LIB
ELLUL
94
44
20
263.9
0.06
1.72
22
37
94
0.87
0.63
2.42
0Lim
oniidae
LIM
ONIID
62
62
72
34.4
0.04
2.14
27
62
98
0.88
0.62
2.62
0Naucoridae
NAUCORID
62
62
12
260.1
0.01
3.44
35
58
66
1.00
0.98
4.19
2
Nepidae
NEPID
AE
94
94
32
25.9
0.09
2.31
33
92
113
0.79
0.40
2.26
0Palaem
onidae
PALAEMON
25
25
41
59.6
0.00
6.00
23
26
35
0.99
0.92
6.17
0Perlidae
PLEID
AE
52
52
62
35.3
0.05
2.64
49
53
112
0.97
0.67
3.01
0Pyralidae
PYRALID
A72
72
42
20.5
0.26
0.97
35
68
109
0.74
0.34
1.78
0Scirtidae
SCIR
TID
A40
72
31
15.8
0.29
0.84
38
62
72
0.39
0.12
1.46
0Stratiomyidae
STRATIO
M44
44
52
27.8
0.12
1.74
43
58
94
0.86
0.37
1.98
0Tabanidae
TABANID
A60
60
31
18.8
0.22
1.51
30
59
61
0.80
0.19
1.73
0Thiaridae
THIA
RID
A52
44
17
189.1
0.00
3.79
36
49
66
0.99
0.97
3.91
1
Tubificidae
TUBIF
ICI
27
94
61
26.1
0.27
0.71
27
44
94
0.58
0.22
1.48
0Veliidae
VELIIDAE
62
62
11
257.3
0.01
3.60
44
62
79
0.98
0.92
3.95
0
b.Conductivity(mS.cm
x1)
Acari
ACARI
198
198
61
59.1
0.01
4.83
198
282
331
1.00
0.96
4.95
1
Atyidae
ATYID
AE
1434
1434
62
54.6
0.00
4.60
1164
1434
1751
1.00
0.98
5.27
2
Baetidae
BAETID
AE
1200
1200
19
178.6
0.00
4.93
344
930
1475
1.00
1.00
5.19
1
Belostomatidae
BELOSTOM
219
219
91
66.7
0.01
4.14
218
226
1555
0.98
0.84
4.14
0Calopterygidae
CALOPTER
1662
1555
11
136.5
0.20
0.77
198
612
1628
0.46
0.42
1.80
0Cambaridae
CAMBARID
1568
930
62
24.5
0.21
0.95
218
930
1555
0.60
0.45
2.02
0Ceratopogonidae
CERATOPO
1662
1662
81
32.0
0.34
0.67
255
982
1662
0.51
0.24
1.49
0
T. H. T. Nguyen et al..: Ann. Limnol. - Int. J. Lim. 53 (2017) 203–219210

Table
3.(C
ontd.)
Taxa
Shortcode
ienv.cp
zenv.cp
freq
maxgrp
IndVal
obsiv.prob
zscore
5(%
)50(%
)95(%
)Purity
reliability
z.median
filter
Chironomidae
CHIR
ONOM
302
302
29
267.5
0.20
0.92
198
328
1751
0.68
0.50
1.85
0Coenagrionidae
COENAGRI
1434
1434
21
246.7
0.33
0.27
186
310
1837
0.65
0.39
1.60
0Corbiculidae
CORBIC
UL
930
930
92
61.2
0.00
3.65
664
930
1189
0.98
0.95
3.87
2
Corydalidae
CORYDALI
302
302
31
18.3
0.09
1.21
246
302
1148
0.80
0.22
1.68
0Dryopidae
DRYOPID
A930
302
31
17.6
0.16
1.12
186
302
1148
0.84
0.27
1.84
0Elm
idae
ELMID
AE
302
302
61
20.0
0.31
0.28
196
652
1750
0.57
0.29
1.62
0Gerridae
GERRID
AE
1200
1200
51
18.3
0.48
0.34
196
425
1751
0.56
0.22
1.53
0Gomphidae
GOMPHID
A1662
1662
17
155.9
0.12
1.31
219
1200
1750
0.60
0.58
2.19
0Haliplidae
HALIPLID
198
1200
91
50.0
0.01
3.74
198
385
1216
1.00
0.93
4.46
0Hydrophilidae
HYDROPHI
1475
1475
51
25.0
0.22
1.07
262
930
1477
0.56
0.24
1.34
0Hydropsychidae
HYDROPSY
219
652
92
33.3
0.15
1.07
219
652
1750
0.85
0.55
2.16
0Hydroptilidae
HYDROPTI
1475
1475
41
20.0
0.27
0.96
282
371
1477
0.54
0.14
1.54
0Leptoceridae
LEPTOCER
1200
1200
91
41.5
0.05
2.09
246
1200
1568
0.85
0.59
2.27
0Leptohyphidae
LEPTOHYP
930
930
11
164.7
0.00
3.78
302
930
1164
1.00
0.99
4.19
1
Leptophlebiidae
LEPTOPHL
302
302
81
37.8
0.06
2.27
196
330
1568
0.93
0.71
3.02
0Libellulidae
LIB
ELLUL
1200
1200
20
163.9
0.06
1.71
195
1148
1751
0.84
0.62
2.39
0Lim
oniidae
LIM
ONIID
198
302
71
46.4
0.01
3.76
186
270
1475
0.98
0.87
4.48
0Naucoridae
NAUCORID
1200
1200
12
159.0
0.01
3.37
246
1200
1526
1.00
0.95
3.73
0Nepidae
NEPID
AE
198
198
31
37.5
0.04
3.50
197
219
1526
0.80
0.52
2.90
0Palaem
onidae
PALAEMON
1662
1662
42
59.6
0.01
5.76
1216
1625
1837
0.99
0.87
5.30
0Perlidae
PLEID
AE
385
385
61
40.0
0.02
3.16
262
385
664
1.00
0.84
3.58
0Pyralidae
PYRALID
A1526
1526
41
18.2
0.44
0.51
196
612
1526
0.57
0.21
1.34
0Scirtidae
SCIR
TID
A246
246
31
25.9
0.08
2.36
226
255
1750
0.66
0.42
2.68
0Stratiomyidae
STRATIO
M1200
1200
51
27.8
0.11
1.76
270
1200
1241
0.78
0.34
1.96
0Tabanidae
TABANID
A330
330
32
17.7
0.08
1.25
319
365
1475
0.58
0.14
1.52
0Thiaridae
THIA
RID
A930
1200
17
289.1
0.00
3.64
330
930
1418
0.98
0.96
3.96
2
Tubificidae
TUBIF
ICI
1568
1568
61
25.0
0.15
0.55
182
310
1555
0.63
0.42
1.90
0Veliidae
VELIIDAE
302
302
11
161.6
0.00
3.83
198
302
1200
0.99
0.95
4.32
1
c.Nitrate-nitrogen
(mg.L
x1)
Acari
ACARI
0.25
0.25
61
71.3
0.00
6.94
0.23
0.25
0.43
1.00
0.98
6.47
1
Atyidae
ATYID
AE
2.29
2.29
62
73.4
0.00
6.17
1.04
1.54
2.45
1.00
0.97
6.35
2
Baetidae
BAETID
AE
1.36
0.60
19
177.7
0.00
4.91
0.56
1.03
1.36
1.00
0.99
4.94
1
Belostomatidae
BELOSTOM
0.53
0.53
91
29.8
0.19
1.05
0.23
0.54
2.38
0.72
0.46
1.98
0Calopterygidae
CALOPTER
0.32
0.32
11
252.4
0.02
2.79
0.31
0.32
1.36
0.91
0.86
3.06
0Cambaridae
CAMBARID
2.29
2.29
62
55.0
0.02
3.53
0.48
2.06
2.47
0.93
0.73
3.53
0Ceratopogonidae
CERATOPO
0.23
0.23
81
38.5
0.09
1.36
0.23
0.53
2.29
0.63
0.46
1.92
0Chironomidae
CHIR
ONOM
1.47
1.47
29
167.5
0.20
0.94
0.25
0.57
2.29
0.56
0.47
1.81
0Coenagrionidae
COENAGRI
0.24
0.32
21
269.9
0.01
2.96
0.24
0.32
2.22
0.93
0.88
3.49
0Corbiculidae
CORBIC
UL
1.86
1.86
92
69.9
0.01
4.33
0.57
1.66
2.47
1.00
0.98
5.06
2
Corydalidae
CORYDALI
0.53
0.53
31
23.1
0.06
2.26
0.23
0.53
0.54
0.94
0.44
2.37
0Dryopidae
DRYOPID
A0.52
0.52
31
25.0
0.06
2.51
0.23
0.52
0.52
0.95
0.57
3.00
0Elm
idae
ELMID
AE
2.06
0.52
61
23.8
0.19
0.90
0.23
0.52
1.86
0.82
0.41
2.07
0Gerridae
GERRID
AE
1.71
1.71
51
22.7
0.29
0.89
0.23
0.57
1.71
0.55
0.17
1.46
0Gomphidae
GOMPHID
A1.71
1.71
17
252.4
0.11
1.37
0.26
0.61
2.21
0.75
0.58
2.23
0Haliplidae
HALIPLID
0.93
0.54
91
49.2
0.01
3.62
0.37
0.56
1.04
1.00
0.93
4.25
0
T. H. T. Nguyen et al..: Ann. Limnol. - Int. J. Lim. 53 (2017) 203–219 211

Table
3.(C
ontd.)
Taxa
Shortcode
ienv.cp
zenv.cp
freq
maxgrp
IndVal
obsiv.prob
zscore
5(%
)50(%
)95(%
)Purity
reliability
z.median
filter
Hydrophilidae
HYDROPHI
2.29
2.29
52
19.2
0.54
0.11
0.25
0.56
2.47
0.58
0.38
1.76
0Hydropsychidae
HYDROPSY
2.06
0.60
92
28.6
0.29
0.52
0.23
0.49
1.54
0.65
0.41
1.68
0Hydroptilidae
HYDROPTI
0.23
0.23
41
37.0
0.07
2.74
0.23
0.28
2.39
0.79
0.53
2.88
0Leptoceridae
LEPTOCER
0.93
0.93
91
41.5
0.09
1.79
0.24
0.93
1.07
0.82
0.58
2.25
0Leptohyphidae
LEPTOHYP
0.60
0.60
11
164.7
0.00
3.82
0.41
0.60
1.03
1.00
0.99
4.19
1
Leptophlebiidae
LEPTOPHL
0.53
0.53
81
46.8
0.01
3.89
0.23
0.53
1.36
0.99
0.89
4.14
0Libellulidae
LIB
ELLUL
1.47
1.47
20
180.7
0.00
3.38
0.24
1.47
2.06
0.97
0.96
3.31
1
Lim
oniidae
LIM
ONIID
0.53
0.53
71
34.4
0.04
2.17
0.24
0.53
1.25
0.86
0.66
2.76
0Naucoridae
NAUCORID
0.93
0.93
12
159.0
0.01
3.18
0.52
0.93
1.26
0.98
0.90
3.48
0Nepidae
NEPID
AE
0.23
0.23
31
37.5
0.04
3.87
0.23
0.24
1.86
0.76
0.53
3.05
0Palaem
onidae
PALAEMON
1.36
1.36
42
36.4
0.01
3.46
1.03
1.43
2.36
0.99
0.81
4.02
0Perlidae
PLEID
AE
0.54
0.54
61
40.0
0.01
3.46
0.25
0.54
0.57
0.99
0.83
3.67
0Pyralidae
PYRALID
A0.52
0.52
41
18.1
0.22
0.80
0.23
0.52
1.71
0.67
0.38
1.85
0Scirtidae
SCIR
TID
A0.52
0.52
32
16.7
0.27
0.99
0.44
0.56
1.36
0.63
0.12
1.53
0Stratiomyidae
STRATIO
M0.93
0.93
51
27.8
0.12
1.74
0.23
0.54
1.04
0.85
0.44
2.14
0Tabanidae
TABANID
A0.53
0.53
32
17.7
0.08
1.20
0.50
0.54
2.47
0.66
0.21
1.81
0Thiaridae
THIA
RID
A1.86
1.54
17
298.0
0.00
4.09
0.58
1.54
2.21
0.98
0.98
4.49
2
Tubificidae
TUBIF
ICI
2.29
2.29
62
36.4
0.11
1.60
0.25
1.04
2.39
0.72
0.37
1.87
0Veliidae
VELIIDAE
0.53
0.53
11
157.3
0.00
3.74
0.26
0.53
1.71
0.99
0.93
4.00
0
Ienv.cp–environmentalchangepointforeach
taxonbasedonIndValmaxim
um;zenv.cp–environmentalchangepointforeach
taxonbasedonzmaxim
um;freq
–number
of
times
each
taxonoccurred
inthedata
set;maxgrp
–1ifz-
(negativeresponse);2ifz+
(positiveresponse);IndVal-DufreneandLegendre
1997IndValstatistic,scaled0–100%
(with100indicatingataxonthatoccurred
inallofthesamplesaboveorbelowachangepointvalueandin
noneofthesamplesontheother
sideofthechangepoint);obsiv.prob–
theprobabilityofobtaininganequalorlarger
IndValscore
from
random
data;(number
ofrandom
IndVals"observed
IndVal)/numPerm);zscore
–IndValzscore;5%
,50%
,95%
–changepointquantilesamongbootstrapreplicates;purity
–proportionofreplicatesmatchingobserved
maxgrp
assignment;reliability–proportionofreplicateobsiv.prob
values
!0.05;z.median–medianscore
magnitudeacross
allbootstrapreplicates;filter
–logical(if>
0)indicatingwhether
each
taxamet
purity
andreliabilitycriteria,value
indicatesmaxgrp
assignment.Negativelyandpositivelyassociatedtaxaare
shownin
bold.
T. H. T. Nguyen et al..: Ann. Limnol. - Int. J. Lim. 53 (2017) 203–219212

Discussion
Water quality of the portoviejo river
The majority of the sampling locations have DOconcentrations ranging from 7 to 10 mg.Lx1. The lowestvalue of DO (2.2 mg.Lx1) was observed at the PozaHonda reservoir, which was characterized by the highestBOD5 (5.9 mg.Lx1), a sludge layer between 5 and 20 cm,a water hyacinth coverage of 50–75% and stagnant water.Based on the ecological water quality index (BMWP-Colombia), this sampling site (site Po3, Fig. 1) had badwater quality with seven taxa present. This finding may beexplained by a combination of unfavorable conditions(e.g., low stream velocity, thick sludge layer) for rheophilictaxa and the fact that when the percentage of waterhyacinth cover is higher than 50%, the cover might be toodense, which negatively affects the physico-chemical waterquality (e.g., DO, BOD5) (Nguyen et al., 2015). Flowvelocity is often considered as one of the most importantvariables that influences macroinvertebrate communities
(Forio et al., 2015; Damanik-Ambarita et al., 2016). In thisrespect, damming causes unfavorable changes in theriverine biota through changes in flow regime, sedimenttransport and habitat modification (Kairo et al., 2011).As the Poza Honda dam started operating in 1971, theremight be sediment accumulation. Sedimentation cannegatively affect the macroinvertebrate community bychanging the suitability of the substrate for some taxa,increasing drift due to sediment deposition, affectingrespiration due to the deposition and affecting feedingactivities (Wood and Armiage, 1997).
The negative correlation between elevation and con-ductivity, nutrient concentrations (e.g., NO3
x, NO2x,
oPO43x, TP) and TOC (Appendix 1) indicates the
cumulative negative impacts of human disturbance onwater quality from upstream to downstream in thePortoviejo River. The affected sites have higher conduc-tivity, a higher chlorophyll concentration and higherconcentrations of NO3
x, NO2x, oPO4
3x, TN, TP andTOC, compared with less affected sites. The PortoviejoRiver suffers from a high level of environmental
Fig. 4. Threshold Indicator Taxa ANalysis and change points (dots) for the pure and reliable indicator taxa response to elevation(A, B), conductivity (C,D) and nitrate-nitrogen (E, F) gradient (Pj0.05, purity=0.95, reliability=0.95 for 5 minimum number of
observations, 1000 bootstrap and 1000 permutation replicates). Negatively associated taxa (z–) are indicated by black symbols andlines and positively associated taxa (z+ ) are indicated by red symbols and dashed lines. Solid and dashed lines are cumulativefrequency distributions of sum(z–) and sum(z+ ) maxima (respectively) across bootstrap replicates. Size of change point symbol (dots)
is proportional to the magnitude of the taxa response. Zx species responded negatively to an increase in the environmental gradient,Z+ species responded positively to an increase in the gradient. Horizontal lines suggest 5–95% quantiles from the bootstrappedchange point distribution. ACARI, Acari; ATYIDAE, Atyidae; BAETIDAE, Baetidae; CORBICUL, Corbiculidae, LEPTOHYP,
Leptohyphidae; LIBELLUL, Libellulidae; NAUCORID, Naucoridae, THIARIDA, Thiaridae; VELIIDAE, Veliidae.
T. H. T. Nguyen et al..: Ann. Limnol. - Int. J. Lim. 53 (2017) 203–219 213
deterioration caused by deforestation, burning of vegeta-tion, drainage of agrochemicals and fertilizers, garbagedisposal and discharge of sewage without adequateprevious treatment (Parraga and Aguirre, 2010; ACBIO,2012). Nutrients (e.g., NO3
x) enter the water as a result ofdomestic wastewater discharge, agricultural activities (e.g.,using manure and fertilizer containing NO3
x) and as aresult of oxidation of nitrogenous waste products inhuman and animal excreta (Singh and Sharma, 2014).
Lower BMWP-Colombia scores were reported for siteslocated right after the outlets of wastewater treatmentplants (sites Po31 and Po34, Fig. 1), in front of a small weir(site Po47, Fig. 1) and right after the small weir (site Po40,Fig. 1); with chlorophyll concentrations higher than30 mg.Lx1. It is estimated that each year roughly 20 millioncubic meters of wastewater are discharged into thePortoviejo River (ACBIO, 2012). As such, the PortoviejoRiver continues to suffer from sewage pollution, as therelated increase in nutrient concentrations supportsphytoplankton growth. Our results indicate negativeeffects of anthropogenic disturbances on biological diver-sity and water quality in the Portoviejo River. Based onour results, we emphasize the need for managementactions to control the diffuse pollution and futureinvestments in wastewater treatment in order to reducethe nutrient load in the river.
Relevance of the TITAN method: indicator taxaof environmental change and thresholdfor macroinvertebrates
TITAN uncovered a clear community change alongboth human affected gradients (e.g., conductivity andnitrate-nitrogen) and a natural gradient (e.g., elevation).For instance, a community change point for toleranttaxa (z+ ) was observed at 1430 mS.cmx1, which is closeto the findings of Schroder et al. (2015), who determineda community threshold for tolerant taxa at 1464 mS.cmx1
in the Lippe River, Germany. The change point forsensitive indicator taxa (zx ) at a conductivity valueof 930 mS.cmx1 in the Portoviejo River is similar to thethreshold identified by Schroder et al. (2015) at926 mS.cmx1. In this study, half of the sites (i.e., lessaffected sites) had conductivity values lower than500 mS.cmx1, the other half (i.e., affected sites) had valueshigher than 1400 mS.cmx1 and only two sites hadconductivity values in between (Fig. 4(C)). Moreover,only four taxa (Acari, Veliidae, Leptohyphidae andBaetidae) showed a negative association (zx) withincreasing conductivity. In this case, it is possible that thecommunity change point was high due to the limitedamount of samples in the middle section of the conductiv-ity gradient (only two). Therefore, the results should becarefully considered before use.
Nitrate-nitrogen was found to influence communitycomposition at a concentration of 0.6 mg.Lx1 (forsensitive (zx) taxa) and 2.3 mg.Lx1 (for tolerant (z+ )taxa). There was a strong relationship between
conductivity and NO3x (r=0.82), NO2
x (r=0.75) andTOC (r=0.73), suggesting that a similar effect could beobserved for NO2
x and TOC gradients. However, thesewere not observed when applying TITAN. Nevertheless,the observed influence of NO3
x is consistent with theliterature, as it has been shown that there is a strongrelationship between nutrient concentrations and macro-invertebrate communities (Ashton et al., 2014).
Combining the observed change points and theecological water quality shows that the less affectedsites had a conductivity lower than 880 mS.cmx1 and anitrate-nitrogen concentration lower than 0.6 mg.Lx1
(Appendix 3), while the ecological water quality rangedfrom poor to good. On the other hand, at the affected sites,conductivity was higher than 980 mS.cmx1 and the nitrate-nitrogen concentration was higher than 0.6 mg.Lx1
(Appendix 3), while the ecological water quality rangedfrom bad to poor. This supports the assumption thatmacroinvertebrate communities respond predictably tothe degradation of water quality in the Portoviejo River.However, biological communities are always affectedby multiple factors, making it impossible to separatethe effects of each factor when they co-vary (Bergeret al., 2016). Therefore, the identified thresholds forconductivity and nitrate-nitrogen should be seen aspreliminary results.
Finally, elevation was found to influence the macro-invertebrate community with a change point at 30 m a.s.l.(fsumzx) and at 58 m a.s.l. (fsumz+ ). Yet, elevation is anatural gradient that was highly correlated with conduc-tivity (r=x0.84) and nitrate-nitrogen (r=0.81); thus, asimilar pattern in community shift was expected. Theelevation of the sampling sites in the Portoviejo Riverranged between 0 and 121 m a.s.l., which is very low.As such, the reported change points for elevation may notrepresent the influence of altitude on the community, butindicate the cumulative negative impacts of humandisturbance on water quality from upstream to down-stream in the Portoviejo River.
Among the tolerant taxa, three widely distributed taxawere present: Atyidae, Thiaridae and Corbiculidae.Moreover, these taxa are also considered to be invasive,which highlights the importance of identifying changepoints so as to conserve sensitive species and predict localcommunity composition (Schroder et al., 2015). Withincreasing conductivity and nitrate-nitrogen, sensitive taxalike Baetidae and Leptohyphidae will show a decrease inabundance and frequency of occurrence, which will reducethe indigenous community composition and allow forinvasive species to take over. Based on these observations,management related to aquatic conservation, biologicalinvasions, ecosystem restoration and natural resources canbe performed (King and Baker, 2010). Moreover, thesechange point values have valuable applications for detect-ing reference condition boundaries and selecting sites atgreatest risk of significant change (Kovalenko et al., 2014).Nevertheless, the obtained change point values should beconsidered as preliminary results, as this is only the firstpublication on macroinvertebrate communities in the
T. H. T. Nguyen et al..: Ann. Limnol. - Int. J. Lim. 53 (2017) 203–219214

Portoviejo River and therefore require confirmationthrough future research.
Conclusions
In the present research, we provided baseline informa-tion about the physico-chemical water quality and themacroinvertebrate community composition in thePortoviejo River (Ecuador). The BMWP-Colombia scoresshowed that water quality of the sampling sites within thePortoviejo River ranged from good to bad. TITANrevealed clear tipping points in elevation, conductivityand nitrate-nitrogen concentrations and associated indi-cator taxa. Atyidae, Corbiculidae and Thiaridae showed apositive response to the increase in conductivity andnitrate-nitrogen, while they were assigned a negativeresponse to increasing elevation. In contrast to these taxa,Acari, Baetidae and Leptohyphidae showed a negativeresponse to the increase in conductivity and nitrate-nitrogen, while they were assigned a positive response toincreasing elevation. Based on these correlations, thesetaxa can be considered as indicator taxa that significantlychange in abundance and frequency of occurrence due tothe change in water quality along the Portoviejo River.Based on the patterns that are characterized in thisresearch, novel management approaches can be developedand implemented.
Acknowledgements. Nguyen Thi Hanh Tien is grateful for thefinancial support for this work from the Belgian Technical
Cooperation (BTC) in the framework of her PhD grant. MarieAnne Eurie Forio received financial support from the SpecialResearch Fund of Ghent University. Gert Everaert is supported
by a post-doctoral fellowship from the Special Research Fund ofGhent University (BOF15/PDO/061). We would like to thankthe VLIR Ecuador Biodiversity Network project for theirsupport and CADS-ESPOL and Universidad Tecnica de
Manabı for their help during the fieldwork. We gratefullyacknowledge the insightful comments from two anonymousreviewers that helped to improve the manuscript.
References
ACBIO, 2012. Plan de Accion del Biocorredor “Estuario del RioPortoviejo y Cordillera El Balsamo” (in Spanish),Assessed online 29 February 2016, http://ppd-ecuador.org/publicaciones/acbio-estuario-portoviejo-y-cordillera-de-balsamo.pdf.
Allan J.D., 2004. Landscapes and Riverscapes: the influence ofland use on stream ecosystems. Ann. Rev. Ecol. Evol. Syst.,35, 257–284.
Andres C.B., 2009. Sedimentation Processes at the Confluence ofthe Daule and Babahoyo Rivers, El Palmar Island. ManejoAmbiental de Rıos, The University of Birmingham,Guayaquil, Ecuador, 55 p.
Armitage P.D., Moss D., Wright J.F. and Furse M.T., 1983. Theperformance of a new biological water quality score system
based on macroinvertebrates over a wide range of unpollutedrunning-water sites. Water Res., 17, 333–347.
Ashton M.J., Morgan R.P. II and Stranko S., 2014. Relationsbetween macroinvertebrates, nutrients, and water qualitycriteria in wadeable streams of Maryland, USA. Environ.Monit. Assess., 186, 1167–1182.
AUSRIVAS, 1994. AUSRIVAS physical assessment protocolfield data sheets. AUSRIVAS (Australian River AssessmentSystem), Available online at: http://ausrivas.ewater.com.au/protocol/pubs/chapter4b.pdf.
Baker M.E. and King R.S., 2010. A new method for detectingand interpreting biodiversity and ecological communitythresholds. Meth. Ecol. Evol., 1, 25–37.
Baker M., King R. and Kahle D., 2015. TITAN2: thresholdindicator taxa analysis. Available online at: https://CRAN.R-project.org/package=TITAN2.
Berger E., Haase P., Oetken M. and Sundermann A., 2016.Field data reveal low critical chemical concentrationsfor river benthic invertebrates. Sci. Total Environ., 544,864–873.
Bredenhand E. and Samways M.J., 2008. Impact of a Damon Benthic Macroinvertebrates in a Small River in aBiodiversity Hotspot: Cape Floristic Region, South Africa.J. Insect Conserv., 13, 297–307.
Cairns J.J. and Pratt J.R., 1993. A history of biologicalmonitoring using benthic macroinvertebrates. In:Rosenberg D. and Resh V. (eds.), FreshwaterBiomonitoring and Benthic Macroinvertebrates, Chapmanand Hall, New York, 10–27.
Chapman D.V., 1996. Water Quality Assessments: A Guide tothe Use of Biota, Sediments and Water in EnvironmentalMonitoring (2nd edn), CRC Press, London, UK.
Damanik-Ambarita M.N., Lock K., Boets P., Everaert G.,Nguyen T.H.T., Forio M.A.E., Musonge P.L.S.,Suhareva N., Bennetsen E., Landuyt D., Dominguez-Granda L. and Goethals P.L.M., 2016. Ecological waterquality analysis of the Guayas river basin (Ecuador) based onmacroinvertebrates indices. Limn. Ecol. Manag. InlandWaters, 57, 27–59.
Domınguez E. and Fernandez H.R., 2009. MacroinvertebradosBentonicos Sudameri-canos: Sistematica y Biologıa,Fundacion Miguel Lillo, Tucuman, 656 p.
Dominguez-Granda L., Lock K. and Goethals P., 2011. Usingmulti-target clustering trees as a tool to predict biologicalwater quality indices based on benthic macroinvertebratesand environmental parameters in the Chaguana watershed(Ecuador). Ecol. Info., 6, 303–308.
Ellenberg D. and Mueller-Dombois D. (eds.), 1974. Aims andMethods of Vegetation Ecology, Wiley, New York, NY.
Everaert G., Neve J.D., Boets P., Dominguez-Granda L.,Mereta S.T., Ambelu A., Hoang T.H., Goethals P.L.M.,and Thas O., 2014. Comparison of the abiotic preferences ofmacroinvertebrates in tropical river basins. PLoS ONE, 9.
Forio M.A.E., Landuyt D., Bennetsen E., Lock K.,Nguyen T.H.T., Ambarita M.N.D., Musonge P.L.S.,Boets P., Everaert G., Dominguez-Granda L. andGoethals P.L.M., 2015. Bayesian belief network models toanalyse and predict ecological water quality in rivers. Ecol.Model., 312, 222–238.
Gabriels W., Lock K., De Pauw N. and Goethals P.L.M.,2010. Multimetric Macroinvertebrate Index Flanders(MMIF) for biological assessment of rivers and lakes in
T. H. T. Nguyen et al..: Ann. Limnol. - Int. J. Lim. 53 (2017) 203–219 215

Flanders (Belgium). Limn. Ecol. Manag. Inland Waters 40,199–207.
Kairo K., Mols T., Timm H., Virro T. and Jarvekulg R., 2011.The effect of damming on biological quality according tomacroinvertebrates in some Estonian streams, Central—Baltic Europe: a pilot study. River Res. Appl., 27, 895–907.
Kibena J., Nhapi I. and Gumindoga W., 2014. Assessingthe relationship between water quality parameters andchanges in landuse patterns in the Upper ManyameRiver, Zimbabwe. Phys. Chem. Earth Parts A/B/C, 67–69,153–163.
King R.S. and Baker M.E., 2010. Considerations for analyzingecological community thresholds in response to anthropo-genic environmental gradients. J. North Am. Benthol. Soc.,29, 998–1008.
King R.S. and Baker M.E., 2014. Use, misuse, and limitationsof Threshold Indicator Taxa Analysis (TITAN) fornatural resource management. In: Application of ThresholdConcepts in Natural Resource Decision Making, Springer,New York, 231–254.
Kovalenko K.E., Brady V.J., Brown T.N., Ciborowski J.J.H.,Danz N.P., Gathman J.P., Host G.E., Howe R.W.,Johnson L.B., Niemi G.J. and Reavie E.D., 2014.Congruence of community thresholds in response to anthro-pogenic stress in Great Lakes coastal wetlands. Freshw. Sci.33, 958–971.
Mereta S.T., Boets P., Meester L.D. and Goethals P.L.M., 2013.Development of a multimetric index based on benthicmacroinvertebrates for the assessment of natural wetlandsin Southwest Ethiopia. Ecol. Indicators, 2013, 510–521.
Nguyen T.H.T., Boets P., Lock K., Ambarita M.N.D.,Forio M.A.E., Musonge P.S.L., Dominguez-Granda L.E.,Hoang T.H.T., Everaert G. and Goethals P., 2015. Habitatsuitability of the invasive water hyacinth and its relation towater quality and macroinvertebrate diversity in a tropicalreservoir. Limnologica, 52, 67–74.
Nolivos I., Villacis M., Vazquez R., Mora D.E., Domınguez-Granda L., Hampel H. and Velarde E., 2015. Challenges fora sustainable management of Ecuadorian water resources.Sustain. Water Qual. Ecol., 6, 101–106.
Oksanen J., Blanchet F.G., Kindt R., Legendre P., Minchin P.R.,O’Hara R.B., Simpson G.L., Solymos P., Stevens M.H.H.and Wagner H., 2016. Package “vegan”, Available onlineat: https://cran.r-project.org, https://github.com/vegandevs/vegan.
Pan B., Wang Z., Xu M. and Xing L., 2012. Relation betweenstream habitat conditions and macroinvertebrate assem-blages in three Chinese rivers. Quat. Int., 282, 178–183.
Parraga R.M. and Aguirre S.D., 2010. General Strategies toControl and Prevent the Contamination of the SuperficialWater in the Basin of Portoviejo River (In Spanish). NECICMagazine. Life Sciences, National Center for ScientificResearch, Havana, Cuba, 1–7.
Perez G.R., 2003a. Bioindicacion de la calidad del agua enColombia. Uso del metodo BMWP/Col, Universidad deAntioquia, Medellın, Medellın, Colombia.
PerezM., 2003b. Portoviejo River with high pollution (in spanish),Available online at: http://www.eluniverso.com/2003/01/04/0001/12/503724521B0045E99E47BA165A3BD293.html.
Perez Q.F.H.W.Y., 2004. Study the Physical, Chemical andBiological of Eutrophication Process of Poza HondaReservoir and The Impact on the Formation ofTrihalomethanes in the Regional Water-Supply System ofPoza Honda (In Spanish), Faculty of Chemical. UniversidadDe Guayaquil Guayaquil, Ecuador, 361 p.
Raven P.J., Holmes N.T.H., Dawson F.H., Fox P.J.A.,Everard M., Fozzard I.R. and Rouen K.J., 1998.River Habitat Quality the Physical Character of Riversand Streams in the UK and Isle of Man, EnvironmentAgency, UK.
R Core Team, 2015. R: A language and environment forstatistical computing. R Foundation for StatisticalComputing, Vienna, Austria, Available online at: https://www.R-project.org/.
Richter B.D., Mathews R., Harrrison D.L. and Wigington R.,2003. Ecologically sustainable water management:managing river flows for ecological integrity. Ecol. Appl.,13, 206–224.
Schroder M., Sondermann M., Sures B. and Hering D., 2015.Effects of salinity gradients on benthic invertebrate anddiatom communities in a German lowland river. Ecol. Ind.,57, 236–248.
Shannon C.E. and Wiener W., 1949. The MathematicalTheory of Communication, University of Illinois Press,Urbana, 125 p.
Singh P.P. and Sharma V. (eds.), 2014. Water and Health,Springer India, New Delhi.
Smith A.J., Bode R.W. and Kleppel G.S., 2007. A nutrient bioticindex (NBI) for use with benthic macroinvertebrate commu-nities. Ecol. Indicators, 7, 371–386.
Takao A., Kawaguchi Y., Minagawa T., Kayaba Y. andMorimoto Y., 2008. The relationships between benthicmacroinvertebrates and biotic and abiotic environmentalcharacteristics downstream of the Yahagi Dam, CentralJapan, and the State Change Caused by inflow from aTributary. River Res. Appl., 24, 580–597.
U.S. Army Corps of Engineers, 1998. Water resources assess-ment of Ecuador, Available online at: http://www.sam.usace.army.mil/Portals/46/docs/military/engineering/docs/WRA/Ecuador/Ecuador%20WRA%20English.pdf.
Water Framework Directive, 2002. The EU Water FrameworkDirective – integrated river basin management for Europe inT. E. P. a. t. C. o. t. E. U. D. 2000/60/EC, editor.
Wood P.J. and Armiage P.D., 1997. Biological effects offine sediment in the lotic environment. Environ. Manag., 21,203–217.
Zhang M., Shao M., Xu Y. and Cai Q., 2010. Effect ofhydrological regime on the macroinvertebrate community inThree-Gorges Reservoir, China. Quat. Int., 226, 129–135.
Zuniga M.C. and Cardona W., 2009. Water quality andenvironmental flow bioindicators (in Spanish). In:Cantera J., Carvajal Y.L. and Castro L. (eds.)Environmental Flow: Concepts, Experiences andChallenges, Del Valle University, Cali, Colombia, 167–198.
Zuur A.F., Ieno E.N. and Elphick C.S. 2010. A protocol for dataexploration to avoid common statistical problems. MethodsEcol. Evol., 1, 3–14.
T. H. T. Nguyen et al..: Ann. Limnol. - Int. J. Lim. 53 (2017) 203–219216

Appendix
1.Spearm
an’srankcorrelationmatrix
ofthe16environmentalvariablesofthePortoviejo
River
dataset(n
=30).Correlationcoeffi
cients
withanabsolute
valueofat
least
0.70are
marked
inbold.
Elevation
Velocity
Tem
perature
Conductivity
pH
DO
Chlorophyll
Turbidity
BOD
5NO
3xNO
2xNH
4+TN
oPO
43x
TP
TOC
Elevation
1Velocity
x0.22
1Tem
perature
x0.33
x0.39
1Conductivity
x0.84
0.05
0.46
1pH
0.03
x0.21
0.36
0.1
1DO
x0.07
x0.31
0.38
0.11
0.69
1Chlorophyll
x0.57
x0.33
0.53
0.58
0.23
0.49
1Turbidity
x0.28
0.42
x0.25
x0.23
x0.28
x0.13
x0.15
1BOD
50.51
x0.51
0.05
x0.3
x0.12
x0.05
0.08
x0.43
1NO
3xx
0.81
0.05
0.43
0.82
0x
0.08
0.52
x0.06
x0.31
1NO
2xx
0.78
0.01
0.41
0.75
0.03
0.34
0.79
x0.05
x0.18
0.7
1NH
4+x
0.08
0.23
x0.16
x0.08
x0.16
x0.22
x0.32
0.37
x0.37
0.08
x0.1
1TN
x0.61
x0.06
0.47
0.63
0.1
0.07
0.36
x0.07
x0.21
0.79
0.48
0.03
1oPO
43x
x0.76
0.34
x0.06
0.54
x0.08
x0.07
0.33
0.38
x0.39
0.52
0.58
0.08
0.22
1TP
x0.73
0.09
0.14
0.55
x0.04
x0.02
0.58
0.21
x0.13
0.66
0.7
x0.07
0.44
0.83
1TOC
x0.86
0.15
0.48
0.73
0.11
0.23
0.65
0.21
x0.41
0.74
0.76
00.68
0.58
0.68
1
Appendix
T. H. T. Nguyen et al..: Ann. Limnol. - Int. J. Lim. 53 (2017) 203–219 217
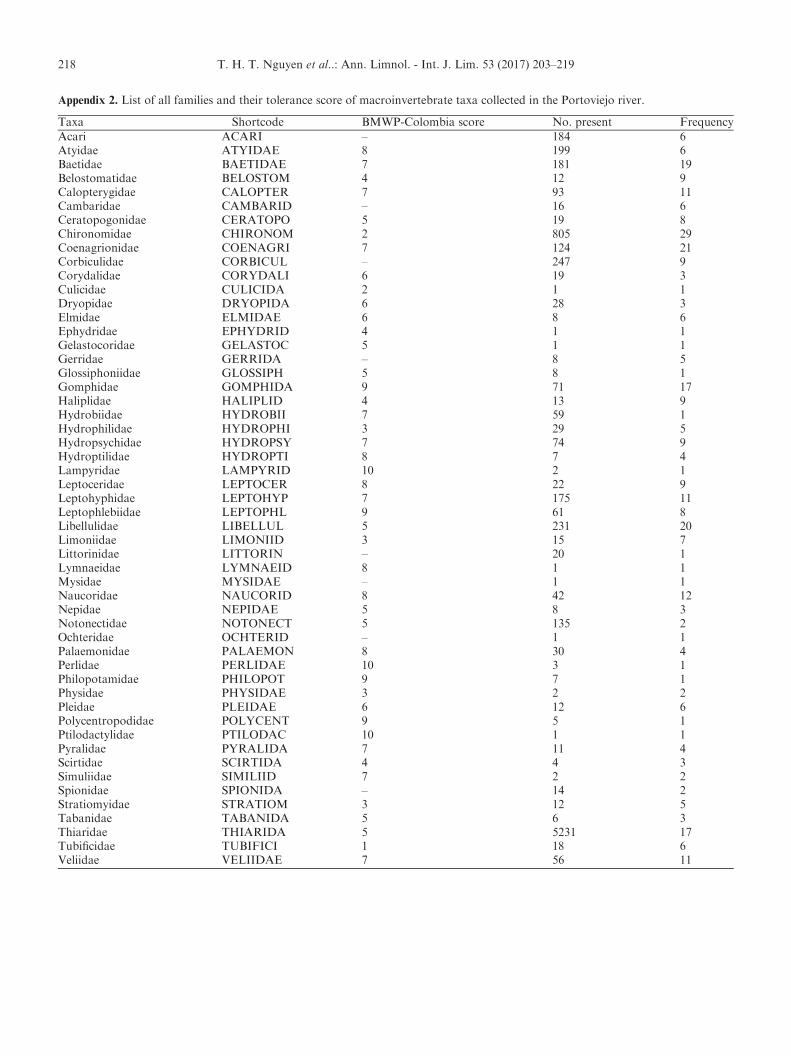
Appendix 2. List of all families and their tolerance score of macroinvertebrate taxa collected in the Portoviejo river.
Taxa Shortcode BMWP-Colombia score No. present FrequencyAcari ACARI – 184 6Atyidae ATYIDAE 8 199 6Baetidae BAETIDAE 7 181 19Belostomatidae BELOSTOM 4 12 9Calopterygidae CALOPTER 7 93 11Cambaridae CAMBARID – 16 6Ceratopogonidae CERATOPO 5 19 8Chironomidae CHIRONOM 2 805 29Coenagrionidae COENAGRI 7 124 21Corbiculidae CORBICUL – 247 9Corydalidae CORYDALI 6 19 3Culicidae CULICIDA 2 1 1Dryopidae DRYOPIDA 6 28 3Elmidae ELMIDAE 6 8 6Ephydridae EPHYDRID 4 1 1Gelastocoridae GELASTOC 5 1 1Gerridae GERRIDA – 8 5Glossiphoniidae GLOSSIPH 5 8 1Gomphidae GOMPHIDA 9 71 17Haliplidae HALIPLID 4 13 9Hydrobiidae HYDROBII 7 59 1Hydrophilidae HYDROPHI 3 29 5Hydropsychidae HYDROPSY 7 74 9Hydroptilidae HYDROPTI 8 7 4Lampyridae LAMPYRID 10 2 1Leptoceridae LEPTOCER 8 22 9Leptohyphidae LEPTOHYP 7 175 11Leptophlebiidae LEPTOPHL 9 61 8Libellulidae LIBELLUL 5 231 20Limoniidae LIMONIID 3 15 7Littorinidae LITTORIN – 20 1Lymnaeidae LYMNAEID 8 1 1Mysidae MYSIDAE – 1 1Naucoridae NAUCORID 8 42 12Nepidae NEPIDAE 5 8 3Notonectidae NOTONECT 5 135 2Ochteridae OCHTERID – 1 1Palaemonidae PALAEMON 8 30 4Perlidae PERLIDAE 10 3 1Philopotamidae PHILOPOT 9 7 1Physidae PHYSIDAE 3 2 2Pleidae PLEIDAE 6 12 6Polycentropodidae POLYCENT 9 5 1Ptilodactylidae PTILODAC 10 1 1Pyralidae PYRALIDA 7 11 4Scirtidae SCIRTIDA 4 4 3Simuliidae SIMILIID 7 2 2Spionidae SPIONIDA – 14 2Stratiomyidae STRATIOM 3 12 5Tabanidae TABANIDA 5 6 3Thiaridae THIARIDA 5 5231 17Tubificidae TUBIFICI 1 18 6Veliidae VELIIDAE 7 56 11
T. H. T. Nguyen et al..: Ann. Limnol. - Int. J. Lim. 53 (2017) 203–219218

Appendix 3. Boxplots of the different elevation, conductivity and nitrate-nitrogen in relation to impact level. Bold horizontal lines
represent median, boxes represent interquartile ranges (25–75% percentiles) and range bars show maximum and minimum values,small black dots show outliers.
T. H. T. Nguyen et al..: Ann. Limnol. - Int. J. Lim. 53 (2017) 203–219 219