water quality study of lake mead - unlv libraries
TRANSCRIPT

Publications (WR) Water Resources
11-1967
Water quality study of Lake Mead Water quality study of Lake Mead
Dale A. Hoffman
Paul R. Tramutt
Frank C. Heller
Bureau of Reclamation
Follow this and additional works at: https://digitalscholarship.unlv.edu/water_pubs
Part of the Chemical Engineering Commons, Environmental Chemistry Commons, Environmental
Health and Protection Commons, Environmental Indicators and Impact Assessment Commons,
Environmental Monitoring Commons, Fresh Water Studies Commons, and the Natural Resources and
Conservation Commons
Repository Citation Repository Citation Hoffman, D. A., Tramutt, P. R., Heller, F. C., Bureau of Reclamation (1967). Water quality study of Lake Mead. Available at:Available at: https://digitalscholarship.unlv.edu/water_pubs/42
This Technical Report is protected by copyright and/or related rights. It has been brought to you by Digital Scholarship@UNLV with permission from the rights-holder(s). You are free to use this Technical Report in any way that is permitted by the copyright and related rights legislation that applies to your use. For other uses you need to obtain permission from the rights-holder(s) directly, unless additional rights are indicated by a Creative Commons license in the record and/or on the work itself. This Technical Report has been accepted for inclusion in Publications (WR) by an authorized administrator of Digital Scholarship@UNLV. For more information, please contact [email protected].

•JAMES F. UBOUNTY.
orUNITED STATES
DEPARTMENT OF THE INTERIORBUREAU OF RECLAMATION
WATER QUALITY STUDY OF LAKE MEAD
Report No. ChE-70
CHEMICAL ENGINEERING BRANCHDIVISION OF RESEARCH
OFFICE OF CHIEF ENGINEERDENVER, COLORADO
NOVEMBER 1967
Reprinted April 1970

The information contained in this report may not be used in anypublication, advertising, or other promotion in such a manneras to constitute an endorsement by the United States Governmentor the Bureau of Reclamation, either explicit or implicit, ofany material, product, device, or process that may be referredto in the report.
Where approximate or nominal English units are used to express avalue or range of values, the converted metric units in parenthesesare also approximate or nominal. Where precise English units areused, the converted metric units are expressed as equally significantvalues.

Report No. ChE-70
WATER QUALITY STUDY OF LAKE MEAD
byDale A. Hoffman, Paul R. Tramutt, and Frank C. Heller
November 1967
Reprinted 1970
CHEMICAL ENGINEERING BRANCHDIVISION OF RESEARCH
UNITED STATES DEPARTMENT OF THE INTERIOR * BUREAU OF RECLAMATION
Office of Chief Engineer . Denver, Colorado

ACKNOWLEDGMENT
This study was conducted by Dr. Dale A. Hoffman and Mr. Frank C.Heller under the supervision of Mr. Paul R. Tramutt, Head,Chemistry and Water Quality Research Section. Mr. Lloyd 0.Timblin, Jr., is Chief of the Chemical Engineering Branch. Thecontributions of others in the preparation of this report isacknowledged separately herein.
This reprint includes minor corrections

ERRATA SHEET
Water Quality Study of Lake MeadLaboratory Report ChE-70
Abstract
Page iv -t Lines 5 and 6, should read: cycle characterized bysummer stratification, fall overturn leading into acontinuous circulation throughout the winter tem-peratures - - -.
Report
Page 4 - Paragraph 2, line 8: change homothermous toisothermous.
Page 6 - Paragraph 5, line 3, should read: spring surveyswere made during the spring mixing and beforestratification had formed.
Appendix A
Page 101 - Station 6PH:
Change 51 , November 1965 value from 0 .8 to 8. 8.Change 50', April 1966 value from 0. 3 to 8. 3.
Page 103 - Station 8PH:
Change 5", November 1965 value from 0.5 to 8.5.
Page 105 - Station 9PH:
Change 5', November 1965 value from 0. 2 to 8. 2.\e 107 - Station 10
pH:
Change 150', November 1966 value from 0. 05 to 7 . 7 .\e 123 -
Carbon dioxide:
Delete under column headed "November 1965, " 0. 0 fordepths of 5', 50', 100' and 2. 2 for 140'.

Enter under column headed "23A November 1965, " 0. 0 fordepths of 5', 50', 100' and 2.2 for 140'.
Page 129 -
No 003 was detected.
Pages 131, 136, 140 -
CO2 should read COs.
Appendix B
Units of measurement are mg/L for TDS, Ca, Mg, Na, K,HC03, S04, Cl, NOs-

CONTENTS
Page
Abstract ivIntroduction 1Summary and Conclusions 1
Part I. Limnological Background 3Part II. Lake Mead Study 6
Introduction 6Methods and Materials 6Discussion of Results 11
Temperature 11Dissolved Oxygen 12Carbon Dioxide - Carbonate 13pH 13Conductivity 13Light Transparency 14Algae Growth Nutrients 14Mineral Quality . . . . . 16Effect of Lake Powell 17
Future Research 20Glossary 21Acknowledgments 22Bibliography 23
APPENDIX A
Chemical and Physical Data 25
APPENDIX B
Chemical Analyses Data 63
APPENDIX C
Photographs 149
FIGURES
Figure
1 Boulder Basin, Lake Mead 72 Sample Stations, Lake Mead 83 Sample Stations, Boulder Basin 10

CONTENTS - Continued
Figure Page
4 Temperature, Station 1, 1964-66 275 Conductivity, Station 1, 1964-66 836 Dissolved Oxygen, Station 1, 1964-66 857 Station 1, Temperature, Dissolved
Oxygen, Conductivity 878 Station 1, pll, Carbon Dioxide, Alkalinity 899 Station 3, Temperature, Dissolved
Oxygen, Conductivity 9110 Station 3, pH, Carbon Dioxide, Alkalinity 9311 Station 4, Temperature, Dissolved
Oxygen, Conductivity 9512 Station 4, pH, Carbon Dioxide, Alkalinity 9713 Station 6, Temperature, Dissolved
Oxygen, Conductivity 9914 Station 6, pH, Carbon Dioxide, Alkalinity 10115 Station 14, Temperature, Dissolved
Oxygen, Conductivity 10316 Station 14, pH, Carbon Dioxide, Alkalinity . . . . 10517 Station 16, Temperature, Dissolved Oxygen,
Conductivity 10718 Station 16, pH, Carbon Dioxide, Alkalinity . . . . 10919 Station 18, Temperature, Dissolved Oxygen,
Conductivity Ill20 Station 18, pH, Carbon Dioxide, Alkalinity . . . . 11321 Station 20, Temperature, Dissolved Oxygen,
Conductivity 11522 Station 20, pll, Carbon Dioxide, Alkalinity . . . . 11723 Station 8, Temperature, Dissolved Oxygen,
Conductivity, pH, Carbon Dioxide,Alkalinity 119
24 Station 9, Temperature, Dissolved Oxygen,Conductivity, pH, Carbon Dioxide,Alkalinity 121
25 Station 10, Temperature, Dissolved Oxygen,Conductivity, pH, Carbon Dioxide,Alkalinity 123
26 Temperature Isopleth, Lake Mead, Fall 1965 . . . . 12527 Temperature Isopleth, Lake Mead, Fall 1966 . . . . 12728 Temperature-Dissolved Oxygen Isopleths,
Lake Mead, Spring 1965 12929 Temperature-Dissolved Oxygen Isopleths,
Lake Mead, Spring 1966 13130 Dissolved Oxygen Isopleth, Lake Mead,
Fall 1965 13331 Dissolved Oxygen Isopleth, Lake Mead,
Fall 1966 135
11

CONTENTS - Continued
Page
32 Conductivity Isopleth, Lake Mead, Fall 1965 . . . . 13733 Conductivity Isopleth, Lake Mead, Fall 1966 . . . . 13934 Conductivity and Total Dissolved Solids,
Lake Mead, 1965-66 14135 Cations, Lake Mead, 1964-66 14336 Anions, Lake Mead, 1964-66 14537 Colorado River Flow and Lake Mead
Elevation, 1964-66 147
TABLES
Table
1 Survey Dates and Season, Lake MeadLimnology Study 6
2 Conductivity, Micromhos/centimeter at25° C, Stations 1, 20, and 24 14
3 Secchi Disc Readings, Lake Mead 154 Phosphorus and Nitrogen, Lake Mead 165 Chemical Analyses, Stations 1, 12, 20, and 22 ... 186 Chemical Analyses, Inflowing Waters to
Lake Mead 19

ABSTRACT
This report presents Lake Mead Water quality data obtained from 1964 to1966. The effect of filling Lake Powell on the water quality of LakeMead is evaluated. General limnological principles and the presentlimnology of Lake Mead are discussed. Lake Mead has a warm monomicticannual temperature cycle characterized by summer stratification, falloverturn leading into a continuous circulation throughout the winter;temperatures never fall below 39 deg F (4 deg C). During stratification,lower dissolved oxygen values were recorded in the thermocline than inthe epilimnion and hypolimnion. Mineral content increases from the upperto the lower end of Lake Mead. The greatest increase is in calcium andsodium sulfates and chlorides, although there is an overall decrease inbicarbonate. The filling of Lake Powell intensified the deterioration ofwater quality in Lake Mead during 1965, as evidenced by increased tempera-ture, conductivity, and total dissolved solids and decreased dissolvedoxygen. Las Vegas Bay reach was found to be a major source for degradationof water quality in Lake Mead because of its large input of dissolved saltsand algae nutrients. The monitoring station at Hoover Dam has been a use-ful indicator of water quality in the lower reach of Boulder Basin.
DESCRIPTORS— *dissolved oxygen/ electrical conductance/ reservoirs/ watersupplies/ *limnology/ pH/ temperature/ salinity/ *water quality/ multiplepurpose projects/ test procedures/ chemical engineering/ chemical analysis/chemistry/ basins/ field laboratories/ field tests/ laboratory tests/ watersampling/ field data/ water management/ *water analysis/ reservoir surveysIDENTIFIERS-- Lake Mead/ Boulder Canyon Project/ *water chemistry/ Winklermethod/ dissolved carbon dioxide/ Lake Powell/ impoundments
IV

UNITED STATESDEPARTMENT OF THE INTERIOR
BUREAU OF RECLAMATION
INTRODUCTION
During FY 64, the Bureau of Reclamation initiated a research program atLake Mead to obtain: (1) dissolved oxygen data, (2) water quality databefore the impoundment of water in Lake Powell became a significant fac-tor in the quality of water in Lake Mead, and (3) additional measurementsfor evaluating the data previously collected at the Hoover Dam intaketower station. A previous study was conducted during 1948-50, coopera-tively by the Bureau of Reclamation, Geological Survey, and the NavyElectronics Laboratory. Since that time, continuing monthly measurementshave been made of a limited number of water quality parameters at theintake towers. Although these measurements are a valuable guide to thewater quality released from the reservoir, they do not describe the waterquality throughout the remainder of the lake. For this reason, it wasdecided that a study of Boulder Basin would establish a basis for futuresurveys regarding the effect of future storage. Chemical EngineeringReport ChE-46, dated June 1965, presented the results of the initialprogram, and includes data on such parameters as pll, electrical conduc-tivity, temperature, dissolved carbon dioxide, and dissolved oxygen. I/
The purpose of this report is to: (1) present the data collected atselected seasons during the 3-year study describing the physical andchemical limnology of Lake Mead, (2) evaluate the effect of filling LakePowell upon the limnology of Lake Mead, (3) provide information on prob-lem areas where future research and/or remedial measures are needed, (4)describe the present limnology of Lake Mead and its significance to cur-rent and future water quality in the reservoir, and (5) describe generallimnological principles to engineers and scientists in the Bureau ofReclamation, who are not familiar with this aspect of water resources.
SUMMARY AND CONCLUSIONS
During the spring of 1964, a water quality survey was initiated at LakeMead to determine: (1) the chemical and physical limnology of LakeMead, (2) the effect of impounding water in Lake Powell upon the waterquality in Lake Mead, and (3) to evaluate the data previously collectedat the intake tower station. This survey was continued with field tripsduring the spring and fall of 1964, 1965, and 1966.
I/ All citations are listed in Bibliography at end of text.

The annual temperature cycle of Lake Mead can be classified as warmmonoraictic, in that the temperature is never below 39.2° F (except per-haps at the inlet), undergoes circulation during the winter, and isdirectly stratified in the summer.
During the period of stratification a negative heterograde dissolvedoxygen profile develops, in which the minimum is located in the ther-mocline. Also, at this time the total alkalinity and carbon dioxideincreased in the thermocline and hypolimnion.
There is an increase in mineral content from the upper to the lowerend of Lake Mead with the greatest increases being in the sulfates andchlorides of calcium and sodium. The only decrease noted was in thebicarbonate value.
The impoundment of water in Lake Powell, which lowered the level of waterin Lake Mead, intensified the deterioration of water quality in Lake Mead.This was typified by increased mineral content, increased conductivity,increased temperature, and decreased dissolved oxygen values. However,since the elevation of Lake Mead has raised, the water quality hasimproved.
Water quality data collected from the Las Vegas Wash drain, Virgin River,and Muddy River indicated that these sources are contributors of poorquality water to Lake Mead. These rivers may cause the deterioration ofwater quality in the basins into which they drain.
The inflow from Las Vegas Wash is of particular importance since it isa major source of wastes which contribute to the deterioration of waterquality in Lake Mead, and will become more important as the SouthernNevada Project reaches full operation.
The determination of the existence of a negative heterograde dissolvedoxygen profile during summer stratification presents the opportunity forselecting water of optimum dissolved oxygen value for enhancement ofdownstream water quality if necessary.
The survey data indicate that the monitoring station at the intake towersof Hoover Dam has provided a general indication of water quality parametersin Boulder Basin, but not in the other reaches of the lake. For morespecific and detailed water quality information concerning future uses ofLake Mead, other stations will be necessary.

Limnological Background - Part I
In order to more clearly describe the limnological characteristics ofLake Mead, a short review of some general limnological principles willbe presented, using a temperate zone lake as an example. When consider-ing the following limnological principles, one must remember that althougha reservoir has lentic* (lake-like) characteristics, being located on astream or river, it will also possess lotic (flowing) characteristics.Consequently, at certain times of the year, some reservoirs may be morelike a river than a lake.
The most important phenomenon in the annual cycle of a lake or reservoiris that concerning temperature. All biological, chemical, and otherphysical cycles are directly or indirectly influenced by temperature. Animportant characteristic of water is that as its temperature decreases,its density increases. This inverse relationship between temperature anddensity continues until a temperature of 3.9° C (39.2° F) is reached. Withfurther cooling, the density decreases and water becomes lighter. Thuswater with a temperature between zero and 3.9° C (32 and 39.2° F) is lighterthan water with a temperature of 4° C (39.4° F).
A convenient time of the year to begin a description of the temperaturecycle of a lake is in the spring, when the ice cover starts to melt. Atthis time a temperature profile, from surface to bottom, would showwater with a temperature of 0° C immediately under the ice. Below thislayer of water, the temperature increases from 0° to 4° C as one followsthe profile into the deeper water. This arrangement is known as winterstratification or inverse stratification, since colder water is on topof warmer water.
With the advent of spring, the ice cover melts exposing the surface layerof water to solar radiation, thereby raising its temperature above 0° C.As the water becomes warmer it also becomes denser and sinks down throughthe colder but lighter water, setting up convection currents. However,the action of the spring winds is the most important factor in mixingthe surface waters with the deeper waters. The combined action of con-vection currents and wind brings the water temperatures to an equilibriumfrom top to bottom, thereby reducing the stability and resistance tomixing of the lake to zero. At this point, the lake is in complete cir-culation. During circulation the lake is resupplied with organic mate-rial and nutrients brought up off the bottom and dissolved oxygen isdistributed throughout the area of mixing. This period of circulationis known as the spring overturn.
During the summer, the increased amount of solar radiation heats theupper waters of the lake. As the surface waters become warmer, the tem-perature and density gradients between them and the deeper waters increase.
*Glossary on page 92.

With a greater density gradient, the lake becomes more resistant to mixingand more stable. Consequently, the area of mixing is reduced and limitedto the upper warmer layer, known as the epilimnion. Beneath the epilmnionis a zone of transition, in which the rate of decrease in temperature perunit of depth is greater than in the upper and deeper layers. This zoneor layer is known as the thermocline, and acts as a barrier between theepilimnion and the lower layer, the hypolimnion. The hypolimnion iscolder than the other two layers and essentially isolated from furthercontact with the atmosphere. The period during which the three layersare present is known as summer stratification. In this case the strati-fication is direct, i.e., warmer water on top of colder water. Thiscontrasts with the condition during the period of winter stratification.
As fall approaches, the days are shorter and cooler, decreasing the amountof heat input from solar radiation. The upper layer of the lake decreasesin temperature due to heat loss to the colder air. As the surface watercools, it becomes denser and sinks into the underlying warmer water set-ting up convection currents. Essentially the same factors that causedthe spring overturn, wind action and convection currents, are responsiblefor the fall overturn. At this time, the lake again becomes isothermousand undergoes complete circulation.
With the advent of colder fall and winter air temperatures, the surfacewaters continue to cool until reaching a temperature of 3.9° C. Furthercooling results in a decrease in density and the surface waters remainon top of the underlying warmer but denser waters. With continued cool-ing and windless conditions, the ice cover forms and isolates the lakefrom the atmosphere, beginning the period of winter stratification.
In conjunction with the temperature cycle are those of various chemicalconstituents. For example, as the lake passes through the period ofspring overturn, it is reoxygenated. But after summer stratificationbegins, no further oxygen is brought into the hypolimnion and organicmaterial settling out from the upper waters will utilize the oxygenresulting in a profile of decreasing oxygen values from surface tobottom. At the same time, carbon dioxide is produced in the hypolimnionfrom decomposition of organic material. Thus, at the end of the summer,it is possible for the deeper waters to be devoid of oxygen and rich incarbon dioxide.
The lack of dissolved oxygen will cause iron, manganese and phosphorusto come into solution from the benthic mud. If this water is used fordomestic purposes, the iron and manganese may cause taste and stain prob-lems. When the fall overturn occurs, these materials are mixed with theupper waters, thus affecting a larger volume of |*ater with potentialproblems. This is why some domestic water supplies have reduced waterquality each fall. Also, the carbon dioxide brought up into the upperwaters can cause fish kills. The phosphorus brought up during thespring overturn acts as a nutrient supply for algae blooms.
Essentially, the same temperature cycle occurs in both a lake and a reser-voir located in the temperate zone. However, since a reservoir is usuallylocated on a river or stream, its limnological cycles will be altered bythe incoming flow. Also, the location and operation of the outlets willaffect the limnological regime of a reservoir, especially after summerstratification is established.
As the inflowing stream enters, it will sink into the reservoir untilreaching water of its same density. If the inflow is colder, it willsink through the warmer upper waters of the reservoir. Thus it is pos-sible for a river to flow through a reservoir and out the discharge gates,although usually it becomes mixed with the reservoir water. An inflowcontaining silt, organic debris, and/or waste could flow through a reser-voir and have a detrimental effect on the quality of the water being dis-charged. When the lower tunnel of Hoover Dam was being used, si It-ladendensity currents flowed through Lake Mead. I/ Now that the upper outletsare being used, the density currents are no longer detected downstream.Similarly, if the temperature of the inflowing water is warmer than thatof the reservoir, the inflow will remain on top or within the upper layer.The quality of the water released from a stratified reservoir will be thesame as that at the depth of the outlet. If the outlet is located nearthe bottom of the dam, the released water will come only from the hypolim-nion and not from the upper layers. Water from the upper layers will notappear in the discharge until the hypolimnetic water has been discharged.A knowledge of the quality and quantity of the water in a reservoir andthe rate of discharge will enable the dam operator to predict the timeat which the type of water will change. This also holds true for outletsin the upper part of the dam. It is readily apparent that multiple out-lets enable the operator to select the desired quality of water to servedownstream users.
The above description is that of a typical temperate zone lake and res-ervoir. The temperature cycles of lakes or reservoirs located in thearctic or tropical zones will be different. For example, in some polarlakes the water temperature is always below 4° C and in some tropic lakesalways well above 4 C. Lake Mead has a temperature cycle that is clas-sified as warm monomictic, that is, never below 4° C, freely circulatingin the winter above 4° C, and directly stratified during the summer. 2/

Lake Mead Study - Part II '
Introduction
The water quality study of Lake Mead was initiated during 1964. A reportof the 1964 survey has been published. I/ In order to maintain continuitywith the 1965 and 1966 surveys, some 1964 data have been included in thepresent report.
Lake Mead is a canyon-type reservoir formed by impounding the ColoradoRiver behind Hoover Dam. Photographs of the lake are presented in Appen-dix C. At full elevation, the reservoir extends a distance of 115 milesupstream and has a capacity of 31,047,000 acre-feet. The maximum depthis 589 feet, and when full the shoreline of 550 miles encompasses 158,000surface acres. The water is used for power, domestic and industrial sup-ply, recreation, flood control, and irrigation. The lake is made up offour major sections, Boulder Basin, Virgin Basin, Overton Arm, and thereach extending from Virgin Basin upstream to Pierce's Ferry (Figures 1and 2).
Methods and Materials
Sample dates. - Field studies were made during the spring of 1964 andthe spring and fall of 1965 and 1966. The survey dates and season ofthe year are given in Table 1.
Table 1
SURVEY DATES AND SEASONLAKE MEAD LIMNOLOGY STUDY
Season Date
Spring April 23 - May 8, 1964Spring May 11-24, 1965Fall November 1-11, 1965Spring April 14-20, 1966Fall November 1-9, 1966
The 1964 spring survey was scheduled so that data could be collectedbefore Lake Mead reached a low level due to filling Lake Powell. The1965 spring survey was made at the time Lake Mead was at a low leveland the 1965 fall surveys and both 1966 surveys were conducted afterLake Mead had returned to the early 1964 elevation.
By scheduling the surveys as described above, data were collectedduring key periods of the lake's annual temperature cycle. Thus thespring surveys were made during the spring mixing and before strati-fication had formed, while the fall surveys were made after the lake

(
Figure 1. Boulder Basin, Lake Mead.Photo P45-300-7327

Virgin River
Muddy River
LAKE MEADWater Quality Survey Stations
Upper Lake Phase1965-1966
22A
Virgin Canyon
Figure 2
'

wwas well stratified. Also, the effect of filling Lake Powell uponthe limnology of Lake Mead could be ascertained by using the 1964 dataas a base line. The spring surveys were limited to Boulder and VirginBasins. During the fall, the water quality studies were combined withthe annual sediment surveys and the upper reaches of the lake as wellas Boulder and Virgin Basins were studied.
Sample Stations. - Twenty-eight sample stations were initially estab-lished throughout the length of Lake Mead. The station locations aregiven in Figures 2 and 3. The station locations are in the same gen-eral areas as those of the 1948-50 study. V Since data collectedduring the first and second trips indicated that some stations weresimilar, only one of the similar stations was sampled during the latersurveys.
Station 1, located between the intake towers of Hoover Dam, is uniquein that water analyses have been conducted at this point for over20 years. Over the past years, this station has been used as the keymonitoring station for Lake Mead. However, due either to operatorerror and/or instrument malfunction, some of the data collected beforethe start of this survey are questionable. Figures 4, 5, and 6 showplots of temperature, conductivity, and dissolved oxygen at Station 1during the period of study covered by this report, 1964-66.
Due to size of the lake and the best utilization of men and equipment,the principal part of the work has been accomplished in Boulder Basin.This basin is also the most important reach of the lake from the stand-point of present and future water use.
Analytical Techniques. - Water samples were collected by means of aplexiglass Kemmerer water sampler. Photographs of the equipment arepresented in Appendix C. Tests for dissolved oxygen, carbon dioxide,pH, and alkalinity were conducted in the boat laboratory immediatelyafter collection. Temperature and conductivity were measured with aportable instrument. Light transparency was measured with a 20-centi-meter-diameter Secchi disc, divided into alternate black and whitequadrants. Water samples for chemical analyses were placed in poly-ethylene bottles for return to the chemistry laboratory in Denver,Colorado. These samples were analyzed for calcium, magnesium, sodium,potassium, carbonate, bicarbonate, sulfate, chloride, nitrate, electri-cal conductivity, total dissolved solids, and pH. The analyses forthe above parameters were conducted according to the methods given inStandard Methods for the Analysis of Water and Waste Water. 4/ Separ-ate water samples for phosphorus analyses were collected and treatedto prevent bacterial decay by a variety of techniques as follows:those collected in the fall 1965 were quick frozen in polyethylenebottles, those collected in the spring of 1966 were treated with chlor-oform in polyethylene bottles, and those collected in the fall of 1966were treated with mercury bichloride in acid washed pyrex bottles. The

^
O T
-•
•8n0)oo

analyses of the 1965 and spring 1966 samples were for soluble phosphateby the araino naphthol sulfonic acid method. 4_/ The samples collectedthe fall of 1966 were filtered through a membrane filter and the resi-due analyzed for insoluble phosphorus, while the filtrate was analyzedfor soluble phosphorus according to the method of Jenkins. 5/
Discussion of Results
The data collected during this study are given in Appendix A.
Temperature. - Temperature measurements were taken during each sea-sonal survey. Although the spring surveys had similar profiles, theoverall temperatures in 1964 were colder than 1965 and 1966, and thosein 1966 colder than 1965. For example, during the spring the tempera-tures at the 100-foot depth, in consecutive order for the years 1964,1966, and 1965, in Boulder Basin were: Station 1, 52.7, 53.8, and56.5; Station 4, 52.3, 54.5, and 55.5; Station 6, 52.5, 54.0, and56.2; and Station 16, 54.0, 54.2, and 56.0 (Figures 7, 11, 13, and 17).
The sequence in the development of summer stratification can be seenin the spring survey temperature profiles of the representative sta-tions, starting with the data from April 1964, then April 1966, fol-lowed by May 1965. The April data show the gradual warming of thesurface waters; and the beginning of the thermocline is apparent atthe 50- to 100-foot level in the May survey. The established thermo-cline can be seen at the 100- to 200-foot level in the fall surveysof 1965 and 1966 (Figures 7-27).
During stratification, the upper zone, the epilimnion, consists of67-70° F water; the middle zone, the thermocline, is located between100-250 feet, with temperatures between 54° and 66° F; and the deepzone, the hypolimnion, below 250 feet, consists of water of tempera-tures between 52° and 54° F. This condition exists throughout thelake (Figures 27 and 28).
The data from the monthly surveys at Station 1 indicate that strati-fication begins to break up and circulation begins during Decemberand January, with the lake becoming isothermous within 30 days. Atthis time, the lake temperatures from bottom to surface were 53° to55° F in 1964, 54° F in 1965, and 53° to 56° F in 1966 (Figure 4).
After an initial warming period during the early spring, there is adecrease in the water temperatures of the upper 50 feet, and anincrease in temperatures below this depth. This may be due to theinflow of spring runoff consisting of water with a temperature nearthose at the 50-foot level. The spring winds help to mix the warmersurface water with the colder spring inflow resulting in a net decreasein the temperature of the upper waters. Anderson and Pritchard's workshowed that the spring inflow current set up a countercurrent in the
11

deeper waters, creating a cell of circulating water. 3_/ Such a cir-culating cell could mix the colder deep water with the warmer inflow,resulting in a net temperature increase in the deeper zone. The effectof this mixing can be seen in Figure 4 with the concurrent temperatureincrease in the 50- to 100-foot layer and a decrease in the surface to50-foot layer, during May 1964, June 1965, and May 1966.
Dissolved Oxygen. - Closely associated with the temperature cycle isthat of dissolved oxygen. The largest part of the dissolved oxygenin a reservoir is supplied during the spring and fall overturns. Alesser amount is provided by photosynthetic action of algae and aquaticplants. Still another source of dissolved oxygen is that of the inflow-ing streams.
The dissolved oxygen isopleths in Figures 28 and 29 show that duringthe spring the reservoir is reaerated from surface to bottom. However,after stratification is formed, the lower depths are isolated from theatmosphere and no further oxygen is supplied directly from the atmos-phere. The normal pattern of dissolved oxygen during stratificationshows decreasing amounts from surface to bottom. However, in LakeMead, the pattern of dissolved oxygen fits Hutchinson's classificationas negative heterograde. 2/ This type of oxygen profile is typifiedby a marked minimum in the thermocline with higher quantities in theepilimnion and hypolimnion. This condition existed throughout thereservoir during the fall of 1965 and 1966 (Figures 31 and 32).
Two probable causes for this type of dissolved oxygen distributionare suggested by Hutchinson. 2/ In one case organic material, suchas algae, is produced in the epilimnion, then sinks into the thermo-cline where it is oxidized. The other possible cause is that thedepth of the oxygen minimum corresponds to a shelf in the bottom con-tour. It is not known what causes the low dissolved oxygen zone inLake Mead, but it may be a combination of the two above-mentionedcauses. Although Lake Mead is considered as a canyon-type reservoir,Boulder and Virgin Basins have a flat contour which could be describedas shelf-like. Work by Sisler indicated a large number of bacteria inthe sediments at the towers. 6_/ Such a bacterial population could bea source of oxygen utilization. Algae blooms have been reported inLake Mead and taste and odor problems have occurred in domestic watersupplies taken from the lake. The magnitude and classification ofthe algae blooms have not been thoroughly studied in Lake Mead. Workby the FWPCA indicates the presence of algae blooms in the Las VegasWash area and the potential for greater blooms. 7/ Another source oforganic material is the debris brought in with the spring runoff.Still another cause of the oxygen depletion could be the presence oflarge populations of zooplankton.
Examination of the dissolved oxygen profiles for the Boulder Basinindicates that the amount of dissolved oxygen below 100 feet, at the
12

beginning of the summer, decreased with each succeeding year (Figures 7,9, 11, 13, 15, 17, and 19). To date (1967) the layer of low dissolvedoxygen (<3 mg/L) has not reached the depth of the outlets of Hoover Dam.
Carbon Dioxide. - The water quality parameters of carbon dioxide car-bonate, and bicarbonate will be discussed concurrently since they areinterrelated in the carbonate cycle. The principal sources of carbondioxide in water are the atmosphere, decomposition of organic material,respiration by plants and animals, and combination with such elementsas calcium and magnesium.
When present in sufficient quantities, carbon dioxide combines withwater forming carbonic acid. This in turn acts upon the relativelyinsoluble carbonates forming the relatively soluble bicarbonates.This relationship is apparent in the figures for free carbon dioxide,phenolphthalein alkalinity and total alkalinity. The depth at whichthe total alkalinity increases, 50 to 150 feet, is approximately thesame as that at which the carbonate alkalinity decreases and the car-bon dioxide increases. The profile for carbon dioxide and total alka-linity is nearly inverse to that for oxygen. Also, during 1965, therewas a loss in total alkalinity in the upper 100 feet and a gain belowthis depth during the summer. To a lesser degree, the same trend isnoticeable during 1966.
Station 3 is unique from the others in that during the spring 1965survey, carbonate alkalinity was detected from the surface to 300 feet.This was the only station and the time that carbonate alkalinity wasdetected below 150 feet (Figure 10).
pH. - Values of hydrogen ion as pH ranged from 7.0 to 9.3 during theperiod of study. During periods of stratification values below 8.3were found in the thermocline and hypolimnion. These values reflectthe presence of carbon dioxide in these zones. The pH of the epilim-nion was usually 8.6 to 9.3. During the spring, the pH values aver-aged 8.3 from the surface to the bottom, with lower values in thedeeper waters.
Conductivity. - Measurement of electrical conductivity is a methodby which an indication of the quantity of dissolved solids can bedetermined. The results given in the tables and figures are correctedto a standard temperature of 25° C (77° F). The significant featurein the conductivity data during the period of study is the largeincrease during 1965. The data from Station 1, as given in Figure 5,depict the change in electrical conductivity during 1964, 1965, and1966. The large increase is due to the retention of water in LakePowell and subsequent release from the lower depths of that lake.
During the fall surveys of 1965 and 1966, a layer of lower conductiv-ity (as compared to the rest of the lake) was detected at the bottomof the thermocline. The conductivity of this layer was approximately
13

50 micromhos less than that of the water above and below. This layeroccurred both years even though the conductivity values were higherin 1965. The layer was only present in the Boulder Basin, whereasthe conductivity in the remainder of the lake increased with increas-ing depth (Figures 32 and 33). This layer may be part of the fallinflow moving along a temperature gradient.
In general, the conductivity increases from the inlet to the outlet.For example, during the fall surveys the conductivities of Stations 1,20, and 24 at various depths are given in Table 2.
Table 2
CONDUCTIVITY MICROMHOS/CENTIMETER AT 25° C
5 f e e t 1 0 0 f e e t 3 0 0 feetStation 1965 1966 1965 1966 1965 1966
12024
1,2501,000650
1,040920795
1,2101,100
1,050920
1,2501,190
1,060970
The highest conductivity measured in the lake proper was 1,460 micro-mhos, at Station 10 during the fall of 1965 (Figure 25).
Light Transparency. - The amount of light penetration was determinedby Secchi disc measurements. These data provide a comparison of theturbidity between stations and are presented in Table 3.
Stations 10 and 10A had consistently low readings as compared withthe rest of Lake Mead. Low readings are also noted for Stations 23,23A, and 24 near the mouth of the Colorado River, and Station OV2,near the mouth of the Virgin River. The low readings at the latterstations are due to silt from the rivers, whereas the low readingsat Stations 10 and 10A are due to algae blooms and silt. The effectof the algae blooms is especially noticeable during the spring.
Algae Growth Nutrients. - Water samples were collected from selectedstations for phosphorus and nitrogen analysis (Table 4). These datagive an indication of the potential for algae growth. Although thespecific amounts vary from lake to lake, the generally accepted thresh-old values to support algae blooms are 0.3 mg/L nitrogen and 0.015 mg/Lphosphorus. On the basis of the above threshold values, it can be seenthat the large algae blooms observed in Las Vegas Bay, as compared toBoulder Basin, are due to the larger amounts of phosphorus and nitrogenin the Bay.
14

Table 3
SECCHI DISC READINGS - LAKE MEADDepth in Feet
Station
1233A3B
3C44A4B5
678910
10A11121314
1516171819
20212222A23
23A24
OV1OV2
5/65
28352823
—
28--32__
—
22261885.5
—38363130
27223430- -
— _
'--
—--
—_ _
--
——
11/65
2217----21
1720--2015
2018141818
11--18--24_ _
25--2516
2118141711
101
199
4/66
383035--- -
3336--31
—
36--36468
4_ _
28--26_ _
34--30
— —
28
————
~ _----
—
11/66
18
17--— -
1719--21
—
19--181812
10--20--22
—----19
—
25
—25
——_ _
42110
15

Phosphorus and nitrogen analyses were conducted on samples from similarstations during May 1966 by the Federal Water Pollution Control Admin-istration. 7/ Their data show lower values for ammonia and nitrate-nitrogen and total phosphorus and higher values for organic nitrogenthan during our November 1966 survey (Table 4). This difference maybe due to the utilization of these nutrients by algae blooms whichwere present during the spring but not the fall survey.
No samples for algae identification and enumeration were collected bythe Bureau of Reclamation, but such analyses were made by the FederalWater Pollution Control Administration and their data confirm thepresence of algae blooms in Las Vegas Bay. TJ
Table 4
PHOSPHORUS AND NITROGEN, LAKE MEADmg/L
Phosphorus (P04)Station
3C
4B
10
10A
Depth
Surface10 feet
Surface10 feet
Surface10 feet
Surface10 feet
Insoluble
0.330.26
0.330.35
0.430.45
0.780.85
Soluble
0.100.16
0.160.10
0.100.04
0.040.00
Nitrogen (N)N03
0.27
0.14
0.27
0.14
NH3
0.220.25
0.250.28
0.340.44
0.630.53
Organic
0.320.20
0.360.30
0.300.36
0.370.39
North Surface - 7.90 0.00 0.89 0.16ShoreDrive
Mineral Quality. - Water samples were collected from the shallow,5 to 10 feet, and deep, 100 to 200 feet, zones of the lake for chem-ical analysis. The data are presented in Appendix B, with selectedstations plotted in Figures 34, 35, and 36 in order to show seasonal,geographical, and zonal variations.
16

It is evident that the mineral content of the water in Lake Mead wasgreater during 1965 than 1964 or 1966. For example, during the springseason, the values for calcium and bicarbonate in the shallow zone atStation 1 were as follows: 1964, 87 mg/L and 144 mg/L; 1965, 110 mg/Land 154 mg/L; and 1966, 94 mg/L and 144 mg/L.
Seasonal differences can be seen by examination of the data in Fig-ures 35, 36, and 37, which show that the values for the parametersmeasured are higher during the spring than in the fall at the samestation. During stratification, the mineral content increases withdepth; this is especially noticeable with the bicarbonate values dur-ing the fall of 1965 (Figure 36).
In general, there is an increase in mineral content from the upperto the lower end of Lake Mead and the greatest increases are foundin the sulfate and chlorides of calcium and sodium; however, thereis a decrease in bicarbonate. The chemical analyses from the upperand lower end of Lake Mead are given in Table 5 and represent samplestaken in the fall of 1966. Other chemical data showing the improvedmineral quality of the water since the period of poor condition (1965)are found in Figures 34, 35, and 36.
Since it is desirable to know the chemical quality of the incomingrivers and streams, samples were collected from the Las Vegas Washdrain, Muddy River, and Virgin River. The total volume of watercoming from flows of the Virgin and Muddy Rivers is small comparedto the volume of water in Lake Mead; however, they contribute a con-siderable amount of minerals into the local area of the Upper OvertonArm. The high mineral content contributed by these rivers couldeffect the future water quality of withdrawals from the Upper OvertonArm for both domestic and irrigation uses. Samples were also takenwithin the zone of convergence of the Colorado River with Lake Mead.The results of these analyses are given in Table 6.
Similarly, the impact of the mineral contribution from the Las VegasWash to Boulder Basin will effect the quality of water withdrawn forfuture use in the Southern Nevada Project. Since the current patternsin Boulder Basin are not well known, the possibility exists that waterfrom Las Vegas Wash will short circuit into domestic water intakes nearSaddle Island. The deterioration of water quality at Stations 9 and 10in Las Vegas Wash as compared to Station 8 in Boulder Basin can be seenin Figures 23, 24, and 25.
Effect of Lake Powell. - One purpose of this study was to determinethe effect of Lake Powell upon the water quality in Lake Mead. DuringMarch 1963, storage was begun in Lake Powell. While water was beingstored in Lake Powell, the flow into Lake Mead was reduced, resultingin a decrease in the water level in the latter. The lowest level dur-ing this period was reached in January 1965. During the spring andsummer of 1965, the flow to Lake Mead increased and the lake reachedthe early 1964 level (Figure 37).
17

Table 5
CHEMICAL ANALYSIS—STATIONS 1, 12, 20, 22Lake Mead
1966Station No.DepthParameter
EC x 106at 25° C
PH
TDS mg/L
Ca mg/L
Mg mg/L
Na mg/L
K mg/L
HC03 mg/L
S04 mg/L
Cl mg/L
N03 mg/L
1 — Hoover Dam10
1,106
8.3
748
80
31
105
5.5
129
312
94
1.2
100
1,100
7.9
740
87
27 ~
101
5.5
146
303
94
2.5
12 — Boulder Basin10
1,076
8.2
812
82
28
101
5.5
125
304
92
0.6
100
1,084
8.0
828
85
30
98
5.5
138
299
93
2.5
20— Vir10
971
8.1
676
78
26
90
4.7
140
268
74
1.2
?in Basin100
976
8.3
692
78
26
90
4.7
144
269
77
1.9
2 2- -Virgin Canyon10
881
8.2
628
72
21
81
4.3
145
223
70
1.9
100
885
8.0
608
69
23
78
3.9
154
213
73
1.9
00

Table 6
Chemical Analysis of InflowingWaters to Lake Mead
Station
DateParameter
EC x ,106at 25° C
PH
IDS mg/L
Ca mg/L
Mg mg/L
Na mg/L
K mg/L
003 mg/L
HC03 mg/L
Sty mg/L
Cl mg/L
N03 mg/L
Iceberg Canyon*Nov 81965
632
8.0
408
52
20
53
3.1
0.0
124
124
53
0.6
Oct 311966
851
7.9
608
71
20
77
3.9
0.0
151
209
65
0.6
Muddy RiverNov 11966
2,232
8.1
1,712
154
78
221
22
0.0
299
715
178
1.2
Virgin RiverNov 11966
1,276
8.0
908
95
35
121
7.4
0.0
135
369
119
0.6
Las Vegas WashNov 121965
6,384
8.1
5,424
496
228
656
63
0.0
271
1,718
1,264
44
Nov 61966
6,144
8.2
5,256
516
253
656
68
0.0
292
1,824
1,179
0.0
^Convergence Area of Colorado River
19

The effect of this fluctuation is reflected in the data from Station 1(Figures 4, 5, and 6). Data from the other stations also show thedifference in water quality during the study period.
The overall effect of filling Lake Powell was to intensify the deteri-oration of water quality in Lake Mead caused by low flows in theColorado River Basin. This is indicated by lower quantities of dis-solved oxygen, increased amounts of carbon dioxide, higher temperatures,higher conductivity, and higher alkalinity.
Where data are available, it appears that the spring 1966 water qualityvalues are similar to those of 1964. This indicates that the deteriora-tion during 1965 is being alleviated and the lake is returning to 1964conditions.
Future Research
The present study indicates that there is a decrease in dissolved oxygenduring periods of stratification. It is desirable to identify and measurethe material which utilizes this oxygen. The probable sources of the mate-rial are plankton, waste products, or debris from the inflowing rivers.More frequent surveys to measure the organic constituents of Lake Meadwould be necessary. This would include such measurements as Biologicaland Chemical Oxygen Demand, photosynthetic production of oxygen, the rela-tionship between zooplankton and oxygen, and the effect of the benthicenvironment upon the dissolved oxygen.
The present study and those of others indicate that Las Vegas Wash is asource of nutrients and wastes for Boulder Basin. Since the present useof Boulder Basin as a source of water supply and recreation will increase,it is desirable to ascertain the fate of the inflow from Las Vegas Wash.In order to do this, it is necessary to determine the current patterns inBoulder Basin by tracer studies, drouges, floats, and current meters.
Another monitoring station should be established in the vicinity of themouth of Las Vegas Bay. This station would provide more accurate data asto the water quality in Boulder Basin than the present station at HooverDam.
A study should be conducted to ascertain the effect of the Muddy Riverand the Virgin River upon the water quality of the Overton Arm. Theserivers drain a developing area and may cause a rapid deterioration ofwater quality in the Overton Arm reach of Lake Mead.
20

Benthi c
Epilimnion
Hypolimnion
Isopleth
Isothermous
Lentic
Limnology
Lotic
Negative HeterogradeDissolved Oxygen Curve
Overturn
Photosynthesis
Thermocline
Warm monomictic
GLOSSARY
The bottom zone of a body of water, rangesfrom the shore to the deep water.
The upper area of a lake or reservoir duringstratification, lies on top of the thermocline.
The bottom area of a lake or reservoir duringstratification, lies below the thermocline.
A line on a map or graph joining points of aspecific constant value.
Having the same temperature.
Flowing water, i.e., river or stream.
The study of inland waters.
Standing water, lake or reservoir.
Dissolved oxygen curve in which a marked mini-mum occurs in the area of the thermocline.
Condition whereby a lake or reservoir becomesisothermous and circulates from surface tobottom.
Construction of organic material (carbohydrates)from C02 and water with the aid of energy, usu-ally from sunlight, by chlorophyll-bearingplants.
The area of a stratified lake or reservoir thatseparates the epilimnion from the hypolimnion.The area where the change in temperature isgreatest with depth.
Thermo classification of a lake or reservoirin which the water temperature is never below4° C and freely circulates during the winterat or above 4° C.
21

ACKNOWLEDGMENTS
This report is the result of the combined efforts of many persons includ-ing the following Bureau of Reclamation laboratory and field personnel.The assistance of these individuals and all others who participated inthe planning and organizing of the program is deeply appreciated.
Office of Chief Engineer
Lloyd 0. Timblin, Jr.Edward T. LyonsDelmont M. HopkinsHoward A. SalmanHelen M. Frause
Boulder Basin Project
Dee 0. TowneDyer D. JohnsonC. R. BilderbackSteve ChubbsAmber Slack
22

BIBLIOGRAPHY
1. Bureau of Reclamation, 1965. Water Chemistry Survey of BoulderBasin, Lake Mead. Chemical Engineering Report No. ChE-46, 33 pp.
2. Hutchinson, G. 0., 1957, A. treatise on Limnology, Vol I,Geography, Physics, and Chemistry. John Wiley and Sons, Inc.,New York, 1015 pp.
3. Anderson, E. R. and D. W. Pritchard, 1951, Physical Limnology ofLake Mead, Lake Mead Sedimentation Survey, U.S. Navy ElectronicsLaboratory, San Diego, California, Report 258, October 3, 1951,153 pp.
4. American Public Health Association, Inc., 1960, Standard Methodsfor the Examination of Water and Waste Water, APHA, New York,626 pp.
5. Jenkins, D., 1965, A Study of Methods Suitable for the Analysisand Preservation of Phosphorus Forms in an Estuarine Environment.San. Eng. Lab Report No. 65-18, University of California, Berkeley,November 1965, 50 pp.
6. Sisler, F. D., 1954. Lake Mead Comprehensive Survey of 1948-49,Vol III, pp 266-281, U.S. Department Interior and U.S. DepartmentNavy, February 1954.
7. Federal Water Pollution Control Administration, 1967. Report onPollution in Las Vegas Wash and Las Vegas Bay, 18 pp.
23

APPENDIX A
CHEMICAL AND PHYSICAL DATA
25

M A M J J A S O N D J F M A M J J A S O N D J F M A M J J A S O N D
L A K E M E A D - S T A T I O N IT E M P E R A T U R E - ' F A H R E N H E I T
Figure 4

CHEMICAL AND PHYSICAL DATALake Mead Station 1
Temperature,°F
Dissolvedoxygen.mg/L
Conductivity,EC x 106at 25° Cmicromhos/cm
pH
Collection
depth
52550100150200250300350400
52550100150200250300350400
5
2550100150200250300350400
52550100150200250300350400
April1964
55.455.455.452.752.052.0
52.052.052.0
9.53
9.279.088.948.688.508.428.358.27
1,0901,0751,0501,0851,0951,110
-1,1201,1251,125
7.47.47.27.07.97.9
-7.97.27.2
May1965
66.565.264.556.5
-54.0
-53.253.053.0
8.928.968.558.12
-7.93
-7.727.557.58
1,3001,3051,3051,290
1,305
-1,3251,3251,325
8.58.58.58.1
-8.1
8.08.08.0
November1965
70.770.070.065.359.255.454.053.653.053.0
7.507.357.051.182.184.505.525.755.002.65
1,1001,2001,2001,0001,1001,200990
1,3501,3001,300
8.48.58.57.87.78.08.18.08.07.9
April1966
56.255.054.853.853.553.553.553.553.553.5
8.78.48.27.9
-6.7
-6.2
6.0
1,0501,0501,0501,0801,0901,0901,0901,0901,0901,090
8.28.38.38.3
-8.1
-8.1
-8.0
November1966
70.570.270.265.958.954.253.553.253.253.2
7.20_
-0.75
-5.70
-5.50_
1.60
1,0401,0401,0401,0501,0601,0051,0201,0601,0601,090
8.2
-_
7.7_
7.8_
7.8
-7.6
29

Lake Mead Station 1Continued
Alkalinity,phthas C»C03mg/L
Alkalinity,MOas CaC03mg/L
Carbondioxide,mg/L
Collection
depth
52550100150200250300350400
52550100150200250300350400
52550100150200250300350400
April1964
0.000.000.000.971.942.13
-1.452.724.07
May1965
7.14.44.80.00.00.00.00.00.00.0
127.8128.8128.8128.3131.0131.0
-132.8132.2133.5
November1965
3.0
1.00.00.00.00.00.00.00.0
104.5
103.5123.2138.5138.0135.2131.2
135.5
0.00.00.06.967.066.585.513.384.356.48
April1966
•»
0.0
0.0
0.0.0.0.0.0
120.0117.0120.0122.0
124.0
-126.0
-127.0
0.961.451.922.90
-3.87
-2.90
-3.87
November1966
3.0
0.0
0.0
-0.0_
0.0
104.8
117.5
125.5
-127.5
-130.5
•
4.07
-2.71
-2.91
-4.07
30

CHEMICAL AND PHYSICAL DATALake Mead Station 3
Temperature,°F
Dissolvedoxygen,mg/L
Conductivity,EC x 106at 25° Cmicromhos/cm
pH
Alkalinity,phthas CaCOsmg/L
Collection
depth
52550100150200250300
52550100150200250300
52550100150200250300
52550100150200250300
52550100150200250300
April1964
58.857.4
-53.0
51.851.851.8
10.3010.20
-9.55
-9.169.10-
1,0601,060
-1,080
-1,1101,1101,120
8.28.1
-8.1
-8.18.18.1
May1965
59.557.056.054.853.553.553.053.0
9.018.508.508.308.128.03
-7.92
1,3001,2901,3001,3001,3201,3201,3401,340
8.38.38.18.08.07.9
-7.9
5.33.24.53.03.0
2.03.8
November1965
69.8
-69.868.059.9-
58.1
8.05
7.451.001.75
--5.10
1,200
-1,1901,1001,050
800
8.4
-8.78.07.9
--8.2
4.2
-5.00.00.0
--0.0
April1966
63.562.557.554.553.853.853.553.2
9.710.09.38.2
-7.9
-6.8
1,1101,1101,1101,1201,1201,1201,1601,160
8.68.68.48.2_
8.1
-8.0
6.05.00.00.0
-0.0.0.0
November1966
71.770.770.268.258.755.253.753.7
8.02
--2.48
-3.05_
5.55
1,0251,0401,0401,0701,0801,0401,0401,060
8.6
--8.0_
8.0
-8.0
5.0
--0.0
-0.0
-0.0
31

Lake Mead Station 3Continued
Alkalinity,MOas CaC03mg/L
Carbondioxide,mg/L
Collection
depth
52550100150200250300
52550100150200250300
April1964
2.420.97
0.97.0.971.451.45
May1965
126.5124.0124.5122.0123.8124.8
-130.0
November1965
106.5
105.0122.0137.0.
131.0
0.0
0.05.036.50
3.97
April1966
122.0121.0121.0121.0
118.0
-122.0
0.00.00.01.93.1.93
-2.90
November1966
106.5
115.0
125.0
-129.8
0.0
2.91.4.36
-3.68
32

CHEMICAL AND PHYSICAL DATALake Mead Station 4
.
Temperature°F
Dissolvedoxygen.mg/L
•
Conductivity,EC x 106at 25° Cmicromhos/cm
pH
Collection
depth
52550100150200250300350400
52550100150200250300350400
52550100150200250300350400
52550100150200250300350400
April1964
56.855.854.752.352.251.051.851.651.651.6
10.19.849.459,05_
8.75.8.878.888.42
1,0751,0801,0801,085
-1,115
-1,1251,1251,130
8.28.28.18.0
-8.0
-8.07.97.8
May1965
63.561.559.555.5
-54.0
-53.053.0
-
9.309.078.758.408.108.208.328.188.00
-
1,3001,3001,3001,300
-1,310
-1,3301,340
8.48.28.17.97.87.87.87.77.7_
November1965
69.068.568.063.559.056.053.853.052.8
-
7.65
-7.156.852.154.30_
5.70
1,2101,2101,2101,2001,1901,2001,2201,2501,270
8.65
-8.658.57.97.9
-7.9•»_
April1966
65.062.557.254.554.053.553.553.253.053.0
9.49.89.0O • £.
«.
6.2
-6.2
-4.6
1,1051,1101,1101,1101,1101,1501,1501,1901,1901,200
8.68.78.48.2_.
8.1
-8.0
-7.8
November1966
70.270.270.267.759.254.753.753.253.253.2
7.7
--4.1_
5.7
5.6
--
1,0001,0201,0201,0601,0501,0001,0201,0401,0801,100
8.5
-_
8.1
-8.0
-8.1._
33

Lake Mead Station 4Continued
Alkalinity,phthas CaC03mg/L
Alkalinity,MOas CaCOjmg/L
Carbondioxide,mg/L
Collection
depth
52550100150200250300350400
52550100150200250300350400
52550100150200250300350400
April1964
.
0.00.00.01.45
-1.94_
1.940.970.97
May1965
4.22.80.00.00.00.00.00.02.0-
125.4125.0125.0125.8125.2126.2126.0127.9128.8
-
November1965
3.0
2.54.00.00.0-0.0
109.5
111.5112.0144.0146.0_
155.0_
-
0.0
0.00.05.803.88
-2.90
--
April1966
7.06.00.00.0
0.0_
0.0
0.0
123122120122
122
-126
-130
0.00.00.03.88_
2.90_
5.80
-5.80
November1966
4.2
0.0
0.0
-
-
-0.0
105.0
112.5
126.5_
127.8_
-0.0
1.45
—2.71_
2.52.-
34

CHEMICAL AND PHYSICAL DATALake Mead Station 6
Temperature,°F
Dissolvedoxygen,mg/L
"
Conductivity,EC x 106at 25° Cmicromhos/cra
pH
Collection
depth
52550100150200250300350400
52550100150200250300350400
52550100150200250300350400
52550100150200250300350400
April1964
61.258.654.752.552.851.651.651.651.651.6
9.910.09.69.0
8.8
8.98.98.5
1,0801,0751,0801,080.1,110
-1,1151,1251,130
8.48.48.28.2
-8.2
-8.28.28.2
May1965
68.5.64.556.2
--_
53.5
-
8.989.308.708.20_
8.20_
8.187.95
-
1,250
-1,3001,300
---1,325
--
8.38.58.48.2_
8.0_
7.97.9
-
November1965
77.5-70.768.963.559.9-57.2--
7.7
-7.33.02.154.4
-5.58
--
1,200_
1,2001,2251,2001,250
-1,250
-
8.8
-8.88.28.08.1
-8.2
-_
April1966
65.060.557.254.053.853.053.053.053.053.0
9.59.78.68.0_
7.4_
6.1
-4.2
1,1101,1101,1101,1201,1201,1501,1501,1801,1901,195
8.58.58.38.1_
8.0_
7.8_
7.7
November1966
71.270.270.269.259,254.253.753.253.2
7.8
-7.87.5
—5.8_
5.75.4
-
1,0401,0401,0401,0801,0801,0051,0401,0401,065
-
8.4
-8.58.5_
8.0_
8.07.9
-
35

Lake Mead Station 6Continued
Alkalinity,phthas CaCOjmg/L
Alkalinity,MOm CaC03mg/L
Carbondioxide,mg/L
Collection
dtpth
52550100150200250300350400
52550100150200250300350400
52550100150200250300350400
April1964
0.00.00.0
-0.970.97
0.970.970.97
May1965
5.0v
5.00.00.00.0_
0.00.0
128.5
-130.2128.7
-127.8_
130.5133.0
November1965
4.8
-4.50.00.00.0
0.0--
105.0
-106.5121.0139.5141.0.
135.5
--
0.0
-0.03.107.746.87_
5.32_
••
April1966
6.52.00.00.0
0.0
-0.0
-0.0
119.0120.0120.0
124.0_
127.0_
125.0
0.00.01.451.94.1.94.3.39_
3.87
November1966
4.5
-4.54.0
0.0
-0.00.00.0
107.5
-105.0105.5
-.
-121.5126.5
-
0.00.0
--_
2.42_
3.203.39•
36

CHEMICAL AND PHYSICAL DATALake Mead Station 8
Temperature,°F
Dissolvedoxygen.mg/L
Conductivity,EC x 106at 25° Cmicromhos/cm
PH
Collection
depth
5102550100150200250300
5102550100150200250300
5102550100150200250300
5102550100150200250300
April1964
60.8
58.555.253.152.251.8
-9.60
9.689.389.008.558.55
1,085
1,0701,0601,070
-1,110
-8.2
8.28.28.18.18.1
-
May1965
70.2_
61.856.0_
53.8
-
10.48
9.308.728.25_
7.65
1,305
-1,3051,300
-1,325
-
8.6
8.58.38.0
-8.0
-
November1965
71.6
68.061.762.6
—
7.75
-2.552.003.08
1,200
1,2001,2101,2101,1501,230
8.5
--7.97.87.8
-
April1966
61.561.556.854.553.553.053.053.053.0
9.6
9.79.08.3.7.7
6.8
1,100
1,1001,1101,1101,1101,1101,1501,150
8.6
8.78.48.3
—8.2
8.1
November1966
70.770.770.270.267.259.755.753.7
7.8
--7.5
-4.8
-
1,0401,0401,0401,0401,0401,0551,0251,020
_
8.5
--8.5_
8.0
-
37

Lake Mead Station 8Continued
Alkalinity,phthas CaC03mg/L
Alkalinity,MOas CaCOsmg/L
Carbondioxide,mg/L
Collection1
depth
5102550100150200250
o102550100150200250300
102550100150200250300
April1964
0.00
0.000.000.970.971.94
*
May1965
7.3
6.34.20.0_
0.0
123.0
124.2126.2128.0.
129.5
-
November1965
5.0
0.00.00.0
106.5_
119.5130.5139.0
-0.0
3.194.265.30
April1966
7.5
0.00.00.00.00.0
127.5
123.0125.5
-123.0
123.0
0.0
0.00.982.422.422.42
2.90
November1966
5.0
4.0.0.0
-
105.5•
107.0_
129.0_
^0.0
0.0.3.8
-
38

CHEMICAL AND PHYSICAL DATALake Mead Station 9
Temperature,0 F
Dissolvedoxygen,mg/L
Conductivity,EC x 106at 25* Cmicromhos/cm
pH
Collection
depth
5102550100150200270
5102550100150200270
5102550100150200270
5102550100150200270
April1964
61.5
59.555.052.952.952.3
9.70
9.869.108.698.698.42
1,090
1,0801,0601,0851,1001,135
8.0
8.08.28.28.28.1
May1965
70.2
-63.058.5
53.0
12.32
9.128.507.97
-7.35
1,320
-1,2801,300
-1,360
8.8
-8.358.1
-8.0
November1965
67.5
67.567.567.559.556.0
7.70
7.607.602.301.78
1,210
1,2101,2101,2101,1901,250
8.2_
8.68.67.87.8
April1966
63.5
56.555.554.553.853.5
9.8
9.88.78.2_
7.3
1,130
1,1101,1301,1601,1601,160
8.7
8.78.48.2_
8.2
November1966
69.769.569.569.569.558.255.253.7
^
7.9
-7.87.7_
3.23.8
1,0201,0201,0301,0301,0301,0651,0601,060
^
8.5_
8.68.7_
7.97.8
39

Lake Mead Station 9Continued
Alkalinity,phthas CaC03mg/L
Alkalinity,MOas CaC03mg/L
Carbondioxide,mg/L
Collection
depth
5102550100150200270
5102550100150200270
5102550100150200270
April1964
m
--
---_
•
0.0
0.00.01.451.451.94
~
f̂ay1965
8.5-
3.70.00.00.0
117.5-
-128.0127.2
129.5
_
-
November1965
5.2
--5.00.00.0
108.0
-
107.5137.0134.5
0.0
--0.04.063.39
April1966
0.0
0.00.00.00.00.0
118.0
125.0130.0120.0
123.0
0.0
0.02.422.42_
3.39
November1966
4.8-5.05.3.0.00.0
_
103.5
-106.5109.0_
127.5130.6
0.0
-0.0
-0.0_
5.15.0
40

CHEMICAL AND PHYSICAL DATALake Mead Station 10
Temperature,°F
Dissolvedoxygen,mg/L
Conductivity,EC x 106at 25° Cmicromhos/cm
pH
Alkalinity,phthas CaC03mg/L
Collection
depth
5102550100150200
5102550100150200
5102550100150200
5102550100150200
5102550100150
April1964
59.7
59.058.852.552.552.0
9.57
9.629.678.948.748.75
1,080
1,0801,0801,0701,0851,100
8.0
8.28 • 2,8.28.18.1
•
---
May1965
71.2
65.063.057.057.0
-
13.85
9.227.206.686.30
-
1,350
1,3101,4601,4601,480
8.8
8.68.27.97.9
-
8.0
-0.00.00.0
November1965
67.5
67.567.567.560.0
-
7.90
-8.050.20
1,210
1,2101,2101,2101,210
8.7__
8.78.7
-
5.5
--5.80.0
April1966
63.2
61.057.055.054.0
-
11.7
9.38.77.87.5-
1,125
1,1251,1251,1251,090
8.6
8.58.28.18.0-
9.0
0.00.00.00.0
November1966
70.270.269.769.769.259.3
—
8.0
-7.757.720.05
1,0401,0401,0401,0401,0601,095
_
8.4_
8.458.57.70
—
5.0
-4.55.50.0
41

Lake Mead Station 10Continued
Alkalinity,MOas CaC03mg/L
Carbondioxide,mg/L
Collection
depth
5102550100150
5102550100150200
April1964
0.972.42
May1965
111.0
125.0127.8129.8
~
—
November1965
109.5
109.0145.5
0.0
-0.07.1
—
April1966
120.0
123.0123.0126.0123.0
0.0
0.00.963.383.87
-
November1966
104.5
105.2107.5129.0
^
0.0
0.0
-5.5
42

CHEMICAL AND PHYSICAL DATALake Mead Station 12
Temperature,°F
Dissolvedoxygen.mg/L
Conductivity,EC x 106at 25° Cmicromhos/cm
pH
Collection
depth
5102550100150200250300350
5102550100150200250300350
5102550100150200250300350
5102550100150200250300350
April1964
54.8
57.957.654.3
-52.0
-52.0
-
9.51
9.509.488.93
-8.83_
8.80
-1,080
1,0801,0851,085
-1,100
-1,120
-
8.0
8.18.17.8
—7.5
-7.5
-
May1965
69.5
.62.855.5
53.5
53.053.0
8.75
9.208.858.20
8.05_
8.057.30
1,310
-1,3001,300
-1,320
-1,3251,340
8.5
8.58.358.0
-7.9_
7.87.9
November1965
68.0
68.068.567.559.556.054.053.053.0
7.50
-7.500.752.504.10_
5.405.35
1,200
1,2001,2101,2101,1501,2001,2501,250
8.4_
8.37.57.67.7
—7.87.8
April1966
65.5
61.557.554.053.553.253.053.053.0
10.00
10.209.48.5
—7.7_
6.55.7
1,120
1,1201,1201,1051,1051,1501,1201,1201,190
8.3
8.58.28.1
-8.0
—7.17.8
November1966
70.770.770.770.766.258.754.253.253.253.2
7.42
-7.531.58
-5.72_
5.65
-
1,0201,0201,0251,0251,0251,030990
1,0201,0401,070_
8.5_
8.57.8
-7.8_
7.8_
43

Lake Mead Station 12Continued
Alkalinity,phthas CaC03mg/L
Alkalinity,MOas CaC03mg/L
Carbondioxide,mg/L
Collection
depth
5102550100150200250300350
5102550100150200250300350
5102550100150200250300350
April1964
----__
-
-
._
-•-
0.0
0.00.01.94
-2.42_
2.42••
May1965
9.0
-4.30.00.00.00.0
--126.2
-125.5126.0.
129.7_
132.0134.2
----•
-—
November1965
4.0
-4.80.00.00.00.0
--107.0
-109,0129.0139.5
141.0137.0
0.0
-0.04.555.614.07_
3.682.71
April1966
3.0
4.00.00.00.00.00.0
--123
126126126«•
126.126130
0.0
0.02.421.94.2.90_
2.902.90
November1966
4.5
-4.00.0_
0.0_
0.0
-.
105.5.106.0123.5
-129.0_
127.5
-—
-.
-5.1
-4.1_
4.3
-
44

CHEMICAL AND PHYSICAL DATALake Mead Station 14
Temperature.°F
Dissolvedoxygen,mg/L
Conductivity,EC x 106at 25° Cmicromhos/cm
Collection
depth
C.
102550100125150175200250300350
D
102550100125150175200250300350
o102550100125150175200250300350
April1964
58.5
58.558.558.0
52.7
52.0.
52.0-
9.49
9.499.558.78
8.87
8.90
-8.86
-
1,080
1,0801,0801,080
1,065
1,0851,1001,120
-
May1965
68.5
67.060.055.0
—DO . O_
53.5
-
9.00
9.208.858.32_
8.20
-8.00
-
1,300
1,3051,3001,310
-
1,320
-1,325
-
November1965
68.5
68.568.566.0
59.0
56.053.553.0-
7.00
-6.970.75
2.32
4.43
-5.155.00
1,225
1,2251,2001,210
1,125
1,2001,2501,250-
April1966
66.0
61.357.053.5
53.0
52.552.552.552.5
9.9
10.39.38.3_
7.8
-6.16.2
1,110
1,1101,1101,095
1,100
1,1001,1001,100
November1966
70.770.770.770.267.762.758.755.754.253.253.253.2
^
7.22
-7.284.30
—__
5.52
-5.60
-
1,0201.0201,0201,0201,0651,0401,025990990
1,0001,0001,050
45

Lake Mead Station 14Continued
pH
Alkalinity,phthas CaCOjmg/L
Alkalinity,MOas CaC03mg/L
Collection
depth
5102550100125150175200250300350
5102550100125150175200250300350
5102550100125150175200250300350
April1964
8.2
8.28.38.3
8.2
8.1.8.0
-_
---
—
-__
-,»
---
-_
.
-
May1965
8.3
8.58.258.0
-
7.9_
8.0
-
3 . 5
4.83.20.0
0.0
0.00.00.00.0
131.0
131.2134.8135.5
_
134.0_
134.0
-
November1965
8.5
-8.57.8
7.8
7.9**
8.08.0
4.3
""
""
0.0
"" t<
<
0.01
-
los.o :4
*™
~
132.5f
—
141.5 ._
- ('
"• i
kk
. April
.' 1966
' 8.6.! 8.6! 8.4i 8.2,
—8.1•
8.07.8
1.0
5.00.00.0
0.0
0.00.00.00.0
120
123123125
••
122•
127125
•••»
November1966
—
8.6
-8.68.2___
8.2«.8.2
-_
4.0
-3.80.0
-
—
_
0.0.0.0
-«k
107.5
-106.0114.0
-__
125.0.._
-
46

Lake Mead Station 14Continued
Carbondioxide,mg/L
Collection
depth
5102550100125150175200250300350
April1964
-1.94
1.94
2.42
-2.42~
May1965
--
-
--
—
November1965
0.0
0.03.68
4.84
4.65
-3.873.40
April1966
0.0
0.01.931.93
-
2.40
-2.903.87
November1966
0.0
0.01.16_
--2.42
-3.39
—
47

CHEMICAL AND PHYSICAL DATALake Mead Station 16
Temperature.°F
Dissolvedoxygen,mg/L
Conductivity,EC x 106at 25° Cmicromhos/cm
pH
Collection
depth
52550100150200250300350
52550100150200250300350
52550100150200250300350
52550100150200250300
April1964
61.061.059.554.0
53.053.0
9.469.469.398.94
-8.918.85
--1,0701,0801,0801,080
-1,1201,125
--
8.08.18.07.9
-7.87.8
-
May1965
70.568.561.556.055.554.053.5
--8.858.918.007.908.158.008.02
1,3101.3051,2751,2901,2901,3001,310
-8.458.428.07.957.907.887.85
-
November1965
68.068.068.566.559.056.054.053.5
7.15
-7.000.722.724.35_
4.60
-
1,1501,1501,1501,1751,1251,2001,2251,225
-8.6
-8.67.97.98.1_
8.1
April1966
67.062.058.054.253.553.052.552.0
-
9.810.09.18.1
-7.4_
7.1
-1,1051,1051,1051,1101,1101,1101,1101,080
-
8.68.58.18.1_
8.0_
8.0
48

Lake Mead Station 16Continued
Alkalinity,phthas CaC03mg/L
Alkalinity,MOas CaC03mg/L
Carbondioxide.mg/L
Collection
depth
52550100150200250300350
52550100150200250300
f
2550100150200250300350
April1964
0.000.000.000.97_
0.970.97.
-
May1965
6.26.00.00.00.00.00.00.00.0
132.2133.0142.5135.5135.3134.5134.5
-
November1965
4.0
--0.0-
----
113.0
--130.5
-141.0.•
0.000.00
-6.295.133.39_
3.39
-
April1966
4.04.00.00.00.00.00.00.0-
124.0122.0122.0121.0
-123.0_
126.0
^
-0.001.94_
2.42_
2.91
-
49

CHEMICAL AND PHYSICAL DATALake Mead Station 18
Temperature.°F
Dissolvedoxygen,mg/L
Conductivity,EC x 106at 25° Cmicromhos/cm
pH
Alkalinity,phthas CaCOjmg/l
Collection
depth
52550100150200300350
52550100150200300350
«/
2550100150200300350
52550100150200300350
d
2550100150200300350
May1965
71.570.563.056.0.53.253.053.0
8.758.858.427.80
-8.228.037.98
1,3001,3001,2751,275
-1,3101,3201,325
8.48.48.157.89.7.97.87.8
6.57.23.00.00.00.00.00.0
November1965
68.068.068.067.059.055.553.053.0
6.85
-4.300.602.726.554.954.25
1,0501,0751,0751,1501,1251,2001,2501,250
8.1
-8.47.67.77.87.87.8
4.50.00.00.00.00.00.00.0
April1966
62.859.055.553.052.552.552.552.5
9.29.18.88.6
-8.47.67.4
1,000960960950950950960975
8.68.58.48.3
-8.38.28.1
5.04.00.00.00.00.00.00.0
November1966
69.769.769.769.259.756.253.253.2
6.83
--4.60.5.554.35
-
930930930925980990
1,0301,040
8.3._
8.0.7.97.9
-3.8
--0.0
-0.00.0-
50

Lake Mead Station 18Continued
Alkalinity,MOas CaC03mg/L
Carbondioxide,mg/L
Collection
depth
52550100150200300350
52550100150200300350
May1965
131 • »>
132.5139.8140.0
137.2138.2137.8
November1965
118.5
131.0
140.2
-
0.0
0.06.585.614.363.683.09
April1966
127.0126.0130.0129.0
127.0128.0
-0.00.00.03.39
-1.932.903.87
November1966
112.5
122.5
127.5131.0
-
0.0
1.45
-2.423.85•
51

CHEMICAL AND PHYSICAL DATALake Mead Station 20
Temperature,Op
Dissolvedoxygen,mg/L
Conductivity,EC x 106at 25° Cmicronhos/cm
PH
Alkalinity,phthas CaC03mg/L
Collection
depth
52550100150200250300
ej2550100150200250300
52550100150200250300
52550100150200250300
52550100150200250300
November1965
70.067.567.065.058.556.054.053.5
7.50-7.351.852.554.05-4.30
1,0001,0001,0001,1001,1501,2001,2501,190
8.4
-8.47.77.67.8
-7.7
5.2--0.00.0o.o_
0.0
IApril1966
60.059.058.553.852.852.052.052.0
9.7-9.79.0_
8.7
-8.3
925925925950950950950950
8.5_
o» 58.3-8.3_
8.1
7.0-5.00.00.00.00.00.0
November1966
70.270.270.269.763.758.755.252.7
7.32
--5.60_
5.10
-5.55
920920920920940980980970
8.5_
.8.3.7.9_
7.8
4.0._
1.2
-0.0-0.0
52

Lake Mead Station 20Continued
Alkalinity,MOas CaC03mg/L
Carbondioxide,mg/L
Collection
depth
52550100150200250300
52550100150200250300
November1965
115.5
--131.0138.5140.5
-139.5
0.0-0.02.903.383.87
-3.38
April1966
129_
130128
-128_
128
0.0-0.02.9_
2.9_
2.9
November1966
114.0
--117.8
-126.5_
127.2
0.0
--0.0
-2.91.2.91
53

CHEMICAL AND PHYSICAL DATALake Mead Station 21
Temperature,°F
Dissolvedoxygen ,rag/L
Conductivity,EC x 106at 25° Cmicromhos/cm
PH
Alkalinity,phthas CaCOsmg/L
Alkalinity,MOas CaC03mg/L
Carbondioxide,mg/L
Collectiondepth
52550100150200300
5100150200300
52550100150200300
5100200300
5100200300
5100200300
5100200300
November1965
69.068.568.066.059.556.053.5
7.403.002.924.154.25
940950975
1,0751,1101,1751,275
8.37.77.67.8
3.50.00.00.0
113.5123.5137.5136.0
0.03.43.44.4
54

CHEMICAL AND PHYSICAL DATALake Mead Station 22 § 22A
Temperature ,°F
Dissolvedoxygen,mg/L
Conductivity,EC x 106at 25° Cmicromhos/cm
pH
Alkalinity,phthas CaCOsmg/L
Collectiondepth
52550100125150200250
550100150200250
52550100125150200250
550100150200250
550100150200250
22November
1965
67.067.067.064.561.059.055.554.0
7.87.56.054.103.553.15
650650650790
1,0501,0901,1901,210
8.758.708.47.97.98.0
2.53.20.00.00.00.0
22November
1966
70.770.770.765.760.756.753.252.2
7.60-7.584.554.554.40
825825825825865865870900
8.7-8.68.08.08.0
3.3-3.20.00.00.0
22ANovember
1965
68.067.567.564.261.058.855.554.0
7.757.254.803.604.003.45
790800800950
1,0601,1051,1901,225
8.358.407.957.707.857.75
5.53.00.00.00.00.0
55

Lake Mead Station 22 § 22AContinued
Alkalinity,MOas CaCOsmg/L
Carbondioxide,mg/L
Collectiondepth
550100150200250
550100150200250
22November
1965
111.0114.5117.0139.0140.5140.0
0.00.00.972.44.45.0
22November
1966
119.5
-126.5134.2139.2139.0
0.00.00.02.63.12.9
22ANovember
1965
117.0118.5130.5147.0144.5145.0
0.00.02.914.363.884.07
56

CHEMICAL AND PHYSICAL DATALake Mead Station 23 & 23A
Temperature ,°p
Dissolvedoxygen,mg/L
Conductivity,EC x 106at 25° Cmicromhos/cm
pH
Alkalinity,phthas CaCOsmg/L
Alkalinity,MOas CaC03mg/L
Carbondioxide,mg/L
Collectiondepth
5102550100140
51050100140
5102550100140
550100140
550100140
550100140
550100140
23November
1965
68.067.066.765.764.259.0
8.75-7.958.003.15
650650640640660
1,100
8.958.758.708.15
5.51.02.00.0
112.0108.5112.0139.0
0.00.00.04.2
23November
1966
69.769.769.769.765.756.7
—7.70-8.25-
810810810810810860
23ANovember
1965
66.567.067.066.063.858.5
8.05
-7.658.204.40
640640640640670
1,110
8.358.308.357.80
3.03.02.50.0
107.0108.2109.5136.0
0.00.00.02.1
57

CHEMICAL AND PHYSICAL DATALake Mead Station 24
Temperature,°F
Dissolvedoxygen,mg/L
Conductivity,EC x 106at 25° Cmicromhos/cm
PH
Alkalinity,phthas CaC03mg/L
Alkalinity,MOas CaC03mg/L
Carbondioxide,mg/L
Collection
depth
5
5
5
5
5
5
5
November1965
62.5
8.55
650
8.9
3.0
114.5
0.0
November1966
60.2
8.35
795
8.5
4.0
124.5
0.0
58

CHEMICAL AND PHYSICAL DATALake Mead Station OV1
Temperature ,°F
Dissolvedoxygen,mg/L
Conductivity,EC x 106at 25° Cmicromhos/cm
PH
Alkalinity,phthas CaCOsmg/L
Collectiondepth
5102550
100125150200
51050100150200
5102550
100125150200
51050100150200
51050100150200
November1965
67.867.567.567.0
67.0-59.056.0
7.80-7.584.850.651.82
950950950
1,000
1,2051,2051,2101,230
8.10-8.458.157.707.75
4.0-4.00.00.00.0
November1966
69.268.768,768.7
68.768.758.554.7
—7.50-1.75-4.30
920930930930
935960980980
_
8.4-7.7
-7.8_
4.0-0.0
--
59

Lake Mead Station OV1Continued
Alkalinity,MOas CaC(>3mg/L
Carbondioxide,mg/L
Collectiondepth
51050
100150200
51050
100150200
November1965
118.5-
118.0119.5146.5141.5
0.00.00.01.27.56.6
November1966
_
113.2
125.5-
127.2_
0.0-4.0-4.5
60

CHEMICAL AND PHYSICAL DATALake Mead Station OV2
Temperature ,°F
Dissolvedoxygen,mg/L
Conductivity,EC x 106at 25° Cmicromhos/cm
pH
Alkalinity,phthas CaCOsmg/L
Alkalinity,MOas CaCOsmg/L
Carbondioxide,mg/L
Collectiondepth
5255075
5255075
5255075
5255075
5255075
5255075
5255075
November1965
67.267.267.067.0
7.857.407.307.05
1,1251,1251,1251,200
8.408.458.458.45
5.04.54.24.5
116.0118.0119.5121.0
0.00.00.00.0
November1966
65.2
-
8.50
-™
-
1,240
--
8.40
-_
-
4.0
---
110.8
---
0.0--
61
APPENDIX B
CHEMICAL ANALYSES DATA
63
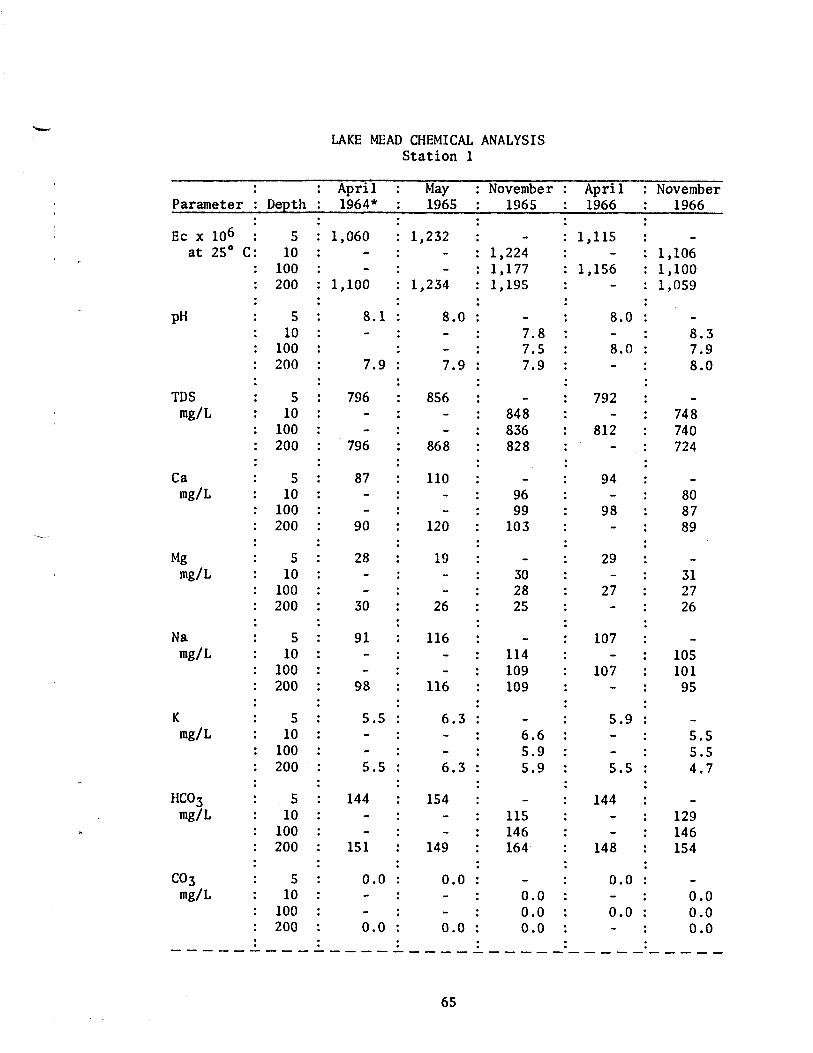
LAKE MEAD CHEMICAL ANALYSISStation 1
Parameter
EC x 106at 25° C
pH
IDSmg/L
Camg/L
Mgmg/L
Namg/L
Kmg/L
HC03mg/L
C03mg/L
Depth
510100200
510100200
510100200
510100200
510100200
510100200
5
10100200
510100200
510100200
April1964*
1,060--
1,100
8.1-
7.9
796-
-796
87-
-90
28-
-30
91--98
5.5-
-5.5
144
--
151
0.0
--0.0
May1965
1,232--
1,234
8.0--7.9
856--
868
110--
120
19--26
116--
116
6.3--6.3
154--
149
0.0--0.0
November1965
_
1,2241,1771,195
-7.87.57.9_
848836828
*•
9699103
—302825_
114109109
»
6.65.95.9_
115146164
_
0.00.00.0
April1966
1,115-
1,156-
8.0-8.0-
792-
812-
94-98-
29-
27-
107-
107-
5.9--5.5
144--
148
0.0-0.0
—
November1966
_
1,1061,1001,059
_
8.37.98.0_
748740724
_
808789_
312726_
10510195_
5.55.54.7_
129146154
«.
0.00.00.0
65

Station 1Continued
Parameter
804mg/L
Cl•g/L
N03ng/L
•
Depth
510100200
510100200
510100200
!
April1964*
291
294
86
95
0.6
! 0.05
May1965
345
338
122
115
1.2
1.25
November1965
360335332
10898102
0.01.22.5
April1966
330
337
99
98
2.5
2.5
November1966
312303287
949486
1.22.51.9
*Data given at 200 feet were collected at 400 feet on April 1964.
66

LAKE MEAD CHEMICAL ANALYSISStation 3C
Parameter
EC x 106at 25* C
PH
TDSmg/L
Camg/L
Mgmg/L
Namg/L
Kmg/L
C03mg/L
HC03mg/L
S04mg/L
Clmg/L
N03mg/L
Depth
5100
5100
5100
5100
5100
5100
5100
5100
5100
5100
5100
5100
Fall 1965
1,1951,244
7.87.7
832884
101104
2528
112118
5.96.3
0.00.0
122131
345360
109114
0.60.6
Soring 1966
1,1551,155
8.38.1
800808
89104
3325
104106
5.55.5
0.00.0
147147
332330
98100
1.92.5
Fall 1966
1,1001,137
8.28.1
764784
8085
3132
101104
5.15.9
0.00.0
125134
314317
95100
1.21.9
67

LAKE MEAD CHEMICAL ANALYSISStations 4 and 4B
StationParameter
EC x 106at 25° C
pH
TDSmg/L
Camg/L
Mgmg/L
Namg/L
Kmg/L
C03mg/L
HC03mg/L
S04mg/L
Clmg/L
Depth
10100200
10100200
10100200
10100200
10100200
10100200
10100200
10100200
10100200
10100200
10100200
4Spring 1965*
1,2271,2251,232
8.18.18.0
880916968
133104116
112822
113112114
6.36.36.3
0.00.00.0
151146154
341338346
119117121
Fall 1965
1,1951,168
7.67.8
836832
9196
3232
116107
5.95.5
0.00.0
123154
357331
11097
4BFall 1966
1,0961,1411,060
8.38.18.0
748776744
828586
303228
10410597
5.55.95.1
0.00.00.0
125132151
314320285
9310186
68

Stations 4 and 4BContinued
StationParameter
N03mg/L
Depth
10100200
4Spring 1965*
1.21.21.9
Fall 1965
0.62.5
4BFall 1966
0.61.92.5
*Data given as 10 feet were collected from 25 feet on April 1965.
69

LAKE MEAD CHEMICAL ANALYSISStations 6 and 8
Station
Parameter
EC x 106at 25° C
pH
IDSmg/L
Camg/L
Mgmg/L
Namg/L
Kmg/L
C03mg/L
HCOsmg/L
S04mg/L
Clmg/L
Depth
5100200
5100200
5100200
5100200
5100200
5100200
5100200
5100200
5100200
5100200
5100200
6May1965*
1,218
1,232
8.1
7.8
896
872
112
110
14
26
115
113
6.3
6.3
0.0
0.0
148
146
344
340
119
121
8November
1965
1,1951,1711,157
7.98.08.1
844868812
979597
283129
112109106
5.95.95.5
0.00.00.0
115144159
351335323
11410196
April1966
1,1491,155
8.18.1
800812
92102
3125
106107
5.55.5
0.00.0
149146
330332
9495
November1966**
1,0961,0941,083
8.38.28.0
780804804
798092
313126
10410498
5.55.55.1
0.00.00.0
125125157
313316301
959487
70

Stations 6 and 8Continued
Station
Parameter
N03mg/L
Depth
5100200
6May1965*
0.0
2.5
8November
1965
0.62.53.7
April1966
1.92.5
November1966**
1.20.61.9
*Data given at 5 feet were collected from 25 feet on May 1965.**Data given at 5 feet were collected from 10 feet on November 1966.
71

LAKE MEAD CHEMICAL ANALYSISStation 10
Parameter
EC x 106at 25° C
pH
IDSmg/L
Camg/L
Mgmg/L
Namg/L
Kmg/L
C03mg/L
HC03mg/L
S04mg/L
Clmg/L
Depth
550100
550100
550100
550100
o50100
550100
550100
550100
550100
550100
550100
May1965
1,261
-1,366
7.7
7.7
924-
1,012
119-
120
23-
31
117-
125
7.0-7.8
0.0-0.0
126-
154
368
-391
126-
140
November1965
1,199-
1,224
8.0_
7.8
840-
872
94-
94
33-34
112-
114
5.9-6.6
0.0-0.0
125-
123
352-
358
109-
Ill
April1966
1,182-
1,240
8.2_
8.1
840-
916
101-
108
29-30
107-
114
5.9-6.3
0.0-0.0
142-
144
344-
360
101x -111
November1966*
1,0941,1121,096
8.38.48.3
796780792
808180
313231
104105105
5.55.95.5
0.00.90.0
121121124
315317312
949794
72

Station 10Continued
Parameter
NO 3mg/L
Depth
550100
May1965
0.6-1.9
November1965
1.2-0.0
April1966
1.9-3.1
November1966*
1.21.21.2
*November 1966 data collected from 10 feet, 50 feet, and 100 feet.
73

LAKE MEAD CHEMICAL ANALYSISStations 12 and 14
Station
Parameter
EC x 106at 25° C
PH
IDSmg/L
Camg/L
Mgmg/L
Namg/L
9f
mg/L
co3mg/L
HC03mg/L
so4mg/L
Depth
5100200
5100200
5100200
5100200
5100200
5100200
5100200
5100200
5100200
5100200
12May1965
1,228
1,232
8.2
8.0
844
896
97
126
34
19
113
113
6.6
6.6
0.0
0.0
149
144
316
341
14May1965
1,232
1,232
8.3
8.0
904
876
99
86
32
41
115
113
6.3
6.3
0.0
0.0
151
156
340
341
November1965
1,1811,168
8.08.0
812828
9397
3030
111106
5.95.5
0.00.0
115157
346328
April1966
1,1601,068
8.38.4
828800
9398
3022
10296
5.55.1
0.02.1
148144
327305
12November1966
1,0761,0841,037
8.28.08.1
812828764
828585
283028
1019894
5.55.55.1
0.00.00.0
125138154
304299276
74

Stations 12 and 14Continued
Station
Parameter
Clmg/L
NO 3mg/L
Depth
5100200
5100200
12May1965
115
124
1.9
1.9
14May1965
130
117
1.2
2.5
November1965
10795
1.93.1
April1966
10090
2.53.1
12November1966
929384
0.62.53.1
*Data given as 5 feet were collected from 10 feet on November 1966.
75

LAKE MEAD CHEMICAL ANALYSISStation 18
Parameter
EC x 106at 25° C
PH
TDSmg/L
Camg/L
Mgmg/L
Namg/L
Kmg/L
co3mg/L
HC03mg/L
Depth
5100200300
5100200300
5100200300
5100200300
5100200300
5100200300
5100200300
5100200300
5100200300
May1965
1,232
1,232
8.2
8.0
856
880
94
91
36
41
113
115
6.3
6.3
0.0
0.0
154
154
November1965
.
1,1031,155
8.07.9
788792
87102
3026
101106
5.55.5
0.00.0
125156
April1966
1,1021,029
8.38.4
808748
9892
2726
10998
5.14.7
0.00.9
149149
November1966*
985987
1,0371,088
8.28.08.08.0
700732744784
75828689
28252728
89899297
4.74.75.15.1
0.00.00.00.0
136148151154
76

Station 18Continued
Parameter
so4mg/L
Clmg/L
N03mg/L
Depth
5100200300
5100200300
510100200
May1965
342
333
122
124
1.9
2.5
November1965
313323
9592
1.23.1
April1966
308287
9182
2.53.1
November1966*
269267279294
79778492
1.91.93.12.5
*Data given as 5 feet were collected from 10 feet on November 1966.
77

LAKE MEAD CHEMICAL ANALYSISStation 20
1<
Parameter :
EC x 106at 25° C
PH
IDSmg/L
Camg/L
Mgmg/L
Namg/L
Kmg/L
C03mg/L
HCO*mg/L
S04mg/L
Clmg/L
N03mg/L
Depth
5100
5100
5100
5100
5100
5100
5100
5100
5100
5100
5100
5100
November1965
9701,070
8.28.1
644740
7891
2625
8293
4.75.1
0.00.0
129160
261295
7580
1.23.7
April1966
9851,006
8.38.2
708708
8686
2526
9394
4.74.7
0.00.0
148154
271280
8082
2.52.5
November1966*
971976
8.38.1
676692
7878
2626
9090
4.74.7
0.00.0
140144
268269
7477
1.21.9
*Data given as 5 feet were collected from 10 feet on November 1966,
78

LAKE MEAD CHEMICAL ANALYSISStations 21, OV1, and OV2
Station
Parameter :
EC x 106at 25° C
pH
IDSmg/L
Camg/L
Mgmg/L
Namg/L
Kmg/L
co3mg/L
HC03mg/L
Depth
51050100
51050100
51050100
c
1050100
c
1050100
F
1050100
C
1050100
C
1050100
C
1050100
21November1965
886
1,028
8.5
8.3
600
708
79
84
19
27
77
90
4.3
4.7
0.9
0.0
134
146
OV2November1965
1,116
1,114
8.0
8.0
760
764
89
94
28
29
99
102
5.1
5.5
0.0
0.0
134
129
OV1November1966
985
1,005
8.3
8.0
692
692
75
82
28
28
90
92
4.7
4.7
0.0
0.0
139
154
OV2November1966
1,284
8.1
892
99
36
123
7.4
0.0
134
79

LAKE MEAD CHEMICAL ANALYSISStations 21, OV1, and OV2
Station
Parameter
S04mg/L
Clmg/L
NOsmg/L
Depth
51050100
51050100
51050100
21November1965
231
280
70
81
1.9
2.5
OV2November1965
316
313
95
94
0.6
0.6
OV1November1966
269
269
78
80
0.6
2.5
OV2November1966
376
119
0.6
80

LAKE MEAD CHEMICAL ANALYSISStations 22, 23, and 24
Station
Parameter
EC x 106at 25° C
pH
IDSmg/L
Camg/L
Mgmg/L
Namg/L
K
mg/L
CO 3mg/L
HC03mg/L
S04mg/L
Clmg/L
N03mg/L
Depth
5100
5100
5100
5100
5100
5100
5100
5100
5100
5100
5100
5100
24November1965
632
8.0
408
52
20
53
3.1
0.0
124
124
53
0.6
23November
1965
623613
8.08.0
400392
5453
1515
5050
2.32.7
0.00.0
127135
130128
4847
0.60.6
24November1966*
851
7.9
608
71
20
77
3.9
0.0
151
209
65
0.6
22November1966*
881885
8.28.0
628608
7269
2123
8178
4.33.9
0.00.0
145154
223213
7073
1.91.9
*Data given as 5 feet were collected from 10 feet on November 1966.
81

FIGURES 5-37 were not copied.To see these figures, contact the U.S. Bureau ofReclamation in Denver, Colorado.

APPENDIX C
PHOTOGRAPHS
149

_ .
Lake Mead-
151

w
Typical Marina, Lake Mead. Photo P45-D-57734.
3 -, ...
Upstream face of Hoover Dam. Photo P45-D-57740.
152

Survey boat. Photo P45-D-57738.
Kemmerer Water Sampler.Photo P45-D-44303 NA.
153

Laboratory in surveyboat.Photo P45-D-57736.
Laboratory in surveyboat.Photo P45-D-57737.
Conductivity Meter.Photo P45-D-44299 NA.
154

^
pH Meter. Photo PX-D-60076 NA.
155

N^7-1750(1-70)Bureau ol Reclamation
CONVERSION FACTORS—BRITISH TO METRIC UNITS OF MEASUREMENT
The following conversion factors adopted by the Bureau of Reclamation are those published by the American Society forTesting and Materials (ASTM Metric Practice Guide, E 380-68) except that additional factors (*) commonly used inthe Bureau have been added. Further discussion of definitions of quantities and units is given in the ASTM MetricPractice Guide.
The metric units and conversion factors adopted by the ASTM are based on the "International System of Units" (designatedSI for Systeme International d'Unites), fixed by the International Committee for Weights and Measures; this system isalso known as the Giorgi or MKSA (meter-kilogram (mass)-second-ampere) system. This system has been adopted bythe International Organization for Standardization in ISO Recommendation R-31.
The metric technical unit of force is the kilogram-force; this is the force which when applied to a body having amass of 1 kg, gives it an acceleration of 9.80665 m/sec/sec, the standard acceleration of free fall toward the earth'scenter for sea level at 45 deg latitude. The metric unit of force in SI units is the nejvton (N), which is defined asthat force which, when applied to a body having a mass of 1 kg, gives it an acceleration of 1 m/sec/sec. These unitsmust be distinguished from the (inconstant) local weight of a body having a mass of 1 kg; that is, the weight of abody is that force with which a body is attracted to the earth and is equal to the mass of a body multiplied by theacceleration due to gravity. However, because it is general practice to use "pound" rather than the technicallycorrect term "pound-force, " the term "kilogram" (or derived mass unit) has been used in this guide instead of "kilogram-force" in expressing the conversion factors for forces. The newton unit of force will find increasing use, and isessential in SI units.
Where approximate or nominal English units are used to express a value or range of values, the converted metric unitsin parentheses are also approximate or nominal. Where precise Elnglish units are used, the converted metric unitsare expressed as equally significant values.
Table I
QUANTITIES AND UNITS OF SPACE
Multiply By To obtain
LENGTH
Mil . .
Feet
Miles (statute)
25 4 (exactly) . . . .25 4 (exactly) . . . .
. . . 2.54 (exactly)*
. . . 30. 48 (exactly)
. . . 0. 3048 (exactly)*. . . .
. . . 0. 0003048 (exactly)* . .0 9144 (exactly) . . . .
1 609 344 (exactly)* . . . .. . . 1. 609344 (exactly) . . .
. Micron
. . Centimeters
. . Centimeters
. . Meters
. . Kilometers
. . Meters
. . Meters
. . Kilometers
AREA
Square inches . . . .Square feet
Square miles . . . \
6. 4516 (exactly) . . . .. . . . 929.03*
. . . 0 092903 . . . .. . . . 0.836127. . . . 0. 40469*. . . . 4,046.9*. . . . 0.0040469*. . . . 2,58999
. . Square centimeters
. . Square centimeters
. . Square meters
. . Square meters
. . Square kilometers
VOLUME
Cubic inches . . .Cubic feet. . . . .Cubic yards . . . .
Fluid ounces (U. S. )
Liquid pints (U. S. )
Quarts (U. S. ) . . .
Gallons (U.S.). . .
Gallons (U. K. ) . .
Cubic feetCubic yards. . . .Acre-feet
16.3871 . .0.0283168. . . .0.764555 . . . .
CAPACITY
. . . . 29.5737
. . . . 29.5729
. . . . 0.473179 . . . .
. . . . 0.473166 . . . .
. . . . 946.358*
. . . . 0.946331*. . . .
. . . . 3,785.43*
. . . . 3.78543
. . . . 3.78533
. . . . 0.00378543*. . ,
. . . . 4.54609 . . . .
. . . . 4.54596 . . . .
. . . . 28.3160
. . . . 764.55*
. . . . 1,233.5*
. . . .1,233,500*
Cubic centimetersCubic metersCubic meters
Cubic centimetersMUlilitersCubic decimetersLitersCubic centimetersLitersCubic centimetersCubic decimetersLitersCubic metersCubic decimetersLitersLitersLitersCubic metersLiters

ITable II
QUANTITIES AND UNITS OF MECHANICS
MASS
Grains (1/7,000 Ib) . . .Troy ounces (480 grains).Ounces (avdp)Pounds (avdp)Short tons (2,0001b). . .
Long tons (2.2401b). !
64. 79891 (exactly) . .31.103528.34950.45359237 (exactly).
, 907.1850.907185
, 1,016.05
MilligramsGramsGramsKilogramsKilogramsMetric tonsKilograms
FORCE/AREA
Pounds per square inch
Pounds per square foot
Kilograms per square centimeterNewtons per square centimeterKilograms per square meterNewtons per scuare_meter
MASS/VOLUME (DENSITY)
Ounces per cubic inch .Pounds per cubic foot .
Tons (long) per cubic yard ,
1. 72999 .16.0186 .0.01601851. 32894
Grams per cubic centimeterKilograms per cubic meterGrams per cubic centimeterGrams per cubic centimeter^
MASS/CAPACITY
Ounces per gallon (U. K. ) . . .Pounds per gallon (U. S. ) . . .Pounds oer oallon (U, K. ) . . .
. . . 6.2362
. . . 119.829
. . . 99.779
Grams per literGrams per literGrams per liter
BENDING MOMENT OR TORQUE
Inch-pounds
Foot-pounds
Foot-pounds per inchOunce-inches
Meter-kilogramsCentimeter-dynesMeter-kilogramsCentimeter-dynesCentimeter-kilograms per centimeterGram-centimeter s
VELOCITY
Feet per second.
Feet per year.Miles per hour
30.48 (exactly). . .0.3048 (exactly)* .0.965873 x 10-6* .1. 609344 (exactly).0. 44704 (exactly? .
Centimeters per secondMeters per secondCentimeters per secondKilometers per hourMeters per second
ACCELERATION*
Feet per second^ Meters per second
Cubic feet per second (secondfeet)
Cubic feet per minute . . . ._GaIlcr.E (U.S.) per ralnute_. _.
0.028317*0.4719 .0.06309 .
Cubic meters per secondLiters per secondLitar;, Dcr second
KilogramsNewt ensDynes
Multiply
WORK AND ENERGY*
British thermal units (Btu).
Btu per pound. . . .Foot-pounds . . . .
Kilogram caloriesJoulesJoules per gramJoules
HorsepowerBtu per hourFoot-pounds per second . . .
WattsWattsWatts
HEAT TRANSFER
Btu in. /hr ft^ deg F (k,thermal conductivity)
Btu ft/hr ft2 deg FBtu/hrft2 degF (C, thermal
1.442 .0.1240.1.4880*
conductance)
Deg F hr ft2/Btu (R, thermal'resistance) ,
Btu/lb deg F (c, heat capacity) ,Btu/lb deg F ,FWhr (thermal diffusivity) . .
0.5684.882
1. 7614.1868 .1.000* .0.2581 .0 09290*.
Milliwatts/cm deg CKg cal/hr m deg CKg cal m/hr m^ deg C
Milliwatts/cm2 deg CKg cal/hr m2 deg C
Deg C cm2/milliwattJ/g deg CCal/gram deg CCmS/secM^/hr
WATER VAPOR TRANSMISSION
Grains/hr ft (water vaportransmission)
Perms (permeance) . . . .Per;m-inc he s_ foe r me ability)
16.70.658
Grams/24 hr m2Metric permsMetric perm-centimeters
OTHER QUANTITIES AND UNITS
Multiply By
Cubic feet per square foot perday (seepage)
Pound-seconds per square foot(viscosity) 4.S824*. .
Square feet per second (viscosity). . . 0.092903*.Fahrenheit degrees (change)* 5/9 exactlyVolts per mil 0.03937. .Lumens per sauare foot (foot-
candles) 10. 764. . .Ohm-circular mils per foot 0. 001662 .Milllcuries per cubic foot 35.3147* .Milliamps per square foot 10, Y639* .Gallons per square yard 4,527219*-PouflGsper inch Q. 17858*.
Liters per square meter per day
Kilogram second per square meterSquare meters per secondCelsius or Kelvin degrees (change)*Kiiovolts per millimeter
Lumens per square meterOhm-square millimeters per meterMiilicuries per cubic meterMilliamps per square meterLiters per square meterKilograms per centimeter

<
ABSTRACT
This report presents Lake Mead water quality data obtained from 1964 to1966. The effect of filling Lake Powell on the water quality of Lake Meadis evaluated. General llmnological principles and the present limnology ofLake Mead are discussed. Lake Mead has a warm monomictic annual tempera-ture cycle characterized by spring overturn, summer stratification, andcontinuous circulation throughout the winter; temperatures never fall below39 deg F (1* deg C). During stratification, lower dissolved oxygen valueswere recorded in the thermocline than in the epilimnion and hypolimnion.Mineral content increases from the upper to the lower end of Lake Mead.The greatest increase is in calcium and sodium sulfates and chlorides, al-though there is an overall decrease in bicarbonate. The filling of LakePowell intensified the deterioration of water quality in Lake Mead during1965, as evidenced by increased temperature, conductivity, and total dis-solved solids and decreased dissolved oxygen. Las Vegas Bay reach wasfound to be a major source for degradation of water quality in Lake Meadbecause of its large input of dissolved salts and algae nutrients. Themonitoring station at Hoover Dam has been a useful indicator of water qual-ity in the lower reach of Boulder Basin.
ABSTRACT
This report presents Lake Mead water quality data obtained from 1964 to1966. The effect of filling Lake Powell on the water quality of Lake Meadis evaluated. General llmnological principles and the present limnology ofLake Mead are discussed. Lake Mead has a warm monomictic annual tempera-ture cycle characterized by spring overturn, summer stratification, andcontinuous circulation throughout the winter; temperatures never fall below39 deg F (4 deg C). During stratification, lower dissolved oxygen valueswere recorded in the thermocline than in the epilimnion and hypolimnion.Mineral content increases from the upper to the lower end of Lake Mead.The greatest increase is in calcium and sodium sulfates and chlorides, al-though there is an overall decrease in bicarbonate. The filling of LakePowell intensified the deterioration of water quality in Lake Mead during1965, as evidenced by increased temperature, conductivity, and total dis-solved solids and decreased dissolved oxygen. Las Vegas Bay reach wasfound to be a major source for degradation of water quality in Lake Meadbecause of its large input of dissolved salts and algae nutrients. Themonitoring station at Hoover Dam has been a useful indicator of water qual-ity in the lower reach of Boulder Basin.
ABSTRACT
This report presents Lake Mead water quality data obtained from 1964 to1966. The effect of filling Lake Powell on the water quality of Lake Meadis evaluated. General limnological principles and the present limnology ofLake Mead are discussed. Lake Mead has a warm monomictic annual tempera-ture cycle characterized by spring overturn, summer stratification, andcontinuous circulation throughout the winter; temperatures never fall below39 deg F (4 deg C). During stratification, lower dissolved oxygen valueswere recorded in the thermocline than in the epilimnion and hypolimnion.Mineral content increases from the upper to the lower end of Lake Mead.The greatest increase is in calcium and sodium sulfates and chlorides, al-though there is an overall decrease in bicarbonate. The filling of LakePowell intensified the deterioration of water quality in Lake Mead during1965, as evidenced by increased temperature, conductivity, and total dis-solved solids and decreased dissolved oxygen. Las Vegas Bay reach wasfound to be a major source for degradation of water quality in Lake Meadbecause of its large input of dissolved salts and algae nutrients. Themonitoring station at Hoover Dam has been a useful indicator of water qual-ity in the lower reach of Boulder Basin.
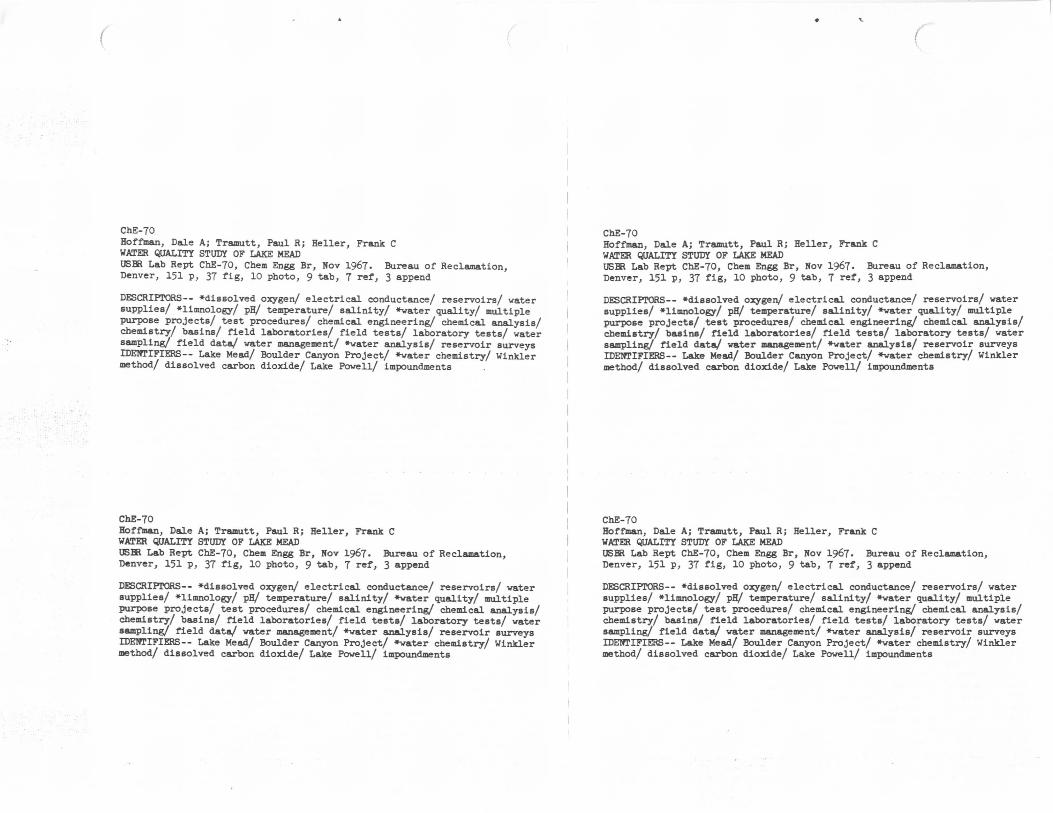
ChE-70Hoffman, Dale A; Tramutt, Paul R; Heller, Frank CWATER QUALITY STUDY OF LAKE MEADUSER Lab Rept ChE-70, Chem Engg Br, Hov 1967. Bureau of Reclamation,Denver, 151 p, 37 fig, 10 photo, 9 tab, 7 ref, 3 append
DESCRIPTORS— 'dissolved oxygen/ electrical conductance/ reservoirs/ watersupplies/ 'limnology/ pH/ temperature/ salinity/ *water quality/ multiplepurpose projects/ test procedures/ chemical engineering/ chemical analysis/chemistry/ basins/ field laboratories/ field tests/ laboratory tests/ watersampling/ field data/ water management/ *water analysis/ reservoir surveysIDENTIFIERS-- Lake Mead/ Boulder Canyon Project/ *water chemistry/ Winklermethod/ dissolved carbon dioxide/ Lake Powell/ impoundments
ChE-70Hoffman, Dale A; Tramutt, Paul R; Heller, Frank CWATER QUALITY STUDY OF LAKE MEADUSSR Lab Rept ChE-70, Chem Engg Br, Hov 1967. Bureau of Reclamation,Denver, 151 p, 37 fig, 10 photo, 9 tab, 7 ref, 3 append
DESCRIPTORS— 'dissolved oxygen/ electrical conductance/ reservoirs/ watersupplies/ 'limnology/ pH/ temperature/ salinity/ »water quality/ multiplepurpose projects/ test procedures/ chemical engineering/ chemical analysis/chemistry/ basins/ field laboratories/ field tests/ laboratory tests/ watersampling/ field data/ water management/ *water analysis/ reservoir surveysIDENTIFIERS-- Lake Mead/ Boulder Canyon Project/ *water chemistry/ Winklermethod/ dissolved carbon dioxide/ Lake Powell/ impoundments
ChE-70Hoffman, Dale A; Tramutt, Paul R; Heller, Frank CWATER QUALITY STUDY OF LAKE MEADUSSR Lab Rept ChE-70, Chem Engg Br, Nov 1967. Bureau of Reclamation,Denver, 151 p, 37 fig, 10 photo, 9 tab, 7 ref, 3 append
DESCRIPTORS-- 'dissolved oxygen/ electrical conductance/ reservoirs/ watersupplies/ 'limnology/ pH/ temperature/ salinity/ »water quality/ multiplepurpose projects/ test procedures/ chemical engineering/ chemical analysis/chemistry/ basins/ field laboratories/ field testa/ laboratory tests/ watersampling/ field data/ water management/ *water analysis/ reservoir surveysIDENTIFIERS-- Lake Mead/ Boulder Canyon Project/ *water chemistry/ Winklermethod/ dissolved carbon dioxide/ Lake Powell/ impoundments
ChE-70Hoffman, Dale A; Tramutt, Paul R; Heller, Frank CWATER QUALITY STUDY OF LAKE MEADUSER Lab Rept ChE-70, Chem Engg Br, Hov 1967. Bureau of Reclamation,Denver, 151 p, 37 fig, 10 photo, 9 tab, 7 ref, 3 append
DESCRIPTORS— 'dissolved oxygen/ electrical conductance/ reservoirs/ watersupplies/ 'limnology/ pH/ temperature/ salinity/ *water quality/ multiplepurpose projects/ test procedures/ chemical engineering/ chemical analysis/chemistry/ basins/ field laboratories/ field tests/ laboratory tests/ watersampling/ field data/ water management/ *water analysis/ reservoir surveysIDENTIFIERS-- Lake Mead/ Boulder Canyon Project/ *water chemistry/ Winklermethod/ dissolved carbon dioxide/ Lake Powell/ impoundments